Test: Lenovo ThinkPad P53 - Klassisk arbetsstation med högpresterande GPU (Sammanfattning)
Gradering | Datum | Modell | Vikt | Höjd | Storlek | Upplösning | Pris |
|---|---|---|---|---|---|---|---|
| 89.8 % v7 (old) | 11/2019 | Lenovo ThinkPad P53-20QN000YGE i7-9850H, Quadro RTX 5000 Max-Q | 2.7 kg | 29.4 mm | 15.60" | 1920x1080 | |
| 87.8 % v7 (old) | 08/2019 | Lenovo ThinkPad P1 2019-20QT000RGE i7-9850H, Quadro T1000 (Laptop) | 1.7 kg | 18.4 mm | 15.60" | 1920x1080 | |
| 86.9 % v7 (old) | 11/2018 | Dell Precision 7530 i9-8950HK, Quadro P3200 | 2.6 kg | 29.95 mm | 15.60" | 3840x2160 | |
| 85.6 % v6 (old) | Fujitsu Celsius H780 i7-8850H, Quadro P2000 | 2.8 kg | 31.9 mm | 15.60" | 1920x1080 | ||
| 85 % v7 (old) | 06/2019 | MSI P65 Creator 9SF-657 i9-9880H, GeForce RTX 2070 Max-Q | 1.9 kg | 18 mm | 15.60" | 3840x2160 |
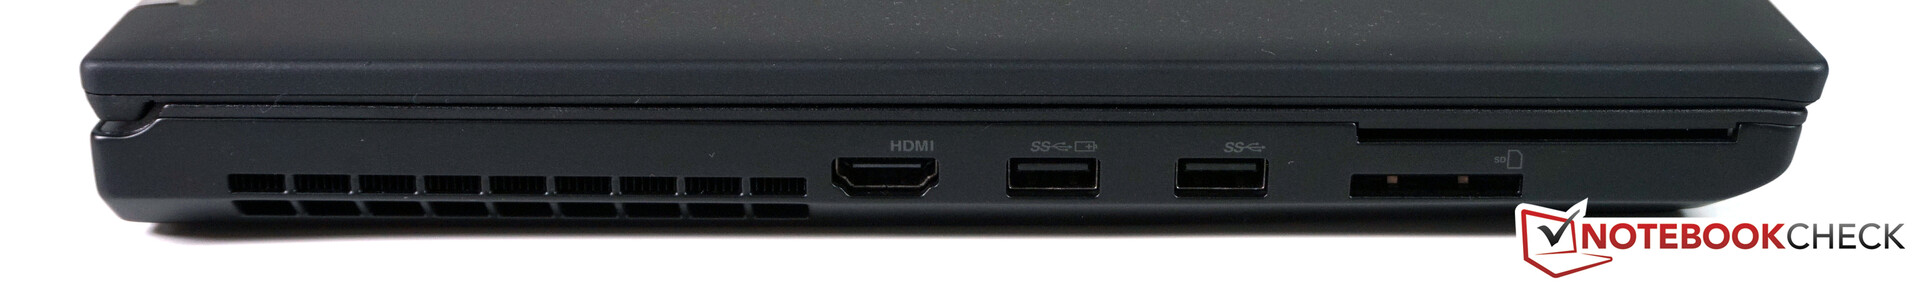
| SD Card Reader | |
| average JPG Copy Test (av. of 3 runs) | |
| Dell Precision 7530 (Toshiba Exceria Pro SDXC 64 GB UHS-II) | |
| Lenovo ThinkPad P53-20QN000YGE (Toshiba Exceria Pro SDXC 64 GB UHS-II) | |
| Lenovo ThinkPad P1 2019-20QT000RGE (Toshiba Exceria Pro SDXC 64 GB UHS-II) | |
| Lenovo ThinkPad P52 20MAS03N00 (Toshiba Exceria Pro SDXC 64 GB UHS-II) | |
| Fujitsu Celsius H780 (Toshiba Exceria Pro SDXC 64 GB UHS-II) | |
| Genomsnitt av klass Workstation (49.6 - 681, n=14, senaste 2 åren) | |
| maximum AS SSD Seq Read Test (1GB) | |
| Genomsnitt av klass Workstation (87.6 - 1455, n=14, senaste 2 åren) | |
| Lenovo ThinkPad P53-20QN000YGE (Toshiba Exceria Pro SDXC 64 GB UHS-II) | |
| Lenovo ThinkPad P1 2019-20QT000RGE (Toshiba Exceria Pro SDXC 64 GB UHS-II) | |
| Dell Precision 7530 (Toshiba Exceria Pro SDXC 64 GB UHS-II) | |
| Lenovo ThinkPad P52 20MAS03N00 (Toshiba Exceria Pro SDXC 64 GB UHS-II) | |
| Fujitsu Celsius H780 (Toshiba Exceria Pro SDXC 64 GB UHS-II) | |
| Networking | |
| iperf3 transmit AX12 | |
| Lenovo ThinkPad P53-20QN000YGE | |
| Lenovo ThinkPad P53-20QN000YGE | |
| Lenovo ThinkPad P1 2019-20QT000RGE | |
| Dell Precision 7530 | |
| Lenovo ThinkPad P52 20MAS03N00 | |
| Fujitsu Celsius H780 | |
| MSI P65 Creator 9SF-657 | |
| iperf3 receive AX12 | |
| Lenovo ThinkPad P53-20QN000YGE | |
| Lenovo ThinkPad P53-20QN000YGE | |
| Dell Precision 7530 | |
| Fujitsu Celsius H780 | |
| Lenovo ThinkPad P52 20MAS03N00 | |
| Lenovo ThinkPad P1 2019-20QT000RGE | |
| MSI P65 Creator 9SF-657 | |
| |||||||||||||||||||||||||
Distribution av ljusstyrkan: 89 %
Mitt på batteriet: 490 cd/m²
Kontrast: 1417:1 (Svärta: 0.36 cd/m²)
ΔE ColorChecker Calman: 2.3 | ∀{0.5-29.43 Ø4.73}
calibrated: 1.2
ΔE Greyscale Calman: 3.2 | ∀{0.09-98 Ø4.97}
93.1% sRGB (Argyll 1.6.3 3D)
59.4% AdobeRGB 1998 (Argyll 1.6.3 3D)
64.3% AdobeRGB 1998 (Argyll 3D)
92.9% sRGB (Argyll 3D)
63.2% Display P3 (Argyll 3D)
Gamma: 2.34
CCT: 7036 K
| Lenovo ThinkPad P53-20QN000YGE N156HCE-GN1, IPS, 1920x1080, 15.6" | Lenovo ThinkPad P52 20MAS03N00 N156HCE-EN1, IPS LED, 1920x1080, 15.6" | Lenovo ThinkPad P1 2019-20QT000RGE N156HCE-GN1, IPS LED, 1920x1080, 15.6" | Dell Precision 7530 Sharp LQ156D1, IPS, 3840x2160, 15.6" | Fujitsu Celsius H780 LP156WF6-SPP1, IPS LED, 1920x1080, 15.6" | MSI P65 Creator 9SF-657 AU Optronics AUO41EB, IPS, 3840x2160, 15.6" | |
|---|---|---|---|---|---|---|
| Display | 1% | -1% | 29% | -2% | 32% | |
| Display P3 Coverage (%) | 63.2 | 65.6 4% | 62.4 -1% | 82.5 31% | 66.3 5% | 84.4 34% |
| sRGB Coverage (%) | 92.9 | 90.3 -3% | 91.5 -2% | 99.4 7% | 85.9 -8% | 100 8% |
| AdobeRGB 1998 Coverage (%) | 64.3 | 65.9 2% | 63.4 -1% | 96.2 50% | 62.8 -2% | 98.5 53% |
| Response Times | -3% | 27% | 2% | -3% | -28% | |
| Response Time Grey 50% / Grey 80% * (ms) | 38.4 ? | 39.2 ? -2% | 34.4 ? 10% | 35.2 ? 8% | 38 ? 1% | 51 ? -33% |
| Response Time Black / White * (ms) | 25.2 ? | 26 ? -3% | 14 ? 44% | 26.4 ? -5% | 26.8 ? -6% | 31 ? -23% |
| PWM Frequency (Hz) | 26040 ? | 25250 ? | 26040 ? | 198.4 ? | 20830 ? | |
| Screen | -34% | -15% | -31% | -36% | -23% | |
| Brightness middle (cd/m²) | 510 | 304 -40% | 542 6% | 292.8 -43% | 271 -47% | 445 -13% |
| Brightness (cd/m²) | 468 | 293 -37% | 528 13% | 295 -37% | 260 -44% | 462 -1% |
| Brightness Distribution (%) | 89 | 88 -1% | 84 -6% | 85 -4% | 86 -3% | 83 -7% |
| Black Level * (cd/m²) | 0.36 | 0.26 28% | 0.41 -14% | 0.36 -0% | 0.29 19% | 0.5 -39% |
| Contrast (:1) | 1417 | 1169 -18% | 1322 -7% | 813 -43% | 934 -34% | 890 -37% |
| Colorchecker dE 2000 * | 2.3 | 4.5 -96% | 3.5 -52% | 3.48 -51% | 3.9 -70% | 4.75 -107% |
| Colorchecker dE 2000 max. * | 5.5 | 7.7 -40% | 7.8 -42% | 6.81 -24% | 10.2 -85% | 7.79 -42% |
| Colorchecker dE 2000 calibrated * | 1.2 | 2.4 -100% | 1.3 -8% | 3.13 -161% | 2.9 -142% | |
| Greyscale dE 2000 * | 3.2 | 5.2 -63% | 4.8 -50% | 4.1 -28% | 2.6 19% | 4.49 -40% |
| Gamma | 2.34 94% | 2.26 97% | 2.33 94% | 2.2 100% | 2.29 96% | 2.49 88% |
| CCT | 7036 92% | 6789 96% | 7690 85% | 6740 96% | 6517 100% | 7374 88% |
| Color Space (Percent of AdobeRGB 1998) (%) | 59.4 | 53.8 -9% | 58.8 -1% | 84.4 42% | 56.1 -6% | 87 46% |
| Color Space (Percent of sRGB) (%) | 93.1 | 90.1 -3% | 91.1 -2% | 99.6 7% | 85.8 -8% | 100 7% |
| Totalt genomsnitt (program/inställningar) | -12% /
-24% | 4% /
-7% | 0% /
-16% | -14% /
-26% | -6% /
-13% |
* ... mindre är bättre
Visa svarstider
| ↔ Svarstid svart till vitt | ||
|---|---|---|
| 25.2 ms ... stiga ↗ och falla ↘ kombinerat | ↗ 15.2 ms stiga | 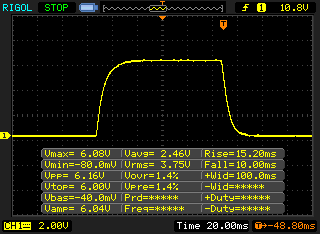 |
| ↘ 10 ms hösten | ||
| Skärmen visar relativt långsamma svarsfrekvenser i våra tester och kan vara för långsam för spelare. I jämförelse sträcker sig alla testade enheter från 0.1 (minst) till 240 (maximalt) ms. » 60 % av alla enheter är bättre. Detta innebär att den uppmätta svarstiden är sämre än genomsnittet av alla testade enheter (19.9 ms). | ||
| ↔ Svarstid 50 % grått till 80 % grått | ||
| 38.4 ms ... stiga ↗ och falla ↘ kombinerat | ↗ 18.8 ms stiga | 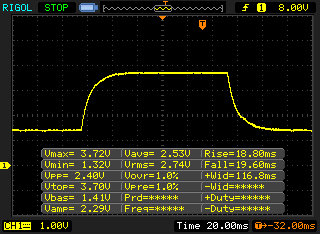 |
| ↘ 19.6 ms hösten | ||
| Skärmen visar långsamma svarsfrekvenser i våra tester och kommer att vara otillfredsställande för spelare. I jämförelse sträcker sig alla testade enheter från 0.165 (minst) till 636 (maximalt) ms. » 57 % av alla enheter är bättre. Detta innebär att den uppmätta svarstiden är sämre än genomsnittet av alla testade enheter (31.1 ms). | ||
Skärmflimmer / PWM (Puls-Width Modulation)
| Skärmflimmer / PWM upptäckt | 26040 Hz | ≤ 77 % ljusstyrka inställning | 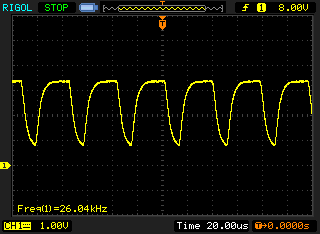 |
Displayens bakgrundsbelysning flimrar vid 26040 Hz (i värsta fall, t.ex. med PWM) Flimrande upptäckt vid en ljusstyrkeinställning på 77 % och lägre. Det ska inte finnas något flimmer eller PWM över denna ljusstyrkeinställning. Frekvensen för 26040 Hz är ganska hög, så de flesta användare som är känsliga för PWM bör inte märka något flimmer. Som jämförelse: 52 % av alla testade enheter använder inte PWM för att dämpa skärmen. Om PWM upptäcktes mättes ett medelvärde av 7798 (minst: 5 - maximum: 343500) Hz. | |||
| PCMark 10 | |
| Score | |
| Lenovo ThinkPad P53-20QN000YGE | |
| Dell Precision 7530 | |
| MSI P65 Creator 9SF-657 | |
| Fujitsu Celsius H780 | |
| Lenovo ThinkPad P1 2019-20QT000RGE | |
| Lenovo ThinkPad P52 20MAS03N00 | |
| Essentials | |
| Lenovo ThinkPad P53-20QN000YGE | |
| Lenovo ThinkPad P1 2019-20QT000RGE | |
| Dell Precision 7530 | |
| MSI P65 Creator 9SF-657 | |
| Fujitsu Celsius H780 | |
| Lenovo ThinkPad P52 20MAS03N00 | |
| Productivity | |
| Dell Precision 7530 | |
| Lenovo ThinkPad P53-20QN000YGE | |
| Fujitsu Celsius H780 | |
| Lenovo ThinkPad P1 2019-20QT000RGE | |
| Lenovo ThinkPad P52 20MAS03N00 | |
| MSI P65 Creator 9SF-657 | |
| Digital Content Creation | |
| MSI P65 Creator 9SF-657 | |
| Lenovo ThinkPad P53-20QN000YGE | |
| Dell Precision 7530 | |
| Fujitsu Celsius H780 | |
| Lenovo ThinkPad P1 2019-20QT000RGE | |
| Lenovo ThinkPad P52 20MAS03N00 | |

| 3DMark 06 Standard Score | 38739 poäng | |
| 3DMark Vantage P Result | 54153 poäng | |
| 3DMark 11 Performance | 19250 poäng | |
| 3DMark Ice Storm Standard Score | 98630 poäng | |
| 3DMark Cloud Gate Standard Score | 38066 poäng | |
| 3DMark Fire Strike Score | 16547 poäng | |
| 3DMark Time Spy Score | 6879 poäng | |
Hjälp | ||
| låg | med. | hög | ultra | QHD | 4K | |
|---|---|---|---|---|---|---|
| GTA V (2015) | 177 | 170 | 150.4 | 77.6 | 68.4 | |
| The Witcher 3 (2015) | 320 | 235 | 141 | 71 | 46.4 | |
| Dota 2 Reborn (2015) | 148 | 137 | 132 | 126 | 102 | |
| Rise of the Tomb Raider (2016) | 281.4 | 198.6 | 134.5 | 110.1 | 45.4 | |
| X-Plane 11.11 (2018) | 117 | 99 | 85 | |||
| Shadow of the Tomb Raider (2018) | 127 | 102 | 98 | 87 | 59 | 29 |
| Hitman 2 (2018) | 87.7 | 85.3 | 78.4 | 75.3 | 73.3 | 46.6 |
| Battlefield V (2018) | 153.6 | 105.4 | 88.2 | 81.2 | 68.3 | 42.5 |
| Far Cry New Dawn (2019) | 107 | 98 | 90 | 86 | 72 | 43 |
| Dirt Rally 2.0 (2019) | 275 | 188.9 | 160.3 | 89.3 | 66.8 | |
| Anno 1800 (2019) | 94.5 | 97.8 | 73.9 | 38.9 | 31.5 | |
| F1 2019 (2019) | 113 | 101 | 93 | 88 | 83 | 52 |
| Ghost Recon Breakpoint (2019) | 127 | 105 | 93 | 65 | 47 | 26 |
| GRID 2019 (2019) | 178.8 | 155.6 | 118.5 | 79.2 | 61.4 | 36.8 |
Ljudnivå
| Låg belastning |
| 28.3 / 28.3 / 28.3 dB(A) |
| Hög belastning |
| 29.8 / 38.3 dB(A) |
 | ||
30 dB tyst 40 dB(A) hörbar 50 dB(A) högt ljud |
||
min: | ||
| Lenovo ThinkPad P53-20QN000YGE Quadro RTX 5000 Max-Q, i7-9850H, Samsung PM981a MZVLB1T0HBLR | Lenovo ThinkPad P1 2019-20QT000RGE Quadro T1000 (Laptop), i7-9850H, WDC PC SN720 SDAQNTW-512G | Dell Precision 7530 Quadro P3200, i9-8950HK, Samsung PM961 NVMe MZVLW512HMJP | Fujitsu Celsius H780 Quadro P2000, i7-8850H, Samsung SSD PM981 MZVLB512HAJQ | MSI P65 Creator 9SF-657 GeForce RTX 2070 Max-Q, i9-9880H, 2x Samsung SSD PM981 MZVLB512HAJQ (RAID 0) | Lenovo ThinkPad P52 20MAS03N00 Quadro P1000, i7-8750H, Samsung SSD PM981 MZVLB512HAJQ | |
|---|---|---|---|---|---|---|
| Noise | -4% | -12% | -20% | -18% | -3% | |
| av / miljö * (dB) | 28.3 | 28.8 -2% | 28.3 -0% | 29.6 -5% | 30.2 -7% | 29.5 -4% |
| Idle Minimum * (dB) | 28.3 | 28.8 -2% | 28.3 -0% | 29.6 -5% | 32.8 -16% | 29.5 -4% |
| Idle Average * (dB) | 28.3 | 28.8 -2% | 28.3 -0% | 32.2 -14% | 32.8 -16% | 29.5 -4% |
| Idle Maximum * (dB) | 28.3 | 28.8 -2% | 30.5 -8% | 37 -31% | 33.6 -19% | 29.5 -4% |
| Load Average * (dB) | 29.8 | 36.1 -21% | 34.5 -16% | 40.3 -35% | 40.9 -37% | 34.7 -16% |
| Witcher 3 ultra * (dB) | 38.3 | 49.5 -29% | 33.1 14% | |||
| Load Maximum * (dB) | 38.3 | 36.7 4% | 49.5 -29% | 49.4 -29% | 42.7 -11% | 39.4 -3% |
* ... mindre är bättre
(±) Den maximala temperaturen på ovansidan är 41.8 °C / 107 F, jämfört med genomsnittet av 38.2 °C / 101 F , allt från 22.2 till 69.8 °C för klassen Workstation.
(-) Botten värms upp till maximalt 46.1 °C / 115 F, jämfört med genomsnittet av 41.1 °C / 106 F
(+) Vid tomgångsbruk är medeltemperaturen för ovansidan 21.9 °C / 71 F, jämfört med enhetsgenomsnittet på 32 °C / ### class_avg_f### F.
(±) När du spelar The Witcher 3 är medeltemperaturen för ovansidan 38 °C / 100 F, jämfört med enhetsgenomsnittet på 32 °C / ## #class_avg_f### F.
(±) Handledsstöden och pekplattan kan bli väldigt varma vid beröring med maximalt 37.1 °C / 98.8 F.
(-) Medeltemperaturen för handledsstödsområdet på liknande enheter var 27.8 °C / 82 F (-9.3 °C / -16.8 F).
Lenovo ThinkPad P53-20QN000YGE ljudanalys
(±) | högtalarljudstyrkan är genomsnittlig men bra (72.8 dB)
Bas 100 - 315 Hz
(±) | reducerad bas - i genomsnitt 11.6% lägre än medianen
(±) | linjäriteten för basen är genomsnittlig (13.6% delta till föregående frekvens)
Mellan 400 - 2000 Hz
(±) | högre mellan - i genomsnitt 7.8% högre än median
(±) | linjäriteten för mids är genomsnittlig (7.5% delta till föregående frekvens)
Högsta 2 - 16 kHz
(+) | balanserade toppar - endast 1.9% från medianen
(+) | toppar är linjära (4.8% delta till föregående frekvens)
Totalt 100 - 16 000 Hz
(±) | linjäriteten för det totala ljudet är genomsnittlig (23.1% skillnad mot median)
Jämfört med samma klass
» 83% av alla testade enheter i den här klassen var bättre, 3% liknande, 14% sämre
» Den bästa hade ett delta på 7%, genomsnittet var 17%, sämst var 35%
Jämfört med alla testade enheter
» 69% av alla testade enheter var bättre, 5% liknande, 26% sämre
» Den bästa hade ett delta på 4%, genomsnittet var 24%, sämst var 134%
Dell Precision 7530 ljudanalys
(±) | högtalarljudstyrkan är genomsnittlig men bra (74.4 dB)
Bas 100 - 315 Hz
(±) | reducerad bas - i genomsnitt 8% lägre än medianen
(±) | linjäriteten för basen är genomsnittlig (12.3% delta till föregående frekvens)
Mellan 400 - 2000 Hz
(+) | balanserad mellan - endast 3.3% från medianen
(±) | linjäriteten för mids är genomsnittlig (7.8% delta till föregående frekvens)
Högsta 2 - 16 kHz
(+) | balanserade toppar - endast 2.3% från medianen
(+) | toppar är linjära (5% delta till föregående frekvens)
Totalt 100 - 16 000 Hz
(+) | det totala ljudet är linjärt (11.4% skillnad mot median)
Jämfört med samma klass
» 13% av alla testade enheter i den här klassen var bättre, 4% liknande, 83% sämre
» Den bästa hade ett delta på 7%, genomsnittet var 17%, sämst var 35%
Jämfört med alla testade enheter
» 7% av alla testade enheter var bättre, 2% liknande, 91% sämre
» Den bästa hade ett delta på 4%, genomsnittet var 24%, sämst var 134%
| Av/Standby | |
| Låg belastning | |
| Hög belastning |
|
Förklaring:
min: | |
| Lenovo ThinkPad P53-20QN000YGE i7-9850H, Quadro RTX 5000 Max-Q, Samsung PM981a MZVLB1T0HBLR, IPS, 1920x1080, 15.6" | Lenovo ThinkPad P1 2019-20QT000RGE i7-9850H, Quadro T1000 (Laptop), WDC PC SN720 SDAQNTW-512G, IPS LED, 1920x1080, 15.6" | Dell Precision 7530 i9-8950HK, Quadro P3200, Samsung PM961 NVMe MZVLW512HMJP, IPS, 3840x2160, 15.6" | Fujitsu Celsius H780 i7-8850H, Quadro P2000, Samsung SSD PM981 MZVLB512HAJQ, IPS LED, 1920x1080, 15.6" | MSI P65 Creator 9SF-657 i9-9880H, GeForce RTX 2070 Max-Q, 2x Samsung SSD PM981 MZVLB512HAJQ (RAID 0), IPS, 3840x2160, 15.6" | Lenovo ThinkPad P52 20MAS03N00 i7-8750H, Quadro P1000, Samsung SSD PM981 MZVLB512HAJQ, IPS LED, 1920x1080, 15.6" | |
|---|---|---|---|---|---|---|
| Power Consumption | -20% | -40% | 3% | -22% | 35% | |
| Idle Minimum * (Watt) | 7.9 | 13.7 -73% | 15.7 -99% | 9.1 -15% | 9.4 -19% | 4.02 49% |
| Idle Average * (Watt) | 11.8 | 17.5 -48% | 20.3 -72% | 13.2 -12% | 17.4 -47% | 7.2 39% |
| Idle Maximum * (Watt) | 14.9 | 20.9 -40% | 25.7 -72% | 14.04 6% | 19.6 -32% | 11.46 23% |
| Load Average * (Watt) | 96 | 77.2 20% | 118.9 -24% | 78.8 18% | 103 -7% | 76.3 21% |
| Witcher 3 ultra * (Watt) | 149 | 131.2 12% | 74 50% | |||
| Load Maximum * (Watt) | 207.8 | 123.7 40% | 174 16% | 172.5 17% | 216 -4% | 154 26% |
* ... mindre är bättre
| Lenovo ThinkPad P53-20QN000YGE i7-9850H, Quadro RTX 5000 Max-Q, 90 Wh | Lenovo ThinkPad P1 2019-20QT000RGE i7-9850H, Quadro T1000 (Laptop), 80 Wh | Dell Precision 7530 i9-8950HK, Quadro P3200, 97 Wh | Fujitsu Celsius H780 i7-8850H, Quadro P2000, 96 Wh | MSI P65 Creator 9SF-657 i9-9880H, GeForce RTX 2070 Max-Q, 82 Wh | Lenovo ThinkPad P52 20MAS03N00 i7-8750H, Quadro P1000, 96 Wh | Genomsnitt av klass Workstation | |
|---|---|---|---|---|---|---|---|
| Batteridrifttid | -20% | -40% | -32% | -46% | -5% | -18% | |
| H.264 (h) | 9.8 | 9.3 -5% | 12.2 24% | 9.51 ? -3% | |||
| WiFi v1.3 (h) | 11.1 | 8.9 -20% | 4.6 -59% | 7.5 -32% | 6 -46% | 10.6 -5% | 8.53 ? -23% |
| Load (h) | 2 | 1.3 -35% | 1.6 -20% | 1.1 -45% | 1.3 -35% | 1.429 ? -29% | |
| Reader / Idle (h) | 6.4 | 9.6 | 25.3 | 26.1 ? |
För
Emot
Läs den fullständiga versionen av den här recensionen på engelska här.
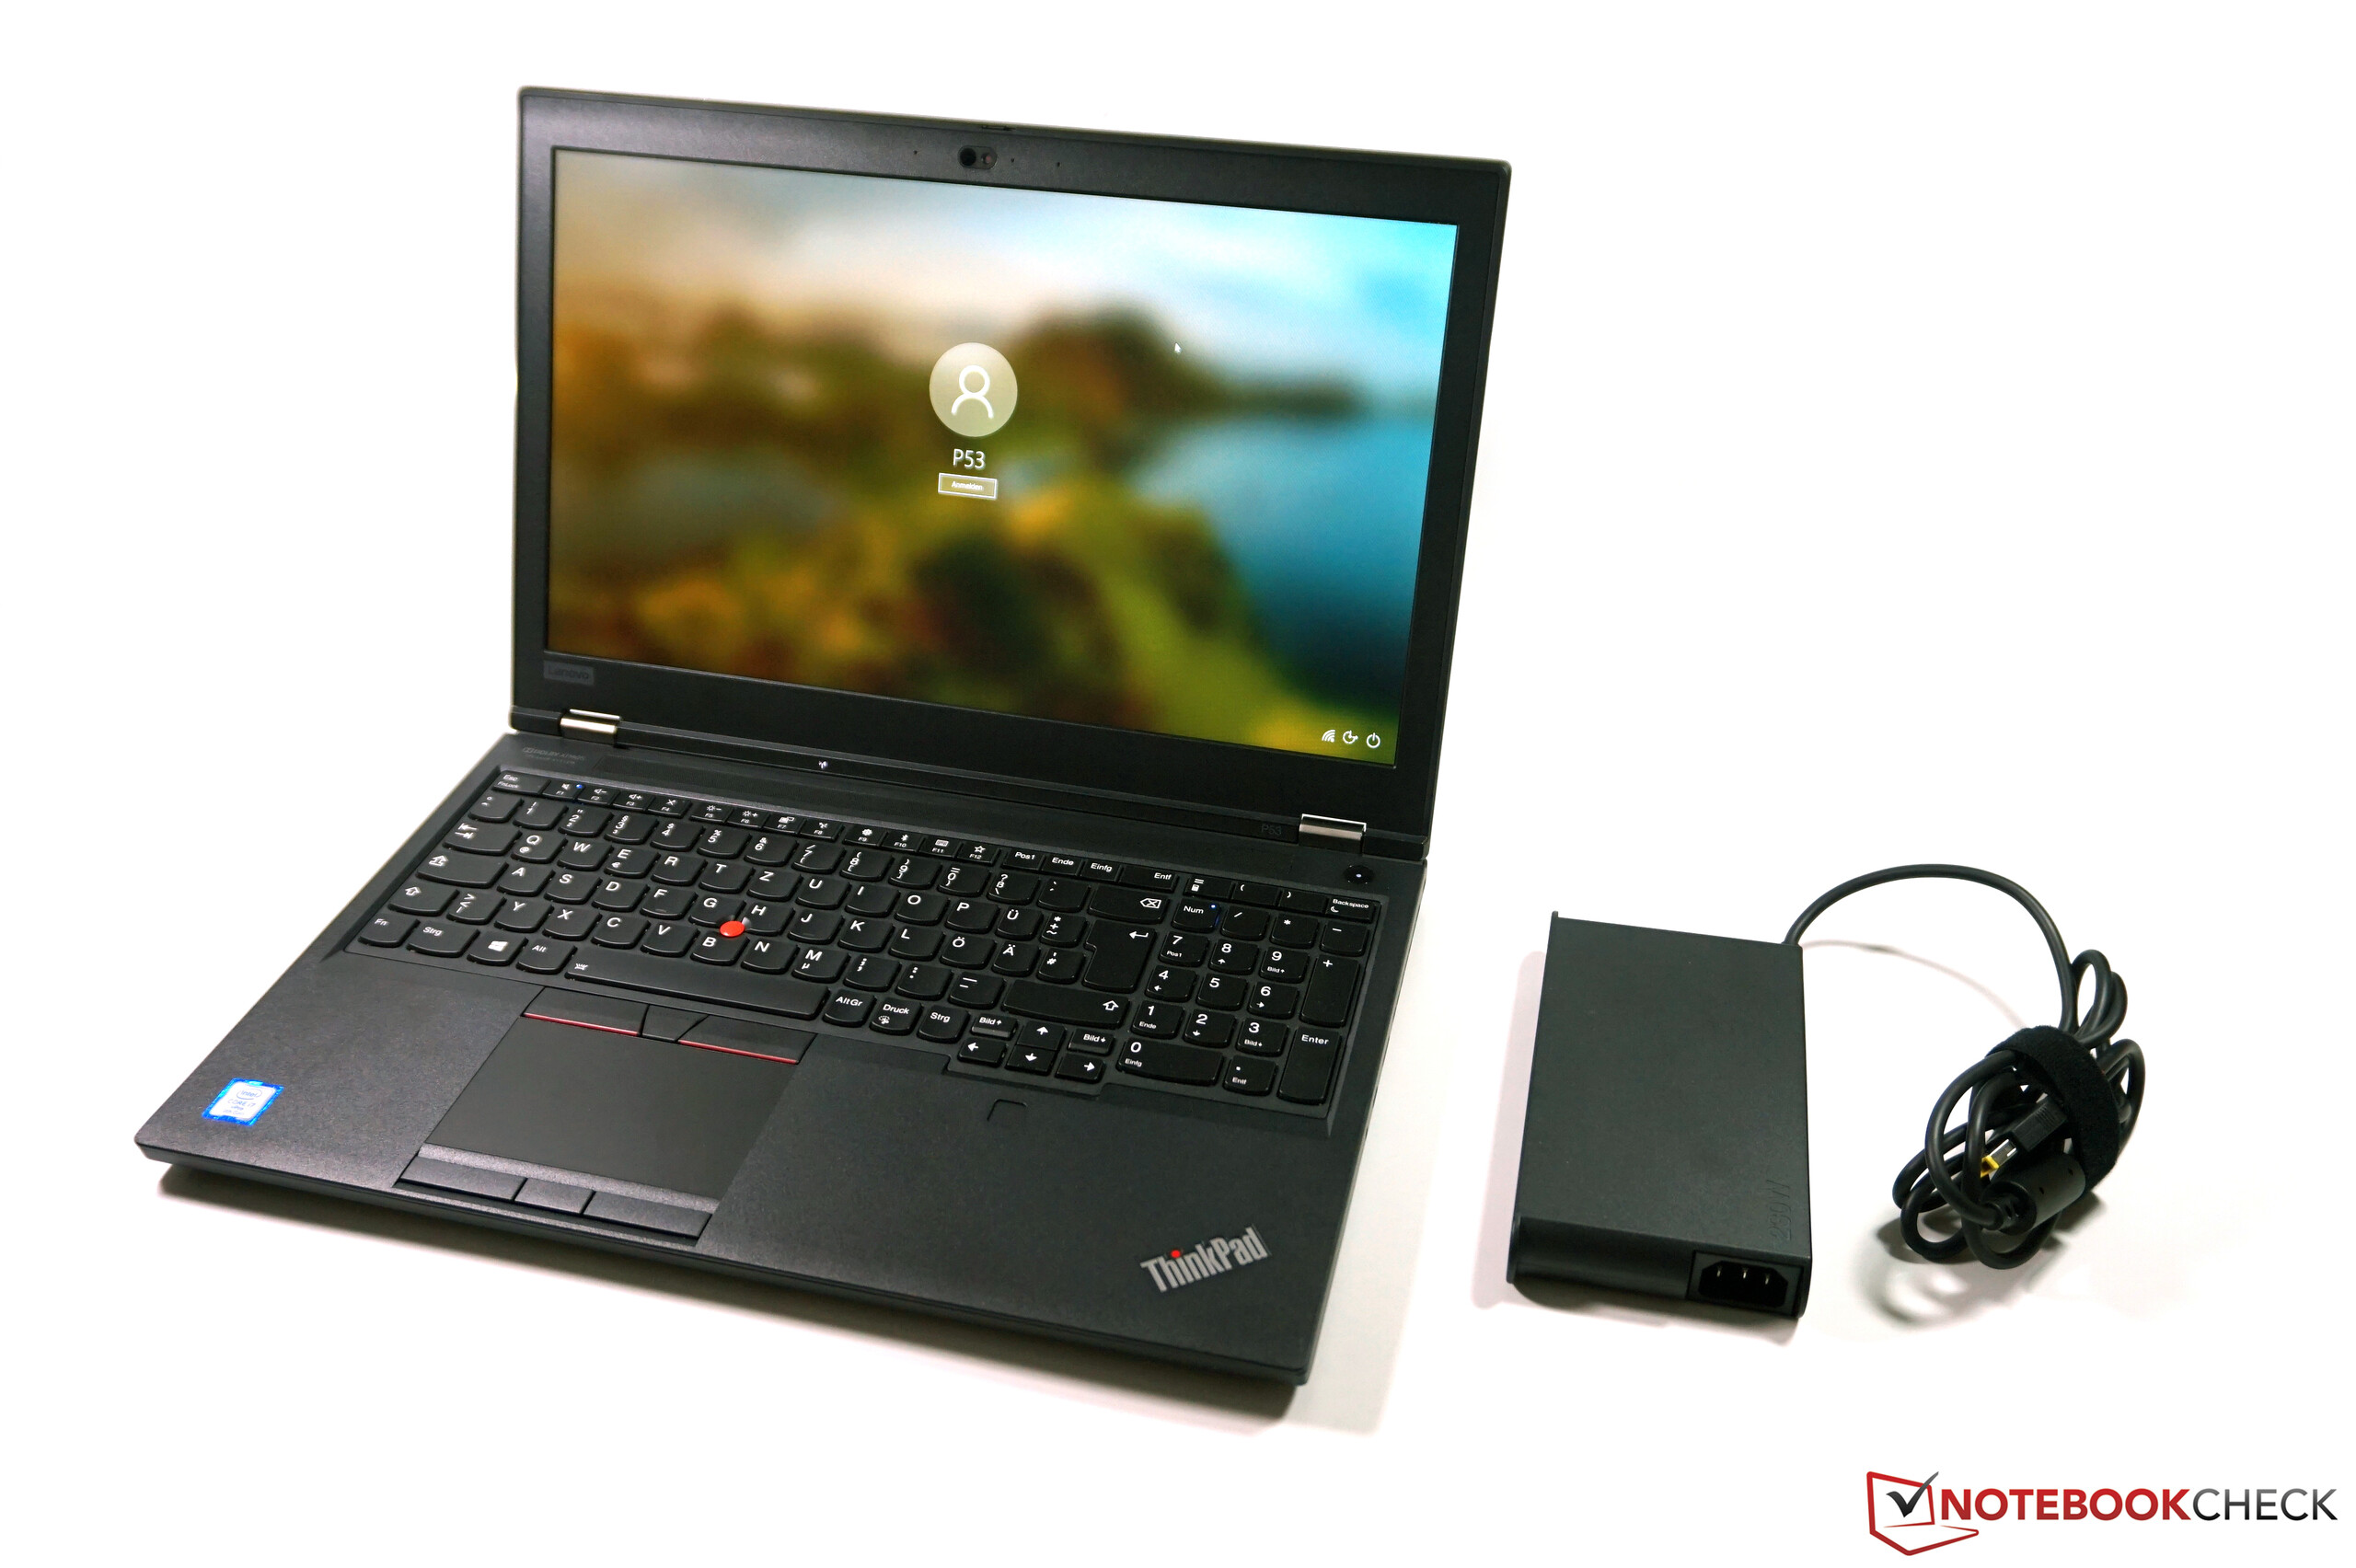
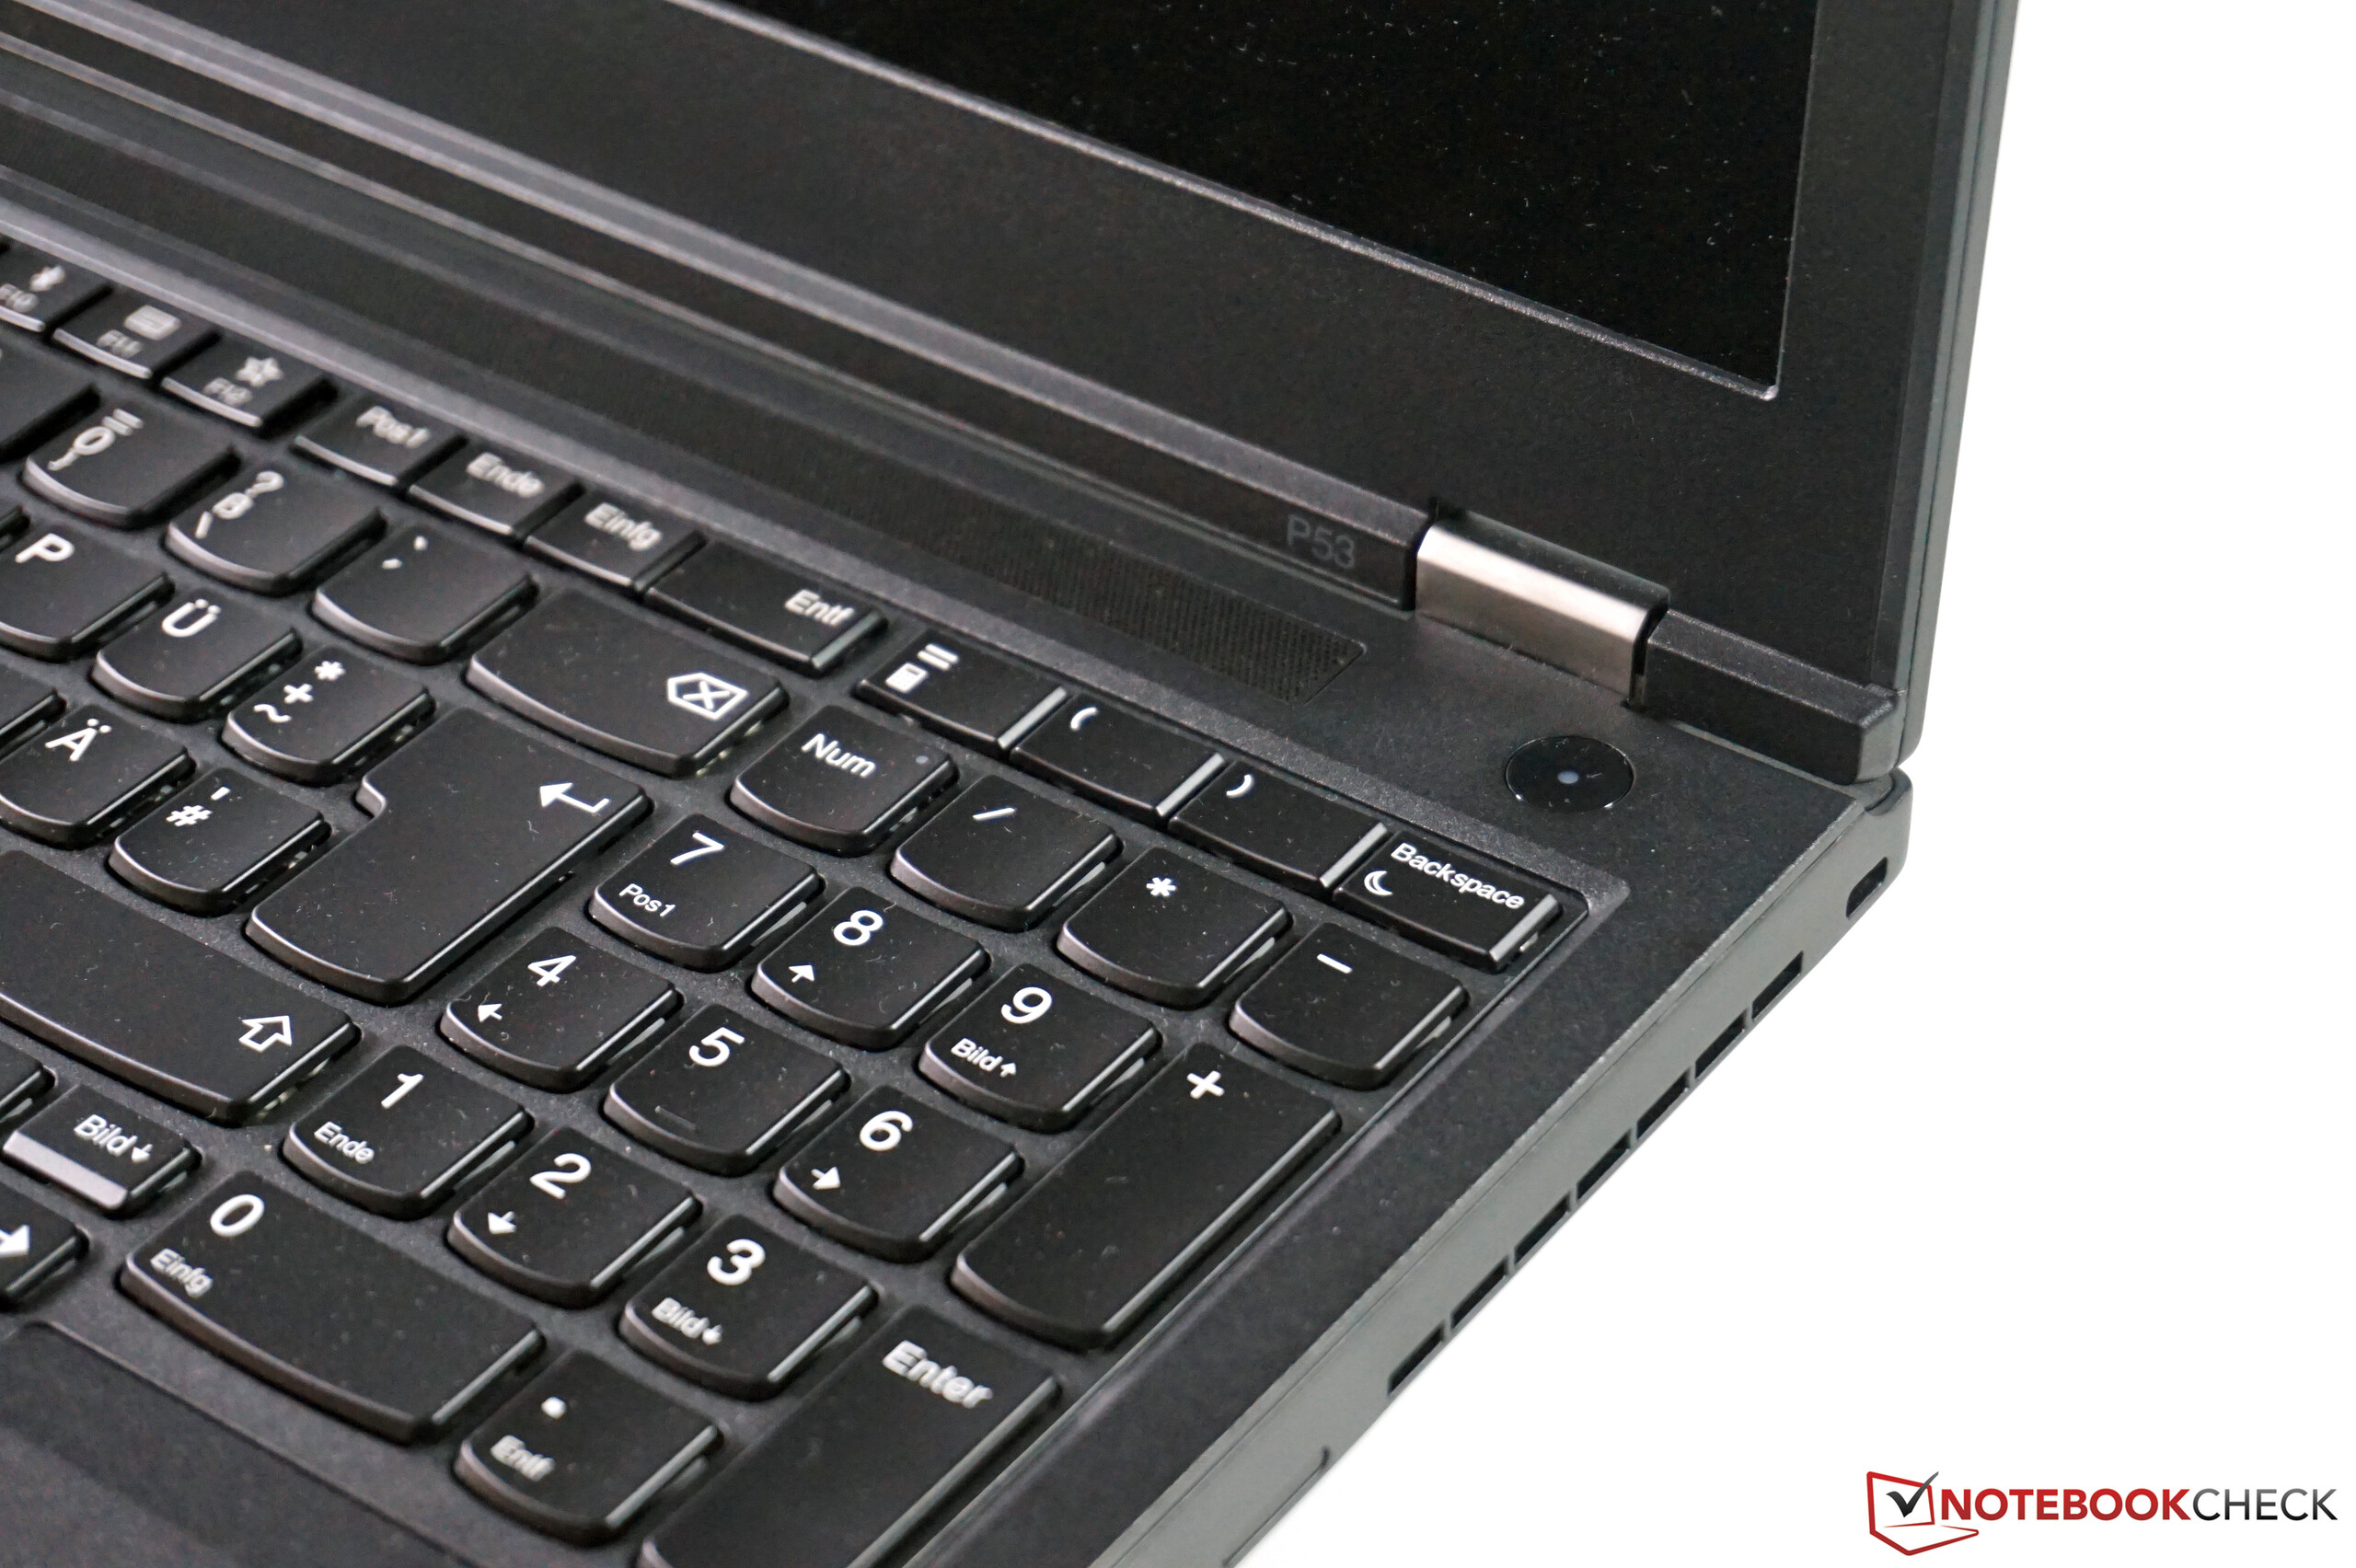
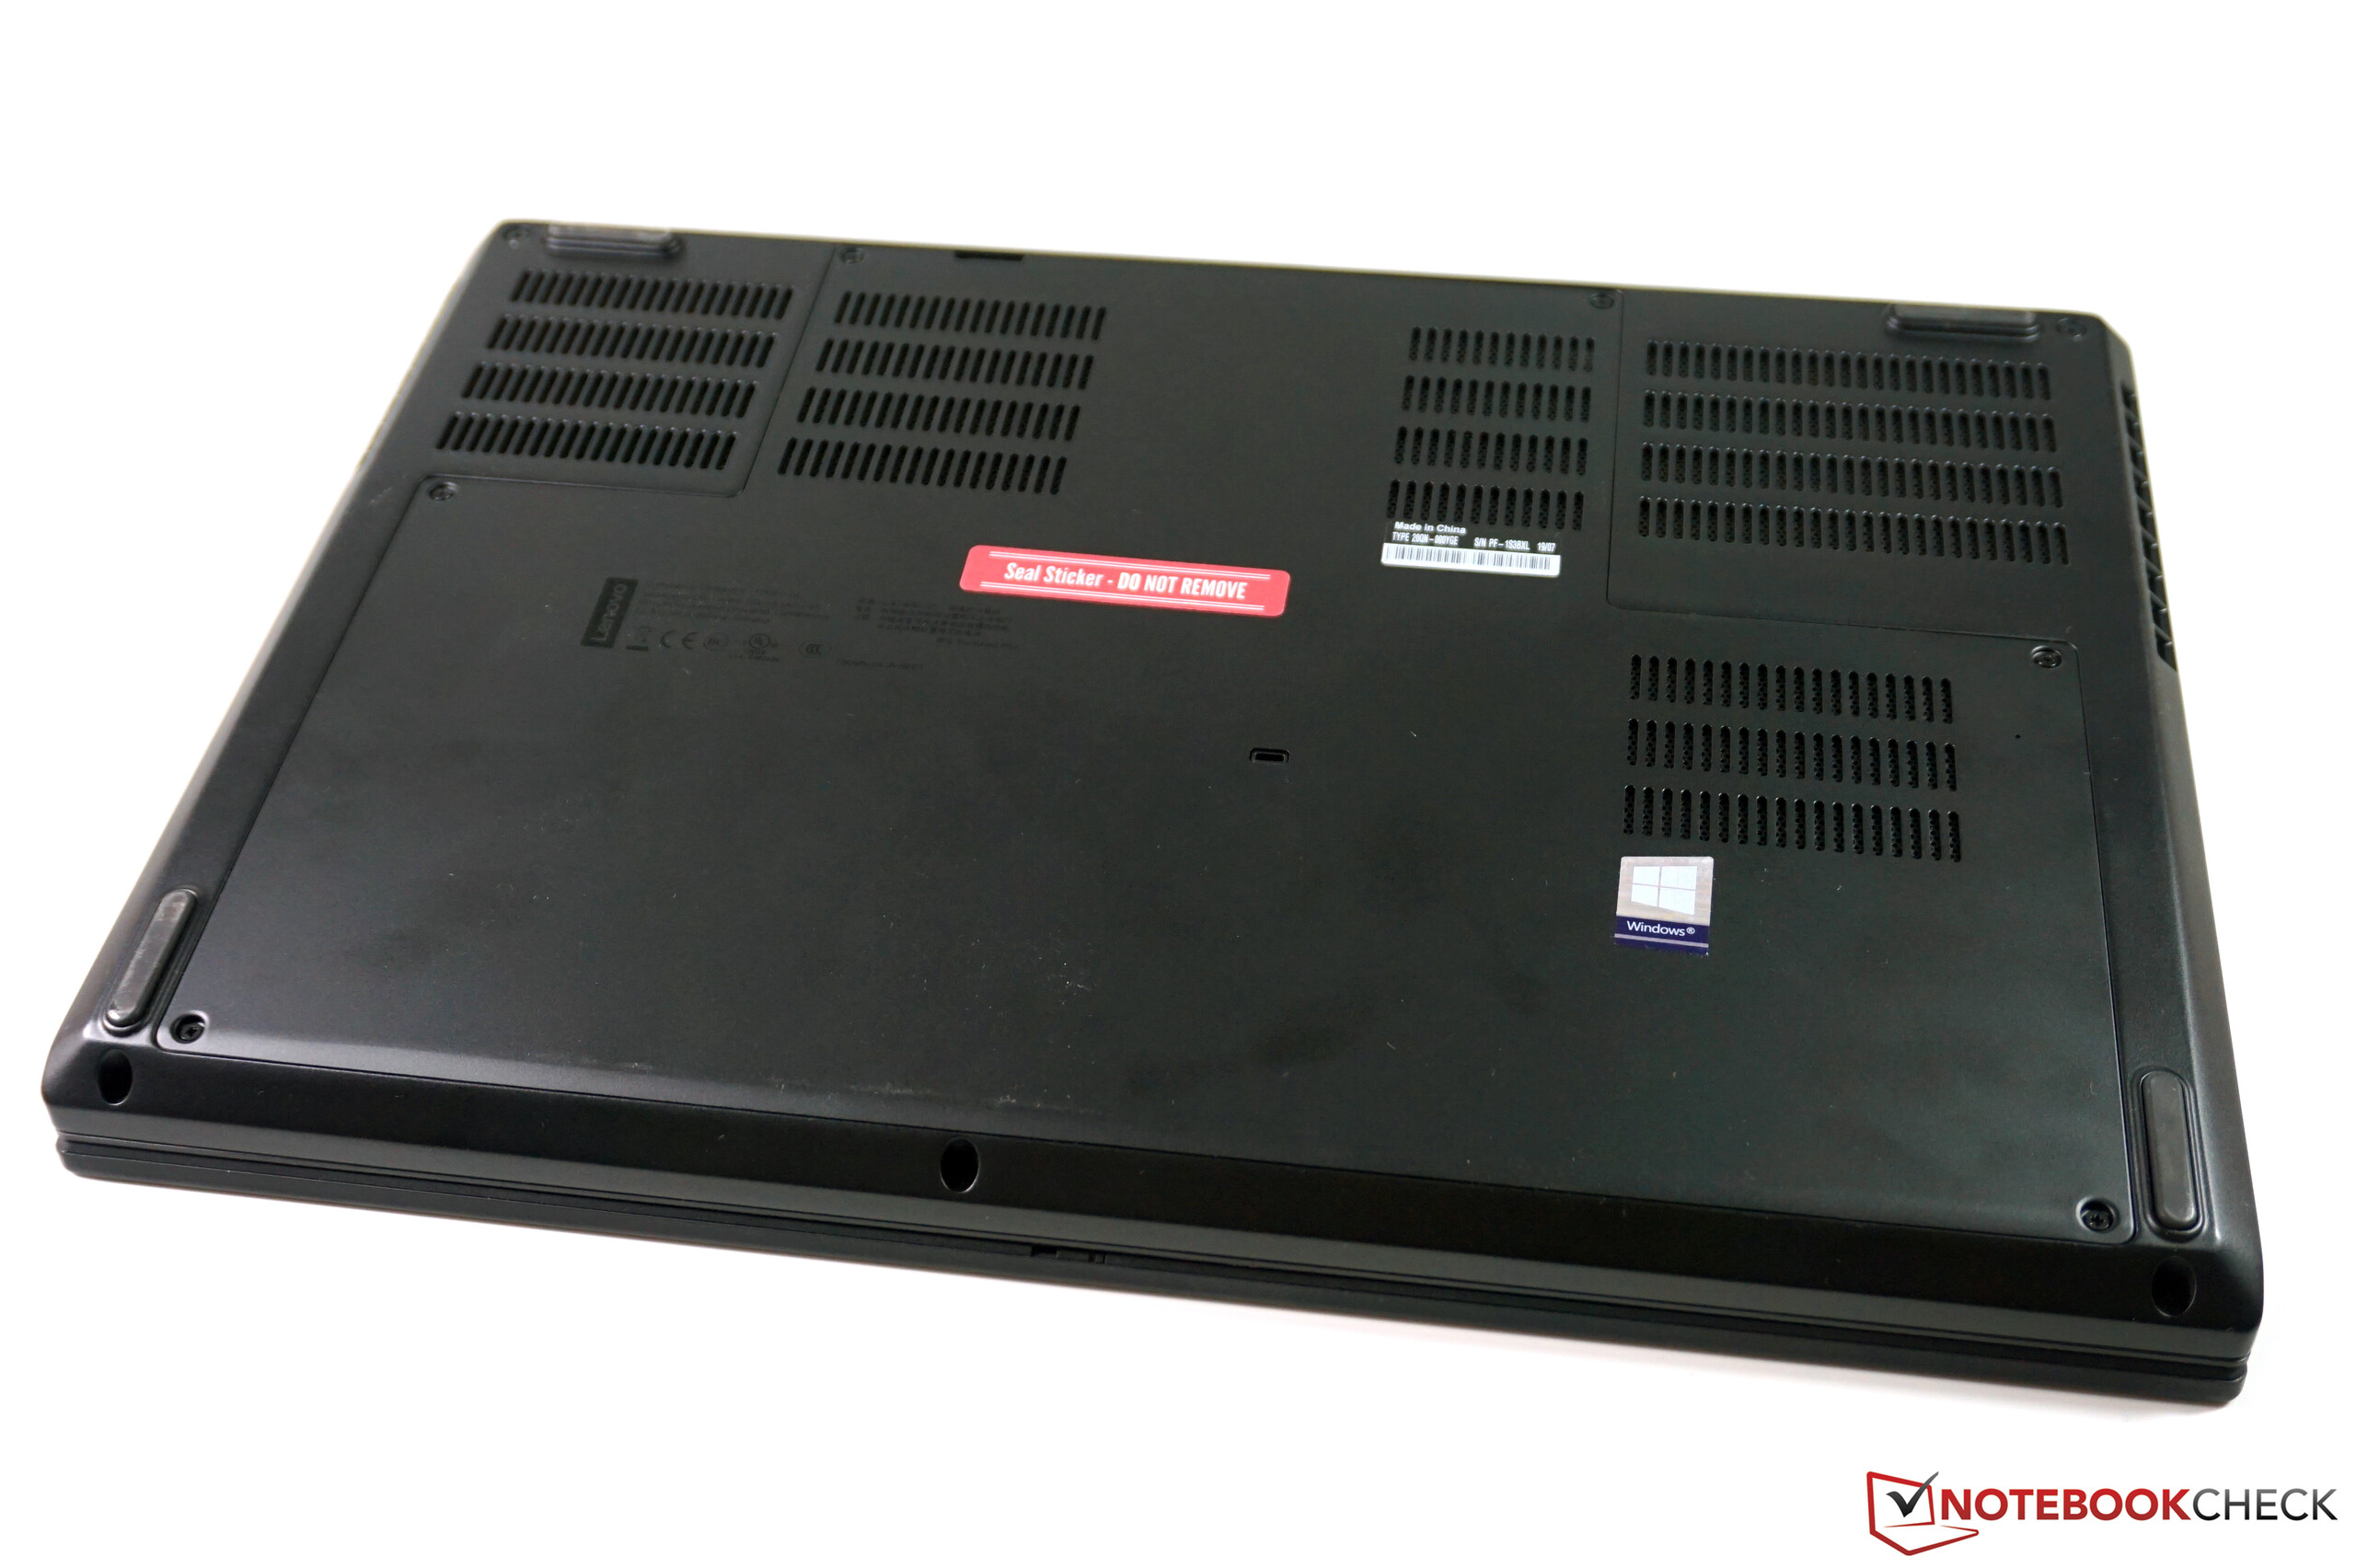
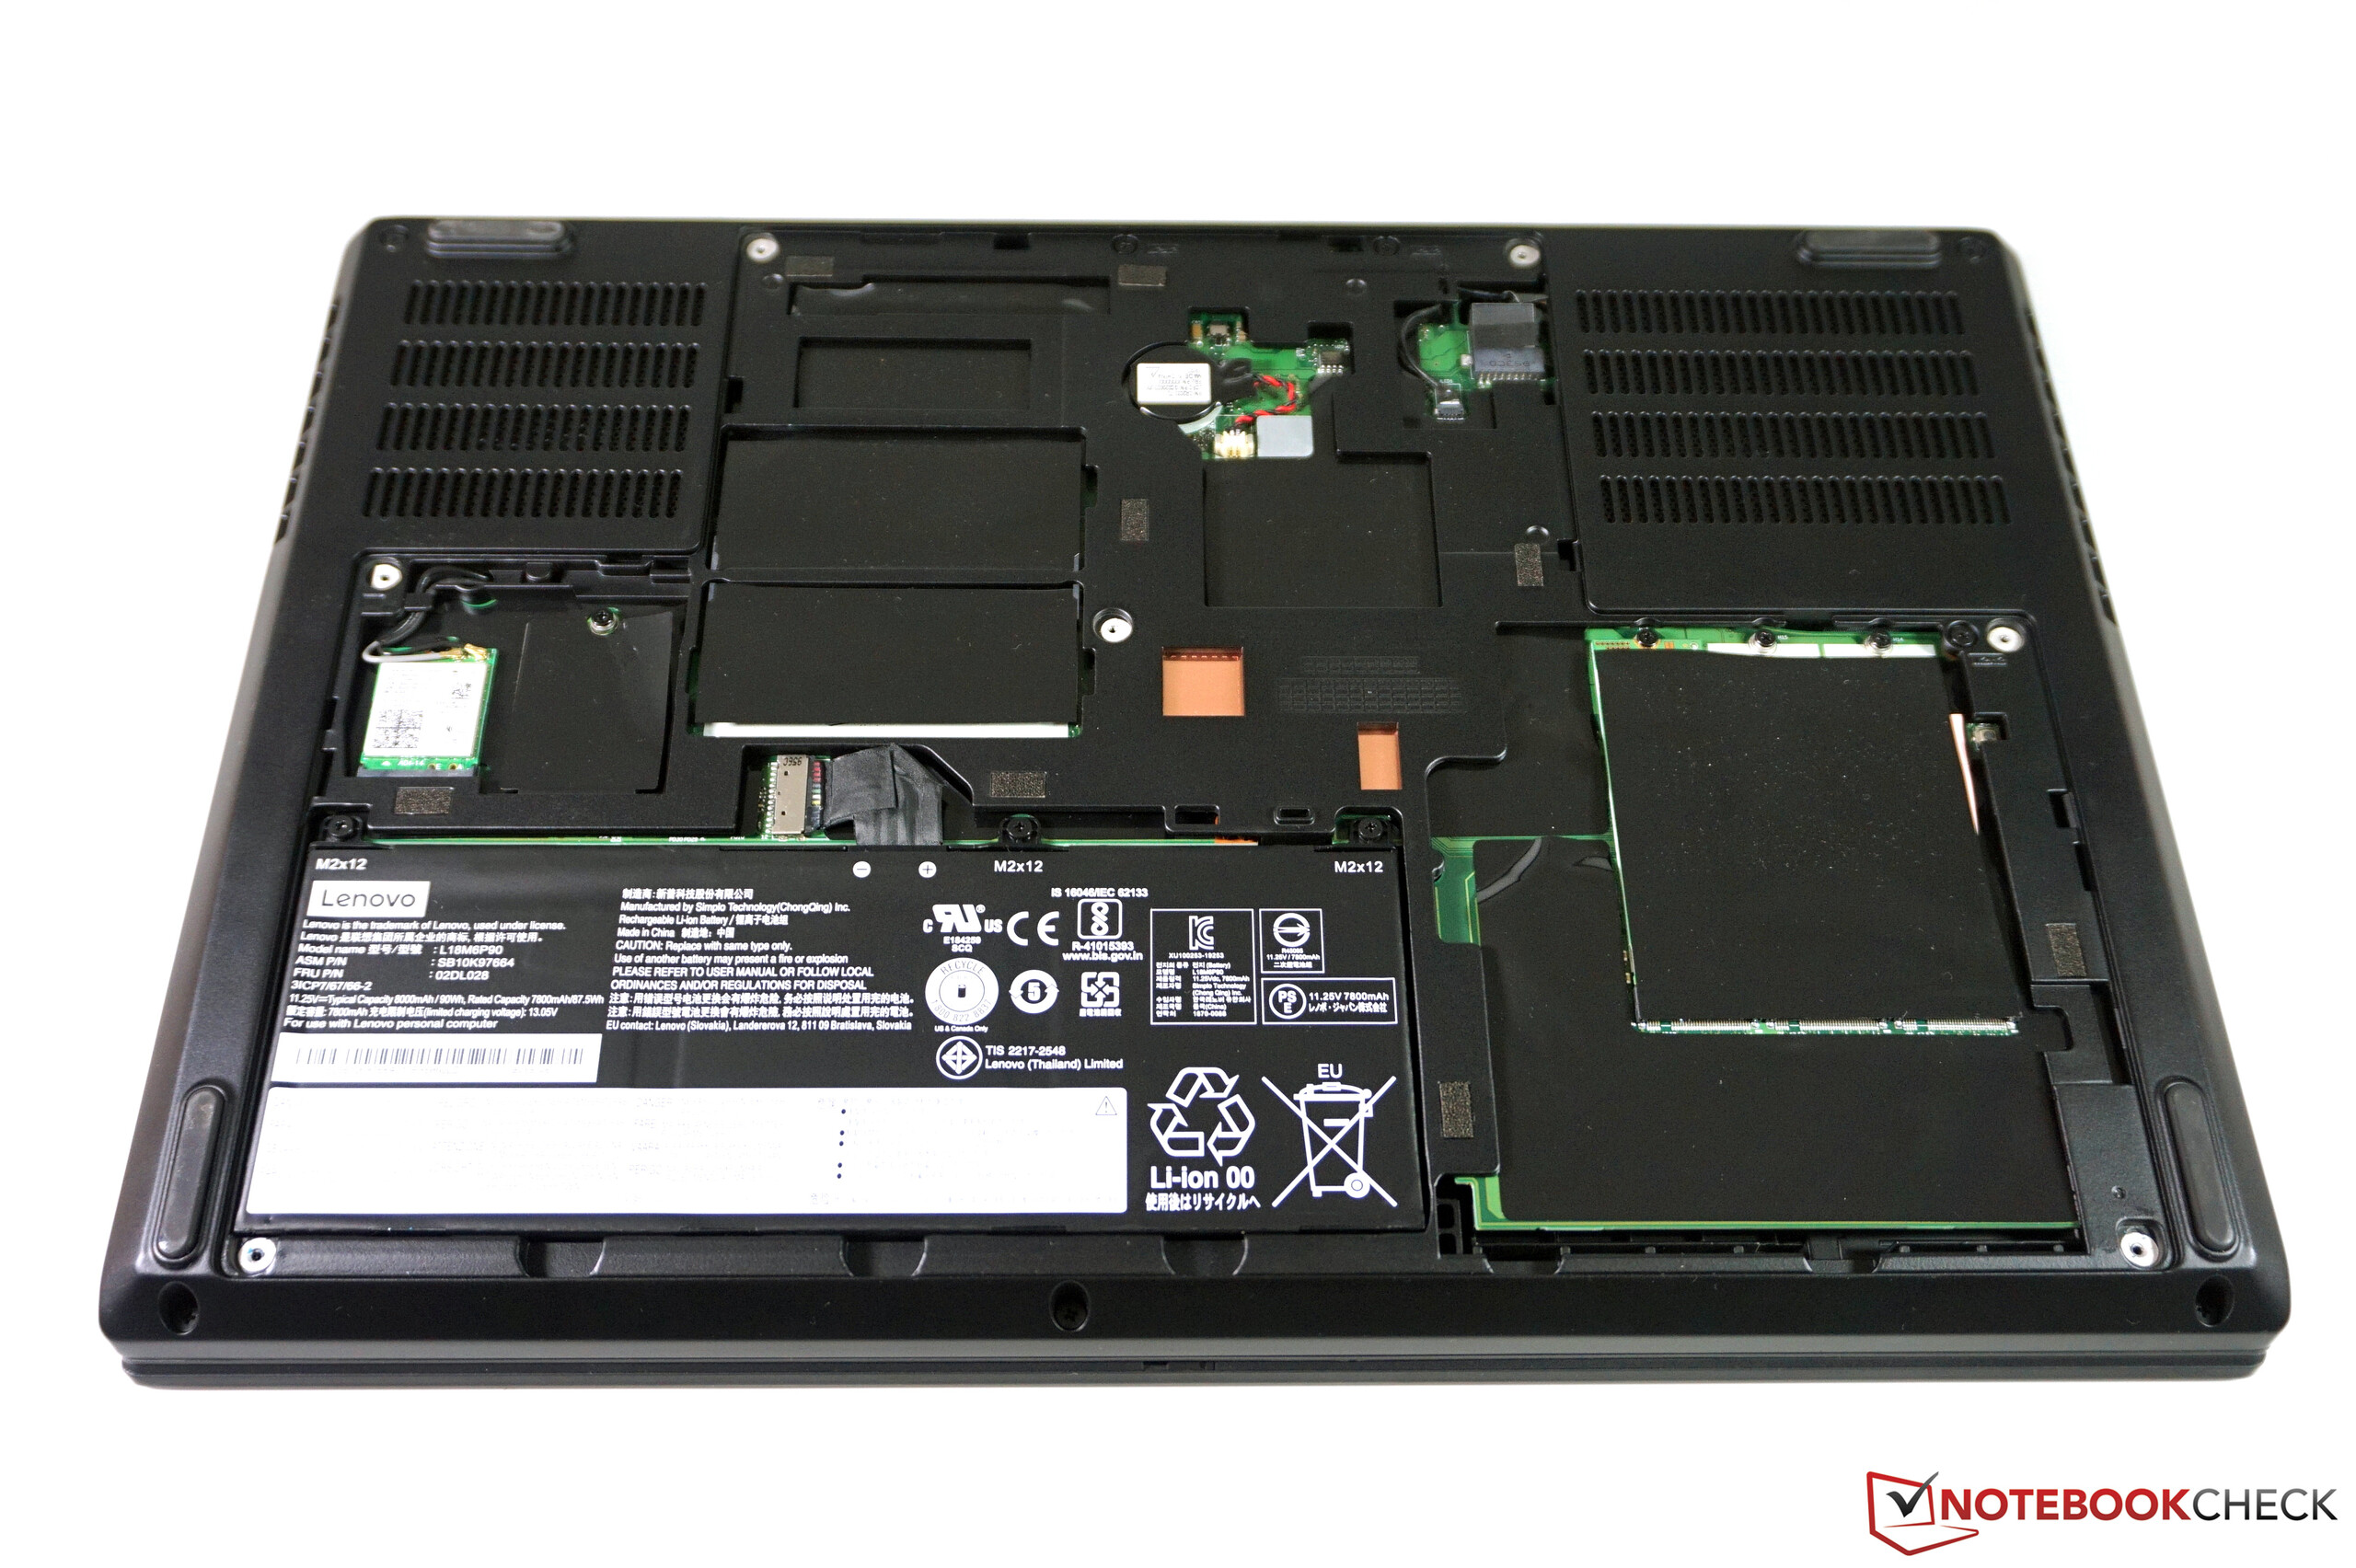
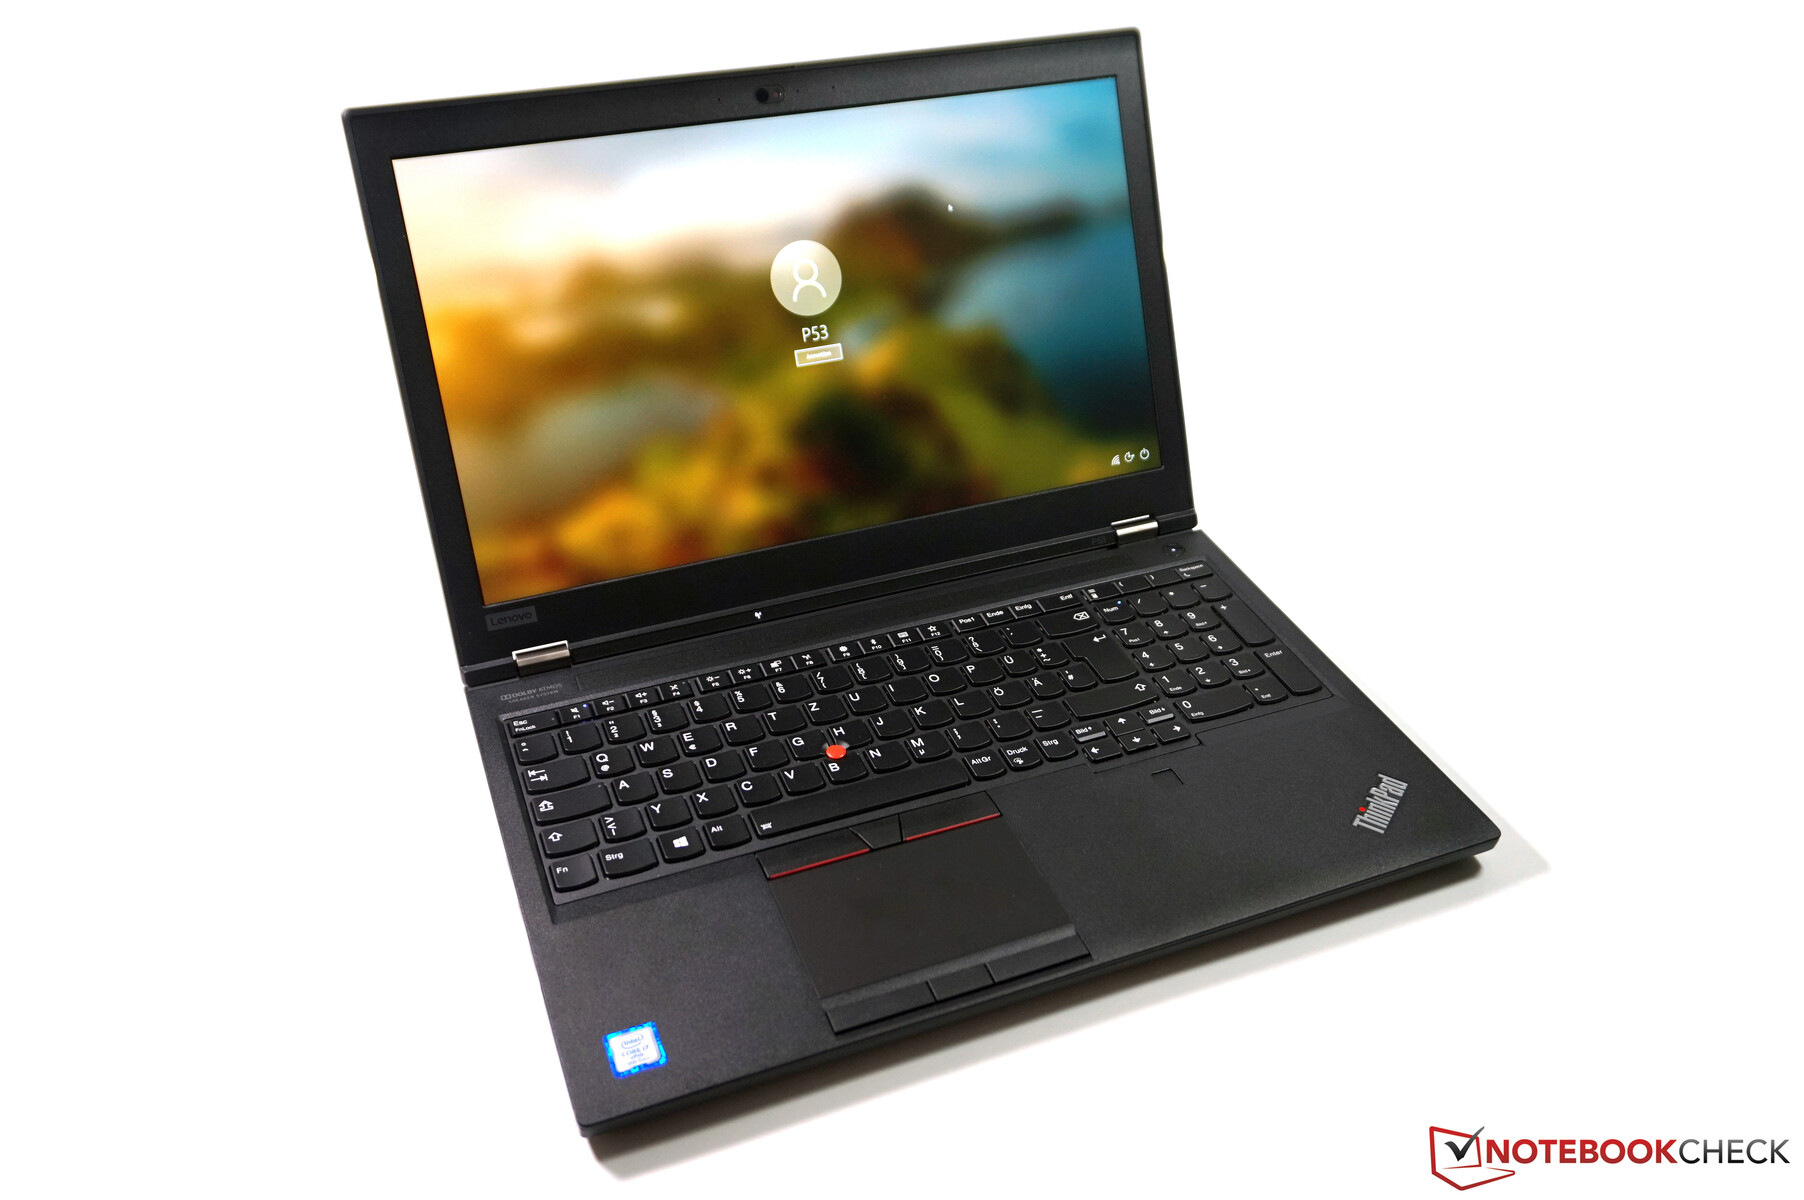
ThinkPad P53 är fortfarande en traditionell mobil arbetsstation som inte bryr sig särskilt mycket om de senaste trenderna rörande tunnare och tunnare chassin och infattningar. Men som ett resultat är höljet riktigt robust, det finns många portar, det är lätt att uppgradera datorn och hårdvaran är riktigt kraftfull, särskilt när det kommer till grafiken.
På utsidan är det inte mycket som ändrats jämfört med förra årets ThinkPad P52, men en del saker har skett under huven. Det största försäljningsargumentet är kraftigare grafikkort (Quadro RTX 4000 & 5000), som oftast bara förekommer i arbetsstationer på 17 tum. Här får vi ge en del kritik, för det är inte uppenbart vilken version av grafikkortet man får. Varken Nvidia eller Lenovo berättar faktum att det är den långsammare versionen på 80 watt som systemet använder. Lenovo använder också den långsammare varianten av RTX 4000. Totalt sett är grafikprestandan dock ändå imponerande.
En ljusstark 1080p-skärm, utmärkta inmatningsenheter och massor av prestanda: ThinkPad P53 är en riktigt välavrundad produkt utan några egentliga svagheter. Det enda vi kan ge den kritik för är kyllösningen som kunde varit bättre optimerad för kombinerad belastning av CPU & GPU.
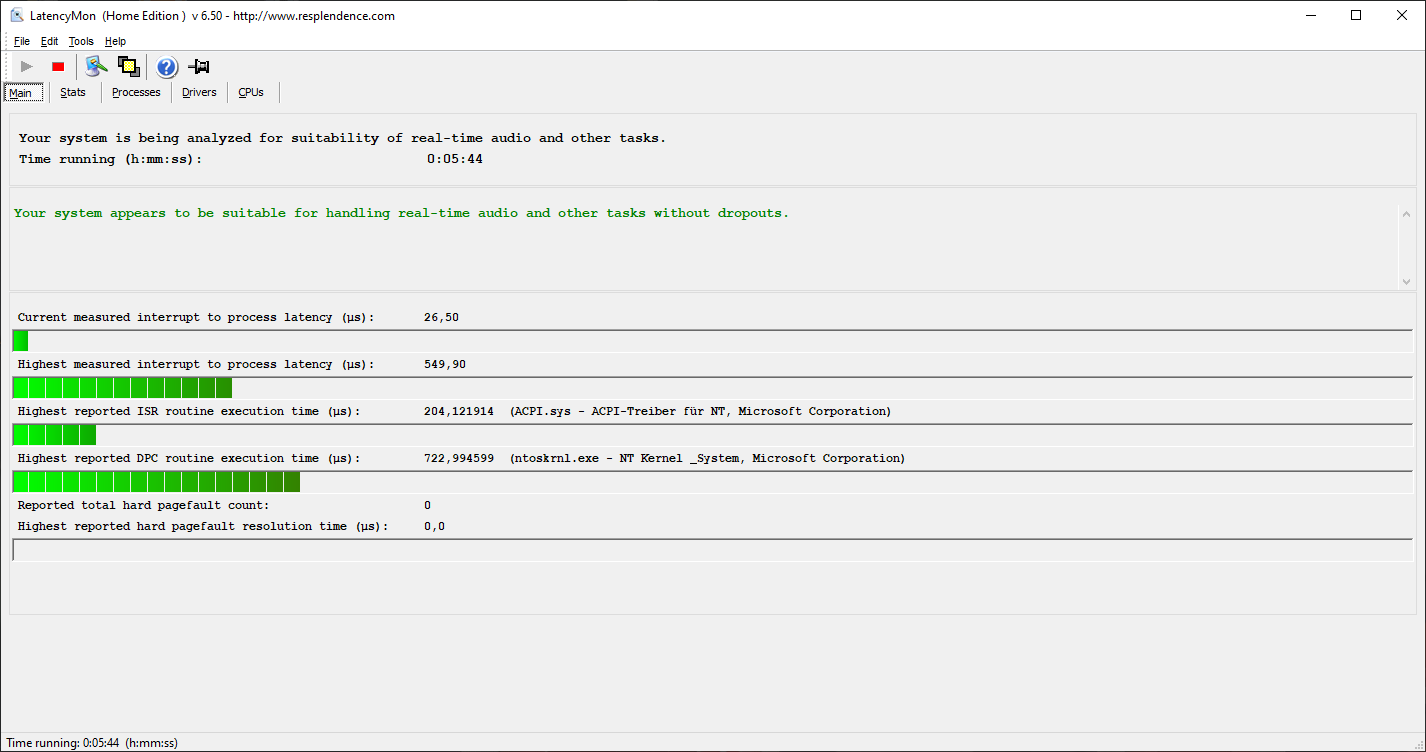
Kyllösningen är heller inte perfekt. Vi uppskattade den defensiva fläktkontrollen som till och med förhindrade att fläktarna snurrande efter korta perioder av belastning. Men kyllösningen kunde inte hålla jämna steg med en kombinerad belastning av CPU & GPU, vilket resulterade i sänkt processorprestanda. Även om det är bra med tysta fläktar så vill nog den som köpt toppskiktskomponenter i den här prisklassen kunna använda dem fullt ut. Vi är övertygade om att kyllösningen hade kunnat varit mer effektiv även om det hade resulterat i en högre ljudnivå. Vid det här laget kan vi bara gissa hur andra konfigurationer av P53 presterar, men vi tänker oss att modellerna med enklare grafikkort (exempelvis RTX 3000 eller T-serien) kan använda processorn bättre.
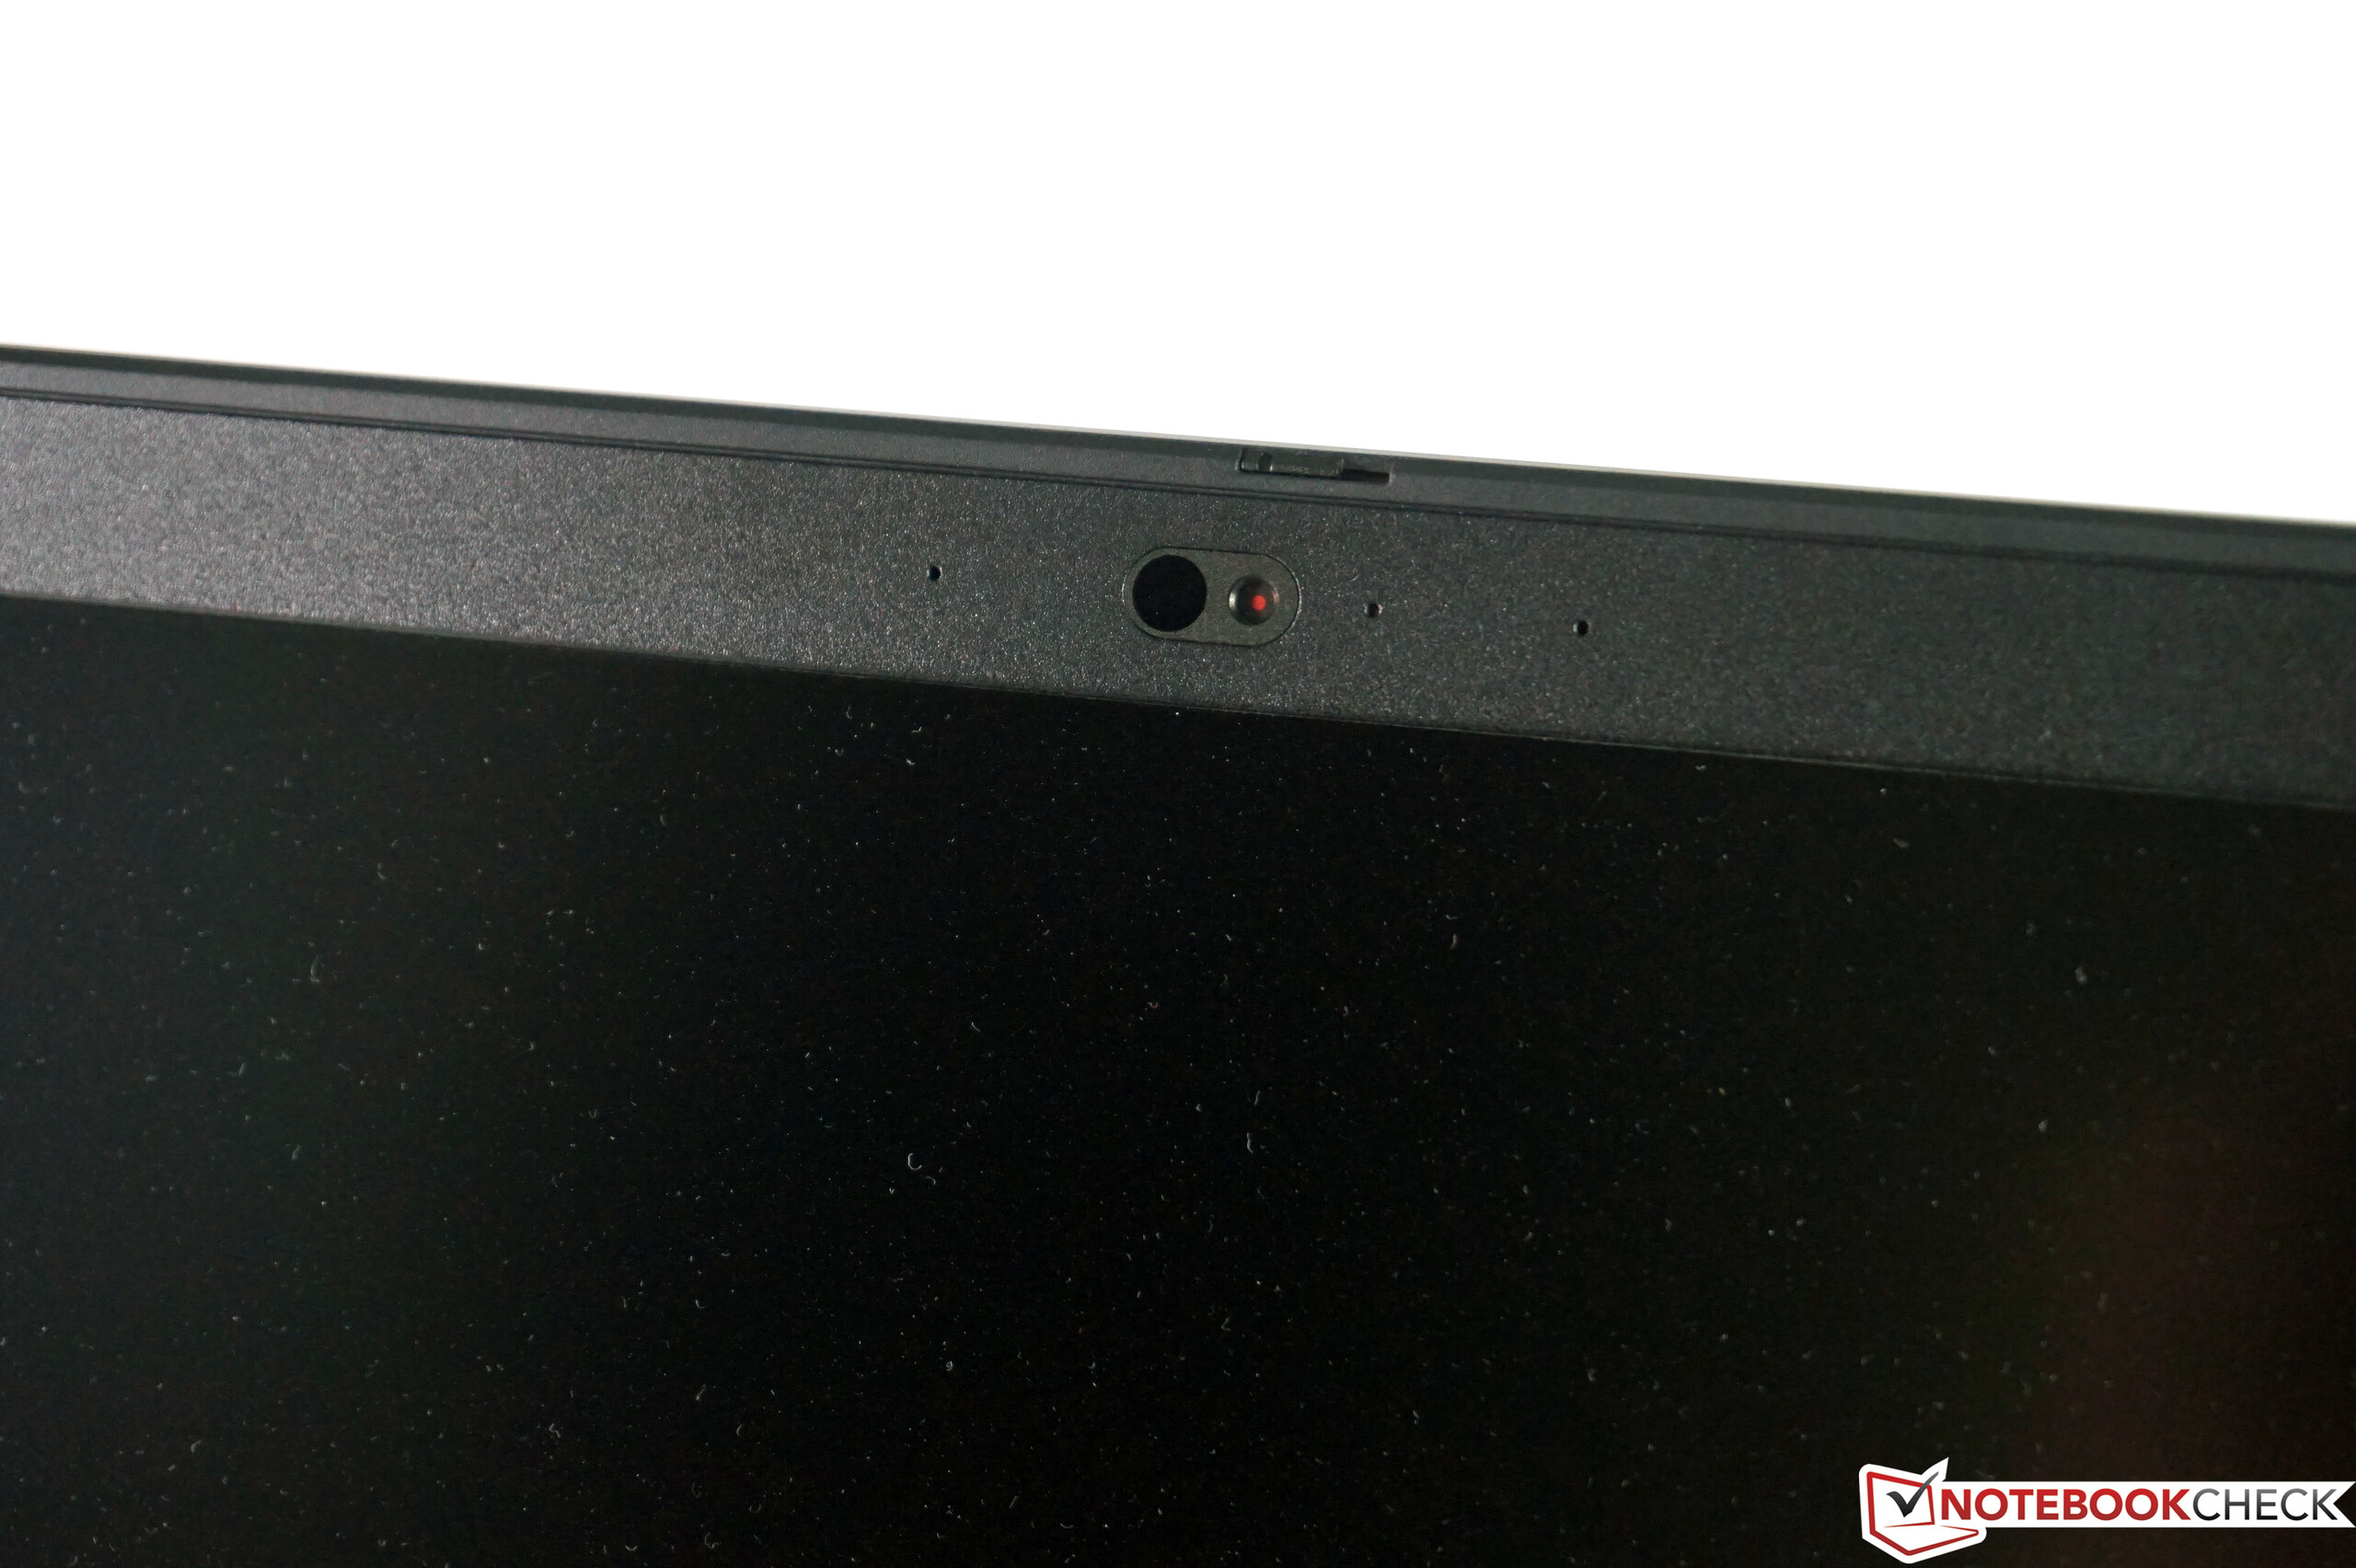
I likhet med många aktuella ThinkPad-modeller har Lenovos P53 fått en betydande uppgradering av skärmalternativen. Även om baskonfigurationen fortfarande inkluderar en IPS-panel med en ljusstyrka på 300 cd/m² så finns det också en mer ljusstark 1080p-modell att välja. Vidare erbjuder Lenovo två högupplösta skärmar (en 4K IPS och en 4K OLED), vilket borde garantera att alla användare kan hitta något som passar.
Kritiken är en aning petig, för ThinkPad P53 har inga egentliga brister och förtjänar sitt totalt sett goda omdöme.
Lenovo ThinkPad P53-20QN000YGE
- 11/14/2019 v7 (old)
Andreas Osthoff
Price comparison
