Dom - Mestadels mindre uppgraderingar
Dell 16 Premium är i huvudsak en prestandaförbättrad XPS 16 9640. Den levereras med nyare, snabbare och effektivare Intel- och Nvidia-processorer som kraftfulla användare kan uppskatta. Om dina dagliga arbetsbelastningar inte kräver betydande processorkraft kan dock den billigare XPS 16 9640 ge dig en identisk användarupplevelse.
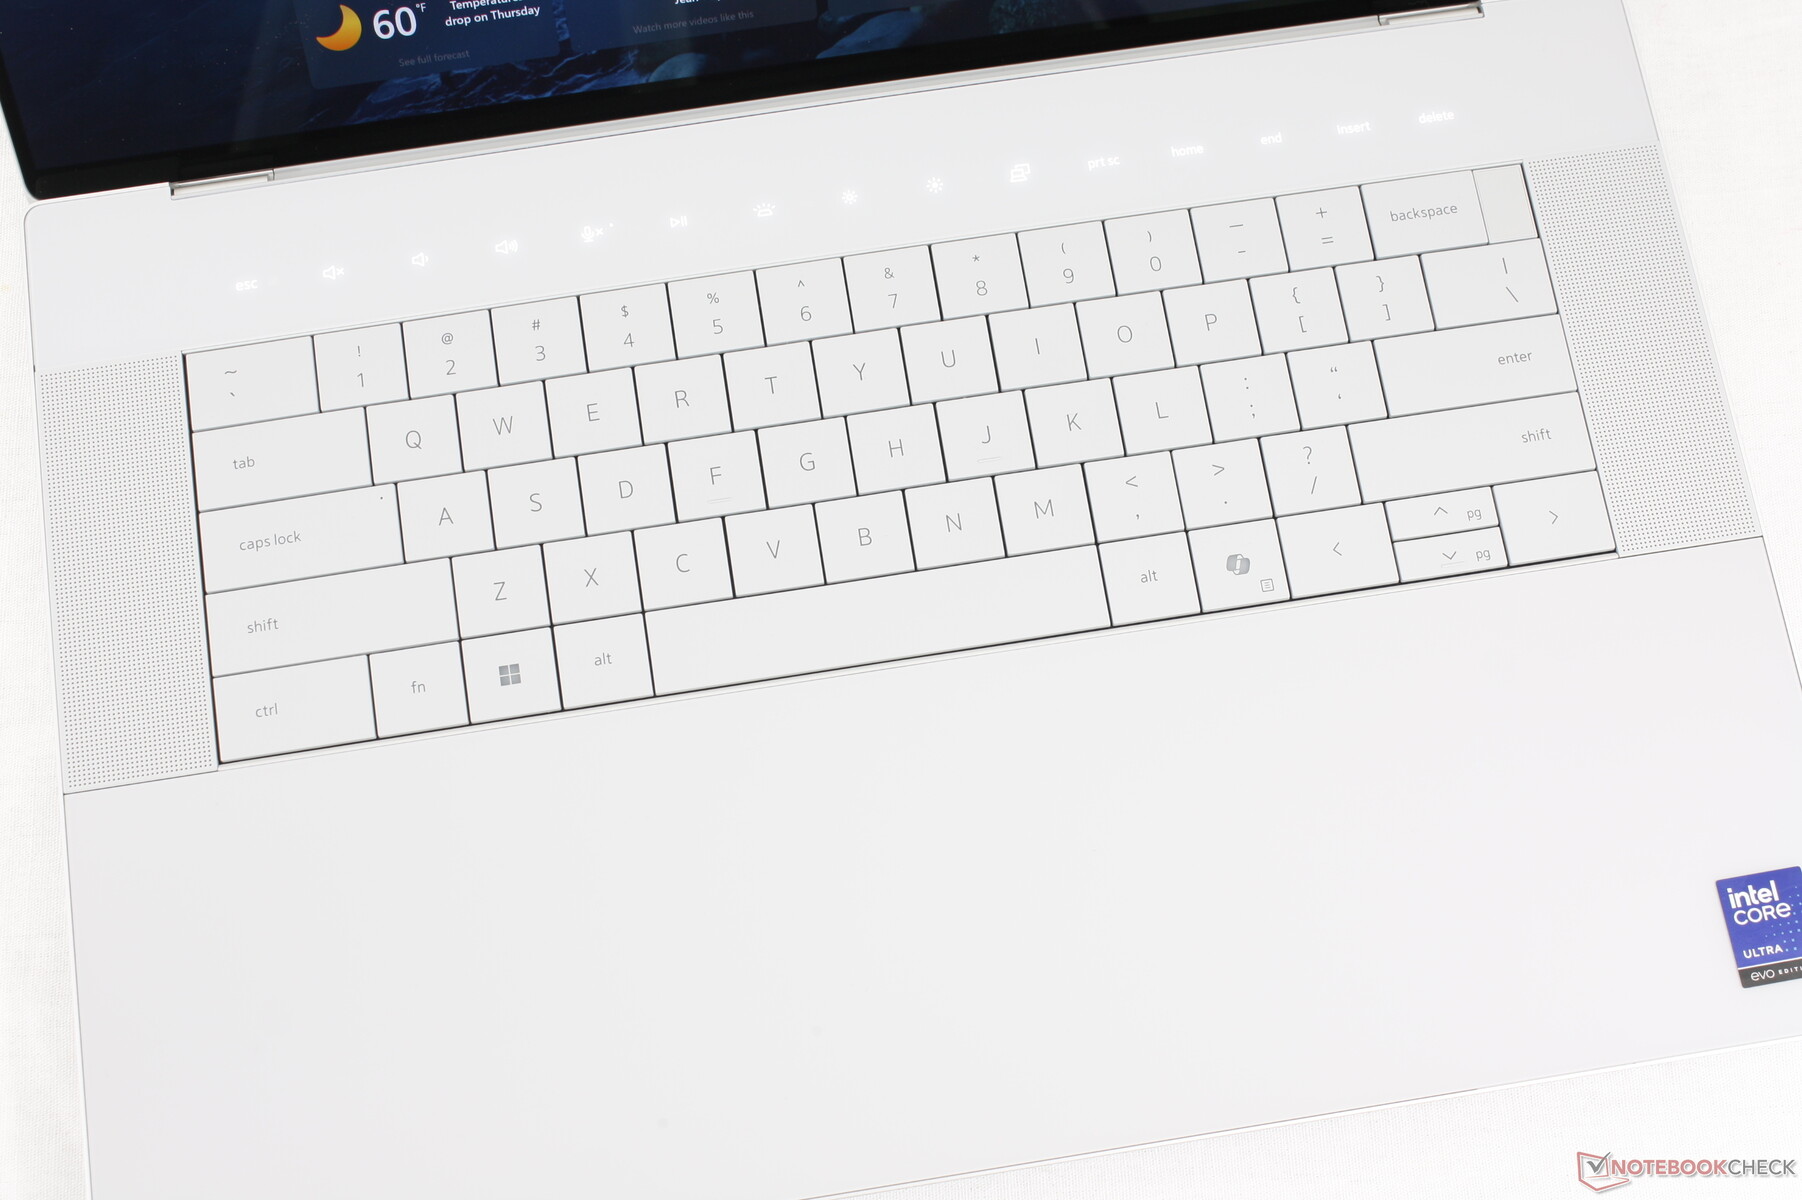
Systemet behåller de flesta, om inte alla, nackdelar som förknippas med XPS 16 9640-nydesignen, inklusive de kontroversiella ändringarna av tangentbord och klickplatta. Dell 16 Premium uppvisar också något brantare strypning av CPU-prestanda än tidigare. Potentiella köpare vill komma ihåg att systemet byter bort lite grafikprestanda för den mindre storleken och den mycket kompakta nätadaptern. Användare som inte har något emot ett något större system kan hitta den konkurrerande Lenovo Yoga Pro 9i 16 vara ett snabbare alternativ även när det är konfigurerat med liknande CPU- och GPU-specifikationer.
För
Emot
Pris och tillgänglighet
Dell levererar nu Dell 16 Premium från 2200 USD för baskonfigurationen Core Ultra 7 RTX 5050 upp till 3400 USD för konfigurationen Core Ultra 9 RTX 5070.
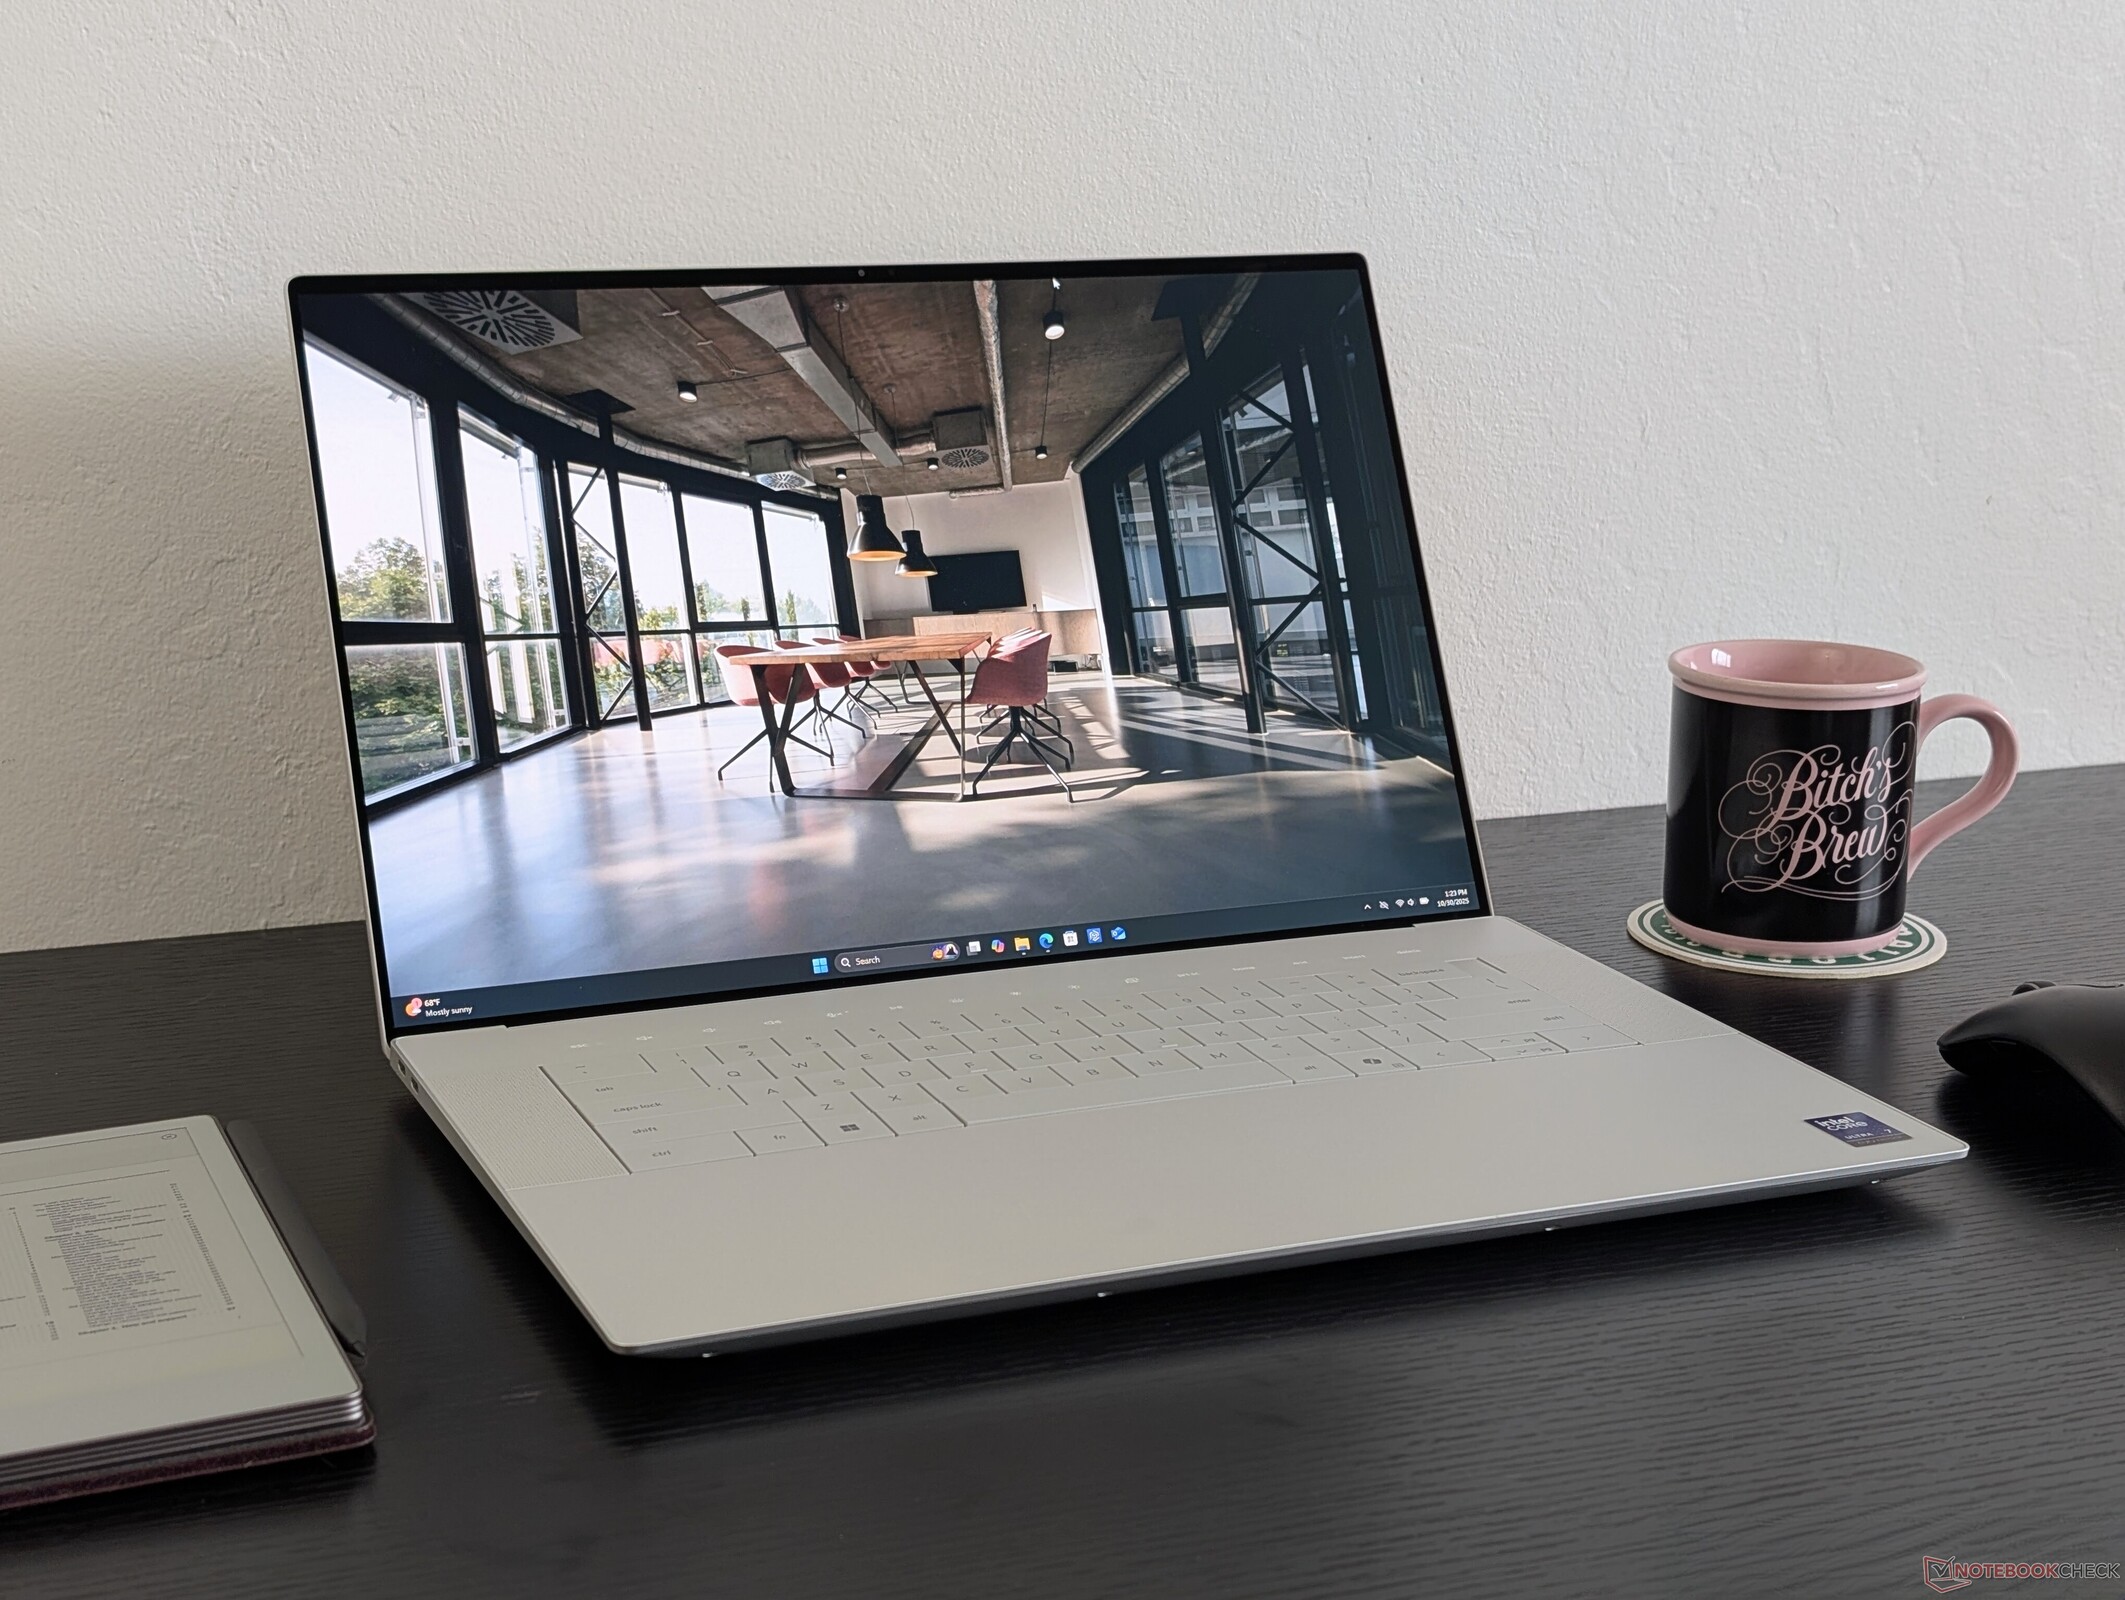
Dell 16 Premium är efterföljaren till XPS 16-serien. Namnet har ändrats, men den välbekanta designen lever vidare och ger en i stort sett identisk användarupplevelse som 2024-versionen. Många av våra kommentarer om XPS 16 9640 gäller här för Dell 16 Premium eftersom den nyare modellen endast introducerar interna förändringar utan några större externa uppdateringar.
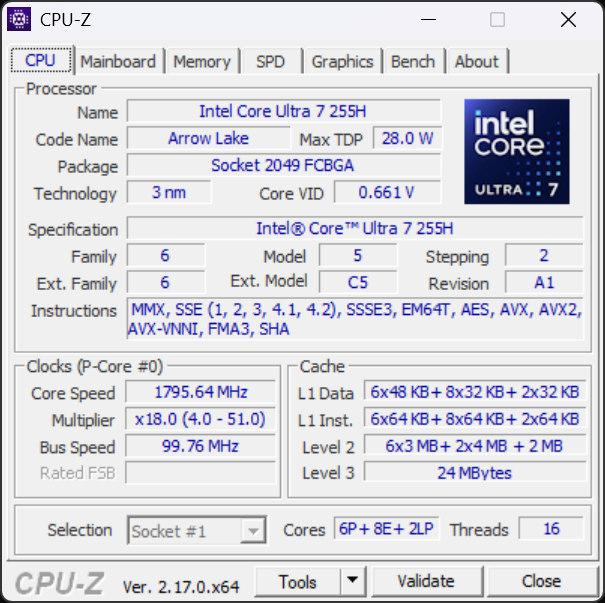
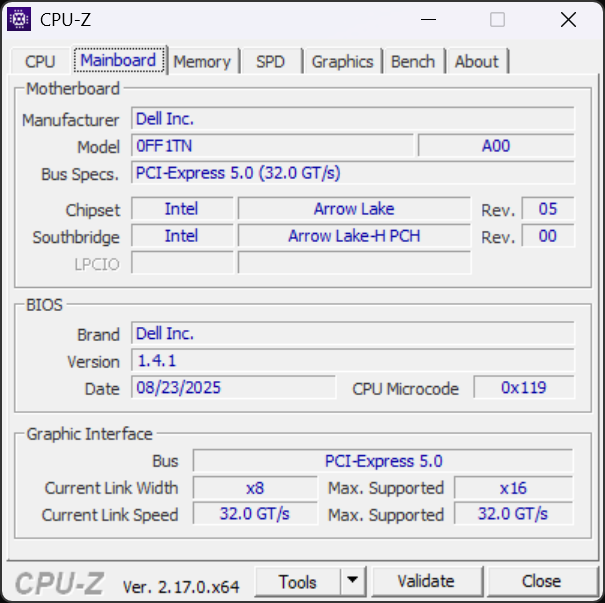
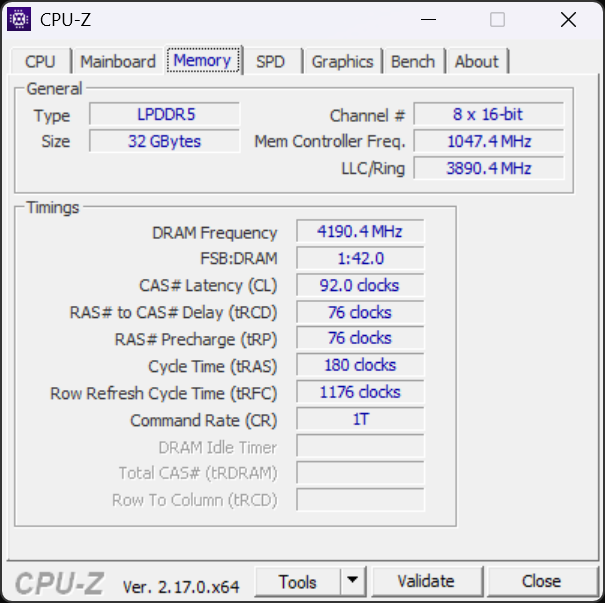
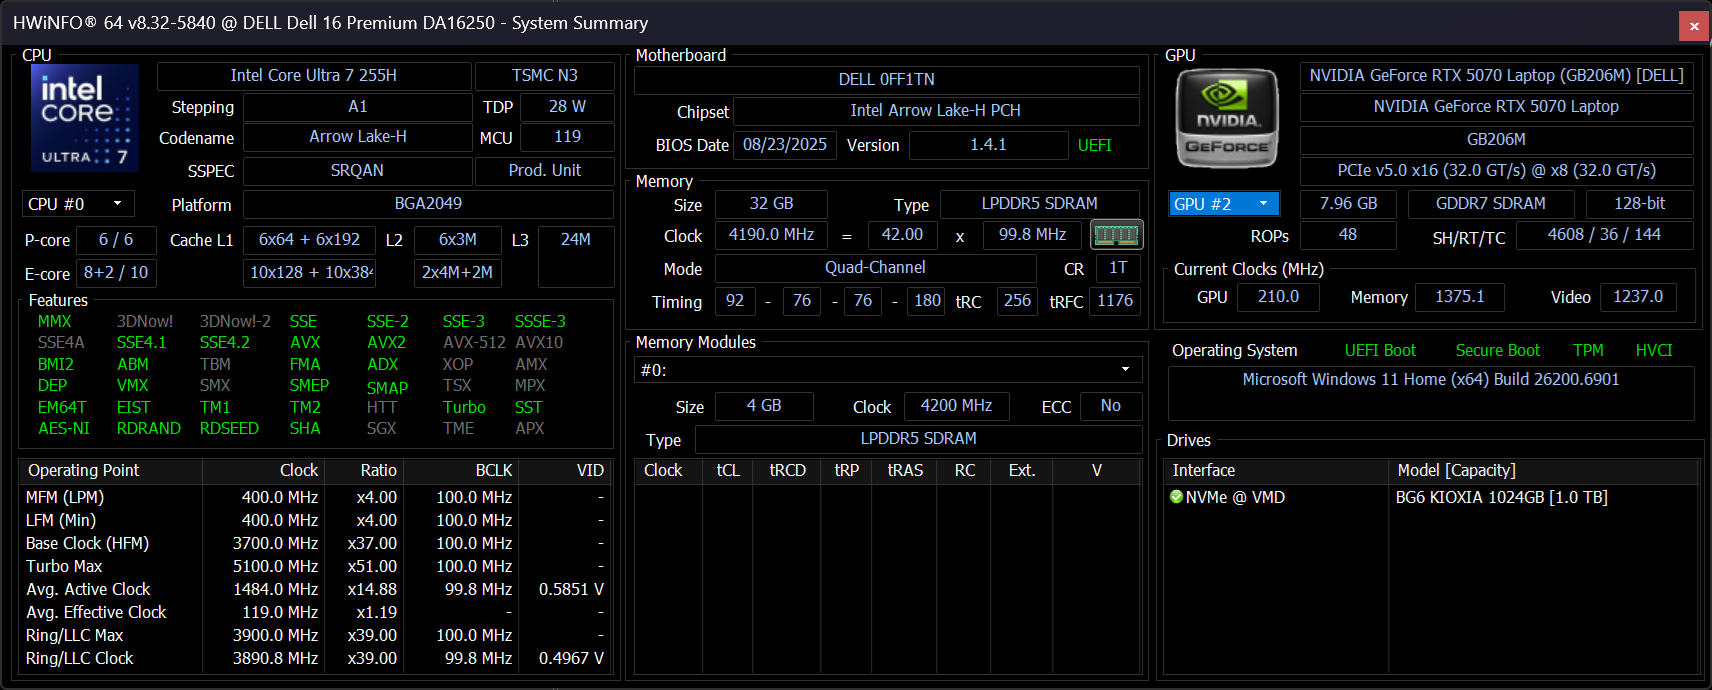
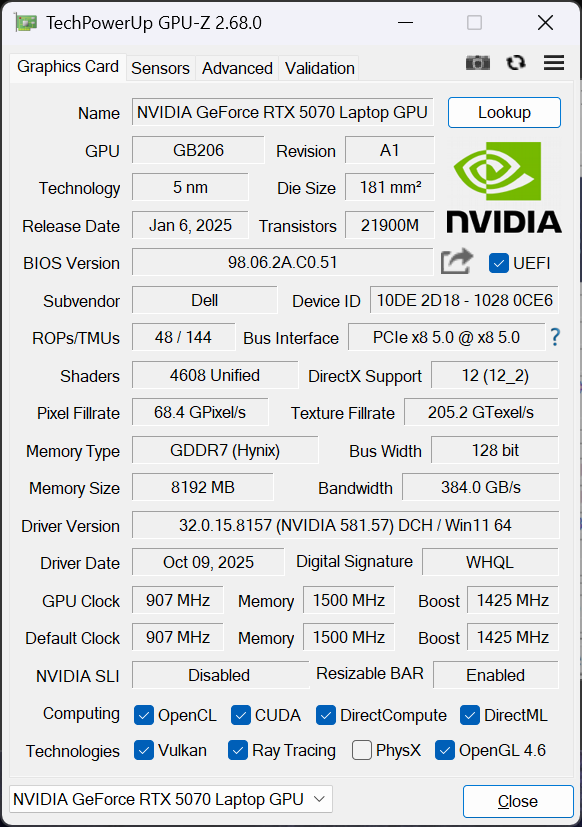
Vår testenhet är en avancerad konfiguration med Arrow Lake-H Core Ultra 7 255H CPU, 60 W Nvidia Blackwell GeForce RTX 5070 GPU och 16,3-tums 4K 2400p 120 Hz OLED-pekskärm för cirka $ 3300 för att ersätta förra årets Meteor Lake-H och Ada Lovelace-processoralternativ. SKU:er i lägre prisklasser kan levereras med endast integrerad grafik, RTX 5050 eller en 2K 1200p skärm utan pekskärm medan den mest avancerade konfigurationen levereras med Core Ultra 9 285H CPU.
Alternativ till Dell 16 Premium inkluderar andra avancerade bärbara multimediadatorer som Lenovo Yoga Pro 9i 16, HP Spectre x360 16eller Apple MacBook Pro 16. Dell 16 Premium ska inte förväxlas med Dell Pro 16 Premium.
Fler recensioner av Dell:
Specifikationer
Fallet
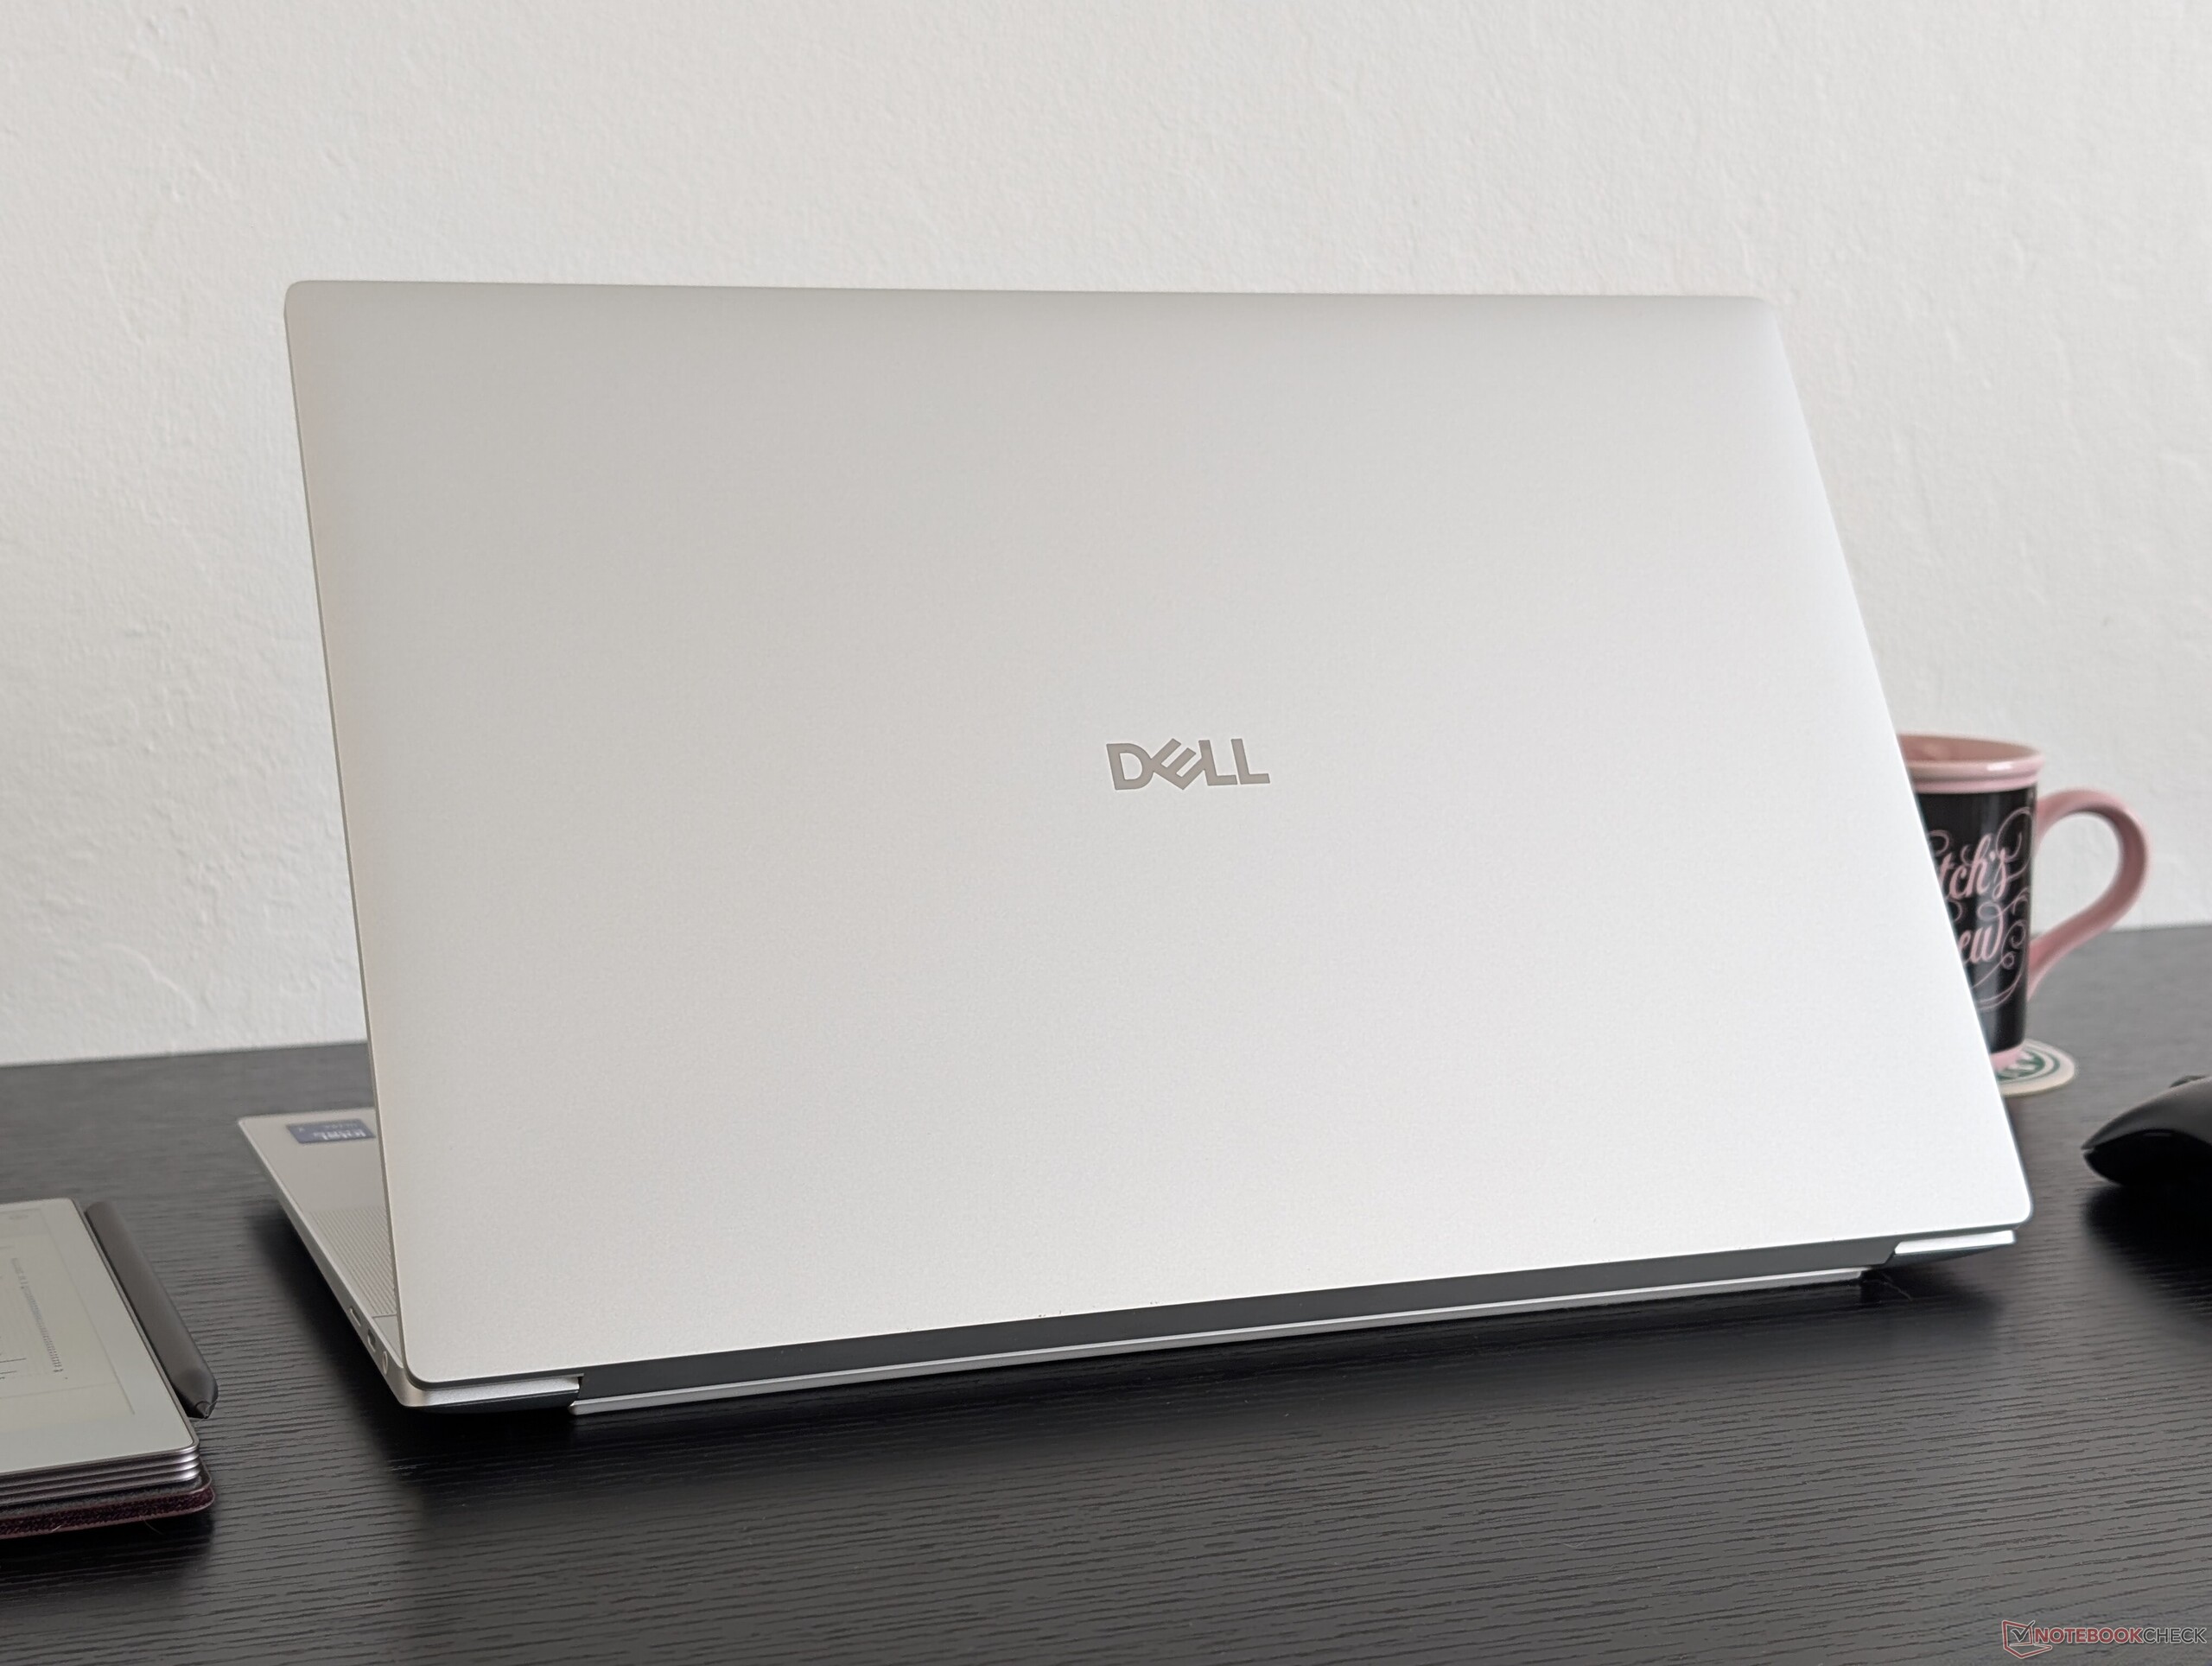
Även om Dell 16 Premium använder samma chassidesign som den utgående XPS 16 9640, har logotypen på det yttre locket ändrats så att den visas utan cirkeln. Detta är också ett av de enklaste sätten att visuellt skilja Dell 16 Premium från äldre XPS-modeller.
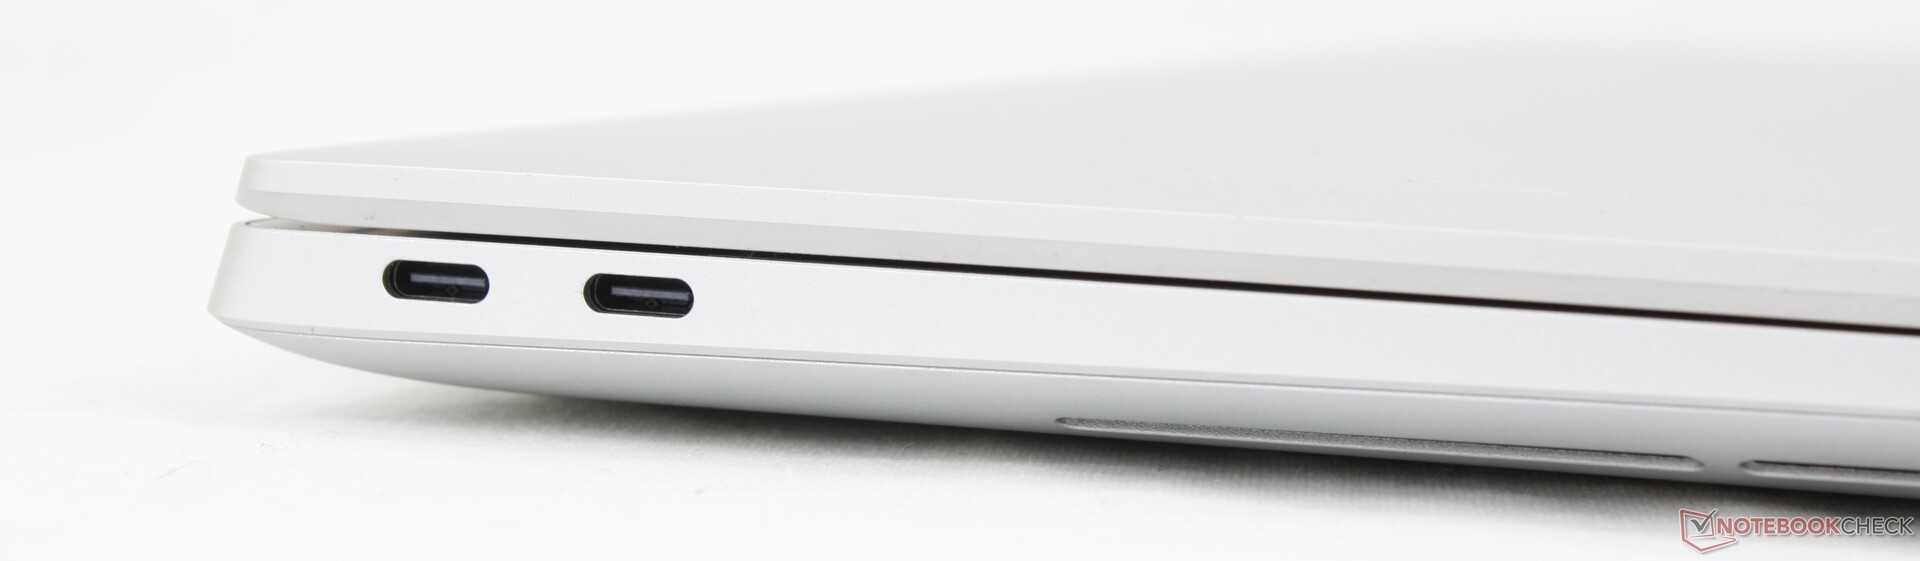
Anslutningsmöjligheter
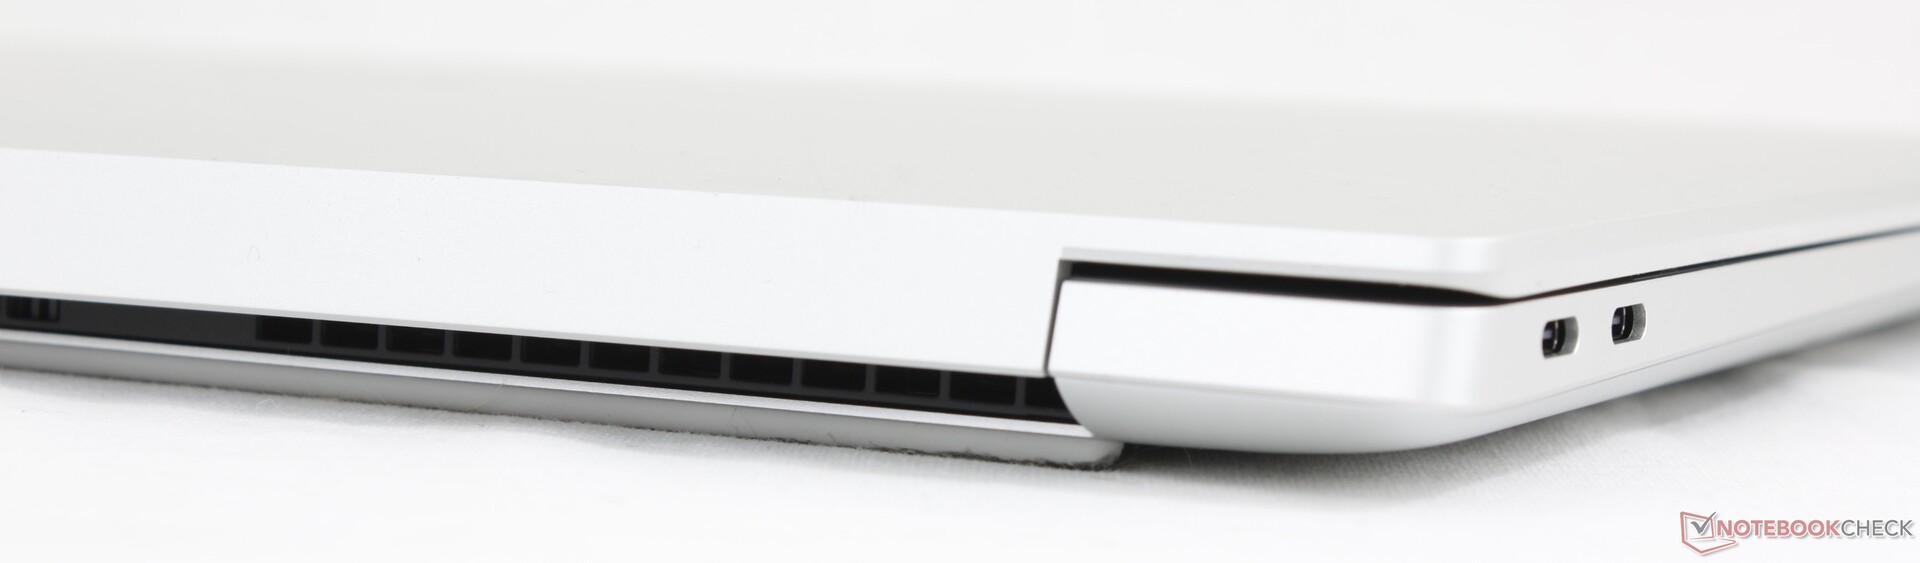
Alla USB-C-portar är nu Thunderbolt 4 med 40 Gbps, vilket inte var fallet på XPS 16 9640.

Kommunikation
| Networking | |
| iperf3 transmit AXE11000 | |
| LG Gram Pro 16Z90TS-G.AU89G | |
| Asus Zenbook S 16 UM5606-RK333W | |
| Lenovo Yoga Pro 9i 16 RTX 5070 | |
| Dell XPS 16 9640 | |
| HP Spectre x360 16 RTX 4050 | |
| Dell 16 Premium DA16250 | |
| iperf3 receive AXE11000 | |
| Asus Zenbook S 16 UM5606-RK333W | |
| Lenovo Yoga Pro 9i 16 RTX 5070 | |
| LG Gram Pro 16Z90TS-G.AU89G | |
| Dell XPS 16 9640 | |
| HP Spectre x360 16 RTX 4050 | |
| Dell 16 Premium DA16250 | |
| iperf3 transmit AXE11000 6GHz | |
| LG Gram Pro 16Z90TS-G.AU89G | |
| Dell 16 Premium DA16250 | |
| HP Spectre x360 16 RTX 4050 | |
| iperf3 receive AXE11000 6GHz | |
| LG Gram Pro 16Z90TS-G.AU89G | |
| Dell 16 Premium DA16250 | |
| HP Spectre x360 16 RTX 4050 | |
Webbkamera


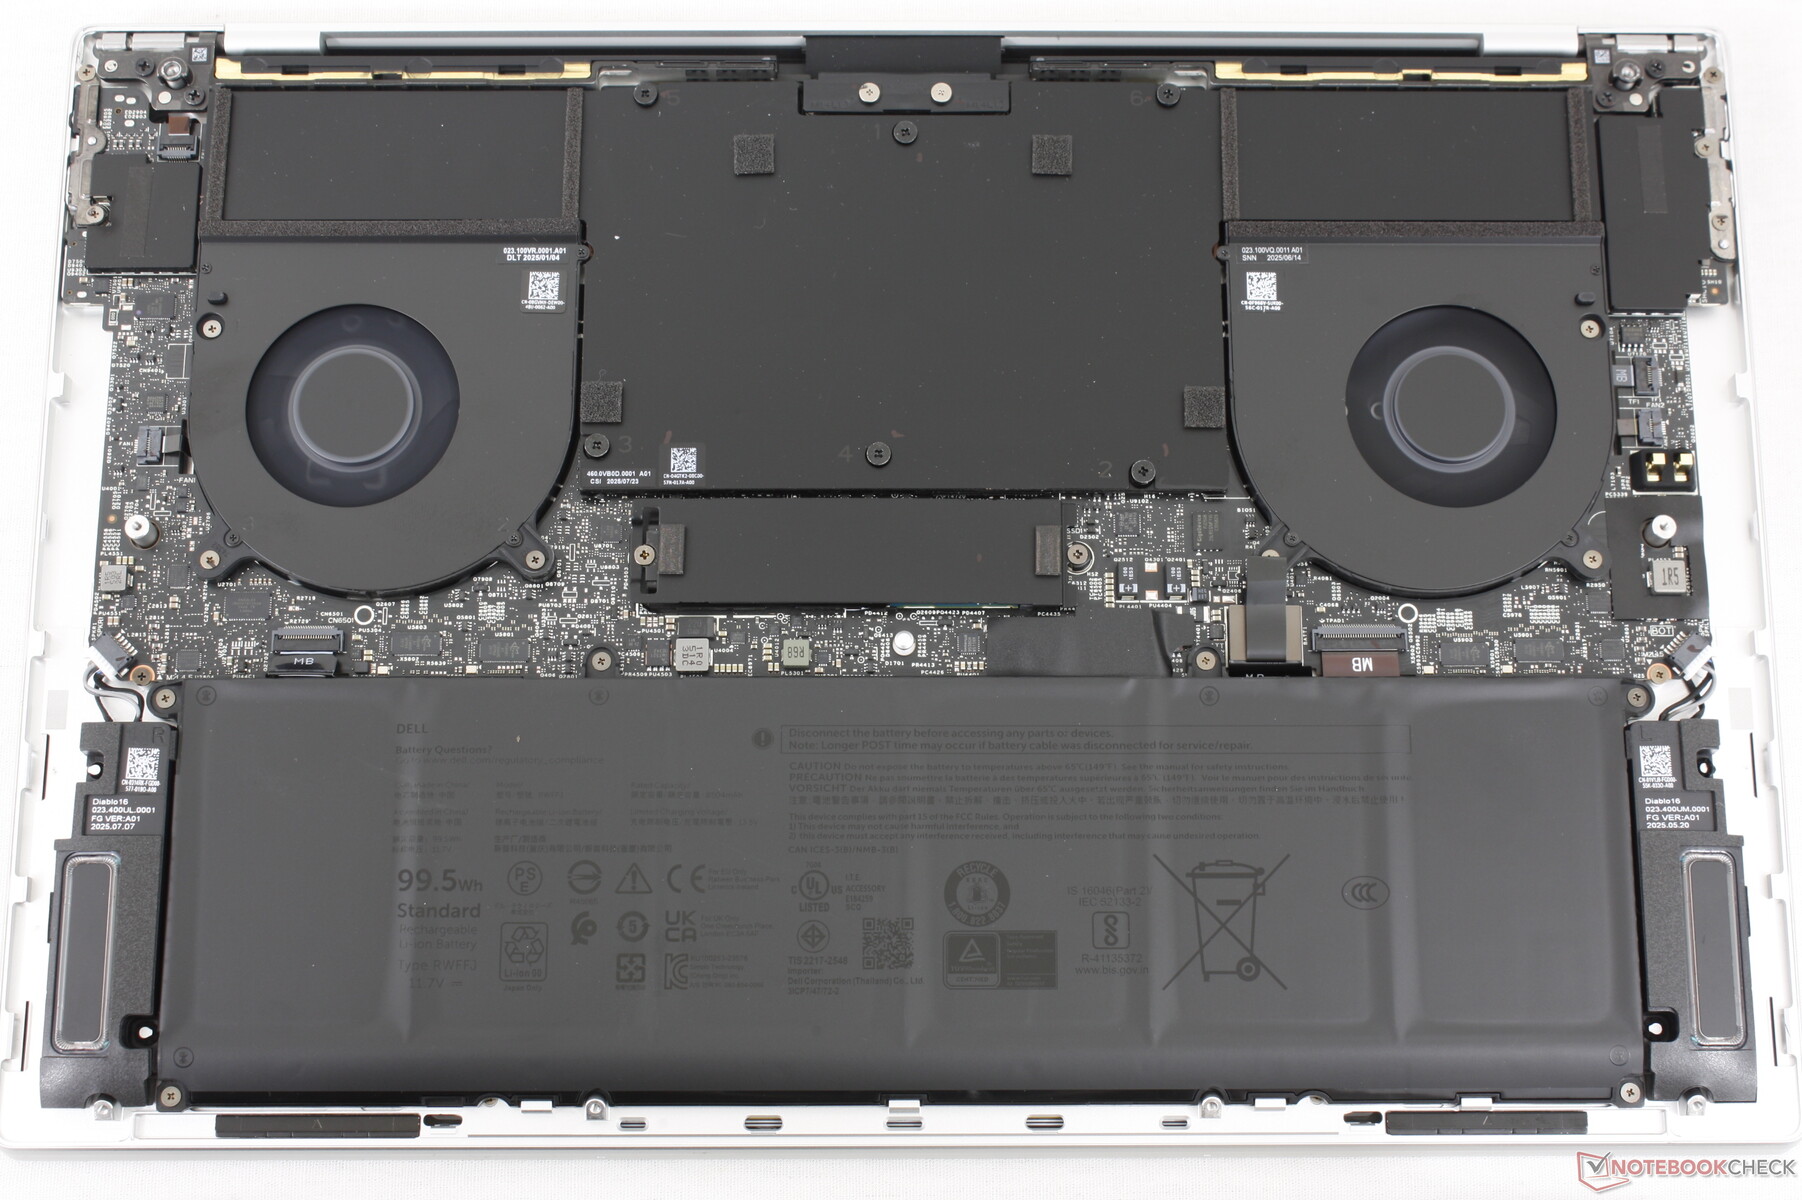
Underhåll
Hållbarhet
Chassit eller skelettet består av 75 procent återvunnen aluminium för topplocket, upp till 22 procent återvunnet glas för skärmen, 25 procent aluminium med låga utsläpp för handledsstödet, 18,5 procent återvunnen plast totalt och 100 procent återvinningsbar förpackning.
Garanti
En ettårig begränsad tillverkargaranti ingår som standard vid köp i USA.
Inmatningsenheter
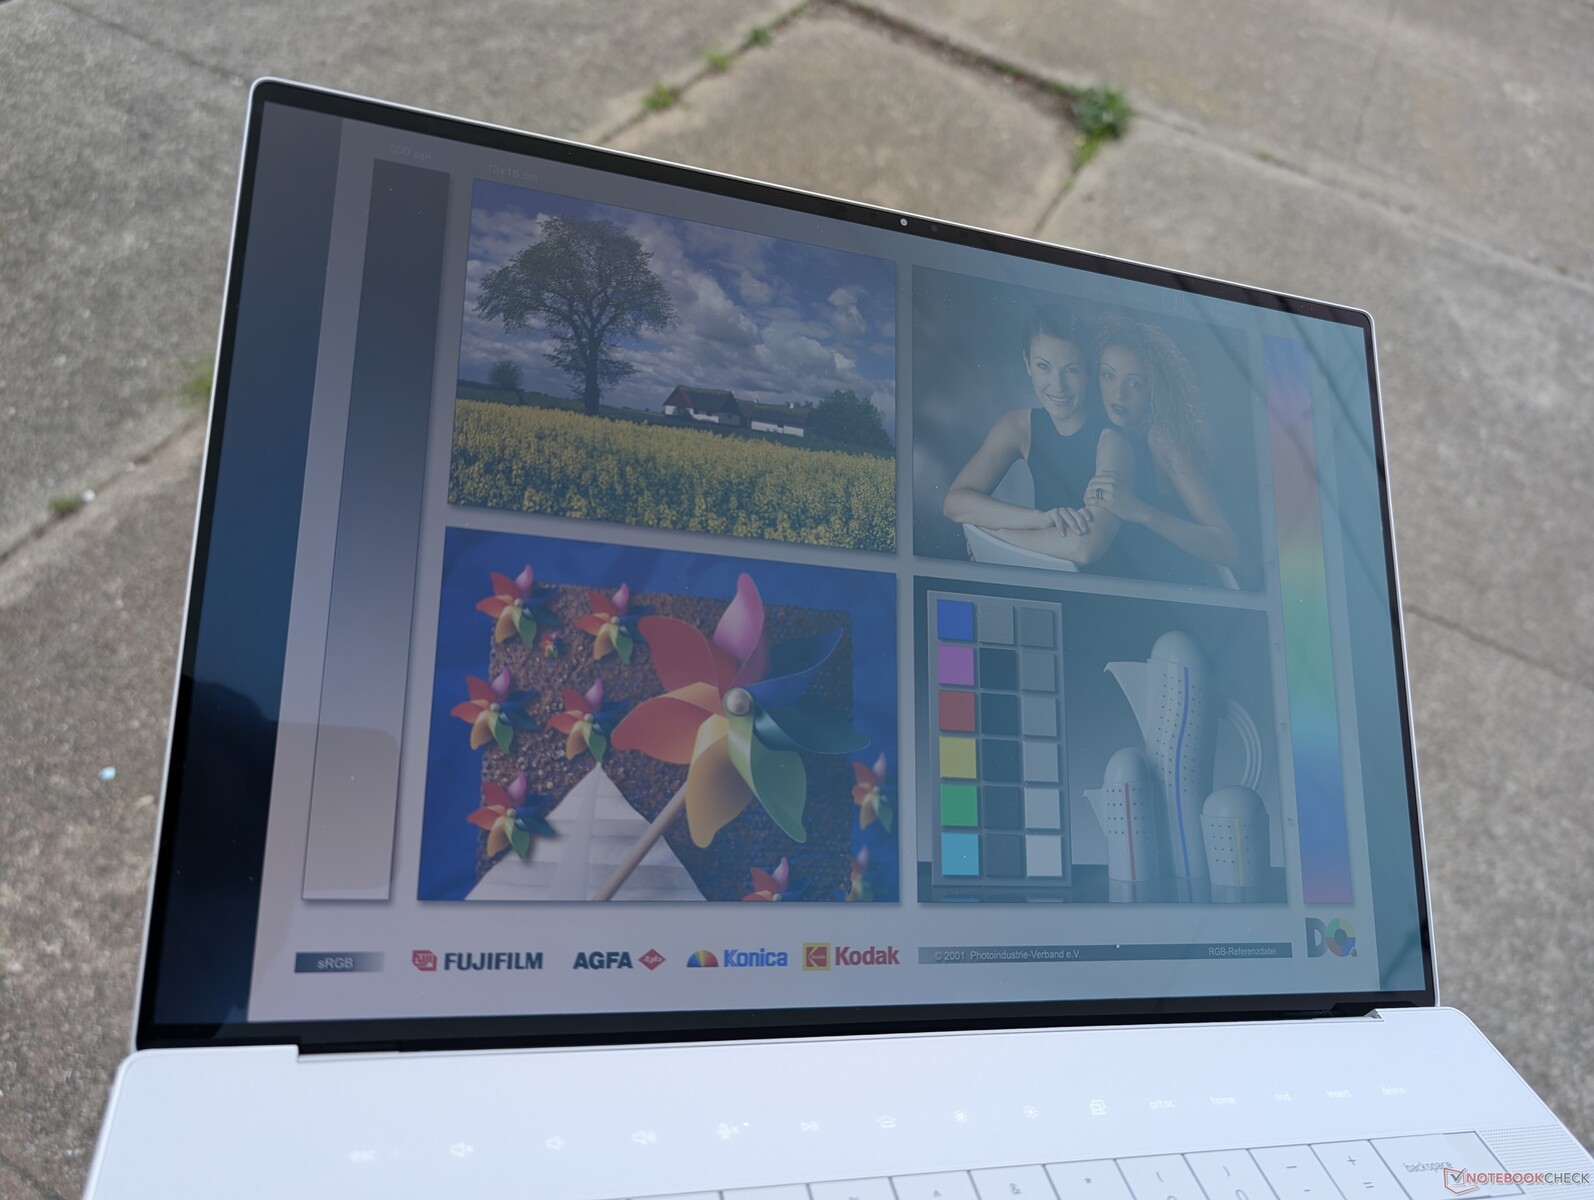
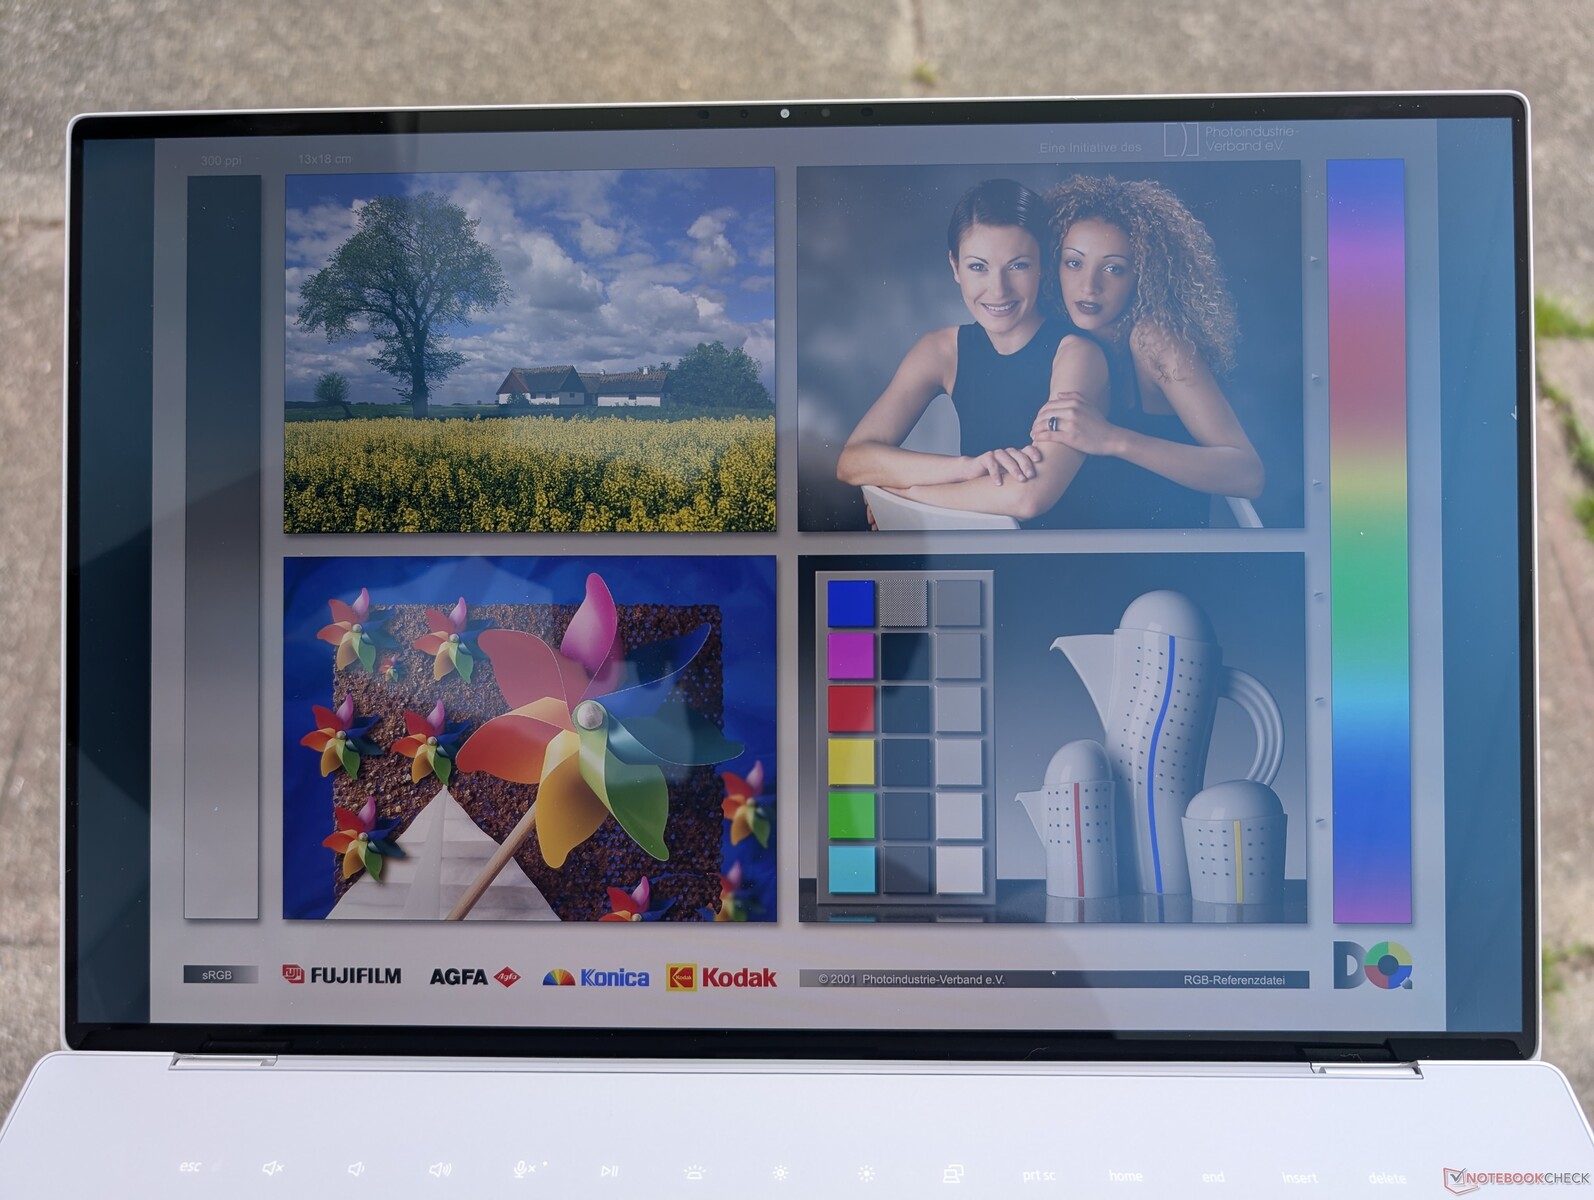
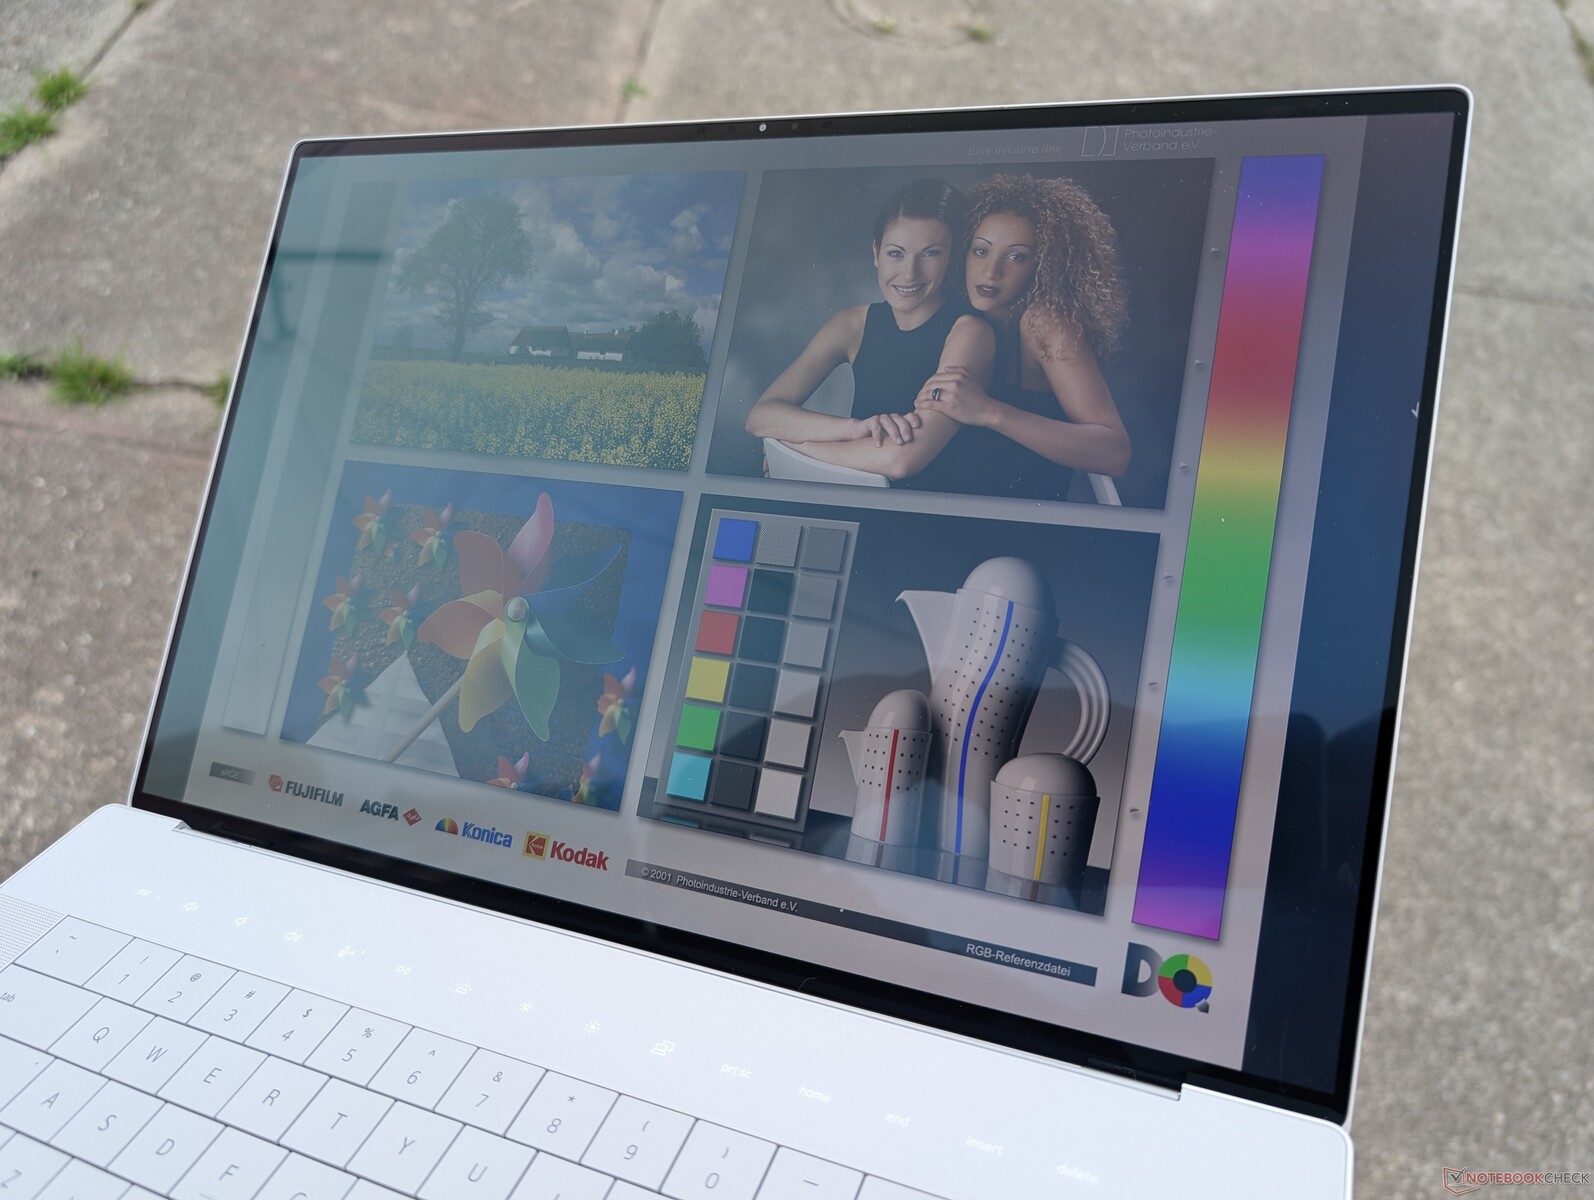
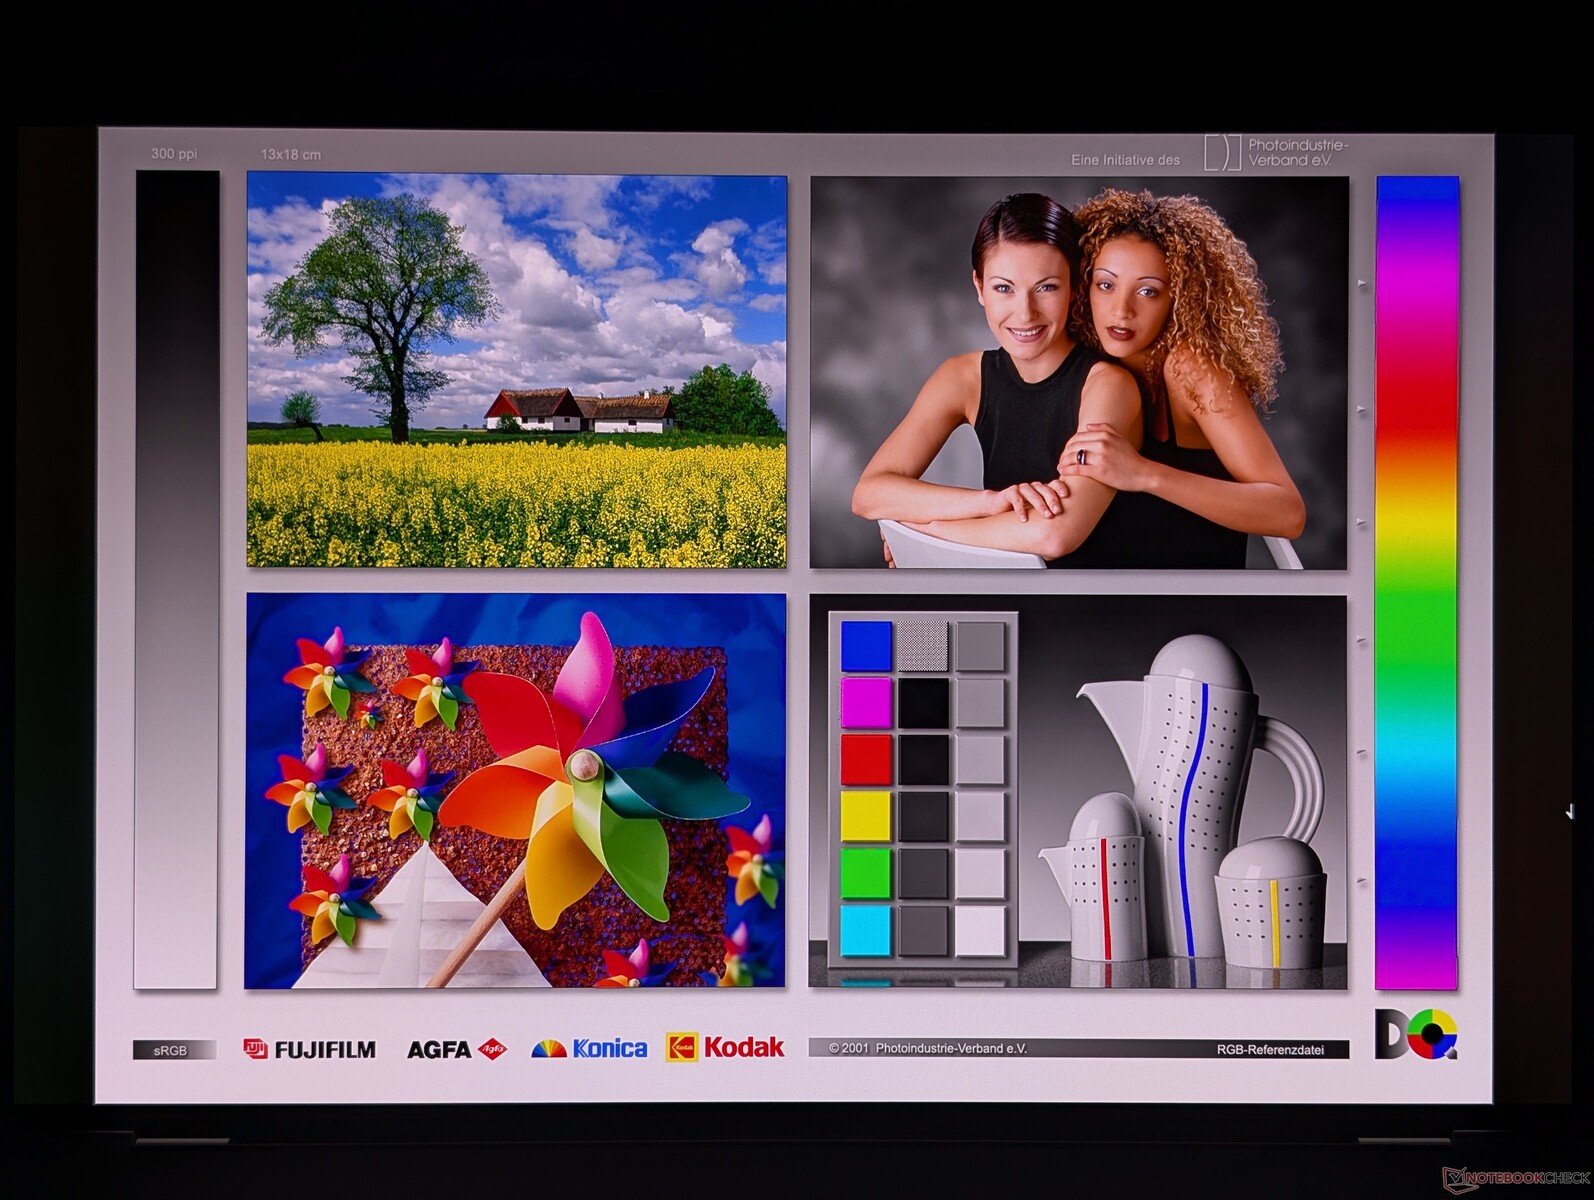
Display
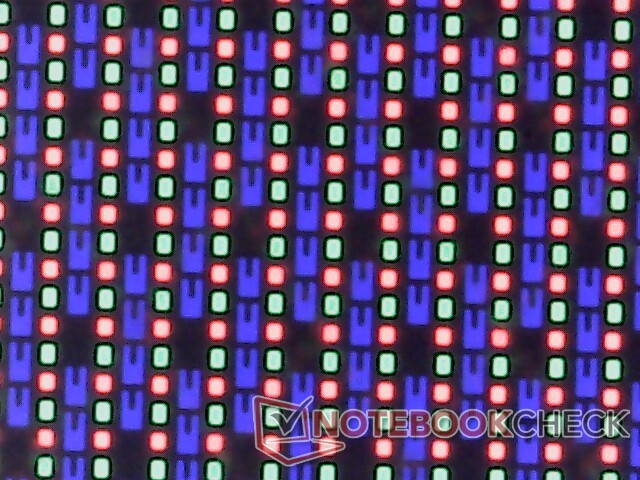
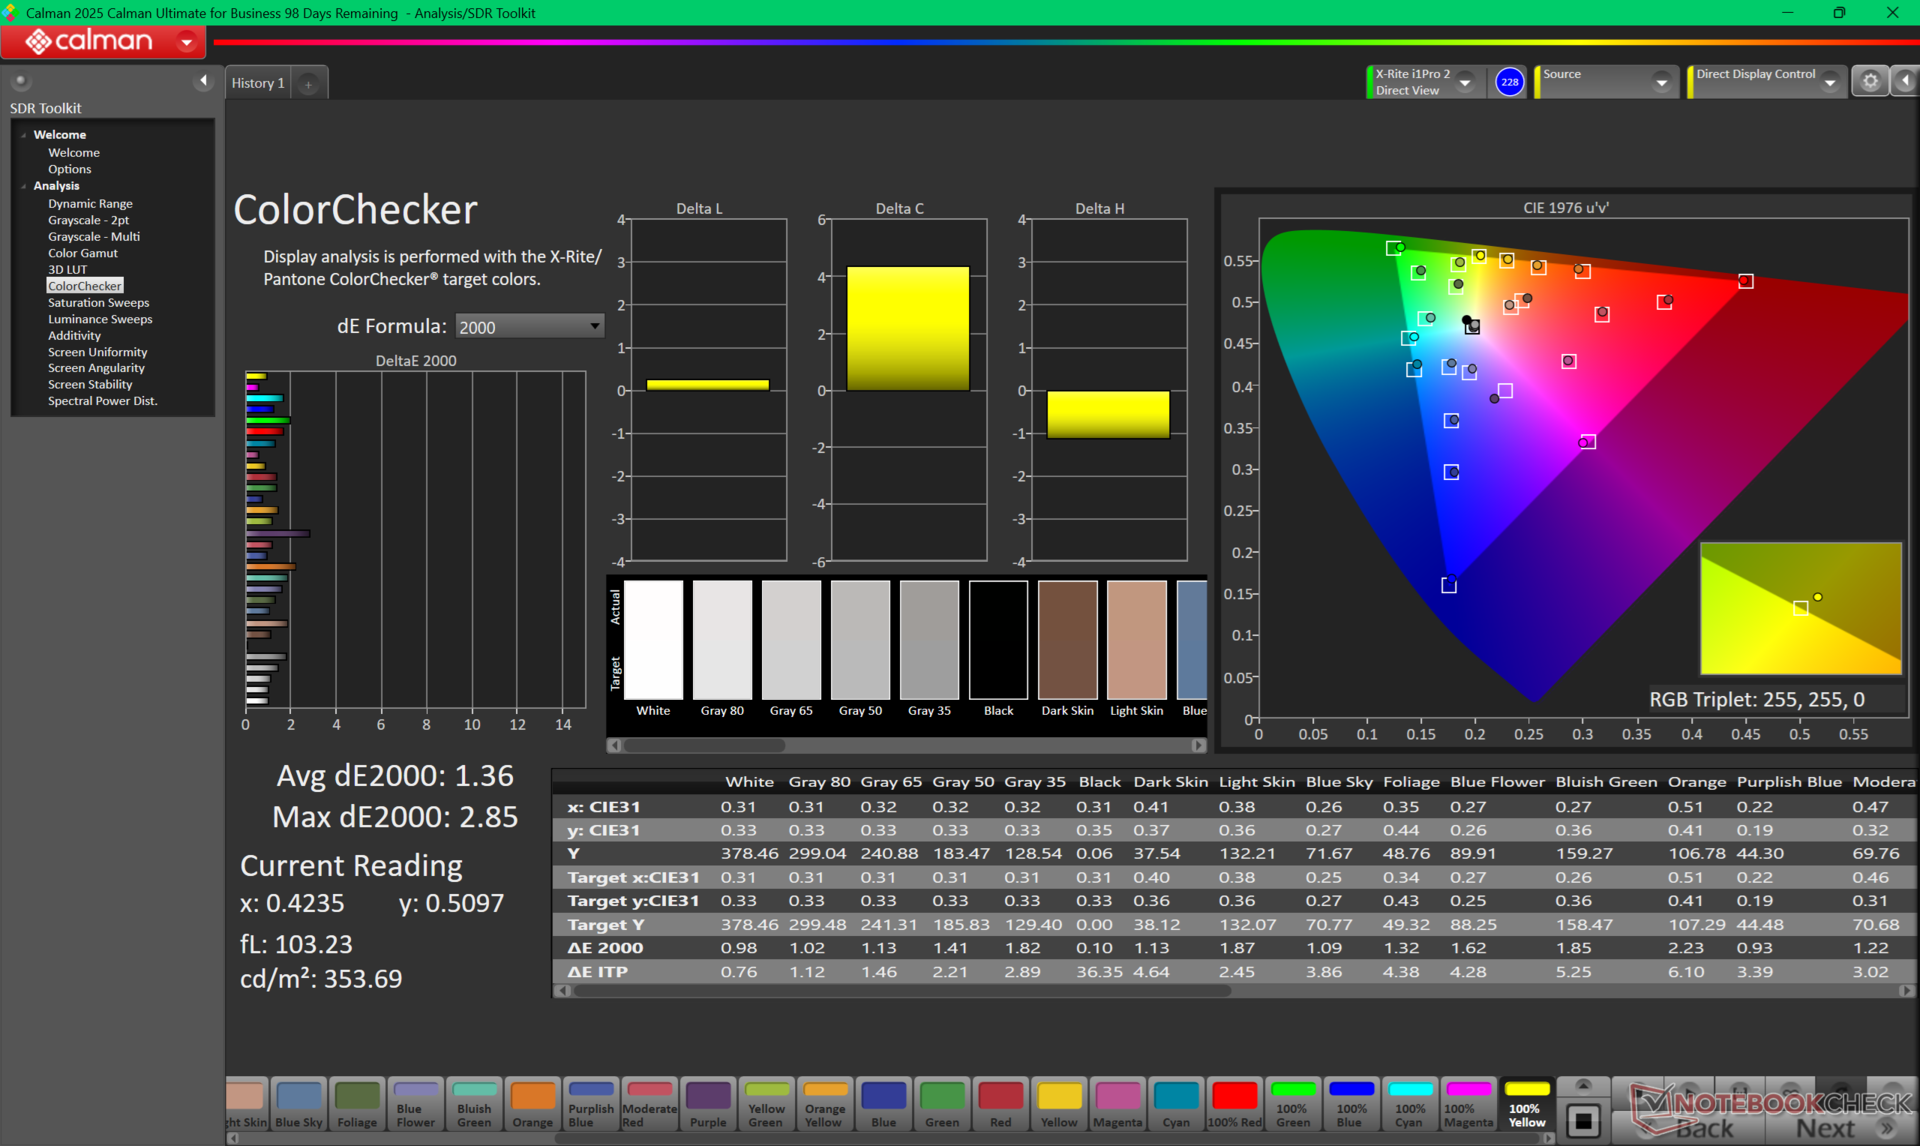
Dell har uppgraderat OLED-panelen på förra årets XPS 16 9640 från 90 Hz till 120 Hz medan den maximala ljusstyrkan förblir densamma på ~400 nits. Windows VRR stöds ner till 48 Hz för att spara på batteriet. Förändringarna är relativt små men ändå anmärkningsvärda eftersom 4K 2400p 120 Hz-skärmar är relativt ovanliga på 16-tums bärbara datorer.
| |||||||||||||||||||||||||
Distribution av ljusstyrkan: 98 %
Mitt på batteriet: 385.7 cd/m²
Kontrast: ∞:1 (Svärta: 0 cd/m²)
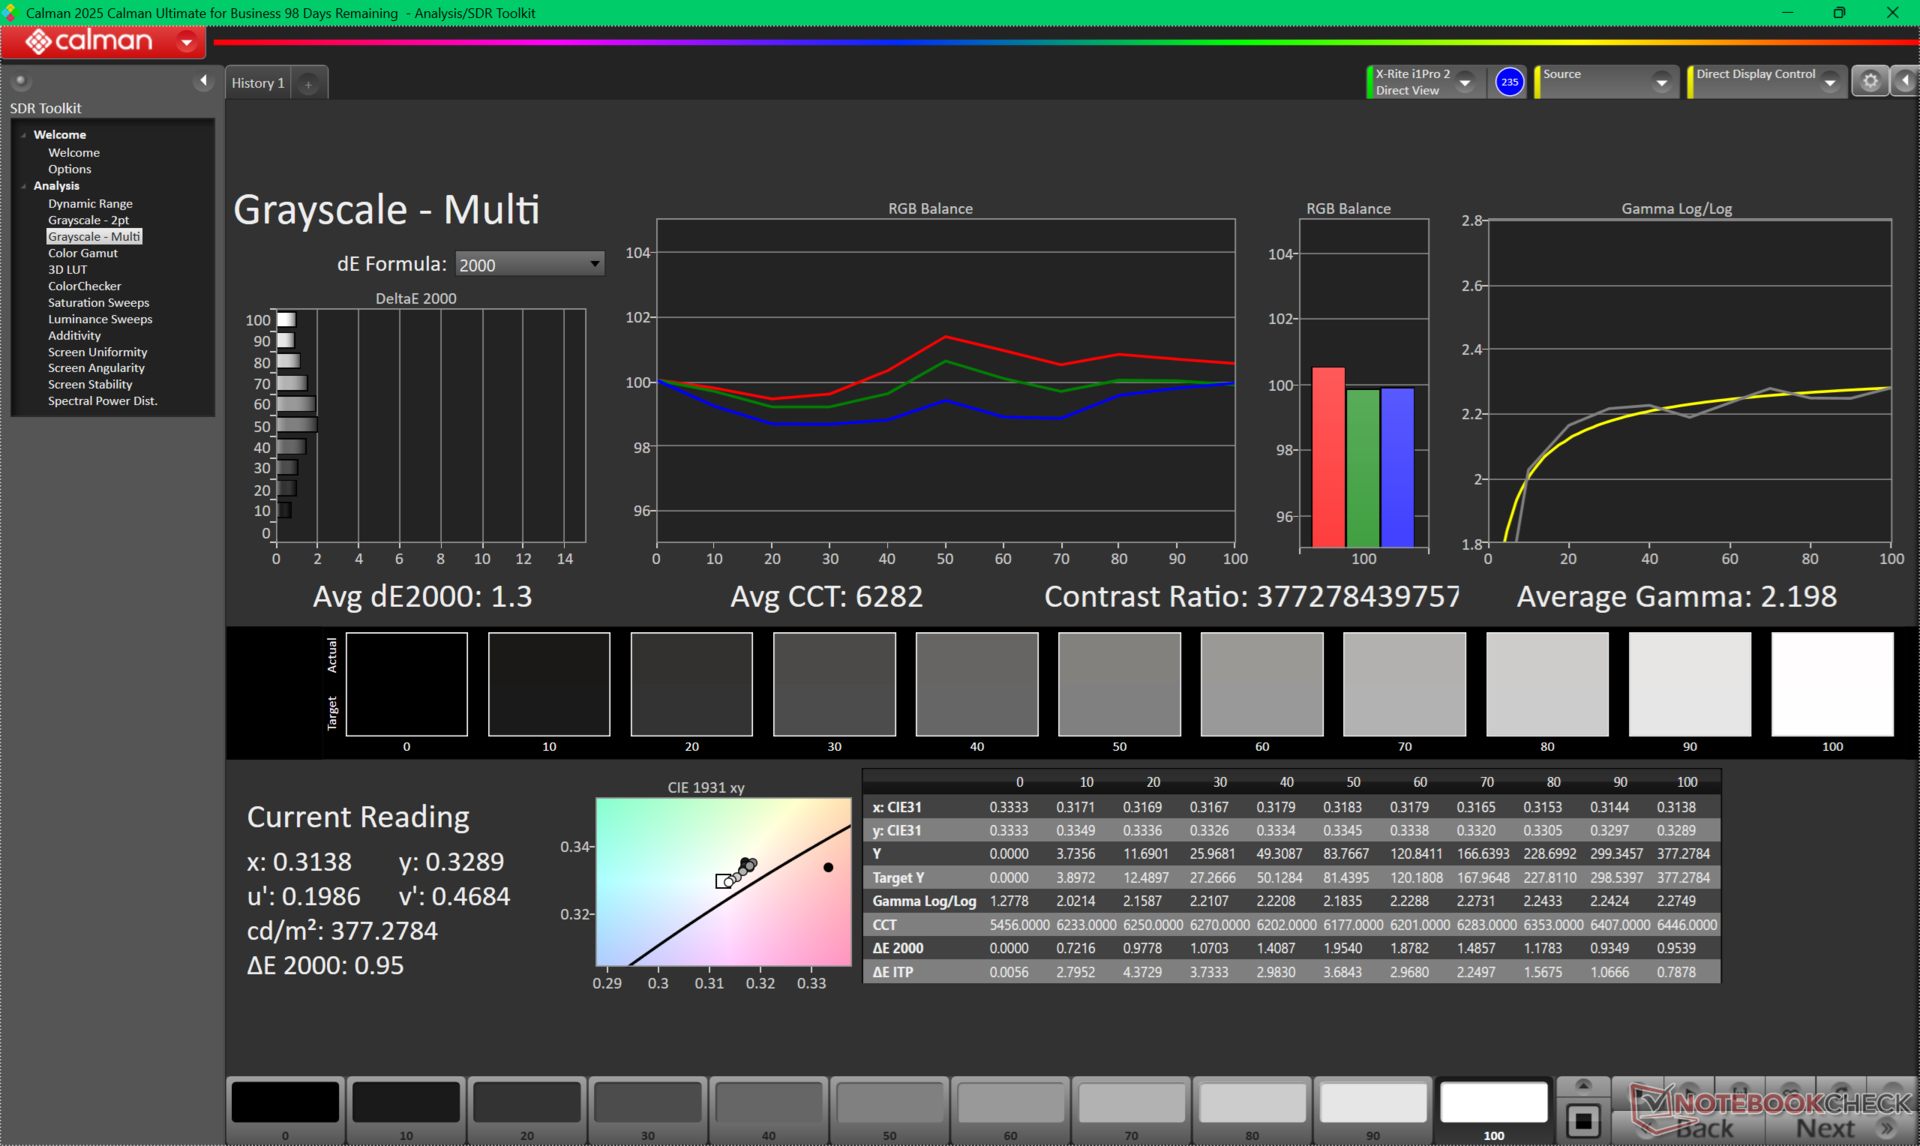
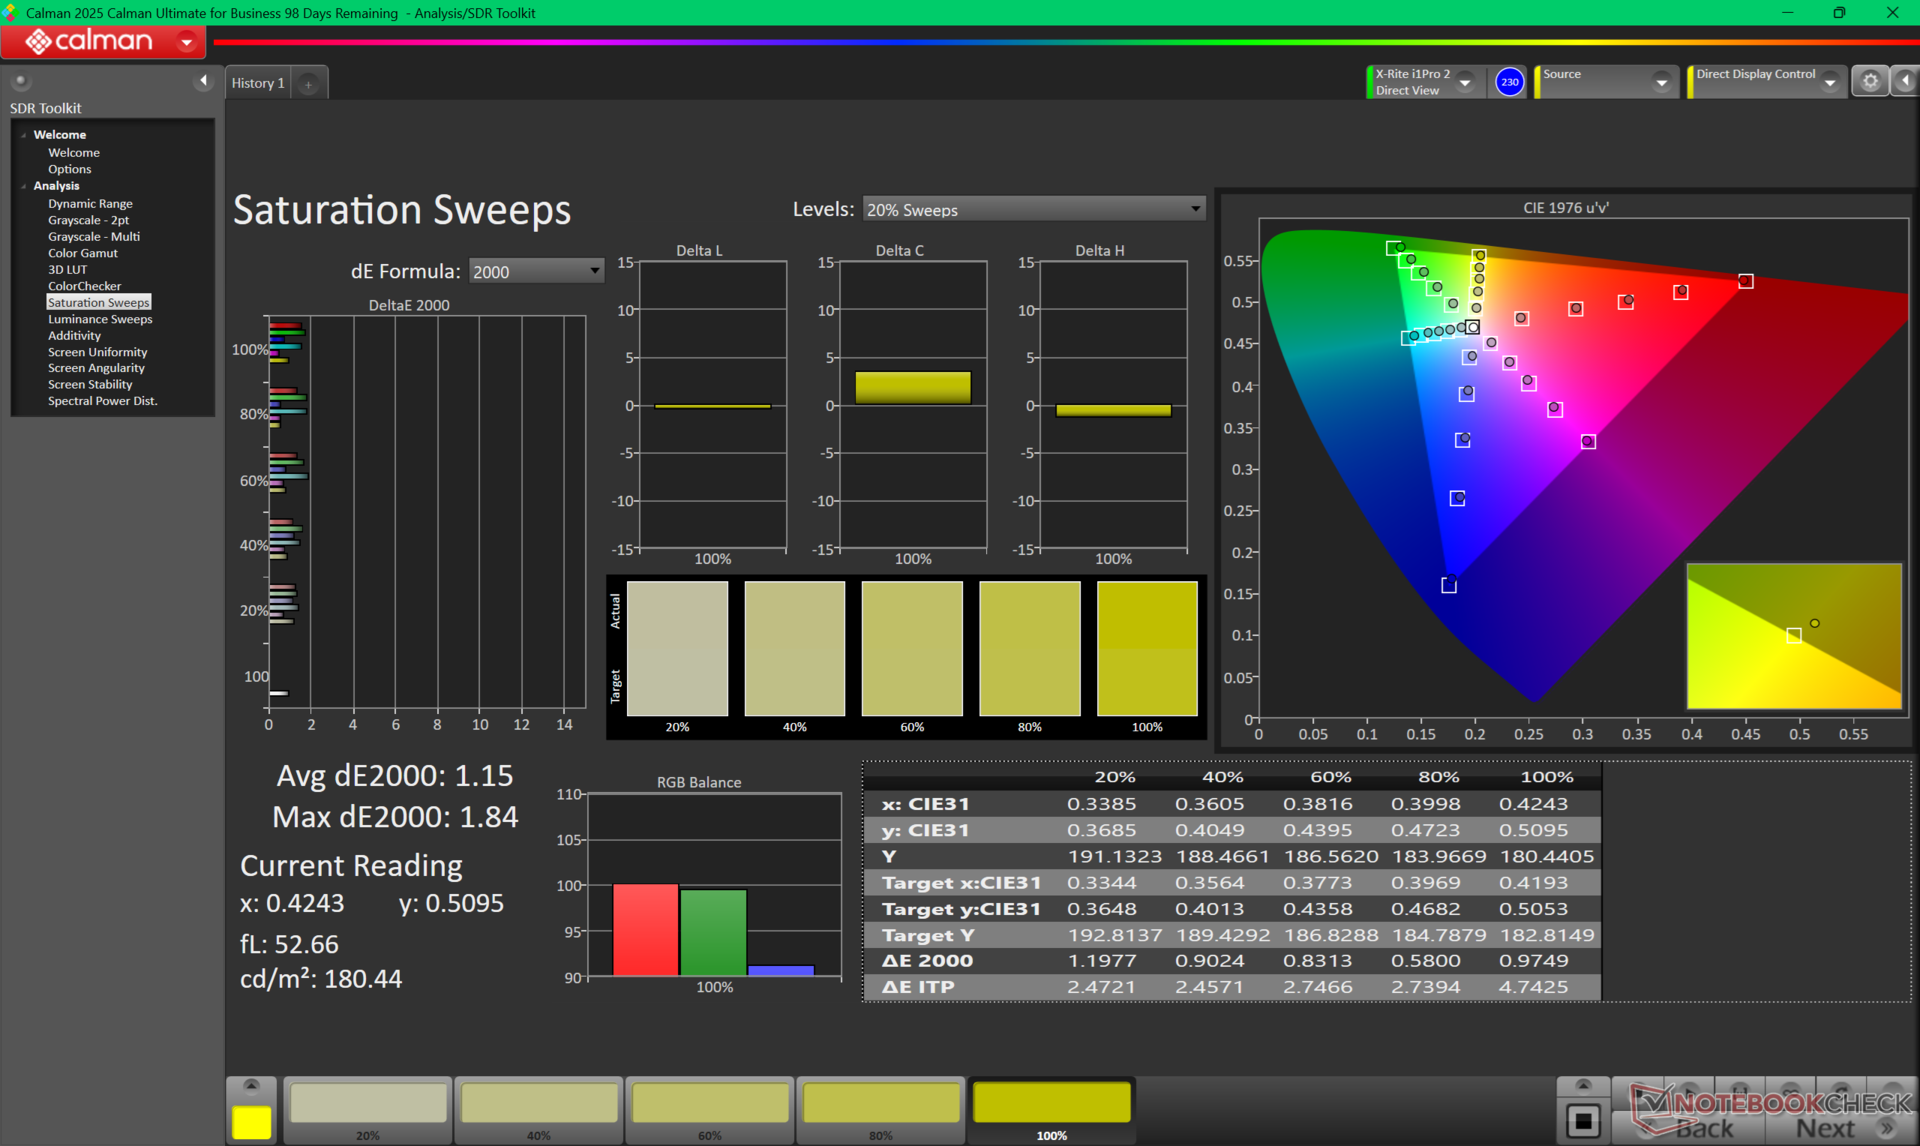
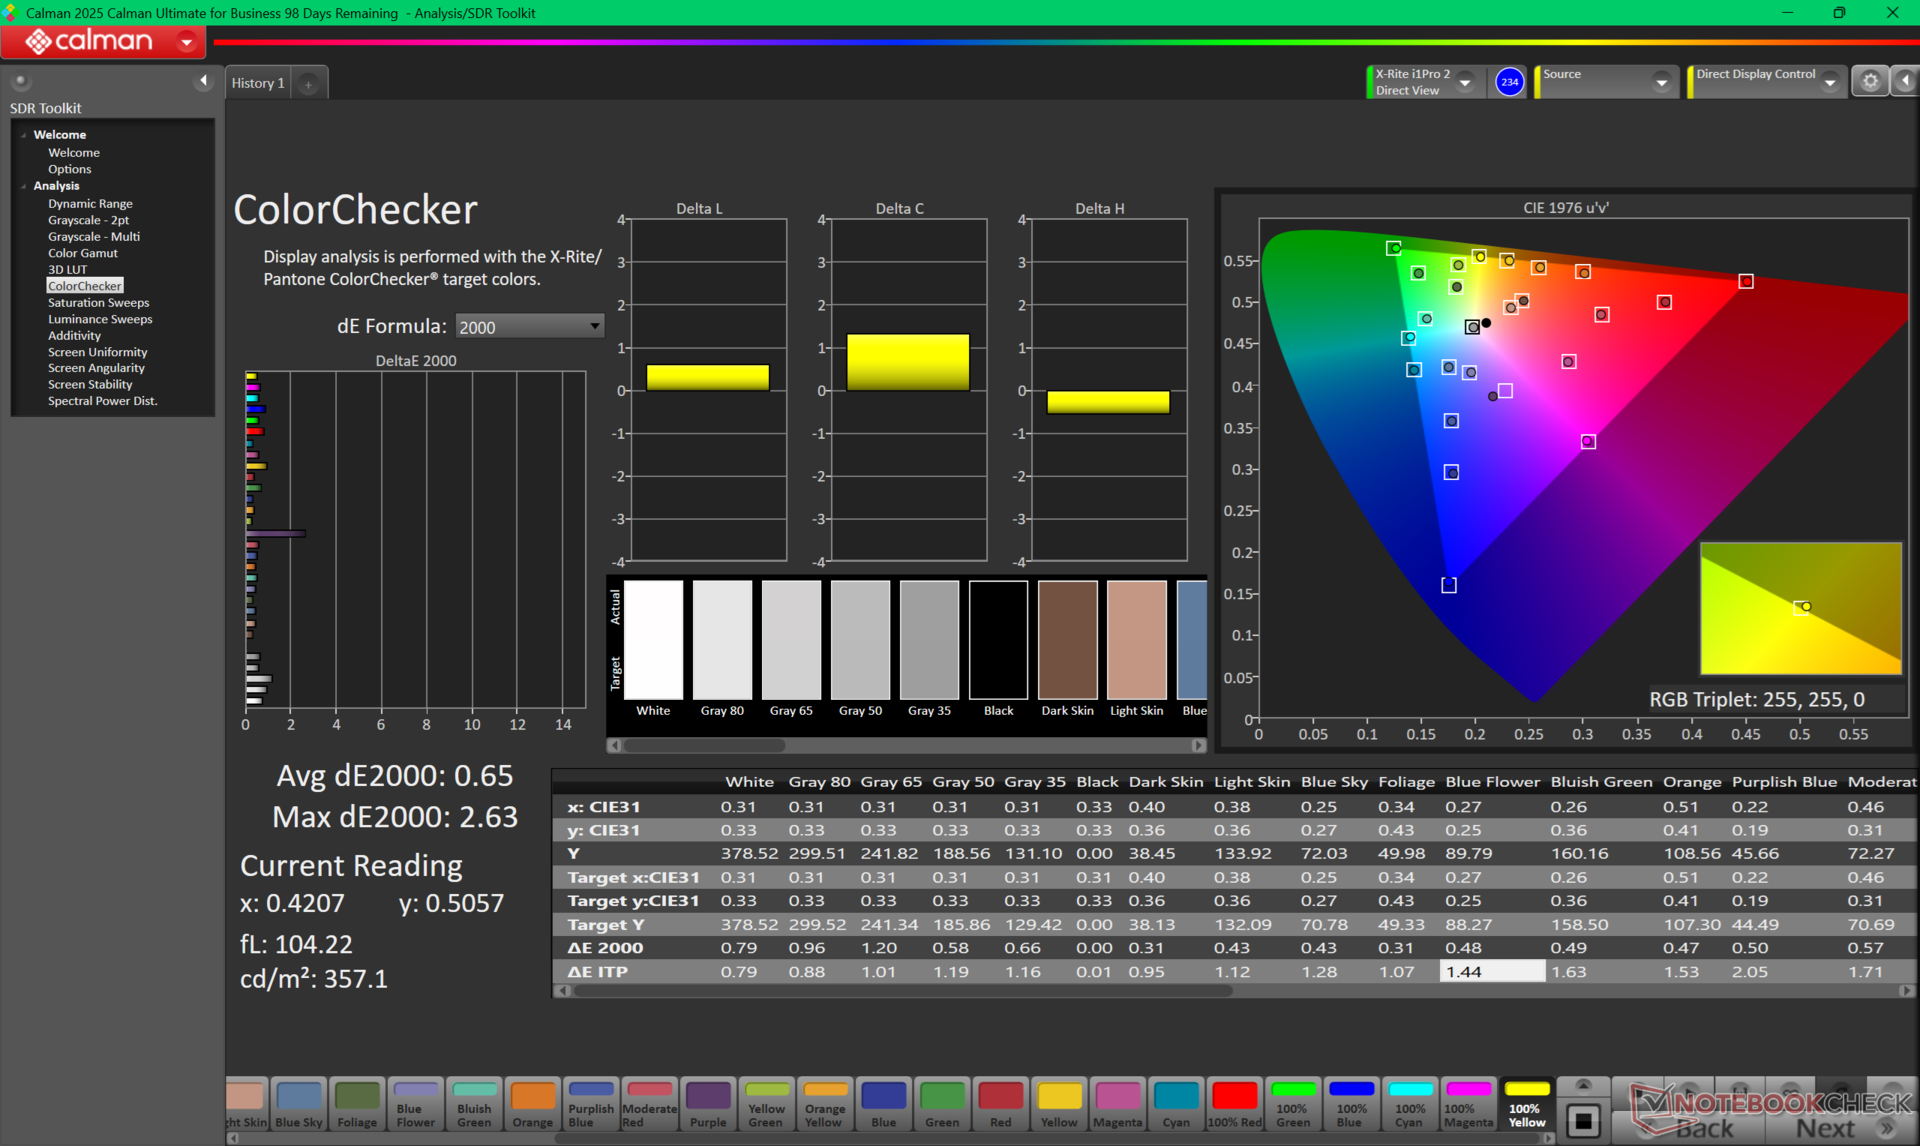
ΔE ColorChecker Calman: 1.36 | ∀{0.5-29.43 Ø4.71}
calibrated: 0.65
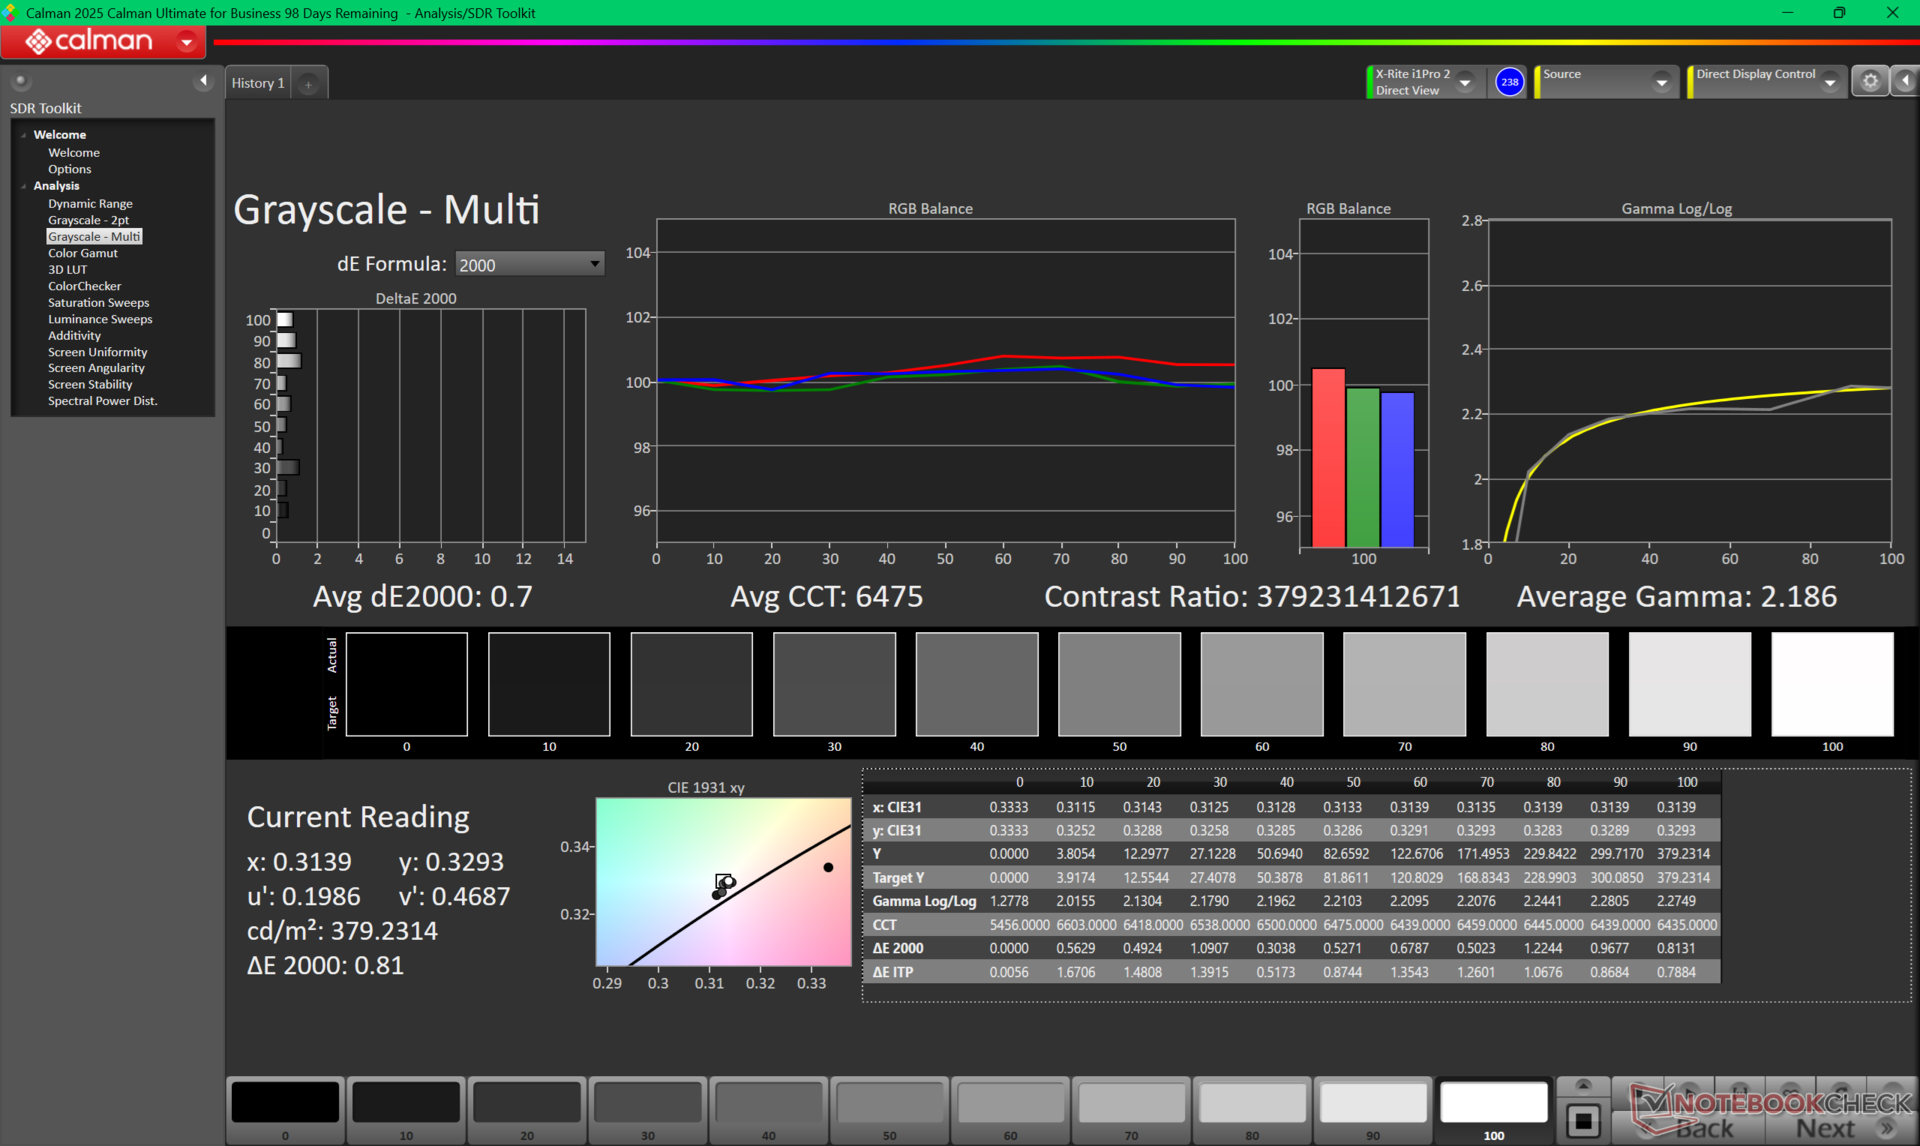
ΔE Greyscale Calman: 1.3 | ∀{0.09-98 Ø4.96}
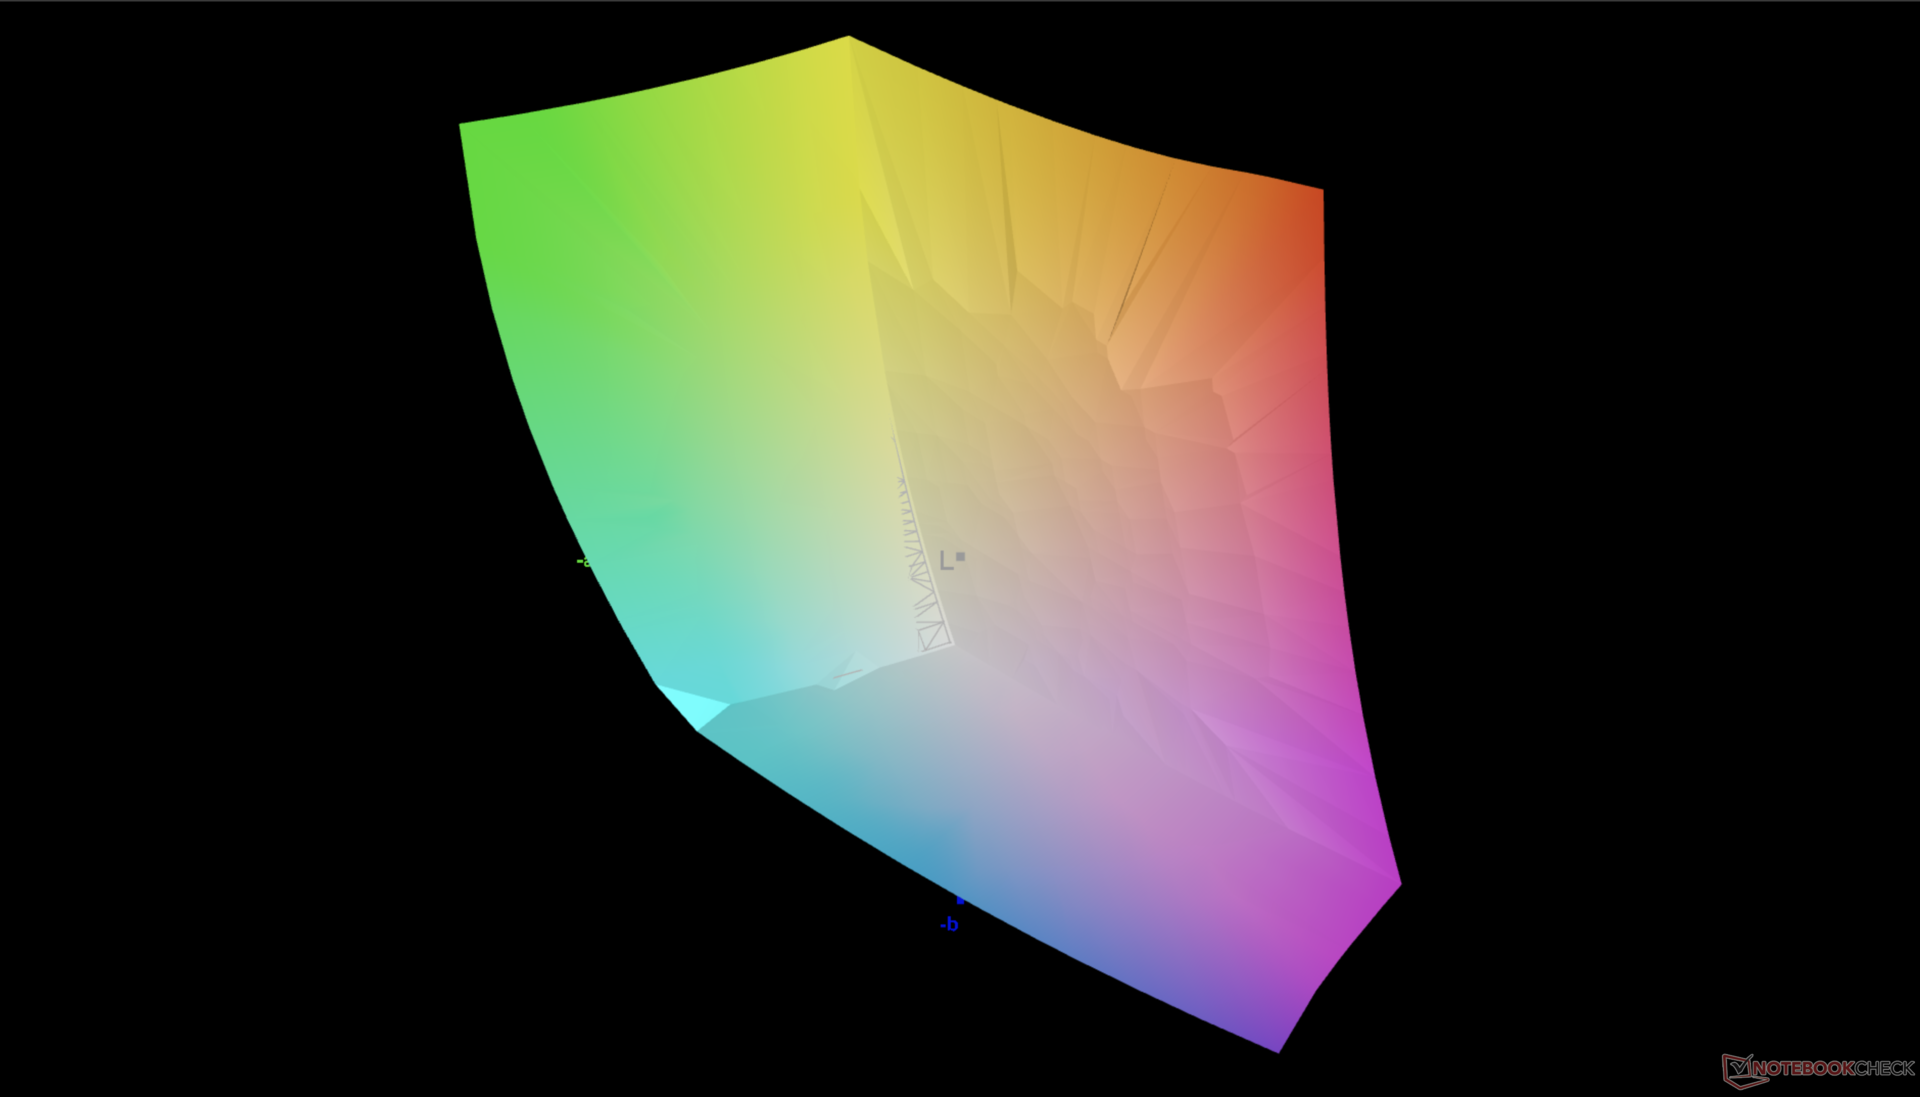
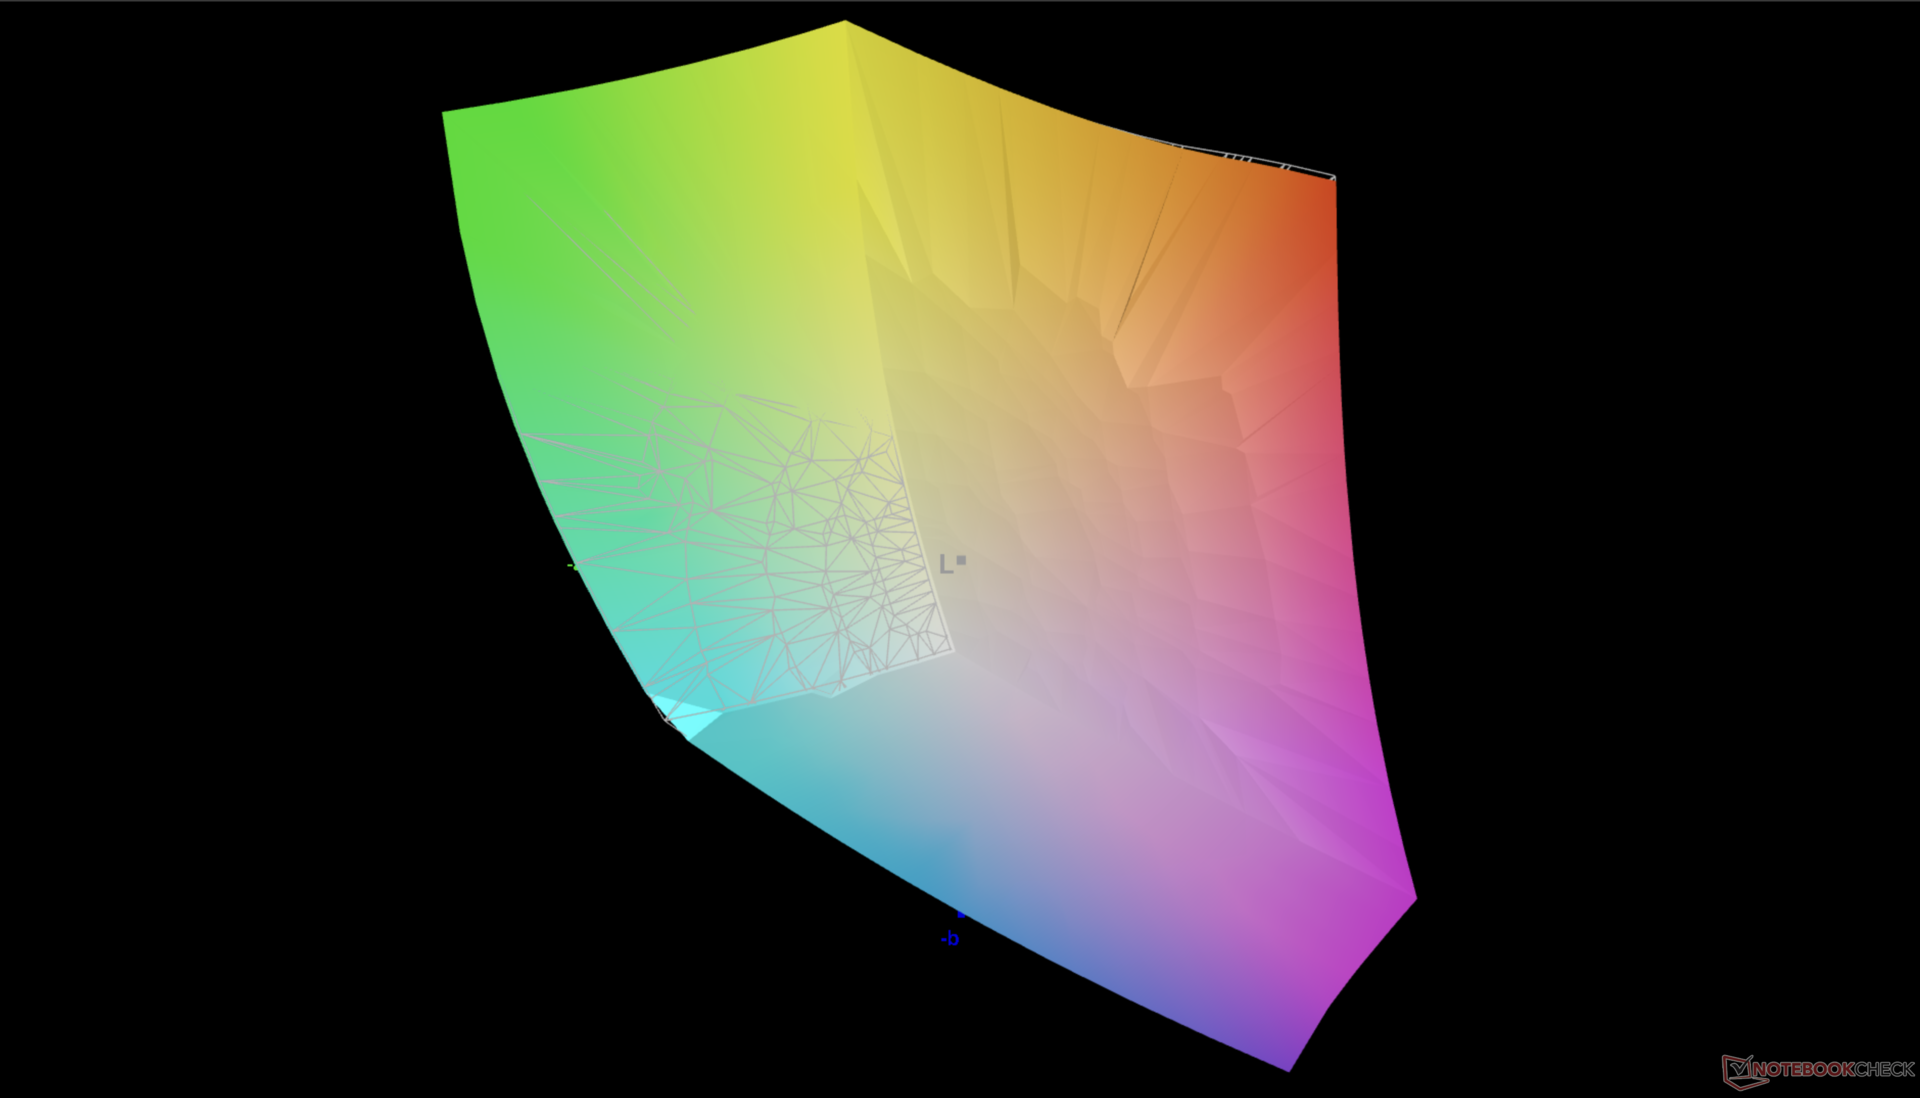
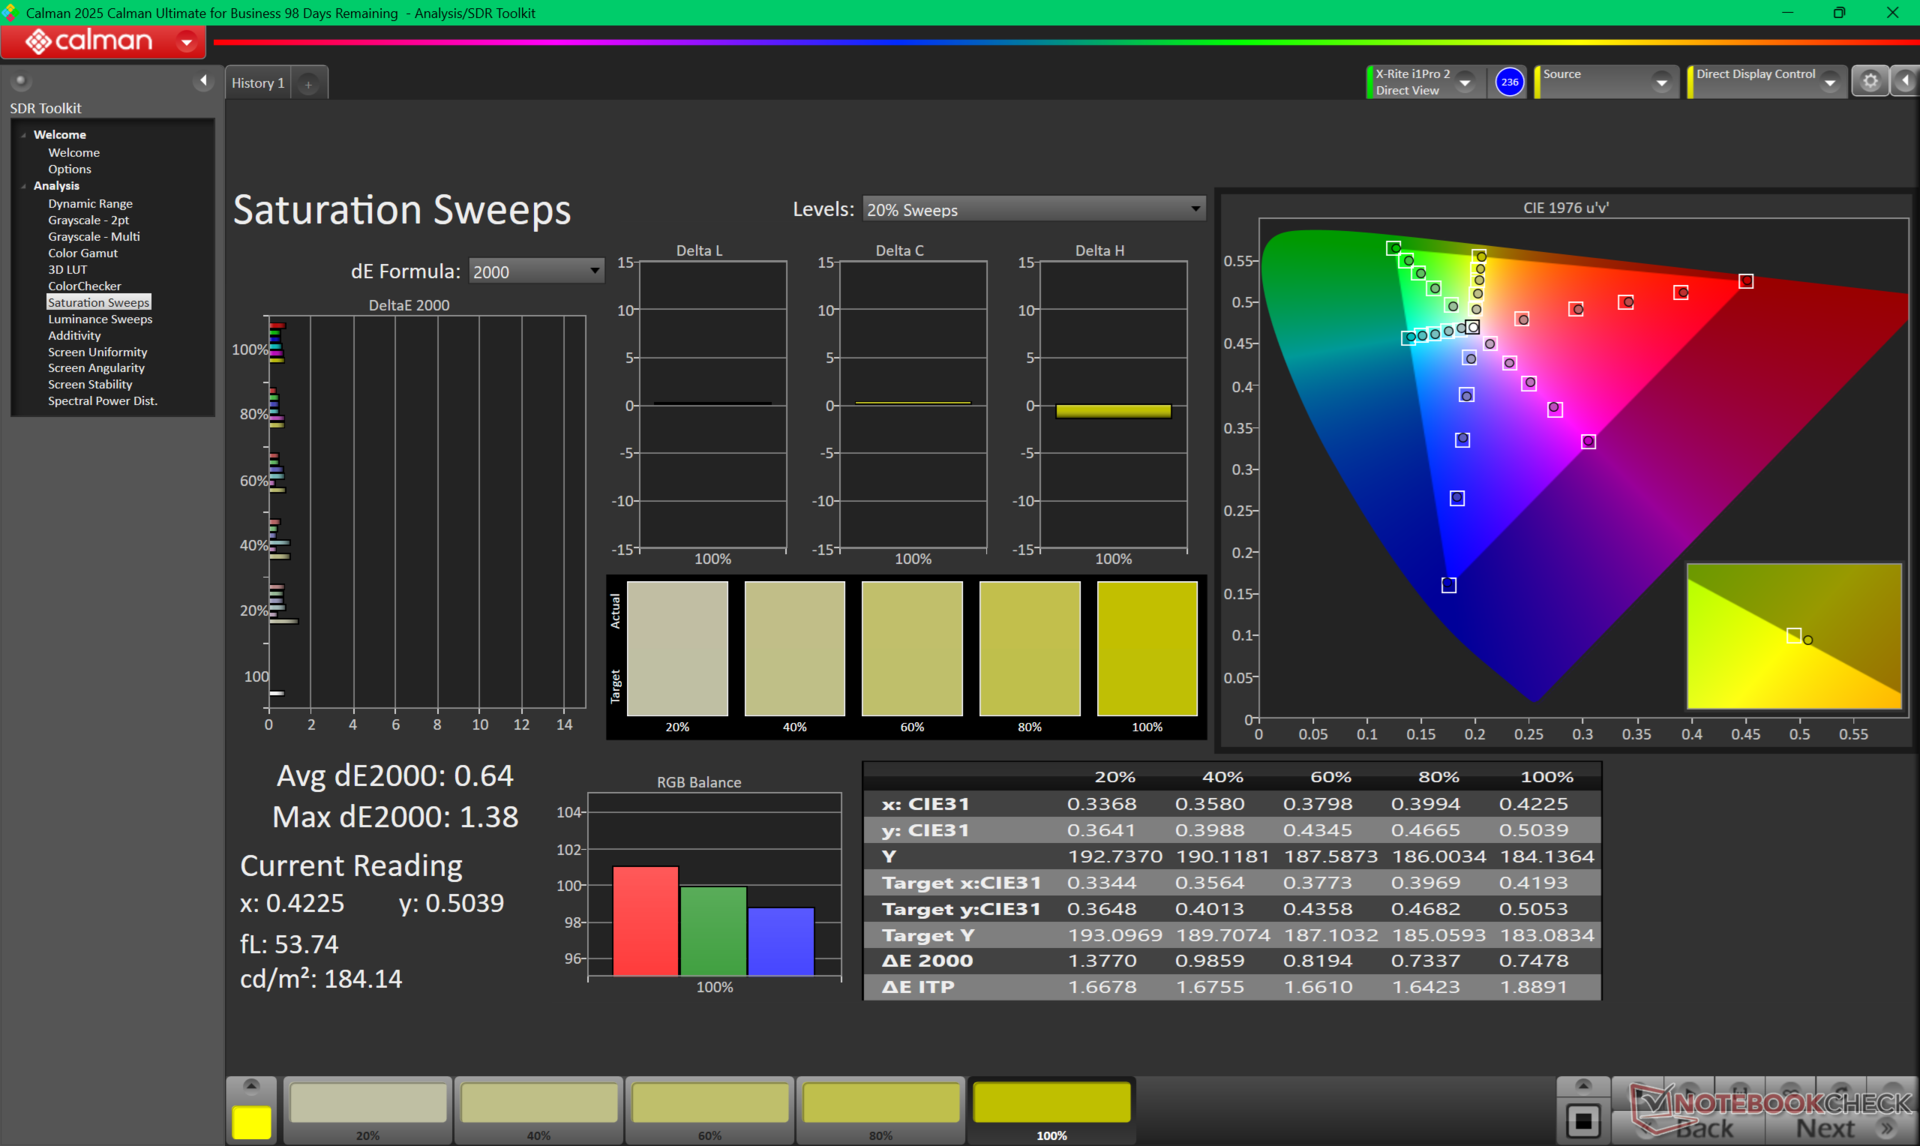
88.1% AdobeRGB 1998 (Argyll 3D)
100% sRGB (Argyll 3D)
99.7% Display P3 (Argyll 3D)
Gamma: 2.2
CCT: 6282 K
| Dell 16 Premium DA16250 Samsung 163DU02, OLED, 3840x2400, 16.3", 120 Hz | Dell XPS 16 9640 SDC4196, OLED, 3840x2400, 16.3", 90 Hz | HP Spectre x360 16 RTX 4050 Samsung SDC41A6, OLED, 2880x1800, 16", 120 Hz | Lenovo Yoga Pro 9i 16 RTX 5070 ATNA60KA01-0, OLED, 3200x2000, 16", 120 Hz | Asus Zenbook S 16 UM5606-RK333W ATNA60CL10-0, OLED, 2880x1800, 16", 120 Hz | LG Gram Pro 16Z90TS-G.AU89G LG DISPLAY LP160WQ2-SPF1, IPS, 2560x1600, 16", 144 Hz | |
|---|---|---|---|---|---|---|
| Display | -0% | 3% | 3% | 3% | -1% | |
| Display P3 Coverage (%) | 99.7 | 98.3 -1% | 99.6 0% | 97.4 -2% | 99.9 0% | 97.96 -2% |
| sRGB Coverage (%) | 100 | 100 0% | 100 0% | 100 0% | 100 0% | 100 0% |
| AdobeRGB 1998 Coverage (%) | 88.1 | 87.8 0% | 96.7 10% | 96.8 10% | 95.6 9% | 86.65 -2% |
| Response Times | -16% | -13% | 50% | 16% | -5457% | |
| Response Time Grey 50% / Grey 80% * (ms) | 0.61 ? | 0.82 ? -34% | 0.78 ? -28% | 0.27 ? 56% | 0.56 ? 8% | 47 ? -7605% |
| Response Time Black / White * (ms) | 0.88 ? | 0.85 ? 3% | 0.86 ? 2% | 0.37 ? 58% | 0.65 ? 26% | 30 ? -3309% |
| PWM Frequency (Hz) | 490.8 ? | 360 ? | 480 ? | 1200 | 480 | |
| PWM Amplitude * (%) | 35 | 22 37% | 30 14% | |||
| Screen | -22% | -28% | 63% | 31% | 5% | |
| Brightness middle (cd/m²) | 385.7 | 366 -5% | 385.2 0% | 974 153% | 407 6% | 442 15% |
| Brightness (cd/m²) | 387 | 367 -5% | 387 0% | 979 153% | 405 5% | 406 5% |
| Brightness Distribution (%) | 98 | 96 -2% | 99 1% | 98 0% | 97 -1% | 86 -12% |
| Black Level * (cd/m²) | 0.02 | 0.17 | ||||
| Colorchecker dE 2000 * | 1.36 | 1.3 4% | 1.73 -27% | 0.9 34% | 0.6 56% | 0.84 38% |
| Colorchecker dE 2000 max. * | 2.85 | 3.6 -26% | 3.95 -39% | 1.7 40% | 1.2 58% | 1.62 43% |
| Colorchecker dE 2000 calibrated * | 0.65 | 1 -54% | 0.88 -35% | |||
| Greyscale dE 2000 * | 1.3 | 2.2 -69% | 2.6 -100% | 1.3 -0% | 0.5 62% | 1.53 -18% |
| Gamma | 2.2 100% | 2.14 103% | 2.17 101% | 2.21 100% | 2.2 100% | 2.173 101% |
| CCT | 6282 103% | 6680 97% | 6133 106% | 6751 96% | 6453 101% | 6496 100% |
| Contrast (:1) | 20350 | 2600 | ||||
| Totalt genomsnitt (program/inställningar) | -13% /
-16% | -13% /
-16% | 39% /
45% | 17% /
20% | -1818% /
-907% |
* ... mindre är bättre
Visa svarstider
| ↔ Svarstid svart till vitt | ||
|---|---|---|
| 0.88 ms ... stiga ↗ och falla ↘ kombinerat | ↗ 0.41 ms stiga | 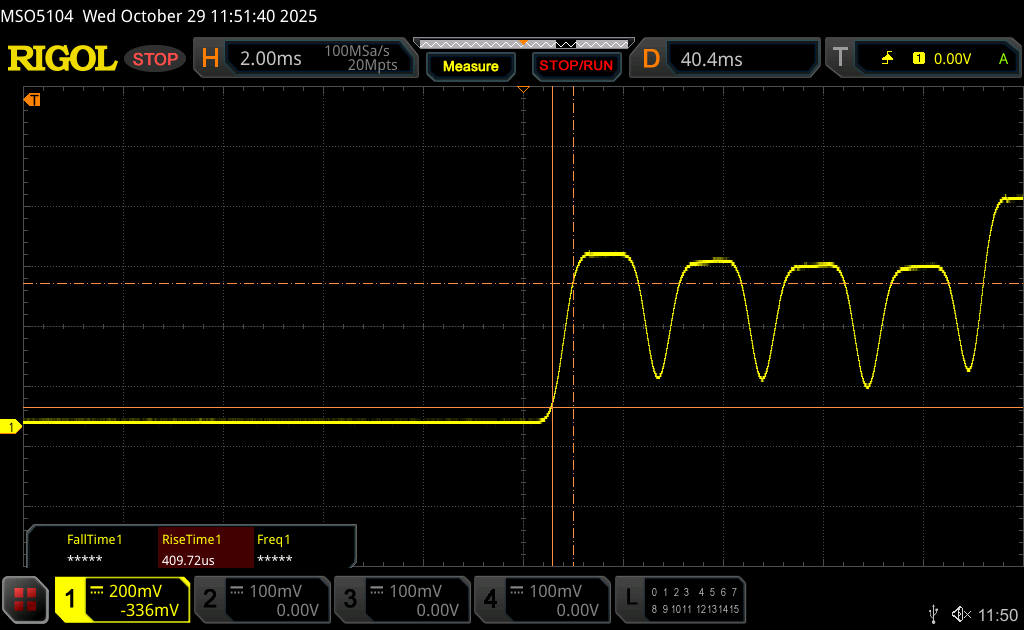 |
| ↘ 0.47 ms hösten | ||
| Skärmen visar väldigt snabba svarsfrekvenser i våra tester och borde vara mycket väl lämpad för fartfyllt spel. I jämförelse sträcker sig alla testade enheter från 0.1 (minst) till 240 (maximalt) ms. » 3 % av alla enheter är bättre. Det betyder att den uppmätta svarstiden är bättre än genomsnittet av alla testade enheter (19.8 ms). | ||
| ↔ Svarstid 50 % grått till 80 % grått | ||
| 0.61 ms ... stiga ↗ och falla ↘ kombinerat | ↗ 0.31 ms stiga | 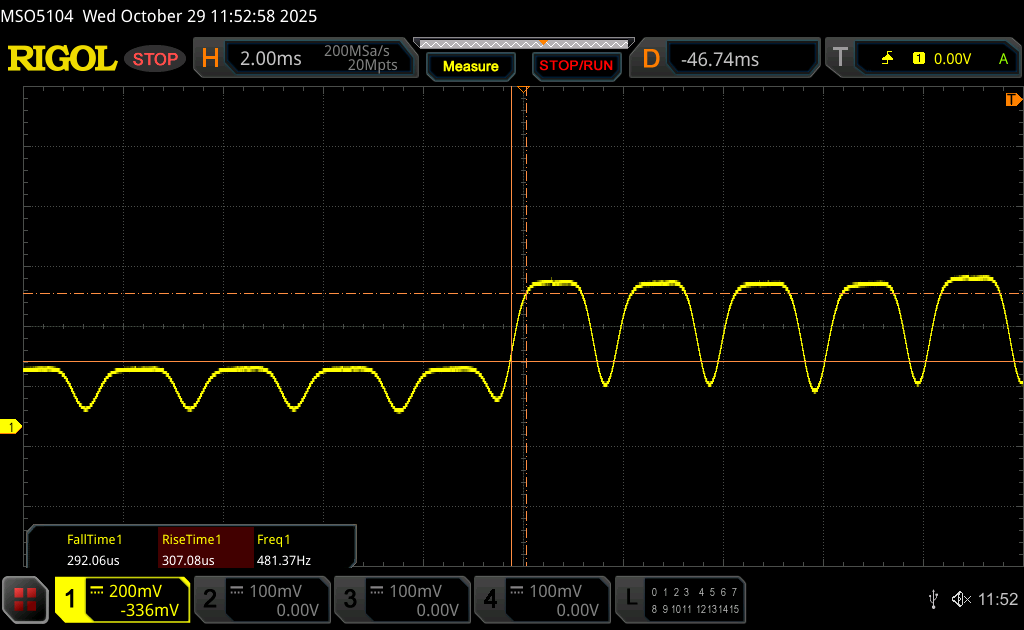 |
| ↘ 0.3 ms hösten | ||
| Skärmen visar väldigt snabba svarsfrekvenser i våra tester och borde vara mycket väl lämpad för fartfyllt spel. I jämförelse sträcker sig alla testade enheter från 0.165 (minst) till 636 (maximalt) ms. » 2 % av alla enheter är bättre. Det betyder att den uppmätta svarstiden är bättre än genomsnittet av alla testade enheter (31 ms). | ||
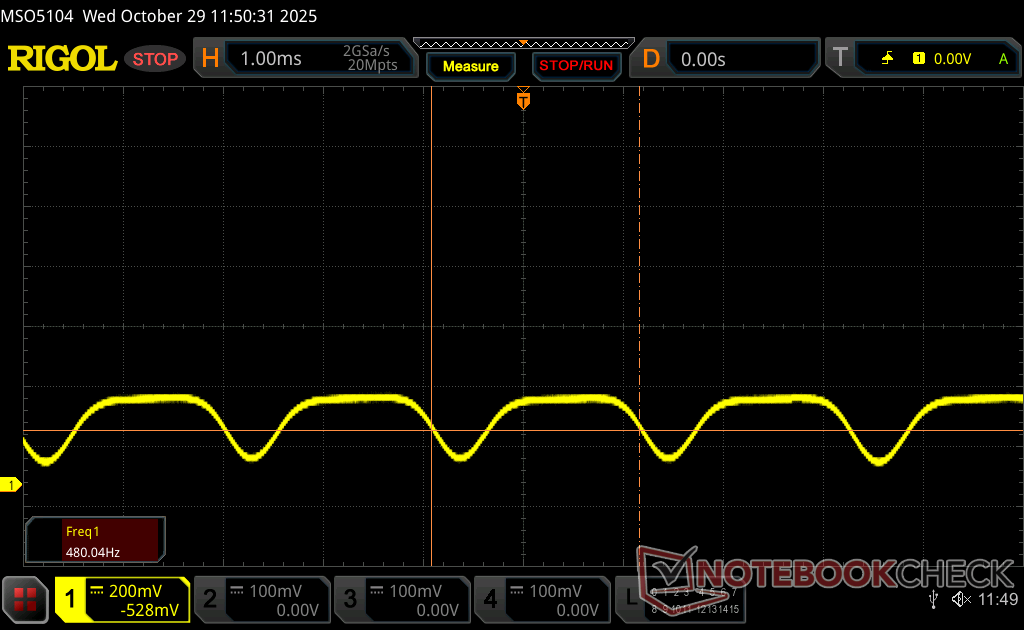
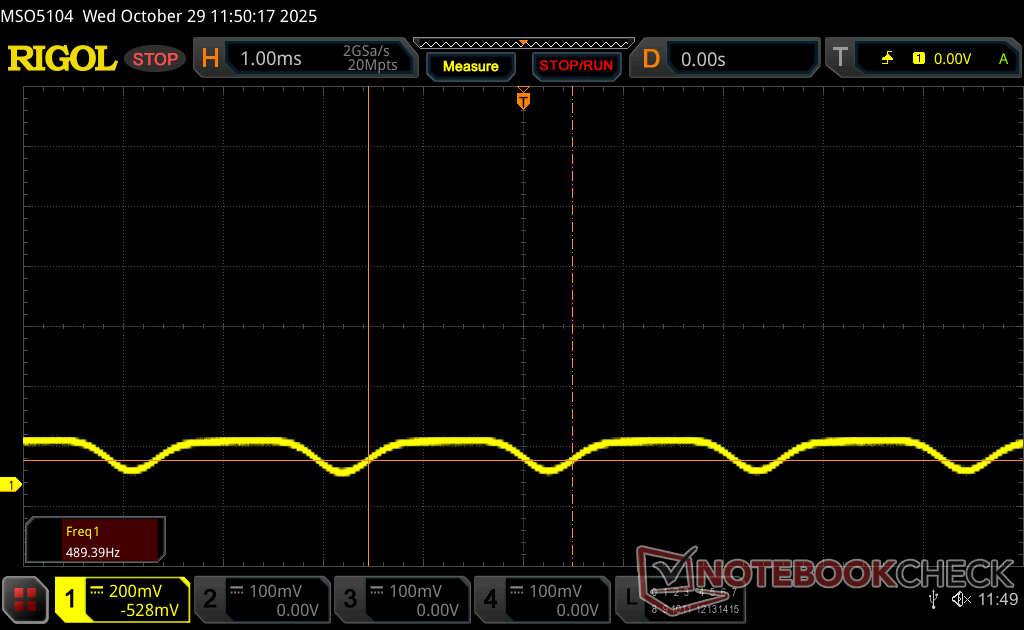
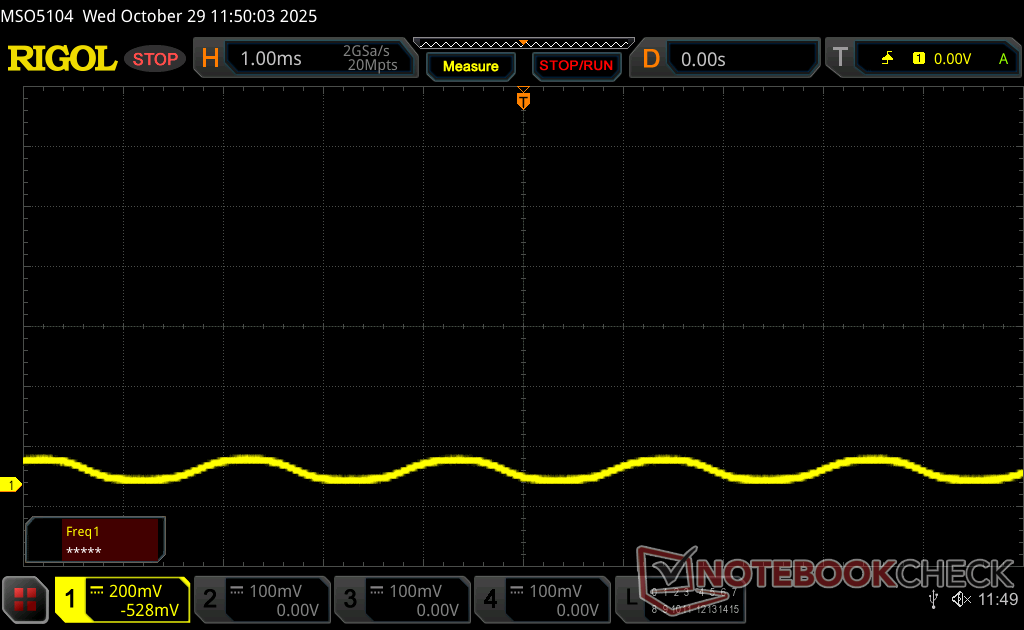
Skärmflimmer / PWM (Puls-Width Modulation)
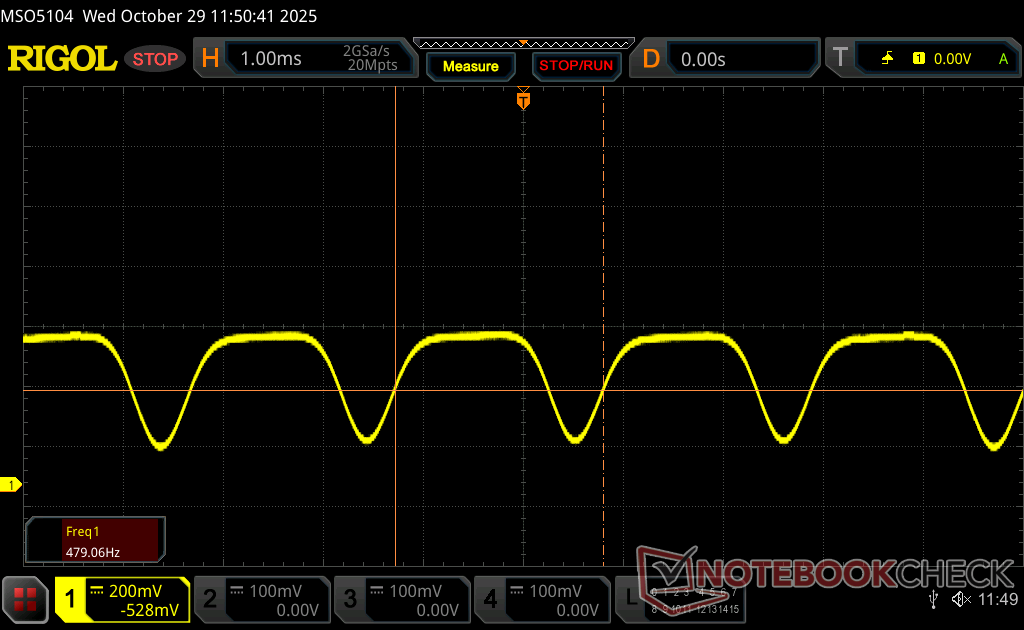
| Skärmflimmer / PWM upptäckt | 490.8 Hz Amplitude: 35 % | ≤ 100 % ljusstyrka inställning | 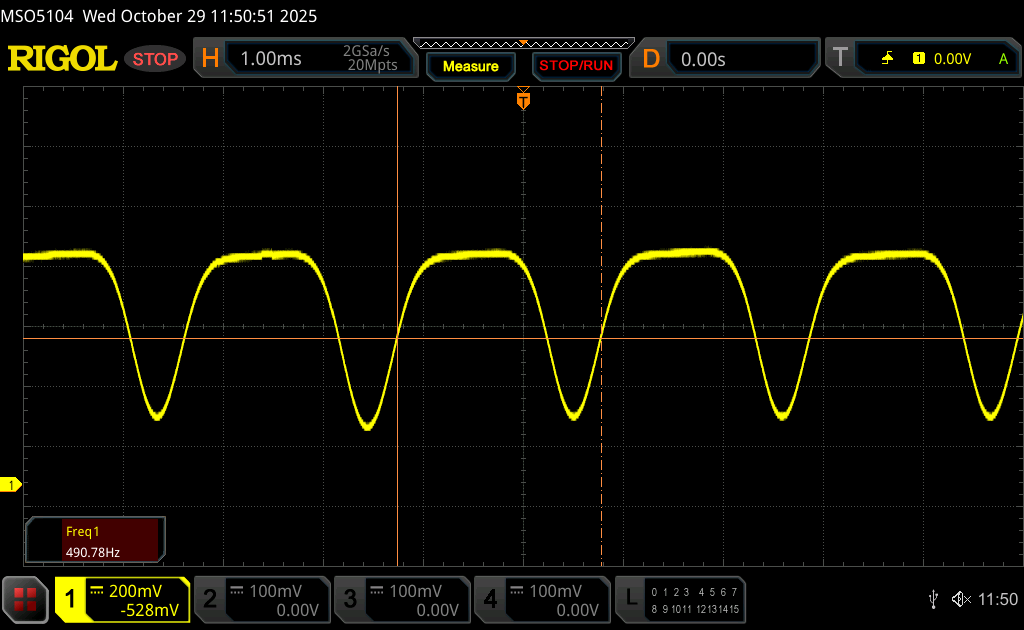 |
Displayens bakgrundsbelysning flimrar vid 490.8 Hz (i värsta fall, t.ex. med PWM) Flimrande upptäckt vid en ljusstyrkeinställning på 100 % och lägre. Det ska inte finnas något flimmer eller PWM över denna ljusstyrkeinställning. Frekvensen för 490.8 Hz är relativt hög, så de flesta användare som är känsliga för PWM bör inte märka något flimmer. Det finns dock rapporter om att vissa användare fortfarande är känsliga för PWM vid 500 Hz och högre, så var uppmärksam. Som jämförelse: 52 % av alla testade enheter använder inte PWM för att dämpa skärmen. Om PWM upptäcktes mättes ett medelvärde av 7754 (minst: 5 - maximum: 343500) Hz. | |||


Prestanda
Testförhållanden
Vi ställde in Dell Optimizer i prestandaläge och Nvidia Control Panel i läge för diskret grafik innan vi körde nedanstående riktmärken.
Processor
Core Ultra 7 Core Ultra 7 255H är upp till 20 procent snabbare än Core Ultra 7 155H i förra årets XPS 16. Uppgradering till den ännu dyrare Core Ultra 9 285H förväntas bara öka prestandan med några få procentenheter.
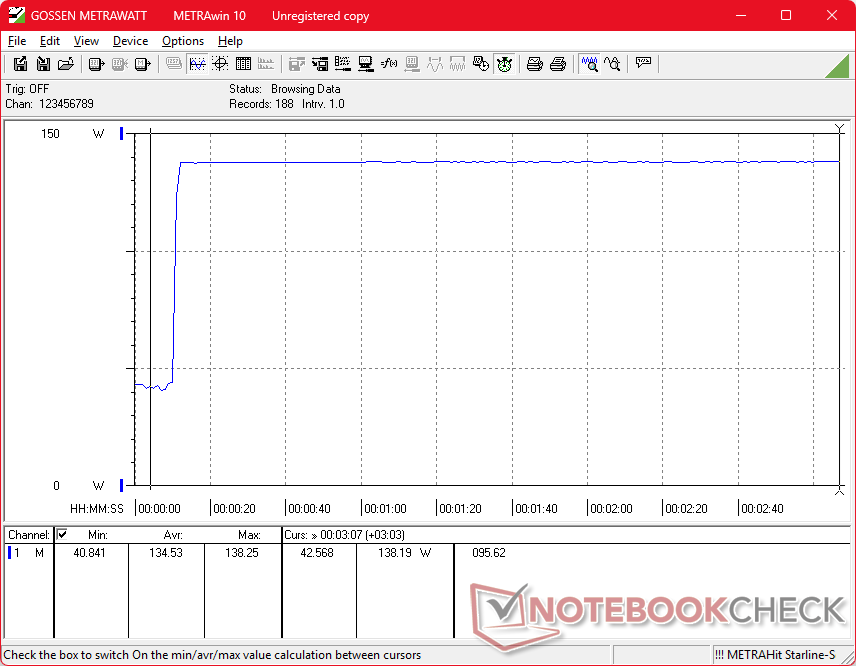
Turbo Boost-hållbarheten kunde vara bättre. När CineBench R15 xT kördes i en loop sjönk poängen med nästan 15 procent över tid, vilket visas i diagrammet nedan. Prestandagapet mellan Core Ultra 7 255H och Core Ultra 7 155H i förra årets modell blir mindre när systemen utsätts för stress.
Cinebench R15 Multi Loop
Cinebench R23: Multi Core | Single Core
Cinebench R20: CPU (Multi Core) | CPU (Single Core)
Cinebench R15: CPU Multi 64Bit | CPU Single 64Bit
Blender: v2.79 BMW27 CPU
7-Zip 18.03: 7z b 4 | 7z b 4 -mmt1
Geekbench 6.7: Multi-Core | Single-Core
Geekbench 5.5: Multi-Core | Single-Core
HWBOT x265 Benchmark v2.2: 4k Preset
LibreOffice : 20 Documents To PDF
R Benchmark 2.5: Overall mean
* ... mindre är bättre
Stresstest
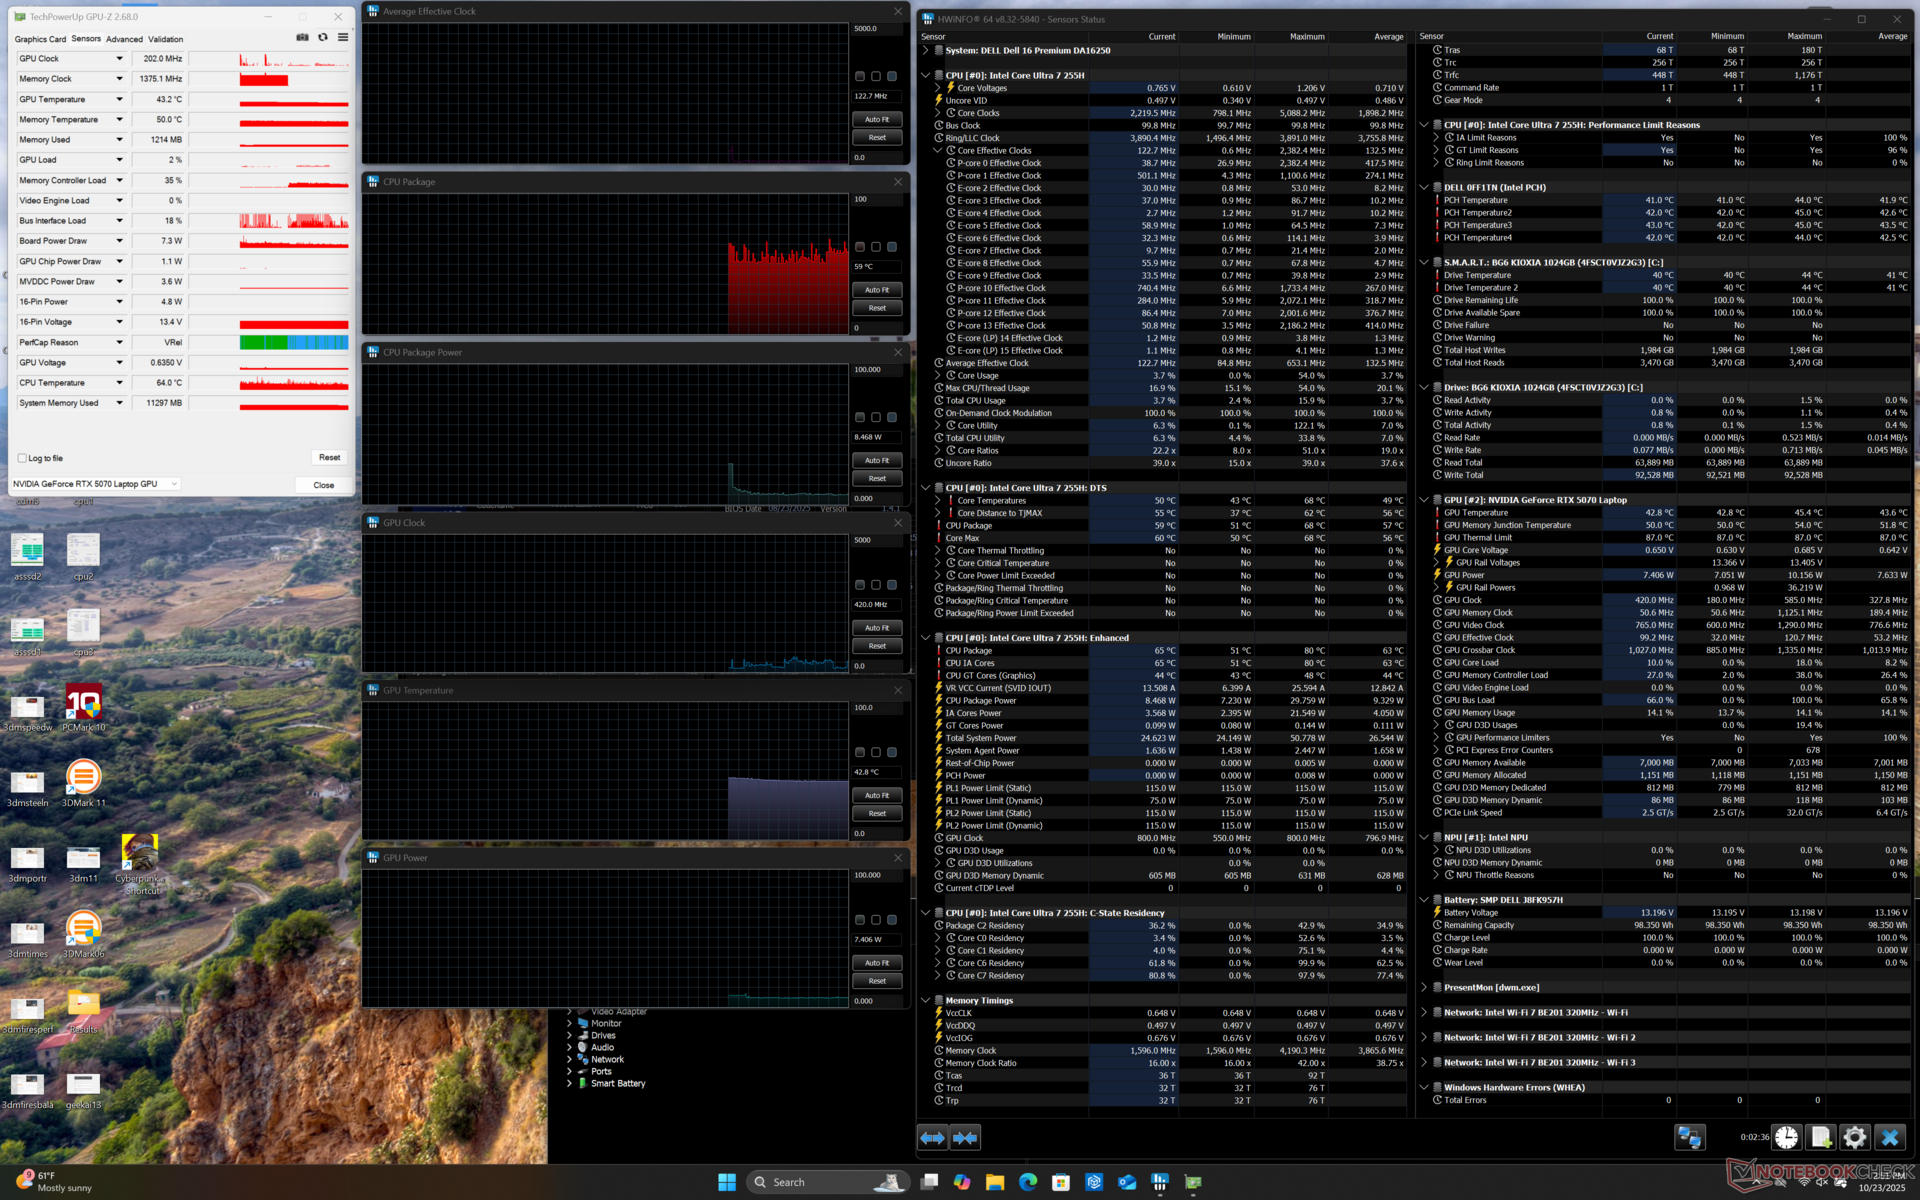
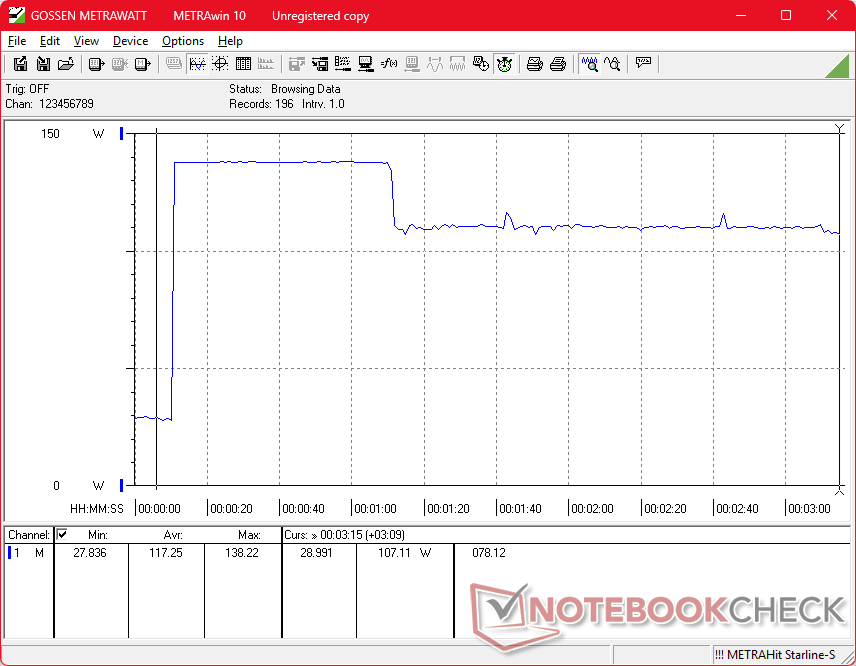
Kärntemperaturerna kan fortfarande nå relativt höga nivåer, särskilt för processorn. När vi körde Prime95-stress, till exempel, ökade processorn till 3,7 GHz, 105 C och 115 W innan den föll till 3 GHz, 93 C och 67 W kort därefter. Maximal Turbo Boost-hållbarhet är således begränsad, vilket exemplifieras ovan i avsnittet CPU-prestanda.
GPU-kortets strömförbrukning när Cyberpunk 2077 körs är i genomsnitt cirka 55 W till 65 W jämfört med 115 W på en bärbar speldator som Alienware 16X Aurora med samma RTX 5070 GPU.
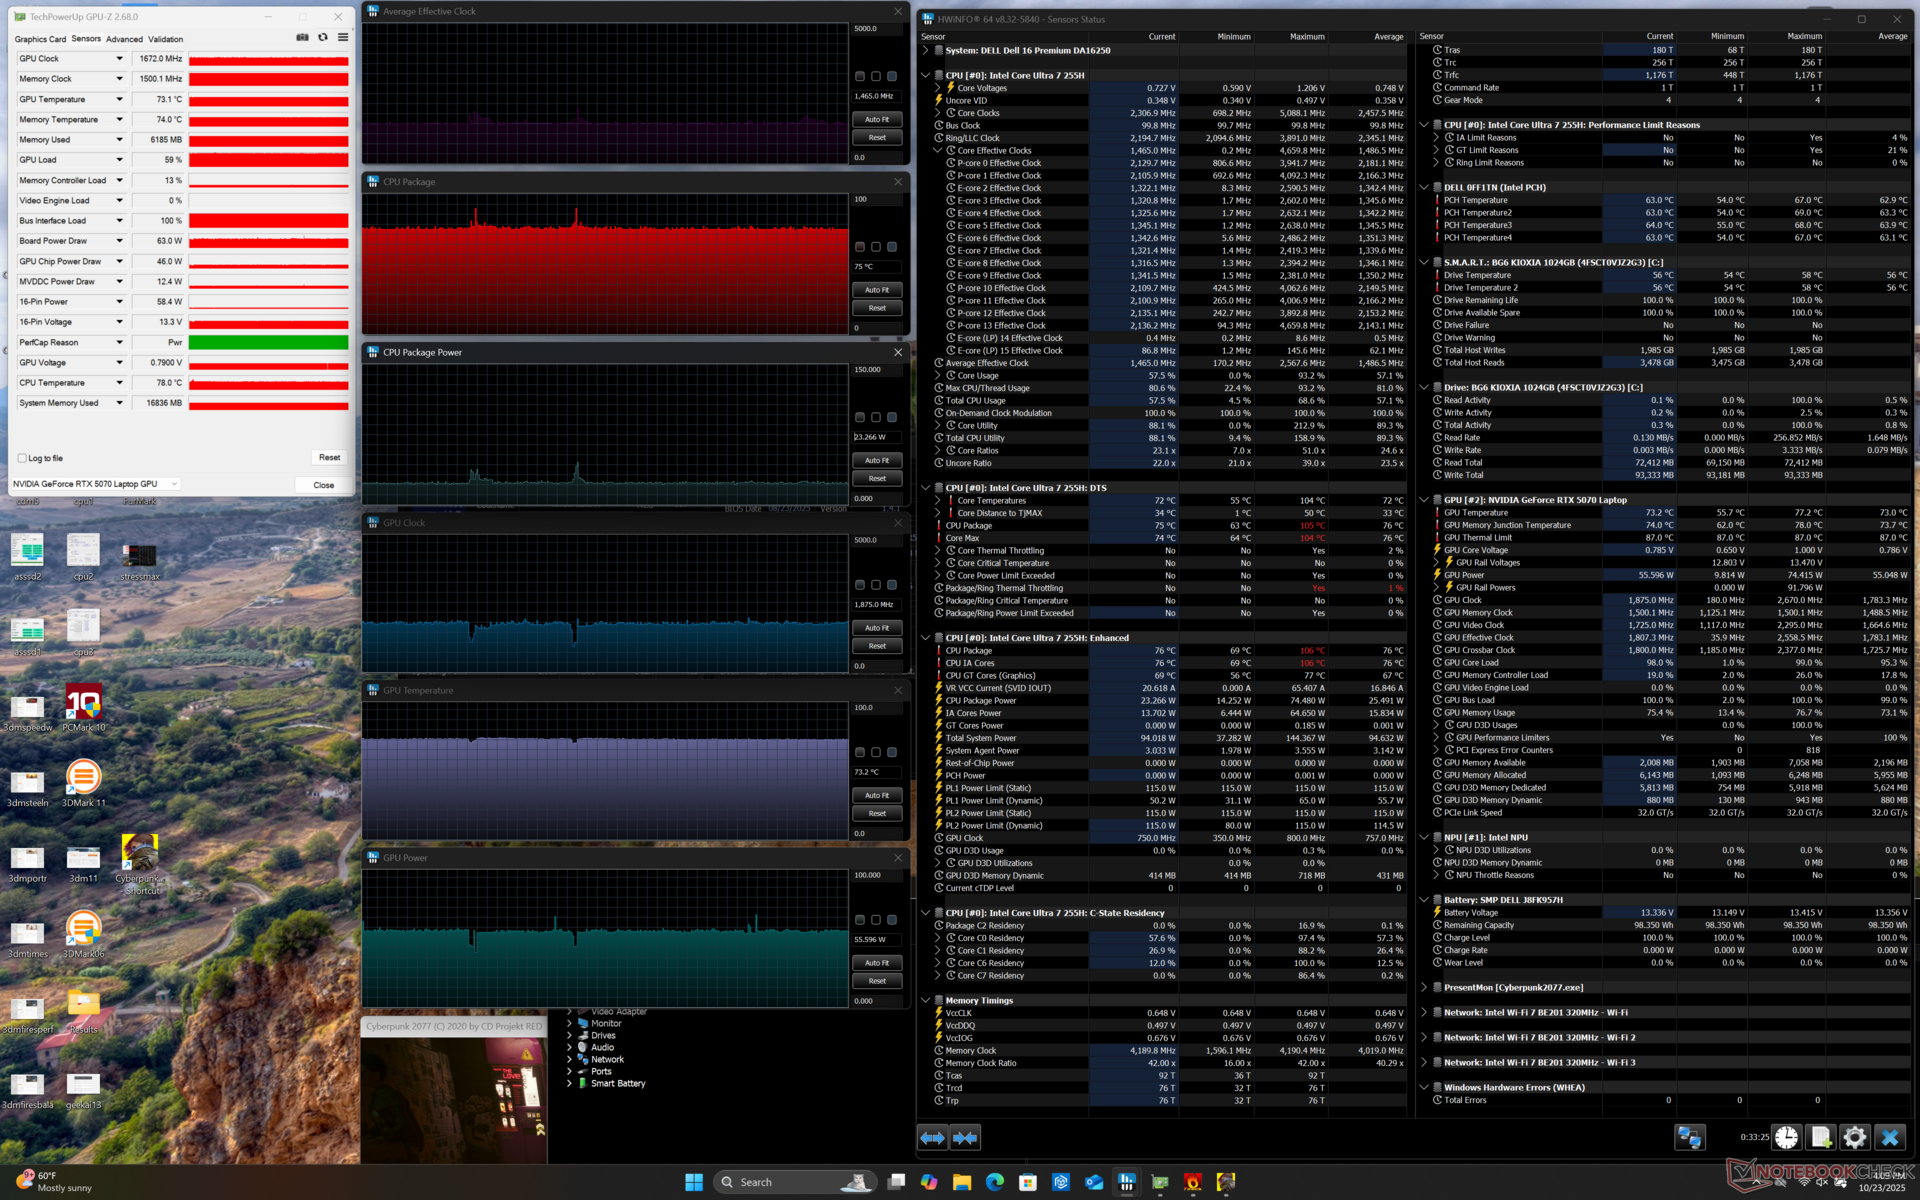

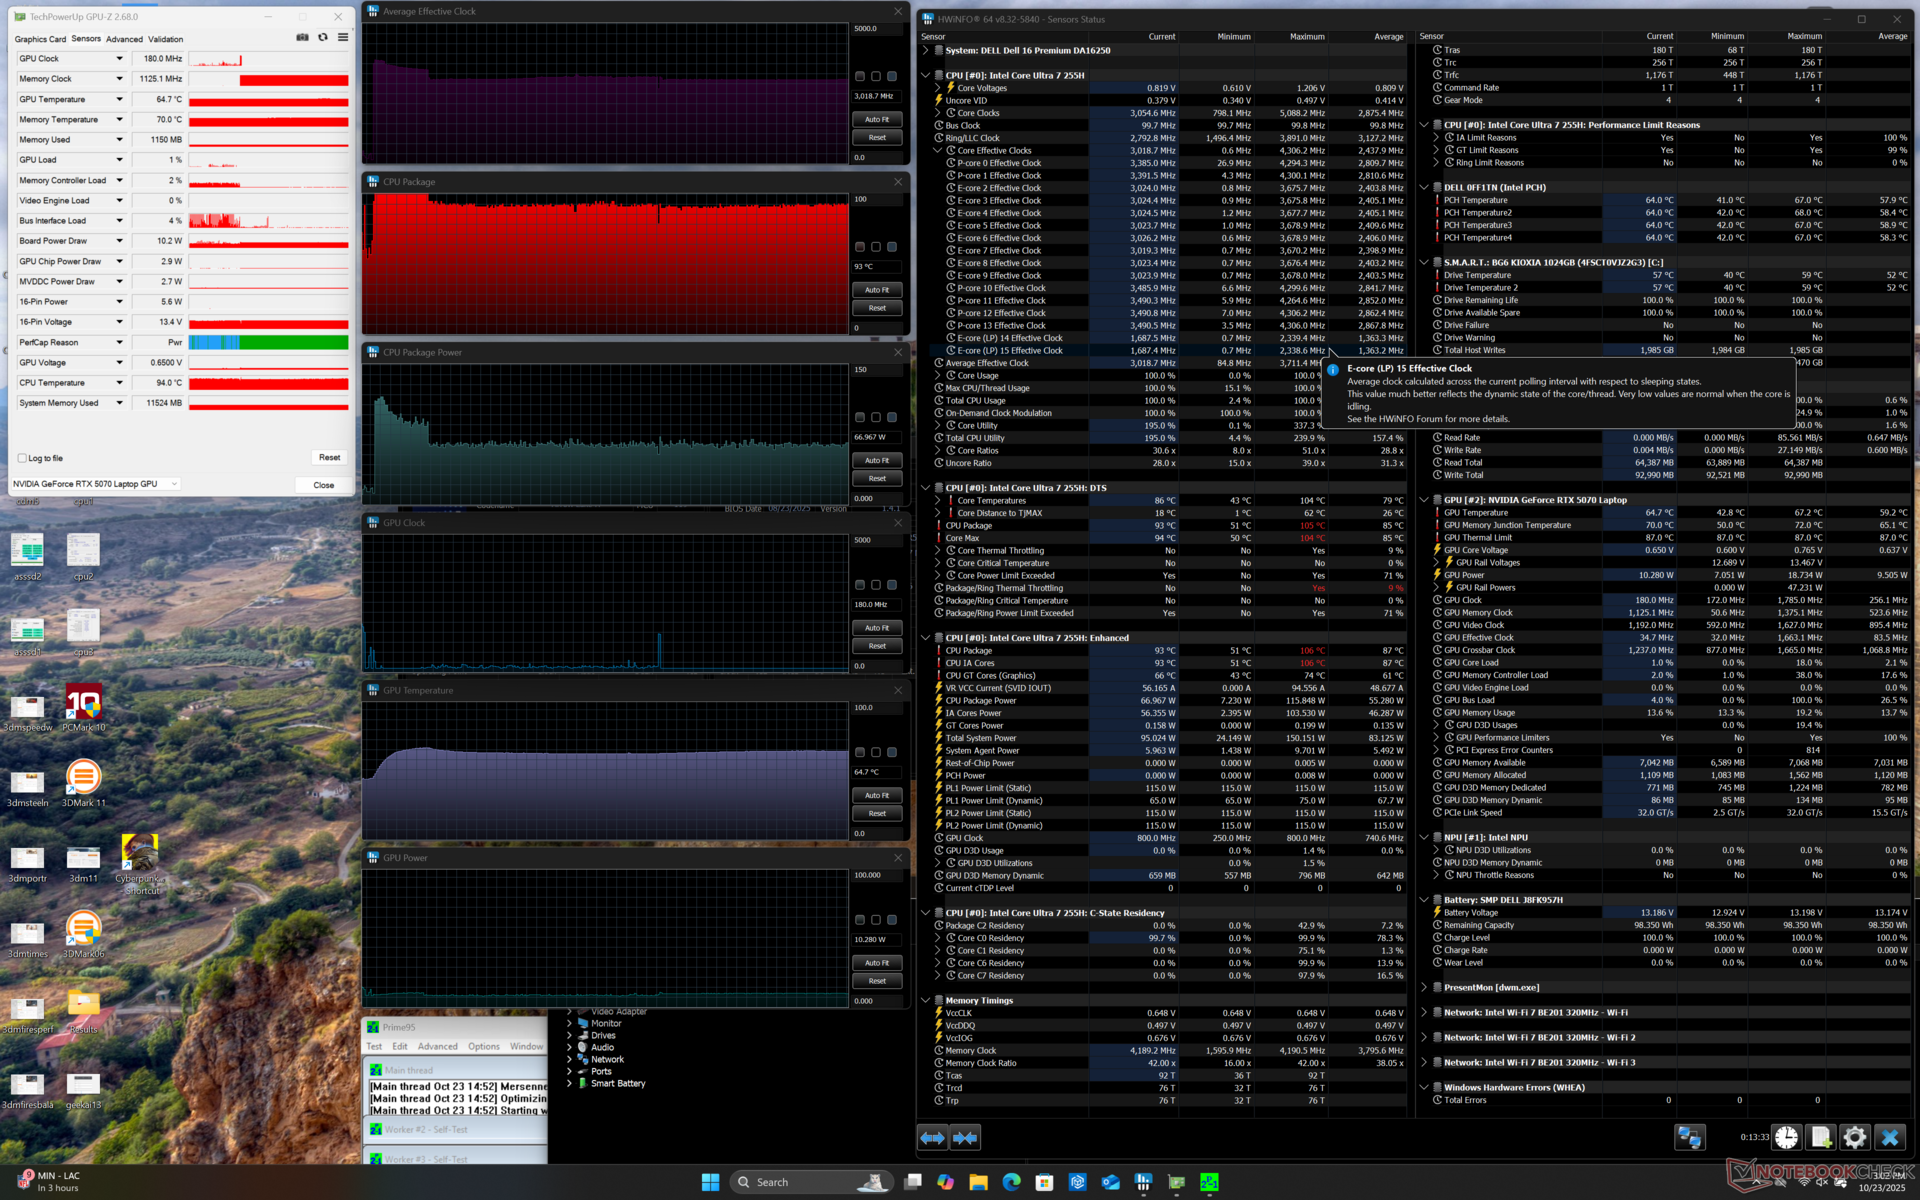
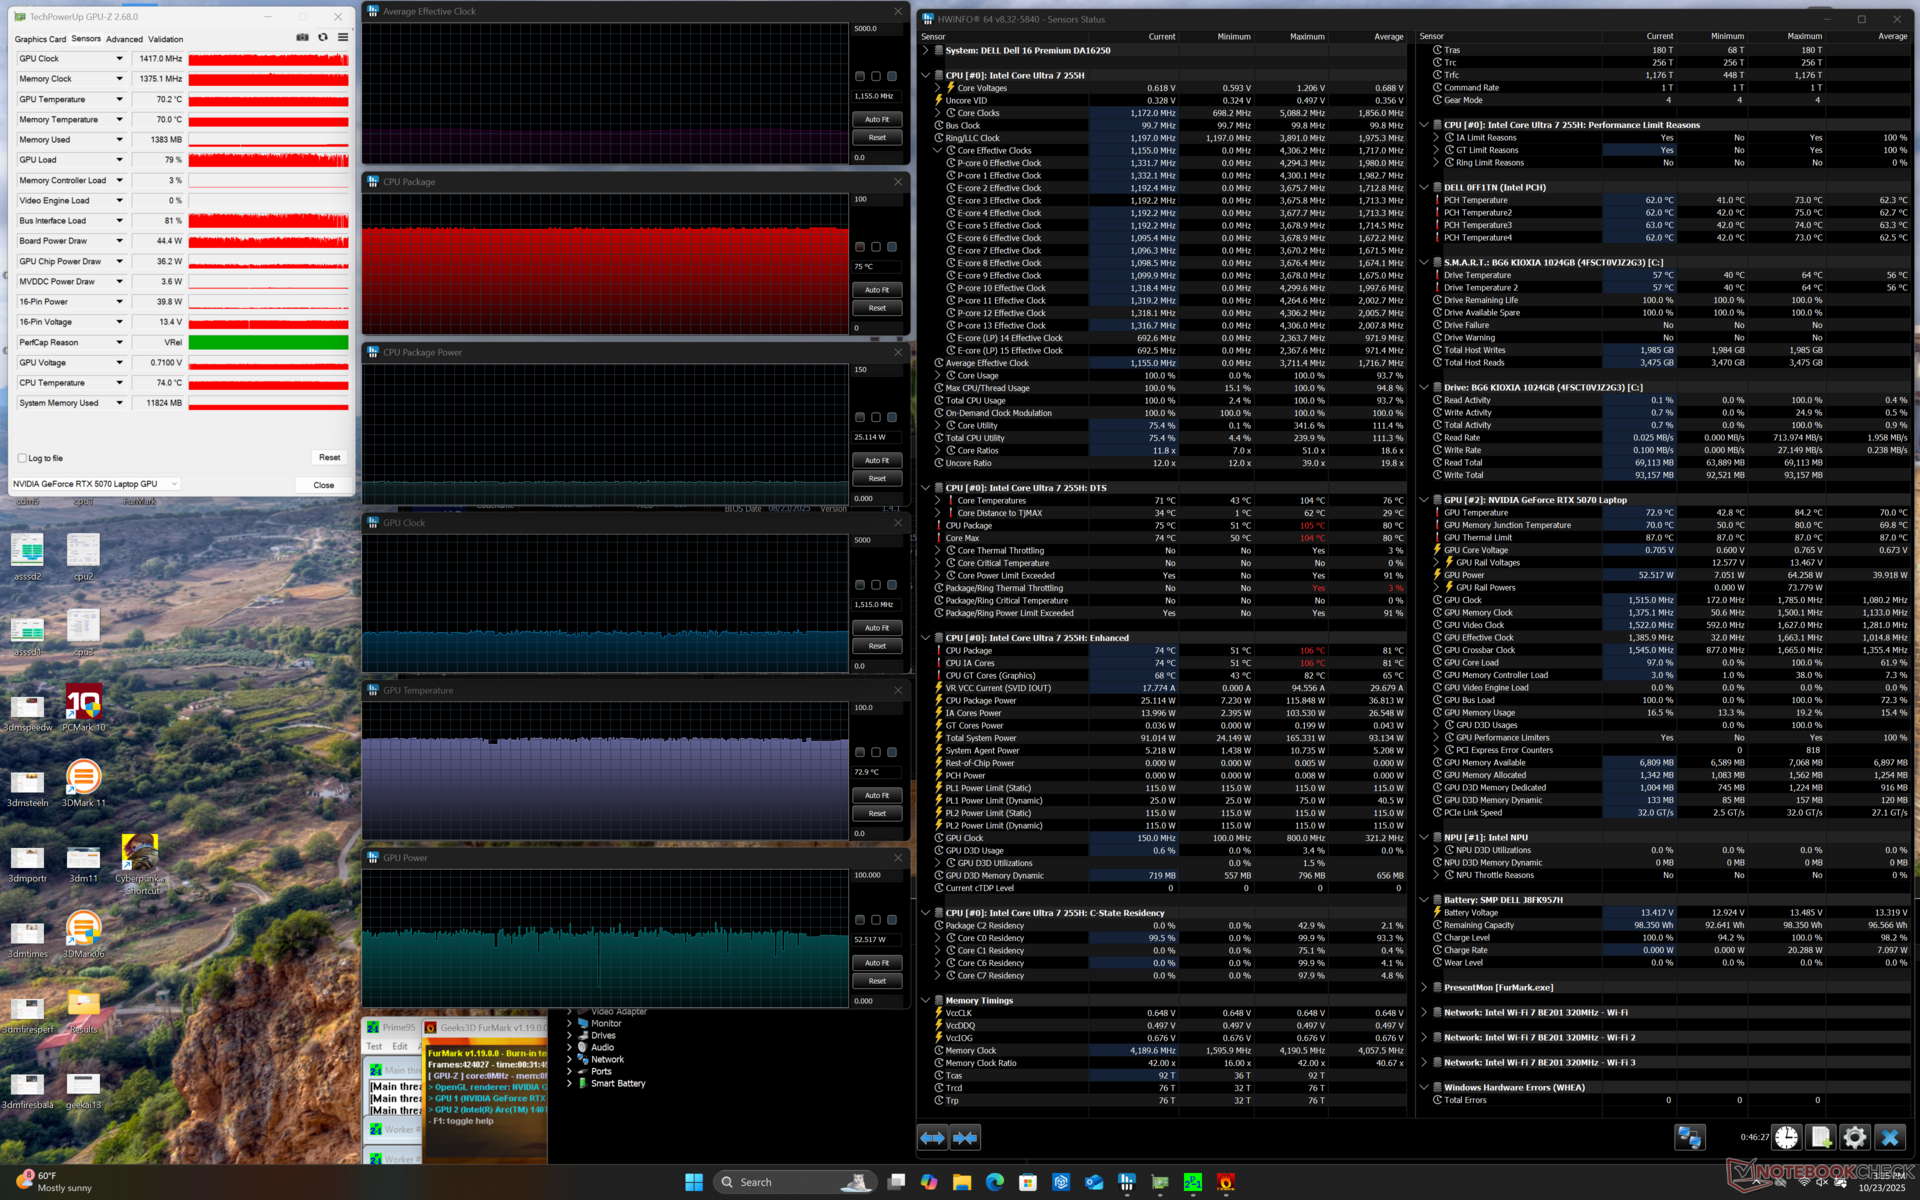
| Genomsnittlig CPU-klocka (GHz) | GPU-klocka (MHz) | Genomsnittlig CPU-temperatur (°C) | Genomsnittlig GPU-temperatur (°C) | |
| System i viloläge | -- | -- | 59 | 43 |
| Prime95 Stress | 3.0 | -- | 93 | 65 |
| Cyberpunk 2077 Stress (balanserat läge) | 1,5 | 1672 | 75 | 73 |
| Cyberpunk 2077 Stress (Performance mode) | 1.5 | 1687 | 76 | 73 |
| Prime95 + FurMark Stress | 1.2 | 1417 | 75 | 73 |
Systemets prestanda
Både AIDA64 och PCMark 10 gick inte att köra på vår enhet och därför har poängen utelämnats nedan.
CrossMark: Overall | Productivity | Creativity | Responsiveness
WebXPRT 3: Overall
WebXPRT 4: Overall
Mozilla Kraken 1.1: Total
| Performance rating | |
| Lenovo Yoga Pro 9i 16 RTX 5070 | |
| Dell XPS 16 9640 -1! | |
| Dell 16 Premium DA16250 | |
| Genomsnitt Intel Core Ultra 7 255H, NVIDIA GeForce RTX 5070 Laptop | |
| Asus Zenbook S 16 UM5606-RK333W | |
| LG Gram Pro 16Z90TS-G.AU89G | |
| HP Spectre x360 16 RTX 4050 | |
| CrossMark / Overall | |
| Lenovo Yoga Pro 9i 16 RTX 5070 | |
| Dell 16 Premium DA16250 | |
| Genomsnitt Intel Core Ultra 7 255H, NVIDIA GeForce RTX 5070 Laptop (n=1) | |
| Dell XPS 16 9640 | |
| Asus Zenbook S 16 UM5606-RK333W | |
| LG Gram Pro 16Z90TS-G.AU89G | |
| HP Spectre x360 16 RTX 4050 | |
| CrossMark / Productivity | |
| Lenovo Yoga Pro 9i 16 RTX 5070 | |
| Dell 16 Premium DA16250 | |
| Genomsnitt Intel Core Ultra 7 255H, NVIDIA GeForce RTX 5070 Laptop (n=1) | |
| Dell XPS 16 9640 | |
| Asus Zenbook S 16 UM5606-RK333W | |
| LG Gram Pro 16Z90TS-G.AU89G | |
| HP Spectre x360 16 RTX 4050 | |
| CrossMark / Creativity | |
| Lenovo Yoga Pro 9i 16 RTX 5070 | |
| Dell 16 Premium DA16250 | |
| Genomsnitt Intel Core Ultra 7 255H, NVIDIA GeForce RTX 5070 Laptop (n=1) | |
| Asus Zenbook S 16 UM5606-RK333W | |
| Dell XPS 16 9640 | |
| LG Gram Pro 16Z90TS-G.AU89G | |
| HP Spectre x360 16 RTX 4050 | |
| CrossMark / Responsiveness | |
| Dell 16 Premium DA16250 | |
| Genomsnitt Intel Core Ultra 7 255H, NVIDIA GeForce RTX 5070 Laptop (n=1) | |
| Dell XPS 16 9640 | |
| Lenovo Yoga Pro 9i 16 RTX 5070 | |
| Asus Zenbook S 16 UM5606-RK333W | |
| LG Gram Pro 16Z90TS-G.AU89G | |
| HP Spectre x360 16 RTX 4050 | |
| WebXPRT 3 / Overall | |
| Lenovo Yoga Pro 9i 16 RTX 5070 | |
| Dell 16 Premium DA16250 | |
| Genomsnitt Intel Core Ultra 7 255H, NVIDIA GeForce RTX 5070 Laptop (n=1) | |
| Asus Zenbook S 16 UM5606-RK333W | |
| Dell XPS 16 9640 | |
| HP Spectre x360 16 RTX 4050 | |
| LG Gram Pro 16Z90TS-G.AU89G | |
| WebXPRT 4 / Overall | |
| Lenovo Yoga Pro 9i 16 RTX 5070 | |
| Dell 16 Premium DA16250 | |
| Genomsnitt Intel Core Ultra 7 255H, NVIDIA GeForce RTX 5070 Laptop (n=1) | |
| LG Gram Pro 16Z90TS-G.AU89G | |
| Asus Zenbook S 16 UM5606-RK333W | |
| HP Spectre x360 16 RTX 4050 | |
| Dell XPS 16 9640 | |
| Mozilla Kraken 1.1 / Total | |
| HP Spectre x360 16 RTX 4050 | |
| LG Gram Pro 16Z90TS-G.AU89G | |
| Dell 16 Premium DA16250 | |
| Genomsnitt Intel Core Ultra 7 255H, NVIDIA GeForce RTX 5070 Laptop (n=1) | |
| Asus Zenbook S 16 UM5606-RK333W | |
| Lenovo Yoga Pro 9i 16 RTX 5070 | |
* ... mindre är bättre
DPC-fördröjning
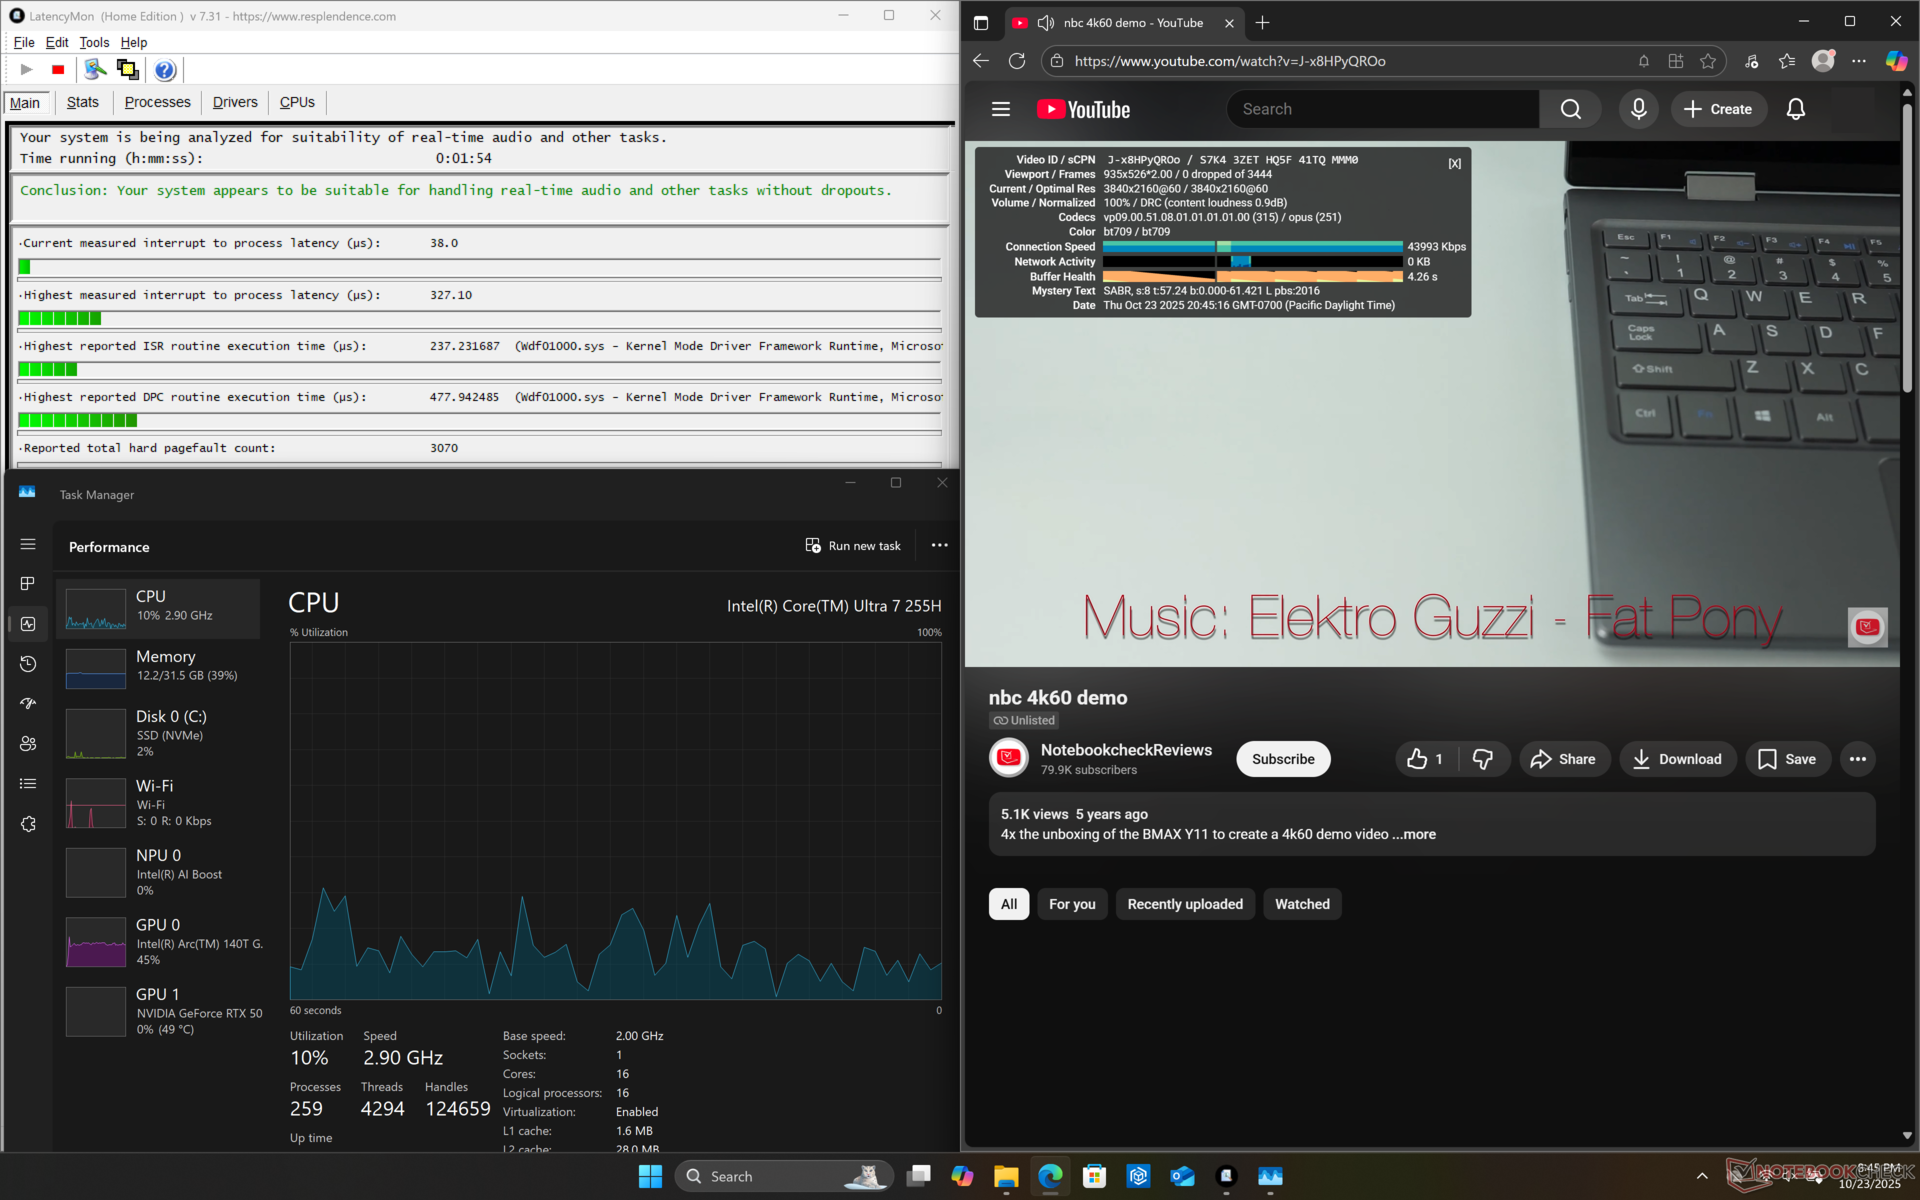

| DPC Latencies / LatencyMon - interrupt to process latency (max), Web, Youtube, Prime95 | |
| HP Spectre x360 16 RTX 4050 | |
| Lenovo Yoga Pro 9i 16 RTX 5070 | |
| Dell XPS 16 9640 | |
| Dell 16 Premium DA16250 | |
* ... mindre är bättre
Lagringsenheter
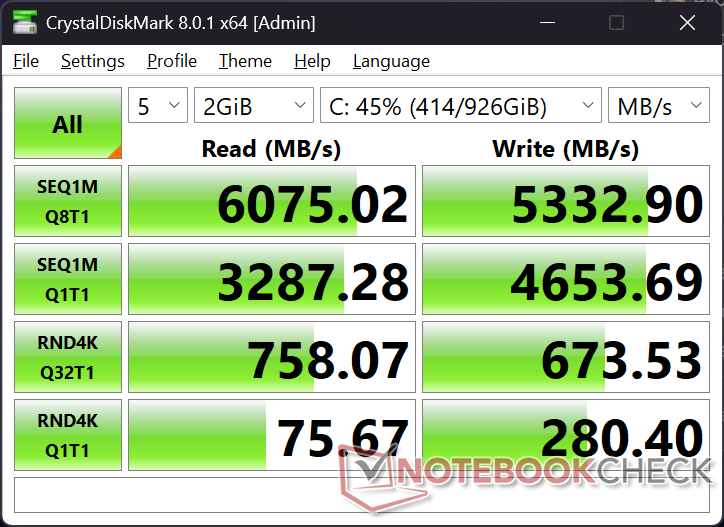
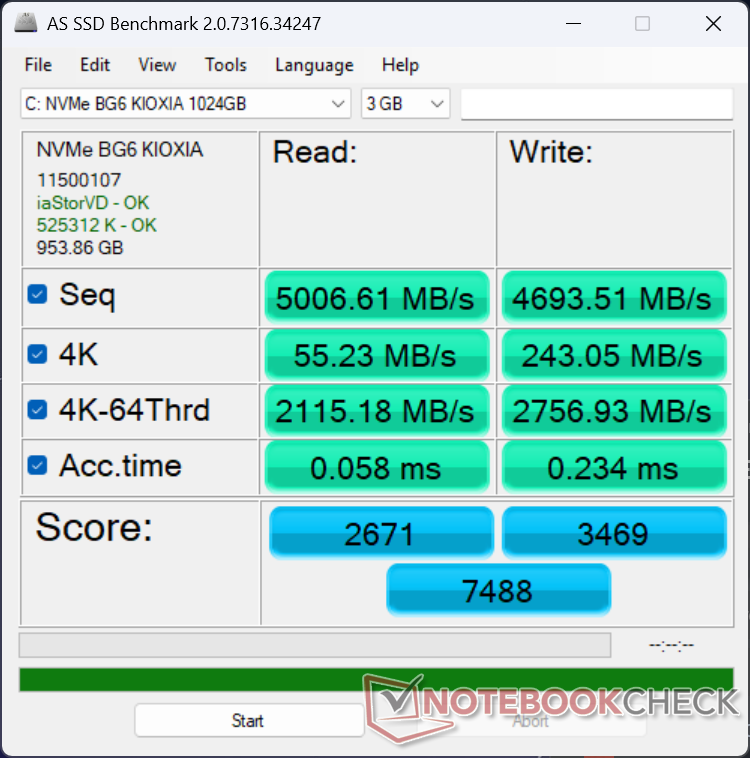

| Drive Performance rating - Percent | |
| Dell XPS 16 9640 | |
| Dell 16 Premium DA16250 | |
| Lenovo Yoga Pro 9i 16 RTX 5070 | |
| HP Spectre x360 16 RTX 4050 | |
| LG Gram Pro 16Z90TS-G.AU89G -11! | |
| Asus Zenbook S 16 UM5606-RK333W | |
* ... mindre är bättre
Diskbegränsning: DiskSpd läsloop, ködjup 8
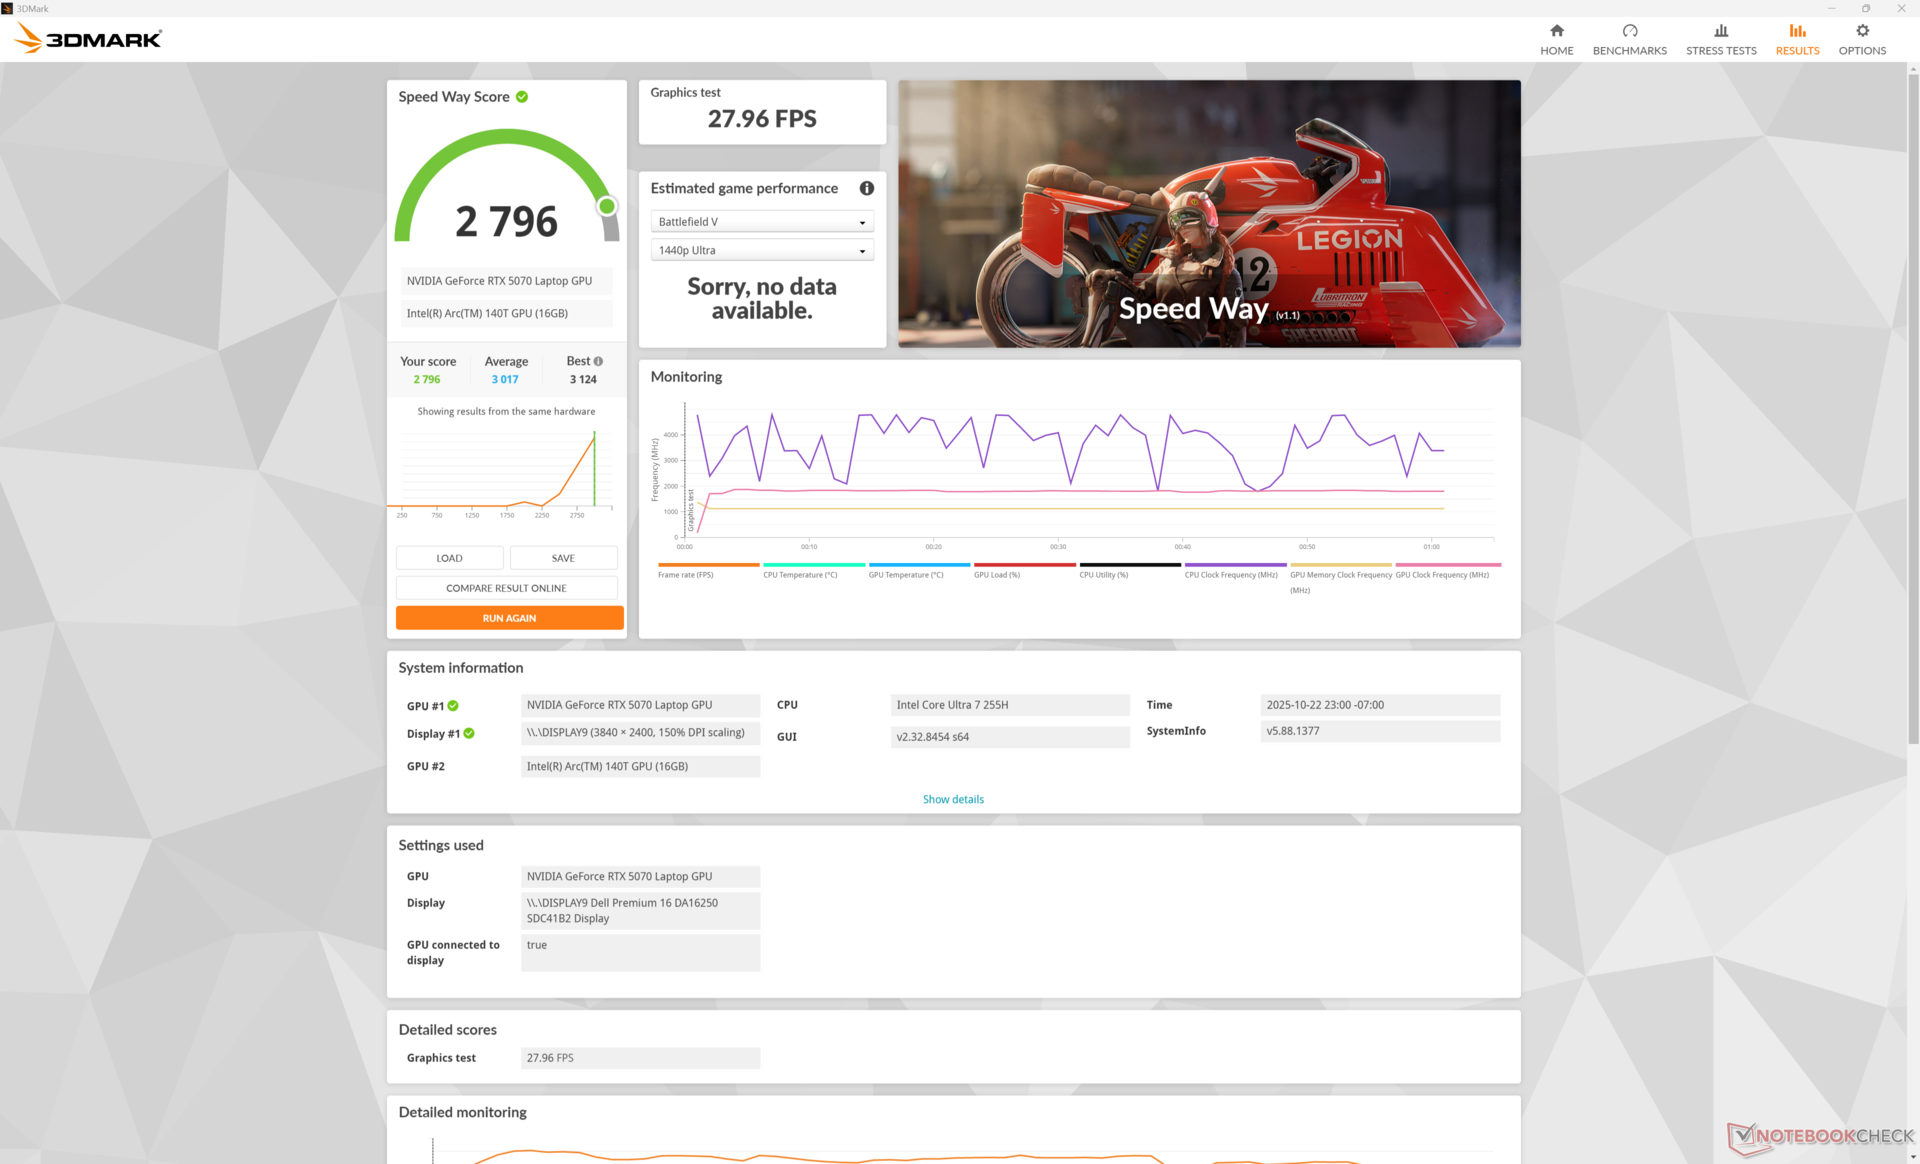
GPU-prestanda
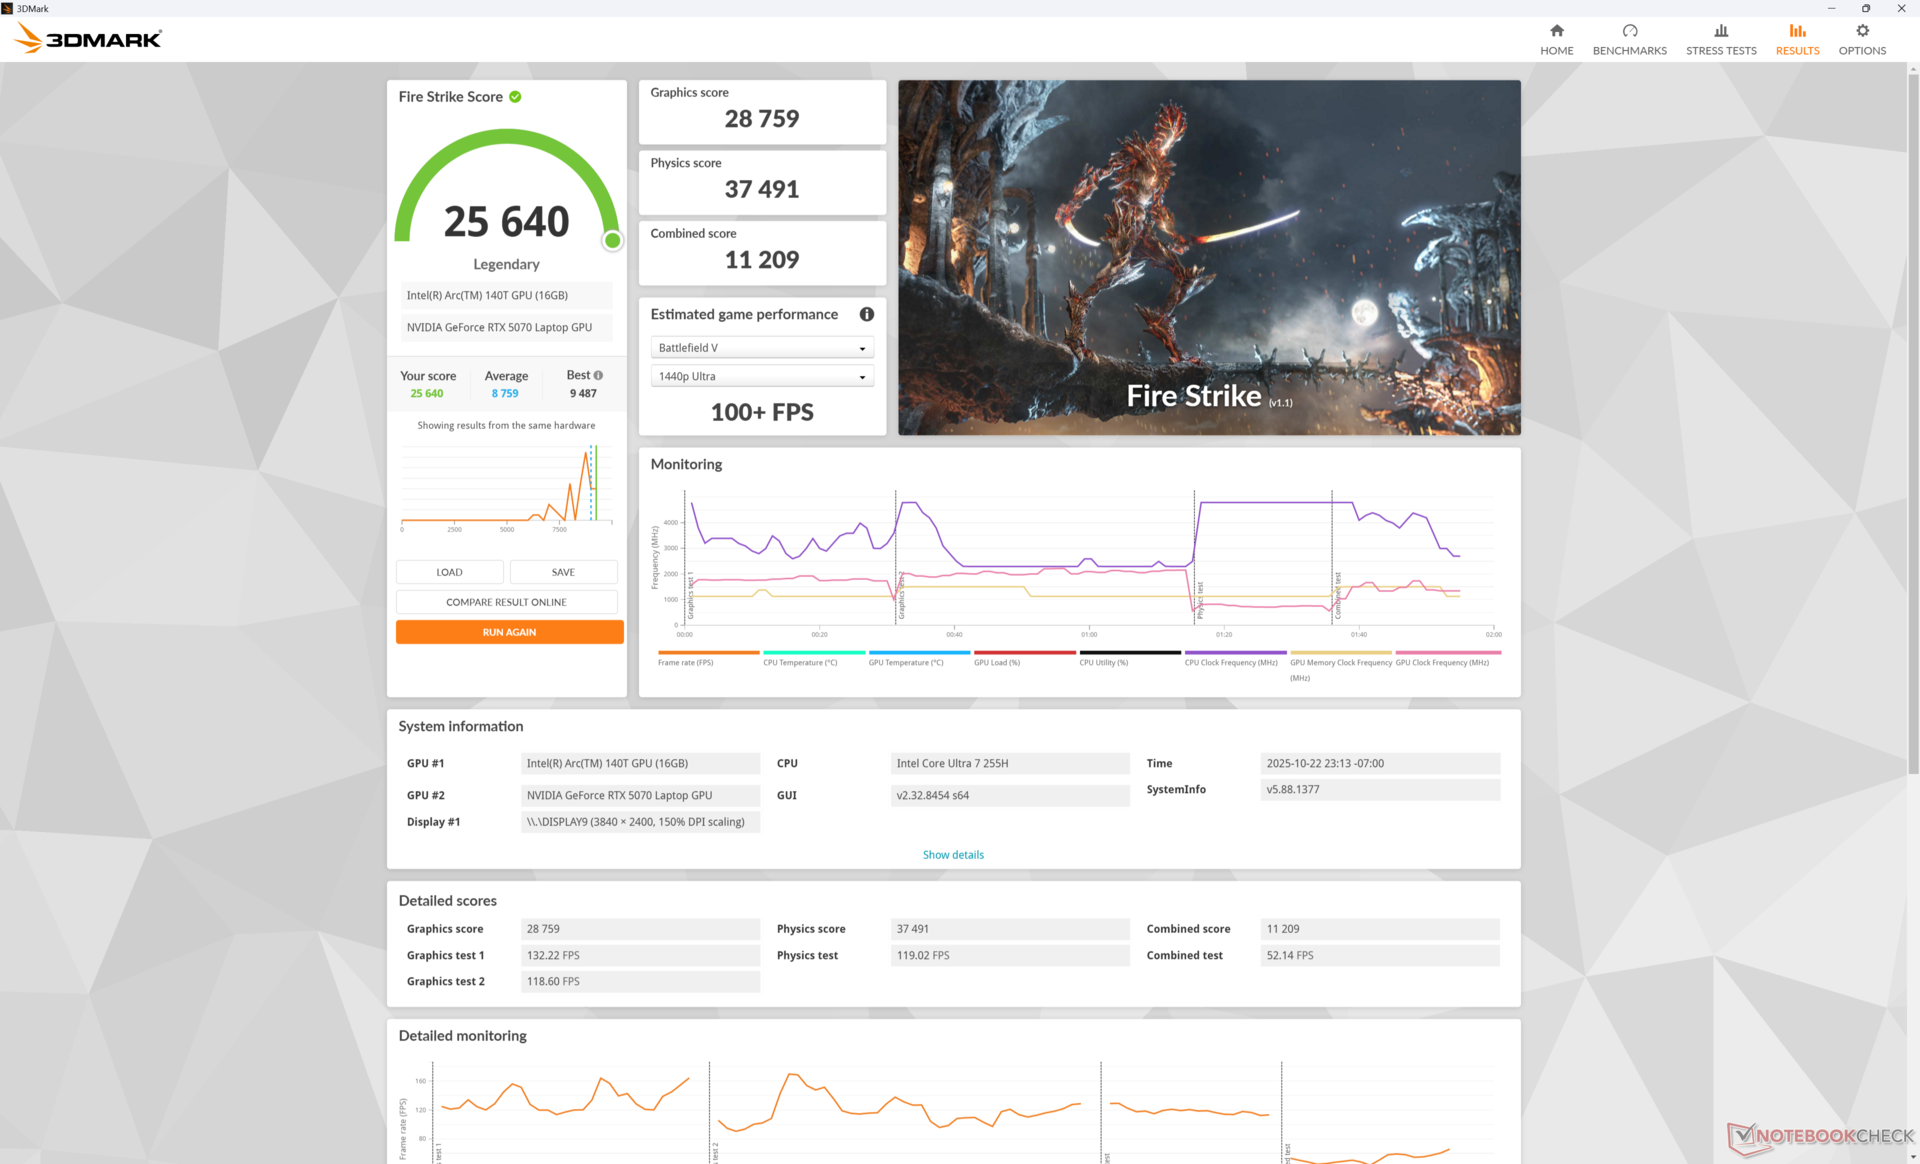
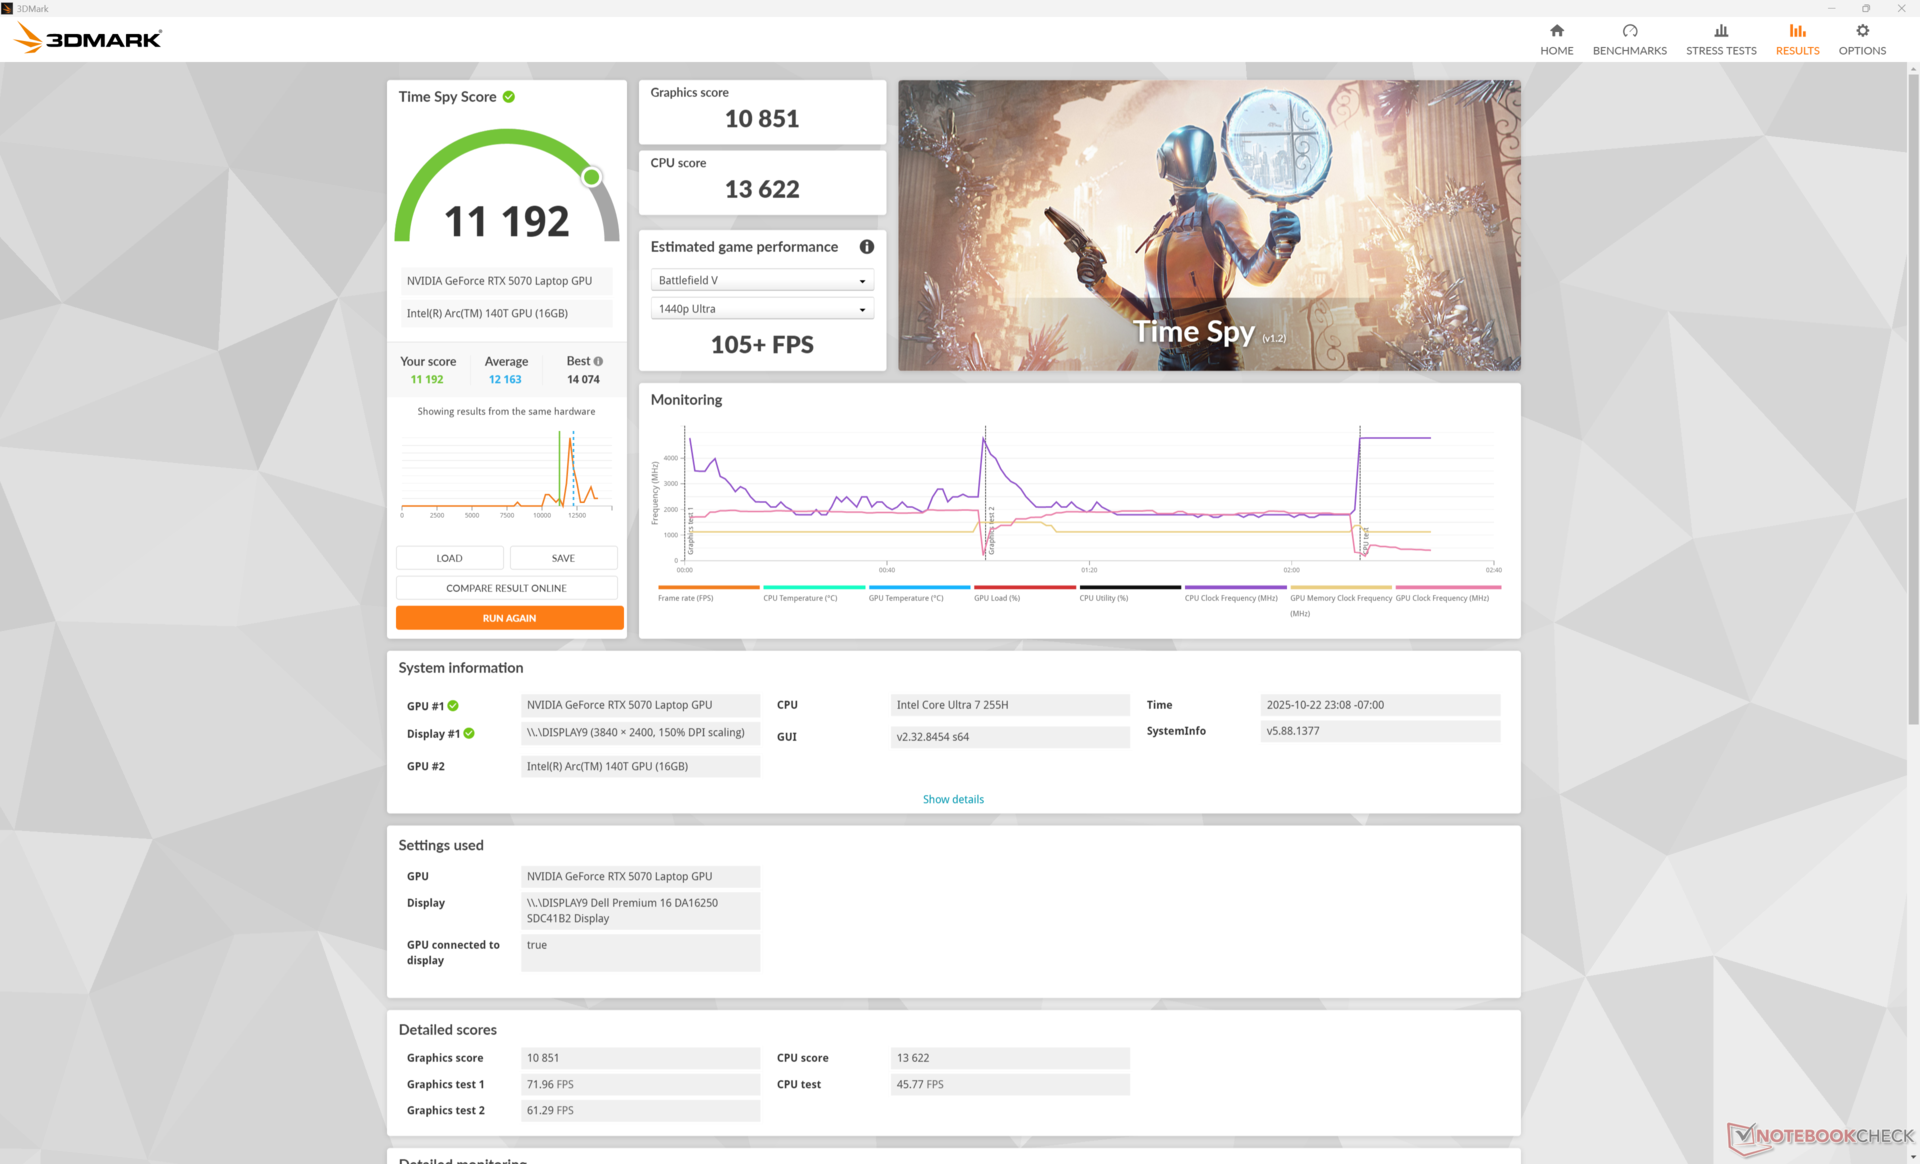
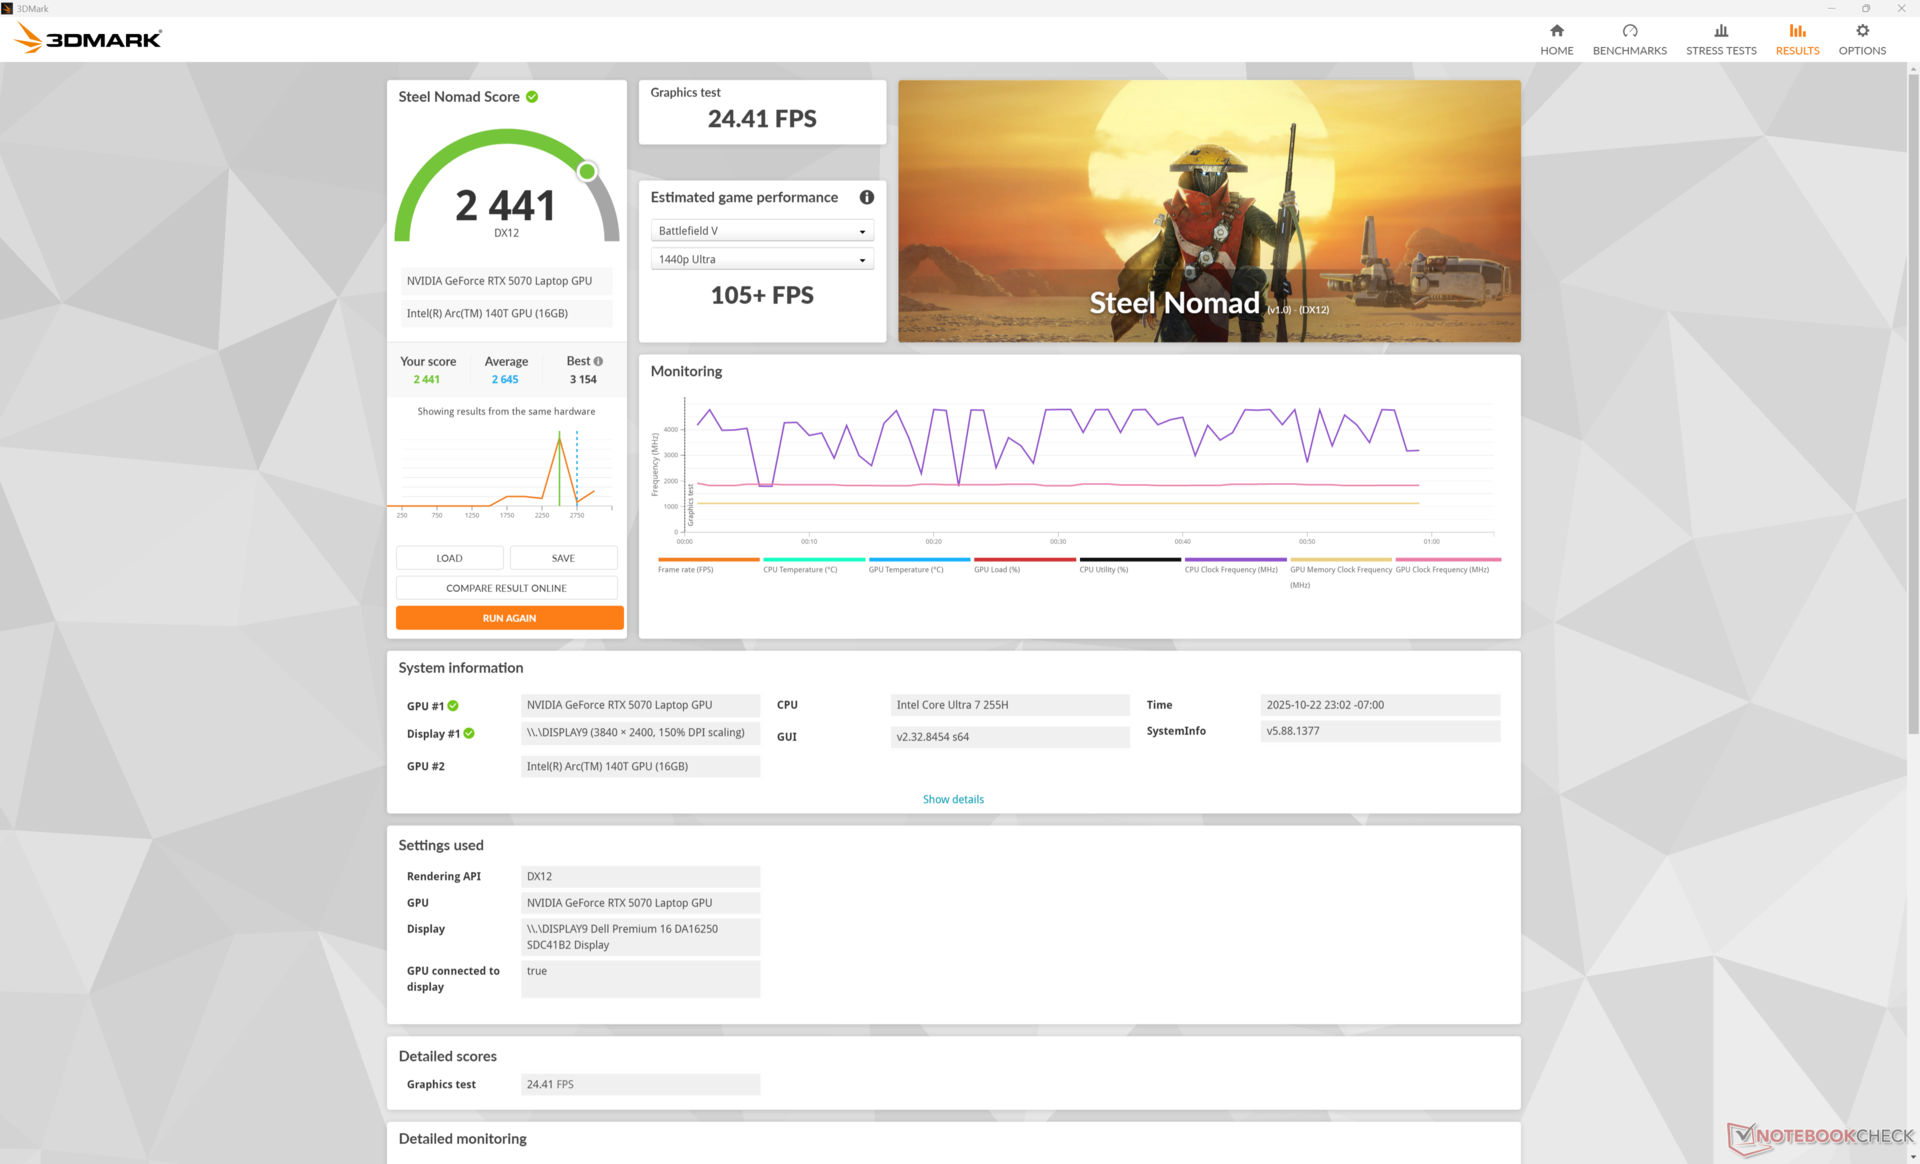
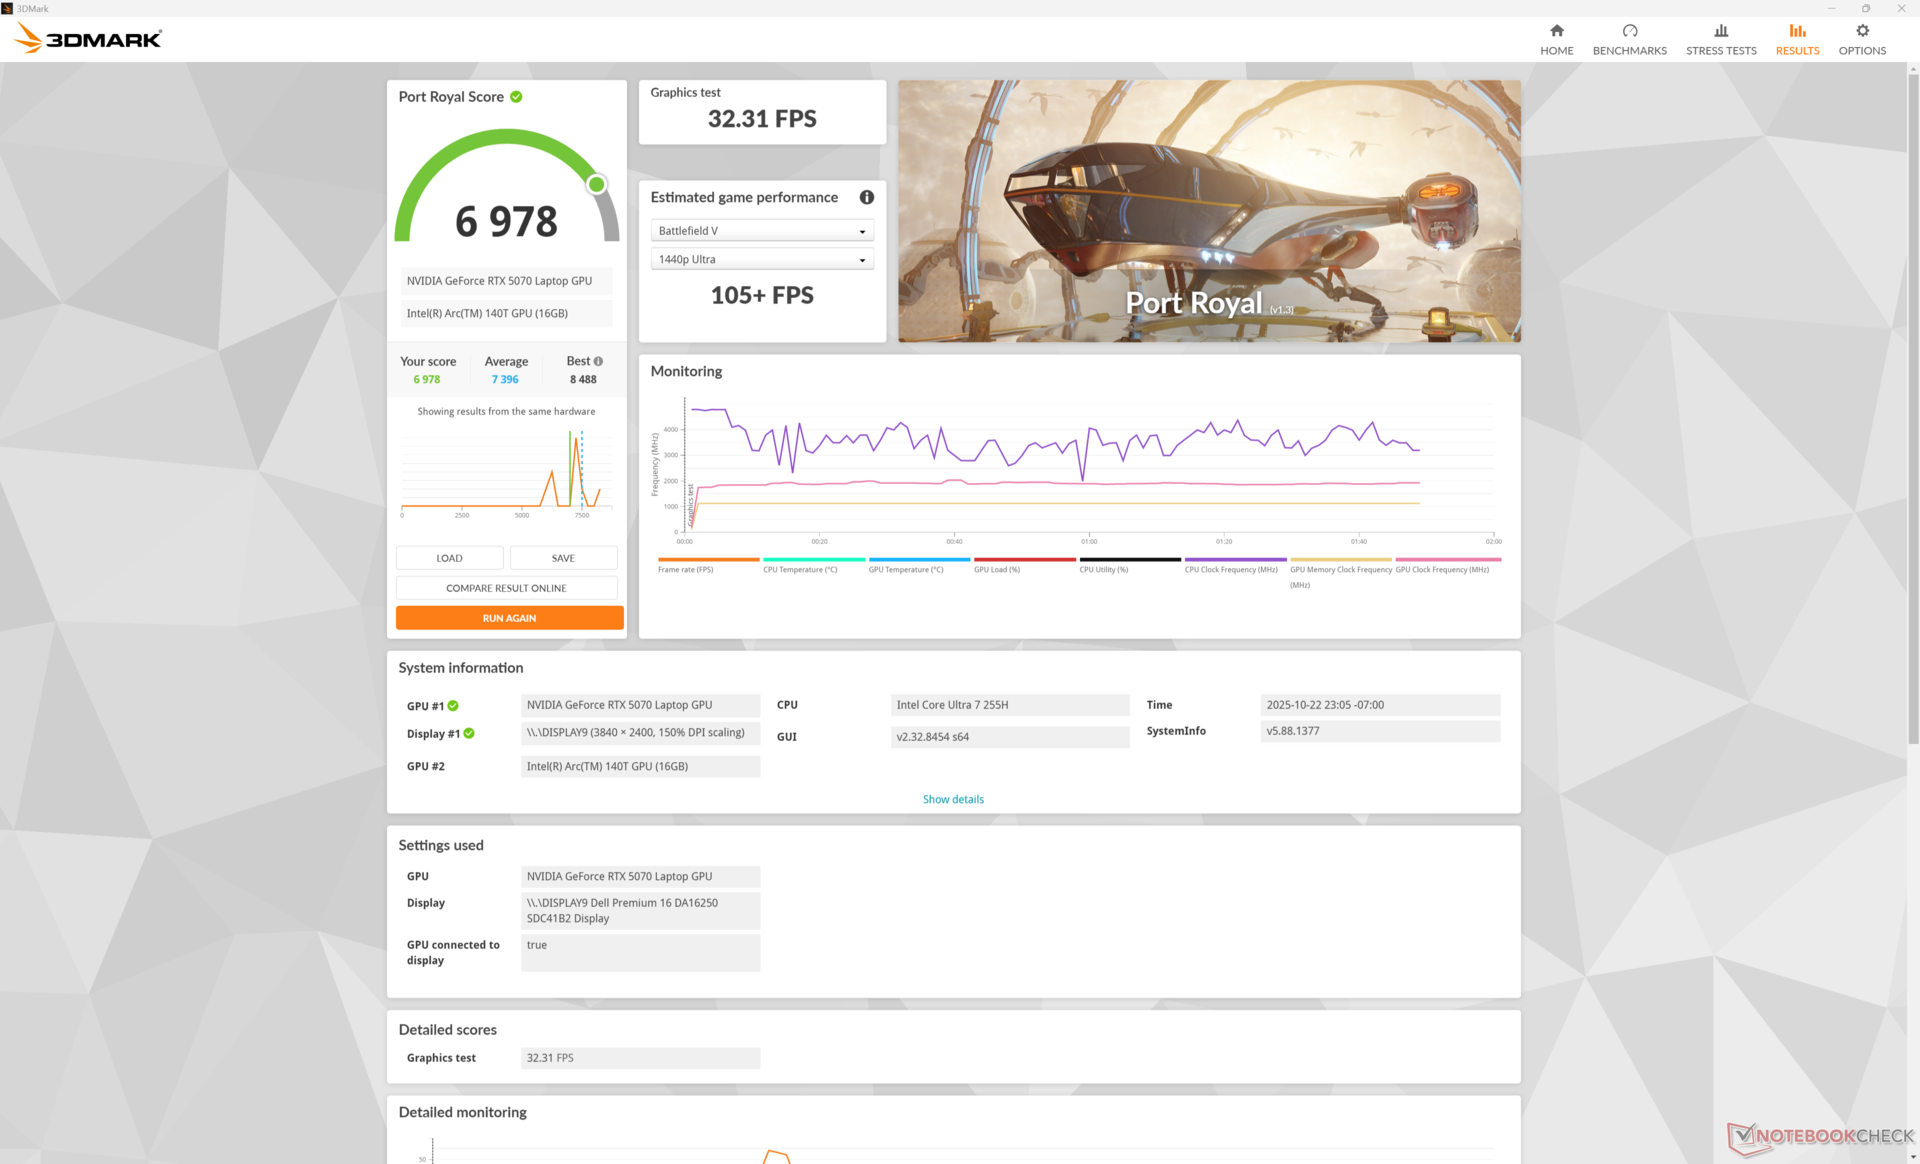
Den mobila GeForce RTX 5070 GPU:n i Dell 16 Premium går nästan 20 procent långsammare än den genomsnittliga bärbara datorn i vår databas med samma RTX 5070 GPU eftersom de flesta bärbara datorer med samma GPU tenderar att vara speldatorer med högre TGP-mål. Traditionell rasteriseringsprestanda ligger därför närmare bärbara datorer med RTX 5060.
För professionella uppgifter som Blender är prestandaskillnaden mot andra bärbara RTX 5070-datorer mindre, med i genomsnitt cirka 10 procent. Dell 16 Premium är i första hand en professionell dator och i andra hand en bärbar speldator.
| Kraftprofil | Grafikpoäng | Fysikpoäng | Kombinerad poäng |
| Prestanda-läge | 28759 | 37491 | 11209 |
| Balanserat läge | 27915 (-3%) | 35948 (-4%) | 9874 (-12%) |
| Batteridrift | 25880 (-10%) | 32601 (-13%) | 11046 (-1%) |
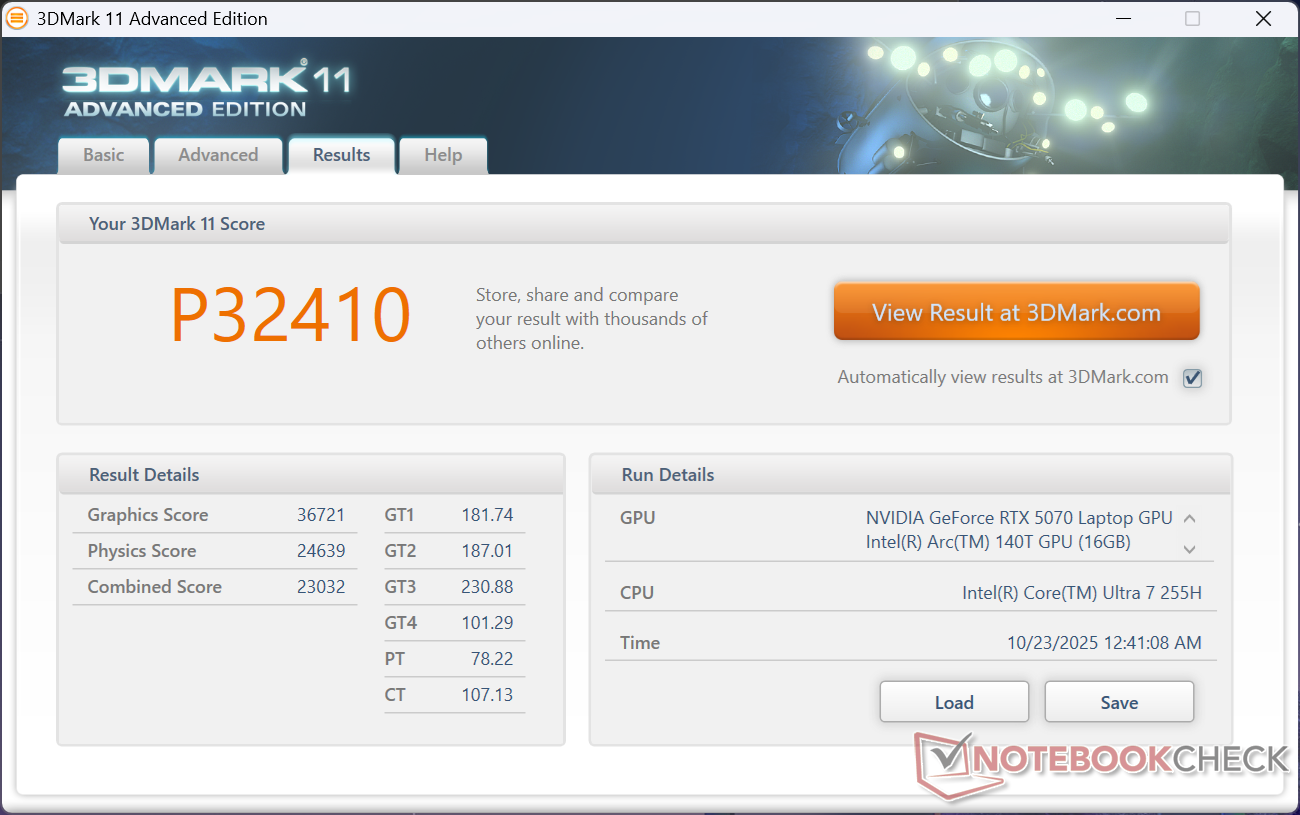
| 3DMark 11 Performance | 32410 poäng | |
| 3DMark Cloud Gate Standard Score | 65334 poäng | |
| 3DMark Fire Strike Score | 25640 poäng | |
| 3DMark Time Spy Score | 11192 poäng | |
| 3DMark Steel Nomad Score | 2441 poäng | |
Hjälp | ||
* ... mindre är bättre
Spelprestanda
Spel kan köras upp till 20 procent långsammare än de flesta andra bärbara datorer med samma GPU. Assassin's Creed Shadows, till exempel, skulle konsekvent köras snabbare på Lenovo Yoga Pro 9i 16 i alla testade inställningar.
| Performance rating - Percent | |
| Lenovo Yoga Pro 9i 16 RTX 5070 | |
| Dell 16 Premium DA16250 | |
| Dell XPS 16 9640 | |
| HP Spectre x360 16 RTX 4050 | |
| Asus Zenbook S 16 UM5606-RK333W | |
| LG Gram Pro 16Z90TS-G.AU89G | |
| Cyberpunk 2077 - 1920x1080 Ultra Preset (FSR off) | |
| Lenovo Yoga Pro 9i 16 RTX 5070 | |
| Dell 16 Premium DA16250 | |
| Dell XPS 16 9640 | |
| HP Spectre x360 16 RTX 4050 | |
| Asus Zenbook S 16 UM5606-RK333W | |
| LG Gram Pro 16Z90TS-G.AU89G | |
| Baldur's Gate 3 - 1920x1080 Ultra Preset AA:T | |
| Dell 16 Premium DA16250 | |
| Dell XPS 16 9640 | |
| Lenovo Yoga Pro 9i 16 RTX 5070 | |
| HP Spectre x360 16 RTX 4050 | |
| Asus Zenbook S 16 UM5606-RK333W | |
| LG Gram Pro 16Z90TS-G.AU89G | |
| GTA V - 1920x1080 Highest AA:4xMSAA + FX AF:16x | |
| Lenovo Yoga Pro 9i 16 RTX 5070 | |
| Dell 16 Premium DA16250 | |
| Dell XPS 16 9640 | |
| HP Spectre x360 16 RTX 4050 | |
| Asus Zenbook S 16 UM5606-RK333W | |
| LG Gram Pro 16Z90TS-G.AU89G | |
| Final Fantasy XV Benchmark - 1920x1080 High Quality | |
| Lenovo Yoga Pro 9i 16 RTX 5070 | |
| Dell 16 Premium DA16250 | |
| Dell XPS 16 9640 | |
| HP Spectre x360 16 RTX 4050 | |
| LG Gram Pro 16Z90TS-G.AU89G | |
| Asus Zenbook S 16 UM5606-RK333W | |
| Strange Brigade - 1920x1080 ultra AA:ultra AF:16 | |
| Lenovo Yoga Pro 9i 16 RTX 5070 | |
| Dell 16 Premium DA16250 | |
| Dell XPS 16 9640 | |
| HP Spectre x360 16 RTX 4050 | |
| LG Gram Pro 16Z90TS-G.AU89G | |
| Asus Zenbook S 16 UM5606-RK333W | |
| Dota 2 Reborn - 1920x1080 ultra (3/3) best looking | |
| Lenovo Yoga Pro 9i 16 RTX 5070 | |
| Dell 16 Premium DA16250 | |
| HP Spectre x360 16 RTX 4050 | |
| Dell XPS 16 9640 | |
| LG Gram Pro 16Z90TS-G.AU89G | |
| Asus Zenbook S 16 UM5606-RK333W | |
| X-Plane 11.11 - 1920x1080 high (fps_test=3) | |
| Lenovo Yoga Pro 9i 16 RTX 5070 | |
| Dell 16 Premium DA16250 | |
| Dell XPS 16 9640 | |
| Dell XPS 16 9640 | |
| HP Spectre x360 16 RTX 4050 | |
| Asus Zenbook S 16 UM5606-RK333W | |
| LG Gram Pro 16Z90TS-G.AU89G | |
| Assassin's Creed Shadows | |
| 1920x1080 Low | |
| Genomsnitt NVIDIA GeForce RTX 5070 Laptop (39 - 100, n=9) | |
| Lenovo Yoga Pro 9i 16 RTX 5070 | |
| Dell 16 Premium DA16250 | |
| 1920x1080 Medium | |
| Genomsnitt NVIDIA GeForce RTX 5070 Laptop (36 - 93, n=10) | |
| Lenovo Yoga Pro 9i 16 RTX 5070 | |
| Dell 16 Premium DA16250 | |
| 1920x1080 High | |
| Genomsnitt NVIDIA GeForce RTX 5070 Laptop (32 - 77, n=11) | |
| Lenovo Yoga Pro 9i 16 RTX 5070 | |
| Dell 16 Premium DA16250 | |
| 1920x1080 Ultra High | |
| Lenovo Yoga Pro 9i 16 RTX 5070 | |
| Genomsnitt NVIDIA GeForce RTX 5070 Laptop (25 - 53, n=12) | |
| Dell 16 Premium DA16250 | |
| 2560x1440 Ultra High | |
| Genomsnitt NVIDIA GeForce RTX 5070 Laptop (22 - 40, n=12) | |
| Lenovo Yoga Pro 9i 16 RTX 5070 | |
| Dell 16 Premium DA16250 | |
| 2560x1440 Ultra High + DLSS Quality | |
| Genomsnitt NVIDIA GeForce RTX 5070 Laptop (25 - 45, n=6) | |
| Dell 16 Premium DA16250 | |
| 2560x1440 Ultra High + GI + DLSS Quality + FG | |
| Genomsnitt NVIDIA GeForce RTX 5070 Laptop (33 - 57, n=4) | |
| Dell 16 Premium DA16250 | |
| Monster Hunter Wilds | |
| 1920x1080 lowest, no upscaling | |
| Genomsnitt NVIDIA GeForce RTX 5070 Laptop (69.1 - 86.5, n=3) | |
| Dell 16 Premium DA16250 | |
| 1920x1080 medium, no upscaling | |
| Genomsnitt NVIDIA GeForce RTX 5070 Laptop (61.6 - 78.2, n=4) | |
| Dell 16 Premium DA16250 | |
| Black Myth: Wukong | |
| 1280x720 low TSR 100 | |
| Genomsnitt NVIDIA GeForce RTX 5070 Laptop (127 - 206, n=2) | |
| Dell 16 Premium DA16250 | |
| 1920x1080 low TSR 100 | |
| Genomsnitt NVIDIA GeForce RTX 5070 Laptop (83 - 197, n=4) | |
| Dell 16 Premium DA16250 | |
| 1920x1080 medium TSR 100 | |
| Genomsnitt NVIDIA GeForce RTX 5070 Laptop (63 - 112, n=4) | |
| Dell 16 Premium DA16250 | |
| 1920x1080 high TSR 100 | |
| Genomsnitt NVIDIA GeForce RTX 5070 Laptop (49 - 86, n=5) | |
| Dell 16 Premium DA16250 | |
| 1920x1080 cinematic TSR 100 | |
| Genomsnitt NVIDIA GeForce RTX 5070 Laptop (28 - 44, n=5) | |
| Dell 16 Premium DA16250 | |
| 2560x1440 cinematic TSR 100 | |
| Genomsnitt NVIDIA GeForce RTX 5070 Laptop (20 - 27, n=5) | |
| Dell 16 Premium DA16250 | |
| 2560x1440 cinematic DLSS 68 | |
| Genomsnitt NVIDIA GeForce RTX 5070 Laptop (31 - 41, n=5) | |
| Dell 16 Premium DA16250 | |
| 2560x1440 cinematic RT: Very High DLSS 68 FG | |
| Genomsnitt NVIDIA GeForce RTX 5070 Laptop (18 - 45, n=4) | |
| Dell 16 Premium DA16250 | |
| Alan Wake 2 | |
| 1280x720 Low Preset | |
| Dell 16 Premium DA16250 | |
| Genomsnitt NVIDIA GeForce RTX 5070 Laptop (106.8 - 115.2, n=2) | |
| 1920x1080 Low Preset | |
| Genomsnitt NVIDIA GeForce RTX 5070 Laptop (68.8 - 86.1, n=4) | |
| Dell 16 Premium DA16250 | |
| 1920x1080 Medium Preset | |
| Genomsnitt NVIDIA GeForce RTX 5070 Laptop (68.4 - 82.4, n=4) | |
| Dell 16 Premium DA16250 | |
| 1920x1080 High Preset | |
| Genomsnitt NVIDIA GeForce RTX 5070 Laptop (60 - 72.5, n=6) | |
| Dell 16 Premium DA16250 | |
| 2560x1440 High Preset | |
| Genomsnitt NVIDIA GeForce RTX 5070 Laptop (35.8 - 45.1, n=6) | |
| Dell 16 Premium DA16250 | |
Cyberpunk 2077 ultra FPS-diagram
| låg | med. | hög | ultra | QHD DLSS | QHD | 4K | |
|---|---|---|---|---|---|---|---|
| GTA V (2015) | 185.6 | 180.9 | 175.7 | 123.7 | 96.9 | ||
| Dota 2 Reborn (2015) | 168.4 | 152.9 | 147.8 | 140.4 | 106.4 | ||
| Final Fantasy XV Benchmark (2018) | 218 | 148.7 | 113.1 | 82.5 | |||
| X-Plane 11.11 (2018) | 114.3 | 110 | 91.9 | 65.7 | |||
| Strange Brigade (2018) | 507 | 282 | 232 | 204 | 140.2 | ||
| Baldur's Gate 3 (2023) | 149.5 | 125.5 | 109.8 | 109 | 107.3 | 73.8 | |
| Cyberpunk 2077 (2023) | 134.9 | 107.8 | 91 | 81.5 | 61.4 | 51.9 | |
| Alan Wake 2 (2023) | 68.8 | 68.4 | 60 | 35.8 | |||
| F1 24 (2024) | 242 | 241 | 186 | 63.8 | 62.9 | 40.3 | |
| Black Myth: Wukong (2024) | 83 | 63 | 49 | 28 | 31 | 20 | |
| Monster Hunter Wilds (2025) | 69.1 | 61.6 | |||||
| Assassin's Creed Shadows (2025) | 61 | 57 | 49 | 33 | 35 | 28 |
Utsläpp
Systembuller
Fläktens ljudnivå och tak är i stort sett identiska med förra årets modell eftersom kyllösningen och kraftpaketet är oförändrade.
Ljudnivå
| Låg belastning |
| 23.2 / 23.2 / 26.6 dB(A) |
| Hög belastning |
| 39.4 / 48.9 dB(A) |
 | ||
30 dB tyst 40 dB(A) hörbar 50 dB(A) högt ljud |
||
min: | ||
| Dell 16 Premium DA16250 Ultra 7 255H, GeForce RTX 5070 Laptop | Dell XPS 16 9640 Ultra 7 155H, GeForce RTX 4070 Laptop GPU | HP Spectre x360 16 RTX 4050 Ultra 7 155H, GeForce RTX 4050 Laptop GPU | Lenovo Yoga Pro 9i 16 RTX 5070 Ultra 9 285H, GeForce RTX 5070 Laptop | Asus Zenbook S 16 UM5606-RK333W Ryzen AI 9 HX 370, Radeon 890M | LG Gram Pro 16Z90TS-G.AU89G Core Ultra 7 256V, Arc 140V | |
|---|---|---|---|---|---|---|
| Noise | -4% | 11% | -5% | 6% | -1% | |
| av / miljö * (dB) | 23.2 | 24.5 -6% | 23.3 -0% | 24.1 -4% | 24.7 -6% | 25.2 -9% |
| Idle Minimum * (dB) | 23.2 | 24.5 -6% | 23.6 -2% | 24.1 -4% | 24.7 -6% | 25.2 -9% |
| Idle Average * (dB) | 23.2 | 24.5 -6% | 23.6 -2% | 24.1 -4% | 24.7 -6% | 25.2 -9% |
| Idle Maximum * (dB) | 26.6 | 27.5 -3% | 23.6 11% | 25.1 6% | 26.4 1% | 27.7 -4% |
| Load Average * (dB) | 39.4 | 39.6 -1% | 29.2 26% | 44.2 -12% | 35.7 9% | |
| Cyberpunk 2077 ultra * (dB) | 47.3 | 52.7 -11% | 36.8 22% | 42.6 10% | ||
| Load Maximum * (dB) | 48.9 | 49.7 -2% | 32.1 34% | 52.7 -8% | 36.8 25% | 42.7 13% |
| Witcher 3 ultra * (dB) | 49.7 | 32.1 |
* ... mindre är bättre
Temperatur
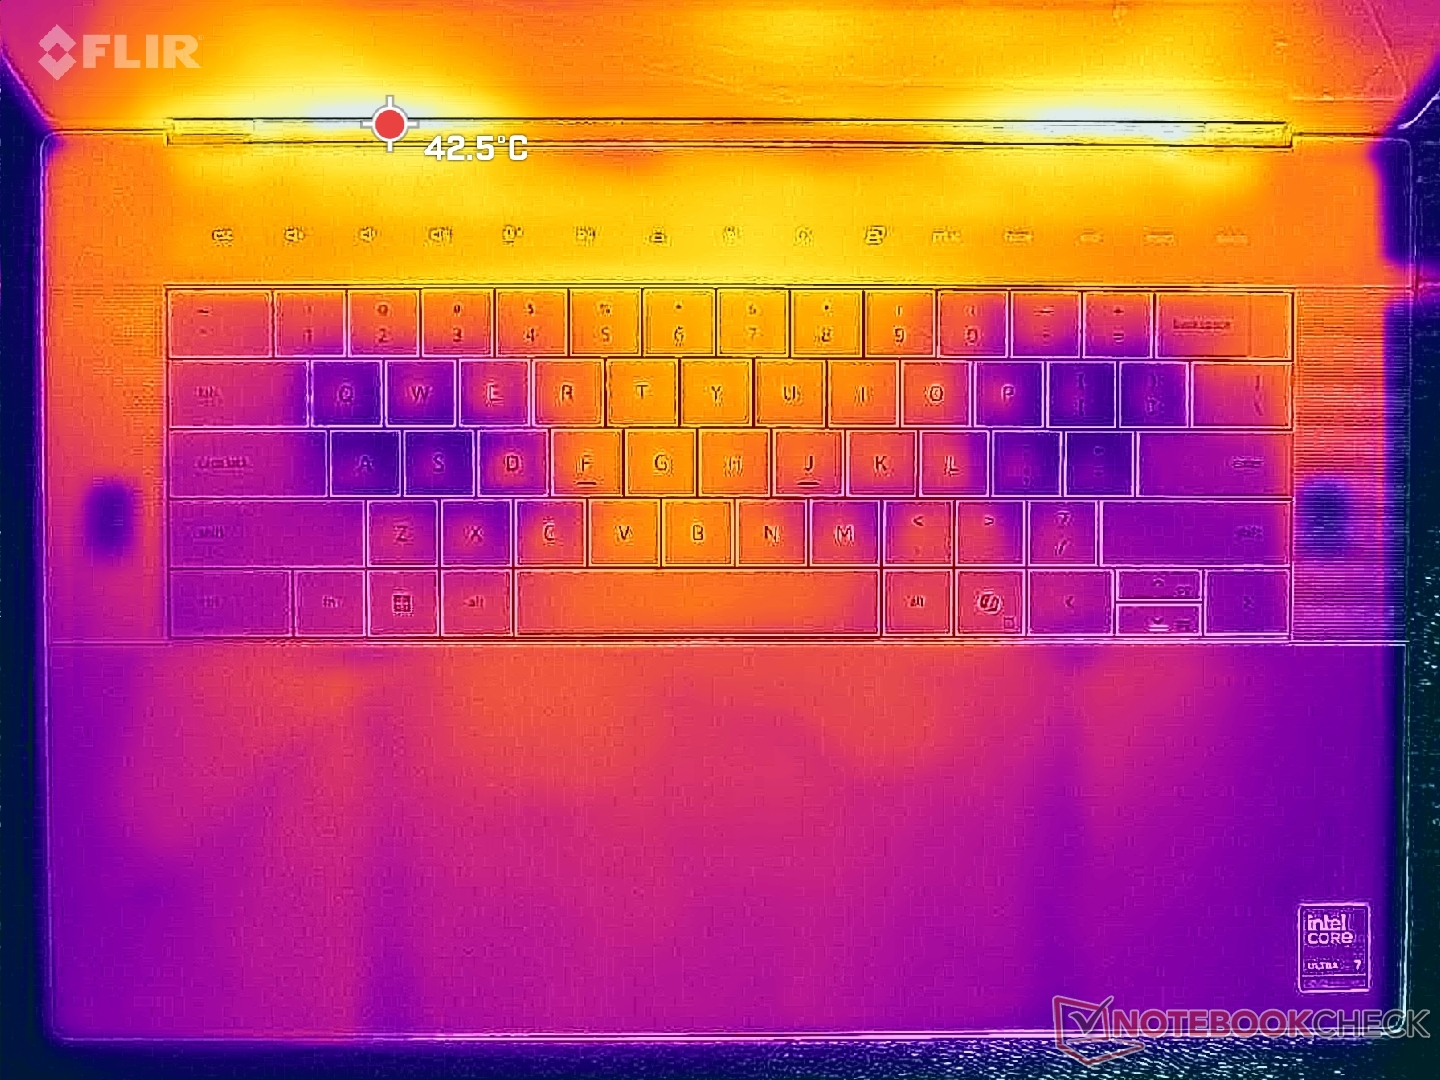
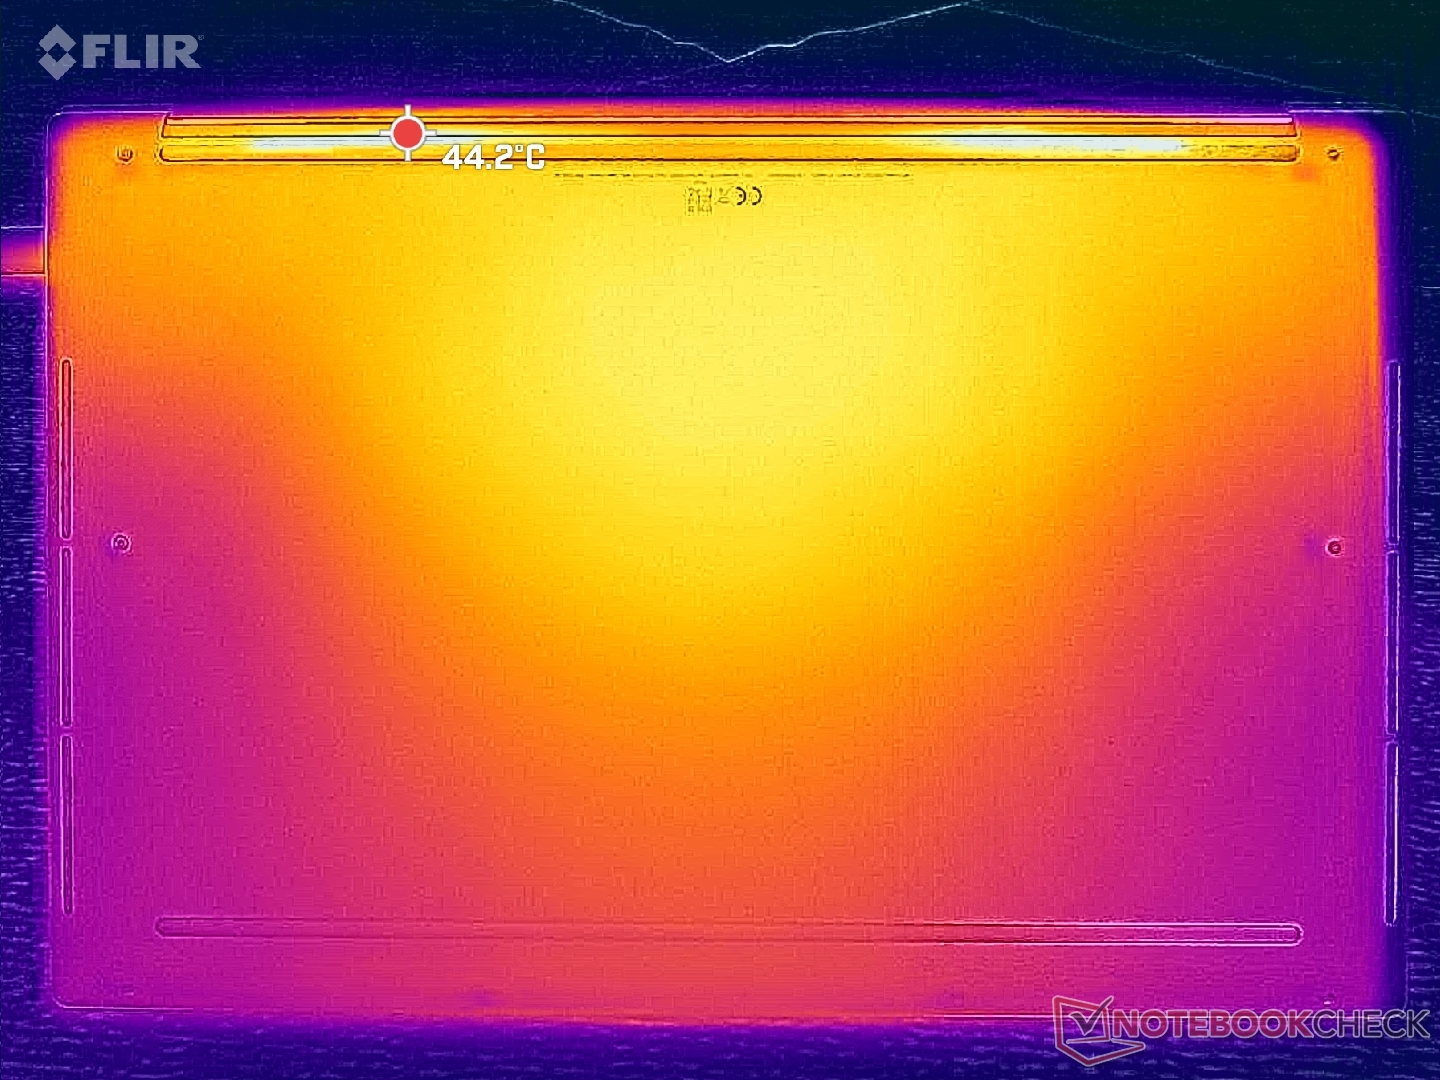
Heta punkter på undersidan nära ventilationshålen kan nå nästan 45 C när man kör krävande belastningar. Vi kan inte låta bli att undra om ytterligare ventilationshål skulle ha förbättrat den totala temperaturen, men Dell prioriterar helt klart en renare visuell design utan ventilationshål i stil med MacBook-serien.
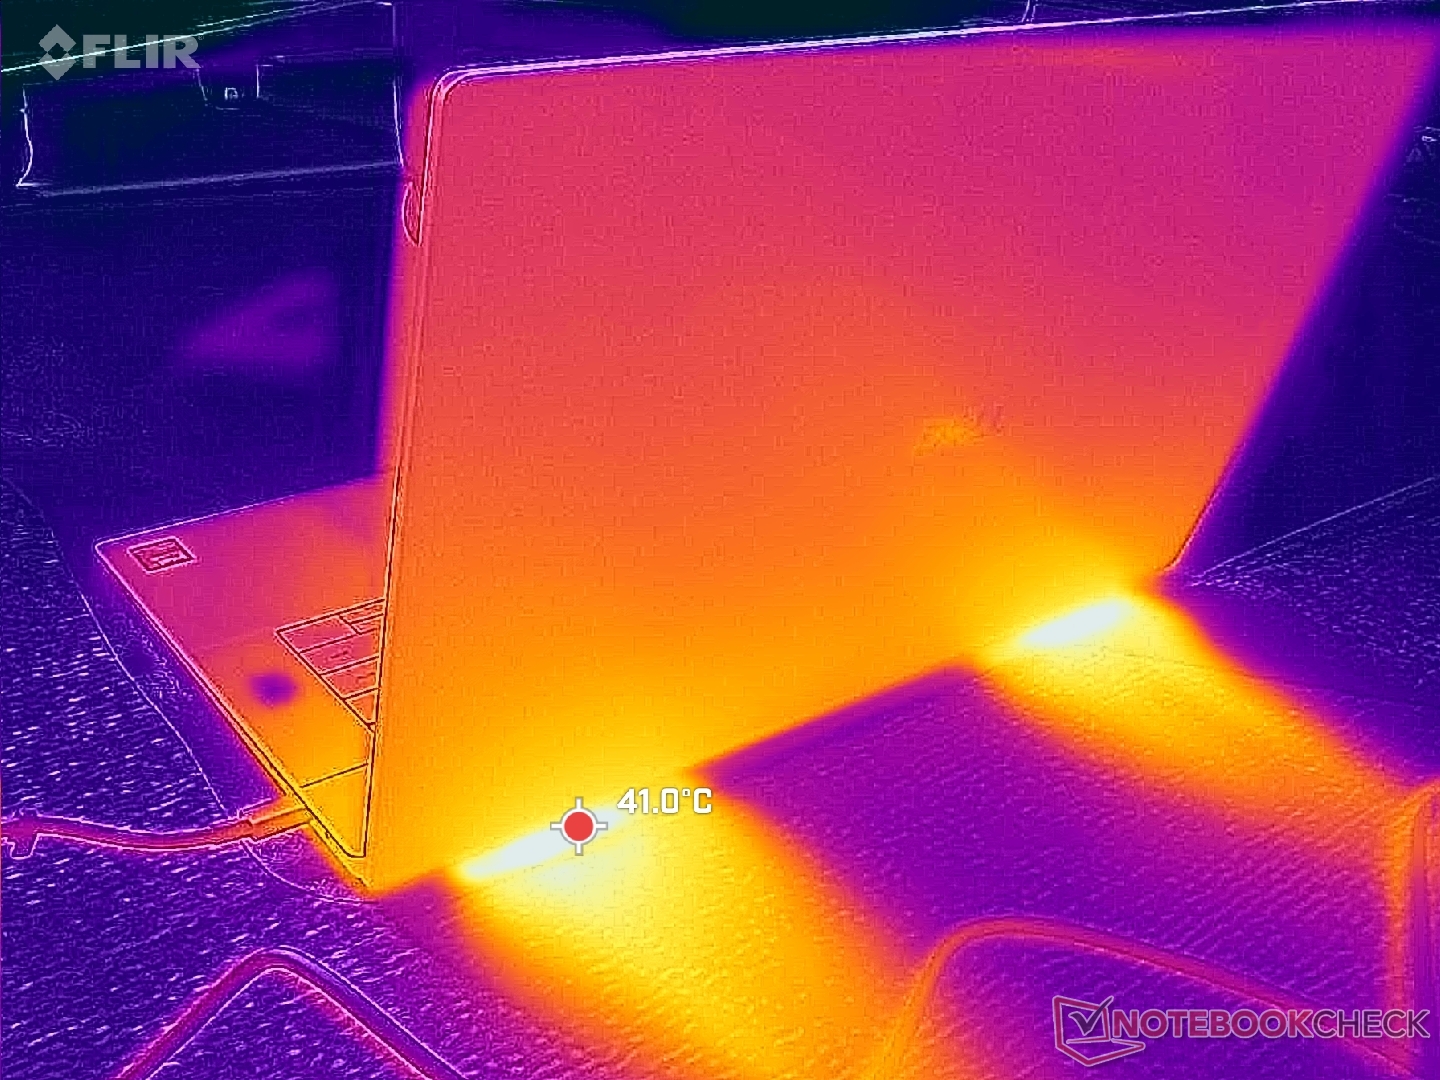
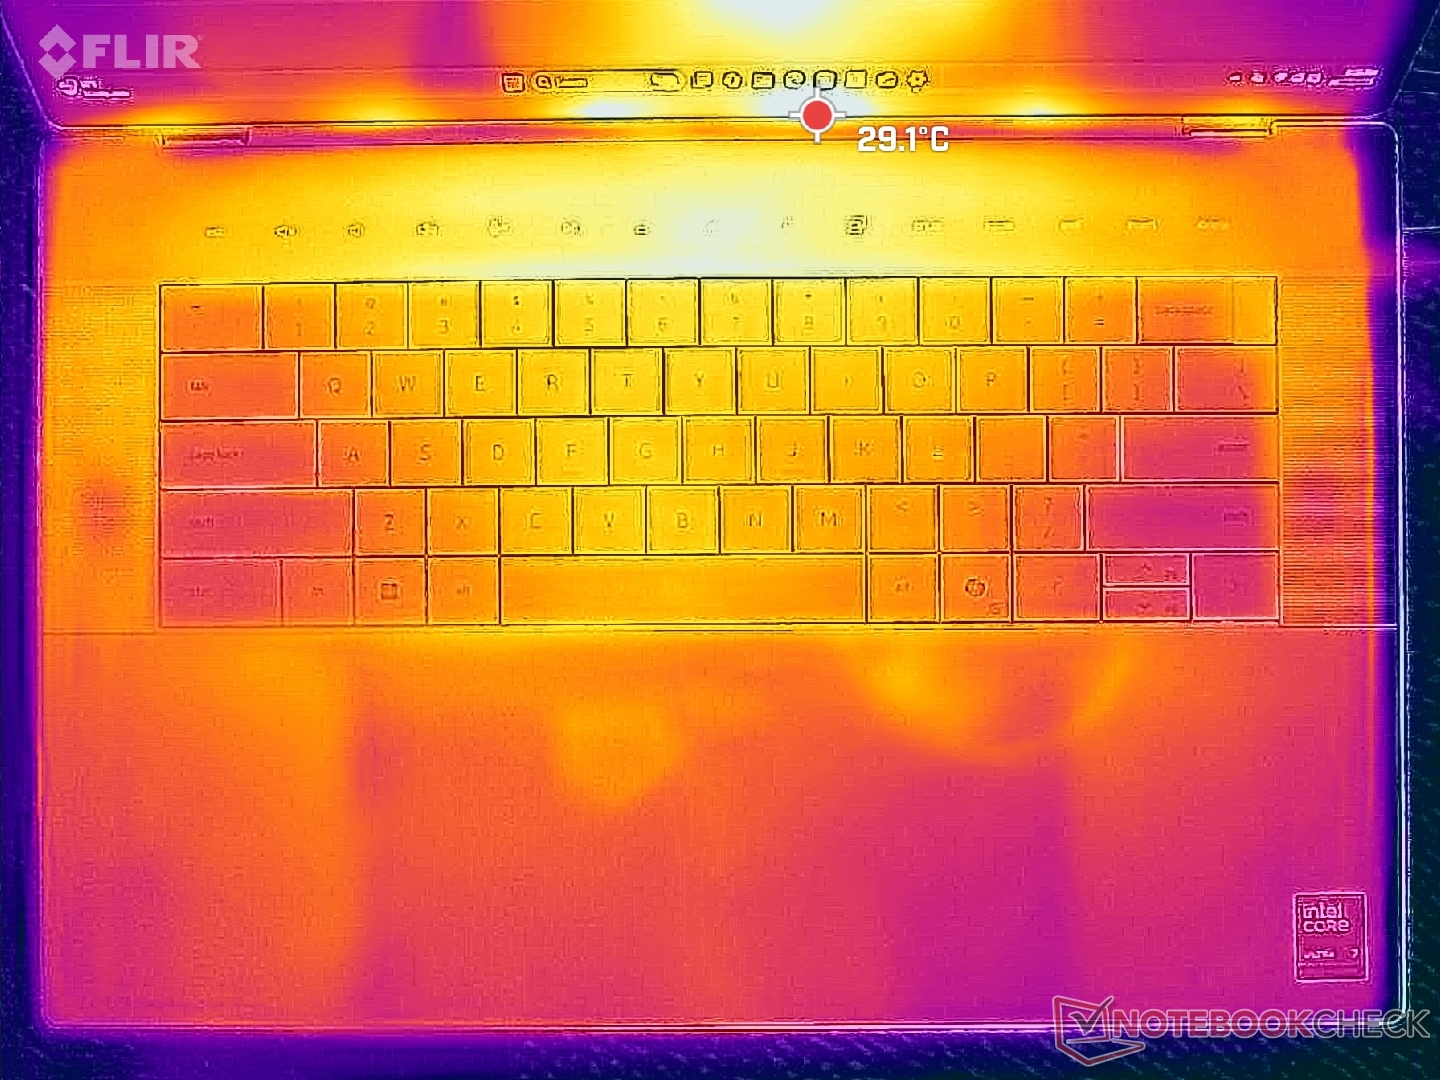
(+) Den maximala temperaturen på ovansidan är 36.8 °C / 98 F, jämfört med genomsnittet av 36.8 °C / 98 F , allt från 21 till 71 °C för klassen Multimedia.
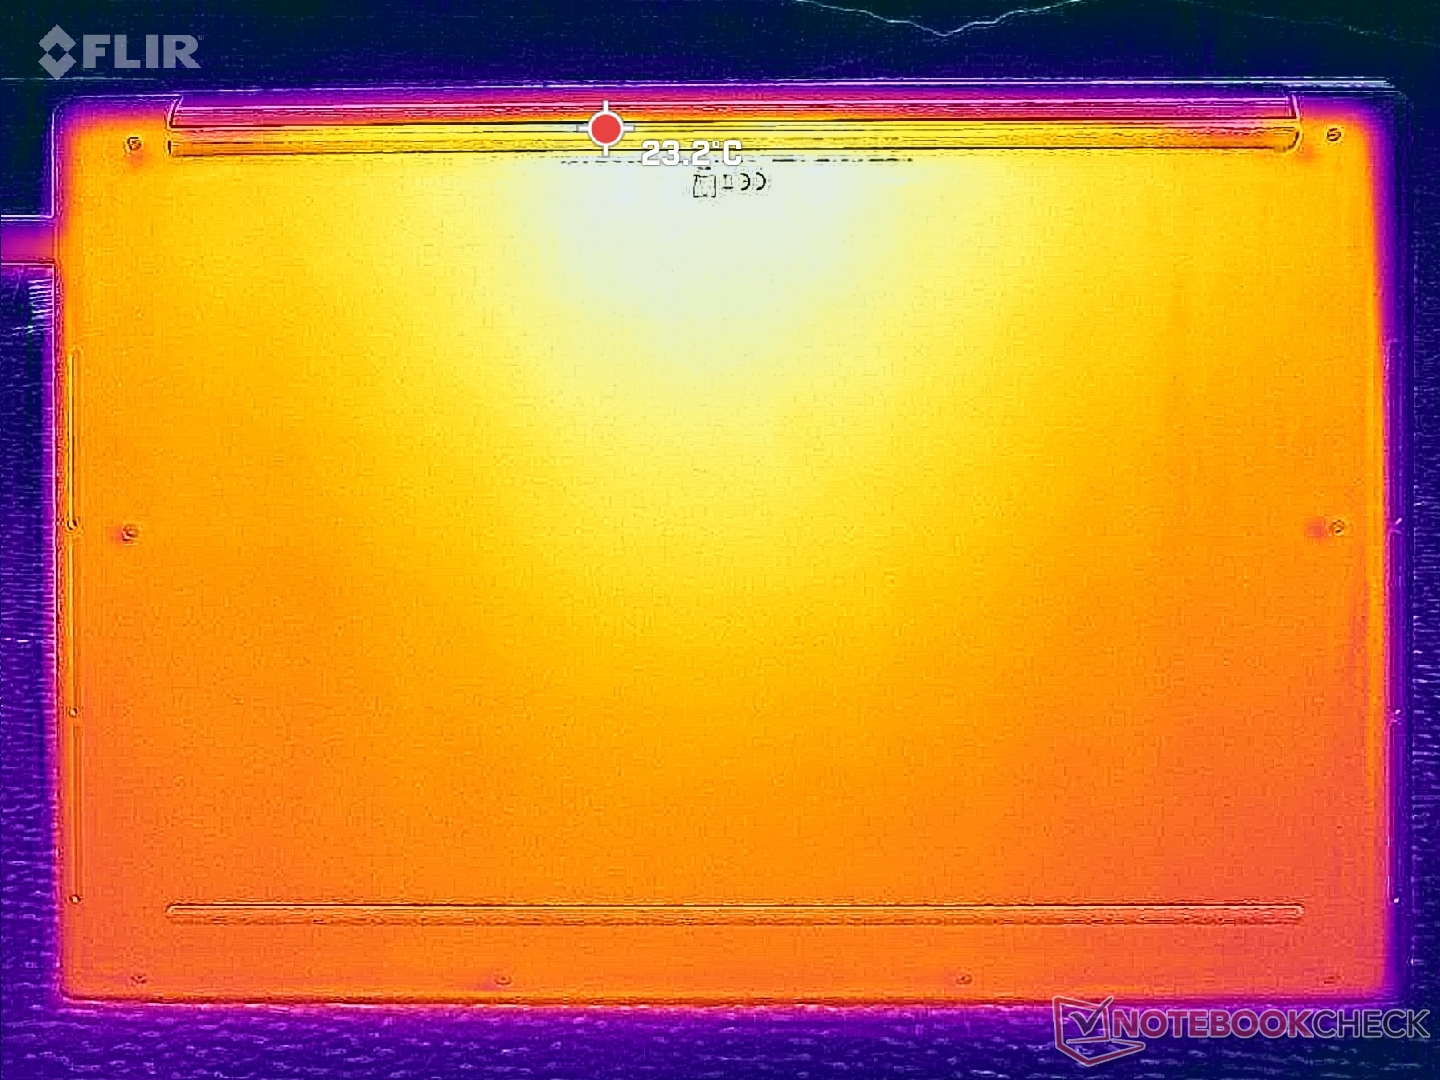
(+) Botten värms upp till maximalt 34.8 °C / 95 F, jämfört med genomsnittet av 39.1 °C / 102 F
(+) Vid tomgångsbruk är medeltemperaturen för ovansidan 28.7 °C / 84 F, jämfört med enhetsgenomsnittet på 31.3 °C / ### class_avg_f### F.
(+) Handledsstöden och pekplattan är kallare än hudtemperaturen med maximalt 28.6 °C / 83.5 F och är därför svala att ta på.
(±) Medeltemperaturen för handledsstödsområdet på liknande enheter var 28.7 °C / 83.7 F (+0.1 °C / 0.2 F).
| Dell 16 Premium DA16250 Ultra 7 255H, GeForce RTX 5070 Laptop | Dell XPS 16 9640 Ultra 7 155H, GeForce RTX 4070 Laptop GPU | HP Spectre x360 16 RTX 4050 Ultra 7 155H, GeForce RTX 4050 Laptop GPU | Lenovo Yoga Pro 9i 16 RTX 5070 Ultra 9 285H, GeForce RTX 5070 Laptop | Asus Zenbook S 16 UM5606-RK333W Ryzen AI 9 HX 370, Radeon 890M | LG Gram Pro 16Z90TS-G.AU89G Core Ultra 7 256V, Arc 140V | |
|---|---|---|---|---|---|---|
| Heat | 2% | -4% | -7% | -19% | -5% | |
| Maximum Upper Side * (°C) | 36.8 | 39.4 -7% | 39.6 -8% | 41.8 -14% | 46.9 -27% | 40.5 -10% |
| Maximum Bottom * (°C) | 34.8 | 36.9 -6% | 39.2 -13% | 47.9 -38% | 53.5 -54% | 45 -29% |
| Idle Upper Side * (°C) | 31.2 | 28.2 10% | 29 7% | 26.3 16% | 29.5 5% | 27.1 13% |
| Idle Bottom * (°C) | 30.8 | 27.4 11% | 31.6 -3% | 27.6 10% | 30.2 2% | 28.8 6% |
* ... mindre är bättre
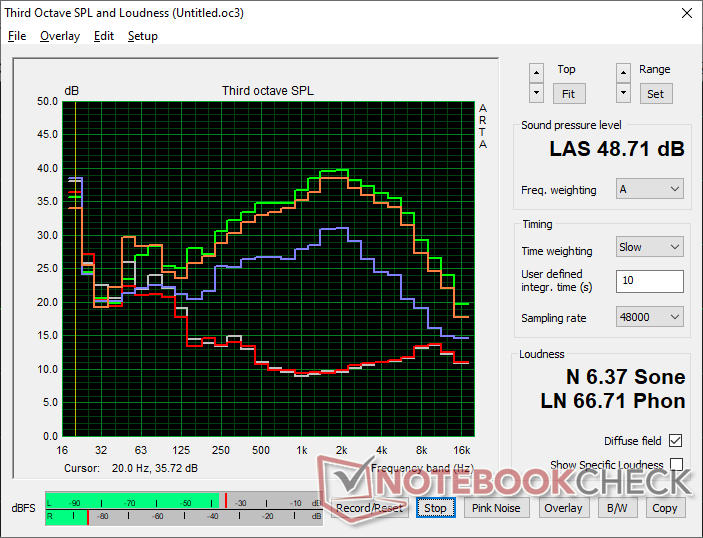
Högtalare
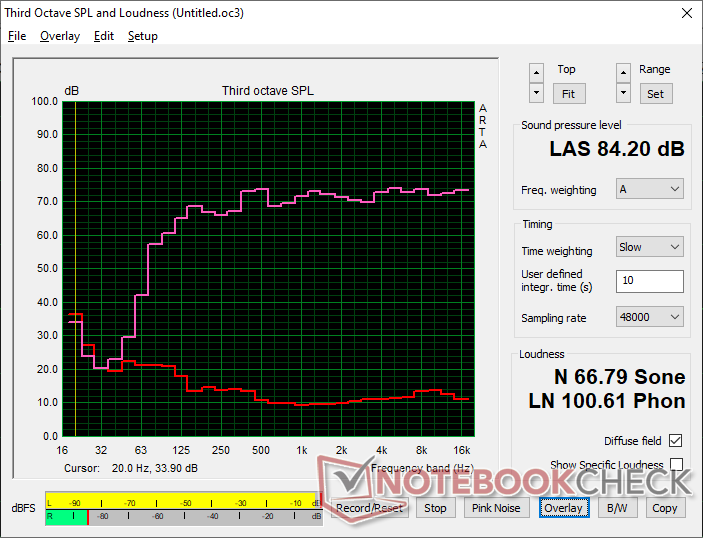
Dell 16 Premium DA16250 ljudanalys
(+) | högtalare kan spela relativt högt (84.2 dB)
Bas 100 - 315 Hz
(±) | reducerad bas - i genomsnitt 6.1% lägre än medianen
(+) | basen är linjär (4.2% delta till föregående frekvens)
Mellan 400 - 2000 Hz
(+) | balanserad mellan - endast 1.4% från medianen
(+) | mids är linjära (3.6% delta till föregående frekvens)
Högsta 2 - 16 kHz
(+) | balanserade toppar - endast 1.5% från medianen
(+) | toppar är linjära (2.2% delta till föregående frekvens)
Totalt 100 - 16 000 Hz
(+) | det totala ljudet är linjärt (5.1% skillnad mot median)
Jämfört med samma klass
» 1% av alla testade enheter i den här klassen var bättre, 0% liknande, 99% sämre
» Den bästa hade ett delta på 5%, genomsnittet var 17%, sämst var 45%
Jämfört med alla testade enheter
» 0% av alla testade enheter var bättre, 0% liknande, 100% sämre
» Den bästa hade ett delta på 4%, genomsnittet var 23%, sämst var 134%
Apple MacBook Pro 16 2021 M1 Pro ljudanalys
(+) | högtalare kan spela relativt högt (84.7 dB)
Bas 100 - 315 Hz
(+) | bra bas - bara 3.8% från medianen
(+) | basen är linjär (5.2% delta till föregående frekvens)
Mellan 400 - 2000 Hz
(+) | balanserad mellan - endast 1.3% från medianen
(+) | mids är linjära (2.1% delta till föregående frekvens)
Högsta 2 - 16 kHz
(+) | balanserade toppar - endast 1.9% från medianen
(+) | toppar är linjära (2.7% delta till föregående frekvens)
Totalt 100 - 16 000 Hz
(+) | det totala ljudet är linjärt (4.6% skillnad mot median)
Jämfört med samma klass
» 0% av alla testade enheter i den här klassen var bättre, 0% liknande, 100% sämre
» Den bästa hade ett delta på 5%, genomsnittet var 17%, sämst var 45%
Jämfört med alla testade enheter
» 0% av alla testade enheter var bättre, 0% liknande, 100% sämre
» Den bästa hade ett delta på 4%, genomsnittet var 23%, sämst var 134%
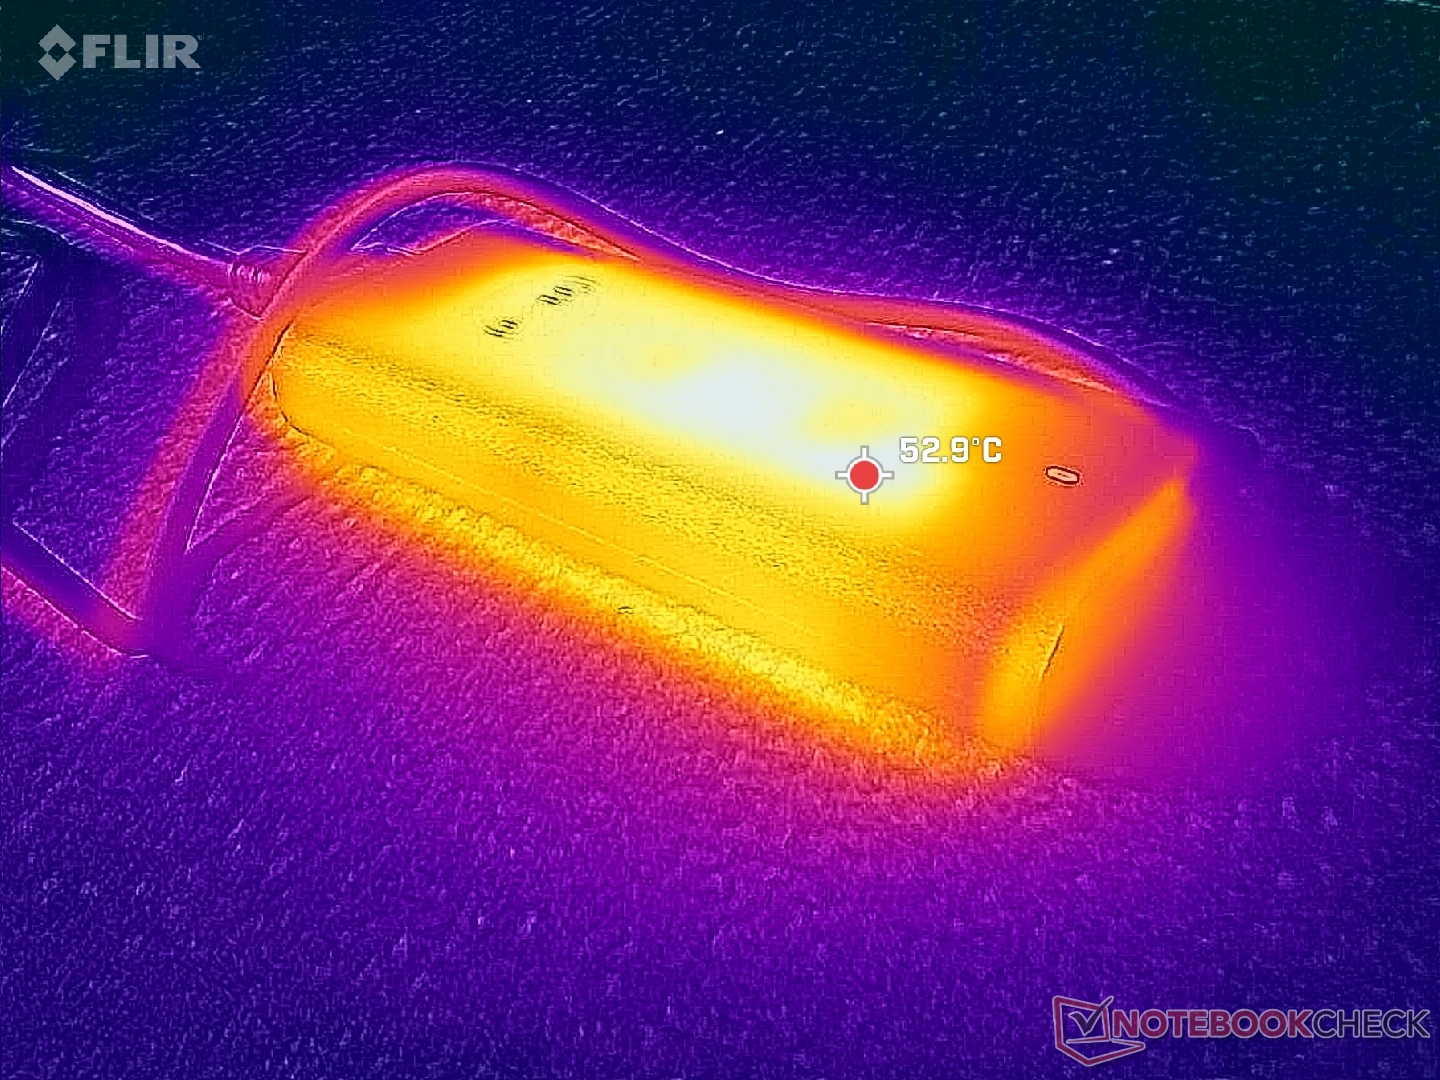
Energiförvaltning
Strömförbrukning
Tomgångskörning på skrivbordet kan dra så lite som 6 W i strömsparläge med iGPU:n aktiv eller upp till 33 W i prestandaläge med dGPU:n aktiv och OLED-skärmen som mestadels visar vita färger (t.ex. när du surfar). Förbrukningen när mer krävande belastningar körs är annars liknande förra årets modell om inte något lägre för förbättrad prestanda per watt, särskilt eftersom Dell 16 Premium levereras med samma 130 W USB-C AC-adapter (~12,8 x 5,5 x 2,3 cm) som tidigare.
Observera att strömförbrukningen är högre i början av Prime95-stresstestet när Turbo Boost-potentialen är som högst.
| Av/Standby | |
| Låg belastning | |
| Hög belastning |
|
Förklaring:
min: | |
| Dell 16 Premium DA16250 Ultra 7 255H, GeForce RTX 5070 Laptop, Kioxia BG6 KBG6AZNV1T02, OLED, 3840x2400, 16.3" | Dell XPS 16 9640 Ultra 7 155H, GeForce RTX 4070 Laptop GPU, Kioxia XG8 KXG80ZNV1T02, OLED, 3840x2400, 16.3" | HP Spectre x360 16 RTX 4050 Ultra 7 155H, GeForce RTX 4050 Laptop GPU, SK hynix PC801 HFS001TEJ9X101N, OLED, 2880x1800, 16" | Lenovo Yoga Pro 9i 16 RTX 5070 Ultra 9 285H, GeForce RTX 5070 Laptop, WD PC SN7100S SDFPMSL-1T00-1101, OLED, 3200x2000, 16" | Asus Zenbook S 16 UM5606-RK333W Ryzen AI 9 HX 370, Radeon 890M, Micron 2400 MTFDKBA1T0QFM, OLED, 2880x1800, 16" | LG Gram Pro 16Z90TS-G.AU89G Core Ultra 7 256V, Arc 140V, Samsung PM9A1a MZVL21T0HDLU, IPS, 2560x1600, 16" | |
|---|---|---|---|---|---|---|
| Power Consumption | 7% | -5% | -29% | 39% | 50% | |
| Idle Minimum * (Watt) | 6.5 | 7.7 -18% | 5.8 11% | 8.8 -35% | 5.4 17% | 4.15 36% |
| Idle Average * (Watt) | 8.1 | 10.3 -27% | 12.3 -52% | 16.1 -99% | 10.5 -30% | 5.4 33% |
| Idle Maximum * (Watt) | 33 | 10.6 68% | 33.9 -3% | 16.5 50% | 10.9 67% | 12.4 62% |
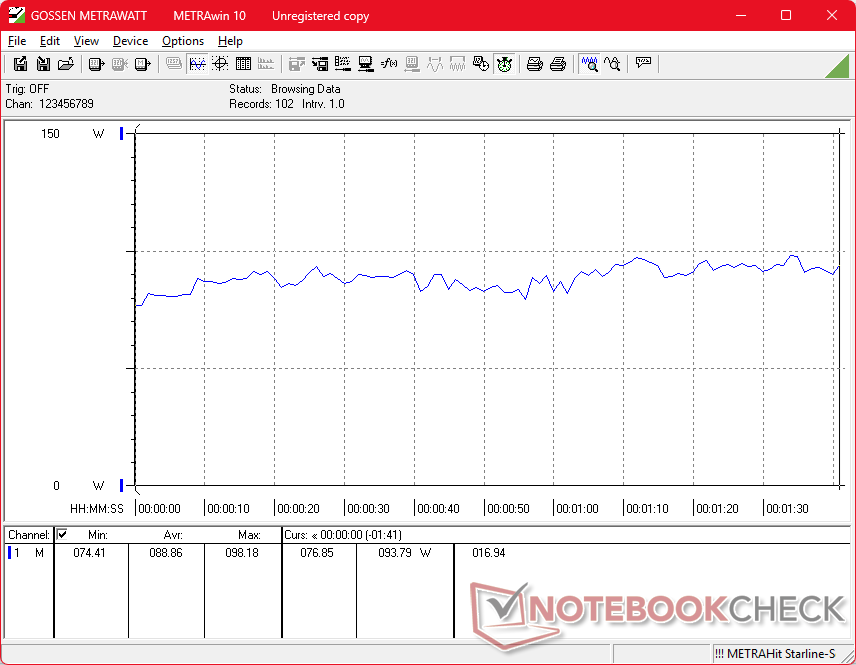
| Load Average * (Watt) | 88.9 | 76.5 14% | 83.3 6% | 89.3 -0% | 47.8 46% | |
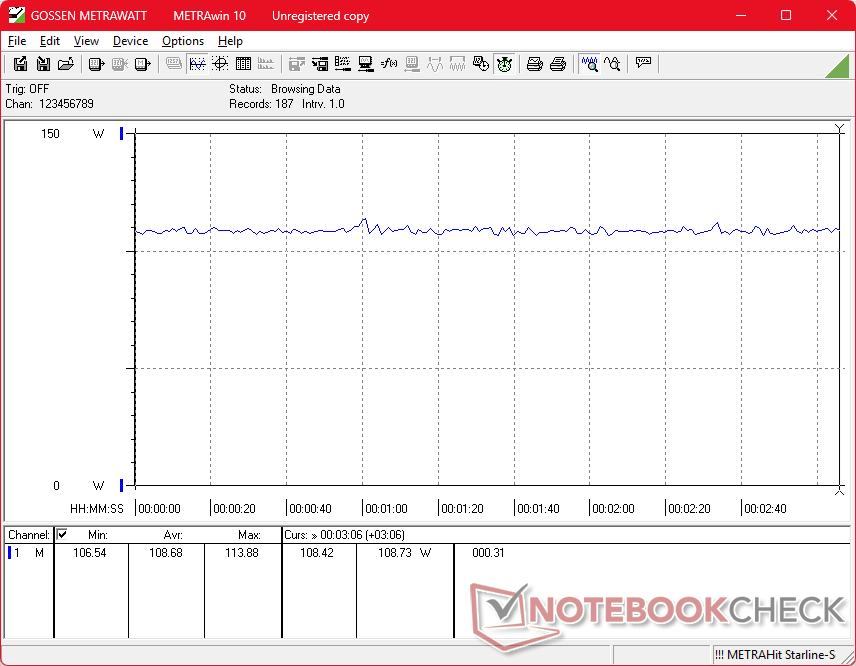
| Cyberpunk 2077 ultra external monitor * (Watt) | 108.9 | 157.9 -45% | 46.7 57% | 48.1 56% | ||
| Cyberpunk 2077 ultra * (Watt) | 108.7 | 160.6 -48% | 49.2 55% | 48.2 56% | ||
| Load Maximum * (Watt) | 138.3 | 138.5 -0% | 120.8 13% | 177.4 -28% | 58.6 58% | 60.049 57% |
| Witcher 3 ultra * (Watt) | 126.4 | 89.1 |
* ... mindre är bättre
Strömförbrukning Cyberpunk / Stresstest
Strömförbrukning extern monitor
Batteritid
Körtiderna är ungefär desamma som tidigare trots processoruppgraderingarna och den snabbare uppdateringsfrekvensen på 120 Hz.
| Dell 16 Premium DA16250 Ultra 7 255H, GeForce RTX 5070 Laptop, 99.5 Wh | Dell XPS 16 9640 Ultra 7 155H, GeForce RTX 4070 Laptop GPU, 99.5 Wh | HP Spectre x360 16 RTX 4050 Ultra 7 155H, GeForce RTX 4050 Laptop GPU, 83 Wh | Lenovo Yoga Pro 9i 16 RTX 5070 Ultra 9 285H, GeForce RTX 5070 Laptop, 84 Wh | Asus Zenbook S 16 UM5606-RK333W Ryzen AI 9 HX 370, Radeon 890M, 78 Wh | LG Gram Pro 16Z90TS-G.AU89G Core Ultra 7 256V, Arc 140V, 77 Wh | |
|---|---|---|---|---|---|---|
| Batteridrifttid | -5% | 0% | 1% | -3% | 78% | |
| WiFi v1.3 (h) | 11 | 10.5 -5% | 11 0% | 11.1 1% | 10.7 -3% | 19.6 78% |
| H.264 (h) | 16.5 | 14.4 | 20.1 | |||
| Load (h) | 1.5 | 1.8 |
Notebookcheck Betyg
Dell 16 Premium erbjuder samma användarupplevelse som XPS 16 9640 men med snabbare och effektivare processorer och en 120 Hz OLED-skärm som tillval.
Dell 16 Premium DA16250
- 10/31/2025 v8
Allen Ngo
 Total Sustainability Score:
 Potentiella konkurrenter i jämförelse
Bild | Modell / recensioner | Pris | Vikt | Höjd | Skärm |
|---|---|---|---|---|---|
1. 87.9%  | Dell 16 Premium DA16250 Intel Core Ultra 7 255H ⎘ NVIDIA GeForce RTX 5070 Laptop ⎘ 32 GB Minne, 1024 GB SSD | Amazon: Listpris: 3300 USD | 2.3 kg | 18.7 mm | 16.30" 3840x2400 278 PPI OLED |
2. 88.6% v7 (old)  | Dell XPS 16 9640 Intel Core Ultra 7 155H ⎘ NVIDIA GeForce RTX 4070 Laptop GPU ⎘ 32 GB Minne, 1024 GB SSD | Amazon: 1. $2,199.00 New XPS 16 9640 Business Lap... 2. $2,499.00 Dell XPS 16 9640 16.3" Touch... 3. $2,199.00 New XPS 16 9640 Powerful AI ... | 2.3 kg | 18.7 mm | 16.30" 3840x2400 139 PPI OLED |
3. 91.1% v7 (old)  | HP Spectre x360 16 RTX 4050 Intel Core Ultra 7 155H ⎘ NVIDIA GeForce RTX 4050 Laptop GPU ⎘ 16 GB Minne, 1024 GB SSD | Amazon: Listpris: 1600 USD | 2 kg | 19.8 mm | 16.00" 2880x1800 212 PPI OLED |
4. 90.4%  | Lenovo Yoga Pro 9i 16 RTX 5070 Intel Core Ultra 9 285H ⎘ NVIDIA GeForce RTX 5070 Laptop ⎘ 64 GB Minne, 1024 GB SSD | Amazon: Listpris: 2800€ | 1.9 kg | 17.9 mm | 16.00" 3200x2000 236 PPI OLED |
5. 84.7%  | Asus Zenbook S 16 UM5606-RK333W AMD Ryzen AI 9 HX 370 ⎘ AMD Radeon 890M ⎘ 32 GB Minne, 1024 GB SSD | Amazon: Listpris: 2100€ | 1.5 kg | 12.9 mm | 16.00" 2880x1800 212 PPI OLED |
6. 83.9%  | LG Gram Pro 16Z90TS-G.AU89G Intel Core Ultra 7 256V ⎘ Intel Arc Graphics 140V ⎘ 16 GB Minne, 1024 GB SSD | Amazon: Listpris: 2050€ | 1.2 kg | 13 mm | 16.00" 2560x1600 189 PPI IPS |
Genomskinlighet
Valet av enheter som ska granskas görs av vår redaktion. Testprovet gavs till författaren som ett lån av tillverkaren eller återförsäljaren för denna recension. Långivaren hade inget inflytande på denna recension och inte heller fick tillverkaren en kopia av denna recension innan publiceringen. Det fanns ingen skyldighet att publicera denna recension. Som ett oberoende medieföretag är Notebookcheck inte föremål för auktoritet från tillverkare, återförsäljare eller förlag.
This is how Notebookcheck is testingEvery year, Notebookcheck independently reviews hundreds of laptops and smartphones using standardized procedures to ensure that all results are comparable. We have continuously developed our test methods for around 20 years and set industry standards in the process. In our test labs, high-quality measuring equipment is utilized by experienced technicians and editors. These tests involve a multi-stage validation process. Our complex rating system is based on hundreds of well-founded measurements and benchmarks, which maintains objectivity.

