Recension av Lenovo ThinkPad P16 G1 RTX A5500 arbetsstation: Snabbare än Dell Precision 7670
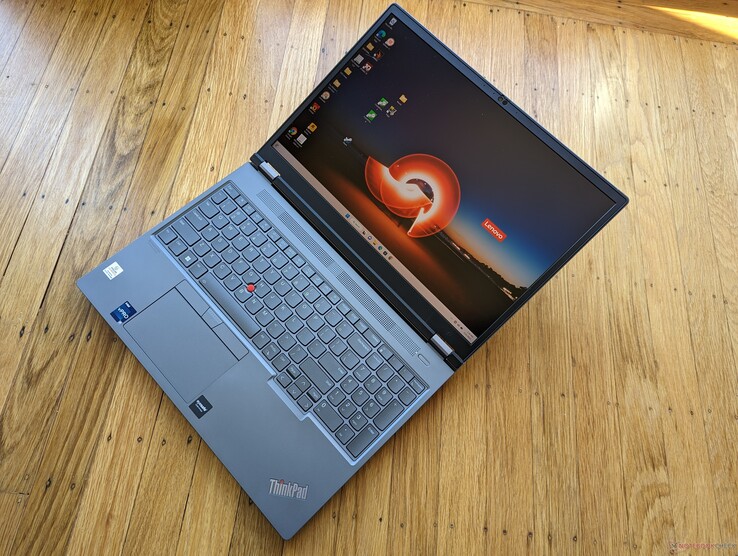
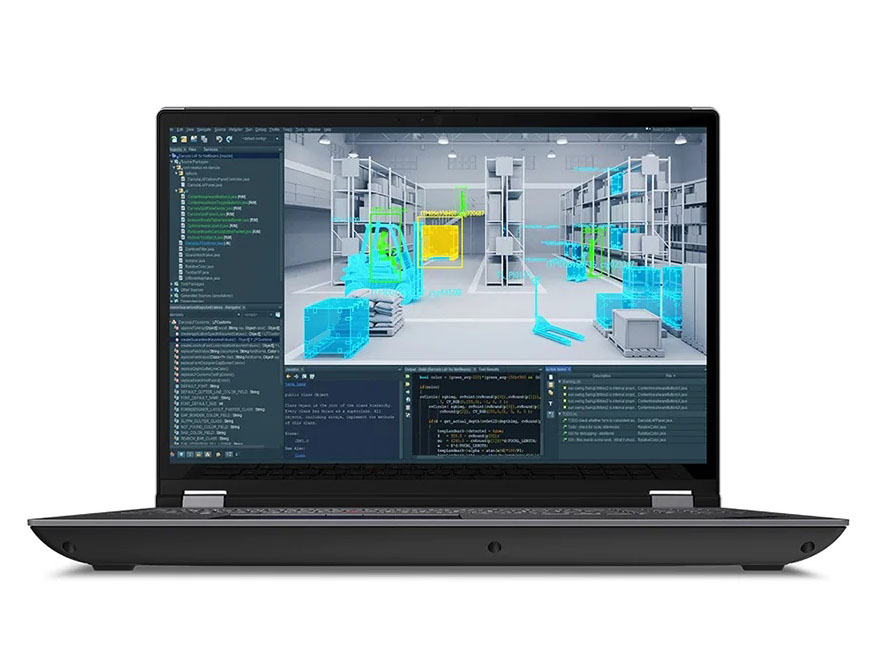
ThinkPad P16 G1 är en ny generation 16-tums ThinkPad-arbetsstationer som är utformade för att överträffa den befintliga 16-tums ThinkPad P1-serien. Den har några av de snabbaste mobila CPU:erna och arbetsstations-GPU:erna som för närvarande finns tillgängliga upp till Core i9-12950HX respektive RTX A5500, för att vara en av de snabbaste mobila arbetsstationerna på marknaden. Vår enhet som konfigurerad säljs för cirka 9 000 dollar. Naturligtvis finns det också lägre SKU:er med långsammare integrerad UHD-grafik eller Intel ARC Pro A30M med startpriser på 3400 dollar i stället.
Modellen konkurrerar direkt med andra mobila arbetsstationer i toppklass och vissa bärbara Nvidia Studio-datorer som Dell Precision 7670, Asus ProArt StudioBook Pro 16, MSI CreatorPro Z16P, eller HP ZBook Studio 16 G9. Se vår fullständiga recension av konfigurationen ThinkPad P16 G1 RTX A2000 om du vill veta mer om chassit och andra fysiska egenskaper hos modellen. Den här recensionen kommer att fokusera på vad användare kan förvänta sig av ThinkPad P16 G1 när det gäller prestanda om de konfigurerar med de högsta CPU- och GPU-alternativen.
Fler Lenovo-recensioner:
Potentiella konkurrenter i jämförelse
Gradering | Datum | Modell | Vikt | Höjd | Storlek | Upplösning | Pris |
|---|---|---|---|---|---|---|---|
| 91 % v7 (old) | 02/2023 | Lenovo ThinkPad P16 G1 RTX A5500 i9-12950HX, RTX A5500 Laptop GPU | 3 kg | 30.23 mm | 16.00" | 3840x2400 | |
v (old) | 12/2021 | Asus ProArt StudioBook 16 W7600H5A-2BL2 W-11955M, RTX A5000 Laptop GPU | 2.4 kg | 21.4 mm | 16.00" | 3840x2400 | |
| 89.1 % v7 (old) | 12/2022 | Dell Precision 7000 7670 Performance i9-12950HX, RTX A5500 Laptop GPU | 2.8 kg | 25.95 mm | 16.00" | 3840x2400 | |
| 88.2 % v7 (old) | 02/2023 | Lenovo ThinkPad P16 G1 21D6001DMB i7-12850HX, RTX A2000 Laptop GPU | 3 kg | 30.23 mm | 16.00" | 2560x1600 | |
| 84.3 % v7 (old) | 11/2022 | MSI CreatorPro Z16P B12UKST i7-12700H, RTX A3000 Laptop GPU | 2.4 kg | 19 mm | 16.00" | 2560x1600 | |
| 90.1 % v7 (old) | 11/2022 | HP ZBook Studio 16 G9 62U04EA i7-12800H, RTX A2000 Laptop GPU | 1.8 kg | 19 mm | 16.00" | 3840x2400 |
Fall
SD-kortläsare
Den integrerade kortläsaren ger bara genomsnittliga överföringshastigheter. Att flytta 1 GB bilder från vårt UHS-II-testkort till skrivbordet tar cirka 14 sekunder jämfört med mindre än hälften så lång tid för Precision 7670. För en mobil arbetsstation av hög kvalitet som vår ThinkPad P1 hade vi förväntat oss lite mer.
| SD Card Reader | |
| average JPG Copy Test (av. of 3 runs) | |
| Dell Precision 7000 7670 Performance (Toshiba Exceria Pro SDXC 64 GB UHS-II) | |
| MSI CreatorPro Z16P B12UKST (AV Pro V60) | |
| Lenovo ThinkPad P16 G1 RTX A5500 (Toshiba Exceria Pro SDXC 64 GB UHS-II) | |
| HP ZBook Studio 16 G9 62U04EA (Angelbird AV PRO V60) | |
| Asus ProArt StudioBook 16 W7600H5A-2BL2 (AV Pro SD microSD 128 GB V60) | |
| Lenovo ThinkPad P16 G1 21D6001DMB (AV Pro V60) | |
| maximum AS SSD Seq Read Test (1GB) | |
| Dell Precision 7000 7670 Performance (Toshiba Exceria Pro SDXC 64 GB UHS-II) | |
| Asus ProArt StudioBook 16 W7600H5A-2BL2 (AV Pro SD microSD 128 GB V60) | |
| MSI CreatorPro Z16P B12UKST (AV Pro V60) | |
| Lenovo ThinkPad P16 G1 RTX A5500 (Toshiba Exceria Pro SDXC 64 GB UHS-II) | |
| HP ZBook Studio 16 G9 62U04EA (Angelbird AV PRO V60) | |
| Lenovo ThinkPad P16 G1 21D6001DMB (AV Pro V60) | |
Kommunikation
| Networking | |
| iperf3 transmit AX12 | |
| Asus ProArt StudioBook 16 W7600H5A-2BL2 | |
| iperf3 receive AX12 | |
| Asus ProArt StudioBook 16 W7600H5A-2BL2 | |
| iperf3 receive AXE11000 6GHz | |
| MSI CreatorPro Z16P B12UKST | |
| HP ZBook Studio 16 G9 62U04EA | |
| Dell Precision 7000 7670 Performance | |
| Lenovo ThinkPad P16 G1 RTX A5500 | |
| iperf3 receive AXE11000 | |
| Lenovo ThinkPad P16 G1 21D6001DMB | |
| Lenovo ThinkPad P16 G1 RTX A5500 | |
| Dell Precision 7000 7670 Performance | |
| iperf3 transmit AXE11000 | |
| Lenovo ThinkPad P16 G1 RTX A5500 | |
| Lenovo ThinkPad P16 G1 21D6001DMB | |
| Dell Precision 7000 7670 Performance | |
| iperf3 transmit AXE11000 6GHz | |
| MSI CreatorPro Z16P B12UKST | |
| HP ZBook Studio 16 G9 62U04EA | |
| Lenovo ThinkPad P16 G1 RTX A5500 | |
| Dell Precision 7000 7670 Performance | |
Webbkamera


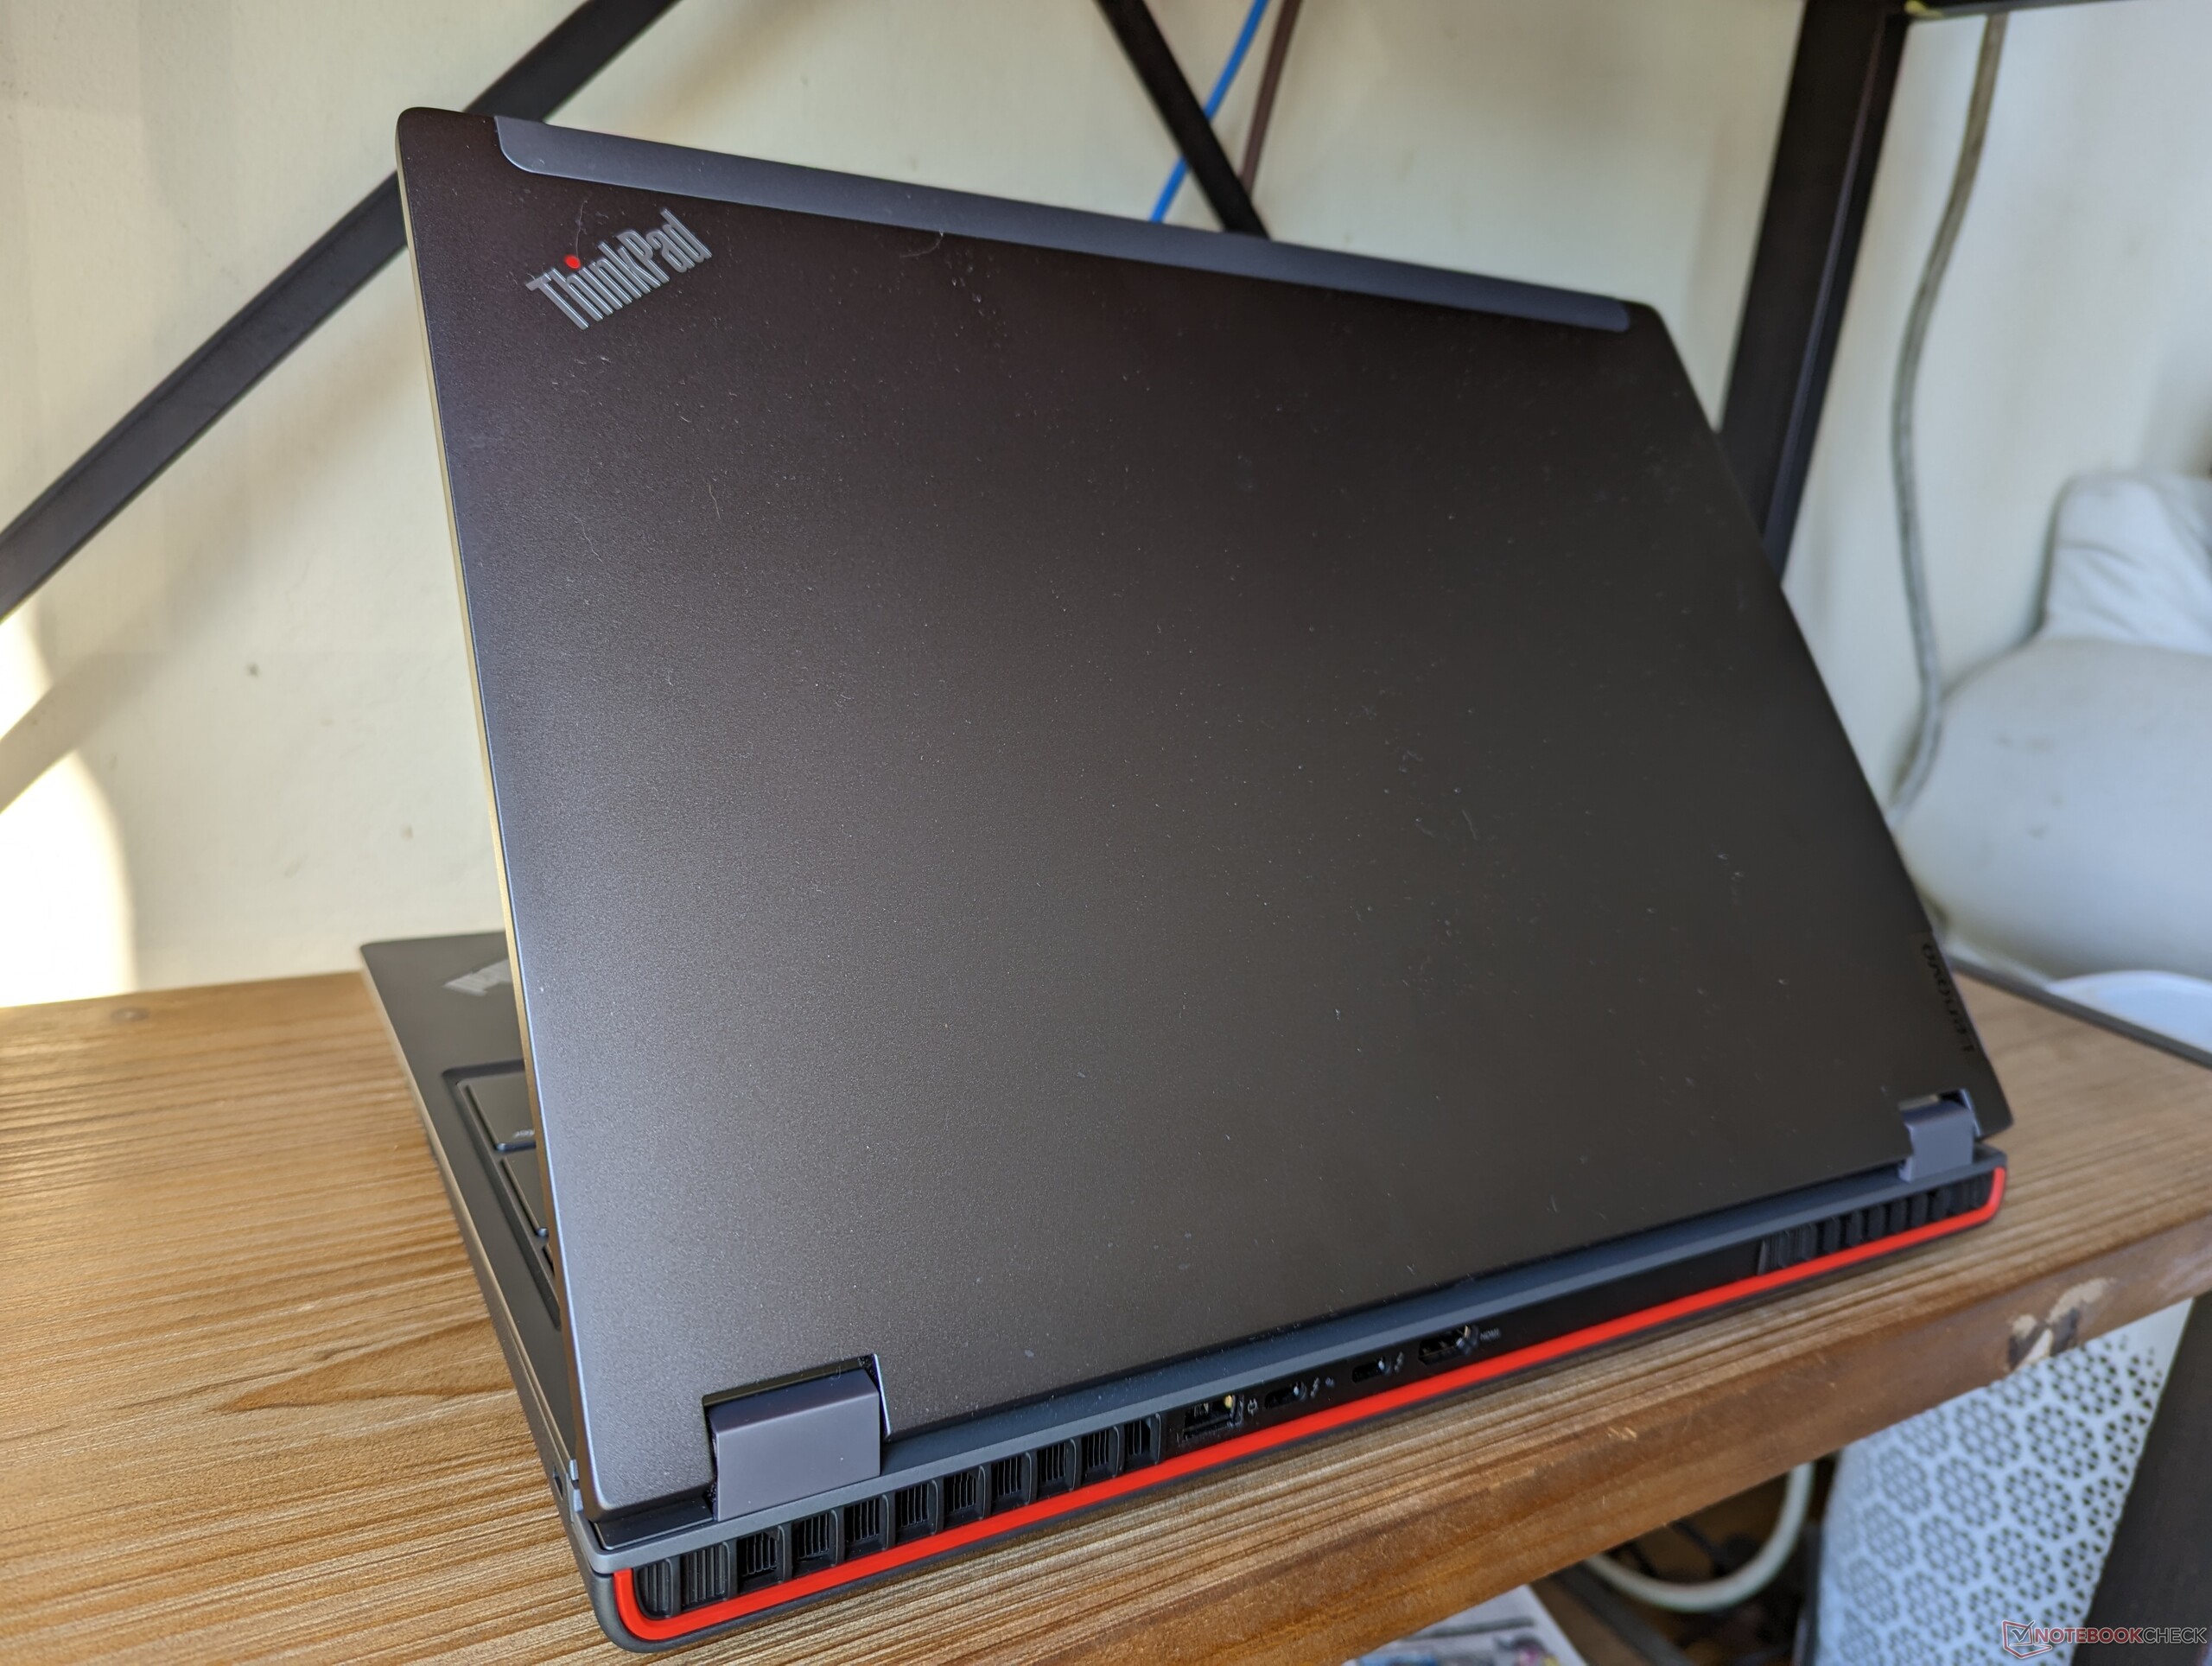
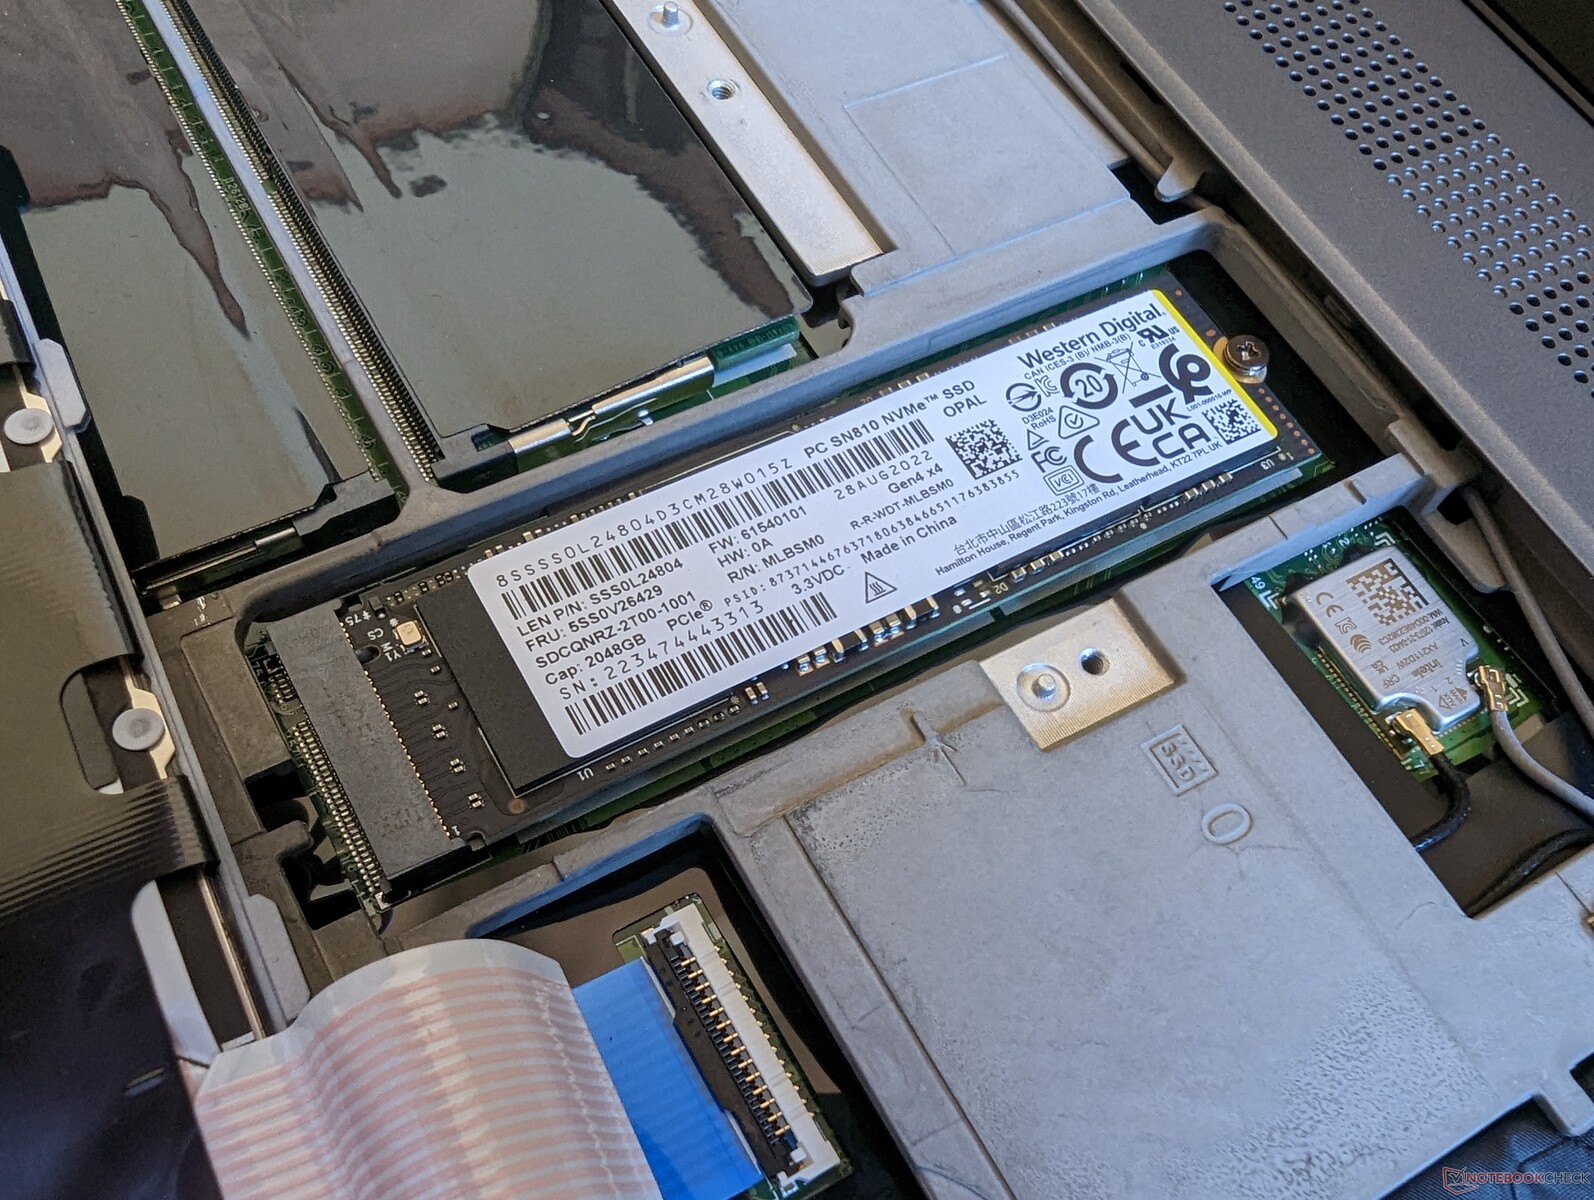
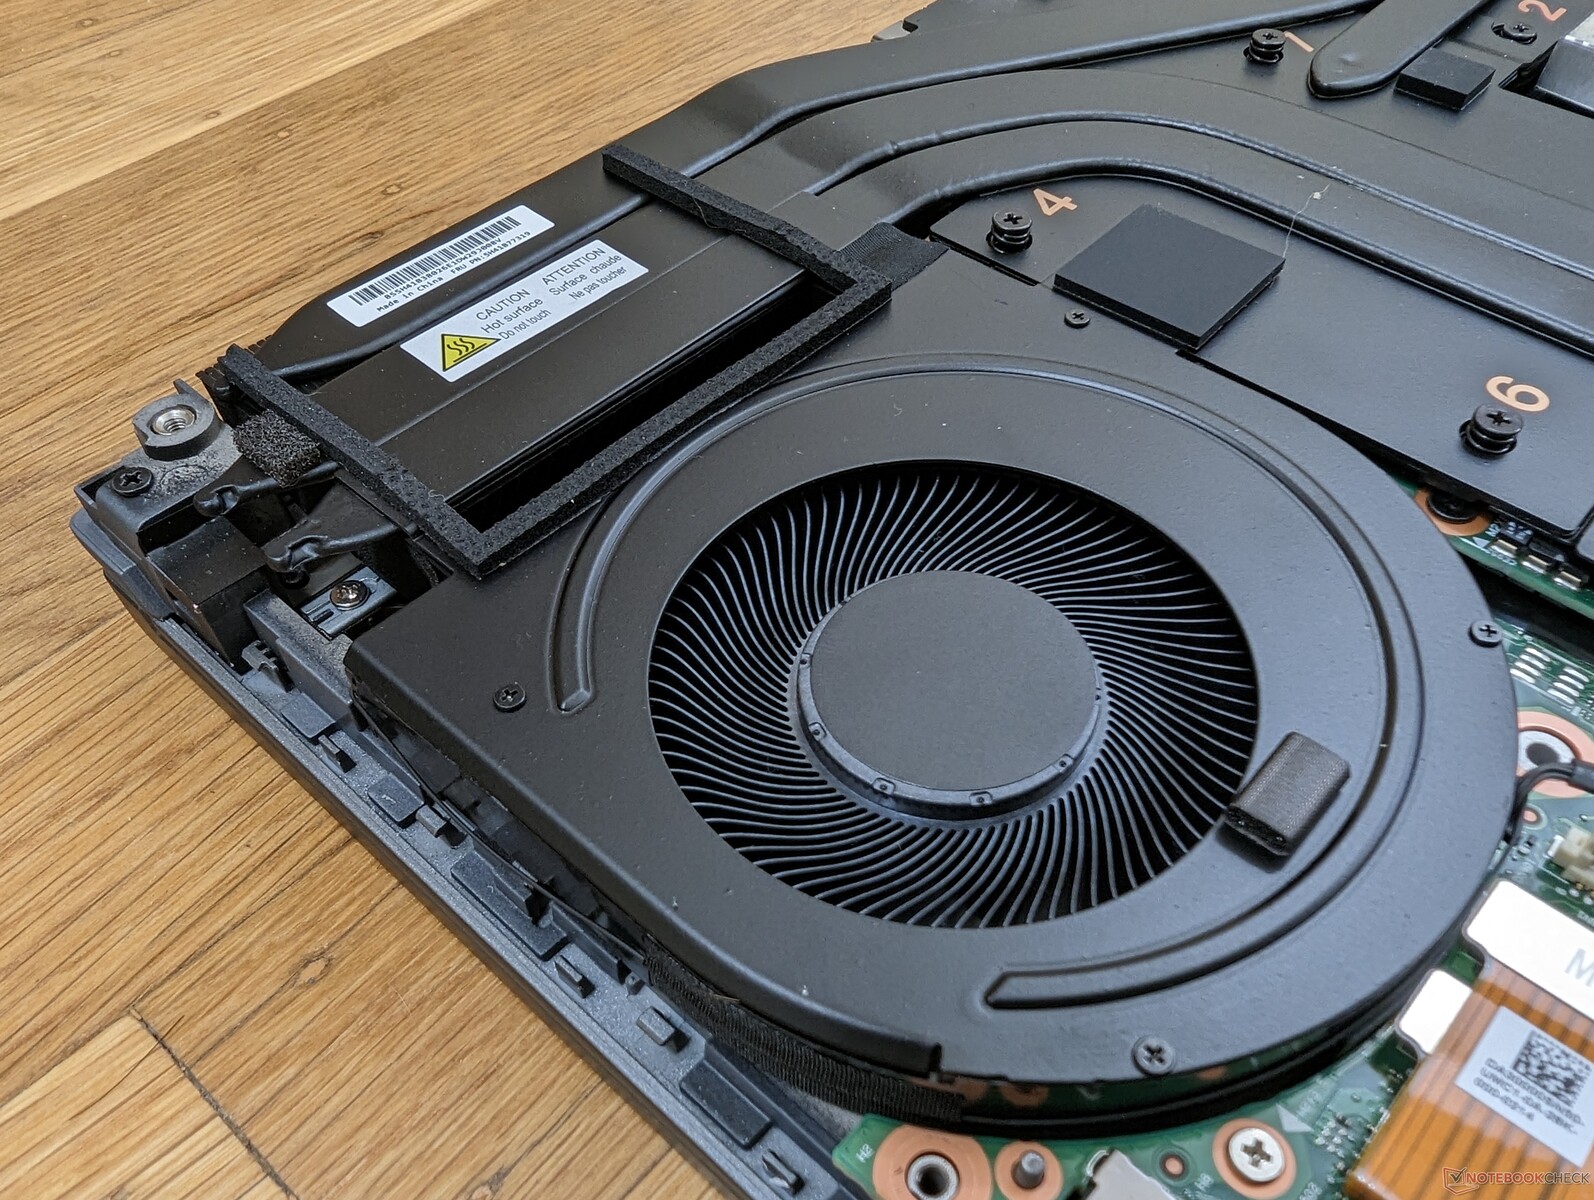
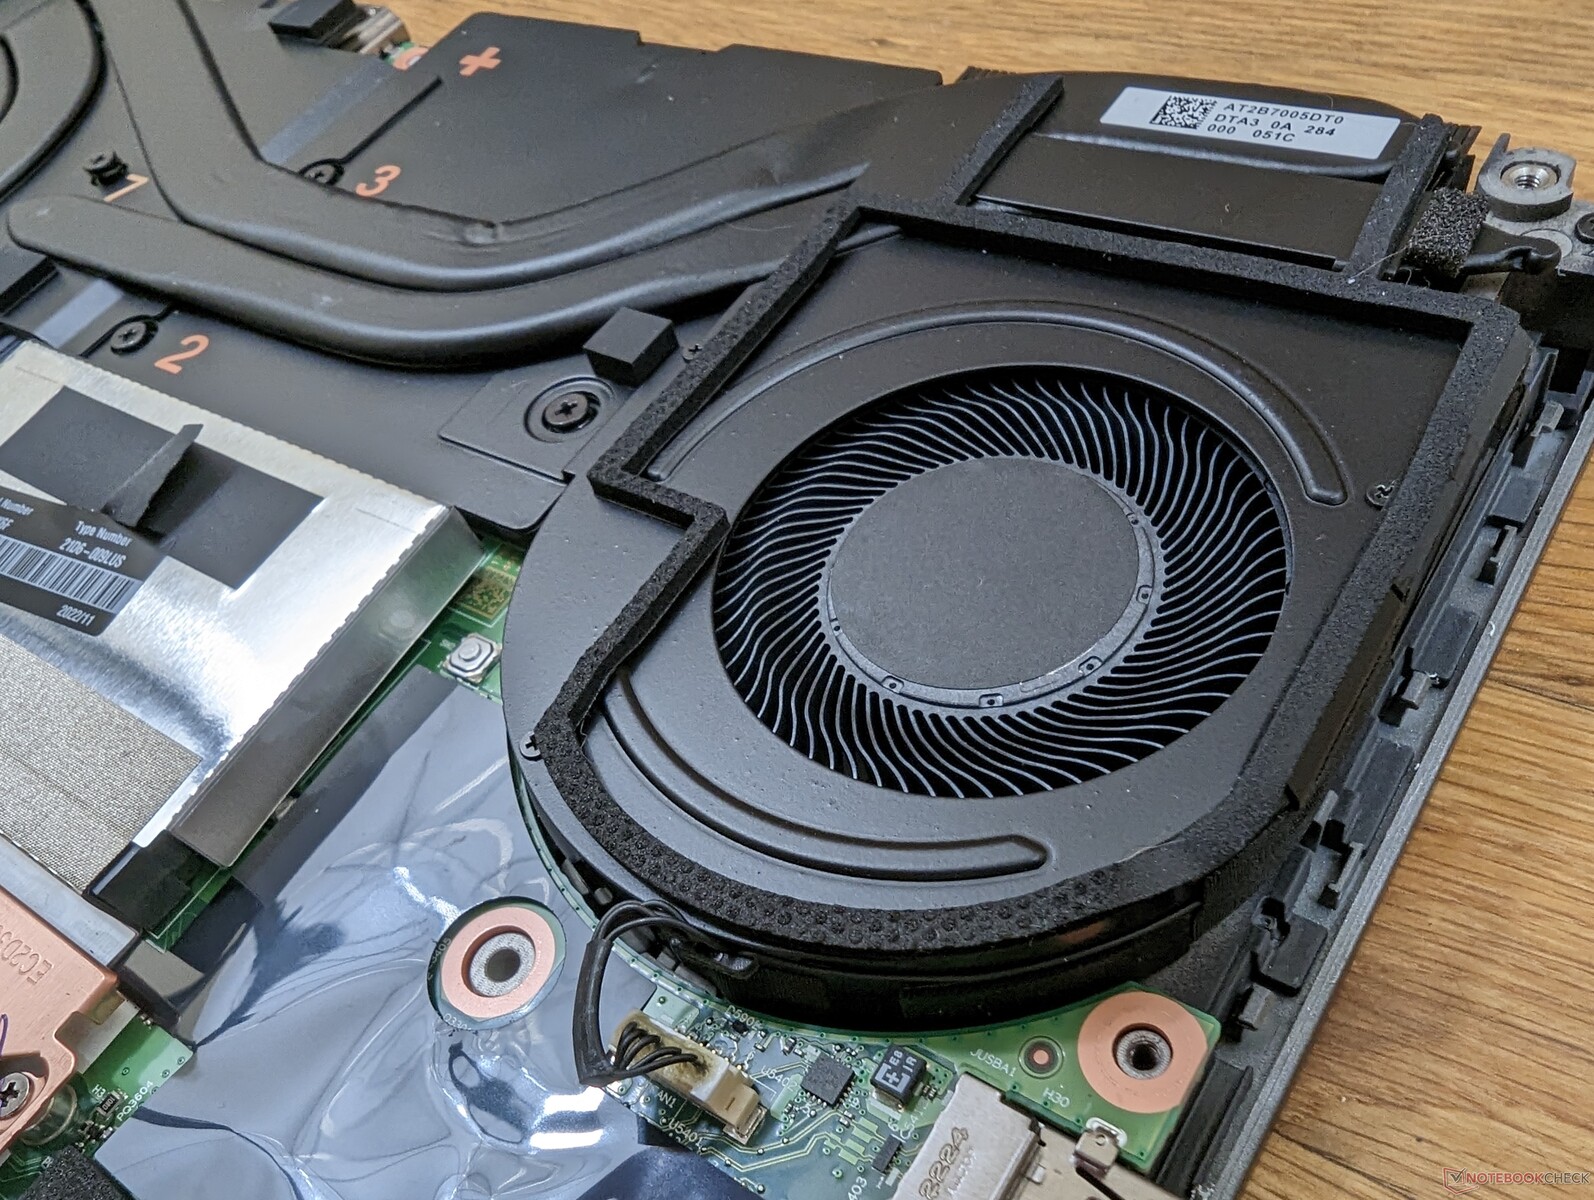
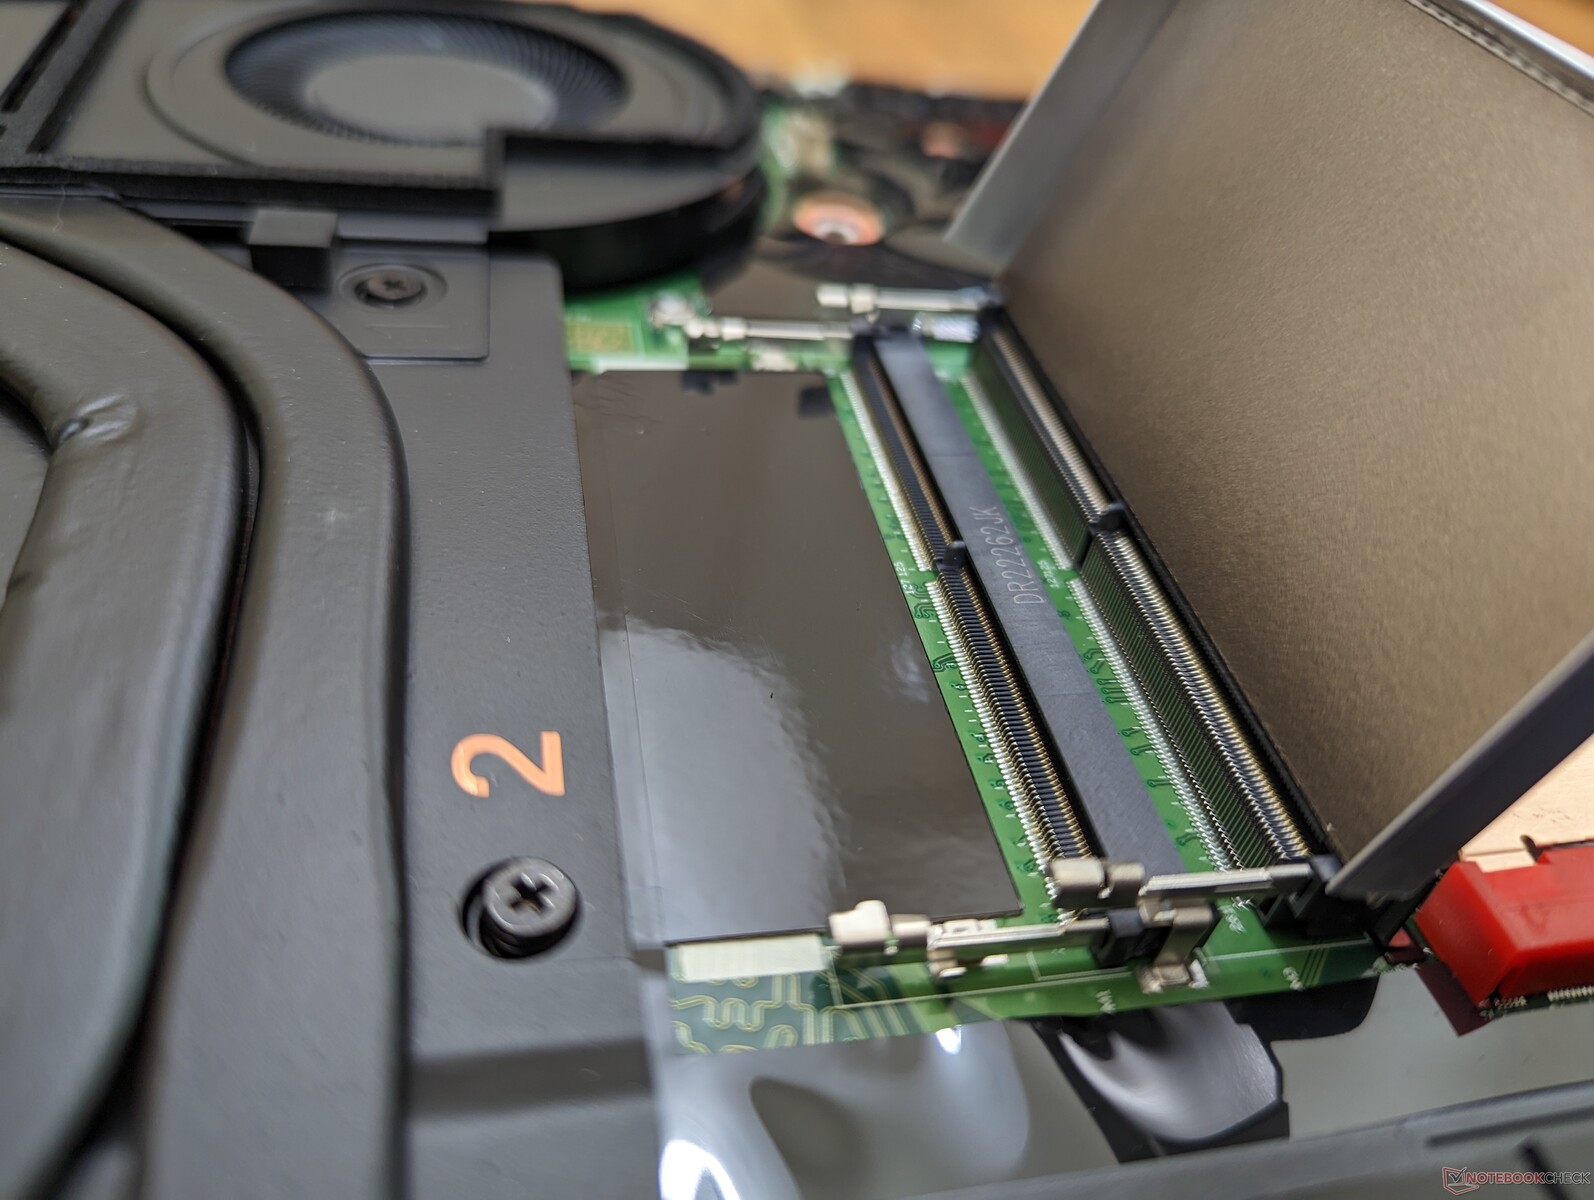
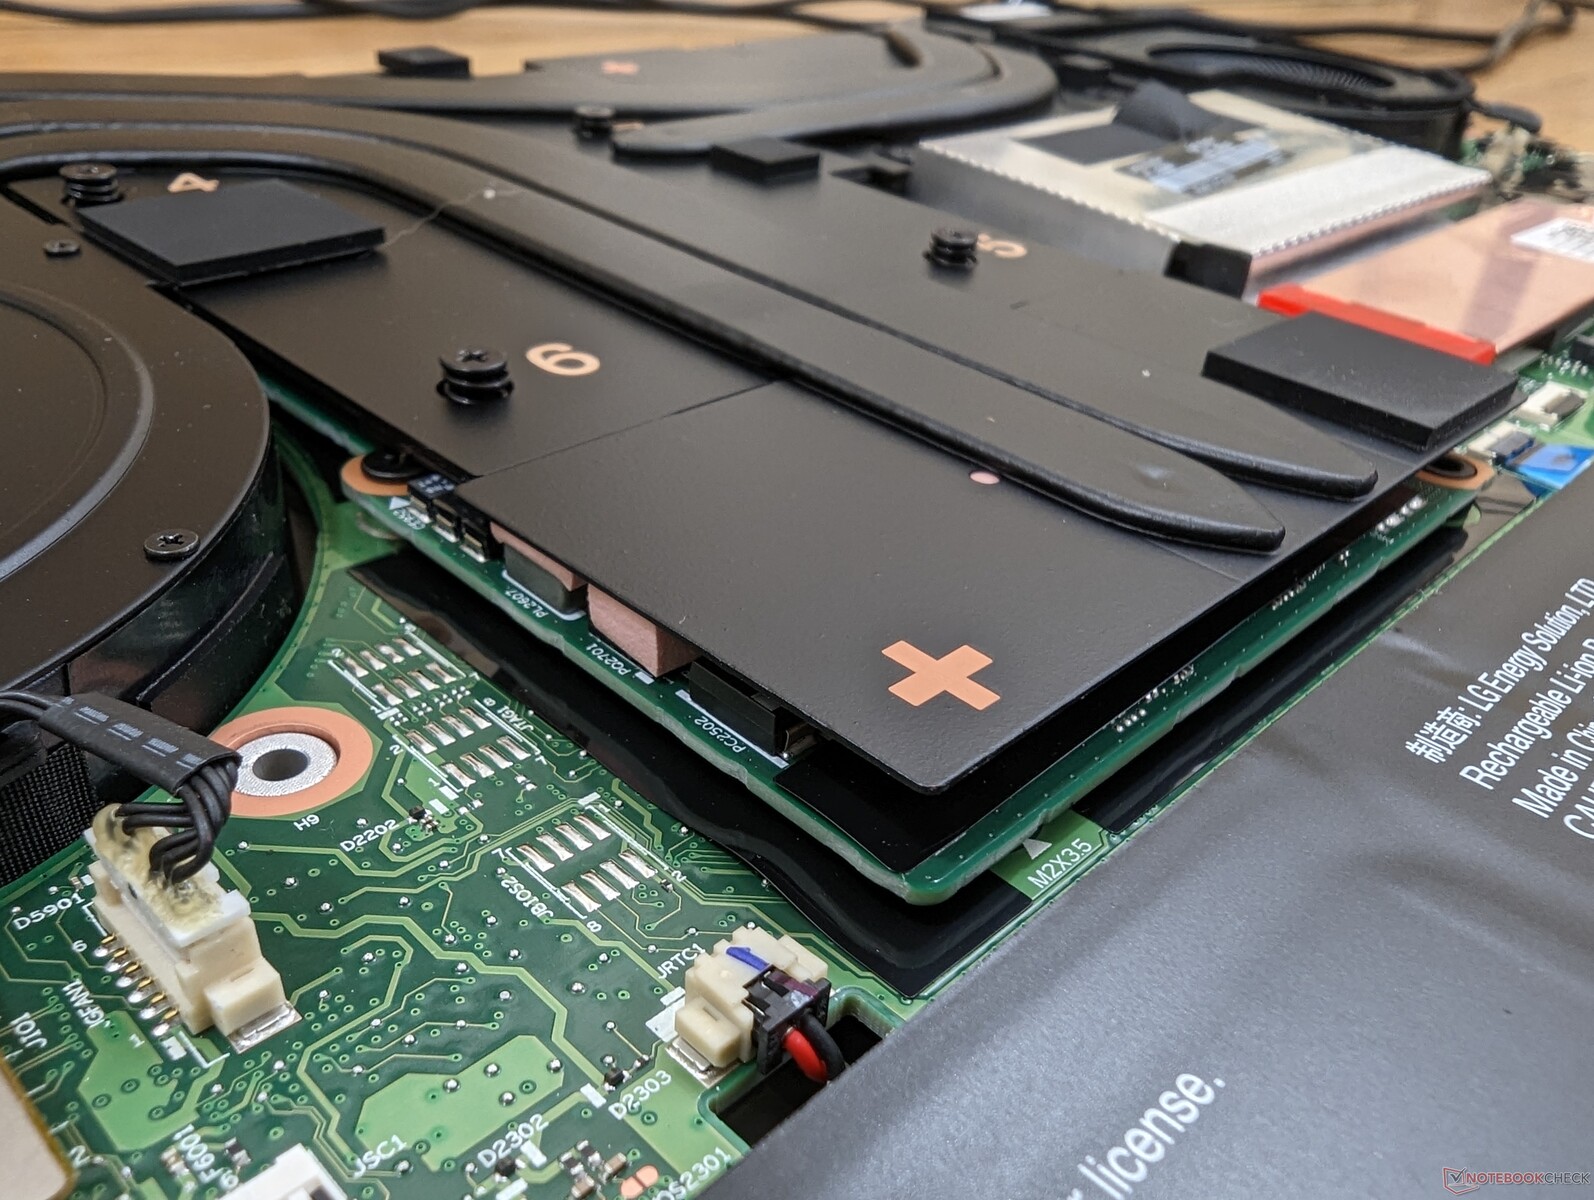
Underhåll
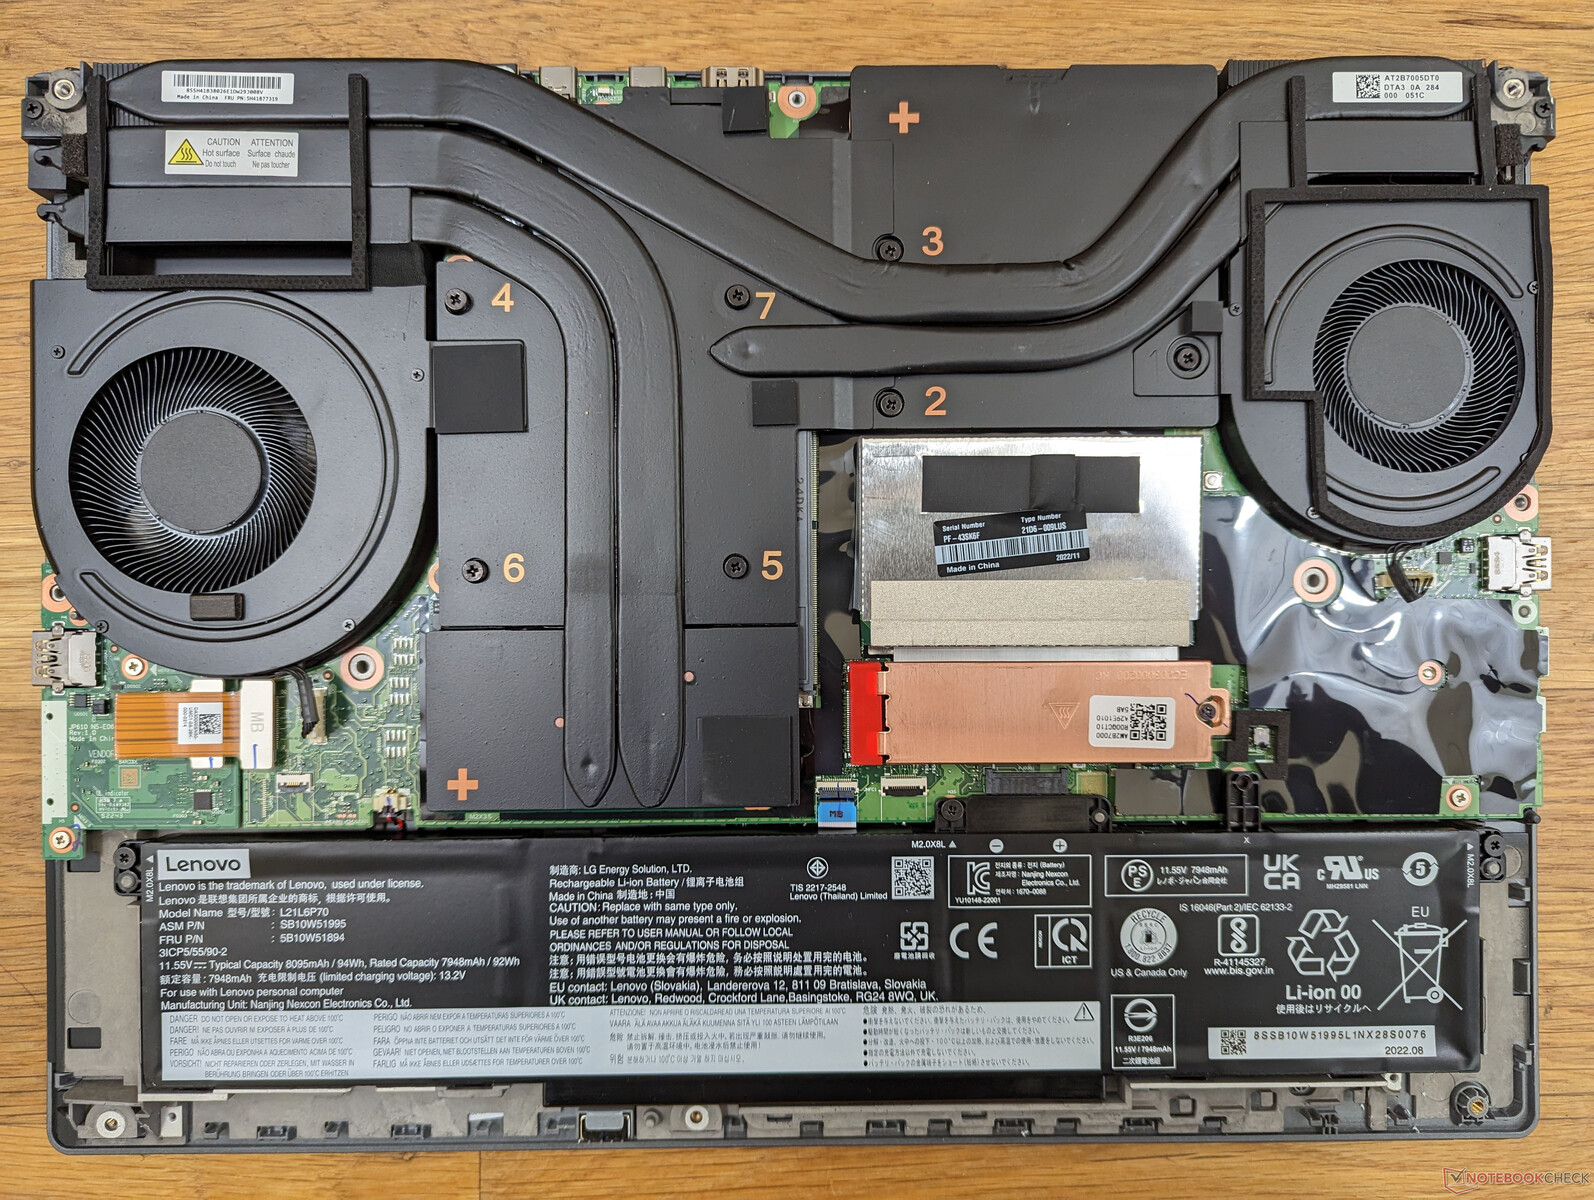
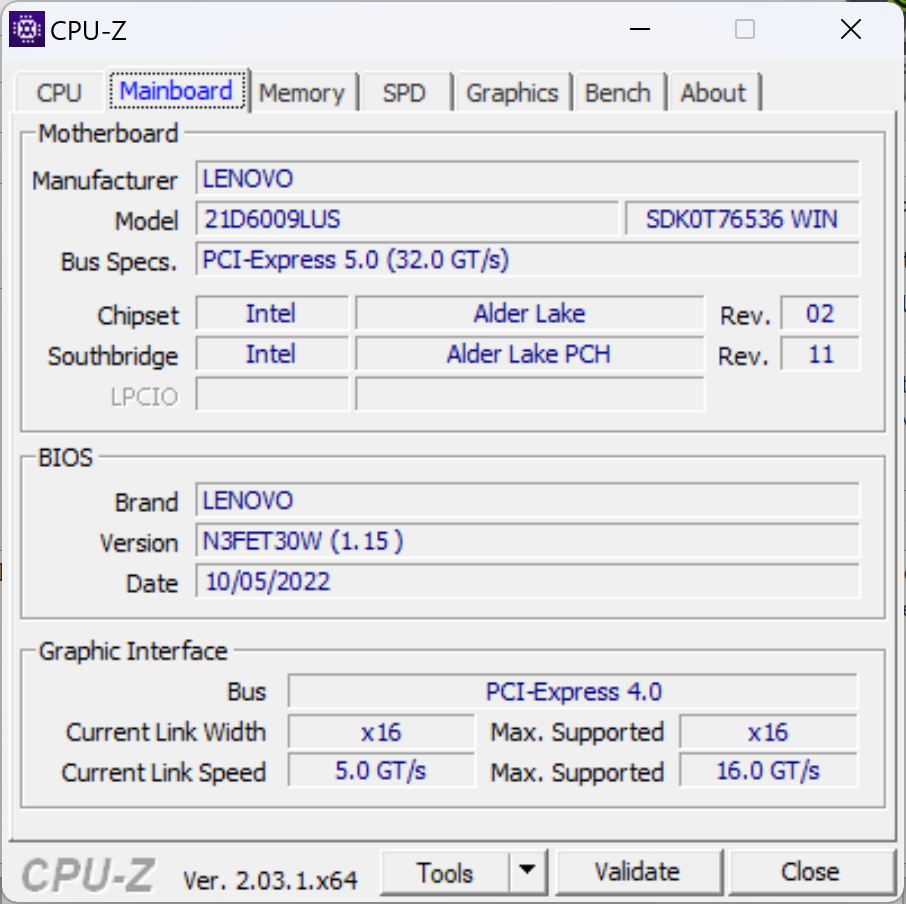
Bottenpanelen är fäst med 12 Philips-skruvar. Tangentbordet måste tas bort för att komma åt WAN-modulen, det primära M.2 SSD-facket och två av de fyra SODIMM-facken. Lenovo har en officiell underhållsmanual på https://download.lenovo.com/pccbbs/mobiles_pdf/p16_gen1_hmm_en.pdf för slutanvändare att följa.
Intressant nog är ThinkPad P16 G1 en av de mycket få bärbara datorer som levereras med en avtagbar GPU. Att byta ut ett grafikkort på en bärbar dator rekommenderas vanligtvis inte, utom vid service eller utbyte.
Tillbehör och garanti
Det finns inga extra tillbehör i förpackningen förutom nätadapter och papper.
En ettårig begränsad garanti gäller, medan Dell Precision 7670 har tre år som standard. Lenovo erbjuder dock service på plats under det ena året om det behövs.
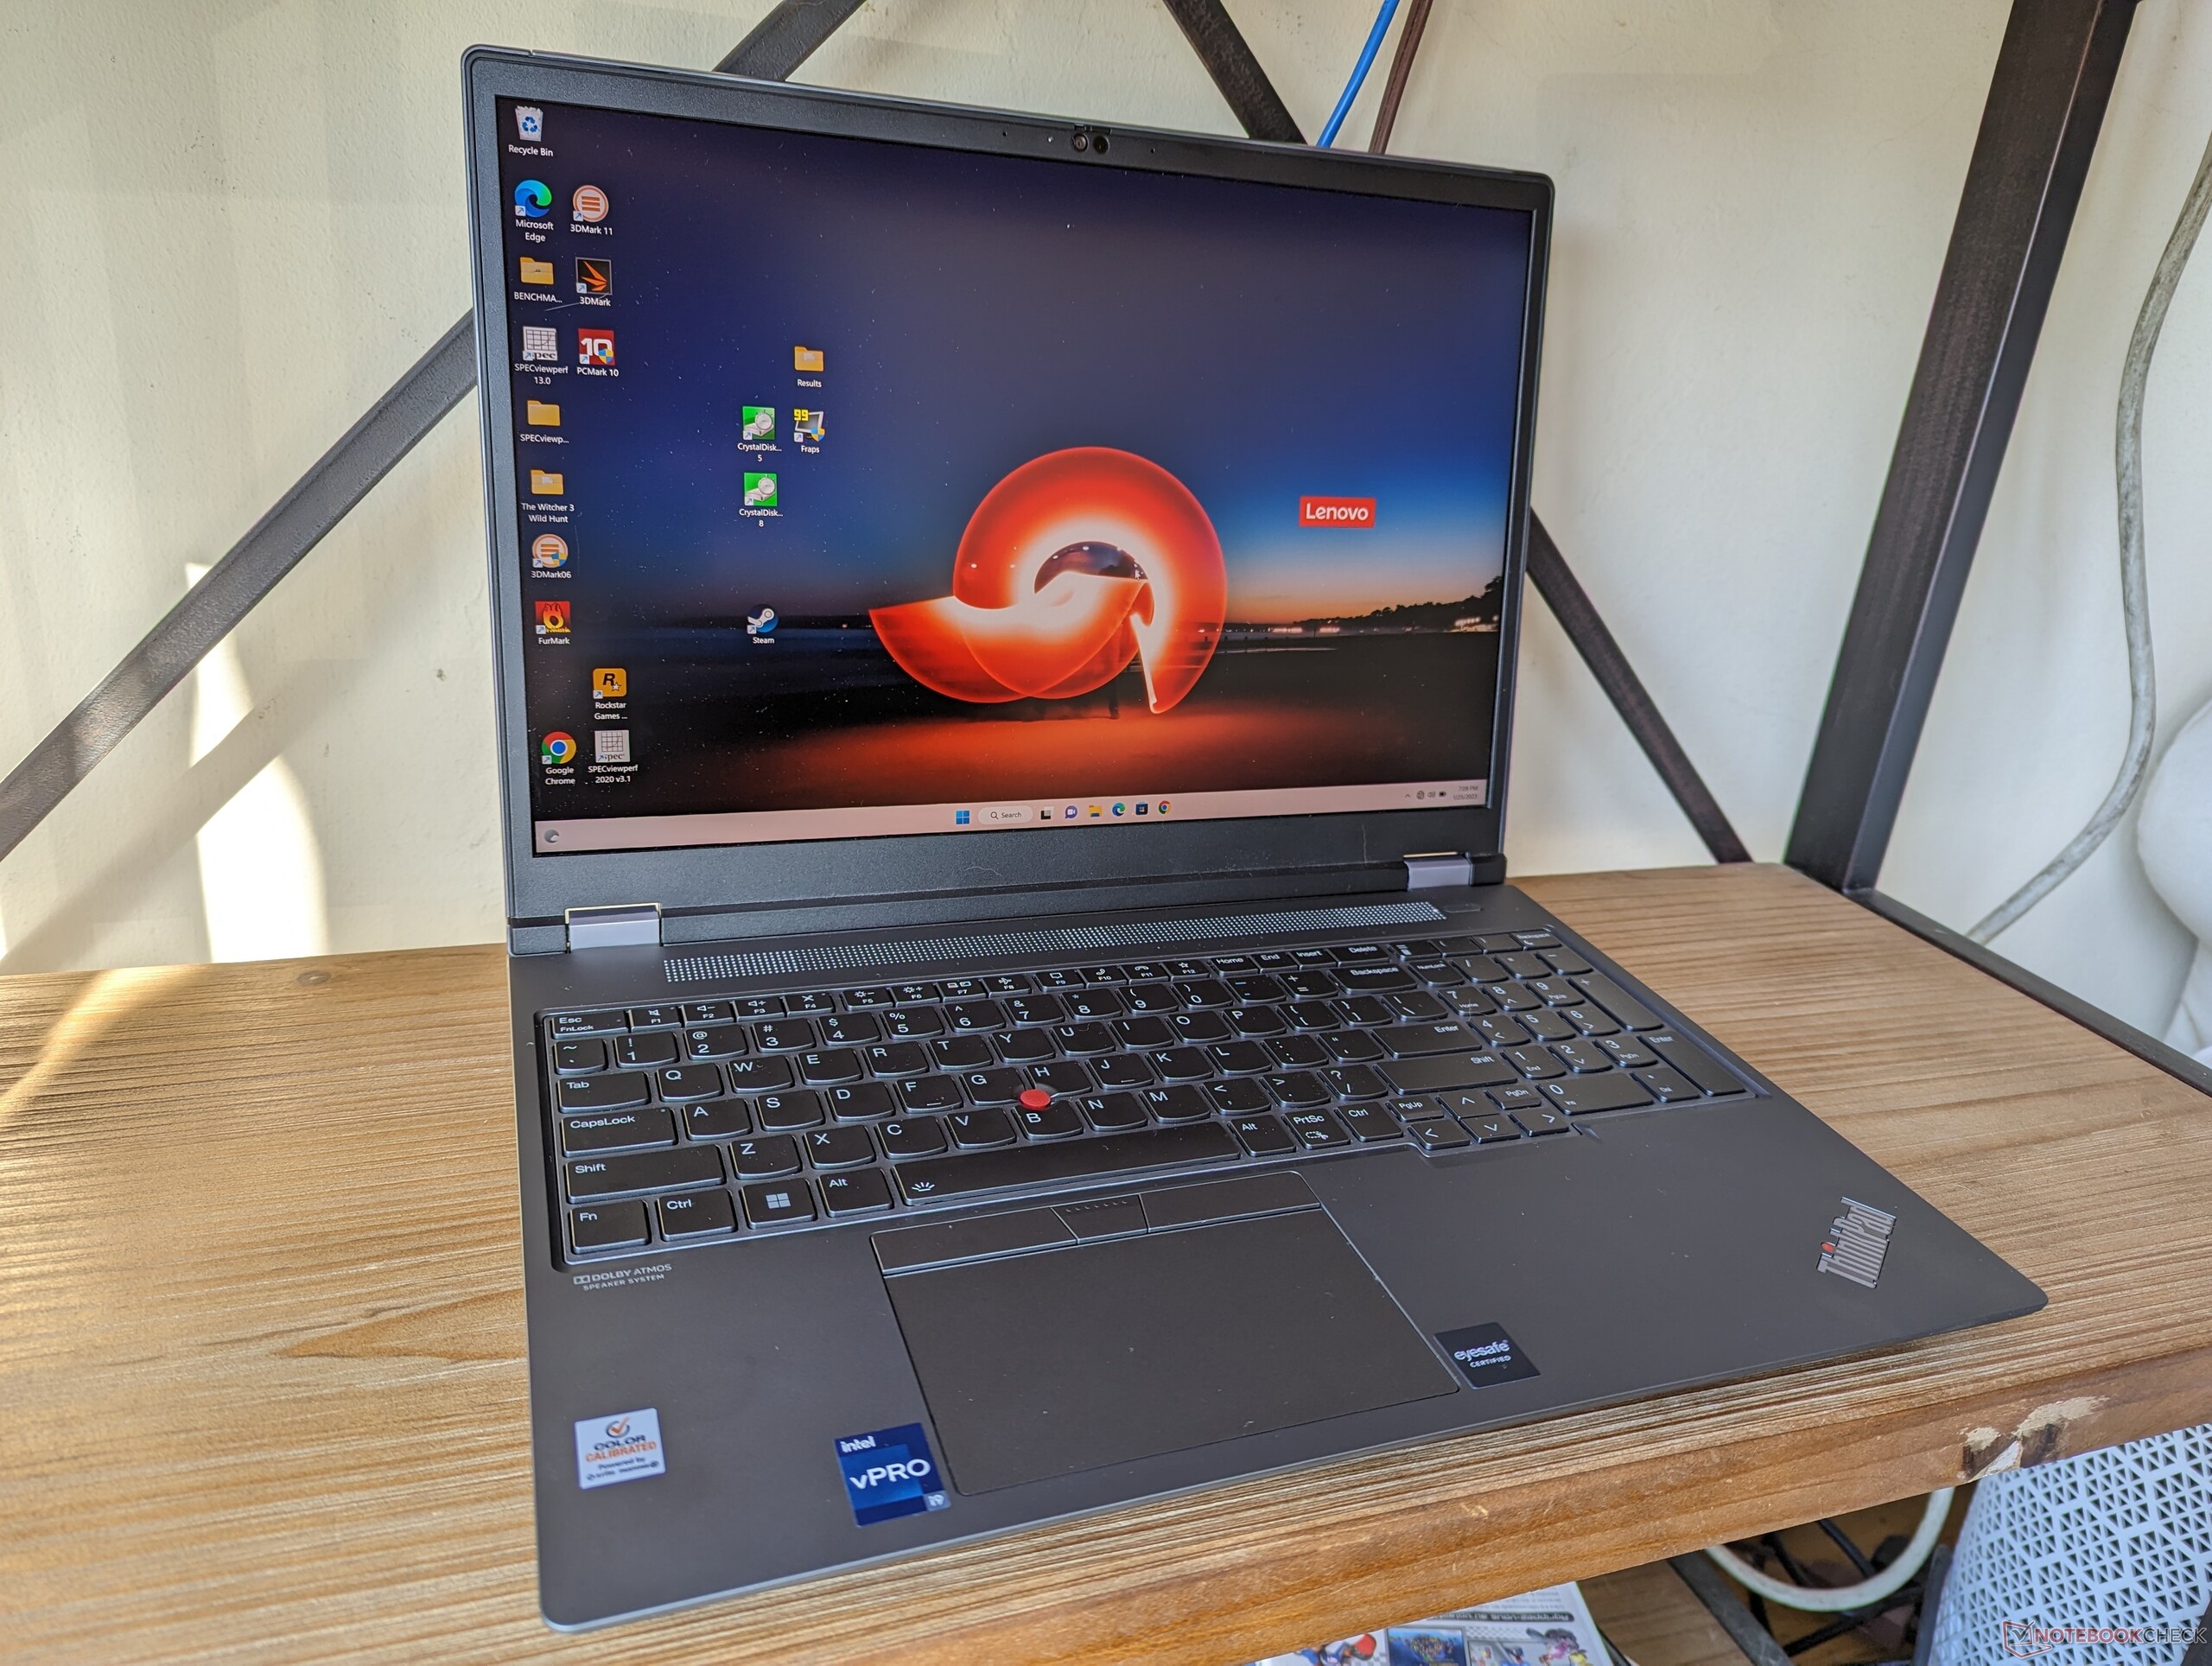
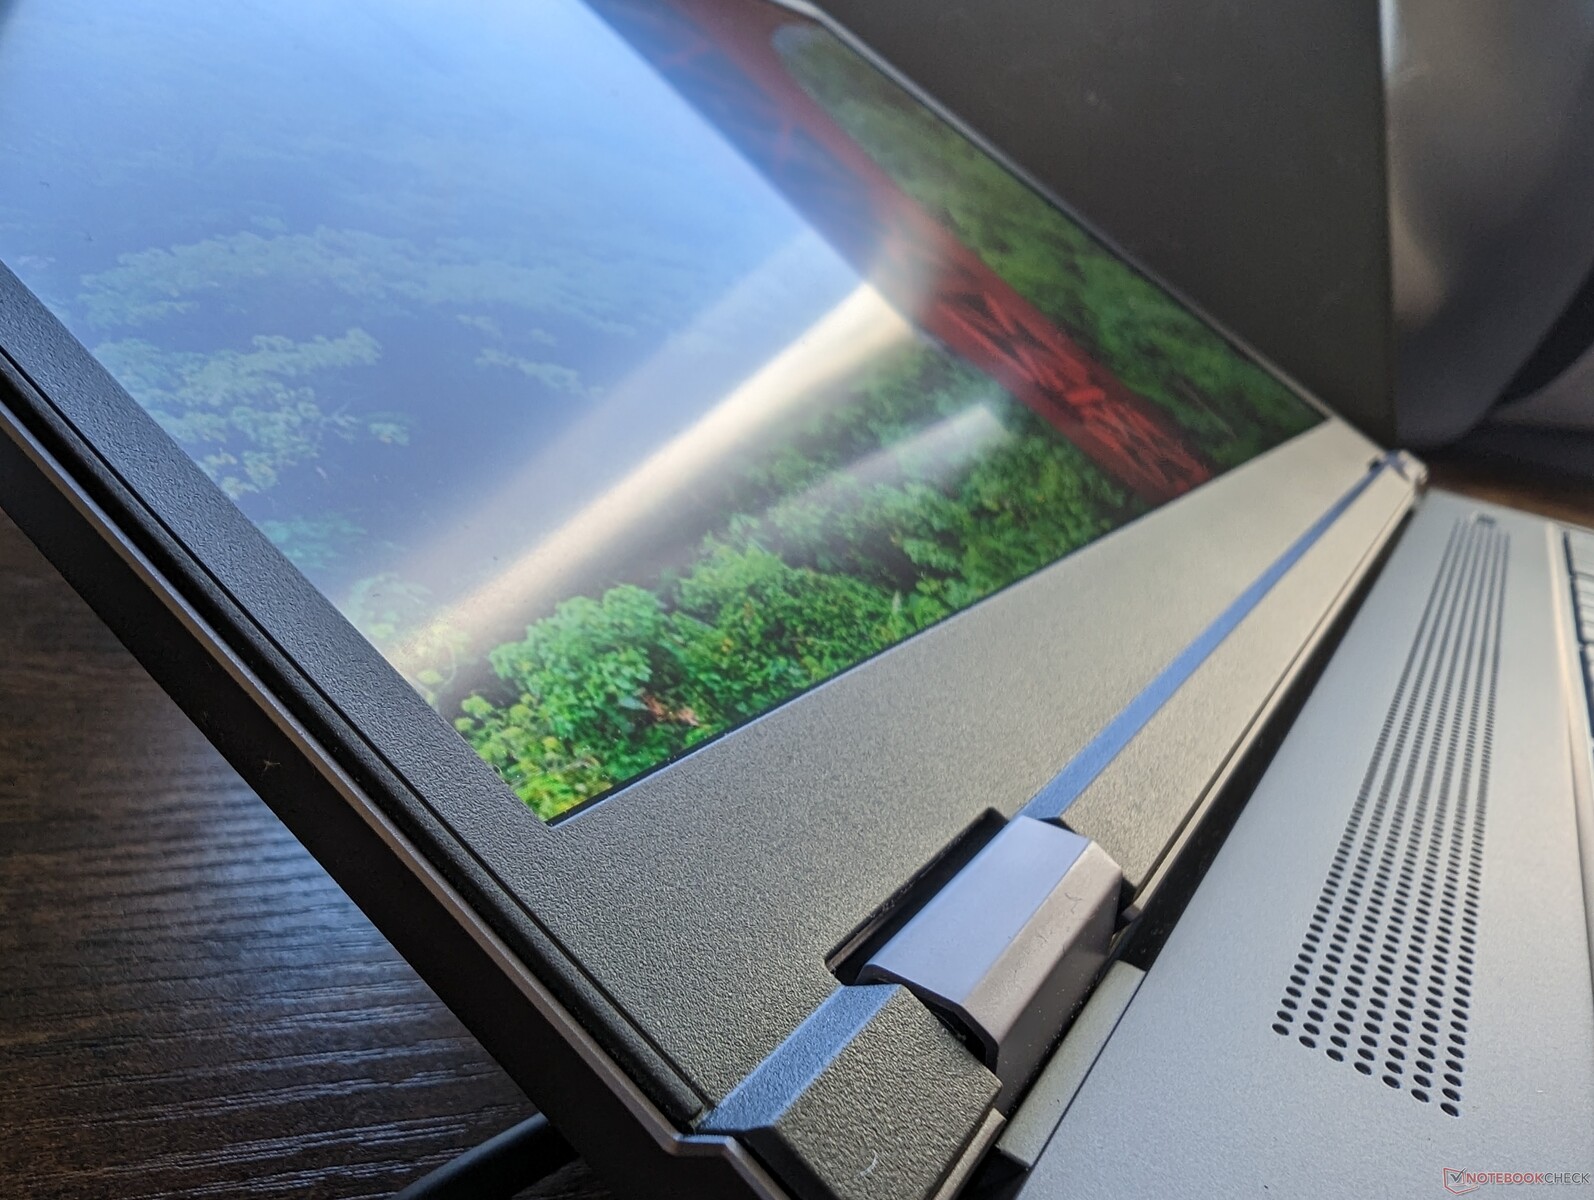
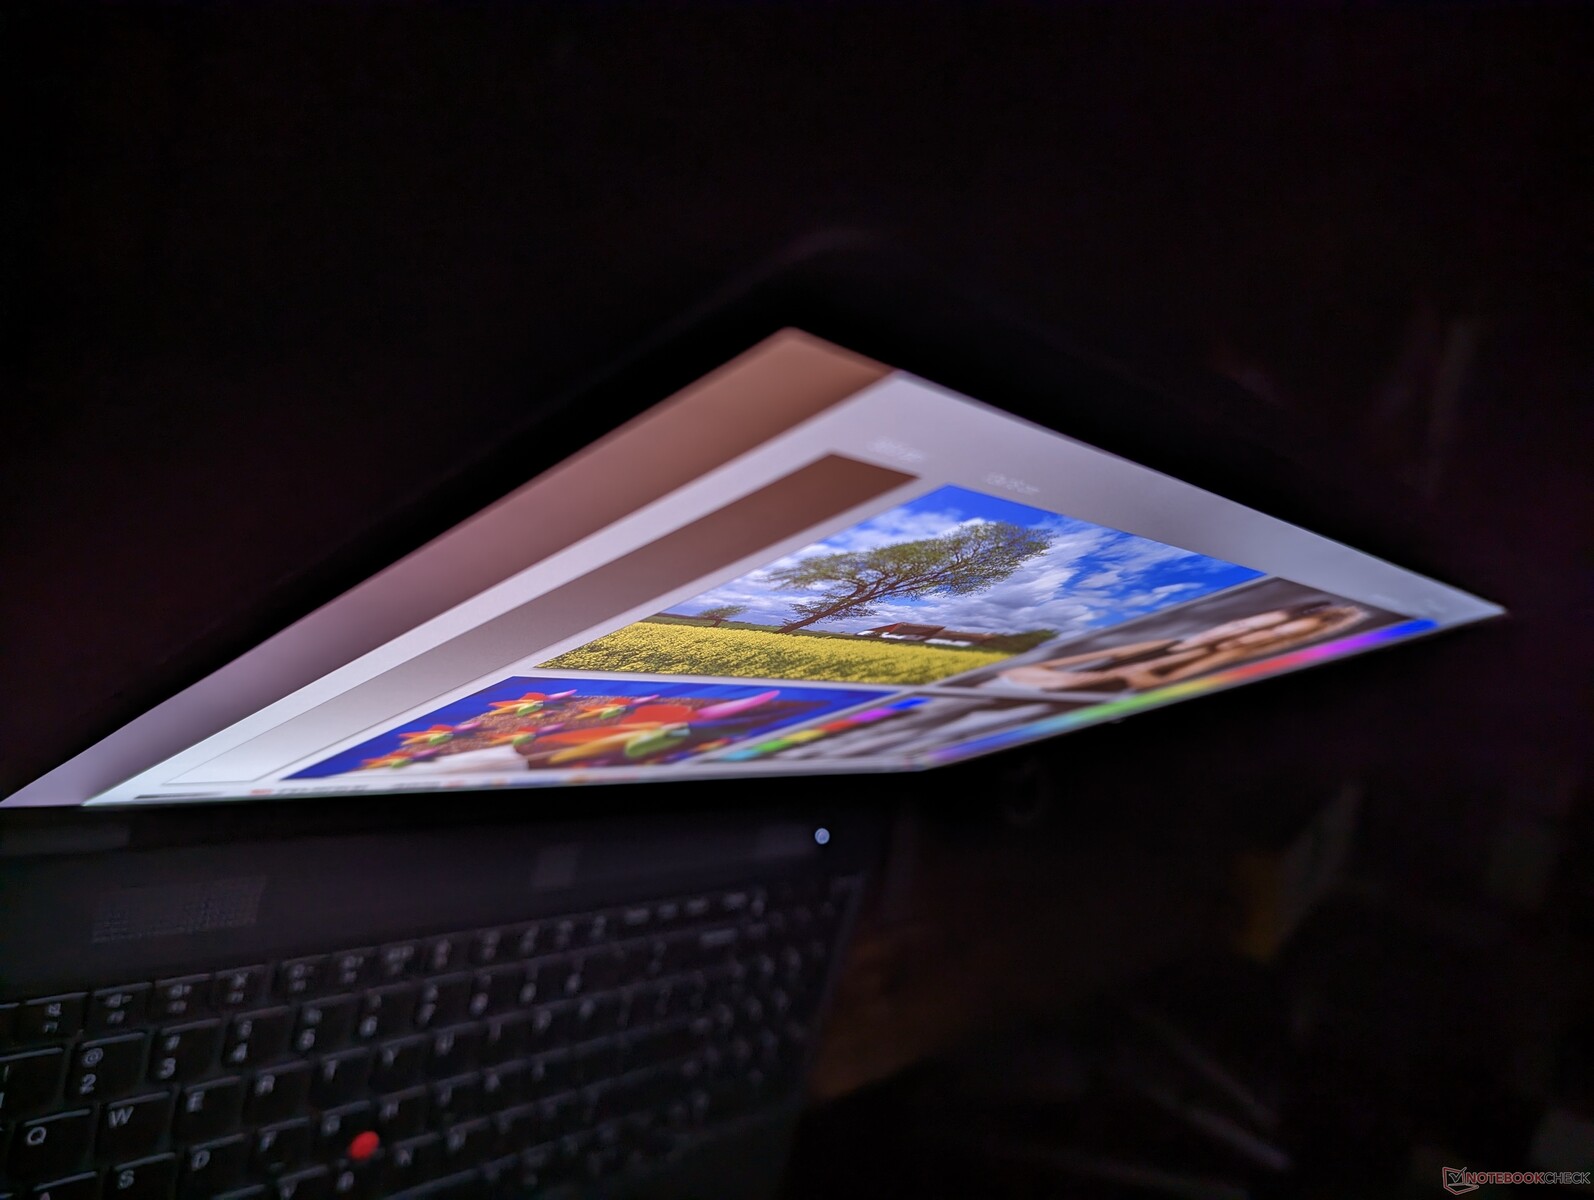
Visa
Lenovo erbjuder fyra olika 60 Hz-skärmalternativ som alla är Pantone-fabrikskalibrerade med DC-dimning. Våra mätningar nedan återspeglar endast det fetstilade alternativet medan vår andra enhet med RTX A2000 GPU är utrustad med 1600p-alternativet.
- 1920 x 1200, utan beröring, IPS, 300 nits, matt, 100 % sRGB
- 2560 x 1600, IPS, 400-nits, matt, 100 % sRGB, utan beröring, IPS, 400-nits, matt, 100 % sRGB
- 3840 x 2400, IPS utan beröring, 600-nits, matt, 100 % AdobeRGB
- 3840 x 2400, touch, OLED, 400-nits, blank, 100 % DCI-P3
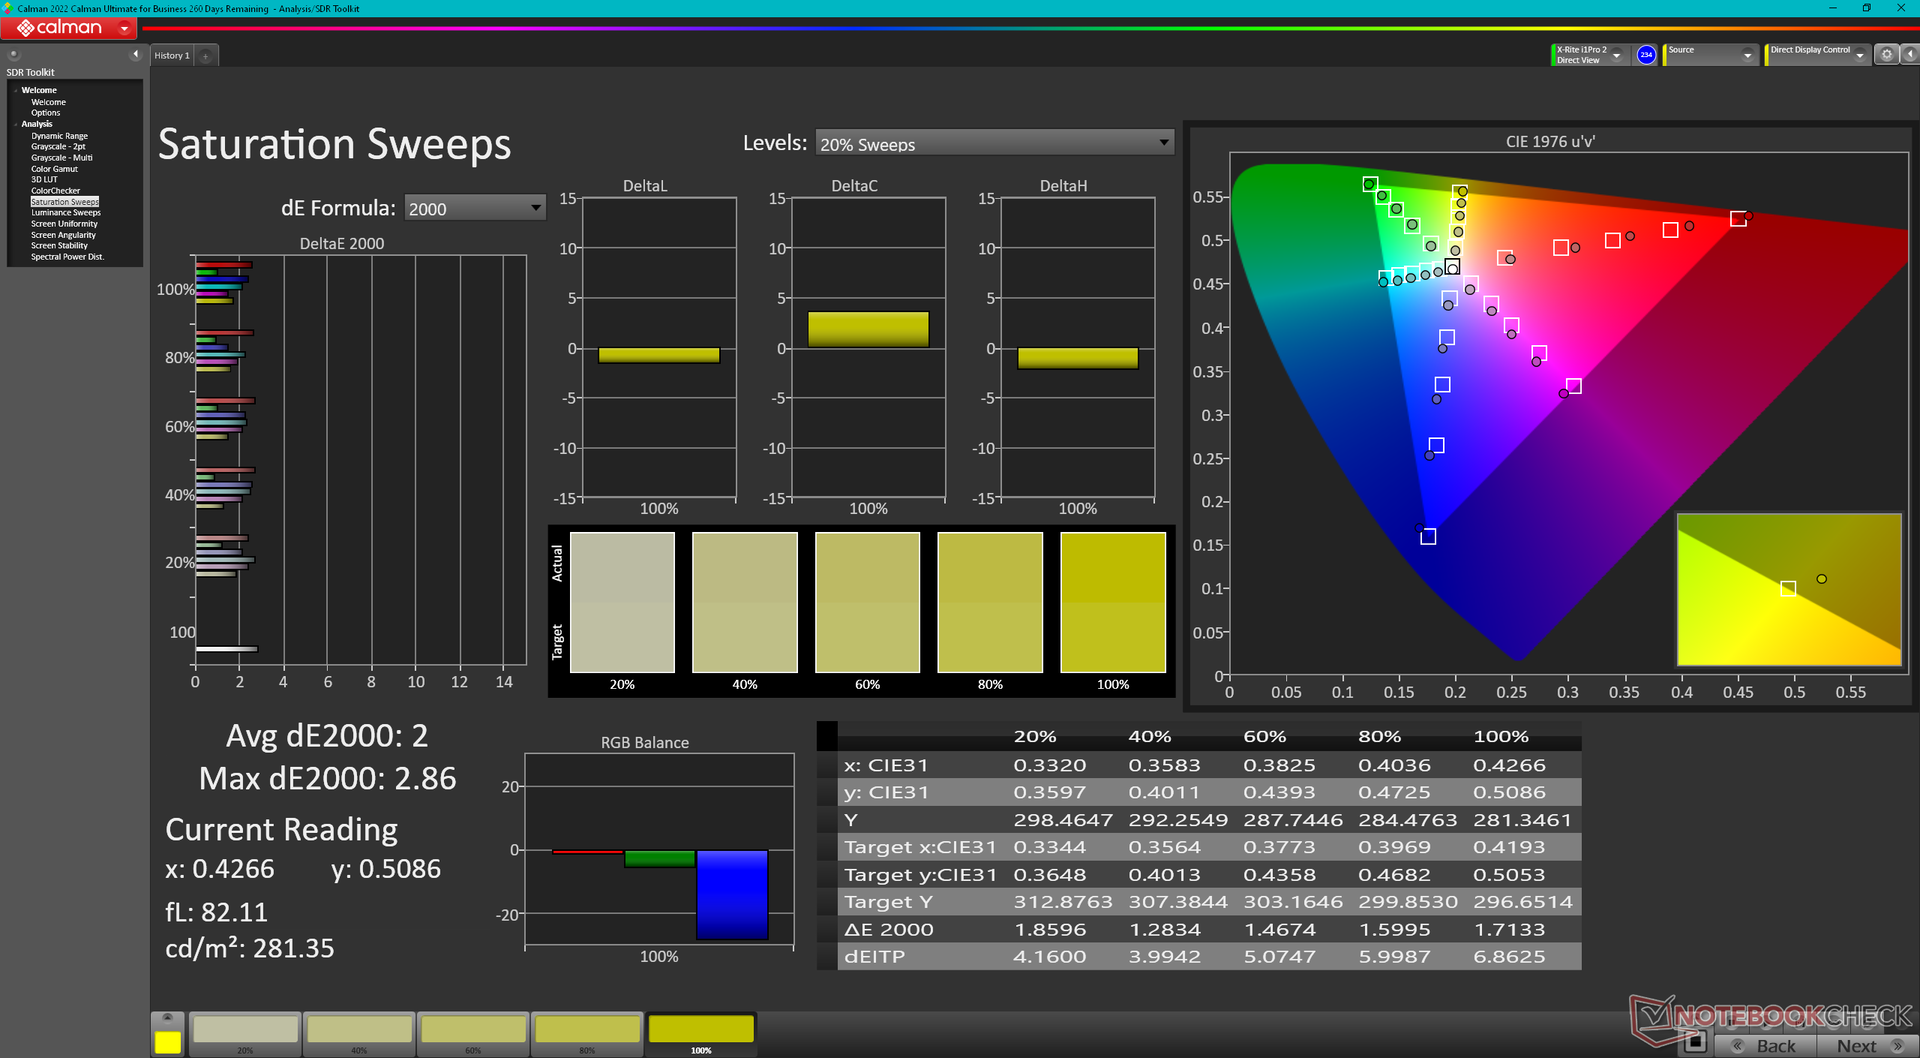
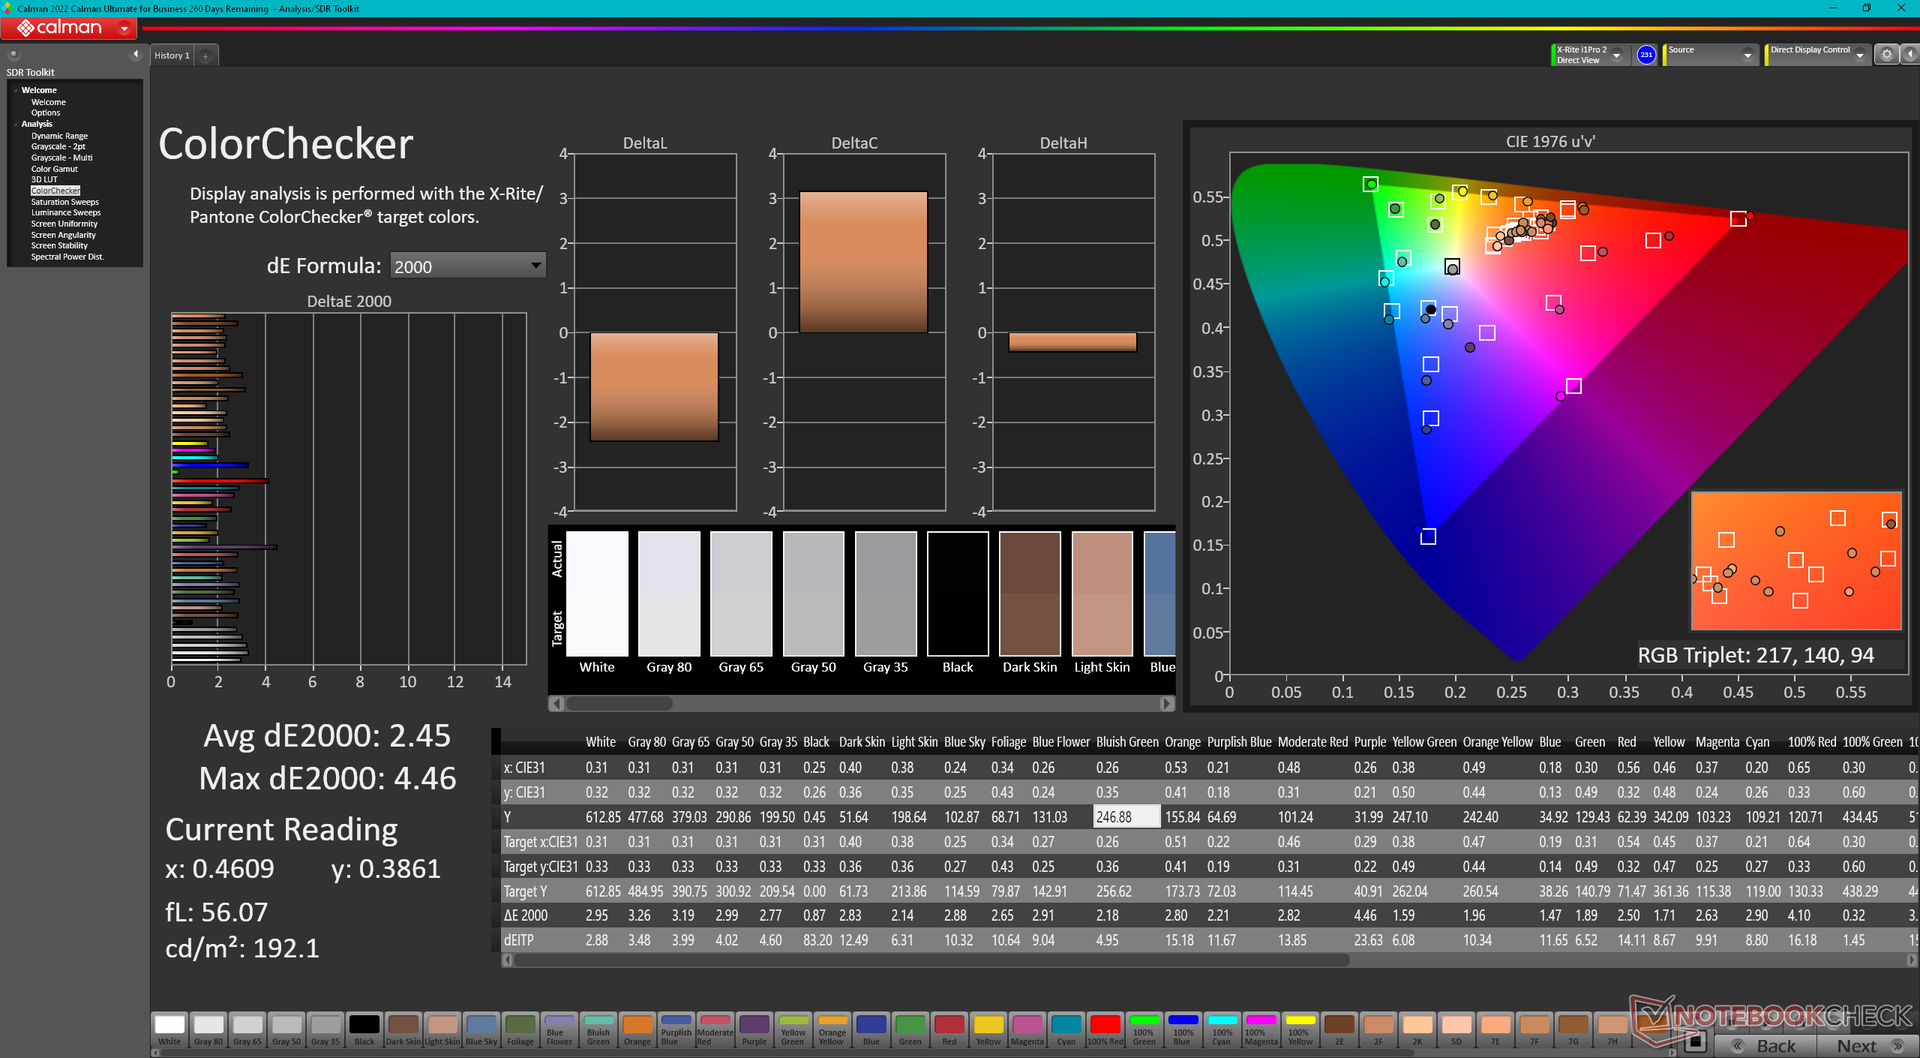
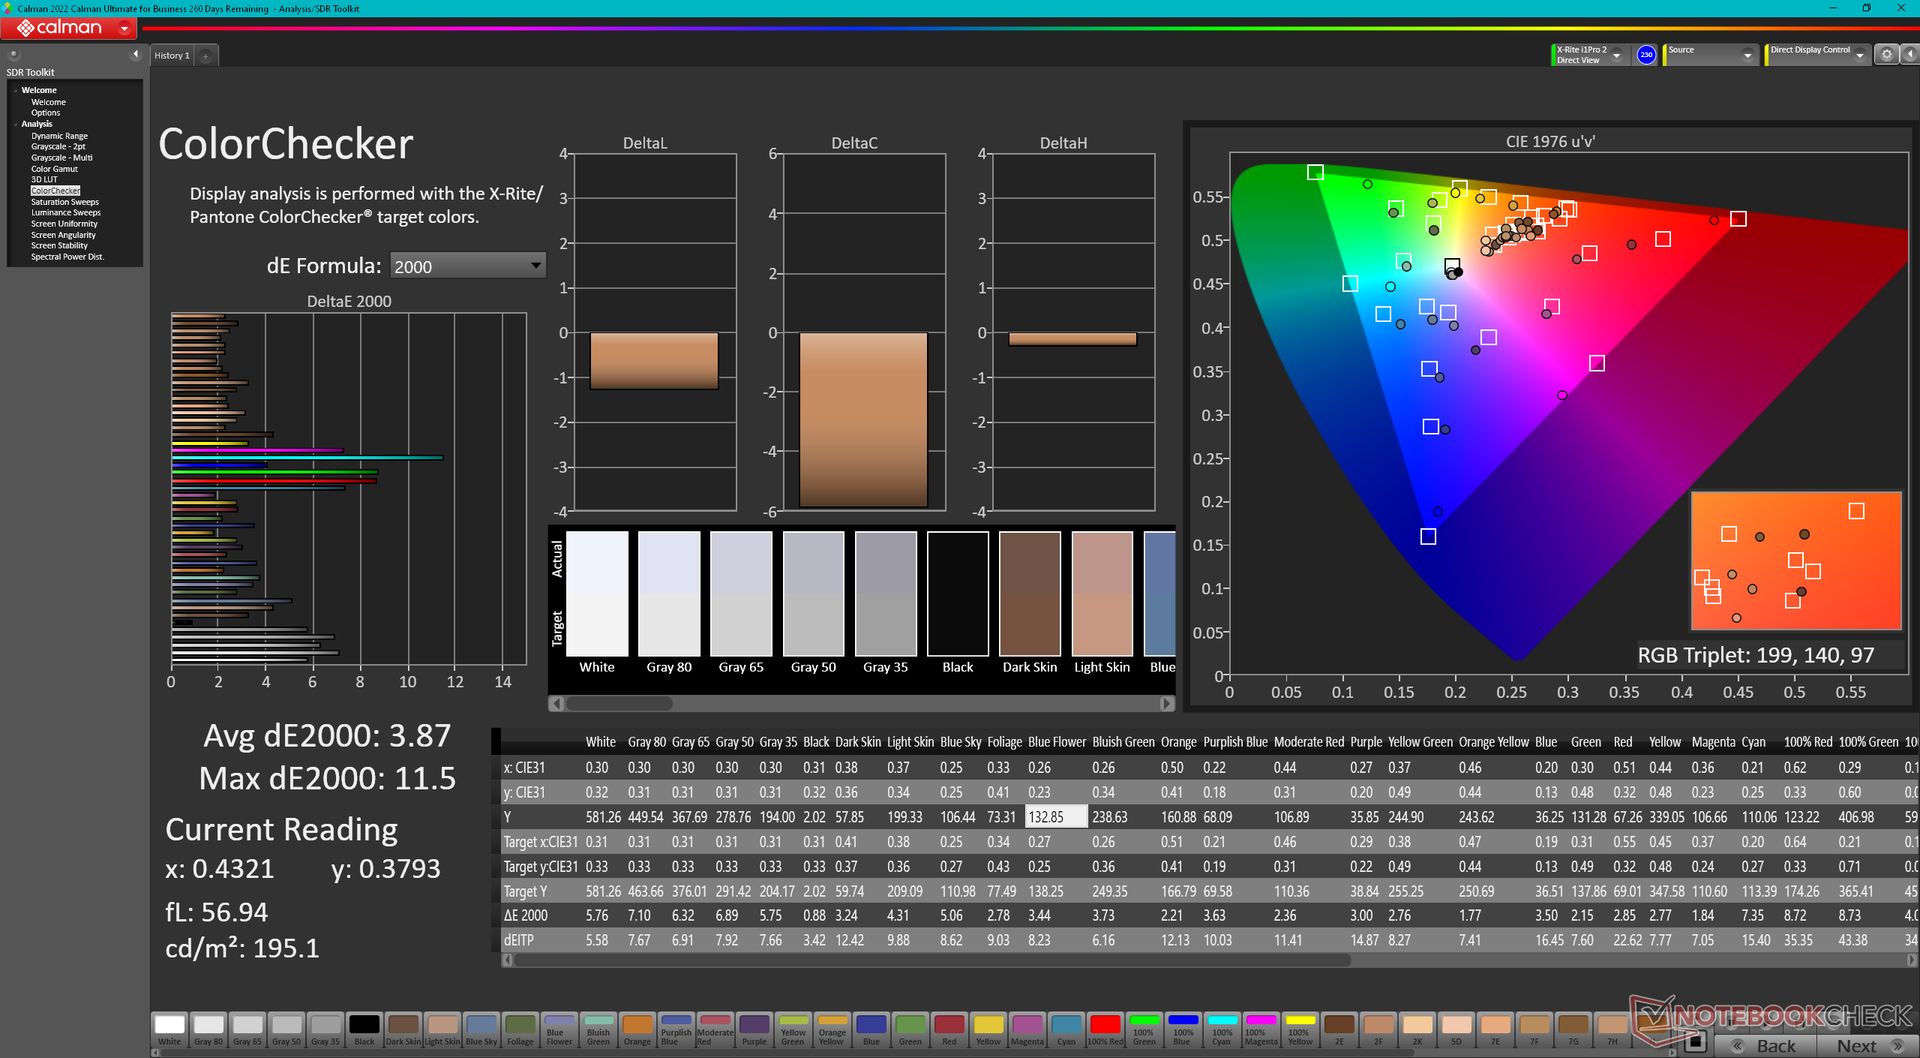
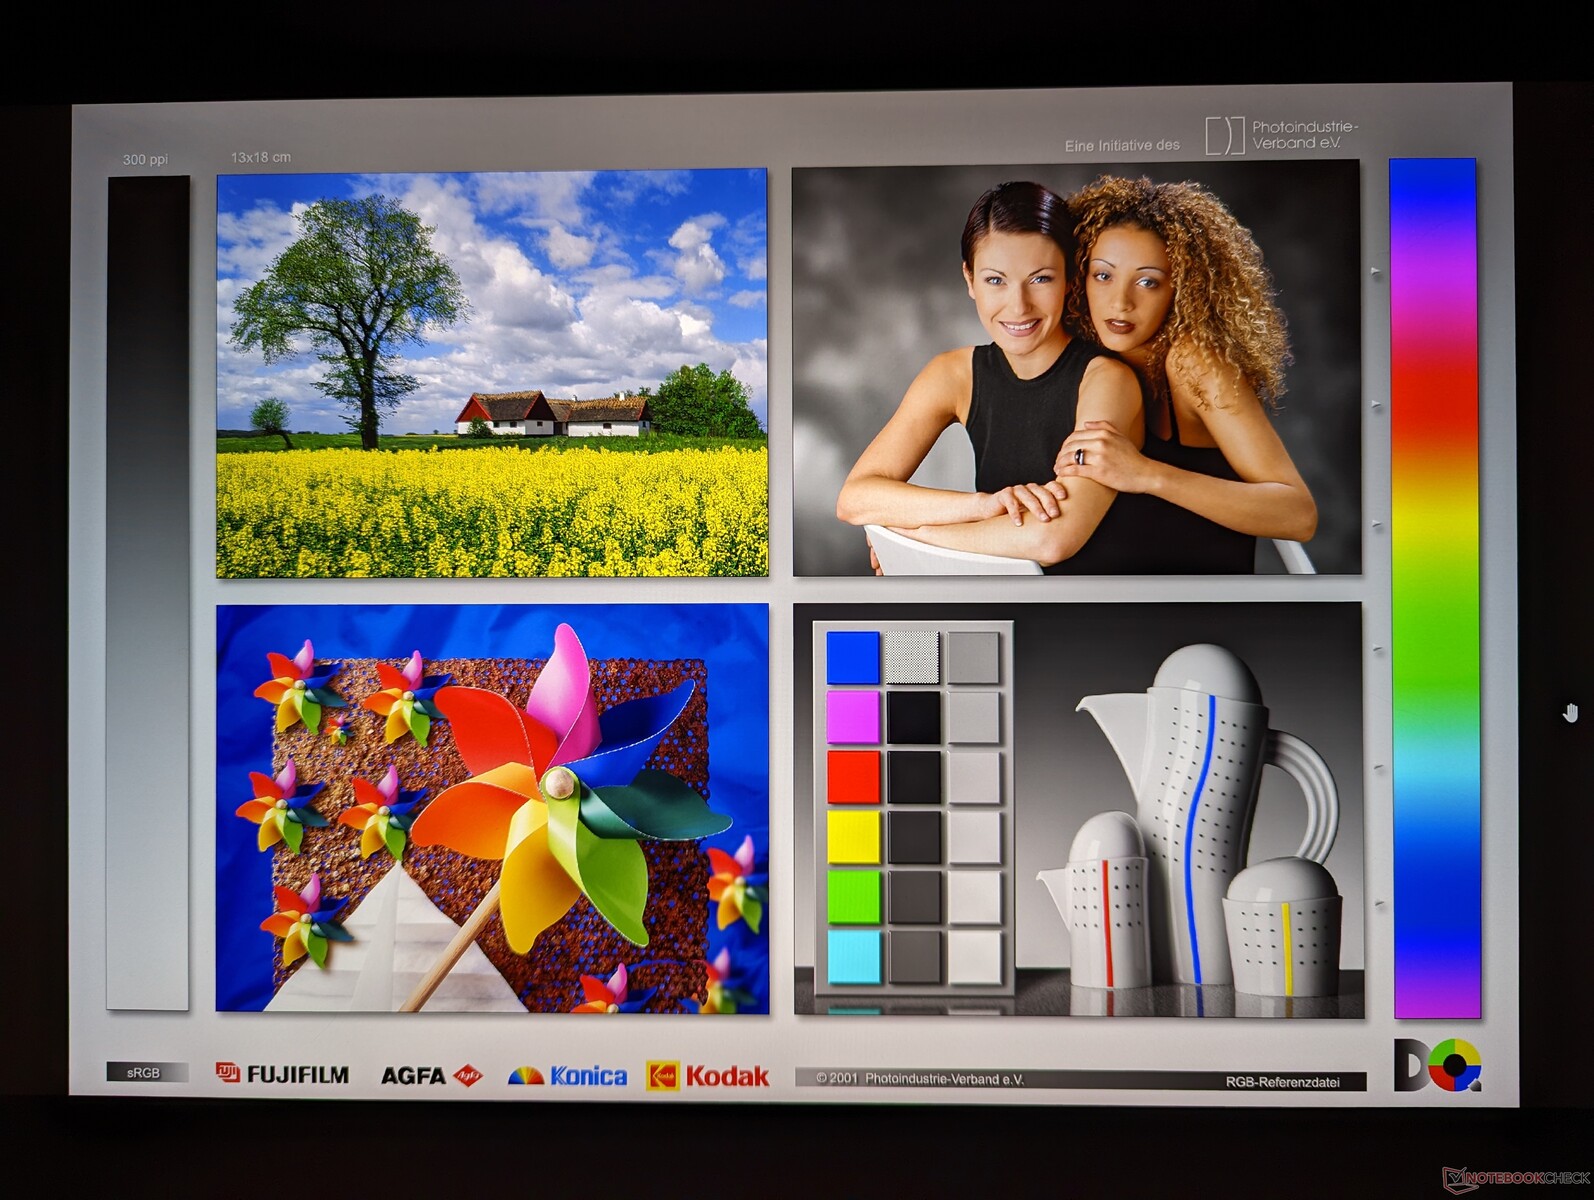
Våra oberoende mätningar kan bekräfta den fullständiga AdobeRGB-täckningen och ljusstyrkan på 600 nit. Ljusfördelningen är dock endast genomsnittlig trots målet på 600 nit. Den övre vänstra kvadranten på vår skärm är till exempel 29 procent ljusare än den nedre högra kvadranten (642 nits jämfört med 497 nits). Att välja OLED-panelen skulle förbättra ljusfördelningen, men vi förväntade oss bättre från vår IPS-panel med tanke på priset på ThinkPad P1 G1.
Det är värt att notera att Lenovo använder samma LP160UQ1-SPB1 IPS-panel på ThinkPad P1 G1 för sina andra 16-tums ThinkPad-modeller, inklusive ThinkPad P1 G1.ThinkPad P1 G4 ochThinkPad X1 Extreme G4.


| |||||||||||||||||||||||||
Distribution av ljusstyrkan: 77 %
Mitt på batteriet: 601.9 cd/m²
Kontrast: 1281:1 (Svärta: 0.47 cd/m²)
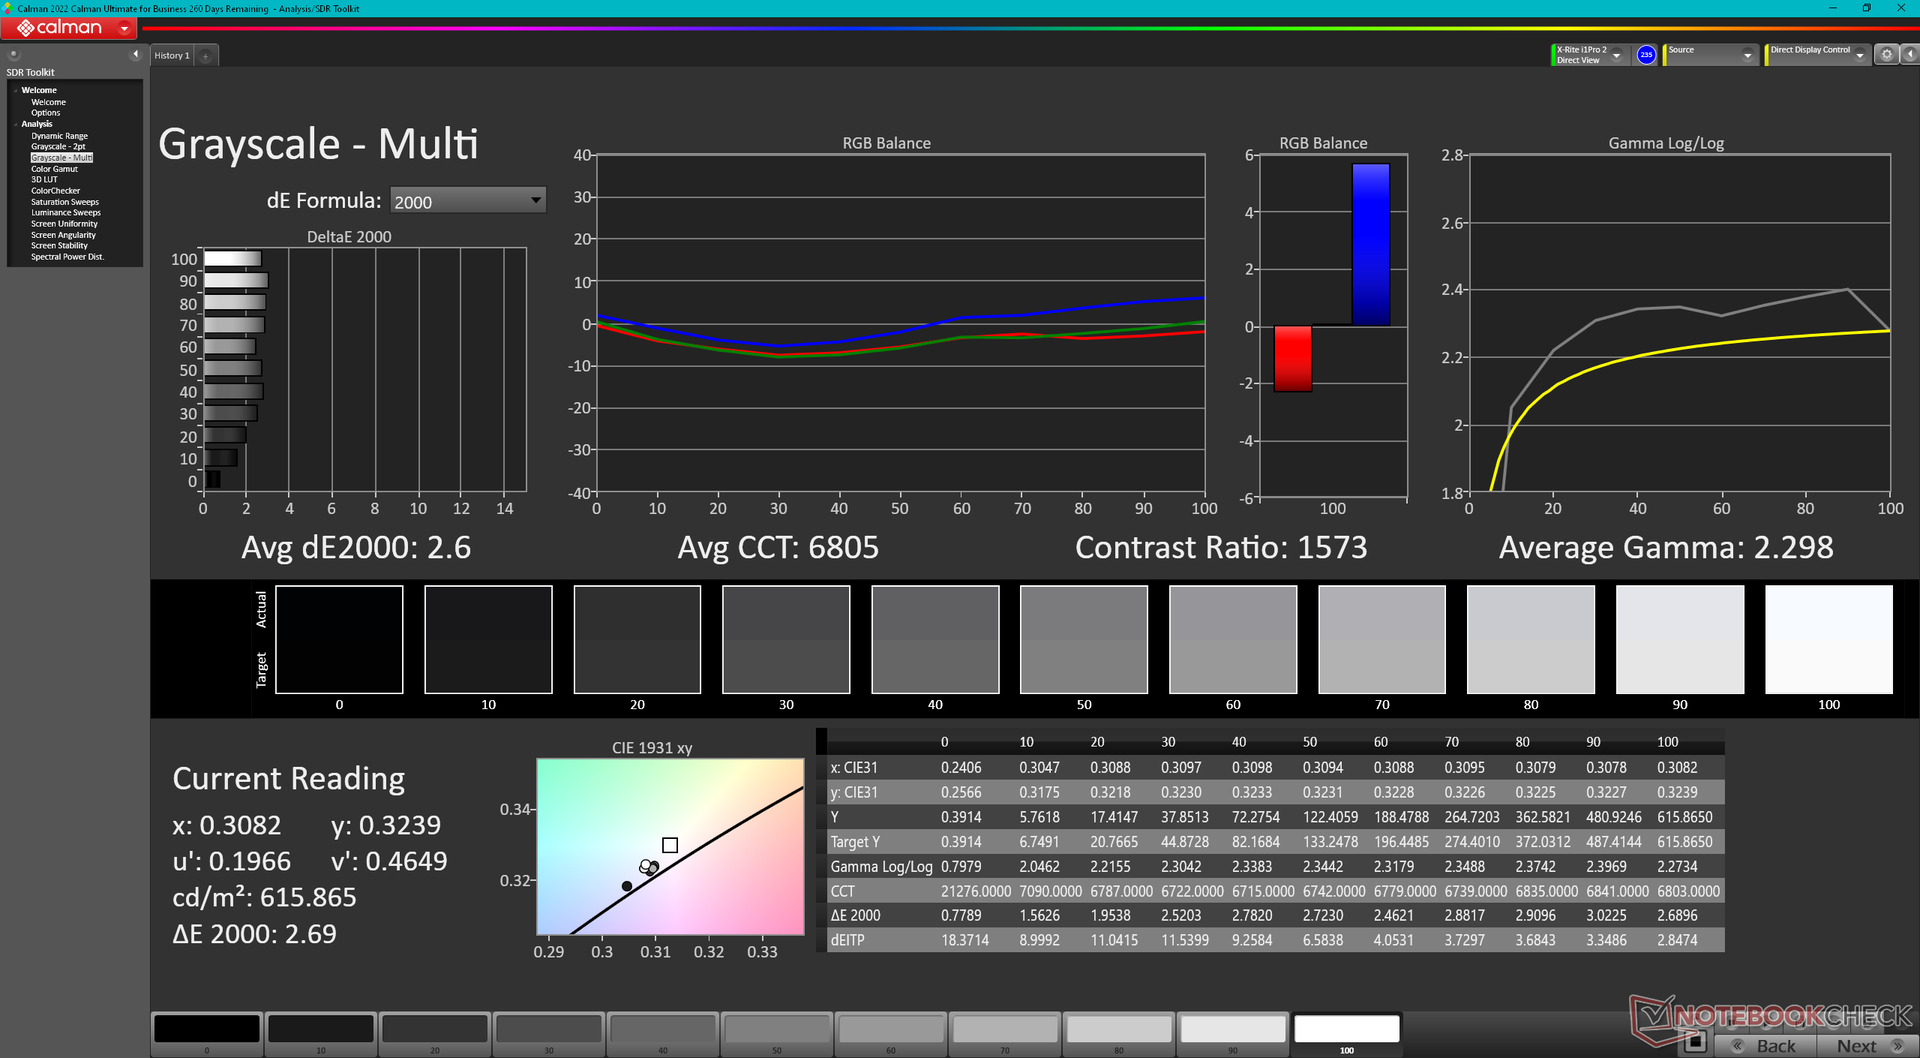
ΔE ColorChecker Calman: 2.45 | ∀{0.5-29.43 Ø4.71}
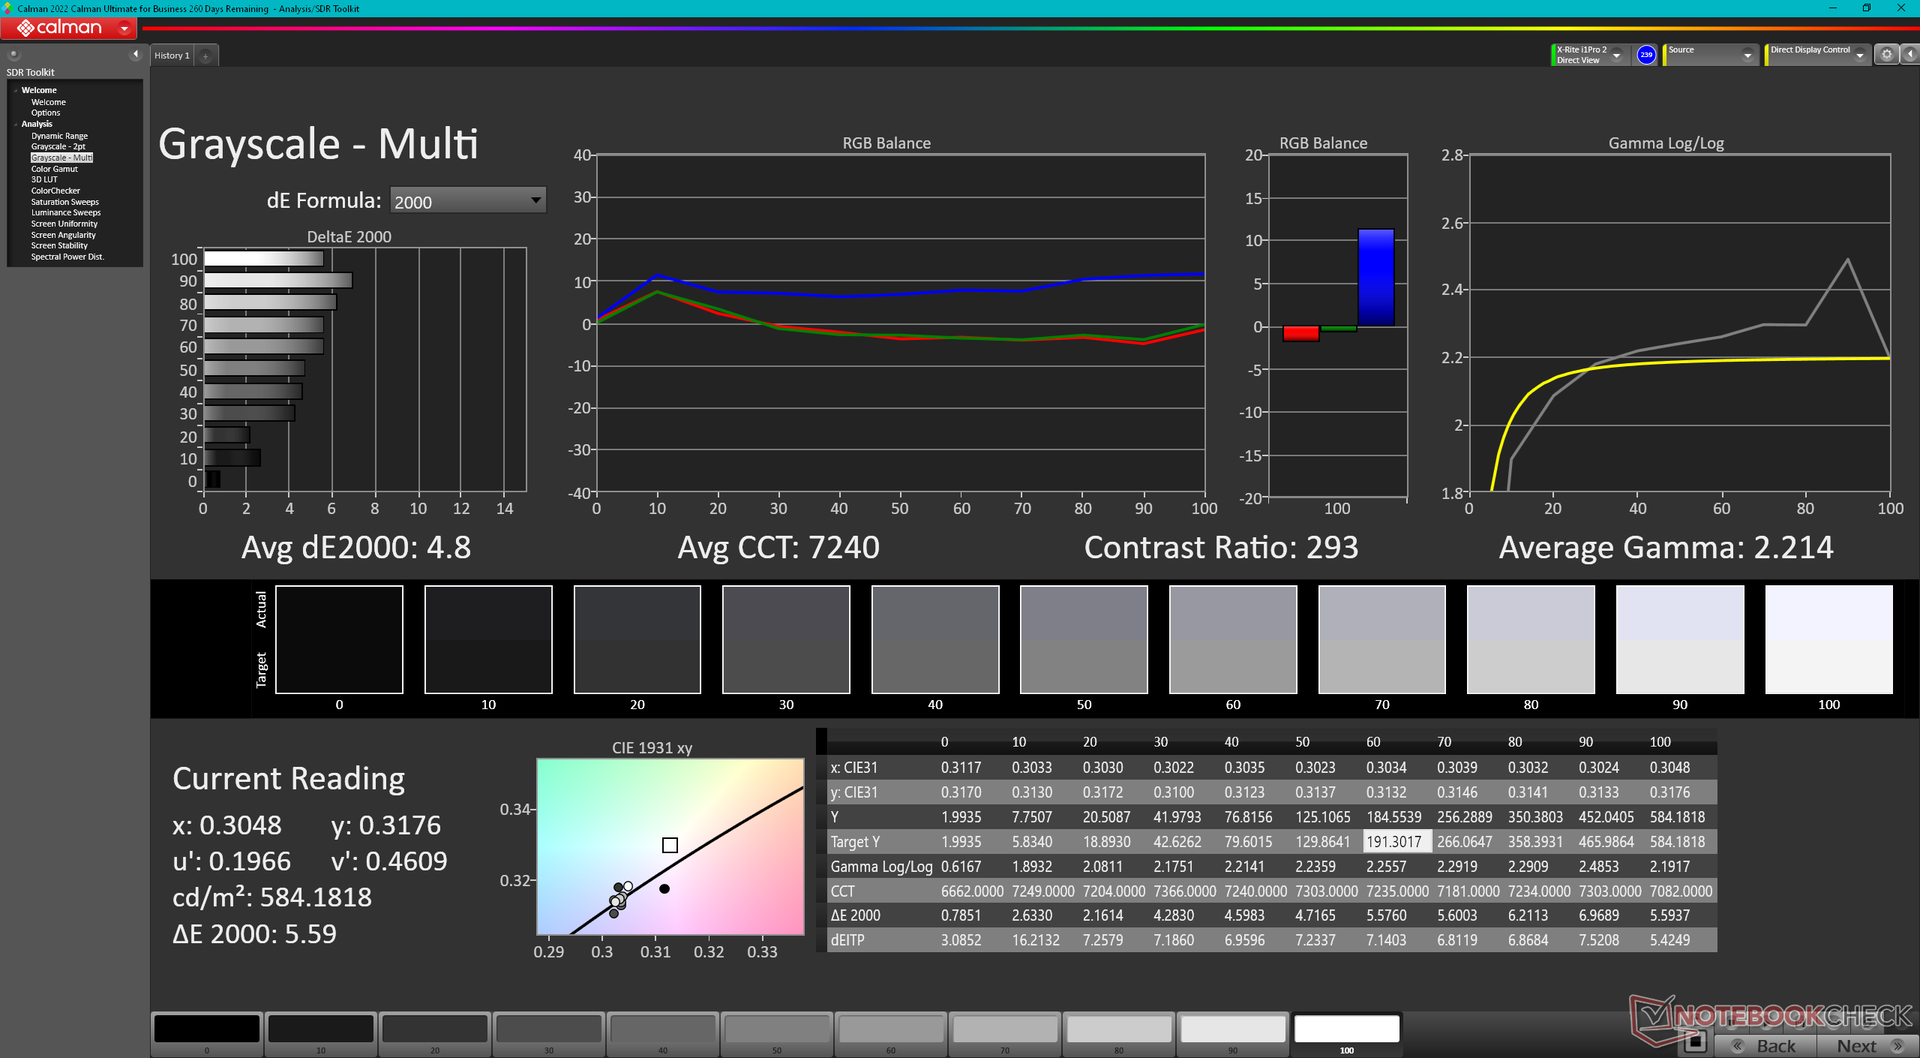
ΔE Greyscale Calman: 2.6 | ∀{0.09-98 Ø4.96}
95.9% AdobeRGB 1998 (Argyll 3D)
98.9% sRGB (Argyll 3D)
82.9% Display P3 (Argyll 3D)
Gamma: 2.3
CCT: 6805 K
| Lenovo ThinkPad P16 G1 RTX A5500 LP160UQ1-SPB1, IPS, 3840x2400, 16" | Asus ProArt StudioBook 16 W7600H5A-2BL2 ATNA60YV02-0, OLED, 3840x2400, 16" | Dell Precision 7000 7670 Performance Samsung 160YV03, OLED, 3840x2400, 16" | Lenovo ThinkPad P16 G1 21D6001DMB NE160QDM-N63 , IPS LED, 2560x1600, 16" | MSI CreatorPro Z16P B12UKST B160QAN02.N, IPS, 2560x1600, 16" | HP ZBook Studio 16 G9 62U04EA BOE0A52, IPS, 3840x2400, 16" | |
|---|---|---|---|---|---|---|
| Display | 8% | 8% | -12% | 3% | 3% | |
| Display P3 Coverage (%) | 82.9 | 99.9 21% | 99.9 21% | 71.5 -14% | 97.6 18% | 97.5 18% |
| sRGB Coverage (%) | 98.9 | 100 1% | 100 1% | 100 1% | 99.9 1% | 99.9 1% |
| AdobeRGB 1998 Coverage (%) | 95.9 | 98.6 3% | 98.1 2% | 73.3 -24% | 87.4 -9% | 86.3 -10% |
| Response Times | 96% | 96% | 23% | 76% | 75% | |
| Response Time Grey 50% / Grey 80% * (ms) | 45.6 ? | 2 ? 96% | 1.84 ? 96% | 37.7 ? 17% | 12.8 ? 72% | 15.3 ? 66% |
| Response Time Black / White * (ms) | 36.8 ? | 2 ? 95% | 1.92 ? 95% | 26.3 ? 29% | 7.4 ? 80% | 6.1 ? 83% |
| PWM Frequency (Hz) | 240 ? | 59.52 ? | ||||
| Screen | -2% | -36% | -4% | 9% | 16% | |
| Brightness middle (cd/m²) | 601.9 | 353 -41% | 325.2 -46% | 424 -30% | 407 -32% | 554 -8% |
| Brightness (cd/m²) | 569 | 360 -37% | 328 -42% | 398 -30% | 388 -32% | 516 -9% |
| Brightness Distribution (%) | 77 | 96 25% | 97 26% | 90 17% | 88 14% | 84 9% |
| Black Level * (cd/m²) | 0.47 | 0.24 49% | 0.36 23% | 0.47 -0% | ||
| Contrast (:1) | 1281 | 1767 38% | 1131 -12% | 1179 -8% | ||
| Colorchecker dE 2000 * | 2.45 | 2.45 -0% | 4.59 -87% | 2.6 -6% | 1.3 47% | 1 59% |
| Colorchecker dE 2000 max. * | 4.46 | 3.75 16% | 7.65 -72% | 4.9 -10% | 2.5 44% | 2.4 46% |
| Greyscale dE 2000 * | 2.6 | 1.88 28% | 2.5 4% | 4.1 -58% | 2.1 19% | 1.6 38% |
| Gamma | 2.3 96% | 2.31 95% | 2.1 105% | 2.13 103% | 2.26 97% | 2.29 96% |
| CCT | 6805 96% | 6441 101% | 6541 99% | 7252 90% | 6437 101% | 6458 101% |
| Colorchecker dE 2000 calibrated * | 2.77 | 0.8 | 0.7 | 0.6 | ||
| Totalt genomsnitt (program/inställningar) | 34% /
19% | 23% /
-0% | 2% /
-2% | 29% /
18% | 31% /
22% |
* ... mindre är bättre
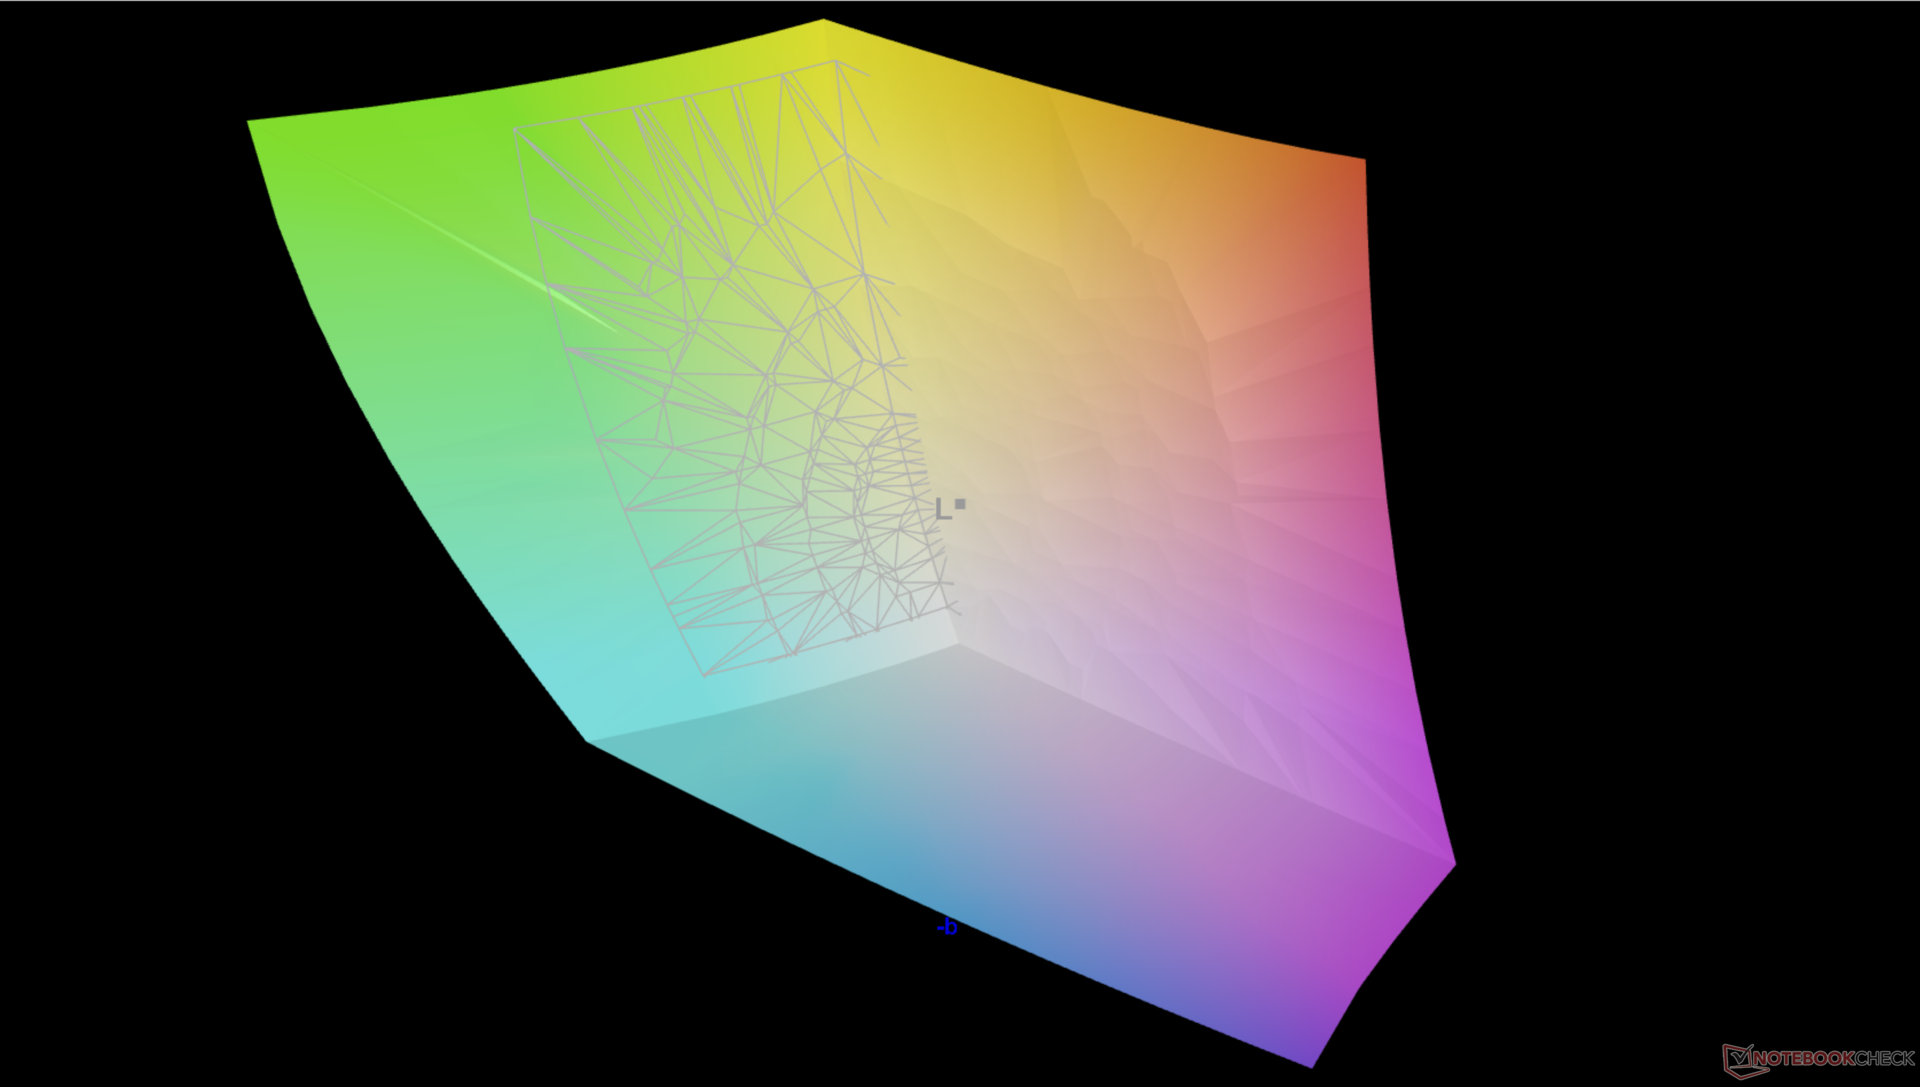
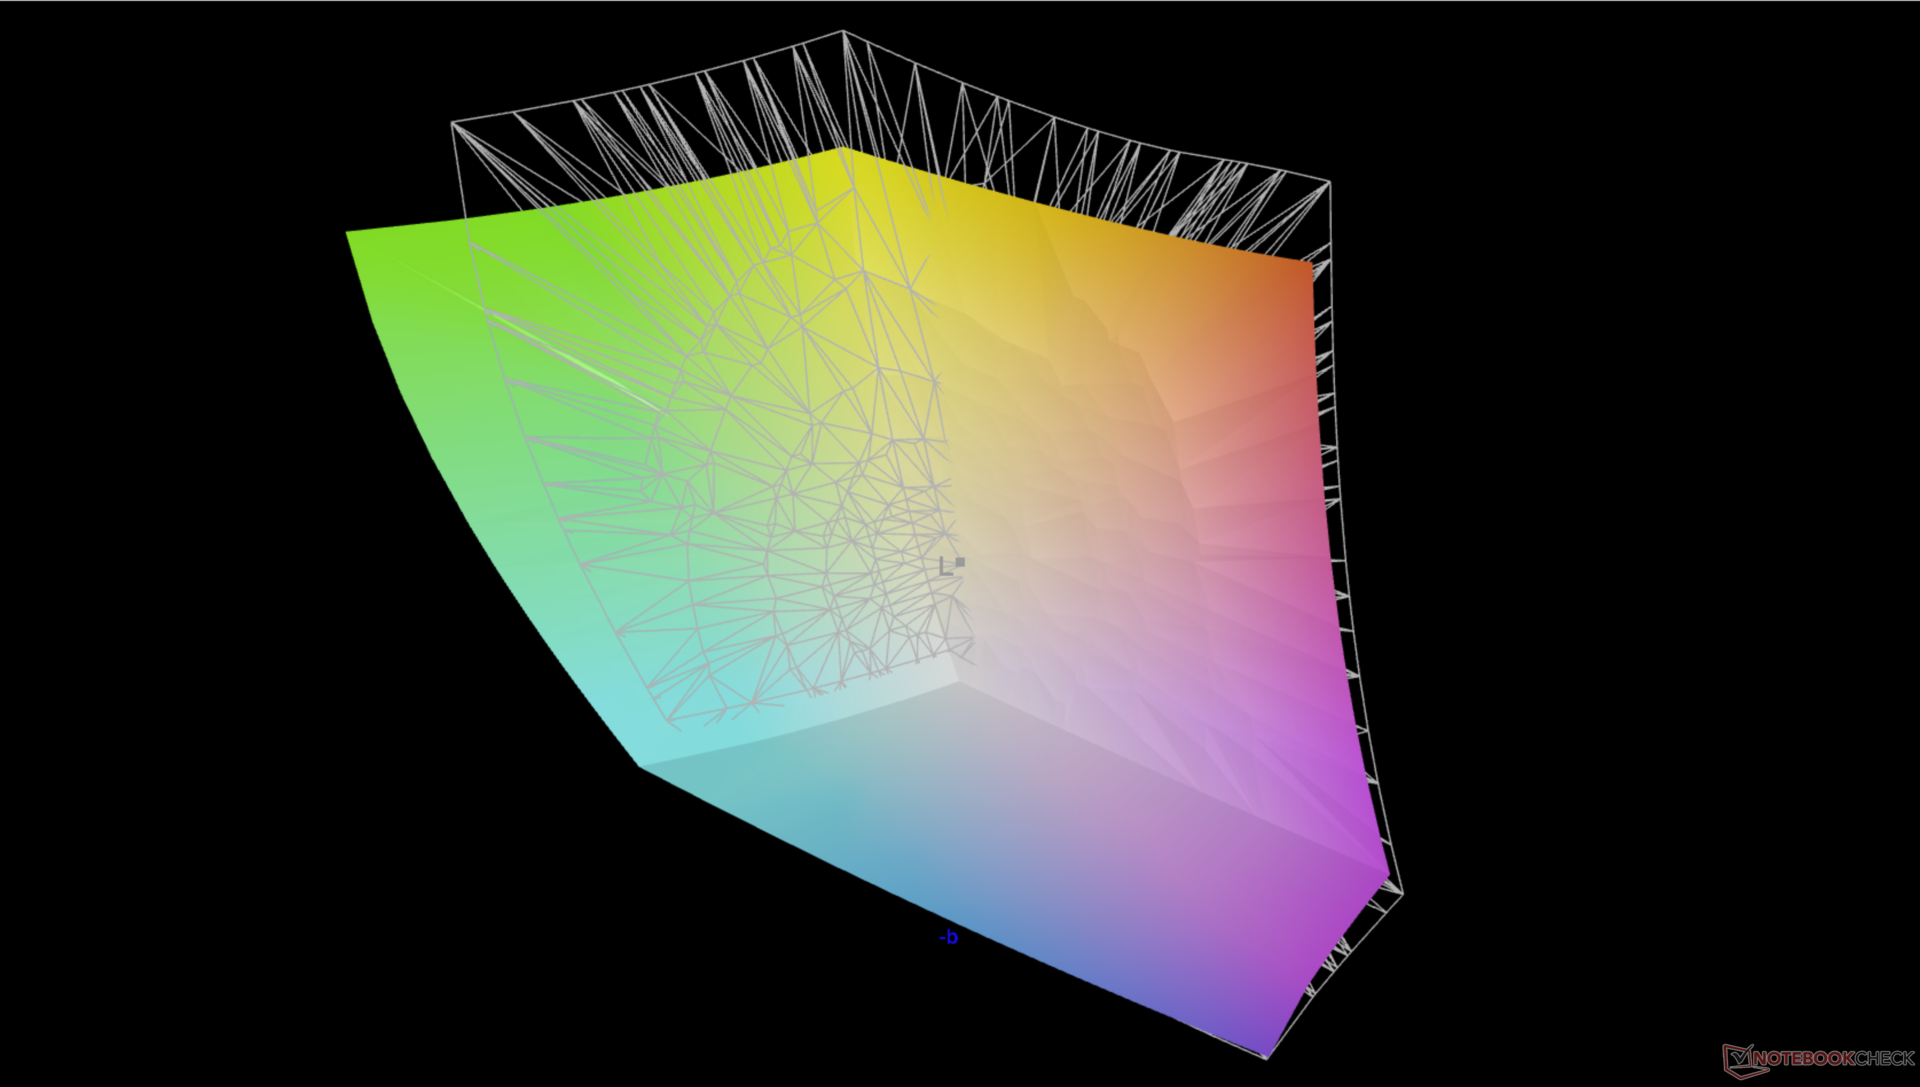
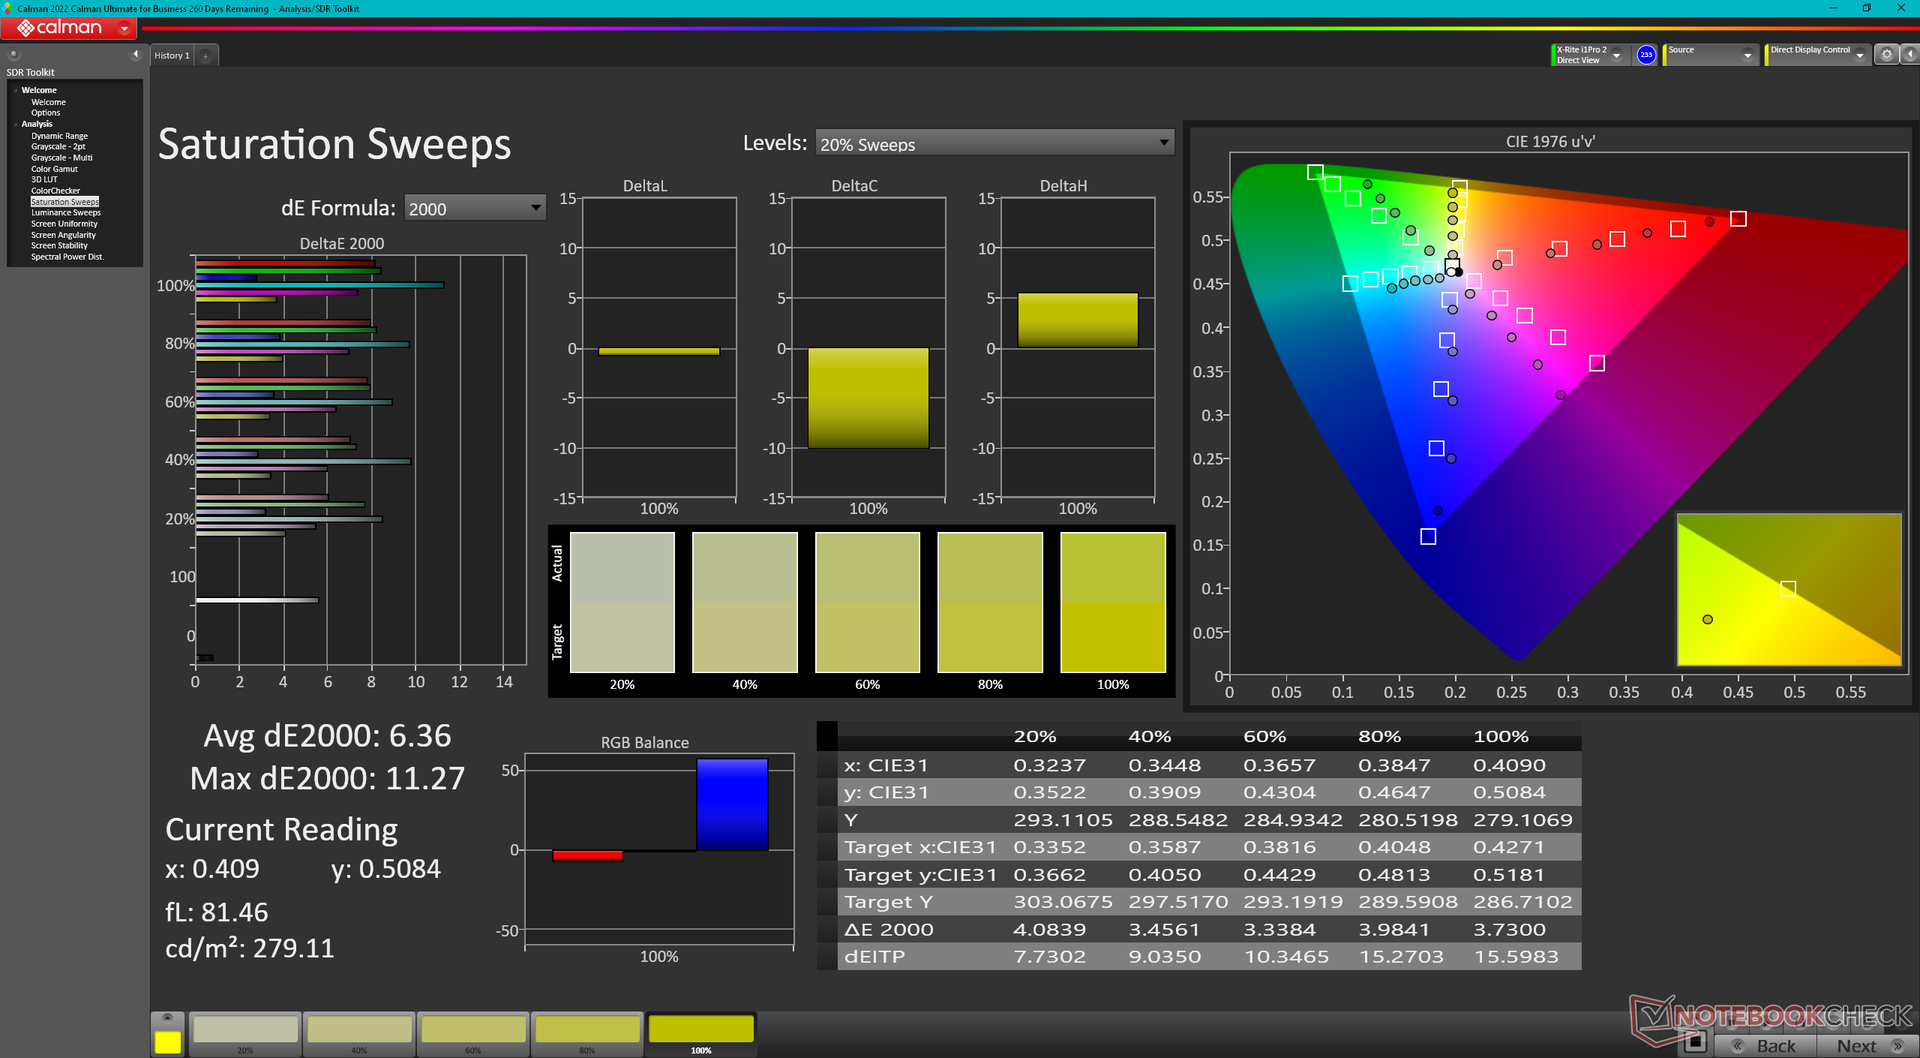
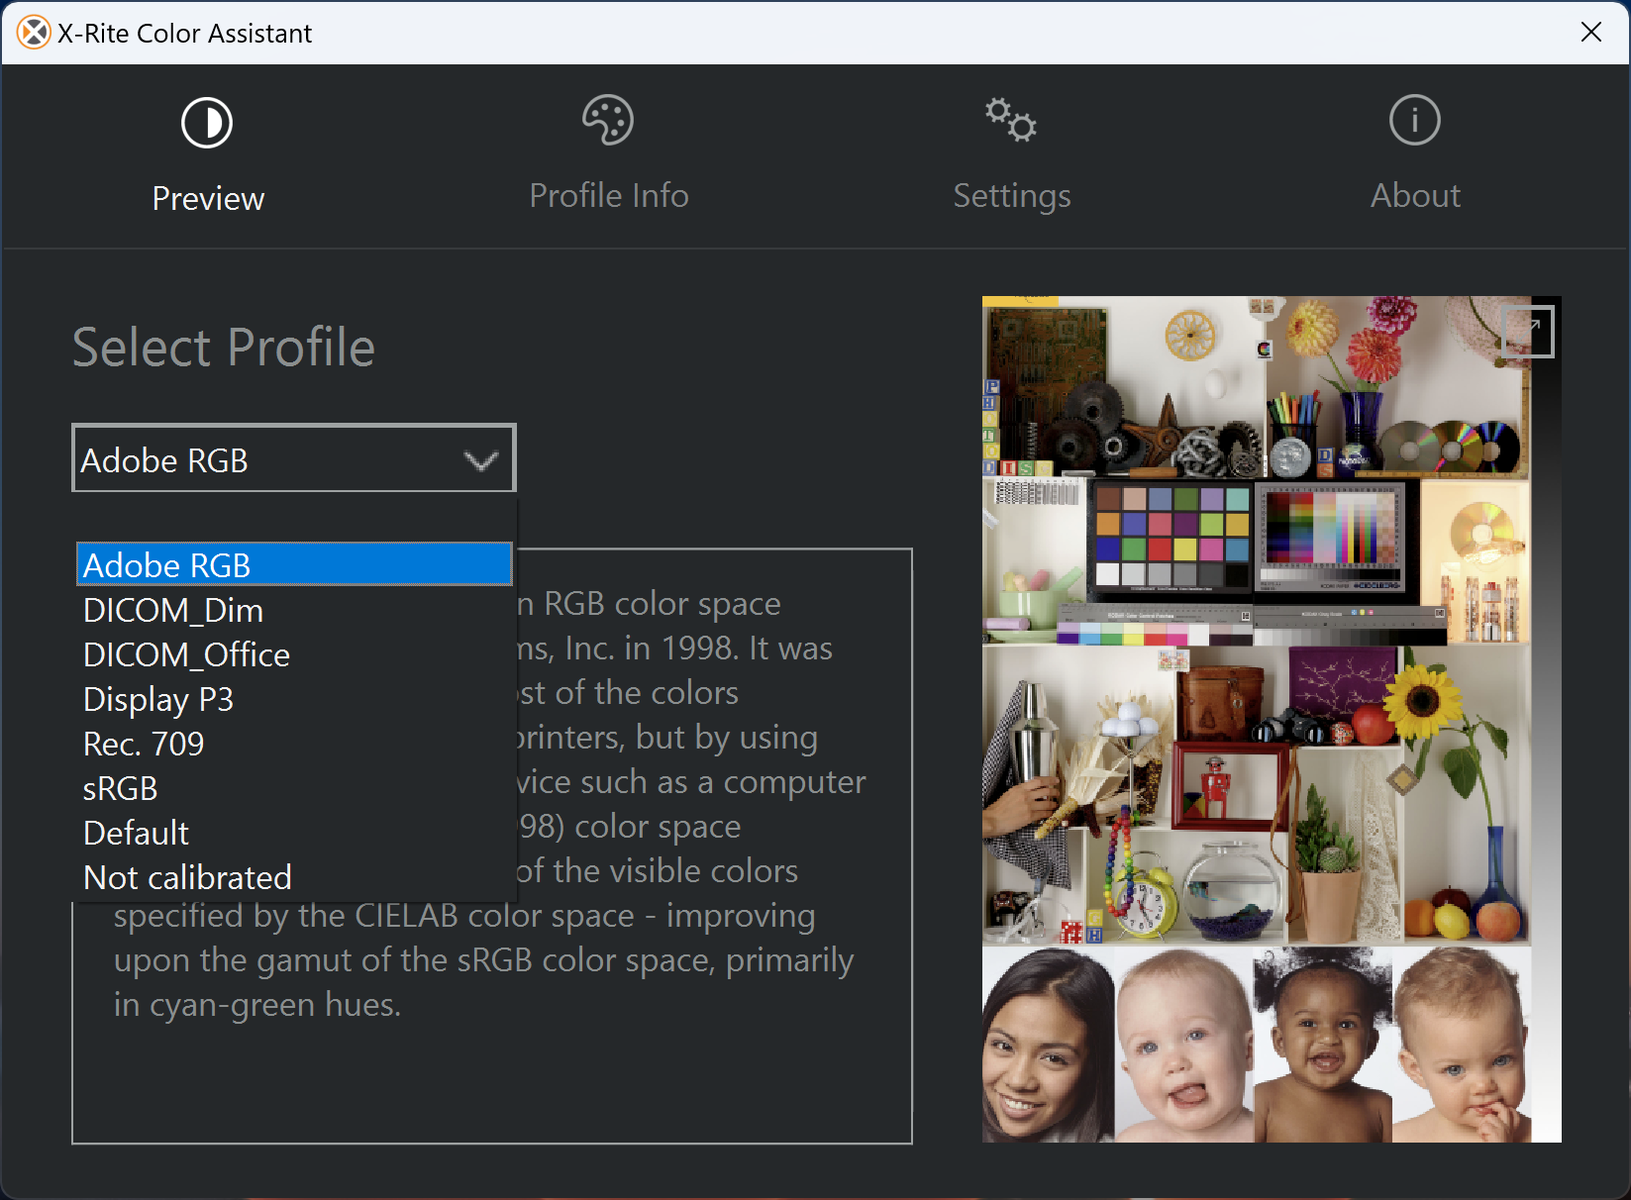
Färgprofilen kan ändras via den förinstallerade programvaran X-Rite Color Assistant. Den verkar vara felkopplad för tillfället eftersom färgerna inte är så exakta som de borde vara out-of-the-box trots att vår panel täcker hela AdobeRGB. När den är inställd på sRGB-läge skulle till exempel de genomsnittliga värdena för gråskala och färgdeltaE vara bara 2,6 respektive 2,45, jämfört med 4,8 och 3,87 när den är inställd på AdobeRGB-läge.
Visa svarstider
| ↔ Svarstid svart till vitt | ||
|---|---|---|
| 36.8 ms ... stiga ↗ och falla ↘ kombinerat | ↗ 19.6 ms stiga | 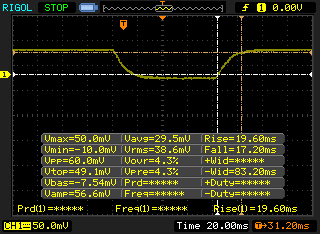 |
| ↘ 17.2 ms hösten | ||
| Skärmen visar långsamma svarsfrekvenser i våra tester och kommer att vara otillfredsställande för spelare. I jämförelse sträcker sig alla testade enheter från 0.1 (minst) till 240 (maximalt) ms. » 95 % av alla enheter är bättre. Detta innebär att den uppmätta svarstiden är sämre än genomsnittet av alla testade enheter (19.8 ms). | ||
| ↔ Svarstid 50 % grått till 80 % grått | ||
| 45.6 ms ... stiga ↗ och falla ↘ kombinerat | ↗ 21.2 ms stiga | 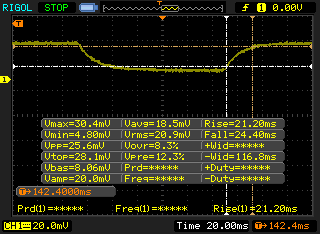 |
| ↘ 24.4 ms hösten | ||
| Skärmen visar långsamma svarsfrekvenser i våra tester och kommer att vara otillfredsställande för spelare. I jämförelse sträcker sig alla testade enheter från 0.165 (minst) till 636 (maximalt) ms. » 78 % av alla enheter är bättre. Detta innebär att den uppmätta svarstiden är sämre än genomsnittet av alla testade enheter (31 ms). | ||
Skärmflimmer / PWM (Puls-Width Modulation)
| Skärmflimmer / PWM upptäcktes inte |  | ||
Som jämförelse: 52 % av alla testade enheter använder inte PWM för att dämpa skärmen. Om PWM upptäcktes mättes ett medelvärde av 7754 (minst: 5 - maximum: 343500) Hz. | |||
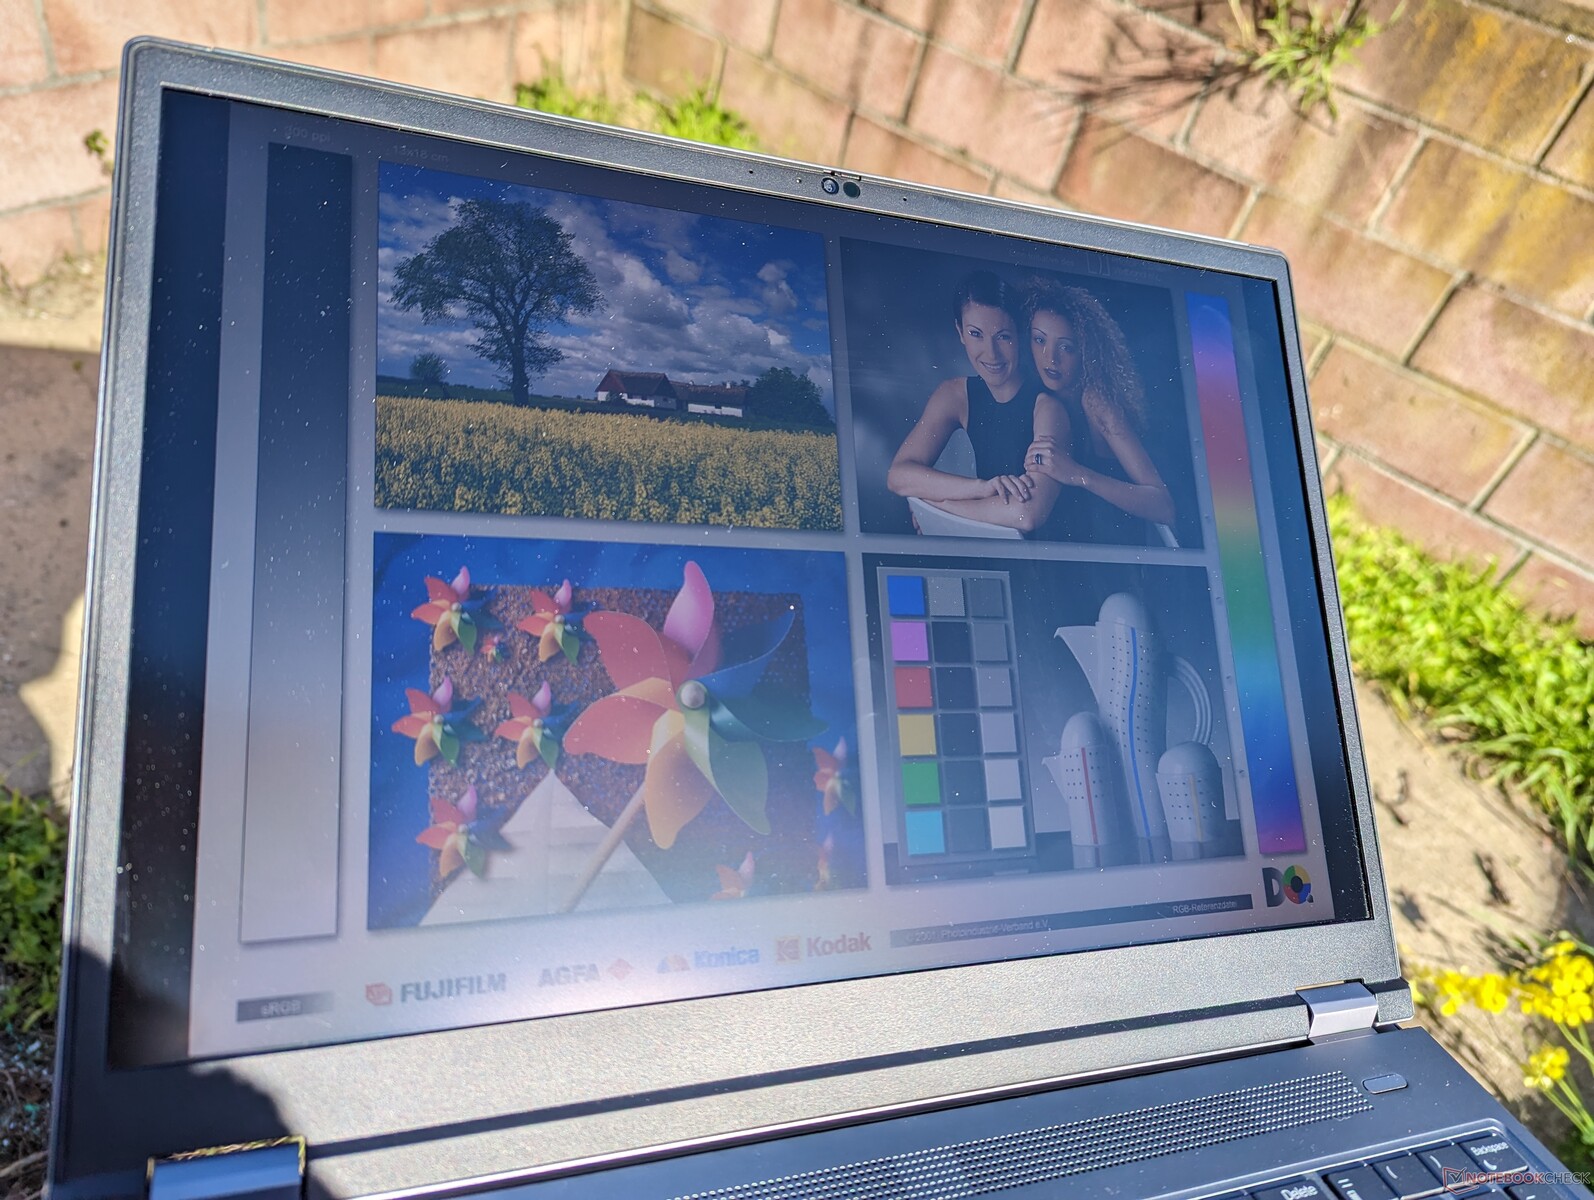
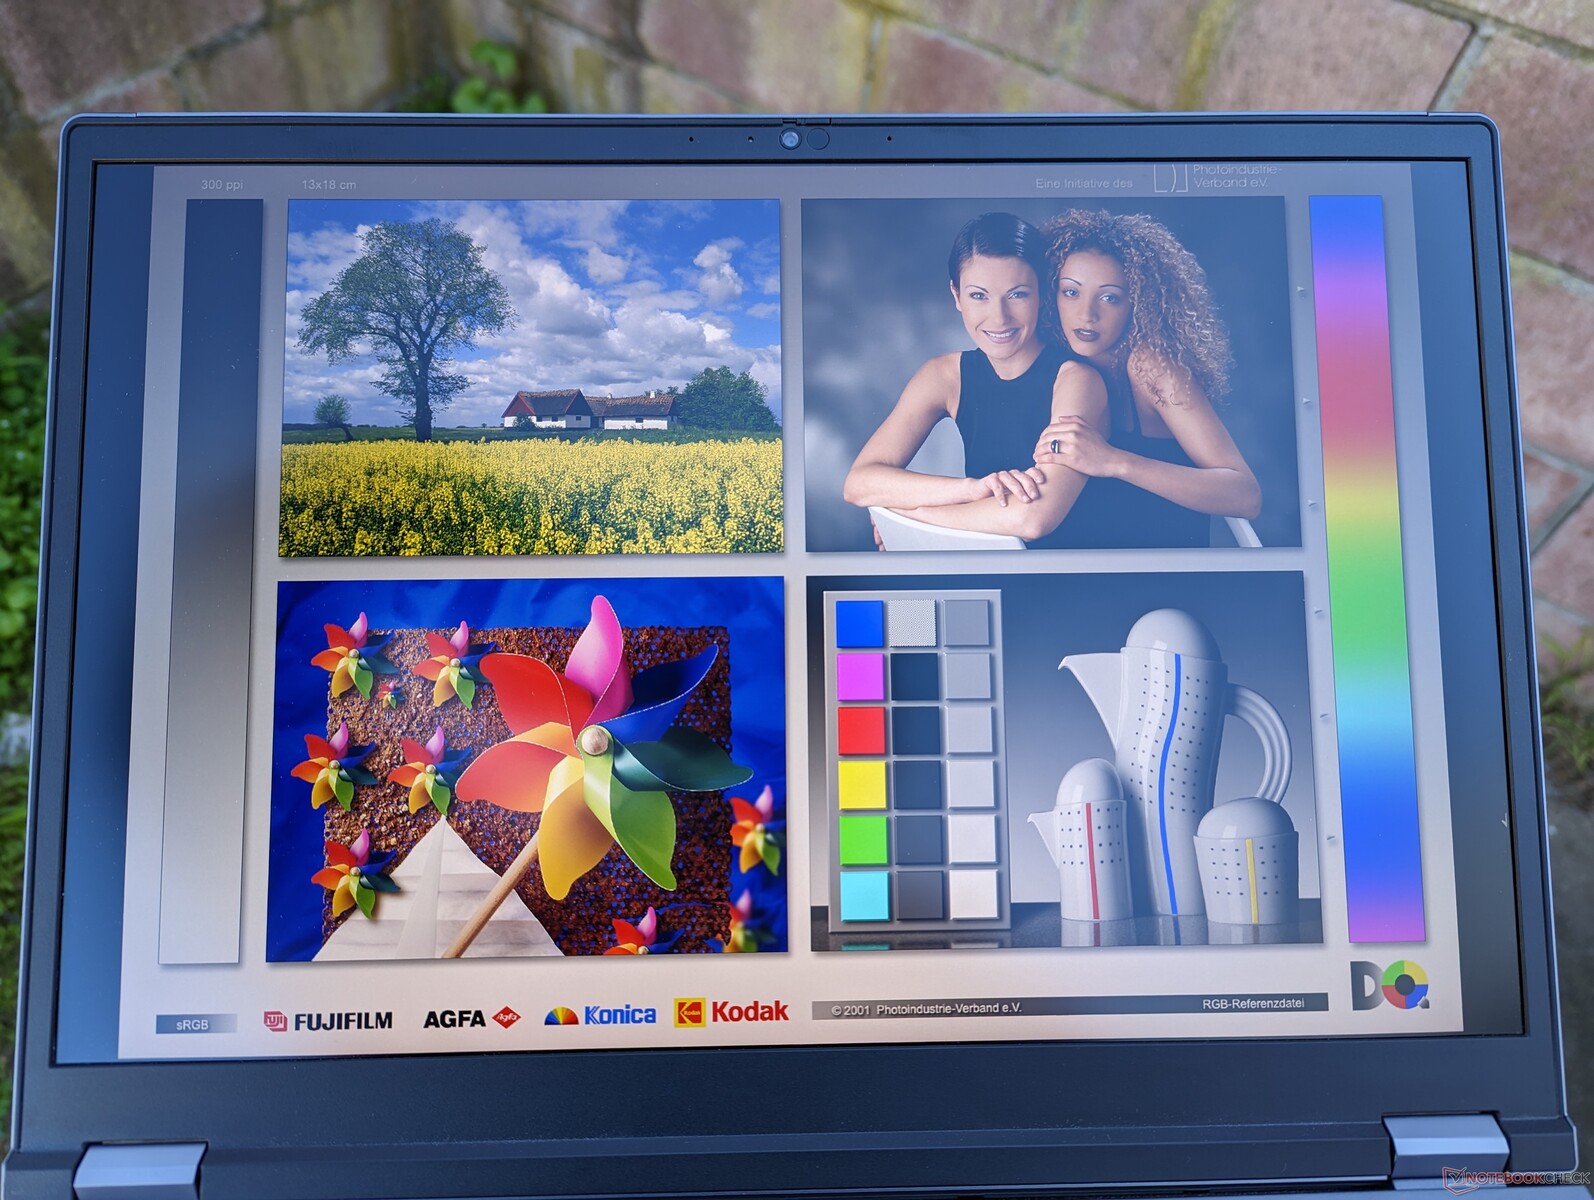
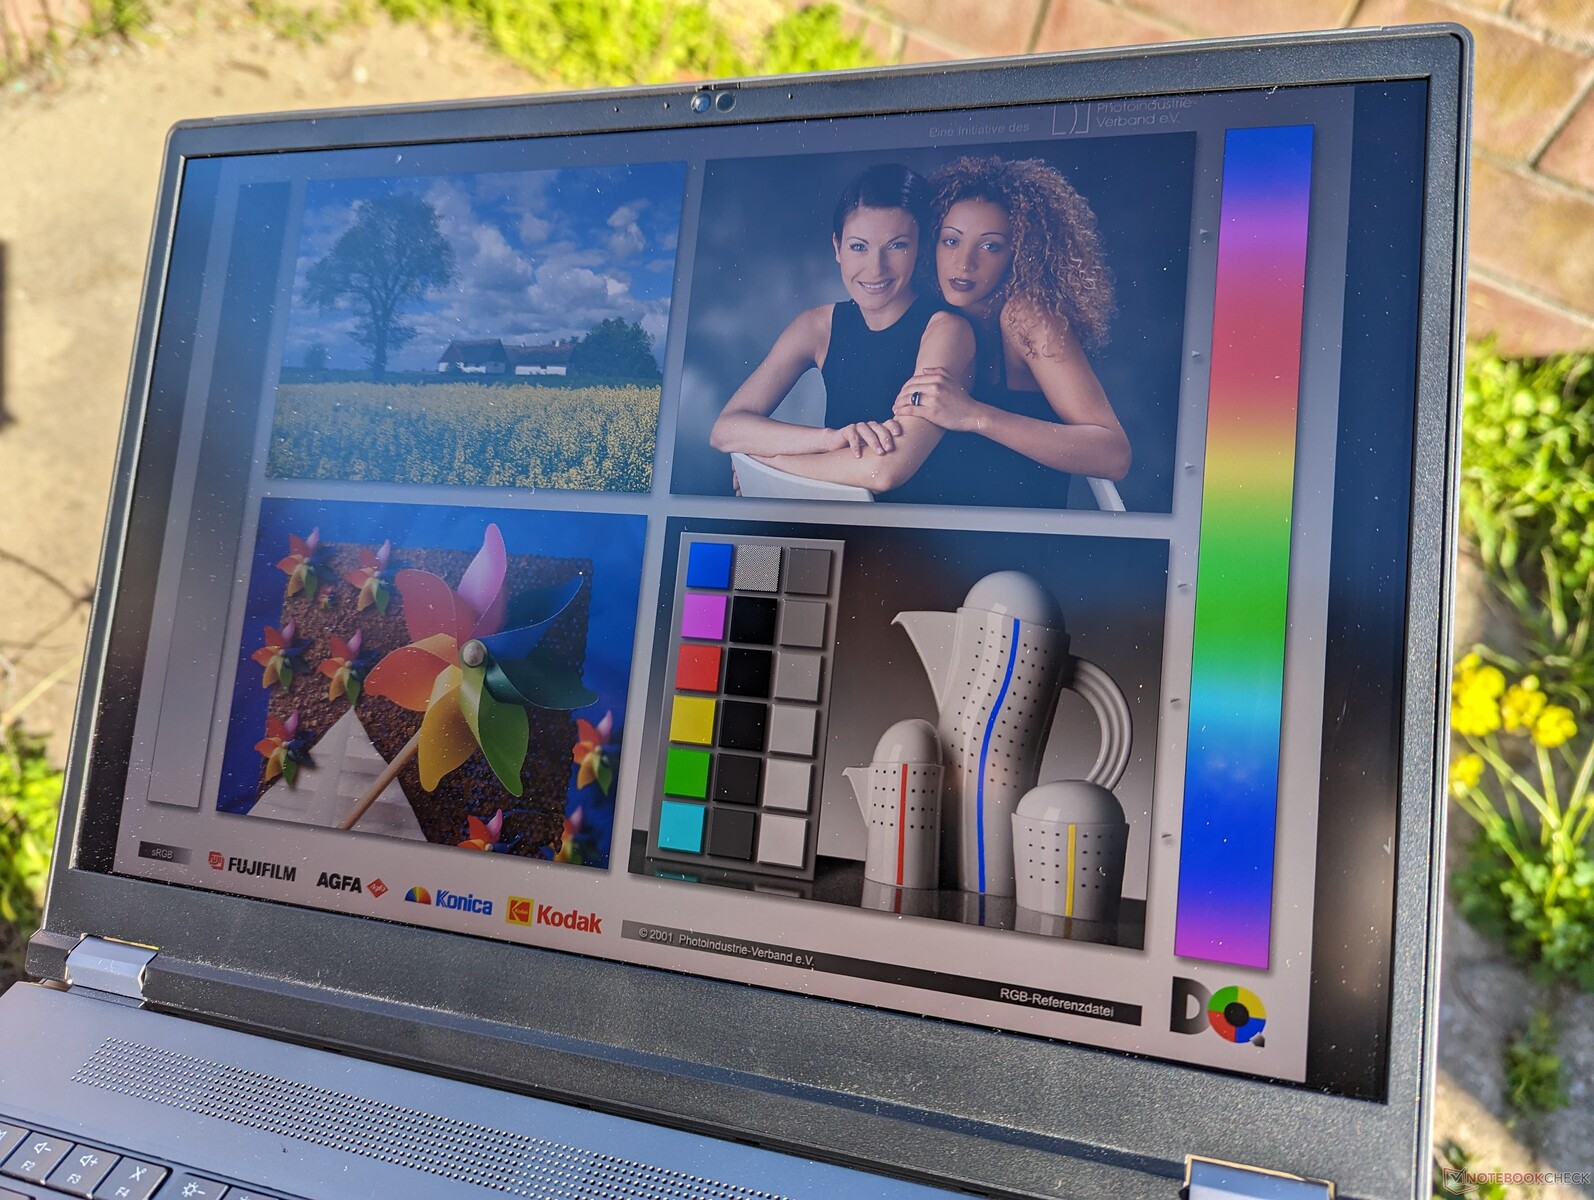
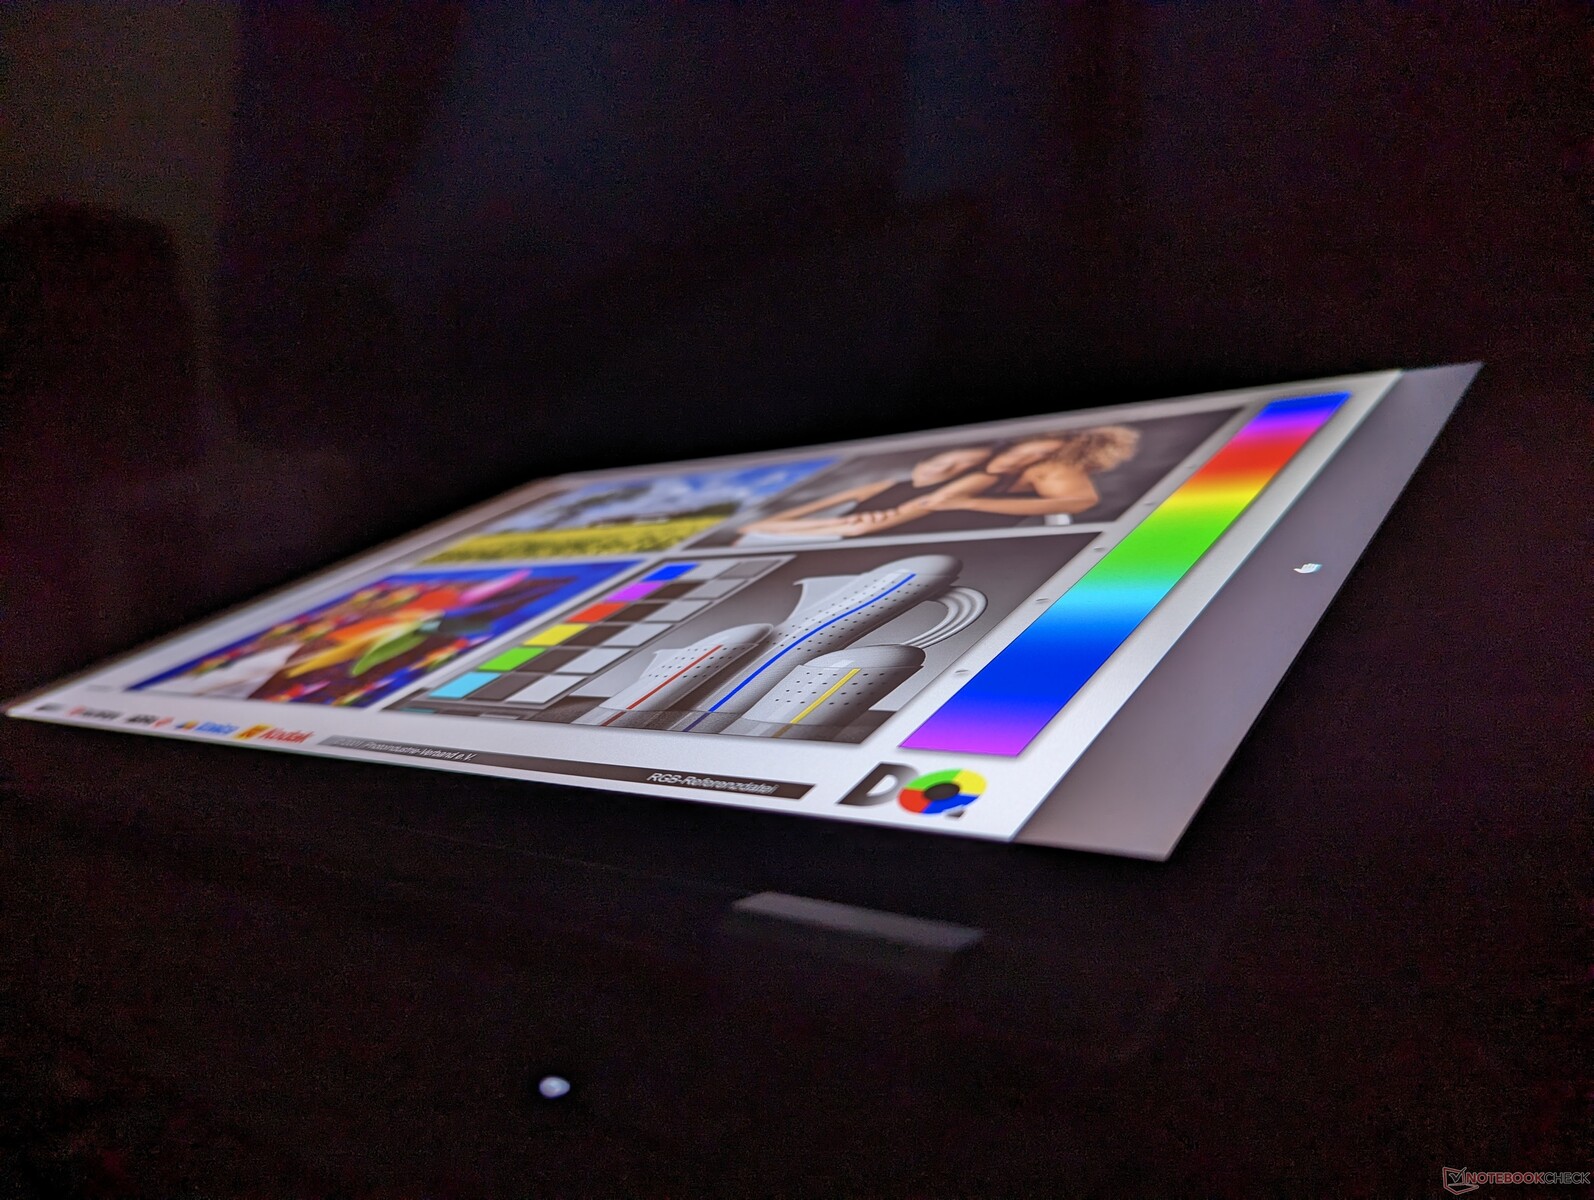
Synligheten utomhus är hyfsad eftersom skärmen är ljusare än på de flesta andra bärbara datorer där 300-400 nit är vanligare. Det rekommenderas dock fortfarande att arbeta i skugga när det är möjligt, eftersom direkt solljus försämrar bildkvaliteten och färgerna.
Prestanda
Provningsförhållanden
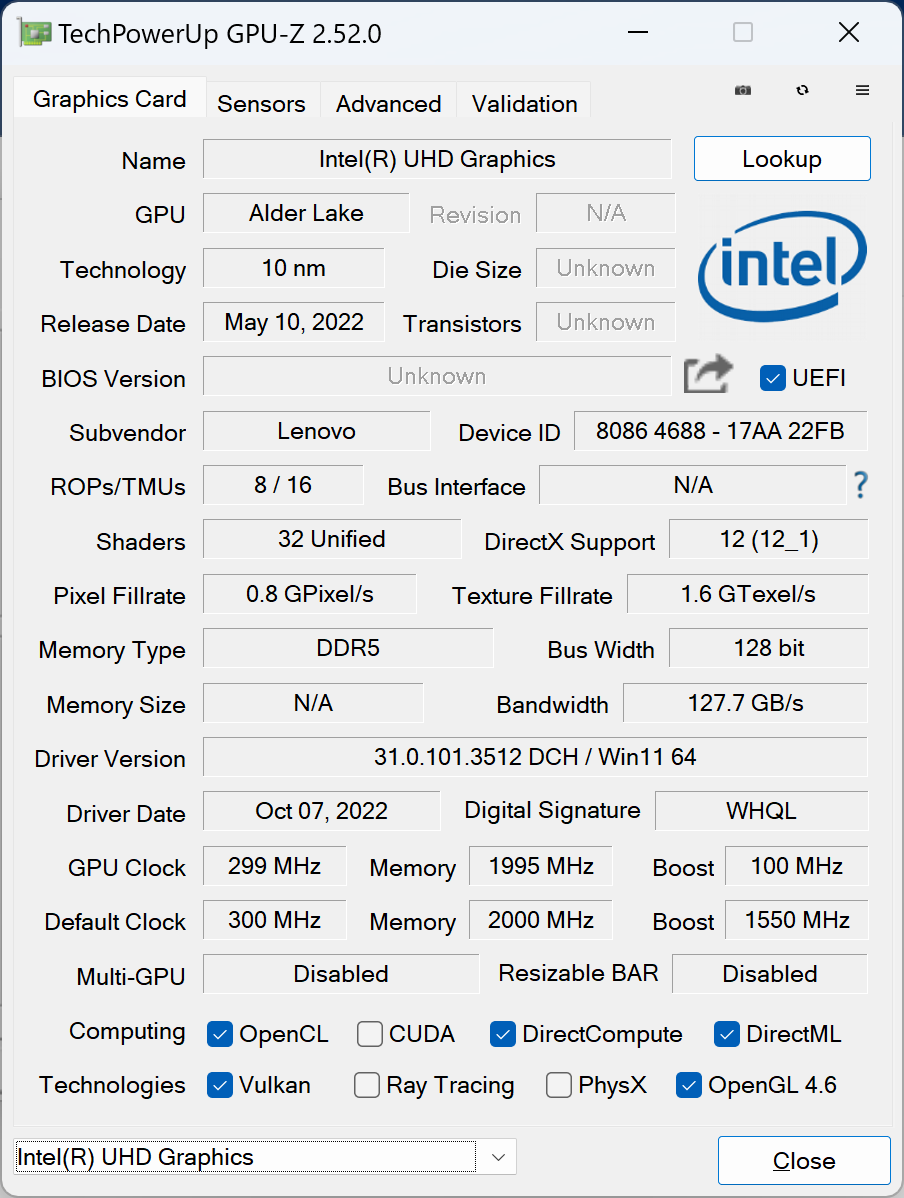
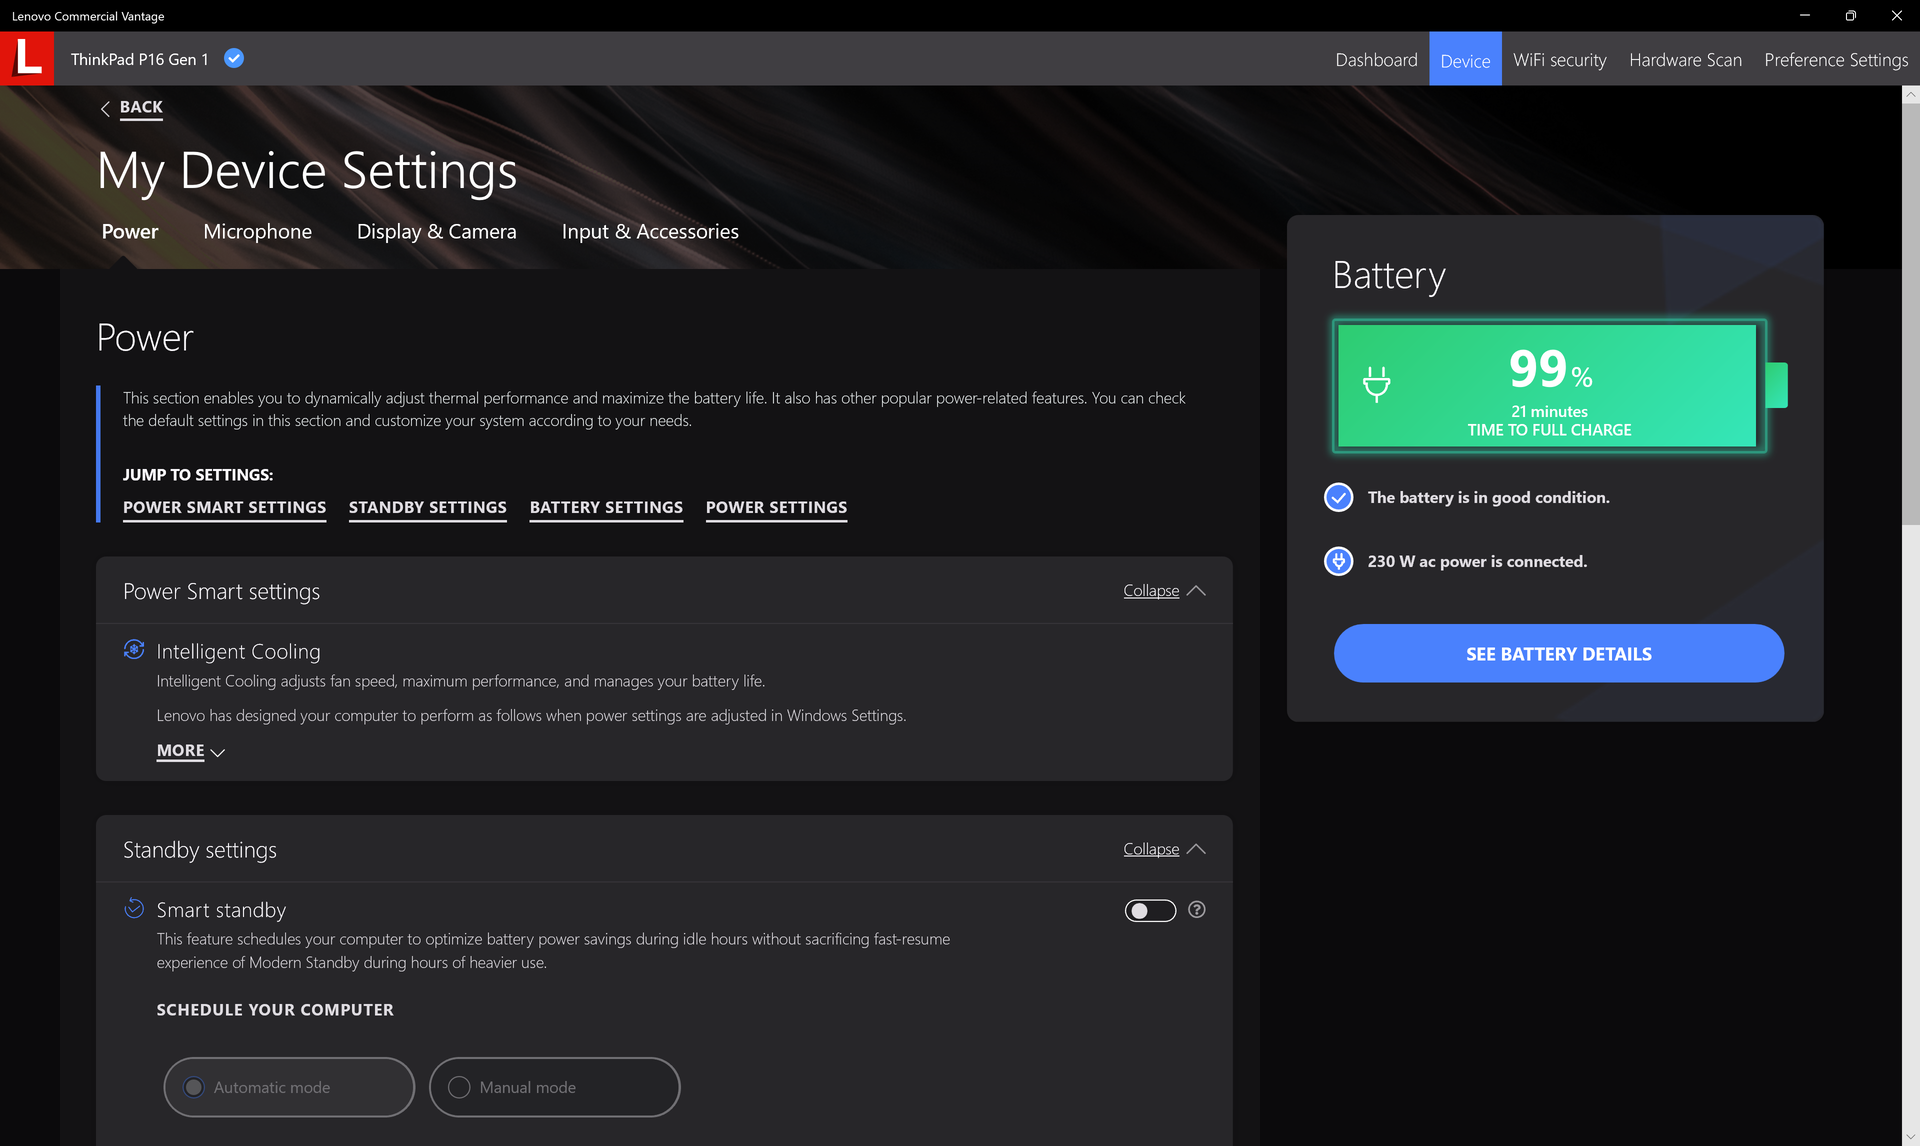
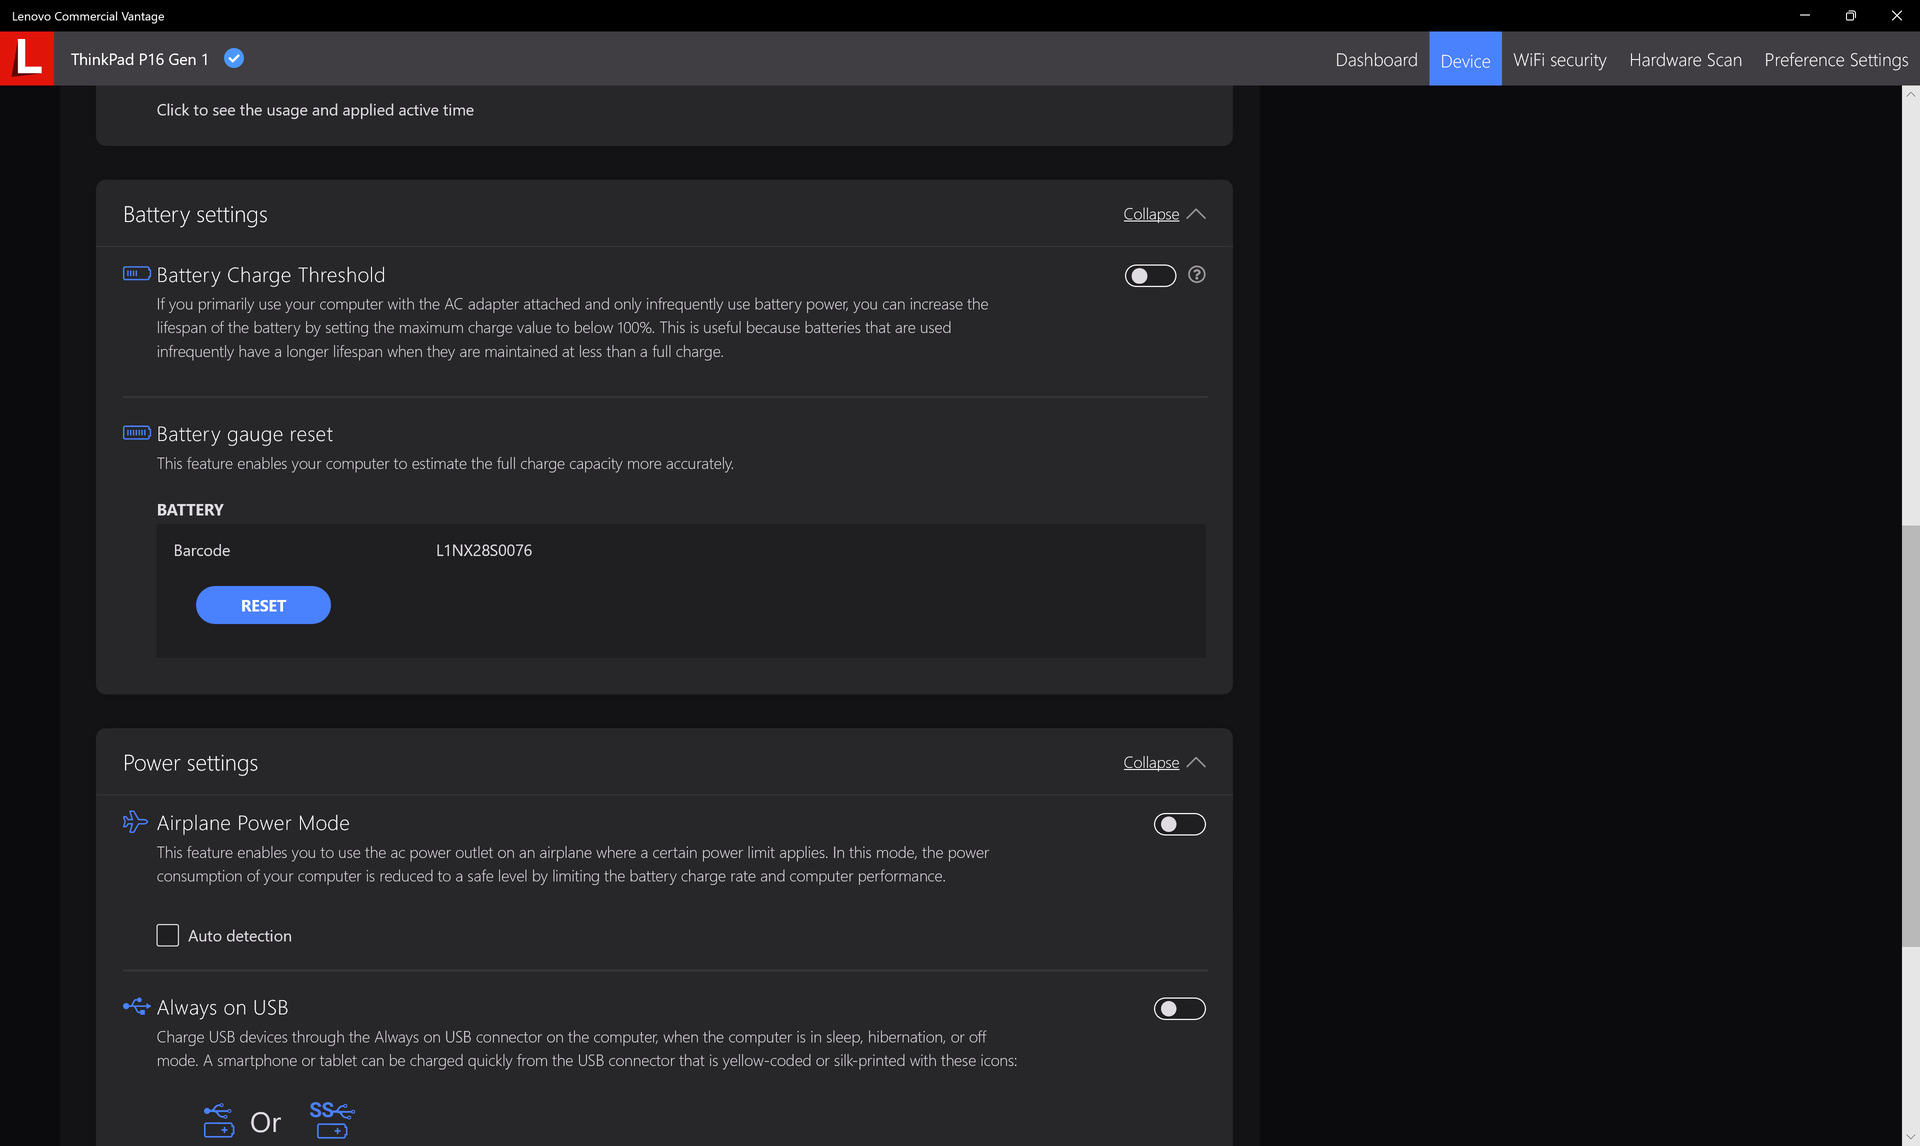
Vi ställde in vår enhet till prestandaläge och dGPU-läge via Windows respektive Nvidias kontrollpanel innan vi körde några av prestandabänkningarna nedan. Det rekommenderas att användarna bekantar sig med den förinstallerade Lenovo Vantage-programvaran eftersom den är den centrala hubben för Lenovo-specifika BIOS-uppdateringar, funktioner, garantistatus med mera.
Det finns inga Xeon CPU-alternativ och ECC RAM stöds därför inte. ECC-tillståndet för GPU:n kan dock slås på eller av via Nvidias kontrollpanel.
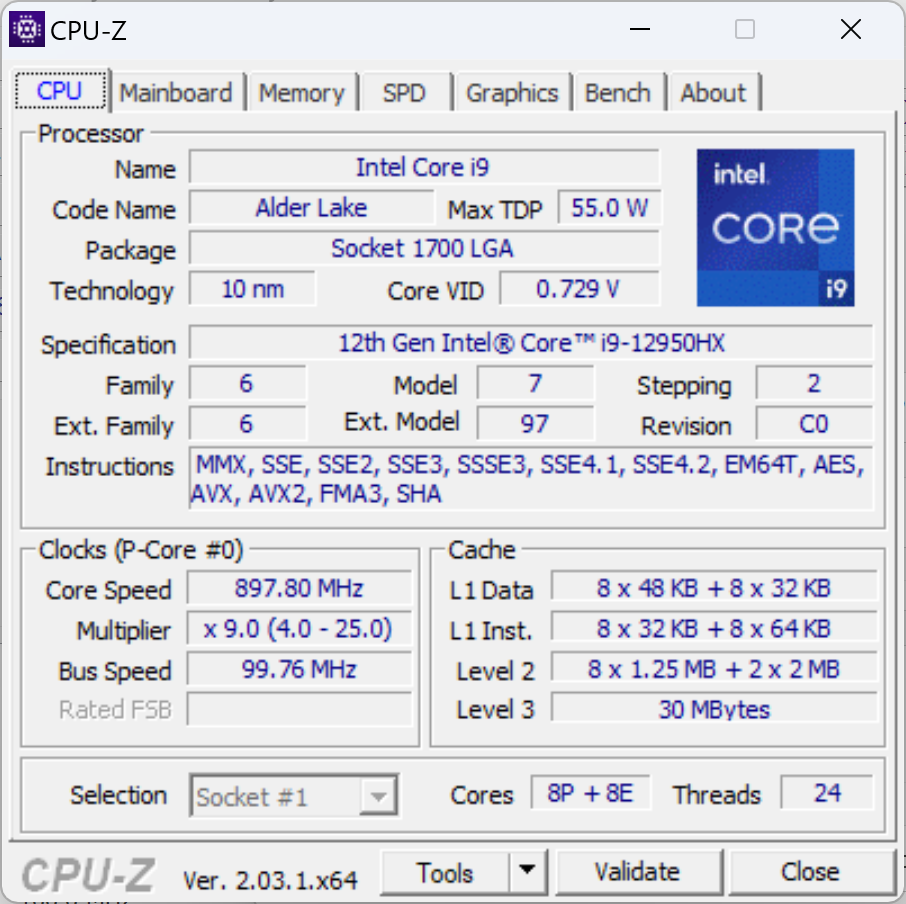
Processor
Den råa prestandan för flera trådar är cirka 10 procent snabbare än den Core i9-12900H i den konkurrerande MSI CreatorPro Z16P. Uppgradering frånCore i7-12850HX konfiguration till vår Core i9-12950HX ökar prestandan med 15 procent. Det kanske mest anmärkningsvärda är att Precision 7670 är ungefär 15-20 procent långsammare trots att den levereras med samma Core i9-12950HX-processor som vår Lenovo.
Turbo Boost hållbarhet är bra men inte perfekt. När man kör CineBench R15 xT i en slinga, till exempel, skulle den ursprungliga poängen på 3141 poäng sjunka till ~2830 poäng med tiden för en prestandadämpning på 10 procent.
Cinebench R15 Multi Loop
Cinebench R23: Multi Core | Single Core
Cinebench R20: CPU (Multi Core) | CPU (Single Core)
Cinebench R15: CPU Multi 64Bit | CPU Single 64Bit
Blender: v2.79 BMW27 CPU
7-Zip 18.03: 7z b 4 | 7z b 4 -mmt1
Geekbench 5.5: Multi-Core | Single-Core
HWBOT x265 Benchmark v2.2: 4k Preset
LibreOffice : 20 Documents To PDF
R Benchmark 2.5: Overall mean
* ... mindre är bättre
AIDA64: FP32 Ray-Trace | FPU Julia | CPU SHA3 | CPU Queen | FPU SinJulia | FPU Mandel | CPU AES | CPU ZLib | FP64 Ray-Trace | CPU PhotoWorxx
| Performance rating | |
| Genomsnitt Intel Core i9-12950HX | |
| Lenovo ThinkPad P16 G1 RTX A5500 | |
| Lenovo ThinkPad P16 G1 21D6001DMB | |
| MSI CreatorPro Z16P B12UKST | |
| HP ZBook Studio 16 G9 62U04EA | |
| Dell Precision 7000 7670 Performance | |
| Asus ProArt StudioBook 16 W7600H5A-2BL2 -9! | |
| AIDA64 / FP32 Ray-Trace | |
| Lenovo ThinkPad P16 G1 RTX A5500 | |
| Genomsnitt Intel Core i9-12950HX (15499 - 22868, n=7) | |
| Lenovo ThinkPad P16 G1 21D6001DMB | |
| Dell Precision 7000 7670 Performance | |
| HP ZBook Studio 16 G9 62U04EA | |
| MSI CreatorPro Z16P B12UKST | |
| AIDA64 / FPU Julia | |
| Lenovo ThinkPad P16 G1 RTX A5500 | |
| Genomsnitt Intel Core i9-12950HX (77846 - 115907, n=7) | |
| Lenovo ThinkPad P16 G1 21D6001DMB | |
| HP ZBook Studio 16 G9 62U04EA | |
| Dell Precision 7000 7670 Performance | |
| MSI CreatorPro Z16P B12UKST | |
| AIDA64 / CPU SHA3 | |
| Lenovo ThinkPad P16 G1 RTX A5500 | |
| Genomsnitt Intel Core i9-12950HX (3426 - 5069, n=7) | |
| Lenovo ThinkPad P16 G1 21D6001DMB | |
| HP ZBook Studio 16 G9 62U04EA | |
| MSI CreatorPro Z16P B12UKST | |
| Dell Precision 7000 7670 Performance | |
| AIDA64 / CPU Queen | |
| HP ZBook Studio 16 G9 62U04EA | |
| Genomsnitt Intel Core i9-12950HX (102752 - 104726, n=7) | |
| Lenovo ThinkPad P16 G1 RTX A5500 | |
| Dell Precision 7000 7670 Performance | |
| MSI CreatorPro Z16P B12UKST | |
| Lenovo ThinkPad P16 G1 21D6001DMB | |
| AIDA64 / FPU SinJulia | |
| Lenovo ThinkPad P16 G1 RTX A5500 | |
| Genomsnitt Intel Core i9-12950HX (10134 - 12823, n=7) | |
| Lenovo ThinkPad P16 G1 21D6001DMB | |
| Dell Precision 7000 7670 Performance | |
| HP ZBook Studio 16 G9 62U04EA | |
| MSI CreatorPro Z16P B12UKST | |
| AIDA64 / FPU Mandel | |
| Lenovo ThinkPad P16 G1 RTX A5500 | |
| Genomsnitt Intel Core i9-12950HX (37146 - 57340, n=7) | |
| Lenovo ThinkPad P16 G1 21D6001DMB | |
| HP ZBook Studio 16 G9 62U04EA | |
| Dell Precision 7000 7670 Performance | |
| MSI CreatorPro Z16P B12UKST | |
| AIDA64 / CPU AES | |
| MSI CreatorPro Z16P B12UKST | |
| Genomsnitt Intel Core i9-12950HX (72599 - 181128, n=7) | |
| Lenovo ThinkPad P16 G1 RTX A5500 | |
| Lenovo ThinkPad P16 G1 21D6001DMB | |
| HP ZBook Studio 16 G9 62U04EA | |
| Dell Precision 7000 7670 Performance | |
| AIDA64 / FP64 Ray-Trace | |
| Lenovo ThinkPad P16 G1 RTX A5500 | |
| Genomsnitt Intel Core i9-12950HX (8455 - 12432, n=7) | |
| Lenovo ThinkPad P16 G1 21D6001DMB | |
| HP ZBook Studio 16 G9 62U04EA | |
| Dell Precision 7000 7670 Performance | |
| MSI CreatorPro Z16P B12UKST | |
| AIDA64 / CPU PhotoWorxx | |
| MSI CreatorPro Z16P B12UKST | |
| Dell Precision 7000 7670 Performance | |
| Genomsnitt Intel Core i9-12950HX (35479 - 42655, n=7) | |
| Lenovo ThinkPad P16 G1 RTX A5500 | |
| HP ZBook Studio 16 G9 62U04EA | |
| Lenovo ThinkPad P16 G1 21D6001DMB | |
Systemets prestanda
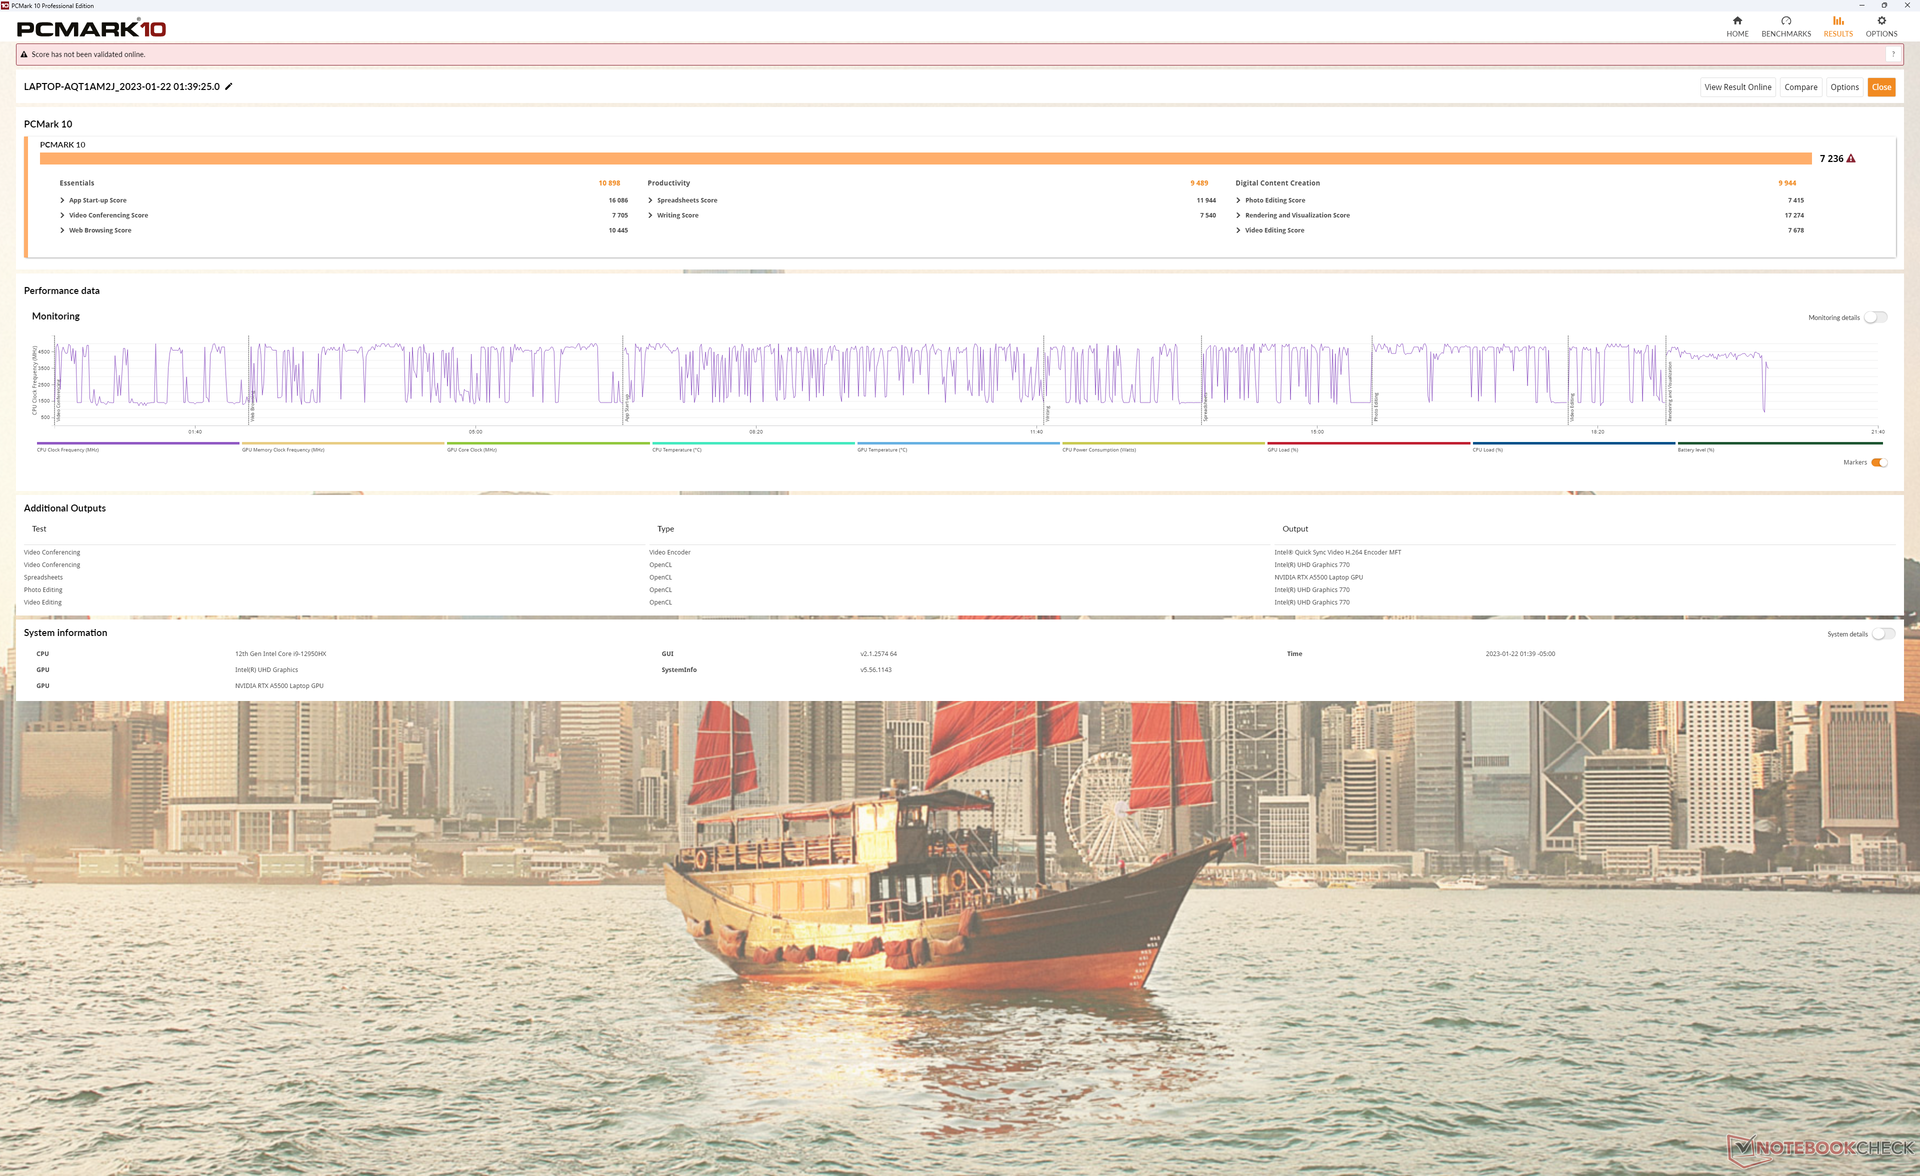
PCMark-resultaten är några av de högsta vi har sett på en mobil arbetsstation. Vårt system överträffar till och med Dell Precision 7670 som levereras med samma CPU- och GPU-alternativ som ThinkPad P16 G1.
CrossMark: Overall | Productivity | Creativity | Responsiveness
| PCMark 10 / Score | |
| Lenovo ThinkPad P16 G1 RTX A5500 | |
| MSI CreatorPro Z16P B12UKST | |
| Genomsnitt Intel Core i9-12950HX, NVIDIA RTX A5500 Laptop GPU (6883 - 7236, n=3) | |
| Asus ProArt StudioBook 16 W7600H5A-2BL2 | |
| Dell Precision 7000 7670 Performance | |
| HP ZBook Studio 16 G9 62U04EA | |
| Lenovo ThinkPad P16 G1 21D6001DMB | |
| PCMark 10 / Essentials | |
| Dell Precision 7000 7670 Performance | |
| Genomsnitt Intel Core i9-12950HX, NVIDIA RTX A5500 Laptop GPU (10898 - 11465, n=3) | |
| Lenovo ThinkPad P16 G1 RTX A5500 | |
| MSI CreatorPro Z16P B12UKST | |
| Asus ProArt StudioBook 16 W7600H5A-2BL2 | |
| Lenovo ThinkPad P16 G1 21D6001DMB | |
| HP ZBook Studio 16 G9 62U04EA | |
| PCMark 10 / Productivity | |
| Lenovo ThinkPad P16 G1 RTX A5500 | |
| MSI CreatorPro Z16P B12UKST | |
| Lenovo ThinkPad P16 G1 21D6001DMB | |
| Asus ProArt StudioBook 16 W7600H5A-2BL2 | |
| Genomsnitt Intel Core i9-12950HX, NVIDIA RTX A5500 Laptop GPU (8054 - 9489, n=3) | |
| Dell Precision 7000 7670 Performance | |
| HP ZBook Studio 16 G9 62U04EA | |
| PCMark 10 / Digital Content Creation | |
| Asus ProArt StudioBook 16 W7600H5A-2BL2 | |
| Lenovo ThinkPad P16 G1 RTX A5500 | |
| MSI CreatorPro Z16P B12UKST | |
| Dell Precision 7000 7670 Performance | |
| Genomsnitt Intel Core i9-12950HX, NVIDIA RTX A5500 Laptop GPU (9155 - 9944, n=3) | |
| HP ZBook Studio 16 G9 62U04EA | |
| Lenovo ThinkPad P16 G1 21D6001DMB | |
| CrossMark / Overall | |
| MSI CreatorPro Z16P B12UKST | |
| Lenovo ThinkPad P16 G1 RTX A5500 | |
| Genomsnitt Intel Core i9-12950HX, NVIDIA RTX A5500 Laptop GPU (1801 - 1889, n=3) | |
| HP ZBook Studio 16 G9 62U04EA | |
| Dell Precision 7000 7670 Performance | |
| Lenovo ThinkPad P16 G1 21D6001DMB | |
| CrossMark / Productivity | |
| MSI CreatorPro Z16P B12UKST | |
| Lenovo ThinkPad P16 G1 RTX A5500 | |
| Genomsnitt Intel Core i9-12950HX, NVIDIA RTX A5500 Laptop GPU (1684 - 1785, n=3) | |
| HP ZBook Studio 16 G9 62U04EA | |
| Dell Precision 7000 7670 Performance | |
| Lenovo ThinkPad P16 G1 21D6001DMB | |
| CrossMark / Creativity | |
| Lenovo ThinkPad P16 G1 RTX A5500 | |
| Genomsnitt Intel Core i9-12950HX, NVIDIA RTX A5500 Laptop GPU (2042 - 2192, n=3) | |
| HP ZBook Studio 16 G9 62U04EA | |
| MSI CreatorPro Z16P B12UKST | |
| Dell Precision 7000 7670 Performance | |
| Lenovo ThinkPad P16 G1 21D6001DMB | |
| CrossMark / Responsiveness | |
| MSI CreatorPro Z16P B12UKST | |
| HP ZBook Studio 16 G9 62U04EA | |
| Genomsnitt Intel Core i9-12950HX, NVIDIA RTX A5500 Laptop GPU (1501 - 1585, n=3) | |
| Dell Precision 7000 7670 Performance | |
| Lenovo ThinkPad P16 G1 RTX A5500 | |
| Lenovo ThinkPad P16 G1 21D6001DMB | |
| PCMark 10 Score | 7236 poäng | |
Hjälp | ||
| AIDA64 / Memory Copy | |
| Dell Precision 7000 7670 Performance | |
| Genomsnitt Intel Core i9-12950HX (59731 - 64732, n=7) | |
| Lenovo ThinkPad P16 G1 RTX A5500 | |
| MSI CreatorPro Z16P B12UKST | |
| HP ZBook Studio 16 G9 62U04EA | |
| Lenovo ThinkPad P16 G1 21D6001DMB | |
| AIDA64 / Memory Read | |
| Dell Precision 7000 7670 Performance | |
| Genomsnitt Intel Core i9-12950HX (59744 - 70359, n=7) | |
| MSI CreatorPro Z16P B12UKST | |
| HP ZBook Studio 16 G9 62U04EA | |
| Lenovo ThinkPad P16 G1 RTX A5500 | |
| Lenovo ThinkPad P16 G1 21D6001DMB | |
| AIDA64 / Memory Write | |
| MSI CreatorPro Z16P B12UKST | |
| Dell Precision 7000 7670 Performance | |
| HP ZBook Studio 16 G9 62U04EA | |
| Genomsnitt Intel Core i9-12950HX (57750 - 67899, n=7) | |
| Lenovo ThinkPad P16 G1 RTX A5500 | |
| Lenovo ThinkPad P16 G1 21D6001DMB | |
* ... mindre är bättre
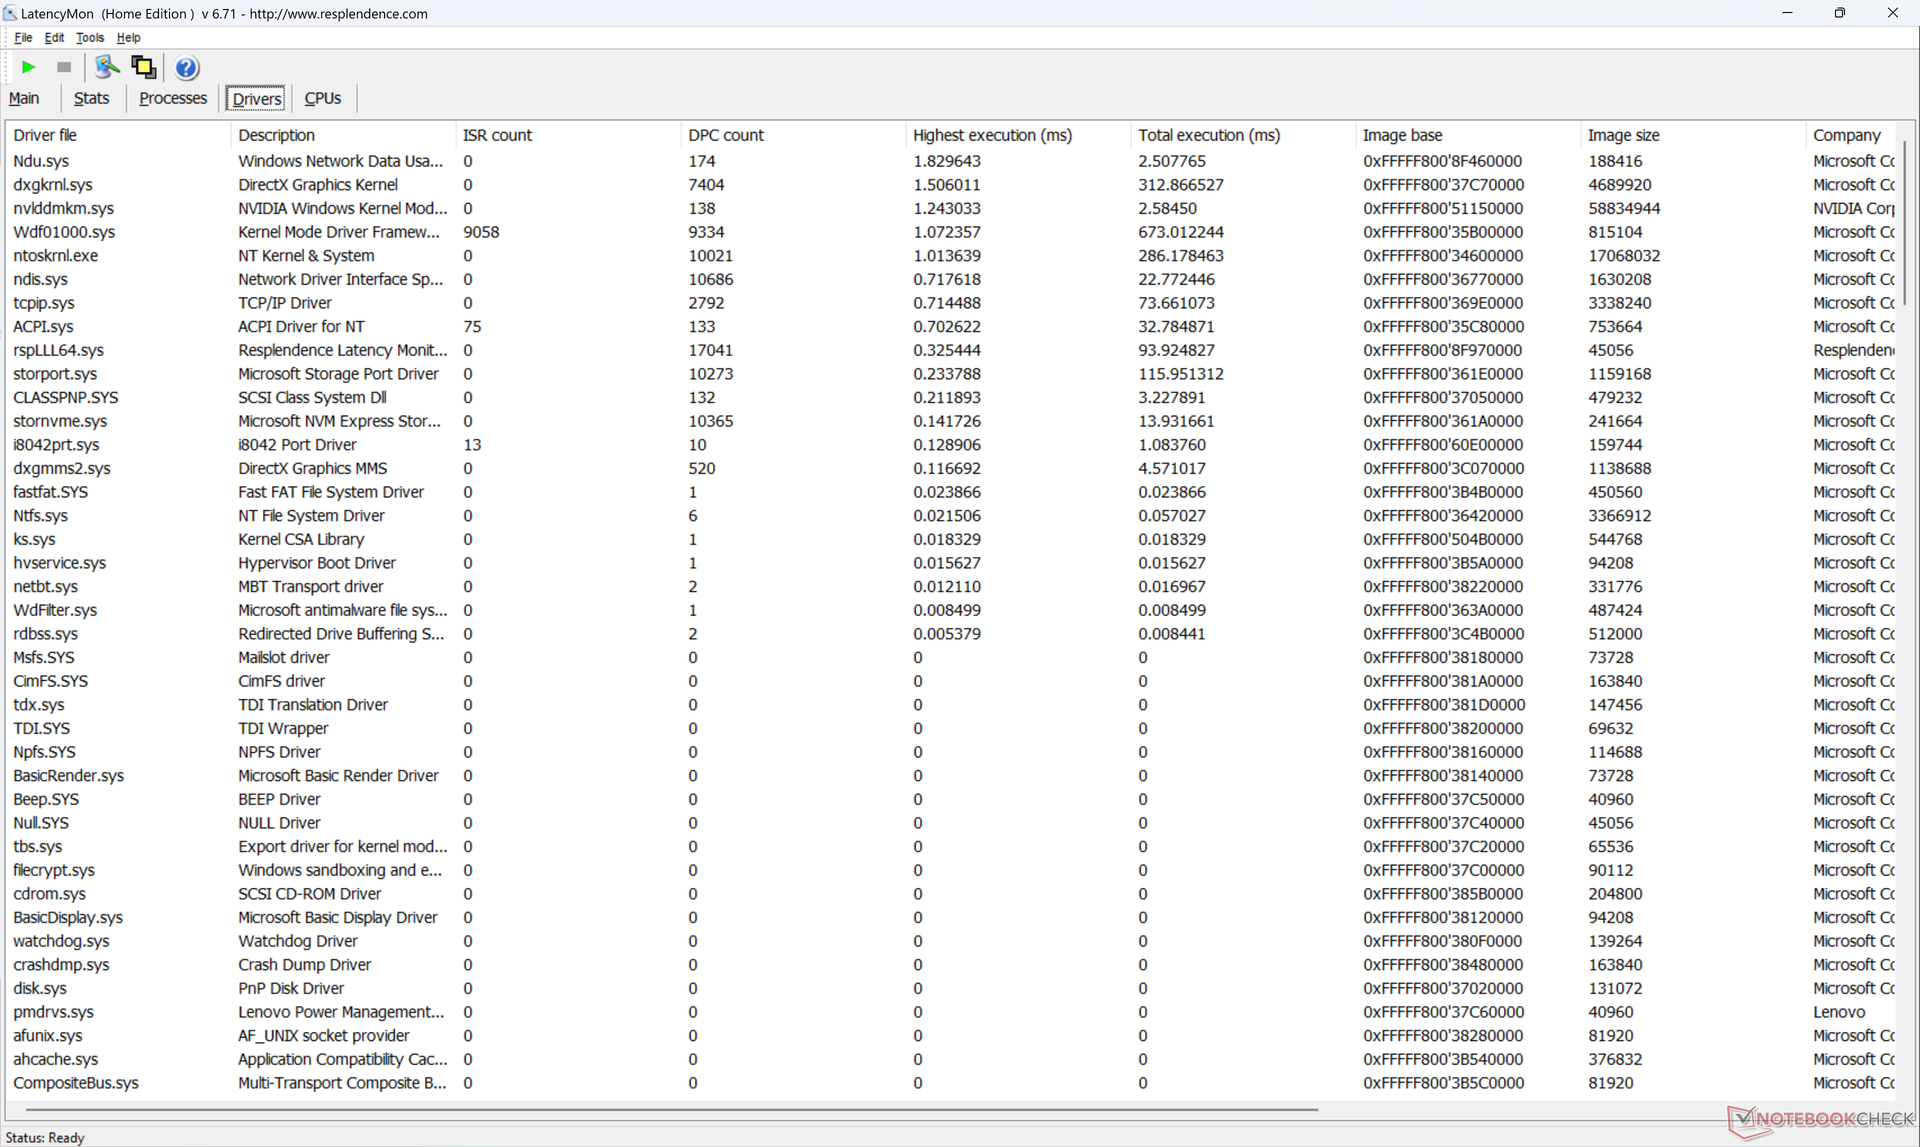
DPC-latenstid
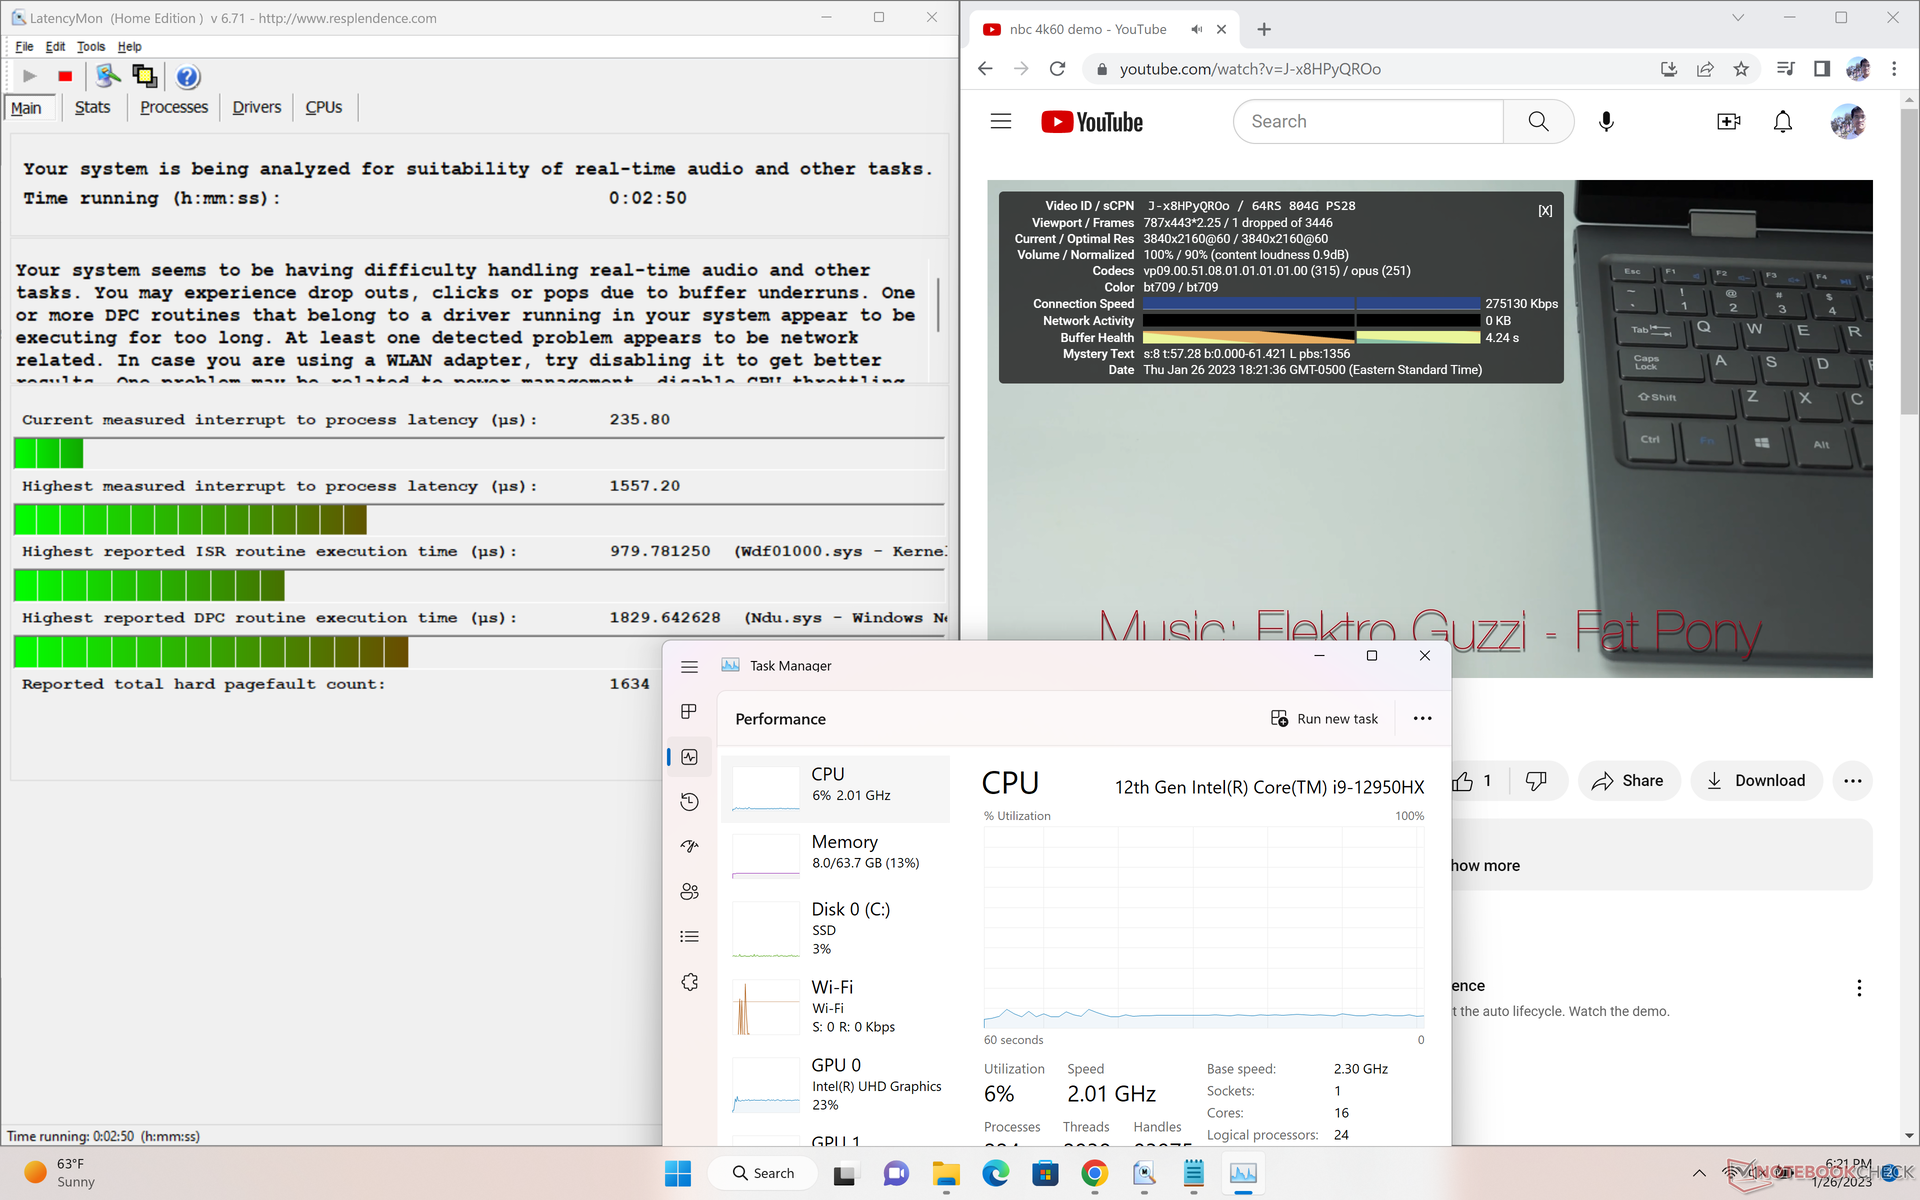
LatencyMon avslöjar mindre DPC-problem när vi öppnar flera webbläsarflikar på vår hemsida, vilket är en besvikelse för en arbetsstation. uppspelning av 4K-video vid 60 FPS är annars utmärkt med bara en enda tappad bild under vår testvideo.
| DPC Latencies / LatencyMon - interrupt to process latency (max), Web, Youtube, Prime95 | |
| Dell Precision 7000 7670 Performance | |
| Lenovo ThinkPad P16 G1 RTX A5500 | |
| Asus ProArt StudioBook 16 W7600H5A-2BL2 | |
| Lenovo ThinkPad P16 G1 21D6001DMB | |
| HP ZBook Studio 16 G9 62U04EA | |
| MSI CreatorPro Z16P B12UKST | |
* ... mindre är bättre
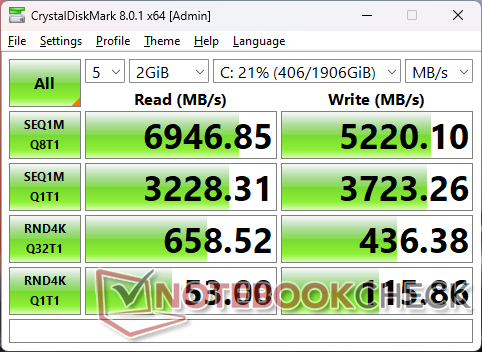
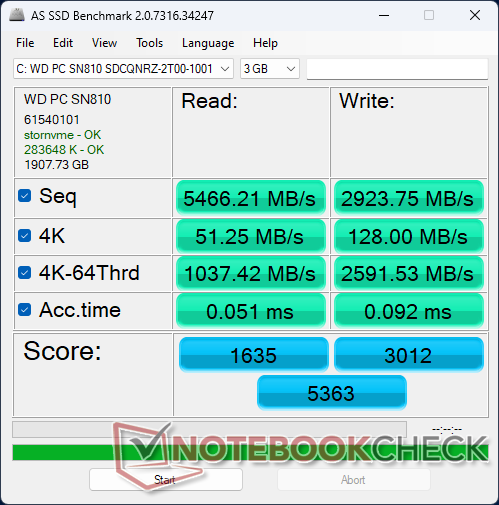
Lagringsenheter
Medan vår A2000-konfiguration skulle levereras med en Micron 3400 SSD, levereras vår A5500-konfiguration med en WD SN810 OPAL SSD i stället. Sekventiell läs- och skrivhastighet är jämförbar mellan de två, men vår WD-enhet verkar ha problem med att bibehålla maximal överföringshastighet efter cirka 5 minuters belastning, vilket visas i vår jämförelsediagram nedan.

* ... mindre är bättre
Disk Throttling: DiskSpd Read Loop, Queue Depth 8
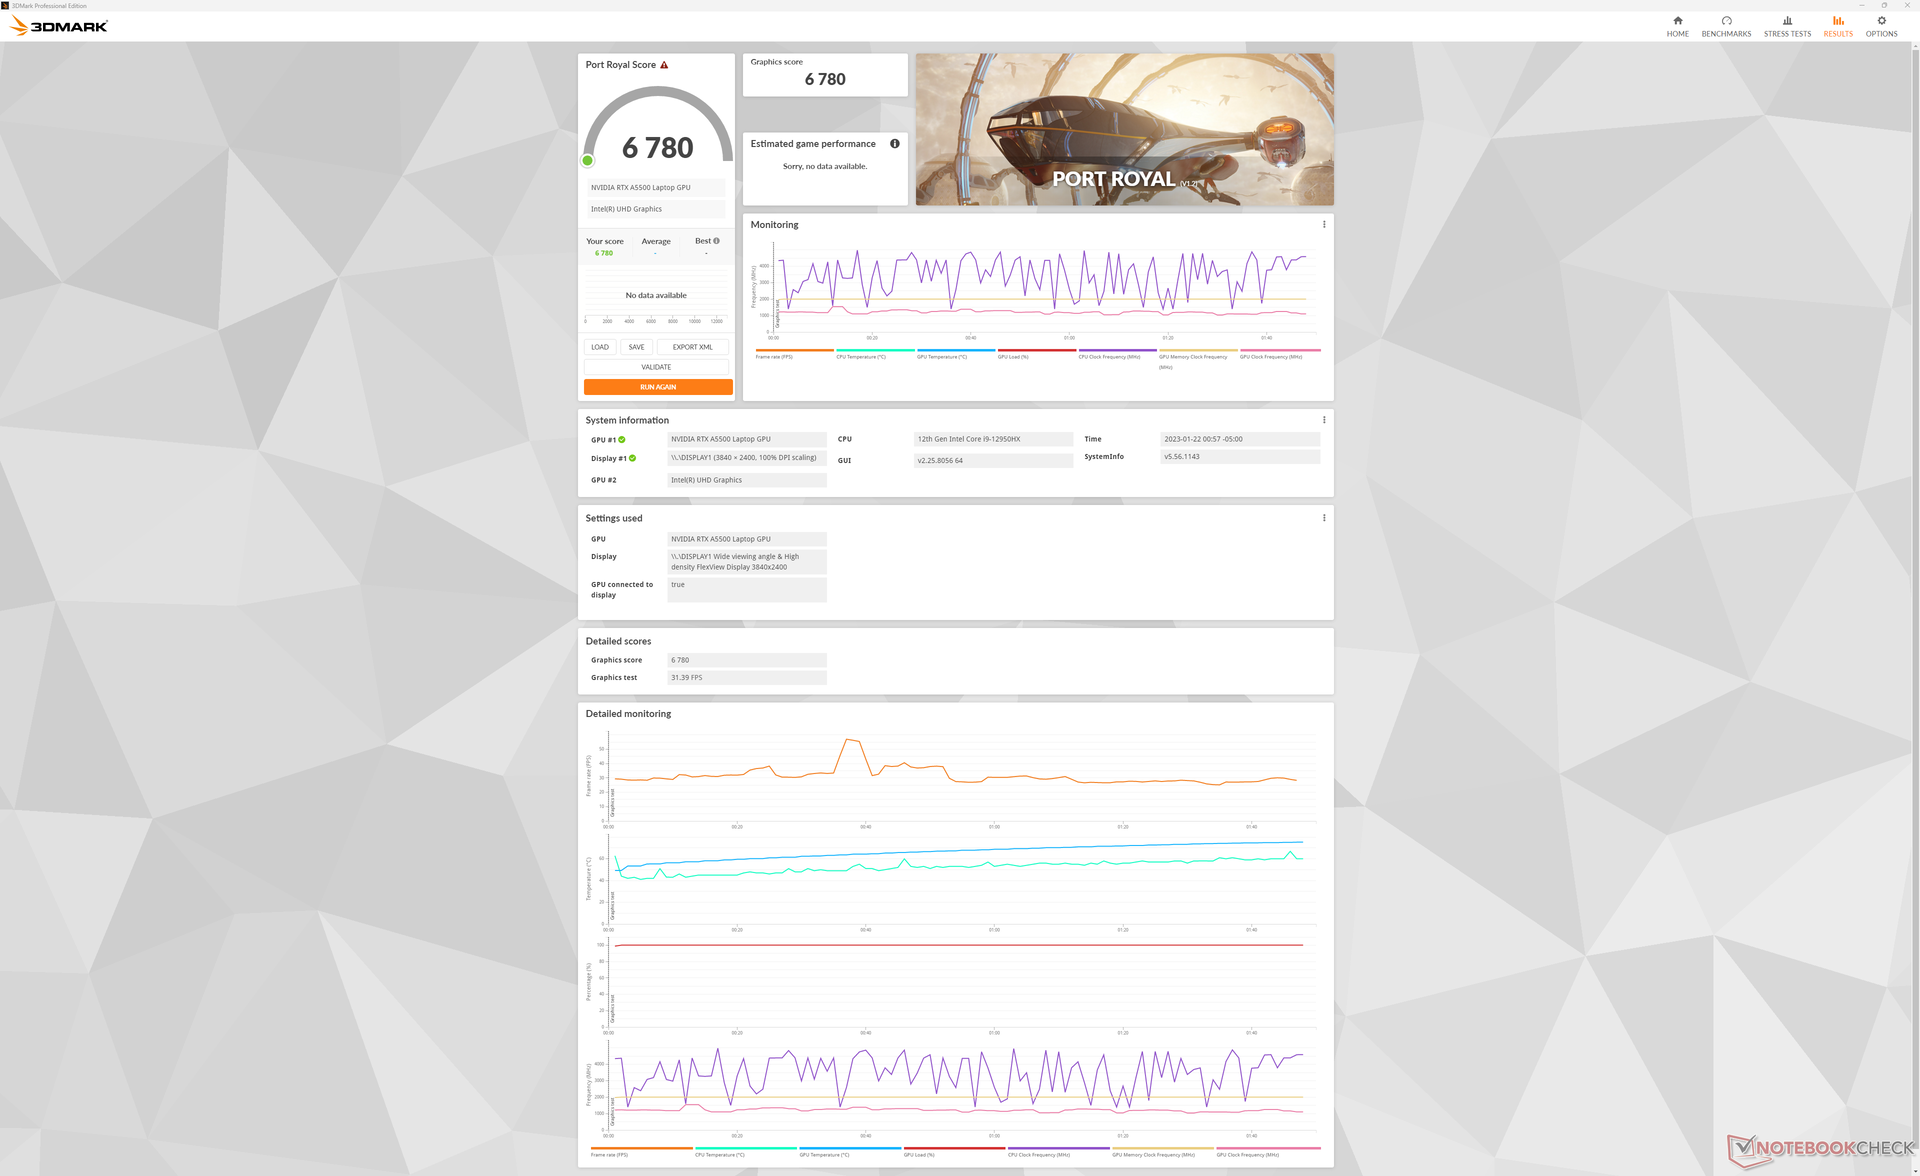
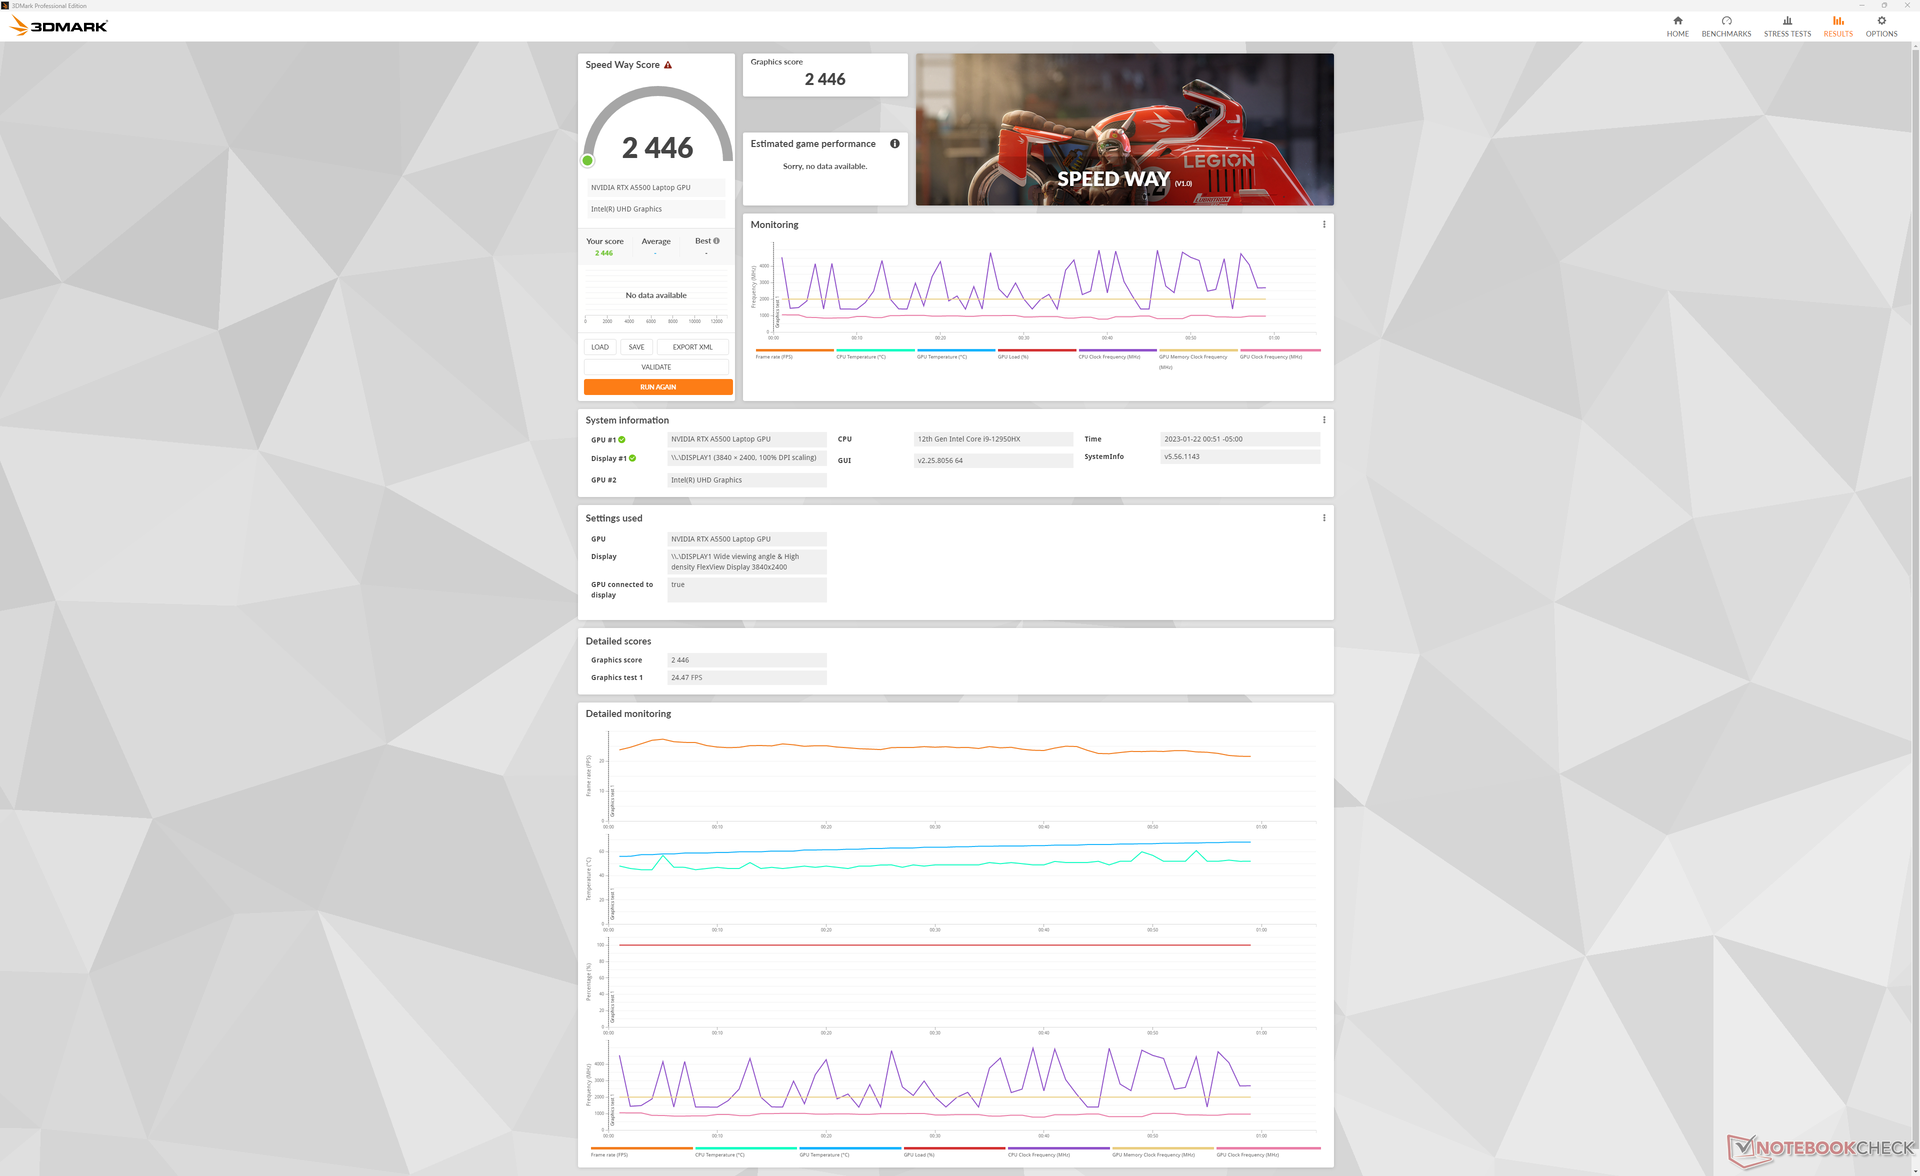
GPU-prestanda
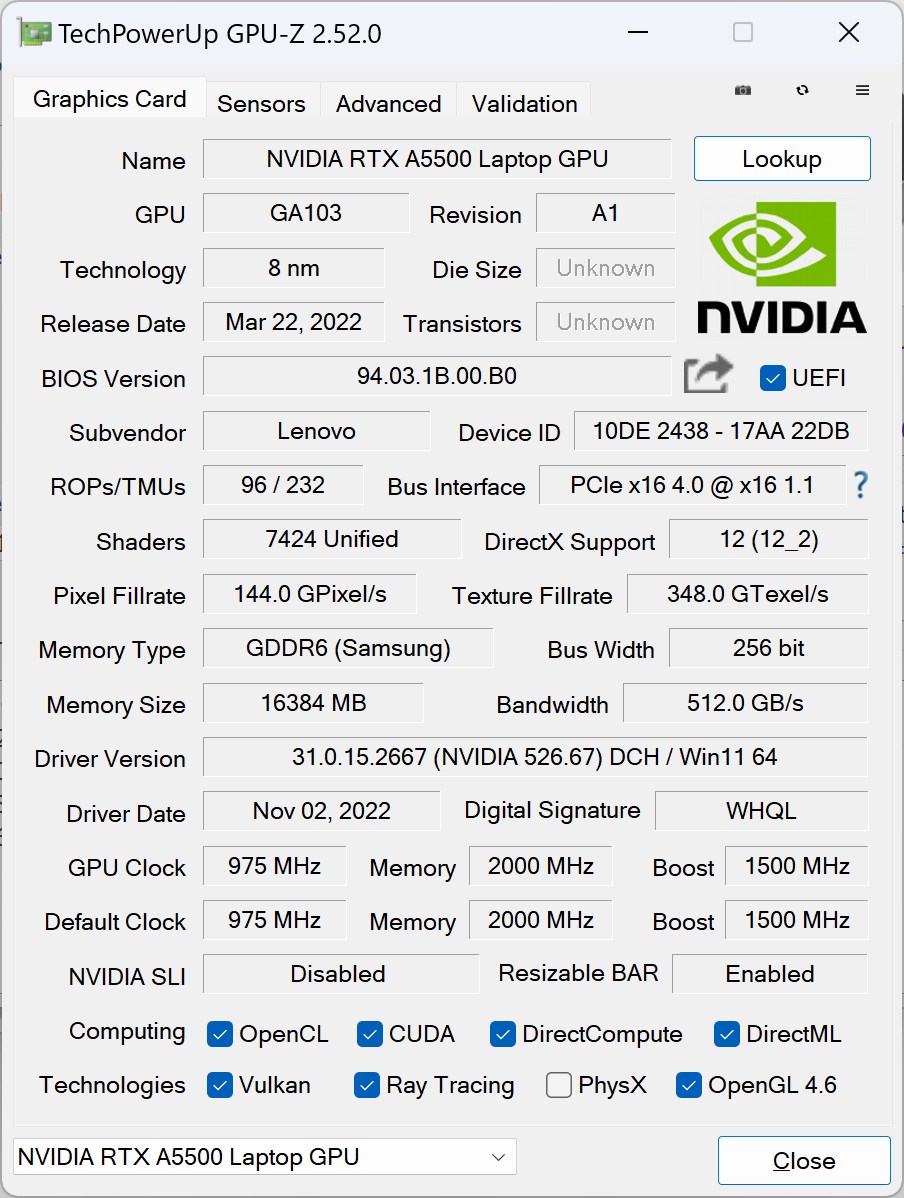
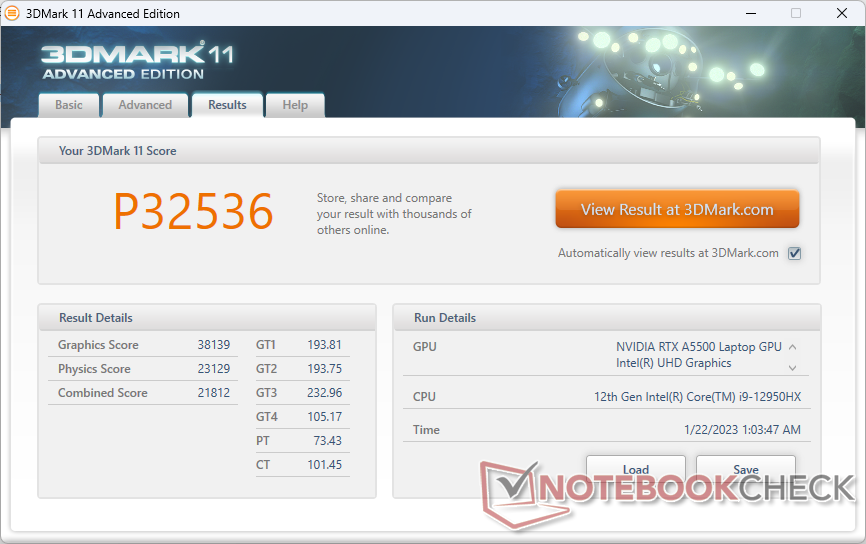
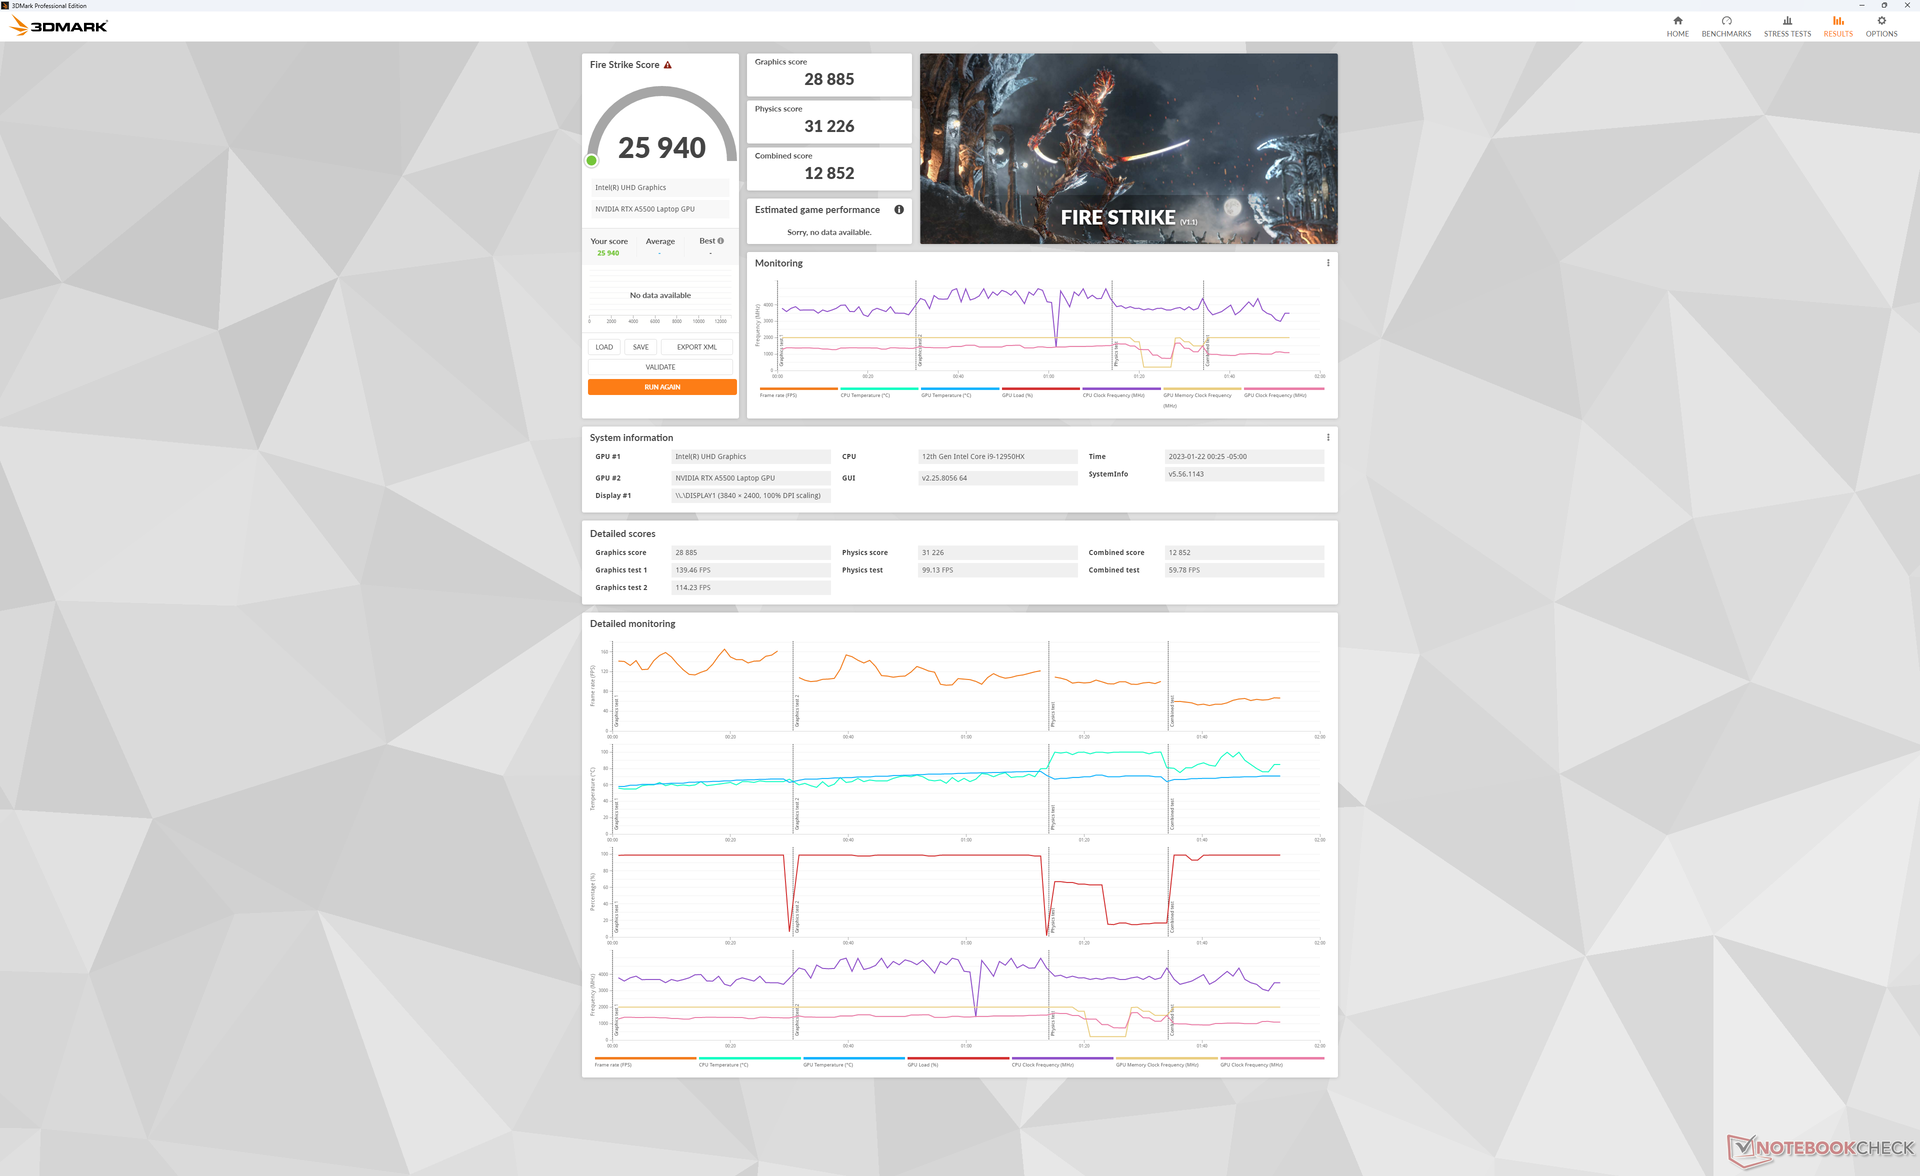
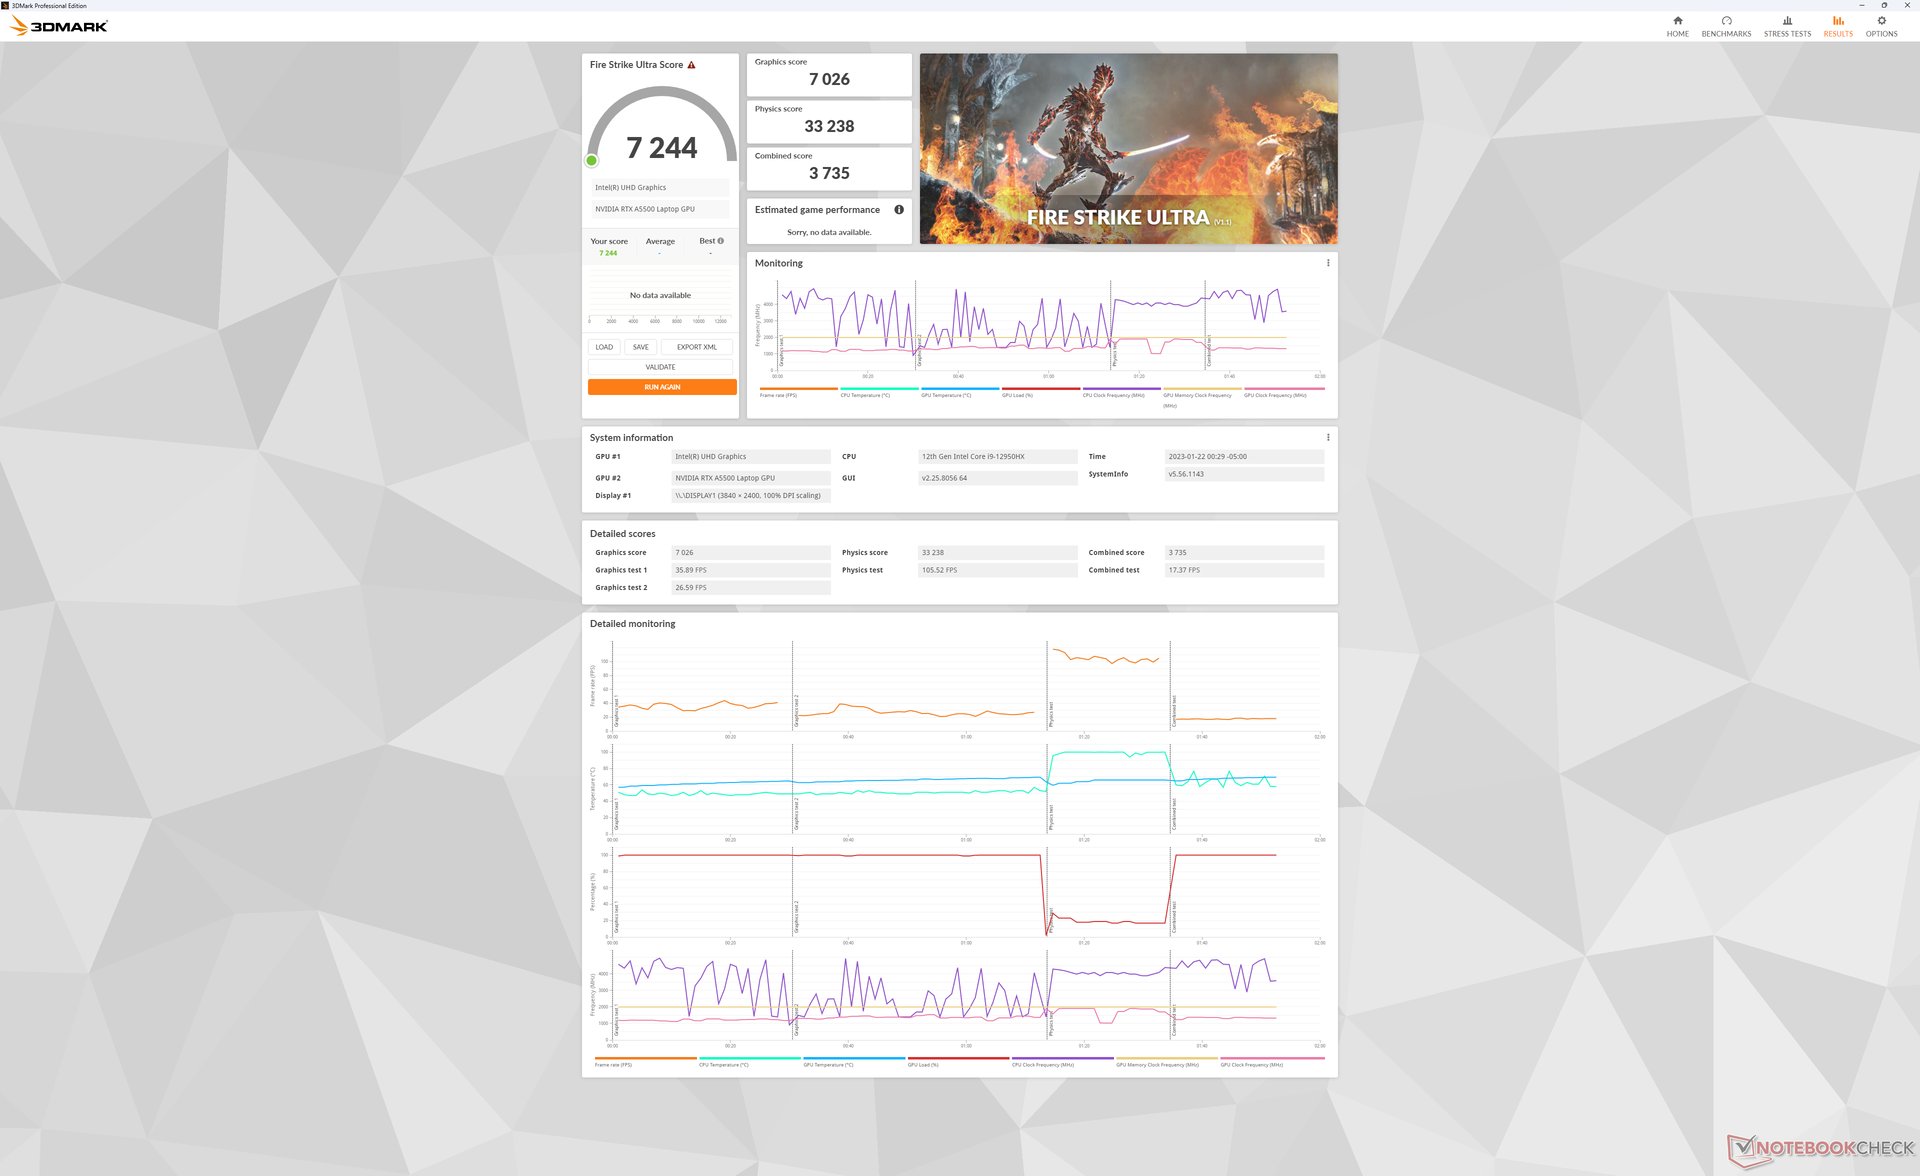
The RTX A5500 i vår Lenovo är ungefär 10 procent snabbare än samma GPU i den konkurrerande Precision 7670. Detta trots att GPU:n i Dell enligt Nvidias kontrollpanel har en TGP på 135 W jämfört med 130 W TGP i vår Lenovo. Om vi går ner till den lägre kategorin RTX A2000 SKU minskar grafikprestandan med så mycket som 50 till 65 procent.
| 3DMark Performance rating - Percent | |
| Lenovo Legion 7 16IAX7-82TD004SGE -34! | |
| Lenovo ThinkPad P16 G1 RTX A5500 | |
| Dell Precision 7000 7670 Performance -1! | |
| Genomsnitt NVIDIA RTX A5500 Laptop GPU | |
| Asus ProArt StudioBook 16 W7600H5A-2BL2 -19! | |
| MSI WE76 11UM-456 -9! | |
| HP ZBook Fury 15 G8 -1! | |
| MSI CreatorPro Z16P B12UKST -17! | |
| HP ZBook Studio 15 G8 -17! | |
| HP ZBook Studio G7 -17! | |
| HP ZBook Studio 16 G9 62U04EA -9! | |
| Dell Precision 5000 5470 -9! | |
| Lenovo ThinkPad P16 G1 21D6001DMB -17! | |
| 3DMark 11 Performance | 32536 poäng | |
| 3DMark Cloud Gate Standard Score | 54323 poäng | |
| 3DMark Fire Strike Score | 25940 poäng | |
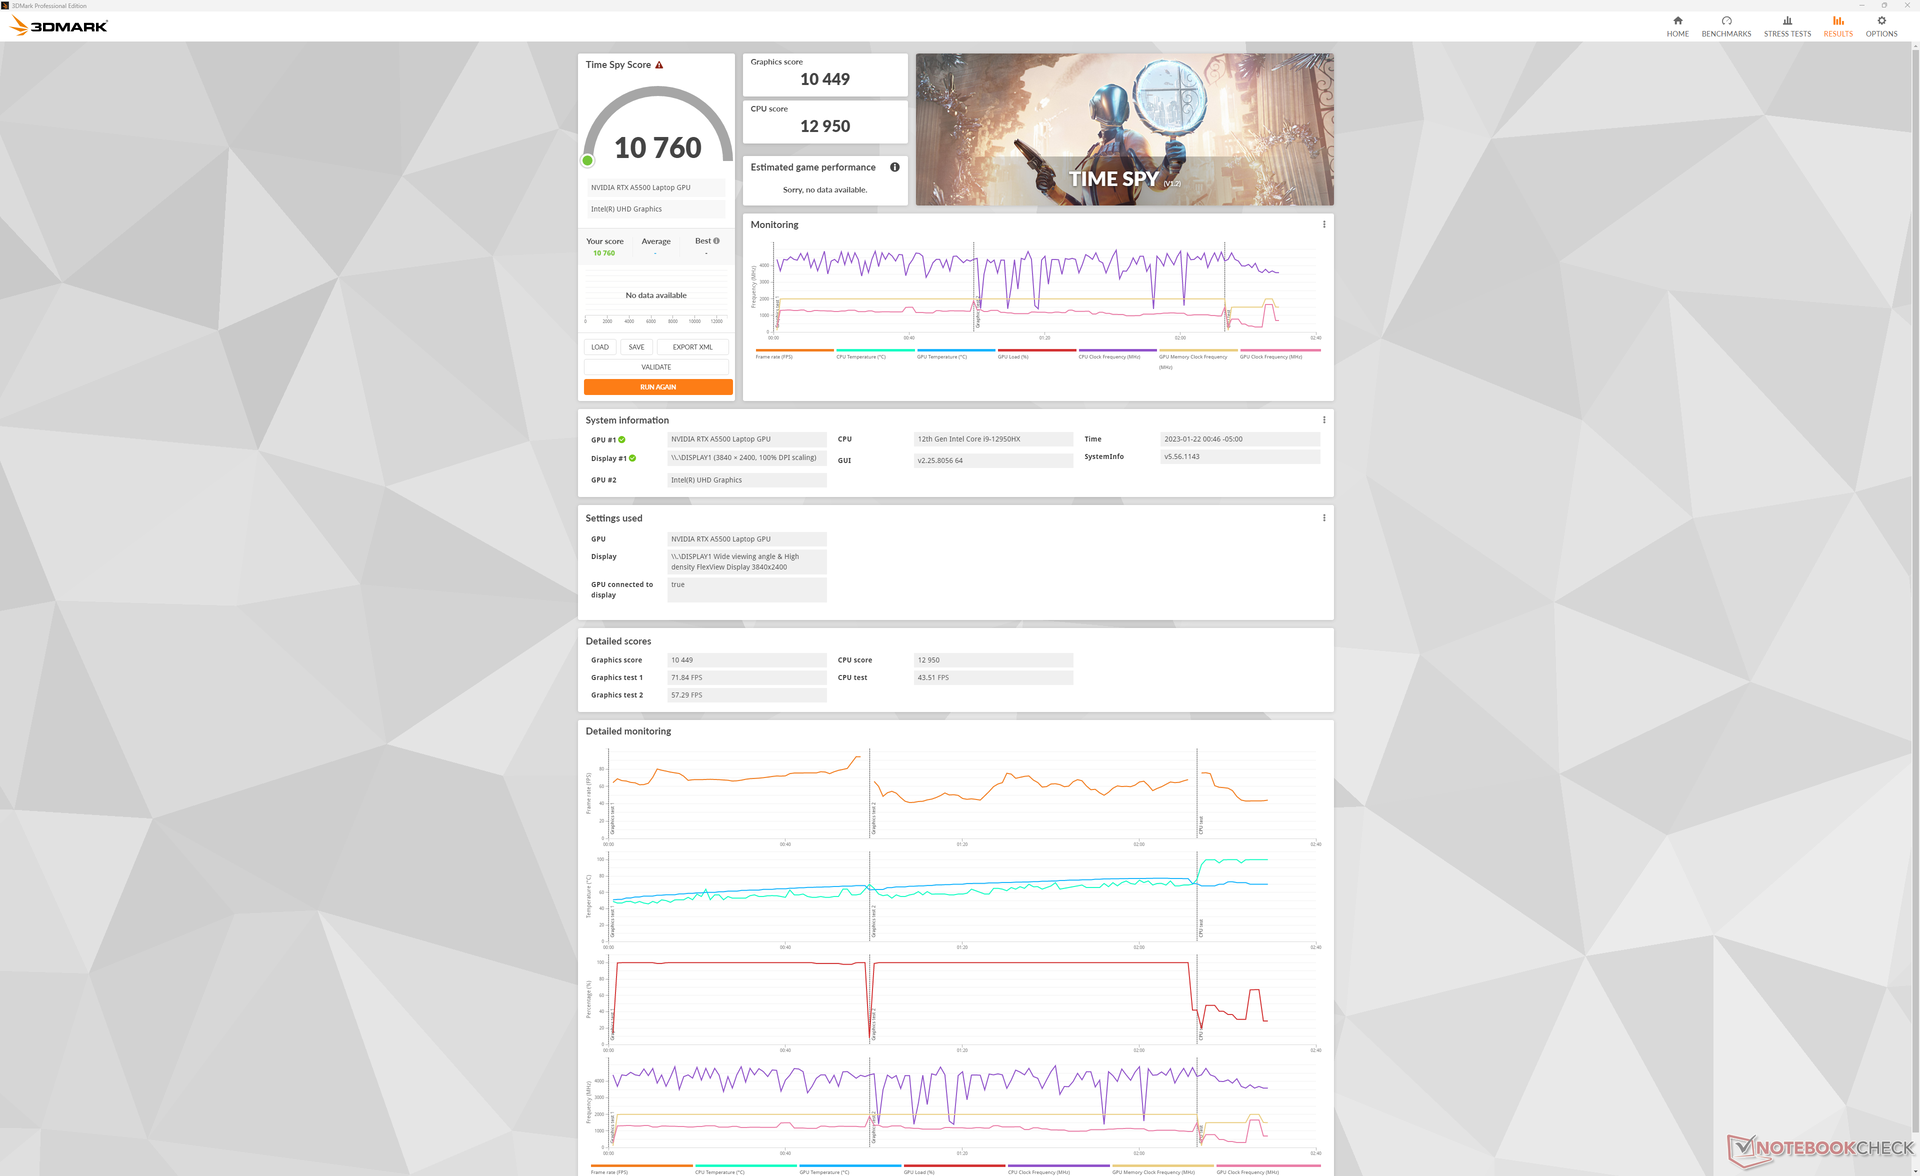
| 3DMark Time Spy Score | 10760 poäng | |
Hjälp | ||
* ... mindre är bättre
Witcher 3 FPS Chart
| låg | med. | hög | ultra | QHD | 4K | |
|---|---|---|---|---|---|---|
| GTA V (2015) | 185.9 | 183.4 | 177.7 | 124.4 | 103.5 | |
| The Witcher 3 (2015) | 489.4 | 329.9 | 211.8 | 110.4 | 63.7 | |
| Dota 2 Reborn (2015) | 194.3 | 174.5 | 166.1 | 156.3 | 132.8 | |
| Final Fantasy XV Benchmark (2018) | 212 | 142.5 | 113.1 | 83.5 | 45.4 | |
| X-Plane 11.11 (2018) | 155.8 | 137.6 | 108.8 | 93.7 | ||
| Strange Brigade (2018) | 442 | 264 | 223 | 197.7 | 138.6 | |
| Cyberpunk 2077 1.6 (2022) | 132.3 | 117.7 | 96.1 | 80.7 | 47 | 20.4 |
Utsläpp
Systembrus
I standardläget Balanced (balanserat) var fläktarna tysta under längre perioder än väntat, trots de högpresterande processorerna inuti. När man körde 3DMark 06, till exempel, nådde fläktljudet upp till bara 28 dB(A) i slutet av den första benchmark-scenen. Det skulle ta flera körningar innan fläktarna skulle pulsera till högre varvtal på upp till 40 dB(A).
Fläktljudet vid mer krävande belastningar i prestandaläget skulle nå en toppnotering på drygt 50 dB(A) och vara märkbart högre än konkurrerande arbetsstationer, inklusive Precision 7670, vilket framgår av tabellen nedan. Naturligtvis är dessa alternativ också långsammare än vår Lenovokonfiguration.
Ljudnivå
| Låg belastning |
| 23.1 / 23.1 / 23.1 dB(A) |
| Hög belastning |
| 28.9 / 51.4 dB(A) |
 | ||
30 dB tyst 40 dB(A) hörbar 50 dB(A) högt ljud |
||
min: | ||
| Lenovo ThinkPad P16 G1 RTX A5500 RTX A5500 Laptop GPU, i9-12950HX, WDC PC SN810 2TB | Asus ProArt StudioBook 16 W7600H5A-2BL2 RTX A5000 Laptop GPU, W-11955M, 2x Micron 2300 2TB MTFDHBA2T0TDV (RAID 0) | Dell Precision 7000 7670 Performance RTX A5500 Laptop GPU, i9-12950HX | Lenovo ThinkPad P16 G1 21D6001DMB RTX A2000 Laptop GPU, i7-12850HX, Micron 3400 1TB MTFDKBA1T0TFH | MSI CreatorPro Z16P B12UKST RTX A3000 Laptop GPU, i7-12700H, Samsung PM9A1 MZVL21T0HCLR | HP ZBook Studio 16 G9 62U04EA RTX A2000 Laptop GPU, i7-12800H, Micron 3400 1TB MTFDKBA1T0TFH | |
|---|---|---|---|---|---|---|
| Noise | -14% | -16% | -6% | -11% | -9% | |
| av / miljö * (dB) | 23.1 | 26 -13% | 23.9 -3% | 23.2 -0% | 24.1 -4% | 24 -4% |
| Idle Minimum * (dB) | 23.1 | 26 -13% | 24 -4% | 23.2 -0% | 27.1 -17% | 24 -4% |
| Idle Average * (dB) | 23.1 | 26 -13% | 24 -4% | 23.2 -0% | 27.1 -17% | 27.7 -20% |
| Idle Maximum * (dB) | 23.1 | 26.5 -15% | 38 -65% | 23.2 -0% | 27.1 -17% | 27.7 -20% |
| Load Average * (dB) | 28.9 | 42 -45% | 46.3 -60% | 47.8 -65% | 42.9 -48% | 39.8 -38% |
| Witcher 3 ultra * (dB) | 51.6 | 41.9 19% | 34.1 34% | 44 15% | 44.3 14% | |
| Load Maximum * (dB) | 51.4 | 43 16% | 47.9 7% | 56.3 -10% | 47 9% | 47.7 7% |
* ... mindre är bättre
Temperatur
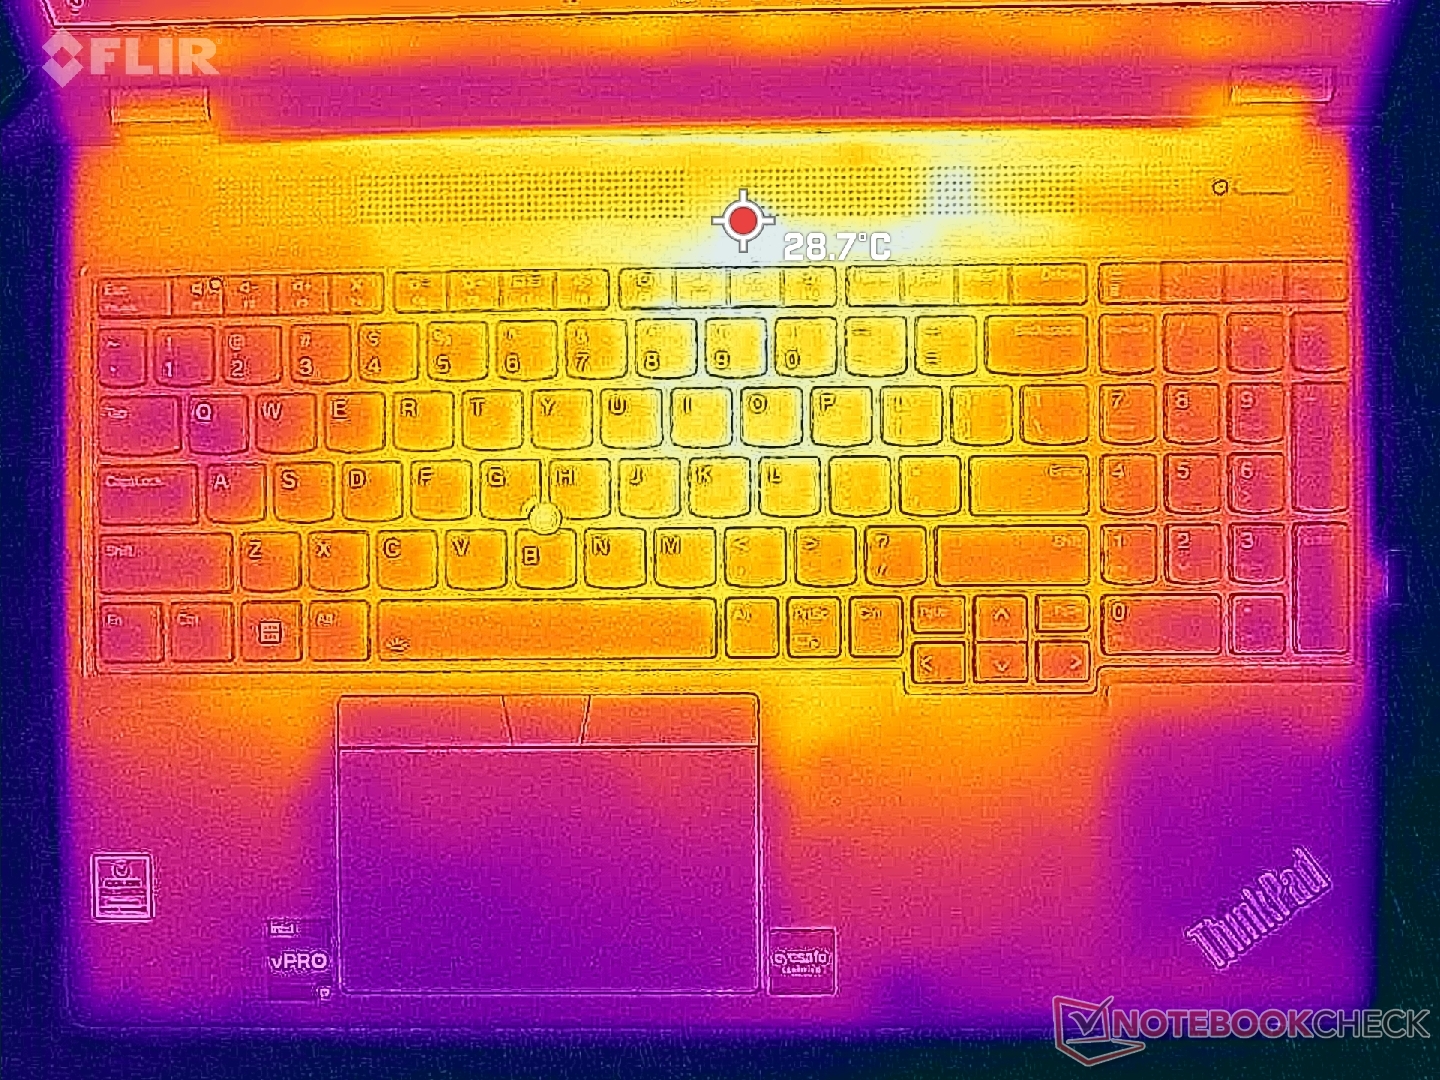
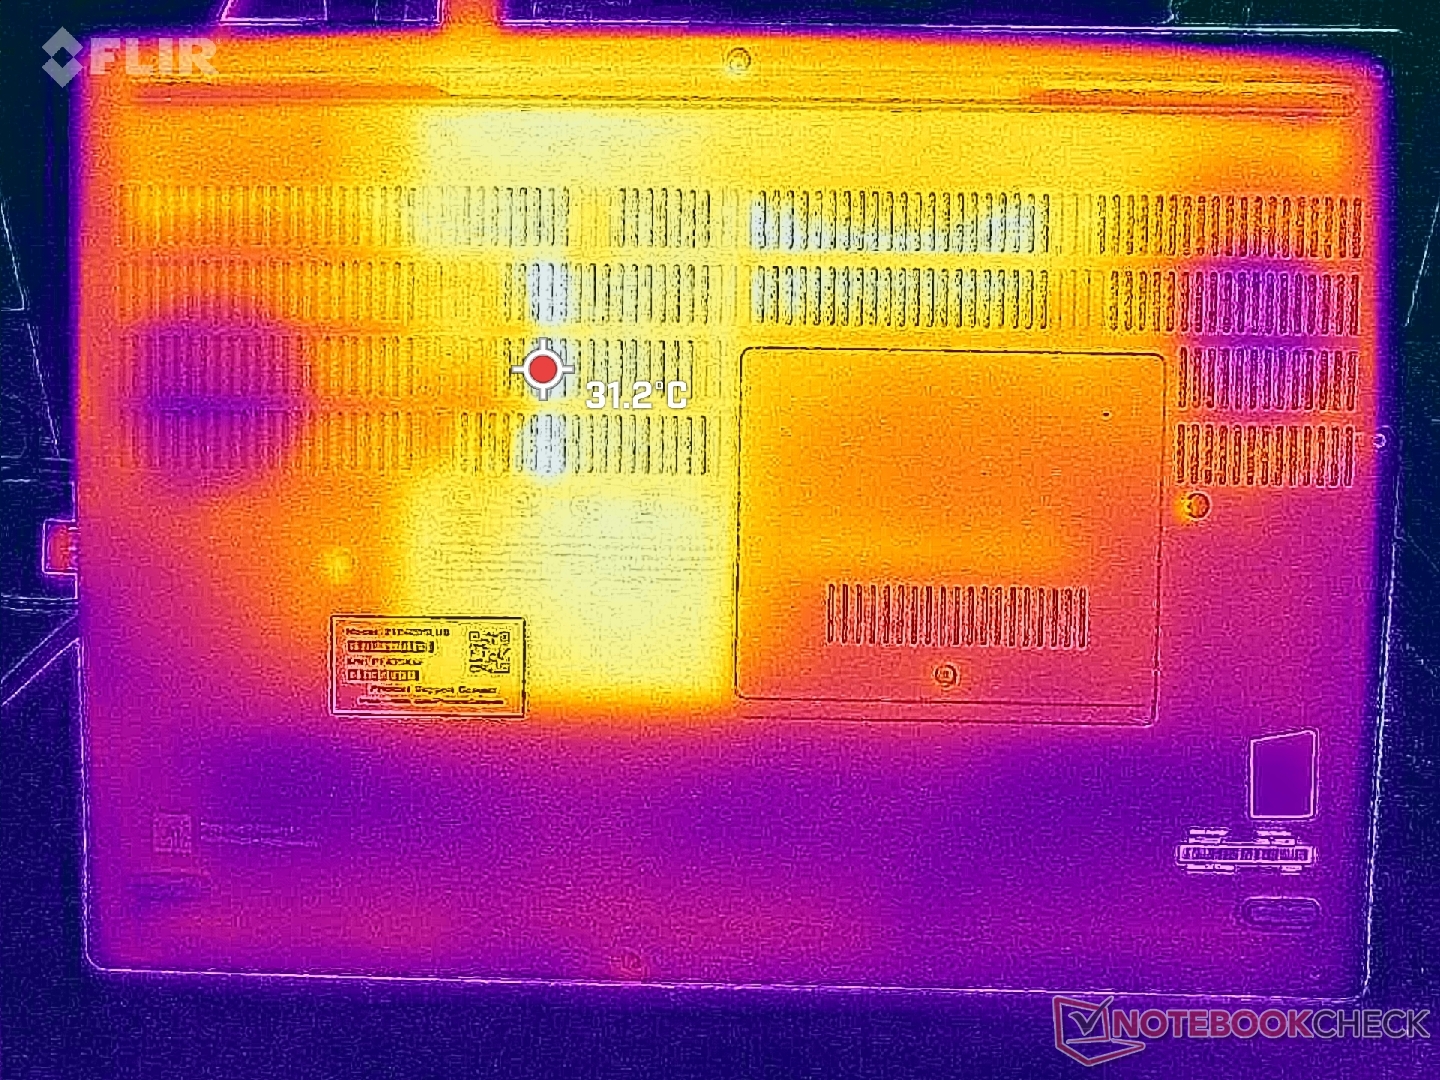
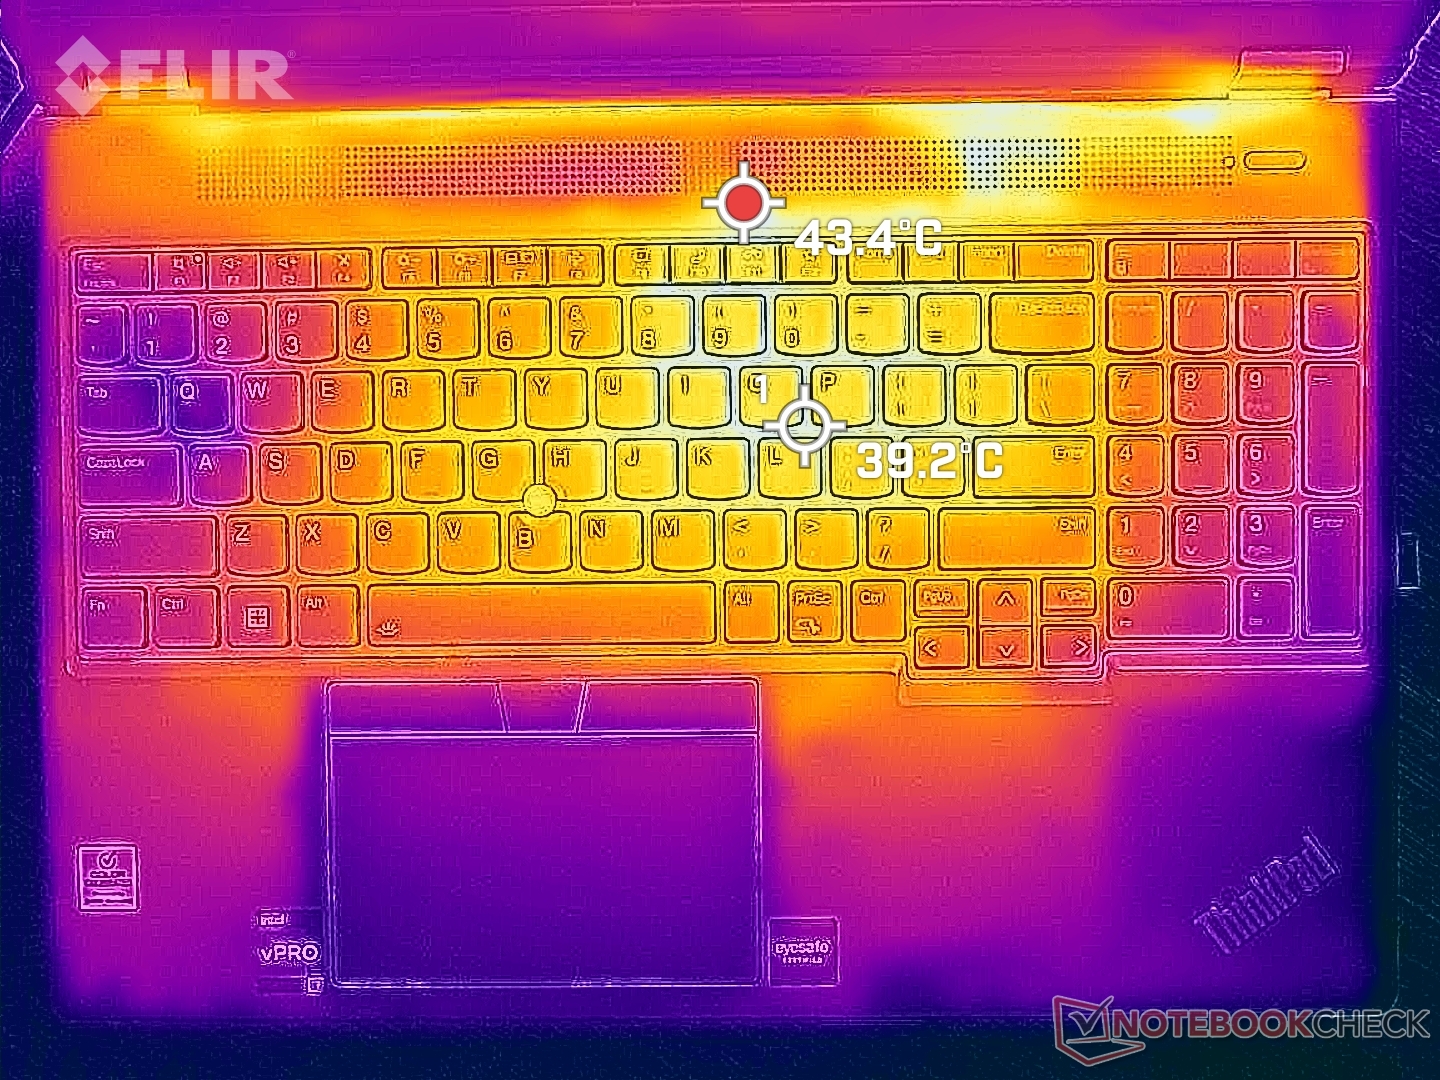
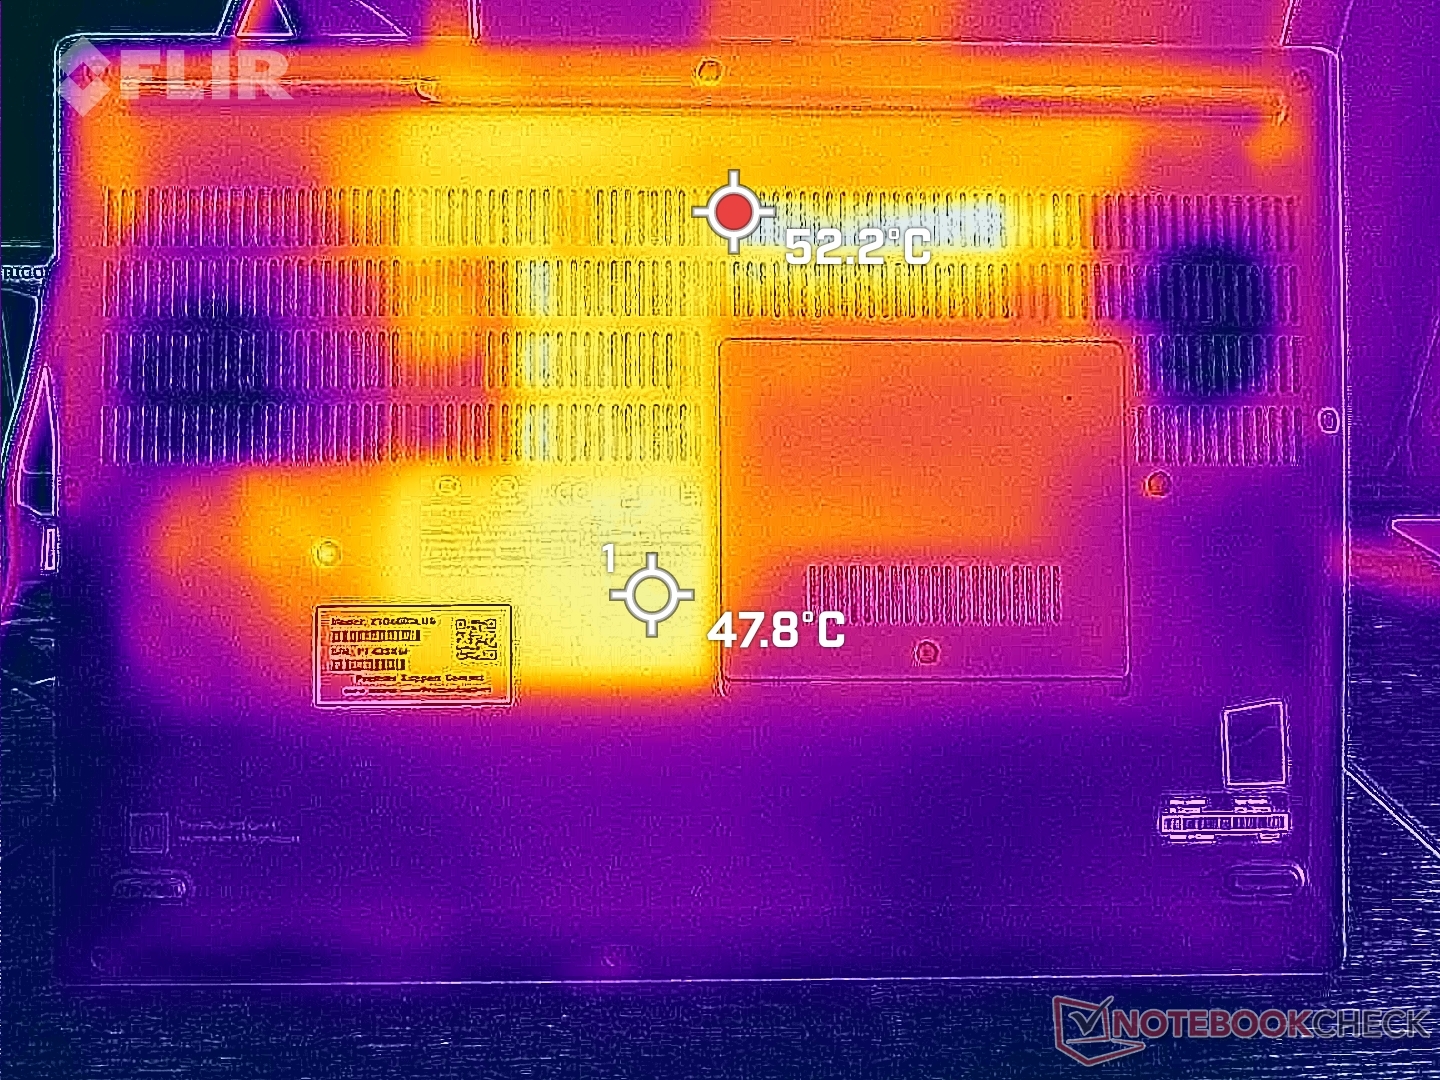
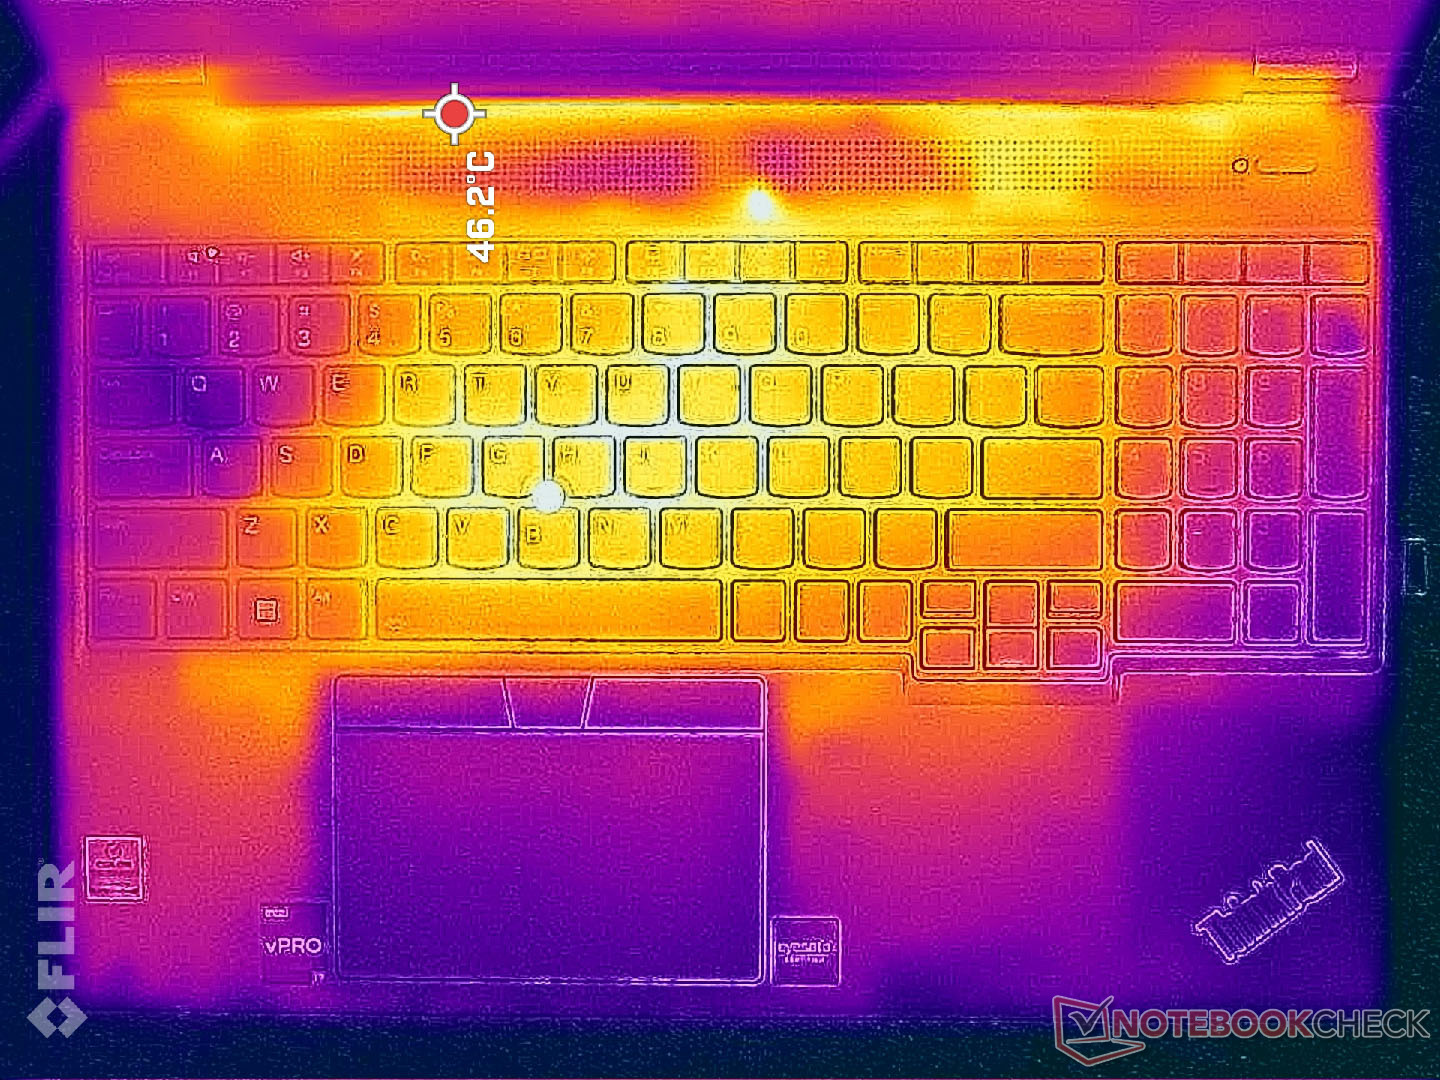
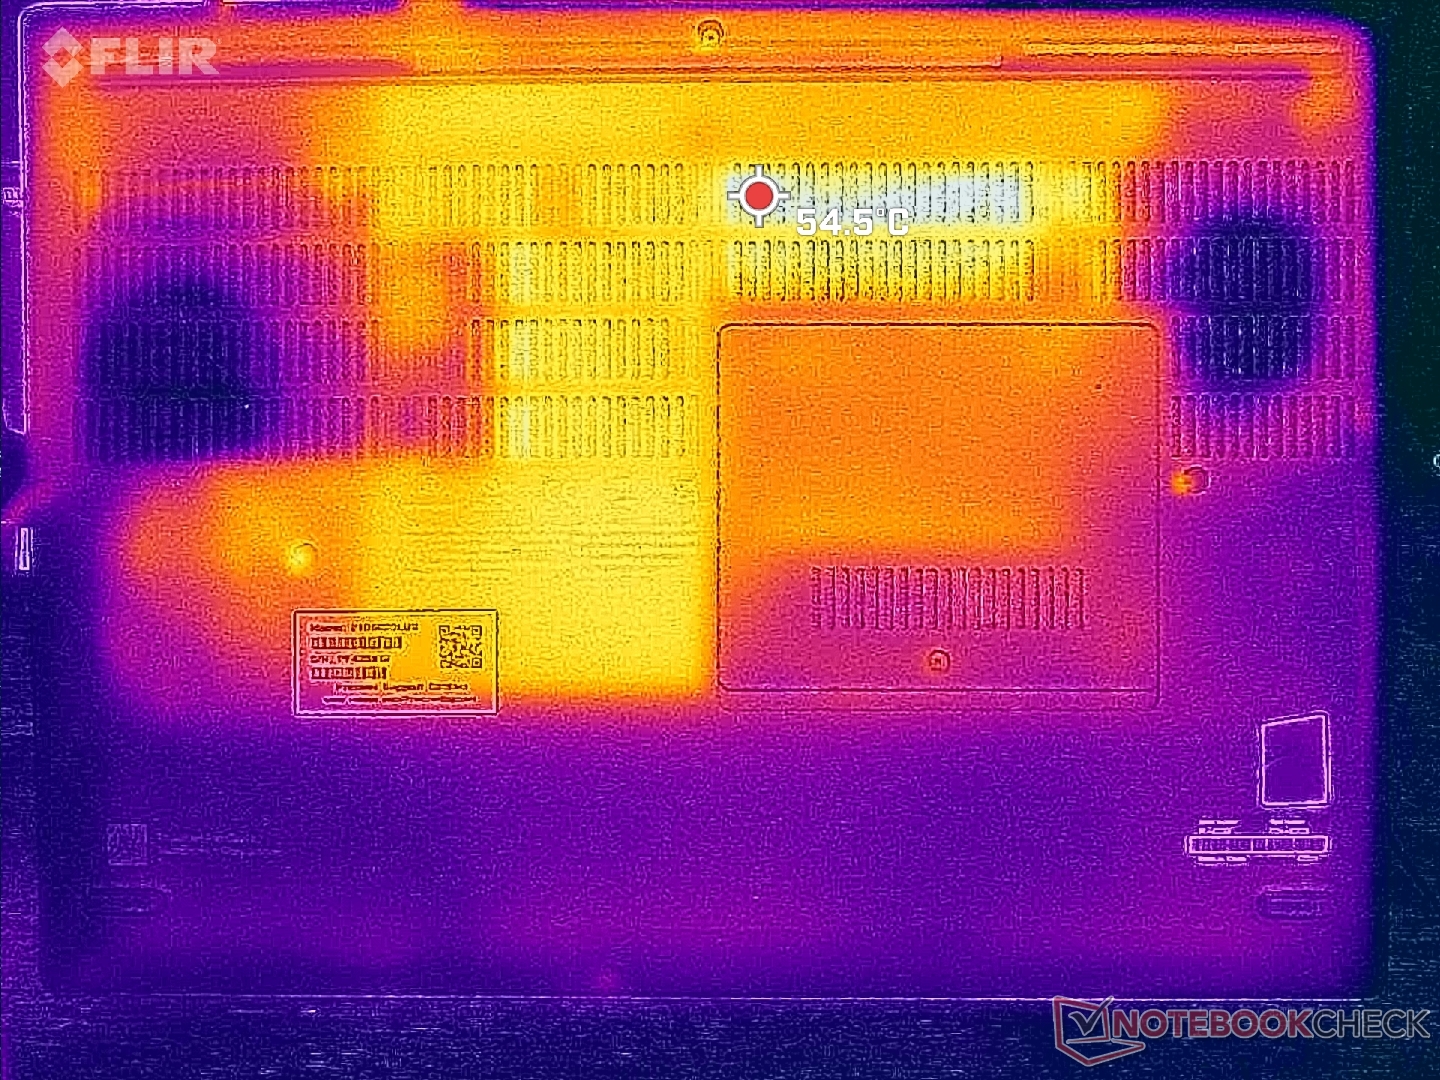
Yttemperaturen är varmare än förväntat även när den går på tomgång på skrivbordet utan några pågående program. Bottenytan kan till exempel bli så varm som 37 C jämfört med 31 C på Precision 7670. Om man kör högre belastning kan samma varma punkter på Lenovo nå 49 C eller varmare medan tangentbordets mittpunkt kan nå 40 C. Hudtemperaturerna kan kännas obehagliga om den bärbara datorn ligger i knät i stället för på ett bord.
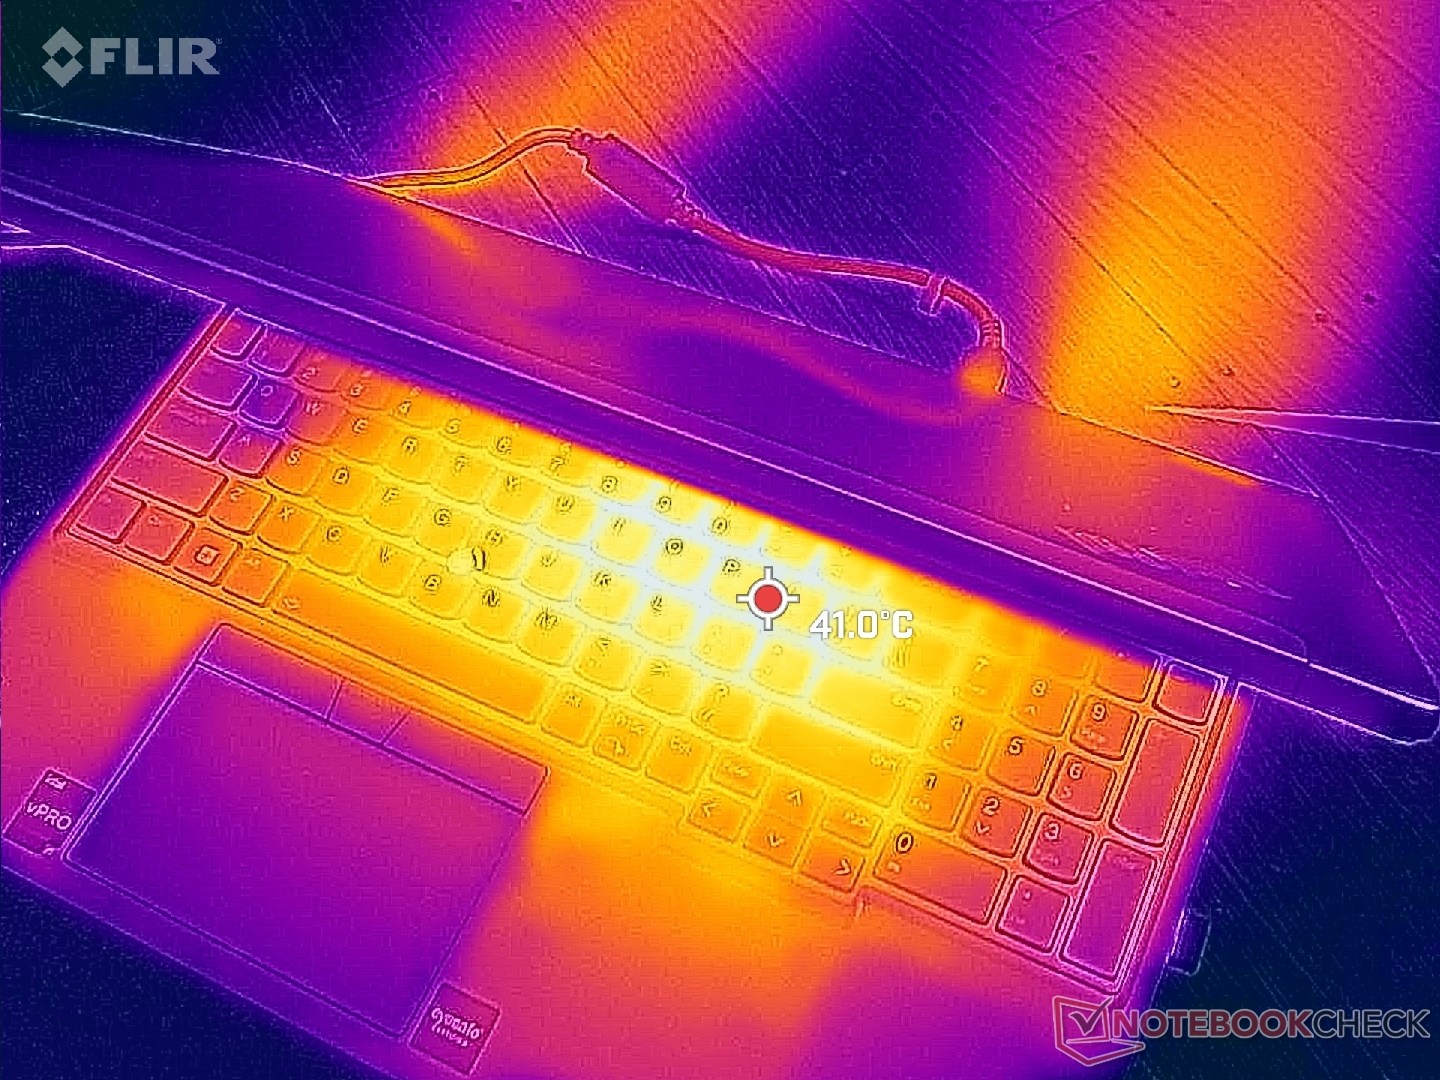
(±) Den maximala temperaturen på ovansidan är 44.8 °C / 113 F, jämfört med genomsnittet av 38.2 °C / 101 F , allt från 22.2 till 69.8 °C för klassen Workstation.
(-) Botten värms upp till maximalt 49.8 °C / 122 F, jämfört med genomsnittet av 41.1 °C / 106 F
(+) Vid tomgångsbruk är medeltemperaturen för ovansidan 28.6 °C / 83 F, jämfört med enhetsgenomsnittet på 32 °C / ### class_avg_f### F.
(±) När du spelar The Witcher 3 är medeltemperaturen för ovansidan 36.4 °C / 98 F, jämfört med enhetsgenomsnittet på 32 °C / ## #class_avg_f### F.
(+) Handledsstöden och pekplattan når maximal hudtemperatur (32.4 °C / 90.3 F) och är därför inte varma.
(-) Medeltemperaturen för handledsstödsområdet på liknande enheter var 27.8 °C / 82 F (-4.6 °C / -8.3 F).
| Lenovo ThinkPad P16 G1 RTX A5500 Intel Core i9-12950HX, NVIDIA RTX A5500 Laptop GPU | Asus ProArt StudioBook 16 W7600H5A-2BL2 Intel Xeon W-11955M, NVIDIA RTX A5000 Laptop GPU | Dell Precision 7000 7670 Performance Intel Core i9-12950HX, NVIDIA RTX A5500 Laptop GPU | Lenovo ThinkPad P16 G1 21D6001DMB Intel Core i7-12850HX, NVIDIA RTX A2000 Laptop GPU | MSI CreatorPro Z16P B12UKST Intel Core i7-12700H, NVIDIA RTX A3000 Laptop GPU | HP ZBook Studio 16 G9 62U04EA Intel Core i7-12800H, NVIDIA RTX A2000 Laptop GPU | |
|---|---|---|---|---|---|---|
| Heat | -1% | -3% | 17% | -3% | 9% | |
| Maximum Upper Side * (°C) | 44.8 | 45.7 -2% | 53 -18% | 43.1 4% | 56.3 -26% | 38.7 14% |
| Maximum Bottom * (°C) | 49.8 | 48.3 3% | 43.2 13% | 39.9 20% | 68.3 -37% | 53.4 -7% |
| Idle Upper Side * (°C) | 30.6 | 35.3 -15% | 36.8 -20% | 26 15% | 25.2 18% | 27.3 11% |
| Idle Bottom * (°C) | 38.6 | 34.4 11% | 33.8 12% | 27.6 28% | 25.9 33% | 31.6 18% |
* ... mindre är bättre
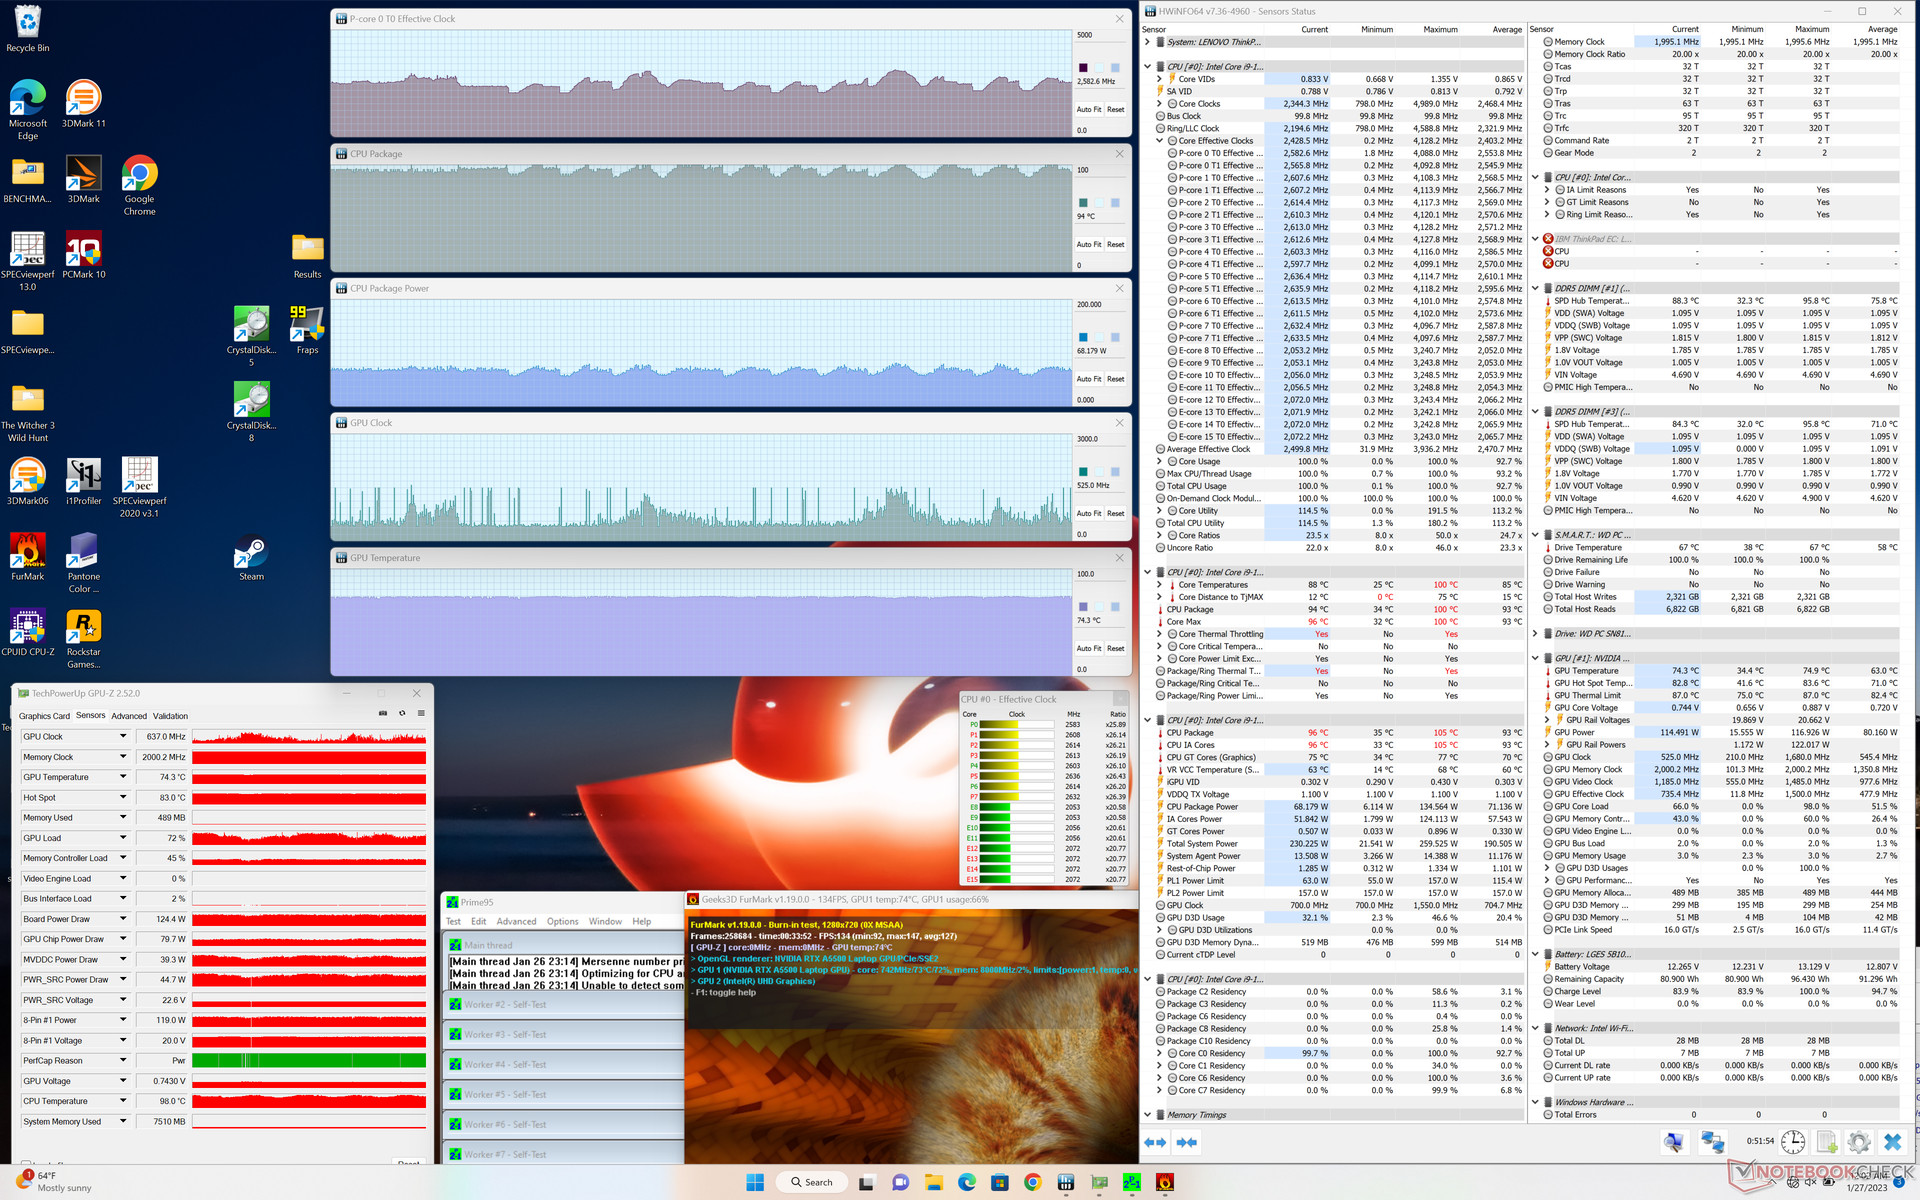
Stresstest
Systemet är definitivt ansträngt när processorerna är hårt belastade. När Prime95 körs, till exempel, ökar CPU-klockfrekvensen och kortets strömförbrukning till 4,1 GHz respektive 135 W. Tyvärr skulle kärntemperaturen nästan omedelbart stiga till 100 C och klockfrekvensen skulle därför snabbt sjunka för att förhindra ännu varmare temperaturer. Processorn skulle slutligen stabiliseras vid 3 GHz, 82 W och 100 C, vilket innebär att den tänjer på gränserna för ThinkPad P16 G1-kylningslösningen. Om detta test upprepas på Precision 7670 som är utrustad med samma processor skulle det resultera i en långsammare stabil klockfrekvens på 2,3 GHz och en svalare kärntemperatur på 78 C.
När du kör Witcher 3 för att representera hög belastning skulle GPU-klockfrekvensen, minnesklockan och temperaturen stabiliseras vid 1477 MHz, 2000 MHz respektive 78 C, jämfört med 1417 MHz, 1750 MHz och 82 C på Precision 7670 under liknande förhållanden. Styrelsens strömförbrukning skulle också vara högre på vår Lenovo på 129 W jämfört med bara 100 W på Dell, vilket skulle förklara de fördelar med GPU-prestanda som nämns ovan.
Att köra på batteri begränsar prestandan. Ett Fire Strike -test på batterier skulle ge fysik- och grafikpoäng på 18903 respektive 12395 poäng, jämfört med 31226 respektive 28885 poäng på nätström.
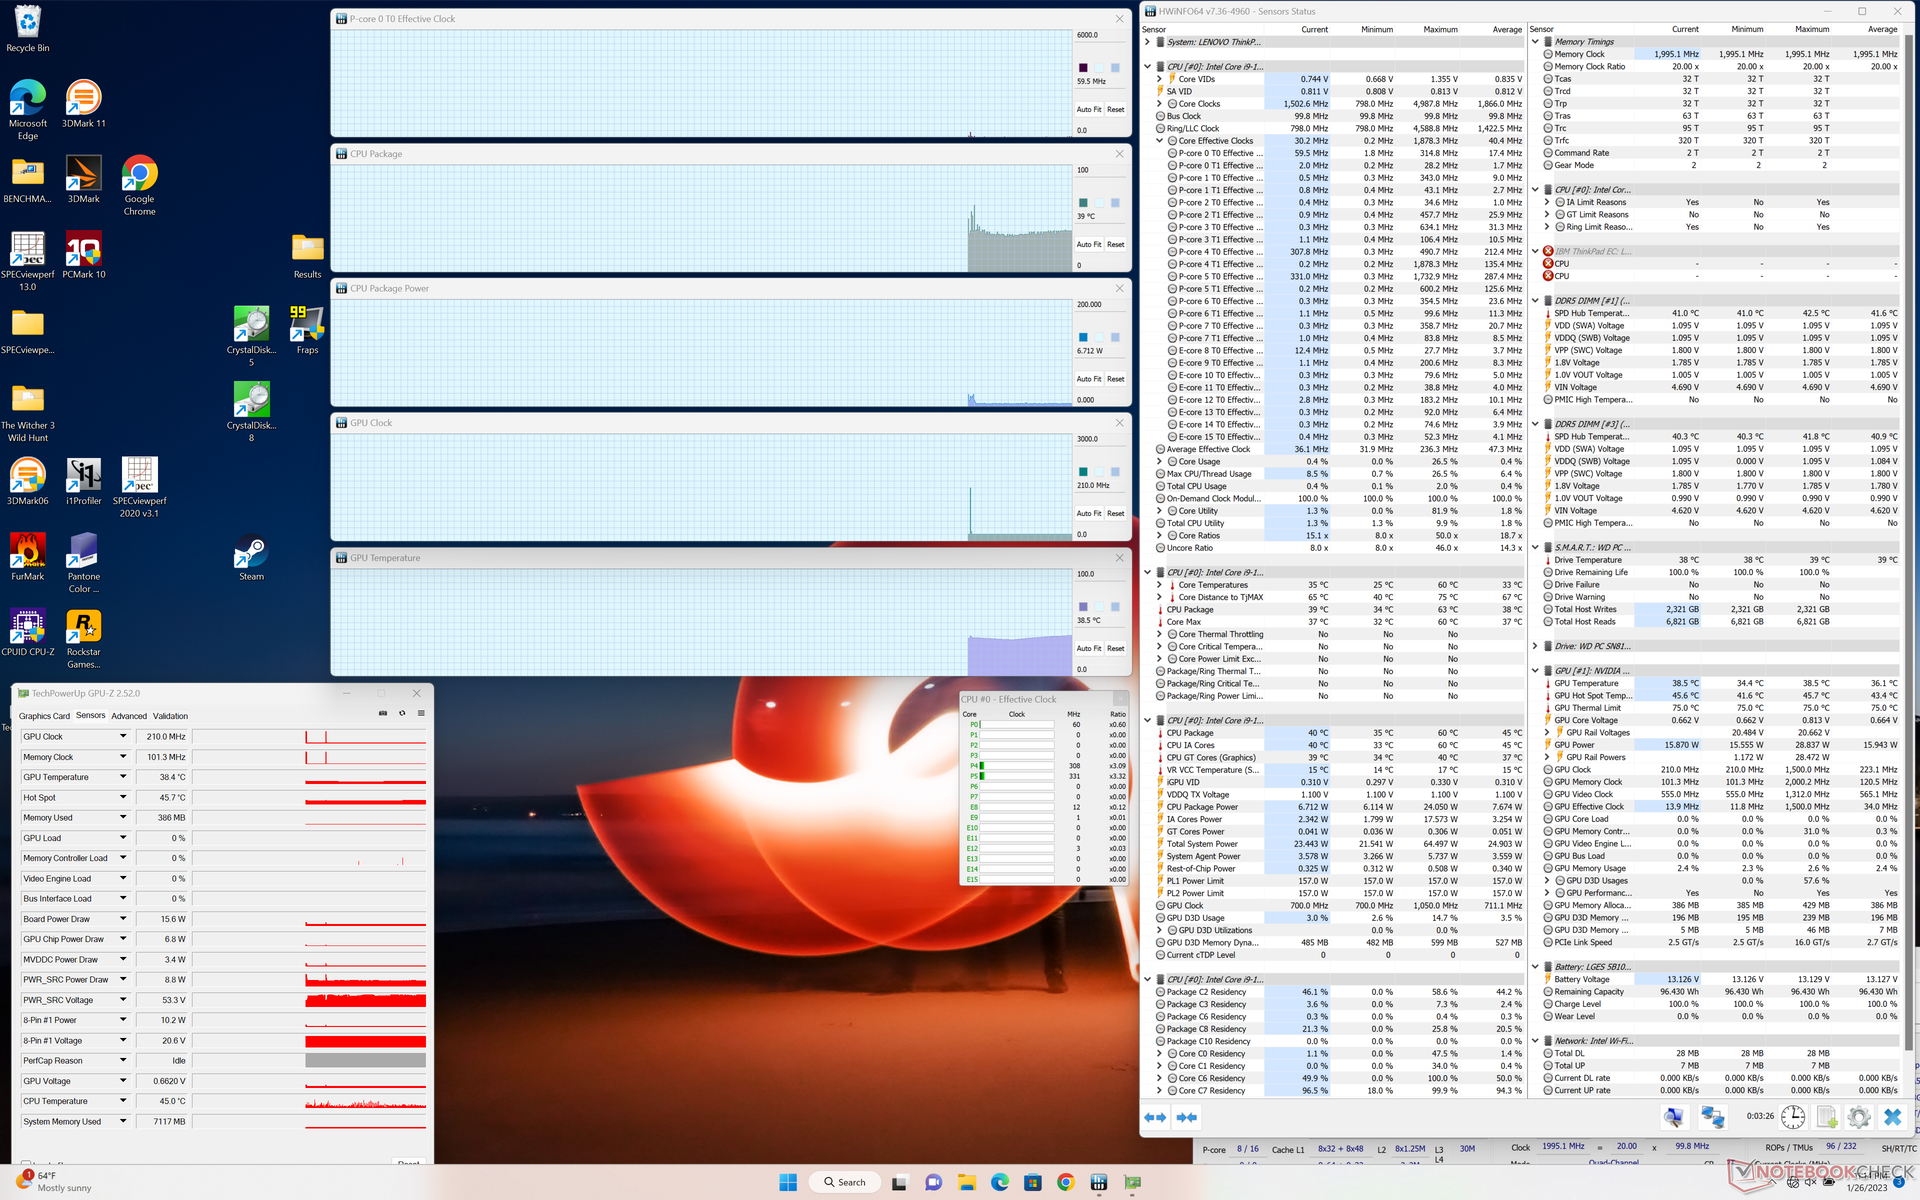
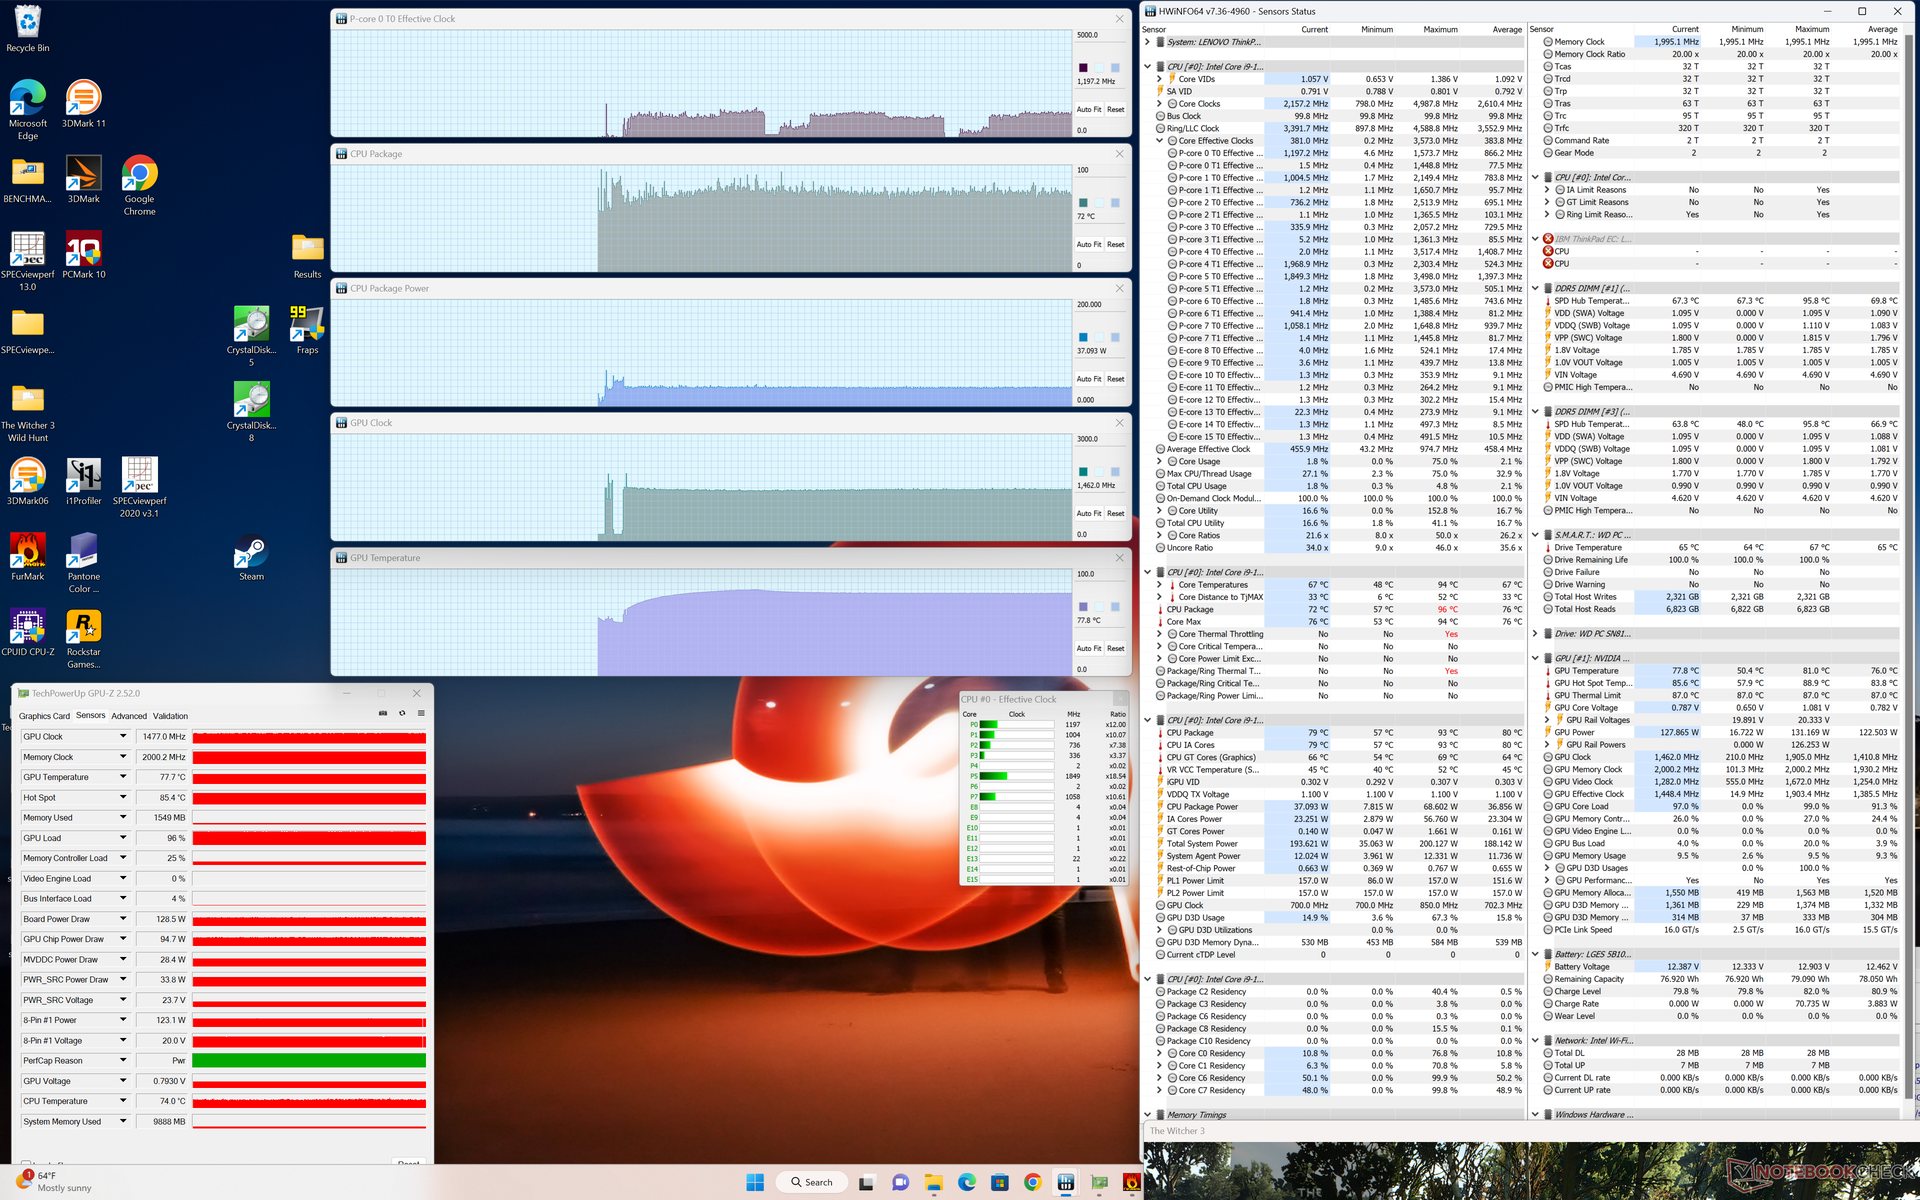
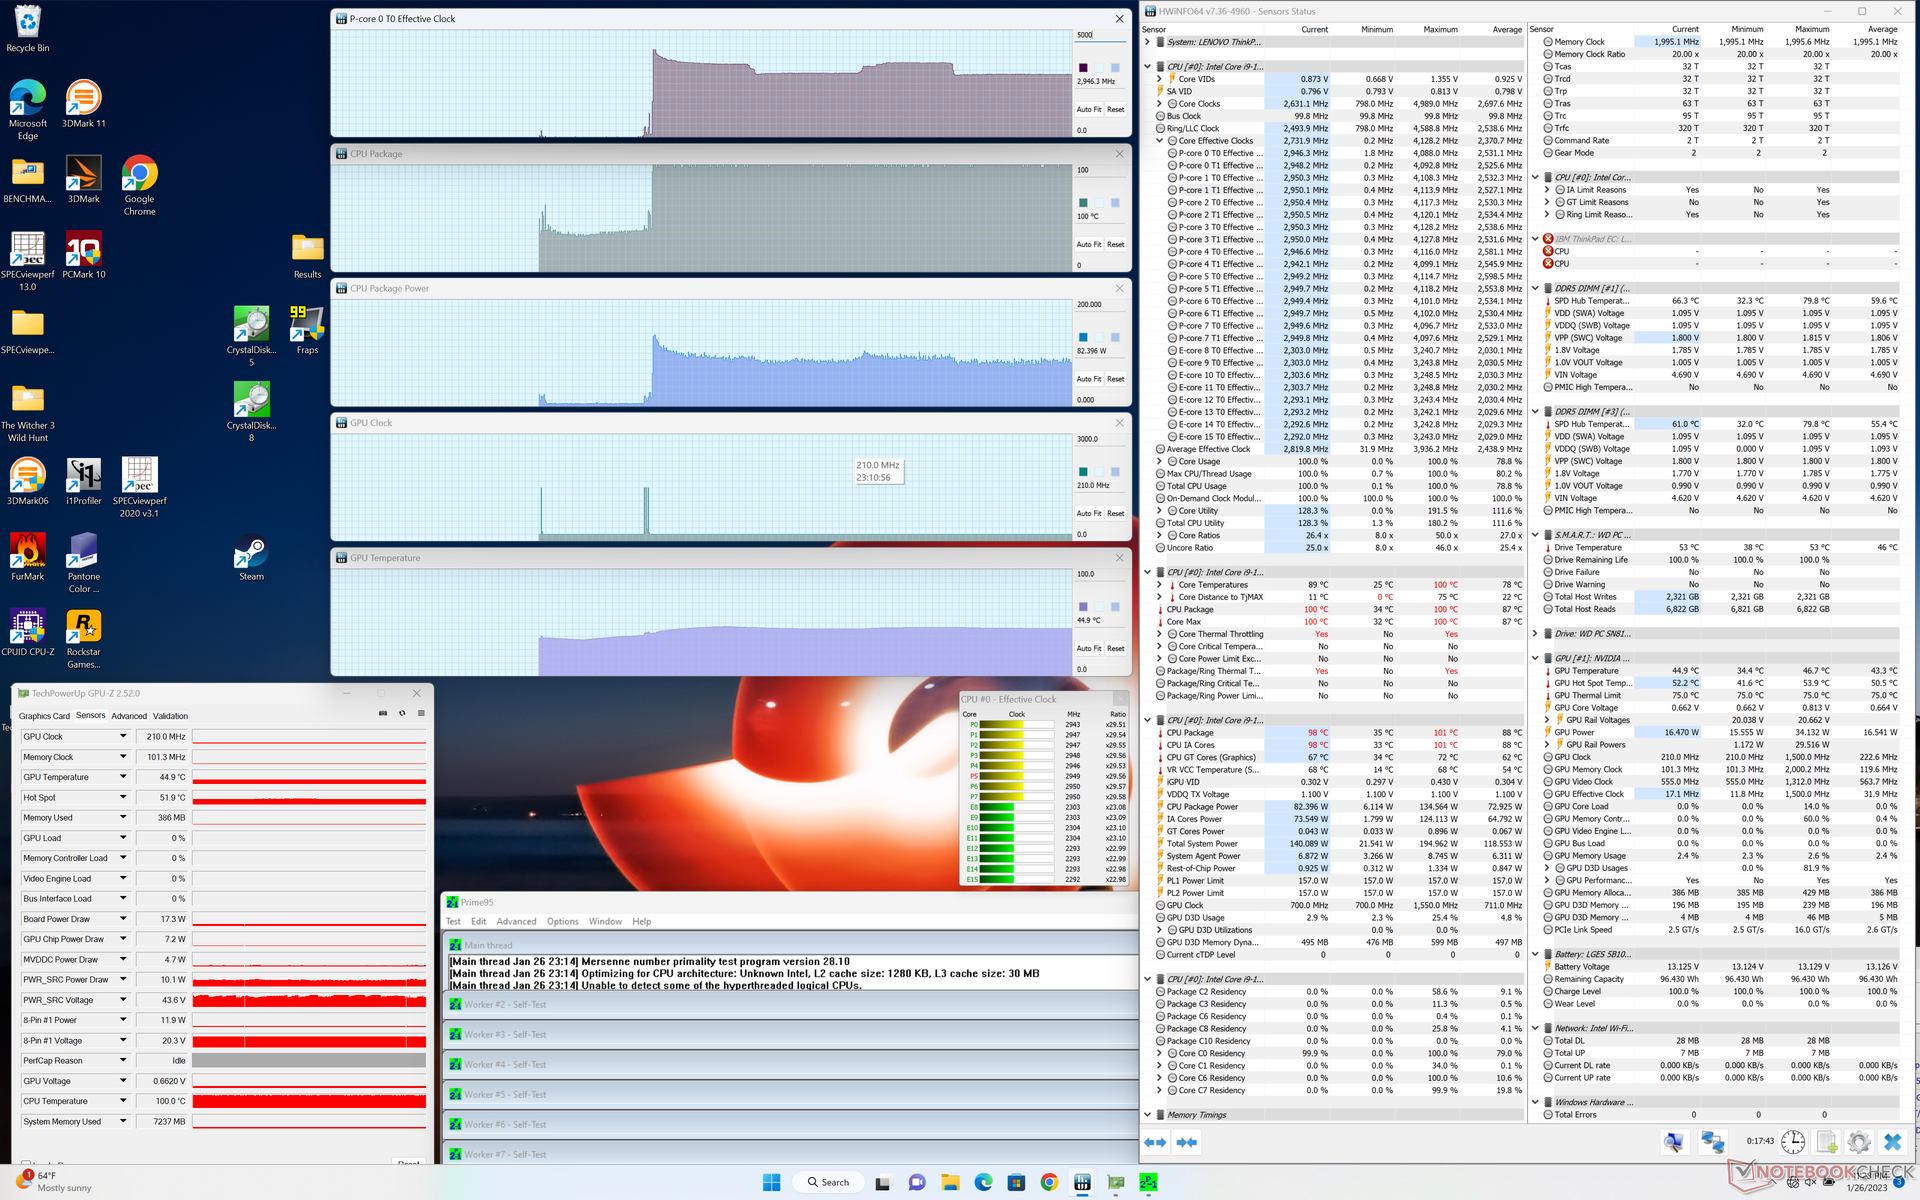
| CPU-klocka (GHz) | GPU-klocka (MHz) | Genomsnittlig CPU-temperatur (°C) | Genomsnittlig GPU-temperatur (°C) | |
| Systemets tomgång | -- | -- | 39 | 39 |
| Prime95 Stress | 3.0 | -- | 100 | 45 |
| Prime95 + FurMark Stress | 2.1 - 2.8 | ~500 - 1550 | 88 - 100 | 75 |
| Witcher 3 Stress | ~1,2 | 1477 | 72 | 78 |
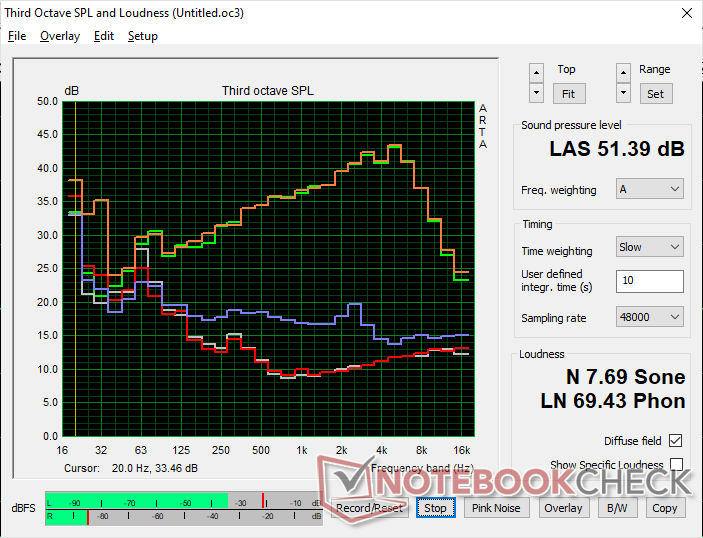
Högtalare
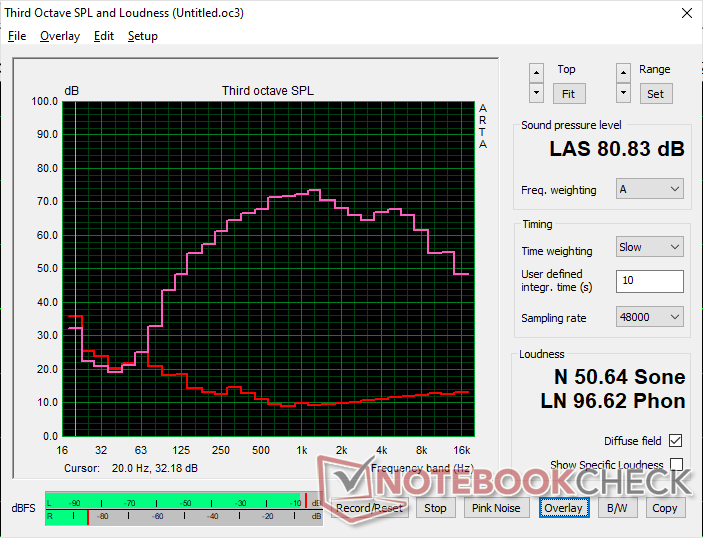
Lenovo ThinkPad P16 G1 RTX A5500 ljudanalys
(±) | högtalarljudstyrkan är genomsnittlig men bra (80.8 dB)
Bas 100 - 315 Hz
(±) | reducerad bas - i genomsnitt 11.1% lägre än medianen
(±) | linjäriteten för basen är genomsnittlig (9.7% delta till föregående frekvens)
Mellan 400 - 2000 Hz
(+) | balanserad mellan - endast 4.1% från medianen
(+) | mids är linjära (3.3% delta till föregående frekvens)
Högsta 2 - 16 kHz
(+) | balanserade toppar - endast 2.9% från medianen
(+) | toppar är linjära (5.2% delta till föregående frekvens)
Totalt 100 - 16 000 Hz
(+) | det totala ljudet är linjärt (13.2% skillnad mot median)
Jämfört med samma klass
» 23% av alla testade enheter i den här klassen var bättre, 6% liknande, 71% sämre
» Den bästa hade ett delta på 7%, genomsnittet var 17%, sämst var 35%
Jämfört med alla testade enheter
» 14% av alla testade enheter var bättre, 3% liknande, 84% sämre
» Den bästa hade ett delta på 4%, genomsnittet var 23%, sämst var 134%
Apple MacBook Pro 16 2021 M1 Pro ljudanalys
(+) | högtalare kan spela relativt högt (84.7 dB)
Bas 100 - 315 Hz
(+) | bra bas - bara 3.8% från medianen
(+) | basen är linjär (5.2% delta till föregående frekvens)
Mellan 400 - 2000 Hz
(+) | balanserad mellan - endast 1.3% från medianen
(+) | mids är linjära (2.1% delta till föregående frekvens)
Högsta 2 - 16 kHz
(+) | balanserade toppar - endast 1.9% från medianen
(+) | toppar är linjära (2.7% delta till föregående frekvens)
Totalt 100 - 16 000 Hz
(+) | det totala ljudet är linjärt (4.6% skillnad mot median)
Jämfört med samma klass
» 0% av alla testade enheter i den här klassen var bättre, 0% liknande, 100% sämre
» Den bästa hade ett delta på 5%, genomsnittet var 17%, sämst var 45%
Jämfört med alla testade enheter
» 0% av alla testade enheter var bättre, 0% liknande, 100% sämre
» Den bästa hade ett delta på 4%, genomsnittet var 23%, sämst var 134%
Energiförvaltning
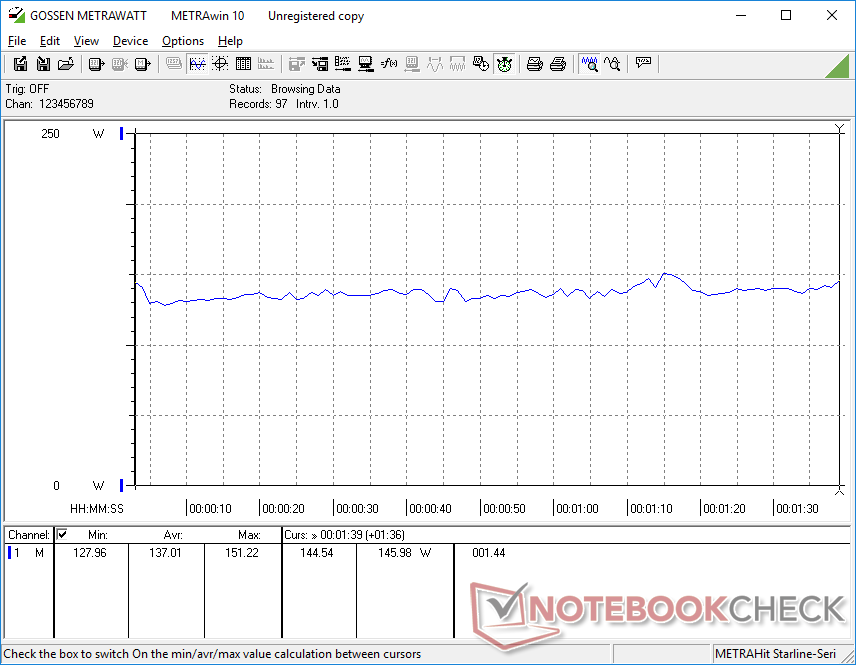
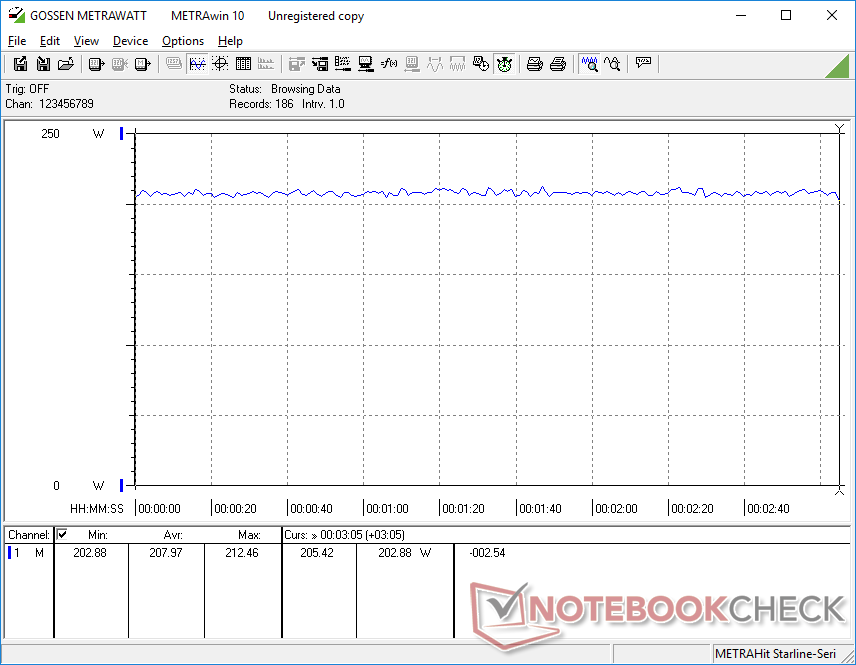
Effektförbrukning
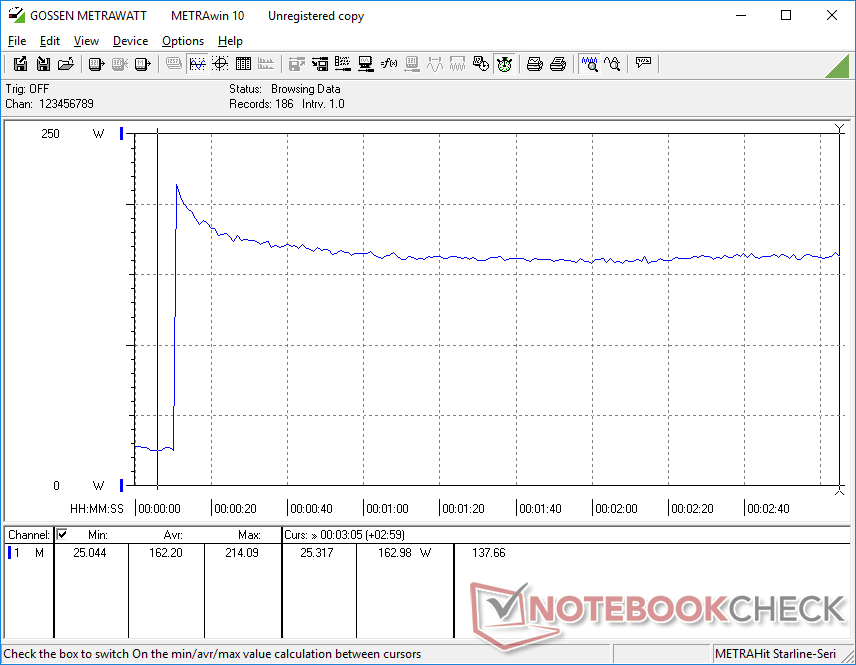
Strömförbrukningen vid tomgång är flera watt lägre än på Precision 7670, vilket sannolikt beror på den mer krävande OLED-panelen på den senare. Vid högre belastning som t.ex Witcher 3blir dock förbrukningen märkbart högre på Lenovo än på Dell (208 W jämfört med 159 W). Den högre strömförbrukningen sammanfaller med den snabbare CPU- och GPU-prestandan jämfört med den konkurrerande Dell-modellen, vilket visas genom våra benchmarks ovan.
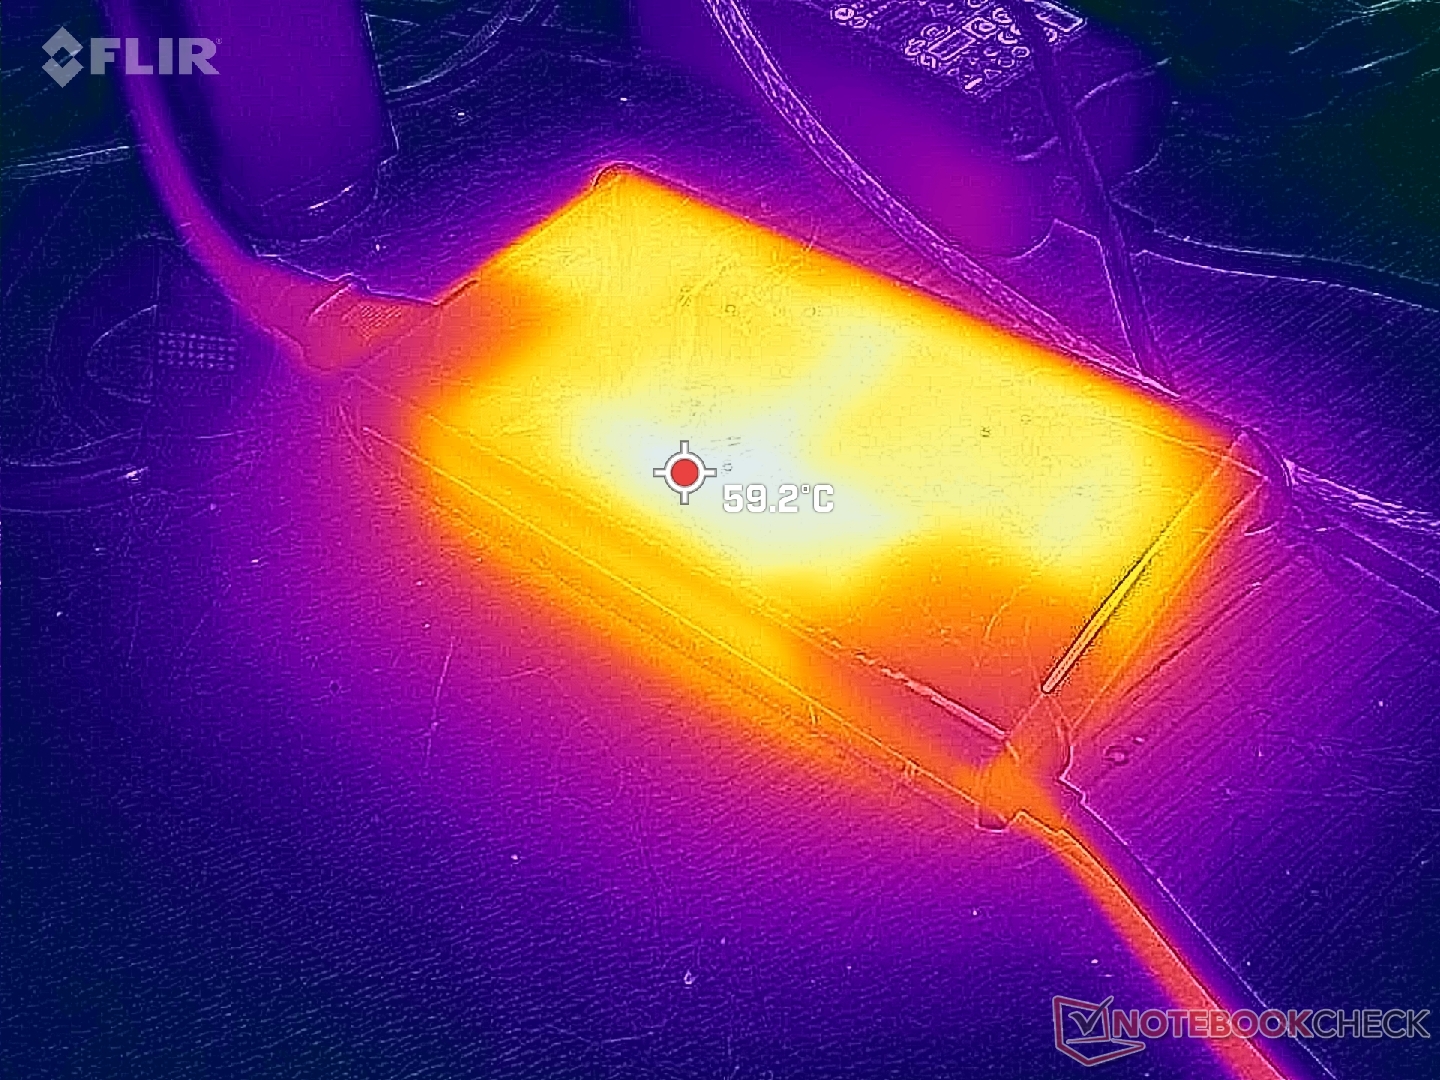
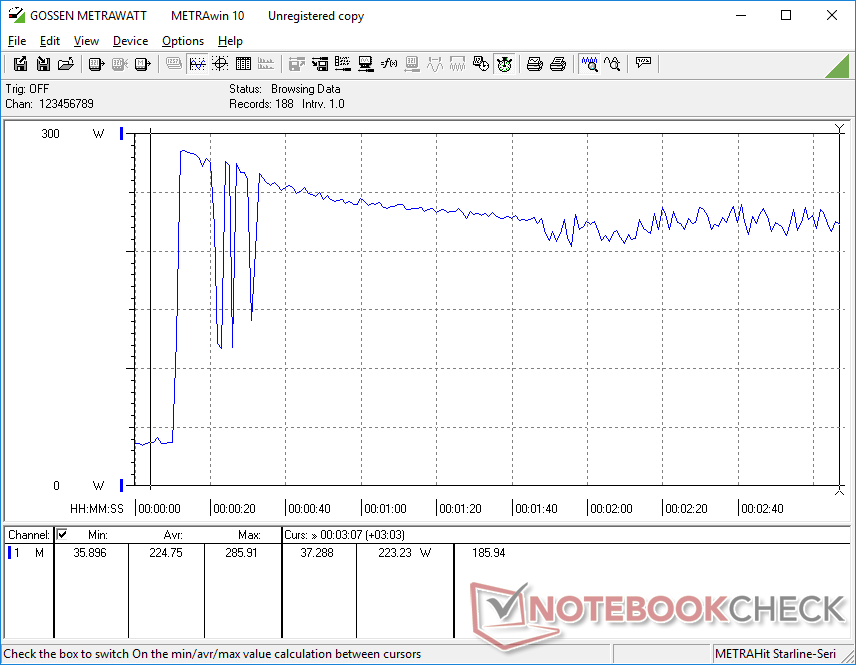
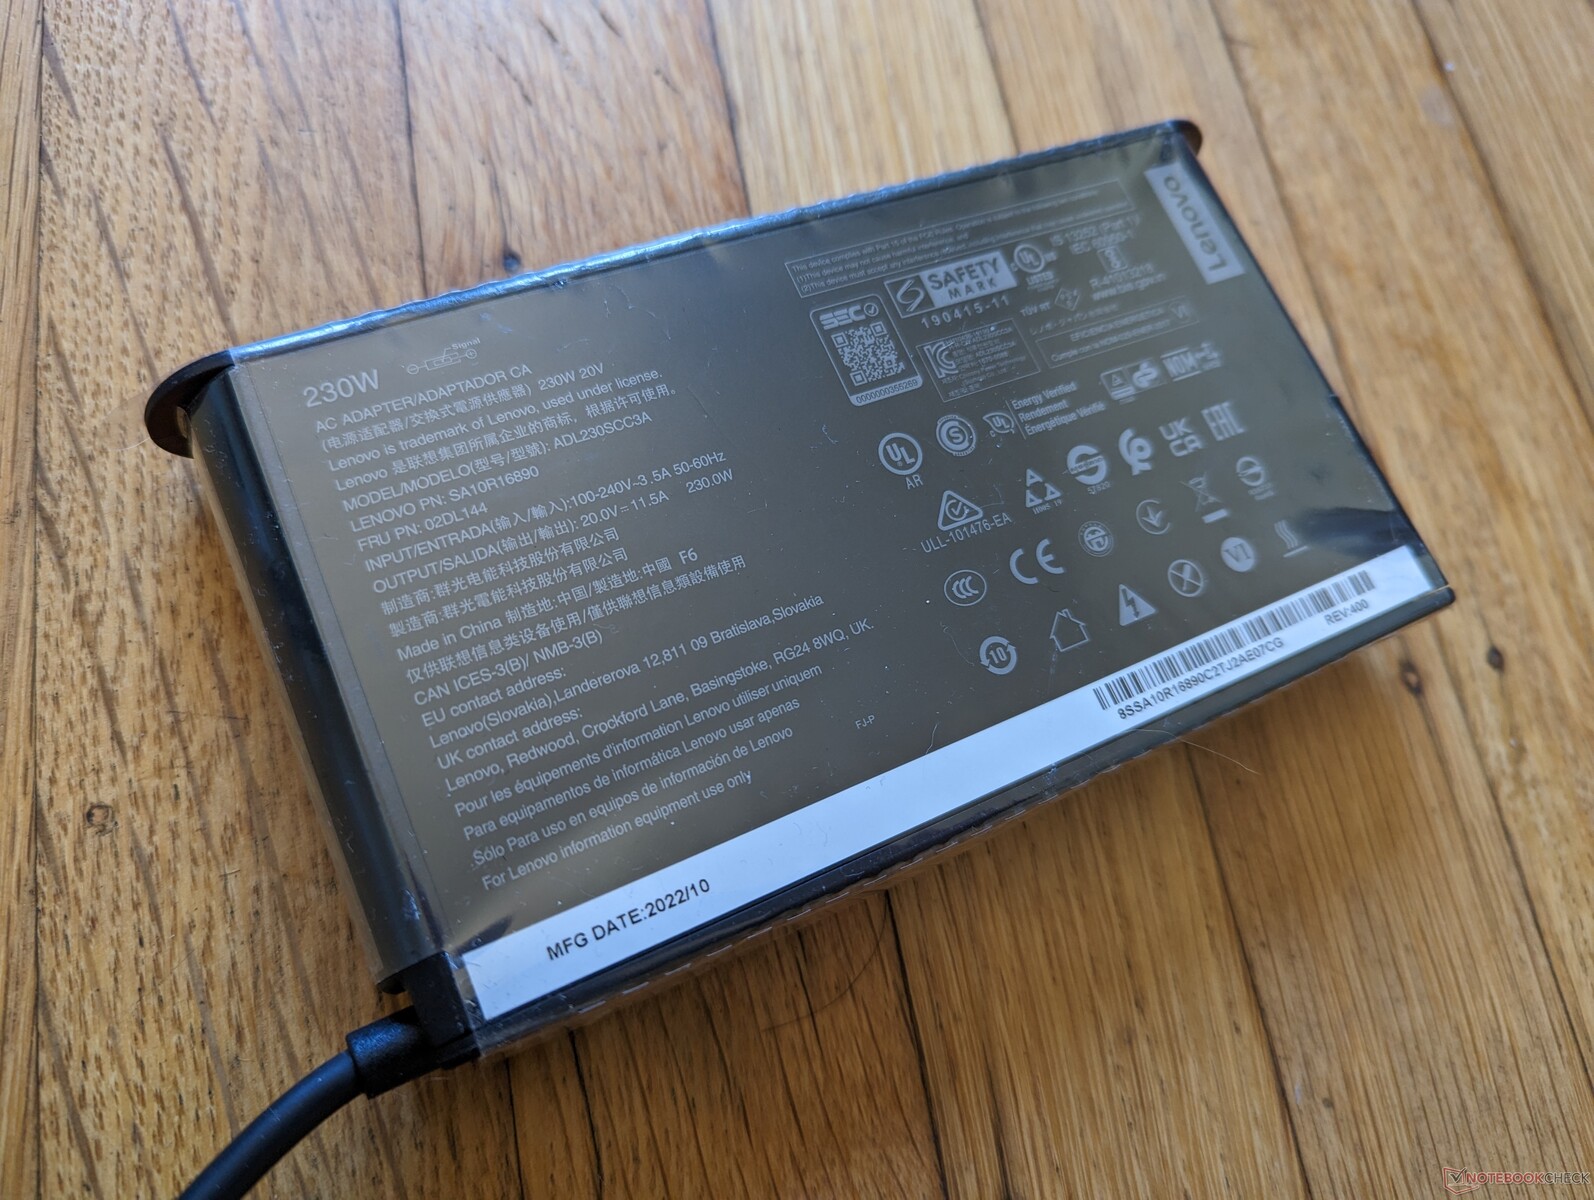
Även om kraftanvändare kanske uppskattar den extra prestandan är vår fullt laddade Lenovo betydligt mer krävande än de flesta andra mobila arbetsstationer. Faktum är att den medelstora (~15 x 8,6 x 2,6 cm) 230 W AC-adaptern kanske inte räcker till för att driva maskinen när CPU och GPU är högt utnyttjade. Vi kan mäta ett tillfälligt maximalt uttag på 286 W från 230 W-adaptern innan det så småningom sjunker och stabiliseras på cirka 223 W. Räkna alltså med att batteriladdningshastigheten kommer att sakta ner eller till och med bli negativ när du kör krävande belastningar. När du kör Witcher 3 i 90 minuter i sträck såg vi till exempel att batterinivån sjönk från 100 procent till 87 procent. Ett liknande beteende observerades på äldre XPS 17 eller Precision 5750. Det är synd att Lenovo inte erbjuder AC-adapteralternativ högre än 230 W vid kassan.
Att konfigurera med RTX A2000 i den lägre prisklassen skulle minska förbrukningen med ungefär hälften. I det här fallet skulle 230 W AC-adaptern vara tillräcklig.
| Av/Standby | |
| Låg belastning | |
| Hög belastning |
|
Förklaring:
min: | |
| Lenovo ThinkPad P16 G1 RTX A5500 i9-12950HX, RTX A5500 Laptop GPU, WDC PC SN810 2TB, IPS, 3840x2400, 16" | Asus ProArt StudioBook 16 W7600H5A-2BL2 W-11955M, RTX A5000 Laptop GPU, 2x Micron 2300 2TB MTFDHBA2T0TDV (RAID 0), OLED, 3840x2400, 16" | Dell Precision 7000 7670 Performance i9-12950HX, RTX A5500 Laptop GPU, , OLED, 3840x2400, 16" | Lenovo ThinkPad P16 G1 21D6001DMB i7-12850HX, RTX A2000 Laptop GPU, Micron 3400 1TB MTFDKBA1T0TFH, IPS LED, 2560x1600, 16" | MSI CreatorPro Z16P B12UKST i7-12700H, RTX A3000 Laptop GPU, Samsung PM9A1 MZVL21T0HCLR, IPS, 2560x1600, 16" | HP ZBook Studio 16 G9 62U04EA i7-12800H, RTX A2000 Laptop GPU, Micron 3400 1TB MTFDKBA1T0TFH, IPS, 3840x2400, 16" | |
|---|---|---|---|---|---|---|
| Power Consumption | 14% | -35% | 45% | 19% | 28% | |
| Idle Minimum * (Watt) | 7.5 | 12.4 -65% | 16.4 -119% | 5.1 32% | 10.8 -44% | 7.2 4% |
| Idle Average * (Watt) | 20.1 | 16.5 18% | 35.9 -79% | 9.2 54% | 16.3 19% | 18.1 10% |
| Idle Maximum * (Watt) | 40 | 25 37% | 47 -18% | 9.9 75% | 16.9 58% | 18.5 54% |
| Load Average * (Watt) | 137 | 132 4% | 147.1 -7% | 124.1 9% | 111.7 18% | 112.8 18% |
| Witcher 3 ultra * (Watt) | 208 | 132 37% | 158.8 24% | 87.7 58% | 152.1 27% | 106.7 49% |
| Load Maximum * (Watt) | 285.9 | 134 53% | 311 -9% | 168.9 41% | 177.4 38% | 186 35% |
* ... mindre är bättre
Power Consumption Witcher 3 / Stresstest
Power Consumption external Monitor
Batteritid
Körtiden är flera timmar kortare än på vår mindre RTX A2000 SKU, vilket ger en total körtid på knappt 6 timmar om den är inställd på Balanced power profile.
Laddning från tom till full tar ungefär 2 timmar. Lenovos uppskattade laddningstid är dock inte så exakt, eftersom Vantage kan visa att den är så lång som 4 timmar till en början innan den automatiskt omkalibrerar sig själv. Tänk på att laddningshastigheten kommer att minska betydligt om du kör krävande program som nämns ovan.
Systemet kan inte laddas via USB-C.
| Lenovo ThinkPad P16 G1 RTX A5500 i9-12950HX, RTX A5500 Laptop GPU, 94 Wh | Asus ProArt StudioBook 16 W7600H5A-2BL2 W-11955M, RTX A5000 Laptop GPU, 90 Wh | Dell Precision 7000 7670 Performance i9-12950HX, RTX A5500 Laptop GPU, 93 Wh | Lenovo ThinkPad P16 G1 21D6001DMB i7-12850HX, RTX A2000 Laptop GPU, 94 Wh | MSI CreatorPro Z16P B12UKST i7-12700H, RTX A3000 Laptop GPU, 90 Wh | HP ZBook Studio 16 G9 62U04EA i7-12800H, RTX A2000 Laptop GPU, 86 Wh | |
|---|---|---|---|---|---|---|
| Batteridrifttid | -14% | -19% | 62% | 0% | 9% | |
| WiFi v1.3 (h) | 5.8 | 5 -14% | 4.7 -19% | 9.4 62% | 5.8 0% | 6.3 9% |
| H.264 (h) | 1.8 | 8.5 | ||||
| Witcher 3 ultra (h) | 1.6 | |||||
| Load (h) | 1.8 | 1.1 |
För
Emot
Bedömning - 230 W AC-adaptern räcker inte till
Rent prestandamässigt är ThinkPad P16 G1 en av de snabbaste mobila arbetsstationerna som finns tillgängliga för närvarande, oavsett skärmstorlek. Dess Core i9-12950HX CPU och RTX A5500 GPU presterar något men konsekvent bättre än Precision 7670 även om Dell-modellen har liknande processoralternativ.
Det finns två viktiga nackdelar som vi hoppas att Lenovo kan åtgärda på framtida iterationer. För det första är CPU-temperaturerna mycket varmare än genomsnittet när man kör krävande belastningar. Höga temperaturer är naturligtvis inte oväntat, men en platå på 100 C är helt enkelt för varmt för att vara bekvämt när samma CPU i den tidigare nämnda Dell-modellen knappt skulle spräcka 80 C under liknande förhållanden. Den höga temperaturen är kanske priset att betala för den något snabbare prestandan.
För det andra svettas 230 W AC-adaptern i ett försök att driva en CPU på över 100 W och en GPU på 130 W. Kampen är observerbar när man kör krävande belastningar eftersom systemets laddningshastighet skulle sakta ner betydligt eller till och med börja tömma batteriet i vissa scenarier. När vi kan mäta ett topputtag på 285 W från en nätadapter som är dimensionerad för endast 230 W, så finns det helt klart en flaskhals här. En större AC-adapter på 280 W eller 330 W hade varit mer lämplig med tanke på vår konfigurationsnivå.
ThinkPad P16 Gen 1 maximerar prestandan även om det innebär högre strömförbrukning och högre kärntemperaturer. AC-adaptern på 230 W kan dock vara för konservativ med tanke på de mycket krävande processorerna i vår toppkonfiguration.
Den övergripande höga systemprestandan är ändå obestridlig trots de höga temperaturerna och den otillräckliga 230 W strömklossen. Se till att avsluta alla krävande program för anständiga laddningshastigheter.
Pris och tillgänglighet
ThinkPad P16 G1 levereras nu på Best Buy och Amazon i lägre konfigurationsnivåer från 2570 USD respektive 3850 USD. Vi rekommenderar att du köper direkt från Lenovo eftersom de har de mest konfigurerbara alternativen i lager.
Lenovo ThinkPad P16 G1 RTX A5500
- 02/06/2023 v7 (old)
Allen Ngo
Genomskinlighet
Valet av enheter som ska granskas görs av vår redaktion. Testprovet gavs till författaren som ett lån av tillverkaren eller återförsäljaren för denna recension. Långivaren hade inget inflytande på denna recension och inte heller fick tillverkaren en kopia av denna recension innan publiceringen. Det fanns ingen skyldighet att publicera denna recension. Som ett oberoende medieföretag är Notebookcheck inte föremål för auktoritet från tillverkare, återförsäljare eller förlag.
This is how Notebookcheck is testingEvery year, Notebookcheck independently reviews hundreds of laptops and smartphones using standardized procedures to ensure that all results are comparable. We have continuously developed our test methods for around 20 years and set industry standards in the process. In our test labs, high-quality measuring equipment is utilized by experienced technicians and editors. These tests involve a multi-stage validation process. Our complex rating system is based on hundreds of well-founded measurements and benchmarks, which maintains objectivity.
Price comparison

