Omdöme - Hög prestanda med praktiska funktioner
Dell Pro Max 16 Plus är ett betydande steg framåt jämfört med den tidigare generationen Precision 7680 eller 7670. Bortsett från den förväntade prestandaförbättringen får den reviderade modellen ytterligare funktioner som inte finns på den äldre, inklusive 120 Hz OLED, modulära USB-C-portar för reparerbarhet, PCIe5 SSD-alternativ, Thunderbolt 5-stöd, kompakt USB-C-laddning och en webbkamera med högre upplösning. Förbättringarna uppväger utan tvekan de små ökningarna i tjocklek och fotavtryck.
Nackdelarna är i allmänhet små. Strömförbrukningen är nu högre än tidigare med upp till 280 W jämfört med 240 W eller mindre på Precision 7680. Pro Max 16 Plus är visserligen mer kraftfull, men den är också mer krävande för kylningslösningen och har överlag kortare batteritid. CPU-temperaturen i synnerhet kan nå 95 till 105 C när den belastas, vilket påverkar systemets Turbo Boost-prestanda. Samtidigt tenderar GPU:n att stabiliseras på 125 W trots att den är klassad för upp till 175 W. Det är därför troligt att samma CPU och GPU kan köras snabbare på tjockare eller större formfaktorer som 18-tums Pro Max 18 Plus. Pro Max 16 Plus-systemet är ändå en av de snabbaste och mest praktiska arbetsstationerna som finns tillgängliga trots eventuella begränsningar i kylningslösningen.
För
Emot
Pris och tillgänglighet
Dell levererar nu Pro Max 16 Plus från $3700 USD för baskonfigurationen Core Ultra 7, RTX Pro 1000. Vår Core Ultra 9 med RTX Pro 5000 Blackwell är ännu inte allmänt tillgänglig.
- $1,574.00Dell Pro Max 16 - Intel Core Ultra 7 255H - Intel Arc Pro 140T GPU - 1TB SSD - 32GB DDR5 RAM - Windows 11 Pro
- $1,899.95Dell Pro 16 Plus PB16250 (Replaces Latitude 5550) AI Business Notebook 16" WUXGA Intel Ultra 7-265U, 32GB RAM DDR5, 1TB SSD, Wi-Fi 6E + BT, Backlit KB, FHD Webcam, RJ-45, Windows 11 Pro - Silver
- $2,799.99Dell Precision 7000 7680 Mobile Workstation Laptop (NVIDIA RTX 2000 Ada 8GB, 16" FHD+, Intel Core i7-13850HX (> Ultra 9-185H), 64GB LPCAMM2 DDR5, 2TB SSD) Pro Max for Engineer, Designer, Win 11 Pro
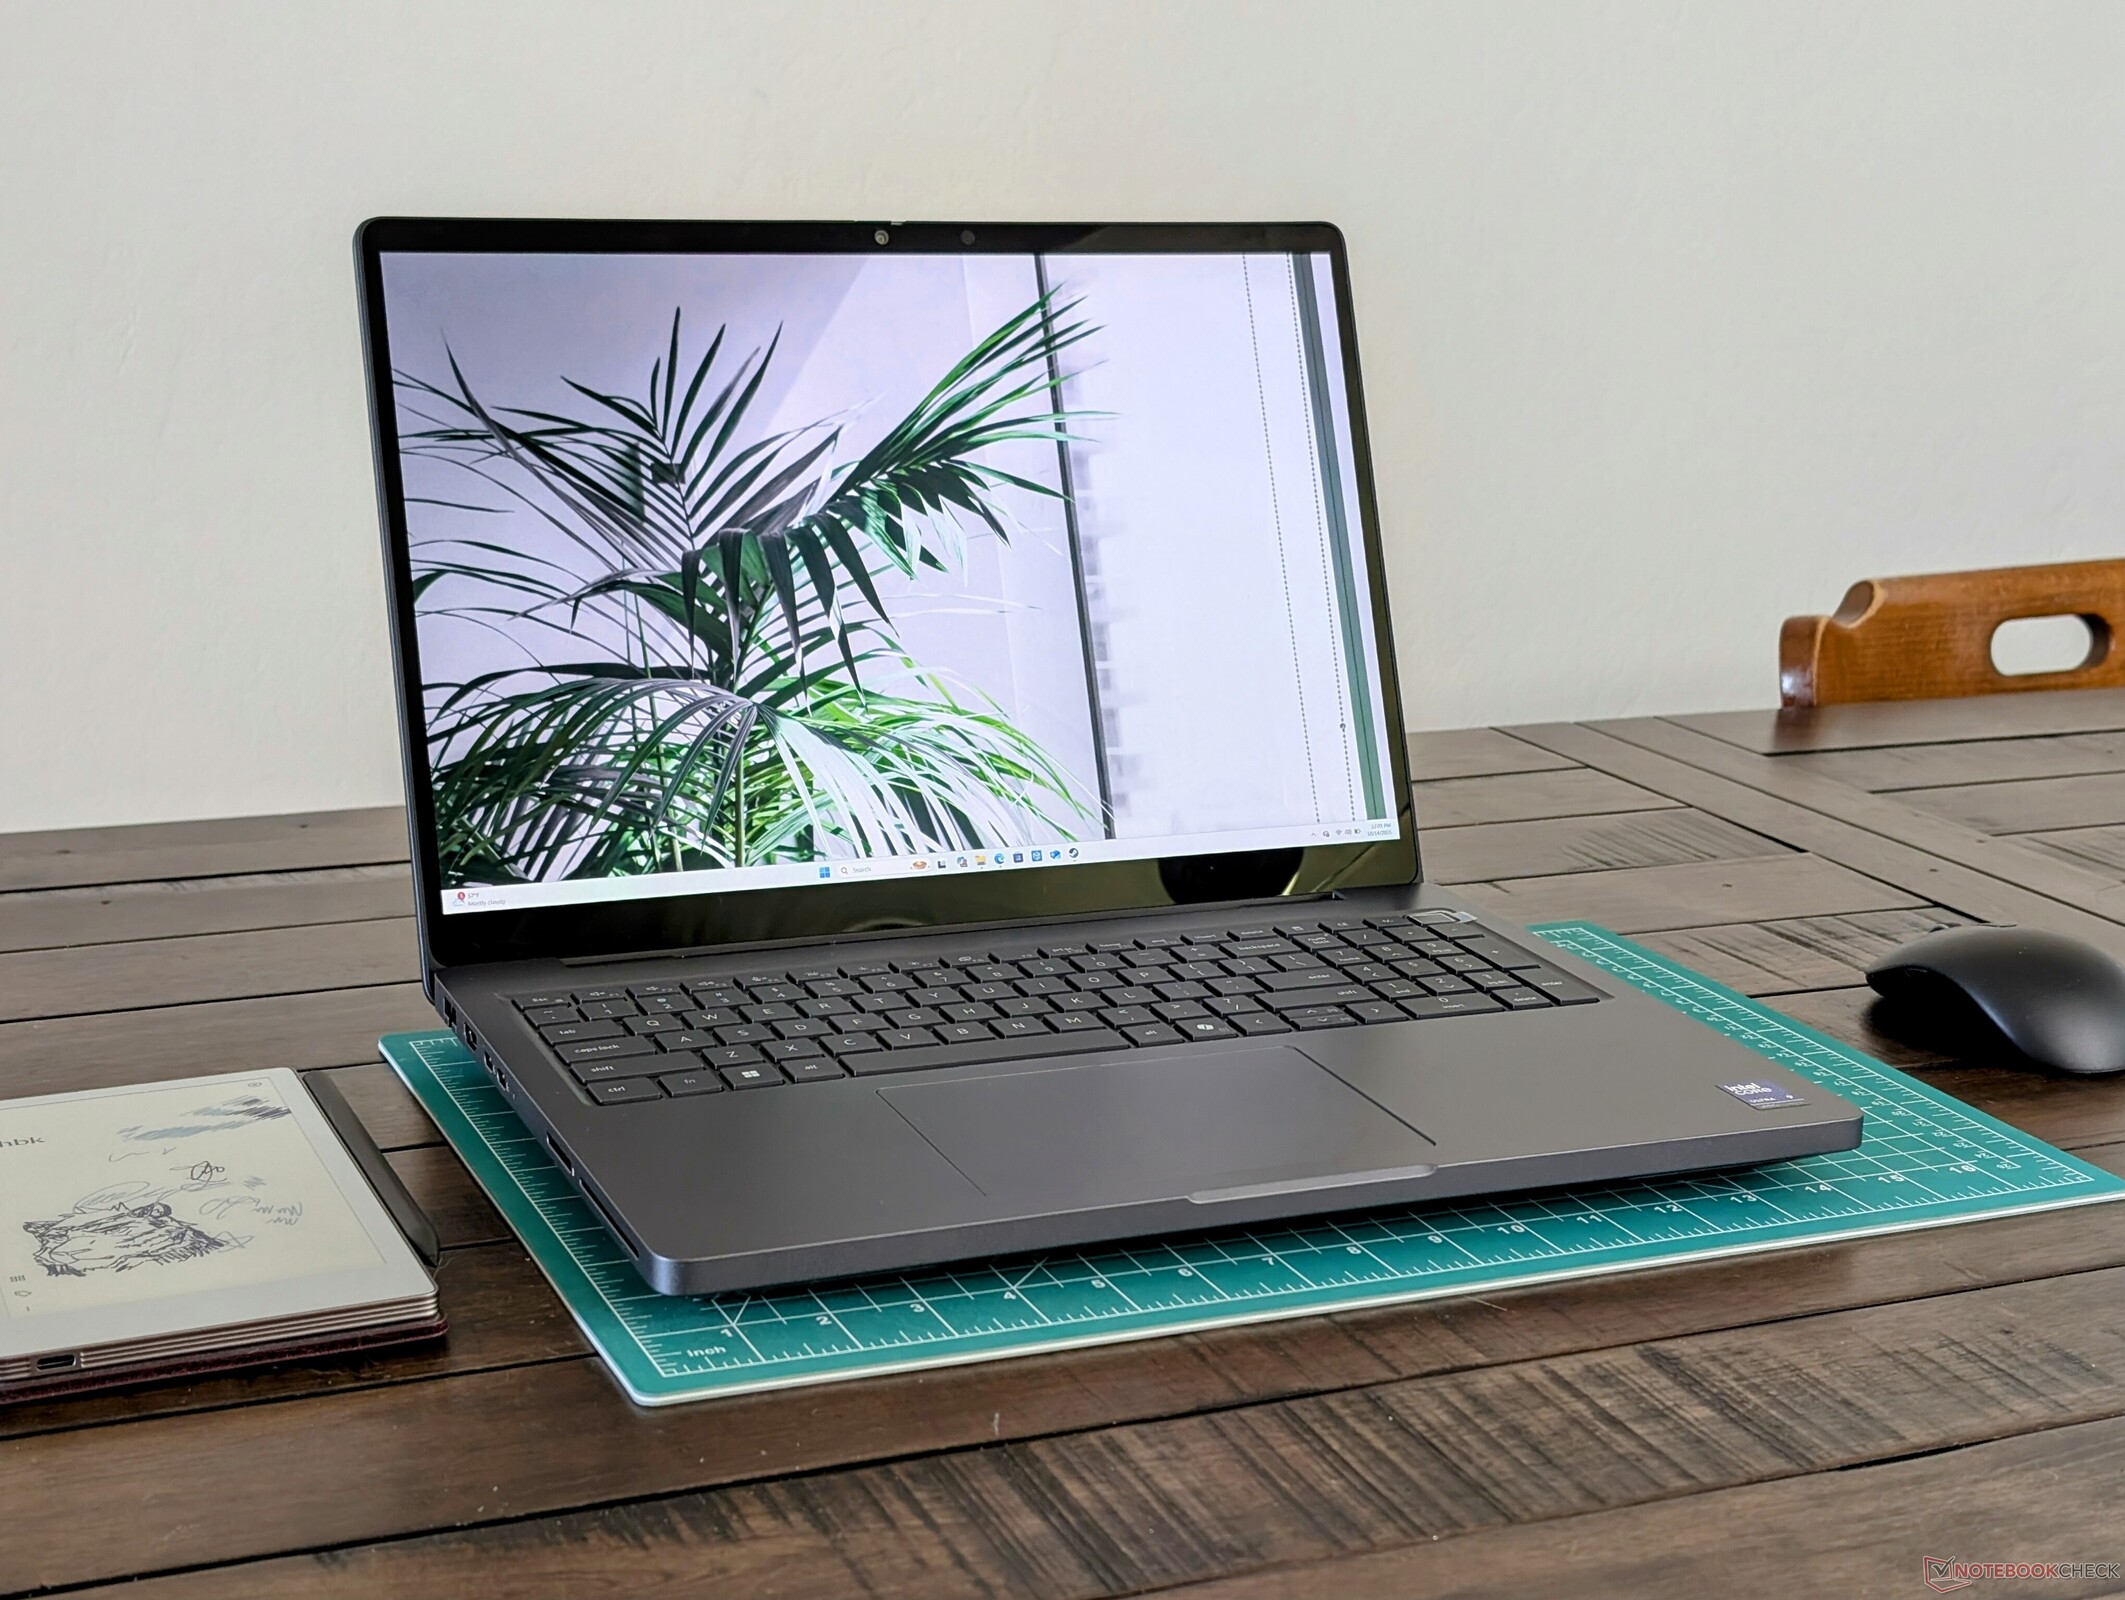
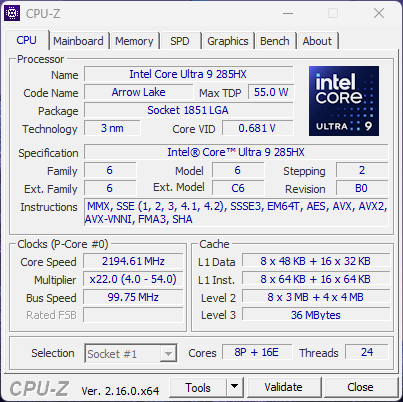
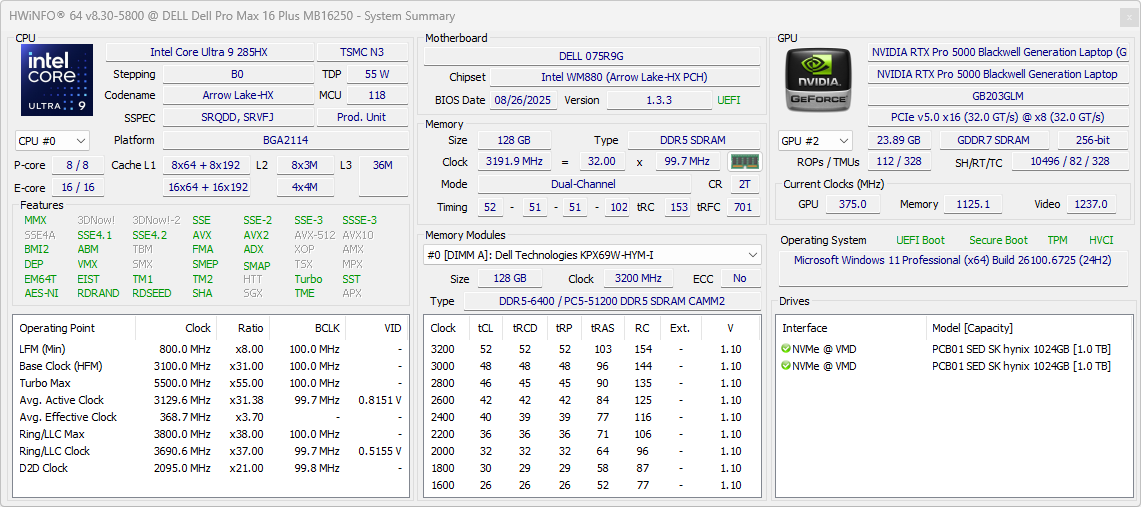
Dell Pro Max 16 Plus är tillverkarens senaste 16-tums mobila arbetsstation som efterträder den senaste generationen Precision 7680-serien. Som sådan är den en avancerad arbetsstation med avancerade processorer och funktioner, inklusive Intel Arrow Lake-HX-processorer, Nvidia Pro Blackwell GPU:er och kompatibilitet med specialiserad hårdvara som DGFF- och CAMM2-moduler.
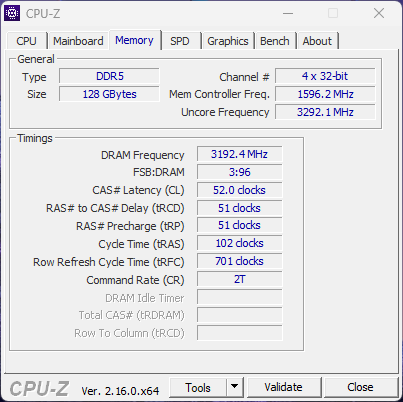
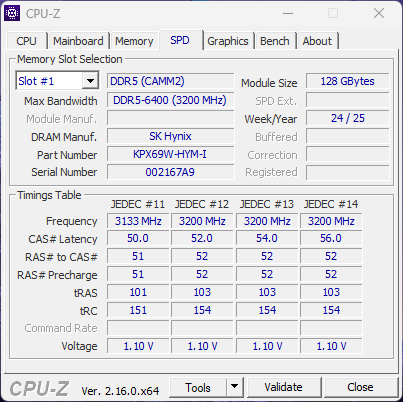
Vår testenhet är den mest avancerade konfigurationen med Core Ultra 9 285HX, RTX Pro 5000 Blackwell, 4K UHD 120 Hz OLED-pekskärm, 2 TB PCIe5 SSD och 128 GB CAMM2-RAM för cirka 5 000 USD. Mindre SKU:er börjar med Core Ultra 5 245HX, 16 GB CSoDIMM, endast integrerad grafik och en grundläggande FHD+ skärm utan pekskärm för cirka 3700 USD.
Alternativen i detta utrymme inkluderar andra prestandainriktade 16-tums arbetsstationer som MSI CreatorPro Z16P, Lenovo ThinkPad P16 Gen 2eller HP ZBook Studio 16.
Fler recensioner av Dell:
Specifikationer
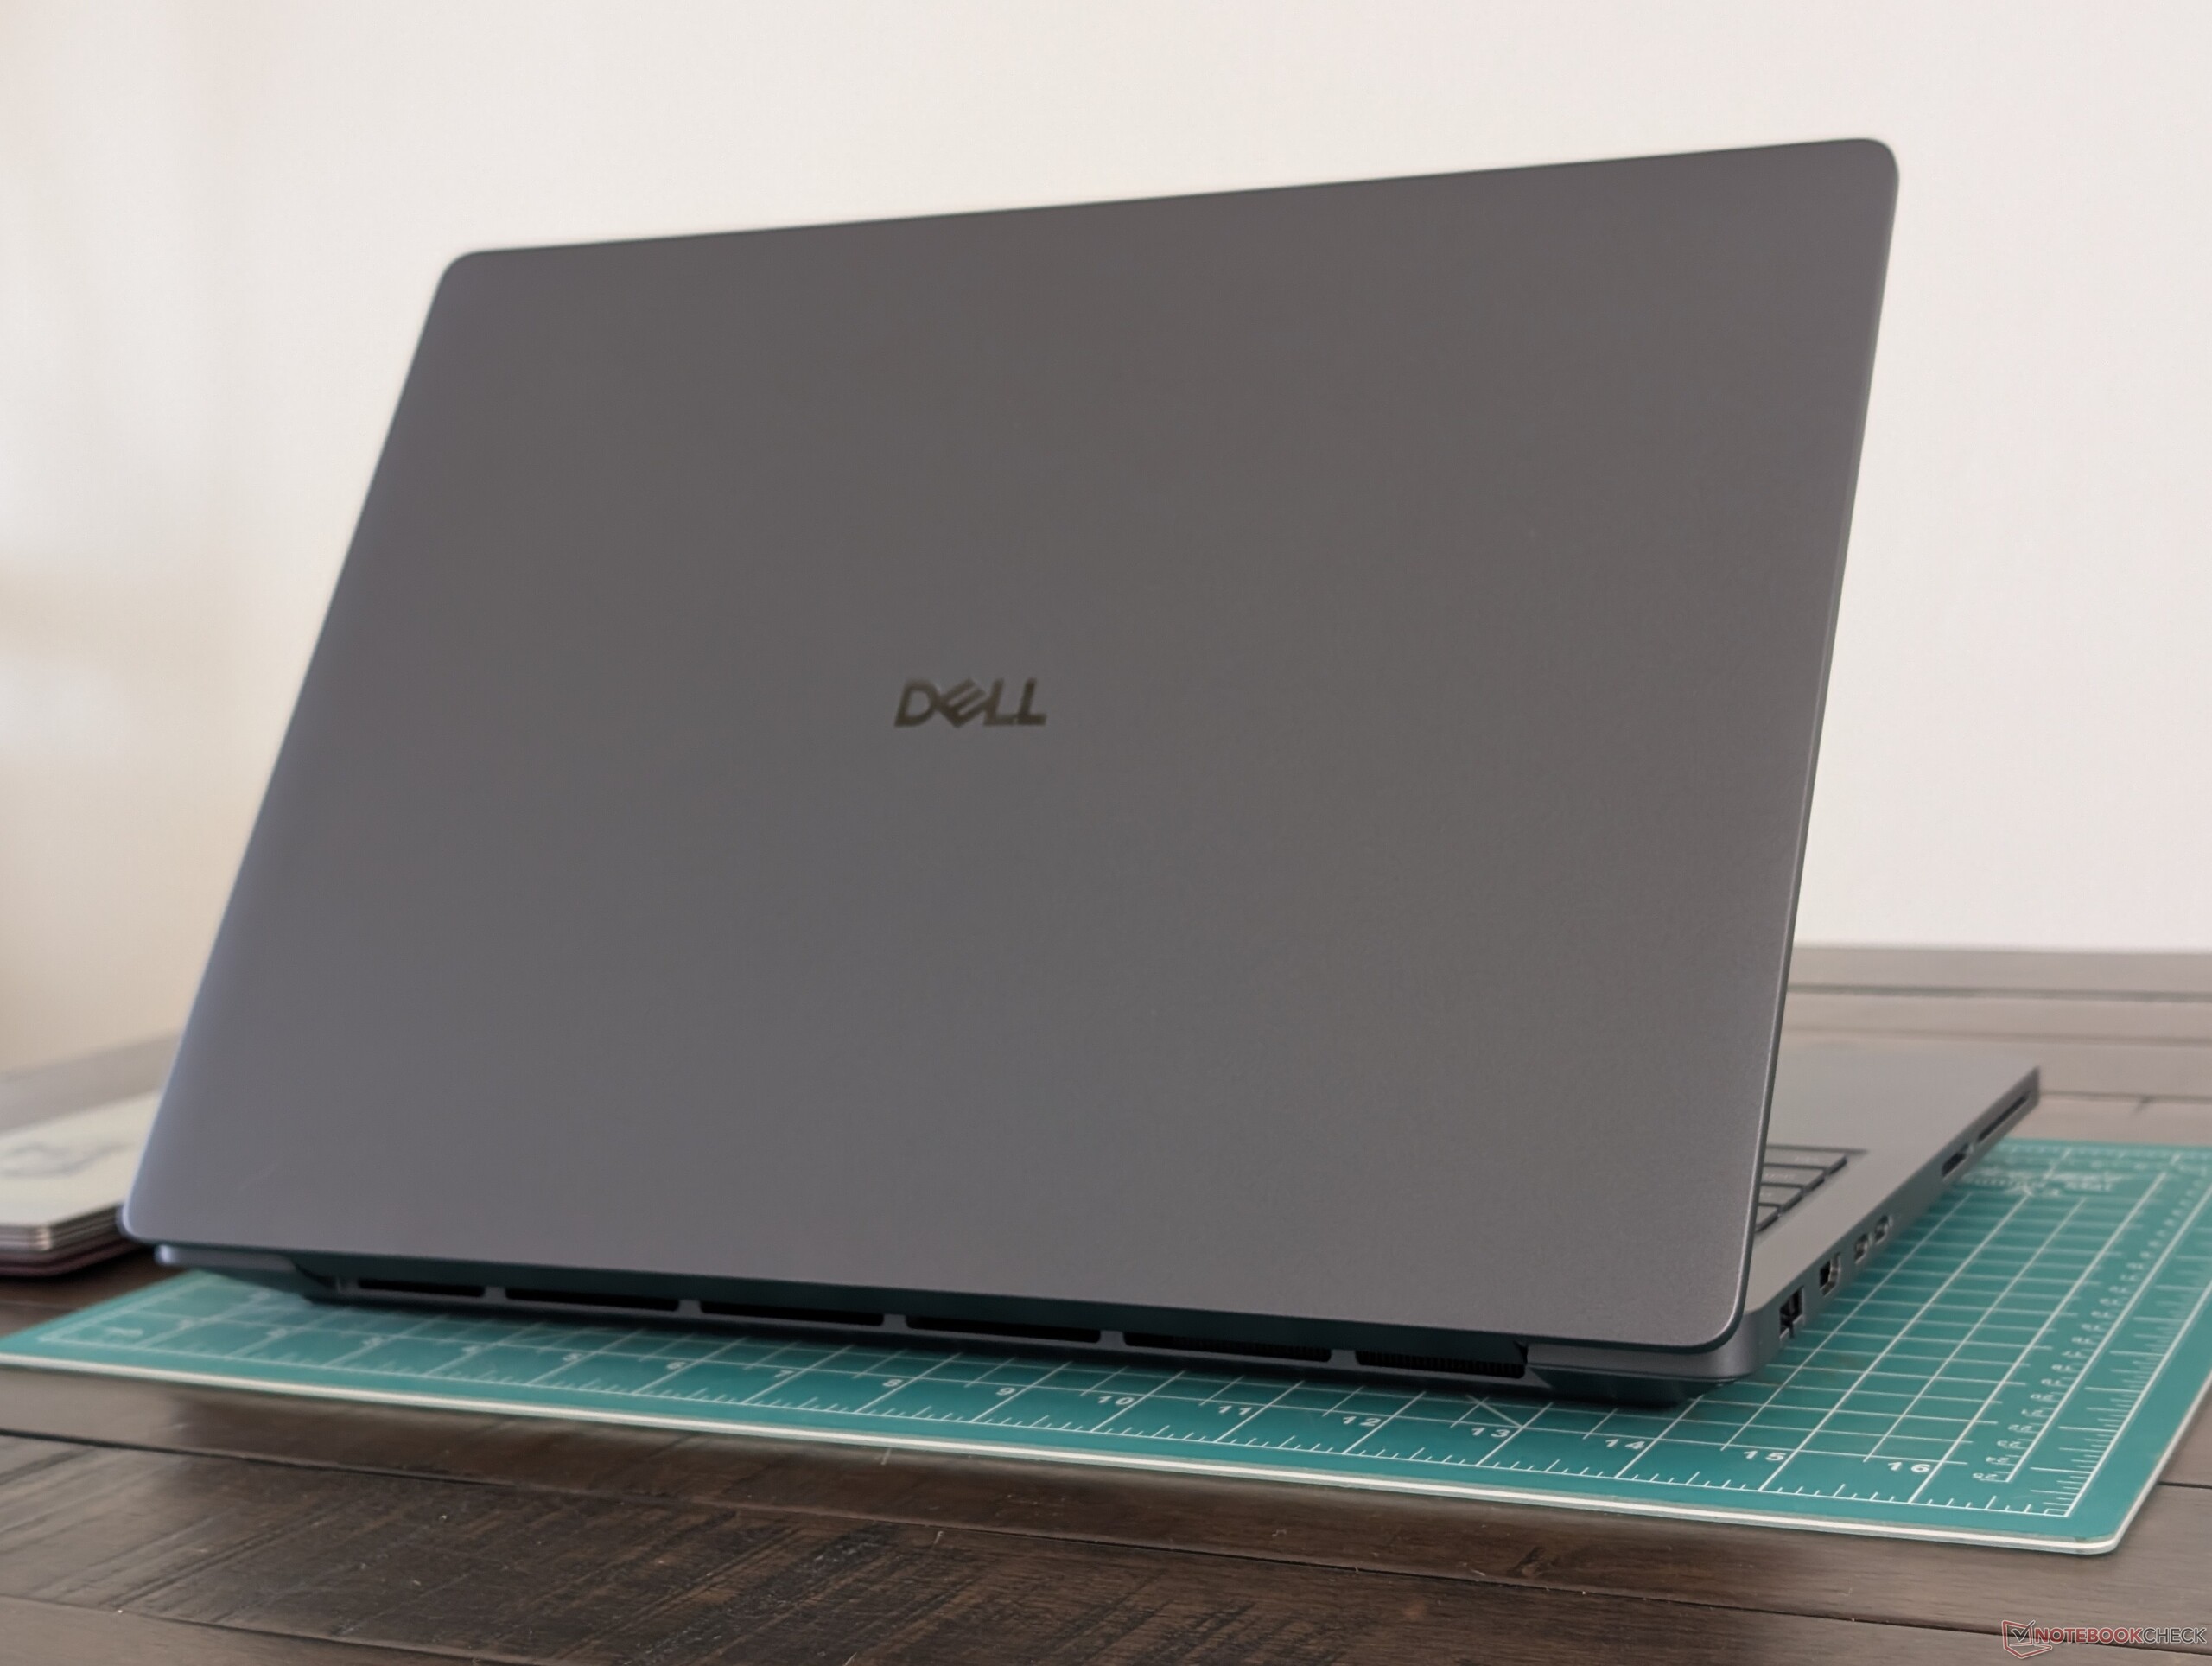
Fallet
Modellen är faktiskt något större och tjockare än den 4 år gamla Precision 7670. Trots detta gör den solida byggkvaliteten och professionella funktioner som CAMM2, DGFF och modulär USB-C-reparerbarhet att den större storleken är värd investeringen.

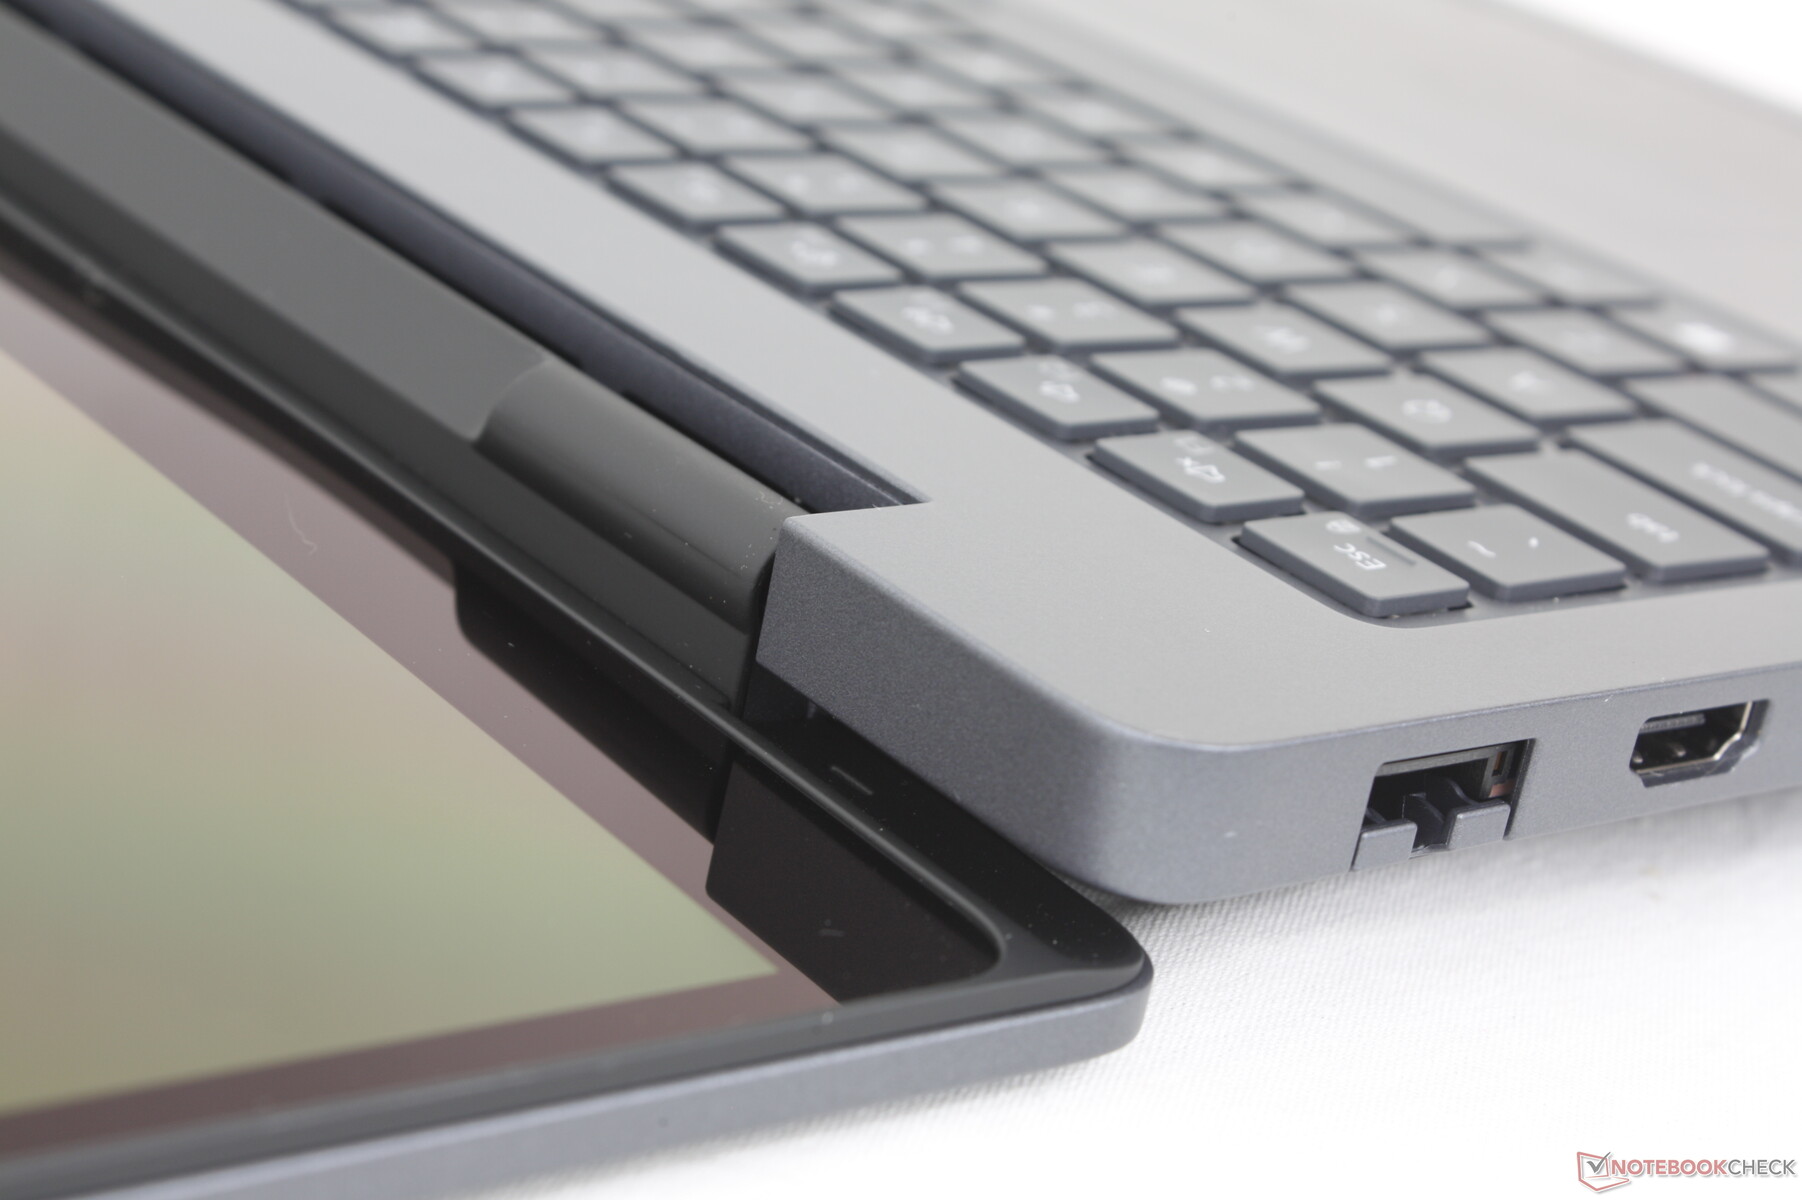

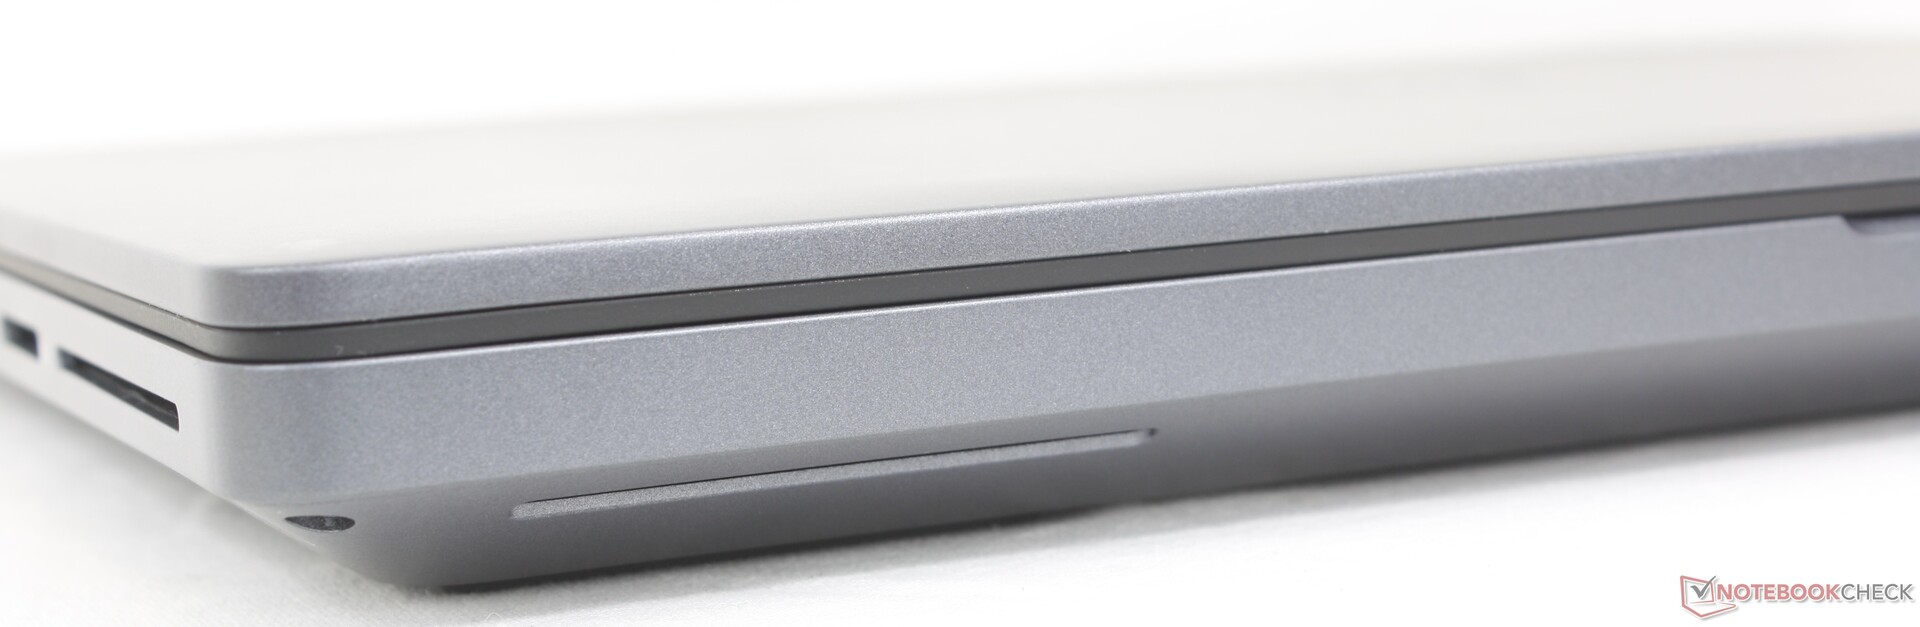
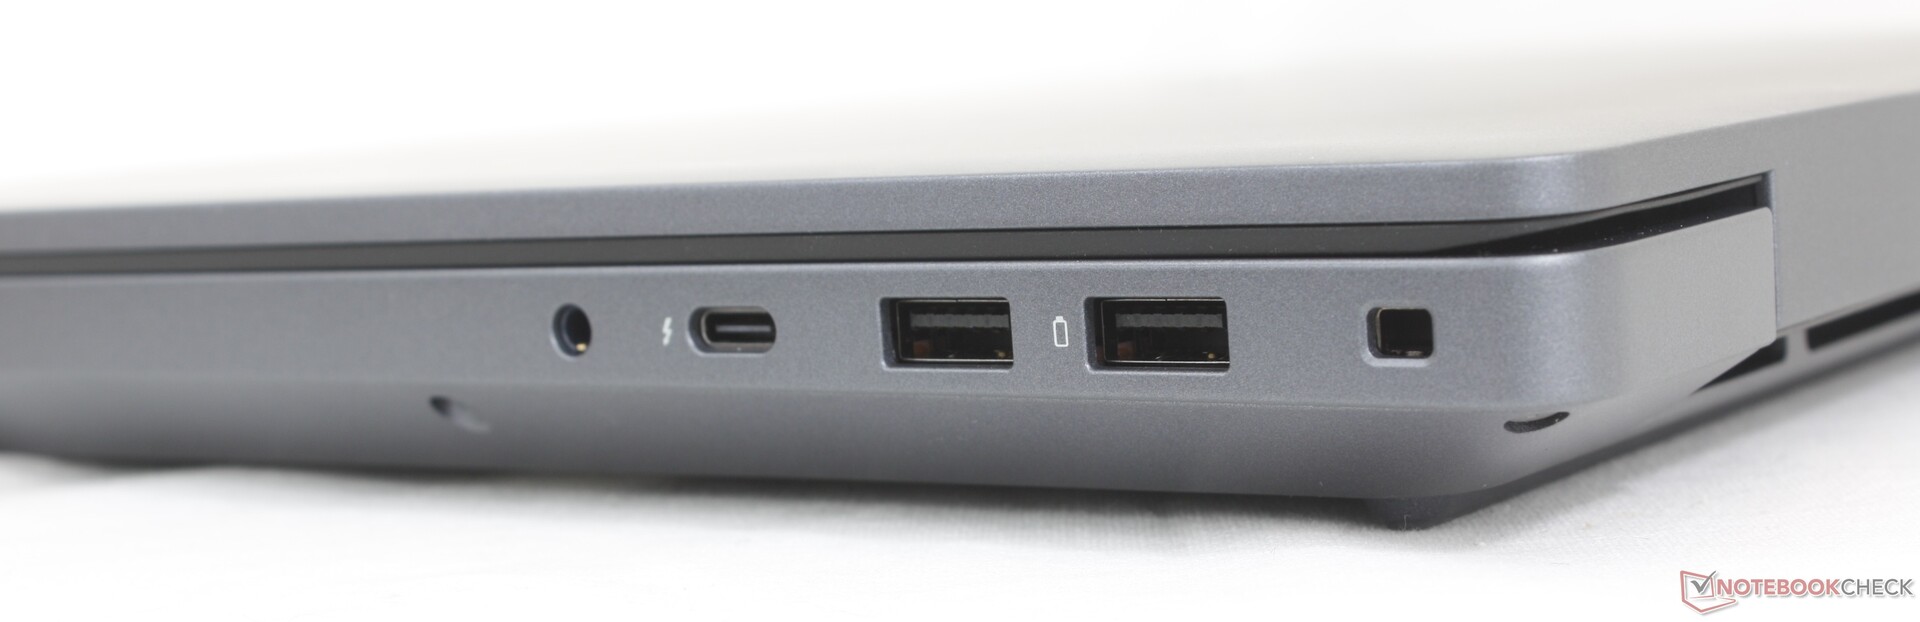
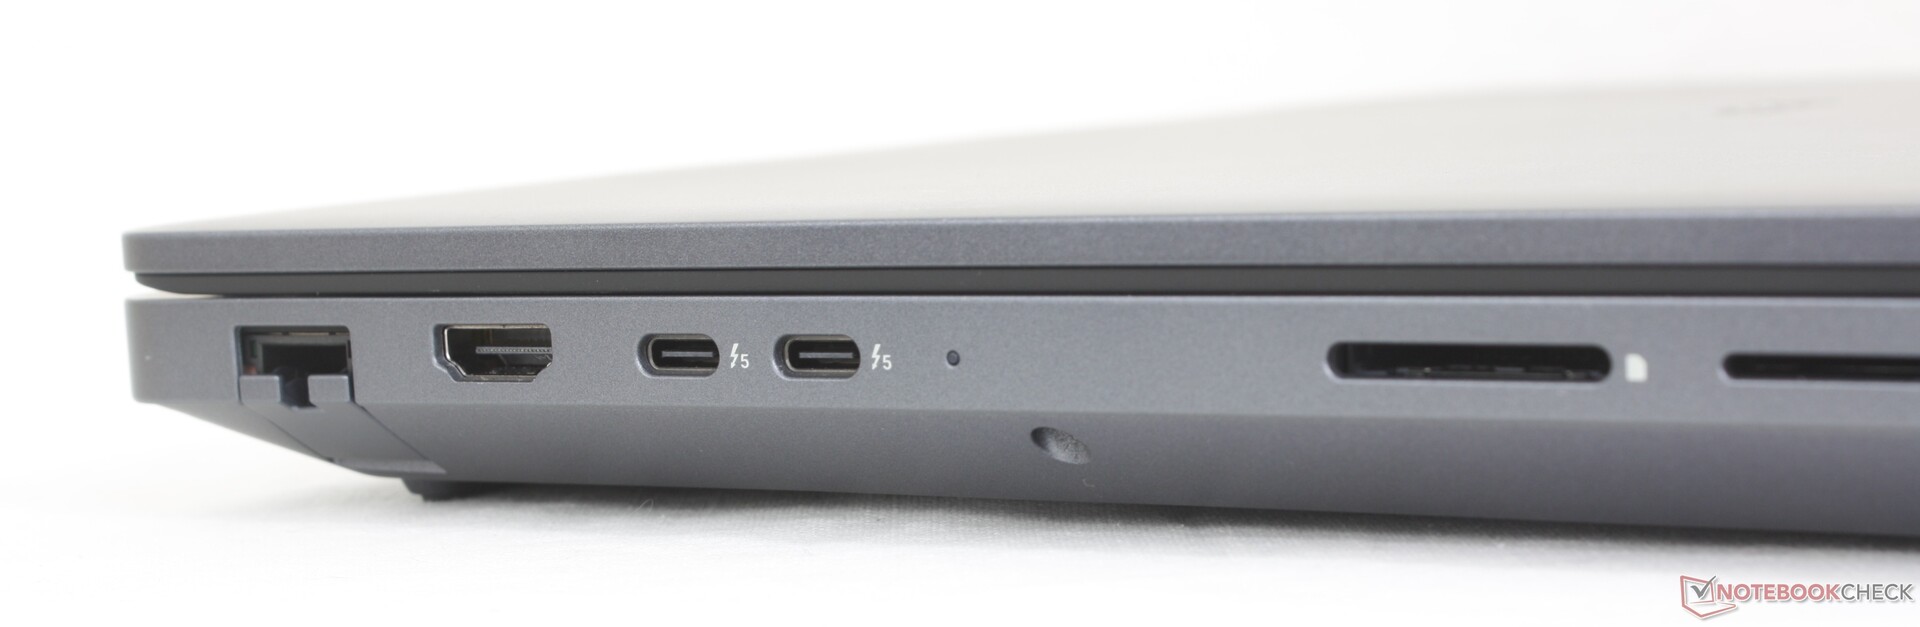
Anslutningsmöjligheter
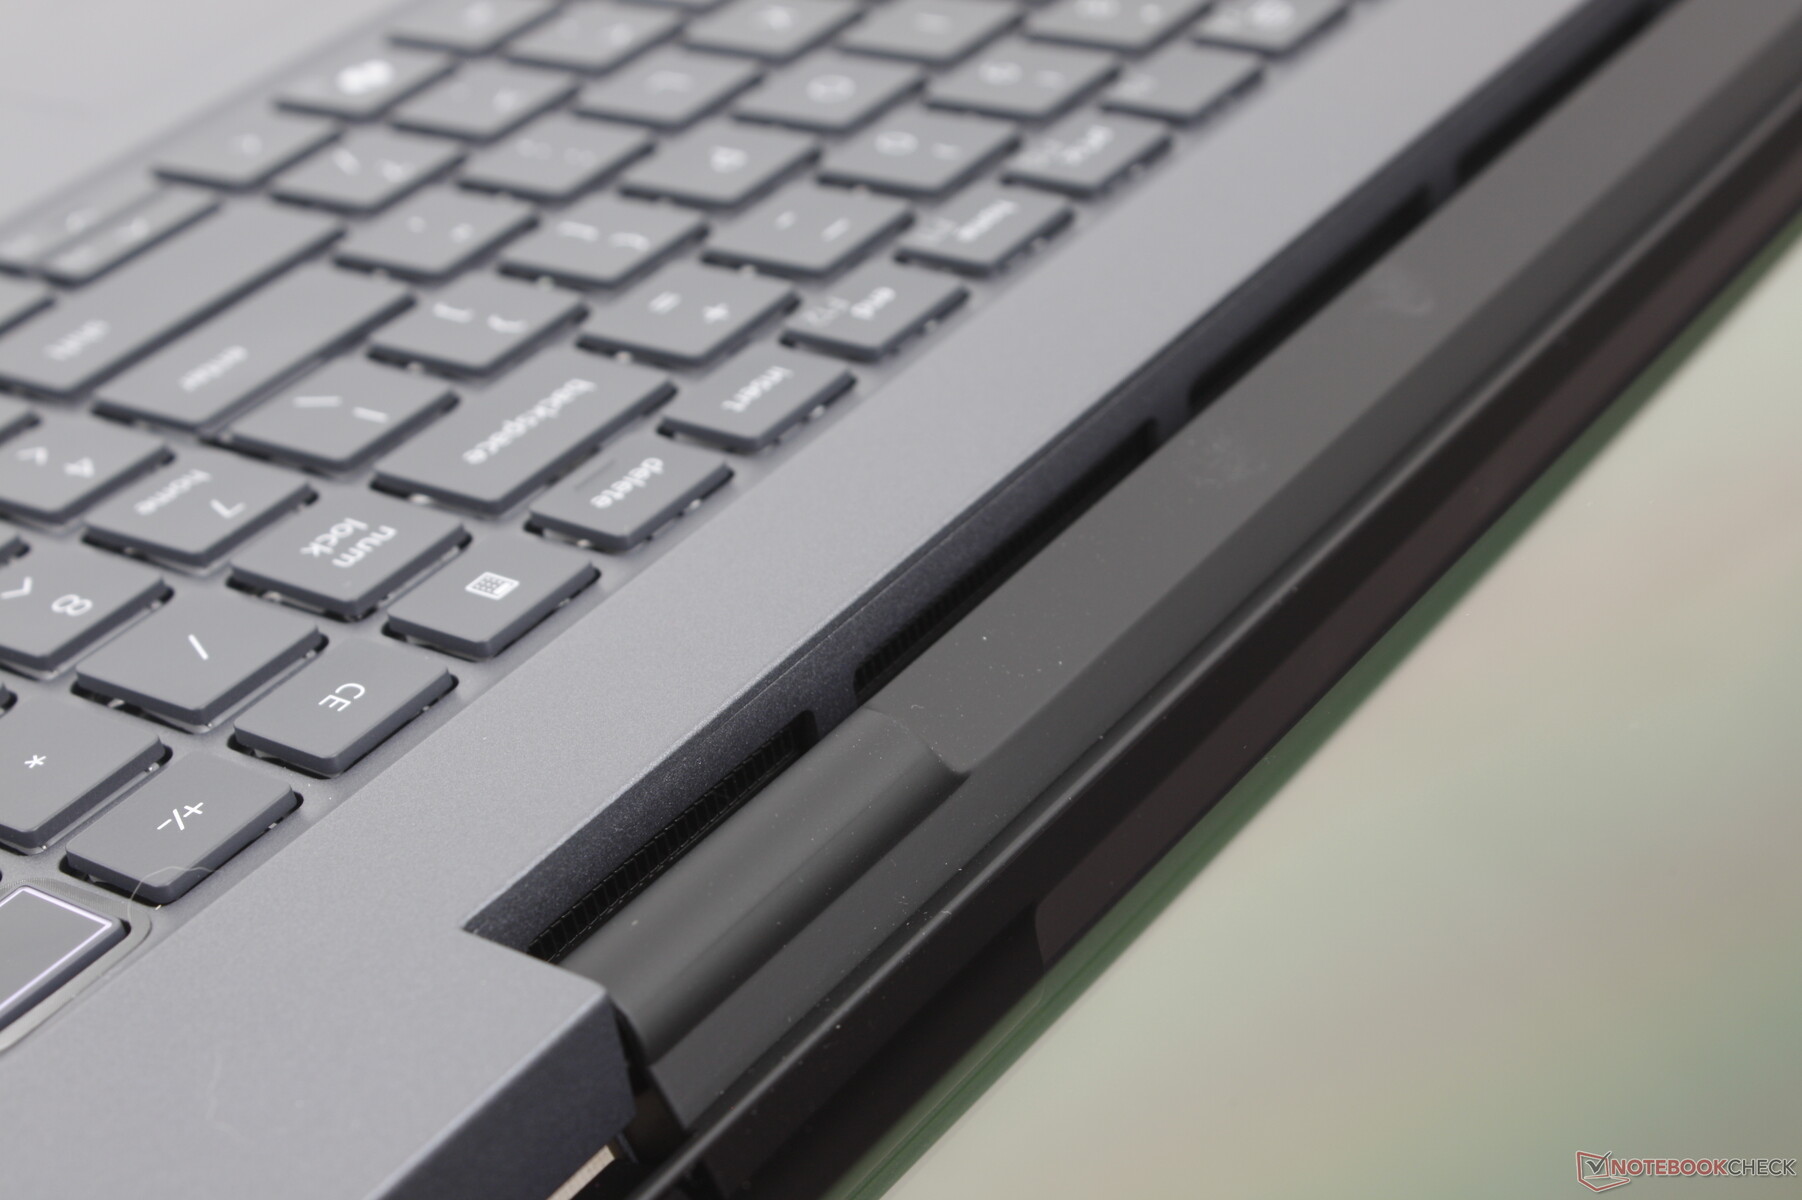
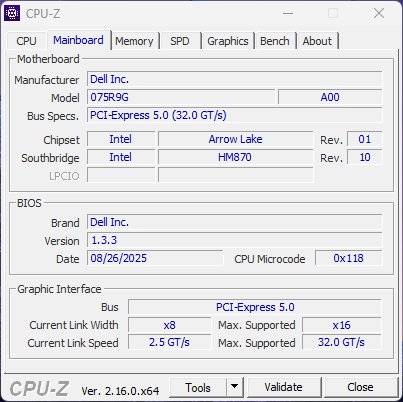
Portalternativen är i stort sett identiska med Precision 7680, om än med några viktiga förändringar. Den dedikerade fatporten för AC-adapter har till exempel tagits bort på Pro Max 16 Plus, vilket innebär att en av de tre USB-C-portarna nästan alltid kommer att användas för laddning. Samtidigt är Thunderbolt 5 nu standard för mer avancerade dockningsmöjligheter.

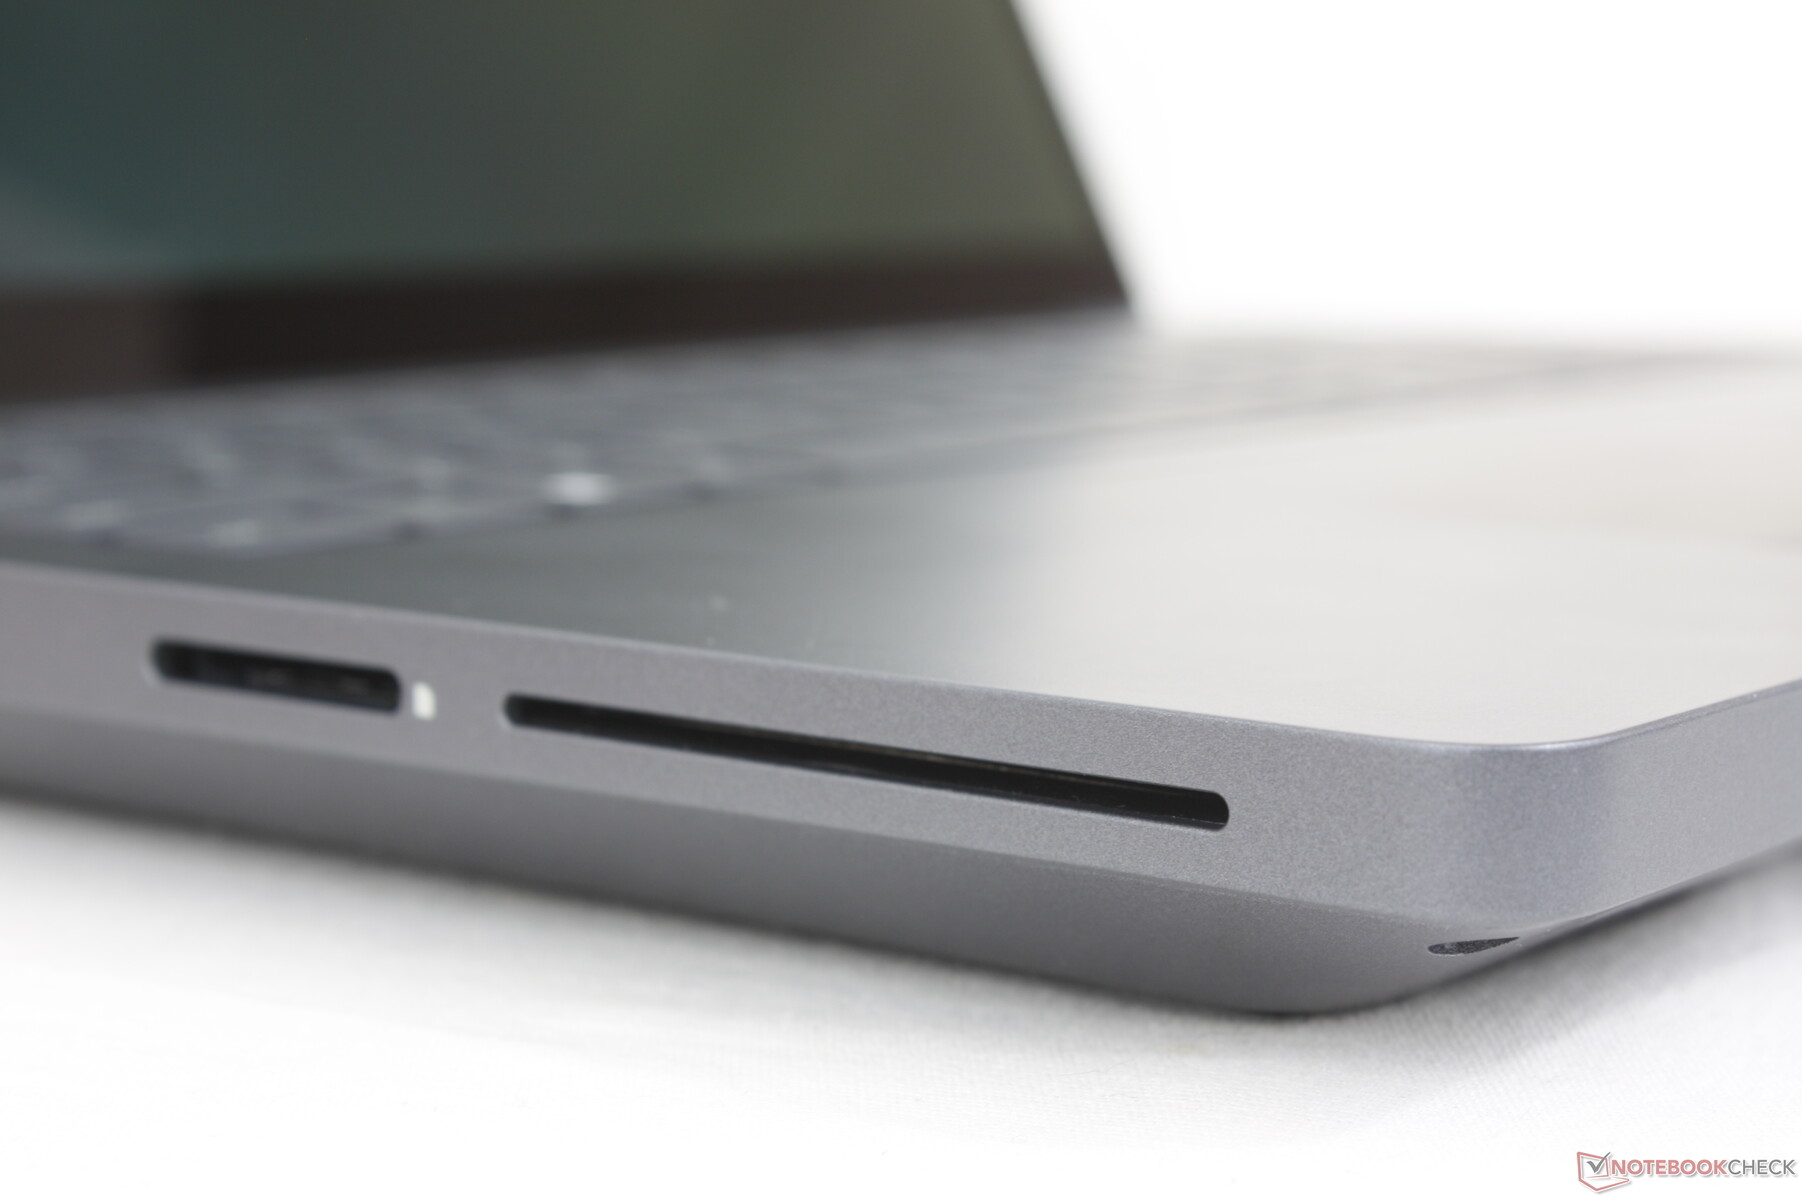
SD-kortläsare
| SD Card Reader | |
| average JPG Copy Test (av. of 3 runs) | |
| Dell Precision 5000 5680 (Toshiba Exceria Pro SDXC 64 GB UHS-II) | |
| Lenovo ThinkPad P16 Gen 2 (Toshiba Exceria Pro SDXC 64 GB UHS-II) | |
| MSI CreatorPro Z16P B12UKST (AV Pro V60) | |
| Dell Pro Max 16 Plus (Toshiba Exceria Pro SDXC 64 GB UHS-II) | |
| Lenovo ThinkPad P1 Gen 7 21KV001SGE (AV Pro V60) | |
| maximum AS SSD Seq Read Test (1GB) | |
| Dell Precision 5000 5680 (Toshiba Exceria Pro SDXC 64 GB UHS-II) | |
| Dell Pro Max 16 Plus (Toshiba Exceria Pro SDXC 64 GB UHS-II) | |
| Lenovo ThinkPad P1 Gen 7 21KV001SGE (AV Pro V60) | |
| Lenovo ThinkPad P16 Gen 2 (Toshiba Exceria Pro SDXC 64 GB UHS-II) | |
| MSI CreatorPro Z16P B12UKST (AV Pro V60) | |
Kommunikation
Webbkamera
Valfri 8 MP webbkamera med IR och fysisk slutare.


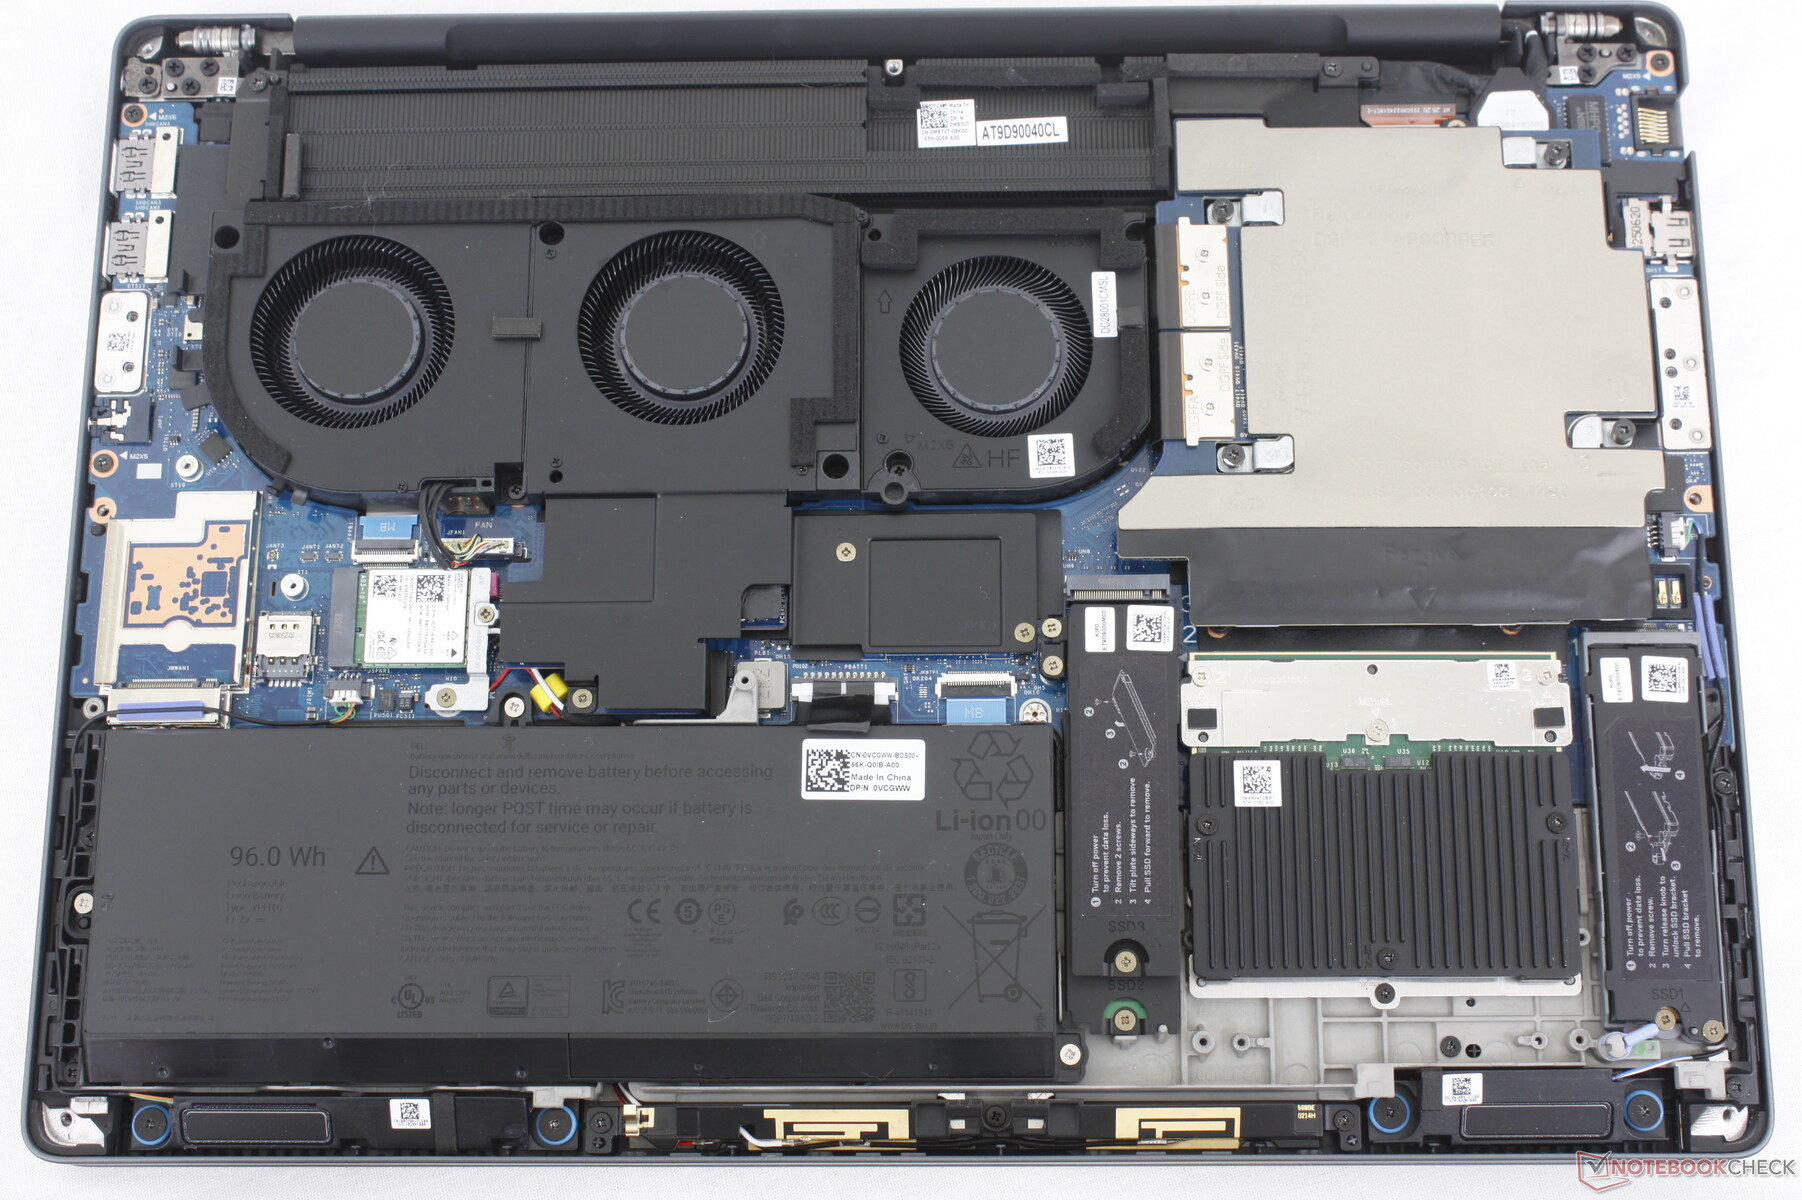
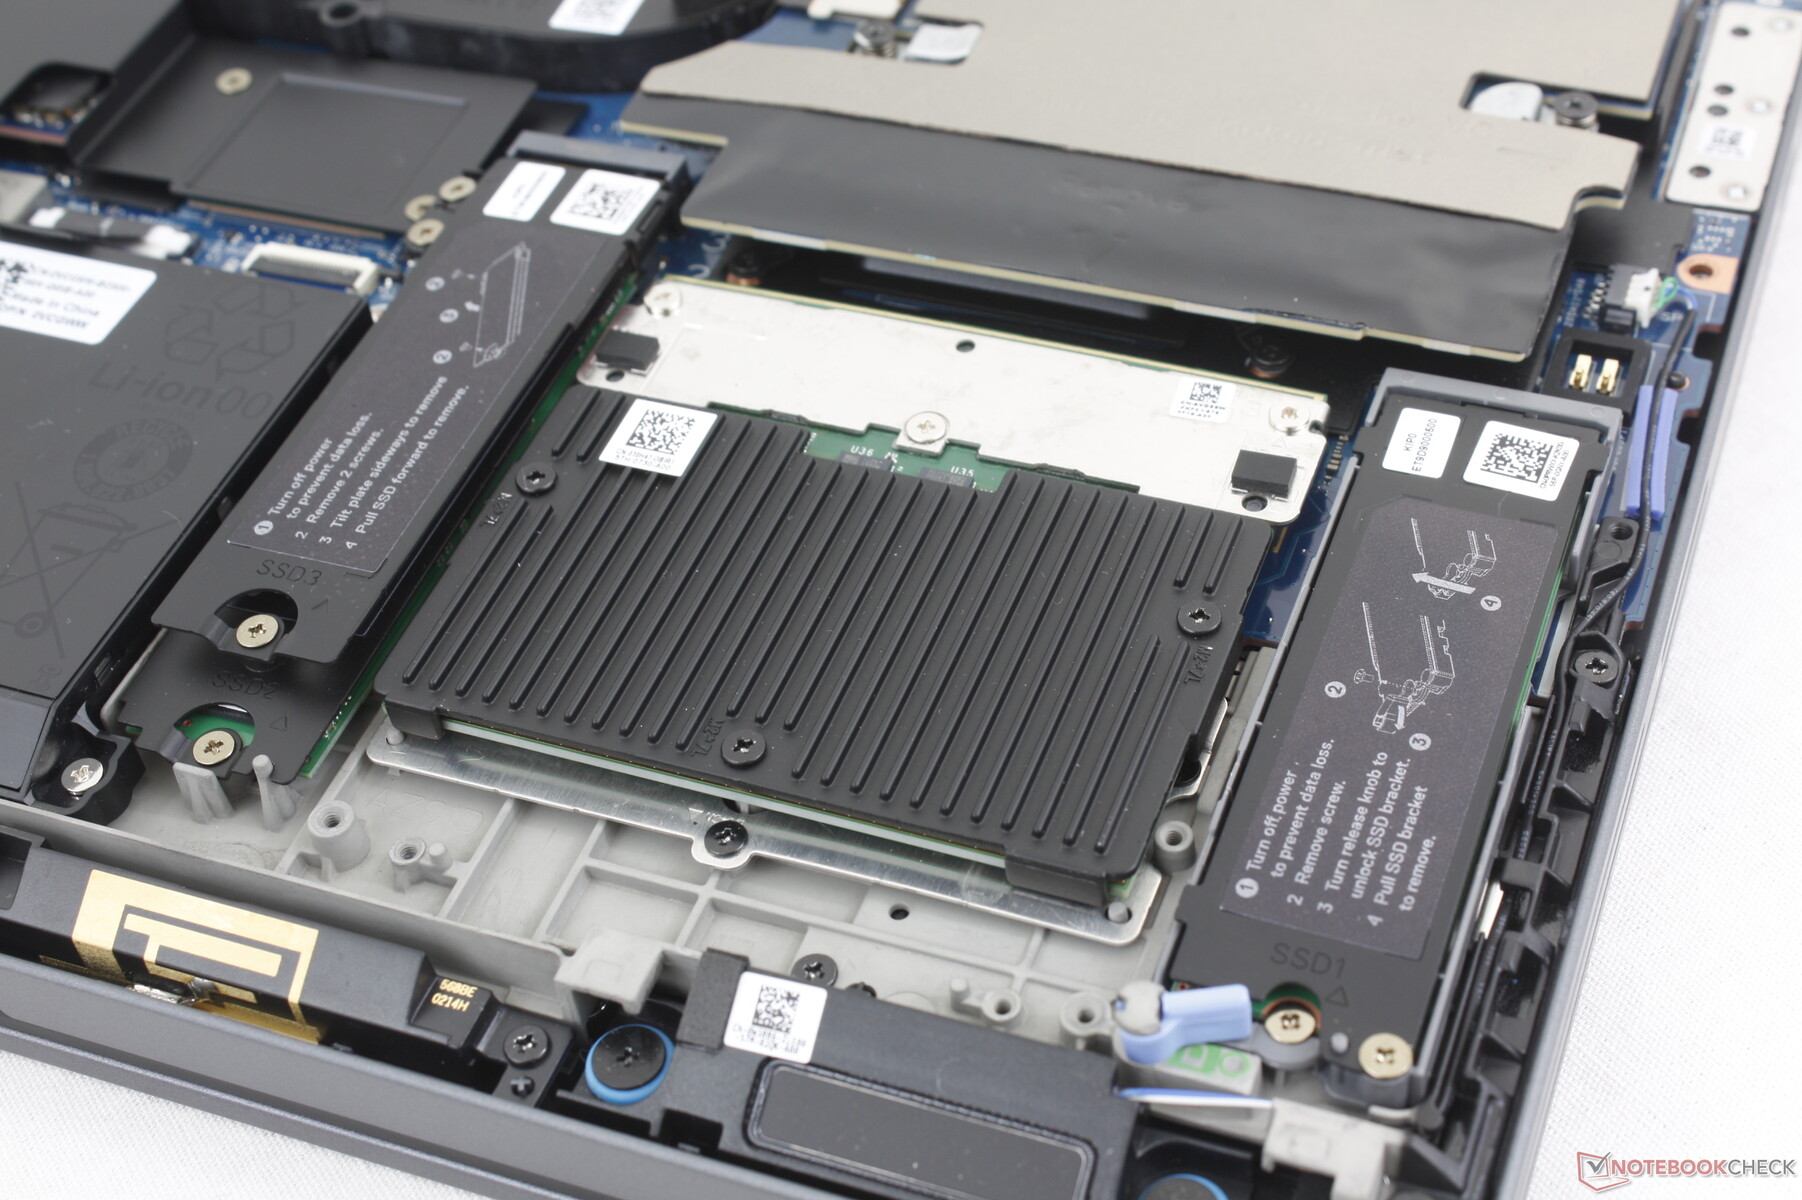
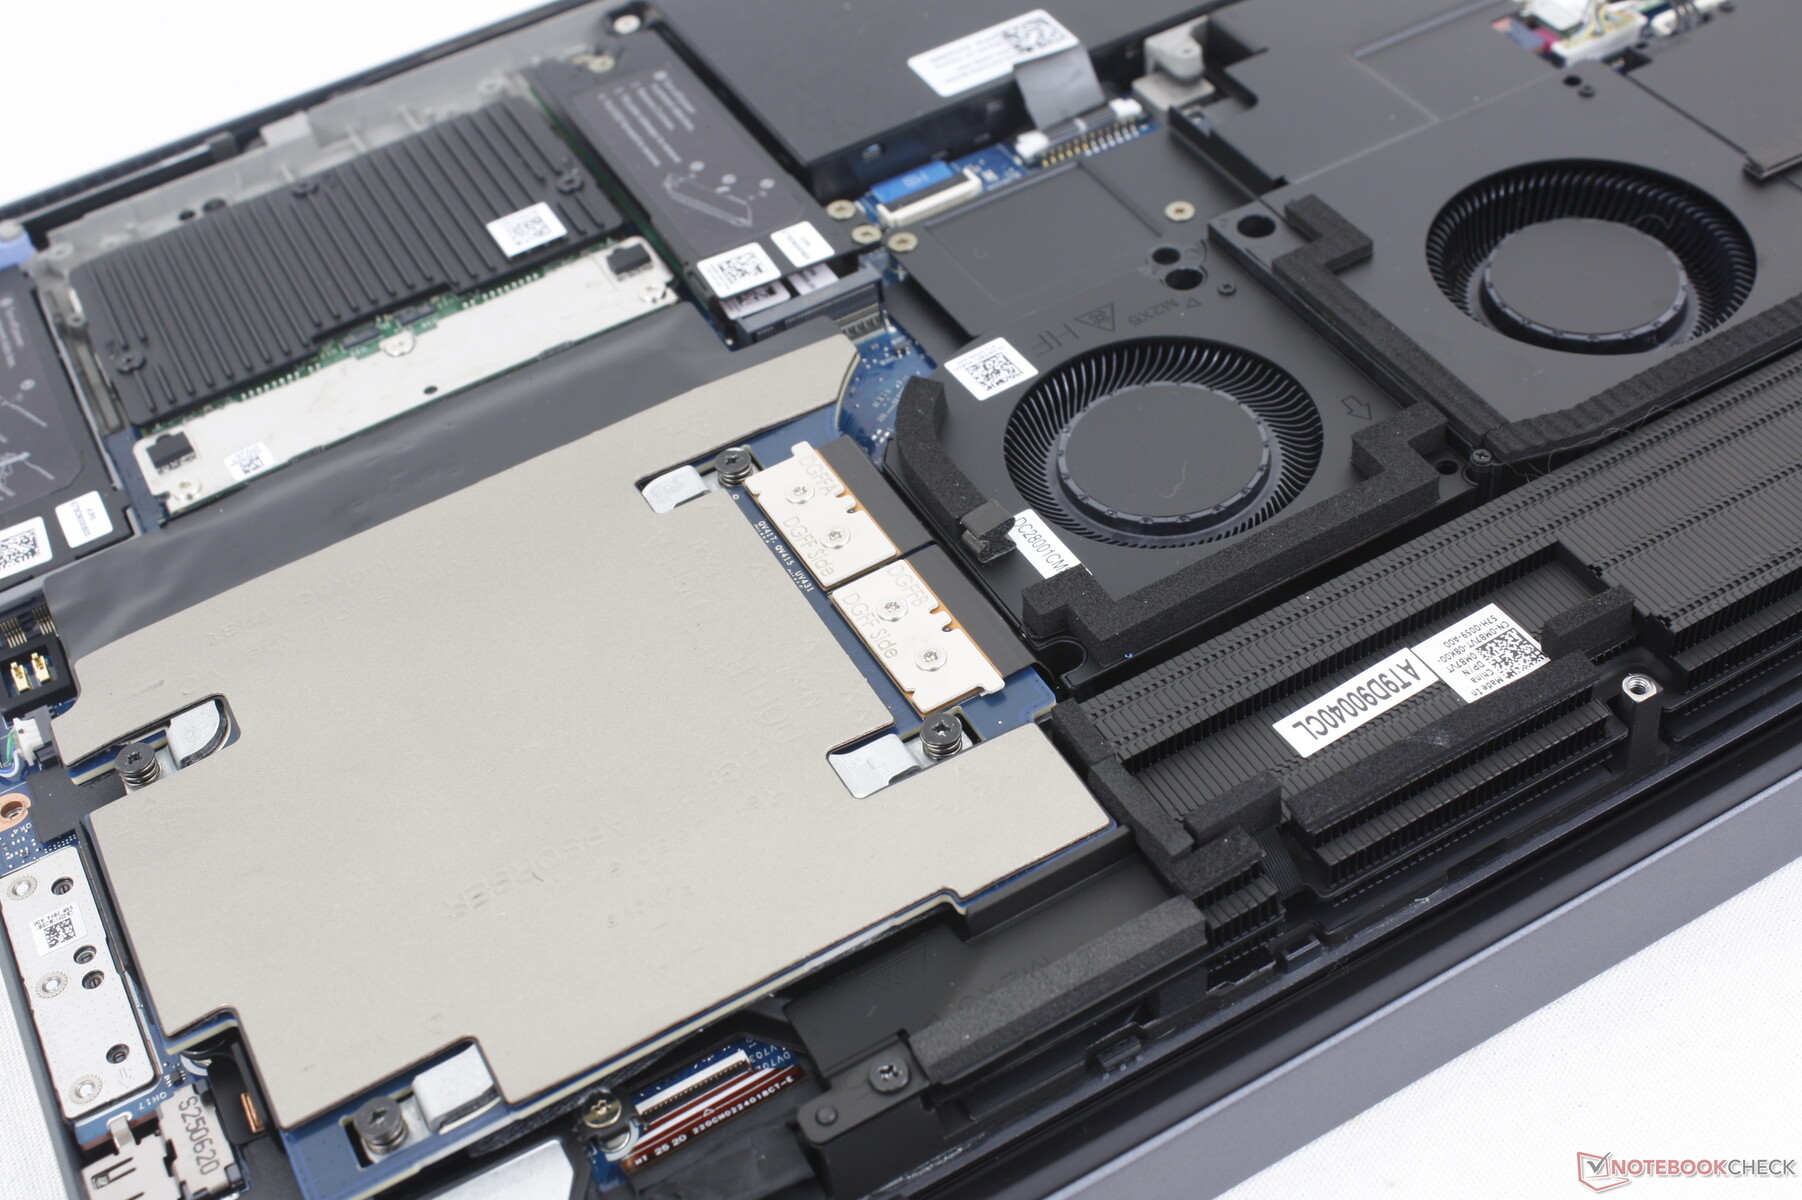
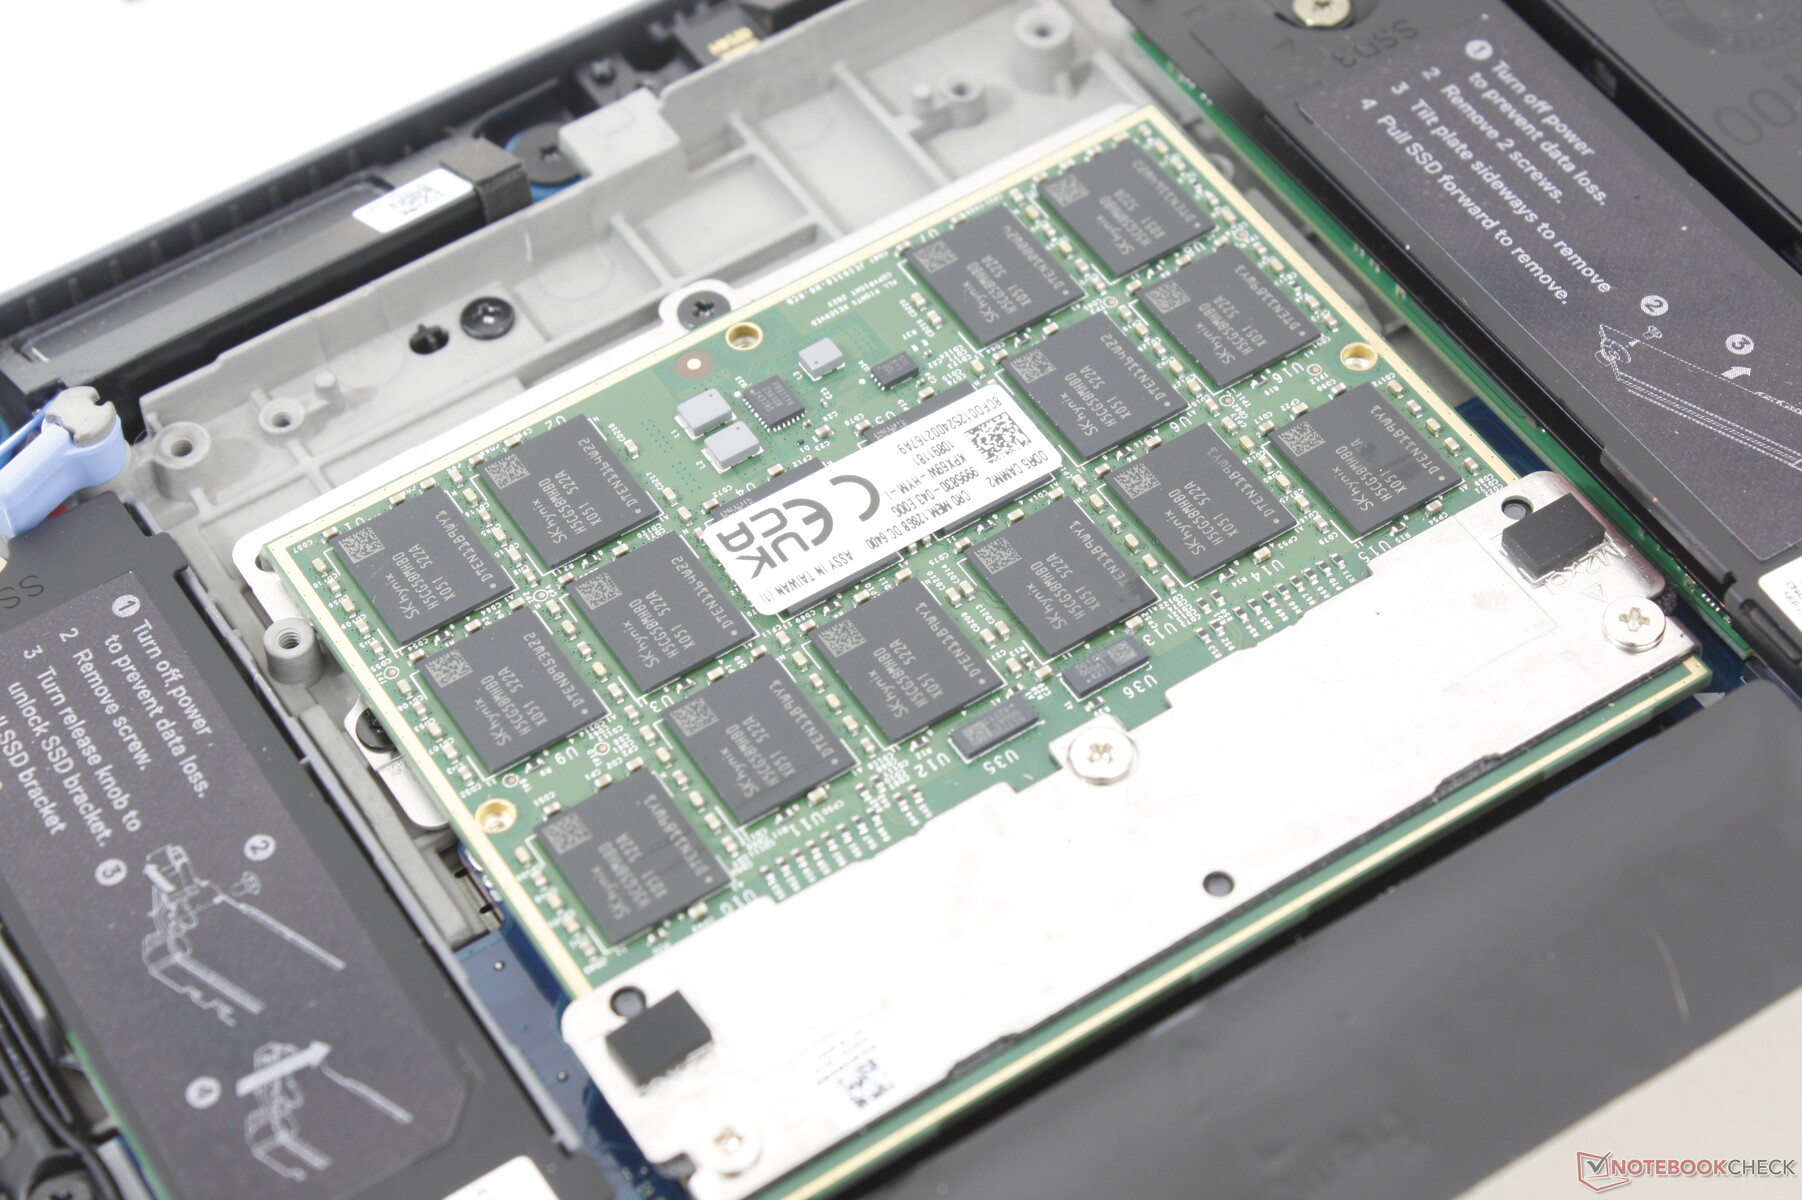
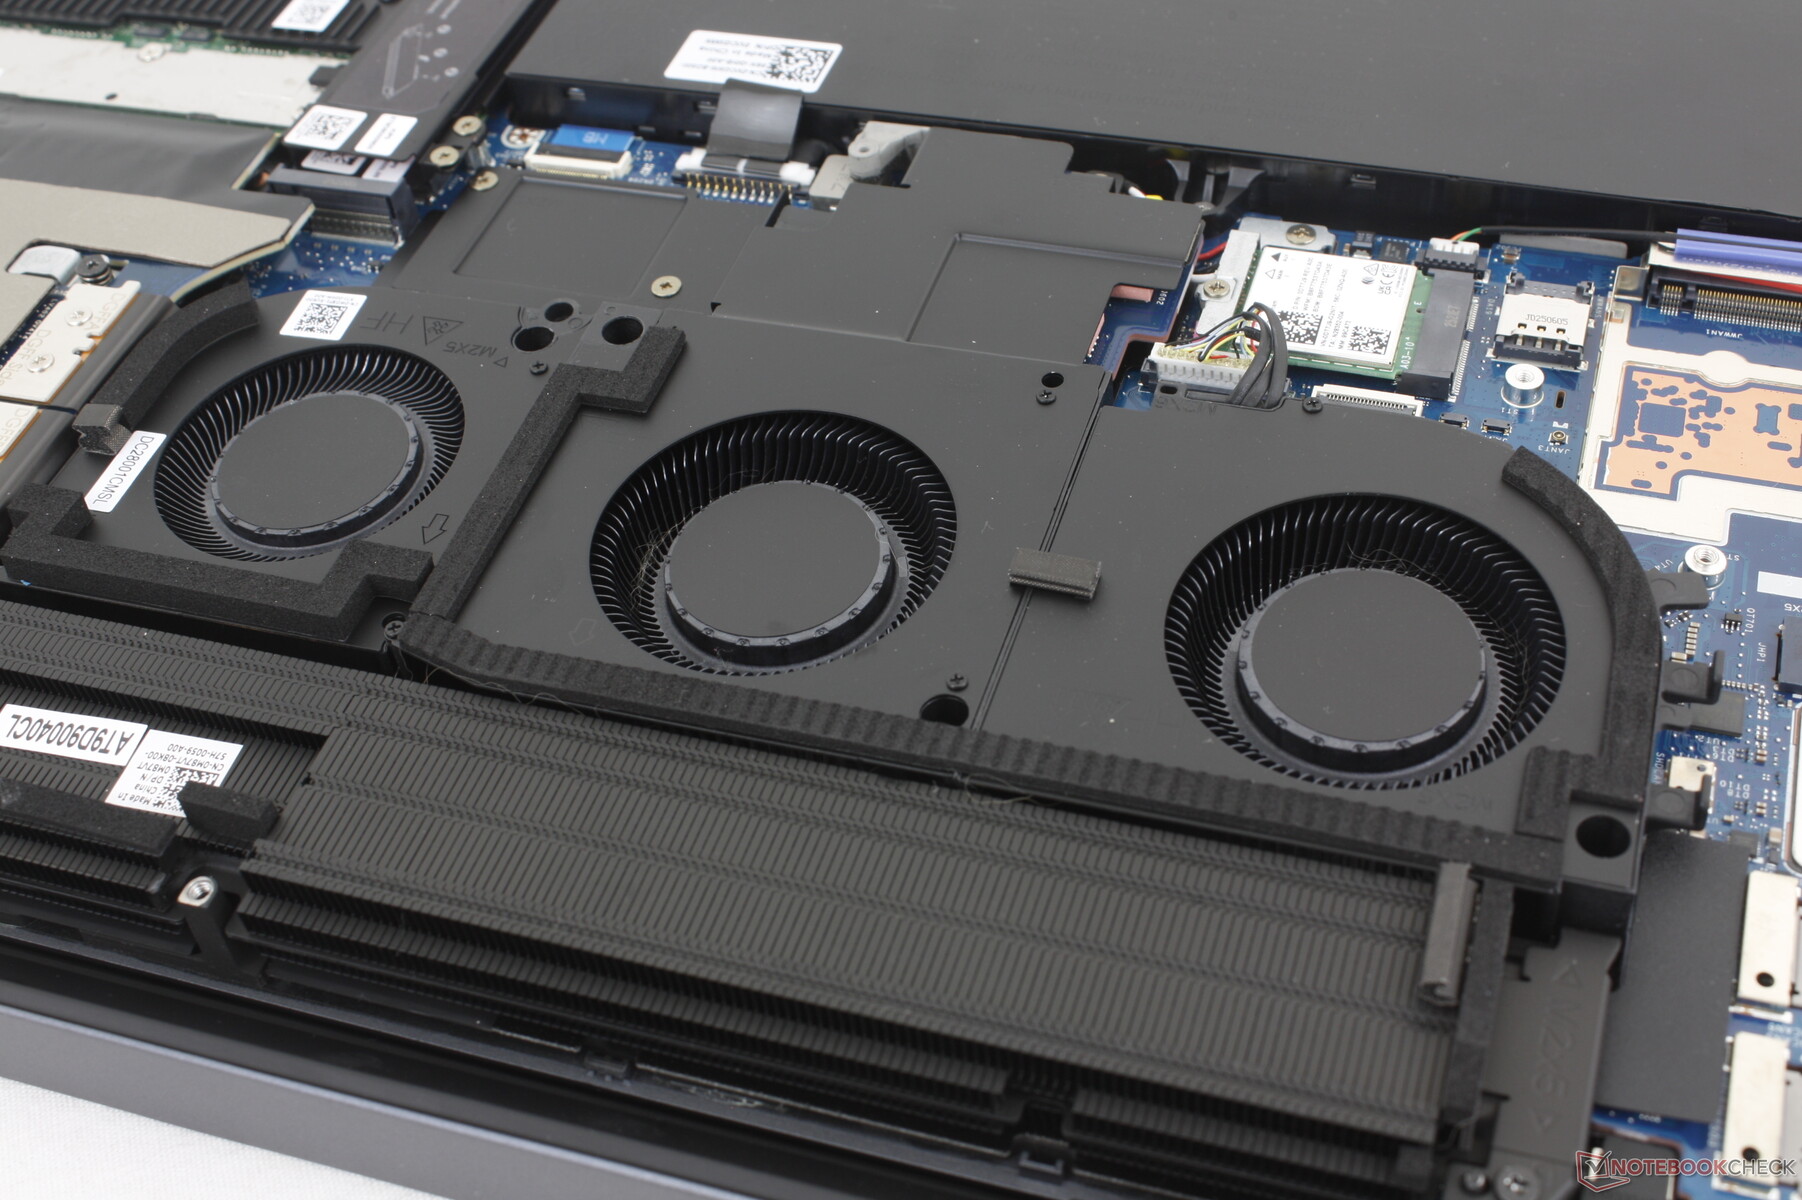
Underhåll
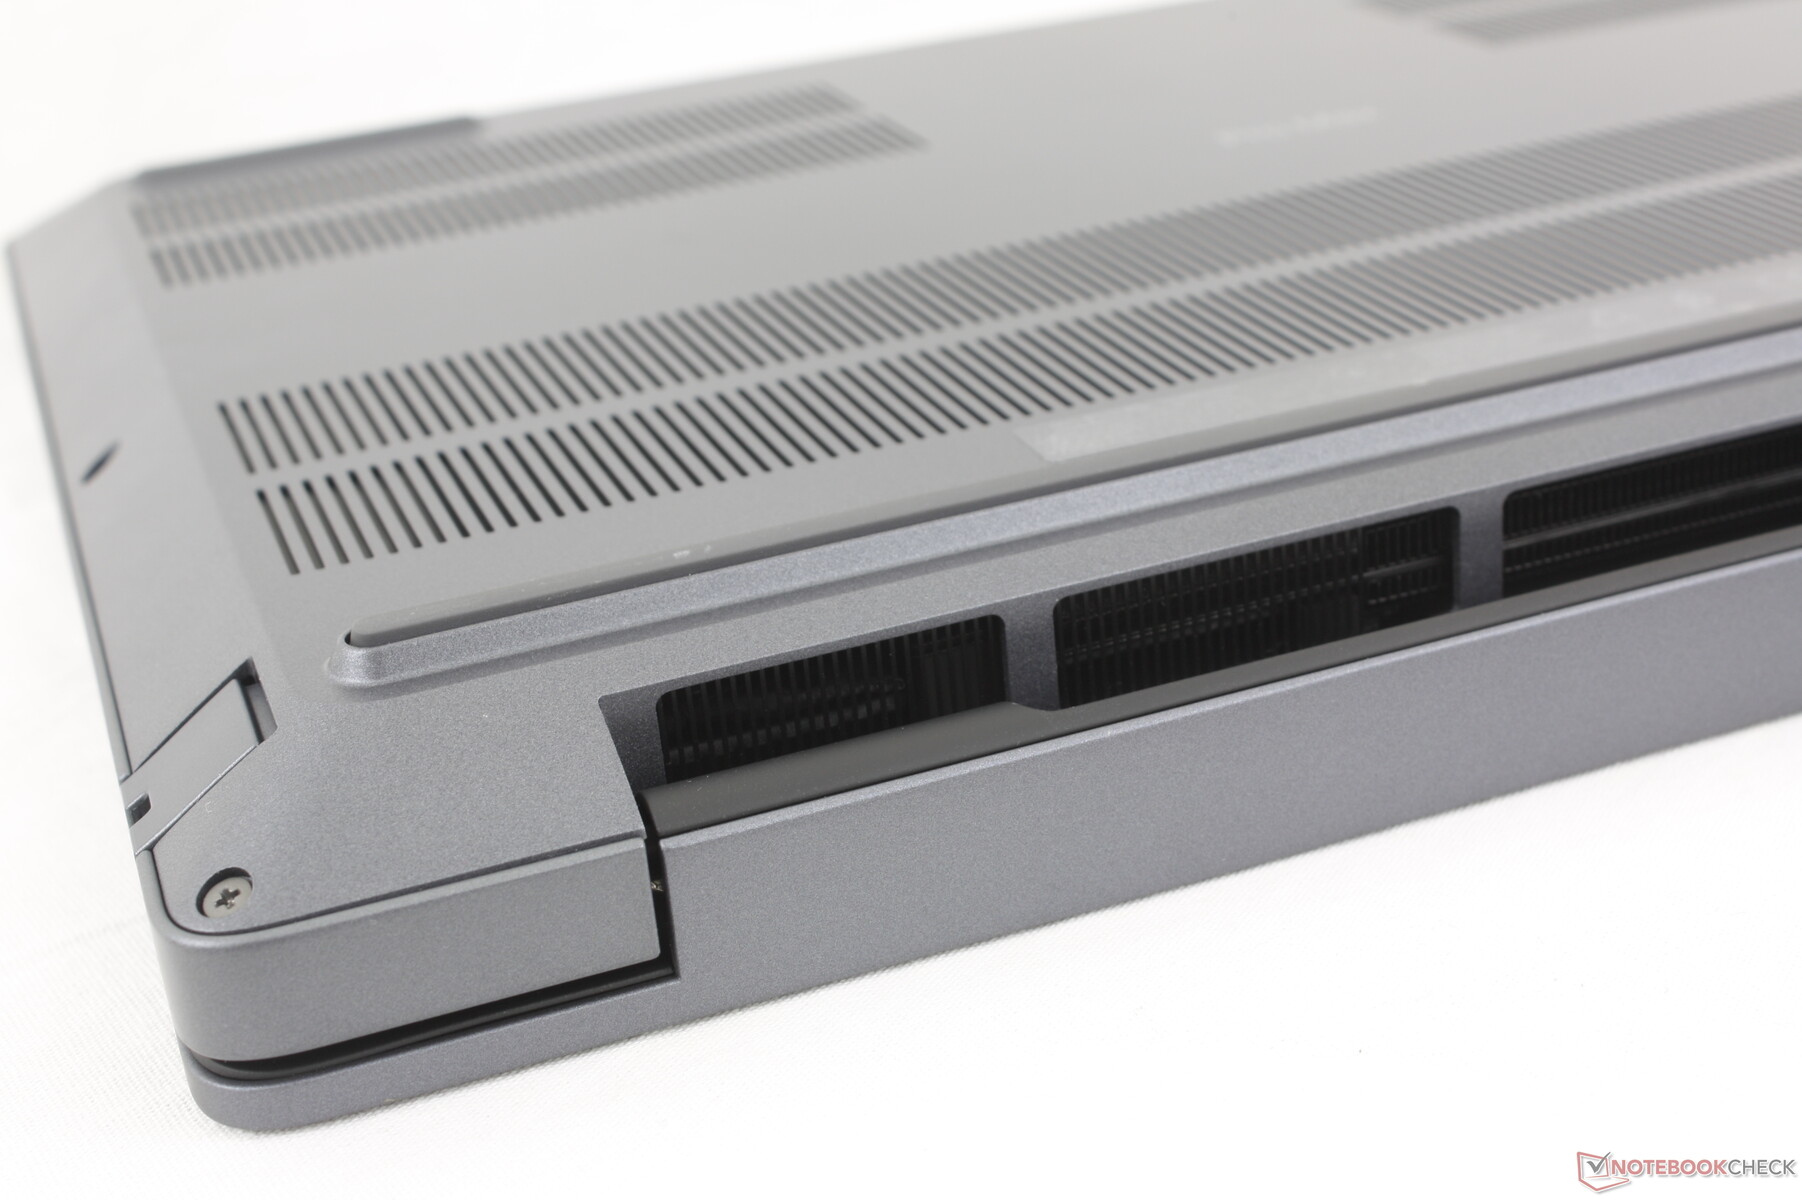
Bottenpanelen kräver endast en stjärnskruvmejsel för att avlägsnas för enkel åtkomst till interndelarna. CAMM2-modulen, två M.2 2280 SSD-kortplatser, WLAN-modulen och grafikkortet (DGFF) är alla löstagbara.
SSD "drive door" som fanns på den äldre Precision 7670/7680-designen har tagits bort.
Hållbarhet
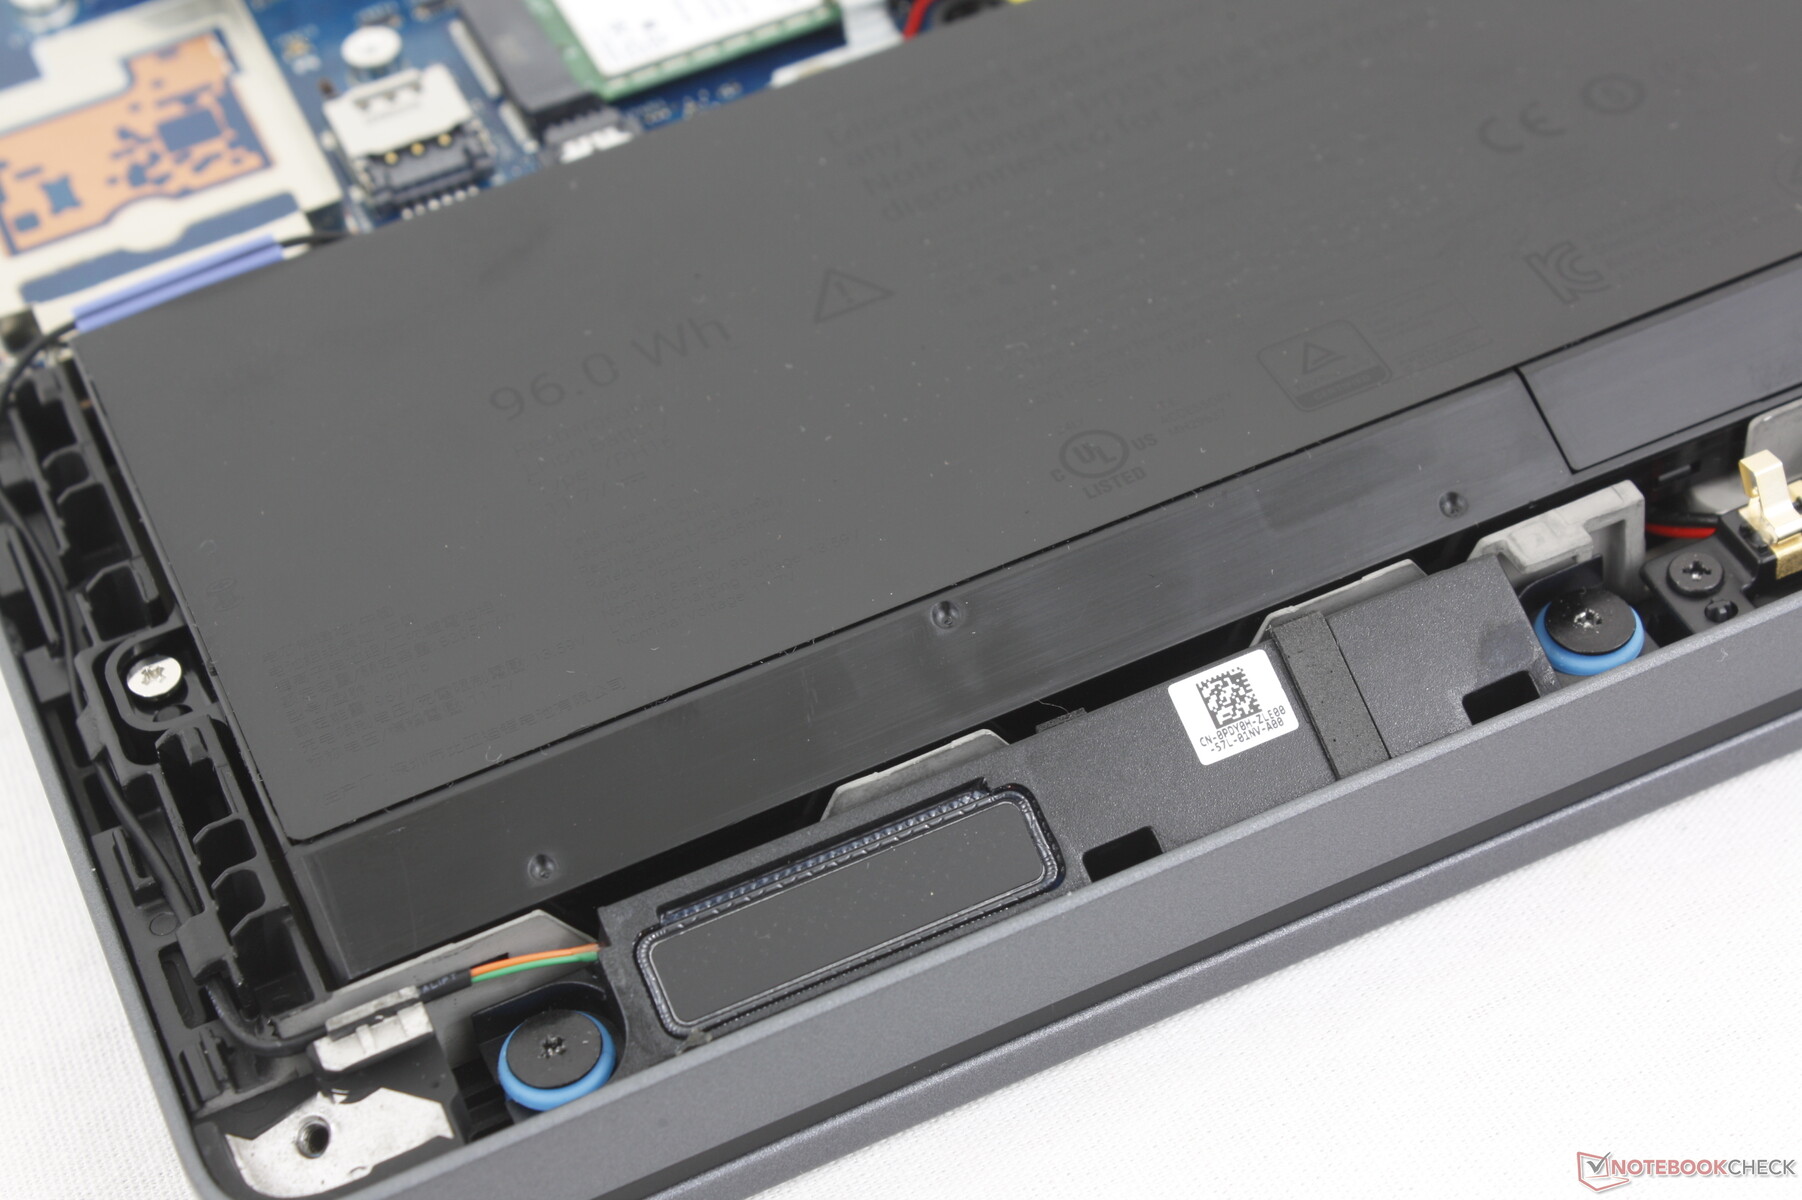
Chassit består av 90 procent återvunnet magnesium för topp- och bottenkåporna, 30 procent PCC-plast för handledsstöden, 46 procent biobaserad plast för bottenstötfångarna och 50 procent återvunnen kobolt för batteriet på 96 Whr. Den här modellen är också en av Dells första med modulära USB-C-portar som är lätta att byta ut om portarna skulle gå sönder eller lossna på grund av överanvändning.
Tillbehör och garanti
Det finns inga extra tillbehör i lådan förutom nätadaptern och pappersarbete. En treårig tillverkargaranti ingår som standard.
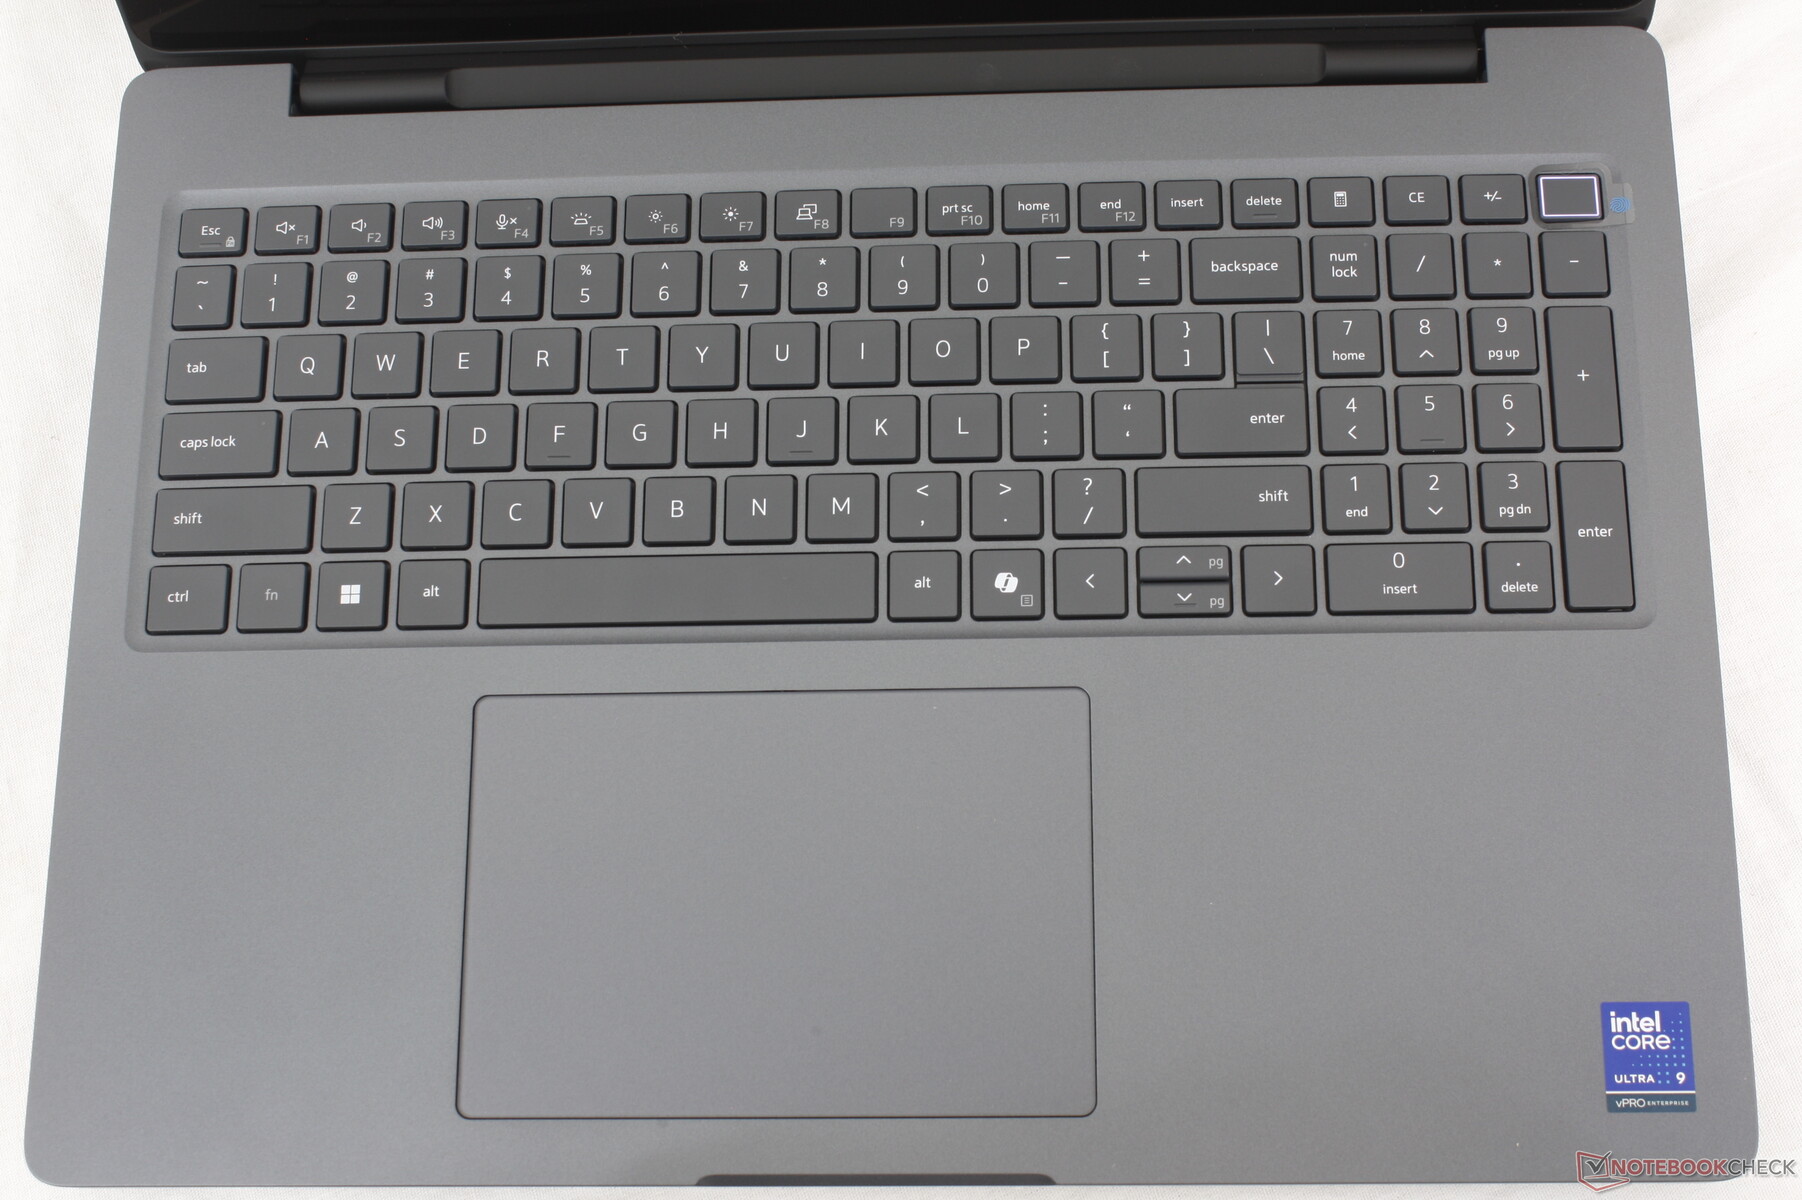
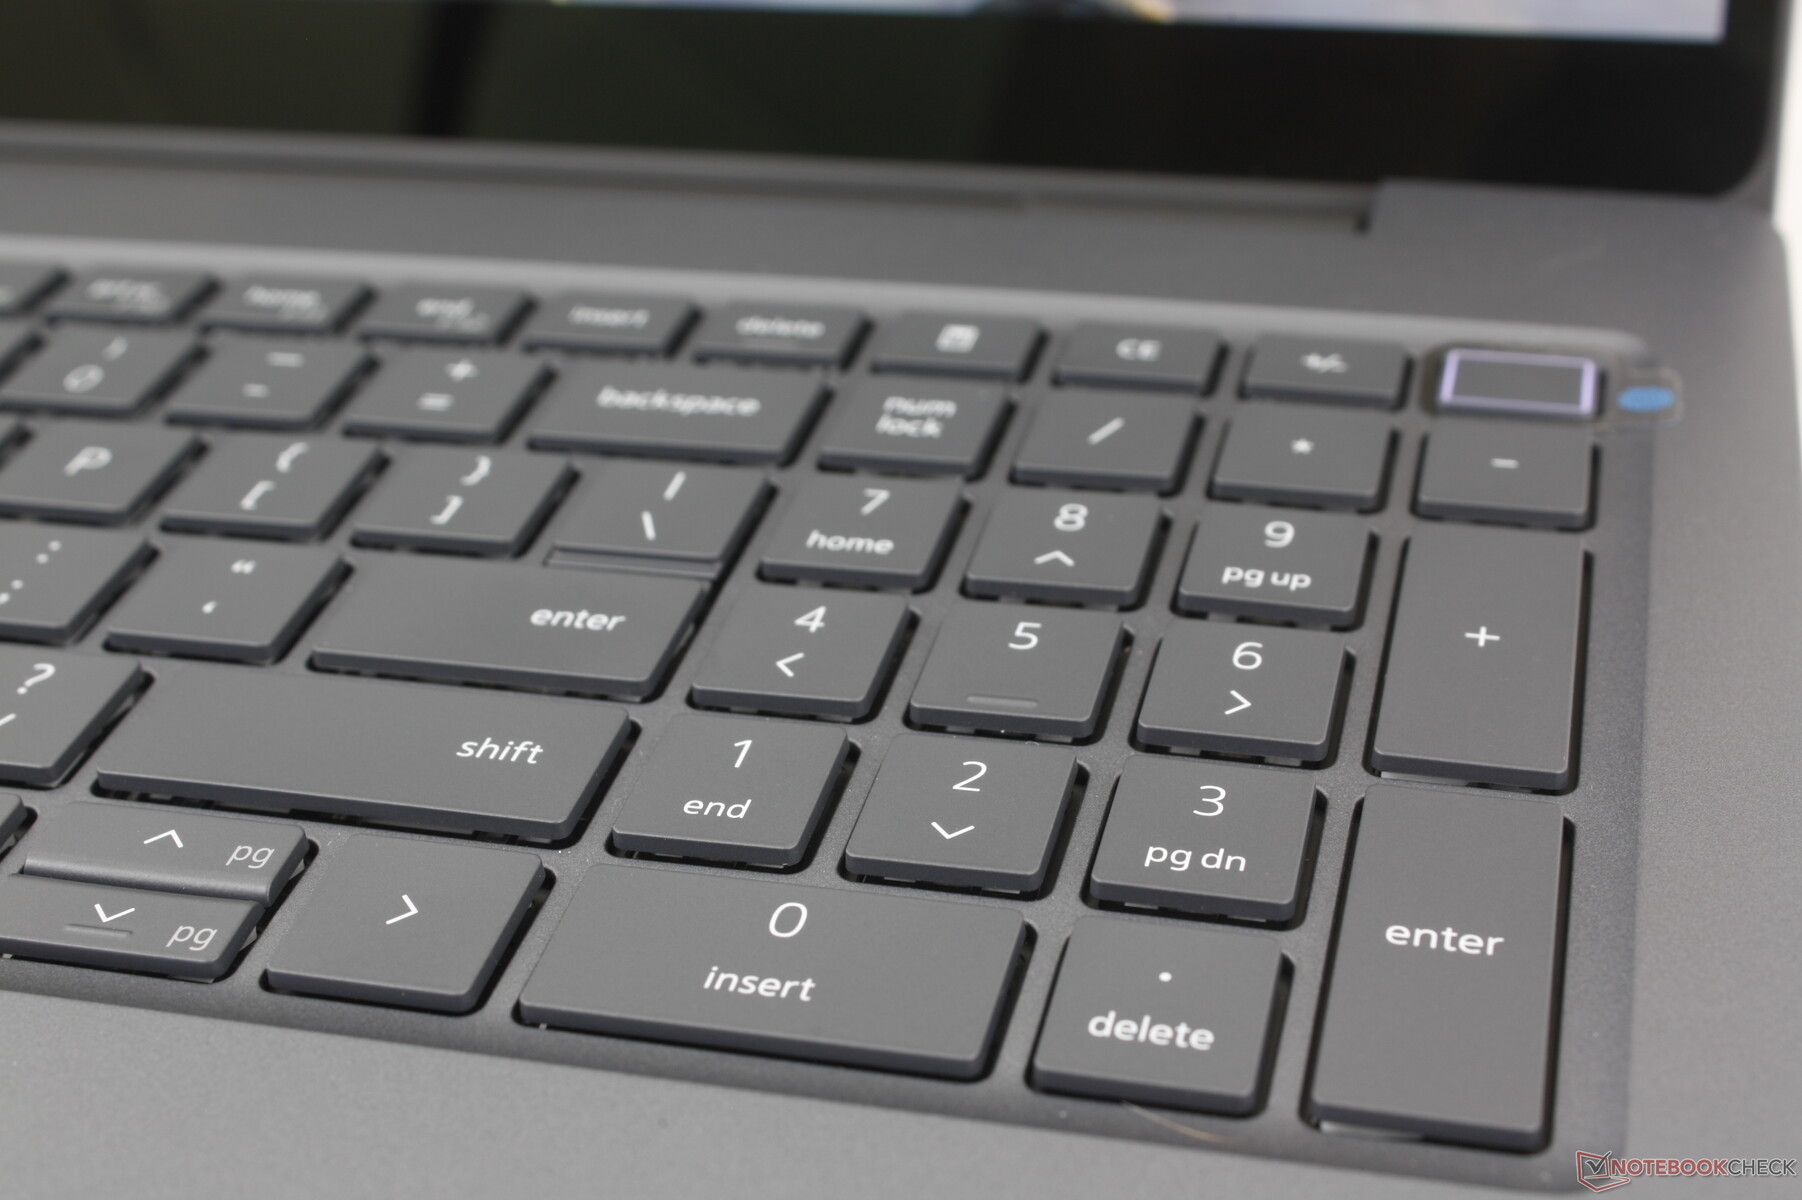
Inmatningsenheter
Tangentbord och pekplatta


Display

Tre displayalternativ finns tillgängliga enligt följande:
- 1920 x 1200, 60 Hz, beröringsfri, 300 nits, ~60 % sRGB
- 1920 x 1200, 120 Hz, beröringsfri, 500 nits, 100 % DCI-P3
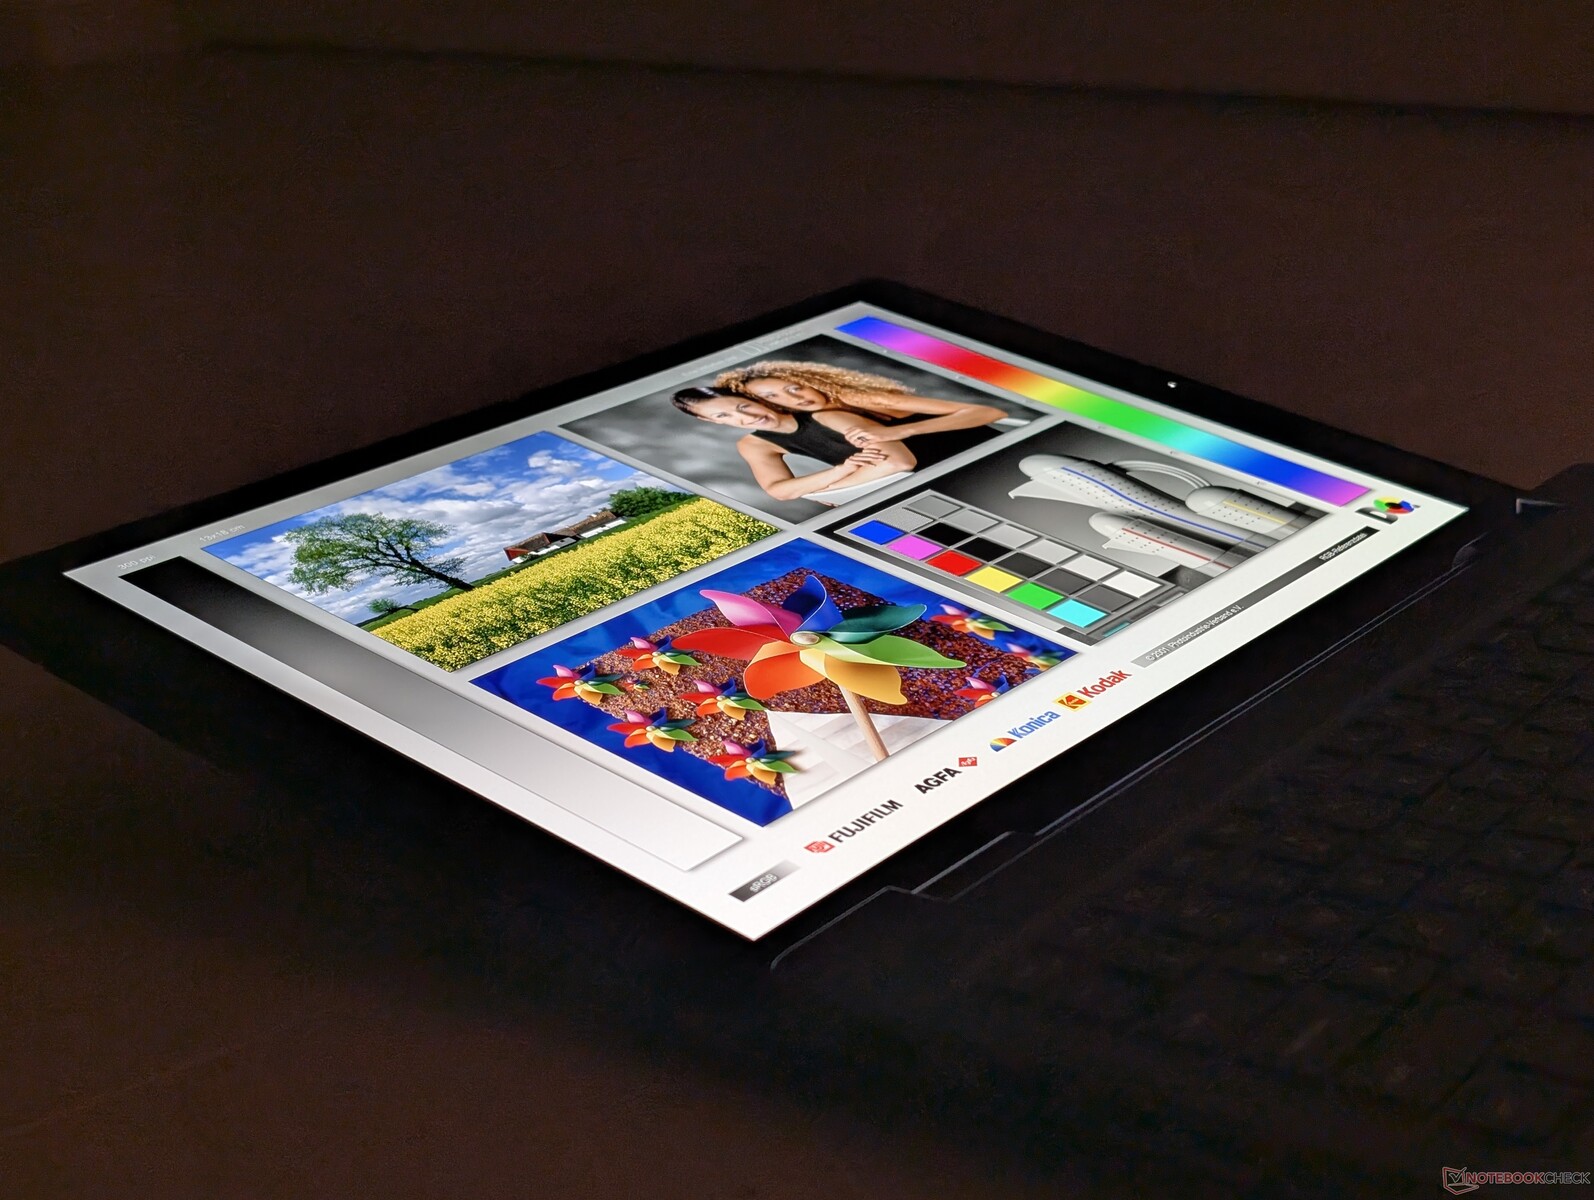
- 3840 x 2400, 120 Hz, OLED, touch, 500 nits, 100 % DCI-P3
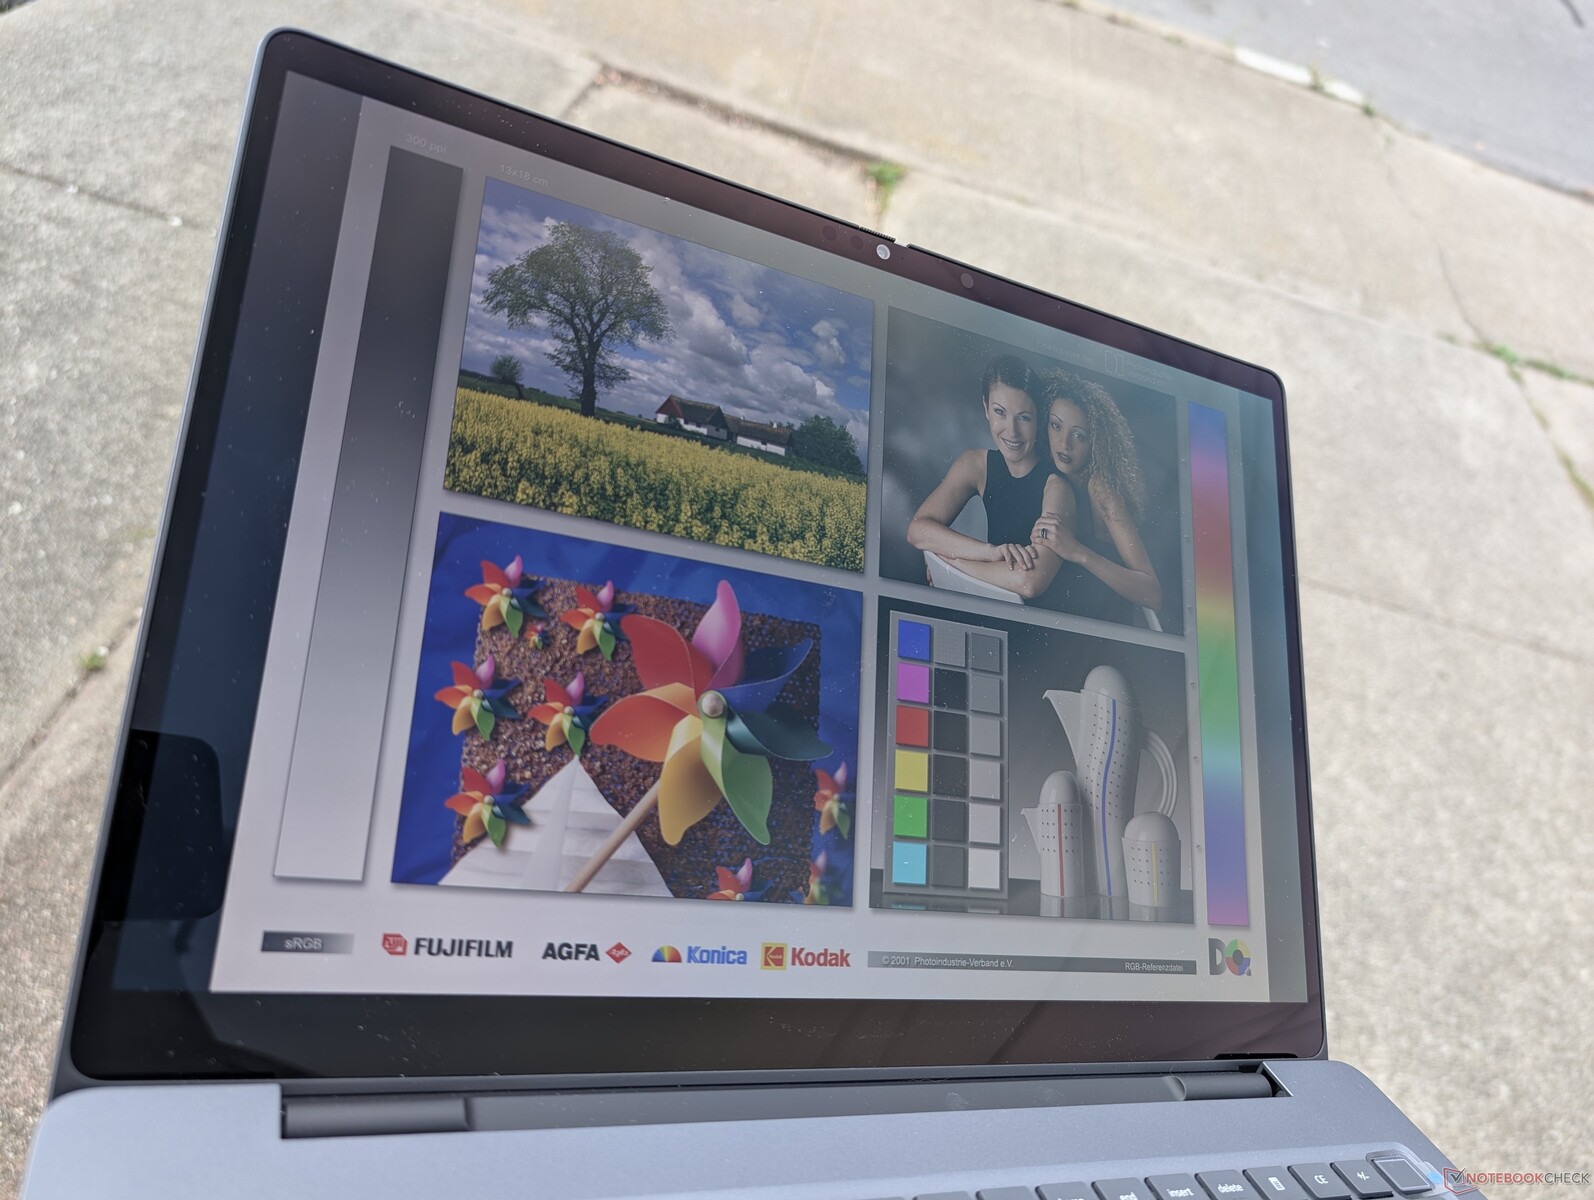
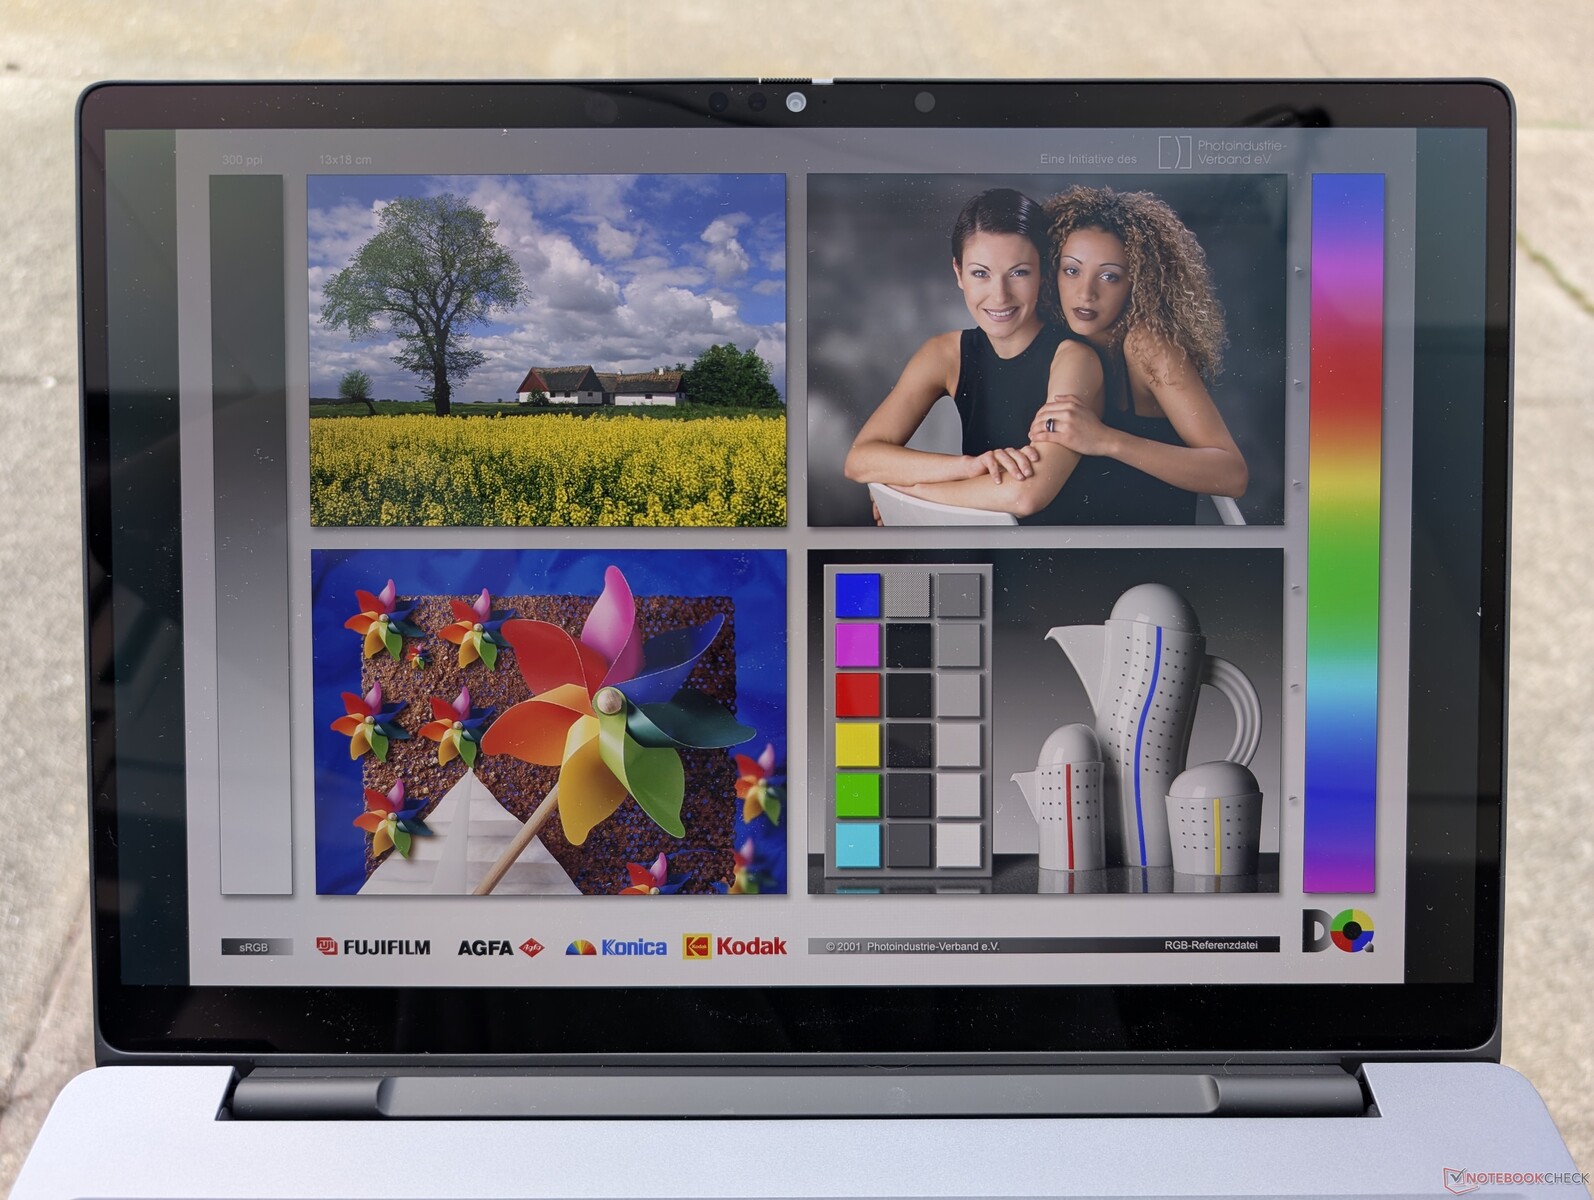
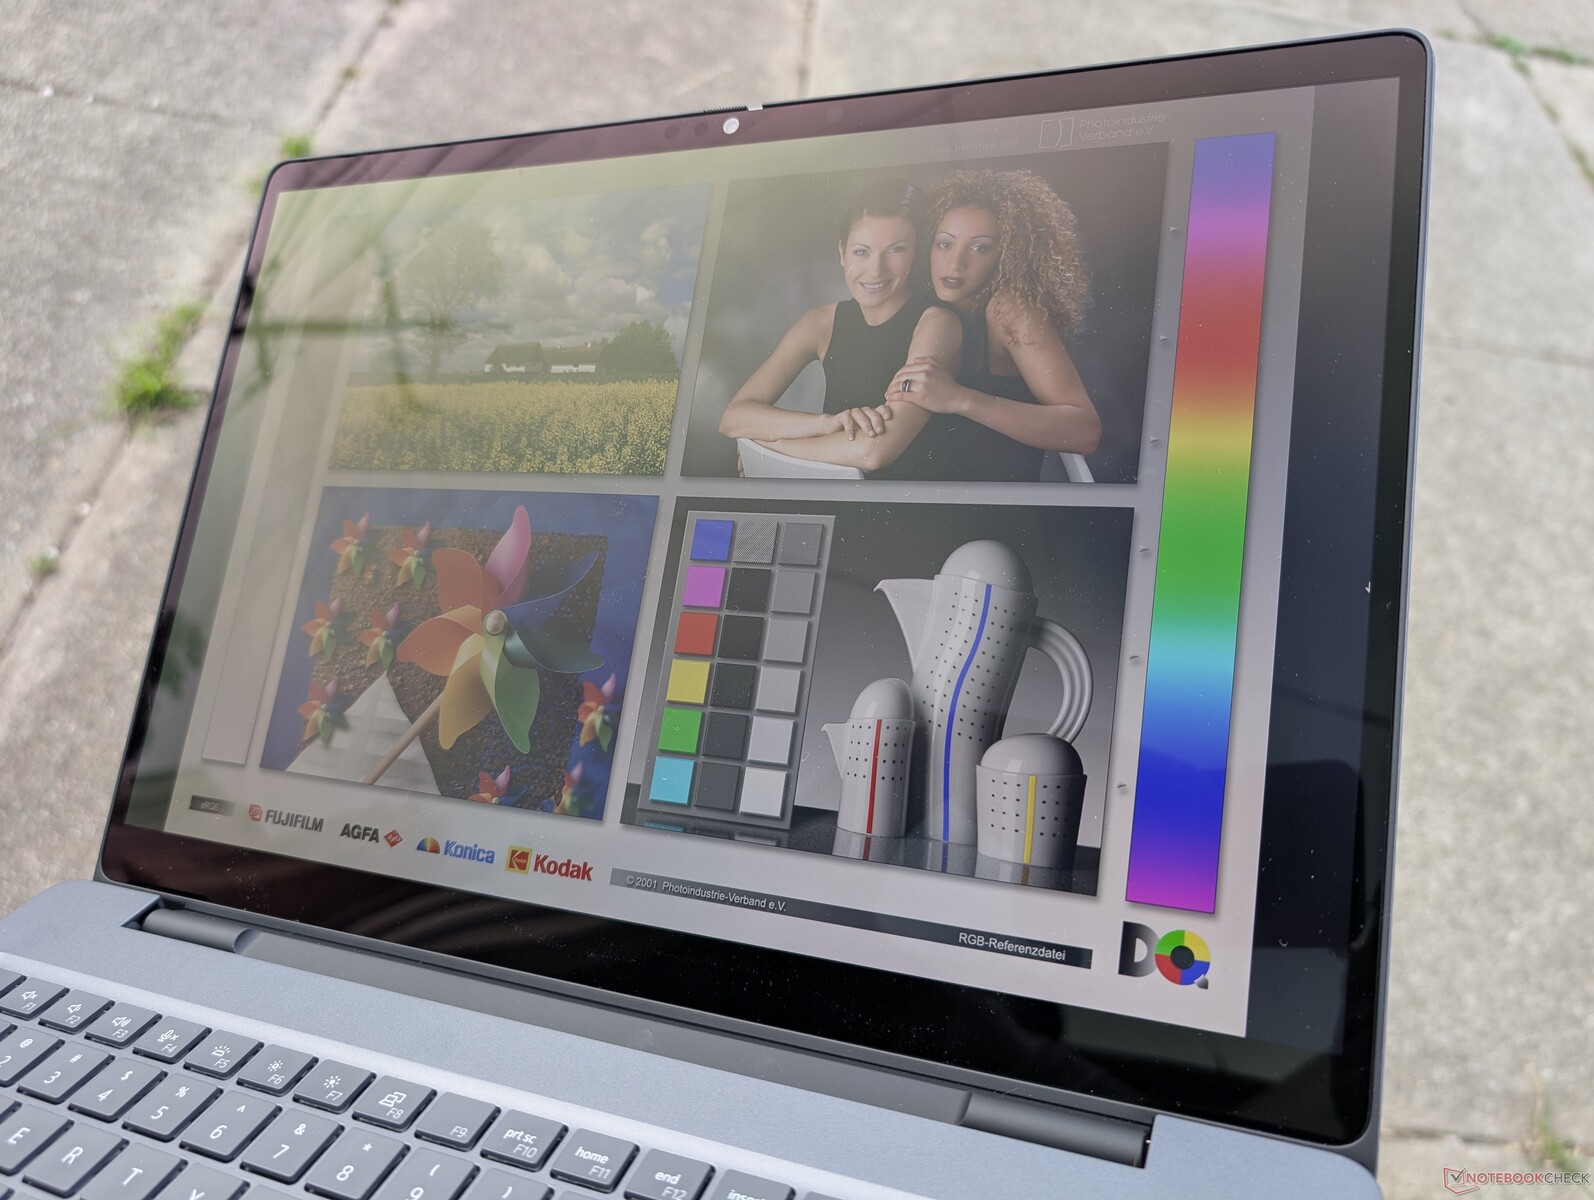
Vår testenhet är utrustad med det fetmarkerade alternativet ovan och är därmed en av de få 16-tums arbetsstationer som levereras med 4K 120 Hz OLED-paneler.
Maximal ljusstyrka toppar på ~550 nits i SDR-läge eller 1066 nits om HDR-läge är aktiverat. 4K HDR-uppspelning är därför lika bra eller bättre än de flesta bärbara konsumentdatorer på entusiastnivå.
| |||||||||||||||||||||||||
Distribution av ljusstyrkan: 95 %
Mitt på batteriet: 530.9 cd/m²
Kontrast: ∞:1 (Svärta: 0 cd/m²)
ΔE ColorChecker Calman: 2.42 | ∀{0.5-29.43 Ø4.72}
calibrated: 0.7
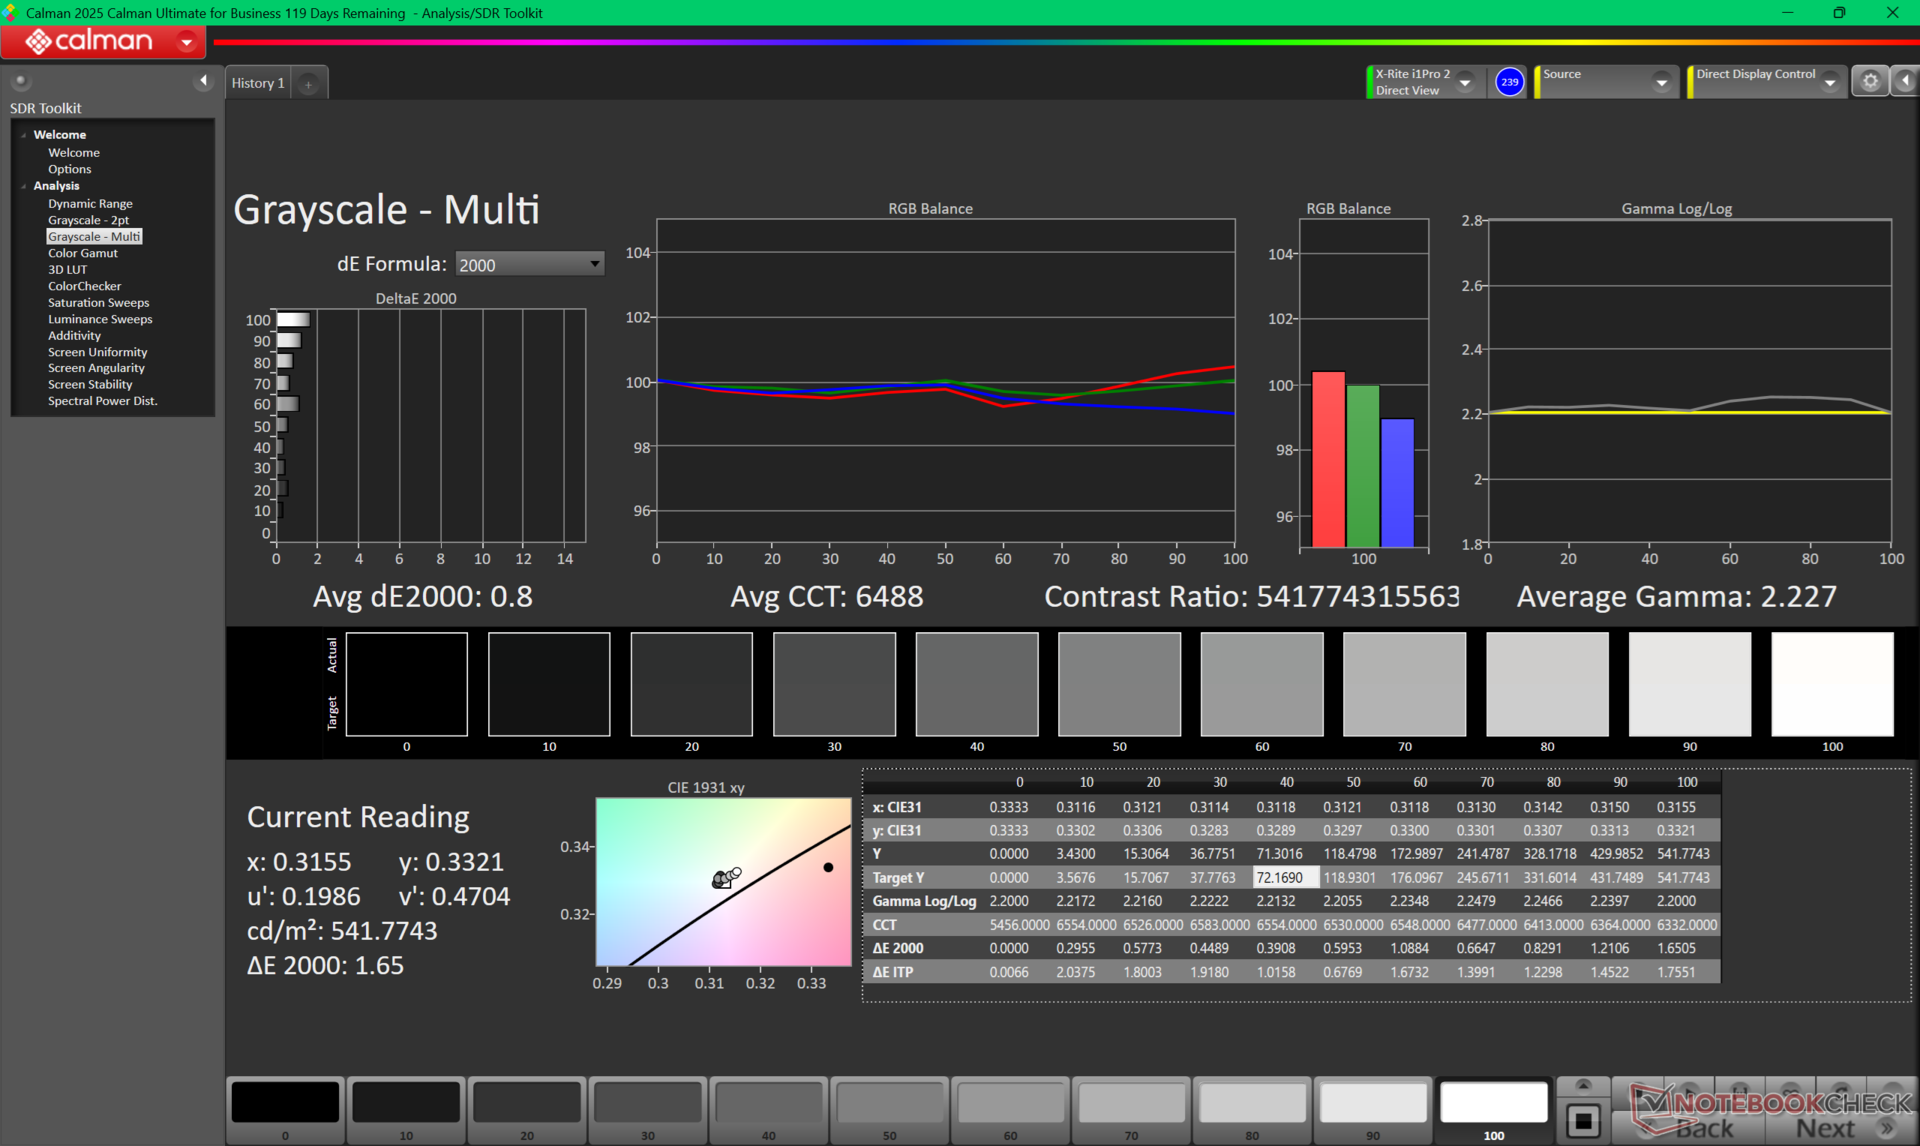
ΔE Greyscale Calman: 0.8 | ∀{0.09-98 Ø4.97}
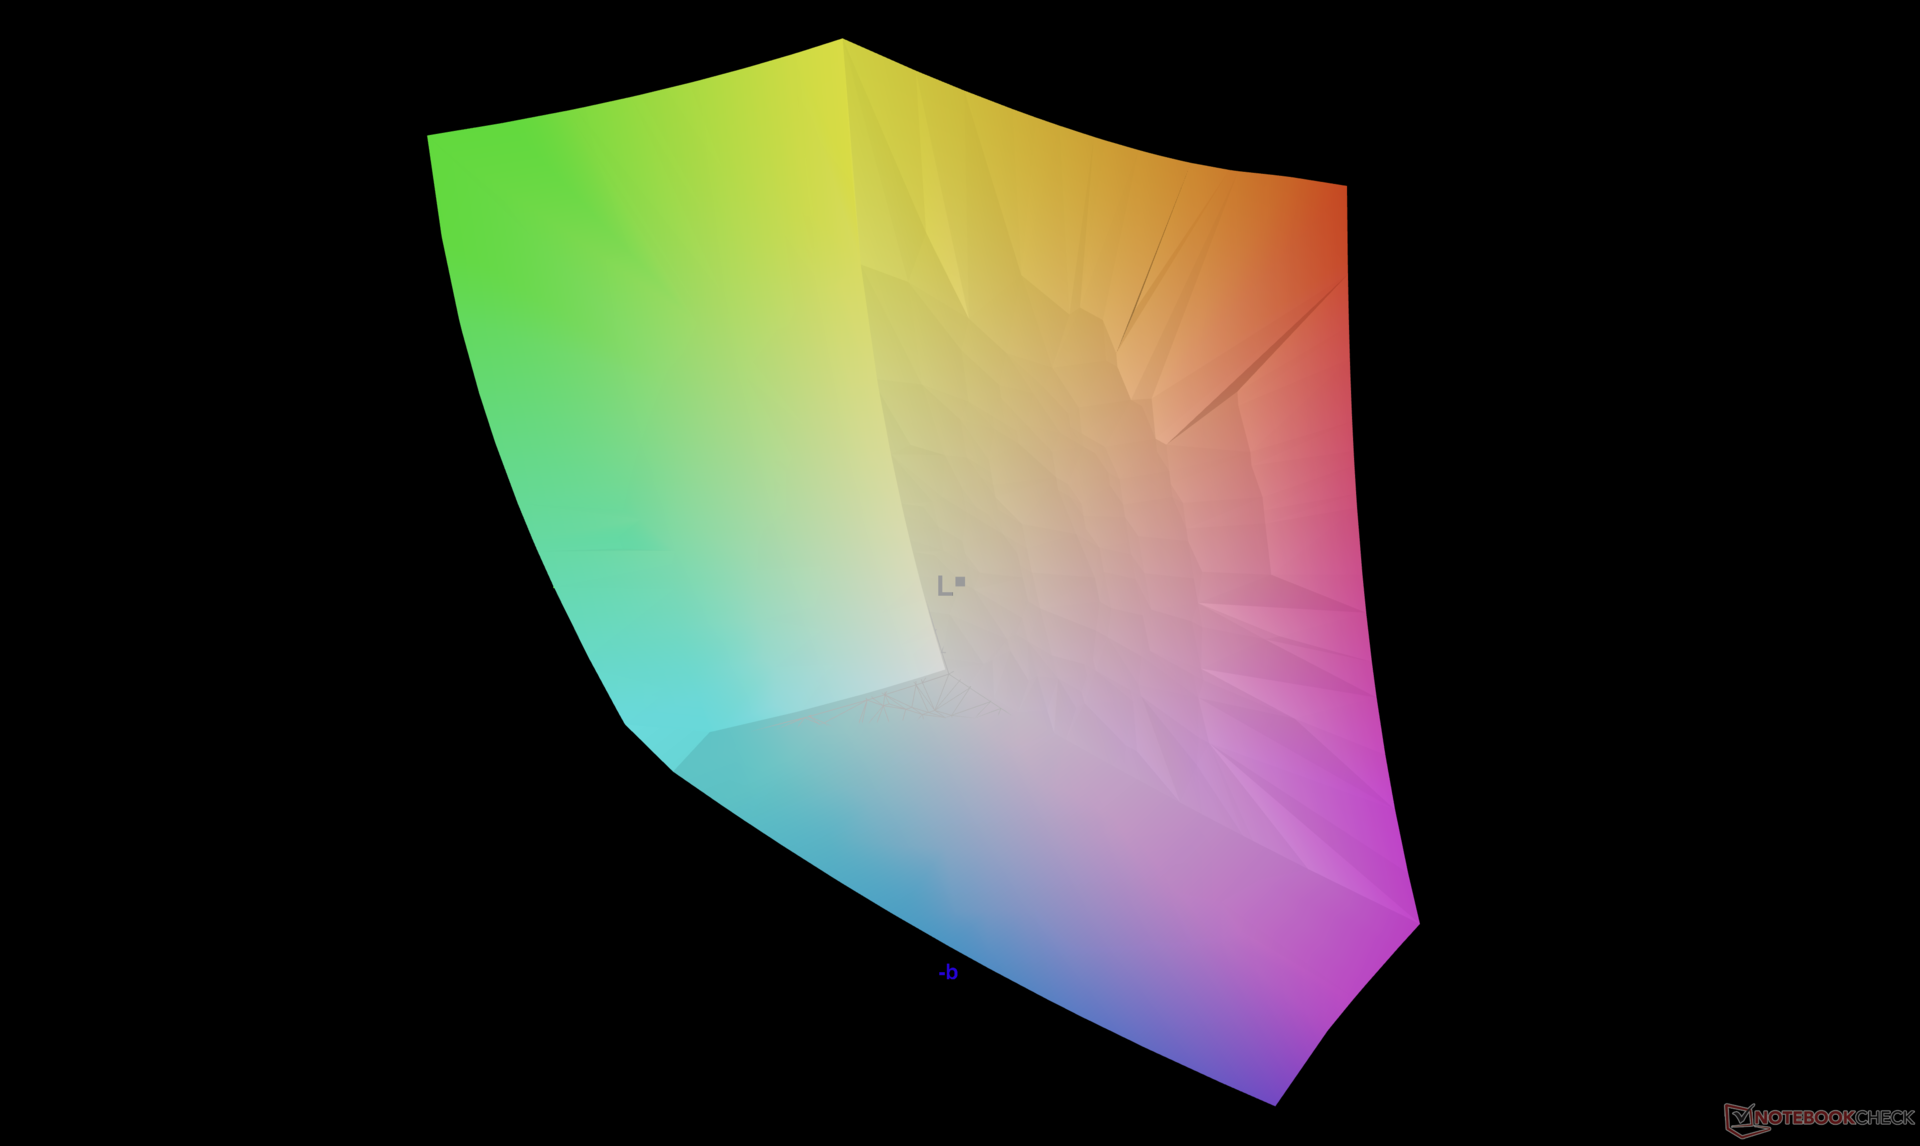
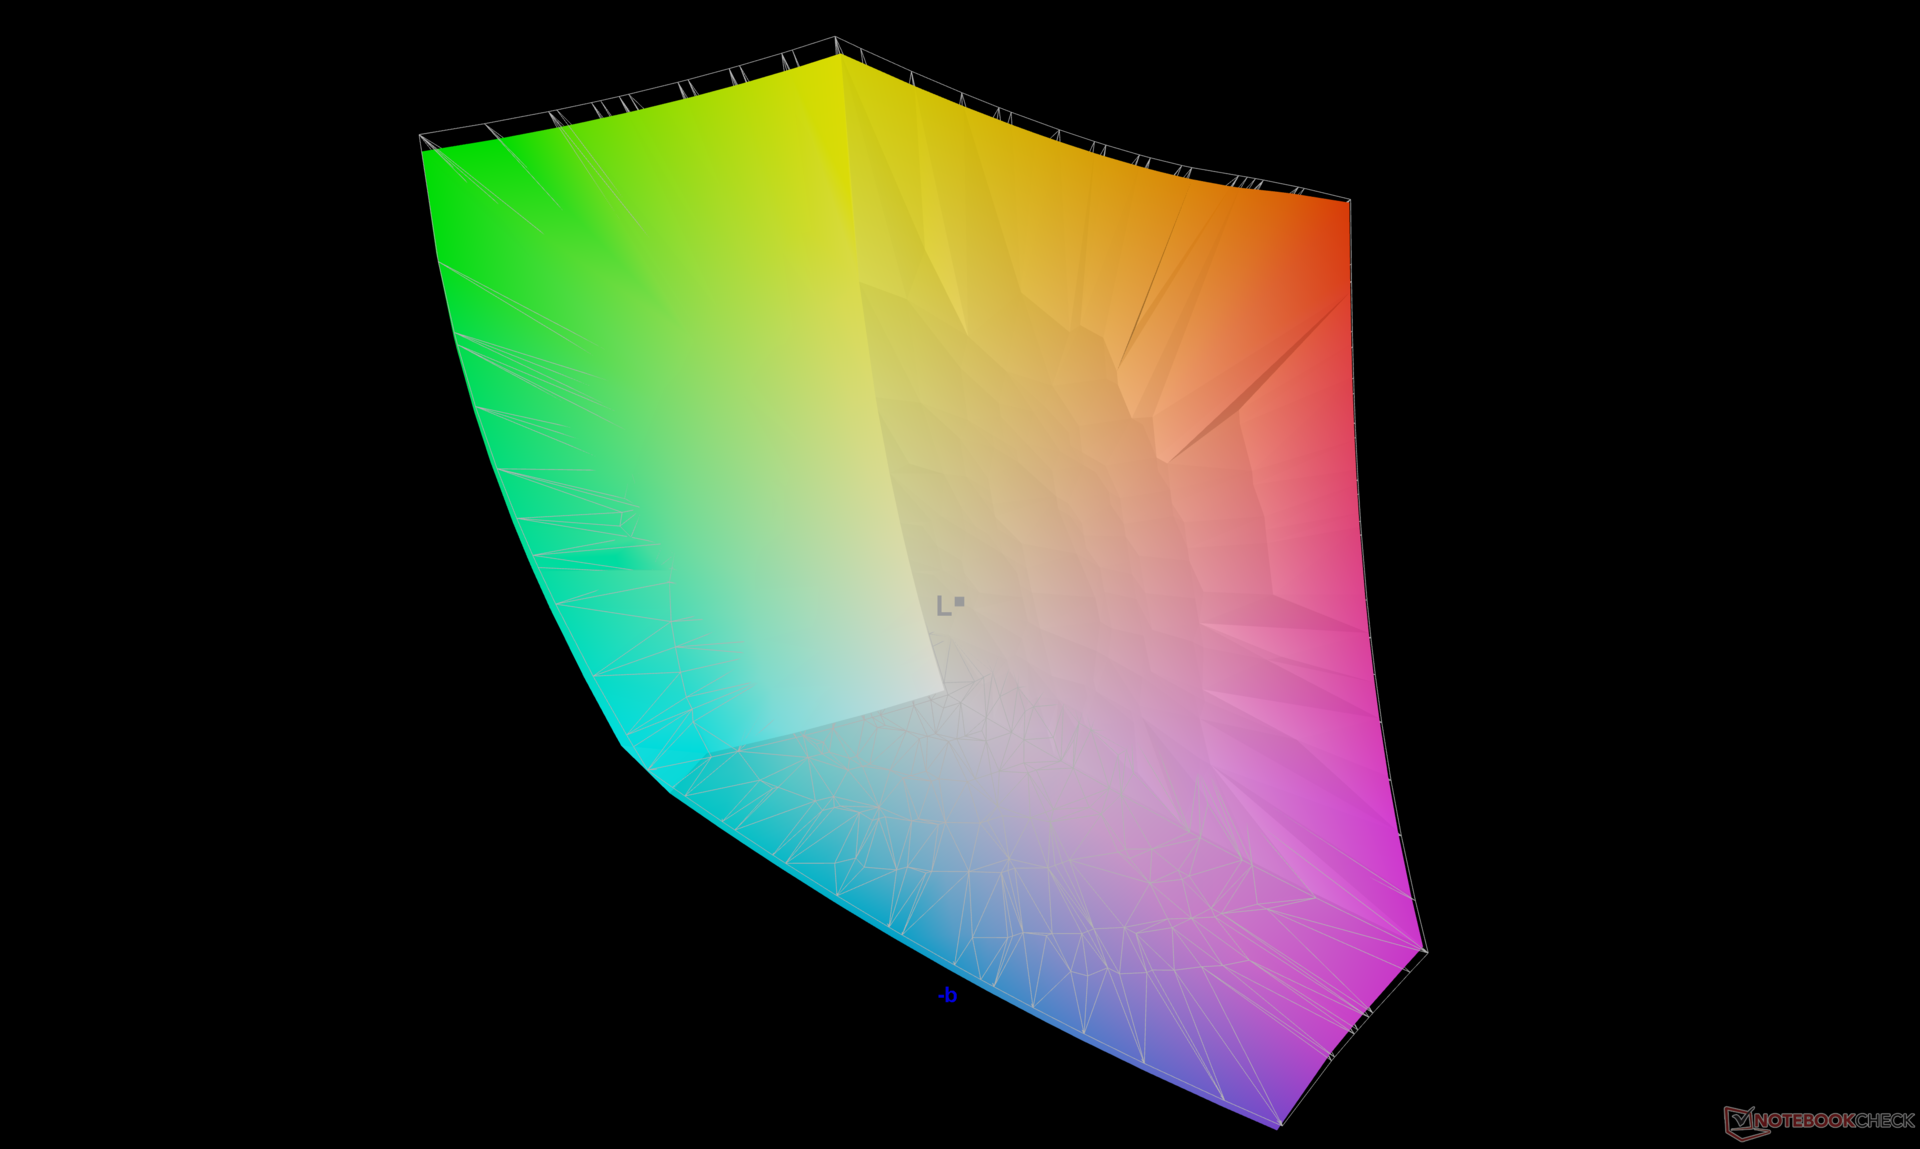
88.8% AdobeRGB 1998 (Argyll 3D)
100% sRGB (Argyll 3D)
97.3% Display P3 (Argyll 3D)
Gamma: 2.23
CCT: 6488 K
| Dell Pro Max 16 Plus Samsung 160HC01, OLED, 3840x2400, 16", 120 Hz | Dell Precision 5690 Samsung 160YV03, OLED, 3840x2400, 16", 60 Hz | Dell Precision 5000 5680 Samsung 160YV03, OLED, 3840x2400, 16", 60 Hz | Lenovo ThinkPad P16 Gen 2 NE160QDM-NY1, IPS, 2560x1600, 16", 165 Hz | Lenovo ThinkPad P1 Gen 7 21KV001SGE MNG007DA1-9 , IPS LED, 2560x1600, 16", 165 Hz | HP ZBook Studio 16 G11 AUO87A8, IPS, 3840x2400, 16", 120 Hz | MSI CreatorPro Z16P B12UKST B160QAN02.N, IPS, 2560x1600, 16", 165 Hz | |
|---|---|---|---|---|---|---|---|
| Display | 4% | 4% | -18% | -17% | -1% | -1% | |
| Display P3 Coverage (%) | 97.3 | 99.8 3% | 99.9 3% | 68.4 -30% | 69.4 -29% | 97.7 0% | 97.6 0% |
| sRGB Coverage (%) | 100 | 100 0% | 100 0% | 96.9 -3% | 97.6 -2% | 99.9 0% | 99.9 0% |
| AdobeRGB 1998 Coverage (%) | 88.8 | 96.6 9% | 97.5 10% | 70.6 -20% | 71.8 -19% | 85.7 -3% | 87.4 -2% |
| Response Times | -131% | -133% | -1575% | -1385% | -1623% | -1332% | |
| Response Time Grey 50% / Grey 80% * (ms) | 0.63 ? | 1.7 ? -170% | 1.68 ? -167% | 14.1 ? -2138% | 11.2 ? -1678% | 14.2 ? -2154% | 12.8 ? -1932% |
| Response Time Black / White * (ms) | 0.89 ? | 1.7 ? -91% | 1.77 ? -99% | 9.9 ? -1012% | 10.6 ? -1091% | 10.6 ? -1091% | 7.4 ? -731% |
| PWM Frequency (Hz) | 479.9 ? | 60 ? | 60 ? | ||||
| PWM Amplitude * (%) | 28 | ||||||
| Screen | -44% | -67% | 0% | -112% | -44% | -17% | |
| Brightness middle (cd/m²) | 530.9 | 348.1 -34% | 345.7 -35% | 531.5 0% | 516 -3% | 404.3 -24% | 407 -23% |
| Brightness (cd/m²) | 540 | 351 -35% | 349 -35% | 499 -8% | 505 -6% | 405 -25% | 388 -28% |
| Brightness Distribution (%) | 95 | 97 2% | 98 3% | 89 -6% | 89 -6% | 92 -3% | 88 -7% |
| Black Level * (cd/m²) | 0.38 | 0.41 | 0.28 | 0.36 | |||
| Colorchecker dE 2000 * | 2.42 | 4.18 -73% | 3.59 -48% | 1.82 25% | 3.5 -45% | 2.63 -9% | 1.3 46% |
| Colorchecker dE 2000 max. * | 5.76 | 6.68 -16% | 7.02 -22% | 4.1 29% | 8.8 -53% | 4.48 22% | 2.5 57% |
| Colorchecker dE 2000 calibrated * | 0.7 | 0.97 -39% | 0.99 -41% | 0.63 10% | 1.2 -71% | 1.46 -109% | 0.7 -0% |
| Greyscale dE 2000 * | 0.8 | 1.7 -113% | 3.1 -288% | 1.2 -50% | 5.6 -600% | 2.1 -163% | 2.1 -163% |
| Gamma | 2.23 99% | 2.2 100% | 2.13 103% | 2.15 102% | 2.27 97% | 2.3 96% | 2.26 97% |
| CCT | 6488 100% | 6198 105% | 6448 101% | 6484 100% | 6071 107% | 6810 95% | 6437 101% |
| Contrast (:1) | 1399 | 1259 | 1444 | 1131 | |||
| Totalt genomsnitt (program/inställningar) | -57% /
-46% | -65% /
-60% | -531% /
-267% | -505% /
-300% | -556% /
-297% | -450% /
-232% |
* ... mindre är bättre
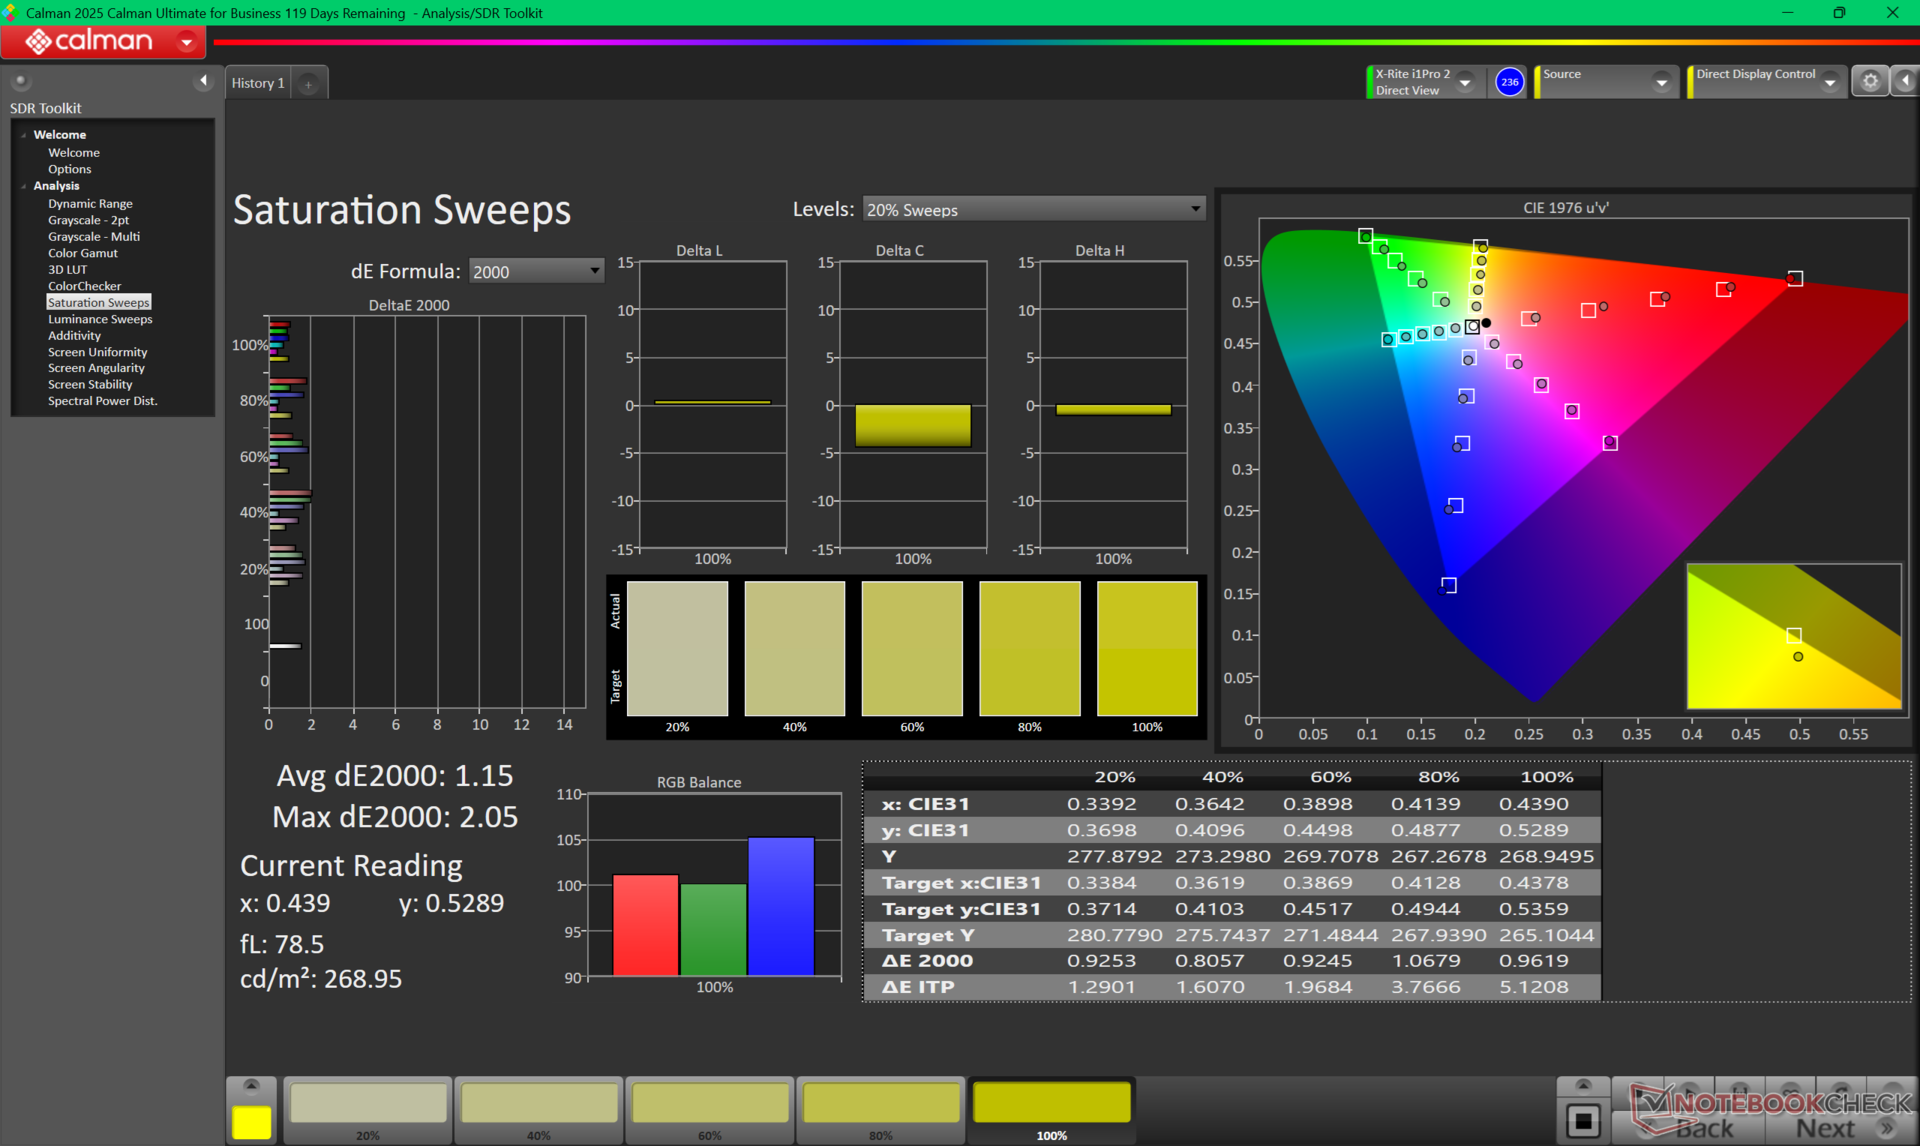
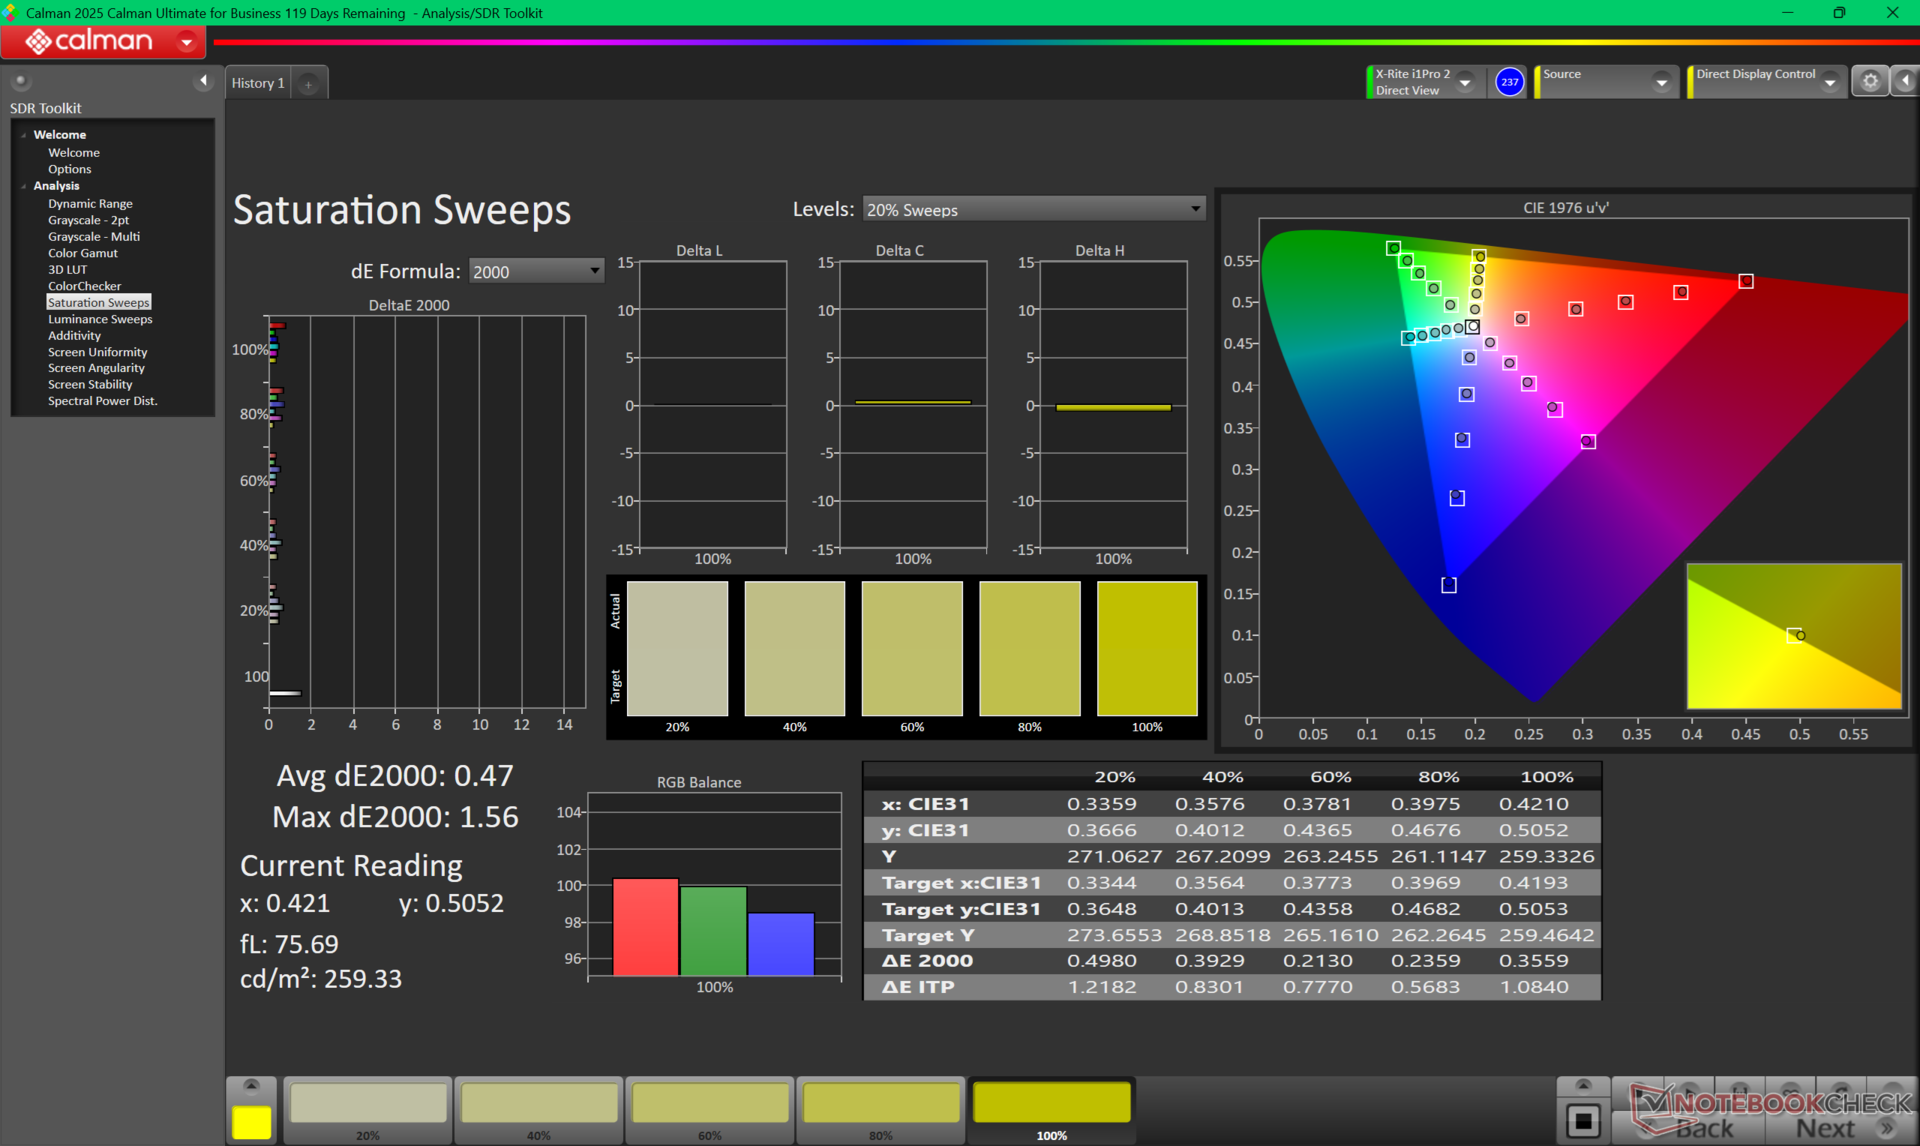
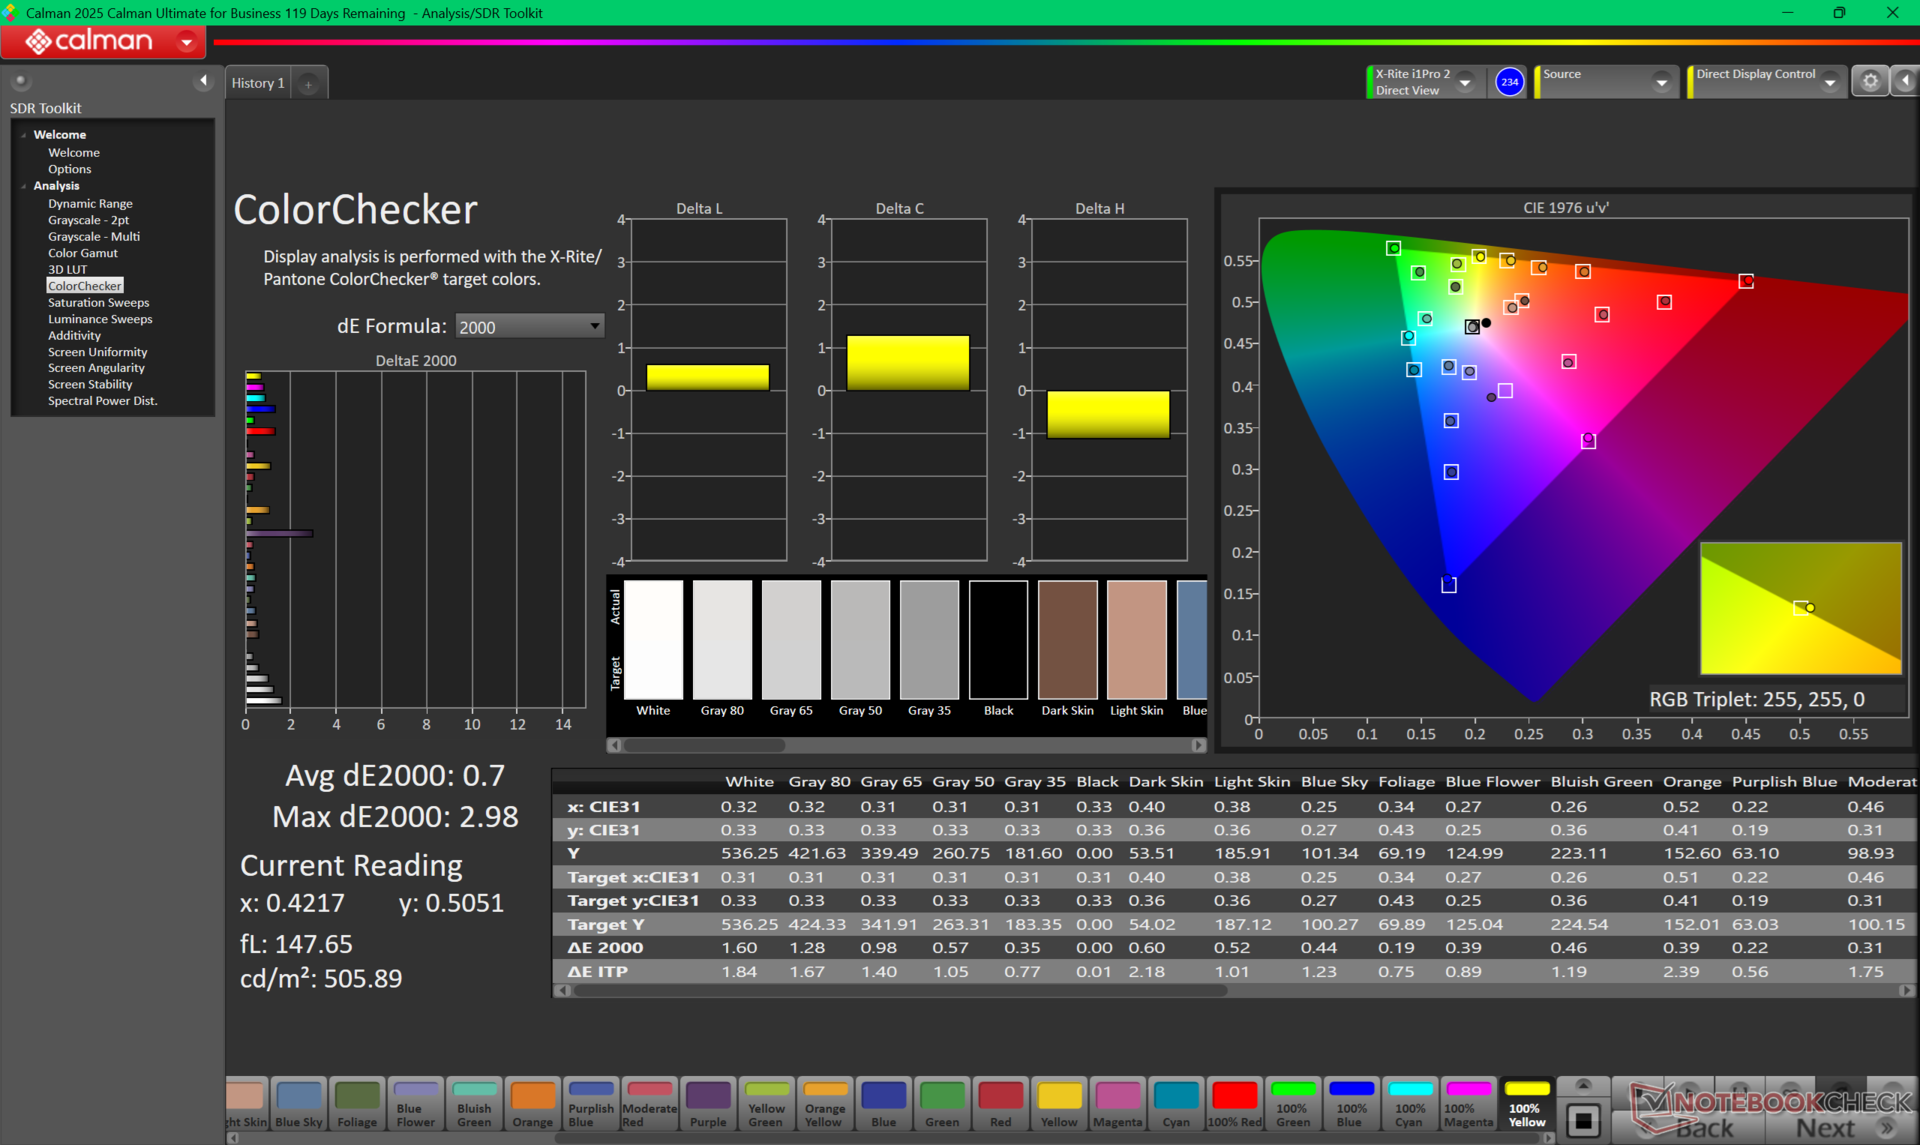
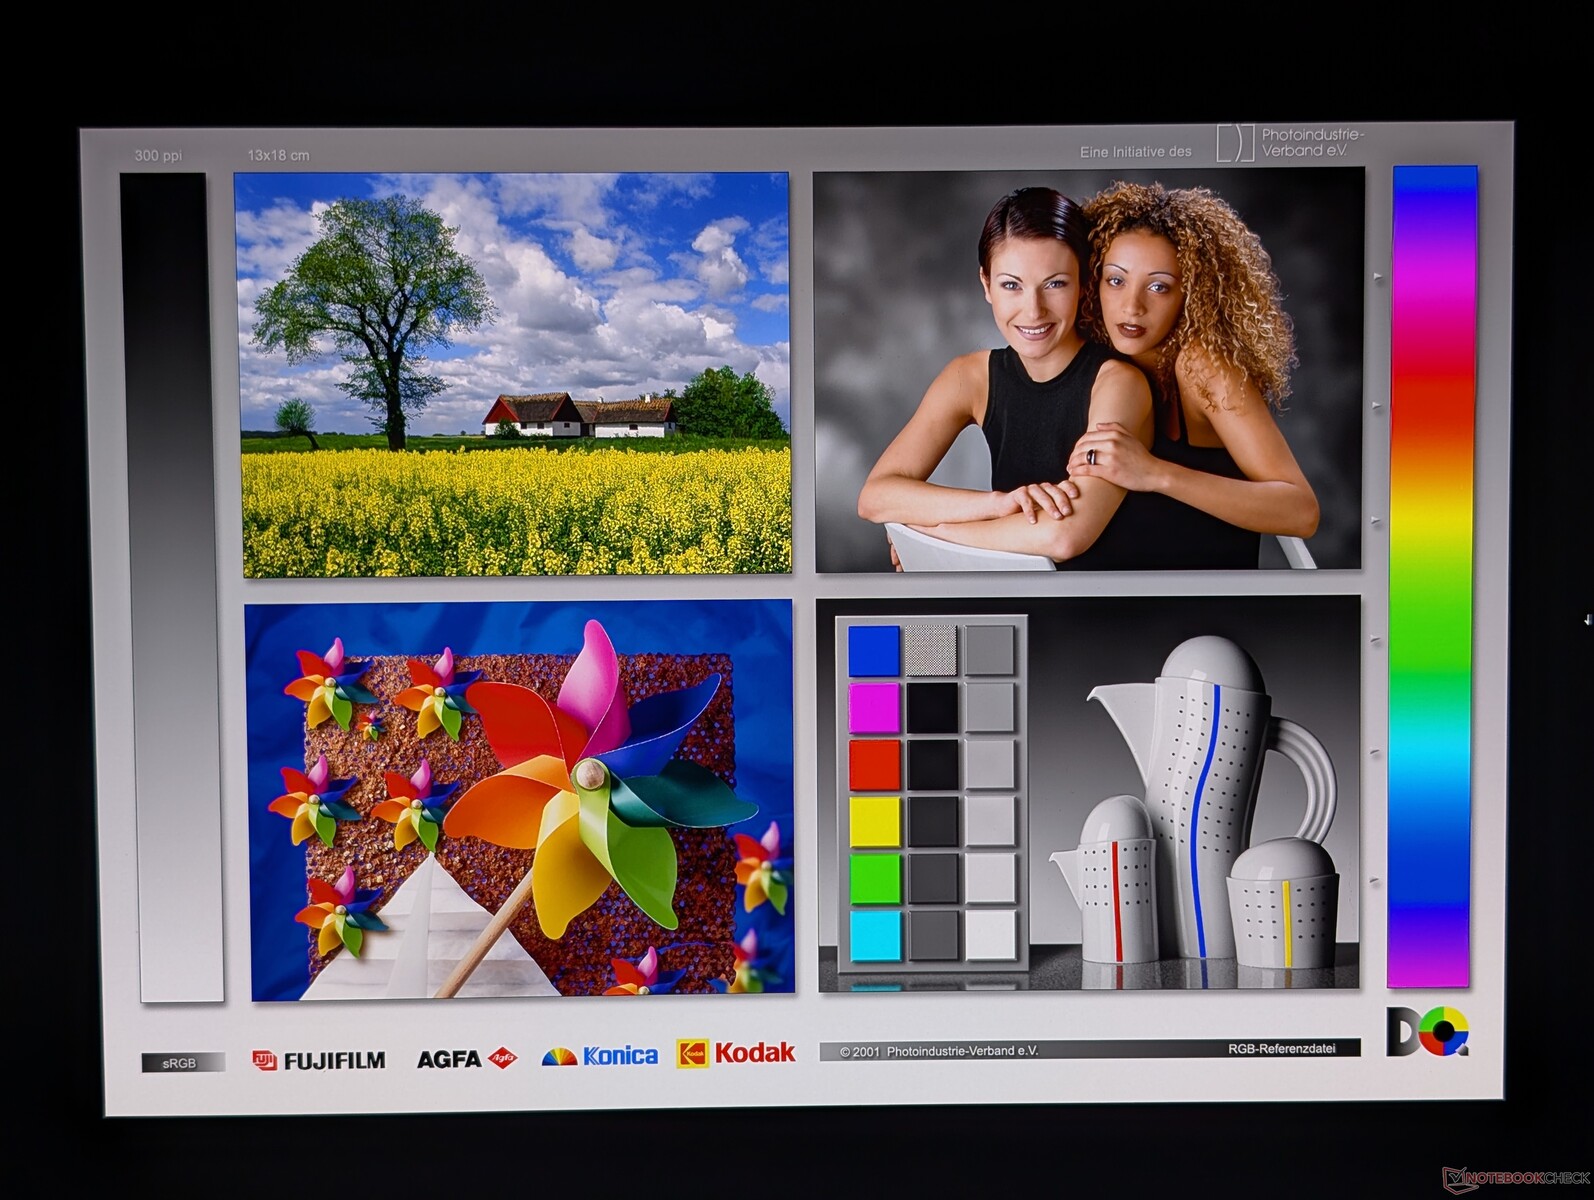
Skärmen är väl kalibrerad mot P3-standarden med genomsnittliga deltaE-värden för gråskala och färg på bara 0,8 respektive 2,42.


Visa svarstider
| ↔ Svarstid svart till vitt | ||
|---|---|---|
| 0.89 ms ... stiga ↗ och falla ↘ kombinerat | ↗ 0.42 ms stiga | 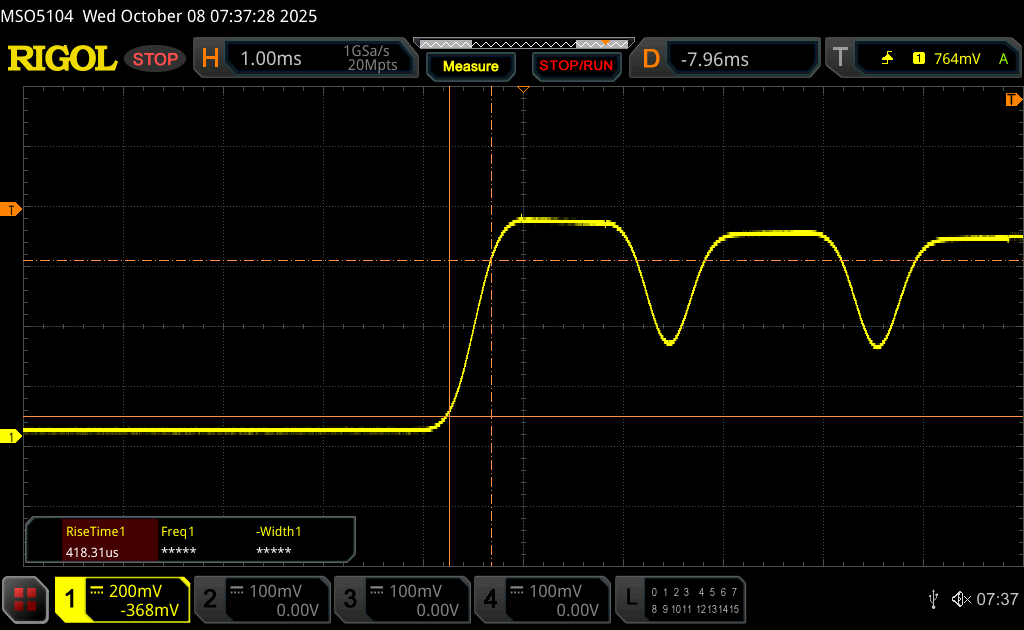 |
| ↘ 0.47 ms hösten | ||
| Skärmen visar väldigt snabba svarsfrekvenser i våra tester och borde vara mycket väl lämpad för fartfyllt spel. I jämförelse sträcker sig alla testade enheter från 0.1 (minst) till 240 (maximalt) ms. » 3 % av alla enheter är bättre. Det betyder att den uppmätta svarstiden är bättre än genomsnittet av alla testade enheter (19.8 ms). | ||
| ↔ Svarstid 50 % grått till 80 % grått | ||
| 0.63 ms ... stiga ↗ och falla ↘ kombinerat | ↗ 0.34 ms stiga | 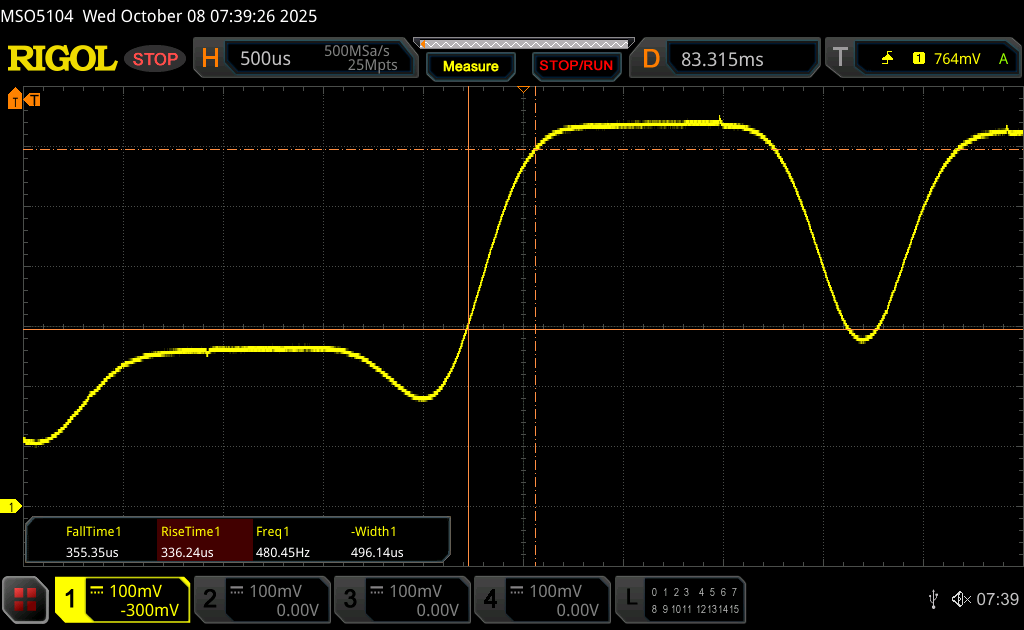 |
| ↘ 0.29 ms hösten | ||
| Skärmen visar väldigt snabba svarsfrekvenser i våra tester och borde vara mycket väl lämpad för fartfyllt spel. I jämförelse sträcker sig alla testade enheter från 0.165 (minst) till 636 (maximalt) ms. » 2 % av alla enheter är bättre. Det betyder att den uppmätta svarstiden är bättre än genomsnittet av alla testade enheter (31 ms). | ||
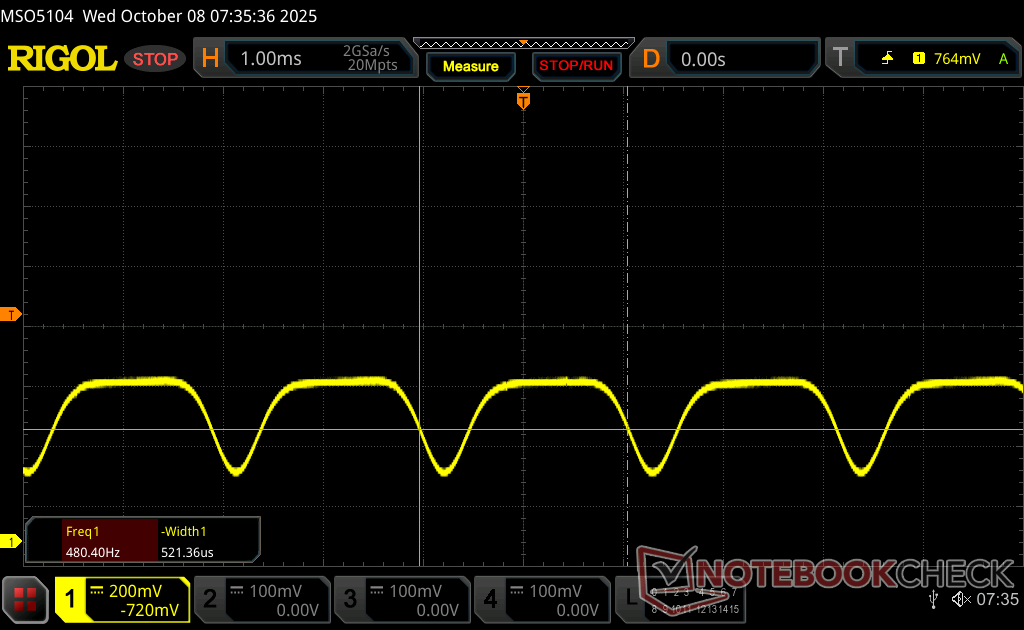
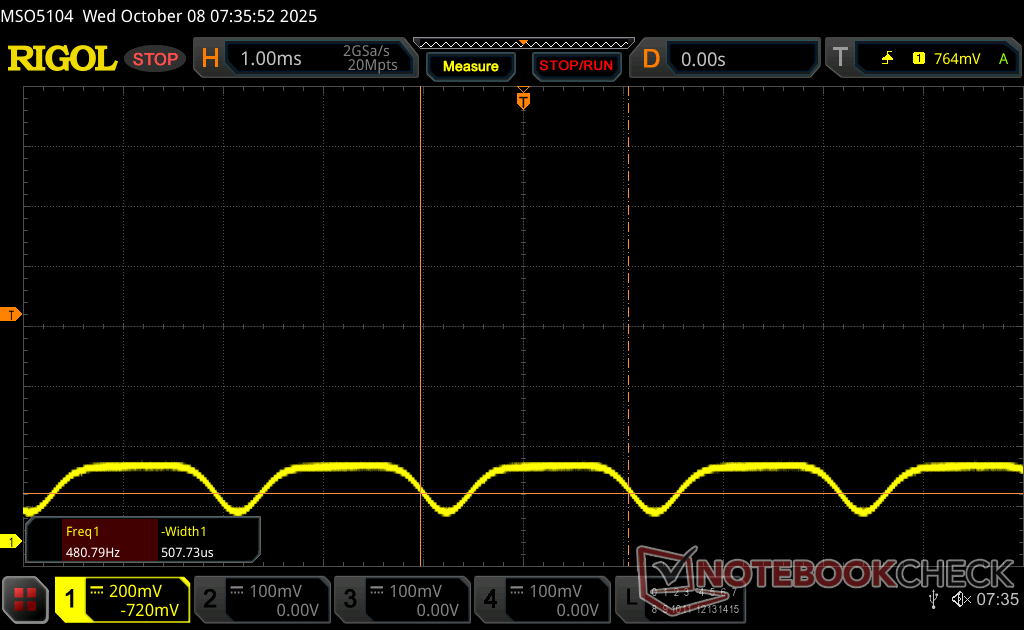
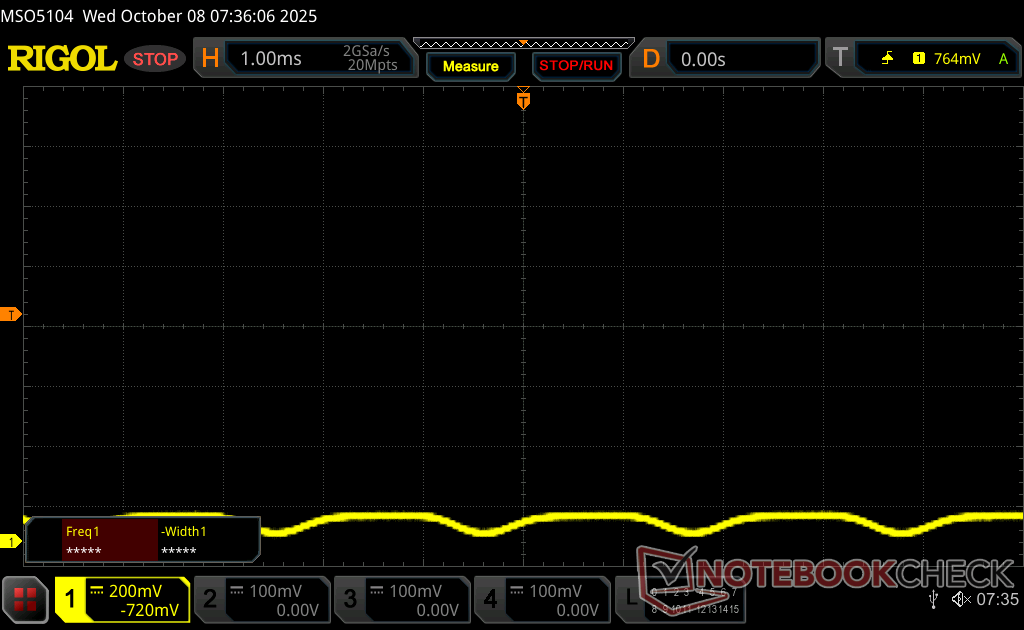
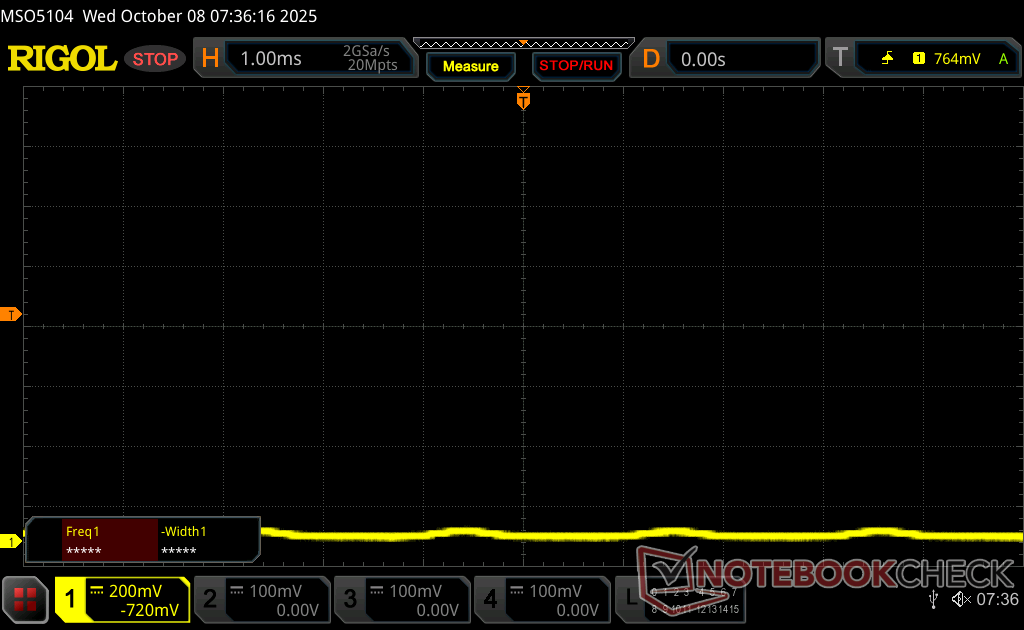
Skärmflimmer / PWM (Puls-Width Modulation)
| Skärmflimmer / PWM upptäckt | 479.9 Hz Amplitude: 28 % | ≤ 100 % ljusstyrka inställning | 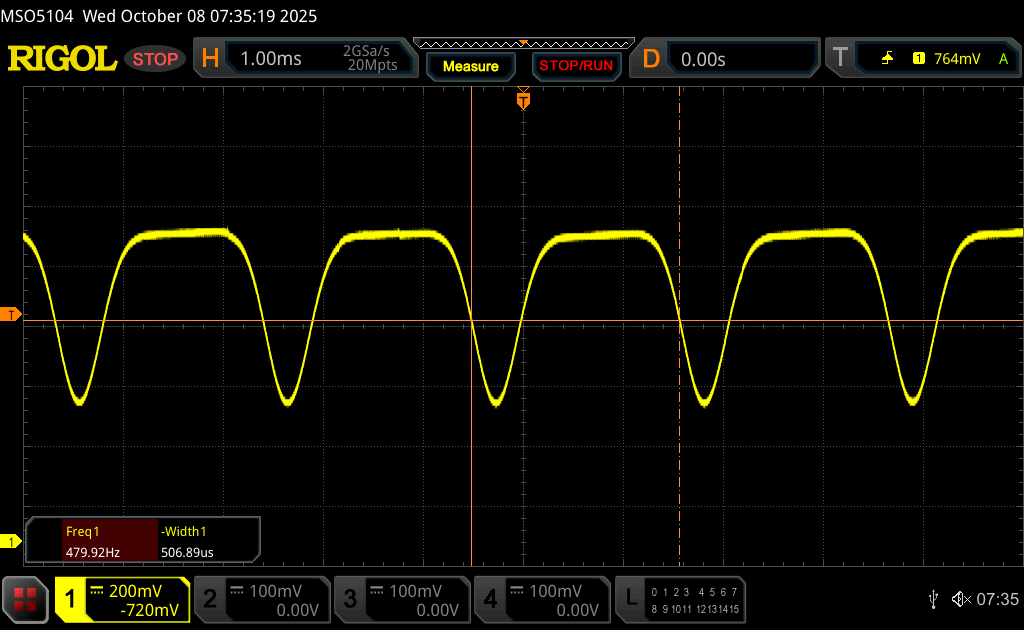 |
Displayens bakgrundsbelysning flimrar vid 479.9 Hz (i värsta fall, t.ex. med PWM) Flimrande upptäckt vid en ljusstyrkeinställning på 100 % och lägre. Det ska inte finnas något flimmer eller PWM över denna ljusstyrkeinställning. Frekvensen för 479.9 Hz är relativt hög, så de flesta användare som är känsliga för PWM bör inte märka något flimmer. Det finns dock rapporter om att vissa användare fortfarande är känsliga för PWM vid 500 Hz och högre, så var uppmärksam. Som jämförelse: 52 % av alla testade enheter använder inte PWM för att dämpa skärmen. Om PWM upptäcktes mättes ett medelvärde av 7753 (minst: 5 - maximum: 343500) Hz. | |||

Prestanda
Testförhållanden
Vi ställde in Dell Optimizer på prestandaläge och Nvidia Control Panel på diskret grafikläge innan vi körde nedanstående riktmärken. Det krävs ingen omstart för att växla mellan Optimus- och dGPU-lägena.
Processor
Core Ultra Core Ultra 9 285HX är en av de snabbaste processorerna som finns tillgängliga på en mobil arbetsstation med nästan 2x högre prestanda än Core Ultra 9 185H i förra årets Precision 5690. Prestandahållbarheten är dock inte perfekt; när man till exempel kör CineBench R15 xT i en loop sjunker prestandan med cirka 10 procent över tid, vilket framgår av jämförelsediagrammet nedan.
Cinebench R15 Multi Loop
Cinebench R23: Multi Core | Single Core
Cinebench R20: CPU (Multi Core) | CPU (Single Core)
Cinebench R15: CPU Multi 64Bit | CPU Single 64Bit
Blender: v2.79 BMW27 CPU
7-Zip 18.03: 7z b 4 | 7z b 4 -mmt1
Geekbench 6.7: Multi-Core | Single-Core
Geekbench 5.5: Multi-Core | Single-Core
HWBOT x265 Benchmark v2.2: 4k Preset
LibreOffice : 20 Documents To PDF
R Benchmark 2.5: Overall mean
| CPU Performance rating | |
| Genomsnitt Intel Core Ultra 9 285HX | |
| Dell Pro Max 16 Plus | |
| HP ZBook Fury 16 G10 | |
| Lenovo ThinkPad P16 Gen 2 | |
| Dell Precision 5000 5680 | |
| Lenovo ThinkPad P16 G2 21FA000FGE -2! | |
| Dell Precision 5690 | |
| HP ZBook Studio 16 G11 | |
| Lenovo ThinkPad P1 Gen 7 21KV001SGE | |
| HP ZBook Studio 16 G9 62U04EA -2! | |
| MSI CreatorPro Z16P B12UKST -2! | |
| Lenovo ThinkPad P16s G2 21K9000CGE | |
| Geekbench 6.7 / Multi-Core | |
| Dell Pro Max 16 Plus | |
| Genomsnitt Intel Core Ultra 9 285HX (18212 - 22104, n=6) | |
| Lenovo ThinkPad P16 Gen 2 | |
| HP ZBook Fury 16 G10 | |
| Dell Precision 5000 5680 | |
| Dell Precision 5690 | |
| HP ZBook Studio 16 G11 | |
| Lenovo ThinkPad P1 Gen 7 21KV001SGE | |
| Lenovo ThinkPad P16s G2 21K9000CGE | |
| Geekbench 6.7 / Single-Core | |
| Genomsnitt Intel Core Ultra 9 285HX (2907 - 3088, n=6) | |
| HP ZBook Fury 16 G10 | |
| Dell Pro Max 16 Plus | |
| Lenovo ThinkPad P16 Gen 2 | |
| Dell Precision 5000 5680 | |
| Dell Precision 5690 | |
| HP ZBook Studio 16 G11 | |
| Lenovo ThinkPad P16s G2 21K9000CGE | |
| Lenovo ThinkPad P1 Gen 7 21KV001SGE | |
| HWBOT x265 Benchmark v2.2 / 4k Preset | |
| Genomsnitt Intel Core Ultra 9 285HX (35.3 - 44.3, n=6) | |
| Dell Pro Max 16 Plus | |
| HP ZBook Fury 16 G10 | |
| Lenovo ThinkPad P16 Gen 2 | |
| Lenovo ThinkPad P16 G2 21FA000FGE | |
| Dell Precision 5690 | |
| Lenovo ThinkPad P1 Gen 7 21KV001SGE | |
| HP ZBook Studio 16 G11 | |
| Dell Precision 5000 5680 | |
| HP ZBook Studio 16 G9 62U04EA | |
| MSI CreatorPro Z16P B12UKST | |
| Lenovo ThinkPad P16s G2 21K9000CGE | |
* ... mindre är bättre
AIDA64: FP32 Ray-Trace | FPU Julia | CPU SHA3 | CPU Queen | FPU SinJulia | FPU Mandel | CPU AES | CPU ZLib | FP64 Ray-Trace | CPU PhotoWorxx
| Performance rating | |
| Genomsnitt Intel Core Ultra 9 285HX | |
| Dell Pro Max 16 Plus | |
| Lenovo ThinkPad P16 Gen 2 | |
| Dell Precision 5690 | |
| HP ZBook Studio 16 G11 | |
| Lenovo ThinkPad P1 Gen 7 21KV001SGE | |
| MSI CreatorPro Z16P B12UKST | |
| Dell Precision 5000 5680 | |
| AIDA64 / FP32 Ray-Trace | |
| Genomsnitt Intel Core Ultra 9 285HX (29076 - 42341, n=6) | |
| Dell Pro Max 16 Plus | |
| Lenovo ThinkPad P16 Gen 2 | |
| Dell Precision 5690 | |
| Lenovo ThinkPad P1 Gen 7 21KV001SGE | |
| HP ZBook Studio 16 G11 | |
| Dell Precision 5000 5680 | |
| MSI CreatorPro Z16P B12UKST | |
| AIDA64 / FPU Julia | |
| Genomsnitt Intel Core Ultra 9 285HX (161276 - 210885, n=6) | |
| Dell Pro Max 16 Plus | |
| Lenovo ThinkPad P16 Gen 2 | |
| Dell Precision 5690 | |
| HP ZBook Studio 16 G11 | |
| Lenovo ThinkPad P1 Gen 7 21KV001SGE | |
| Dell Precision 5000 5680 | |
| MSI CreatorPro Z16P B12UKST | |
| AIDA64 / CPU SHA3 | |
| Genomsnitt Intel Core Ultra 9 285HX (7757 - 9815, n=6) | |
| Dell Pro Max 16 Plus | |
| Lenovo ThinkPad P16 Gen 2 | |
| Dell Precision 5690 | |
| HP ZBook Studio 16 G11 | |
| Lenovo ThinkPad P1 Gen 7 21KV001SGE | |
| MSI CreatorPro Z16P B12UKST | |
| Dell Precision 5000 5680 | |
| AIDA64 / CPU Queen | |
| Lenovo ThinkPad P16 Gen 2 | |
| Genomsnitt Intel Core Ultra 9 285HX (134345 - 141681, n=6) | |
| Dell Pro Max 16 Plus | |
| Dell Precision 5000 5680 | |
| MSI CreatorPro Z16P B12UKST | |
| Dell Precision 5690 | |
| HP ZBook Studio 16 G11 | |
| Lenovo ThinkPad P1 Gen 7 21KV001SGE | |
| AIDA64 / FPU SinJulia | |
| Lenovo ThinkPad P16 Gen 2 | |
| Genomsnitt Intel Core Ultra 9 285HX (12559 - 14431, n=6) | |
| Dell Pro Max 16 Plus | |
| Dell Precision 5690 | |
| HP ZBook Studio 16 G11 | |
| Lenovo ThinkPad P1 Gen 7 21KV001SGE | |
| Dell Precision 5000 5680 | |
| MSI CreatorPro Z16P B12UKST | |
| AIDA64 / FPU Mandel | |
| Genomsnitt Intel Core Ultra 9 285HX (84053 - 108922, n=6) | |
| Dell Pro Max 16 Plus | |
| Lenovo ThinkPad P16 Gen 2 | |
| Dell Precision 5690 | |
| Lenovo ThinkPad P1 Gen 7 21KV001SGE | |
| HP ZBook Studio 16 G11 | |
| Dell Precision 5000 5680 | |
| MSI CreatorPro Z16P B12UKST | |
| AIDA64 / CPU AES | |
| MSI CreatorPro Z16P B12UKST | |
| Genomsnitt Intel Core Ultra 9 285HX (119553 - 134195, n=6) | |
| Dell Pro Max 16 Plus | |
| Lenovo ThinkPad P16 Gen 2 | |
| Dell Precision 5690 | |
| HP ZBook Studio 16 G11 | |
| Lenovo ThinkPad P1 Gen 7 21KV001SGE | |
| Dell Precision 5000 5680 | |
| AIDA64 / CPU ZLib | |
| Genomsnitt Intel Core Ultra 9 285HX (1886 - 2267, n=6) | |
| Dell Pro Max 16 Plus | |
| Lenovo ThinkPad P16 Gen 2 | |
| Dell Precision 5690 | |
| HP ZBook Studio 16 G11 | |
| Lenovo ThinkPad P1 Gen 7 21KV001SGE | |
| MSI CreatorPro Z16P B12UKST | |
| Dell Precision 5000 5680 | |
| AIDA64 / FP64 Ray-Trace | |
| Genomsnitt Intel Core Ultra 9 285HX (15059 - 22312, n=6) | |
| Dell Pro Max 16 Plus | |
| Lenovo ThinkPad P16 Gen 2 | |
| Dell Precision 5690 | |
| Lenovo ThinkPad P1 Gen 7 21KV001SGE | |
| HP ZBook Studio 16 G11 | |
| Dell Precision 5000 5680 | |
| MSI CreatorPro Z16P B12UKST | |
| AIDA64 / CPU PhotoWorxx | |
| Dell Pro Max 16 Plus | |
| HP ZBook Studio 16 G11 | |
| Dell Precision 5690 | |
| Genomsnitt Intel Core Ultra 9 285HX (39232 - 62611, n=6) | |
| Dell Precision 5000 5680 | |
| MSI CreatorPro Z16P B12UKST | |
| Lenovo ThinkPad P1 Gen 7 21KV001SGE | |
| Lenovo ThinkPad P16 Gen 2 | |
Systemets prestanda
PCMark 10-poäng är inte inkluderade eftersom riktmärket konsekvent kraschade även när det uppdaterades till den senaste versionen och olika GPU-konfigurationer testades. Med detta sagt är AIDA64-minnespoängen några av de högsta för alla mobila arbetsstationer tack vare prestandafördelarna med CAMM2-RAM.
CrossMark: Overall | Productivity | Creativity | Responsiveness
WebXPRT 3: Overall
WebXPRT 4: Overall
Mozilla Kraken 1.1: Total
| Performance rating | |
| Genomsnitt Intel Core Ultra 9 285HX, NVIDIA RTX PRO 5000 Blackwell Generation Laptop | |
| Dell Pro Max 16 Plus | |
| Lenovo ThinkPad P16 Gen 2 | |
| Dell Precision 5000 5680 | |
| MSI CreatorPro Z16P B12UKST | |
| Dell Precision 5690 | |
| HP ZBook Studio 16 G11 | |
| Lenovo ThinkPad P1 Gen 7 21KV001SGE | |
| CrossMark / Overall | |
| Dell Pro Max 16 Plus | |
| Genomsnitt Intel Core Ultra 9 285HX, NVIDIA RTX PRO 5000 Blackwell Generation Laptop (2142 - 2267, n=3) | |
| Lenovo ThinkPad P16 Gen 2 | |
| MSI CreatorPro Z16P B12UKST | |
| Dell Precision 5000 5680 | |
| Dell Precision 5690 | |
| HP ZBook Studio 16 G11 | |
| Lenovo ThinkPad P1 Gen 7 21KV001SGE | |
| CrossMark / Productivity | |
| Genomsnitt Intel Core Ultra 9 285HX, NVIDIA RTX PRO 5000 Blackwell Generation Laptop (2016 - 2028, n=3) | |
| Dell Pro Max 16 Plus | |
| Lenovo ThinkPad P16 Gen 2 | |
| MSI CreatorPro Z16P B12UKST | |
| Dell Precision 5000 5680 | |
| Dell Precision 5690 | |
| HP ZBook Studio 16 G11 | |
| Lenovo ThinkPad P1 Gen 7 21KV001SGE | |
| CrossMark / Creativity | |
| Dell Pro Max 16 Plus | |
| Genomsnitt Intel Core Ultra 9 285HX, NVIDIA RTX PRO 5000 Blackwell Generation Laptop (2395 - 2725, n=3) | |
| Lenovo ThinkPad P16 Gen 2 | |
| Dell Precision 5000 5680 | |
| MSI CreatorPro Z16P B12UKST | |
| Dell Precision 5690 | |
| HP ZBook Studio 16 G11 | |
| Lenovo ThinkPad P1 Gen 7 21KV001SGE | |
| CrossMark / Responsiveness | |
| MSI CreatorPro Z16P B12UKST | |
| Genomsnitt Intel Core Ultra 9 285HX, NVIDIA RTX PRO 5000 Blackwell Generation Laptop (1806 - 1858, n=3) | |
| Dell Pro Max 16 Plus | |
| Lenovo ThinkPad P16 Gen 2 | |
| Dell Precision 5000 5680 | |
| Dell Precision 5690 | |
| HP ZBook Studio 16 G11 | |
| Lenovo ThinkPad P1 Gen 7 21KV001SGE | |
| WebXPRT 3 / Overall | |
| Genomsnitt Intel Core Ultra 9 285HX, NVIDIA RTX PRO 5000 Blackwell Generation Laptop (327 - 360, n=3) | |
| Dell Precision 5000 5680 | |
| Lenovo ThinkPad P16 Gen 2 | |
| Dell Pro Max 16 Plus | |
| MSI CreatorPro Z16P B12UKST | |
| HP ZBook Studio 16 G11 | |
| Dell Precision 5690 | |
| Lenovo ThinkPad P1 Gen 7 21KV001SGE | |
| WebXPRT 4 / Overall | |
| Genomsnitt Intel Core Ultra 9 285HX, NVIDIA RTX PRO 5000 Blackwell Generation Laptop (306 - 323, n=3) | |
| Dell Pro Max 16 Plus | |
| Lenovo ThinkPad P16 Gen 2 | |
| Dell Precision 5000 5680 | |
| Dell Precision 5690 | |
| MSI CreatorPro Z16P B12UKST | |
| HP ZBook Studio 16 G11 | |
| Lenovo ThinkPad P1 Gen 7 21KV001SGE | |
| Mozilla Kraken 1.1 / Total | |
| Lenovo ThinkPad P1 Gen 7 21KV001SGE | |
| MSI CreatorPro Z16P B12UKST | |
| HP ZBook Studio 16 G11 | |
| Dell Precision 5690 | |
| Dell Precision 5000 5680 | |
| Lenovo ThinkPad P16 Gen 2 | |
| Dell Pro Max 16 Plus | |
| Genomsnitt Intel Core Ultra 9 285HX, NVIDIA RTX PRO 5000 Blackwell Generation Laptop (411 - 439, n=3) | |
* ... mindre är bättre
| AIDA64 / Memory Copy | |
| Dell Pro Max 16 Plus | |
| Dell Precision 5690 | |
| Genomsnitt Intel Core Ultra 9 285HX (63431 - 93933, n=6) | |
| HP ZBook Studio 16 G11 | |
| Dell Precision 5000 5680 | |
| Lenovo ThinkPad P1 Gen 7 21KV001SGE | |
| Lenovo ThinkPad P16 Gen 2 | |
| MSI CreatorPro Z16P B12UKST | |
| AIDA64 / Memory Read | |
| Dell Pro Max 16 Plus | |
| Dell Precision 5690 | |
| Genomsnitt Intel Core Ultra 9 285HX (67084 - 97565, n=6) | |
| HP ZBook Studio 16 G11 | |
| Lenovo ThinkPad P16 Gen 2 | |
| Dell Precision 5000 5680 | |
| MSI CreatorPro Z16P B12UKST | |
| Lenovo ThinkPad P1 Gen 7 21KV001SGE | |
| AIDA64 / Memory Write | |
| Dell Pro Max 16 Plus | |
| Dell Precision 5000 5680 | |
| Genomsnitt Intel Core Ultra 9 285HX (64112 - 89691, n=6) | |
| HP ZBook Studio 16 G11 | |
| Dell Precision 5690 | |
| MSI CreatorPro Z16P B12UKST | |
| Lenovo ThinkPad P16 Gen 2 | |
| Lenovo ThinkPad P1 Gen 7 21KV001SGE | |
| AIDA64 / Memory Latency | |
| Dell Precision 5690 | |
| Lenovo ThinkPad P1 Gen 7 21KV001SGE | |
| Genomsnitt Intel Core Ultra 9 285HX (104.8 - 151.7, n=6) | |
| HP ZBook Studio 16 G11 | |
| Dell Pro Max 16 Plus | |
| MSI CreatorPro Z16P B12UKST | |
| Lenovo ThinkPad P16 Gen 2 | |
| Dell Precision 5000 5680 | |
* ... mindre är bättre
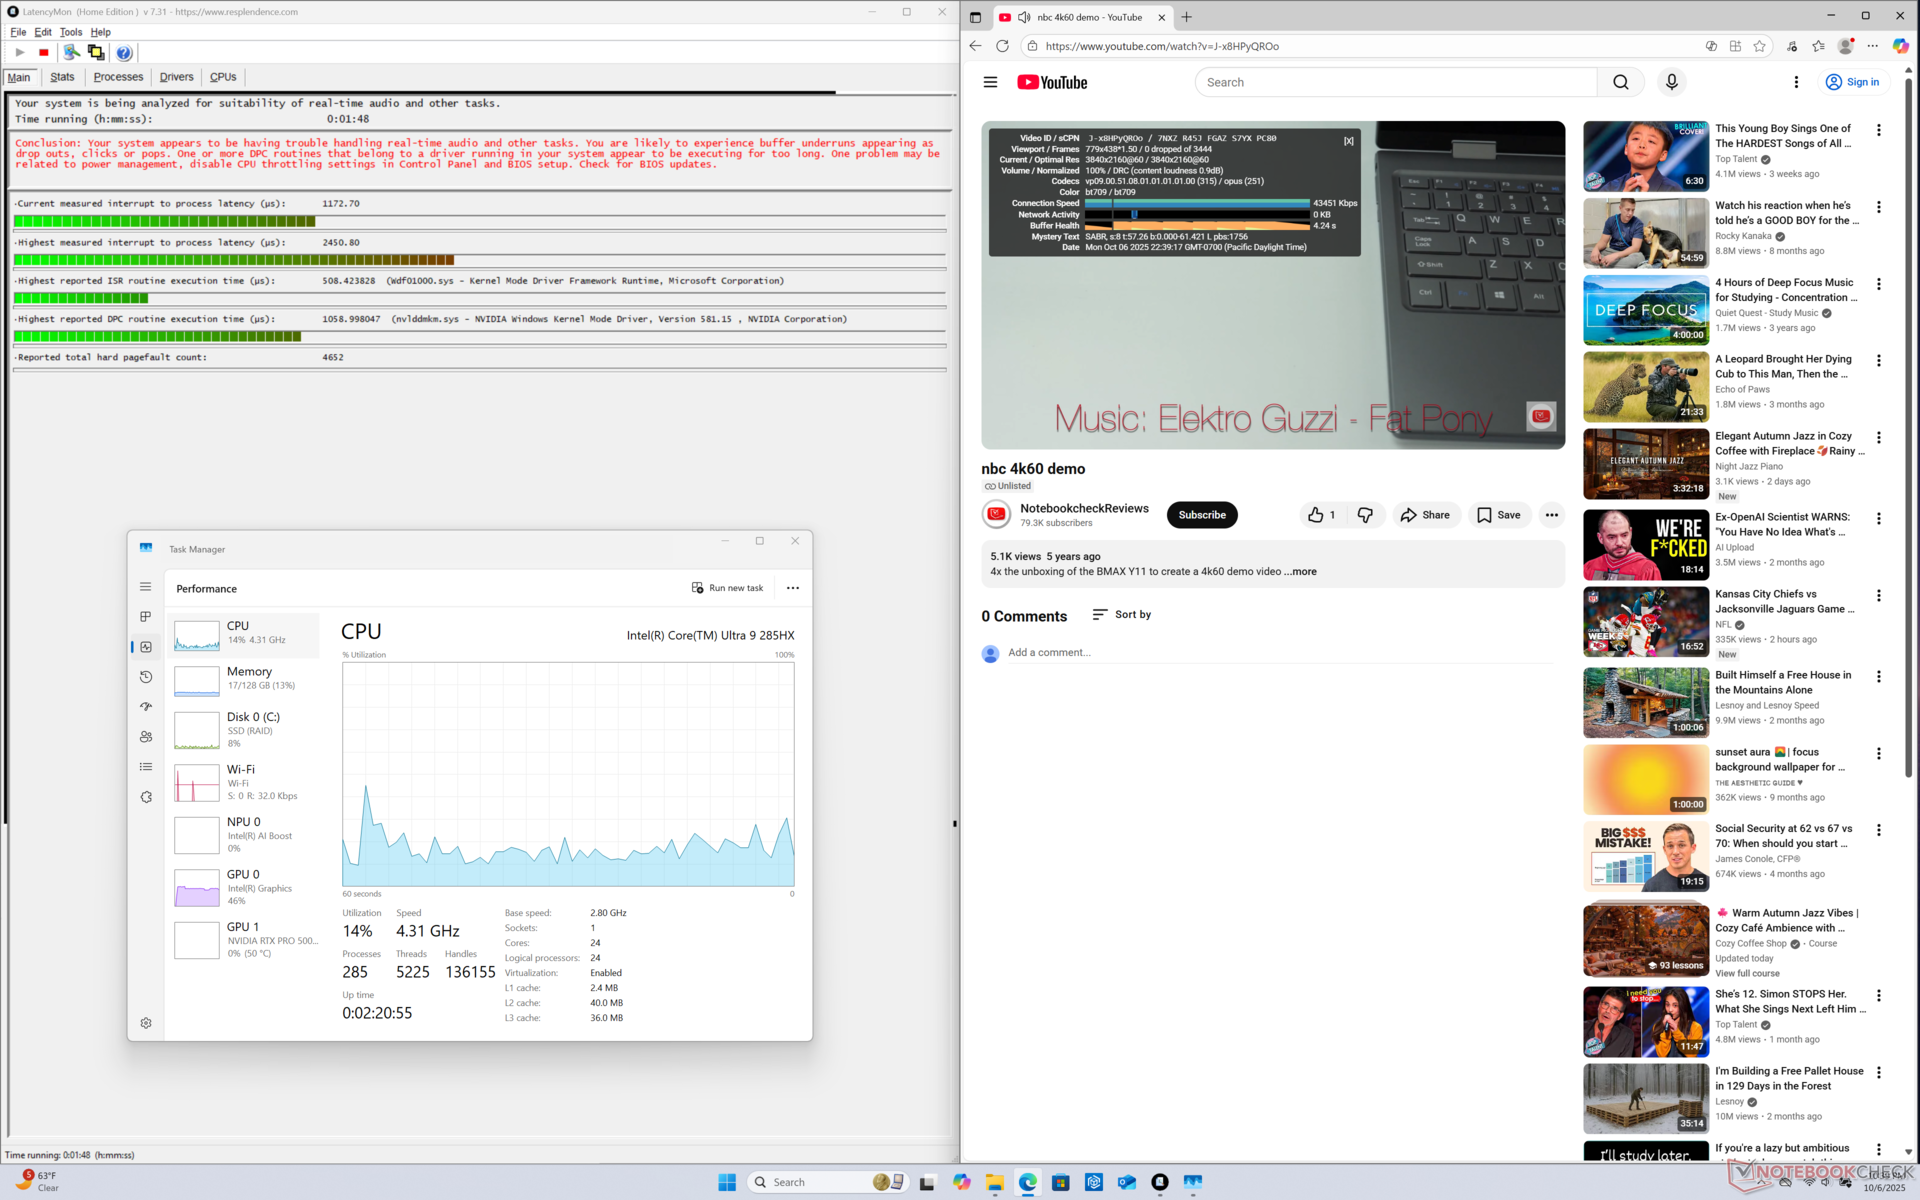
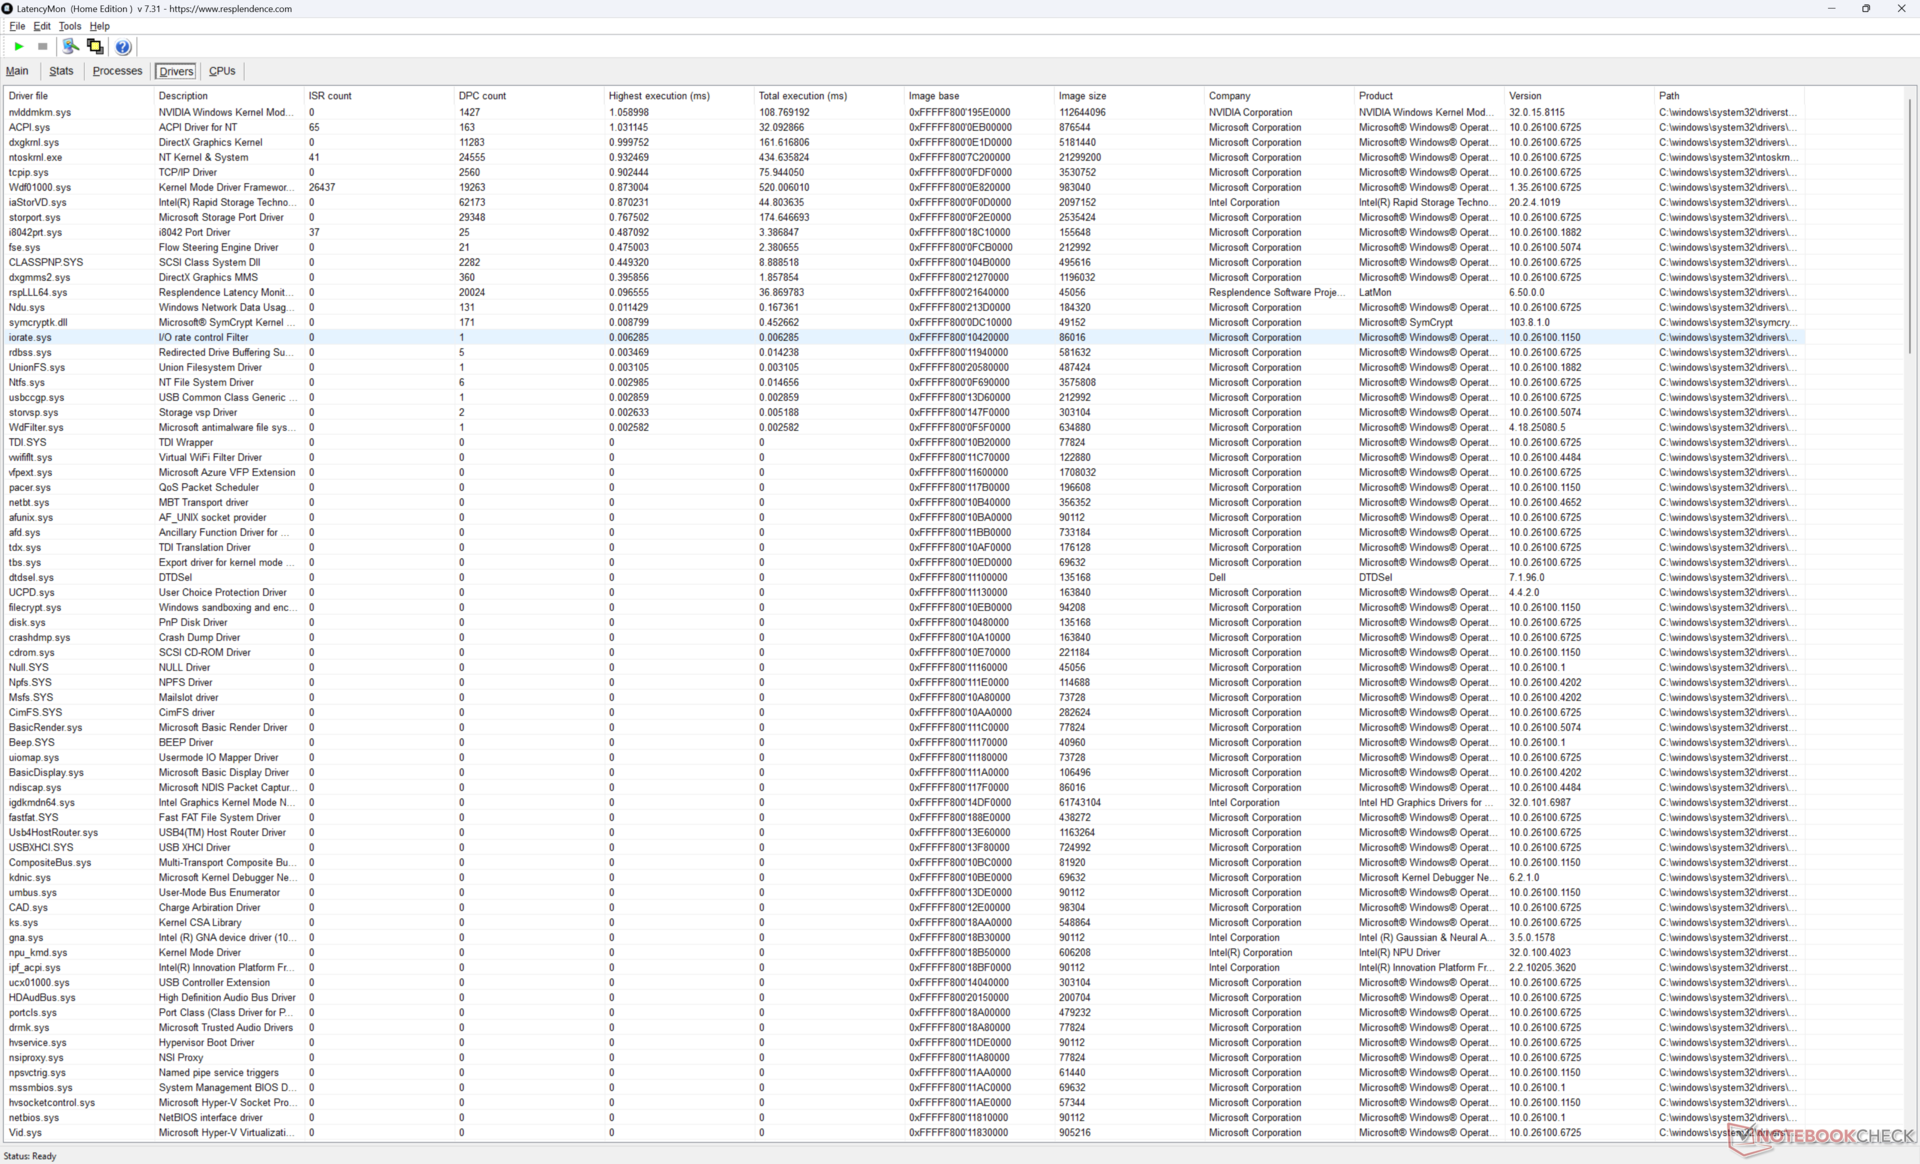
DPC-fördröjning
LatencyMon visar mindre DPC-problem med i övrigt inga tappade bildrutor under vårt 4K60-videouppspelningstest.
| DPC Latencies / LatencyMon - interrupt to process latency (max), Web, Youtube, Prime95 | |
| Dell Pro Max 16 Plus | |
| Dell Precision 5000 5680 | |
| Lenovo ThinkPad P1 Gen 7 21KV001SGE | |
| HP ZBook Studio 16 G11 | |
| Lenovo ThinkPad P16 Gen 2 | |
| MSI CreatorPro Z16P B12UKST | |
| Dell Precision 5690 | |
* ... mindre är bättre
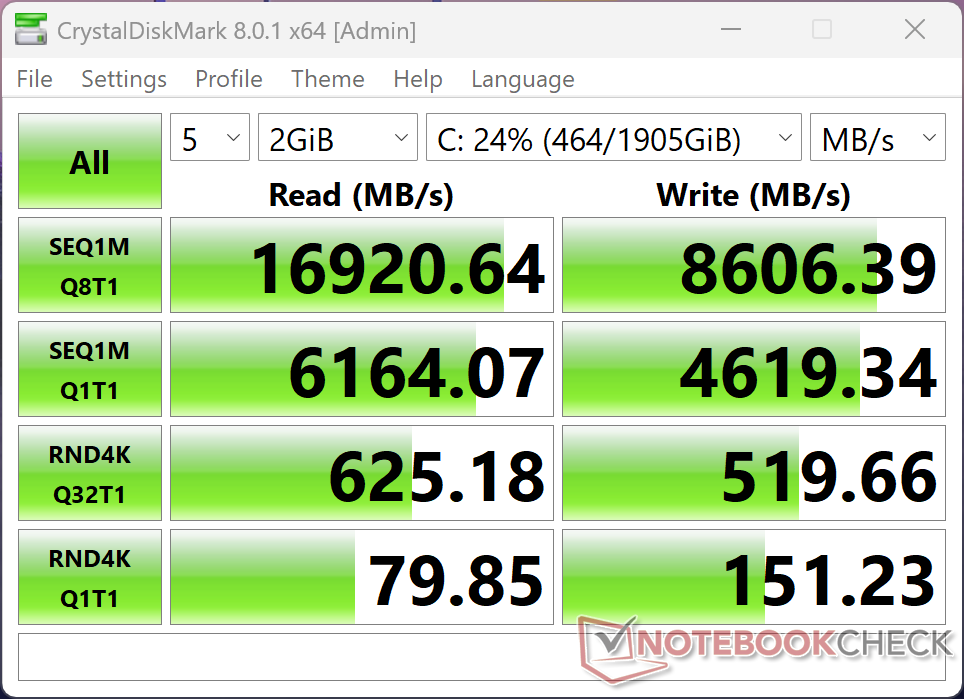
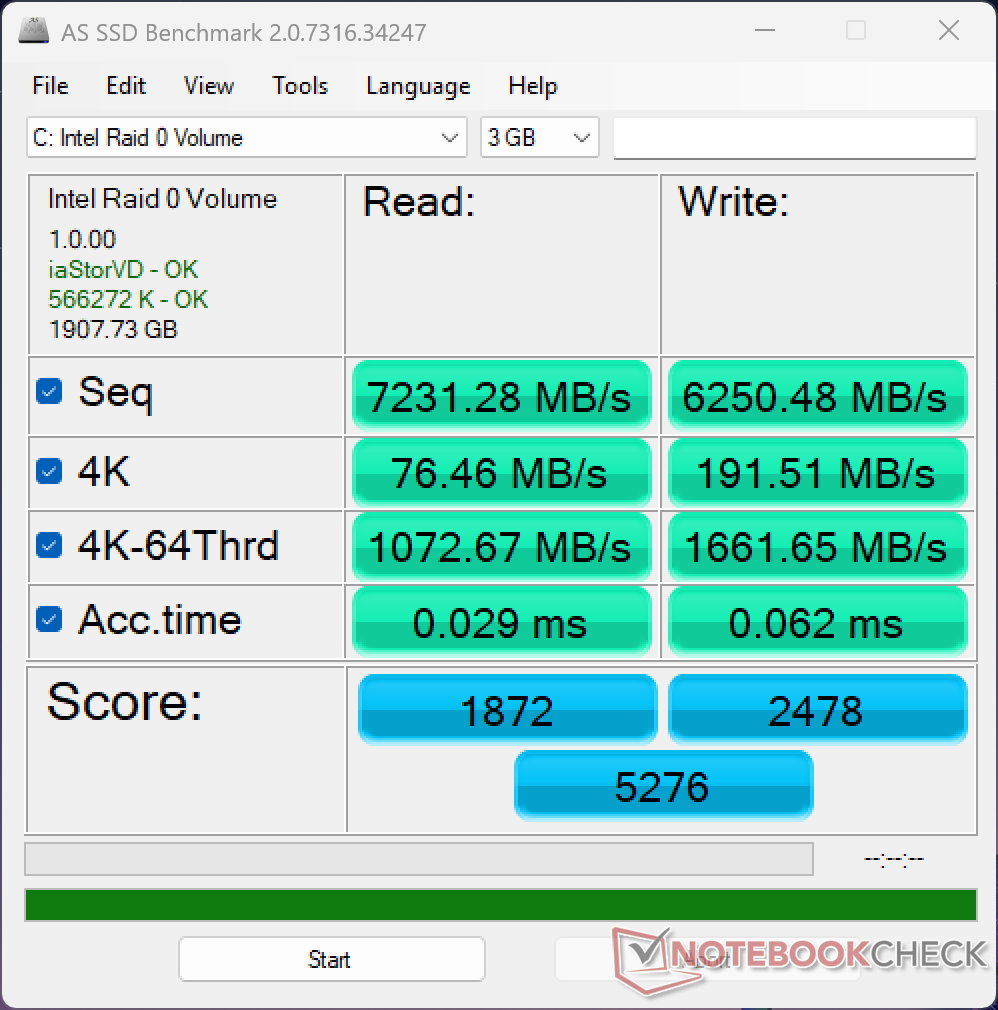
Lagringsenheter
Vår testenhet levereras med SK Hynix PCB01 PCIe5 x4 NVMe SSD för läshastigheter på upp till ~16 GB/s. Prestandan sjönk något till ~13 GB/s efter några minuter i vårt DisKSpd-stresstest, vilket visas i diagrammet nedan.

* ... mindre är bättre
Diskbegränsning: DiskSpd läsloop, ködjup 8
GPU-prestanda
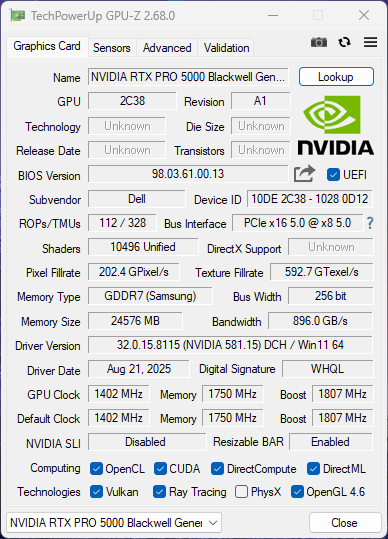
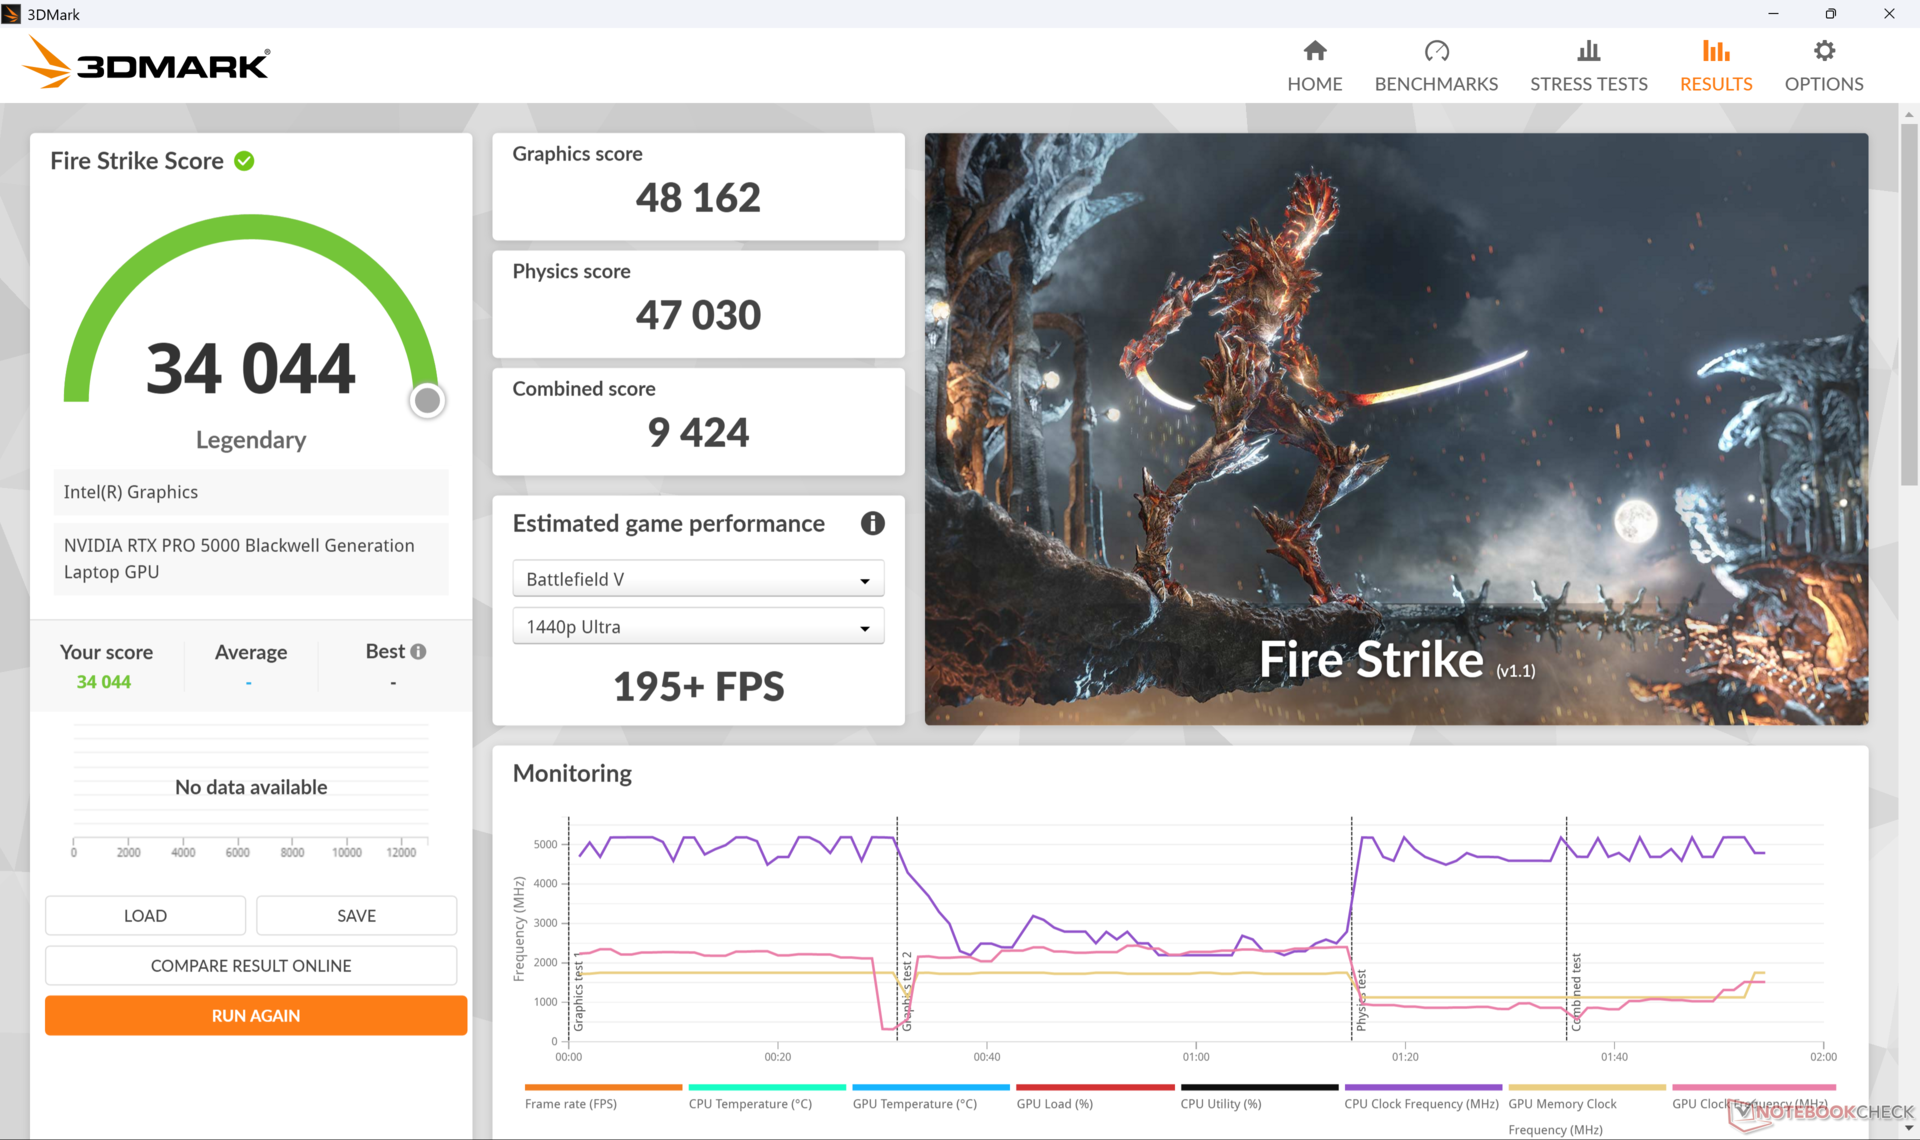
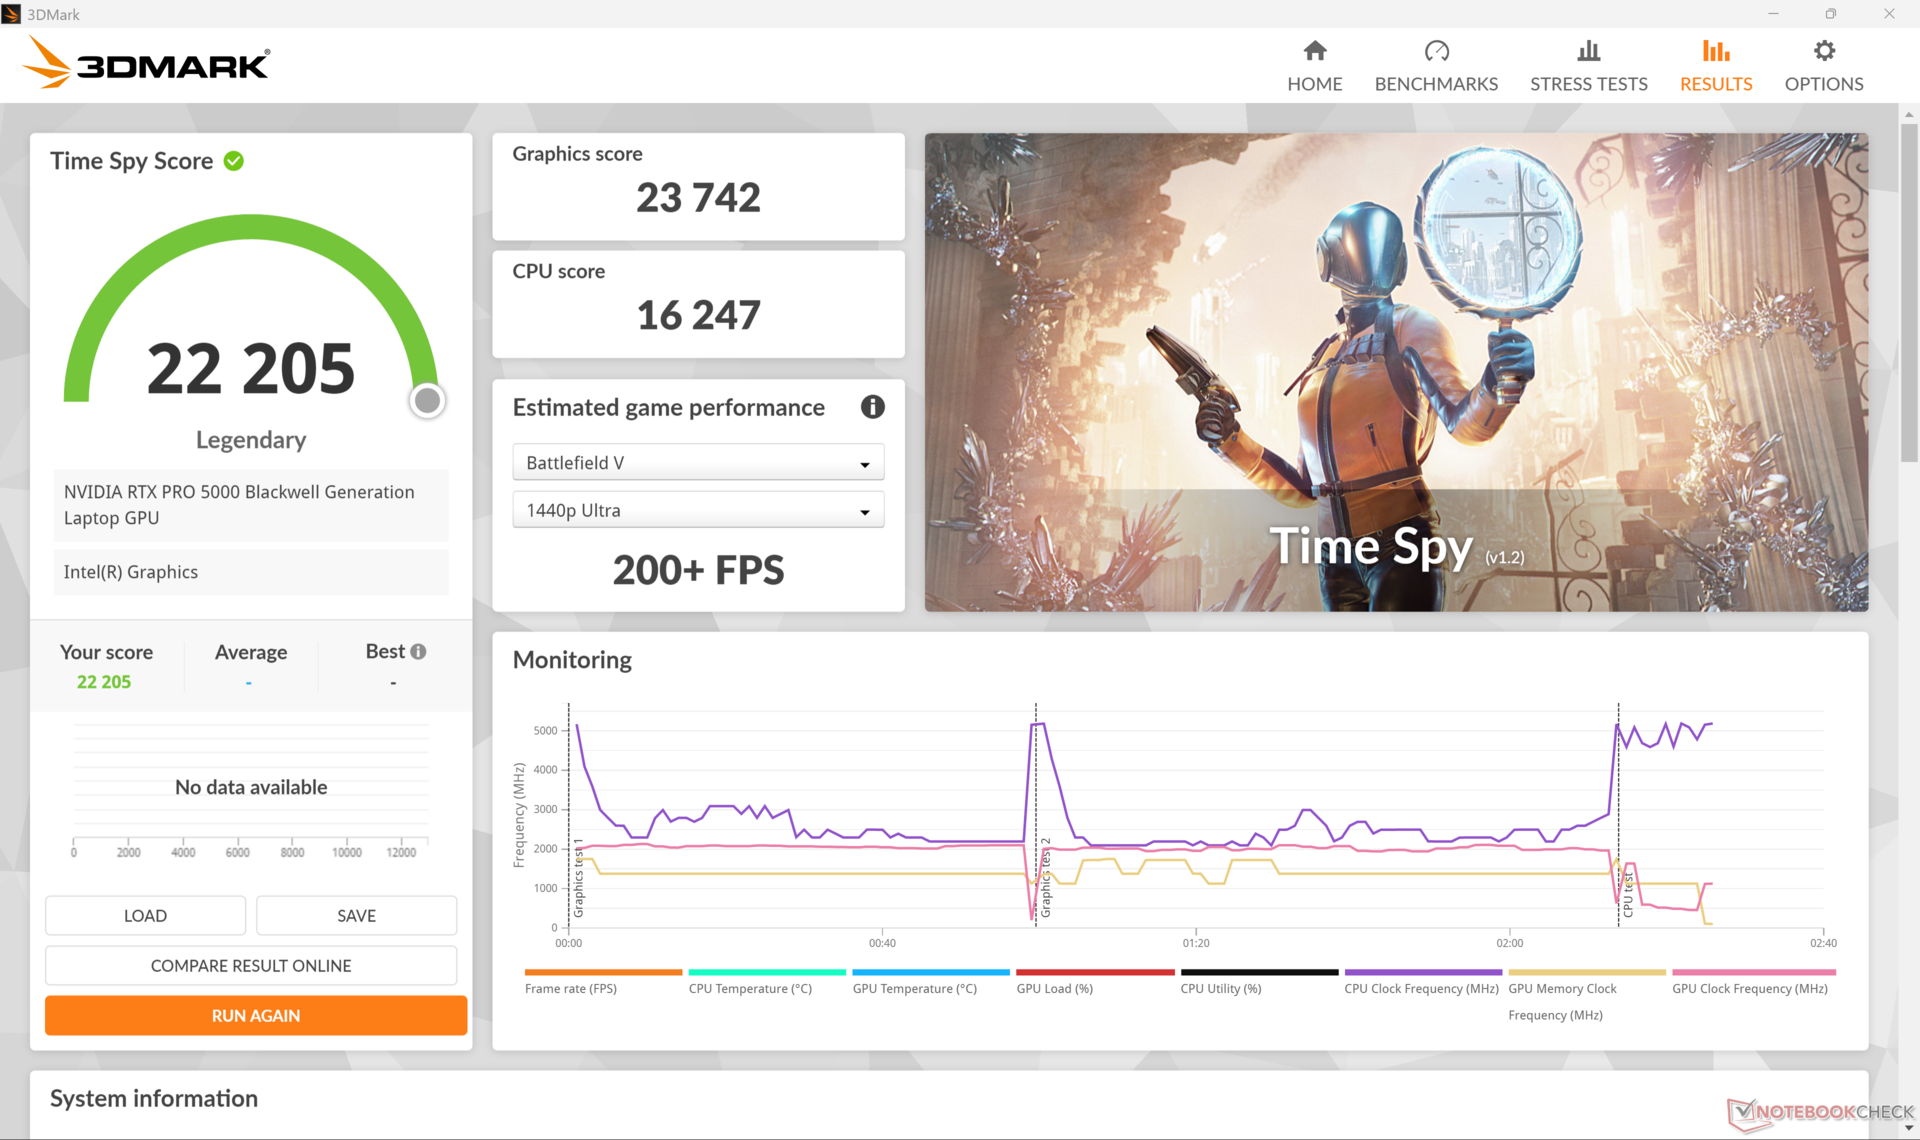
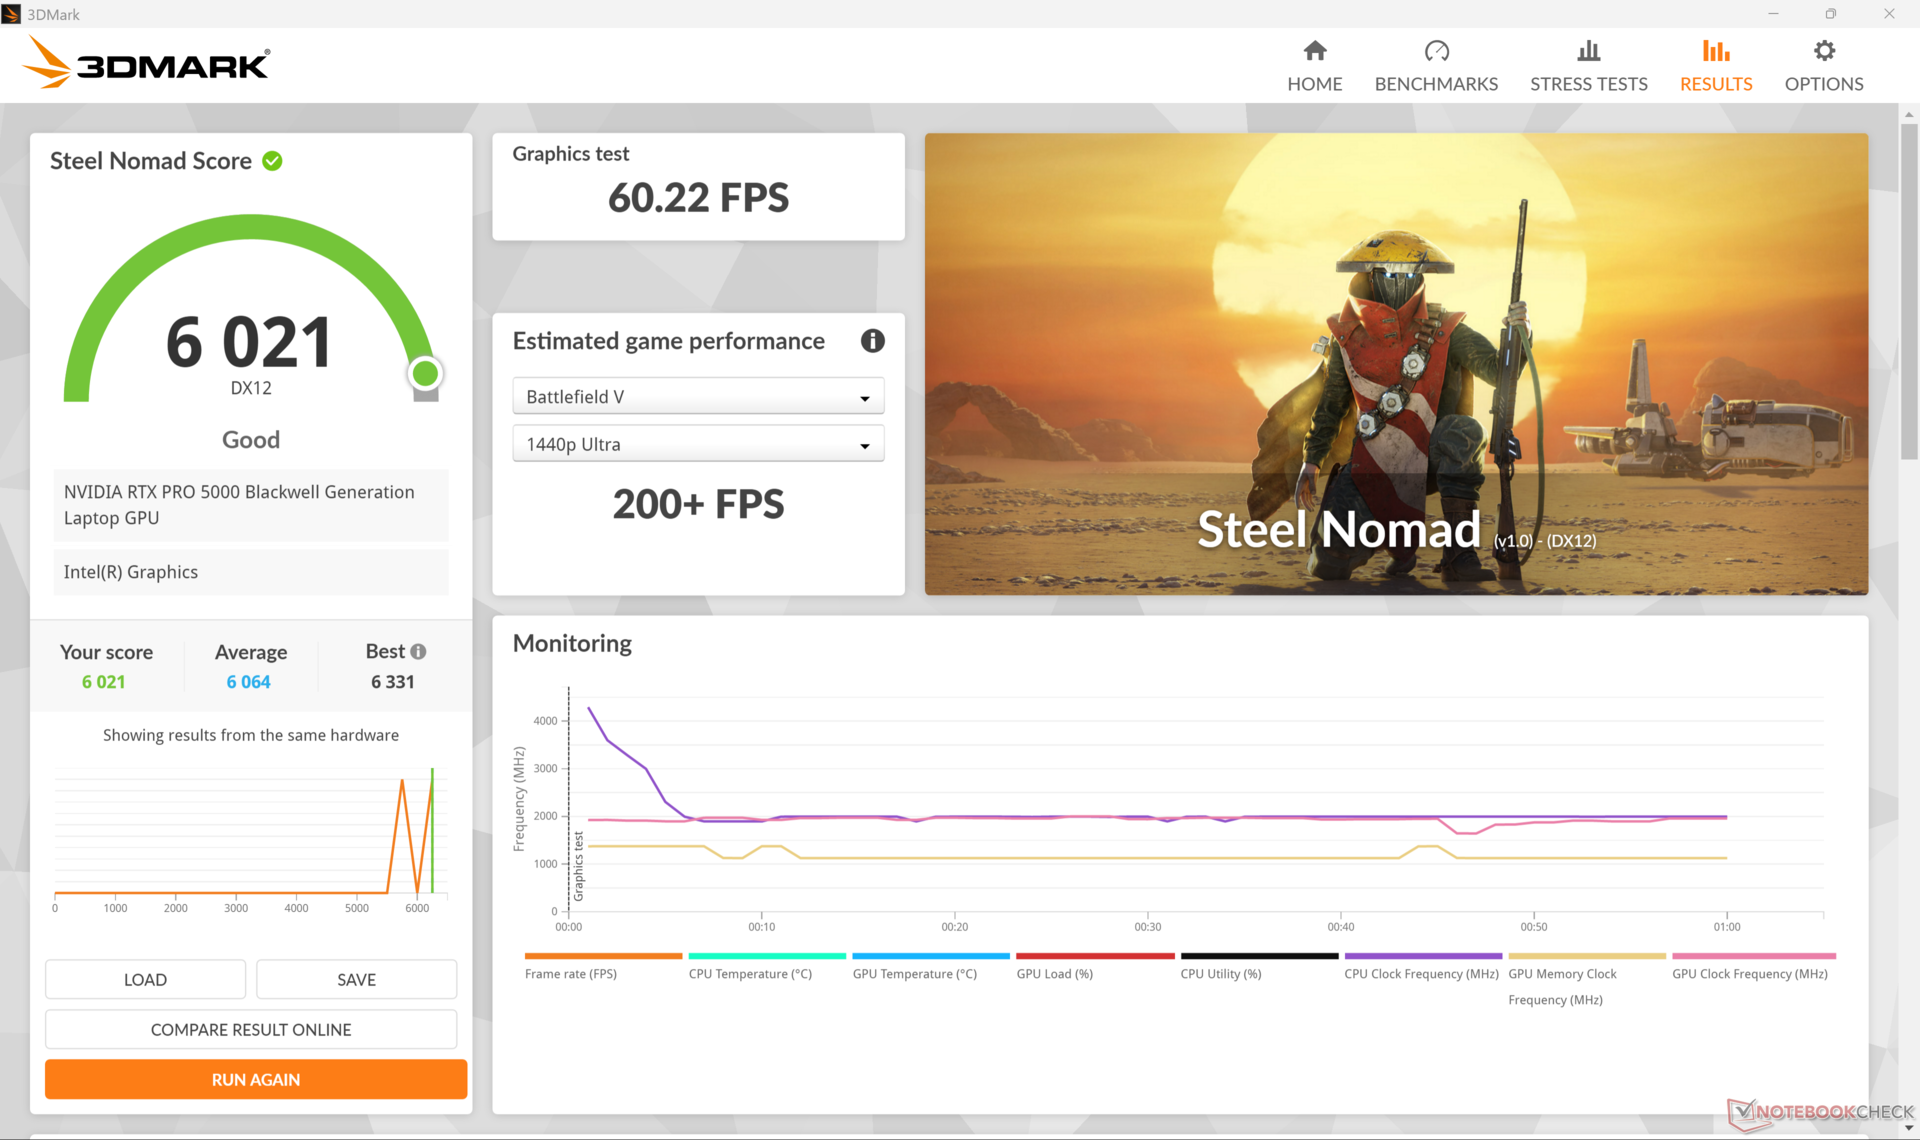
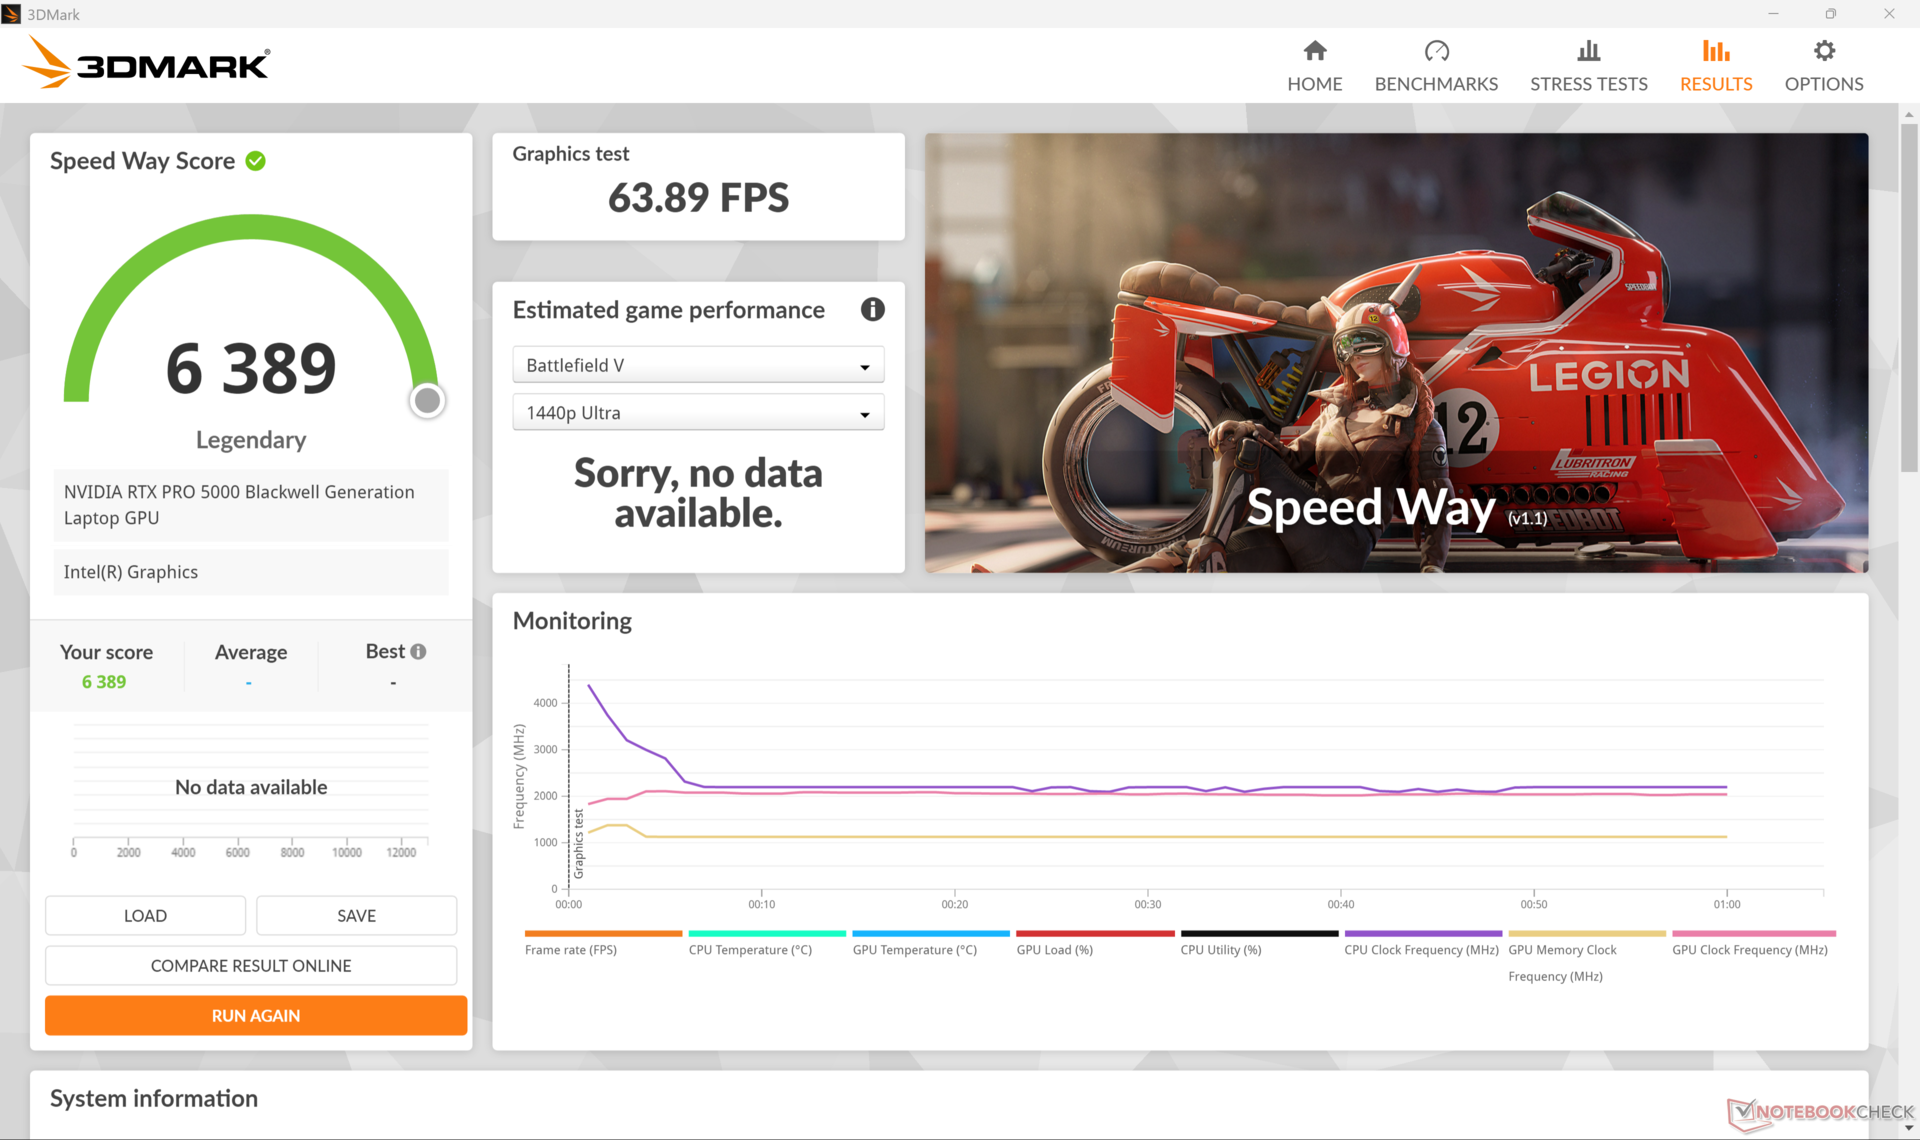
Som den första arbetsstationen i vår databas med RTX Pro 5000 Blackwellöverträffar GPU:n med råge den utgående RTX 5000 Ada som var vanlig på förra generationens flaggskeppsarbetsstationer som HP ZBook Fury 16 G10 med cirka 35 till 50 procent. Fördelarna kan bli ännu större om man tar hänsyn till Specviewperf-resultat. Att köra systemet i balanserat eller optimerat läge istället för prestandaläge skulle bara påverka prestandan minimalt enligt 3DMark Fire Strike benchmarks.
| Effektprofil | Grafikpoäng | Fysikpoäng | Kombinerad poäng |
| Prestandaläge (~121 W) | 48162 | 47030 | 9424 |
| Balanserat läge (~108 W) | 47134 (-2%) | 45150 (-4%) | 12212 (+30%) |
| Batterikraft | 25838 (-46%) | 34253 (-27%) | 6186 (-34%) |
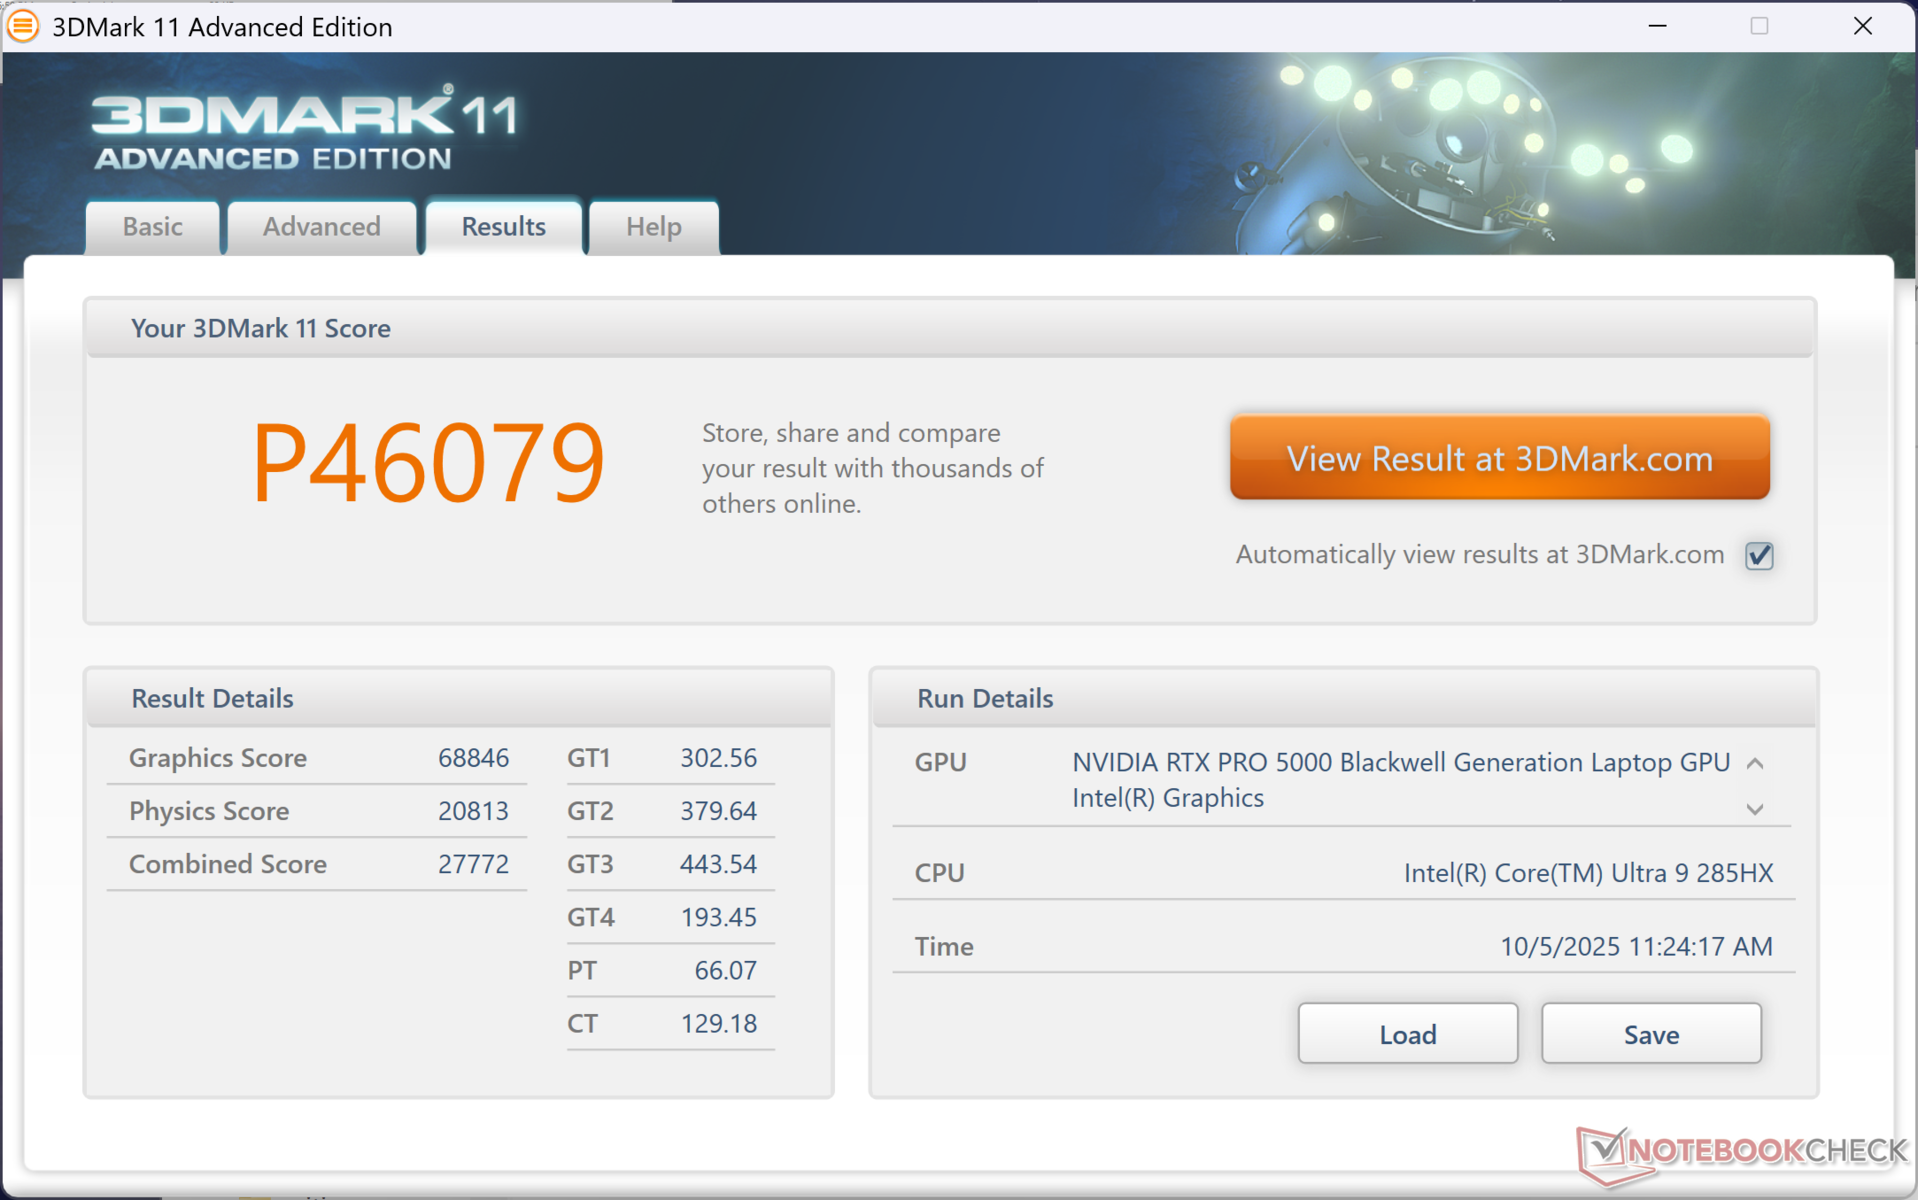

| 3DMark 11 Performance | 46079 poäng | |
| 3DMark Cloud Gate Standard Score | 67837 poäng | |
| 3DMark Fire Strike Score | 34044 poäng | |
| 3DMark Time Spy Score | 22205 poäng | |
| 3DMark Steel Nomad Score | 6021 poäng | |
Hjälp | ||
* ... mindre är bättre
Spelprestanda
Spelprestandan är i stort sett lik den hos mobil GeForce RTX 5080 vilket är att förvänta sig eftersom RTX Pro 5000 Blackwell är baserad på den mobila RTX 5090 chip men utan speloptimeringarna. Vissa titlar körs sämre eller inkonsekvent på RTX Pro 5000 Blackwell, inklusive Monster Hunter Wilds.
| Performance rating - Percent | |
| Dell Pro Max 16 Plus | |
| Lenovo ThinkPad P16 Gen 2 | |
| Dell Precision 5000 5680 -3! | |
| Dell Precision 5690 -1! | |
| HP ZBook Studio 16 G11 | |
| MSI CreatorPro Z16P B12UKST -2! | |
| Lenovo ThinkPad P1 Gen 7 21KV001SGE -1! | |
| Cyberpunk 2077 - 1920x1080 Ultra Preset (FSR off) | |
| Dell Pro Max 16 Plus | |
| Dell Precision 5690 | |
| Lenovo ThinkPad P16 Gen 2 | |
| Lenovo ThinkPad P1 Gen 7 21KV001SGE | |
| HP ZBook Studio 16 G11 | |
| Baldur's Gate 3 - 1920x1080 Ultra Preset AA:T | |
| Dell Pro Max 16 Plus | |
| Lenovo ThinkPad P16 Gen 2 | |
| Dell Precision 5690 | |
| HP ZBook Studio 16 G11 | |
| Lenovo ThinkPad P1 Gen 7 21KV001SGE | |
| GTA V - 1920x1080 Highest AA:4xMSAA + FX AF:16x | |
| Dell Pro Max 16 Plus | |
| Lenovo ThinkPad P16 Gen 2 | |
| Dell Precision 5000 5680 | |
| Lenovo ThinkPad P1 Gen 7 21KV001SGE | |
| HP ZBook Studio 16 G11 | |
| MSI CreatorPro Z16P B12UKST | |
| Final Fantasy XV Benchmark - 1920x1080 High Quality | |
| Dell Pro Max 16 Plus | |
| Lenovo ThinkPad P16 Gen 2 | |
| Dell Precision 5690 | |
| Dell Precision 5000 5680 | |
| HP ZBook Studio 16 G11 | |
| Lenovo ThinkPad P1 Gen 7 21KV001SGE | |
| MSI CreatorPro Z16P B12UKST | |
| Strange Brigade - 1920x1080 ultra AA:ultra AF:16 | |
| Lenovo ThinkPad P16 Gen 2 | |
| Dell Pro Max 16 Plus | |
| Dell Precision 5690 | |
| HP ZBook Studio 16 G11 | |
| MSI CreatorPro Z16P B12UKST | |
| Dota 2 Reborn - 1920x1080 ultra (3/3) best looking | |
| Dell Pro Max 16 Plus | |
| Lenovo ThinkPad P16 Gen 2 | |
| MSI CreatorPro Z16P B12UKST | |
| Dell Precision 5000 5680 | |
| HP ZBook Studio 16 G11 | |
| Dell Precision 5690 | |
| Lenovo ThinkPad P1 Gen 7 21KV001SGE | |
| X-Plane 11.11 - 1920x1080 high (fps_test=3) | |
| Lenovo ThinkPad P16 Gen 2 | |
| Dell Pro Max 16 Plus | |
| Dell Precision 5000 5680 | |
| MSI CreatorPro Z16P B12UKST | |
| Dell Precision 5690 | |
| HP ZBook Studio 16 G11 | |
| Lenovo ThinkPad P1 Gen 7 21KV001SGE | |
Cyberpunk 2077 ultra FPS-diagram
| låg | med. | hög | ultra | QHD DLSS | QHD | 4K DLSS | 4K | |
|---|---|---|---|---|---|---|---|---|
| GTA V (2015) | 184.7 | 183.5 | 178.1 | 142.5 | 138 | 170.3 | ||
| Dota 2 Reborn (2015) | 212 | 181 | 184.8 | 166 | 146.4 | |||
| Final Fantasy XV Benchmark (2018) | 233 | 220 | 184.2 | 162.8 | 102.2 | |||
| X-Plane 11.11 (2018) | 144.4 | 125.7 | 103.2 | 82.6 | ||||
| Strange Brigade (2018) | 382 | 285 | 261 | 288 | 300 | 177.3 | ||
| Baldur's Gate 3 (2023) | 204 | 201.8 | 155.2 | 128.1 | 80.1 | |||
| Cyberpunk 2077 (2023) | 133.9 | 121.6 | 120.6 | 119.8 | 116.3 | 105.1 | 51 | |
| F1 24 (2024) | 251 | 243 | 231 | 131.2 | 128.1 | 94.9 | 82 | 47.2 |
| Black Myth: Wukong (2024) | 142 | 72 | 54 | 42 | 36 | 37 | 32 | 26 |
| Monster Hunter Wilds (2025) | 25.4 | 27 | 27.8 | 43.3 | 39 | 33.9 | 35.3 | |
| Assassin's Creed Shadows (2025) | 103 | 98 | 86 | 68 | 67 | 57 | 56 | 42 |
Utsläpp
Systembuller
Fläktarna är nästan alltid aktiva, men det pulserande beteendet hålls generellt till ett minimum för att minska kraftiga ljudökningar. Med det sagt kan systemet vara ganska högljutt med nästan 55 dB(A) när det körs krävande belastningar, vilket liknar det vi registrerade på Lenovo ThinkPad P1 eller HP ZBook Studio 16 G11.
Fläktljudet toppar på 49 dB(A) och 54,3 dB(A) när det är inställt på balanserat läge respektive prestandaläge.
Ljudnivå
| Låg belastning |
| 26.7 / 30.5 / 34 dB(A) |
| Hög belastning |
| 39.8 / 54.3 dB(A) |
 | ||
30 dB tyst 40 dB(A) hörbar 50 dB(A) högt ljud |
||
min: | ||
| Dell Pro Max 16 Plus RTX PRO 5000 Blackwell Generation Laptop, Ultra 9 285HX, SK hynix PCB01 HFS001TFM9X186N | Dell Precision 5690 RTX 5000 Ada Generation Laptop, Ultra 9 185H, 2x Samsung PM9A1 1TB (RAID 0) | Dell Precision 5000 5680 RTX 5000 Ada Generation Laptop, i9-13900H, 2x SK hynix PC801 HFS512GEJ9X101N RAID 0 | Lenovo ThinkPad P16 Gen 2 RTX 4000 Ada Generation Laptop, i7-14700HX, SK hynix PC801 HFS001TEJ9X162N | Lenovo ThinkPad P1 Gen 7 21KV001SGE GeForce RTX 4060 Laptop GPU, Ultra 7 155H, Kioxia XG8 KXG8AZNV1T02 | HP ZBook Studio 16 G11 RTX 3000 Ada Generation Laptop, Ultra 9 185H, Kioxia XG8 KXG80ZNV1T02 | MSI CreatorPro Z16P B12UKST RTX A3000 Laptop GPU, i7-12700H, Samsung PM9A1 MZVL21T0HCLR | |
|---|---|---|---|---|---|---|---|
| Noise | 7% | 14% | 1% | 6% | 11% | 5% | |
| av / miljö * (dB) | 23.2 | 23.4 -1% | 22.8 2% | 23.9 -3% | 24.7 -6% | 23.8 -3% | 24.1 -4% |
| Idle Minimum * (dB) | 26.7 | 23.6 12% | 23 14% | 29.1 -9% | 24.7 7% | 23.8 11% | 27.1 -1% |
| Idle Average * (dB) | 30.5 | 24.9 18% | 23 25% | 29.1 5% | 24.7 19% | 26.4 13% | 27.1 11% |
| Idle Maximum * (dB) | 34 | 30.9 9% | 23 32% | 29.1 14% | 24.7 27% | 26.4 22% | 27.1 20% |
| Load Average * (dB) | 39.8 | 40.4 -2% | 37.2 7% | 41 -3% | 43.7 -10% | 33.7 15% | 42.9 -8% |
| Cyberpunk 2077 ultra * (dB) | 54.3 | 52.8 3% | 53.2 2% | 46.1 15% | |||
| Load Maximum * (dB) | 54.3 | 51.9 4% | 51 6% | 52.9 3% | 53.3 2% | 53.2 2% | 47 13% |
| Witcher 3 ultra * (dB) | 48.3 | 51 | 44 |
* ... mindre är bättre
Temperatur
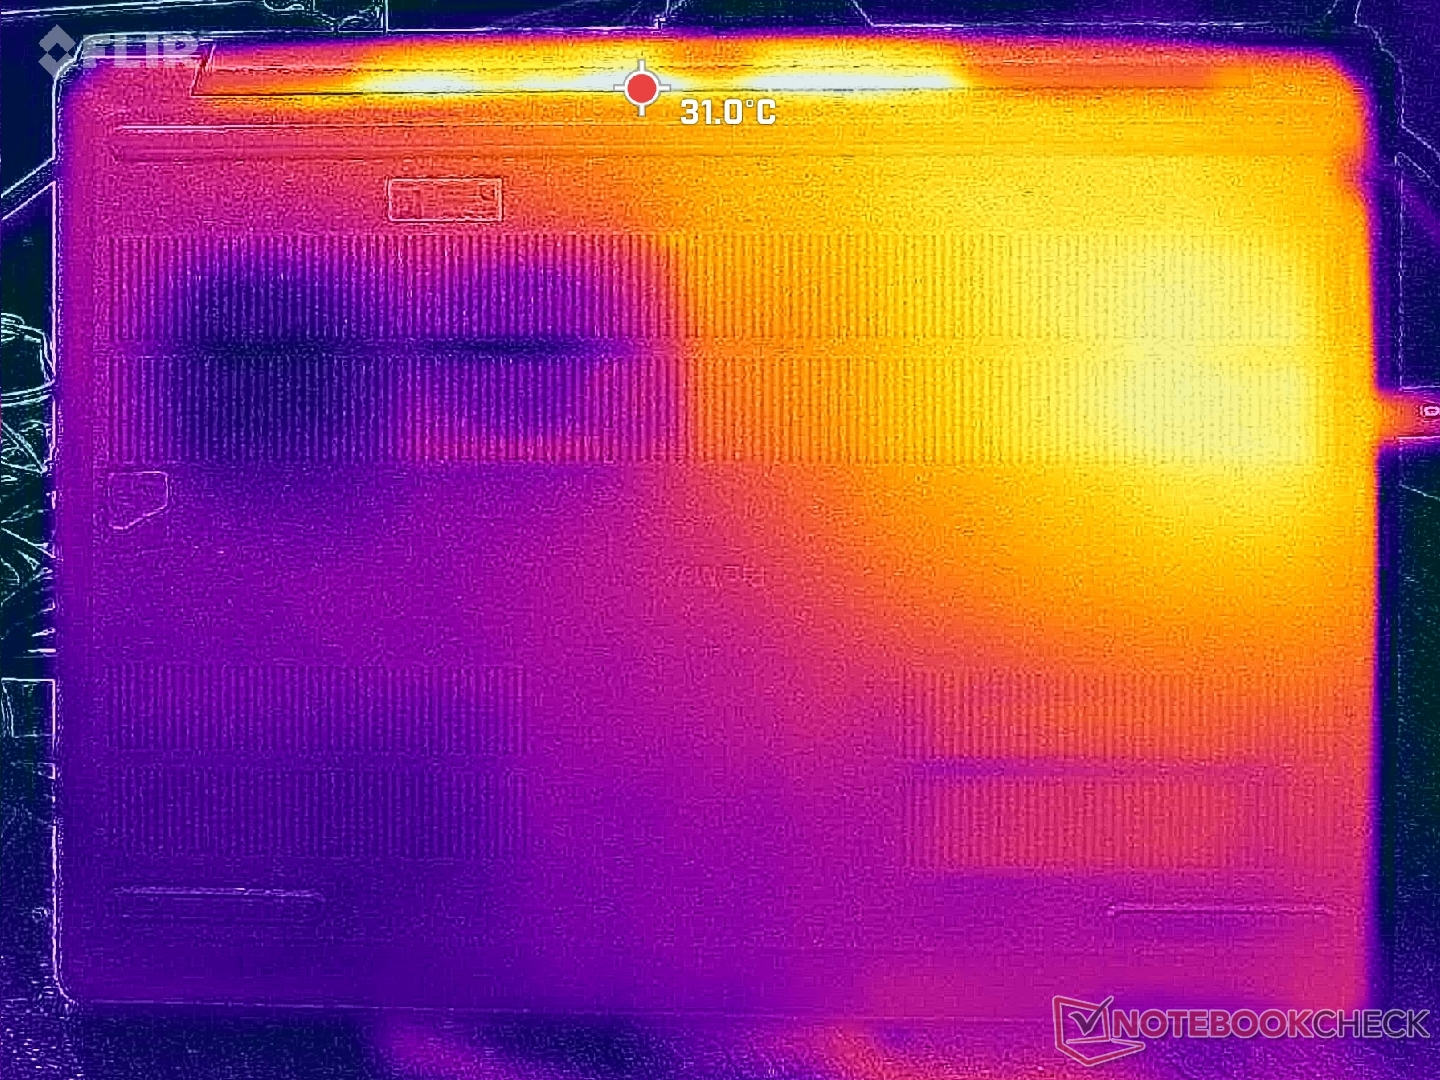
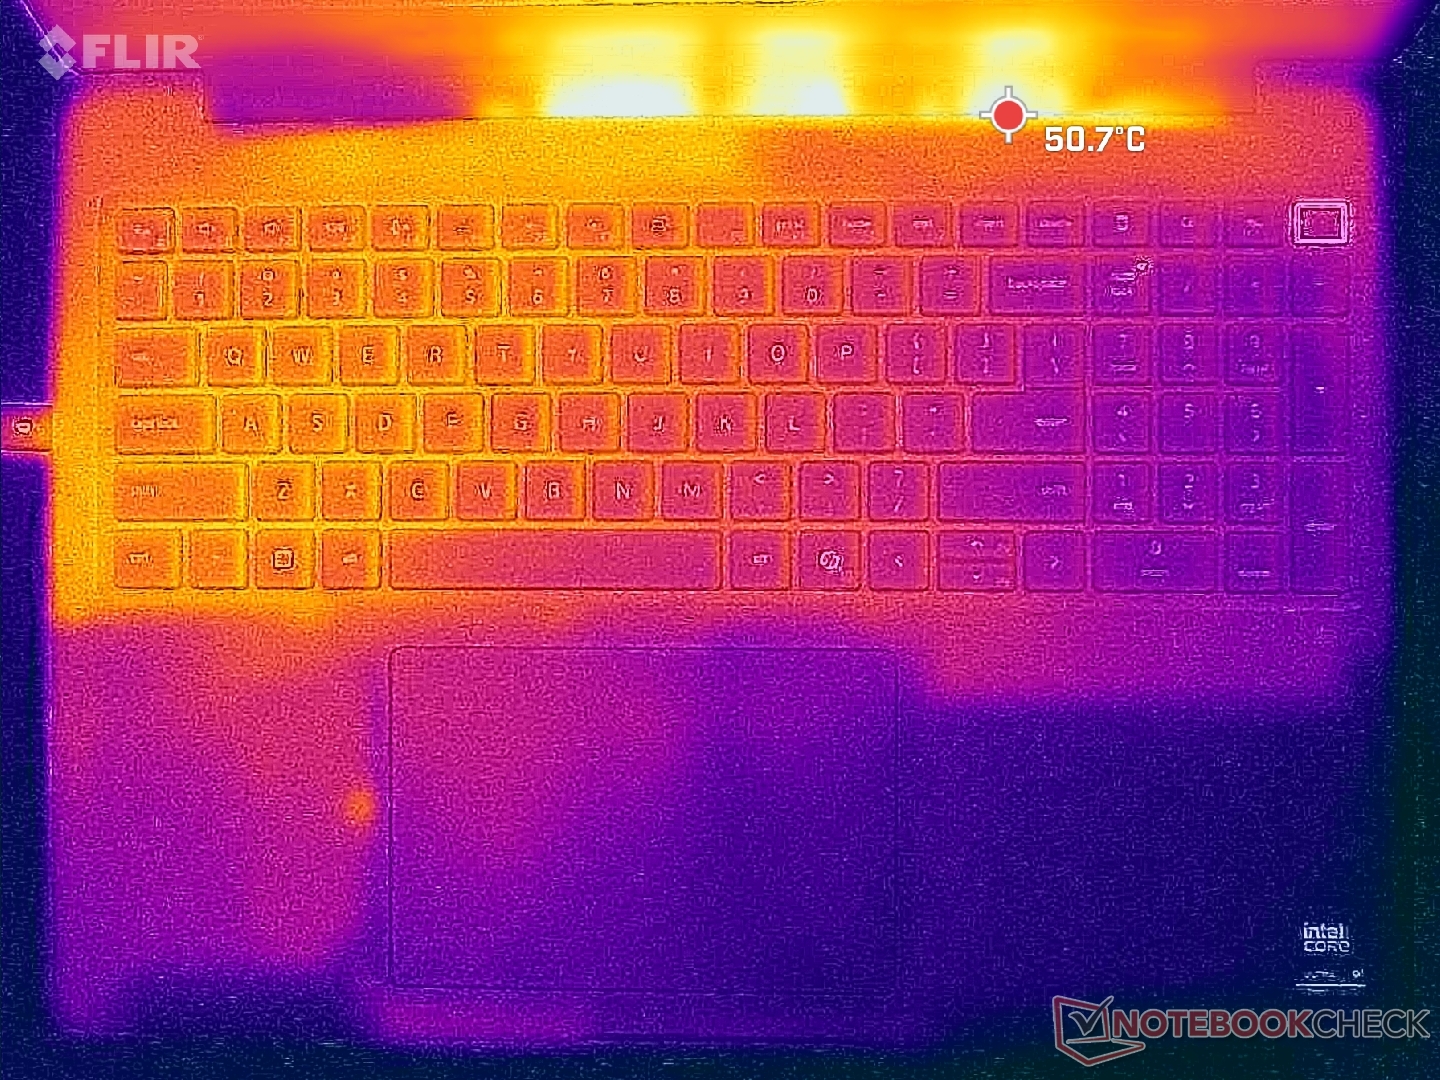
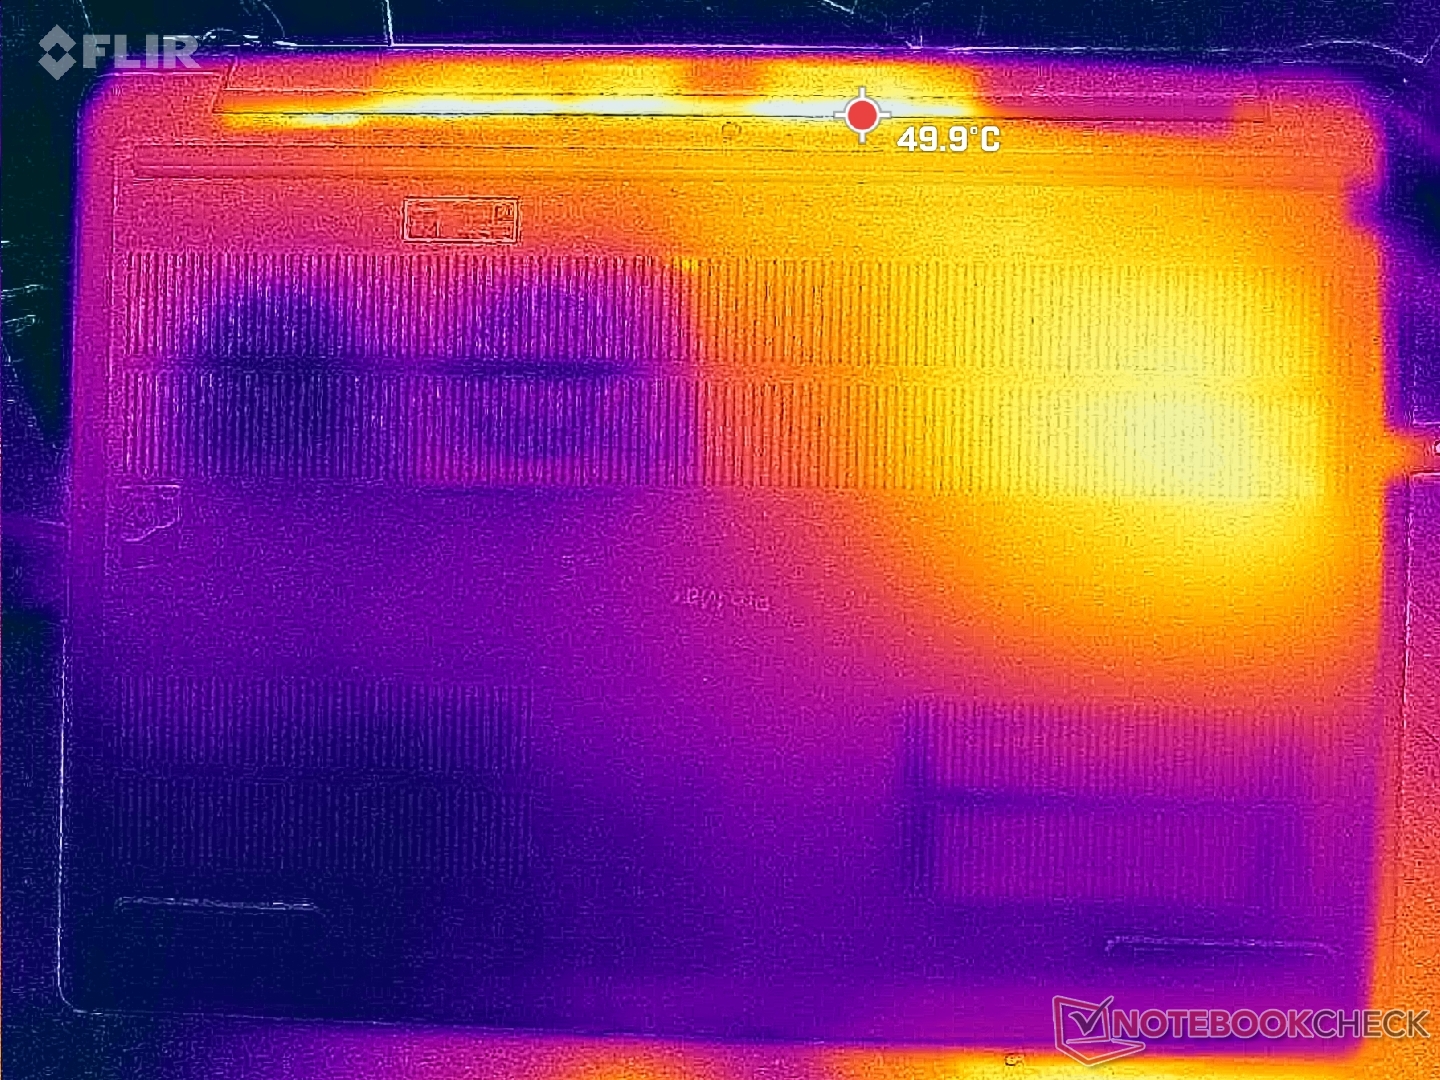
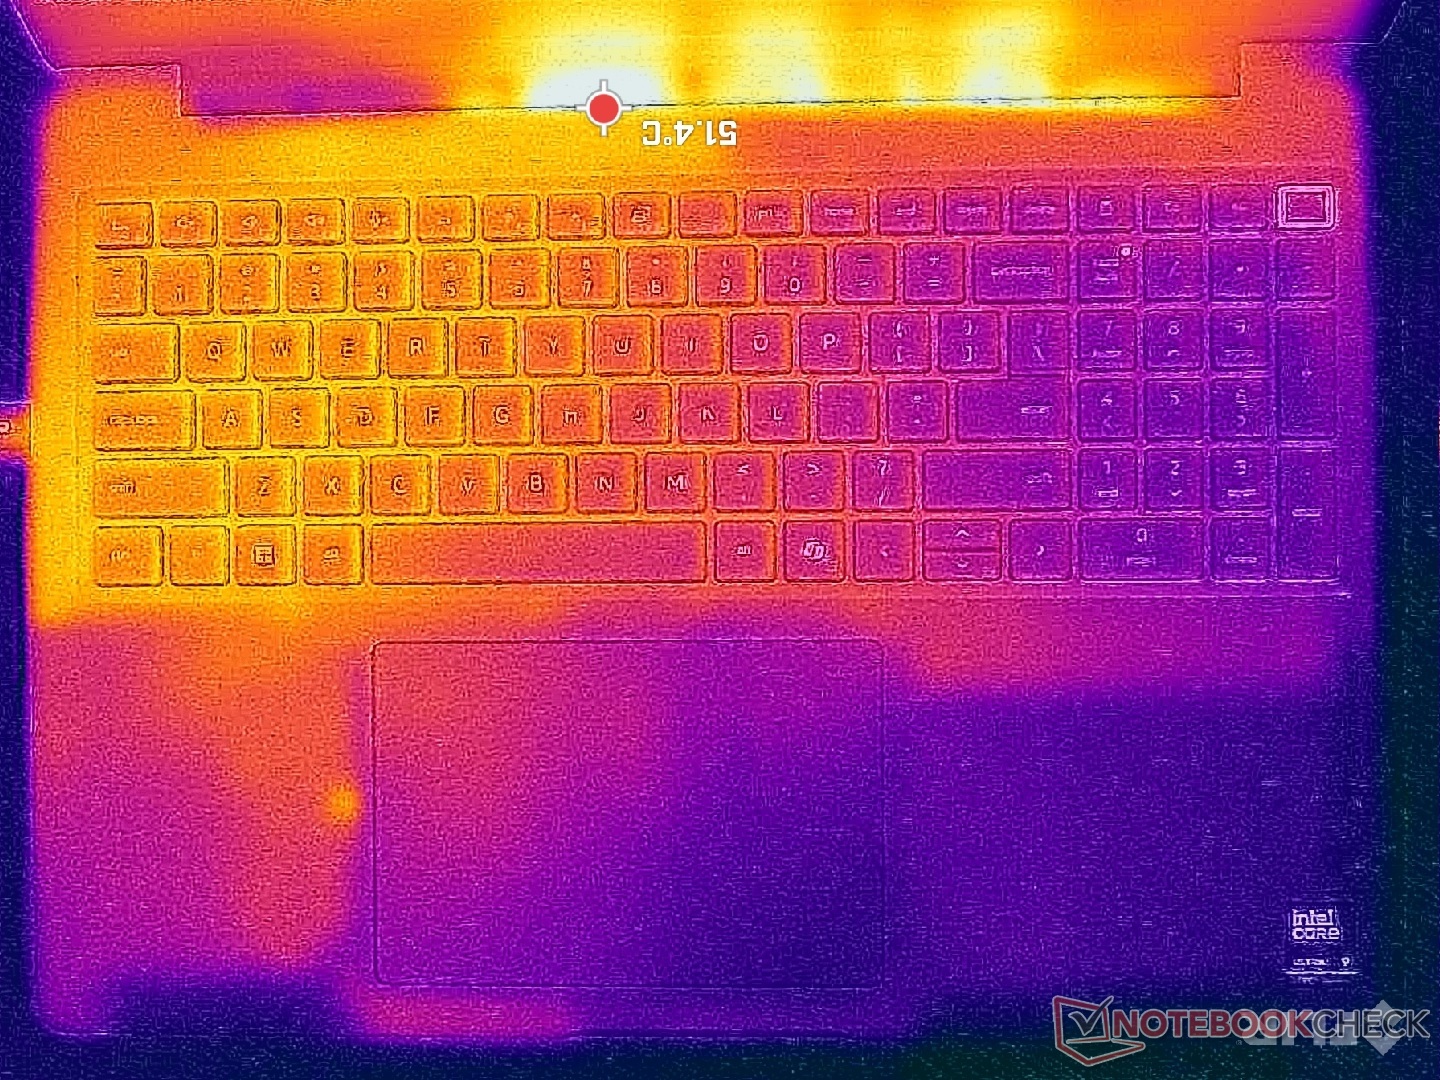
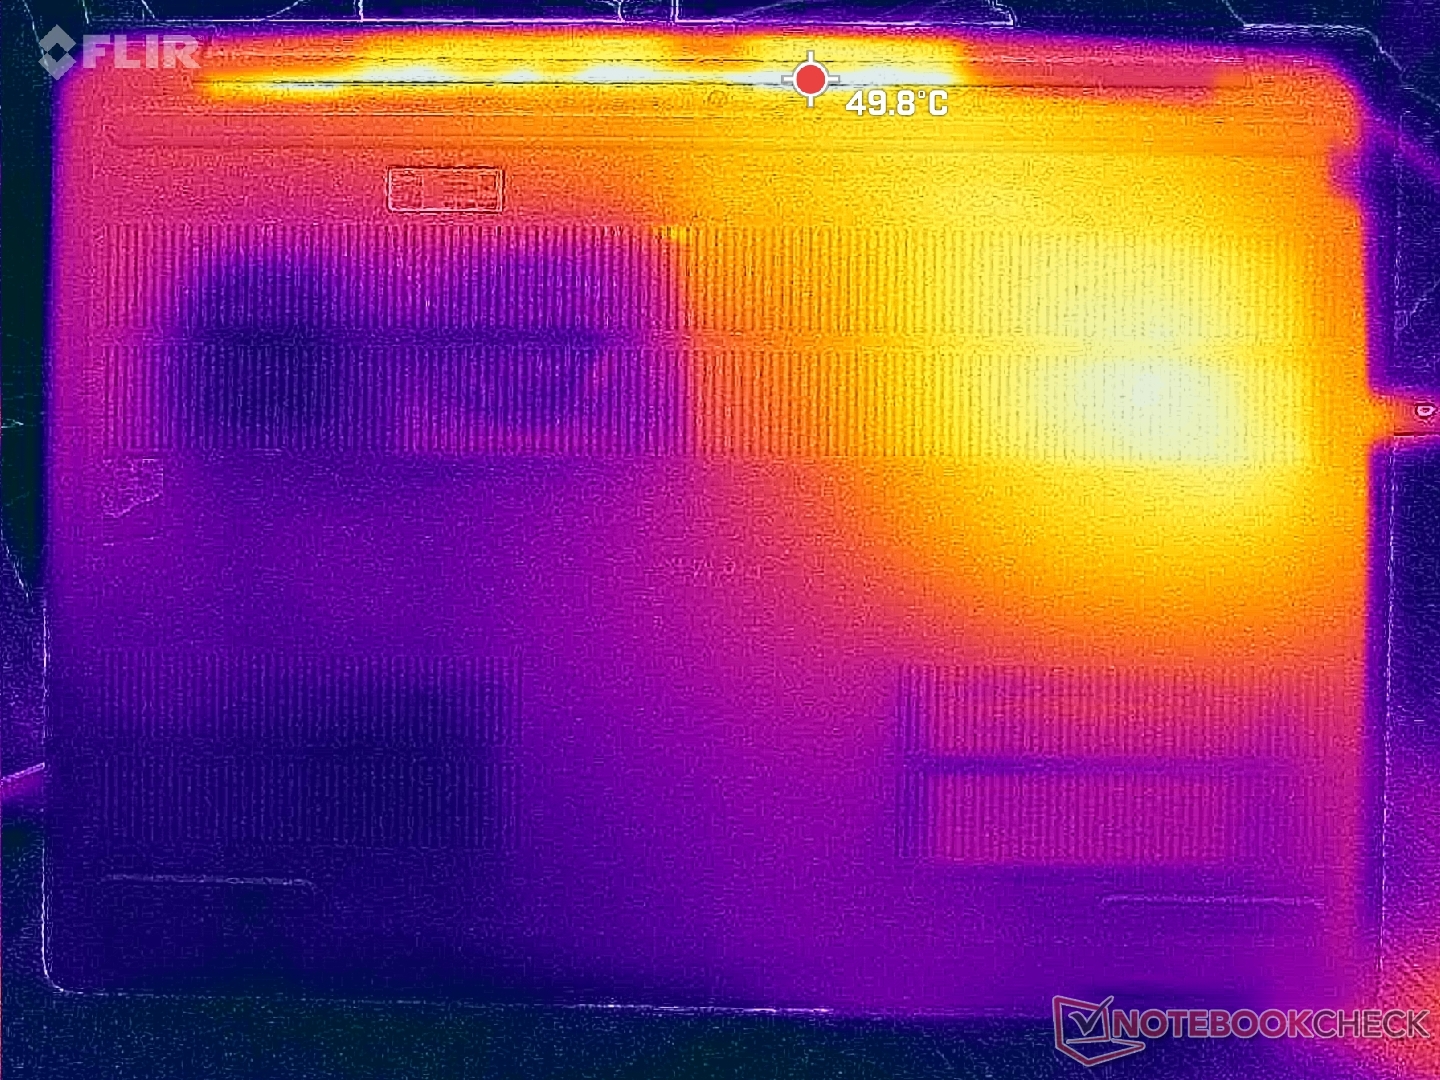
Yttemperaturerna är nästan alltid varma oavsett belastningen på skärmen, vilket sannolikt beror på de slöa fläktarna och de högpresterande komponenterna. Den vänstra halvan av chassit blir märkbart varmare än den högra på grund av den asymmetriska kylningslösningen.
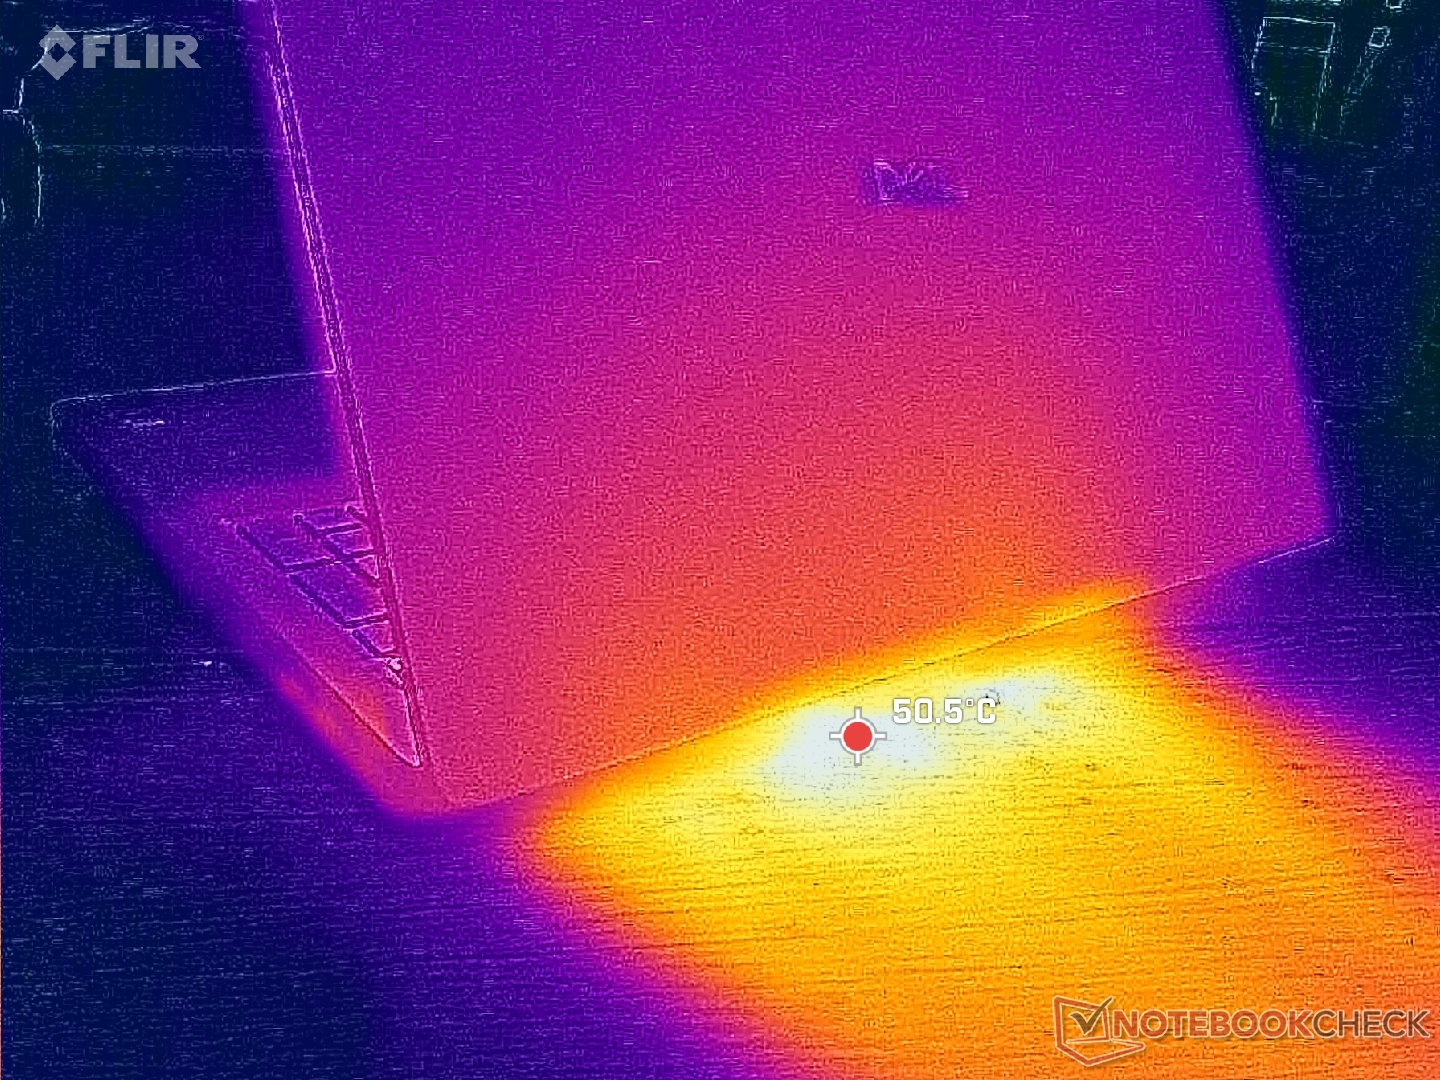
(±) Den maximala temperaturen på ovansidan är 40.4 °C / 105 F, jämfört med genomsnittet av 38.2 °C / 101 F , allt från 22.2 till 69.8 °C för klassen Workstation.
(-) Botten värms upp till maximalt 45.6 °C / 114 F, jämfört med genomsnittet av 41.1 °C / 106 F
(+) Vid tomgångsbruk är medeltemperaturen för ovansidan 29.5 °C / 85 F, jämfört med enhetsgenomsnittet på 32 °C / ### class_avg_f### F.
(±) 3: The average temperature for the upper side is 34.2 °C / 94 F, compared to the average of 32 °C / 90 F for the class Workstation.
(+) Handledsstöden och pekplattan når maximal hudtemperatur (33.2 °C / 91.8 F) och är därför inte varma.
(-) Medeltemperaturen för handledsstödsområdet på liknande enheter var 27.8 °C / 82 F (-5.4 °C / -9.8 F).

| Dell Pro Max 16 Plus Intel Core Ultra 9 285HX, NVIDIA RTX PRO 5000 Blackwell Generation Laptop | Dell Precision 5690 Intel Core Ultra 9 185H, NVIDIA RTX 5000 Ada Generation Laptop | Dell Precision 5000 5680 Intel Core i9-13900H, NVIDIA RTX 5000 Ada Generation Laptop | Lenovo ThinkPad P16 Gen 2 Intel Core i7-14700HX, NVIDIA RTX 4000 Ada Generation Laptop | Lenovo ThinkPad P1 Gen 7 21KV001SGE Intel Core Ultra 7 155H, NVIDIA GeForce RTX 4060 Laptop GPU | HP ZBook Studio 16 G11 Intel Core Ultra 9 185H, NVIDIA RTX 3000 Ada Generation Laptop | MSI CreatorPro Z16P B12UKST Intel Core i7-12700H, NVIDIA RTX A3000 Laptop GPU | |
|---|---|---|---|---|---|---|---|
| Heat | 6% | -1% | 5% | 6% | 0% | -11% | |
| Maximum Upper Side * (°C) | 40.4 | 46.6 -15% | 50.2 -24% | 46.6 -15% | 50.3 -25% | 36.6 9% | 56.3 -39% |
| Maximum Bottom * (°C) | 45.6 | 33 28% | 32 30% | 51 -12% | 38 17% | 47.8 -5% | 68.3 -50% |
| Idle Upper Side * (°C) | 32.8 | 32.4 1% | 37.4 -14% | 24.8 24% | 28.3 14% | 31.4 4% | 25.2 23% |
| Idle Bottom * (°C) | 33 | 29.4 11% | 31.2 5% | 25.6 22% | 27.3 17% | 35.6 -8% | 25.9 22% |
* ... mindre är bättre
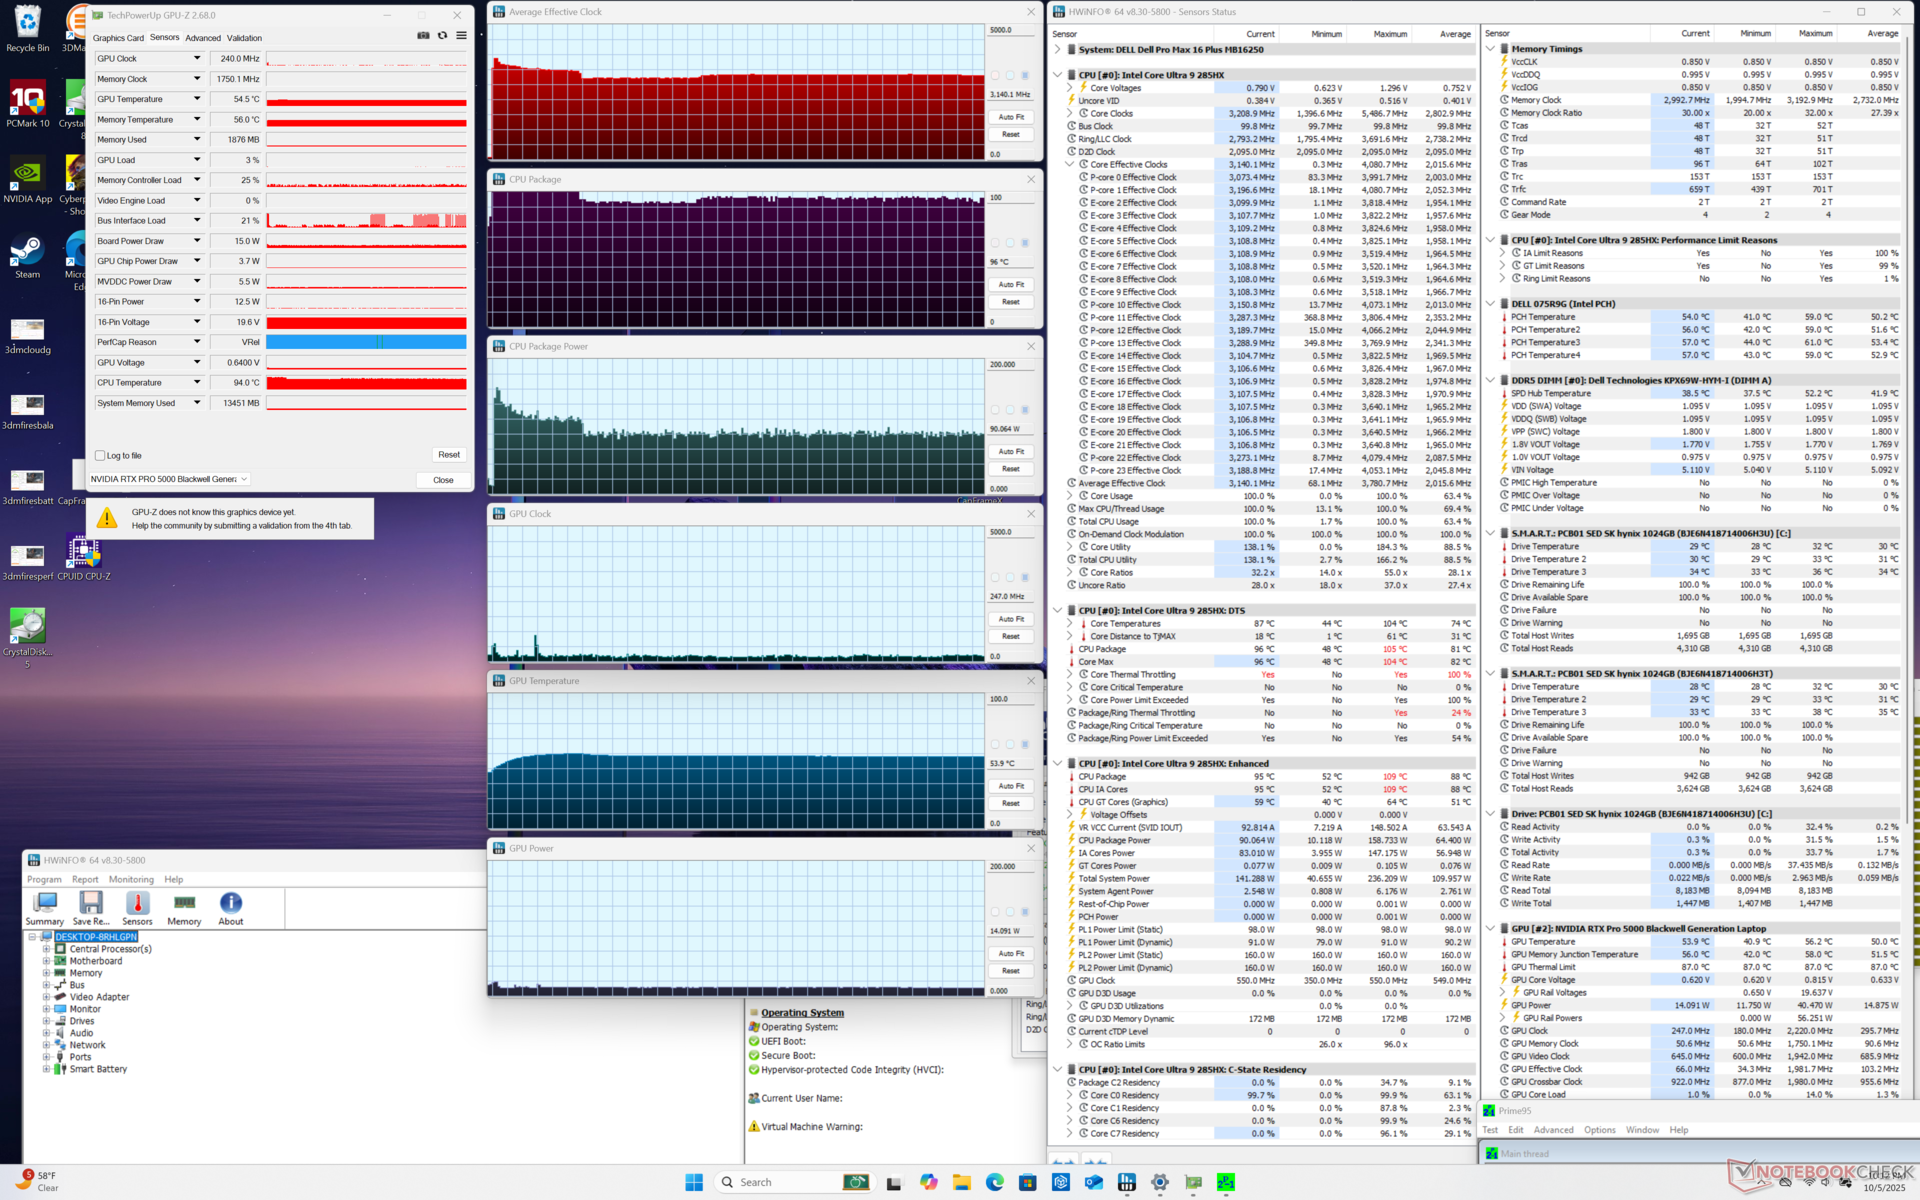
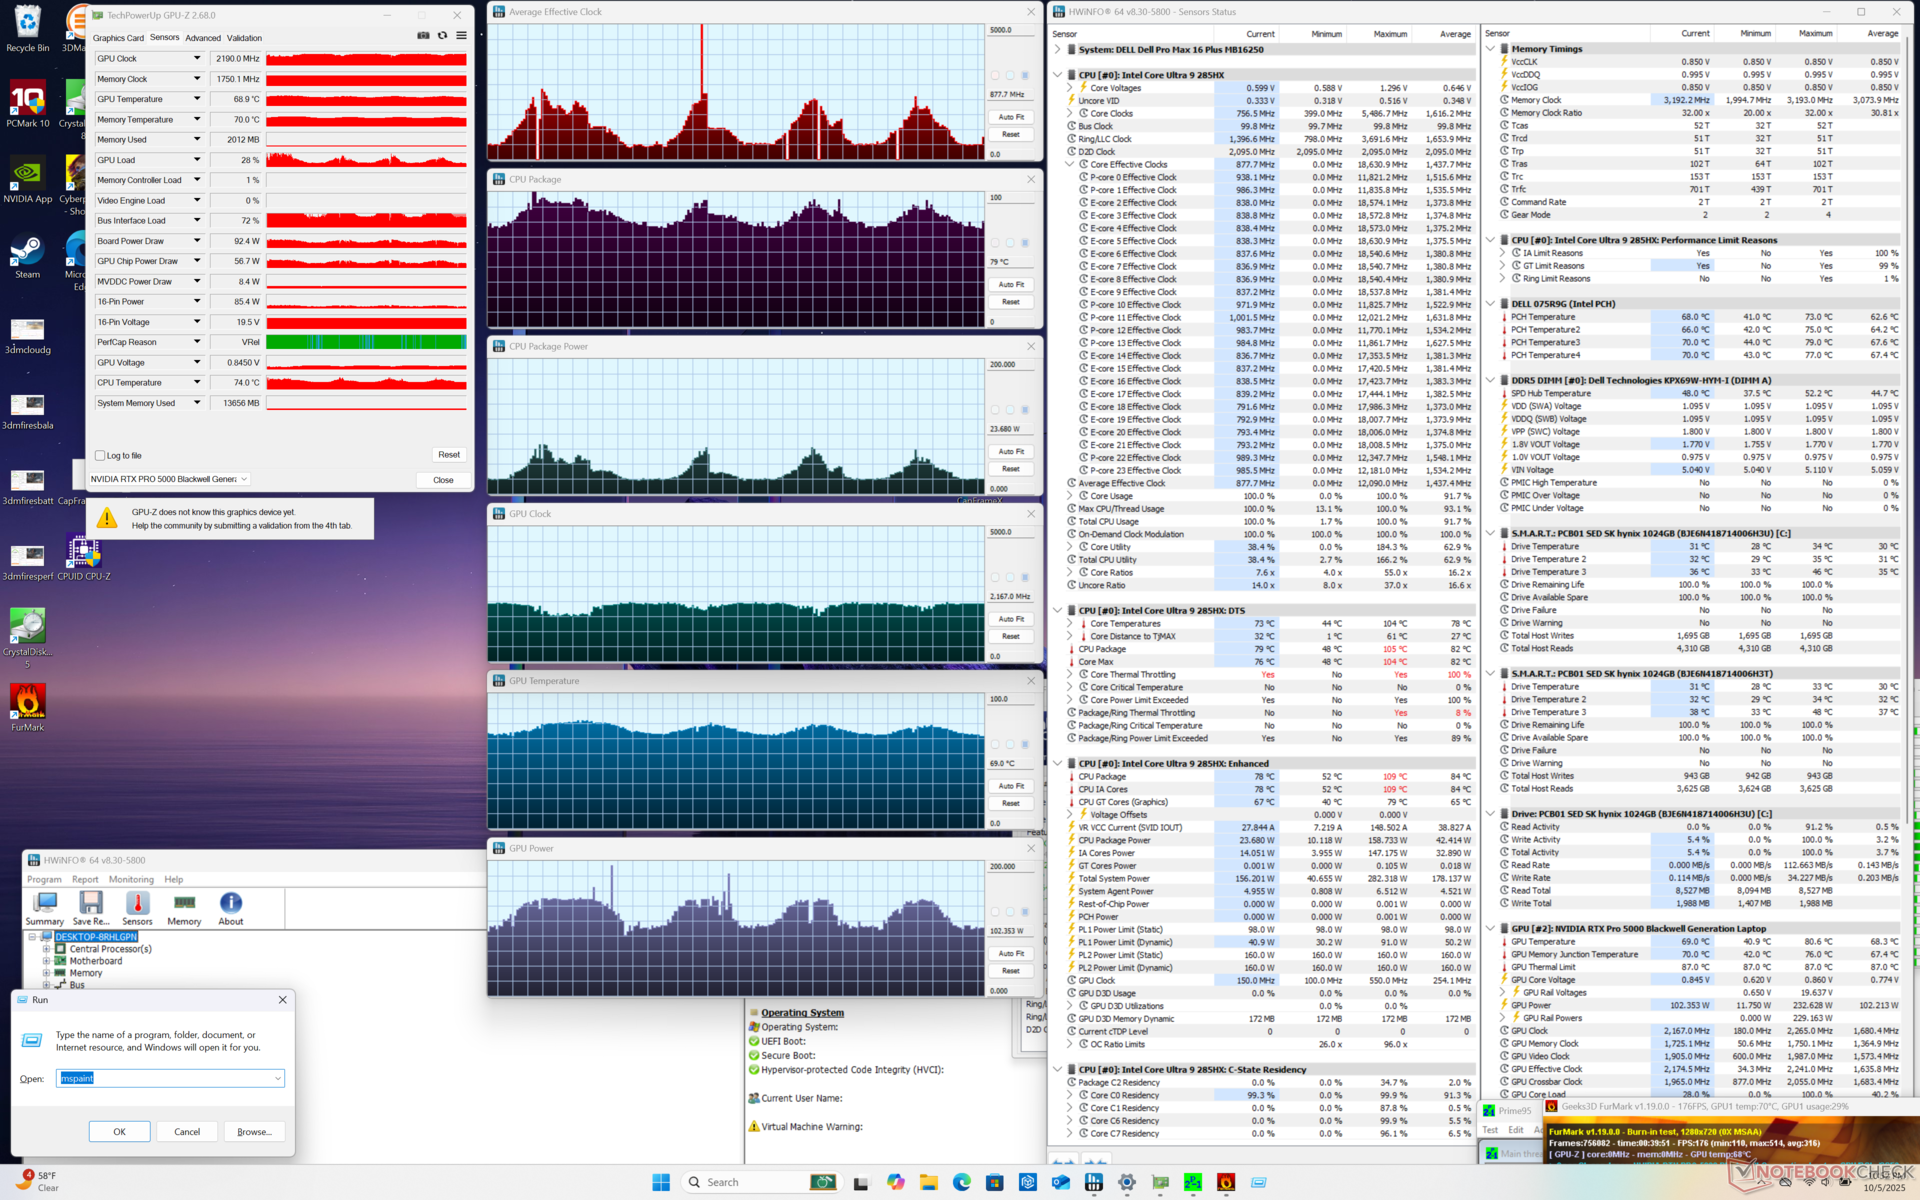
Stresstest
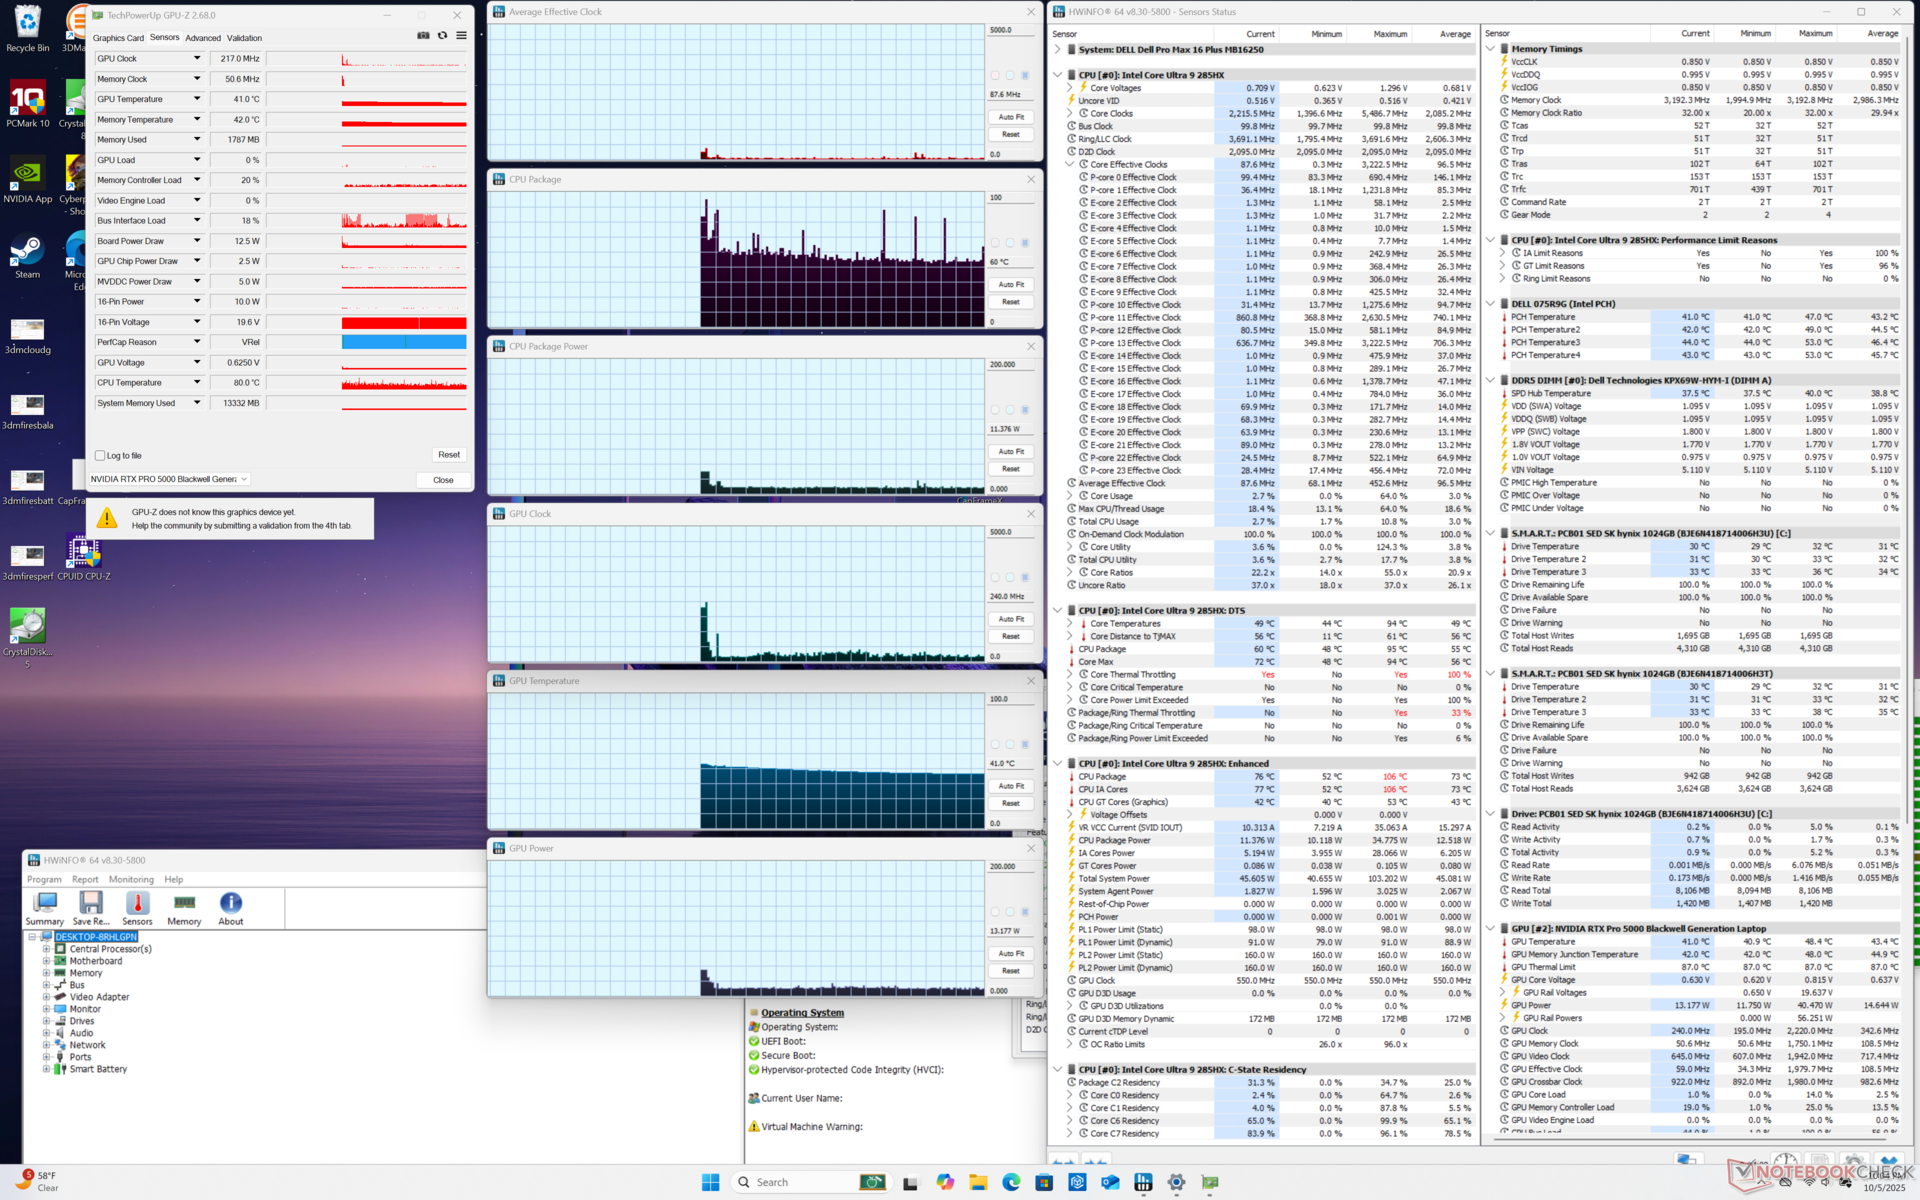
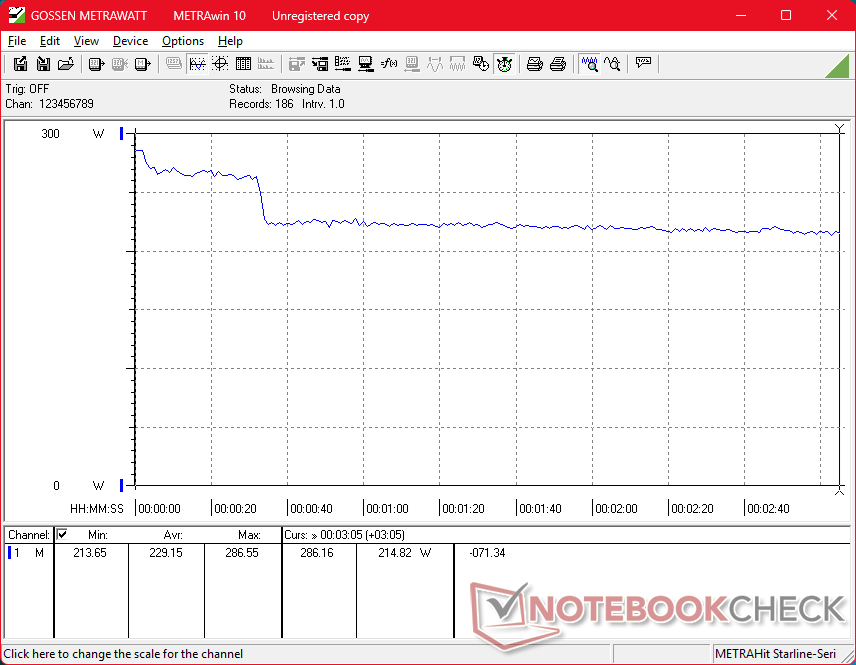
Processorn skulle öka till 3,8 GHz, 159 W och 105 C när Prime95-stress initierades innan den snabbt sjönk och stabiliserades på 3,1 GHz, 90 W och 96 C. Kärntemperaturen skulle bli varmare än vi skulle vilja när den är helt stressad.
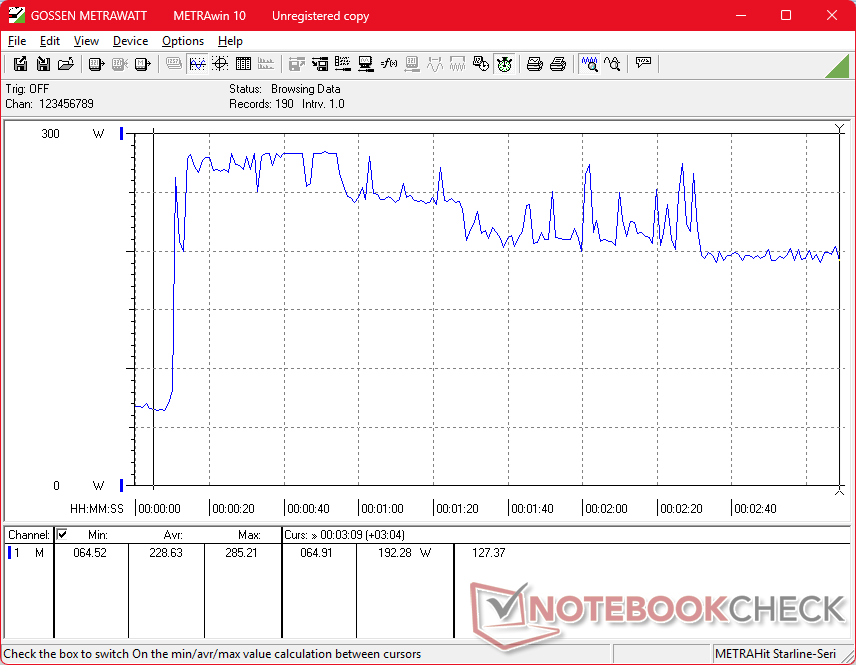
Genom att köra Cyberpunk 2077 i prestandaläge för att representera mer typiska stressförhållanden skulle GPU:n stabiliseras på ~ 121 W. Att gå ner till balanserat läge skulle sänka GPU:ns effektuttagstak till ~ 108 W.
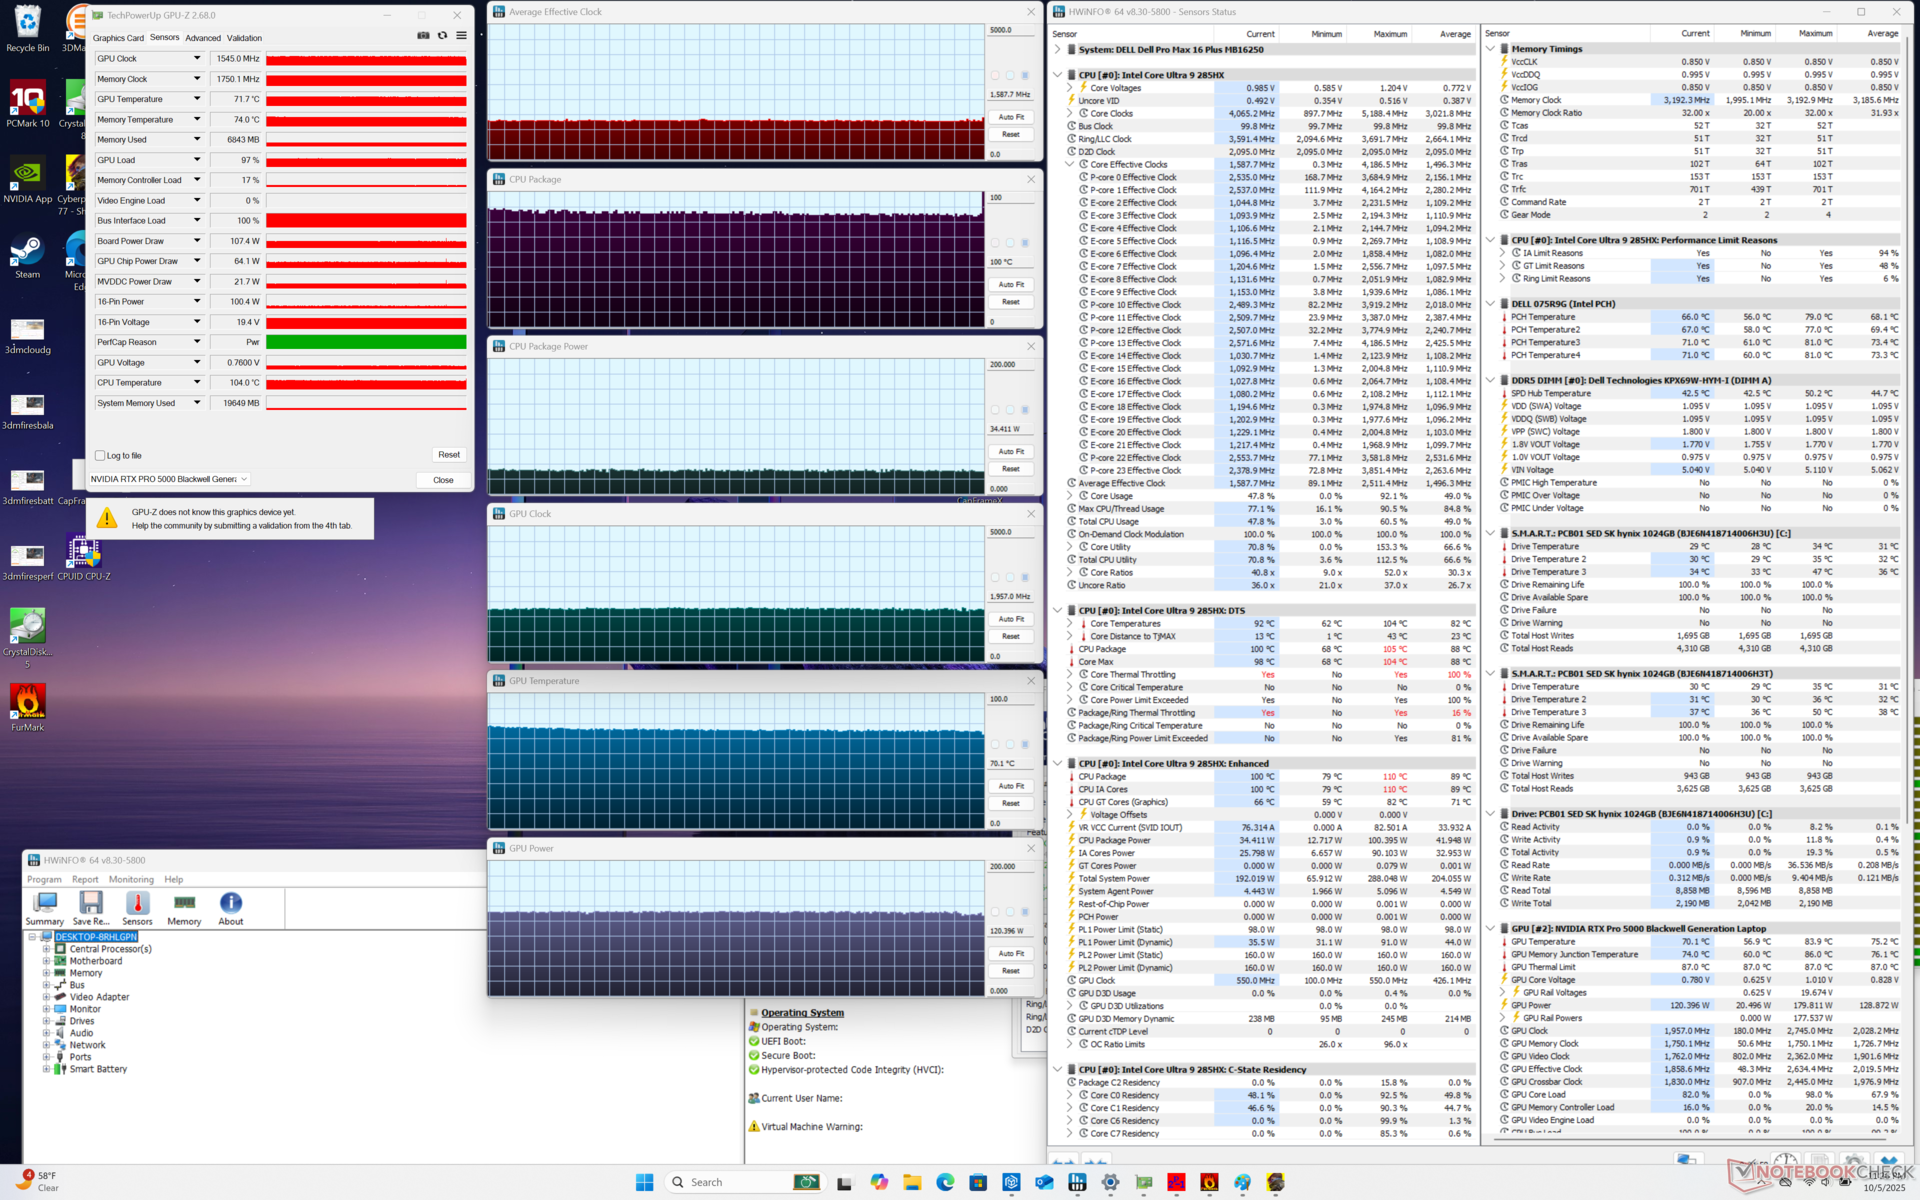
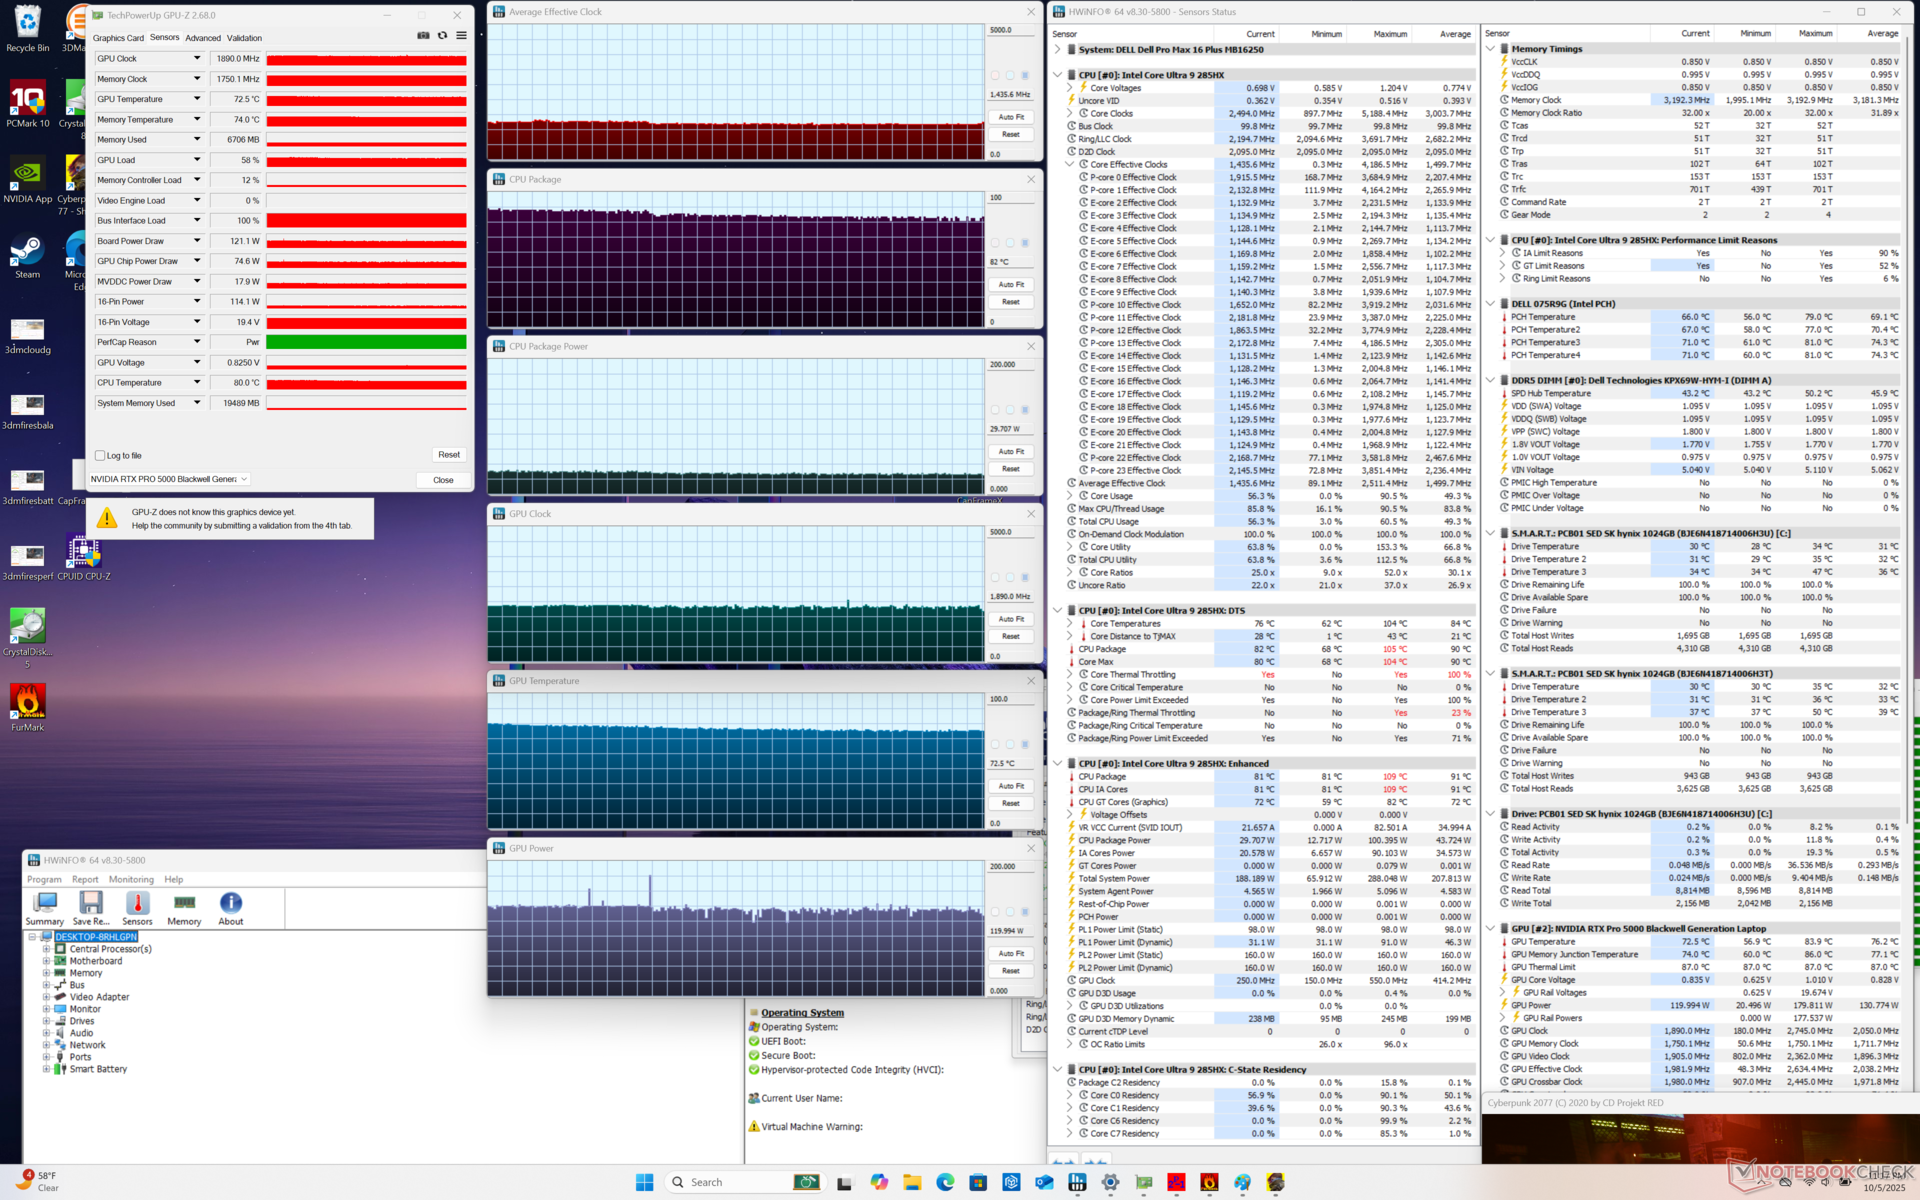
| Genomsnittlig CPU-klocka (GHz) | GPU-klocka (MHz) | Genomsnittlig CPU-temperatur (°C) | Genomsnittlig GPU-temperatur (°C) | |
| System i viloläge | -- | -- | 55 | 41 |
| Prime95 Stress | 3.1 | -- | 96 | 55 |
| Prime95 + FurMark Stress | 0,5 - 2,8 | 1,7 - 2,2 | 75 - 105 | 70 - 78 |
| Cyberpunk 2077 Stress (Balanserat läge) | ~1,6 | 1545 | 82 | 71 |
| Cyberpunk 2077 Stress (Performance mode) | ~1,4 | 1890 | 82 | 73 |
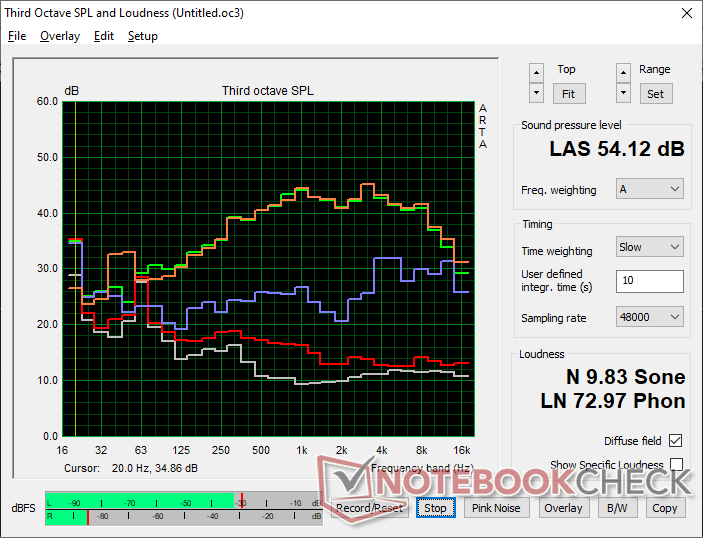
Högtalare
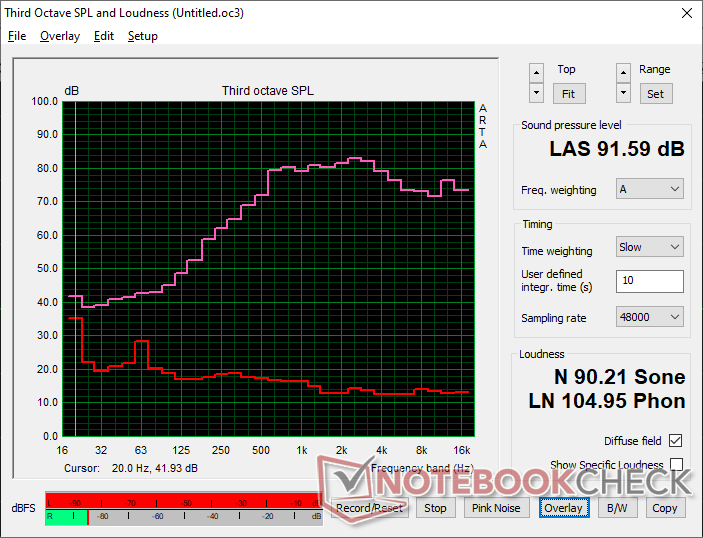
Dell Pro Max 16 Plus ljudanalys
(+) | högtalare kan spela relativt högt (91.6 dB)
Bas 100 - 315 Hz
(-) | nästan ingen bas - i genomsnitt 20.9% lägre än medianen
(+) | basen är linjär (5.9% delta till föregående frekvens)
Mellan 400 - 2000 Hz
(+) | balanserad mellan - endast 4.5% från medianen
(+) | mids är linjära (4% delta till föregående frekvens)
Högsta 2 - 16 kHz
(+) | balanserade toppar - endast 3.7% från medianen
(+) | toppar är linjära (2.9% delta till föregående frekvens)
Totalt 100 - 16 000 Hz
(+) | det totala ljudet är linjärt (14.3% skillnad mot median)
Jämfört med samma klass
» 30% av alla testade enheter i den här klassen var bättre, 4% liknande, 67% sämre
» Den bästa hade ett delta på 7%, genomsnittet var 17%, sämst var 35%
Jämfört med alla testade enheter
» 17% av alla testade enheter var bättre, 4% liknande, 78% sämre
» Den bästa hade ett delta på 4%, genomsnittet var 23%, sämst var 134%
Apple MacBook Pro 16 2021 M1 Pro ljudanalys
(+) | högtalare kan spela relativt högt (84.7 dB)
Bas 100 - 315 Hz
(+) | bra bas - bara 3.8% från medianen
(+) | basen är linjär (5.2% delta till föregående frekvens)
Mellan 400 - 2000 Hz
(+) | balanserad mellan - endast 1.3% från medianen
(+) | mids är linjära (2.1% delta till föregående frekvens)
Högsta 2 - 16 kHz
(+) | balanserade toppar - endast 1.9% från medianen
(+) | toppar är linjära (2.7% delta till föregående frekvens)
Totalt 100 - 16 000 Hz
(+) | det totala ljudet är linjärt (4.6% skillnad mot median)
Jämfört med samma klass
» 0% av alla testade enheter i den här klassen var bättre, 0% liknande, 100% sämre
» Den bästa hade ett delta på 5%, genomsnittet var 17%, sämst var 45%
Jämfört med alla testade enheter
» 0% av alla testade enheter var bättre, 0% liknande, 100% sämre
» Den bästa hade ett delta på 4%, genomsnittet var 23%, sämst var 134%
Energiförvaltning
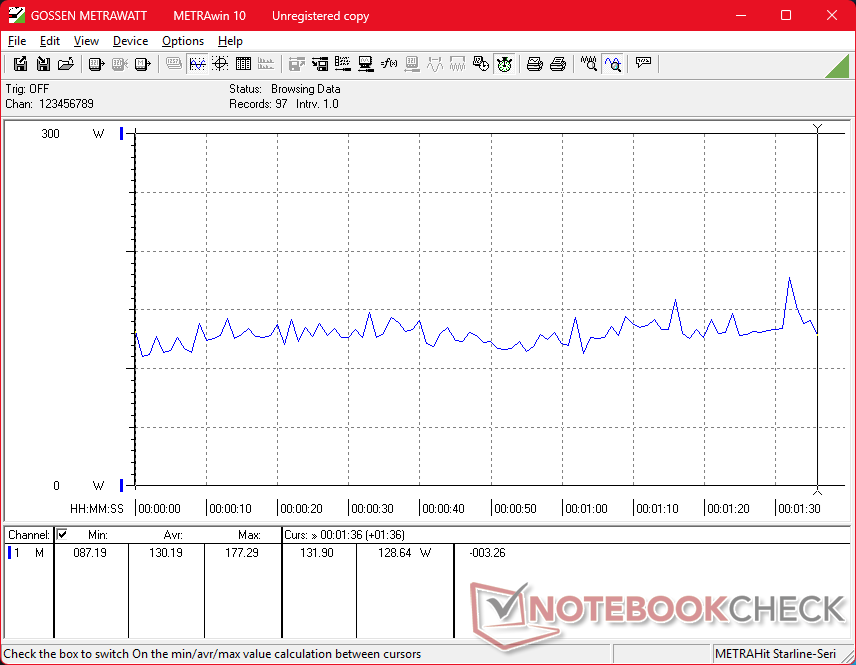
Strömförbrukning
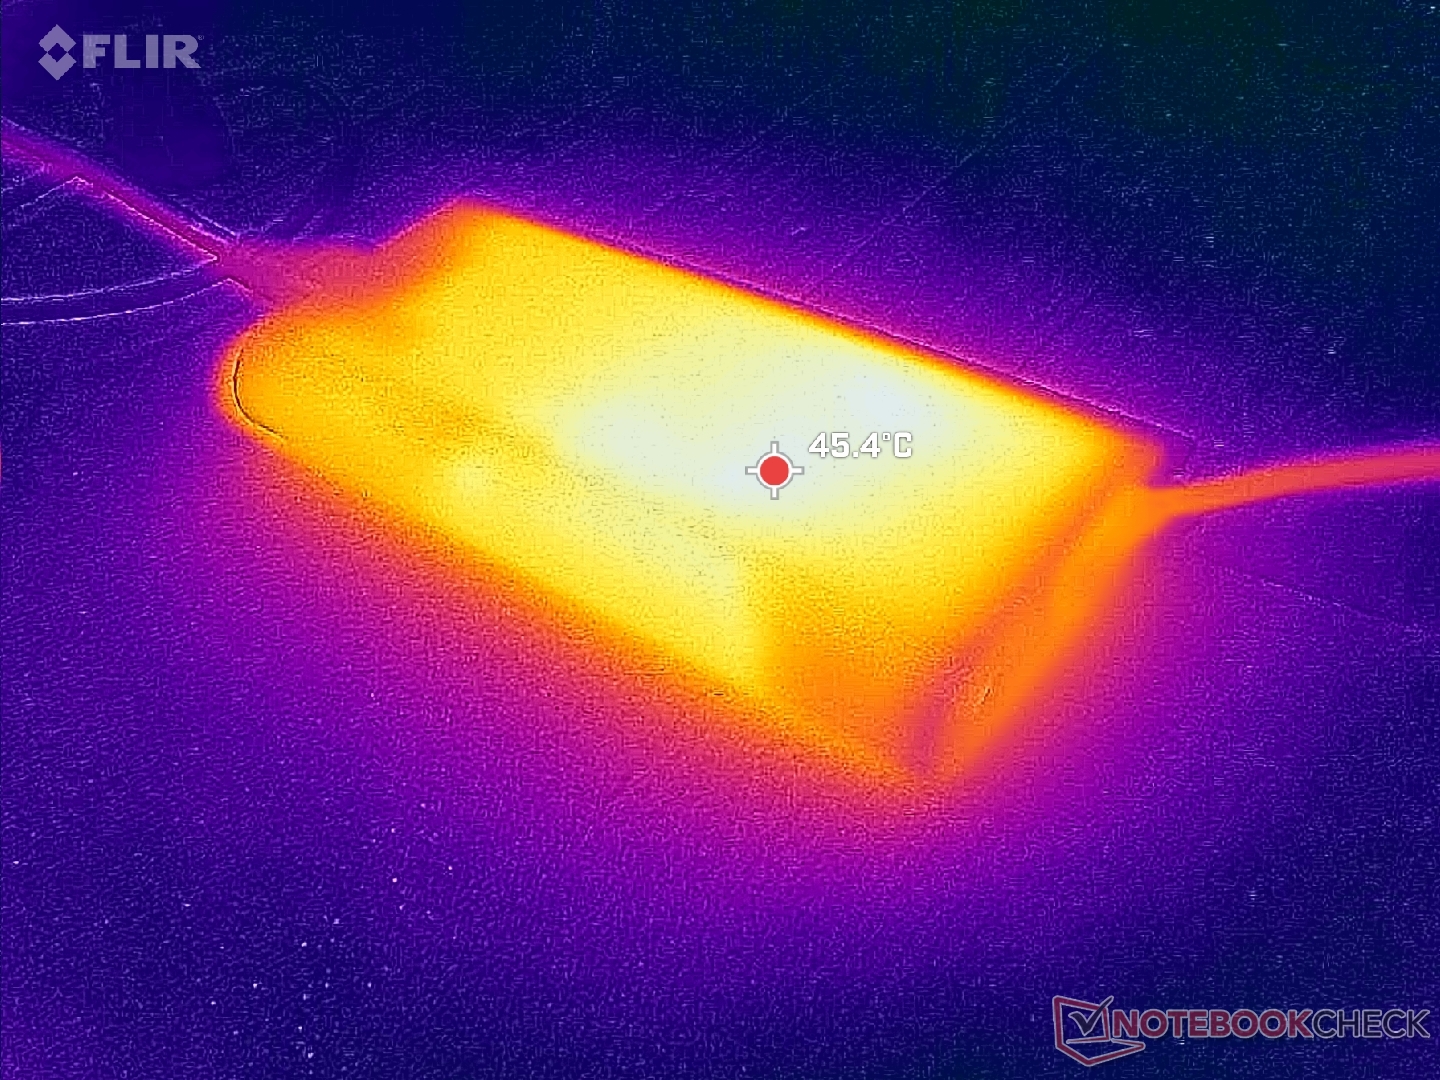
Förbrukningen är som väntat mycket hög även vid tomgångskörning på skrivbordet, vilket bidrar till den lägre batteritiden och de alltid varma ytorna. Systemet är märkbart mer krävande än den utgående Precision 5690, men prestandan är både snabbare och jämnare, vilket är en rättvis avvägning.
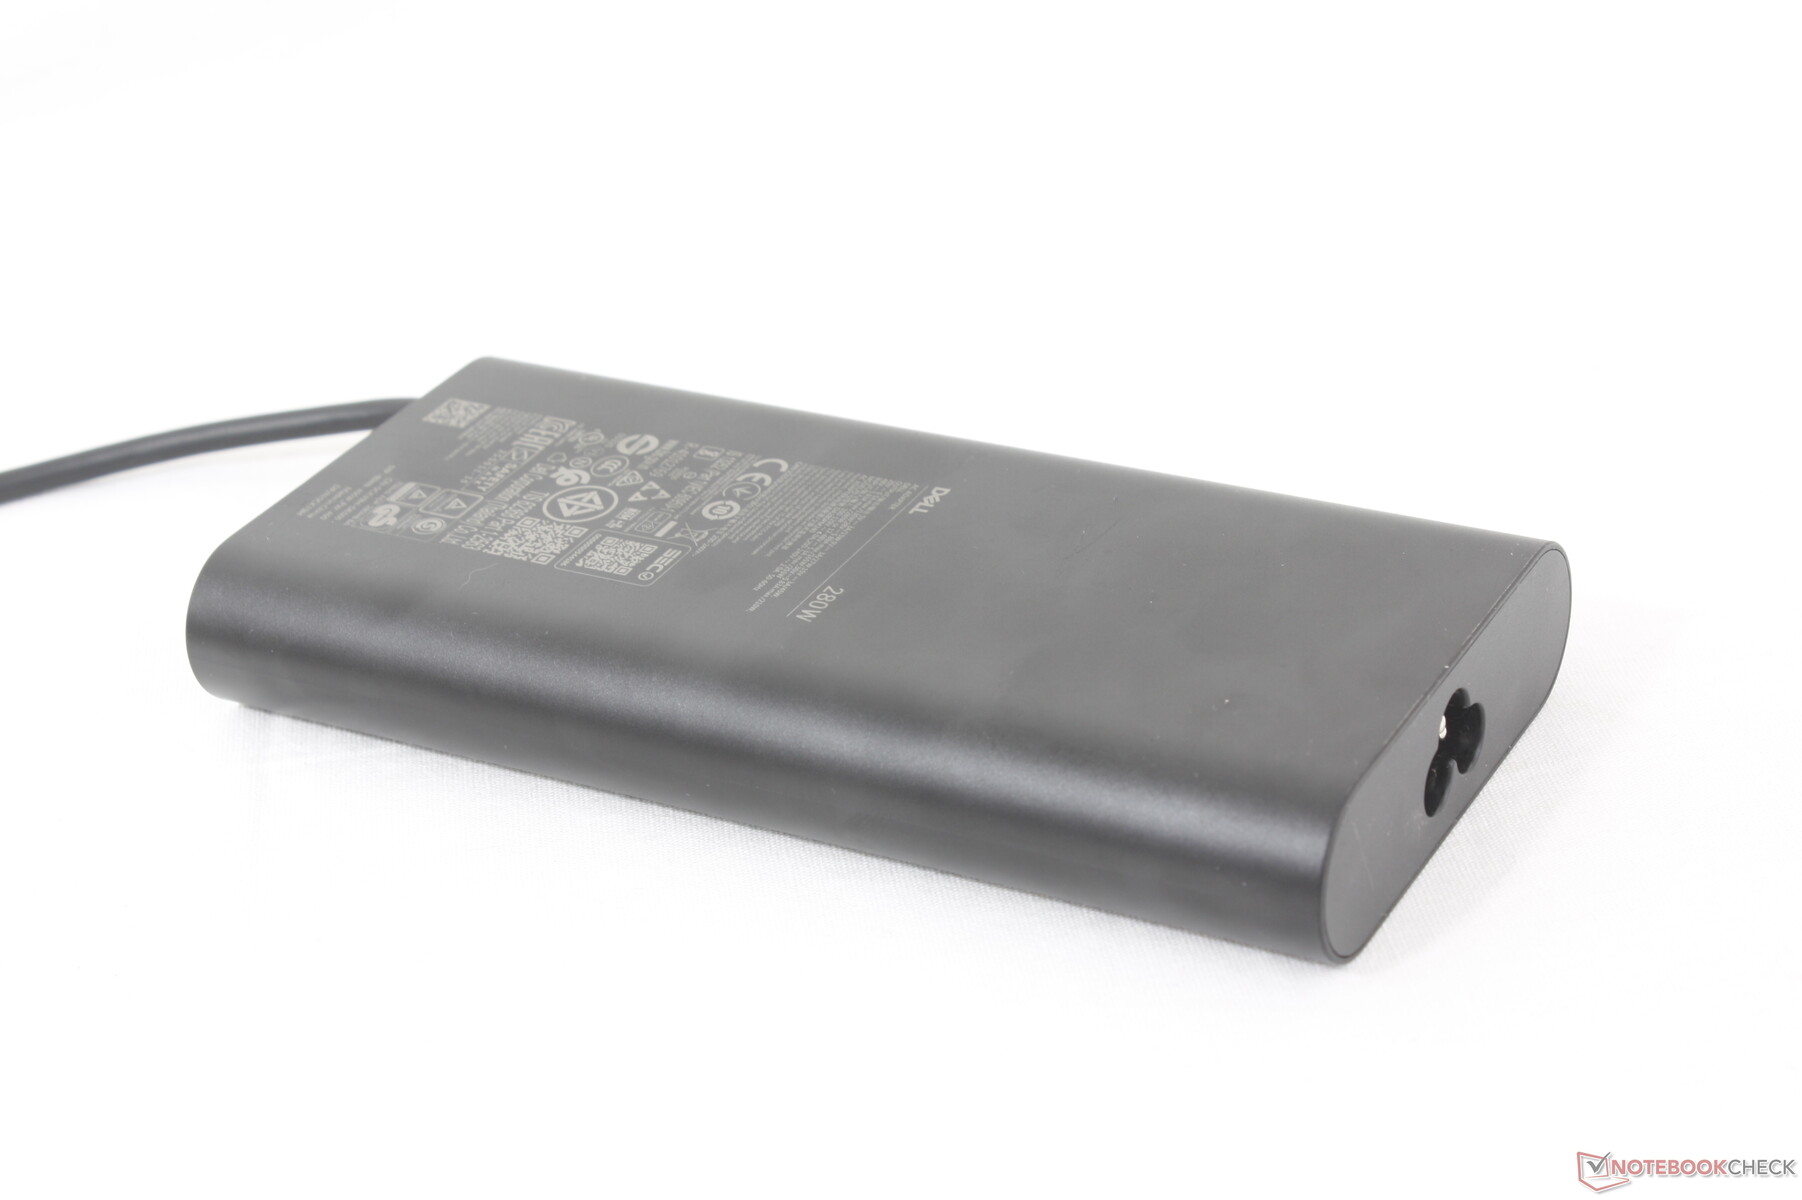
Det är värt att notera att detta är en av de enda bärbara datorer som levereras med en tunn (~16 x 7,8 x 2,4 cm) 280 W USB-C AC-adapter, eftersom de flesta andra USB-C-adaptrar ligger i intervallet 150 W till 240 W.
| Av/Standby | |
| Låg belastning | |
| Hög belastning |
|
Förklaring:
min: | |
| Dell Pro Max 16 Plus Ultra 9 285HX, RTX PRO 5000 Blackwell Generation Laptop, SK hynix PCB01 HFS001TFM9X186N, OLED, 3840x2400, 16" | Dell Precision 5690 Ultra 9 185H, RTX 5000 Ada Generation Laptop, 2x Samsung PM9A1 1TB (RAID 0), OLED, 3840x2400, 16" | Dell Precision 5000 5680 i9-13900H, RTX 5000 Ada Generation Laptop, 2x SK hynix PC801 HFS512GEJ9X101N RAID 0, OLED, 3840x2400, 16" | Lenovo ThinkPad P16 Gen 2 i7-14700HX, RTX 4000 Ada Generation Laptop, SK hynix PC801 HFS001TEJ9X162N, IPS, 2560x1600, 16" | Lenovo ThinkPad P1 Gen 7 21KV001SGE Ultra 7 155H, GeForce RTX 4060 Laptop GPU, Kioxia XG8 KXG8AZNV1T02, IPS LED, 2560x1600, 16" | HP ZBook Studio 16 G11 Ultra 9 185H, RTX 3000 Ada Generation Laptop, Kioxia XG8 KXG80ZNV1T02, IPS, 3840x2400, 16" | MSI CreatorPro Z16P B12UKST i7-12700H, RTX A3000 Laptop GPU, Samsung PM9A1 MZVL21T0HCLR, IPS, 2560x1600, 16" | |
|---|---|---|---|---|---|---|---|
| Power Consumption | 52% | 55% | 31% | 55% | 47% | 50% | |
| Idle Minimum * (Watt) | 35.1 | 7.9 77% | 8 77% | 7.9 77% | 7.3 79% | 14 60% | 10.8 69% |
| Idle Average * (Watt) | 39.2 | 12 69% | 10.4 73% | 13.1 67% | 12.3 69% | 22.4 43% | 16.3 58% |
| Idle Maximum * (Watt) | 56 | 28.6 49% | 30.5 46% | 24.2 57% | 17.9 68% | 25.7 54% | 16.9 70% |
| Load Average * (Watt) | 130.2 | 98.8 24% | 75.4 42% | 127.4 2% | 78.2 40% | 90.2 31% | 111.7 14% |
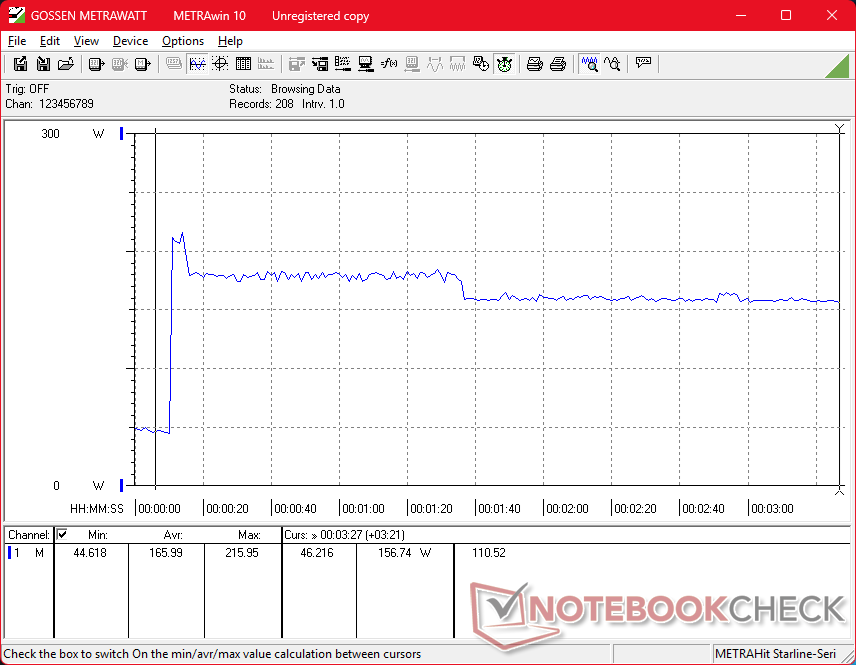
| Cyberpunk 2077 ultra external monitor * (Watt) | 213 | 219 -3% | 117.7 45% | 120.3 44% | |||
| Cyberpunk 2077 ultra * (Watt) | 229 | 225 2% | 123.5 46% | 125.4 45% | |||
| Load Maximum * (Watt) | 285.2 | 174.8 39% | 175 39% | 248.5 13% | 167.5 41% | 142 50% | 177.4 38% |
| Witcher 3 ultra * (Watt) | 144.5 | 134 | 152.1 |
* ... mindre är bättre
Strömförbrukning Cyberpunk / Stresstest
Strömförbrukning extern monitor
Batteritid
Drifttiden för WLAN är kort, endast 3,5 timmar, trots den stora batterikapaciteten. Laddningshastigheten är ändå mycket snabb, särskilt för en USB-C AC-adapter, med drygt en timme från tom till full kapacitet.
| Dell Pro Max 16 Plus Ultra 9 285HX, RTX PRO 5000 Blackwell Generation Laptop, 96 Wh | Dell Precision 5690 Ultra 9 185H, RTX 5000 Ada Generation Laptop, 98 Wh | Dell Precision 5000 5680 i9-13900H, RTX 5000 Ada Generation Laptop, 98 Wh | Lenovo ThinkPad P16 Gen 2 i7-14700HX, RTX 4000 Ada Generation Laptop, 94 Wh | Lenovo ThinkPad P1 Gen 7 21KV001SGE Ultra 7 155H, GeForce RTX 4060 Laptop GPU, 90 Wh | HP ZBook Studio 16 G11 Ultra 9 185H, RTX 3000 Ada Generation Laptop, 86 Wh | MSI CreatorPro Z16P B12UKST i7-12700H, RTX A3000 Laptop GPU, 90 Wh | |
|---|---|---|---|---|---|---|---|
| Batteridrifttid | 156% | 175% | -31% | 175% | 33% | 61% | |
| WiFi v1.3 (h) | 3.6 | 9.2 156% | 9.9 175% | 2.5 -31% | 9.9 175% | 4.8 33% | 5.8 61% |
| Reader / Idle (h) | 17.9 | ||||||
| Load (h) | 1.7 | 1.9 |
Notebookcheck Betyg
Flaggskeppet bland Dells arbetsstationer med unika specifikationer som CAMM2-minne, 4K 120 Hz OLED, Arrow Lake-HX-processorer och RTX 5000 Blackwell-grafik.
Dell Pro Max 16 Plus
- 10/14/2025 v8
Allen Ngo
 Total Sustainability Score:
 Potentiella konkurrenter i jämförelse
Bild | Modell / recensioner | Pris | Vikt | Höjd | Skärm |
|---|---|---|---|---|---|
1. 88.4%  | Dell Pro Max 16 Plus Intel Core Ultra 9 285HX ⎘ NVIDIA RTX PRO 5000 Blackwell Generation Laptop ⎘ 128 GB Minne, SSD | Amazon: Listpris: 5000 USD | 2.8 kg | 30.9 mm | 16.00" 3840x2400 283 PPI OLED |
2. 88.3% v7 (old)  | Dell Precision 5690 Intel Core Ultra 9 185H ⎘ NVIDIA RTX 5000 Ada Generation Laptop ⎘ 32 GB Minne, 2048 GB SSD | Amazon: Listpris: 5900 USD | 2.3 kg | 22.17 mm | 16.00" 3840x2400 283 PPI OLED |
3. 89% v7 (old)  | Dell Precision 5000 5680 Intel Core i9-13900H ⎘ NVIDIA RTX 5000 Ada Generation Laptop ⎘ 32 GB Minne, 1024 GB SSD | Amazon: 1. $1,299.99 Dell Precision 5000 5680 Wor... 2. $1,699.00 Dell Precision 5000 5680 16"... 3. $2,200.00 Dell Precision 5000 5680 16"... Listpris: 6500 USD | 2.3 kg | 22.17 mm | 16.00" 3840x2400 283 PPI OLED |
4. 85.9%  | Lenovo ThinkPad P16 Gen 2 Intel Core i7-14700HX ⎘ NVIDIA RTX 4000 Ada Generation Laptop ⎘ 32 GB Minne, 1024 GB SSD | Amazon: Listpris: 3500 USD | 3.1 kg | 30.23 mm | 16.00" 2560x1600 189 PPI IPS |
5. 83.5%  | Lenovo ThinkPad P1 Gen 7 21KV001SGE Intel Core Ultra 7 155H ⎘ NVIDIA GeForce RTX 4060 Laptop GPU ⎘ 32 GB Minne, 1024 GB SSD | Amazon: Listpris: 3239 Euro | 2 kg | 20.5 mm | 16.00" 2560x1600 189 PPI IPS LED |
6. 84.2%  | HP ZBook Studio 16 G11 Intel Core Ultra 9 185H ⎘ NVIDIA RTX 3000 Ada Generation Laptop ⎘ 64 GB Minne, 1024 GB SSD | Amazon: Listpris: 4300 USD | 1.8 kg | 19 mm | 16.00" 3840x2400 283 PPI IPS |
7. 84.3% v7 (old)  | MSI CreatorPro Z16P B12UKST Intel Core i7-12700H ⎘ NVIDIA RTX A3000 Laptop GPU ⎘ 32 GB Minne, 1024 GB SSD | Amazon: Listpris: 3500€ | 2.4 kg | 19 mm | 16.00" 2560x1600 189 PPI IPS |
Genomskinlighet
Valet av enheter som ska granskas görs av vår redaktion. Testprovet gavs till författaren som ett lån av tillverkaren eller återförsäljaren för denna recension. Långivaren hade inget inflytande på denna recension och inte heller fick tillverkaren en kopia av denna recension innan publiceringen. Det fanns ingen skyldighet att publicera denna recension. Som ett oberoende medieföretag är Notebookcheck inte föremål för auktoritet från tillverkare, återförsäljare eller förlag.
This is how Notebookcheck is testingEvery year, Notebookcheck independently reviews hundreds of laptops and smartphones using standardized procedures to ensure that all results are comparable. We have continuously developed our test methods for around 20 years and set industry standards in the process. In our test labs, high-quality measuring equipment is utilized by experienced technicians and editors. These tests involve a multi-stage validation process. Our complex rating system is based on hundreds of well-founded measurements and benchmarks, which maintains objectivity.

