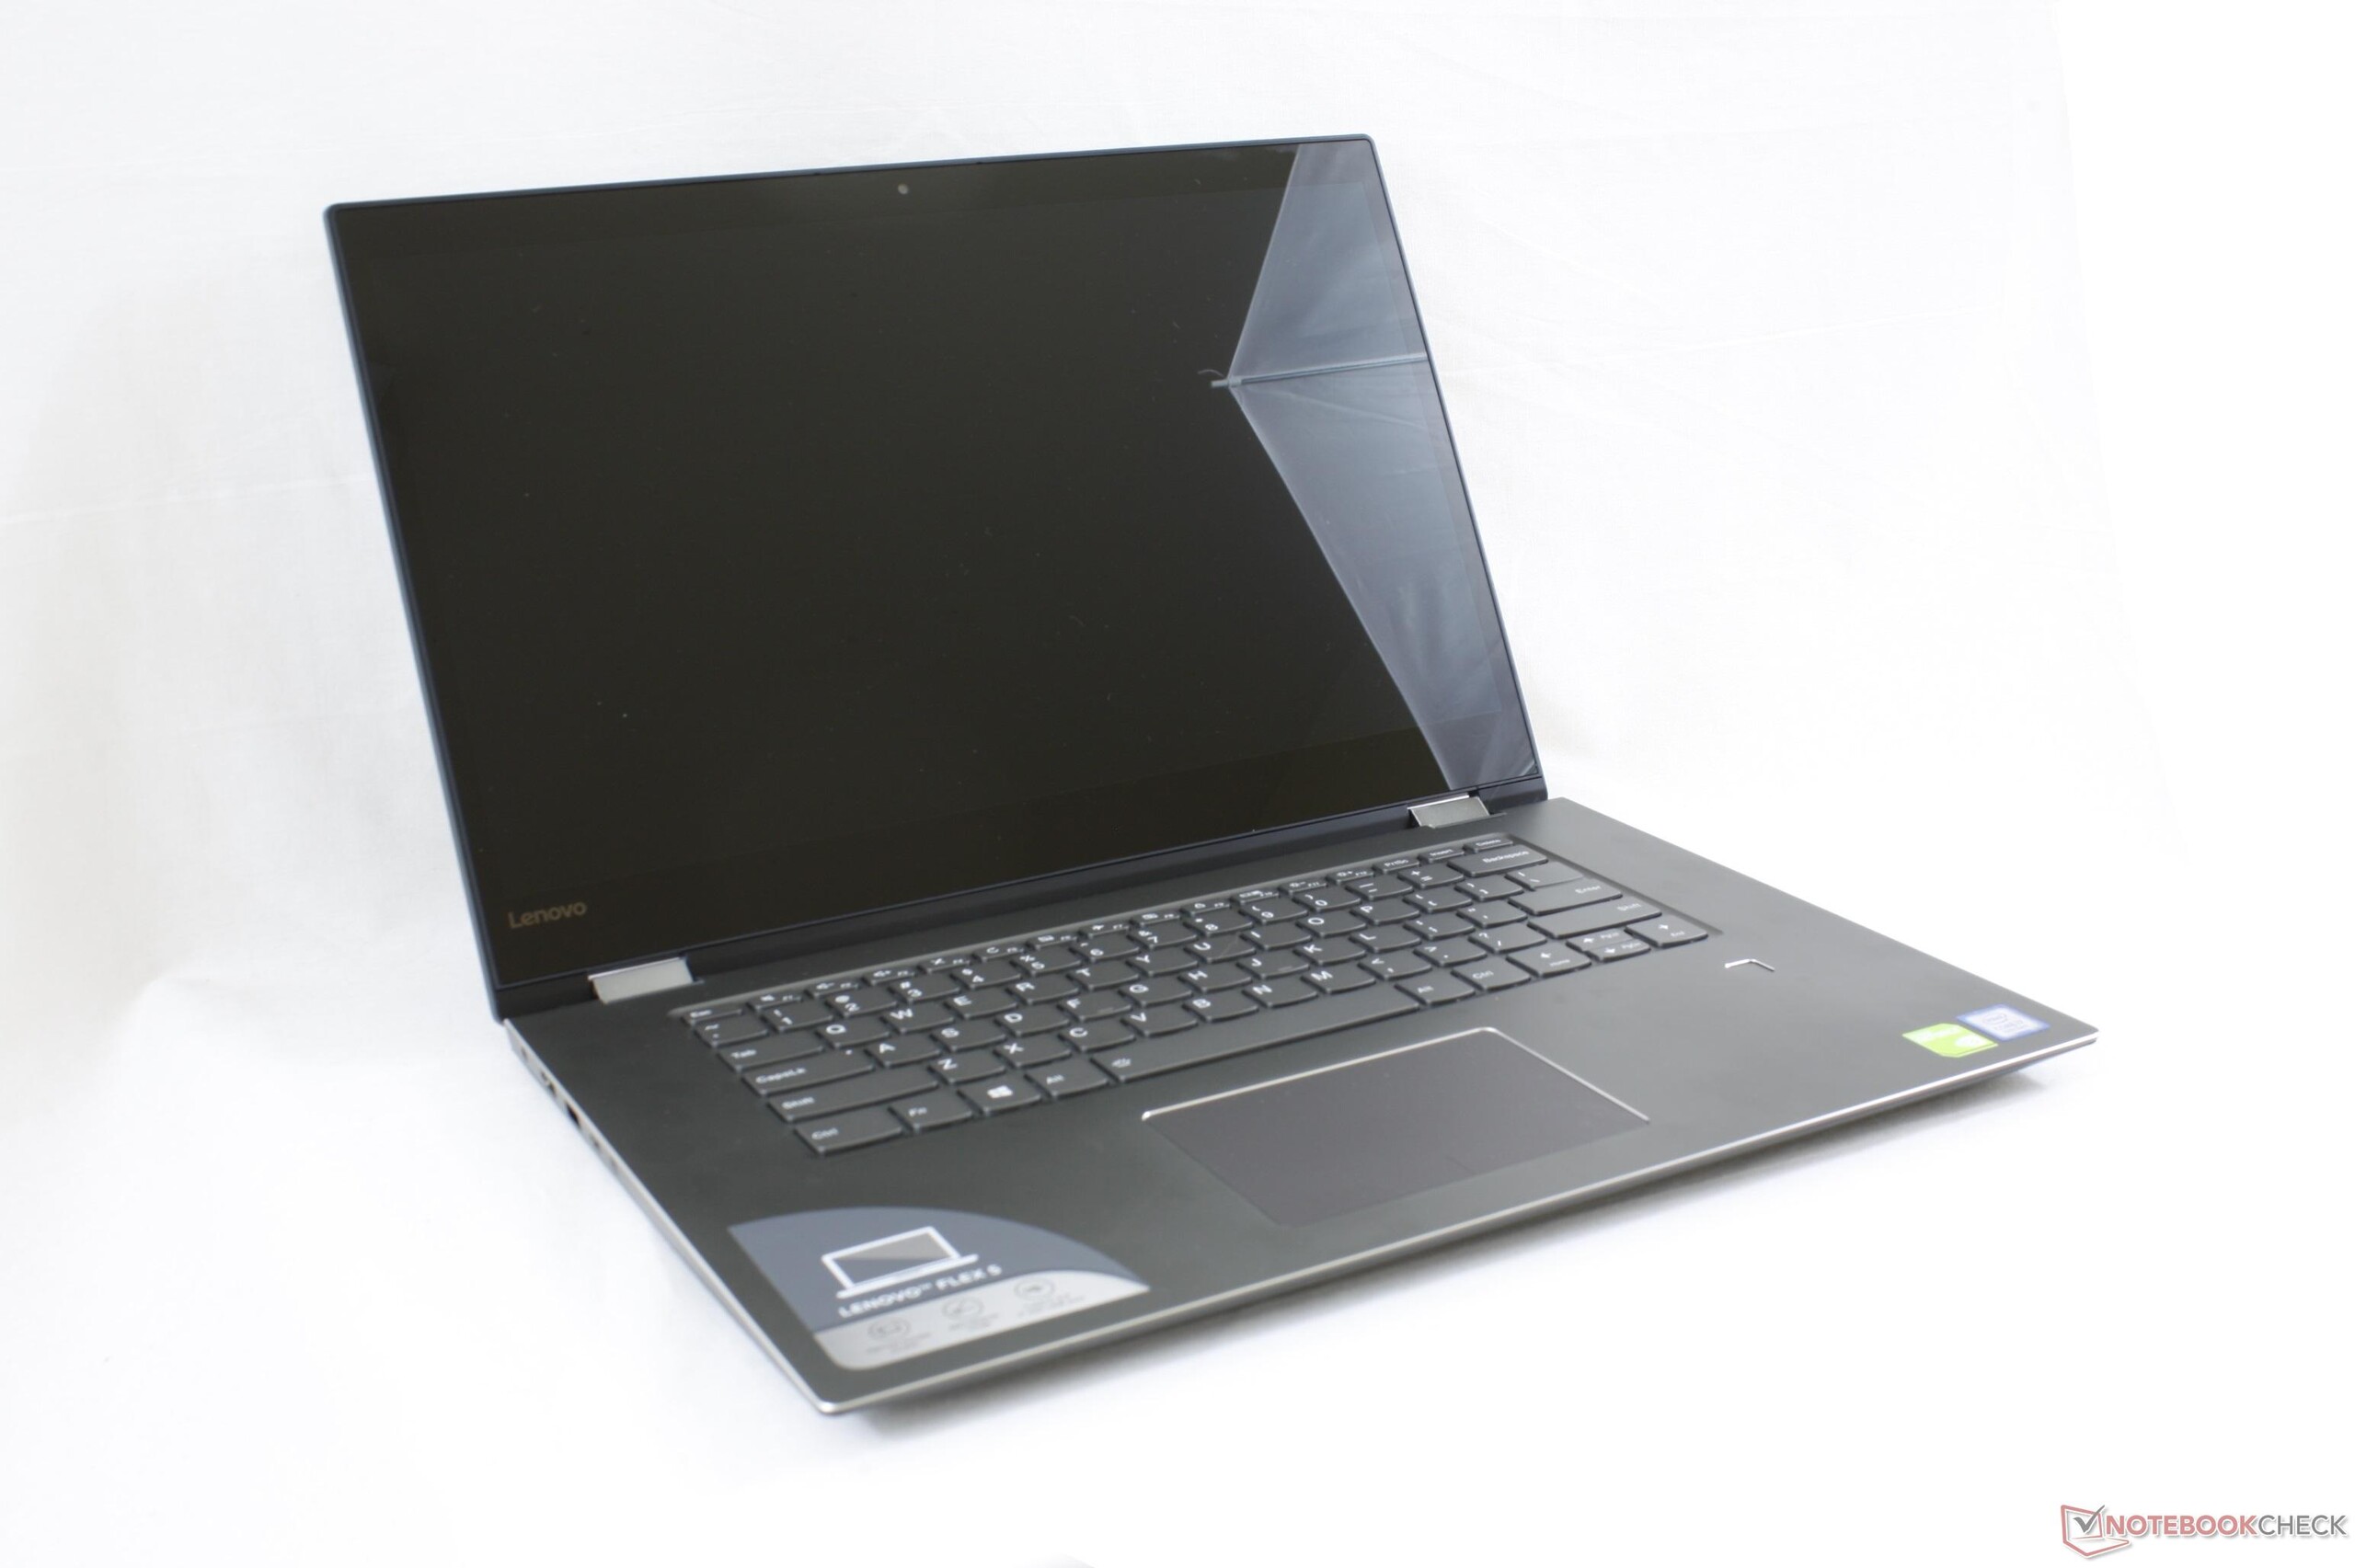
Test: Lenovo Flex 5 15 (i7-8550U, GeForce MX130) Omvandlingsbar (Sammanfattning)
| SD Card Reader | |
| average JPG Copy Test (av. of 3 runs) | |
| Dell XPS 15 9575 i7-8705G (Toshiba Exceria Pro M501 UHS-II) | |
| Lenovo IdeaPad Flex-1570 81CA000RUS (Toshiba Exceria Pro SDXC 64 GB UHS-II) | |
| HP Pavilion 15-cs0053cl (Toshiba Exceria Pro SDXC 64 GB UHS-II) | |
| Lenovo Ideapad 530S-15IKB (Toshiba Exceria Pro SDXC 64 GB UHS-II) | |
| maximum AS SSD Seq Read Test (1GB) | |
| Dell XPS 15 9575 i7-8705G (Toshiba Exceria Pro M501 UHS-II) | |
| Lenovo IdeaPad Flex-1570 81CA000RUS (Toshiba Exceria Pro SDXC 64 GB UHS-II) | |
| HP Pavilion 15-cs0053cl (Toshiba Exceria Pro SDXC 64 GB UHS-II) | |
| Lenovo Ideapad 530S-15IKB (Toshiba Exceria Pro SDXC 64 GB UHS-II) | |
| |||||||||||||||||||||||||
Distribution av ljusstyrkan: 82 %
Mitt på batteriet: 196.3 cd/m²
Kontrast: 755:1 (Svärta: 0.26 cd/m²)
ΔE ColorChecker Calman: 6.97 | ∀{0.5-29.43 Ø4.71}
calibrated: 4.85
ΔE Greyscale Calman: 6.1 | ∀{0.09-98 Ø4.96}
57.7% sRGB (Argyll 1.6.3 3D)
37.4% AdobeRGB 1998 (Argyll 1.6.3 3D)
41.77% AdobeRGB 1998 (Argyll 3D)
58.2% sRGB (Argyll 3D)
40.43% Display P3 (Argyll 3D)
Gamma: 2.2
CCT: 5800 K
| Lenovo IdeaPad Flex-1570 81CA000RUS NV156FHM-N48, IPS, 15.6", 1920x1080 | Dell XPS 15 9575 i7-8705G Sharp SHP148D, IPS, 15.6", 3840x2160 | Lenovo Ideapad 530S-15IKB N156HCA-EAB, IPS, 15.6", 1920x1080 | Huawei MateBook D 15-53010BAJ AU Optronics B156HW02, IPS, 15.6", 1920x1080 | Asus ZenBook Flip 15 UX561UD B156ZAN03.1, IPS, 15.6", 3840x2160 | Acer Swift 3 SF315-41G-R6BR BOE CQ NV156FHM-N48, IPS, 15.6", 1920x1080 | |
|---|---|---|---|---|---|---|
| Display | 84% | 5% | 2% | 108% | -0% | |
| Display P3 Coverage (%) | 40.43 | 78.7 95% | 41.84 3% | 40.96 1% | 86.6 114% | 40.1 -1% |
| sRGB Coverage (%) | 58.2 | 97.9 68% | 62.4 7% | 60.9 5% | 100 72% | 59 1% |
| AdobeRGB 1998 Coverage (%) | 41.77 | 79.2 90% | 43.32 4% | 42.24 1% | 99.5 138% | 41.43 -1% |
| Response Times | -24% | -5% | 5% | -19% | -9% | |
| Response Time Grey 50% / Grey 80% * (ms) | 37.6 ? | 48.4 ? -29% | 37.2 ? 1% | 36.4 ? 3% | 52 ? -38% | 43 ? -14% |
| Response Time Black / White * (ms) | 29.2 ? | 34.8 ? -19% | 32.4 ? -11% | 27.2 ? 7% | 29 ? 1% | 30 ? -3% |
| PWM Frequency (Hz) | 21190 ? | 1000 ? | 25770 ? | 1471 ? | ||
| Screen | 72% | 23% | 16% | 63% | 29% | |
| Brightness middle (cd/m²) | 196.3 | 488 149% | 285.1 45% | 265.7 35% | 380 94% | 284 45% |
| Brightness (cd/m²) | 185 | 440 138% | 271 46% | 258 39% | 371 101% | 254 37% |
| Brightness Distribution (%) | 82 | 81 -1% | 88 7% | 91 11% | 87 6% | 80 -2% |
| Black Level * (cd/m²) | 0.26 | 0.3 -15% | 0.28 -8% | 0.31 -19% | 0.28 -8% | 0.29 -12% |
| Contrast (:1) | 755 | 1627 115% | 1018 35% | 857 14% | 1357 80% | 979 30% |
| Colorchecker dE 2000 * | 6.97 | 3.16 55% | 4.38 37% | 6.01 14% | 4.38 37% | 4.22 39% |
| Colorchecker dE 2000 max. * | 25.53 | 8.8 66% | 24.07 6% | 18.87 26% | 7.59 70% | 9.29 64% |
| Colorchecker dE 2000 calibrated * | 4.85 | 3.95 19% | 3.94 19% | |||
| Greyscale dE 2000 * | 6.1 | 3.3 46% | 3.1 49% | 5 18% | 3.6 41% | 1.17 81% |
| Gamma | 2.2 100% | 2.178 101% | 2.24 98% | 2.7 81% | 2.32 95% | 2.39 92% |
| CCT | 5800 112% | 6811 95% | 6705 97% | 6569 99% | 6860 95% | 6360 102% |
| Color Space (Percent of AdobeRGB 1998) (%) | 37.4 | 71.7 92% | 40 7% | 42.24 13% | 88 135% | 38 2% |
| Color Space (Percent of sRGB) (%) | 57.7 | 97.9 70% | 62 7% | 60.92 6% | 100 73% | 59 2% |
| Totalt genomsnitt (program/inställningar) | 44% /
61% | 8% /
16% | 8% /
12% | 51% /
61% | 7% /
18% |
* ... mindre är bättre
Visa svarstider
| ↔ Svarstid svart till vitt | ||
|---|---|---|
| 29.2 ms ... stiga ↗ och falla ↘ kombinerat | ↗ 17.6 ms stiga | 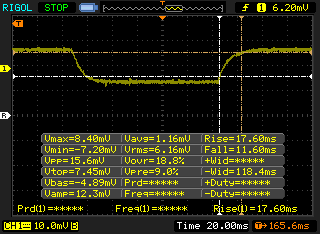 |
| ↘ 11.6 ms hösten | ||
| Skärmen visar relativt långsamma svarsfrekvenser i våra tester och kan vara för långsam för spelare. I jämförelse sträcker sig alla testade enheter från 0.1 (minst) till 240 (maximalt) ms. » 78 % av alla enheter är bättre. Detta innebär att den uppmätta svarstiden är sämre än genomsnittet av alla testade enheter (19.8 ms). | ||
| ↔ Svarstid 50 % grått till 80 % grått | ||
| 37.6 ms ... stiga ↗ och falla ↘ kombinerat | ↗ 19.2 ms stiga | 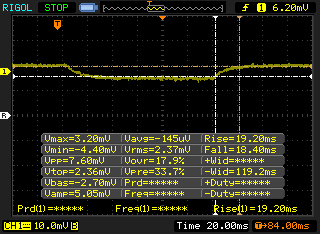 |
| ↘ 18.4 ms hösten | ||
| Skärmen visar långsamma svarsfrekvenser i våra tester och kommer att vara otillfredsställande för spelare. I jämförelse sträcker sig alla testade enheter från 0.165 (minst) till 636 (maximalt) ms. » 55 % av alla enheter är bättre. Detta innebär att den uppmätta svarstiden är sämre än genomsnittet av alla testade enheter (30.9 ms). | ||
Skärmflimmer / PWM (Puls-Width Modulation)
| Skärmflimmer / PWM upptäckt | 21190 Hz | ≤ 99 % ljusstyrka inställning | 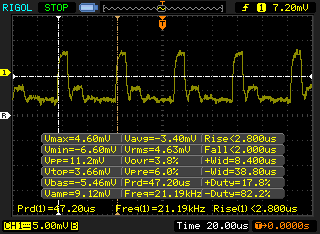 |
Displayens bakgrundsbelysning flimrar vid 21190 Hz (i värsta fall, t.ex. med PWM) Flimrande upptäckt vid en ljusstyrkeinställning på 99 % och lägre. Det ska inte finnas något flimmer eller PWM över denna ljusstyrkeinställning. Frekvensen för 21190 Hz är ganska hög, så de flesta användare som är känsliga för PWM bör inte märka något flimmer. Som jämförelse: 52 % av alla testade enheter använder inte PWM för att dämpa skärmen. Om PWM upptäcktes mättes ett medelvärde av 7748 (minst: 5 - maximum: 343500) Hz. | |||
| Cinebench R15 | |
| CPU Single 64Bit | |
| Lenovo ThinkPad P52 20MAS03N00 | |
| Genomsnitt Intel Core i7-8550U (108 - 172, n=76) | |
| Lenovo Legion Y520-15IKBA-80WY001VGE | |
| Lenovo ThinkPad 13 20J1005TPB | |
| Lenovo Ideapad 530S-15IKB | |
| Lenovo Ideapad 720S-13ARR | |
| Lenovo Ideapad 720S-13ARR | |
| Lenovo IdeaPad Flex-1570 81CA000RUS | |
| Lenovo IdeaPad Miix 320-10ICR Pro LTE | |
| CPU Multi 64Bit | |
| Lenovo ThinkPad P52 20MAS03N00 | |
| Genomsnitt Intel Core i7-8550U (301 - 761, n=78) | |
| Lenovo Ideapad 720S-13ARR | |
| Lenovo Ideapad 720S-13ARR | |
| Lenovo IdeaPad Flex-1570 81CA000RUS | |
| Lenovo Ideapad 530S-15IKB | |
| Lenovo Legion Y520-15IKBA-80WY001VGE | |
| Lenovo ThinkPad 13 20J1005TPB | |
| Lenovo IdeaPad Miix 320-10ICR Pro LTE | |
| Cinebench R11.5 | |
| CPU Single 64Bit | |
| Lenovo ThinkPad P52 20MAS03N00 | |
| Genomsnitt Intel Core i7-8550U (1.43 - 1.95, n=32) | |
| CPU Multi 64Bit | |
| Lenovo ThinkPad P52 20MAS03N00 | |
| Genomsnitt Intel Core i7-8550U (4.38 - 8.56, n=32) | |
| Cinebench R10 | |
| Rendering Multiple CPUs 32Bit | |
| Lenovo ThinkPad P52 20MAS03N00 | |
| Genomsnitt Intel Core i7-8550U (11694 - 24180, n=31) | |
| Lenovo Ideapad 720S-13ARR | |
| Rendering Single 32Bit | |
| Lenovo ThinkPad P52 20MAS03N00 | |
| Genomsnitt Intel Core i7-8550U (4202 - 8211, n=31) | |
| Lenovo Ideapad 720S-13ARR | |
| wPrime 2.10 - 1024m | |
| Lenovo ThinkPad 13 20J1005TPB | |
| Genomsnitt Intel Core i7-8550U (258 - 435, n=11) | |
* ... mindre är bättre
| PCMark 8 Home Score Accelerated v2 | 3381 poäng | |
| PCMark 8 Work Score Accelerated v2 | 4327 poäng | |
| PCMark 10 Score | 2837 poäng | |
Hjälp | ||
| Lenovo IdeaPad Flex-1570 81CA000RUS SK Hynix PC401 512GB M.2 (HFS512GD9TNG) | Dell XPS 15 9575 i7-8705G SK hynix PC401 NVMe 500 GB | Huawei MateBook D 15-53010BAJ Samsung SSD PM981 MZVLB512HAJQ | Asus ZenBook Flip 15 UX561UD Micron 1100 MTFDDAV256TBN | Lenovo Ideapad 530S-15IKB SK hynix PC401 HFS256GD9TNG | |
|---|---|---|---|---|---|
| AS SSD | 7% | 34% | -58% | -28% | |
| Copy Game MB/s (MB/s) | 684 | 944 38% | 1047 53% | 282.3 -59% | 301.1 -56% |
| Copy Program MB/s (MB/s) | 495.6 | 487.9 -2% | 438.1 -12% | 196.8 -60% | 233.5 -53% |
| Copy ISO MB/s (MB/s) | 1013 | 1523 50% | 1287 27% | 291 -71% | 868 -14% |
| Score Total (Points) | 2123 | 2132 0% | 4225 99% | 844 -60% | 1387 -35% |
| Score Write (Points) | 832 | 807 -3% | 1709 105% | 371 -55% | 415 -50% |
| Score Read (Points) | 860 | 921 7% | 1665 94% | 310 -64% | 690 -20% |
| Access Time Write * (ms) | 0.051 | 0.051 -0% | 0.143 -180% | 0.056 -10% | 0.051 -0% |
| Access Time Read * (ms) | 0.045 | 0.044 2% | 0.043 4% | 0.097 -116% | 0.06 -33% |
| 4K-64 Write (MB/s) | 612 | 637 4% | 1486 143% | 248.5 -59% | 271.6 -56% |
| 4K-64 Read (MB/s) | 660 | 649 -2% | 1455 120% | 235.5 -64% | 431.3 -35% |
| 4K Write (MB/s) | 99.5 | 94.3 -5% | 81.9 -18% | 84.8 -15% | 88.4 -11% |
| 4K Read (MB/s) | 40.59 | 41.38 2% | 53 31% | 25.79 -36% | 38.69 -5% |
| Seq Write (MB/s) | 1209 | 752 -38% | 1411 17% | 379.3 -69% | 550 -55% |
| Seq Read (MB/s) | 1596 | 2302 44% | 1567 -2% | 488 -69% | 2205 38% |
* ... mindre är bättre

| 3DMark 11 | |
| 1280x720 Performance GPU | |
| Lenovo Yoga 730-15IKB | |
| Lenovo ThinkPad T580-20LAS01H00 | |
| Genomsnitt NVIDIA GeForce MX130 (2476 - 3203, n=14) | |
| Lenovo ThinkPad 25 | |
| Lenovo Ideapad 720S-13ARR | |
| Lenovo IdeaPad Flex-1570 81CA000RUS | |
| Lenovo IdeaPad 510S-14ISK | |
| Lenovo Ideapad 720S-13ARR | |
| 1280x720 Performance Combined | |
| Lenovo Yoga 730-15IKB | |
| Lenovo ThinkPad T580-20LAS01H00 | |
| Lenovo ThinkPad 25 | |
| Lenovo IdeaPad Flex-1570 81CA000RUS | |
| Genomsnitt NVIDIA GeForce MX130 (2169 - 3031, n=13) | |
| Lenovo IdeaPad 510S-14ISK | |
| Lenovo Ideapad 720S-13ARR | |
| Lenovo Ideapad 720S-13ARR | |
| 3DMark | |
| 1280x720 Cloud Gate Standard Graphics | |
| Lenovo Yoga 730-15IKB | |
| Lenovo ThinkPad T580-20LAS01H00 | |
| Genomsnitt NVIDIA GeForce MX130 (12166 - 14880, n=13) | |
| Lenovo ThinkPad 25 | |
| Lenovo IdeaPad Flex-1570 81CA000RUS | |
| Lenovo Ideapad 720S-13ARR | |
| Lenovo IdeaPad 510S-14ISK | |
| Lenovo Ideapad 720S-13ARR | |
| 1920x1080 Fire Strike Graphics | |
| Lenovo Yoga 730-15IKB | |
| Lenovo ThinkPad T580-20LAS01H00 | |
| Genomsnitt NVIDIA GeForce MX130 (2149 - 2495, n=13) | |
| Lenovo ThinkPad 25 | |
| Lenovo IdeaPad Flex-1570 81CA000RUS | |
| Lenovo Ideapad 720S-13ARR | |
| Lenovo Ideapad 720S-13ARR | |
| Lenovo IdeaPad 510S-14ISK | |
| 3DMark 11 Performance | 28 poäng | |
| 3DMark Cloud Gate Standard Score | 8662 poäng | |
| 3DMark Fire Strike Score | 1991 poäng | |
Hjälp | ||
| låg | med. | hög | ultra | |
|---|---|---|---|---|
| BioShock Infinite (2013) | 126.9 | 74.2 | 64.4 | 23.1 |
| The Witcher 3 (2015) | 42.7 | 25 | 13.6 | 7.2 |
| Rise of the Tomb Raider (2016) | 51.2 | 28.6 | 15.6 | 12.5 |
Ljudnivå
| Låg belastning |
| 29.6 / 29.6 / 29.6 dB(A) |
| Hög belastning |
| 39.2 / 41.6 dB(A) |
 | ||
30 dB tyst 40 dB(A) hörbar 50 dB(A) högt ljud |
||
min: | ||
| Lenovo IdeaPad Flex-1570 81CA000RUS GeForce MX130, i5-8550U, SK Hynix PC401 512GB M.2 (HFS512GD9TNG) | Dell XPS 15 9575 i7-8705G Vega M GL / 870, i7-8705G, SK hynix PC401 NVMe 500 GB | Lenovo Ideapad 530S-15IKB UHD Graphics 620, i5-8250U, SK hynix PC401 HFS256GD9TNG | Asus ZenBook Flip 15 UX561UD GeForce GTX 1050 Mobile, i5-8550U, Micron 1100 MTFDDAV256TBN | HP Envy x360 15-bq102ng Vega 8, R5 2500U, Samsung PM961 MZVLW256HEHP | |
|---|---|---|---|---|---|
| Noise | 2% | 9% | -1% | -1% | |
| av / miljö * (dB) | 28.2 | 28.2 -0% | 28 1% | 30.4 -8% | 30.13 -7% |
| Idle Minimum * (dB) | 29.6 | 28.2 5% | 28 5% | 31.3 -6% | 30.13 -2% |
| Idle Average * (dB) | 29.6 | 28.2 5% | 28 5% | 31.3 -6% | 30.13 -2% |
| Idle Maximum * (dB) | 29.6 | 28.2 5% | 30.1 -2% | 31.3 -6% | 30.13 -2% |
| Load Average * (dB) | 39.2 | 29 26% | 30.2 23% | 36.4 7% | 38.8 1% |
| Witcher 3 ultra * (dB) | 39.2 | 44.7 -14% | |||
| Load Maximum * (dB) | 41.6 | 47.4 -14% | 33.2 20% | 37.1 11% | 38.8 7% |
* ... mindre är bättre
(-) Den maximala temperaturen på ovansidan är 49 °C / 120 F, jämfört med genomsnittet av 36.8 °C / 98 F , allt från 21 till 71 °C för klassen Multimedia.
(-) Botten värms upp till maximalt 55.2 °C / 131 F, jämfört med genomsnittet av 39.1 °C / 102 F
(+) Vid tomgångsbruk är medeltemperaturen för ovansidan 24.6 °C / 76 F, jämfört med enhetsgenomsnittet på 31.3 °C / ### class_avg_f### F.
(±) När du spelar The Witcher 3 är medeltemperaturen för ovansidan 32.6 °C / 91 F, jämfört med enhetsgenomsnittet på 31.3 °C / ## #class_avg_f### F.
(+) Handledsstöden och pekplattan är kallare än hudtemperaturen med maximalt 31.2 °C / 88.2 F och är därför svala att ta på.
(-) Medeltemperaturen för handledsstödsområdet på liknande enheter var 28.7 °C / 83.7 F (-2.5 °C / -4.5 F).
Lenovo IdeaPad Flex-1570 81CA000RUS ljudanalys
(±) | högtalarljudstyrkan är genomsnittlig men bra (74.3 dB)
Bas 100 - 315 Hz
(±) | reducerad bas - i genomsnitt 14.4% lägre än medianen
(-) | basen är inte linjär (15.7% delta till föregående frekvens)
Mellan 400 - 2000 Hz
(+) | balanserad mellan - endast 4.6% från medianen
(±) | linjäriteten för mids är genomsnittlig (14.5% delta till föregående frekvens)
Högsta 2 - 16 kHz
(+) | balanserade toppar - endast 3% från medianen
(±) | linjäriteten för toppar är genomsnittlig (11.7% delta till föregående frekvens)
Totalt 100 - 16 000 Hz
(±) | linjäriteten för det totala ljudet är genomsnittlig (22.4% skillnad mot median)
Jämfört med samma klass
» 80% av alla testade enheter i den här klassen var bättre, 4% liknande, 16% sämre
» Den bästa hade ett delta på 5%, genomsnittet var 17%, sämst var 45%
Jämfört med alla testade enheter
» 66% av alla testade enheter var bättre, 6% liknande, 29% sämre
» Den bästa hade ett delta på 4%, genomsnittet var 23%, sämst var 134%
Apple MacBook 12 (Early 2016) 1.1 GHz ljudanalys
(+) | högtalare kan spela relativt högt (83.6 dB)
Bas 100 - 315 Hz
(±) | reducerad bas - i genomsnitt 11.3% lägre än medianen
(±) | linjäriteten för basen är genomsnittlig (14.2% delta till föregående frekvens)
Mellan 400 - 2000 Hz
(+) | balanserad mellan - endast 2.4% från medianen
(+) | mids är linjära (5.5% delta till föregående frekvens)
Högsta 2 - 16 kHz
(+) | balanserade toppar - endast 2% från medianen
(+) | toppar är linjära (4.5% delta till föregående frekvens)
Totalt 100 - 16 000 Hz
(+) | det totala ljudet är linjärt (10.2% skillnad mot median)
Jämfört med samma klass
» 7% av alla testade enheter i den här klassen var bättre, 2% liknande, 90% sämre
» Den bästa hade ett delta på 5%, genomsnittet var 18%, sämst var 53%
Jämfört med alla testade enheter
» 5% av alla testade enheter var bättre, 1% liknande, 94% sämre
» Den bästa hade ett delta på 4%, genomsnittet var 23%, sämst var 134%
| Av/Standby | |
| Låg belastning | |
| Hög belastning |
|
Förklaring:
min: | |
| Lenovo IdeaPad Flex-1570 81CA000RUS i5-8550U, GeForce MX130, SK Hynix PC401 512GB M.2 (HFS512GD9TNG), IPS, 1920x1080, 15.6" | Dell XPS 15 9575 i7-8705G i7-8705G, Vega M GL / 870, SK hynix PC401 NVMe 500 GB, IPS, 3840x2160, 15.6" | Huawei MateBook D 15-53010BAJ i5-8250U, GeForce MX150, Samsung SSD PM981 MZVLB512HAJQ, IPS, 1920x1080, 15.6" | HP Pavilion 15-cs0053cl i5-8250U, UHD Graphics 620, Toshiba MQ04ABF100, TN LED, 1366x768, 15.6" | Lenovo Ideapad 530S-15IKB i5-8250U, UHD Graphics 620, SK hynix PC401 HFS256GD9TNG, IPS, 1920x1080, 15.6" | Asus ZenBook Flip 15 UX561UD i5-8550U, GeForce GTX 1050 Mobile, Micron 1100 MTFDDAV256TBN, IPS, 3840x2160, 15.6" | |
|---|---|---|---|---|---|---|
| Power Consumption | -79% | -20% | 7% | 15% | -77% | |
| Idle Minimum * (Watt) | 4.1 | 6.2 -51% | 4.2 -2% | 5.6 -37% | 3.5 15% | 5.4 -32% |
| Idle Average * (Watt) | 7.6 | 12.9 -70% | 7.2 5% | 7.1 7% | 5.6 26% | 10.8 -42% |
| Idle Maximum * (Watt) | 7.9 | 13.6 -72% | 12.1 -53% | 7.9 -0% | 10.3 -30% | 13.9 -76% |
| Load Average * (Watt) | 42.5 | 76.1 -79% | 51.1 -20% | 32.8 23% | 30.5 28% | 94 -121% |
| Witcher 3 ultra * (Watt) | 38.6 | 84.3 -118% | 52.7 -37% | |||
| Load Maximum * (Watt) | 54 | 99.4 -84% | 59.9 -11% | 30.5 44% | 33.8 37% | 116.6 -116% |
* ... mindre är bättre
| Lenovo IdeaPad Flex-1570 81CA000RUS i5-8550U, GeForce MX130, 52.5 Wh | Dell XPS 15 9575 i7-8705G i7-8705G, Vega M GL / 870, 75 Wh | Huawei MateBook D 15-53010BAJ i5-8250U, GeForce MX150, 43.3 Wh | HP Pavilion 15-cs0053cl i5-8250U, UHD Graphics 620, 41 Wh | Lenovo Ideapad 530S-15IKB i5-8250U, UHD Graphics 620, 45 Wh | Asus ZenBook Flip 15 UX561UD i5-8550U, GeForce GTX 1050 Mobile, 52 Wh | |
|---|---|---|---|---|---|---|
| Batteridrifttid | -36% | -25% | -22% | -13% | -44% | |
| Reader / Idle (h) | 18.9 | 11.2 -41% | 15.2 -20% | 12 -37% | 9.3 -51% | |
| WiFi v1.3 (h) | 7.5 | 7 -7% | 7.7 3% | 7 -7% | 6.5 -13% | 5.2 -31% |
| Load (h) | 2.8 | 1.1 -61% | 1.2 -57% | 2.2 -21% | 1.4 -50% |
För
Emot
Läs den fullständiga versionen av den här recensionen på engelska här.
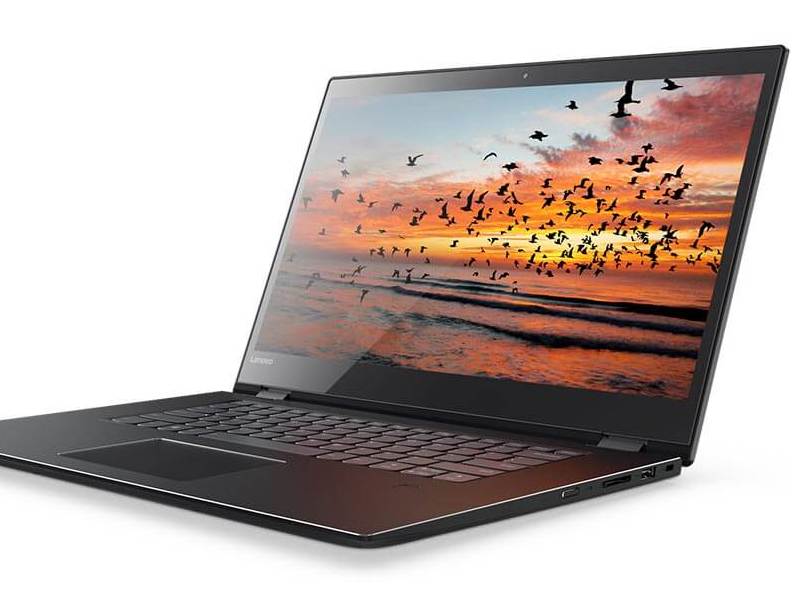
Flex 5 är inte för entusiaster eller användare som behöver mycket prestanda, och det vet Lenovo. Detta är istället ett budgetsystem för hemma-användare som vill använda den till multimedia eller studenter som helt enkelt vill ha en billig Windows-laptop med surfplattefunktioner för filmvisning, ordbehandling och något enklare spel då och då. Den har inga särskilda fördelar framför Pavilion 2-in-1, Vivobook 2-in-1, Envy 2-in-1, eller den tyngre Inspiron 15 2-in-1 utöver att ett långsamt GeForce MX130 GPU finns som tillval. Som en omvandlingsbar för hemmabruk klarar den sig precis.
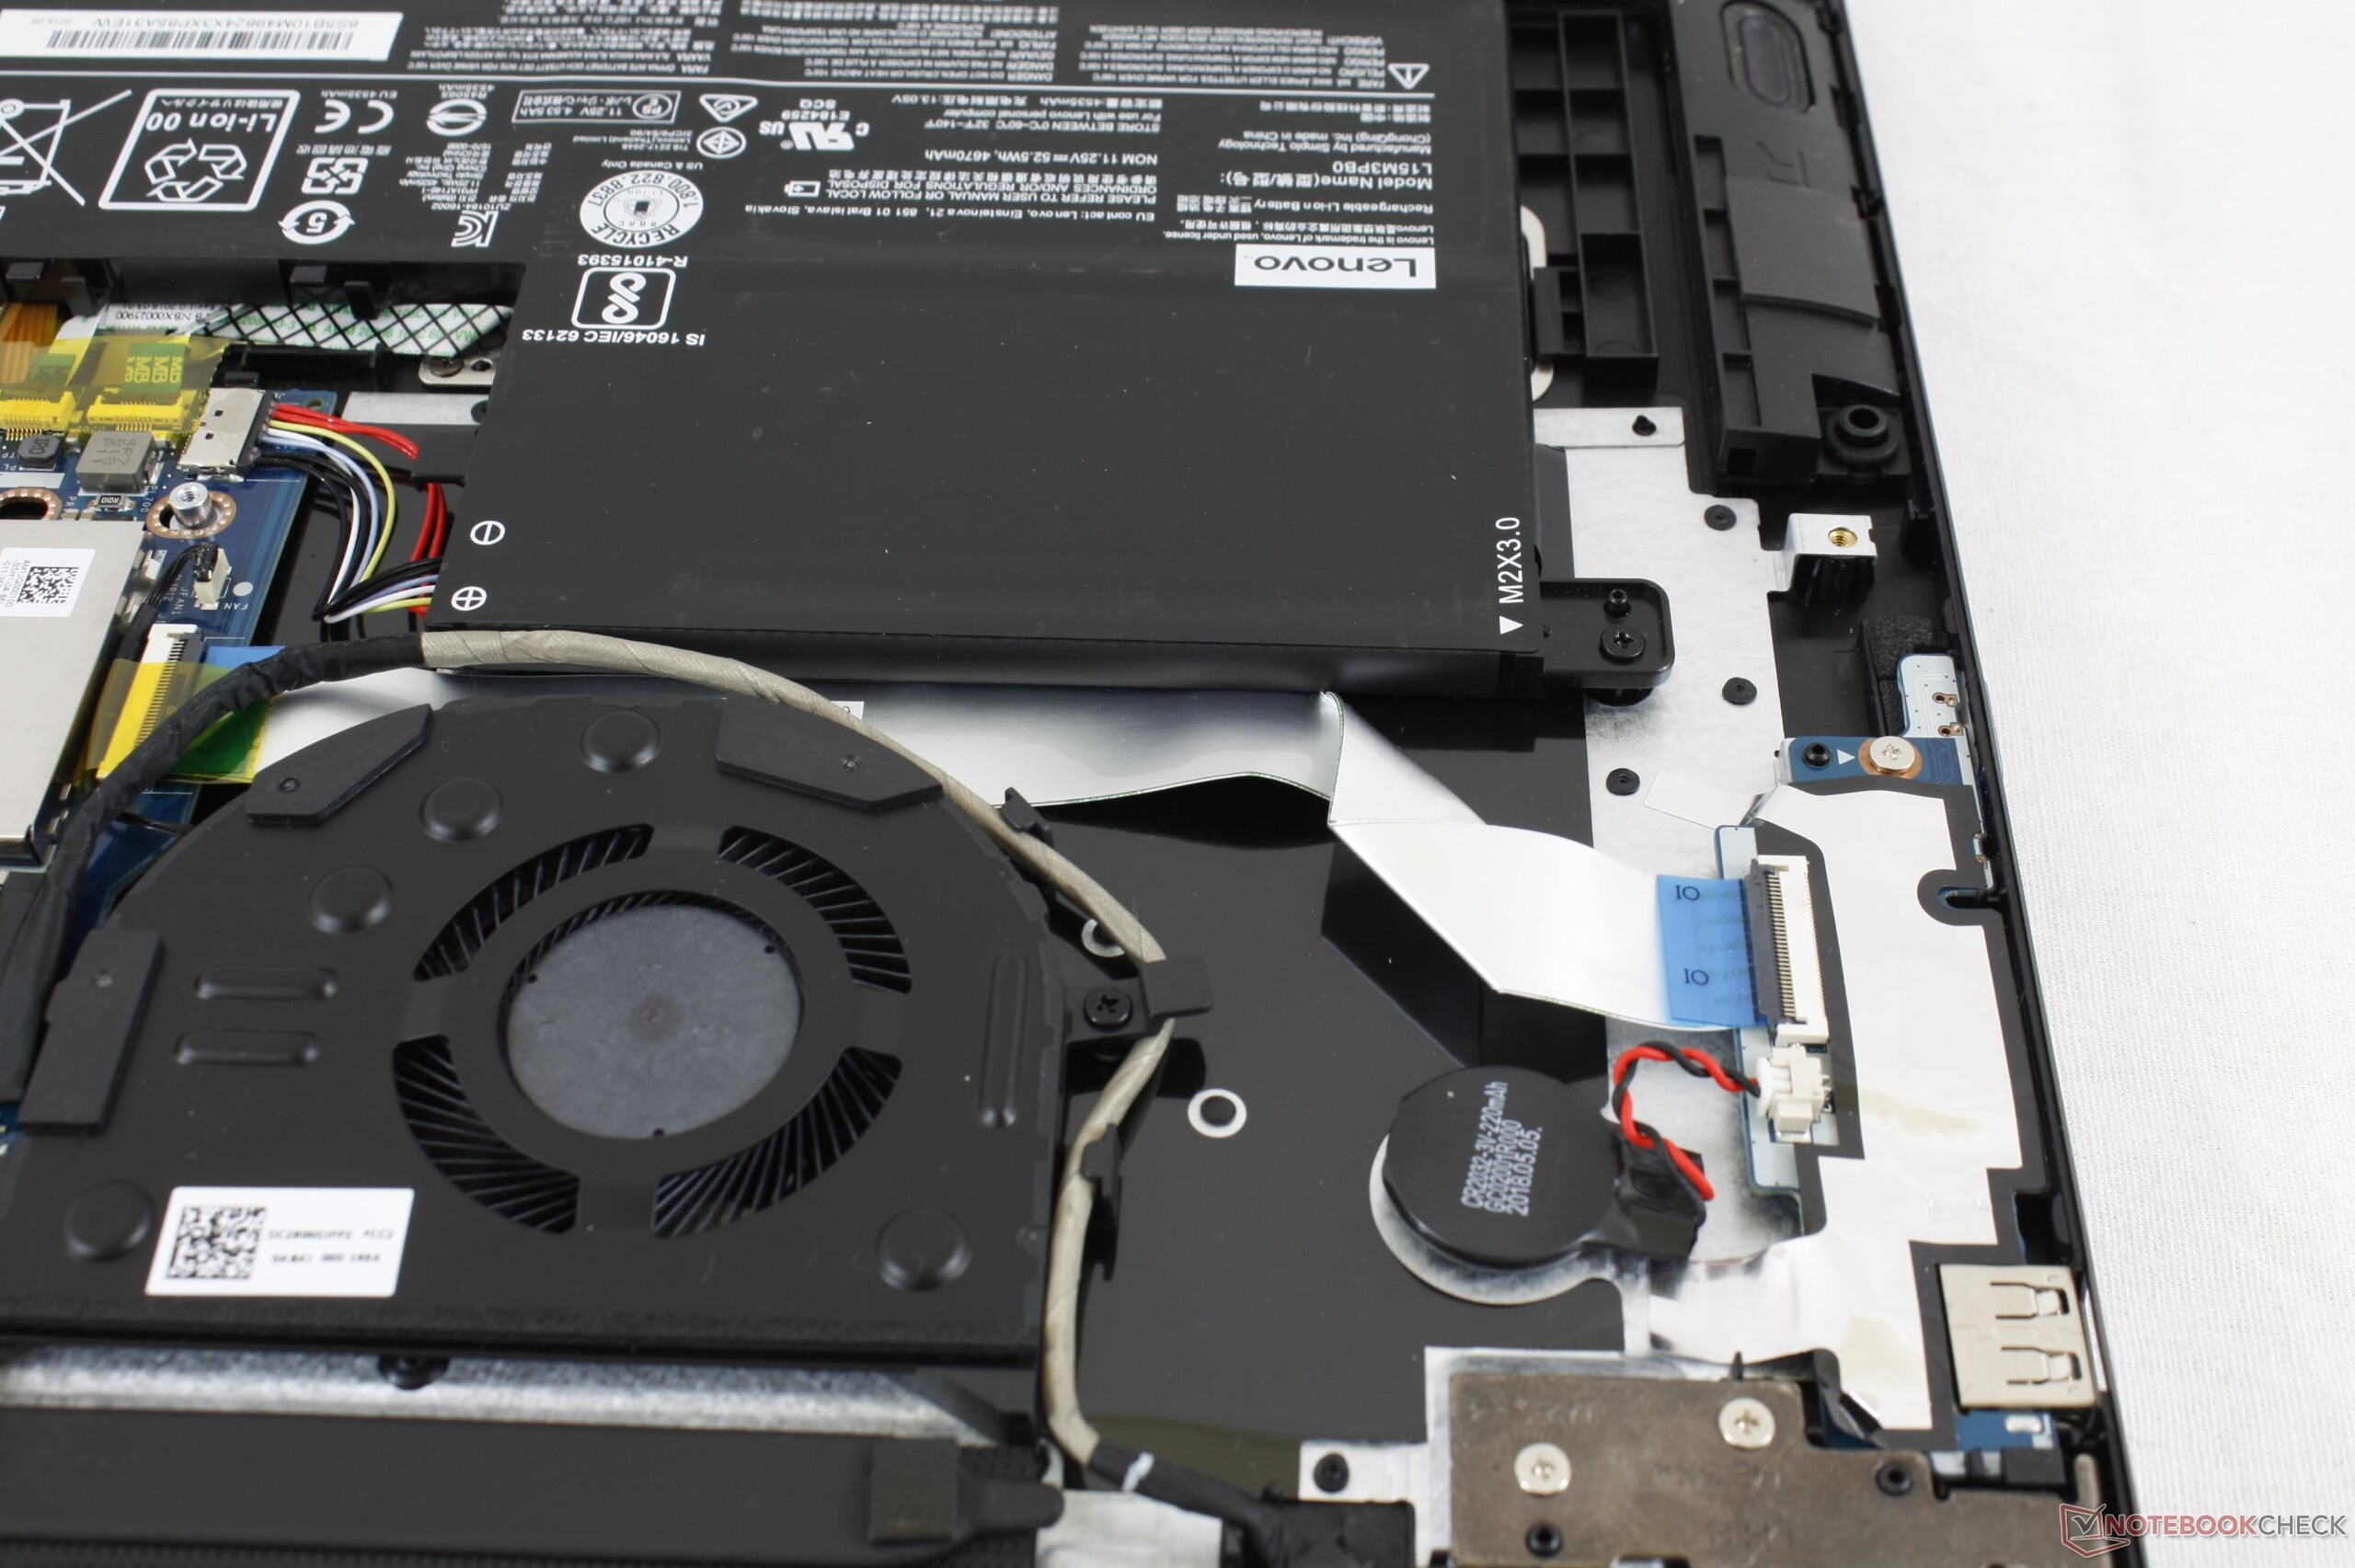
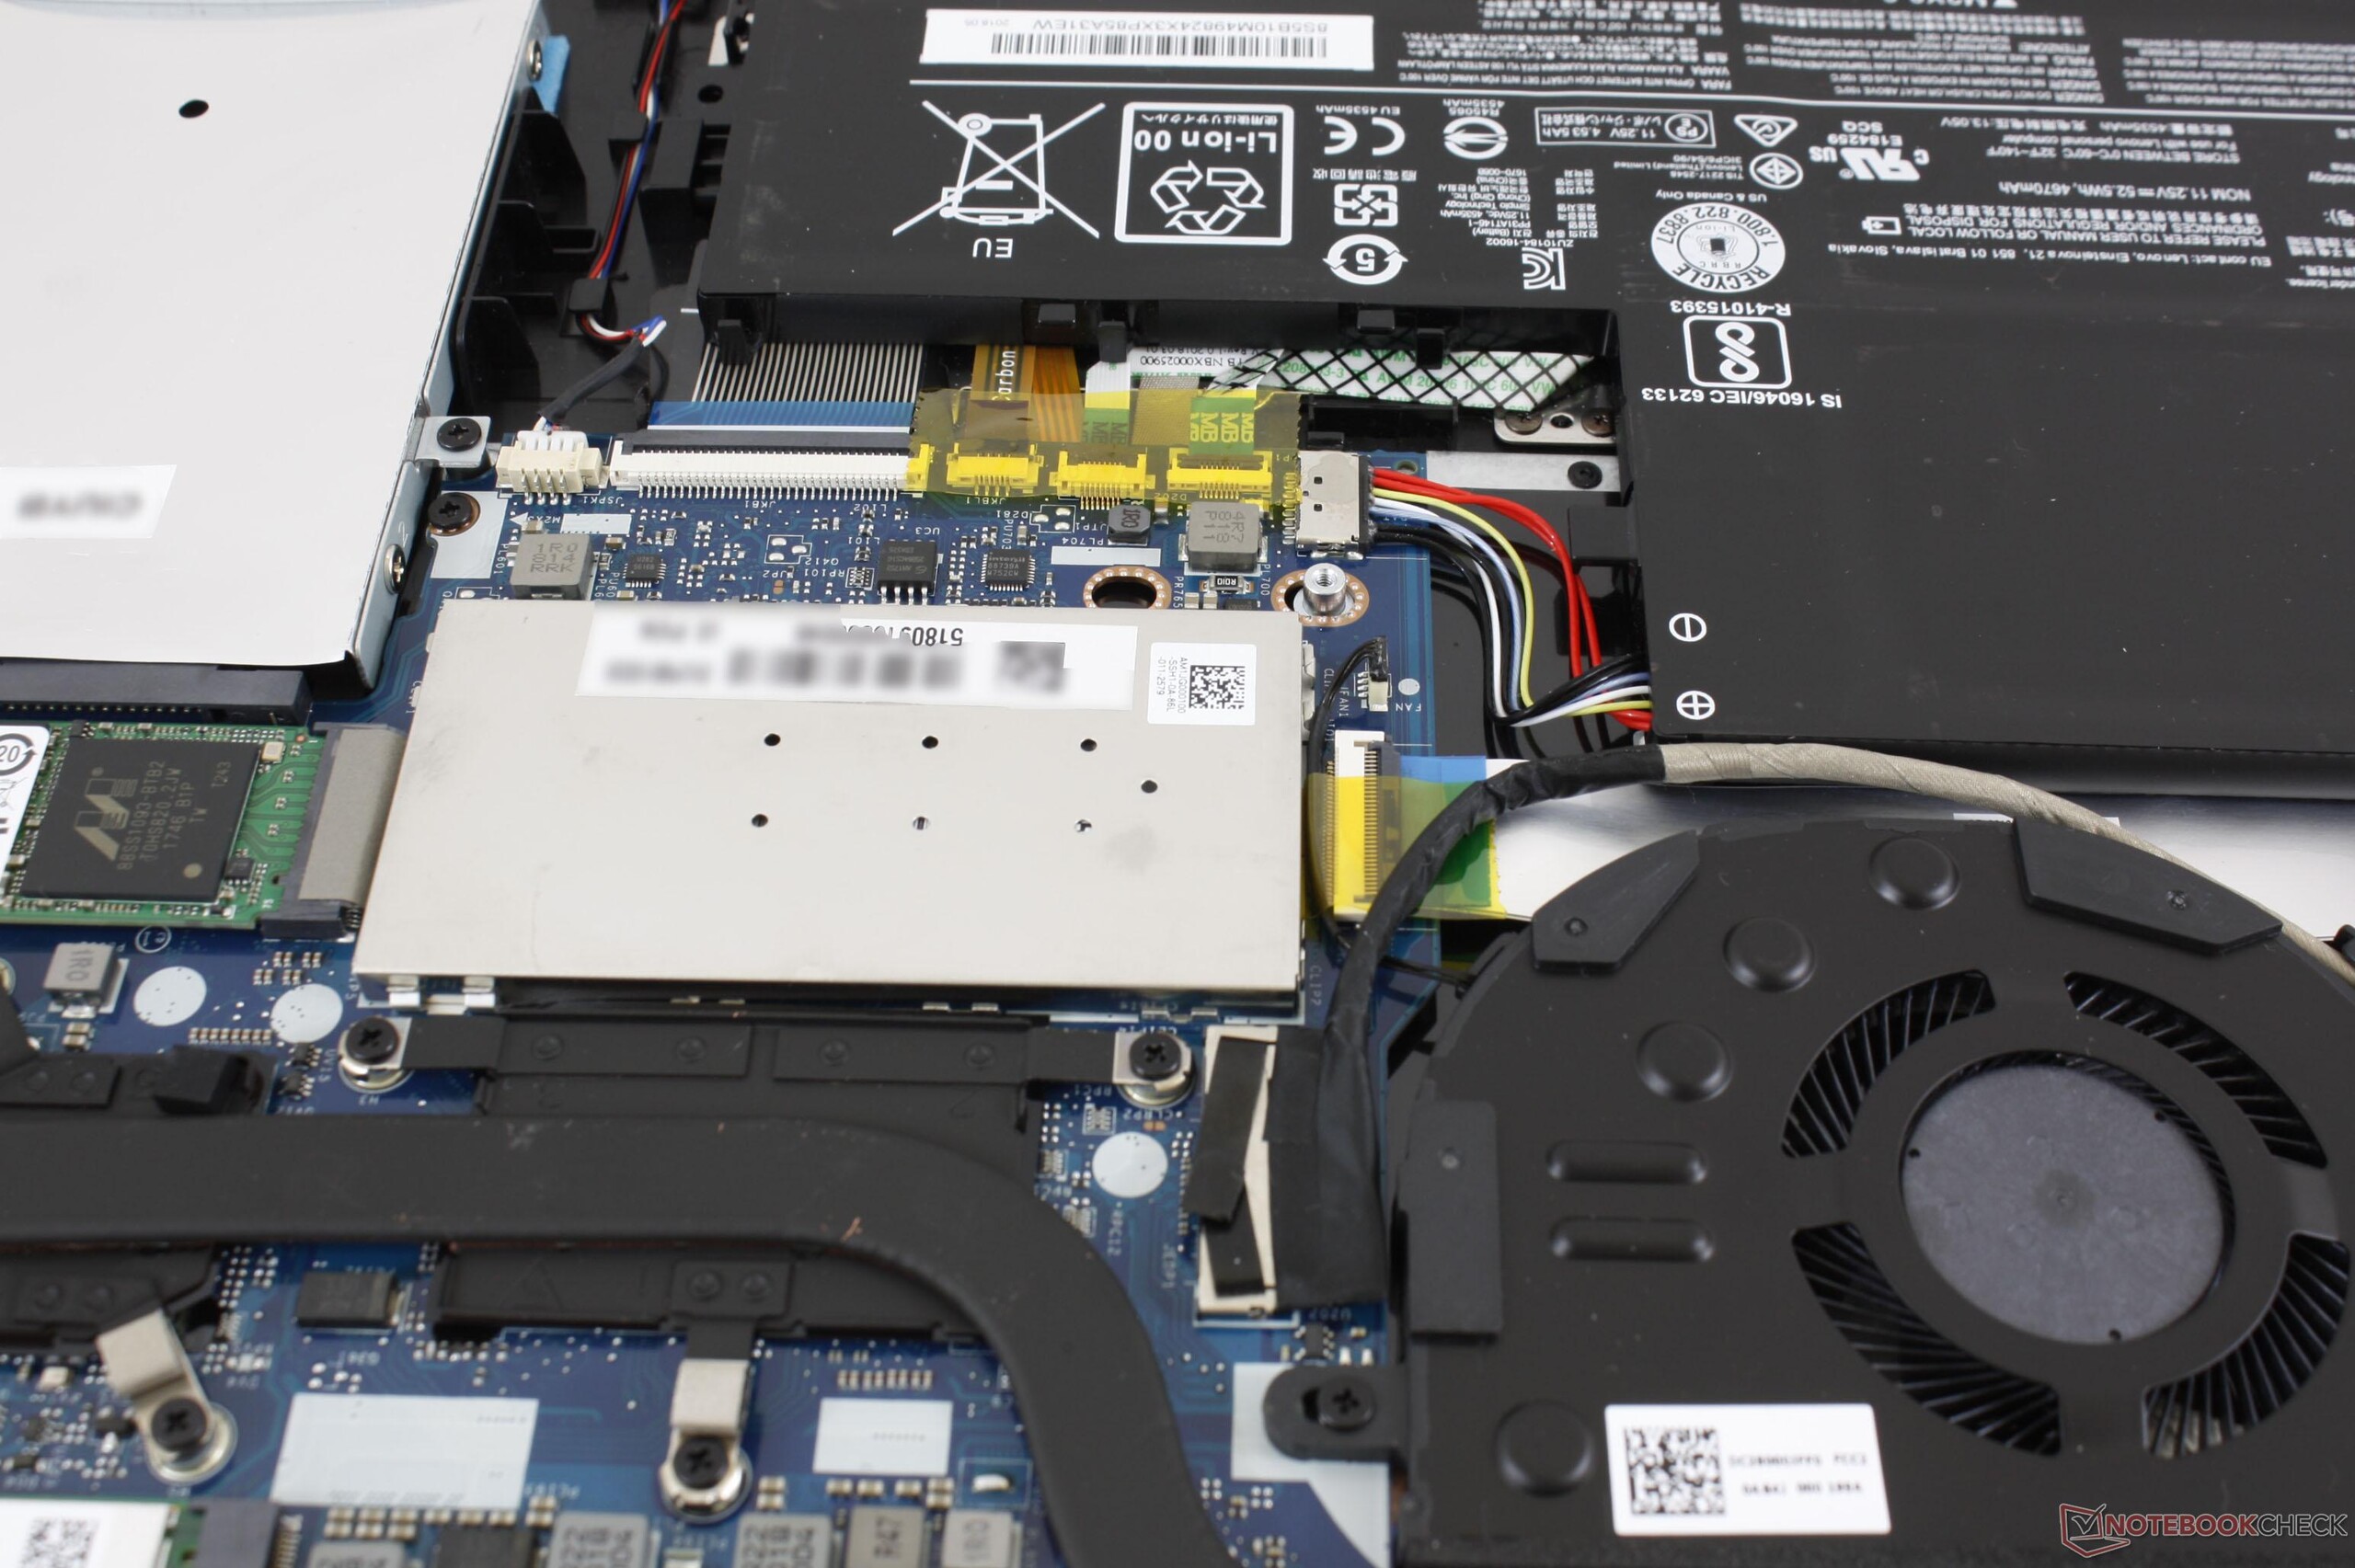
Listan över oturliga prestandanedskärningar är lång. Den riktigt mörka skärmen innebär att detta i huvudsak är en omvandlingsbar för inomhusbruk och den extremt begränsade Turbo Boost-förmågan innebär att det egentligen inte finns någon anledning att köpa den dyrare Core i7 8550U-varianten när den billigare i5 8250U-modellen presterar i princip likadant. Dess enkelkanals-RAM hämmar prestandan ytterligare och kyllösningen är pinsamt liten med tanke på hur mycket rum det finns i en formfaktor på 15 tum. Det finns gott om plats runt fläkten som kunde ha använts till en större kyllösning för att reducera ljudet från fläkten.
Ett utgångspris på 7.000 kronor är rimligt för ett likgiltigt system som man i ärlighetens namn lätt glömmer medans dyrare varianter kan kostar upp emot 10.000 kronor. Vi rekommenderar att undvika de dyrare alternativen då det i så fall vore bättre att skaffa en mer välgjord traditionell laptop såsom XPS 15 eller lägga på lite pengar för att skaffa en Spectre x360 15. Extremt dålig Turbo Boost och en mörk skärm gör den svårsåld.
Lenovo IdeaPad Flex-1570 81CA000RUS
- 09/03/2018 v6 (old)
Allen Ngo
Price comparison
