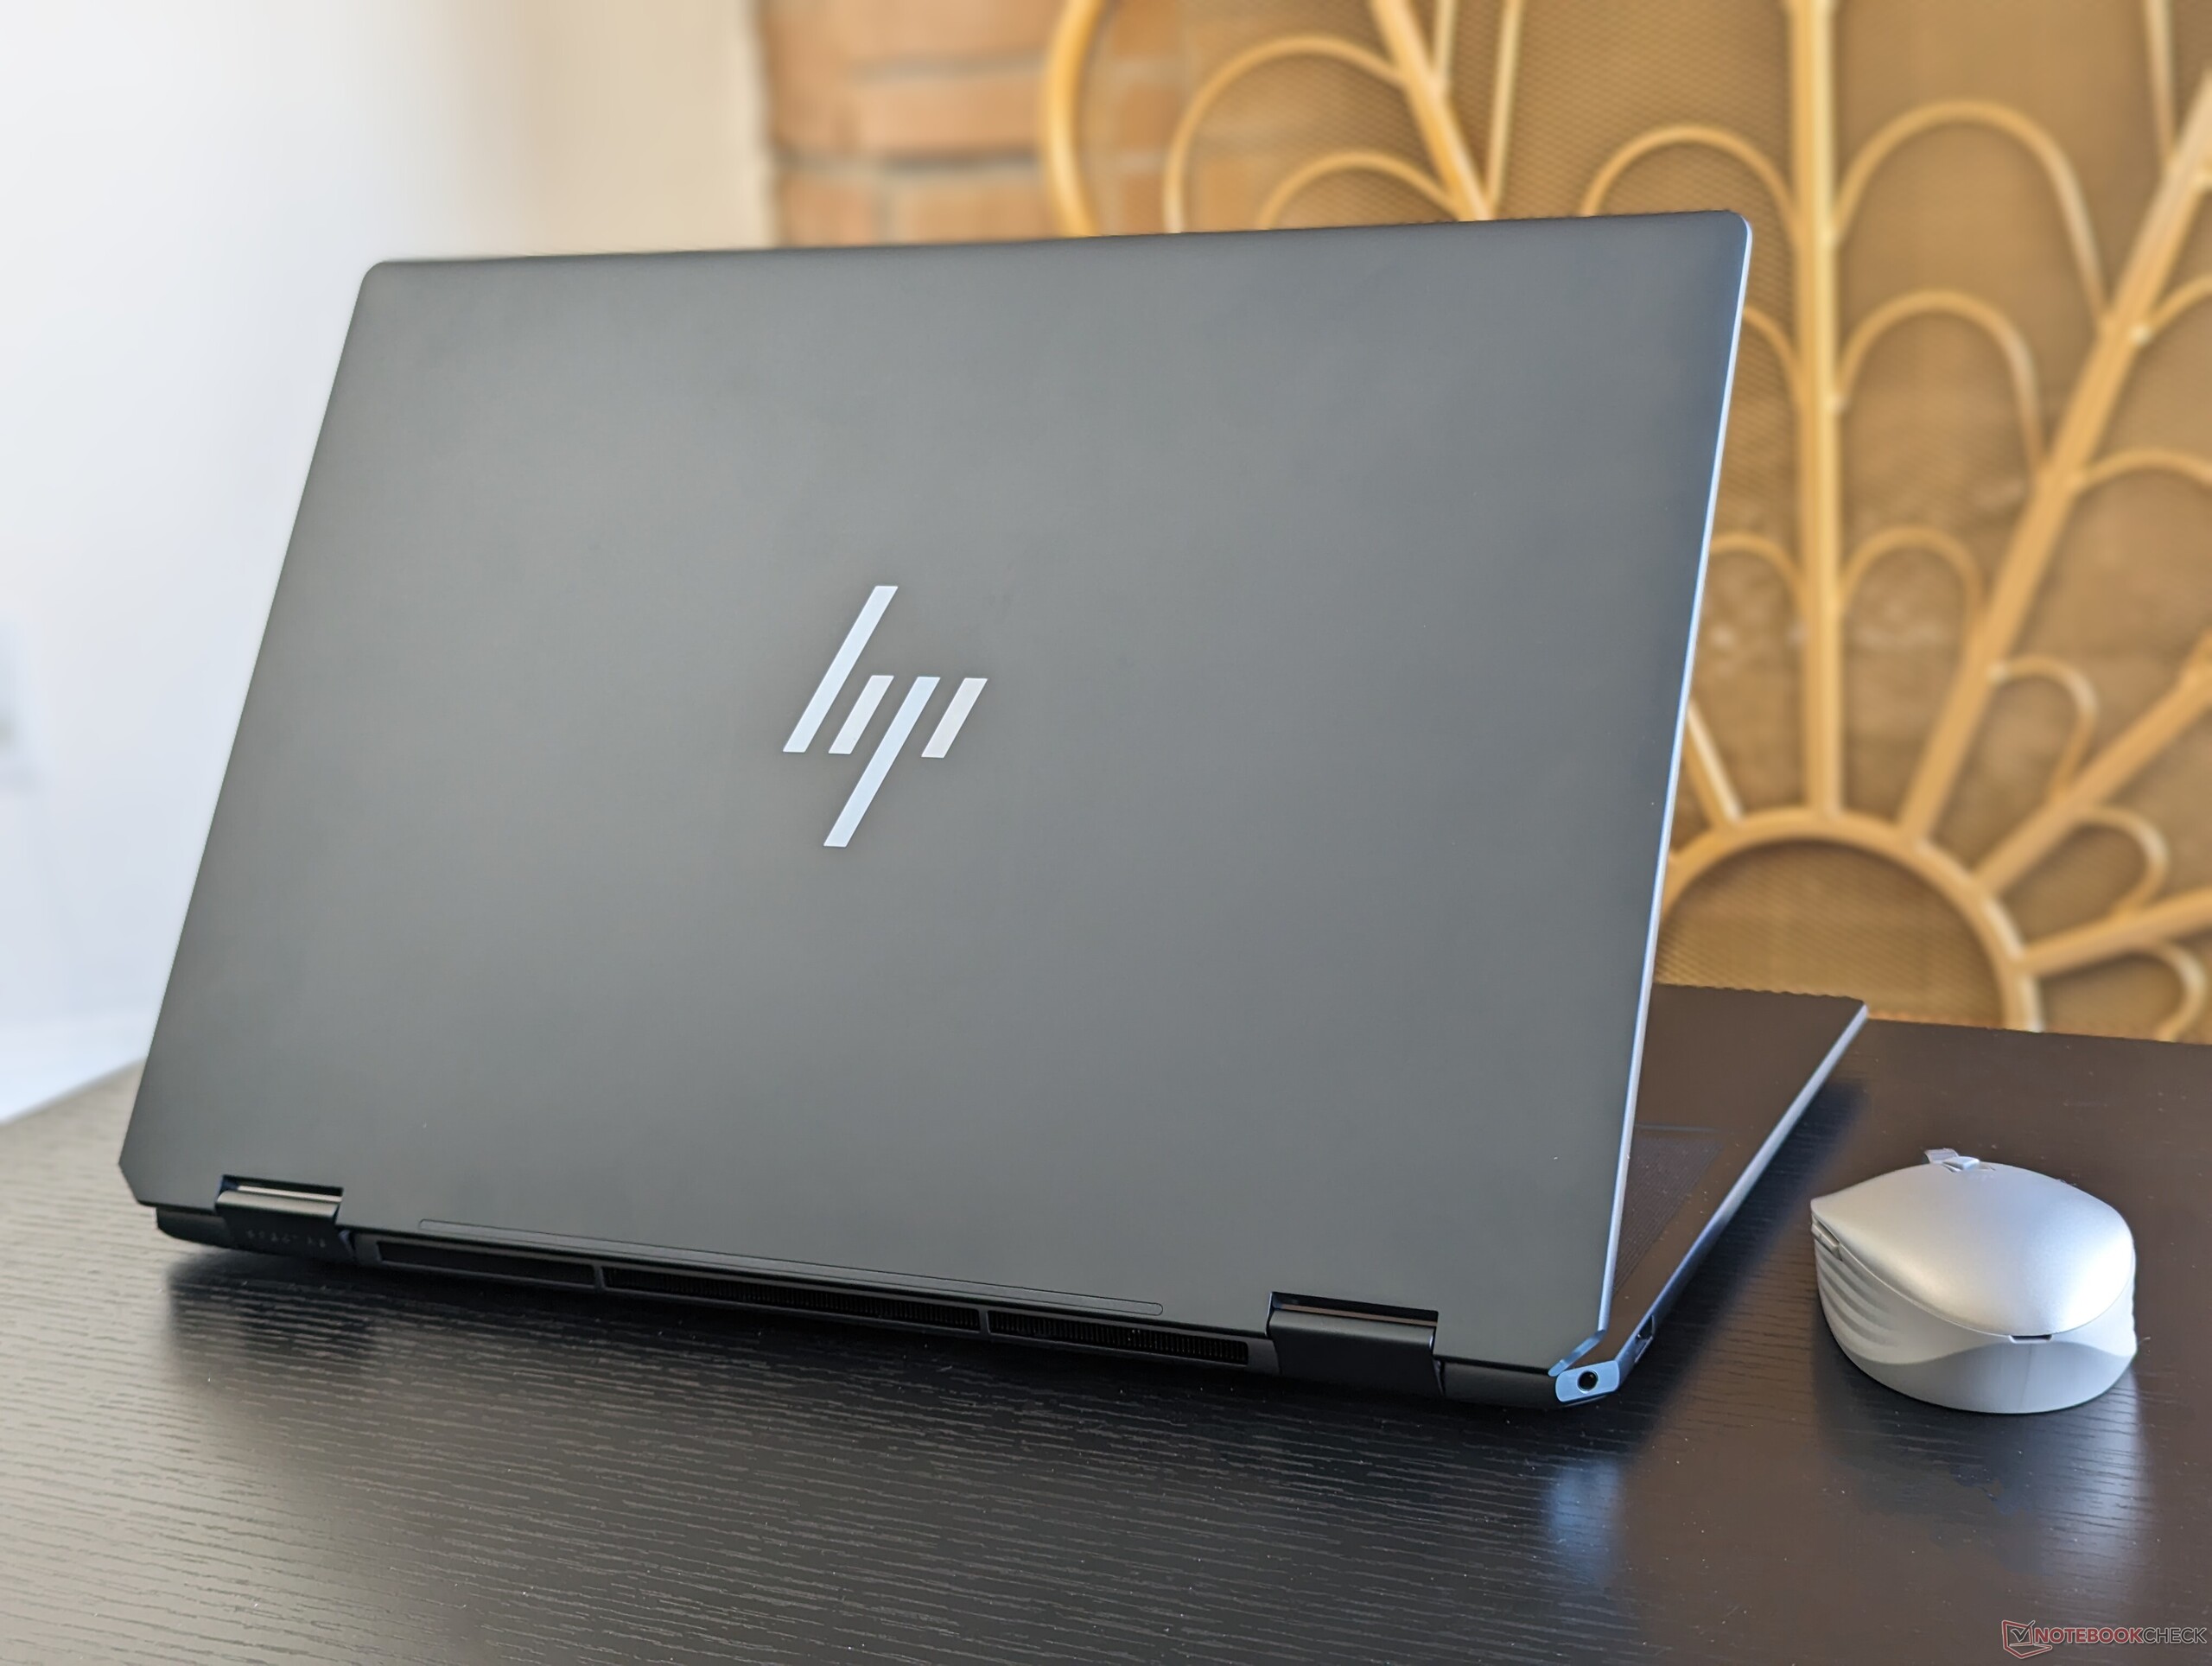
HP Spectre x360 16 konvertibel recension: Nu med 55 W GeForce RTX 4050-grafik

Efter att nyligen ha granskat iGPU-versionen av den nya Spectre x360 16, är vi nu redo att kolla in GeForce RTX-konfigurationen av samma modell. I princip allt annat om den bärbara datorn förblir identiskt mellan de två konfigurationerna och därför rekommenderar vi att du kollar in vår befintliga recension på iGPU SKU för att lära dig mer om de fysiska egenskaperna hos den konvertibla bärbara datorn.
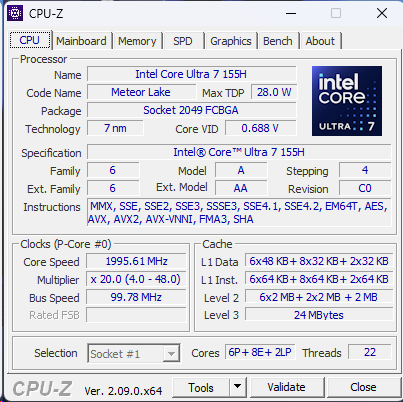
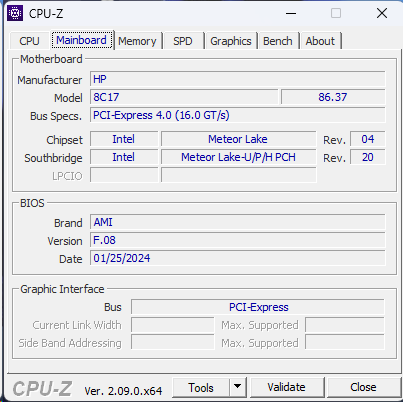
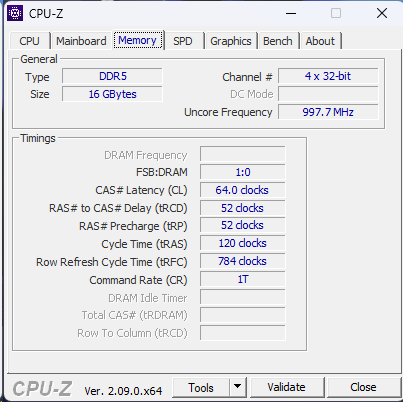
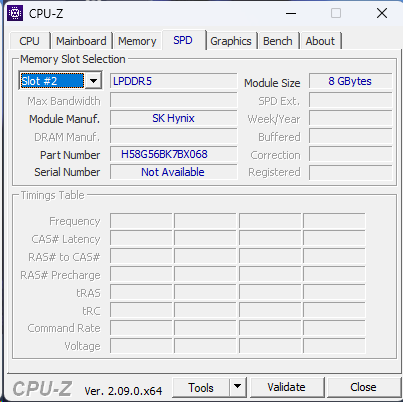
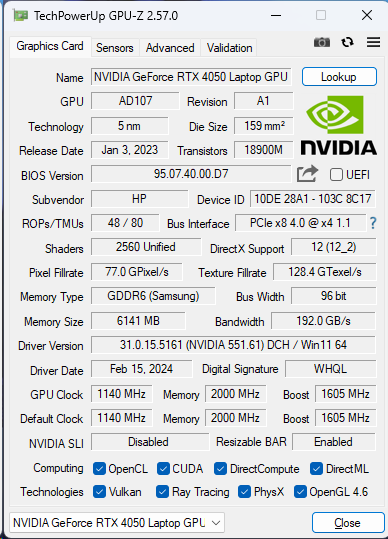
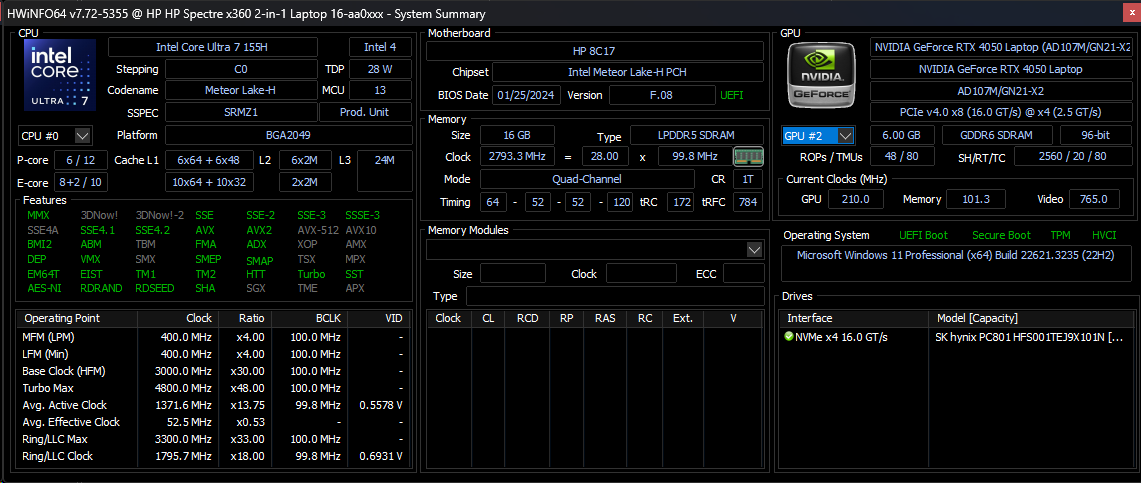
Vår enhet är konfigurerad med 1:a generationens Core Ultra 7 155H CPU, 55 W GeForce RTX 4050 GPU, 16 GB lödd RAM och 1800p OLED-pekskärm för cirka $1600 i detaljhandeln. Andra SKU:er kan innehålla dubbelt så mycket RAM-minne eller en 1600p 120 Hz IPS-pekskärm istället, men alla har samma Core Ultra 7 CPU och RTX 4050 GPU.
Fler recensioner av HP:
Potentiella konkurrenter i jämförelse
Gradering | Datum | Modell | Vikt | Höjd | Storlek | Upplösning | Pris |
|---|---|---|---|---|---|---|---|
| 91.1 % v7 (old) | 03/2024 | HP Spectre x360 16 RTX 4050 Ultra 7 155H, GeForce RTX 4050 Laptop GPU | 2 kg | 19.8 mm | 16.00" | 2880x1800 | |
| 91.4 % v7 (old) | 02/2024 | HP Spectre x360 16-aa0074ng Ultra 7 155H, Arc 8-Core | 1.9 kg | 19.8 mm | 16.00" | 2880x1800 | |
| 87.3 % v7 (old) | 01/2023 | HP Spectre x360 2-in-1 16-f1075ng i7-12700H, Iris Xe G7 96EUs | 2 kg | 19.9 mm | 16.00" | 3072x1920 | |
| 90 % v7 (old) | 03/2024 | Honor MagicBook Pro 16 2024 Ultra 7 155H, GeForce RTX 4060 Laptop GPU | 1.9 kg | 17.9 mm | 16.00" | 3072x1920 | |
| 88.1 % v7 (old) | 12/2023 | MSI Prestige 16 B1MG-001US Ultra 7 155H, Arc 8-Core | 1.6 kg | 19.1 mm | 16.00" | 2560x1600 | |
| 85.8 % v7 (old) | 11/2023 | LG Gram 2in1 16 16T90R - G.AA78G i7-1360P, Iris Xe G7 96EUs | 1.5 kg | 17.2 mm | 16.00" | 2560x1600 |
Fall
Konfigurationen med dGPU är något tyngre än alternativet med iGPU, ca 100 g.
Kommunikation
Webbkamera


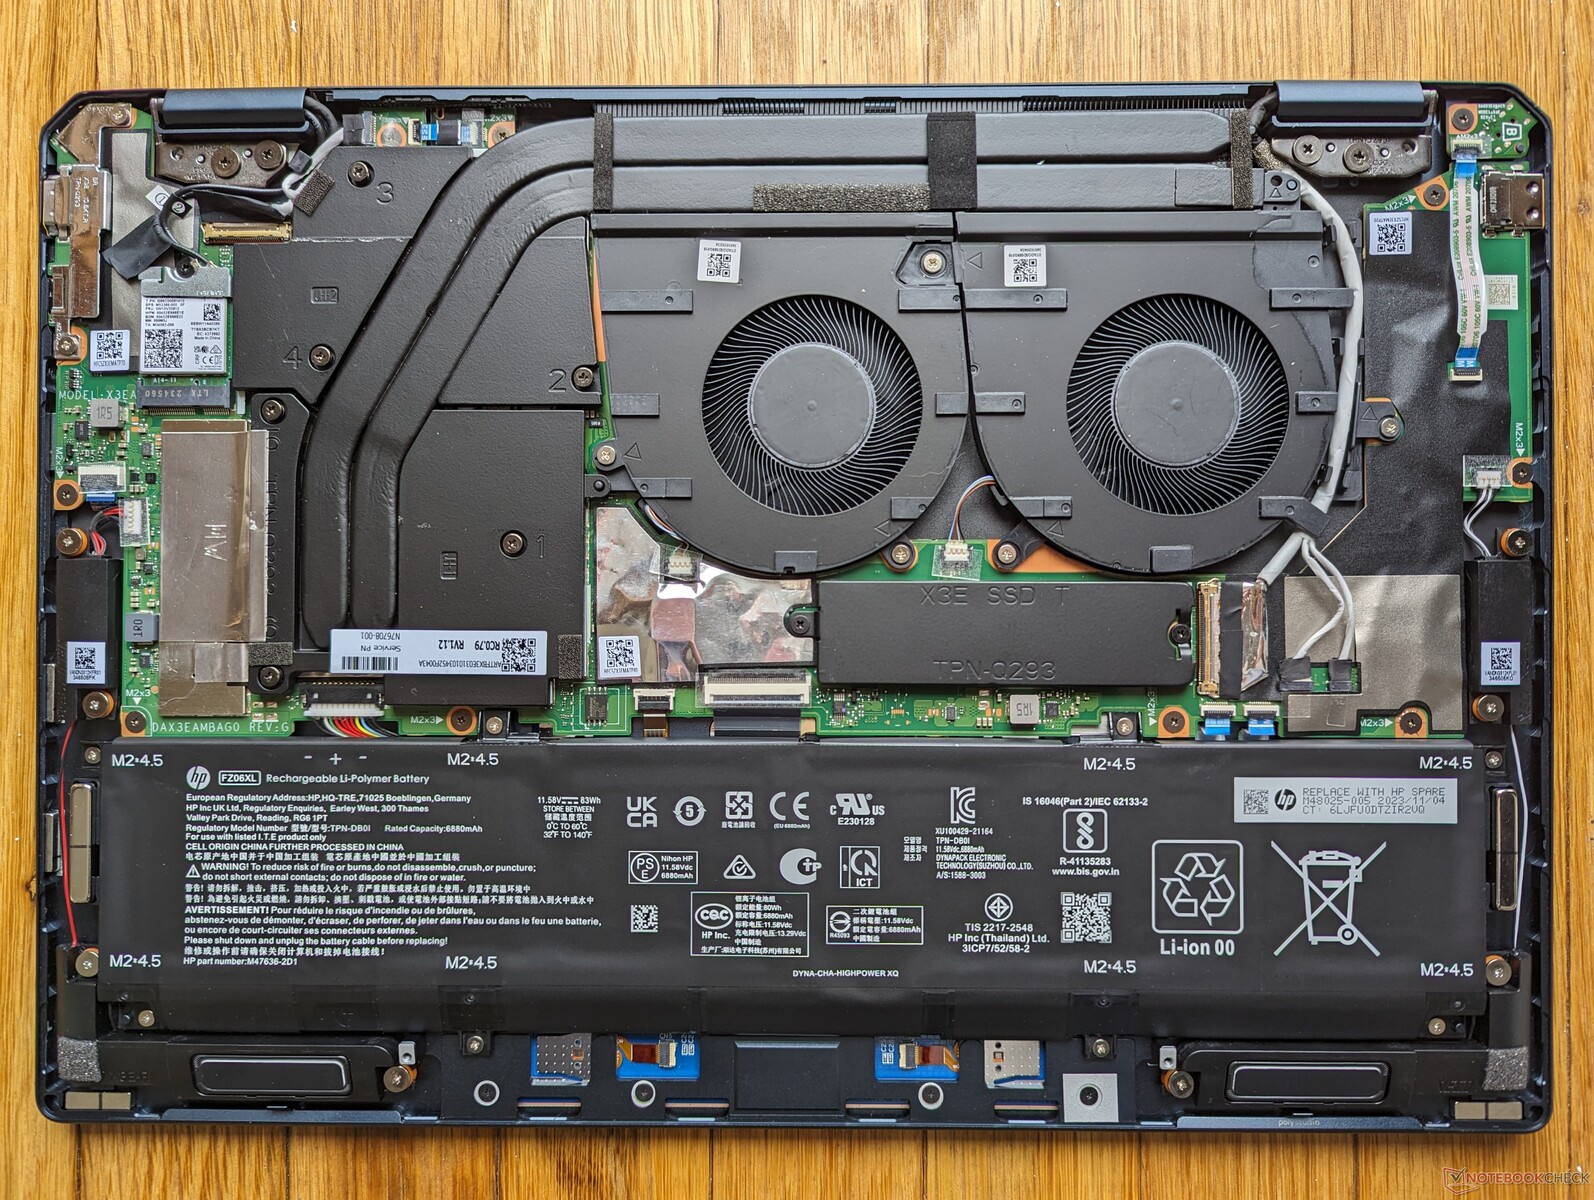
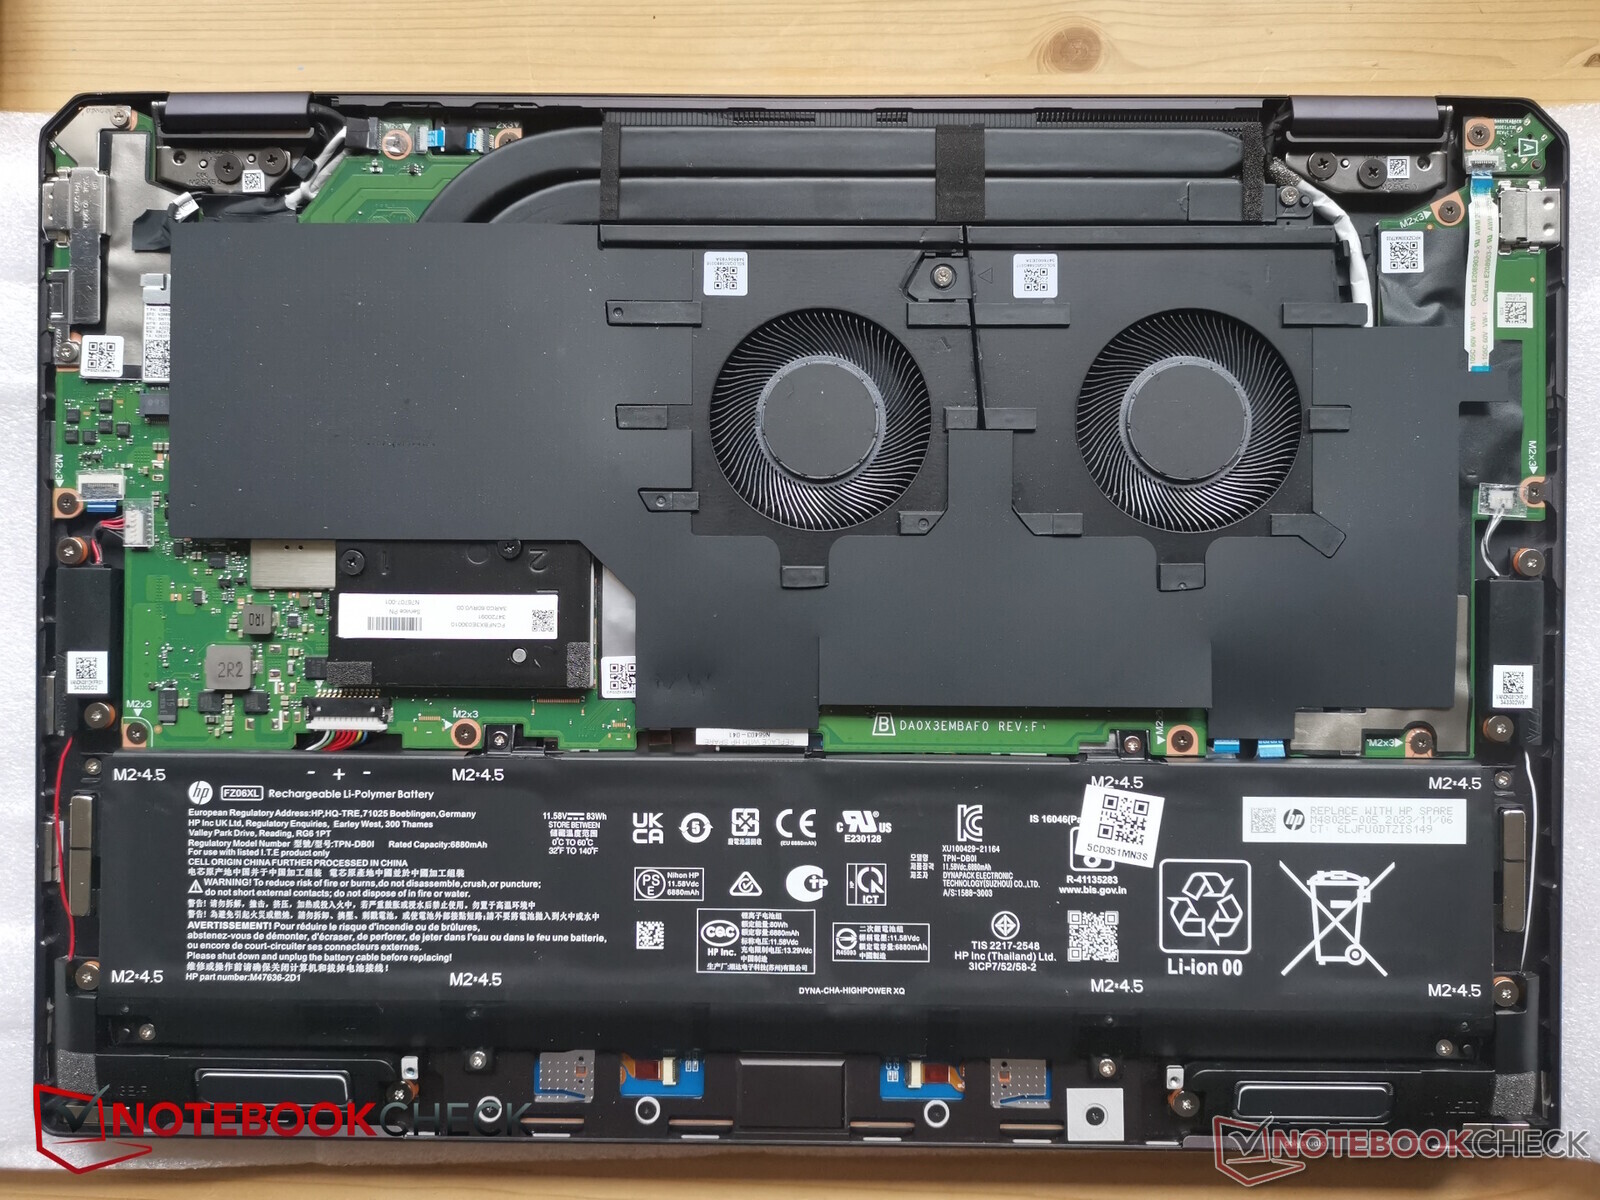
Underhåll
DGPU-konfigurationen innehåller längre kopparvärmerör än iGPU-versionen, vilket visas nedan, vilket bidrar till den något högre vikten. Moderkortet är i övrigt nästan identiskt.
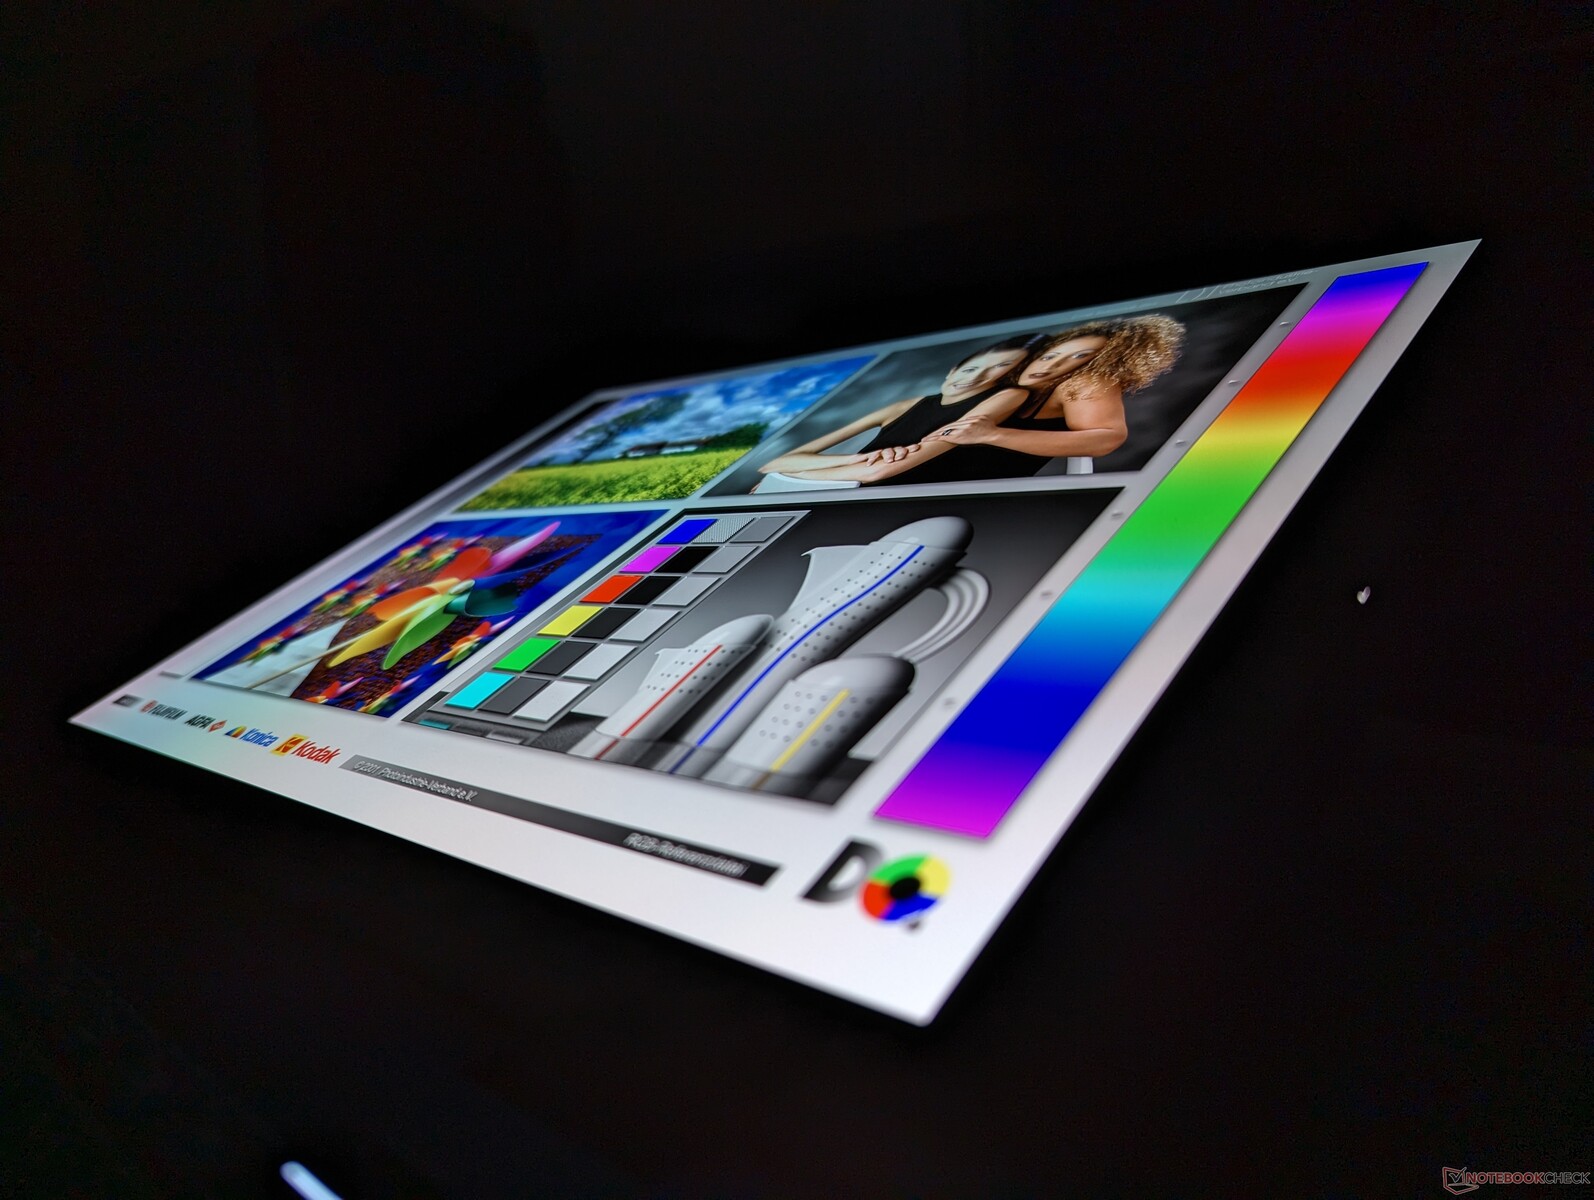
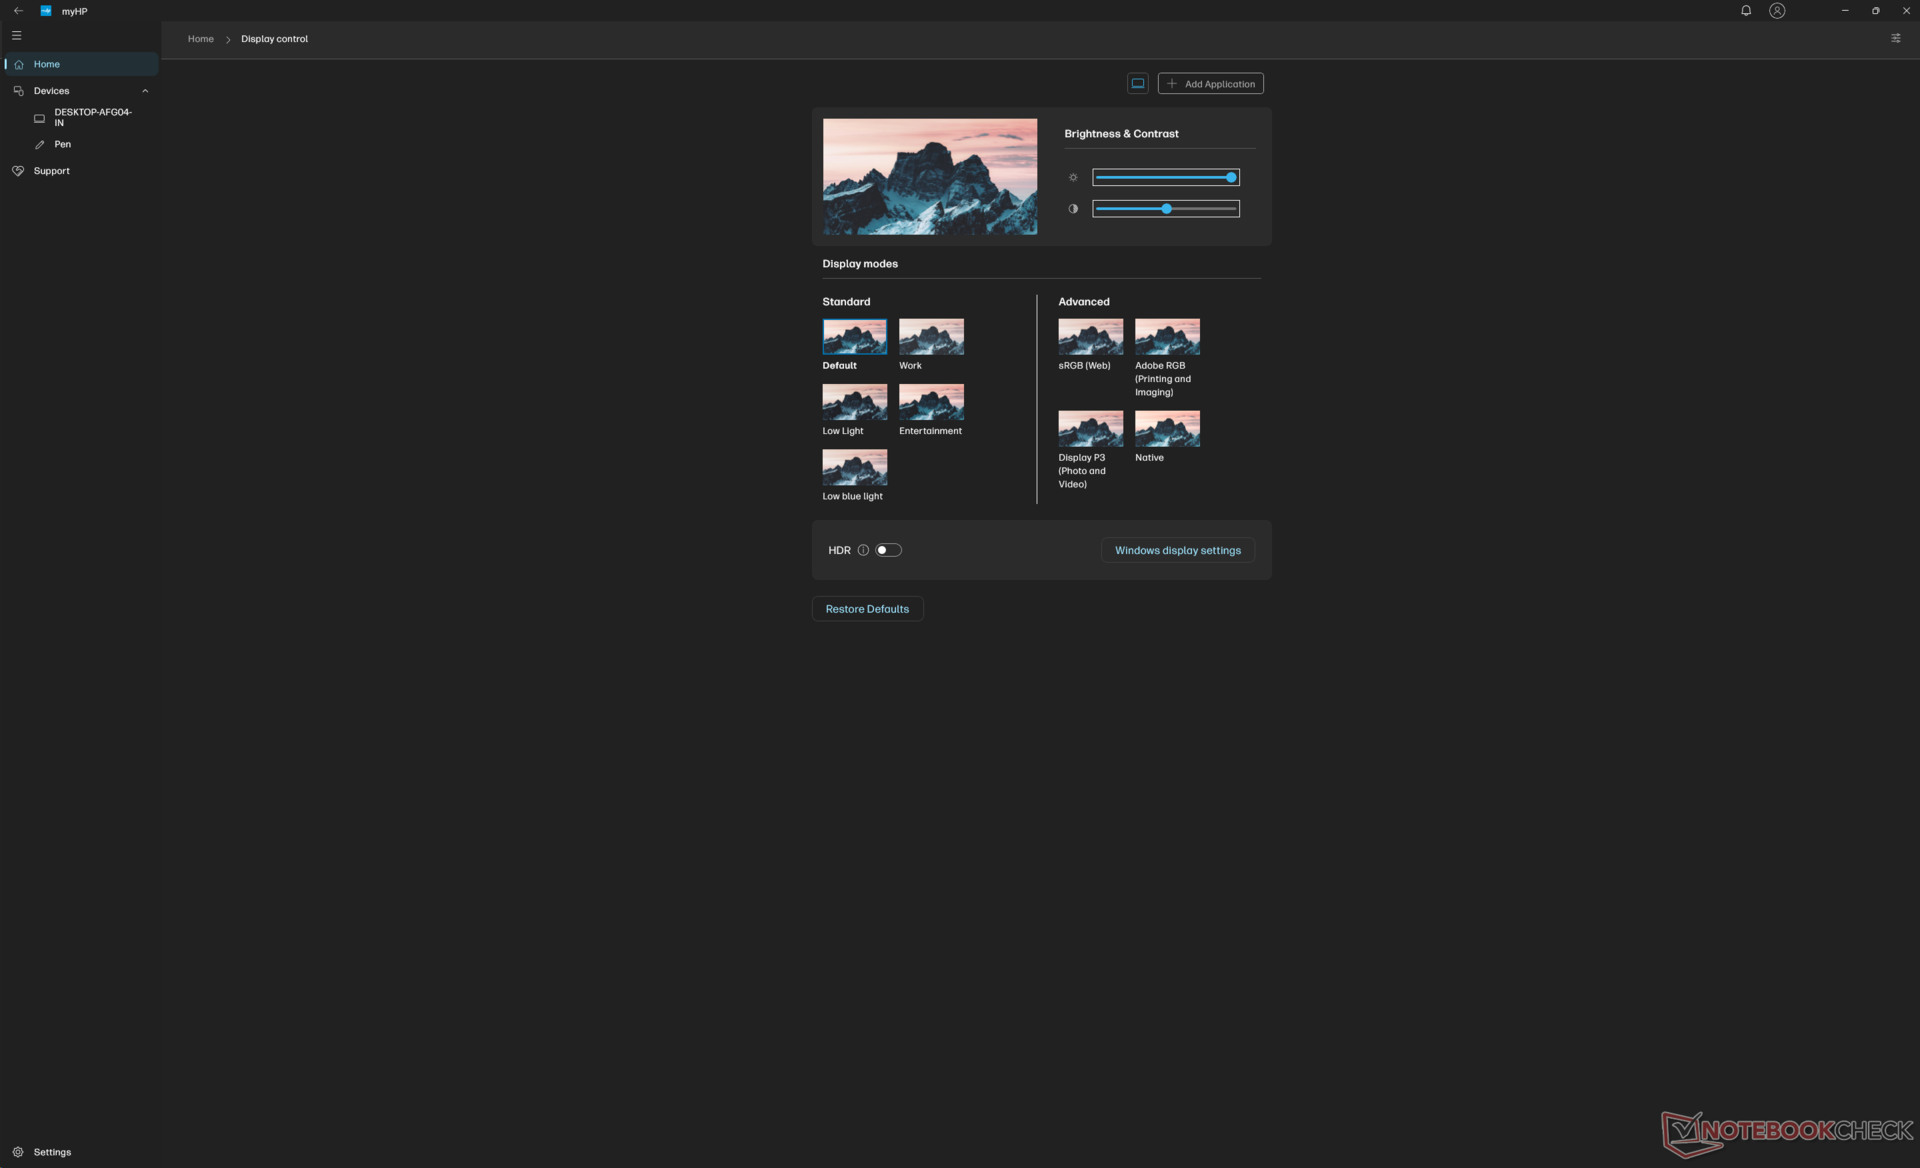
Display
| |||||||||||||||||||||||||
Distribution av ljusstyrkan: 99 %
Mitt på batteriet: 385.2 cd/m²
Kontrast: ∞:1 (Svärta: 0 cd/m²)
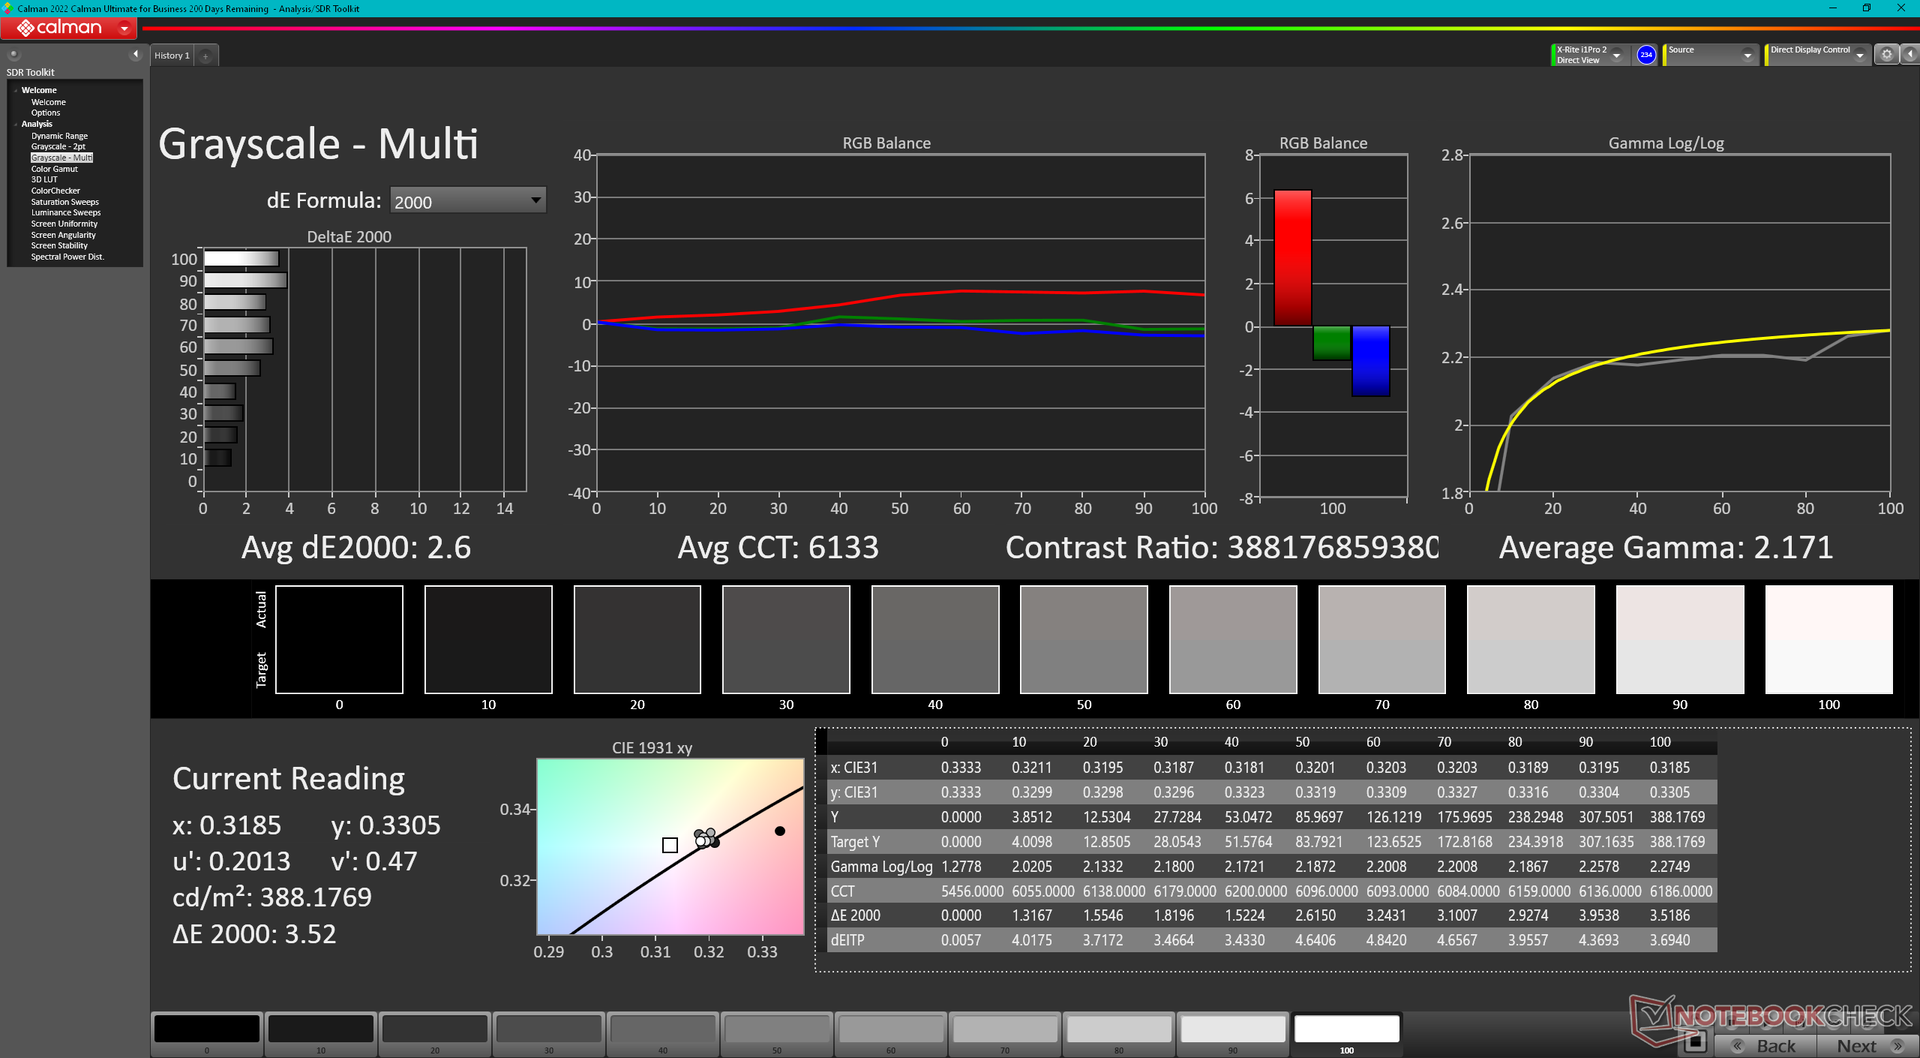
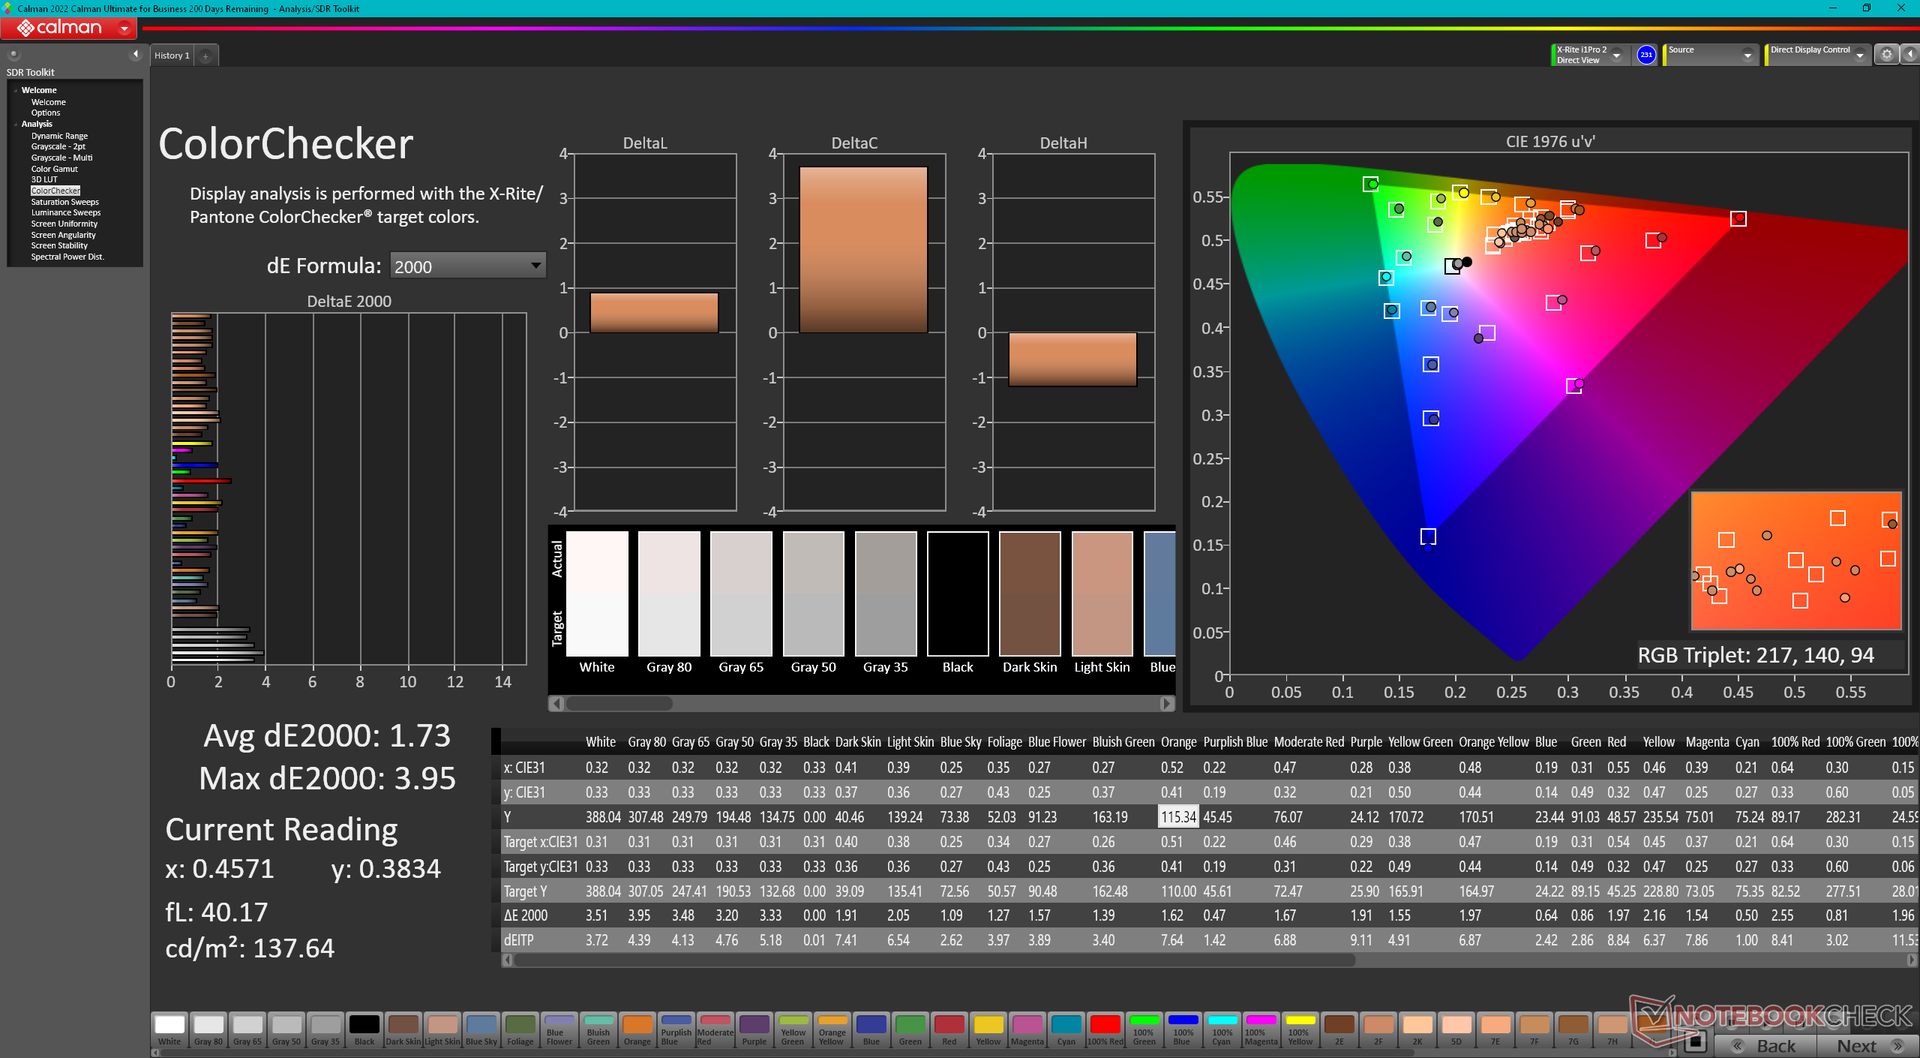
ΔE ColorChecker Calman: 1.73 | ∀{0.5-29.43 Ø4.71}
ΔE Greyscale Calman: 2.6 | ∀{0.09-98 Ø4.96}
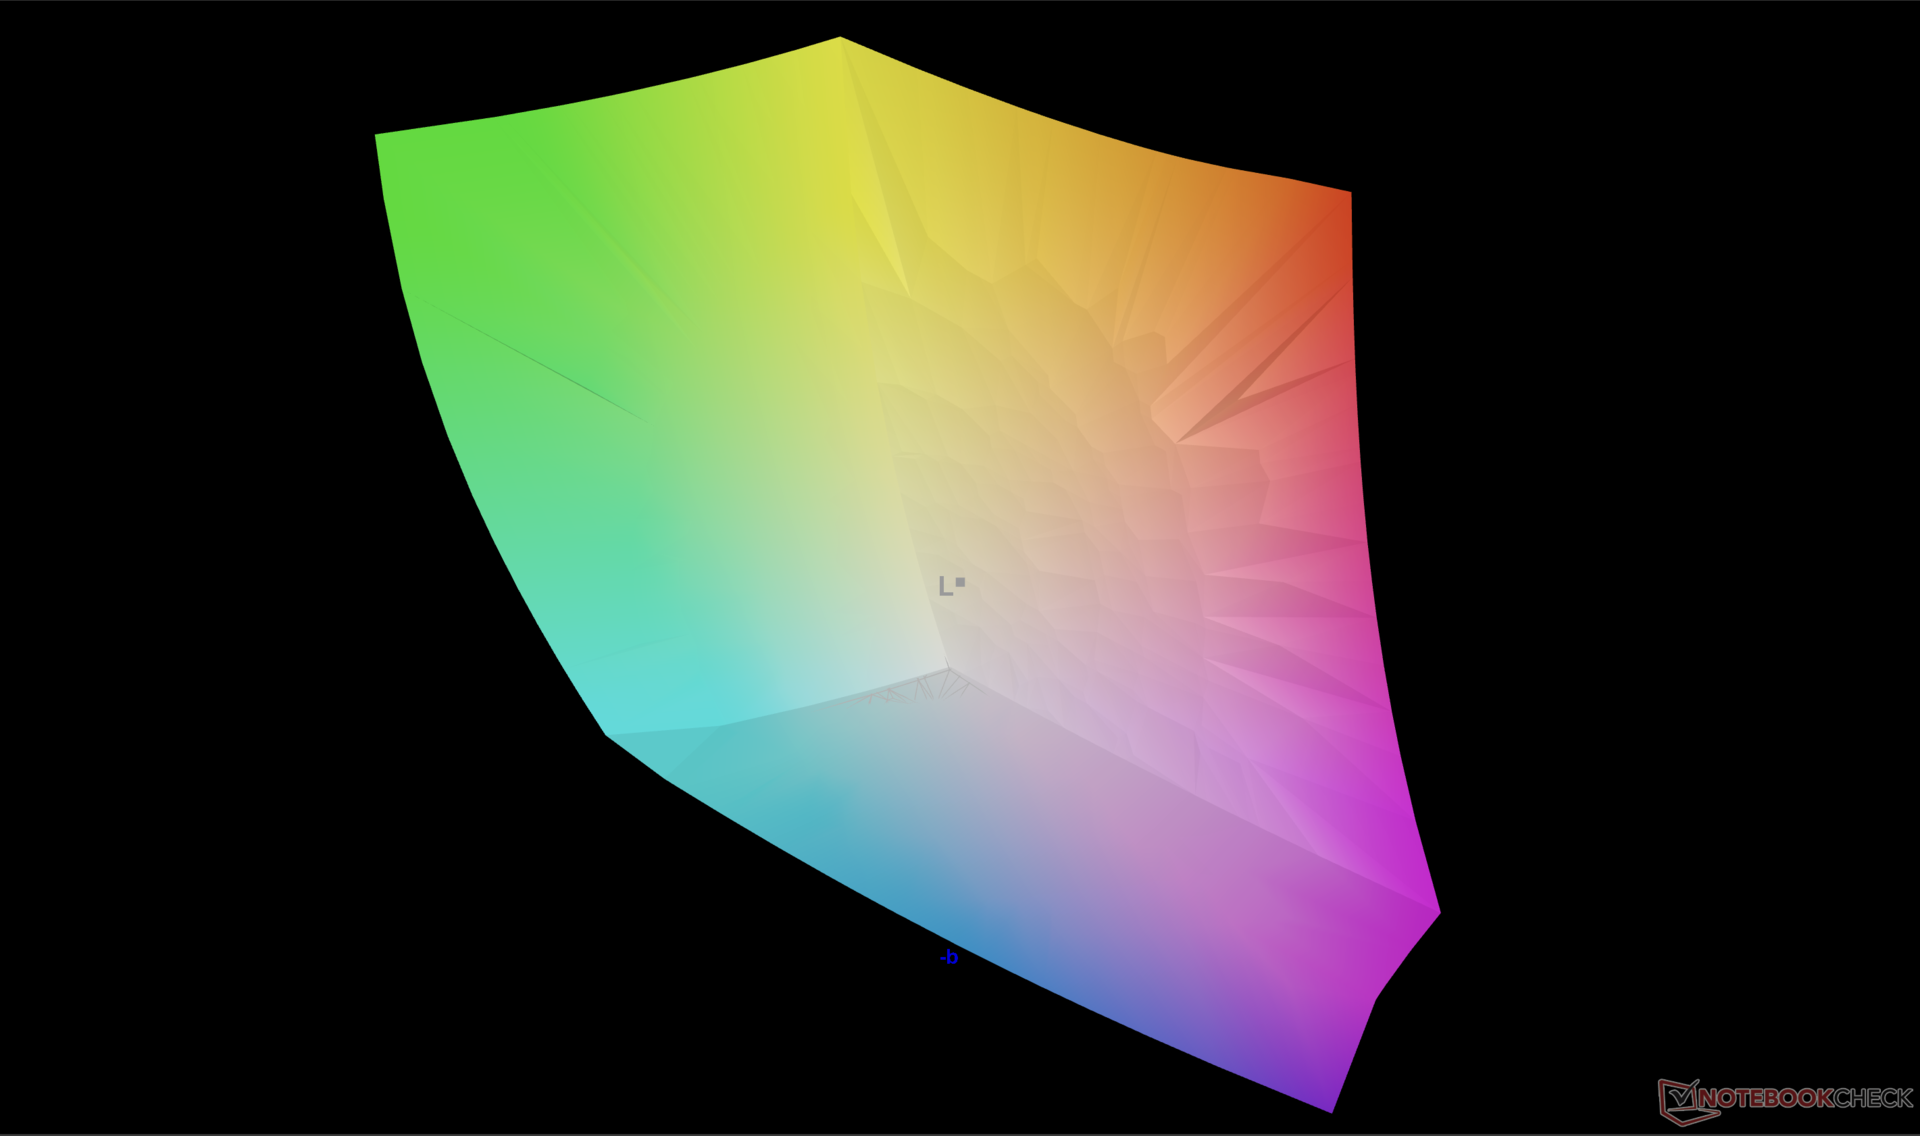
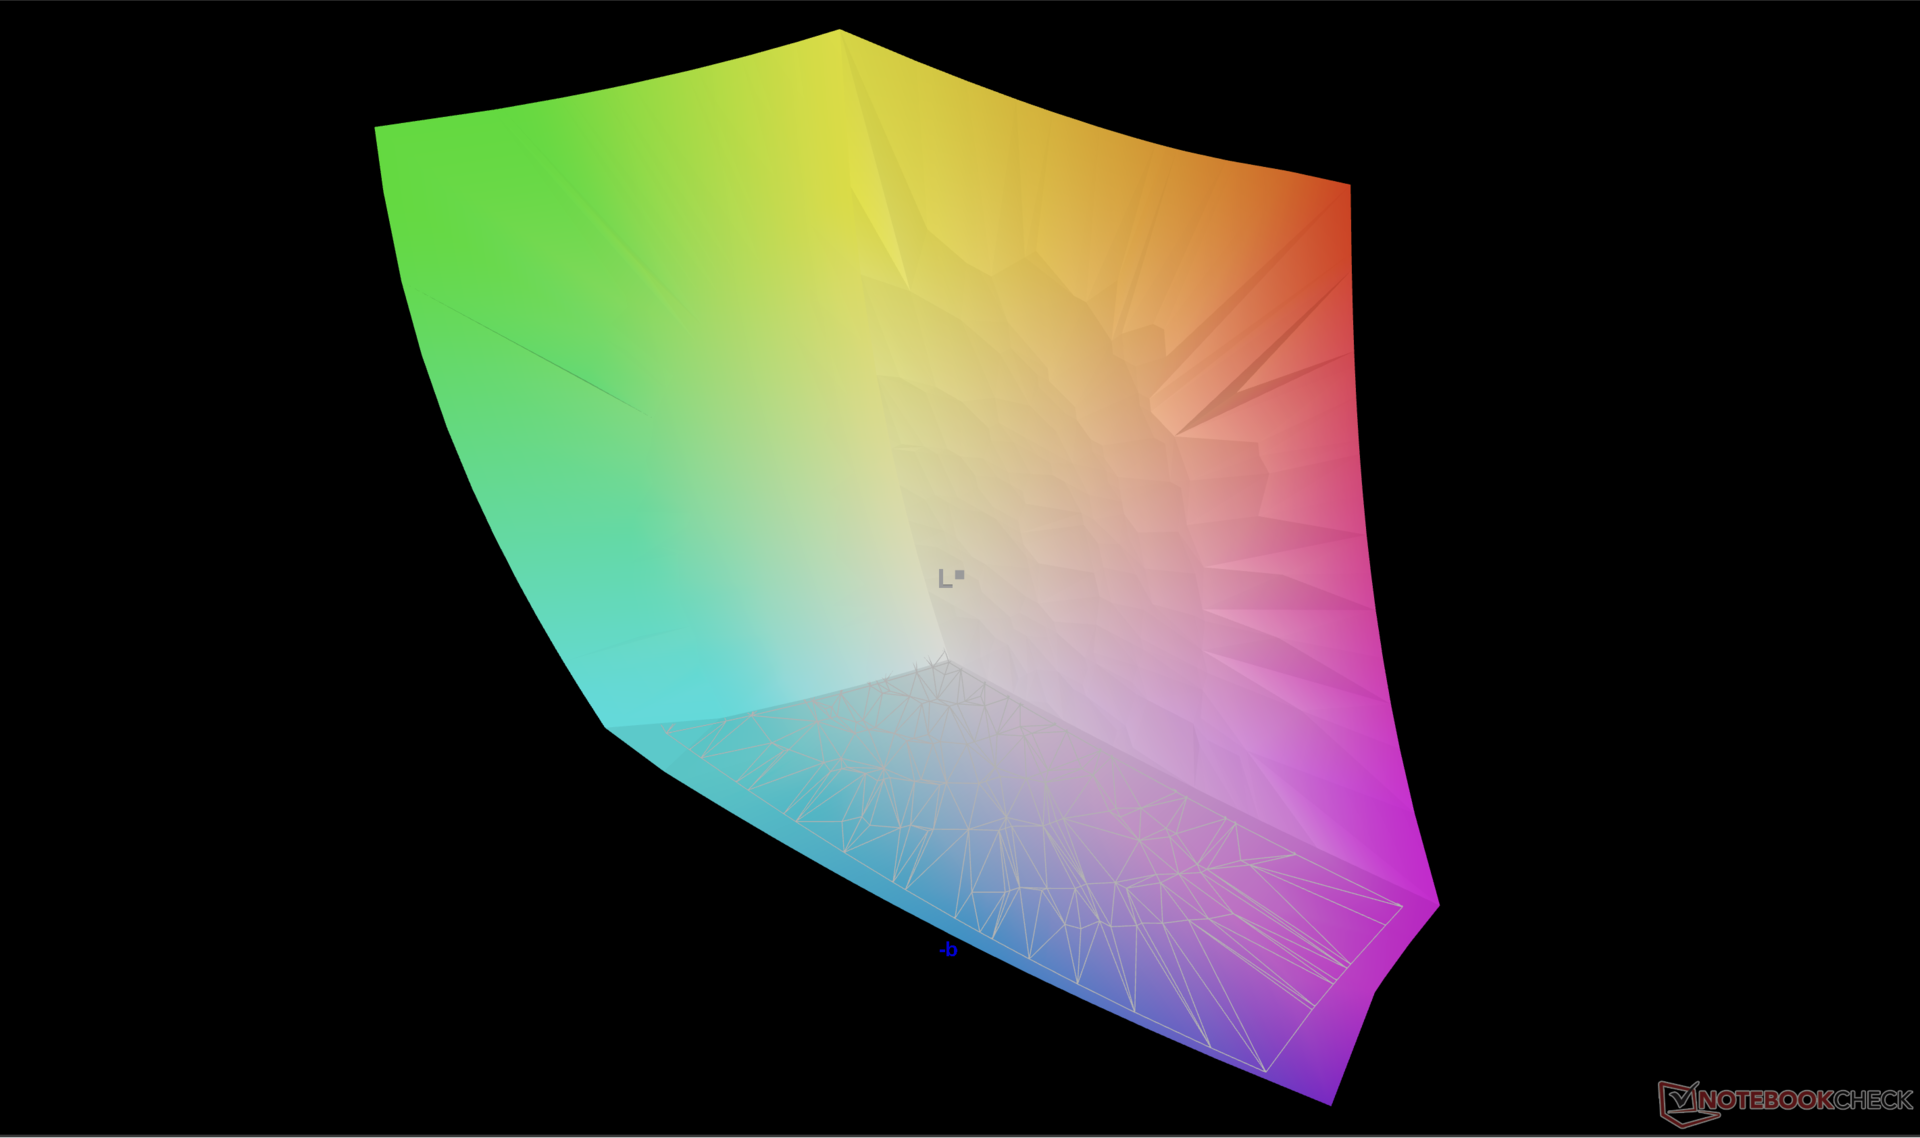
96.7% AdobeRGB 1998 (Argyll 3D)
100% sRGB (Argyll 3D)
99.6% Display P3 (Argyll 3D)
Gamma: 2.17
CCT: 6133 K
| HP Spectre x360 16 RTX 4050 Samsung SDC41A6, OLED, 2880x1800, 16" | HP Spectre x360 16-aa0074ng Samsung SDC41A6, OLED, 2880x1800, 16" | HP Spectre x360 2-in-1 16-f1075ng AU Optronics AUO50A3, IPS, 3072x1920, 16" | Honor MagicBook Pro 16 2024 TL160MDMP01, IPS, 3072x1920, 16" | MSI Prestige 16 B1MG-001US AU Optronics B160QAN03.R, IPS, 2560x1600, 16" | LG Gram 2in1 16 16T90R - G.AA78G LP160WQ1-SPB2, IPS, 2560x1600, 16" | |
|---|---|---|---|---|---|---|
| Display | -1% | -15% | -3% | -5% | -5% | |
| Display P3 Coverage (%) | 99.6 | 98.9 -1% | 75.6 -24% | 98.8 -1% | 96.7 -3% | 96.5 -3% |
| sRGB Coverage (%) | 100 | 99.9 0% | 100.2 0% | 100 0% | 99.8 0% | 99.9 0% |
| AdobeRGB 1998 Coverage (%) | 96.7 | 94.4 -2% | 77.2 -20% | 89.1 -8% | 84.6 -13% | 84.6 -13% |
| Response Times | -10% | -4862% | -630% | -5038% | -3606% | |
| Response Time Grey 50% / Grey 80% * (ms) | 0.78 ? | 0.8 ? -3% | 52 ? -6567% | 6.3 ? -708% | 49.4 ? -6233% | 38.4 ? -4823% |
| Response Time Black / White * (ms) | 0.86 ? | 1 ? -16% | 28 ? -3156% | 5.6 ? -551% | 33.9 ? -3842% | 21.4 ? -2388% |
| PWM Frequency (Hz) | 480 ? | 480 | ||||
| Screen | -7% | -102% | 13% | -88% | -58% | |
| Brightness middle (cd/m²) | 385.2 | 424 10% | 425 10% | 551 43% | 473.6 23% | 329 -15% |
| Brightness (cd/m²) | 387 | 425 10% | 406 5% | 524 35% | 456 18% | 310 -20% |
| Brightness Distribution (%) | 99 | 99 0% | 78 -21% | 91 -8% | 87 -12% | 88 -11% |
| Black Level * (cd/m²) | 0.24 | 0.52 | 0.19 | 0.39 | ||
| Colorchecker dE 2000 * | 1.73 | 2.37 -37% | 5.8 -235% | 1.7 2% | 5.9 -241% | 3.52 -103% |
| Colorchecker dE 2000 max. * | 3.95 | 4.97 -26% | 11.03 -179% | 4.1 -4% | 9.37 -137% | 6.96 -76% |
| Greyscale dE 2000 * | 2.6 | 2.55 2% | 7.57 -191% | 2.4 8% | 7.3 -181% | 5.75 -121% |
| Gamma | 2.17 101% | 2.49 88% | 6600 0% | 2.2 100% | 1.9 116% | 2.137 103% |
| CCT | 6133 106% | 6548 99% | 6842 95% | 7260 90% | 7584 86% | |
| Colorchecker dE 2000 calibrated * | 2.26 | 4.16 | 1 | 0.89 | 1.15 | |
| Contrast (:1) | 1771 | 1060 | 2493 | 844 | ||
| Totalt genomsnitt (program/inställningar) | -6% /
-6% | -1660% /
-943% | -207% /
-108% | -1710% /
-966% | -1223% /
-688% |
* ... mindre är bättre
Visa svarstider
| ↔ Svarstid svart till vitt | ||
|---|---|---|
| 0.86 ms ... stiga ↗ och falla ↘ kombinerat | ↗ 0.4 ms stiga | 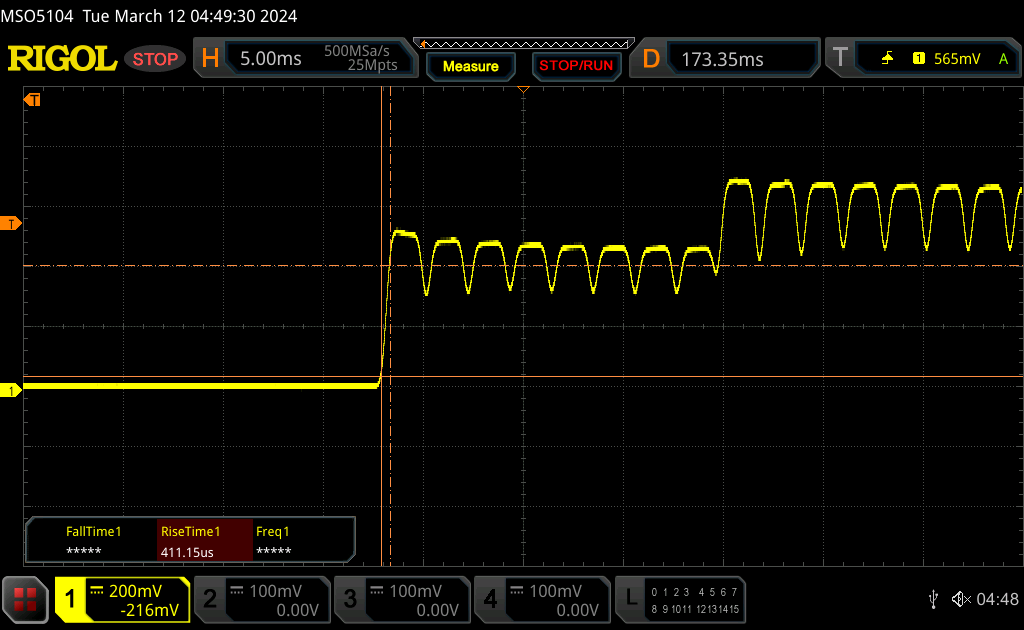 |
| ↘ 0.46 ms hösten | ||
| Skärmen visar väldigt snabba svarsfrekvenser i våra tester och borde vara mycket väl lämpad för fartfyllt spel. I jämförelse sträcker sig alla testade enheter från 0.1 (minst) till 240 (maximalt) ms. » 3 % av alla enheter är bättre. Det betyder att den uppmätta svarstiden är bättre än genomsnittet av alla testade enheter (19.8 ms). | ||
| ↔ Svarstid 50 % grått till 80 % grått | ||
| 0.78 ms ... stiga ↗ och falla ↘ kombinerat | ↗ 0.44 ms stiga |  |
| ↘ 0.34 ms hösten | ||
| Skärmen visar väldigt snabba svarsfrekvenser i våra tester och borde vara mycket väl lämpad för fartfyllt spel. I jämförelse sträcker sig alla testade enheter från 0.165 (minst) till 636 (maximalt) ms. » 3 % av alla enheter är bättre. Det betyder att den uppmätta svarstiden är bättre än genomsnittet av alla testade enheter (31 ms). | ||
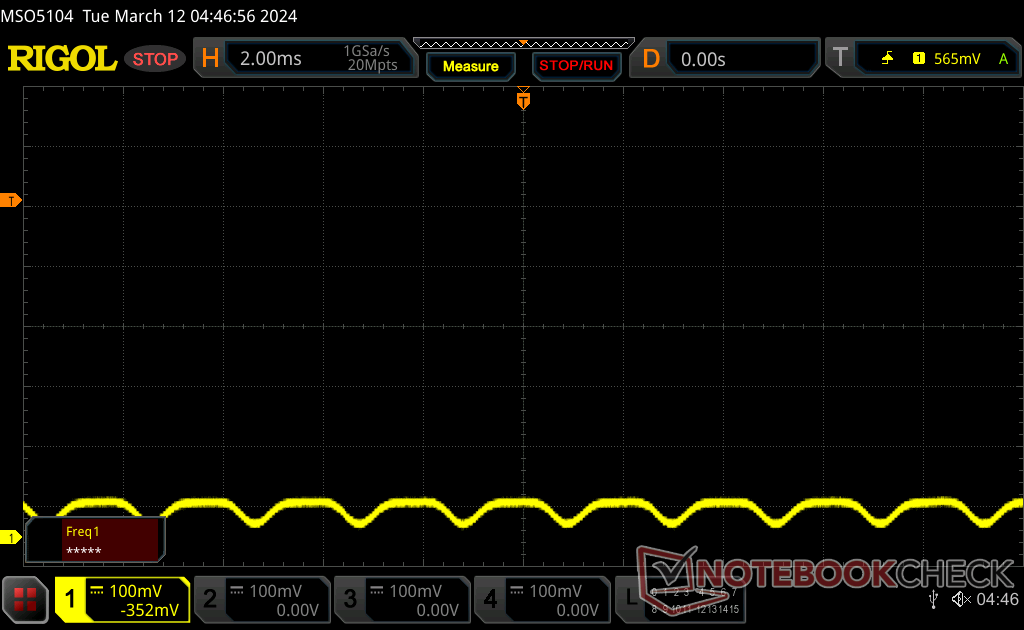
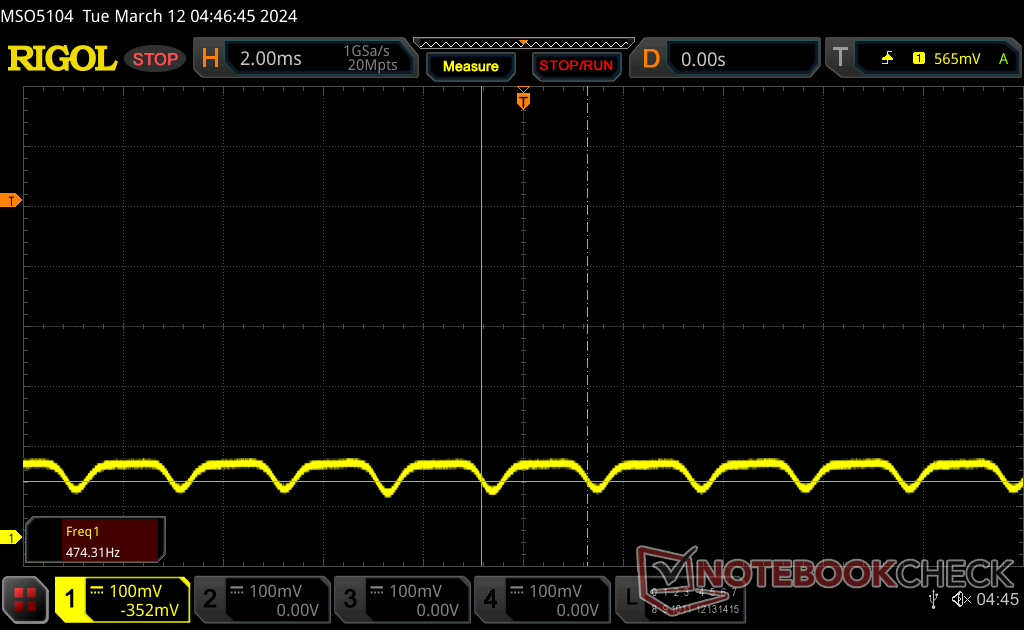
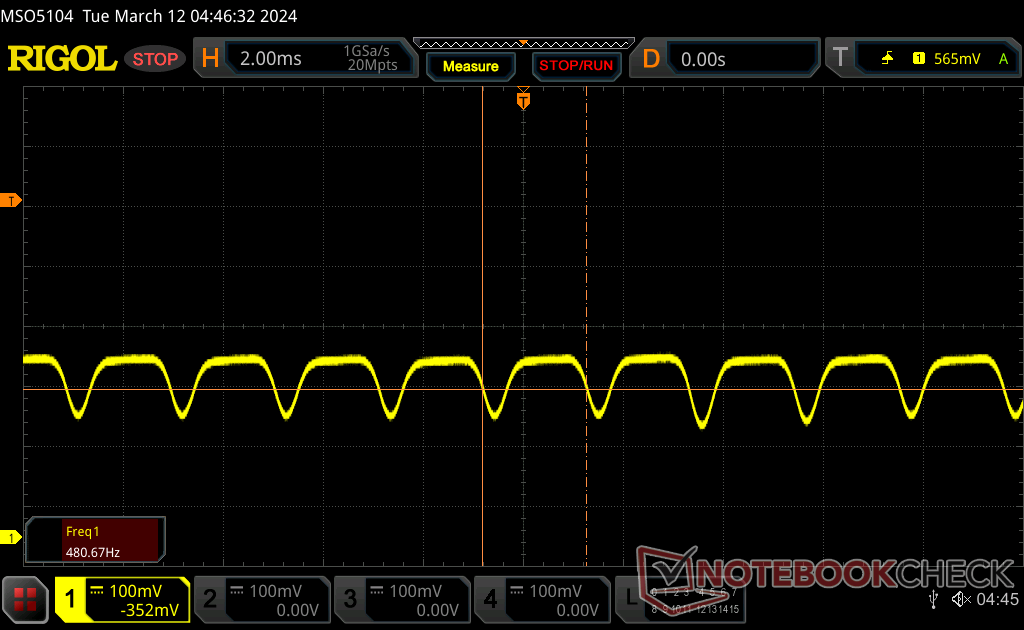
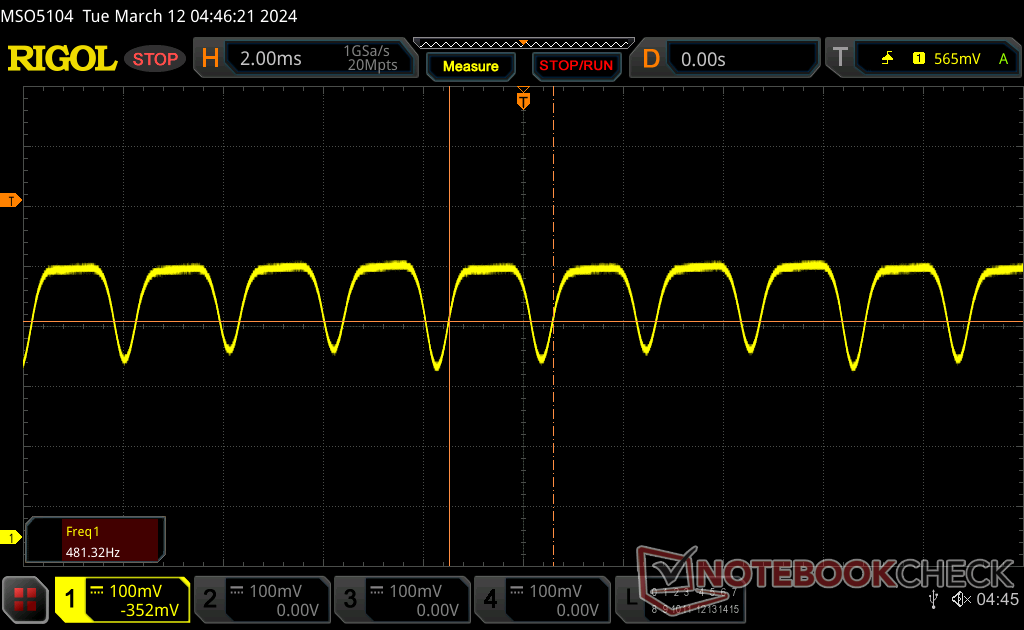
Skärmflimmer / PWM (Puls-Width Modulation)
| Skärmflimmer / PWM upptäckt | 480 Hz | ≤ 100 % ljusstyrka inställning | 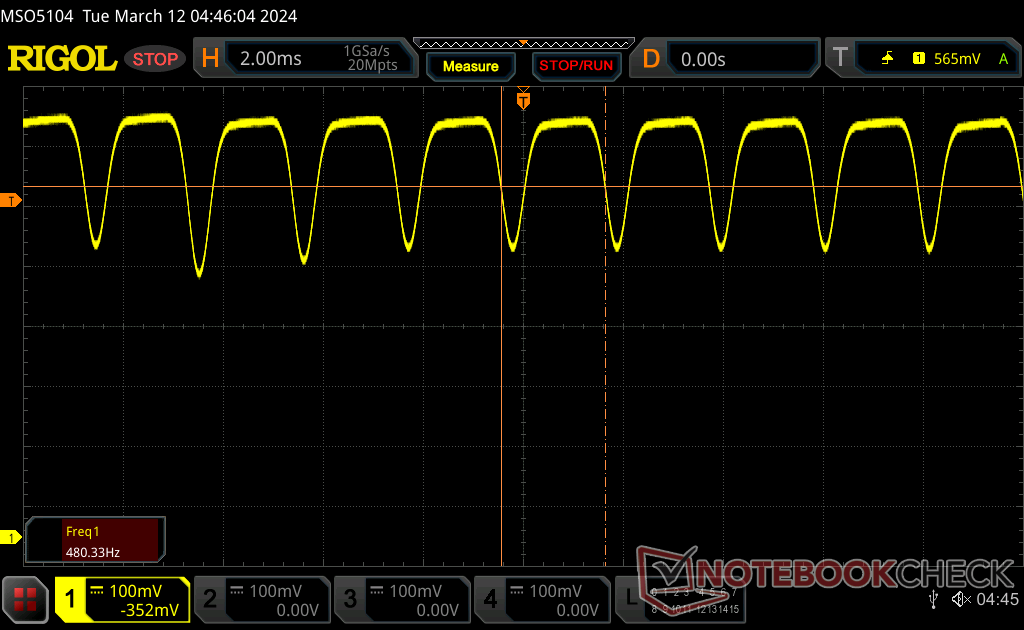 |
Displayens bakgrundsbelysning flimrar vid 480 Hz (i värsta fall, t.ex. med PWM) Flimrande upptäckt vid en ljusstyrkeinställning på 100 % och lägre. Det ska inte finnas något flimmer eller PWM över denna ljusstyrkeinställning. Frekvensen för 480 Hz är relativt hög, så de flesta användare som är känsliga för PWM bör inte märka något flimmer. Det finns dock rapporter om att vissa användare fortfarande är känsliga för PWM vid 500 Hz och högre, så var uppmärksam. Som jämförelse: 52 % av alla testade enheter använder inte PWM för att dämpa skärmen. Om PWM upptäcktes mättes ett medelvärde av 7757 (minst: 5 - maximum: 343500) Hz. | |||


Prestanda
Villkor för testning
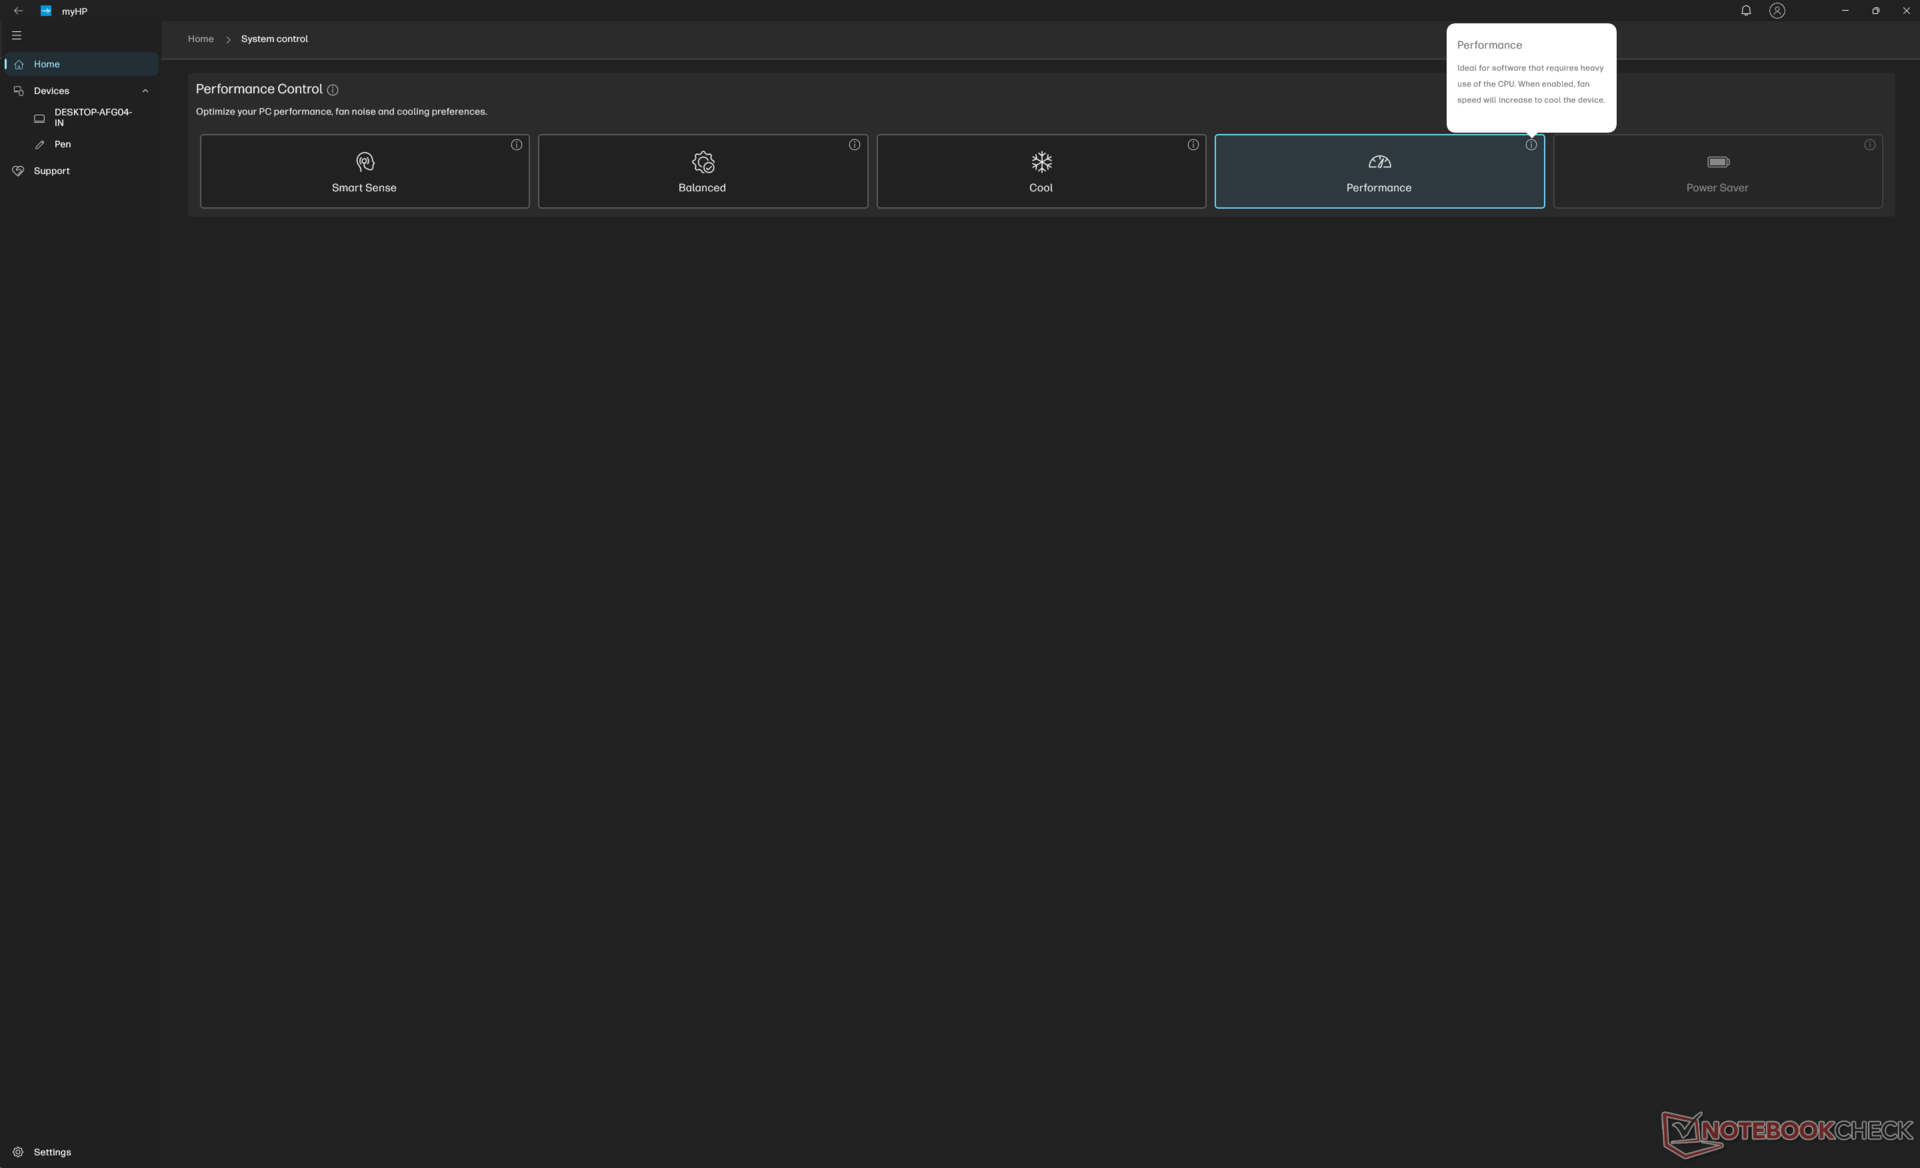
Vi ställde in Windows och MyHP på sina respektive prestandalägen innan vi körde riktmärkena nedan. Både MyHP och Omen Gaming Hub är installerade på systemet, men de flesta av de viktiga funktionerna relaterade till användbarhet och strömprofiler är knutna till MyHP.
Processor
Core Ultra 7 Core Ultra 7 155H i vår dGPU-konfiguration skulle ge lägre resultat än samma CPU i vår iGPU-konfiguration. Skillnaden kan vara så stor som 20 procent mellan de två systemen och resultaten förbättras inte ens efter flera omtester. När vi tittar närmare på CPU-kortets strömförbrukningsnivåer för varje konfiguration, kan CPU:n i vår dGPU-enhet nå så lågt som 28 W medan samma CPU i vår iGPU-enhet stabiliserar sig på en högre effektnivå på 40 W.
HP säger sig vara medvetna om att CPU:n "felaktigt stryps under vissa arbetsbelastningar" och att en programuppdatering är på gång för att lösa problemet. Vi kommer att lägga till de nya resultaten här när uppdateringen är klar.
Cinebench R15 Multi Loop
Cinebench R23: Multi Core | Single Core
Cinebench R20: CPU (Multi Core) | CPU (Single Core)
Cinebench R15: CPU Multi 64Bit | CPU Single 64Bit
Blender: v2.79 BMW27 CPU
7-Zip 18.03: 7z b 4 | 7z b 4 -mmt1
Geekbench 6.7: Multi-Core | Single-Core
Geekbench 5.5: Multi-Core | Single-Core
HWBOT x265 Benchmark v2.2: 4k Preset
LibreOffice : 20 Documents To PDF
R Benchmark 2.5: Overall mean
* ... mindre är bättre
AIDA64: FP32 Ray-Trace | FPU Julia | CPU SHA3 | CPU Queen | FPU SinJulia | FPU Mandel | CPU AES | CPU ZLib | FP64 Ray-Trace | CPU PhotoWorxx
| Performance rating | |
| Honor MagicBook Pro 16 2024 | |
| MSI Prestige 16 B1MG-001US | |
| HP Spectre x360 16 RTX 4050 | |
| Genomsnitt Intel Core Ultra 7 155H | |
| HP Spectre x360 16-aa0074ng | |
| HP Spectre x360 2-in-1 16-f1075ng | |
| LG Gram 2in1 16 16T90R - G.AA78G | |
| AIDA64 / FP32 Ray-Trace | |
| Honor MagicBook Pro 16 2024 | |
| MSI Prestige 16 B1MG-001US | |
| HP Spectre x360 16 RTX 4050 | |
| Genomsnitt Intel Core Ultra 7 155H (6670 - 18470, n=50) | |
| HP Spectre x360 16-aa0074ng | |
| HP Spectre x360 2-in-1 16-f1075ng | |
| LG Gram 2in1 16 16T90R - G.AA78G | |
| LG Gram 2in1 16 16T90R - G.AA78G | |
| AIDA64 / FPU Julia | |
| Honor MagicBook Pro 16 2024 | |
| MSI Prestige 16 B1MG-001US | |
| HP Spectre x360 16 RTX 4050 | |
| Genomsnitt Intel Core Ultra 7 155H (40905 - 93181, n=50) | |
| HP Spectre x360 16-aa0074ng | |
| HP Spectre x360 2-in-1 16-f1075ng | |
| LG Gram 2in1 16 16T90R - G.AA78G | |
| AIDA64 / CPU SHA3 | |
| Honor MagicBook Pro 16 2024 | |
| MSI Prestige 16 B1MG-001US | |
| HP Spectre x360 16 RTX 4050 | |
| Genomsnitt Intel Core Ultra 7 155H (1940 - 4436, n=50) | |
| HP Spectre x360 16-aa0074ng | |
| HP Spectre x360 2-in-1 16-f1075ng | |
| LG Gram 2in1 16 16T90R - G.AA78G | |
| AIDA64 / CPU Queen | |
| MSI Prestige 16 B1MG-001US | |
| HP Spectre x360 2-in-1 16-f1075ng | |
| HP Spectre x360 16-aa0074ng | |
| Honor MagicBook Pro 16 2024 | |
| Genomsnitt Intel Core Ultra 7 155H (64698 - 94181, n=50) | |
| LG Gram 2in1 16 16T90R - G.AA78G | |
| HP Spectre x360 16 RTX 4050 | |
| AIDA64 / FPU SinJulia | |
| Honor MagicBook Pro 16 2024 | |
| MSI Prestige 16 B1MG-001US | |
| HP Spectre x360 16 RTX 4050 | |
| HP Spectre x360 16-aa0074ng | |
| Genomsnitt Intel Core Ultra 7 155H (5639 - 10647, n=50) | |
| HP Spectre x360 2-in-1 16-f1075ng | |
| LG Gram 2in1 16 16T90R - G.AA78G | |
| AIDA64 / FPU Mandel | |
| Honor MagicBook Pro 16 2024 | |
| MSI Prestige 16 B1MG-001US | |
| HP Spectre x360 16 RTX 4050 | |
| Genomsnitt Intel Core Ultra 7 155H (18236 - 47685, n=50) | |
| HP Spectre x360 16-aa0074ng | |
| HP Spectre x360 2-in-1 16-f1075ng | |
| LG Gram 2in1 16 16T90R - G.AA78G | |
| AIDA64 / CPU AES | |
| Honor MagicBook Pro 16 2024 | |
| HP Spectre x360 2-in-1 16-f1075ng | |
| LG Gram 2in1 16 16T90R - G.AA78G | |
| Genomsnitt Intel Core Ultra 7 155H (45713 - 152179, n=50) | |
| MSI Prestige 16 B1MG-001US | |
| HP Spectre x360 16 RTX 4050 | |
| HP Spectre x360 16-aa0074ng | |
| AIDA64 / CPU ZLib | |
| Honor MagicBook Pro 16 2024 | |
| MSI Prestige 16 B1MG-001US | |
| HP Spectre x360 16 RTX 4050 | |
| Genomsnitt Intel Core Ultra 7 155H (557 - 1250, n=50) | |
| HP Spectre x360 16-aa0074ng | |
| HP Spectre x360 2-in-1 16-f1075ng | |
| LG Gram 2in1 16 16T90R - G.AA78G | |
| AIDA64 / FP64 Ray-Trace | |
| Honor MagicBook Pro 16 2024 | |
| MSI Prestige 16 B1MG-001US | |
| HP Spectre x360 16 RTX 4050 | |
| Genomsnitt Intel Core Ultra 7 155H (3569 - 9802, n=50) | |
| HP Spectre x360 16-aa0074ng | |
| HP Spectre x360 2-in-1 16-f1075ng | |
| LG Gram 2in1 16 16T90R - G.AA78G | |
| AIDA64 / CPU PhotoWorxx | |
| HP Spectre x360 16-aa0074ng | |
| HP Spectre x360 16 RTX 4050 | |
| Genomsnitt Intel Core Ultra 7 155H (32719 - 54223, n=50) | |
| MSI Prestige 16 B1MG-001US | |
| Honor MagicBook Pro 16 2024 | |
| LG Gram 2in1 16 16T90R - G.AA78G | |
| HP Spectre x360 2-in-1 16-f1075ng | |
Stresstest
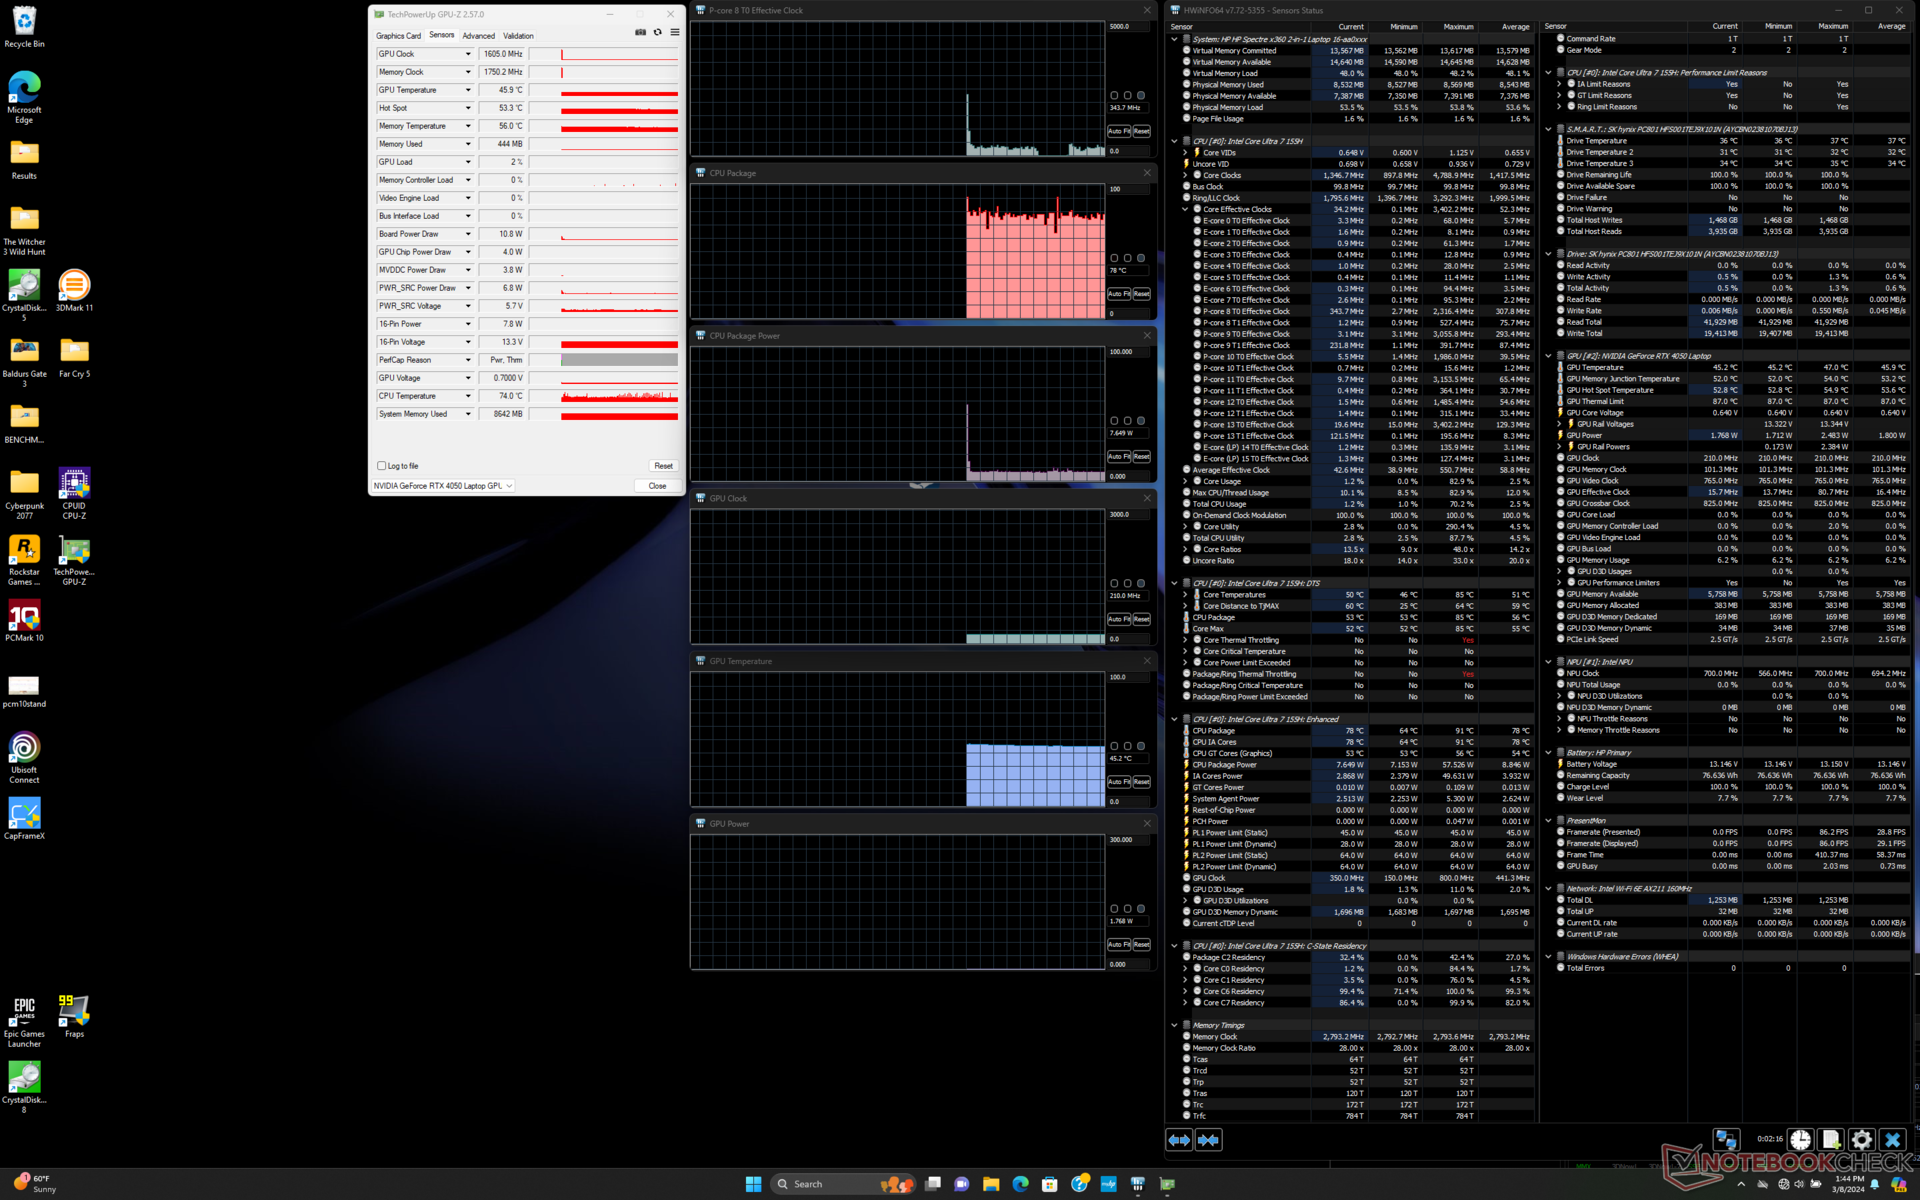
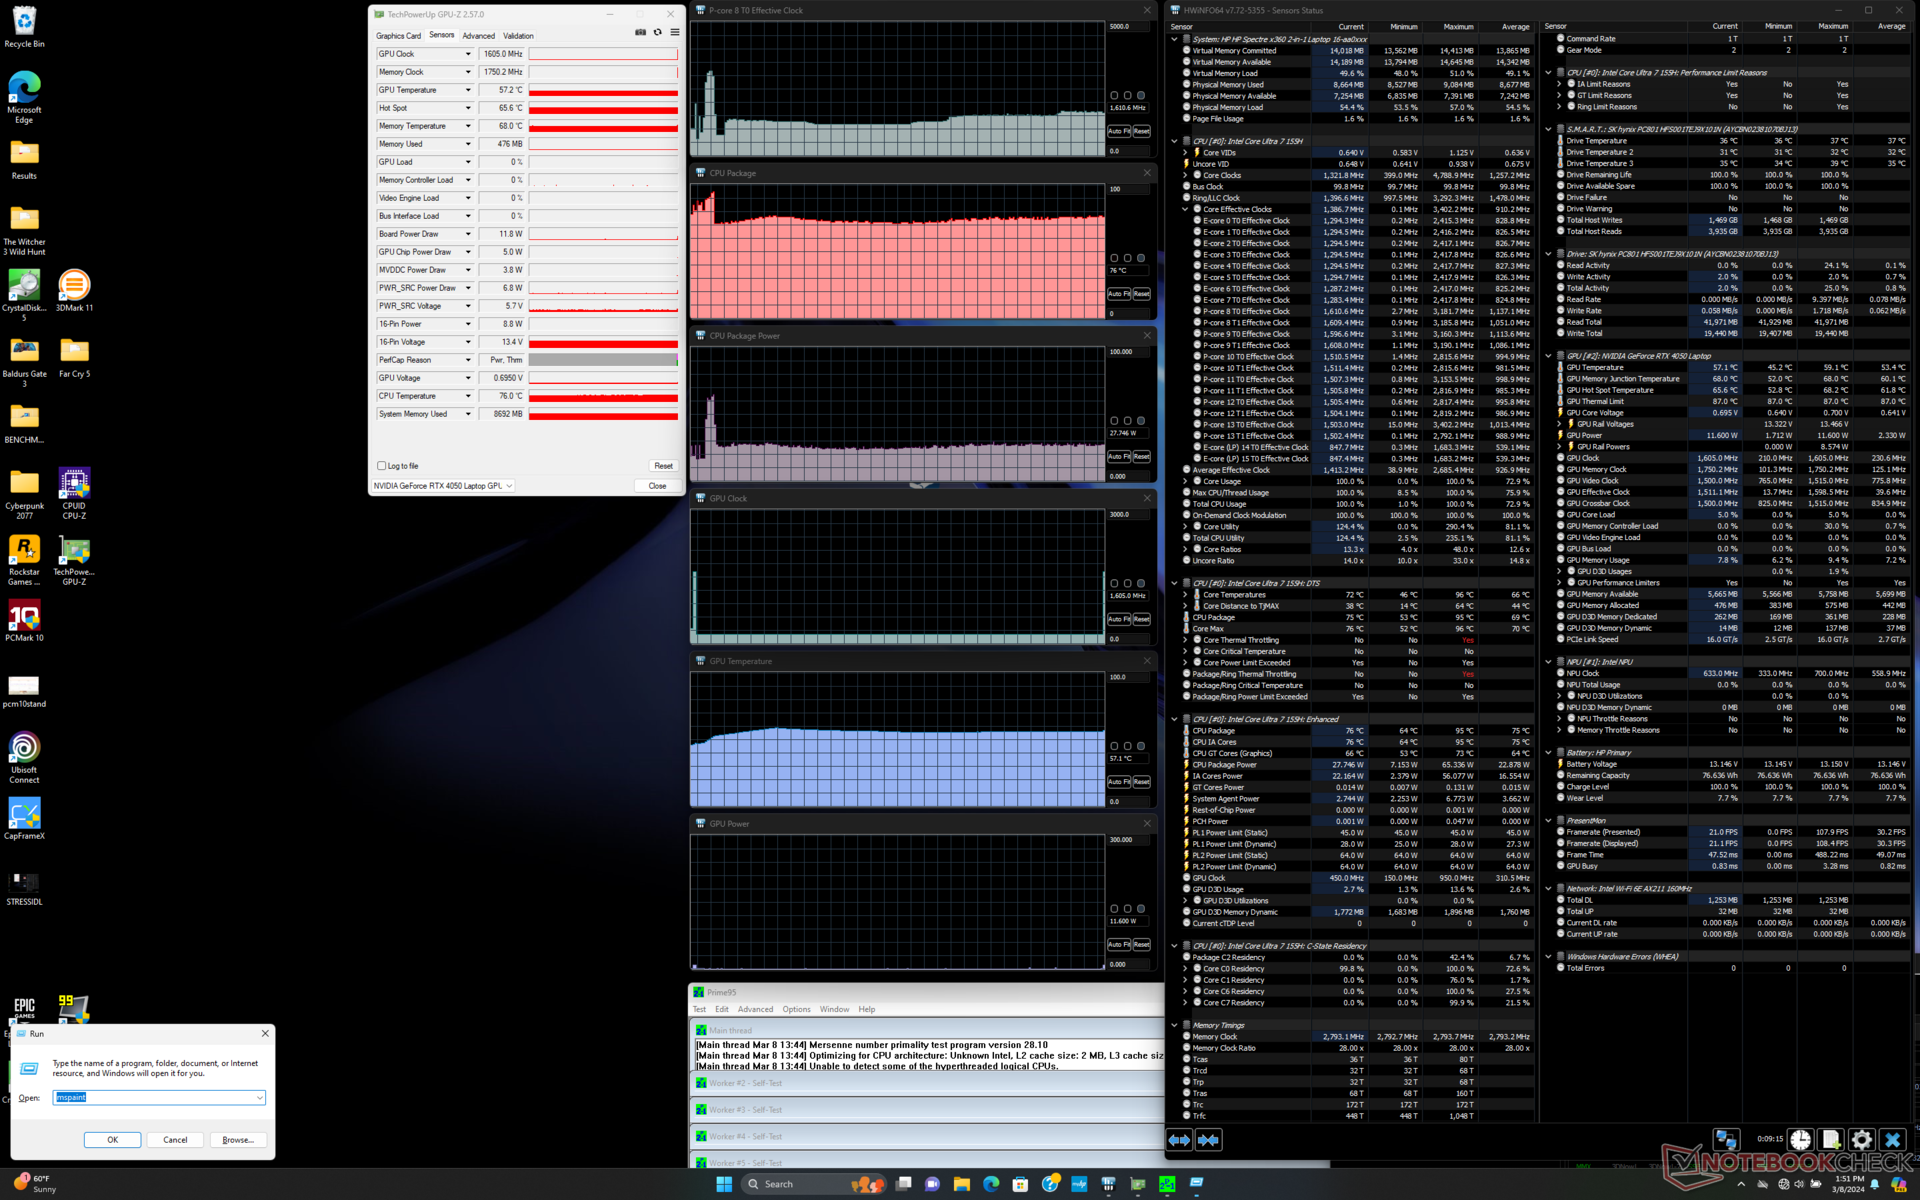
CPU-klockfrekvensen och kortets strömförbrukning vid Prime95-stress skulle nå 3,2 GHz respektive 65 W, innan de sjönk till bara 1,4 GHz och 28 W några sekunder senare, vilket representerar en relativt brant prestandanedgång. Kärntemperaturen kan bli så hög som 95 C när Turbo Boost når 3,2 GHz och därför är de långsammare klockfrekvenserna nödvändiga för att hålla temperaturen i schack.
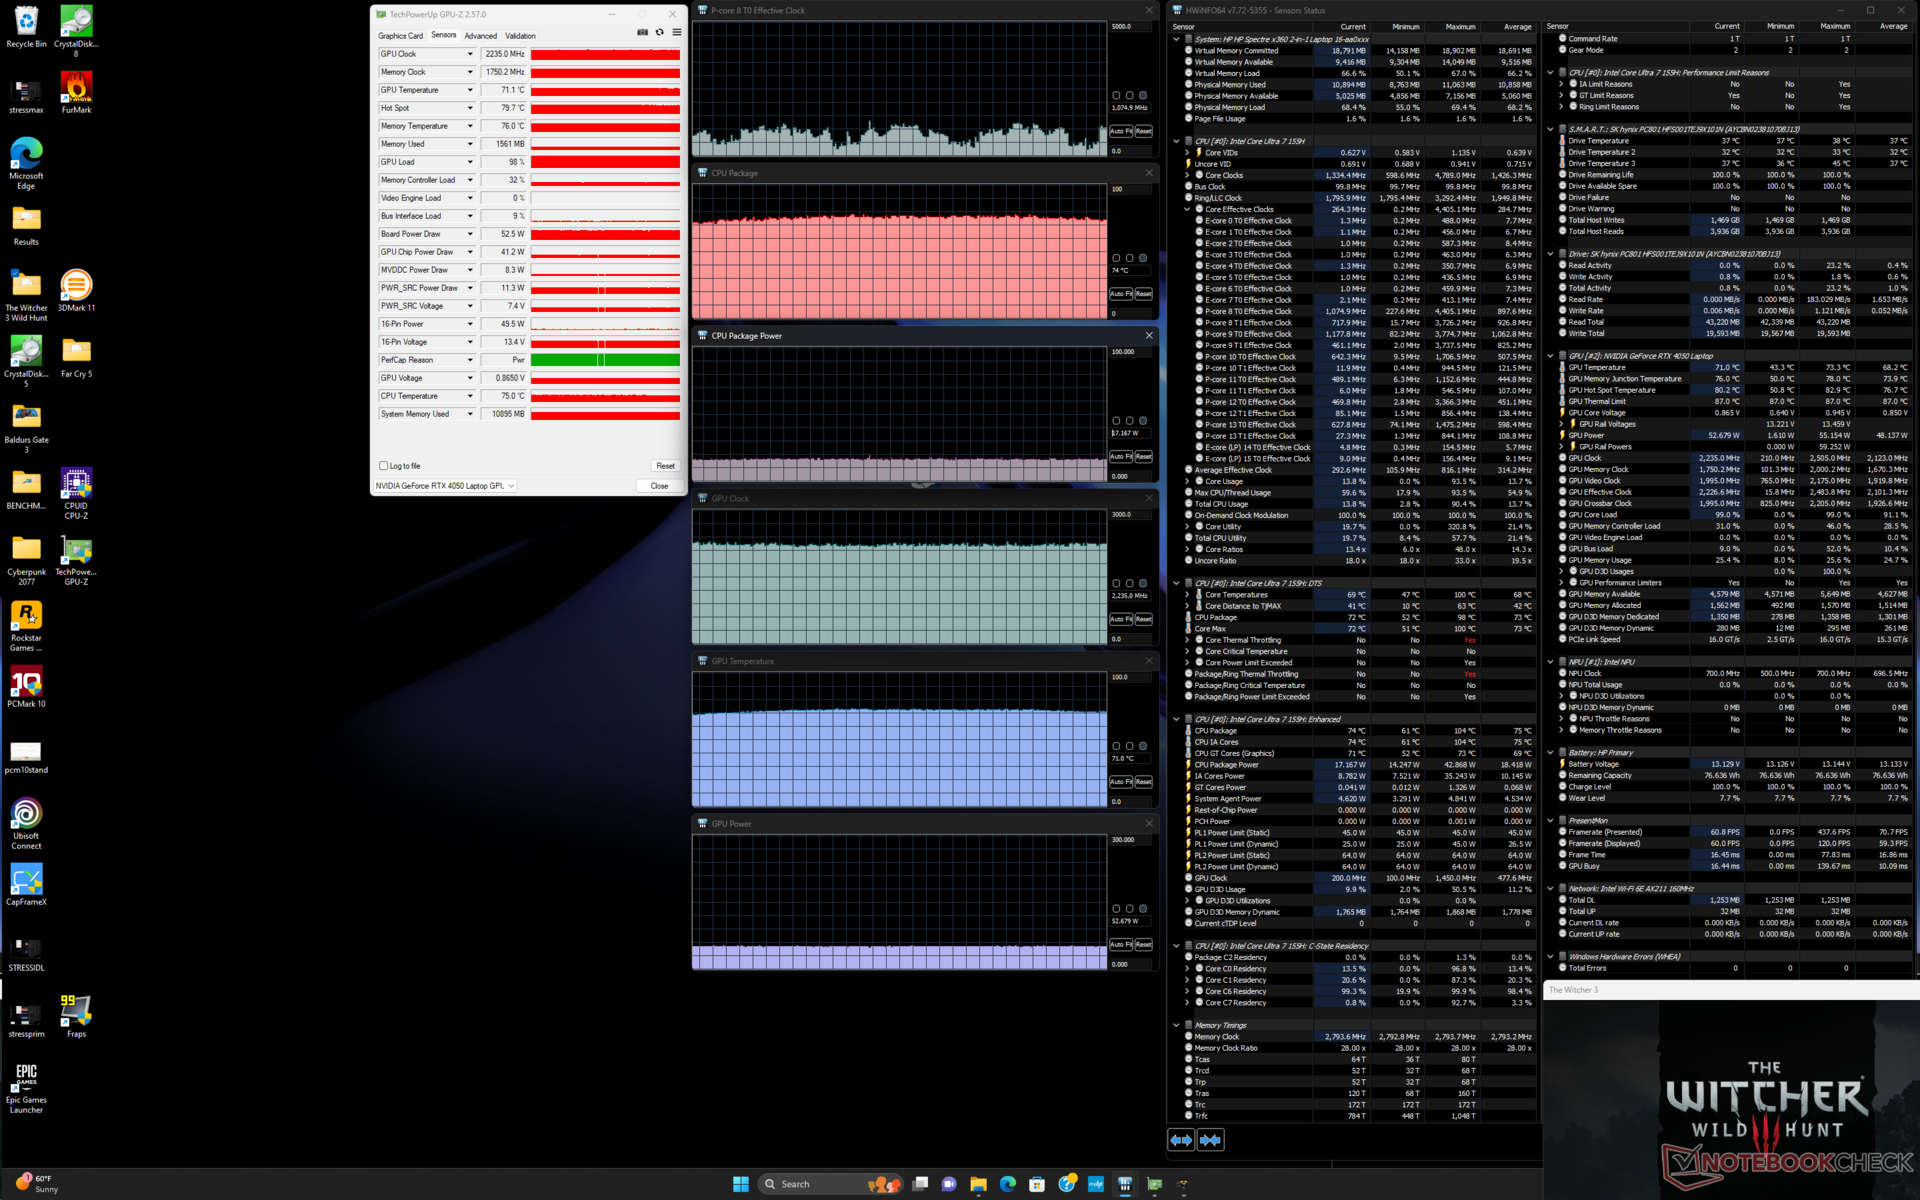
Grafikprestandan skiljer sig åt mellan lägena Balanserad och Prestanda. Till exempel skulle GPU-klockfrekvensen och kortets strömförbrukning vid körning Witcher 3 i läget Balanserad stabiliseras vid 1920 MHz respektive 39 W, jämfört med 2235 MHz och 53 W i läget Prestanda. Kärntemperaturen är också varmare i Performance-läget, vilket framgår av tabellen nedan.

| CPU-klocka (GHz) | GPU-klocka (MHz) | Genomsnittlig CPU-temperatur (°C) | Genomsnittlig GPU-temperatur (°C) | |
| System i viloläge | -- | -- | 53 | 45 |
| Prime95 Stress | ~1,5 | -- | 75 | 57 |
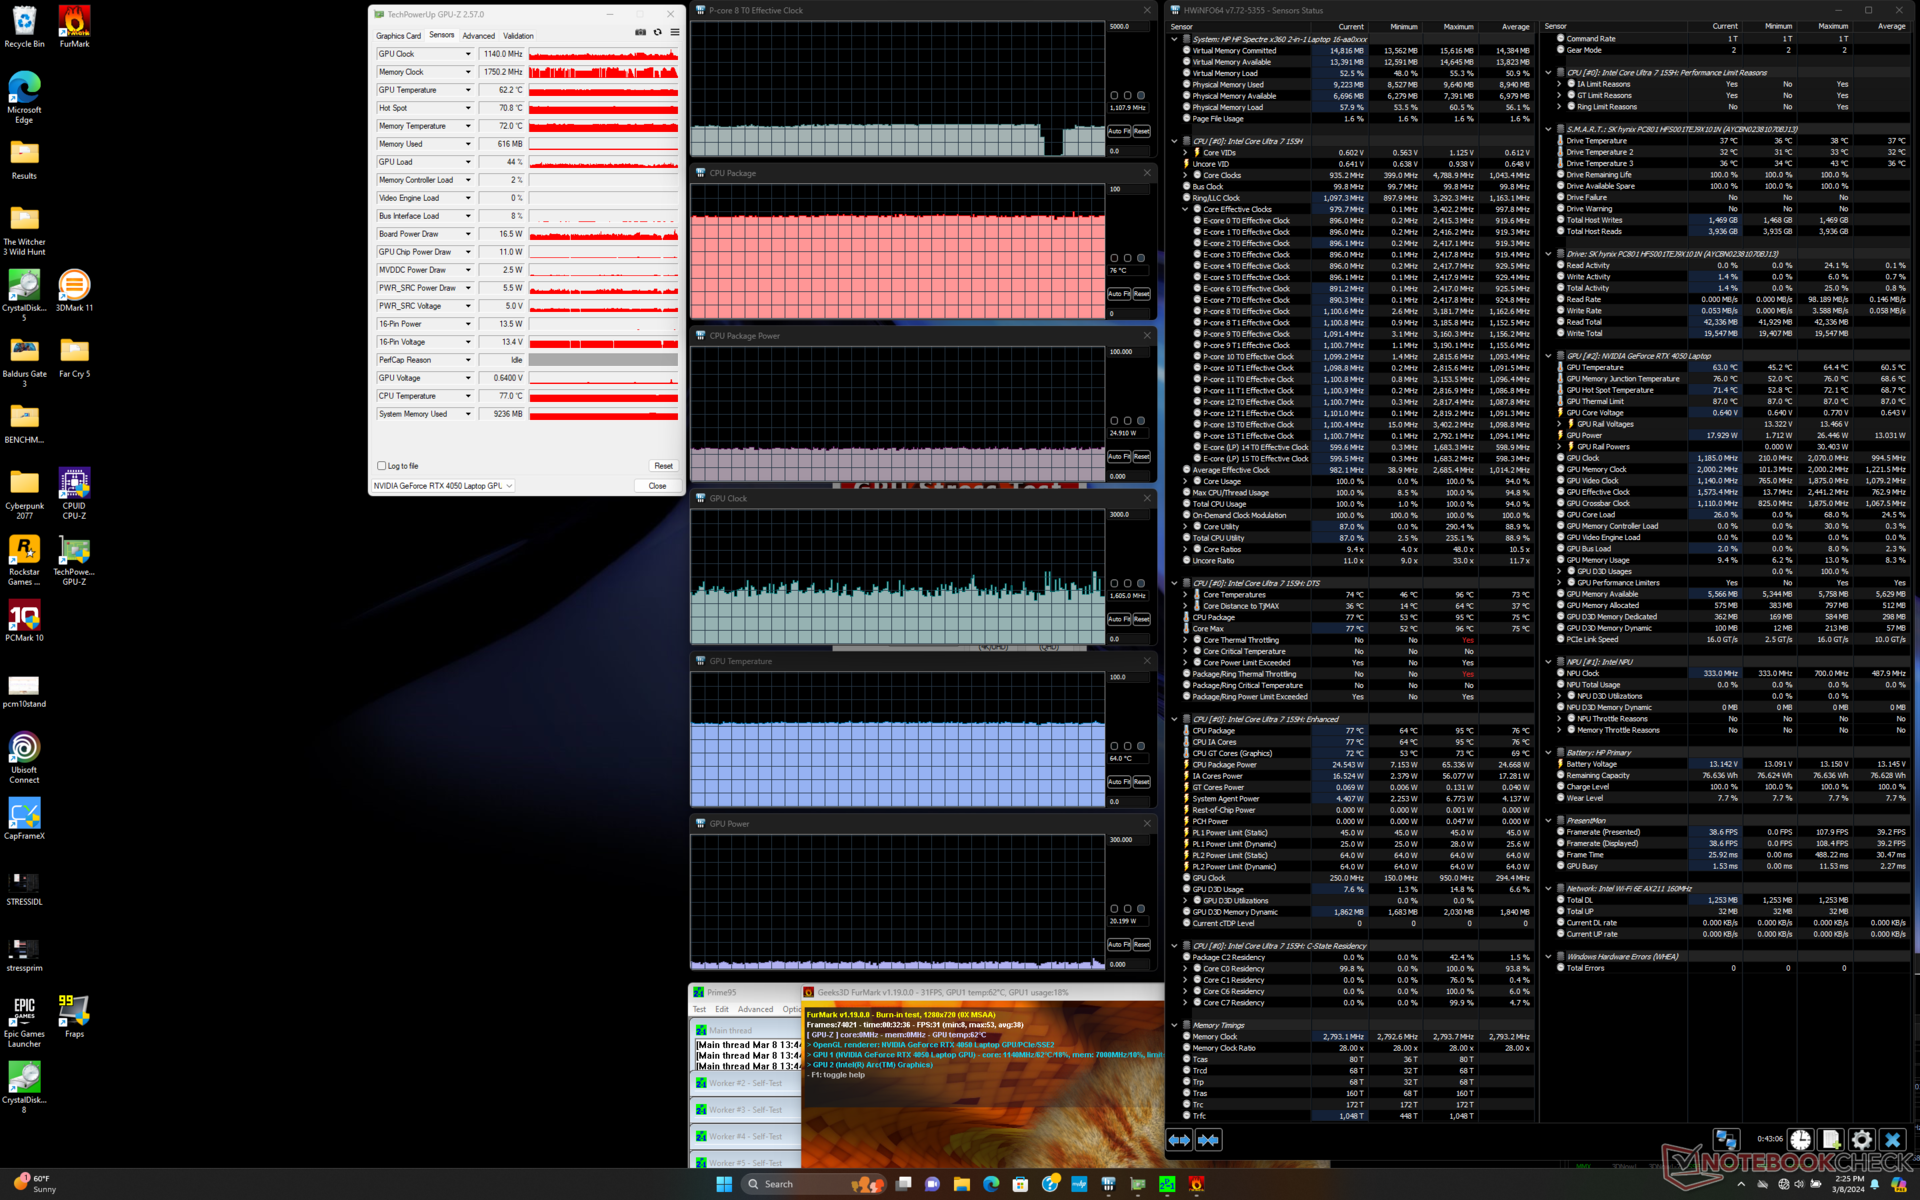
| Prime95 + FurMark Stress | ~1.1 | ~1140 | 77 | 64 |
| Witcher 3 Stress(balanserat läge) | ~1.1 | 1920 | 66 | 62 |
| Witcher 3 Stress (Performance mode) | ~1.1 | 2235 | 72 | 71 |
Systemets prestanda
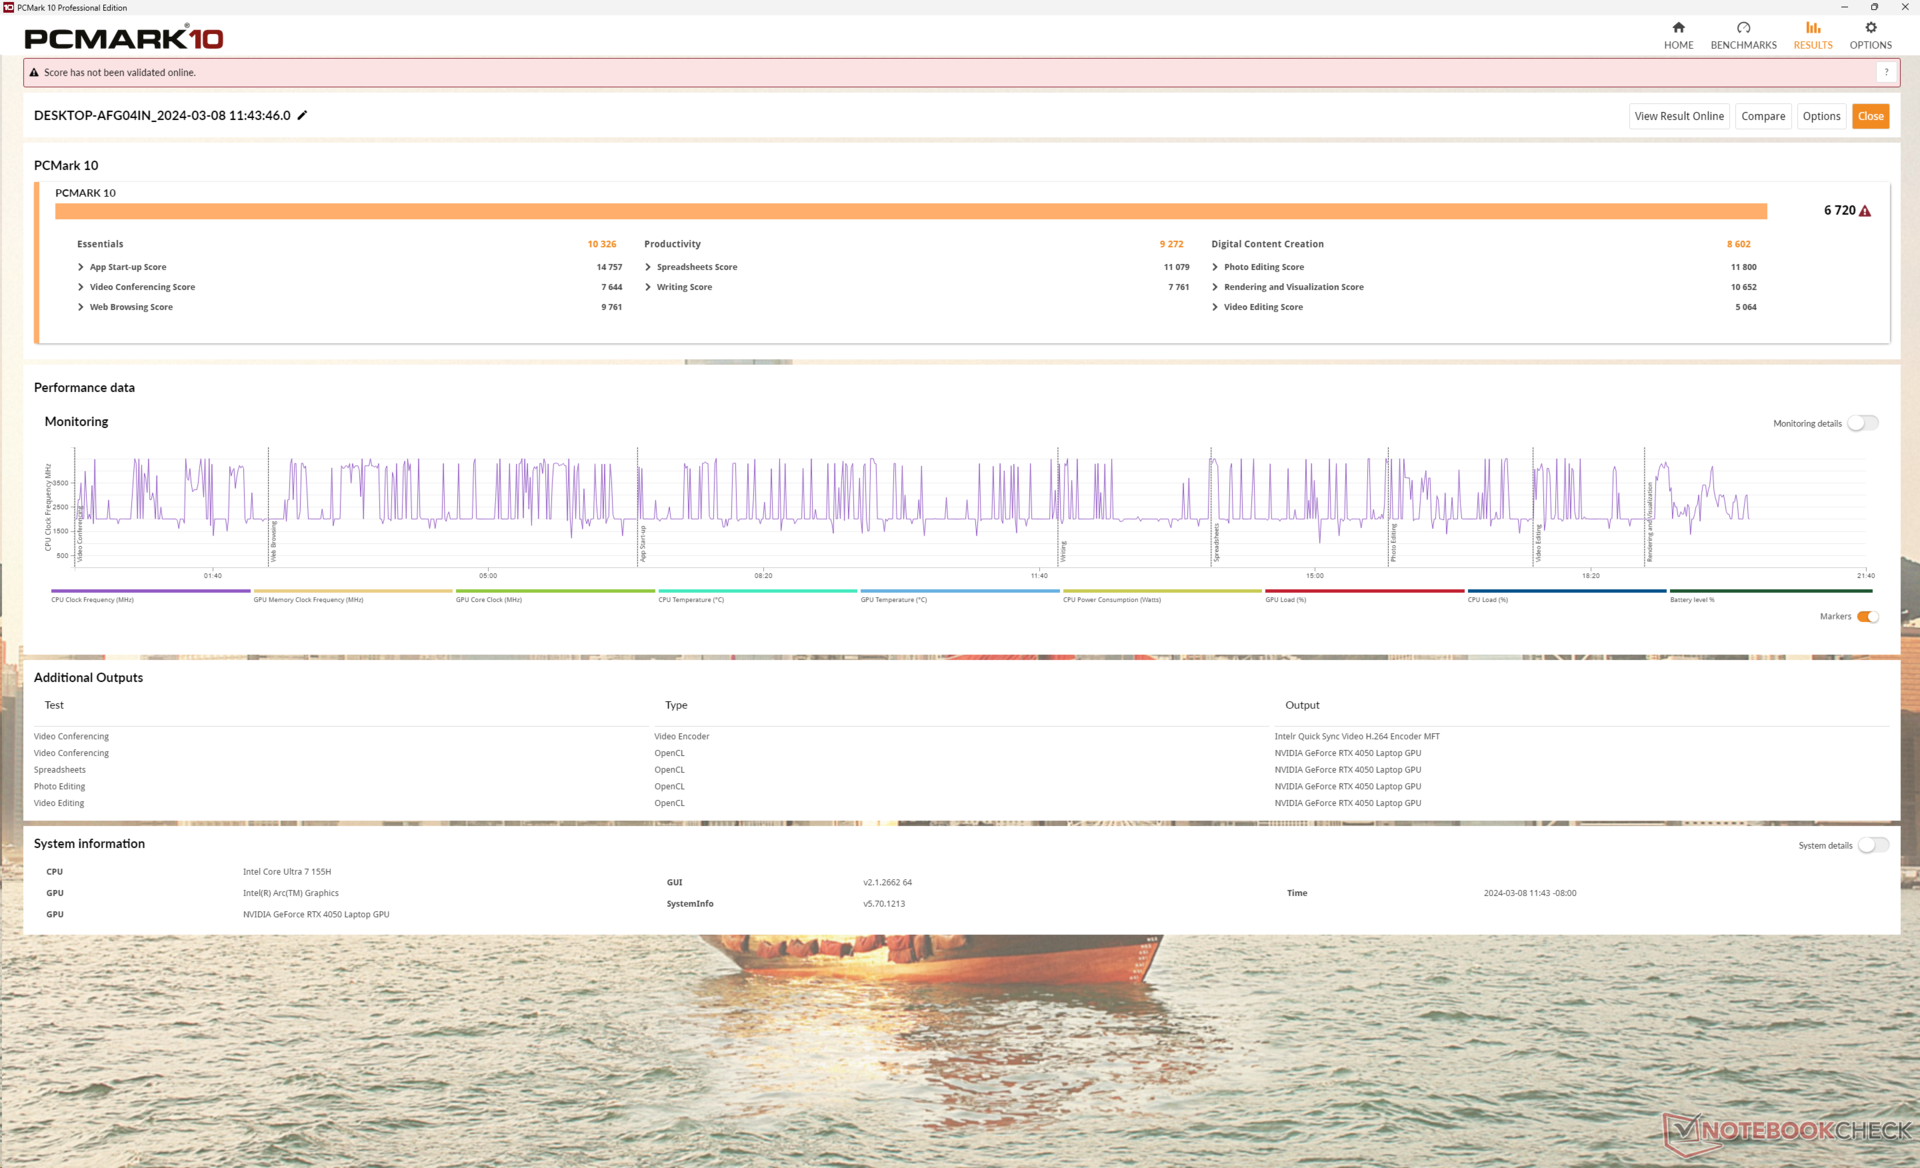
PCMark 10-resultaten är jämförbara med iGPU-konfigurationen för samma modell, även om vår dGPU-version är betydligt snabbare. PCMark har dock aldrig varit ett korrekt GPU-benchmarkingverktyg för system med Optimus 1.0-grafik som vår Spectre x360 16-serie.
CrossMark: Overall | Productivity | Creativity | Responsiveness
WebXPRT 3: Overall
WebXPRT 4: Overall
Mozilla Kraken 1.1: Total
| PCMark 10 / Score | |
| MSI Prestige 16 B1MG-001US | |
| HP Spectre x360 16-aa0074ng | |
| Genomsnitt Intel Core Ultra 7 155H, NVIDIA GeForce RTX 4050 Laptop GPU (6537 - 6973, n=5) | |
| Honor MagicBook Pro 16 2024 | |
| HP Spectre x360 16 RTX 4050 | |
| HP Spectre x360 2-in-1 16-f1075ng | |
| LG Gram 2in1 16 16T90R - G.AA78G | |
| PCMark 10 / Essentials | |
| LG Gram 2in1 16 16T90R - G.AA78G | |
| MSI Prestige 16 B1MG-001US | |
| HP Spectre x360 2-in-1 16-f1075ng | |
| HP Spectre x360 16-aa0074ng | |
| HP Spectre x360 16 RTX 4050 | |
| Genomsnitt Intel Core Ultra 7 155H, NVIDIA GeForce RTX 4050 Laptop GPU (9463 - 10446, n=5) | |
| Honor MagicBook Pro 16 2024 | |
| PCMark 10 / Productivity | |
| HP Spectre x360 16 RTX 4050 | |
| Genomsnitt Intel Core Ultra 7 155H, NVIDIA GeForce RTX 4050 Laptop GPU (8769 - 9272, n=5) | |
| HP Spectre x360 16-aa0074ng | |
| MSI Prestige 16 B1MG-001US | |
| Honor MagicBook Pro 16 2024 | |
| HP Spectre x360 2-in-1 16-f1075ng | |
| LG Gram 2in1 16 16T90R - G.AA78G | |
| PCMark 10 / Digital Content Creation | |
| Honor MagicBook Pro 16 2024 | |
| MSI Prestige 16 B1MG-001US | |
| Genomsnitt Intel Core Ultra 7 155H, NVIDIA GeForce RTX 4050 Laptop GPU (8602 - 10622, n=5) | |
| HP Spectre x360 16-aa0074ng | |
| HP Spectre x360 16 RTX 4050 | |
| HP Spectre x360 2-in-1 16-f1075ng | |
| LG Gram 2in1 16 16T90R - G.AA78G | |
| CrossMark / Overall | |
| MSI Prestige 16 B1MG-001US | |
| Honor MagicBook Pro 16 2024 | |
| HP Spectre x360 16-aa0074ng | |
| HP Spectre x360 2-in-1 16-f1075ng | |
| Genomsnitt Intel Core Ultra 7 155H, NVIDIA GeForce RTX 4050 Laptop GPU (1552 - 1740, n=5) | |
| HP Spectre x360 16 RTX 4050 | |
| LG Gram 2in1 16 16T90R - G.AA78G | |
| CrossMark / Productivity | |
| HP Spectre x360 2-in-1 16-f1075ng | |
| MSI Prestige 16 B1MG-001US | |
| Honor MagicBook Pro 16 2024 | |
| HP Spectre x360 16-aa0074ng | |
| Genomsnitt Intel Core Ultra 7 155H, NVIDIA GeForce RTX 4050 Laptop GPU (1459 - 1659, n=5) | |
| LG Gram 2in1 16 16T90R - G.AA78G | |
| HP Spectre x360 16 RTX 4050 | |
| CrossMark / Creativity | |
| MSI Prestige 16 B1MG-001US | |
| HP Spectre x360 16-aa0074ng | |
| Genomsnitt Intel Core Ultra 7 155H, NVIDIA GeForce RTX 4050 Laptop GPU (1811 - 1943, n=5) | |
| HP Spectre x360 16 RTX 4050 | |
| Honor MagicBook Pro 16 2024 | |
| HP Spectre x360 2-in-1 16-f1075ng | |
| LG Gram 2in1 16 16T90R - G.AA78G | |
| CrossMark / Responsiveness | |
| HP Spectre x360 2-in-1 16-f1075ng | |
| Honor MagicBook Pro 16 2024 | |
| MSI Prestige 16 B1MG-001US | |
| LG Gram 2in1 16 16T90R - G.AA78G | |
| HP Spectre x360 16-aa0074ng | |
| Genomsnitt Intel Core Ultra 7 155H, NVIDIA GeForce RTX 4050 Laptop GPU (1167 - 1467, n=5) | |
| HP Spectre x360 16 RTX 4050 | |
| WebXPRT 3 / Overall | |
| MSI Prestige 16 B1MG-001US | |
| Honor MagicBook Pro 16 2024 | |
| HP Spectre x360 16 RTX 4050 | |
| Genomsnitt Intel Core Ultra 7 155H, NVIDIA GeForce RTX 4050 Laptop GPU (262 - 285, n=5) | |
| HP Spectre x360 16-aa0074ng | |
| HP Spectre x360 2-in-1 16-f1075ng | |
| LG Gram 2in1 16 16T90R - G.AA78G | |
| WebXPRT 4 / Overall | |
| MSI Prestige 16 B1MG-001US | |
| HP Spectre x360 16-aa0074ng | |
| Honor MagicBook Pro 16 2024 | |
| HP Spectre x360 16 RTX 4050 | |
| Genomsnitt Intel Core Ultra 7 155H, NVIDIA GeForce RTX 4050 Laptop GPU (247 - 260, n=5) | |
| HP Spectre x360 2-in-1 16-f1075ng | |
| Mozilla Kraken 1.1 / Total | |
| LG Gram 2in1 16 16T90R - G.AA78G | |
| HP Spectre x360 16 RTX 4050 | |
| MSI Prestige 16 B1MG-001US | |
| HP Spectre x360 2-in-1 16-f1075ng | |
| Honor MagicBook Pro 16 2024 | |
| HP Spectre x360 16-aa0074ng | |
| Genomsnitt Intel Core Ultra 7 155H, NVIDIA GeForce RTX 4050 Laptop GPU (416 - 561, n=5) | |
* ... mindre är bättre
| PCMark 10 Score | 6720 poäng | |
Hjälp | ||
| AIDA64 / Memory Copy | |
| HP Spectre x360 16-aa0074ng | |
| HP Spectre x360 16 RTX 4050 | |
| Honor MagicBook Pro 16 2024 | |
| Genomsnitt Intel Core Ultra 7 155H (62397 - 96791, n=50) | |
| MSI Prestige 16 B1MG-001US | |
| LG Gram 2in1 16 16T90R - G.AA78G | |
| HP Spectre x360 2-in-1 16-f1075ng | |
| AIDA64 / Memory Read | |
| HP Spectre x360 16 RTX 4050 | |
| HP Spectre x360 16-aa0074ng | |
| Genomsnitt Intel Core Ultra 7 155H (60544 - 90647, n=50) | |
| Honor MagicBook Pro 16 2024 | |
| MSI Prestige 16 B1MG-001US | |
| LG Gram 2in1 16 16T90R - G.AA78G | |
| HP Spectre x360 2-in-1 16-f1075ng | |
| AIDA64 / Memory Write | |
| HP Spectre x360 16 RTX 4050 | |
| LG Gram 2in1 16 16T90R - G.AA78G | |
| MSI Prestige 16 B1MG-001US | |
| Honor MagicBook Pro 16 2024 | |
| HP Spectre x360 16-aa0074ng | |
| Genomsnitt Intel Core Ultra 7 155H (58692 - 93451, n=50) | |
| HP Spectre x360 2-in-1 16-f1075ng | |
| AIDA64 / Memory Latency | |
| Genomsnitt Intel Core Ultra 7 155H (116.2 - 233, n=50) | |
| Honor MagicBook Pro 16 2024 | |
| HP Spectre x360 16-aa0074ng | |
| HP Spectre x360 16 RTX 4050 | |
| MSI Prestige 16 B1MG-001US | |
| LG Gram 2in1 16 16T90R - G.AA78G | |
| HP Spectre x360 2-in-1 16-f1075ng | |
* ... mindre är bättre
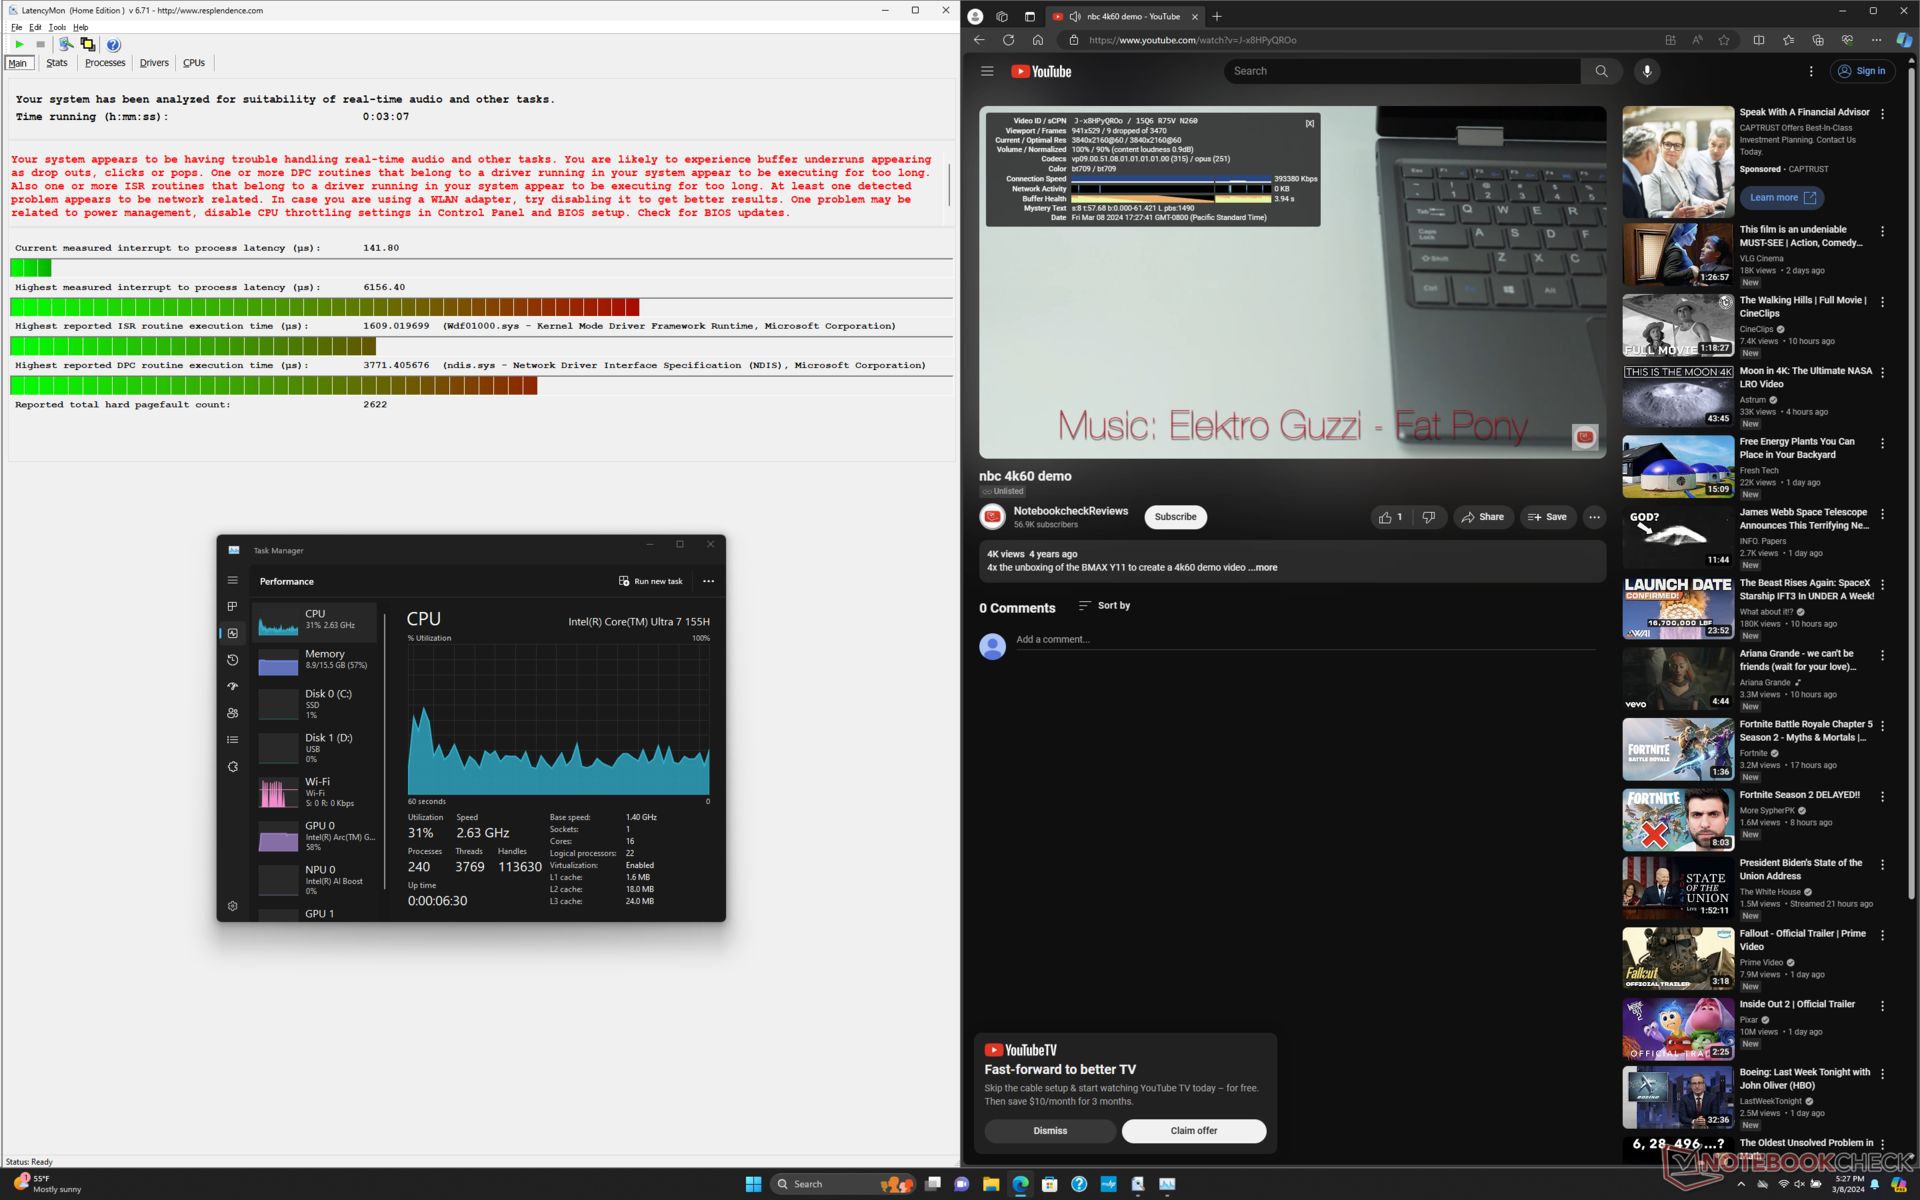
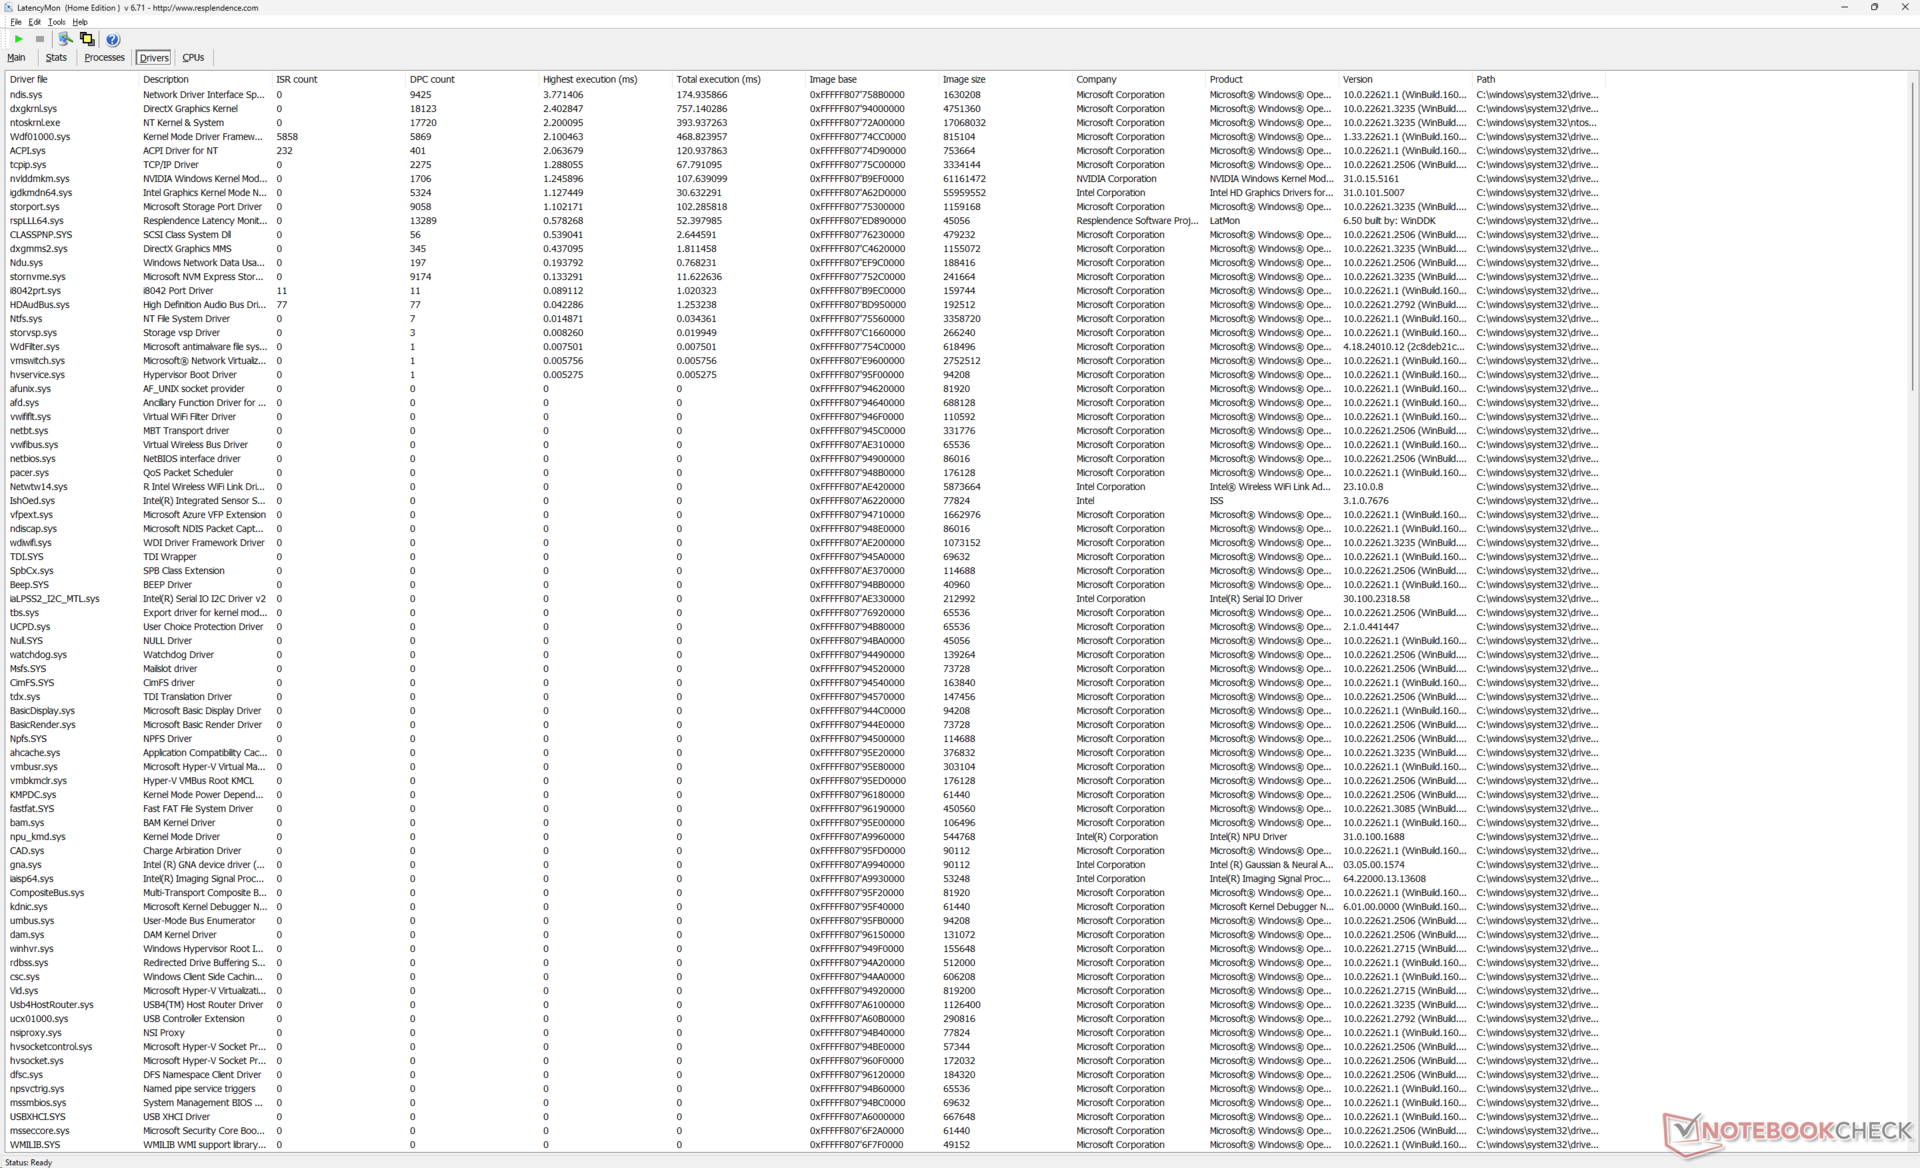
DPC-fördröjning
LatencyMon avslöjar både DPC-problem och tappade bildrutor under vårt minutlånga 4K60-videotest. Vår iGPU-recensionsenhet uppvisade också tappade bildrutor under samma test, vilket tyder på ett potentiellt underliggande problem i båda konfigurationerna.
| DPC Latencies / LatencyMon - interrupt to process latency (max), Web, Youtube, Prime95 | |
| LG Gram 2in1 16 16T90R - G.AA78G | |
| HP Spectre x360 16 RTX 4050 | |
| Honor MagicBook Pro 16 2024 | |
| HP Spectre x360 2-in-1 16-f1075ng | |
| HP Spectre x360 16-aa0074ng | |
| MSI Prestige 16 B1MG-001US | |
* ... mindre är bättre
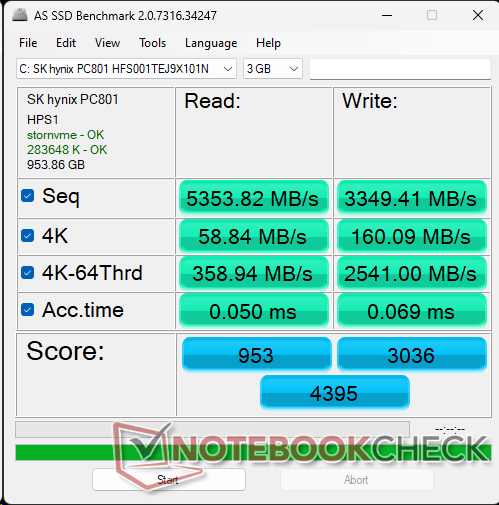
Lagringsenheter
Vår specifika testenhet levereras med SK Hynix PC801 istället för Kioxia XG8. Överföringshastigheterna är ändå utmärkta utan några anmärkningsvärda problem med strypning när DiskSpd körs i en loop.


* ... mindre är bättre
Disk Throttling: DiskSpd Read Loop, Queue Depth 8
GPU-prestanda
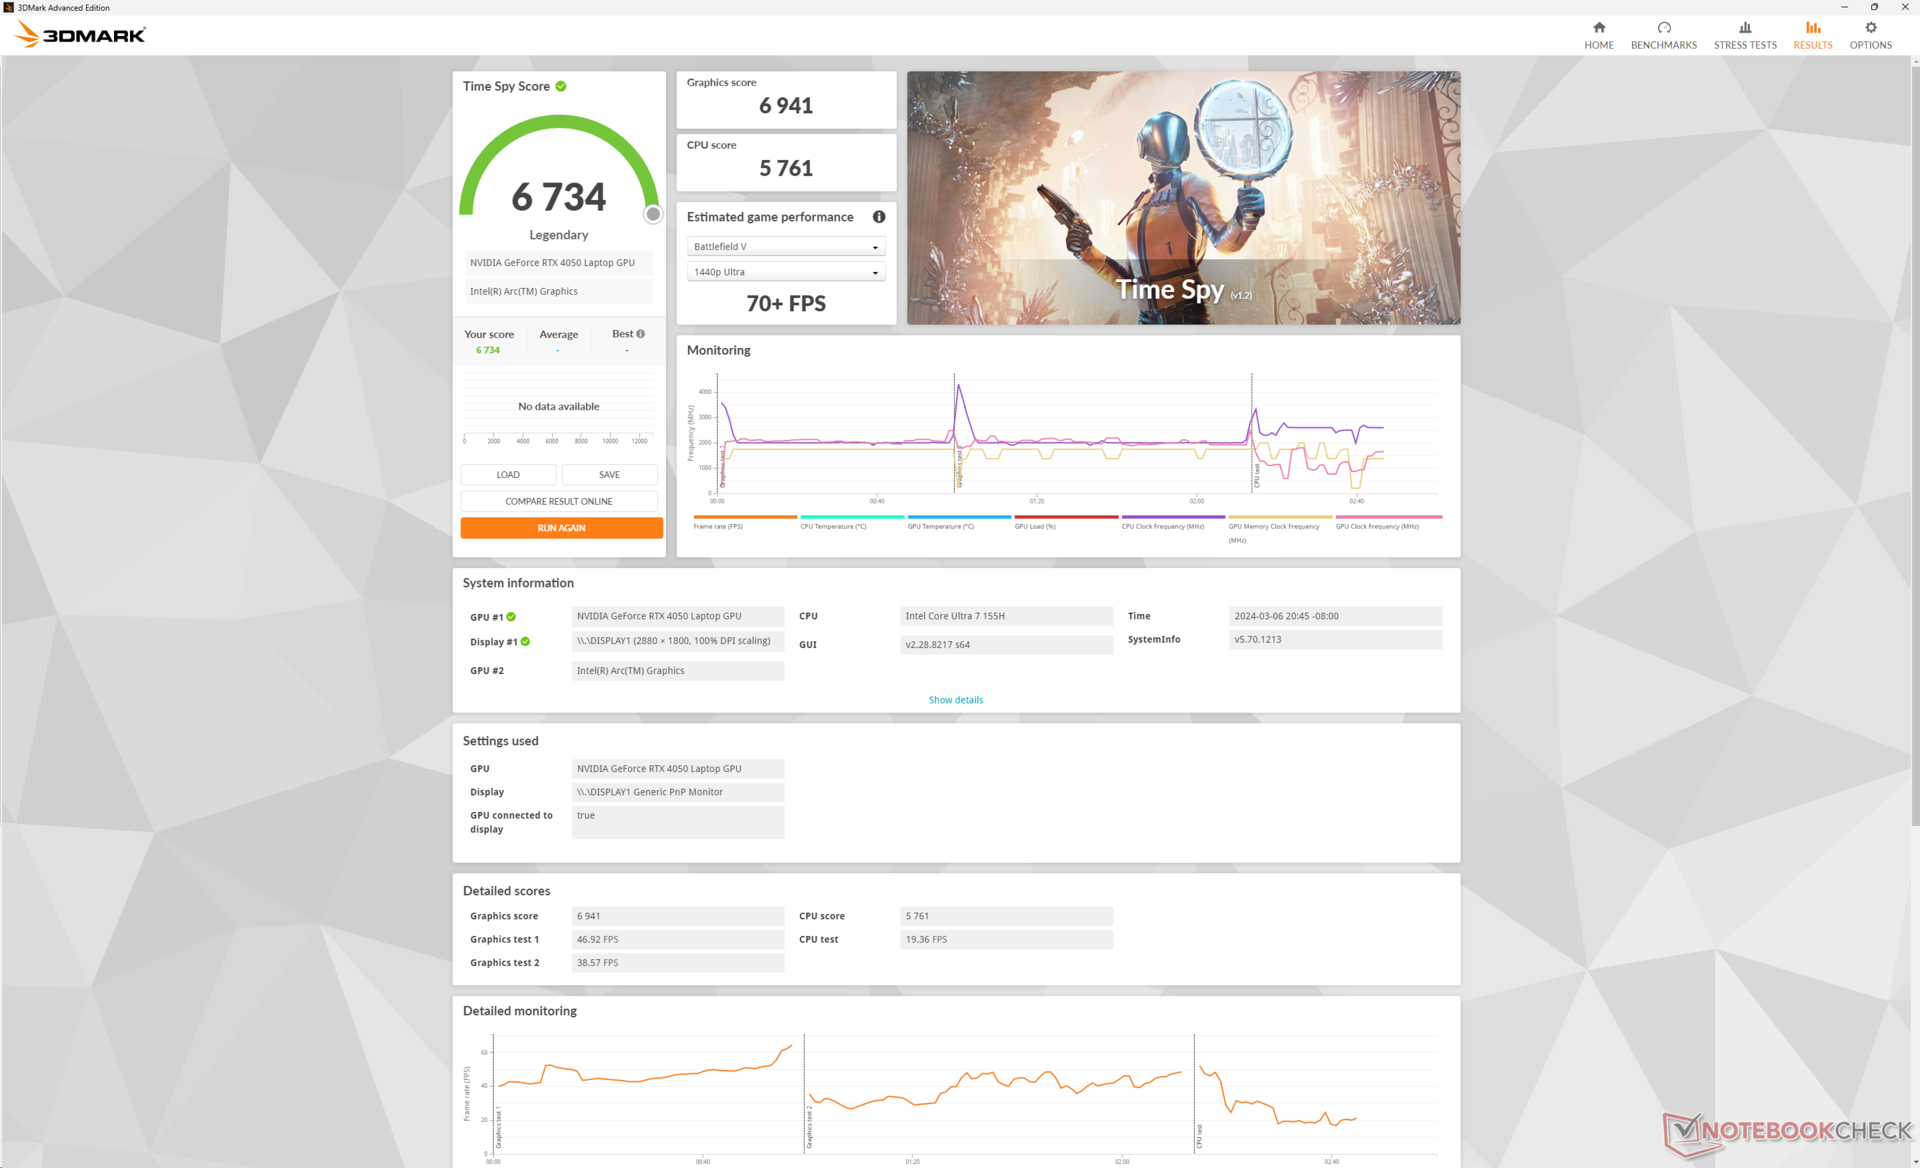
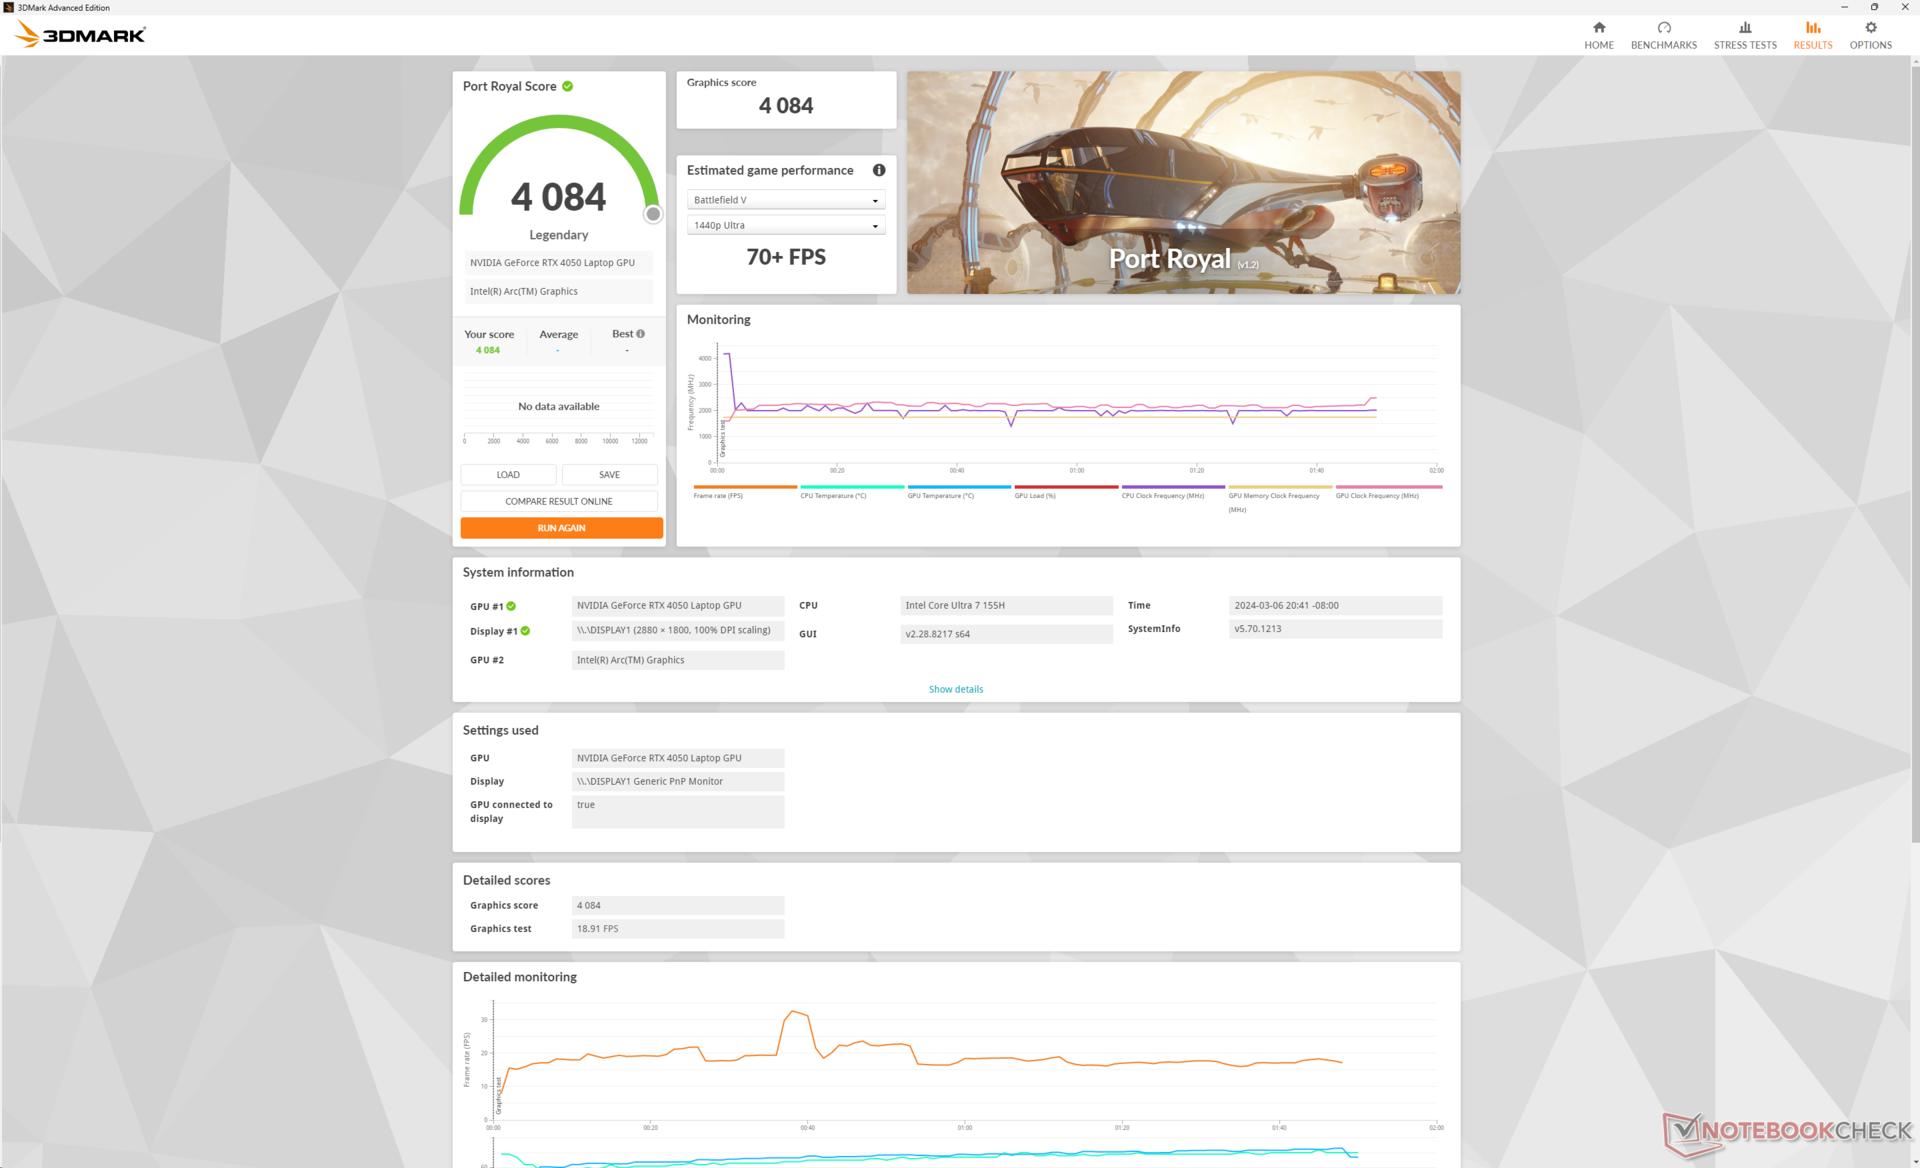
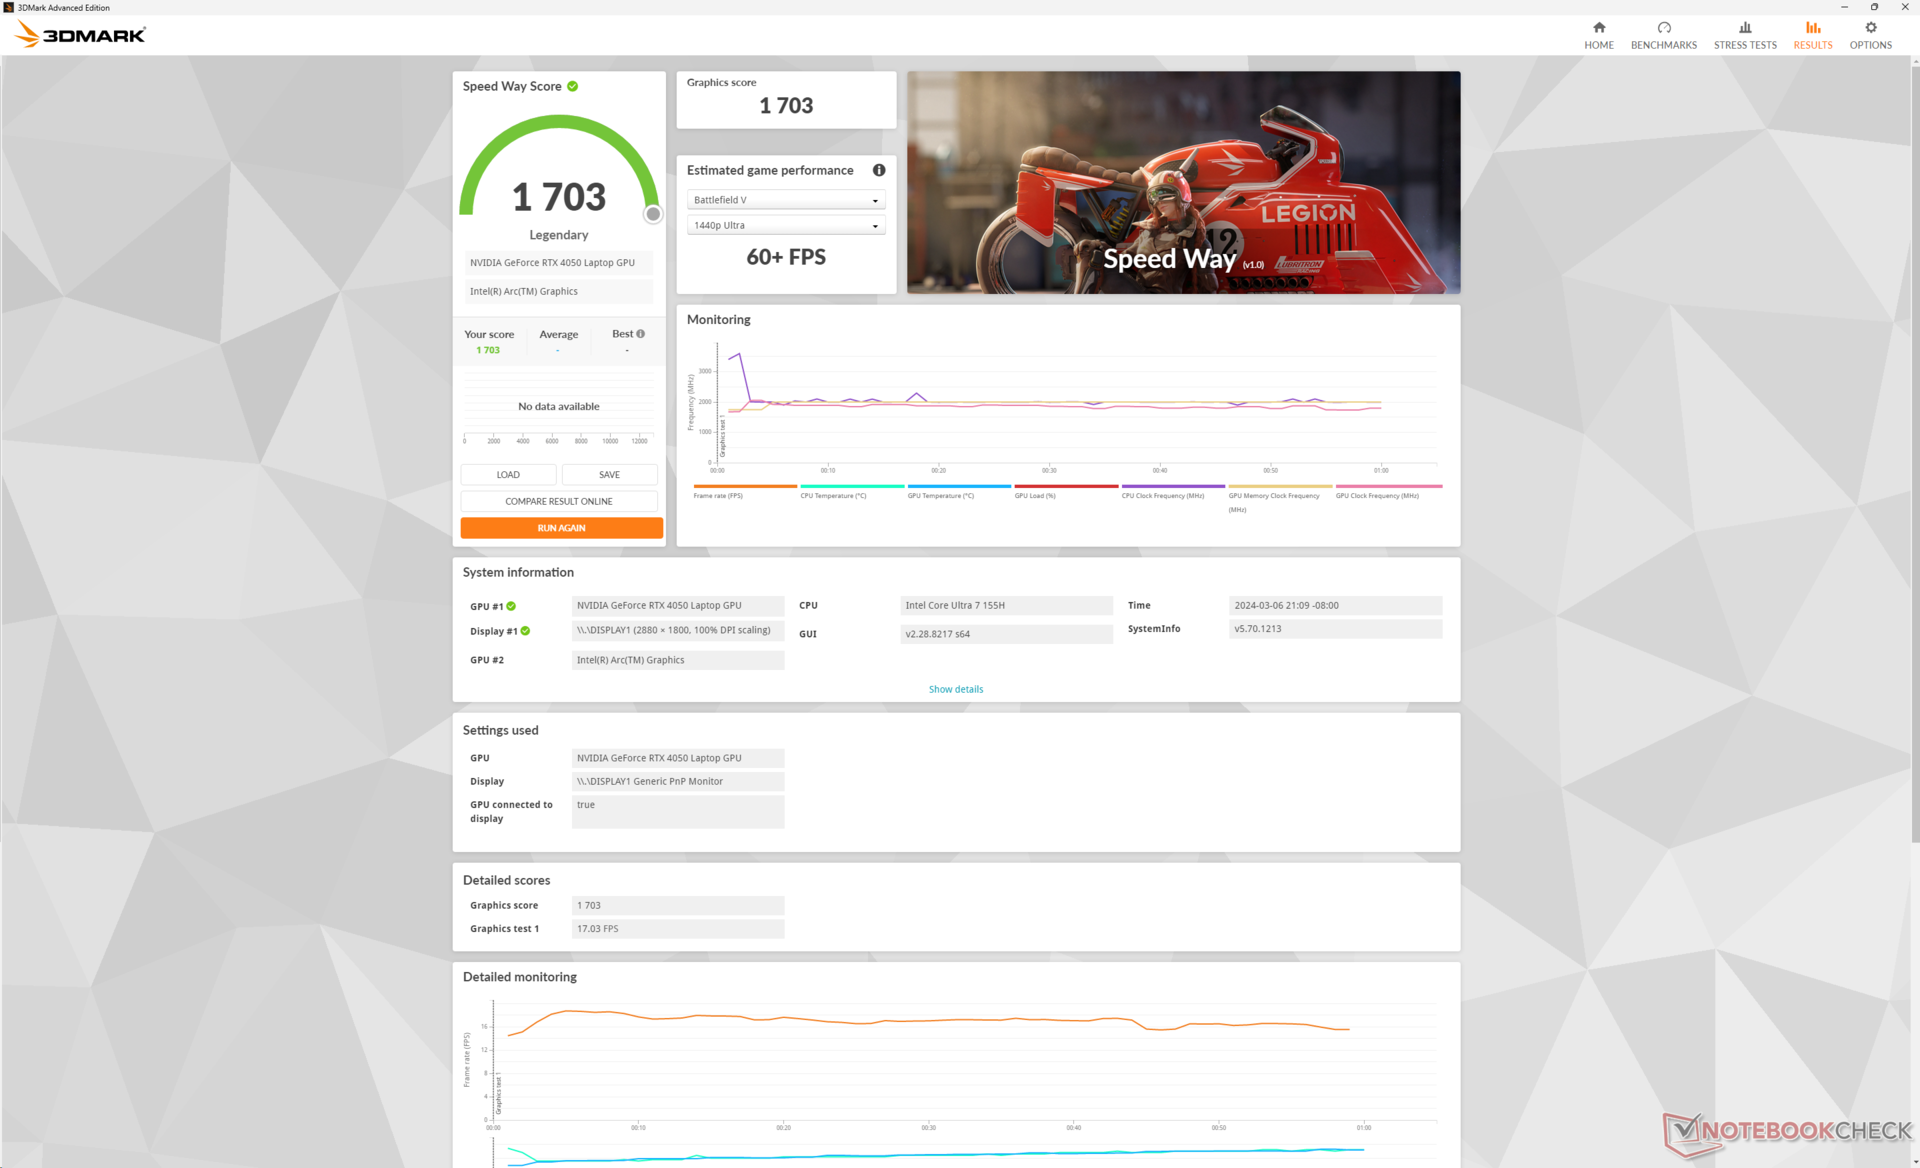
Det behöver knappast påpekas att GeForce RTX 4050 ger massiva prestandaökningar jämfört med integrerade Arc 8 konfigurationen. 3DMark-resultaten är ungefär 2x högre medan CUDA-acceleration möjliggör snabbare rendering i Blender med nästan en faktor på 10.
I jämförelse med andra bärbara datorer med samma RTX 4050 GPU underpresterar dock Spectre x360 16. TGP-målet på 55 W är lägre än på konkurrerande bärbara datorer som Acer Predator Helios Neo 16 eller Victus 15 som har 130 W respektive 75 W som mål. Som ett resultat är 3DMark-resultaten cirka 10 till 15 procent långsammare än den genomsnittliga bärbara datorn i vår databas med samma GeForce RTX 4050 GPU.
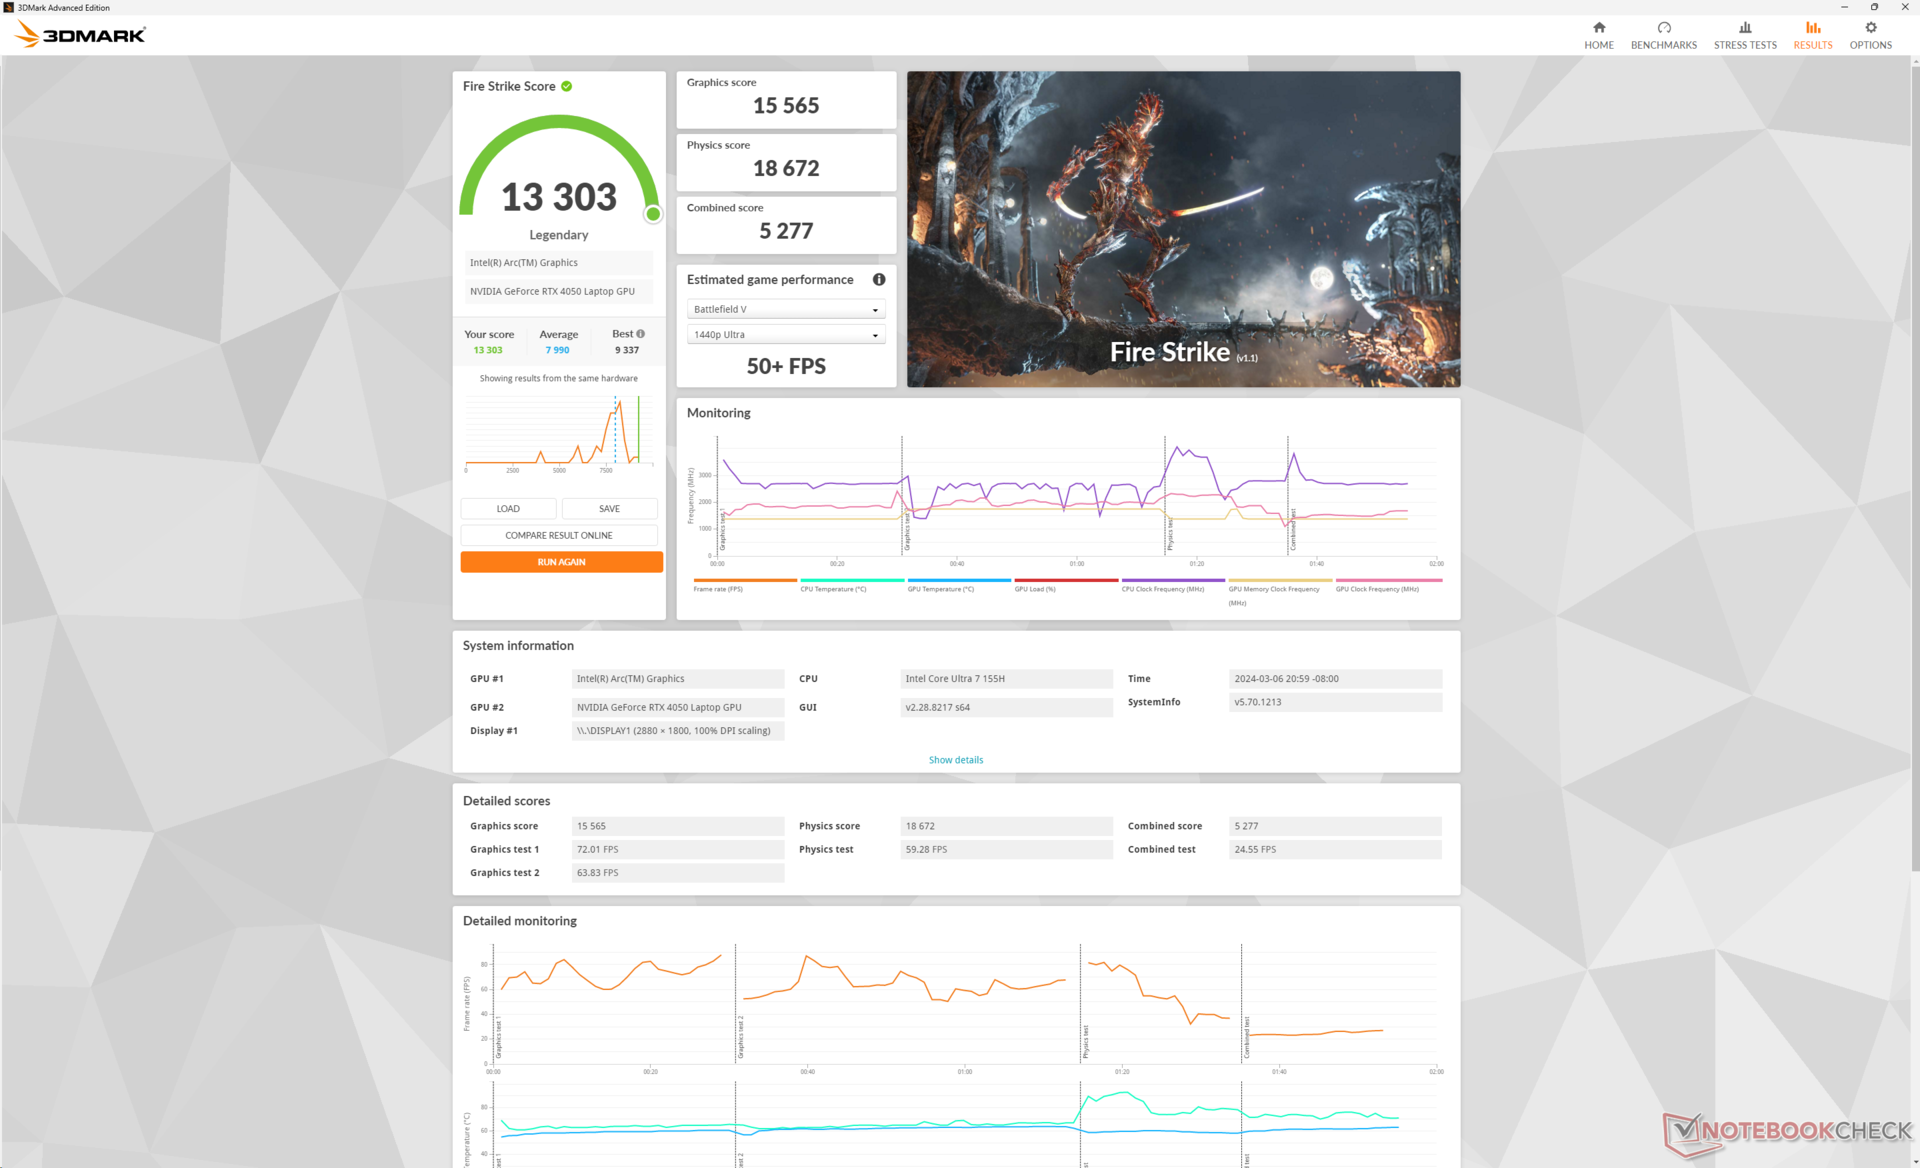
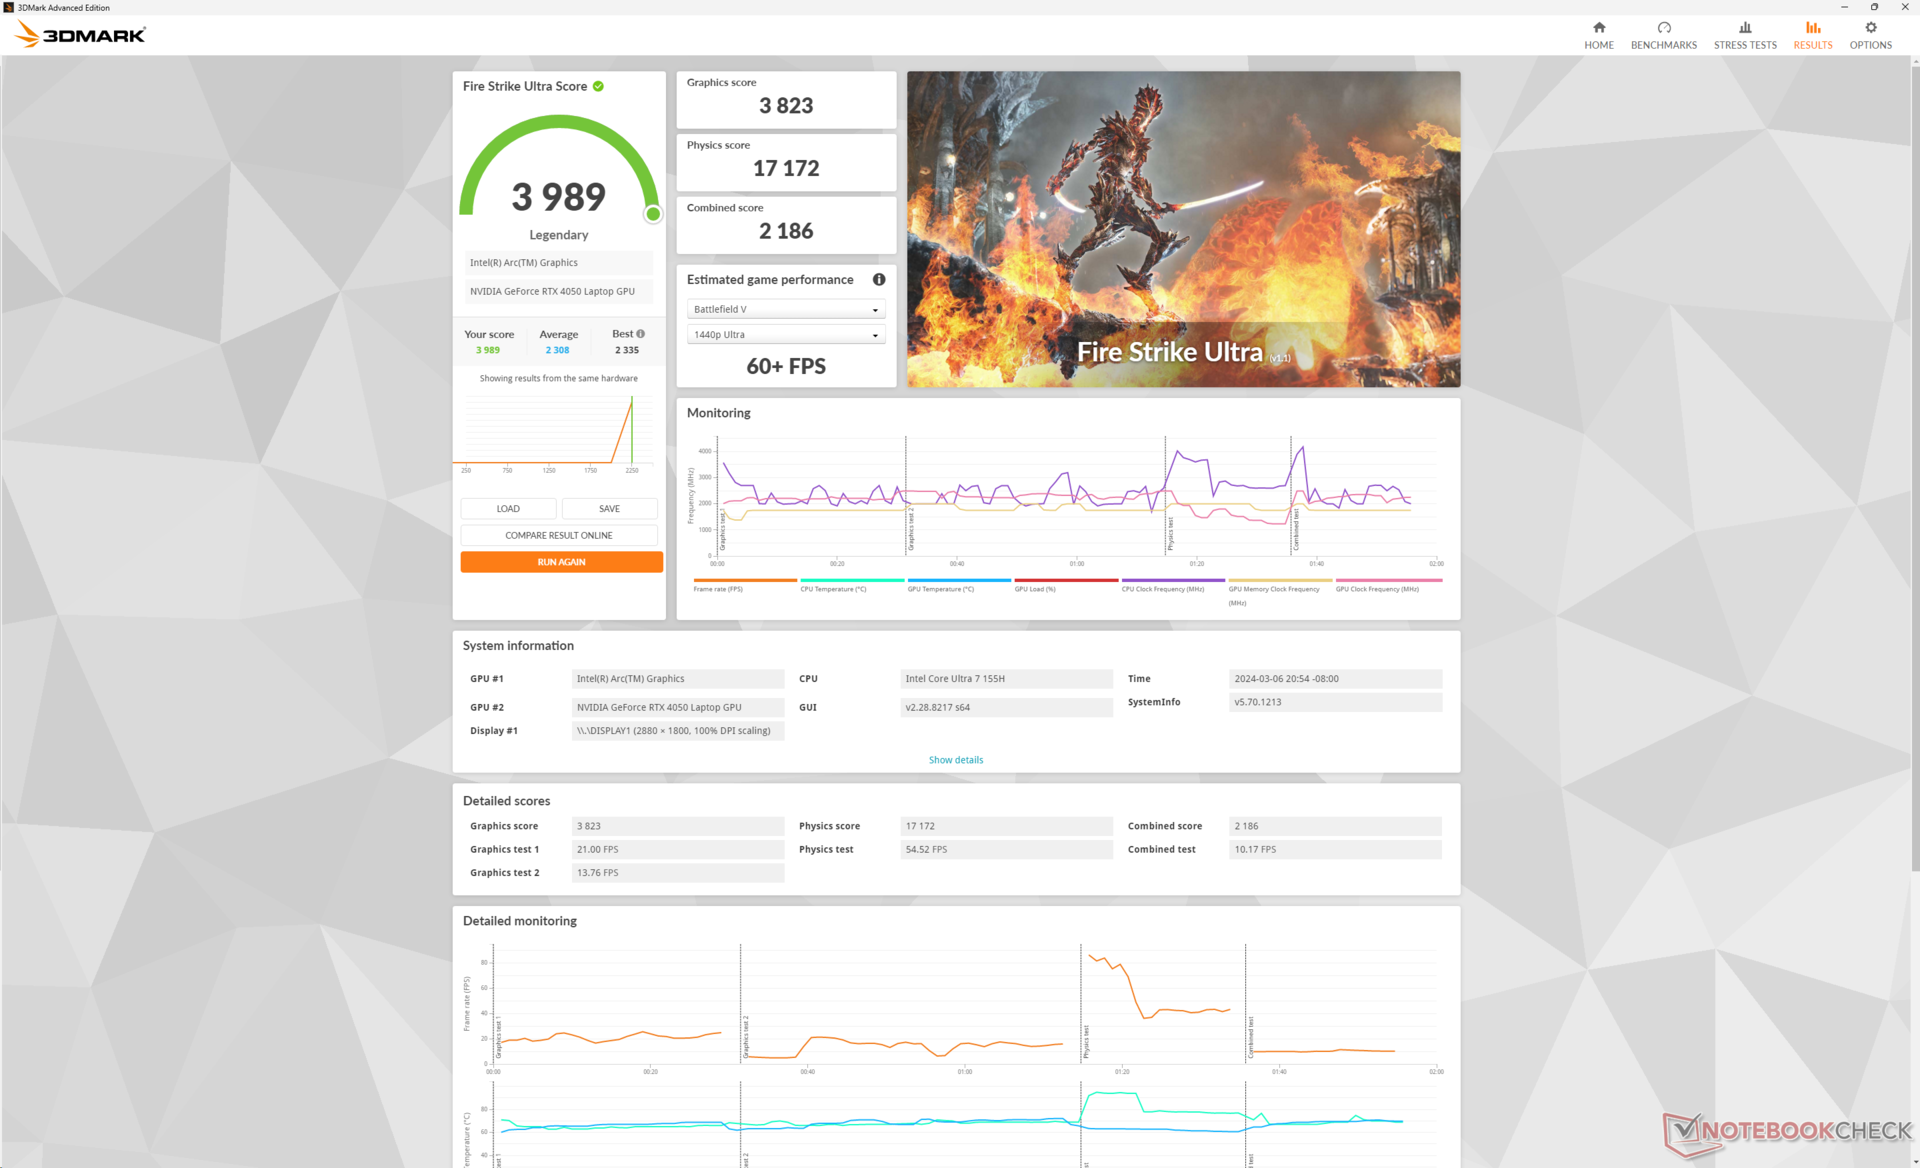
| Effektprofil | Grafisk poäng | Poäng för fysik | Kombinerat resultat |
| Prestanda-läge | 17908 | 17248 | 7364 |
| Balanserat läge | 15565 (-13%) | 18672 (+8%) | 5277 (-28%) |
| Batteridrift | 14156 (-21%) | 21326 (+24%) | 5985 (-19%) |
Fire Strike resultaten är inkonsekventa, vilket framgår av tabellen ovan. CPU-poängen ökar i balanserat läge och batteriläge, medan motsatsen gäller för GPU-poängen, även efter flera omtester i kallt läge. HP är medvetna om problemet och säger att en lösning är på gång.
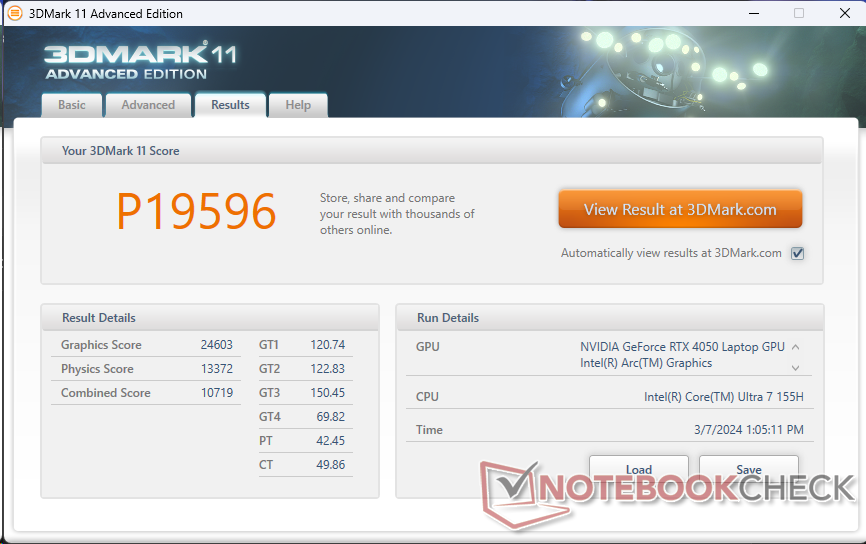
| 3DMark 11 Performance | 19596 poäng | |
| 3DMark Fire Strike Score | 15586 poäng | |
| 3DMark Time Spy Score | 6734 poäng | |
Hjälp | ||
* ... mindre är bättre
Spelprestanda
GeForce RTX 4050 är kraftfull för spel trots sin status som en RTX GPU på instegsnivå. Krävande spel som Cyberpunk 2077 körs bra med 1080p Ultra-inställningar utan några DLSS-förbättringar. Det blir dock hackigt vid högre upplösningar och då rekommenderas lägre inställningar för att hålla bildfrekvenserna flytande. Spel ser mycket skarpa ut när de spelas på den inbyggda 1800p OLED-skärmen, men var beredd på att ställa in de flesta grafiska effekter.
| The Witcher 3 - 1920x1080 Ultra Graphics & Postprocessing (HBAO+) | |
| Honor MagicBook Pro 16 2024 | |
| HP Spectre x360 16 RTX 4050 | |
| MSI Prestige 16 B1MG-001US | |
| HP Spectre x360 16-aa0074ng | |
| LG Gram 2in1 16 16T90R - G.AA78G | |
| HP Spectre x360 2-in-1 16-f1075ng | |
| GTA V - 1920x1080 Highest AA:4xMSAA + FX AF:16x | |
| Honor MagicBook Pro 16 2024 | |
| HP Spectre x360 16 RTX 4050 | |
| HP Spectre x360 16-aa0074ng | |
| LG Gram 2in1 16 16T90R - G.AA78G | |
| HP Spectre x360 2-in-1 16-f1075ng | |
| Final Fantasy XV Benchmark - 1920x1080 High Quality | |
| Honor MagicBook Pro 16 2024 | |
| HP Spectre x360 16 RTX 4050 | |
| MSI Prestige 16 B1MG-001US | |
| HP Spectre x360 16-aa0074ng | |
| LG Gram 2in1 16 16T90R - G.AA78G | |
| HP Spectre x360 2-in-1 16-f1075ng | |
| Strange Brigade - 1920x1080 ultra AA:ultra AF:16 | |
| Honor MagicBook Pro 16 2024 | |
| HP Spectre x360 16 RTX 4050 | |
| HP Spectre x360 16-aa0074ng | |
| MSI Prestige 16 B1MG-001US | |
| LG Gram 2in1 16 16T90R - G.AA78G | |
| HP Spectre x360 2-in-1 16-f1075ng | |
| Dota 2 Reborn - 1920x1080 ultra (3/3) best looking | |
| Honor MagicBook Pro 16 2024 | |
| HP Spectre x360 16 RTX 4050 | |
| MSI Prestige 16 B1MG-001US | |
| HP Spectre x360 16-aa0074ng | |
| LG Gram 2in1 16 16T90R - G.AA78G | |
| HP Spectre x360 2-in-1 16-f1075ng | |
| X-Plane 11.11 - 1920x1080 high (fps_test=3) | |
| Honor MagicBook Pro 16 2024 | |
| HP Spectre x360 16 RTX 4050 | |
| HP Spectre x360 2-in-1 16-f1075ng | |
| LG Gram 2in1 16 16T90R - G.AA78G | |
| MSI Prestige 16 B1MG-001US | |
| HP Spectre x360 16-aa0074ng | |
| Tiny Tina's Wonderlands | |
| 1920x1080 Medium Preset (DX12) | |
| Genomsnitt NVIDIA GeForce RTX 4050 Laptop GPU (93.4 - 149.2, n=7) | |
| HP Spectre x360 16 RTX 4050 | |
| Lenovo ThinkPad E16 G1 Core i5-1335U | |
| 1920x1080 High Preset (DX12) | |
| Genomsnitt NVIDIA GeForce RTX 4050 Laptop GPU (63.3 - 99.5, n=7) | |
| HP Spectre x360 16 RTX 4050 | |
| Lenovo ThinkPad E16 G1 Core i5-1335U | |
| 1920x1080 Badass Preset (DX12) | |
| Genomsnitt NVIDIA GeForce RTX 4050 Laptop GPU (49.8 - 77.3, n=7) | |
| HP Spectre x360 16 RTX 4050 | |
| Lenovo ThinkPad E16 G1 Core i5-1335U | |
| 2560x1440 Badass Preset (DX12) | |
| Genomsnitt NVIDIA GeForce RTX 4050 Laptop GPU (33.6 - 49.5, n=4) | |
| HP Spectre x360 16 RTX 4050 | |
| Baldur's Gate 3 | |
| 1920x1080 Medium Preset AA:T | |
| Genomsnitt NVIDIA GeForce RTX 4050 Laptop GPU (56 - 91.9, n=10) | |
| HP Spectre x360 16 RTX 4050 | |
| 1920x1080 High Preset AA:T | |
| Genomsnitt NVIDIA GeForce RTX 4050 Laptop GPU (49.8 - 83.5, n=10) | |
| HP Spectre x360 16 RTX 4050 | |
| 1920x1080 Ultra Preset AA:T | |
| HP Spectre x360 16 RTX 4050 | |
| Genomsnitt NVIDIA GeForce RTX 4050 Laptop GPU (48.3 - 81.3, n=11) | |
| 2560x1440 Ultra Preset AA:T | |
| HP Spectre x360 16 RTX 4050 | |
| Genomsnitt NVIDIA GeForce RTX 4050 Laptop GPU (32.4 - 55, n=7) | |
Witcher 3 FPS Chart
| låg | med. | hög | ultra | QHD | |
|---|---|---|---|---|---|
| GTA V (2015) | 171.3 | 162.2 | 135.3 | 76.7 | 57.3 |
| The Witcher 3 (2015) | 299 | 209.6 | 120.1 | 62.7 | |
| Dota 2 Reborn (2015) | 142 | 124.2 | 119.6 | 106.4 | |
| Final Fantasy XV Benchmark (2018) | 132.7 | 94.5 | 68.6 | 49.6 | |
| X-Plane 11.11 (2018) | 100.6 | 86.7 | 69.7 | ||
| Far Cry 5 (2018) | 97 | 93 | 95 | 87 | 64 |
| Strange Brigade (2018) | 299 | 171.1 | 137.4 | 121.3 | 81.2 |
| Tiny Tina's Wonderlands (2022) | 135.1 | 113.4 | 75.4 | 59.1 | 40.4 |
| F1 22 (2022) | 159.4 | 146.6 | 124.6 | 42 | 26.9 |
| Baldur's Gate 3 (2023) | 84.9 | 71.4 | 64 | 63.1 | 42.5 |
| Cyberpunk 2077 (2023) | 79.3 | 63.3 | 53.5 | 46 | 27.5 |
Utsläpp - En av de tystaste 16-tums cabrioleterna
Buller från systemet
Fläktljudet är bara något högre än för iGPU-konfigurationen som redan från början var mycket tyst. Vi kan bara registrera maximalt 32 dB(A) när vi spelar i Performance-läget jämfört med 29 dB(A) på iGPU-versionen eller 39 dB(A) på förra årets Spectre x360 16 design.
Ljudnivå
| Låg belastning |
| 23.6 / 23.6 / 23.6 dB(A) |
| Hög belastning |
| 29.2 / 32.1 dB(A) |
 | ||
30 dB tyst 40 dB(A) hörbar 50 dB(A) högt ljud |
||
min: | ||
| HP Spectre x360 16 RTX 4050 GeForce RTX 4050 Laptop GPU, Ultra 7 155H, SK hynix PC801 HFS001TEJ9X101N | HP Spectre x360 16-aa0074ng Arc 8-Core, Ultra 7 155H, Kioxia XG8 KXG80ZNV1T02 | HP Spectre x360 2-in-1 16-f1075ng Iris Xe G7 96EUs, i7-12700H, SK Hynix PC711 1TB HFS001TDE9X073N | Honor MagicBook Pro 16 2024 GeForce RTX 4060 Laptop GPU, Ultra 7 155H, WD PC SN740 SDDPNQD-1T00 | MSI Prestige 16 B1MG-001US Arc 8-Core, Ultra 7 155H, Samsung PM9A1 MZVL22T0HBLB | LG Gram 2in1 16 16T90R - G.AA78G Iris Xe G7 96EUs, i7-1360P, Samsung PM9A1 MZVL21T0HCLR | |
|---|---|---|---|---|---|---|
| Noise | 8% | -21% | -13% | -24% | -12% | |
| av / miljö * (dB) | 23.3 | 23 1% | 26 -12% | 24 -3% | 24.5 -5% | 25.1 -8% |
| Idle Minimum * (dB) | 23.6 | 23 3% | 26 -10% | 24 -2% | 24.5 -4% | 25.1 -6% |
| Idle Average * (dB) | 23.6 | 23 3% | 26 -10% | 24 -2% | 26.3 -11% | 25.1 -6% |
| Idle Maximum * (dB) | 23.6 | 23 3% | 26 -10% | 27.2 -15% | 26.3 -11% | 26.1 -11% |
| Load Average * (dB) | 29.2 | 23 21% | 42.9 -47% | 29 1% | 36.5 -25% | 31.4 -8% |
| Witcher 3 ultra * (dB) | 32.1 | 27 16% | 42.9 -34% | 42.1 -31% | 46.3 -44% | 41.1 -28% |
| Load Maximum * (dB) | 32.1 | 28.62 11% | 39.1 -22% | 45 -40% | 52.9 -65% | 36.6 -14% |
* ... mindre är bättre
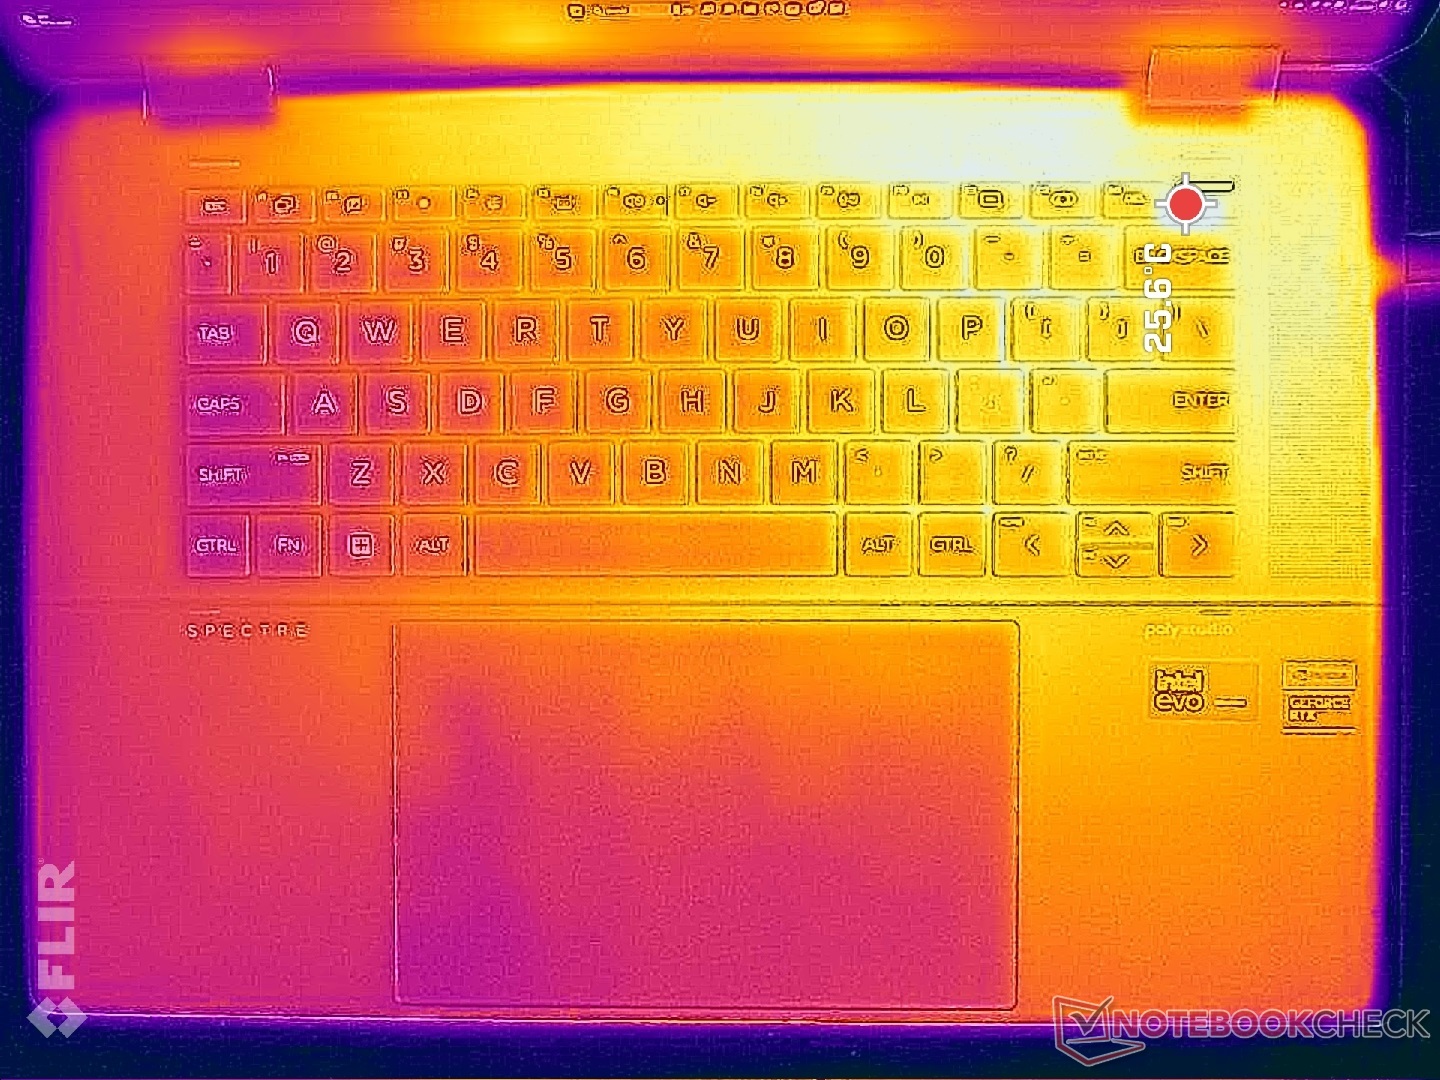
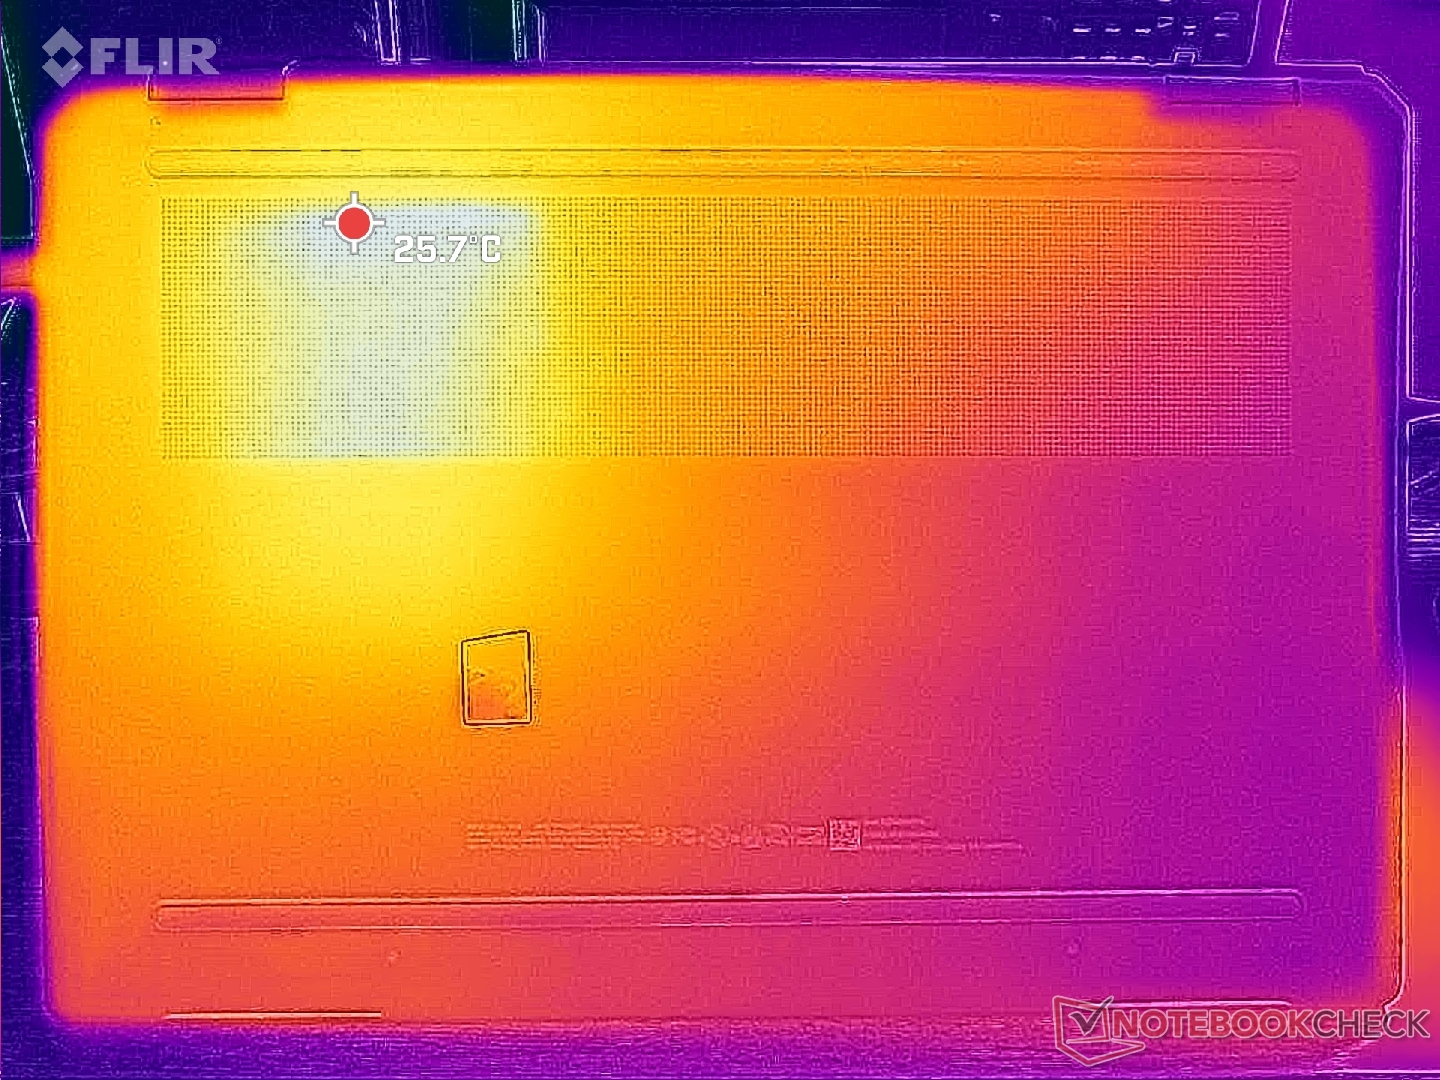
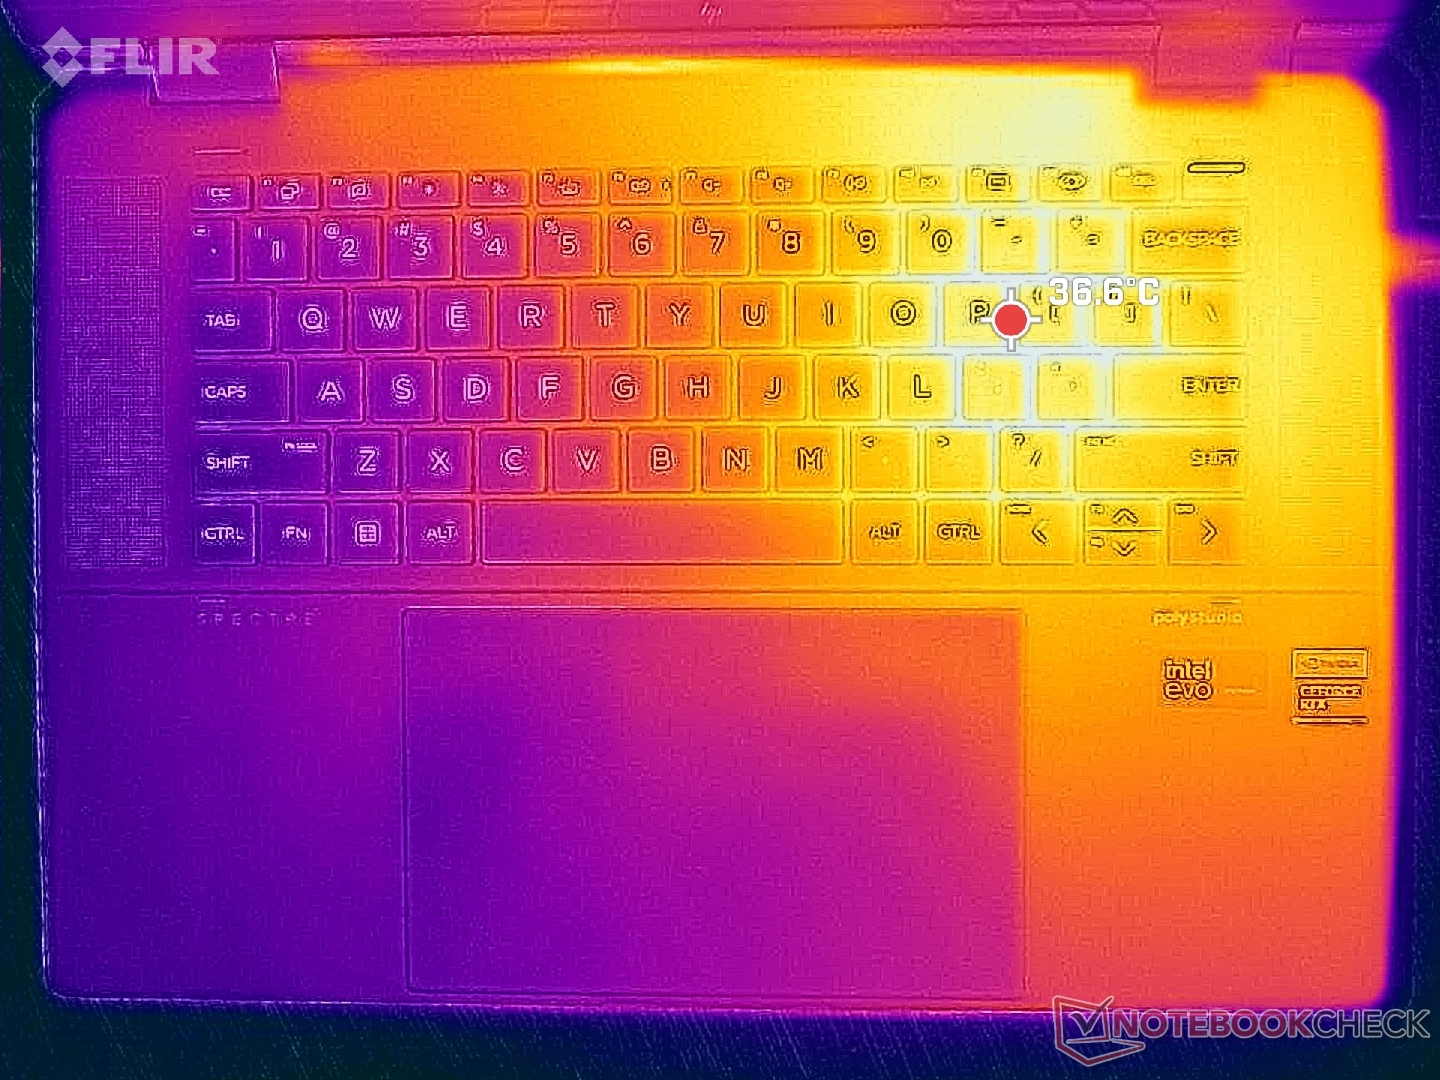
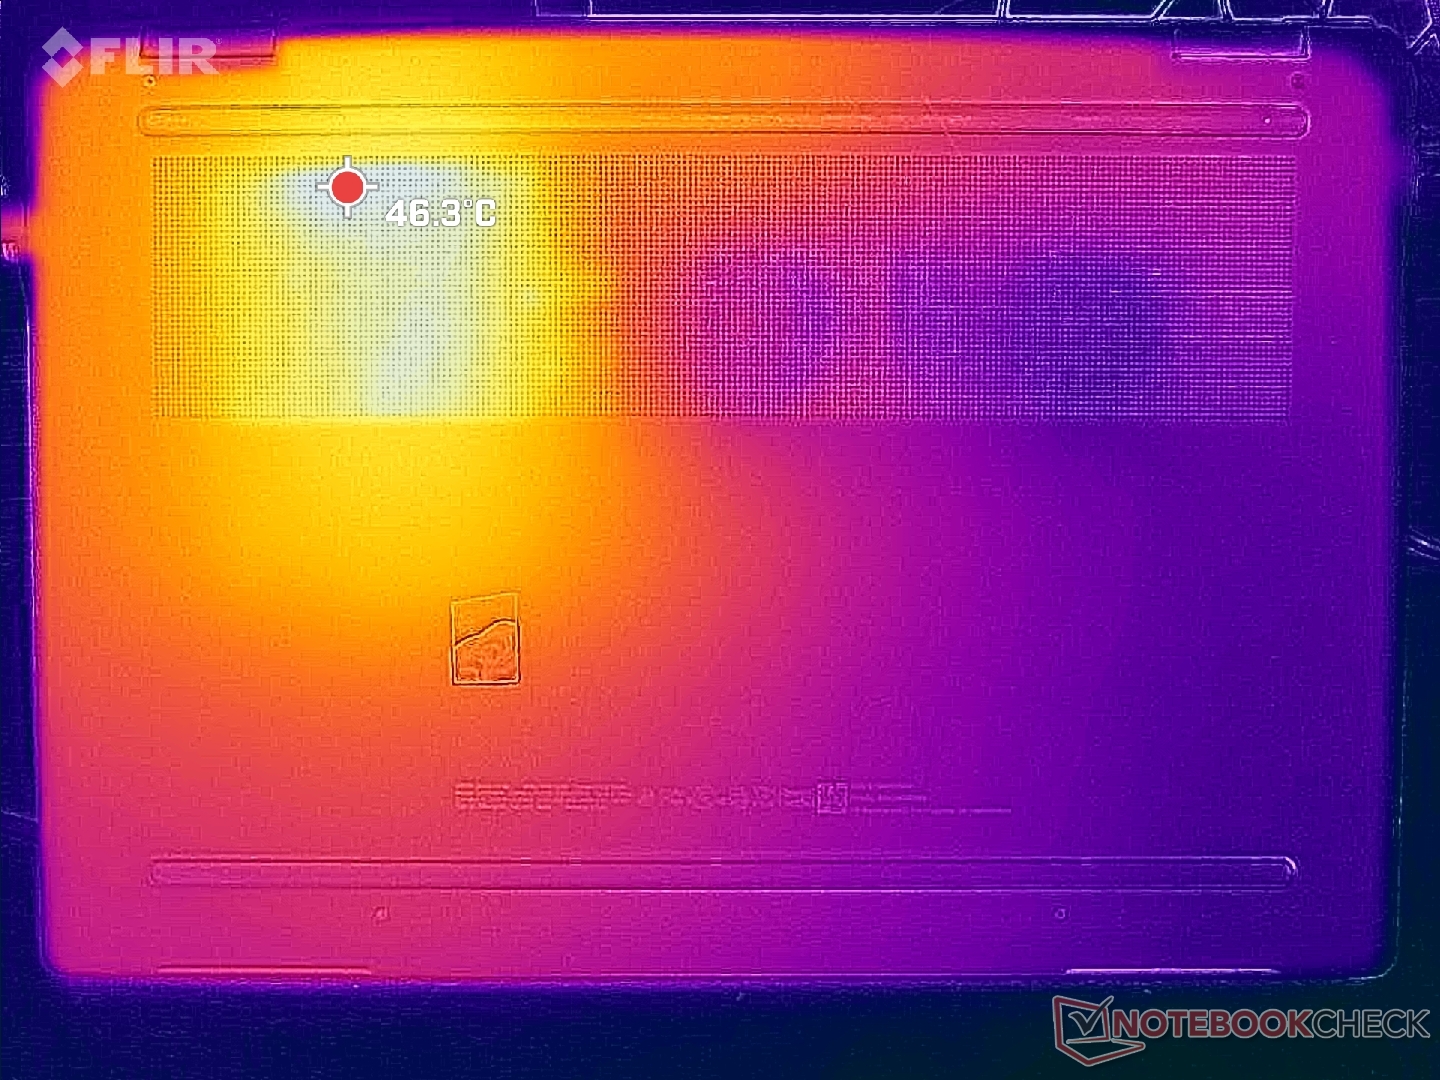
Temperatur
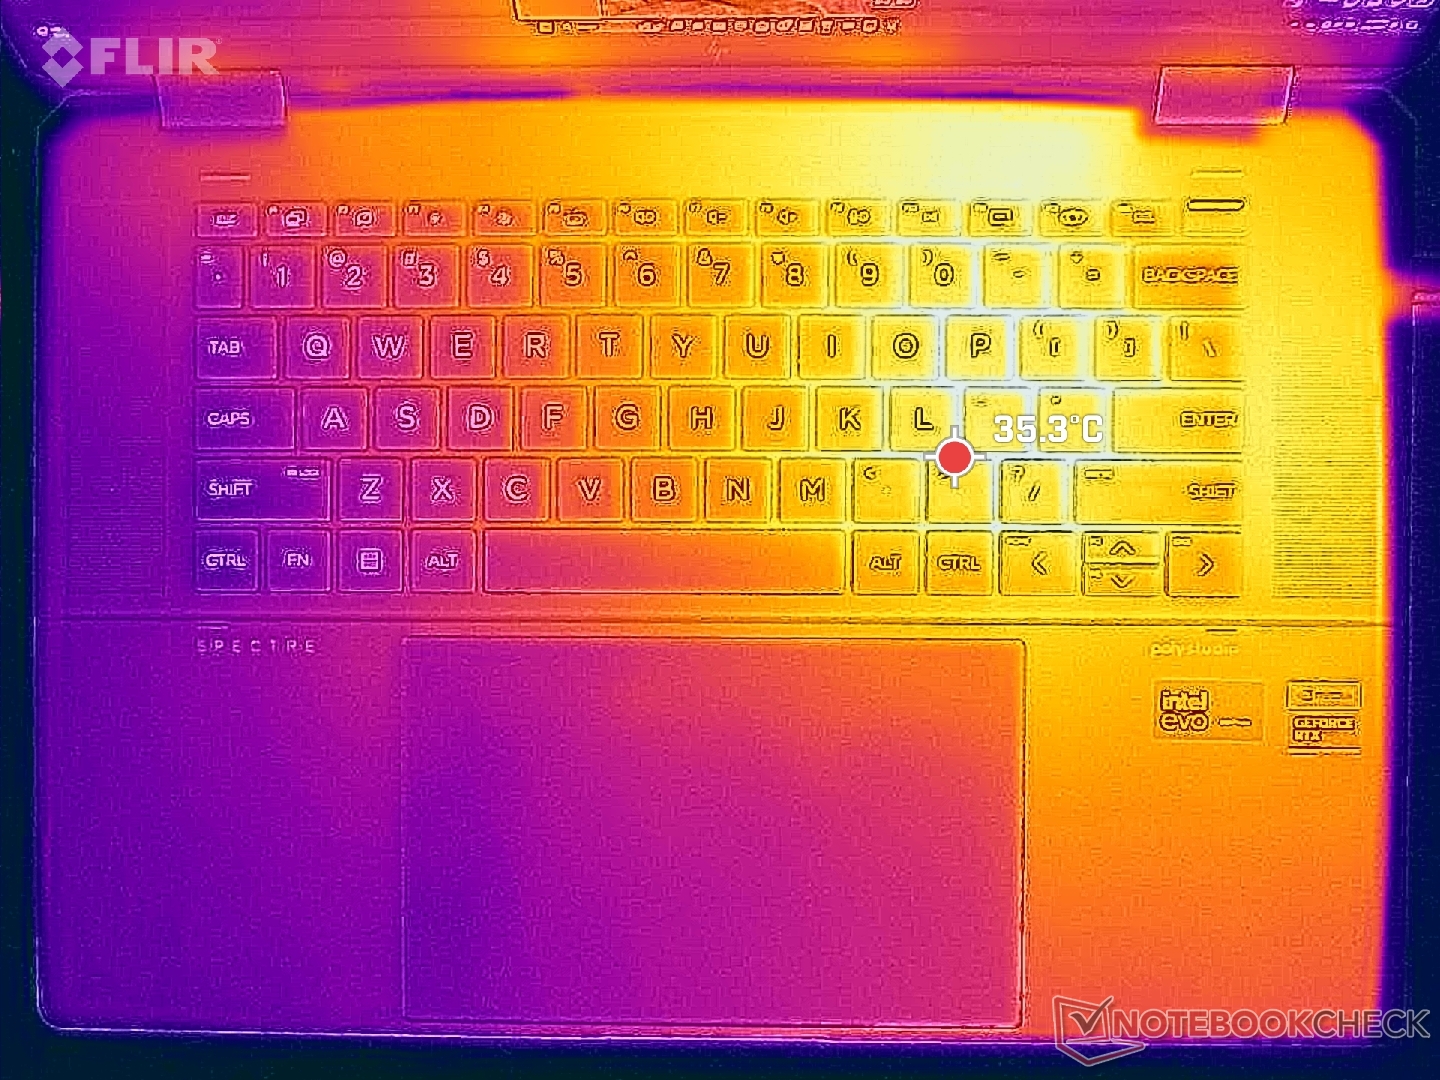
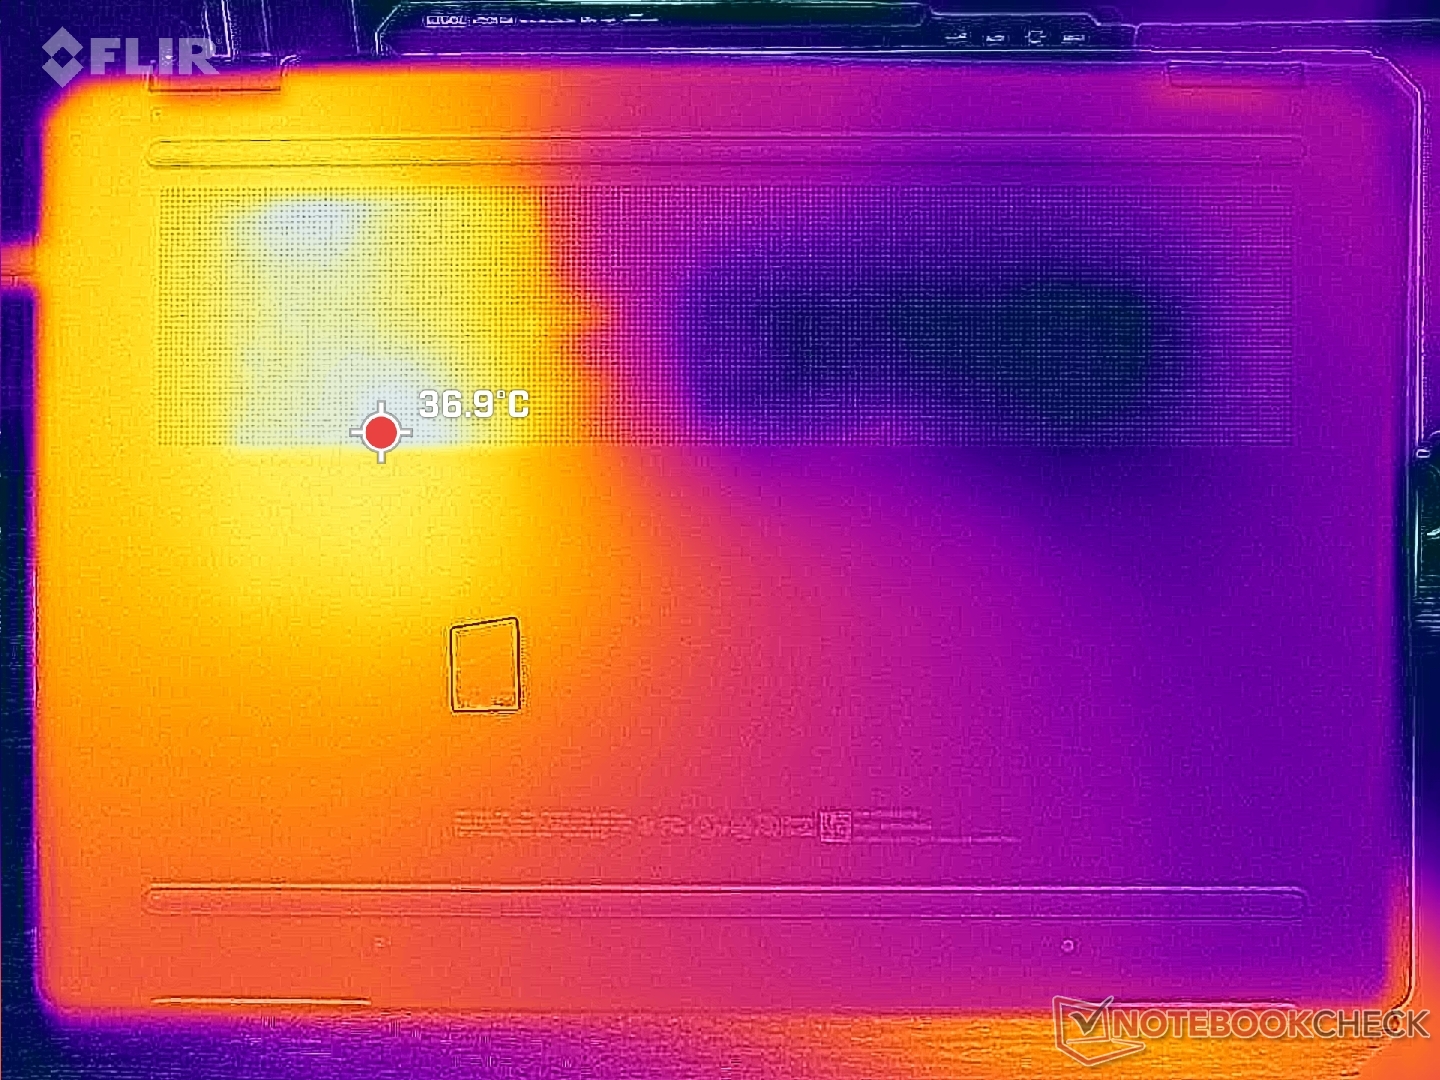
Yttemperaturerna är återigen mycket varmare på den högra halvan av datorn än på den vänstra halvan, vilket framgår av temperaturkartorna nedan på grund av hur kyllösningen är utformad. Hot spots är förutsägbart varmare på vår dGPU-version än iGPU-versionen; toppen och botten när de körs Witcher 3 skulle nå upp till 40 C respektive 46 C, jämfört med bara 35 C och 40 C på iGPU-versionen.
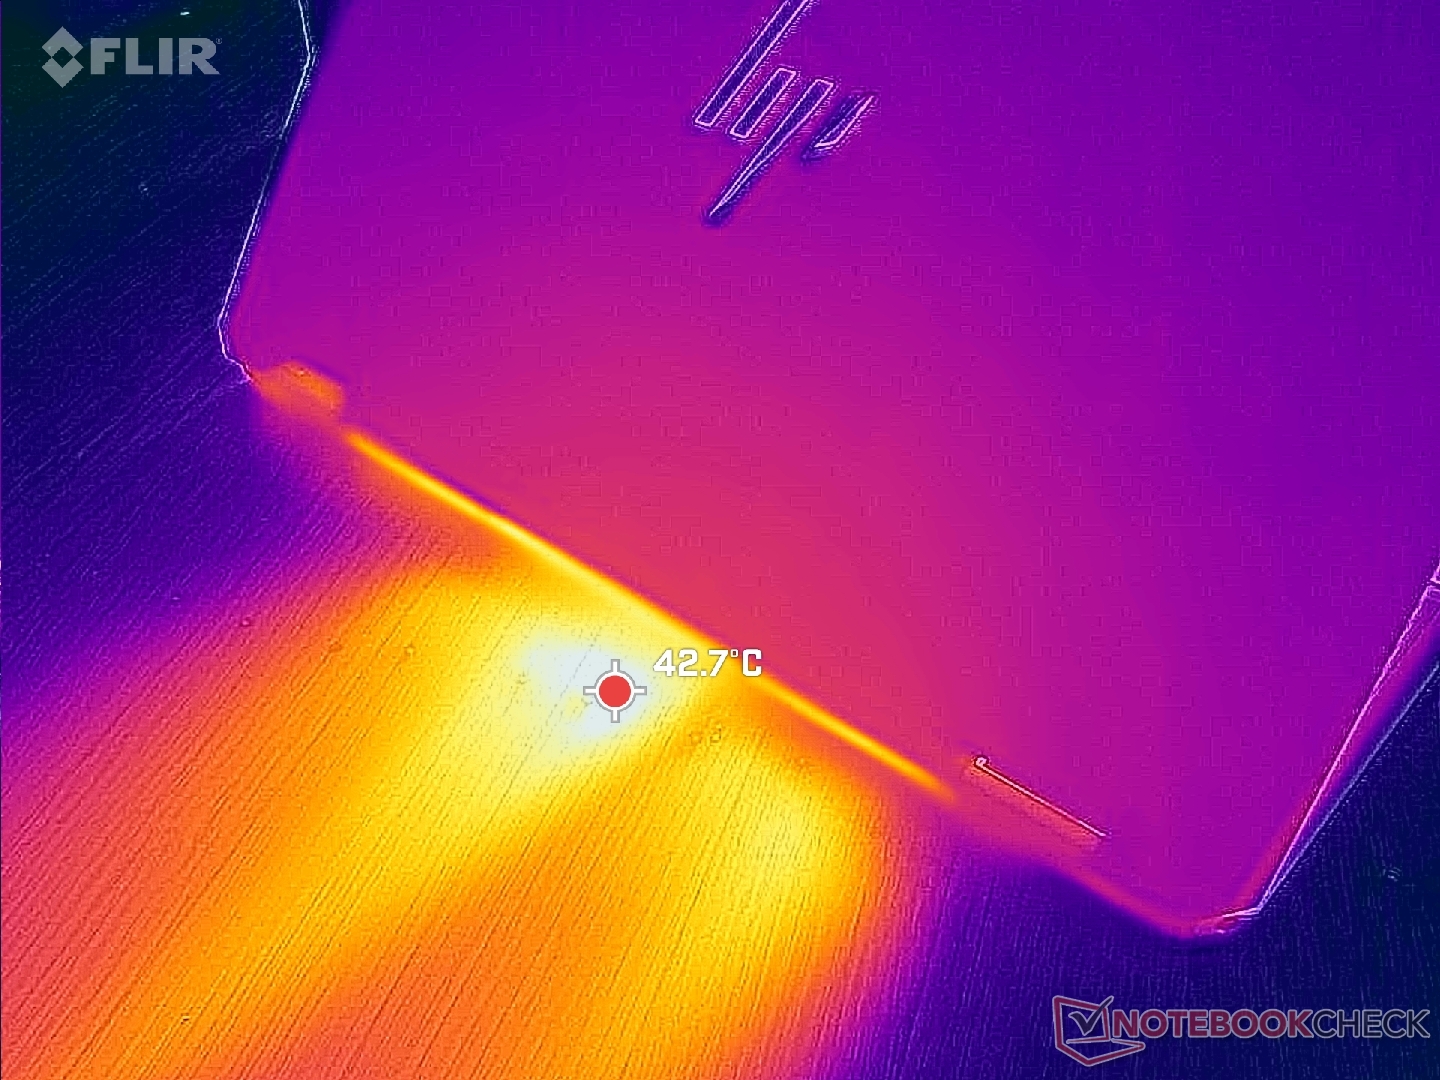
(+) Den maximala temperaturen på ovansidan är 39.6 °C / 103 F, jämfört med genomsnittet av 35.4 °C / 96 F , allt från 19.6 till 60 °C för klassen Convertible.
(+) Botten värms upp till maximalt 39.2 °C / 103 F, jämfört med genomsnittet av 36.9 °C / 98 F
(+) Vid tomgångsbruk är medeltemperaturen för ovansidan 26.1 °C / 79 F, jämfört med enhetsgenomsnittet på 30.3 °C / ### class_avg_f### F.
(+) När du spelar The Witcher 3 är medeltemperaturen för ovansidan 31.6 °C / 89 F, jämfört med enhetsgenomsnittet på 30.3 °C / ## #class_avg_f### F.
(+) Handledsstöden och pekplattan når maximal hudtemperatur (32.2 °C / 90 F) och är därför inte varma.
(-) Medeltemperaturen för handledsstödsområdet på liknande enheter var 28 °C / 82.4 F (-4.2 °C / -7.6 F).
| HP Spectre x360 16 RTX 4050 Intel Core Ultra 7 155H, NVIDIA GeForce RTX 4050 Laptop GPU | HP Spectre x360 16-aa0074ng Intel Core Ultra 7 155H, Intel Arc 8-Core iGPU | HP Spectre x360 2-in-1 16-f1075ng Intel Core i7-12700H, Intel Iris Xe Graphics G7 96EUs | Honor MagicBook Pro 16 2024 Intel Core Ultra 7 155H, NVIDIA GeForce RTX 4060 Laptop GPU | MSI Prestige 16 B1MG-001US Intel Core Ultra 7 155H, Intel Arc 8-Core iGPU | LG Gram 2in1 16 16T90R - G.AA78G Intel Core i7-1360P, Intel Iris Xe Graphics G7 96EUs | |
|---|---|---|---|---|---|---|
| Heat | -1% | 8% | 9% | -1% | -24% | |
| Maximum Upper Side * (°C) | 39.6 | 37 7% | 37.4 6% | 39.7 -0% | 48.8 -23% | 55 -39% |
| Maximum Bottom * (°C) | 39.2 | 44 -12% | 39.1 -0% | 42.9 -9% | 47.6 -21% | 55.4 -41% |
| Idle Upper Side * (°C) | 29 | 31 -7% | 27.1 7% | 23.7 18% | 24.2 17% | 34.9 -20% |
| Idle Bottom * (°C) | 31.6 | 29 8% | 26.3 17% | 23.5 26% | 23.6 25% | 30 5% |
* ... mindre är bättre
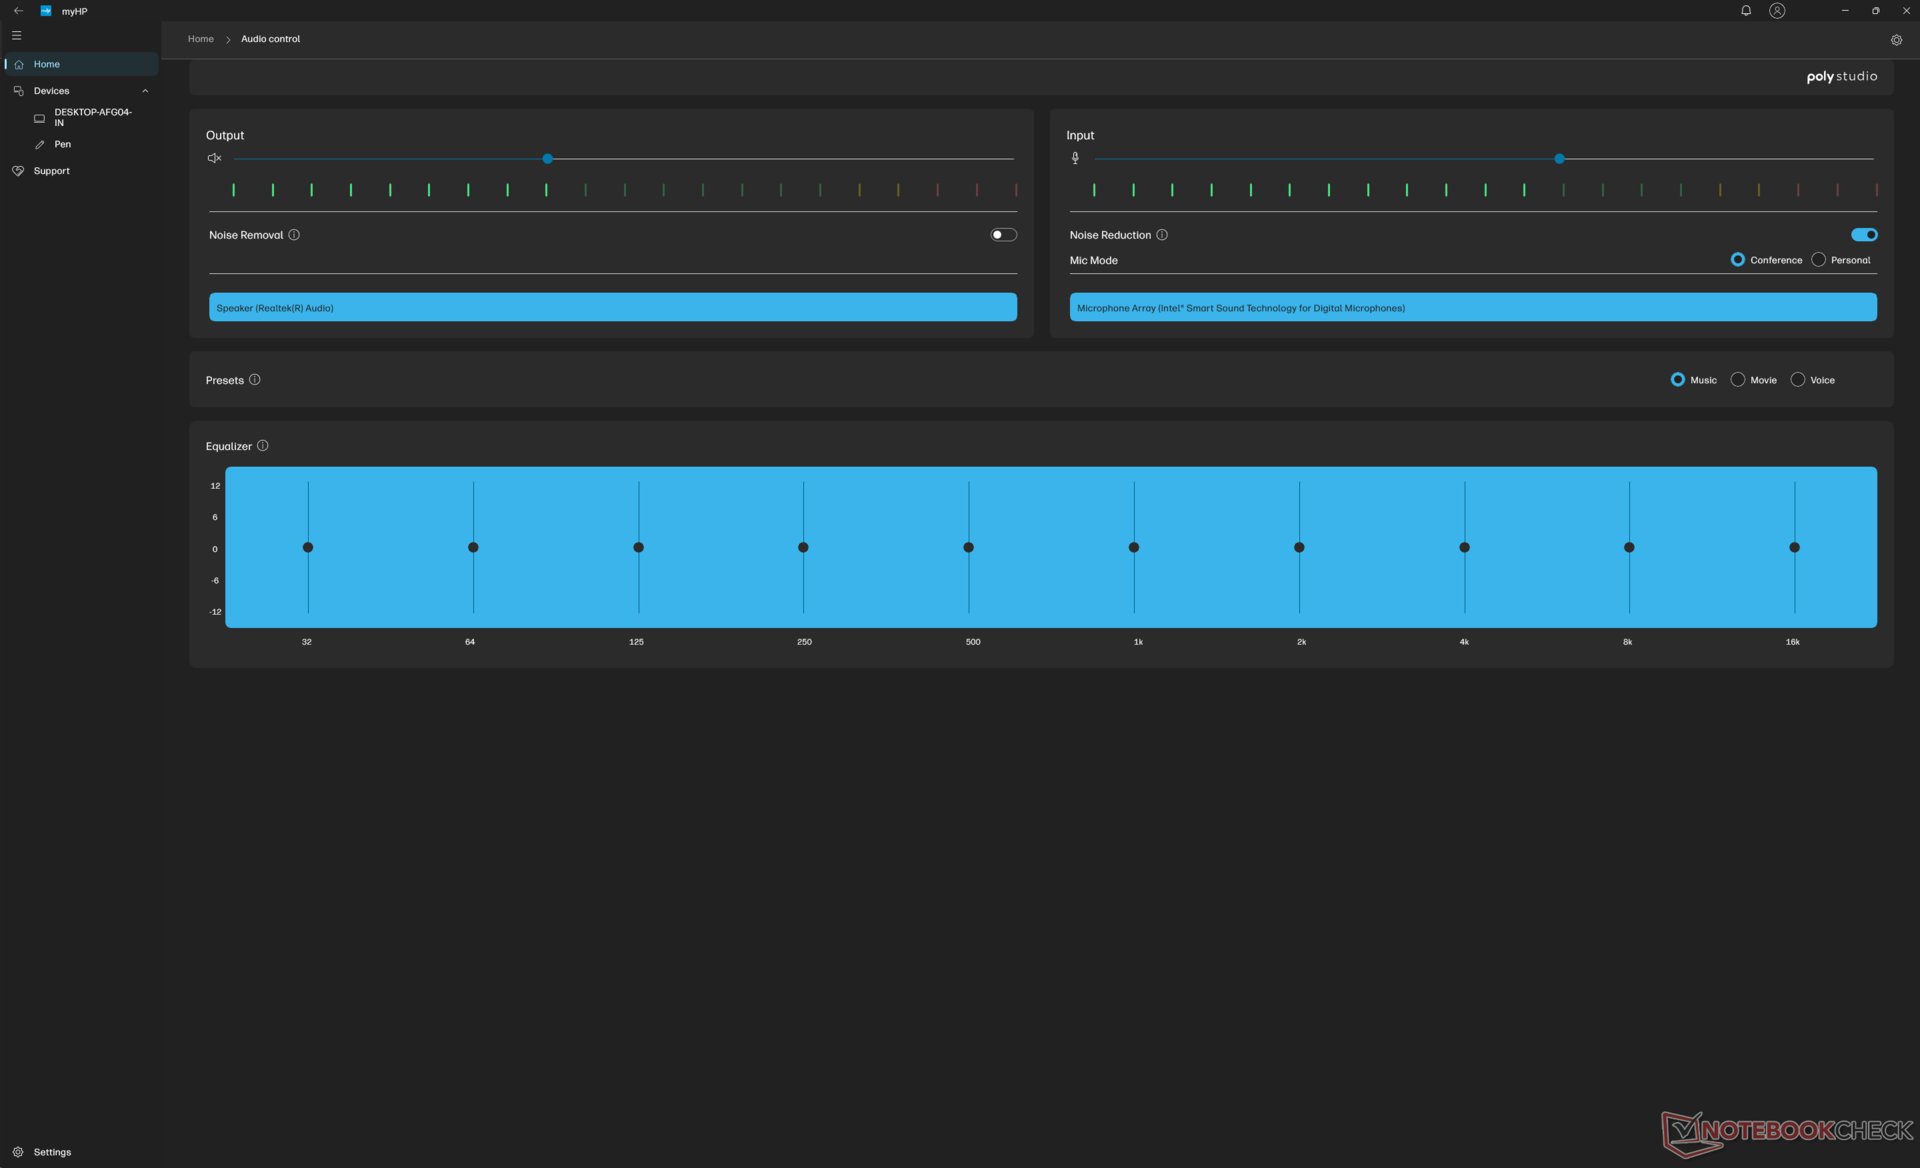
Högtalare
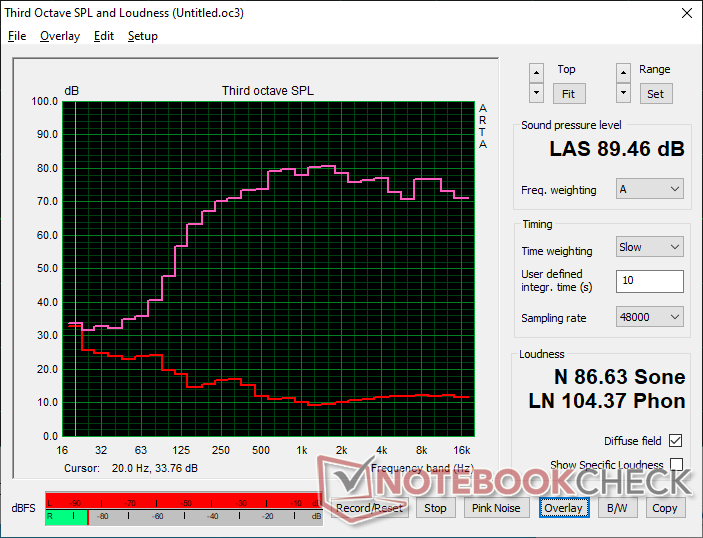
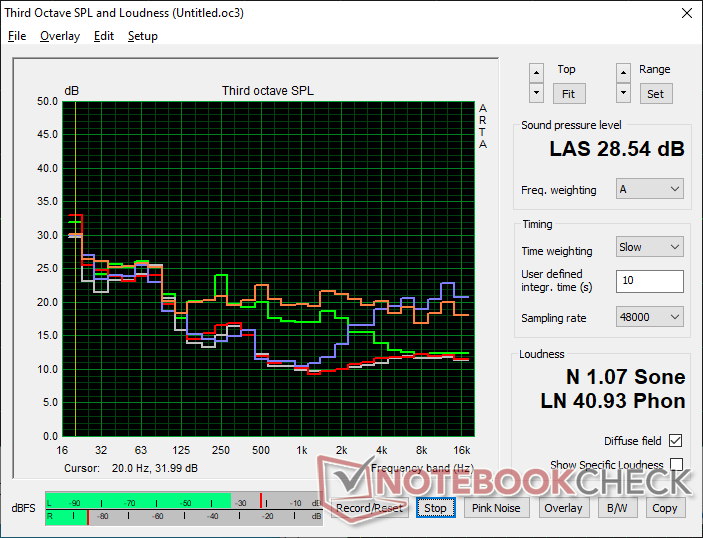
HP Spectre x360 16 RTX 4050 ljudanalys
(+) | högtalare kan spela relativt högt (89.5 dB)
Bas 100 - 315 Hz
(±) | reducerad bas - i genomsnitt 13.2% lägre än medianen
(±) | linjäriteten för basen är genomsnittlig (7.9% delta till föregående frekvens)
Mellan 400 - 2000 Hz
(+) | balanserad mellan - endast 3.2% från medianen
(+) | mids är linjära (3% delta till föregående frekvens)
Högsta 2 - 16 kHz
(+) | balanserade toppar - endast 1.6% från medianen
(+) | toppar är linjära (3.5% delta till föregående frekvens)
Totalt 100 - 16 000 Hz
(+) | det totala ljudet är linjärt (9.2% skillnad mot median)
Jämfört med samma klass
» 4% av alla testade enheter i den här klassen var bättre, 1% liknande, 95% sämre
» Den bästa hade ett delta på 6%, genomsnittet var 20%, sämst var 57%
Jämfört med alla testade enheter
» 3% av alla testade enheter var bättre, 1% liknande, 96% sämre
» Den bästa hade ett delta på 4%, genomsnittet var 23%, sämst var 134%
Apple MacBook Pro 16 2021 M1 Pro ljudanalys
(+) | högtalare kan spela relativt högt (84.7 dB)
Bas 100 - 315 Hz
(+) | bra bas - bara 3.8% från medianen
(+) | basen är linjär (5.2% delta till föregående frekvens)
Mellan 400 - 2000 Hz
(+) | balanserad mellan - endast 1.3% från medianen
(+) | mids är linjära (2.1% delta till föregående frekvens)
Högsta 2 - 16 kHz
(+) | balanserade toppar - endast 1.9% från medianen
(+) | toppar är linjära (2.7% delta till föregående frekvens)
Totalt 100 - 16 000 Hz
(+) | det totala ljudet är linjärt (4.6% skillnad mot median)
Jämfört med samma klass
» 0% av alla testade enheter i den här klassen var bättre, 0% liknande, 100% sämre
» Den bästa hade ett delta på 5%, genomsnittet var 17%, sämst var 45%
Jämfört med alla testade enheter
» 0% av alla testade enheter var bättre, 0% liknande, 100% sämre
» Den bästa hade ett delta på 4%, genomsnittet var 23%, sämst var 134%
Energiförvaltning
Strömförbrukning
Körning Witcher 3 i prestandaläget kräver cirka 93 W eller nästan 2x mer än iGPU-konfigurationen. Bildhastigheterna med Nvidia GPU är 2x till 3x snabbare och därför är den högre energiförbrukningen fortfarande värd det ur ett prestanda-per-watt-perspektiv.
Om du upprepar testet ovan i läget Balanserat istället för Prestanda skulle förbrukningen sjunka till 75 W. Energibesparingarna stämmer överens med våra TGP-observationer i avsnittet Stresstest ovan. Om du vill få ut mesta möjliga av ditt system ska du se till att aktivera Performance-läget via MyHP.
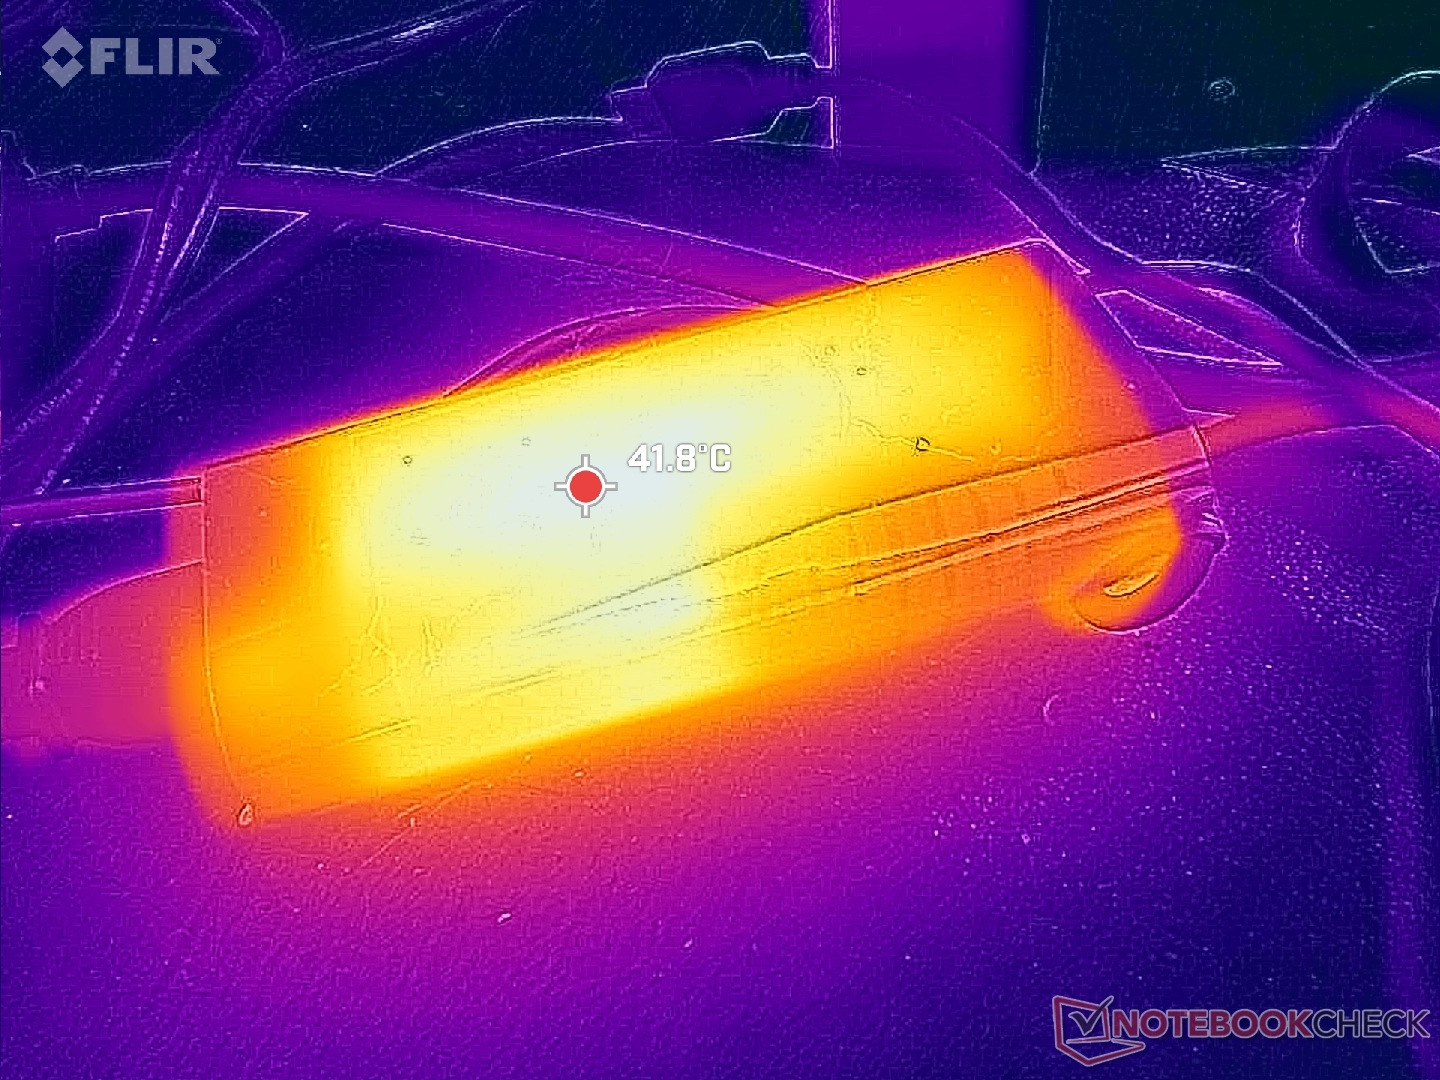
Vi kan registrera en tillfällig maximal strömförbrukning på 121 W från den lilla-medium (~13,8 x 6,5 x 2,9 cm) 140 W USB-C AC-adaptern när CPU och GPU vardera utnyttjas till 100 procent. Laddningshastigheten påverkas inte nämnvärt eftersom prestandastrypningen sätter in mycket snabbt som nämnts ovan för att få ner förbrukningen till 70 W. Observera att iGPU-konfigurationen levereras med en mindre 100 W USB-C-adapter istället.
(Redaktörens anmärkning: Detta avsnitt kommer att uppdateras när reparationerna av vår Metrahit Energy-multimeter är slutförda. Vi ber om ursäkt för besväret)
| Av/Standby | |
| Låg belastning | |
| Hög belastning |
|
Förklaring:
min: | |
| HP Spectre x360 16 RTX 4050 Ultra 7 155H, GeForce RTX 4050 Laptop GPU, SK hynix PC801 HFS001TEJ9X101N, OLED, 2880x1800, 16" | HP Spectre x360 16-aa0074ng Ultra 7 155H, Arc 8-Core, Kioxia XG8 KXG80ZNV1T02, OLED, 2880x1800, 16" | HP Spectre x360 2-in-1 16-f1075ng i7-12700H, Iris Xe G7 96EUs, SK Hynix PC711 1TB HFS001TDE9X073N, IPS, 3072x1920, 16" | Honor MagicBook Pro 16 2024 Ultra 7 155H, GeForce RTX 4060 Laptop GPU, WD PC SN740 SDDPNQD-1T00, IPS, 3072x1920, 16" | MSI Prestige 16 B1MG-001US Ultra 7 155H, Arc 8-Core, Samsung PM9A1 MZVL22T0HBLB, IPS, 2560x1600, 16" | LG Gram 2in1 16 16T90R - G.AA78G i7-1360P, Iris Xe G7 96EUs, Samsung PM9A1 MZVL21T0HCLR, IPS, 2560x1600, 16" | |
|---|---|---|---|---|---|---|
| Power Consumption | 48% | 26% | -10% | 33% | 39% | |
| Idle Minimum * (Watt) | 5.8 | 4.1 29% | 9 -55% | 5.2 10% | 3 48% | 5.5 5% |
| Idle Average * (Watt) | 12.3 | 4.5 63% | 11.1 10% | 14.4 -17% | 9.5 23% | 7.2 41% |
| Idle Maximum * (Watt) | 33.9 | 5.9 83% | 16.4 52% | 15.4 55% | 12 65% | 12.9 62% |
| Load Average * (Watt) | 83.3 | 51.2 39% | 38.3 54% | 105.4 -27% | 68.3 18% | 55 34% |
| Witcher 3 ultra * (Watt) | 89.1 | 47.6 47% | 34.4 61% | 107.6 -21% | 59.8 33% | 47 47% |
| Load Maximum * (Watt) | 120.8 | 90.4 25% | 82.5 32% | 195.2 -62% | 104.8 13% | 63.6 47% |
* ... mindre är bättre
Power Consumption Witcher 3 / Stresstest
Power Consumption external Monitor
Batteritid
Batteritiden är som väntat kortare än med iGPU-konfigurationen, men skillnaden är förvånansvärt liten. Vi kan klämma ut 11 timmars verklig surfanvändning med den balanserade profilen eller bara ungefär en timme mindre än vad vi registrerade på iGPU-enheten. Att välja IPS-konfigurationen kommer sannolikt att förlänga körtiderna.
| HP Spectre x360 16 RTX 4050 Ultra 7 155H, GeForce RTX 4050 Laptop GPU, 83 Wh | HP Spectre x360 16-aa0074ng Ultra 7 155H, Arc 8-Core, 83 Wh | HP Spectre x360 2-in-1 16-f1075ng i7-12700H, Iris Xe G7 96EUs, 83 Wh | Honor MagicBook Pro 16 2024 Ultra 7 155H, GeForce RTX 4060 Laptop GPU, 75 Wh | MSI Prestige 16 B1MG-001US Ultra 7 155H, Arc 8-Core, 99.9 Wh | LG Gram 2in1 16 16T90R - G.AA78G i7-1360P, Iris Xe G7 96EUs, 80 Wh | |
|---|---|---|---|---|---|---|
| Batteridrifttid | 9% | -5% | 11% | 66% | 8% | |
| WiFi v1.3 (h) | 11 | 12 9% | 10.5 -5% | 12.2 11% | 18.3 66% | 11.9 8% |
| H.264 (h) | 14.4 | 11.2 | 13.1 | |||
| Load (h) | 2.3 | 1.6 | 1 | 2.8 | 2 | |
| Reader / Idle (h) | 20.6 | 25.1 |
För
Emot
Slutsats - Mångsidig på bekostnad av viss prestanda
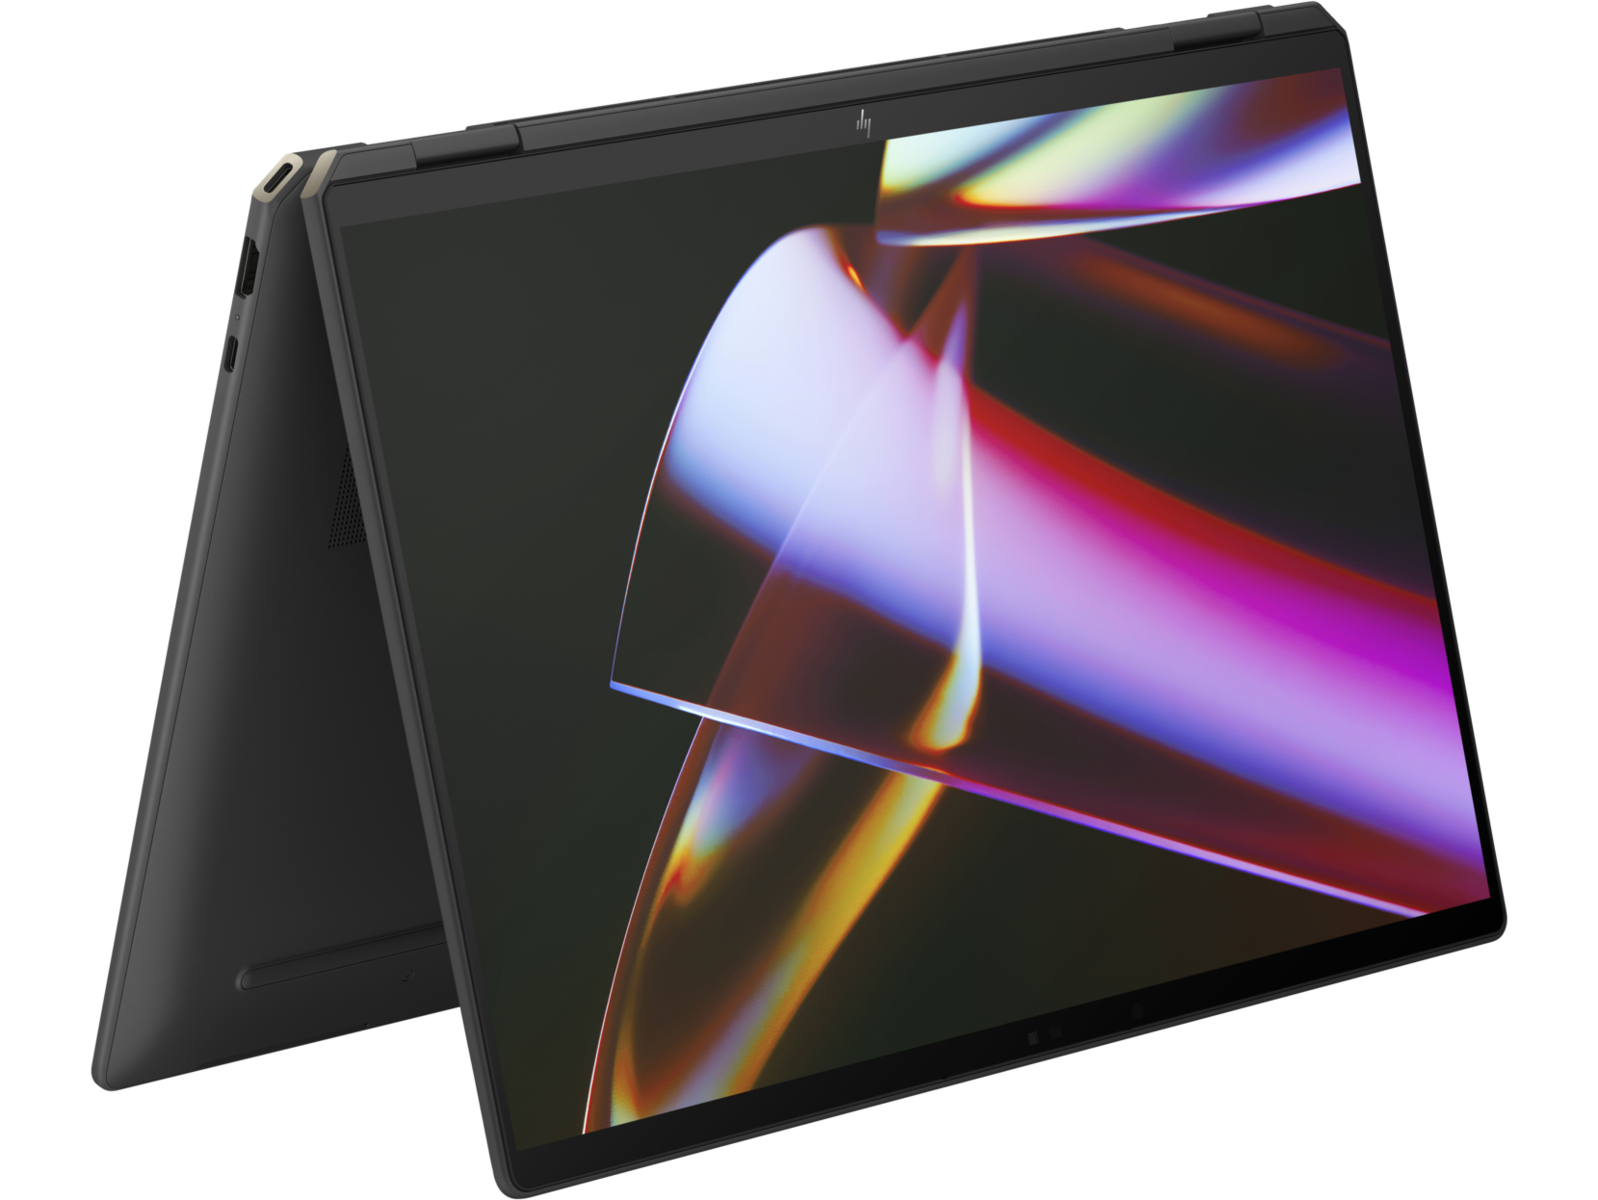
HP Spectre x360 16 är en av de tystaste och mest bärbara 16-tums konvertibla bärbara datorerna på marknaden med diskret GeForce RTX 4050-grafik. Systemet är utformat för power users som är på språng och som också kan dra nytta av 2-i-1-formfaktorn och de djupa P3-färgerna på OLED-pekskärmen. Modellen är en framgång ur det perspektivet.
Den tunna designen krävde prestandakompromisser. I synnerhet är 55 W RTX 4050 GPU betydligt långsammare än de flesta andra bärbara datorer med samma grafikalternativ. Spectre x360 16 är naturligtvis fortfarande snabb för sin storlek, men dess GeForce GPU ligger definitivt i den lägre delen av spektrumet på grund av dess låga TGP-mål. Användare som vill maximera prestanda eller inte tycker att 2-i-1-formfaktorn är användbar kanske vill överväga MSI Prestige 16 eller Honor MagicBook Pro 16 som istället kan konfigureras med mer avancerad RTX-grafik än HP och samtidigt behålla en liknande tunn-och-lätt designfilosofi.
Spectre x360 16 är en avancerad och välbyggd 16-tums konvertibel. Prestandan är i allmänhet utmärkt, men det finns säkert snabbare alternativ där ute om du är villig att ge upp 2-i-1-designen.
Vi måste också nämna den långsammare än förväntade CPU-prestandan för dGPU-konfigurationen i skrivande stund. HP säger att en hotfix är på gång och vi kommer att uppdatera CPU-avsnittet när fixen går live. I övrigt verkar GPU:n prestera korrekt.
Pris och tillgänglighet
HP levererar nu Spectre x360 16 2-in-1 med GeForce RTX 4050 grafik från $1440 med IPS-pekskärm eller $1600 med OLED-pekskärm enligt recensionen.
HP Spectre x360 16 RTX 4050
- 03/13/2024 v7 (old)
Allen Ngo
Genomskinlighet
Valet av enheter som ska granskas görs av vår redaktion. Testprovet gavs till författaren som ett lån av tillverkaren eller återförsäljaren för denna recension. Långivaren hade inget inflytande på denna recension och inte heller fick tillverkaren en kopia av denna recension innan publiceringen. Det fanns ingen skyldighet att publicera denna recension. Som ett oberoende medieföretag är Notebookcheck inte föremål för auktoritet från tillverkare, återförsäljare eller förlag.
This is how Notebookcheck is testingEvery year, Notebookcheck independently reviews hundreds of laptops and smartphones using standardized procedures to ensure that all results are comparable. We have continuously developed our test methods for around 20 years and set industry standards in the process. In our test labs, high-quality measuring equipment is utilized by experienced technicians and editors. These tests involve a multi-stage validation process. Our complex rating system is based on hundreds of well-founded measurements and benchmarks, which maintains objectivity.
Price comparison

