Recension av den bärbara datorn Lenovo ThinkPad T16 Gen 1 Core i7: Tyst på bekostnad av prestanda
ThinkPad T16 G1 är Lenovos andra 16-tums ThinkPad som är utformad för att vara ett steg uppåt från den befintliga ThinkBook 16-serien för prosumenter. Den har både 12:e generationens Core U- och Core P-CPU-alternativ tillsammans med den diskreta GeForce MX550 GPU:n på vissa SKU:er.
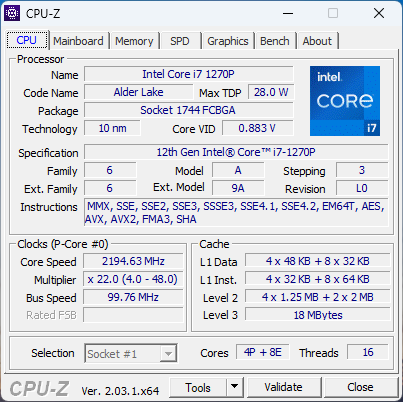
Vi recenserade nyligen Core i5-1240P- och Ryzen 5 Pro 6650U-konfigurationerna och därför kommer den här recensionen att fokusera på Core i7-1270P-konfigurationen. Vi rekommenderar att du kollar in vår befintliga recension av Core i5-versionen för att lära dig mer om chassit och andra fysiska egenskaper hos ThinkPad T16 G1. Hur stor skillnad i prestanda kan användare förvänta sig när de uppgraderar till det dyrare Core i7-alternativet?
Konkurrenter till ThinkPad T16 G1 är bland annat 16-tums LG Gram 16, MSI Summit E16eller HP EliteBook 860/865 G9. Dell har i skrivande stund ännu inte lanserat någon direkt 16-tums konkurrent till Latitude. Vår konfiguration som den har granskats kostar cirka 1 800 USD.
Fler recensioner av Lenovo:
Potentiella konkurrenter i jämförelse
Gradering | Datum | Modell | Vikt | Höjd | Storlek | Upplösning | Pris |
|---|---|---|---|---|---|---|---|
| 88.6 % v7 (old) | 01/2023 | Lenovo ThinkPad T16 Gen 1 Core i7-1270P i7-1270P, Iris Xe G7 96EUs | 2 kg | 20.5 mm | 16.00" | 1920x1200 | |
| 90.2 % v7 (old) | 02/2023 | Lenovo ThinkPad T16 G1 21CH004MGE R5 PRO 6650U, Radeon 660M | 1.8 kg | 20.5 mm | 16.00" | 2560x1600 | |
| 86.6 % v7 (old) | 01/2023 | LG Gram 16Z90Q i7-1260P, Iris Xe G7 96EUs | 1.2 kg | 16.8 mm | 16.00" | 2560x1600 | |
| 87.2 % v7 (old) | 12/2022 | HP EliteBook 865 G9 R7 PRO 6850U, Radeon 680M | 1.9 kg | 19 mm | 16.00" | 1920x1200 | |
| 86.4 % v7 (old) | 07/2022 | Huawei MateBook 16s i7 i7-12700H, Iris Xe G7 96EUs | 2 kg | 17.8 mm | 16.00" | 2520x1680 | |
| 93.2 % v7 (old) | 11/2021 | Apple MacBook Pro 16 2021 M1 Pro M1 Pro, M1 Pro 16-Core GPU | 2.2 kg | 16.8 mm | 16.20" | 3456x2234 |
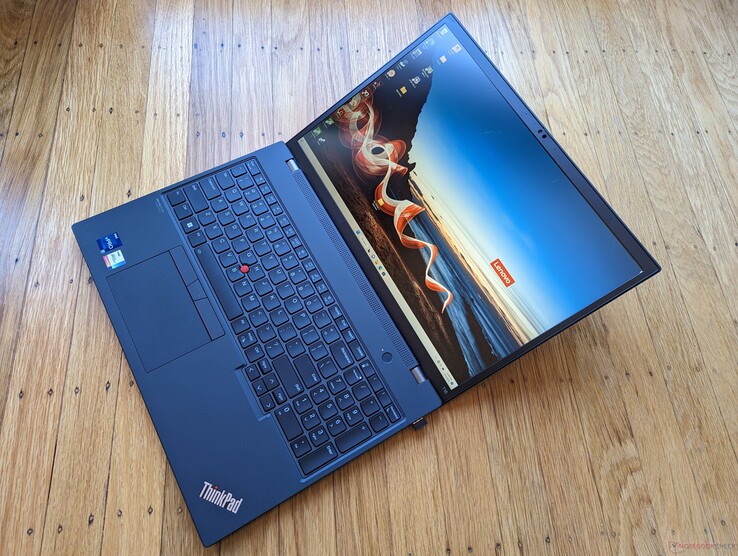
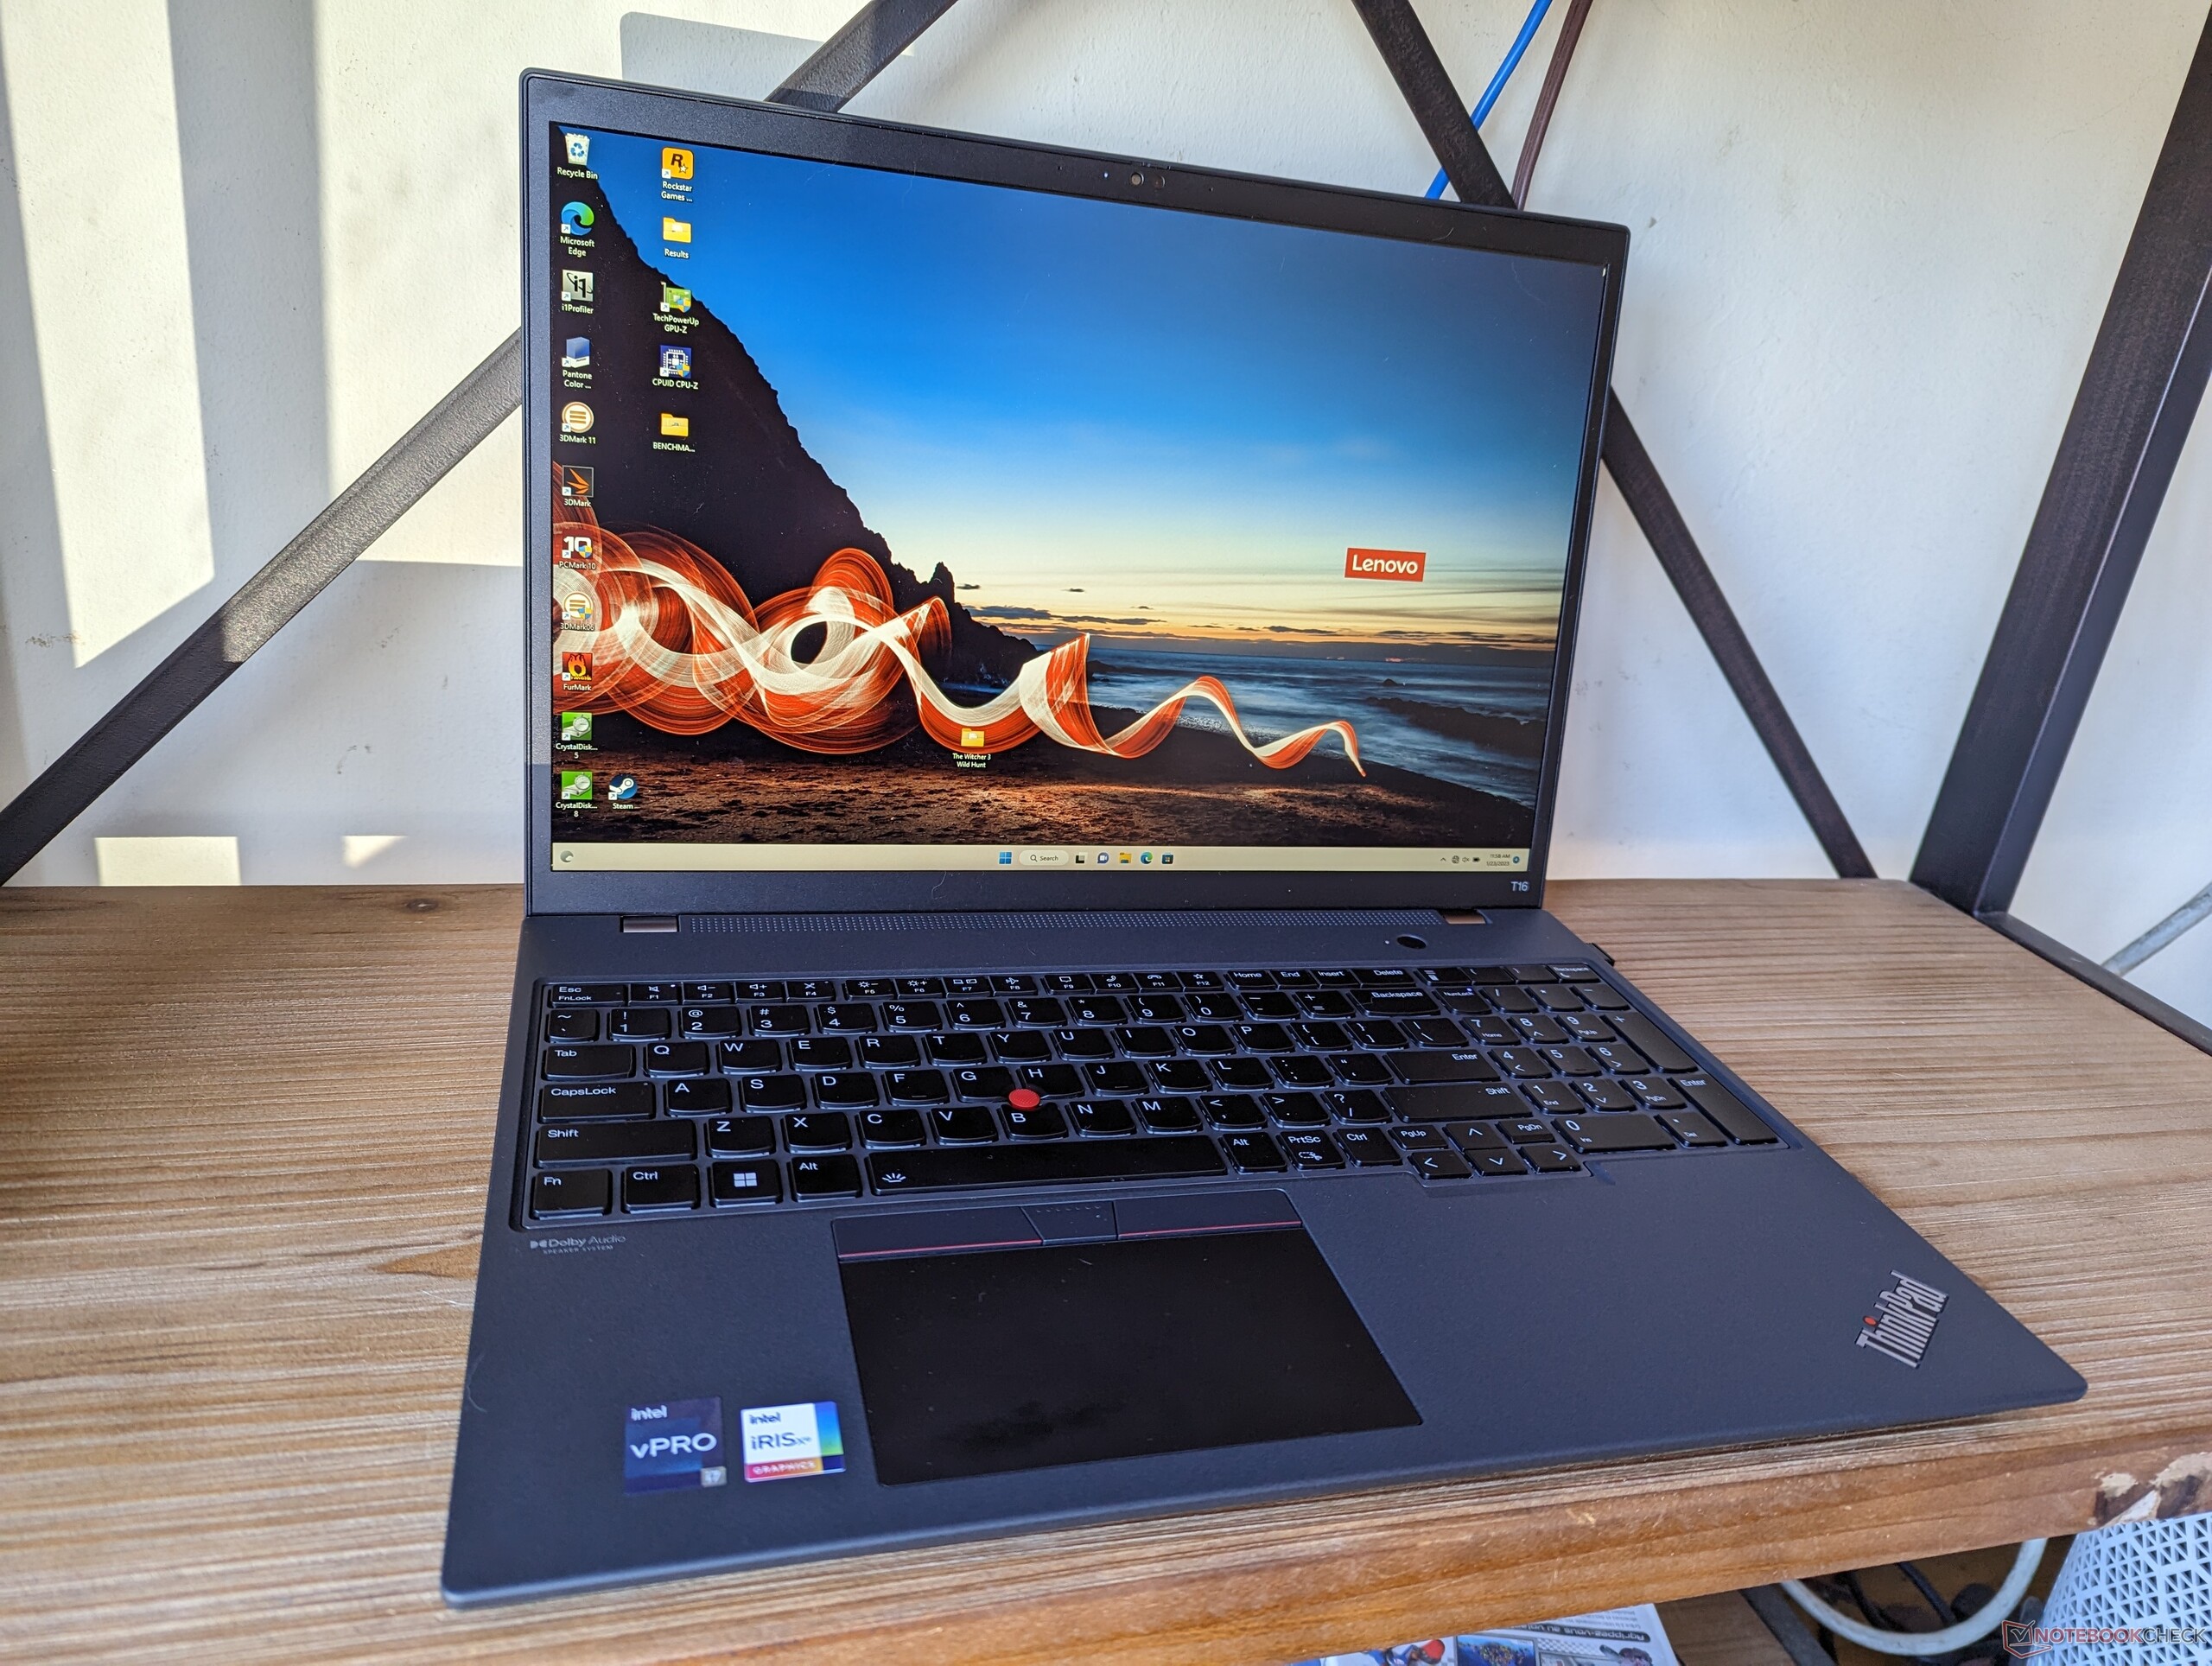
Case - Lite stor
Även om modellen bara är några månader gammal är dess chassi något större i alla dimensioner jämfört med konkurrerande bärbara 16-tumsdatorer som HP EliteBook 865 G9 eller Apple MacBook Pro 16. LG Gram 16 i synnerhet är särskilt lättare med 800 gram.
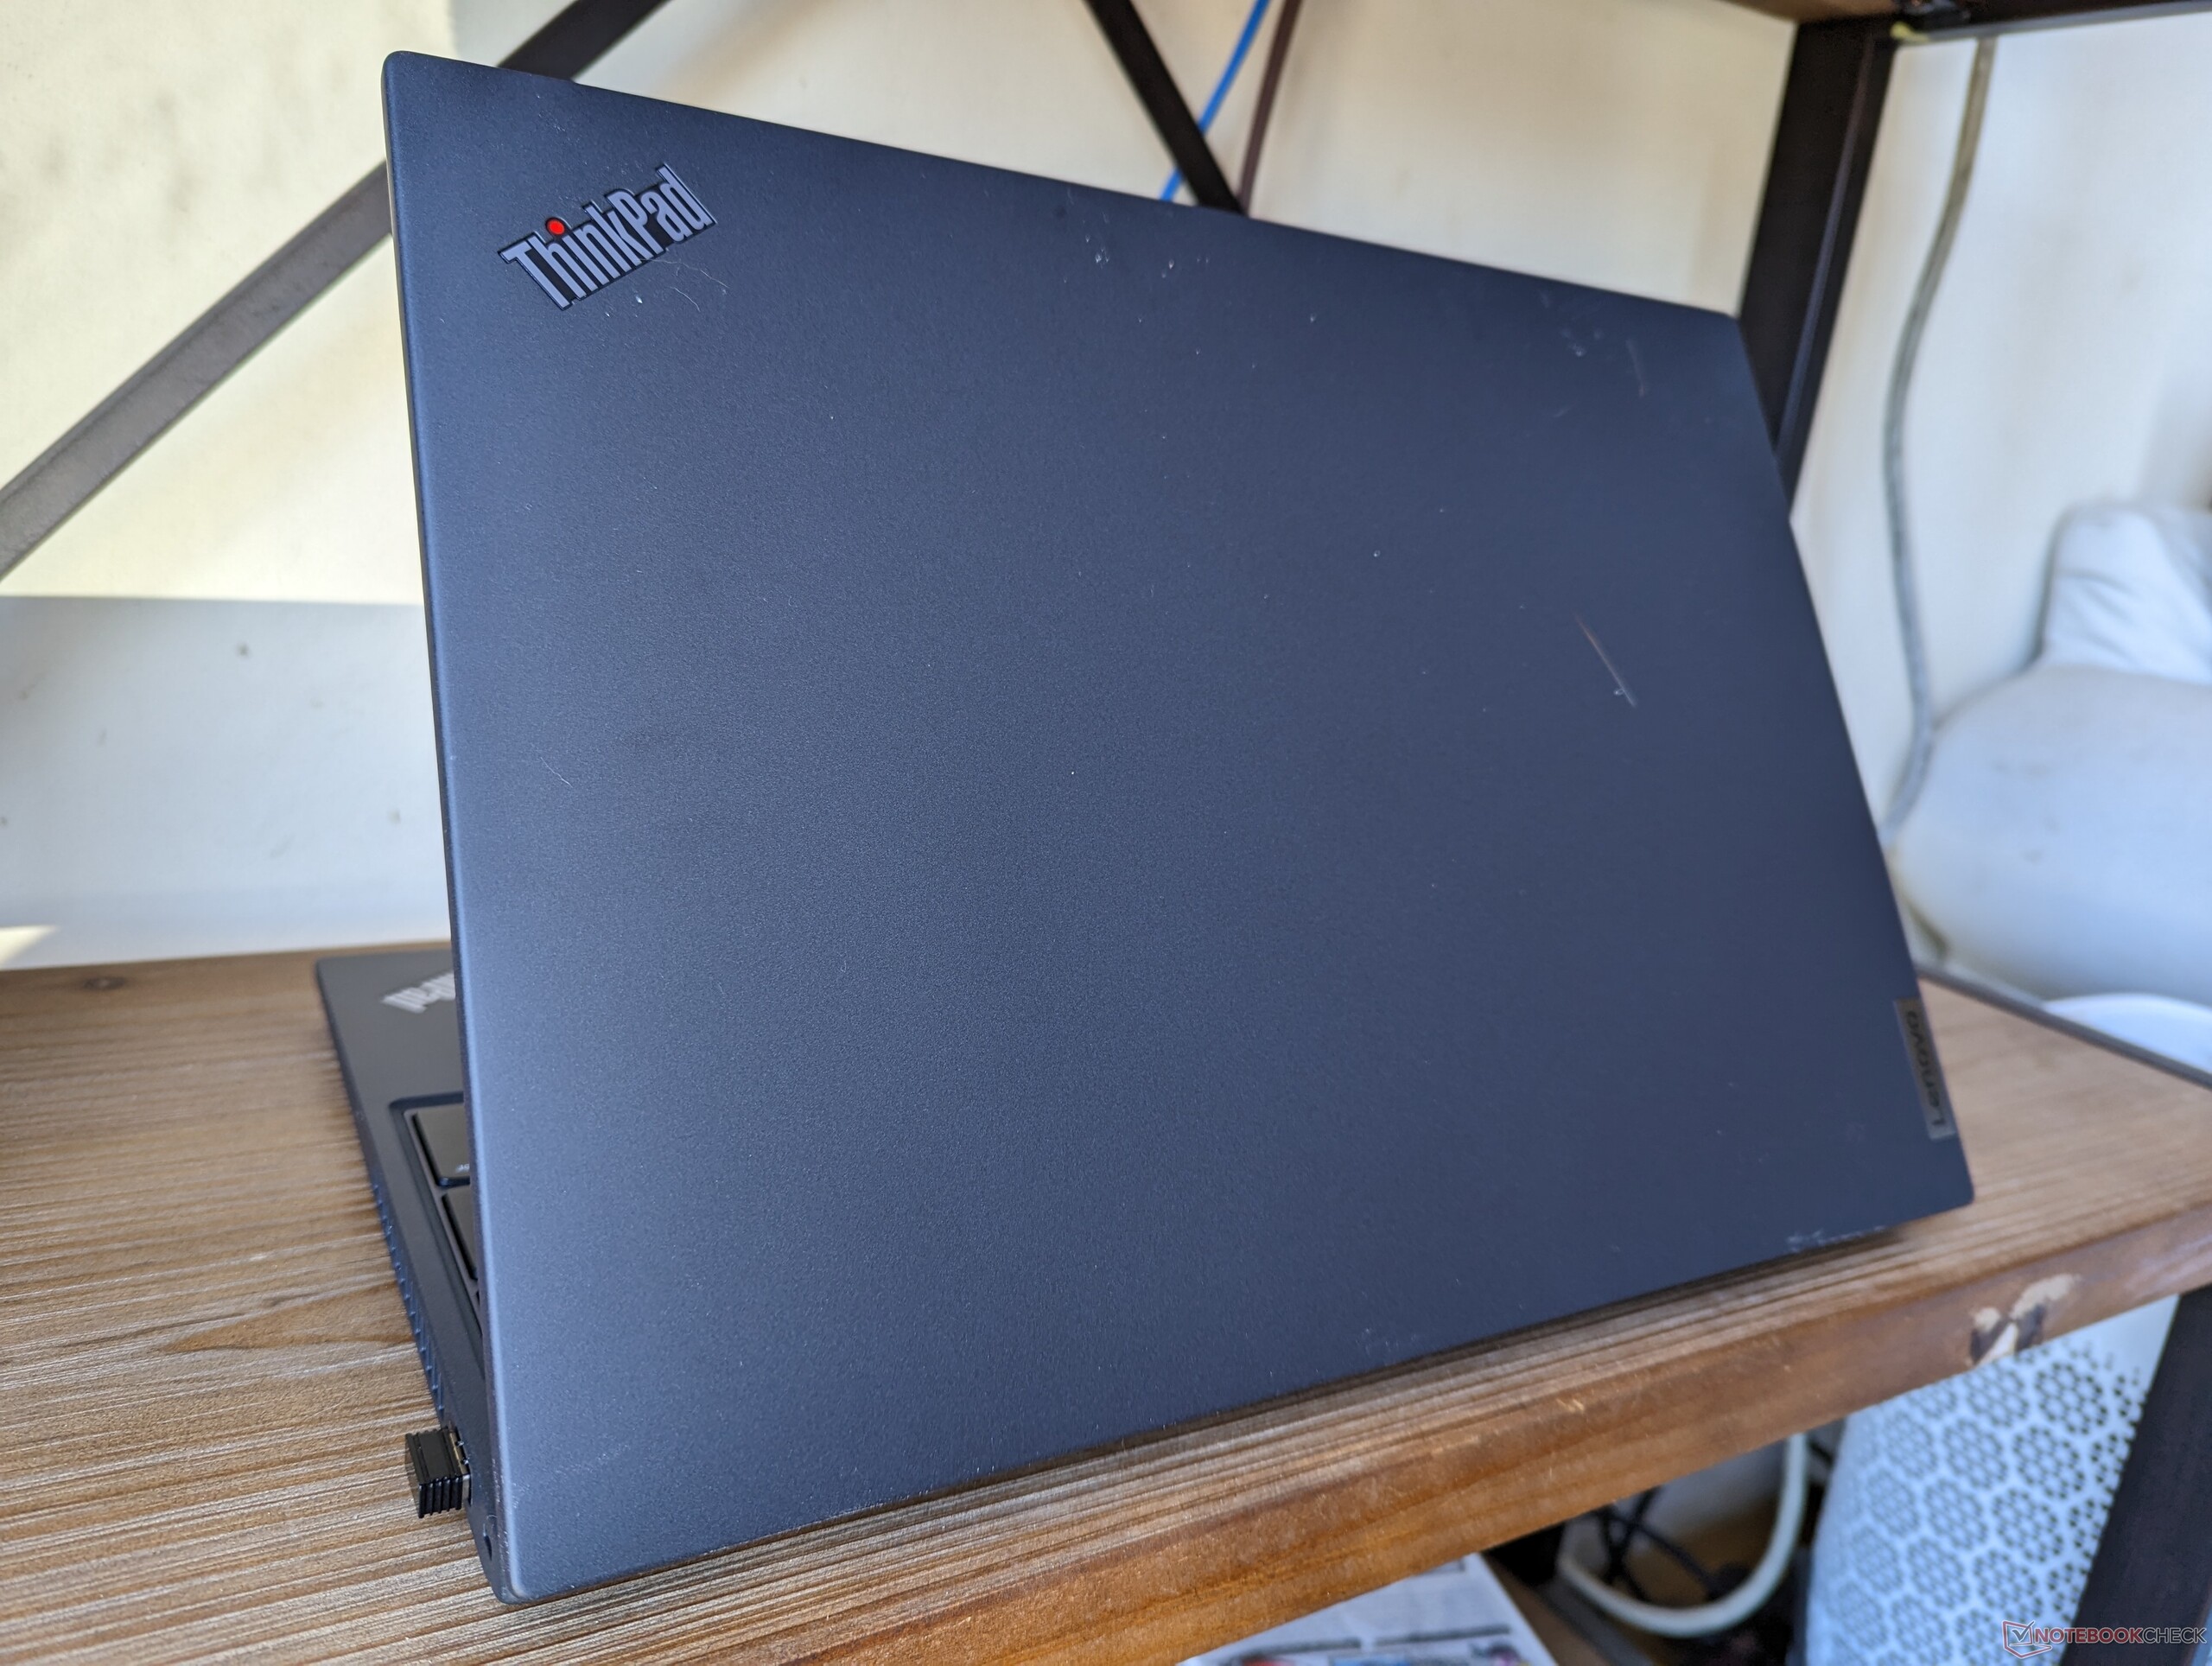
Räkna med att fett och fingeravtryck samlas mycket snabbt på de mattsvarta ytorna. Det mörka tillvägagångssättet med kolfiber, glasfiber och plast här står i kontrast till det ljusgrå tillvägagångssättet med metalllegering i den konkurrerande HP EliteBook.
Kommunikation
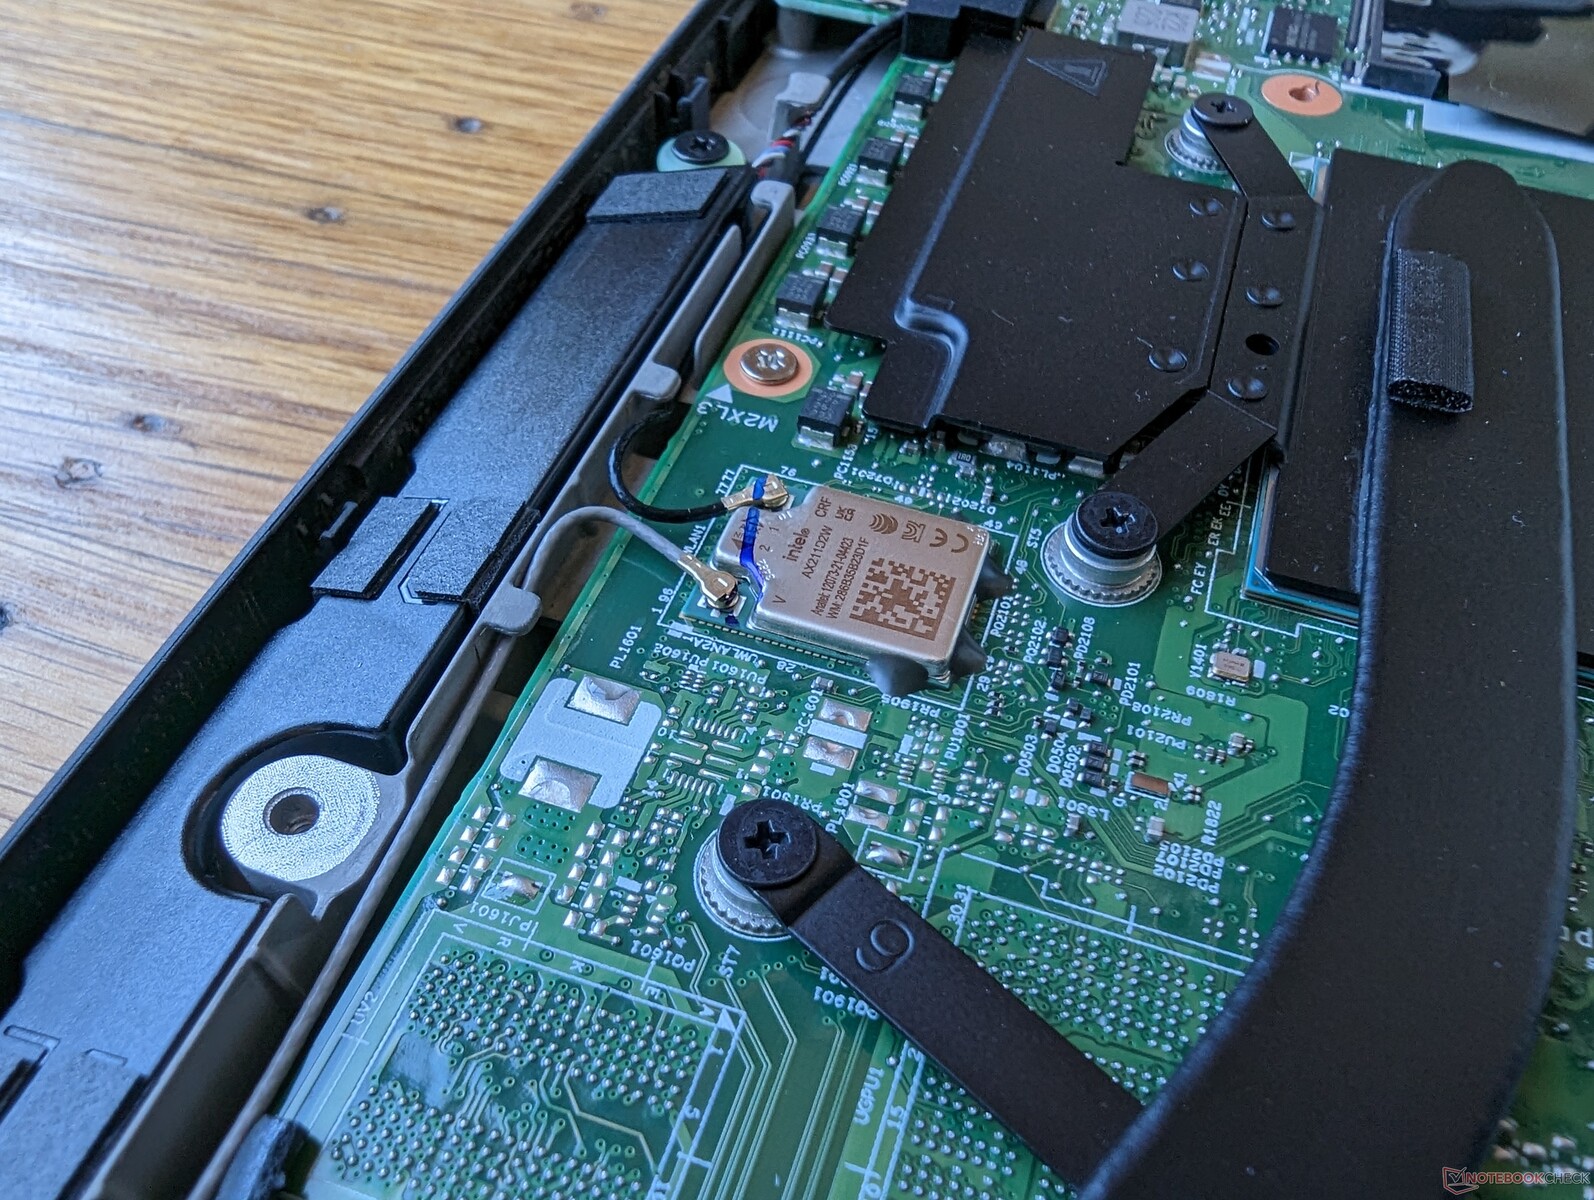
En Intel AX211 är standard för Bluetooth 5.2 och Wi-Fi 6E-anslutning. Överföringshastigheterna är stabila när de kopplas ihop med vår testrouter Asus AXE11000.
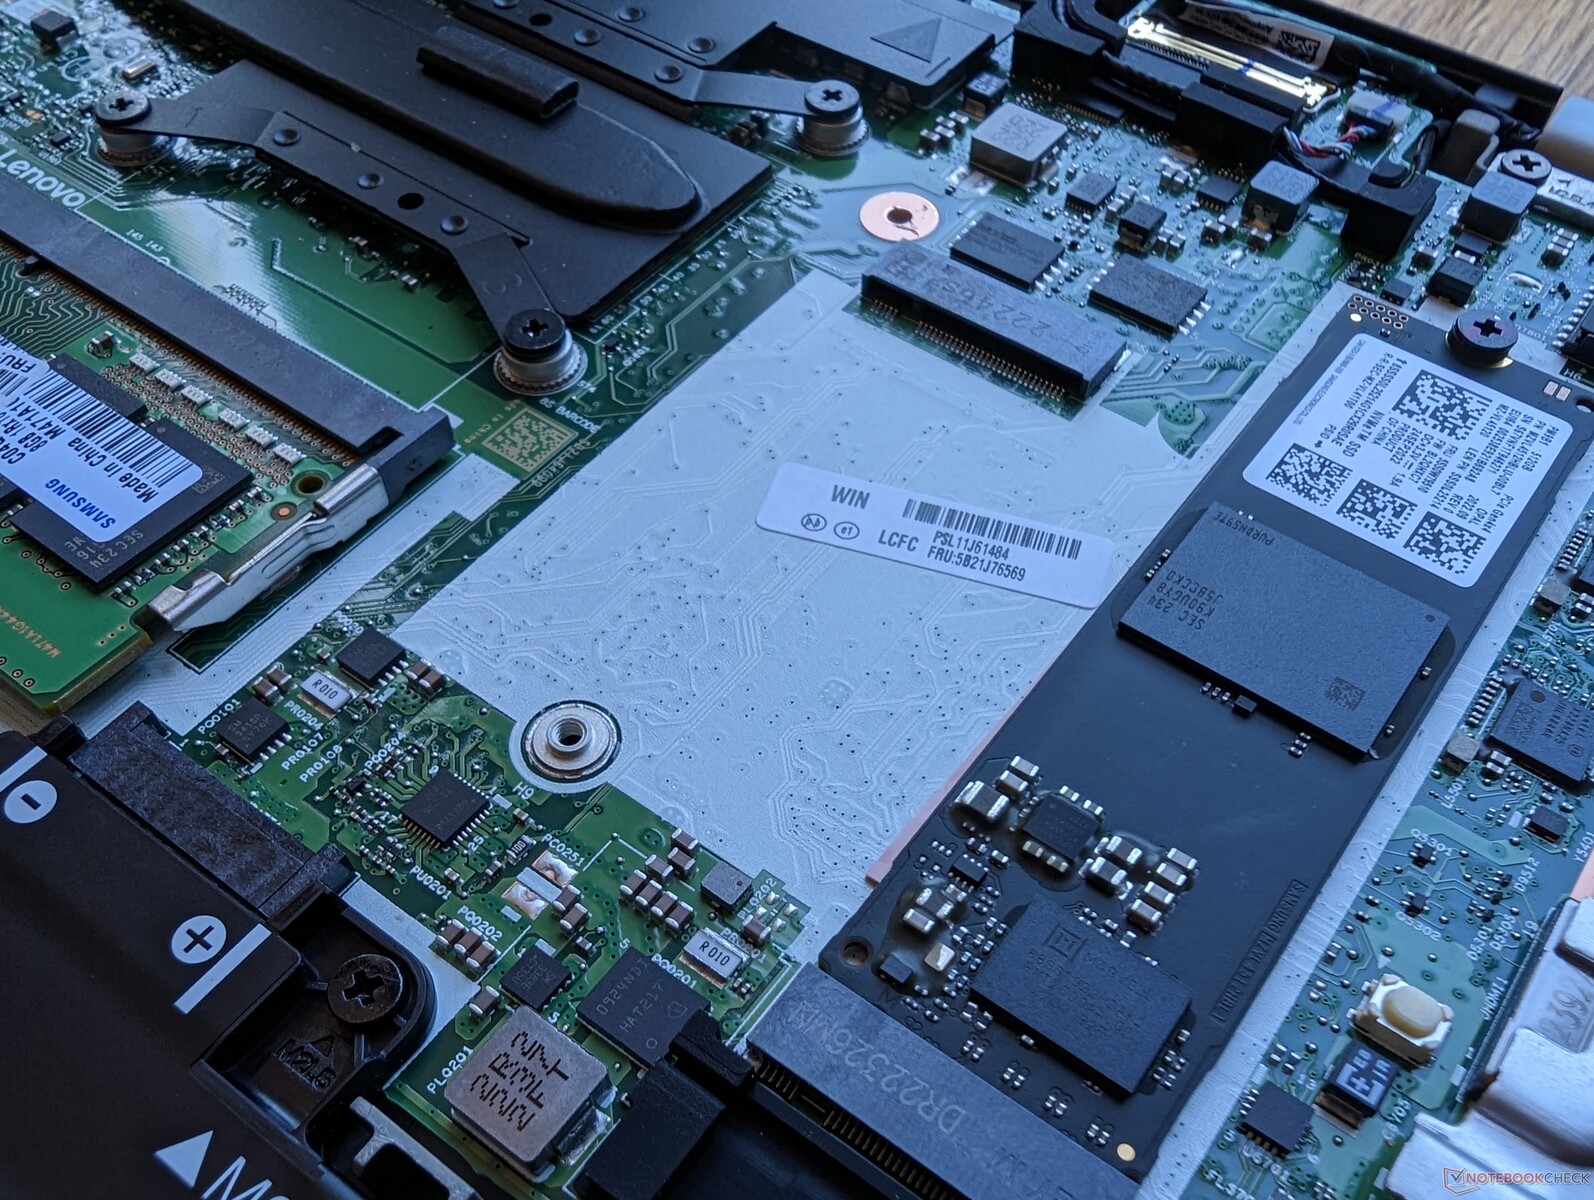
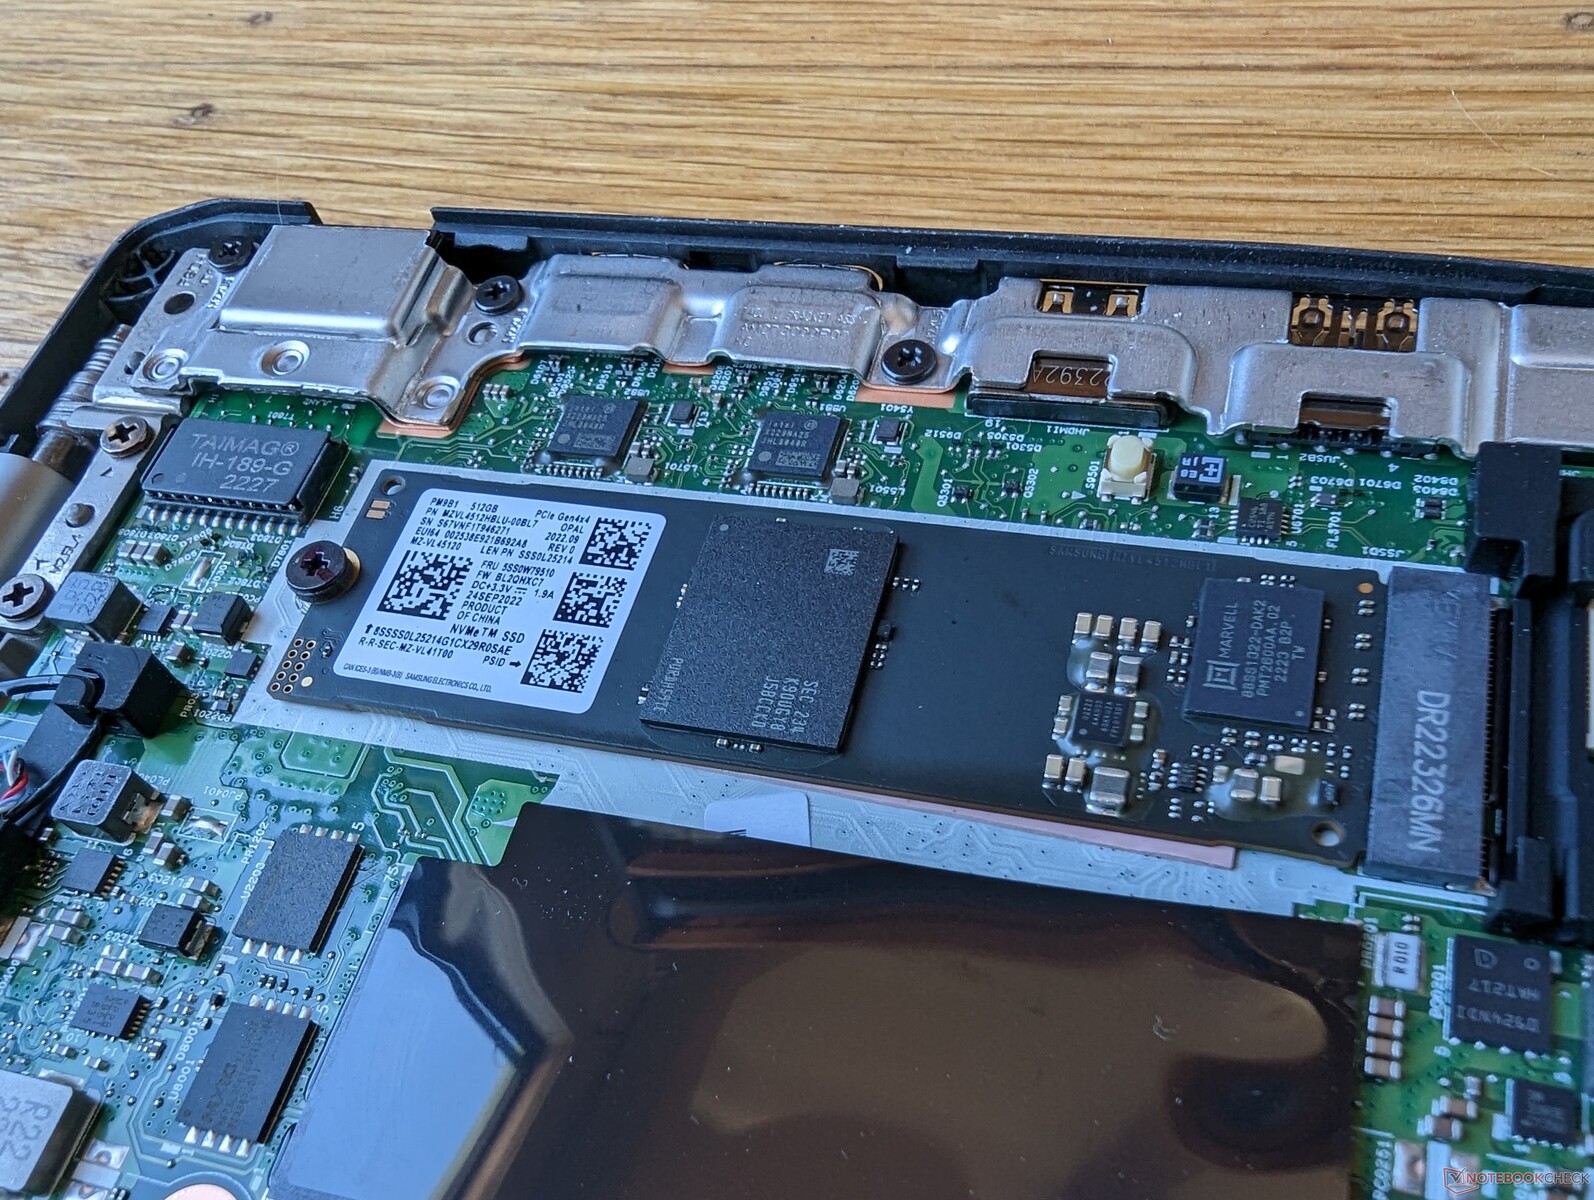
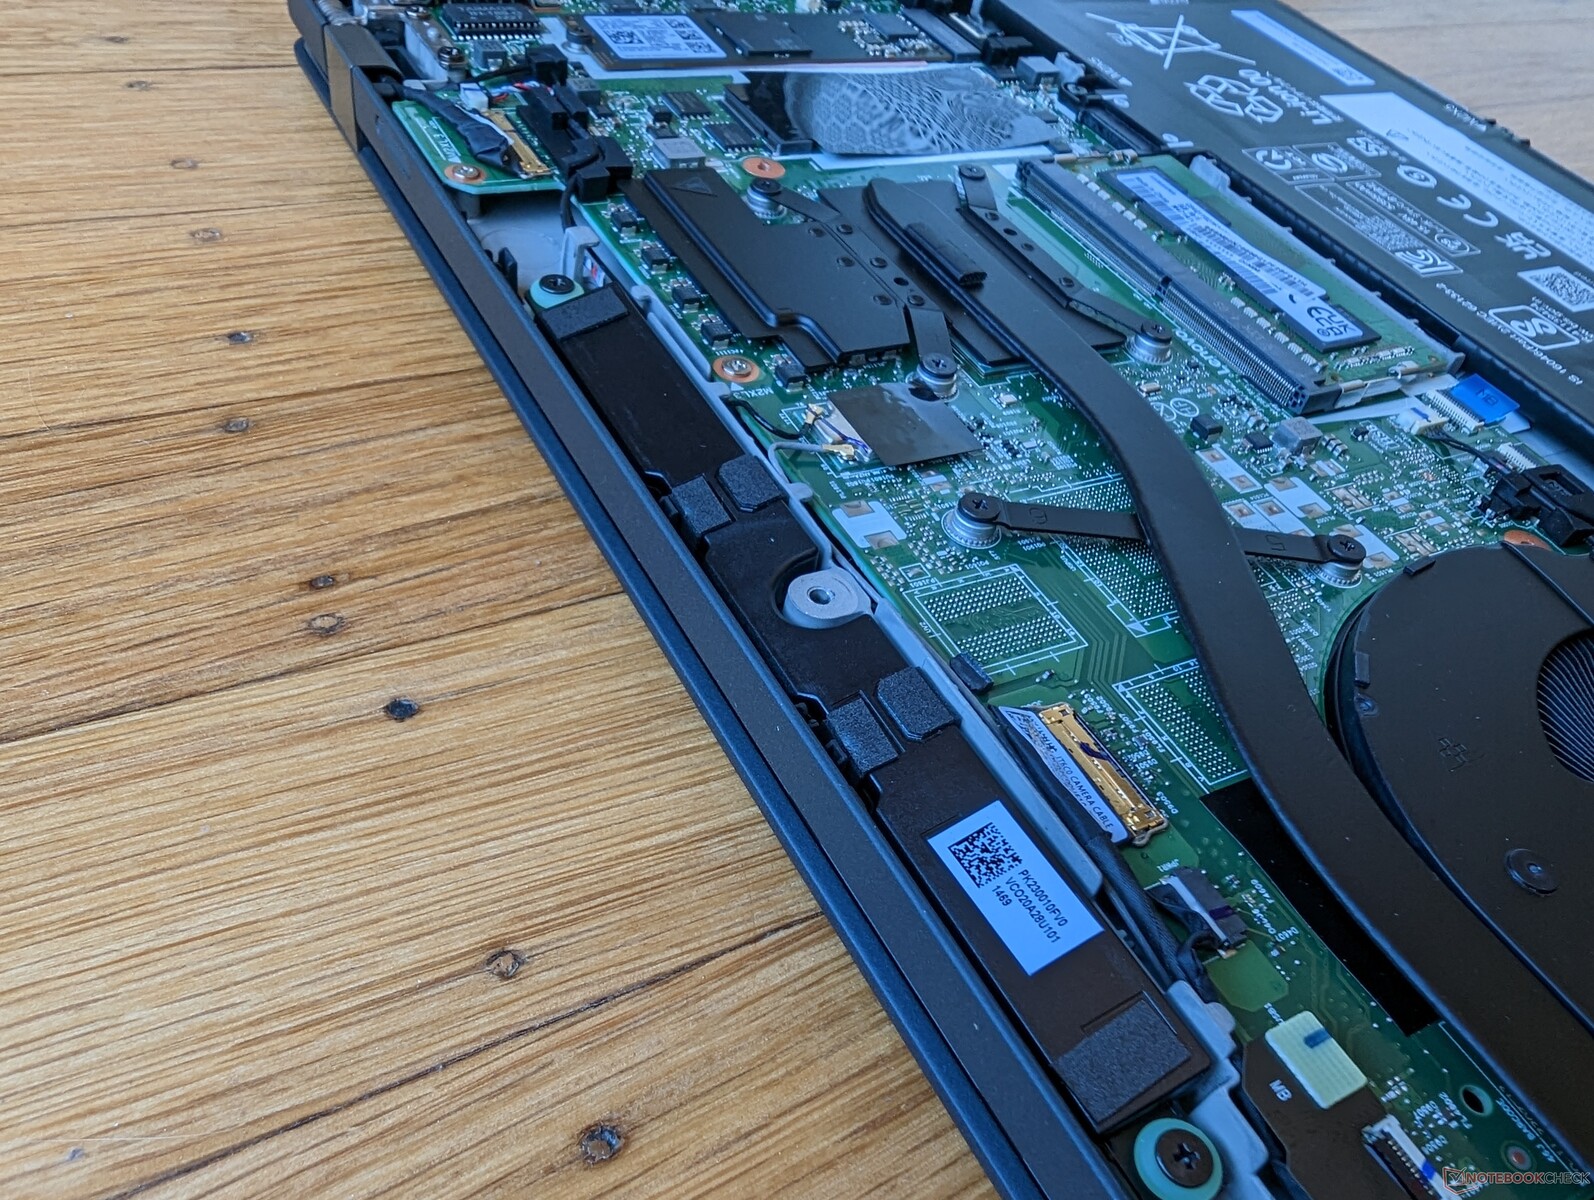
M.2 WWAN-platsen är tom i vår specifika konfiguration, vilket framgår av bilden nedan. Tyvärr inkluderar Lenovo inte antennen om man konfigurerar utan WWAN.
| Networking | |
| iperf3 transmit AX12 | |
| Apple MacBook Pro 16 2021 M1 Pro | |
| iperf3 receive AX12 | |
| Apple MacBook Pro 16 2021 M1 Pro | |
| iperf3 receive AXE11000 6GHz | |
| Lenovo ThinkPad T16 G1 21CH004MGE | |
| Huawei MateBook 16s i7 | |
| Lenovo ThinkPad T16 Gen 1 Core i7-1270P | |
| iperf3 receive AXE11000 | |
| Lenovo ThinkPad T16 G1 21CH004MGE | |
| HP EliteBook 865 G9 | |
| LG Gram 16Z90Q | |
| Lenovo ThinkPad T16 Gen 1 Core i7-1270P | |
| Apple MacBook Pro 16 2021 M1 Pro | |
| iperf3 transmit AXE11000 | |
| Lenovo ThinkPad T16 G1 21CH004MGE | |
| HP EliteBook 865 G9 | |
| LG Gram 16Z90Q | |
| Lenovo ThinkPad T16 Gen 1 Core i7-1270P | |
| Apple MacBook Pro 16 2021 M1 Pro | |
| iperf3 transmit AXE11000 6GHz | |
| Lenovo ThinkPad T16 G1 21CH004MGE | |
| Huawei MateBook 16s i7 | |
| Lenovo ThinkPad T16 Gen 1 Core i7-1270P | |
Webbkamera
Webbkameran med 2 MP är liten i jämförelse med de 5 MP-webbkameror som nu levereras på många HP EliteBook-modeller. ThinkPad T16 har både IR- och fysisk slutare.


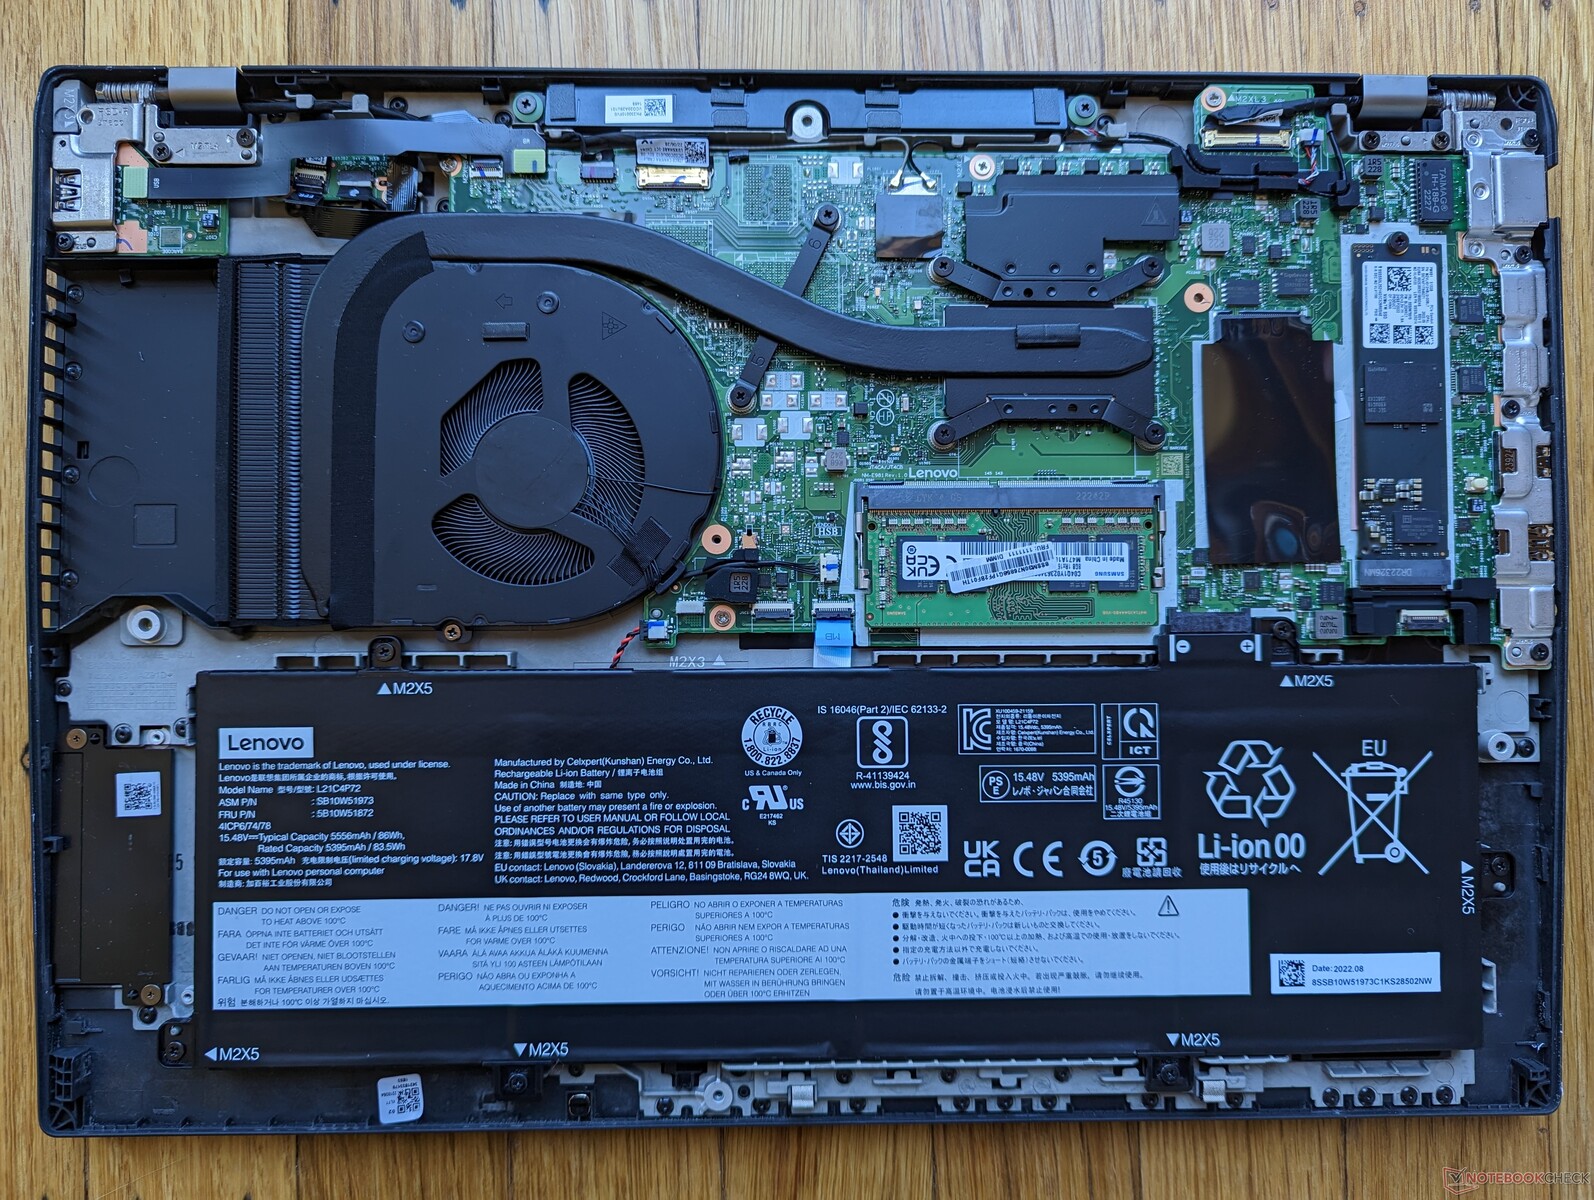
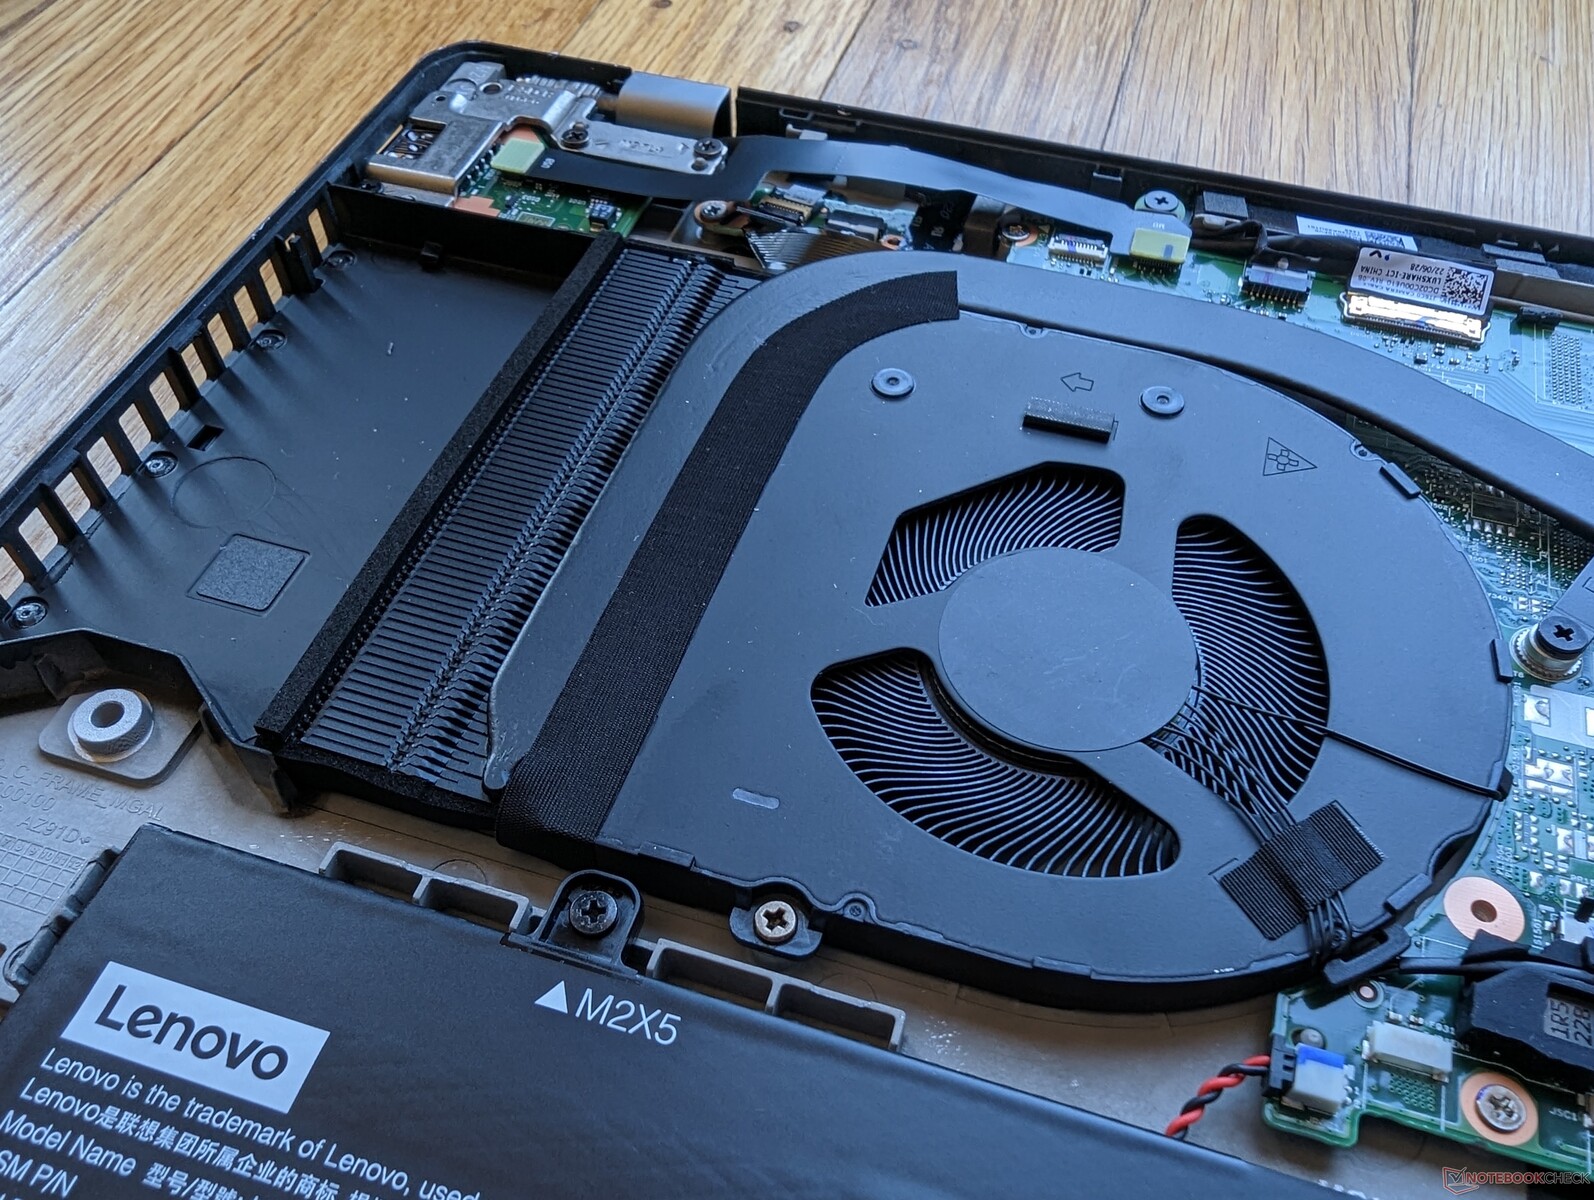
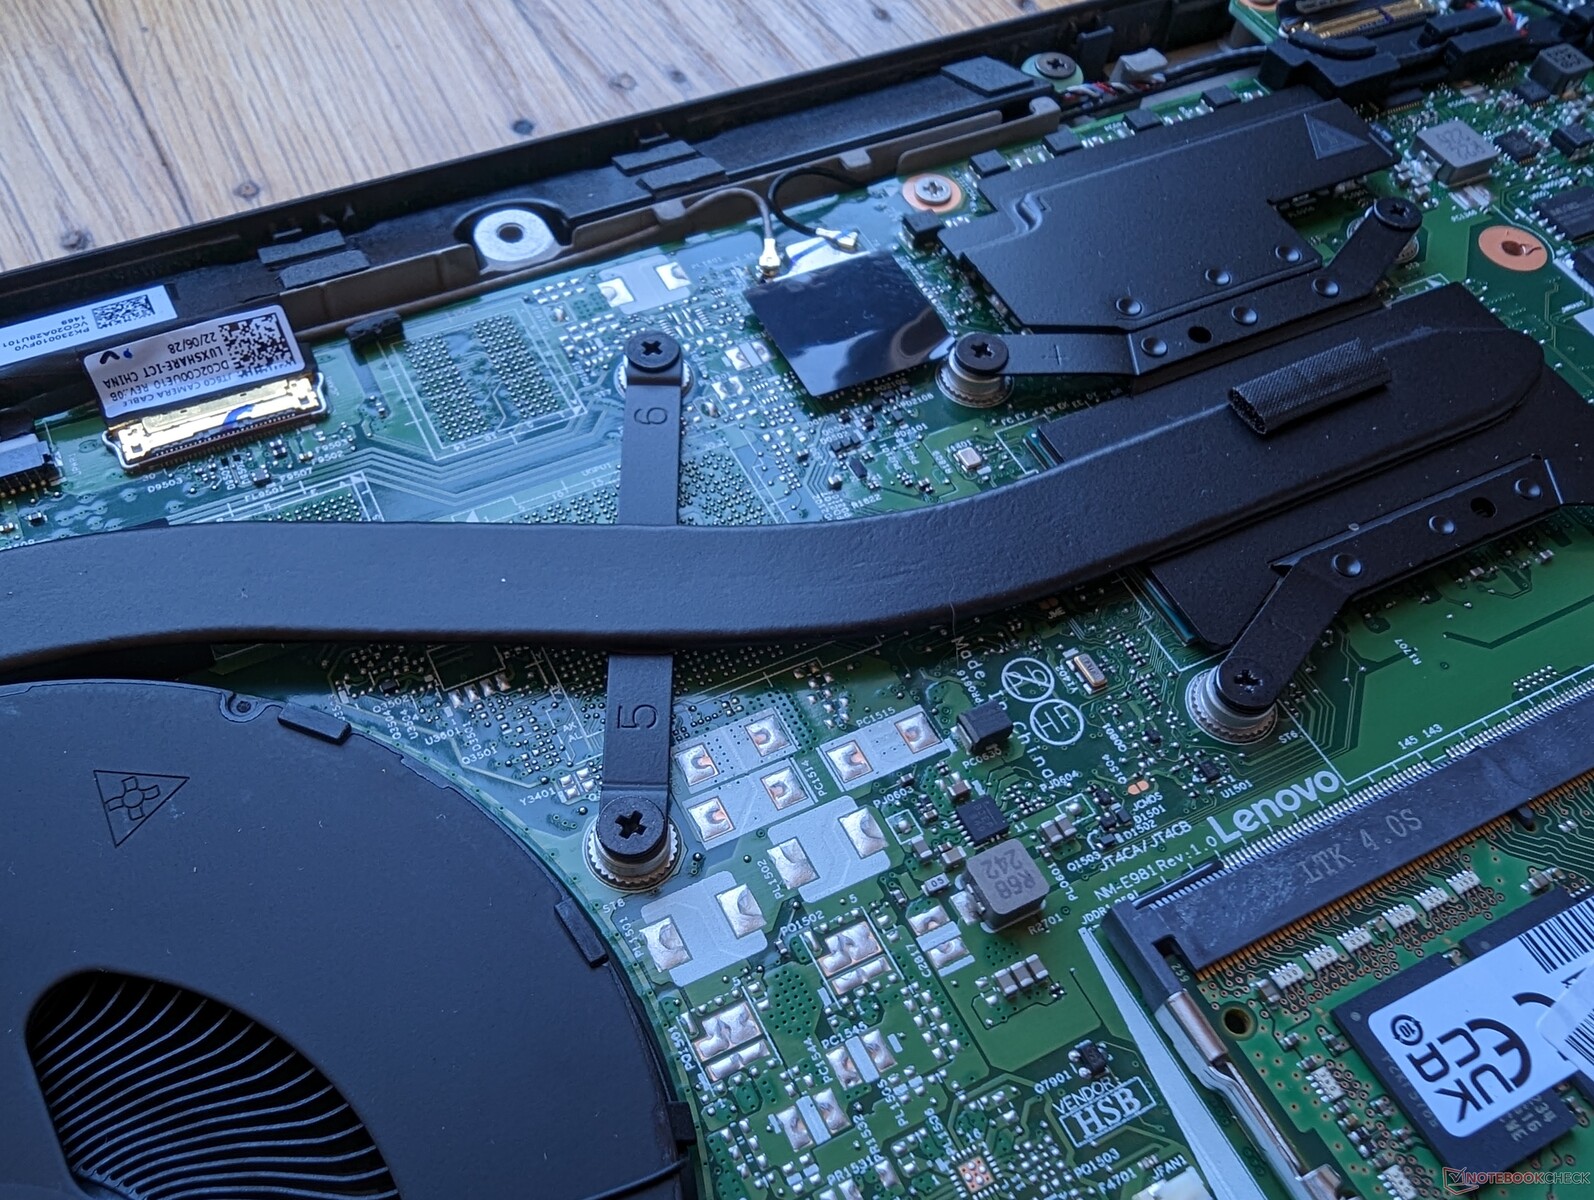
Underhåll
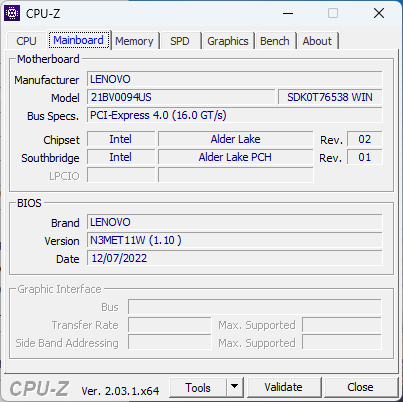
Bottenpanelen är fäst med åtta Philips-skruvar för enkel service. Tänk på att modellen levereras med 8 GB lödda RAM-minne plus 1x SODIMM-plats för expansion medan de flesta andra bärbara datorer endast använder lödda RAM-minne eller 2x SODIMM. Vissa SKU:er kan komma med 16 GB lödda RAM-minne istället.
Tillbehör och garanti
Det finns inga extra tillbehör i förpackningen förutom nätadapter och papper. En ettårig tillverkarbegränsning gäller om den köps i USA.
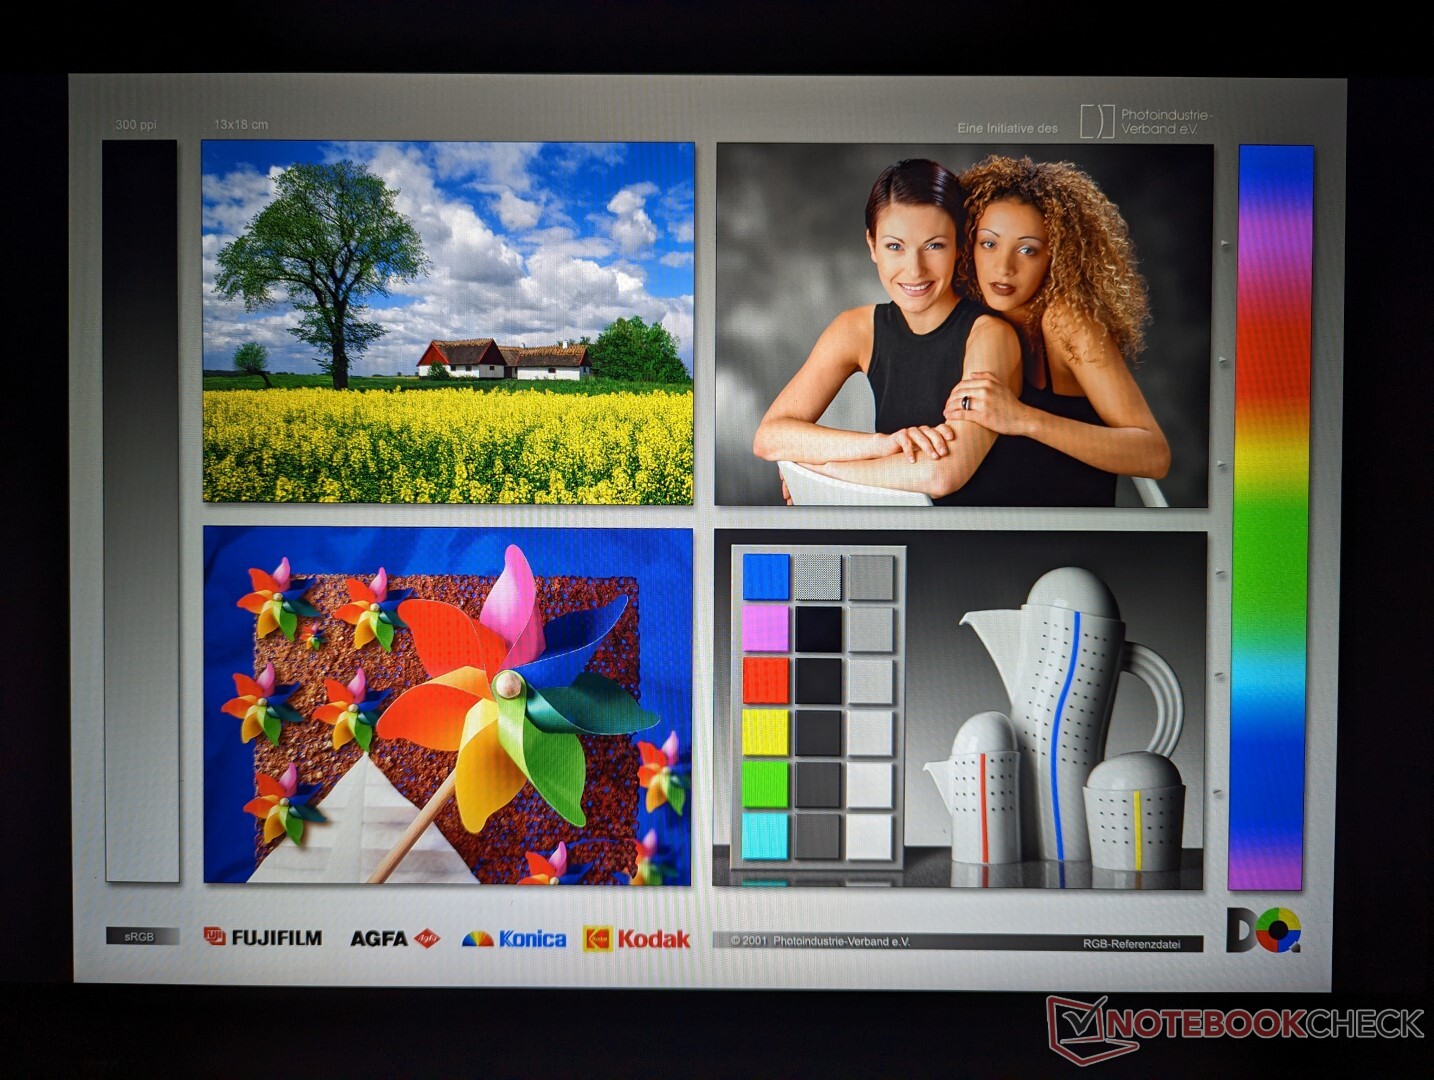
Display - från låg till hög nivå
Lenovo erbjuder för närvarande fem olika matta IPS-skärmar enligt följande:
- 1920 x 1200, 300 nits, 45 % NTSC
- 1920 x 1200, 300 nits, pekskärm, 45 % NTSC
- 1920 x 1200, låg effekt, 400 nits, 100 % sRGB, lågt blått ljus
- 1920 x 1200, pekskärm med Privacy Guard, 500 nits, 100 % sRGB, lågt blått ljus
- 2560 x 1600, 400 nits, lågt blått ljus, kalibrerad av International Color Consortium
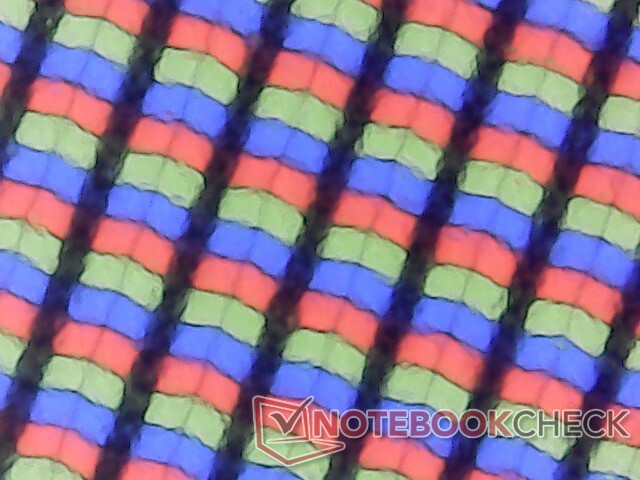
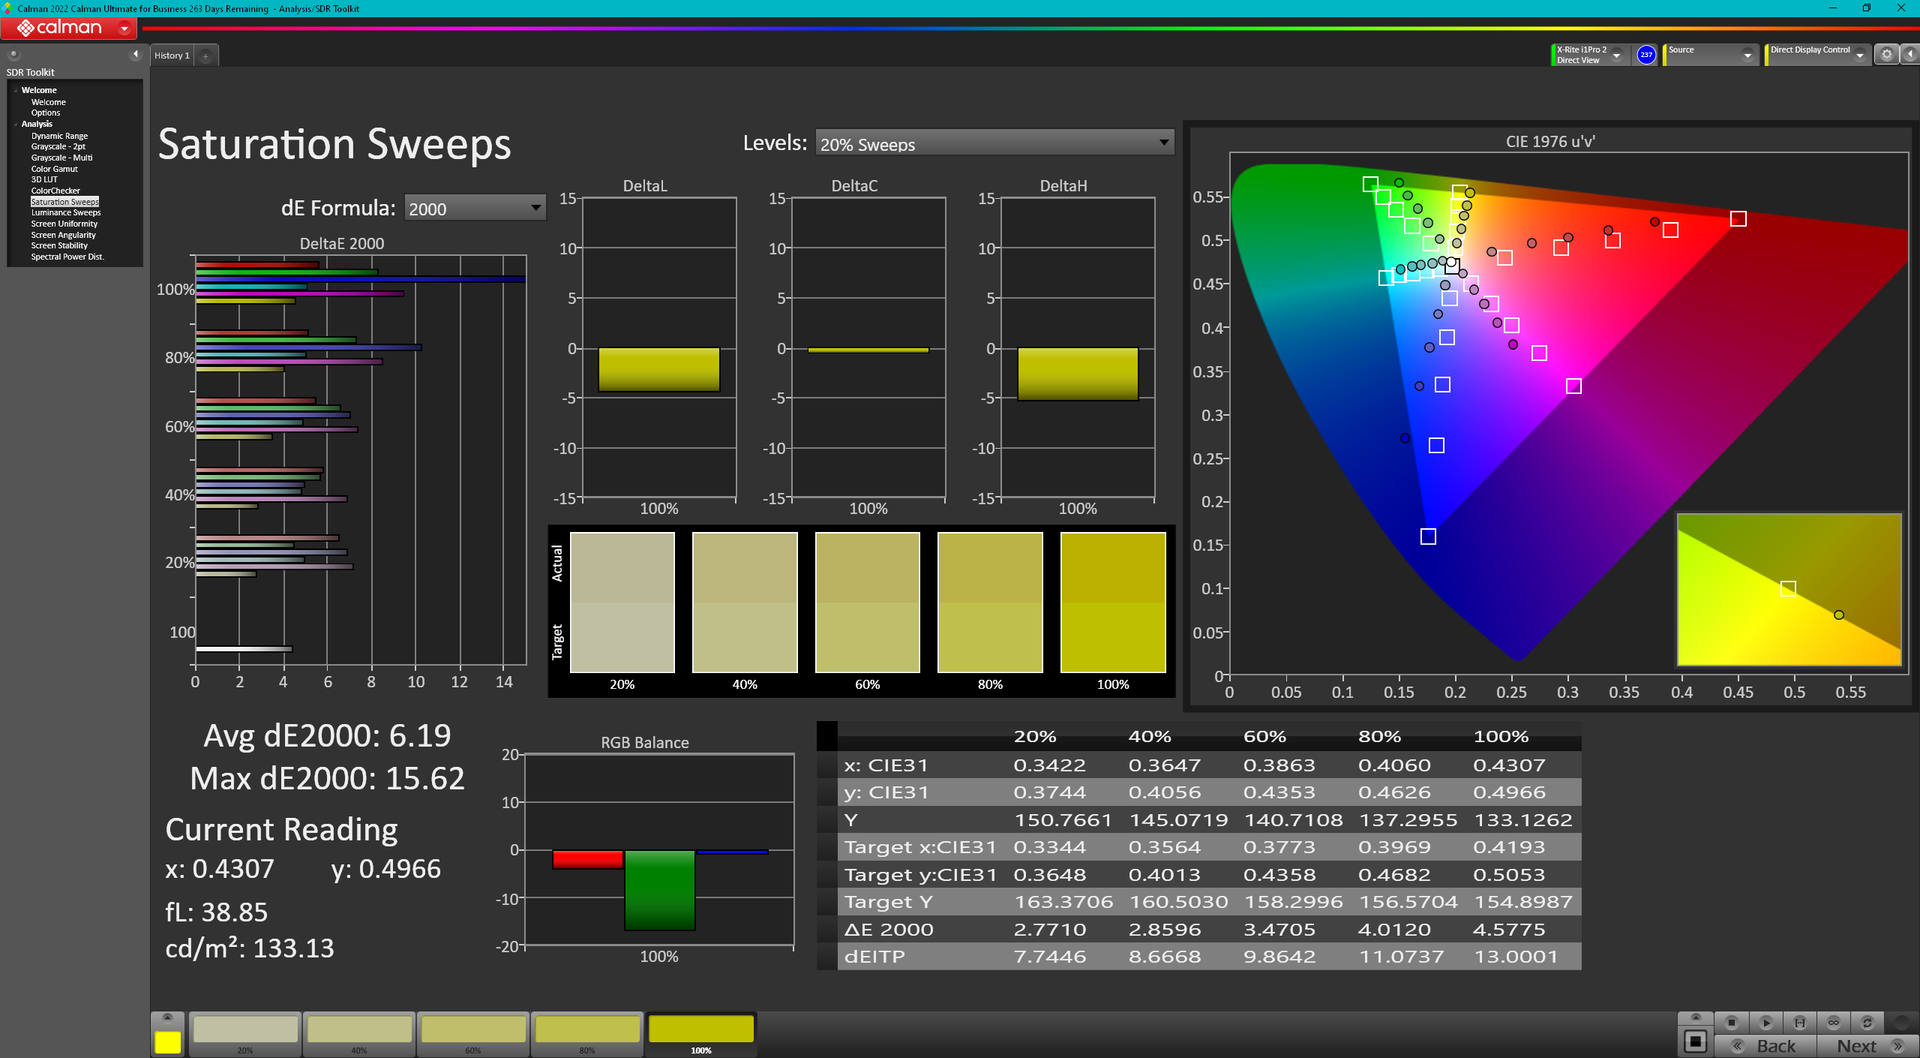
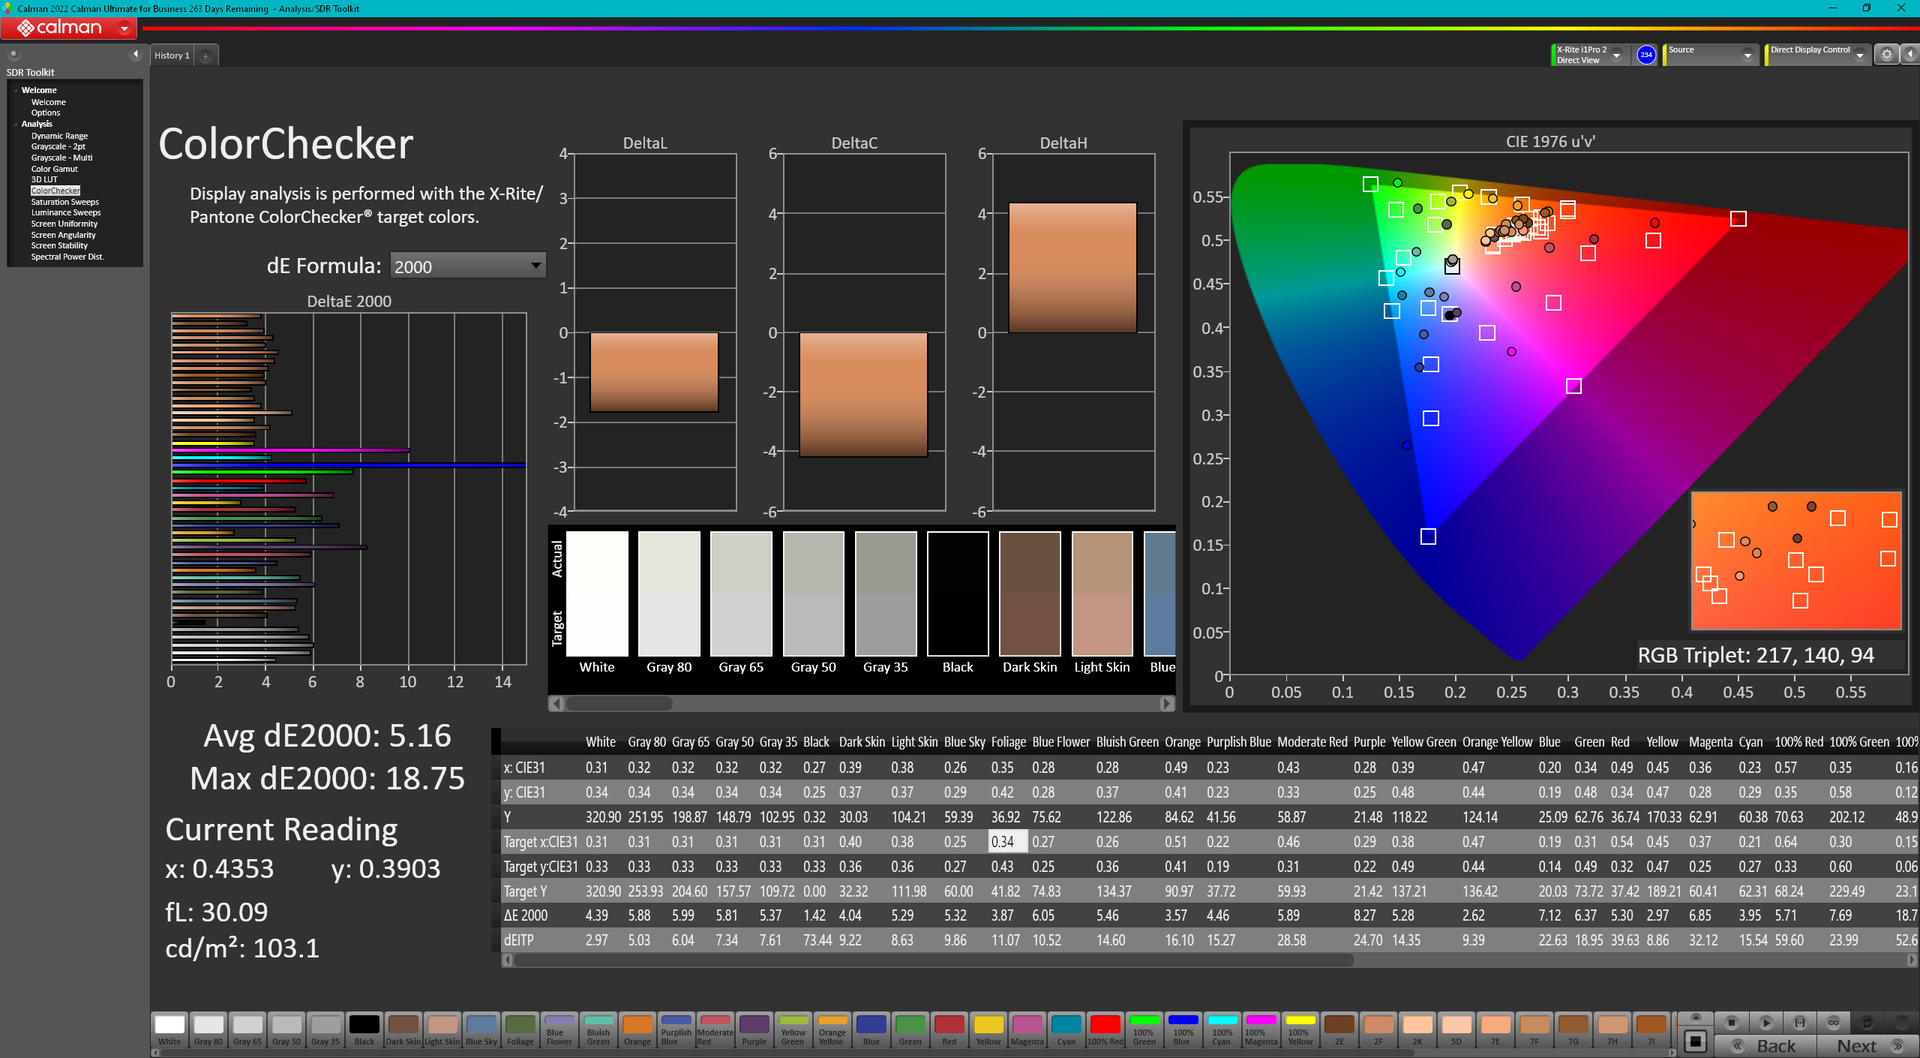
Vår konfiguration levereras med den fetmarkerade B160UAN03.2-panelen ovan som är det billigaste alternativet. Jämfört med den högre 1600p-panelen har vår 1200p-panel både sämre färger och skärpa med märkbara marginaler. Det är dock fortfarande en hyfsad skärm, särskilt jämfört med andra paneler med en liknande sRGB-omfångsbredd på 60 procent, men du kommer att vilja välja full sRGB-täckning för all slags video- eller grafikredigering.

| |||||||||||||||||||||||||
Distribution av ljusstyrkan: 82 %
Mitt på batteriet: 321.3 cd/m²
Kontrast: 1036:1 (Svärta: 0.31 cd/m²)
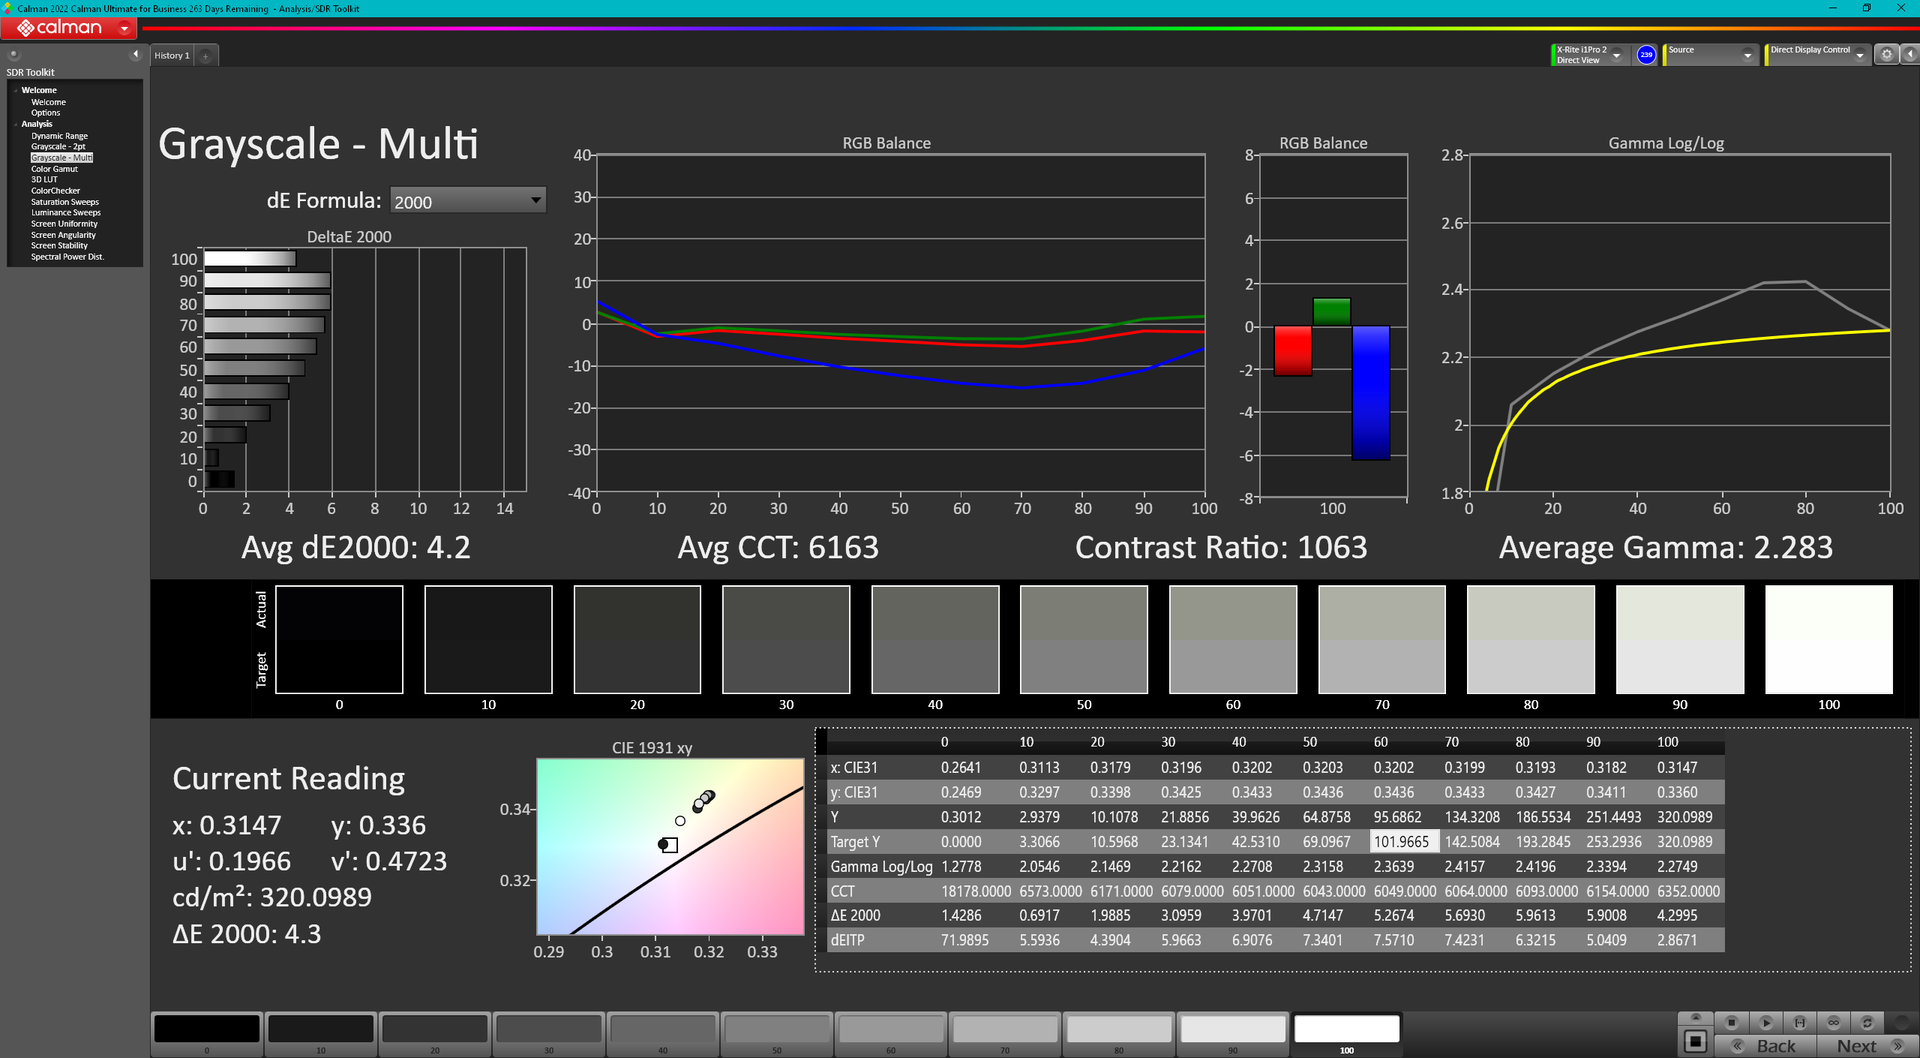
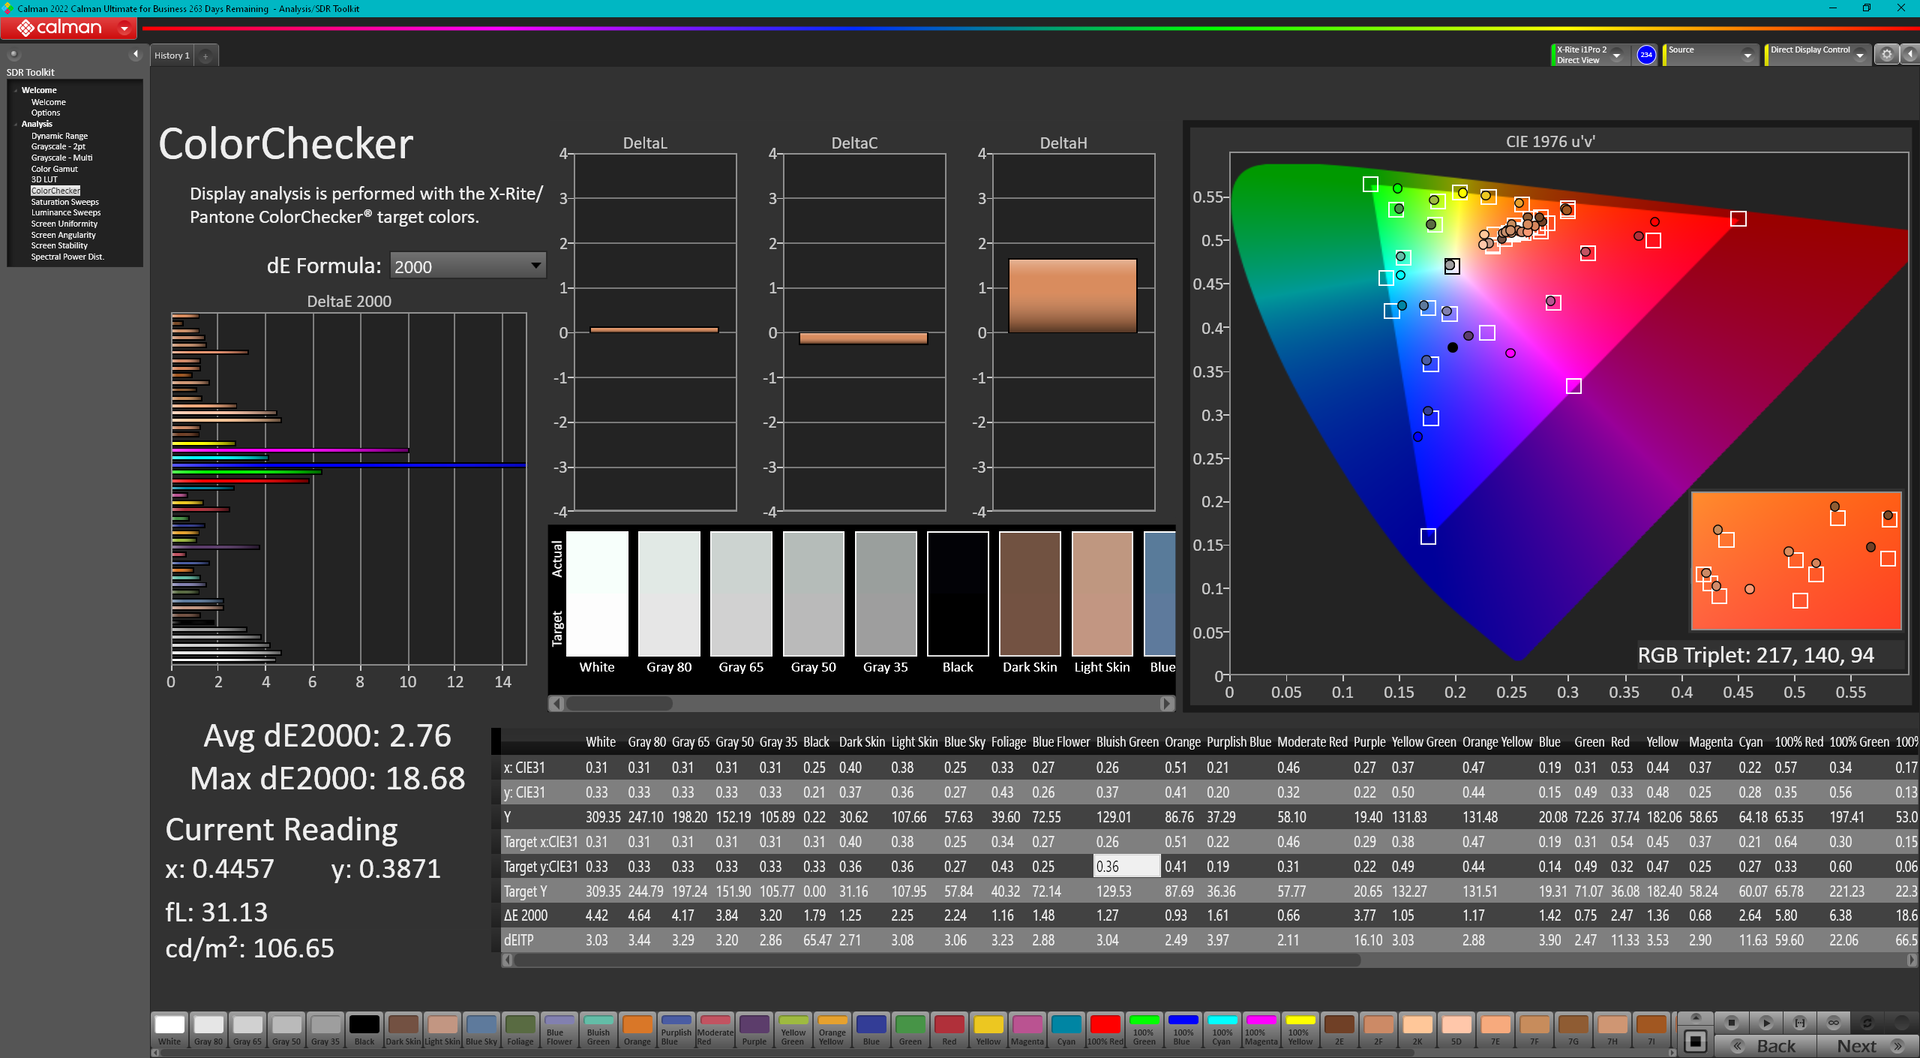
ΔE ColorChecker Calman: 5.16 | ∀{0.5-29.43 Ø4.73}
calibrated: 2.76
ΔE Greyscale Calman: 4.2 | ∀{0.09-98 Ø4.97}
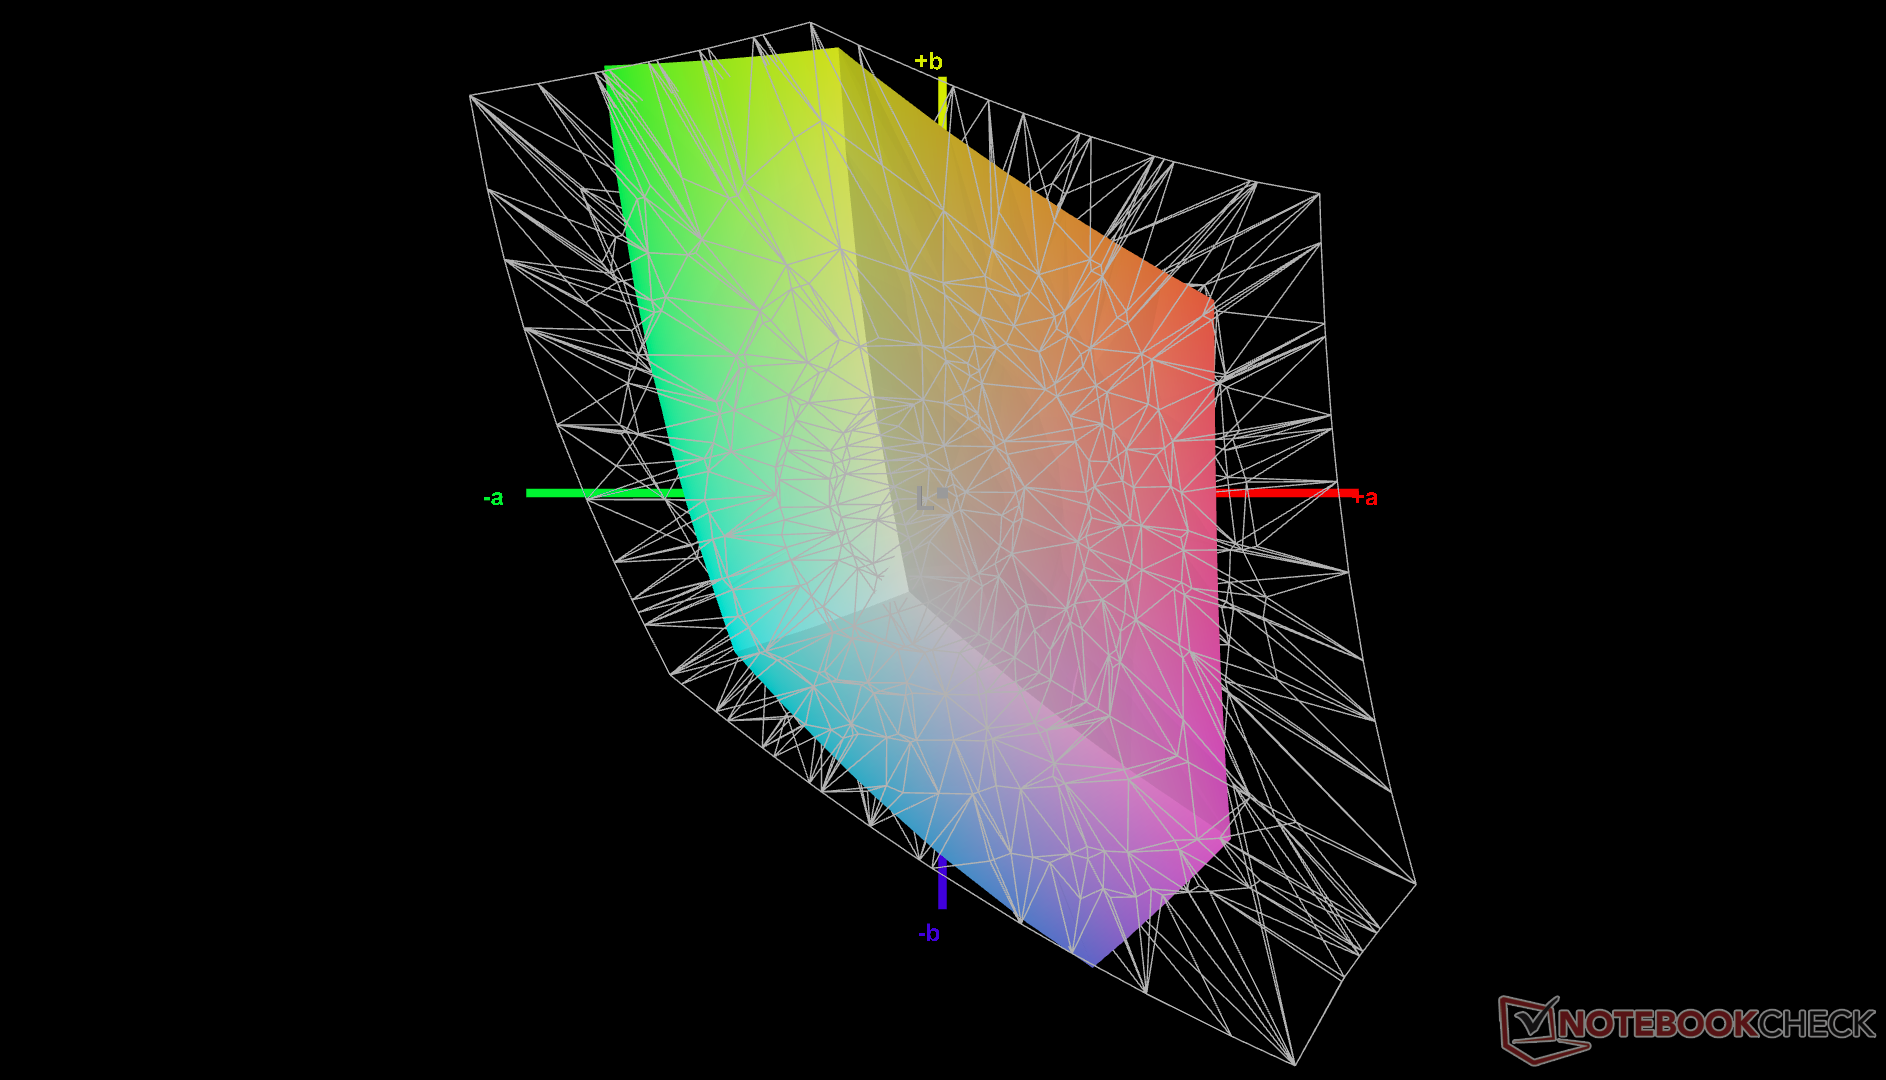
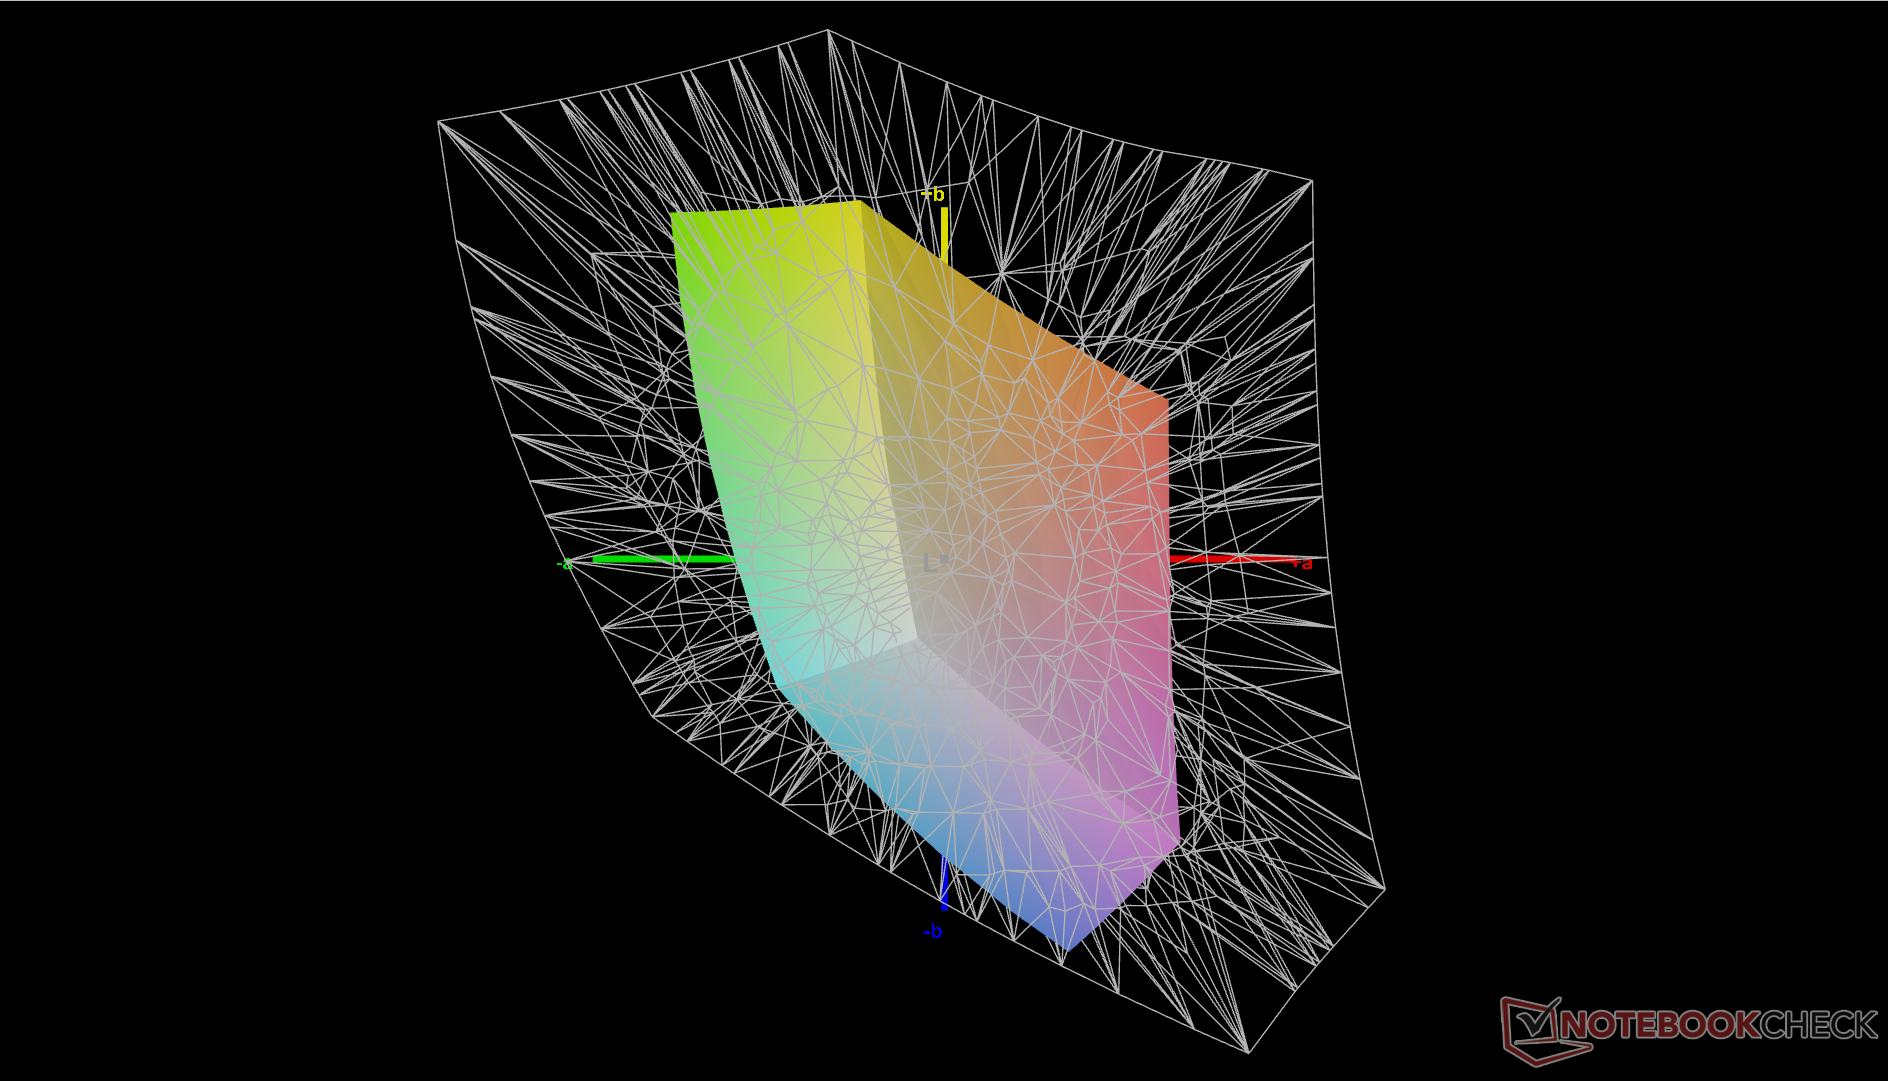
41% AdobeRGB 1998 (Argyll 3D)
59% sRGB (Argyll 3D)
39.7% Display P3 (Argyll 3D)
Gamma: 2.28
CCT: 6163 K
| Lenovo ThinkPad T16 Gen 1 Core i7-1270P B160UAN3.2, IPS, 1920x1200, 16" | Lenovo ThinkPad T16 G1 21CH004MGE MNG007DA1-C, IPS-LED, 2560x1600, 16" | LG Gram 16Z90Q LG LP160WQ1-SPB2 (LGD06EB), IPS, 2560x1600, 16" | HP EliteBook 865 G9 X160NV42, IPS, 1920x1200, 16" | Huawei MateBook 16s i7 BOE XS TV160DKT-NH0, IPS, 2520x1680, 16" | Apple MacBook Pro 16 2021 M1 Pro Liquid Retina XDR, Mini-LED, 3456x2234, 16.2" | |
|---|---|---|---|---|---|---|
| Display | 66% | 106% | 76% | 63% | 111% | |
| Display P3 Coverage (%) | 39.7 | 66.7 68% | 96.8 144% | 71.4 80% | 64.5 62% | 99.1 150% |
| sRGB Coverage (%) | 59 | 95.7 62% | 99.9 69% | 99.3 68% | 96.7 64% | 100 69% |
| AdobeRGB 1998 Coverage (%) | 41 | 69.1 69% | 84.6 106% | 73.2 79% | 66.6 62% | 88 115% |
| Response Times | 7% | -19% | -9% | -9% | -161% | |
| Response Time Grey 50% / Grey 80% * (ms) | 29.2 ? | 32.1 ? -10% | 45.7 ? -57% | 35.5 ? -22% | 35.7 ? -22% | 42.8 ? -47% |
| Response Time Black / White * (ms) | 24.4 ? | 18.9 ? 23% | 19.7 ? 19% | 23.5 ? 4% | 23.2 ? 5% | 91.6 ? -275% |
| PWM Frequency (Hz) | 56.7 | 14880 | ||||
| Screen | 43% | 23% | 73% | 49% | 352% | |
| Brightness middle (cd/m²) | 321.3 | 417 30% | 366 14% | 865 169% | 311 -3% | 514 60% |
| Brightness (cd/m²) | 315 | 388 23% | 347 10% | 771 145% | 319 1% | 497 58% |
| Brightness Distribution (%) | 82 | 81 -1% | 89 9% | 72 -12% | 91 11% | 95 16% |
| Black Level * (cd/m²) | 0.31 | 0.24 23% | 0.32 -3% | 0.3 3% | 0.17 45% | 0.02 94% |
| Contrast (:1) | 1036 | 1738 68% | 1144 10% | 2883 178% | 1829 77% | 25700 2381% |
| Colorchecker dE 2000 * | 5.16 | 1.7 67% | 2.82 45% | 2.4 53% | 1 81% | 1.4 73% |
| Colorchecker dE 2000 max. * | 18.75 | 3.5 81% | 4.65 75% | 5.8 69% | 1.7 91% | 2.8 85% |
| Colorchecker dE 2000 calibrated * | 2.76 | 1.4 49% | 2.69 3% | 1.5 46% | 0.8 71% | |
| Greyscale dE 2000 * | 4.2 | 2.4 43% | 2.3 45% | 3.8 10% | 1.5 64% | 2.3 45% |
| Gamma | 2.28 96% | 2.16 102% | 1.971 112% | 2.36 93% | 2.15 102% | 2.27 97% |
| CCT | 6163 105% | 6924 94% | 6796 96% | 6922 94% | 6432 101% | 6792 96% |
| Totalt genomsnitt (program/inställningar) | 39% /
43% | 37% /
35% | 47% /
62% | 34% /
44% | 101% /
217% |
* ... mindre är bättre
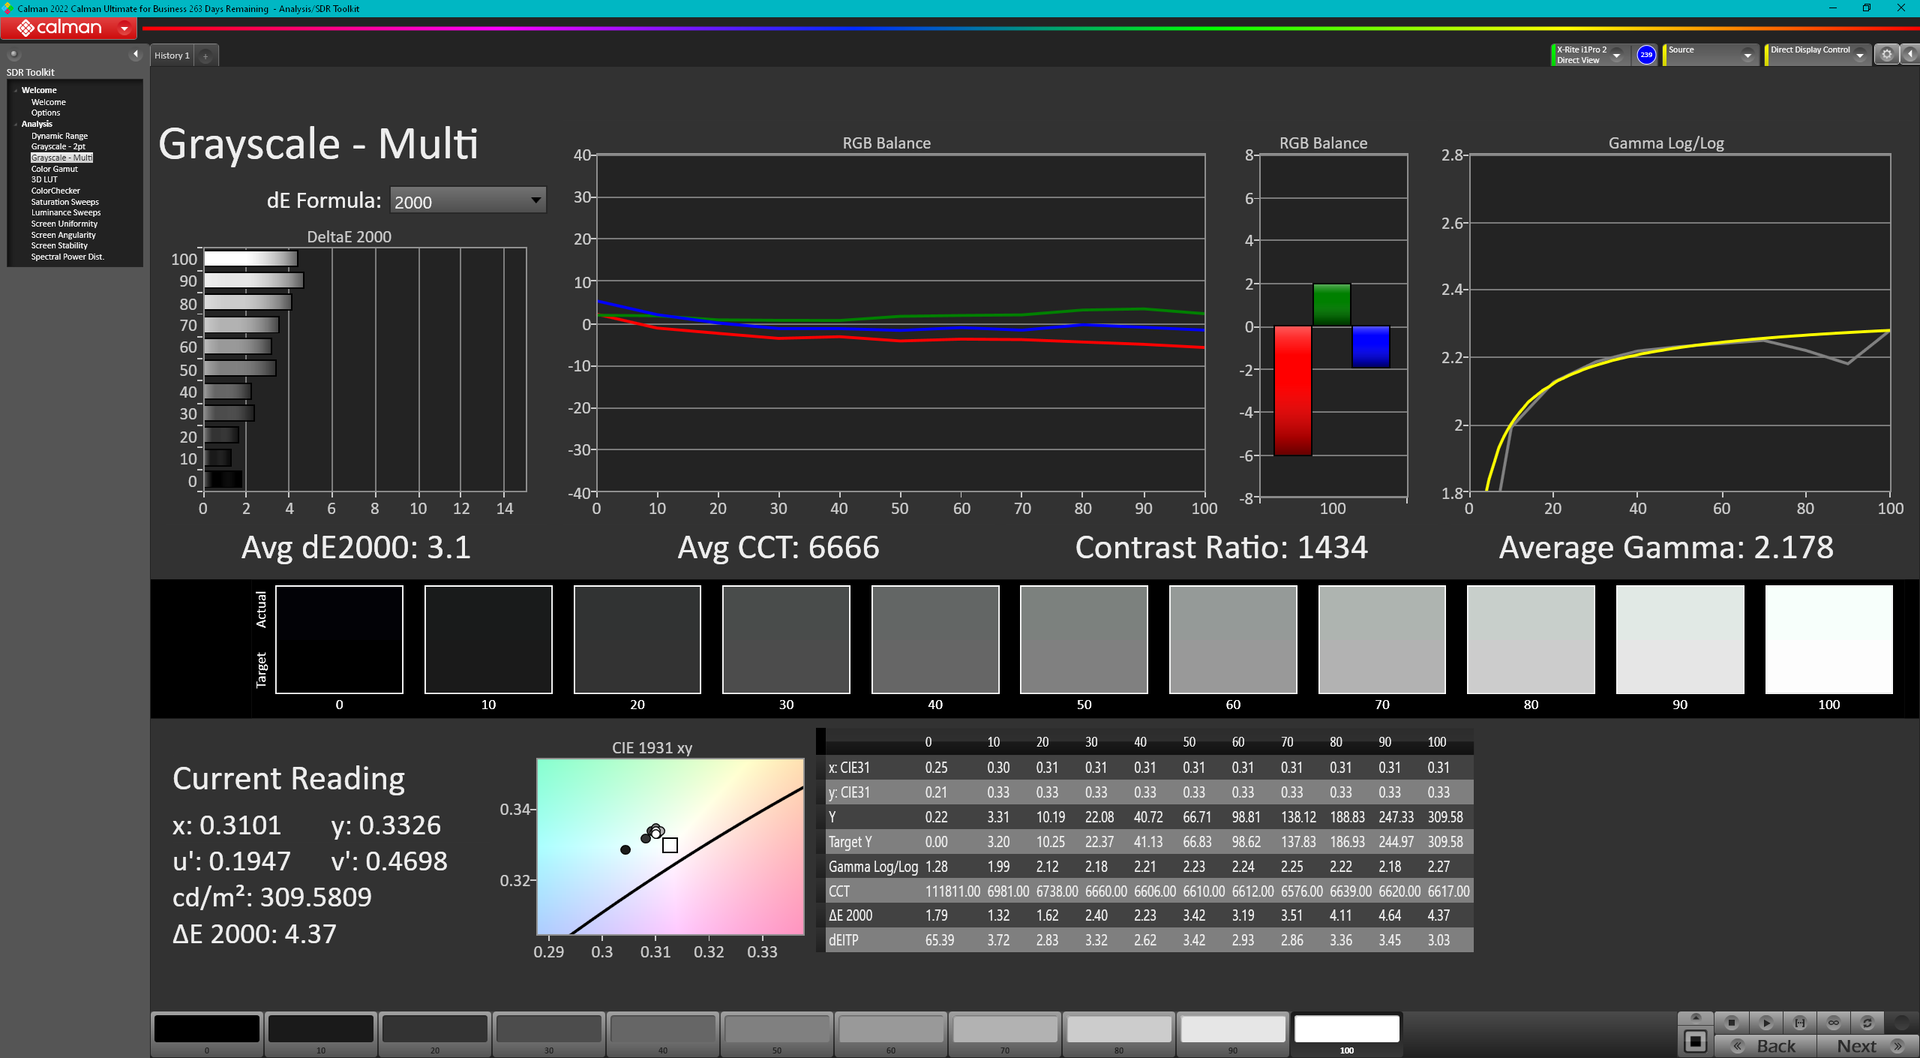
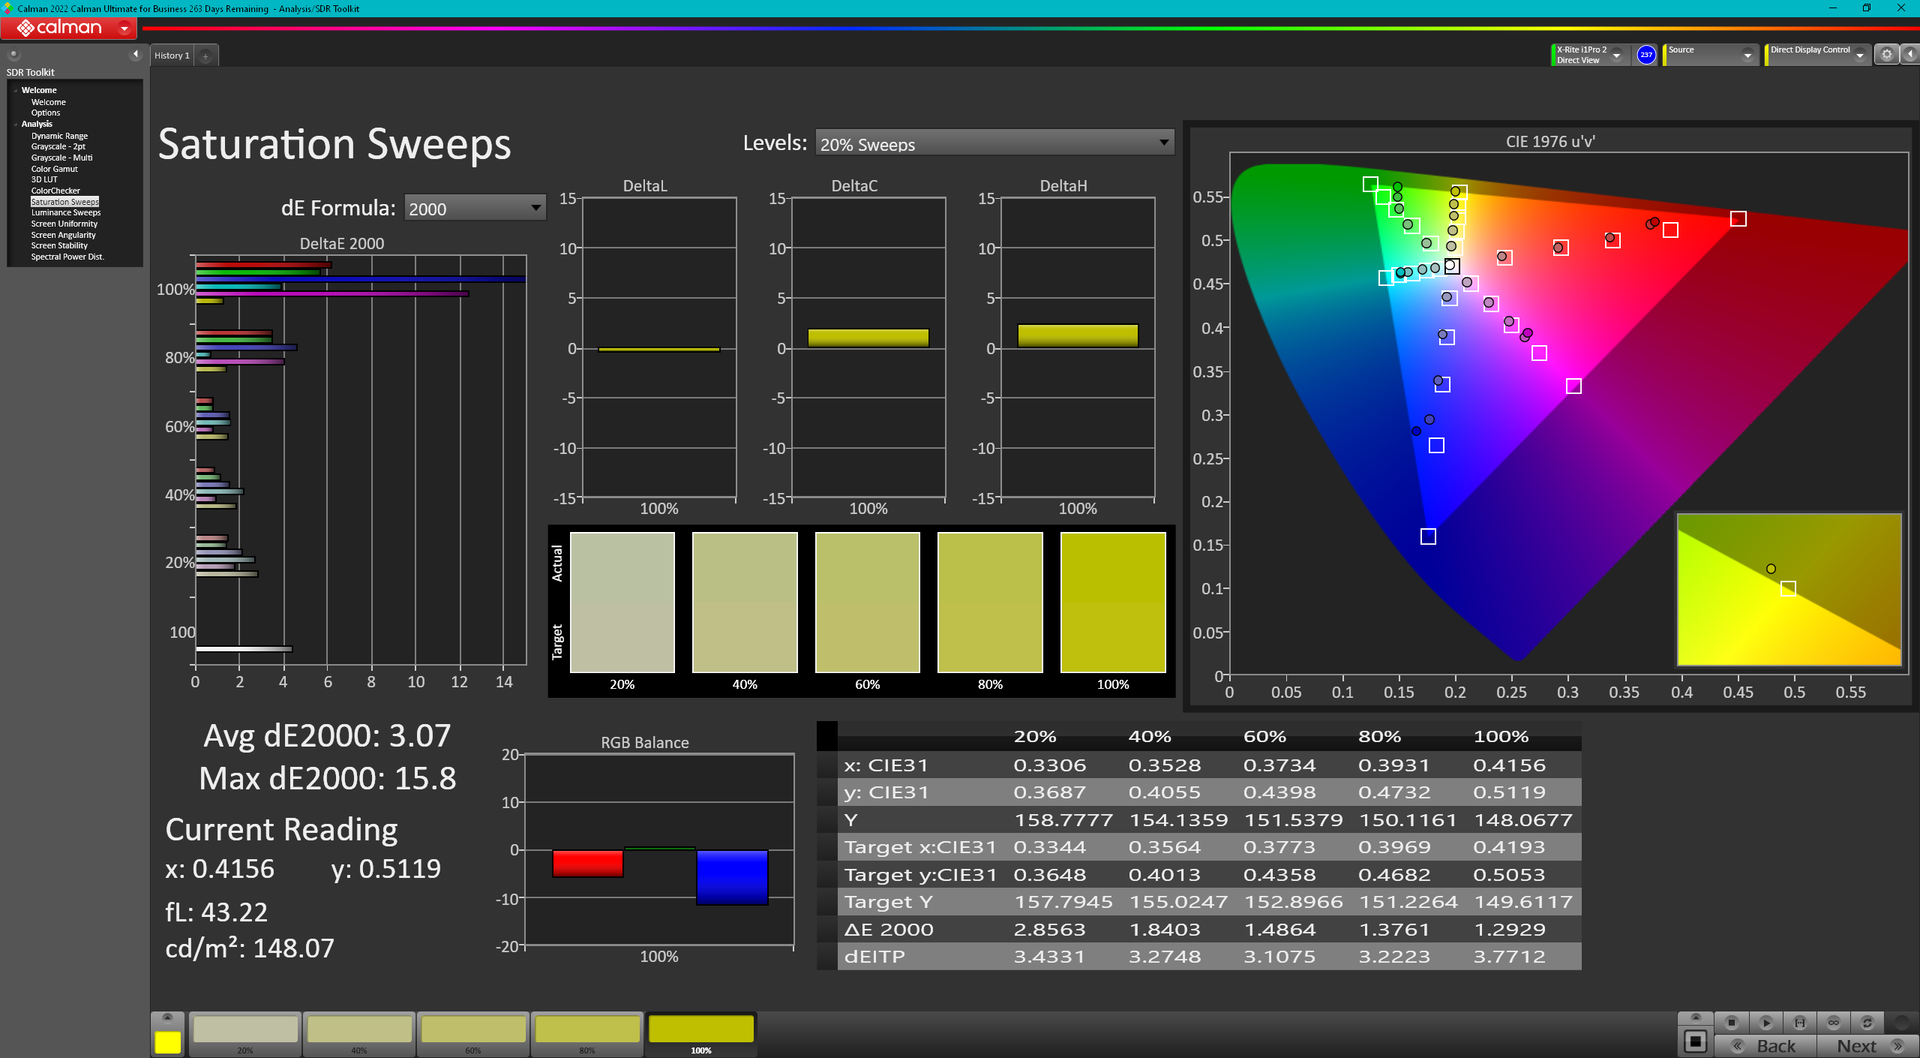
Färgtemperaturen är för varm i utgångsläget, vilket lyckligtvis kan åtgärdas med en korrekt kalibrering. Genomsnittlig färg DeltaE skulle förbättras från 5,05 till 2,23, men färgerna är fortfarande felaktiga vid höga mättnadsnivåer på grund av panelens begränsade färgtäckning. Vi rekommenderar att du tillämpar vår kalibrerade ICM-profil ovan eftersom skärmen inte är kalibrerad på fabriken.
Visa svarstider
| ↔ Svarstid svart till vitt | ||
|---|---|---|
| 24.4 ms ... stiga ↗ och falla ↘ kombinerat | ↗ 14 ms stiga | 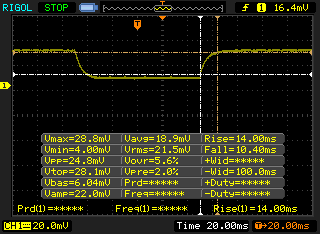 |
| ↘ 10.4 ms hösten | ||
| Skärmen visar bra svarsfrekvens i våra tester, men kan vara för långsam för konkurrenskraftiga spelare. I jämförelse sträcker sig alla testade enheter från 0.1 (minst) till 240 (maximalt) ms. » 57 % av alla enheter är bättre. Detta innebär att den uppmätta svarstiden är sämre än genomsnittet av alla testade enheter (19.9 ms). | ||
| ↔ Svarstid 50 % grått till 80 % grått | ||
| 29.2 ms ... stiga ↗ och falla ↘ kombinerat | ↗ 15.6 ms stiga | 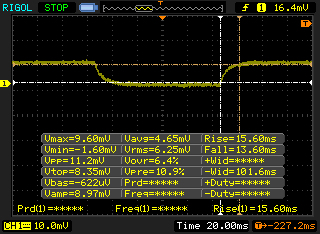 |
| ↘ 13.6 ms hösten | ||
| Skärmen visar relativt långsamma svarsfrekvenser i våra tester och kan vara för långsam för spelare. I jämförelse sträcker sig alla testade enheter från 0.165 (minst) till 636 (maximalt) ms. » 39 % av alla enheter är bättre. Det betyder att den uppmätta svarstiden liknar genomsnittet av alla testade enheter (31.1 ms). | ||
Skärmflimmer / PWM (Puls-Width Modulation)
| Skärmflimmer / PWM upptäcktes inte | 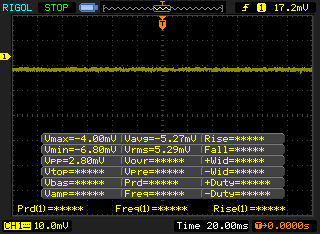 | ||
Som jämförelse: 52 % av alla testade enheter använder inte PWM för att dämpa skärmen. Om PWM upptäcktes mättes ett medelvärde av 7798 (minst: 5 - maximum: 343500) Hz. | |||
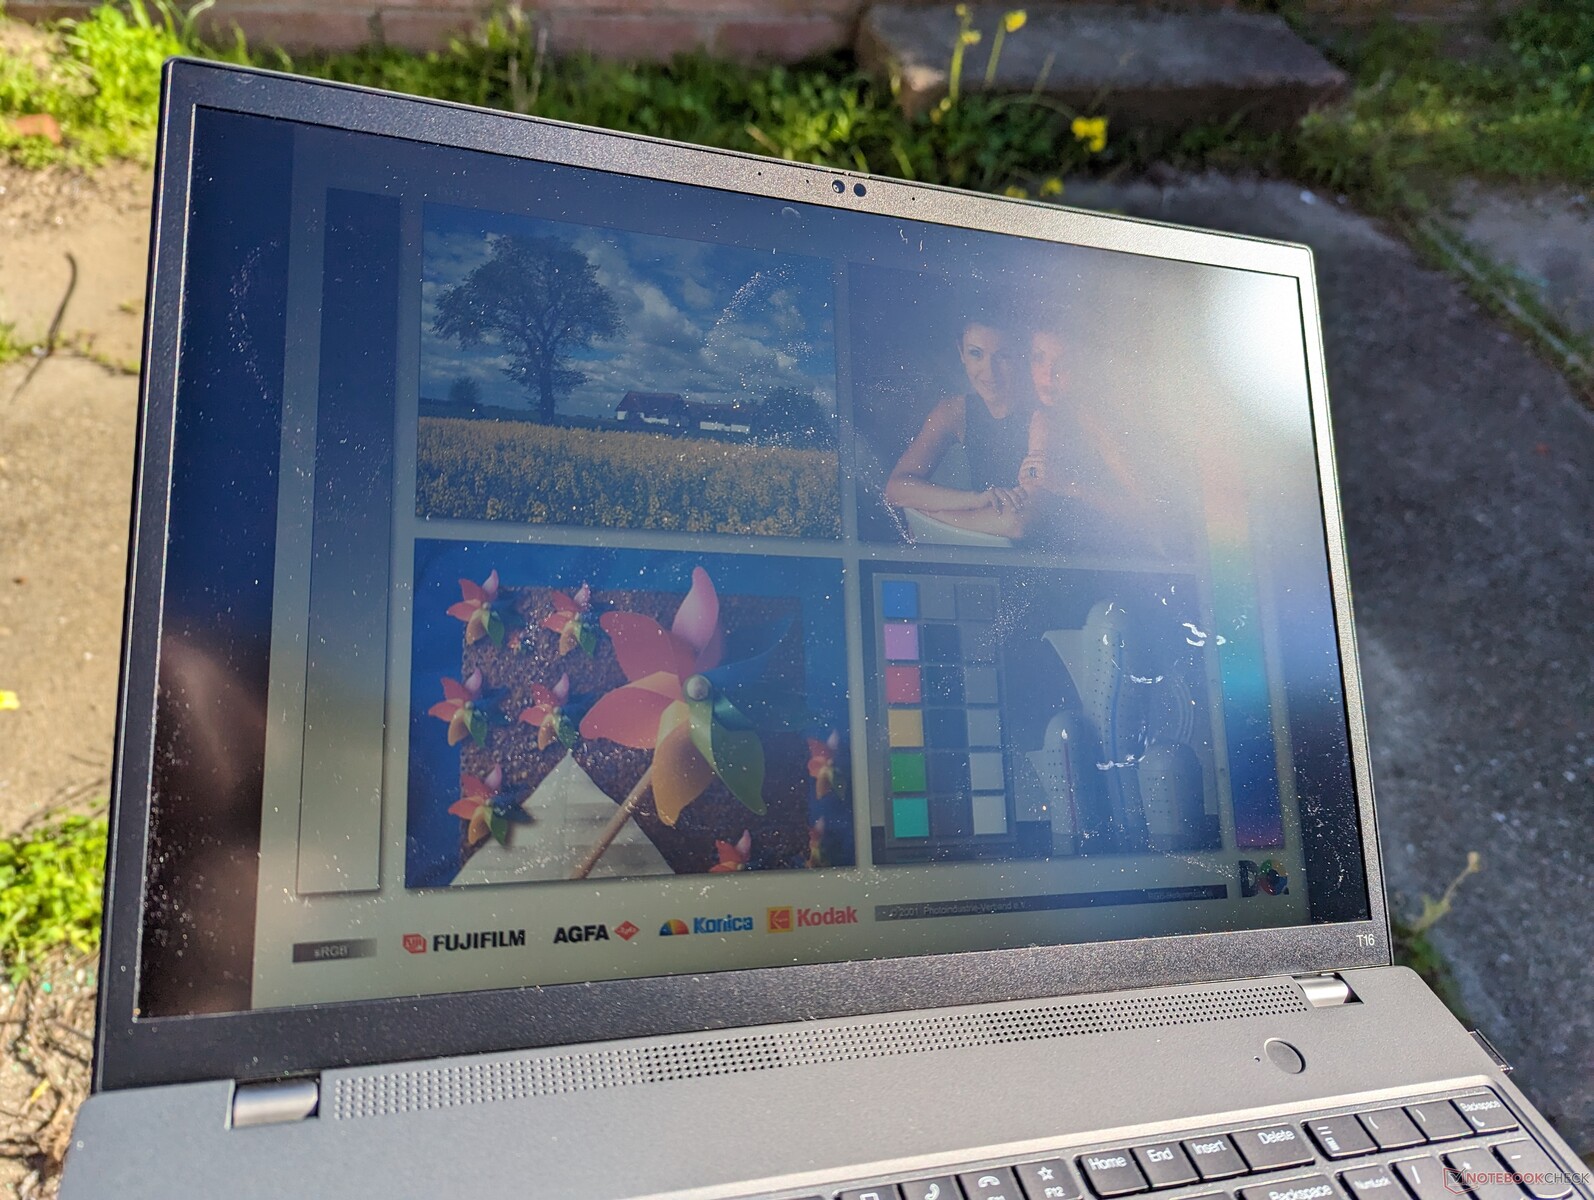
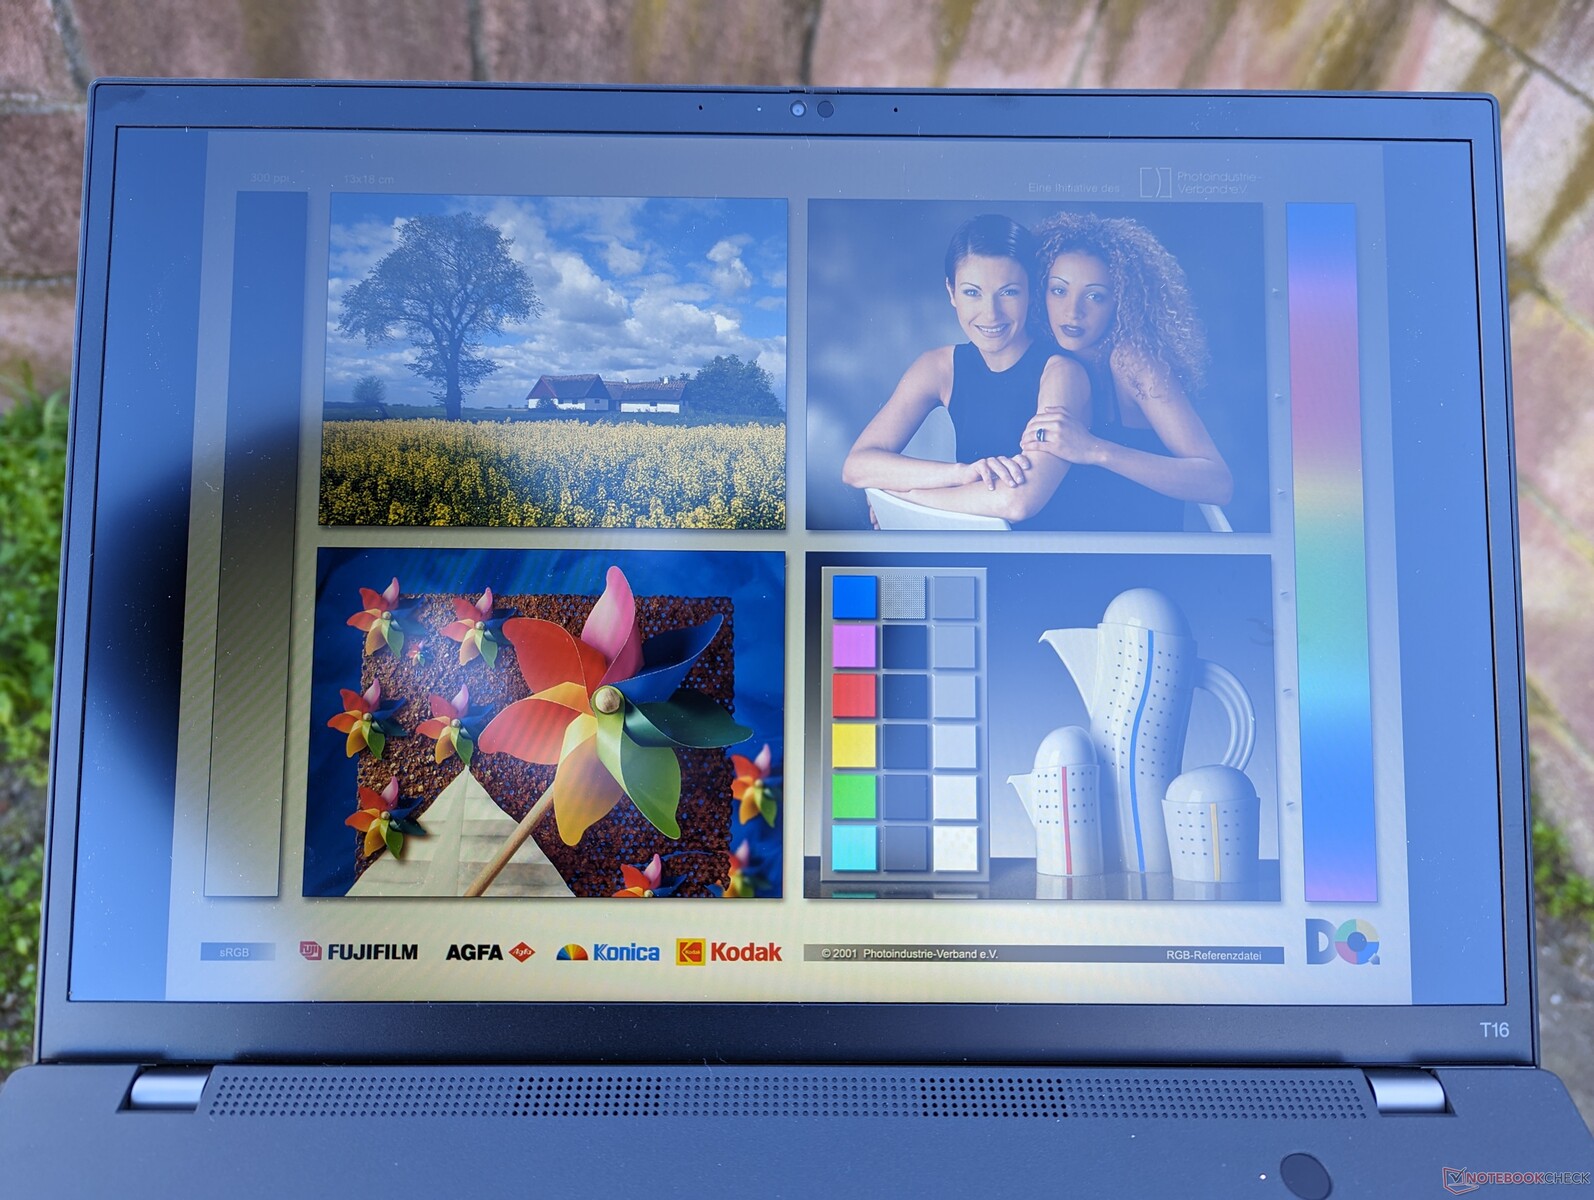
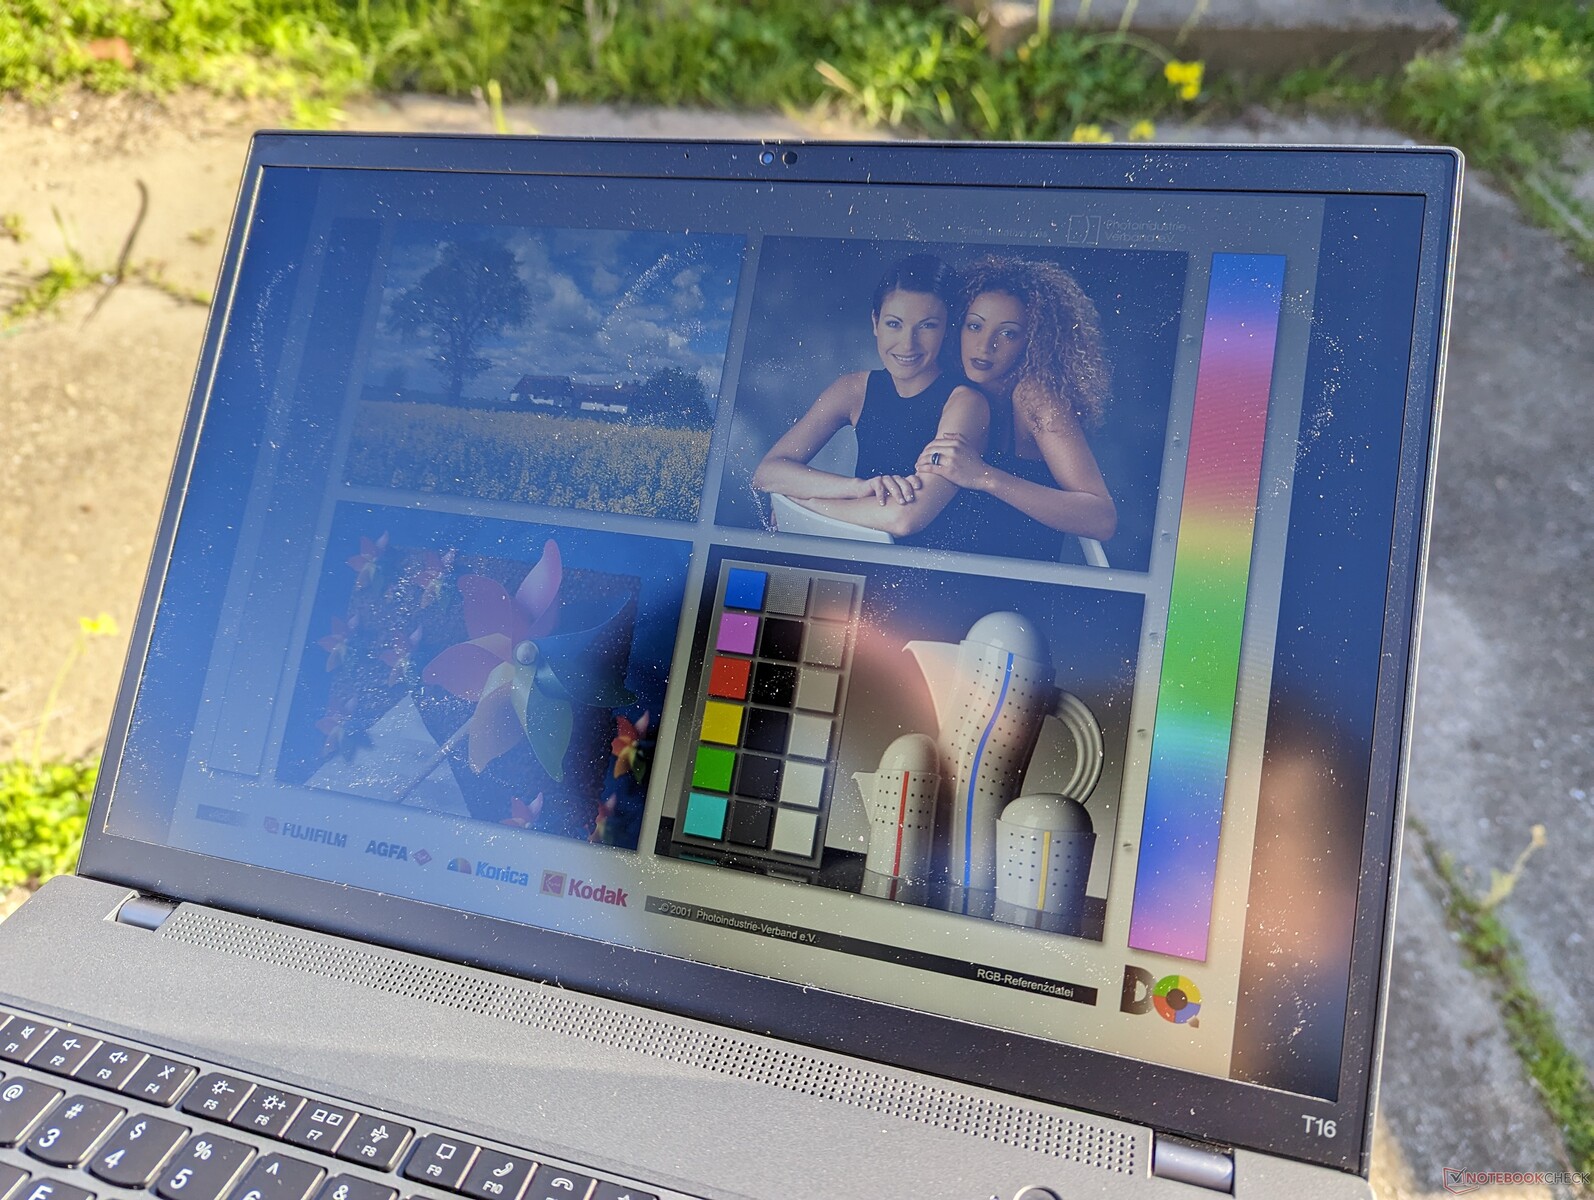
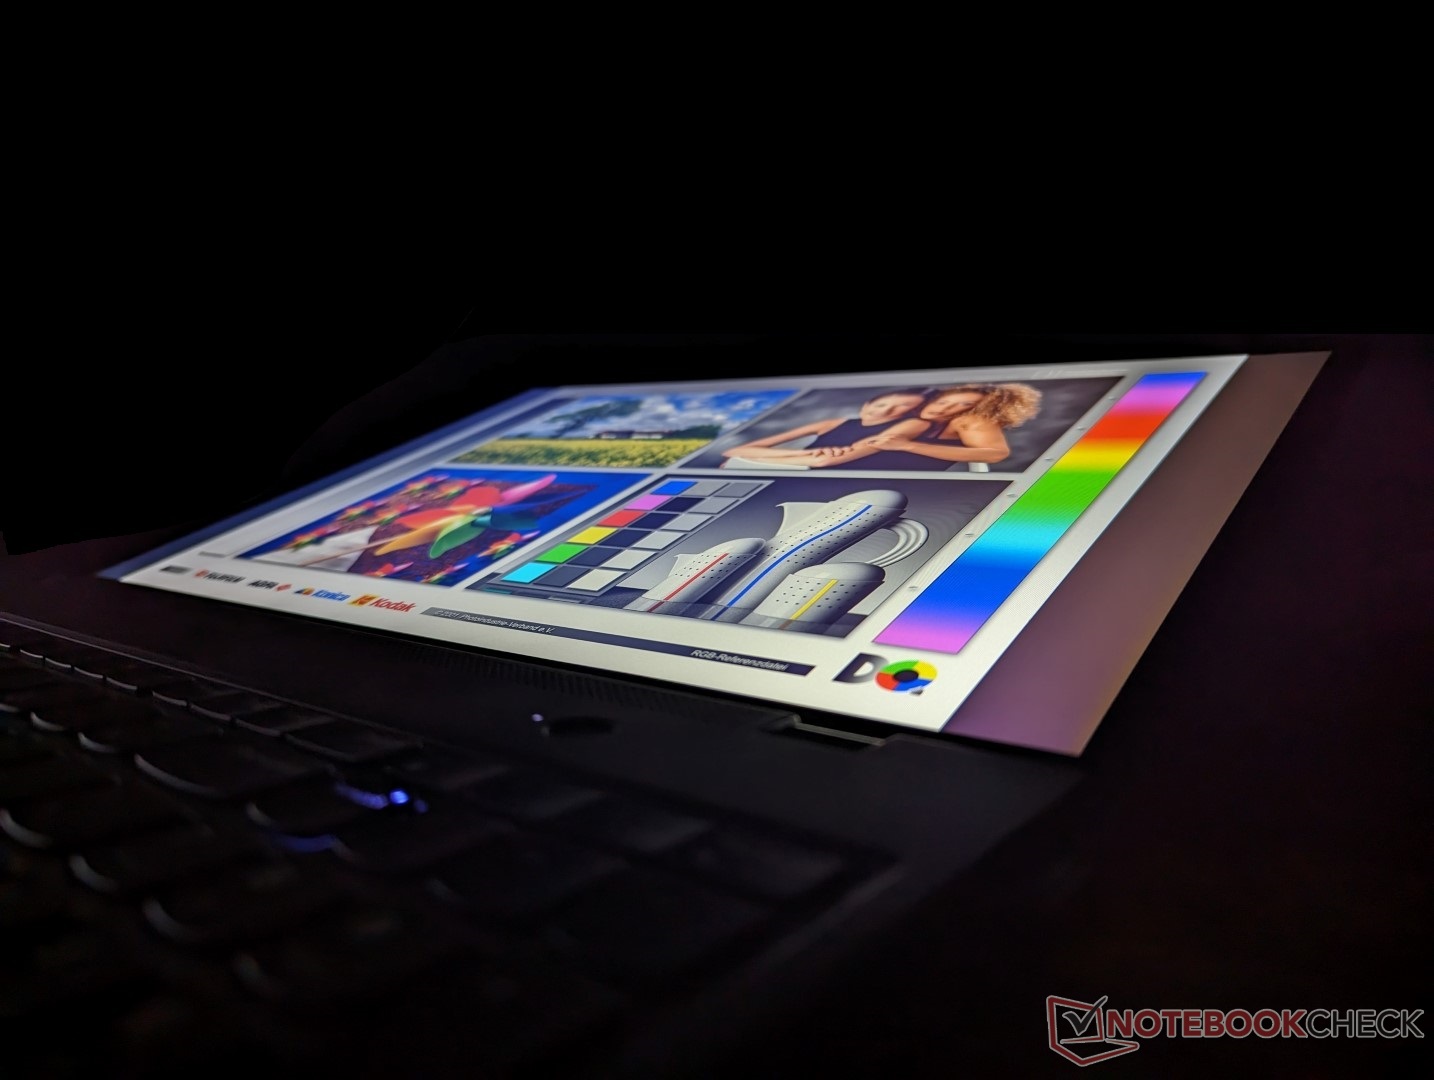
Synligheten utomhus är i bästa fall medelmåttig på vår 300-nit-panel. Användare kanske vill överväga alternativen med 500 nit för att minska effekterna av bländning. Om synligheten är ett problem rekommenderar vi att du tar en titt på HP EliteBook 860/865 G9 och dess mycket ljusare 1000-nit-panelalternativ.
Prestanda - 12:e generationens Intel-alternativ
Provningsförhållanden
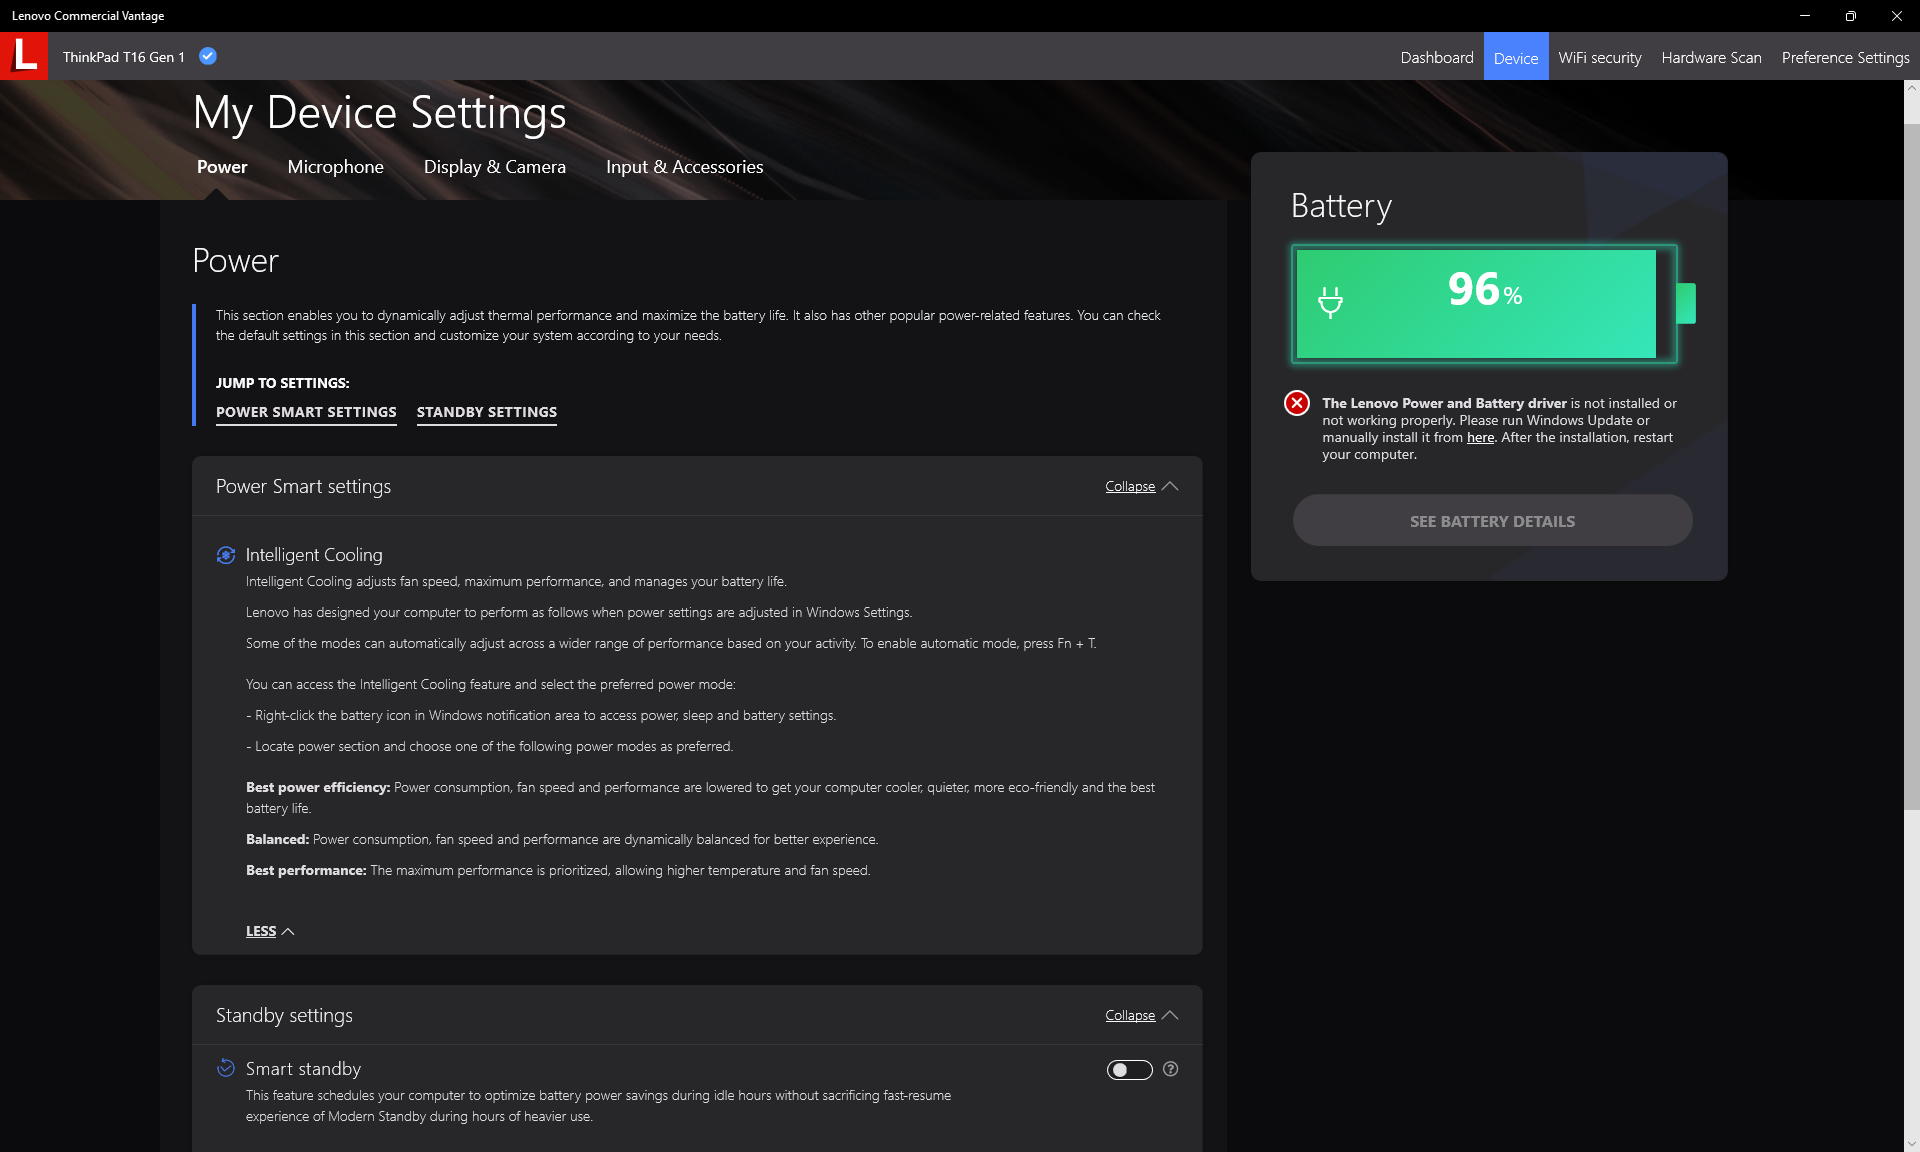
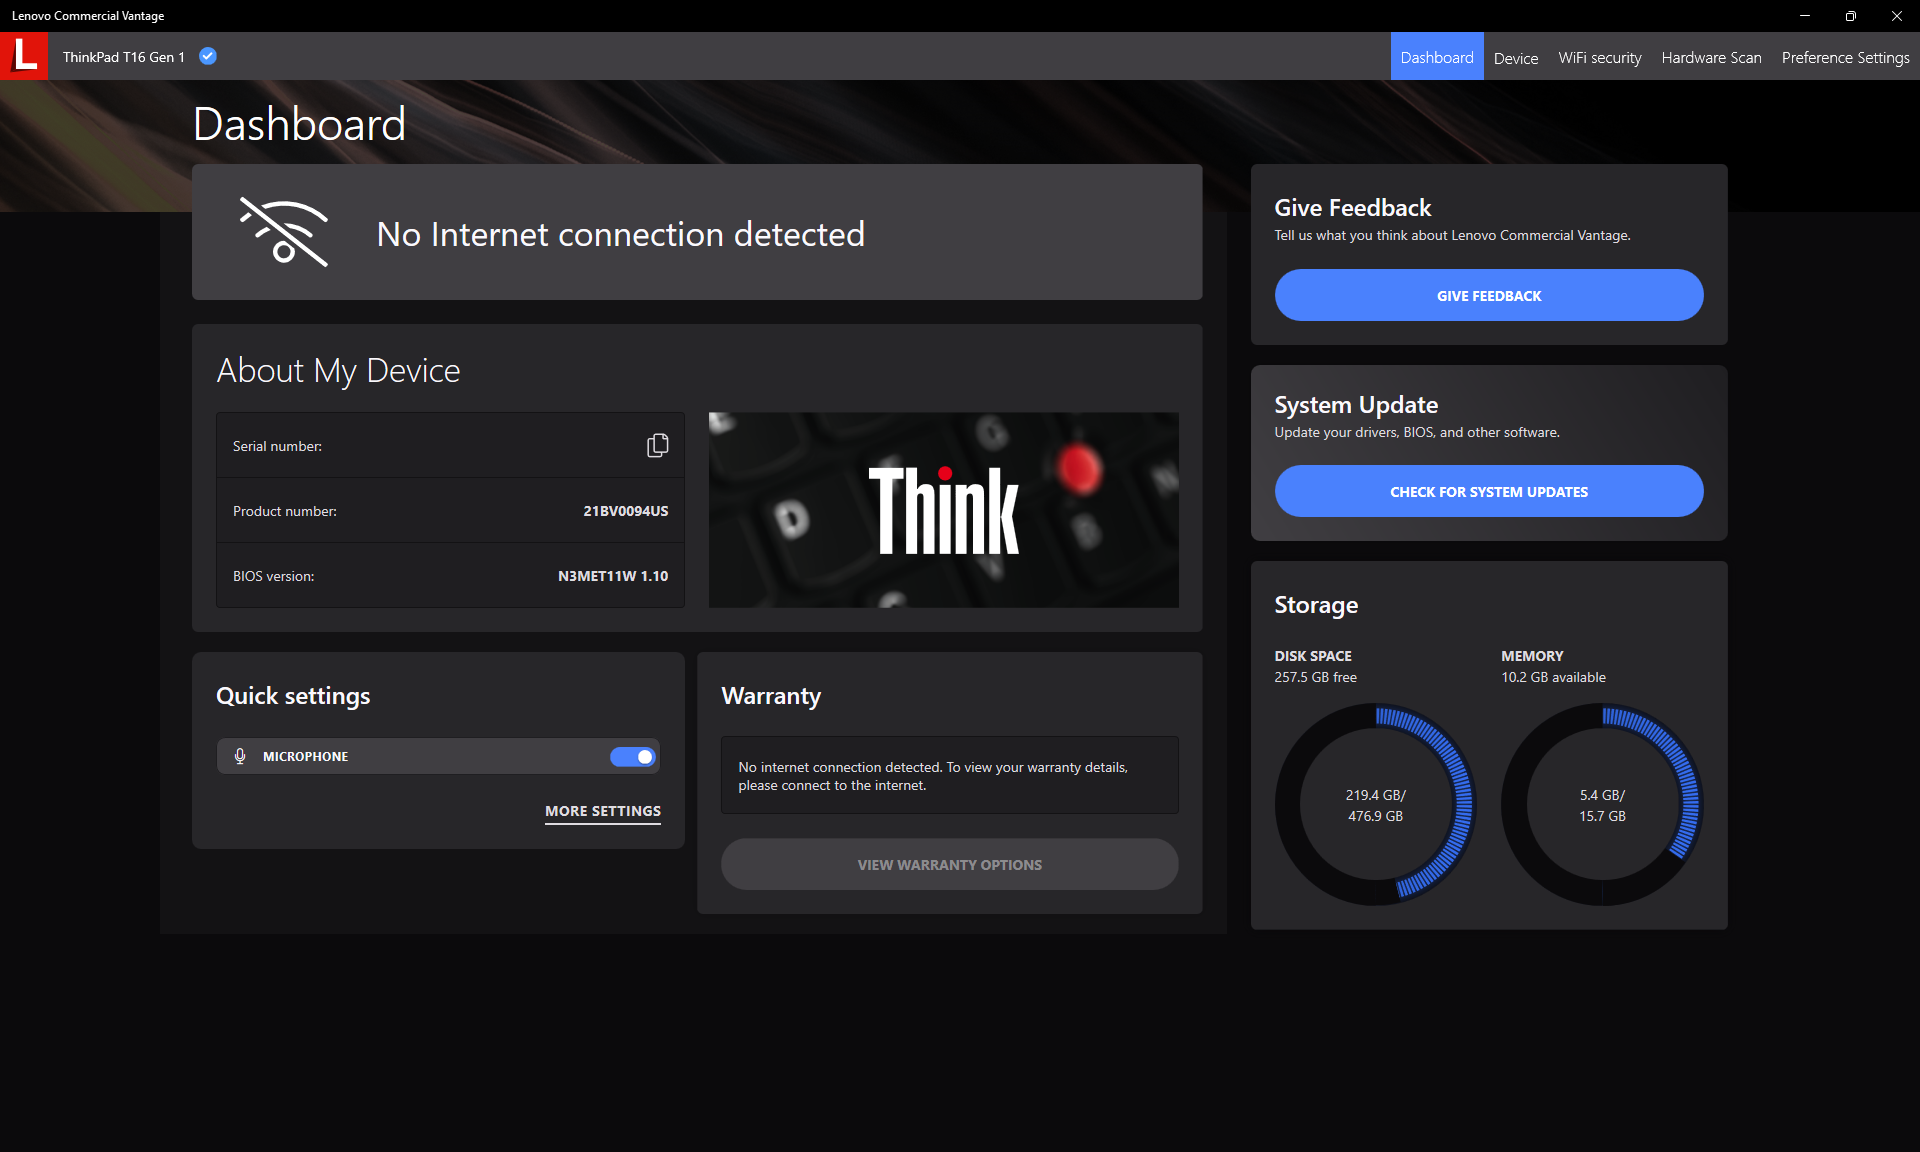
Vi ställde in vår enhet i prestandaläget via Windows innan vi körde alla benchmarks nedan. Användarna bör bekanta sig med programvaran Lenovo Commercial Vantage eftersom den är navet för ytterligare inställningar som rör uppdateringar, garanti, säkerhet med mera. Skärmbilderna nedan visar några av alternativen.
Processor - Turbo Boost kunde vara bättre
Vår Core i7-1270P enhet skulle uppvisa ett liknande strypningsbeteende som det vi observerade på Core i5-1240P SKU. När vi körde CineBench R15 xT i en slinga, till exempel, sjönk den ursprungliga poängen på 1782 poäng med så mycket som 44 procent med tiden, vilket är betydligt mer än på de flesta andra bärbara datorer. I motsats till detta kanRyzen 5 PRO 6650U SKU skulle vara långsammare under de få minuterna av slingtestet, men den kan upprätthålla högre klockfrekvenser och prestanda under längre perioder, vilket visas i vår graf nedan. Turbo Boost-fördelarna med Core i7-1270P är därför mycket kortvariga på ThinkPad T16 G1.
Användare kan installera ThrottleStop för att minimera prestandadämpningen med cirka 20 procent om de så önskar. Trots detta är det en besvikelse att Lenovo inte erbjuder ett sådant prestandamöjlighet utan att behöva ta till tredjepartsprogramvara.
Cinebench R15 Multi Loop
Cinebench R20: CPU (Multi Core) | CPU (Single Core)
Cinebench R23: Multi Core | Single Core
Cinebench R15: CPU Multi 64Bit | CPU Single 64Bit
Blender: v2.79 BMW27 CPU
7-Zip 18.03: 7z b 4 | 7z b 4 -mmt1
Geekbench 5.5: Multi-Core | Single-Core
HWBOT x265 Benchmark v2.2: 4k Preset
LibreOffice : 20 Documents To PDF
R Benchmark 2.5: Overall mean
* ... mindre är bättre
* ... mindre är bättre
AIDA64: FP32 Ray-Trace | FPU Julia | CPU SHA3 | CPU Queen | FPU SinJulia | FPU Mandel | CPU AES | CPU ZLib | FP64 Ray-Trace | CPU PhotoWorxx
| Performance rating | |
| HP EliteBook 865 G9 | |
| Lenovo ThinkPad T16 G1 21CH004MGE | |
| Huawei MateBook 16s i7 | |
| Lenovo ThinkPad T16 Gen 1 Core i7-1270P | |
| LG Gram 16Z90Q | |
| Genomsnitt Intel Core i7-1270P | |
| AIDA64 / FP32 Ray-Trace | |
| HP EliteBook 865 G9 | |
| Lenovo ThinkPad T16 G1 21CH004MGE | |
| Lenovo ThinkPad T16 Gen 1 Core i7-1270P | |
| LG Gram 16Z90Q | |
| Huawei MateBook 16s i7 | |
| Genomsnitt Intel Core i7-1270P (4789 - 6722, n=2) | |
| AIDA64 / FPU Julia | |
| HP EliteBook 865 G9 | |
| Lenovo ThinkPad T16 G1 21CH004MGE | |
| Lenovo ThinkPad T16 Gen 1 Core i7-1270P | |
| Genomsnitt Intel Core i7-1270P (22017 - 37567, n=2) | |
| Huawei MateBook 16s i7 | |
| LG Gram 16Z90Q | |
| AIDA64 / CPU SHA3 | |
| HP EliteBook 865 G9 | |
| Lenovo ThinkPad T16 G1 21CH004MGE | |
| Huawei MateBook 16s i7 | |
| Lenovo ThinkPad T16 Gen 1 Core i7-1270P | |
| Genomsnitt Intel Core i7-1270P (1543 - 1853, n=2) | |
| LG Gram 16Z90Q | |
| AIDA64 / CPU Queen | |
| Huawei MateBook 16s i7 | |
| HP EliteBook 865 G9 | |
| Lenovo ThinkPad T16 G1 21CH004MGE | |
| Lenovo ThinkPad T16 Gen 1 Core i7-1270P | |
| LG Gram 16Z90Q | |
| Genomsnitt Intel Core i7-1270P (61703 - 76671, n=2) | |
| AIDA64 / FPU SinJulia | |
| HP EliteBook 865 G9 | |
| Lenovo ThinkPad T16 G1 21CH004MGE | |
| Huawei MateBook 16s i7 | |
| Genomsnitt Intel Core i7-1270P (5059 - 5210, n=2) | |
| Lenovo ThinkPad T16 Gen 1 Core i7-1270P | |
| LG Gram 16Z90Q | |
| AIDA64 / FPU Mandel | |
| HP EliteBook 865 G9 | |
| Lenovo ThinkPad T16 G1 21CH004MGE | |
| Lenovo ThinkPad T16 Gen 1 Core i7-1270P | |
| Huawei MateBook 16s i7 | |
| Genomsnitt Intel Core i7-1270P (12876 - 17891, n=2) | |
| LG Gram 16Z90Q | |
| AIDA64 / CPU AES | |
| Lenovo ThinkPad T16 G1 21CH004MGE | |
| Huawei MateBook 16s i7 | |
| HP EliteBook 865 G9 | |
| Lenovo ThinkPad T16 Gen 1 Core i7-1270P | |
| Genomsnitt Intel Core i7-1270P (33137 - 39956, n=2) | |
| LG Gram 16Z90Q | |
| AIDA64 / CPU ZLib | |
| Huawei MateBook 16s i7 | |
| HP EliteBook 865 G9 | |
| Lenovo ThinkPad T16 G1 21CH004MGE | |
| Lenovo ThinkPad T16 Gen 1 Core i7-1270P | |
| Genomsnitt Intel Core i7-1270P (553 - 579, n=2) | |
| LG Gram 16Z90Q | |
| AIDA64 / FP64 Ray-Trace | |
| HP EliteBook 865 G9 | |
| Lenovo ThinkPad T16 G1 21CH004MGE | |
| LG Gram 16Z90Q | |
| Lenovo ThinkPad T16 Gen 1 Core i7-1270P | |
| Huawei MateBook 16s i7 | |
| Genomsnitt Intel Core i7-1270P (2603 - 3521, n=2) | |
| AIDA64 / CPU PhotoWorxx | |
| Huawei MateBook 16s i7 | |
| LG Gram 16Z90Q | |
| Genomsnitt Intel Core i7-1270P (21056 - 34745, n=2) | |
| Lenovo ThinkPad T16 G1 21CH004MGE | |
| Lenovo ThinkPad T16 Gen 1 Core i7-1270P | |
| HP EliteBook 865 G9 | |
Systemets prestanda
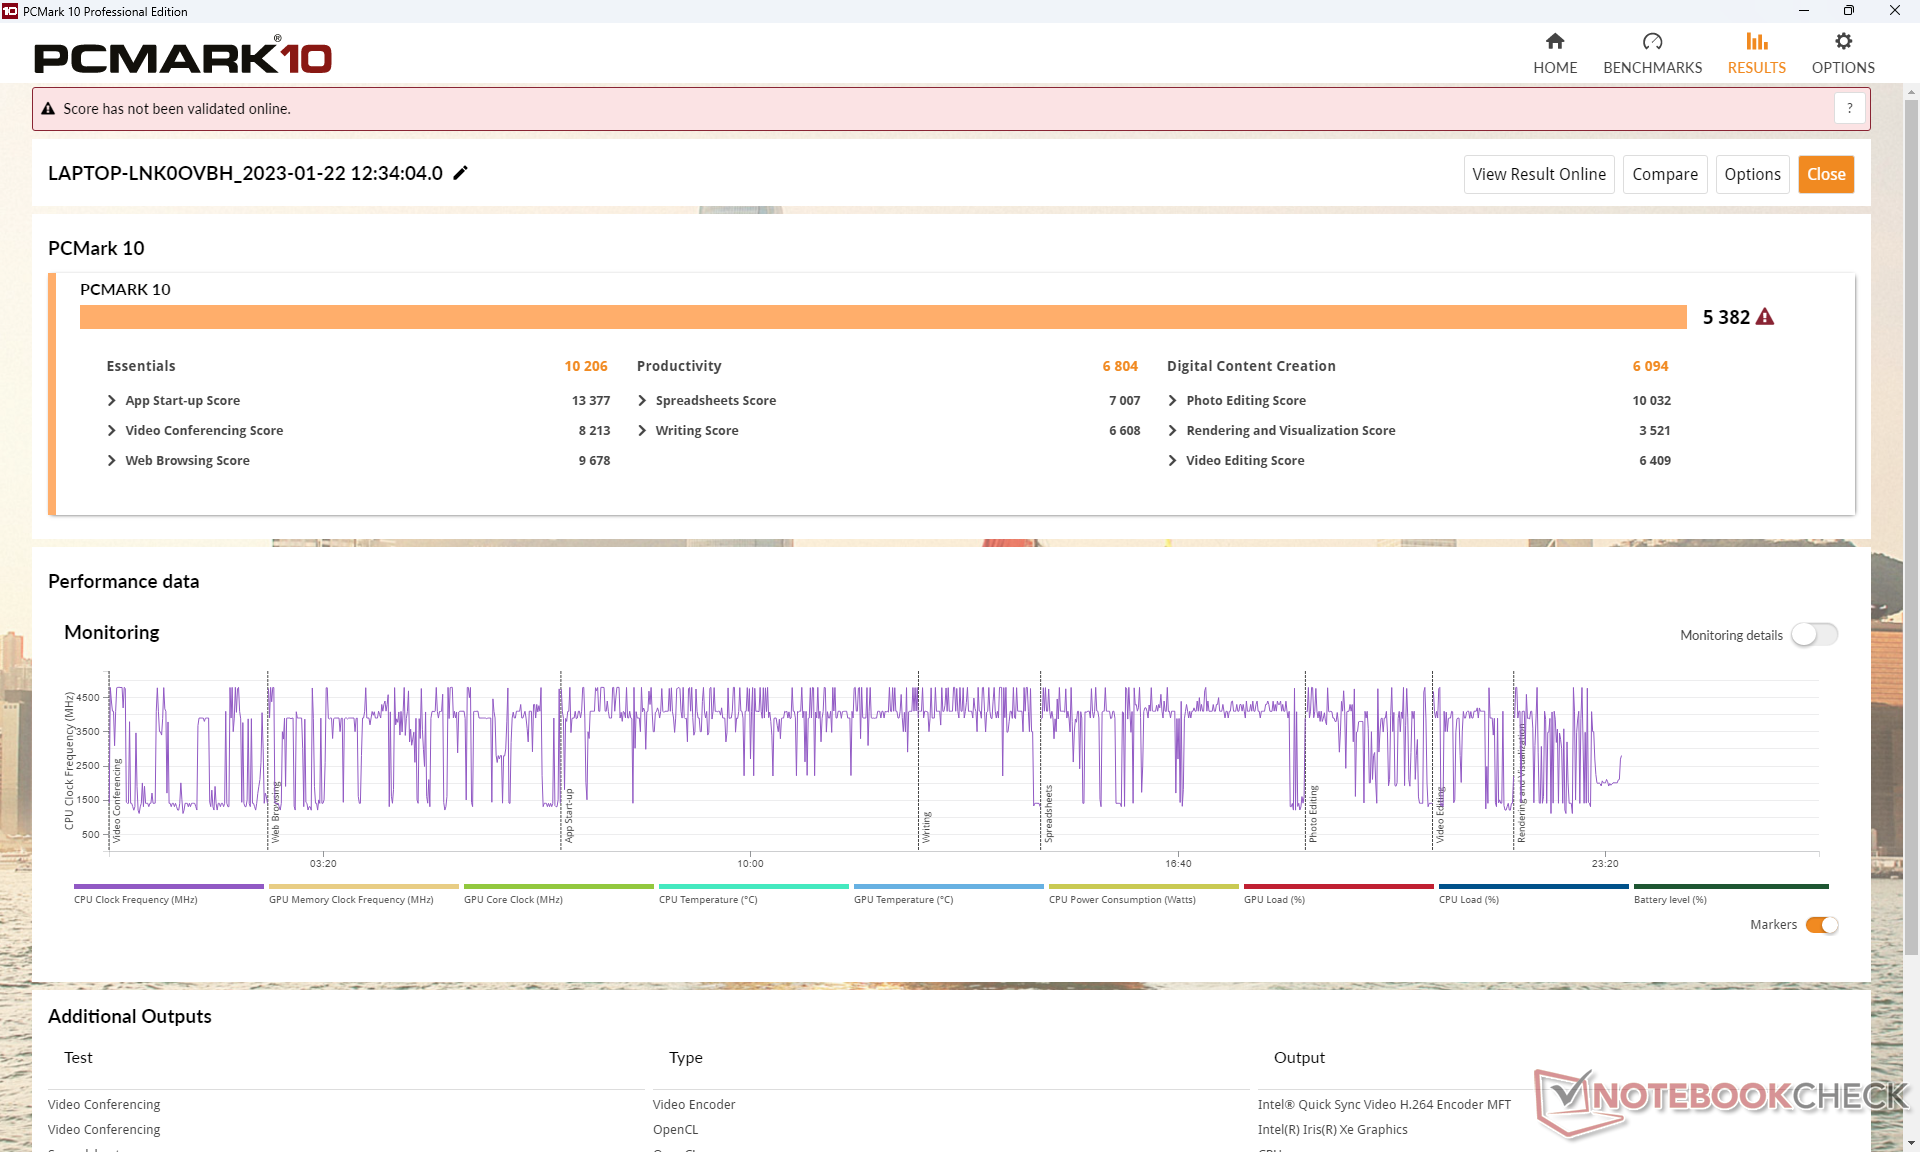
De genomsnittliga PCMark-resultaten ligger mellan de långsammare Core i5-drivna och snabbare Ryzen 5-drivna SKU:erna, vilket framgår av jämförelsediagrammet nedan. AMD:s SKU ligger märkbart före i undertestet Produktivitet, vilket sannolikt beror på dess snabbare prestanda för flera trådar och integrerade GPU jämfört med Intel SKU:erna.
CrossMark: Overall | Productivity | Creativity | Responsiveness
| PCMark 10 / Score | |
| Huawei MateBook 16s i7 | |
| Lenovo ThinkPad T16 G1 21CH004MGE | |
| HP EliteBook 865 G9 | |
| Genomsnitt Intel Core i7-1270P, Intel Iris Xe Graphics G7 96EUs (5382 - 5647, n=2) | |
| Lenovo ThinkPad T16 Gen 1 Core i7-1270P | |
| LG Gram 16Z90Q | |
| Lenovo ThinkPad T16 G1 21BWS00200 | |
| PCMark 10 / Essentials | |
| Huawei MateBook 16s i7 | |
| Genomsnitt Intel Core i7-1270P, Intel Iris Xe Graphics G7 96EUs (10206 - 11224, n=2) | |
| Lenovo ThinkPad T16 Gen 1 Core i7-1270P | |
| LG Gram 16Z90Q | |
| Lenovo ThinkPad T16 G1 21CH004MGE | |
| Lenovo ThinkPad T16 G1 21BWS00200 | |
| HP EliteBook 865 G9 | |
| PCMark 10 / Productivity | |
| Lenovo ThinkPad T16 G1 21CH004MGE | |
| HP EliteBook 865 G9 | |
| Huawei MateBook 16s i7 | |
| Genomsnitt Intel Core i7-1270P, Intel Iris Xe Graphics G7 96EUs (6804 - 6805, n=2) | |
| Lenovo ThinkPad T16 Gen 1 Core i7-1270P | |
| LG Gram 16Z90Q | |
| Lenovo ThinkPad T16 G1 21BWS00200 | |
| PCMark 10 / Digital Content Creation | |
| Huawei MateBook 16s i7 | |
| HP EliteBook 865 G9 | |
| Lenovo ThinkPad T16 G1 21CH004MGE | |
| Genomsnitt Intel Core i7-1270P, Intel Iris Xe Graphics G7 96EUs (6094 - 6398, n=2) | |
| Lenovo ThinkPad T16 Gen 1 Core i7-1270P | |
| LG Gram 16Z90Q | |
| Lenovo ThinkPad T16 G1 21BWS00200 | |
| CrossMark / Overall | |
| Huawei MateBook 16s i7 | |
| Genomsnitt Intel Core i7-1270P, Intel Iris Xe Graphics G7 96EUs (1585 - 1712, n=2) | |
| Lenovo ThinkPad T16 Gen 1 Core i7-1270P | |
| Apple MacBook Pro 16 2021 M1 Pro | |
| Lenovo ThinkPad T16 G1 21CH004MGE | |
| Lenovo ThinkPad T16 G1 21BWS00200 | |
| HP EliteBook 865 G9 | |
| CrossMark / Productivity | |
| Huawei MateBook 16s i7 | |
| Genomsnitt Intel Core i7-1270P, Intel Iris Xe Graphics G7 96EUs (1567 - 1636, n=2) | |
| Lenovo ThinkPad T16 Gen 1 Core i7-1270P | |
| Lenovo ThinkPad T16 G1 21CH004MGE | |
| Lenovo ThinkPad T16 G1 21BWS00200 | |
| HP EliteBook 865 G9 | |
| Apple MacBook Pro 16 2021 M1 Pro | |
| CrossMark / Creativity | |
| Apple MacBook Pro 16 2021 M1 Pro | |
| Huawei MateBook 16s i7 | |
| Genomsnitt Intel Core i7-1270P, Intel Iris Xe Graphics G7 96EUs (1684 - 1839, n=2) | |
| Lenovo ThinkPad T16 Gen 1 Core i7-1270P | |
| Lenovo ThinkPad T16 G1 21CH004MGE | |
| Lenovo ThinkPad T16 G1 21BWS00200 | |
| HP EliteBook 865 G9 | |
| CrossMark / Responsiveness | |
| Huawei MateBook 16s i7 | |
| Genomsnitt Intel Core i7-1270P, Intel Iris Xe Graphics G7 96EUs (1365 - 1584, n=2) | |
| Lenovo ThinkPad T16 Gen 1 Core i7-1270P | |
| Lenovo ThinkPad T16 G1 21BWS00200 | |
| Lenovo ThinkPad T16 G1 21CH004MGE | |
| HP EliteBook 865 G9 | |
| Apple MacBook Pro 16 2021 M1 Pro | |
| PCMark 10 Score | 5382 poäng | |
Hjälp | ||
| AIDA64 / Memory Copy | |
| Huawei MateBook 16s i7 | |
| LG Gram 16Z90Q | |
| Genomsnitt Intel Core i7-1270P (39471 - 62300, n=2) | |
| Lenovo ThinkPad T16 G1 21CH004MGE | |
| Lenovo ThinkPad T16 Gen 1 Core i7-1270P | |
| HP EliteBook 865 G9 | |
| AIDA64 / Memory Read | |
| Huawei MateBook 16s i7 | |
| LG Gram 16Z90Q | |
| Genomsnitt Intel Core i7-1270P (42289 - 72572, n=2) | |
| Lenovo ThinkPad T16 Gen 1 Core i7-1270P | |
| Lenovo ThinkPad T16 G1 21CH004MGE | |
| HP EliteBook 865 G9 | |
| AIDA64 / Memory Write | |
| LG Gram 16Z90Q | |
| Huawei MateBook 16s i7 | |
| Genomsnitt Intel Core i7-1270P (43051 - 61340, n=2) | |
| Lenovo ThinkPad T16 G1 21CH004MGE | |
| Lenovo ThinkPad T16 Gen 1 Core i7-1270P | |
| HP EliteBook 865 G9 | |
| AIDA64 / Memory Latency | |
| Lenovo ThinkPad T16 G1 21CH004MGE | |
| Huawei MateBook 16s i7 | |
| LG Gram 16Z90Q | |
| HP EliteBook 865 G9 | |
| Lenovo ThinkPad T16 Gen 1 Core i7-1270P | |
| Genomsnitt Intel Core i7-1270P (89.3 - 89.3, n=2) | |
* ... mindre är bättre
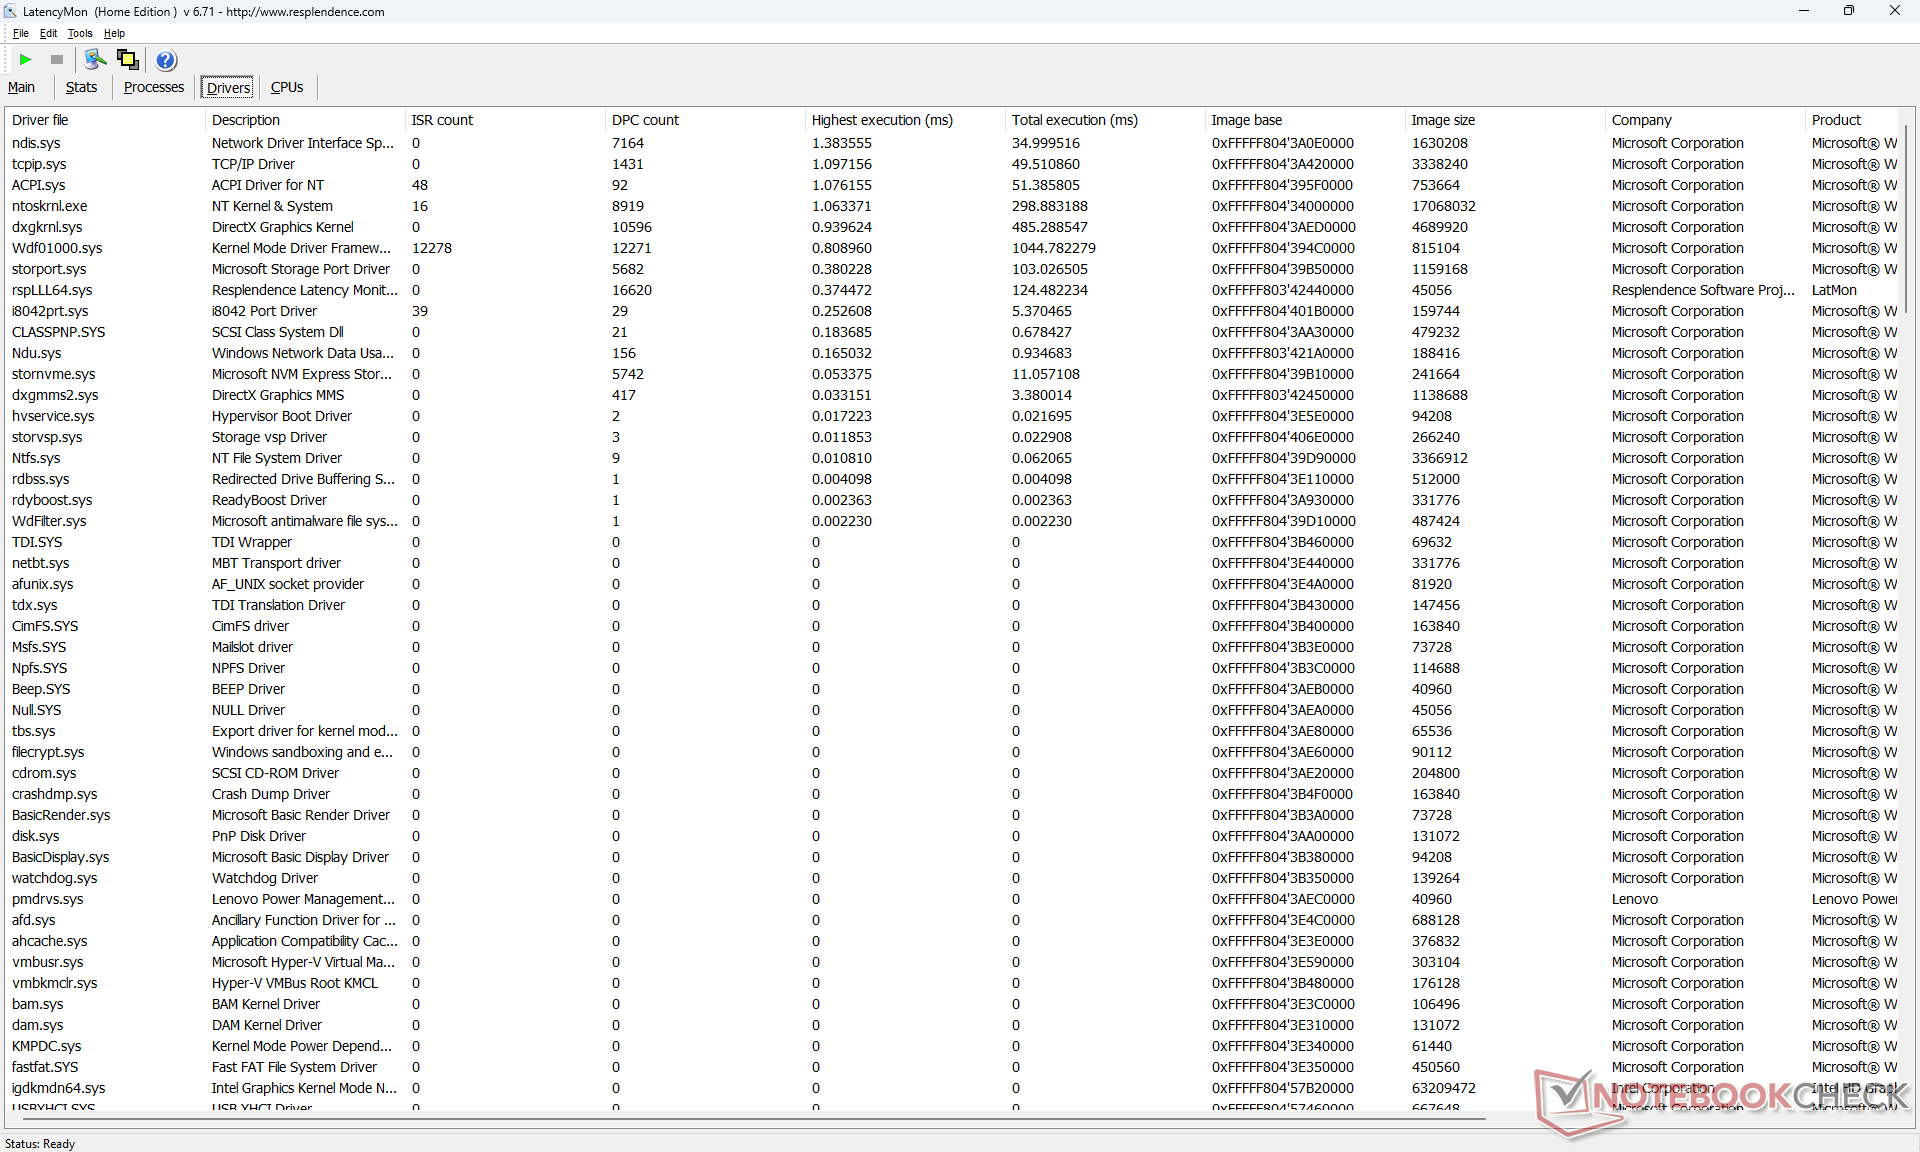
DPC-latenstid
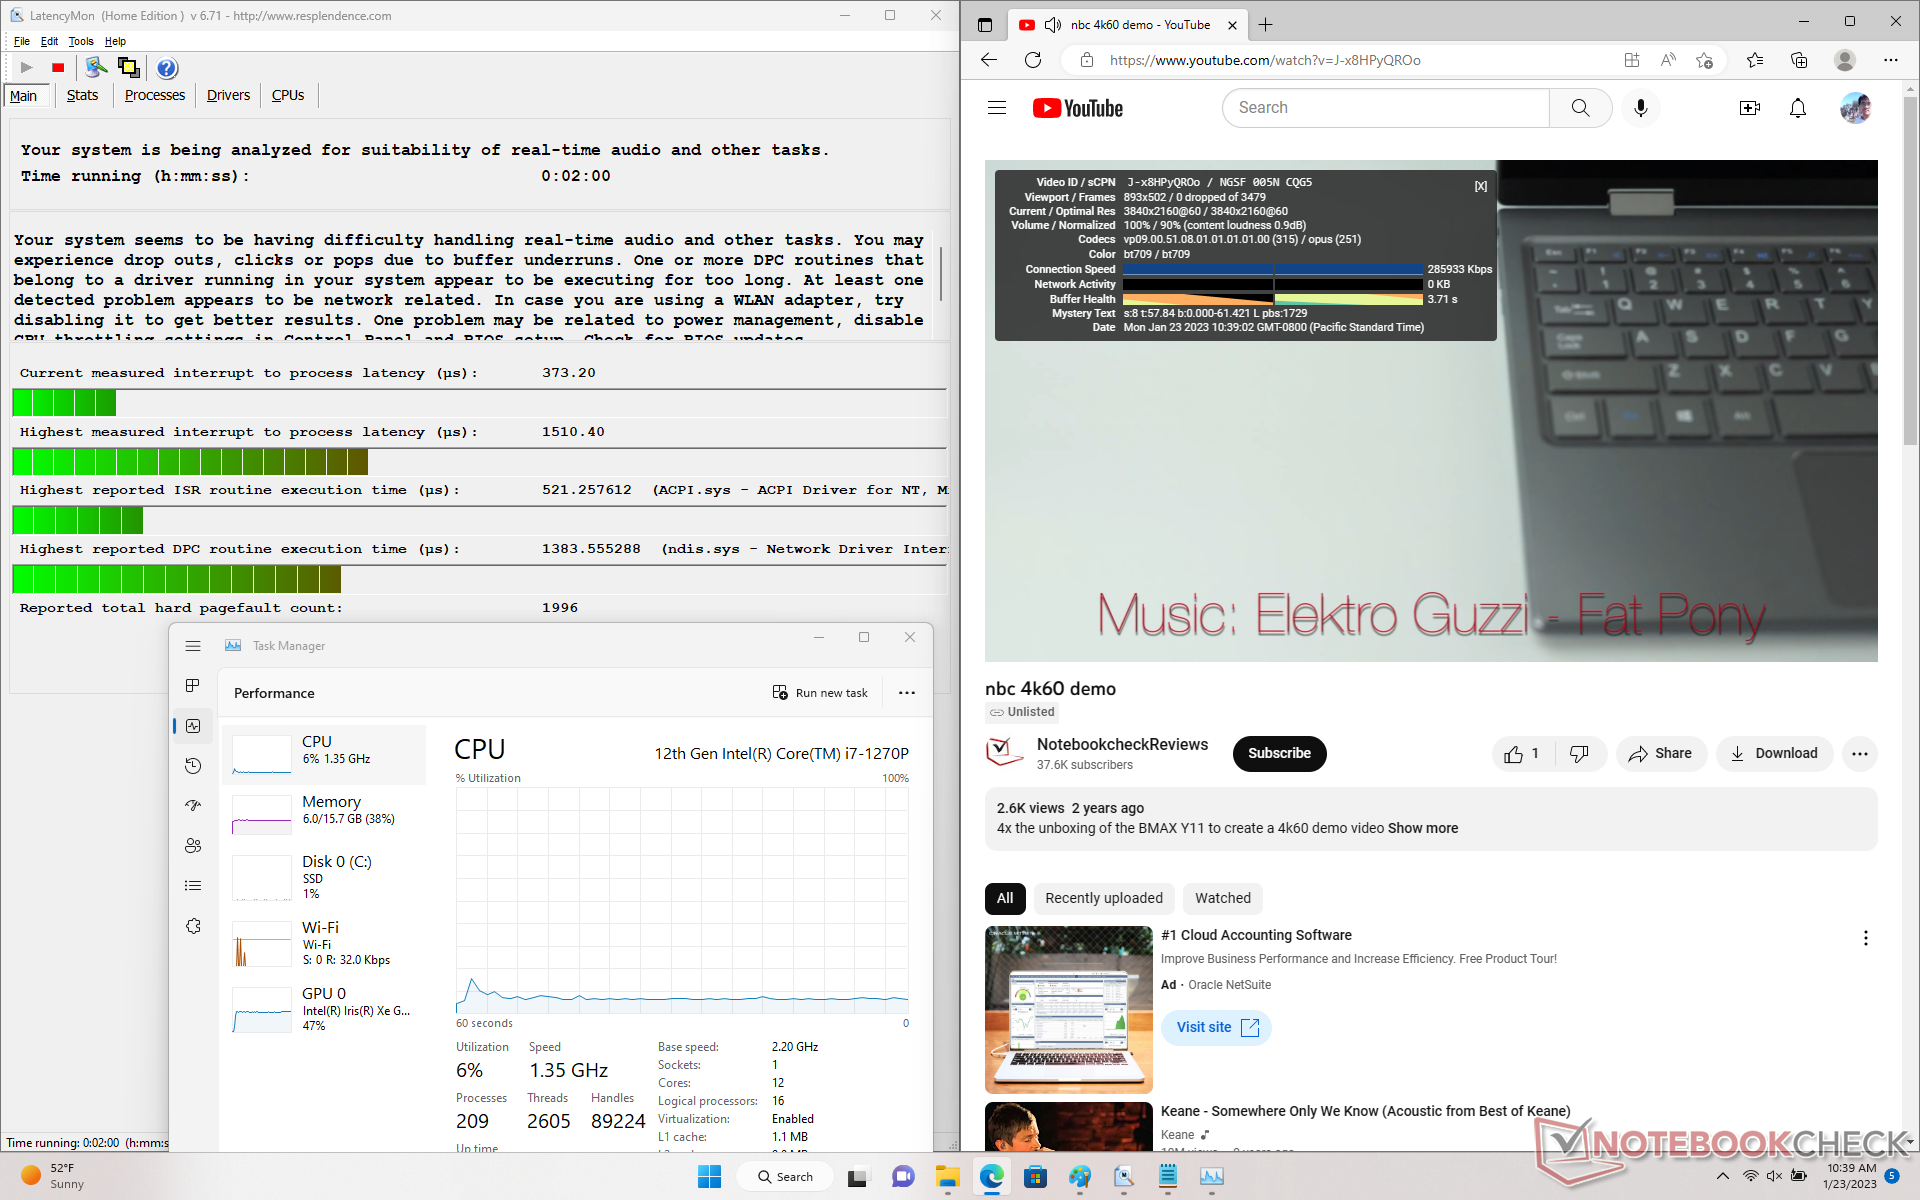
LatencyMon visar DPC-problem när man öppnar flera webbläsarflikar på vår hemsida. uppspelning av 4K-video vid 60 FPS är annars perfekt och utan några tappade bilder.
| DPC Latencies / LatencyMon - interrupt to process latency (max), Web, Youtube, Prime95 | |
| LG Gram 16Z90Q | |
| Lenovo ThinkPad T16 Gen 1 Core i7-1270P | |
| Lenovo ThinkPad T16 G1 21CH004MGE | |
| HP EliteBook 865 G9 | |
* ... mindre är bättre
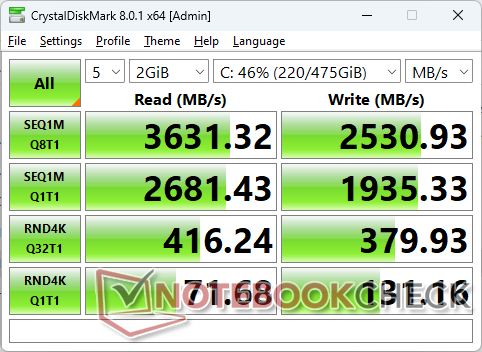
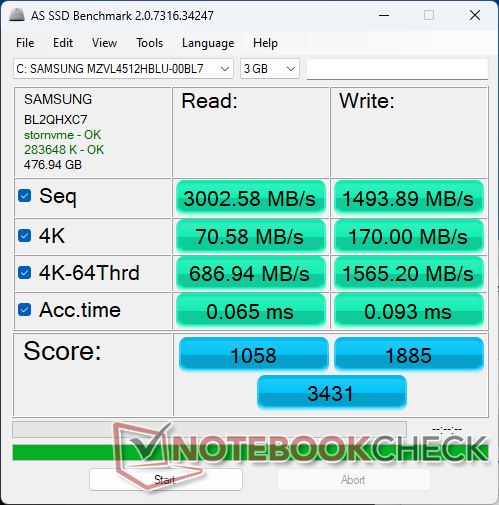
Lagringsenheter
Vår enhet levereras med en 512 GB Samsung PM9B1 PCIe4 x4 NVMe SSD i stället för den vanligare Samsung PM9A1. PM9B1-serien erbjuder långsammare överföringshastigheter med nästan hälften; sekventiell läshastighet toppar vid ~3600 MB/s på vår enhet jämfört med ~6300 MB/s på LG Gram 16 med Samsung PM9A1.

| Drive Performance rating - Percent | |
| Huawei MateBook 16s i7 | |
| LG Gram 16Z90Q | |
| Lenovo ThinkPad T16 G1 21CH004MGE | |
| Lenovo ThinkPad T16 Gen 1 Core i7-1270P | |
| HP EliteBook 865 G9 | |
* ... mindre är bättre
Disk Throttling: DiskSpd Read Loop, Queue Depth 8
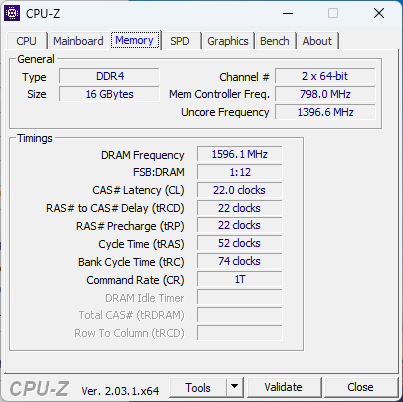
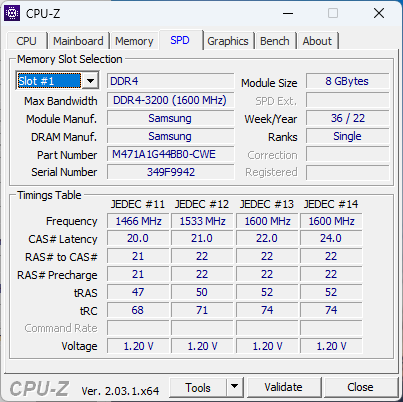
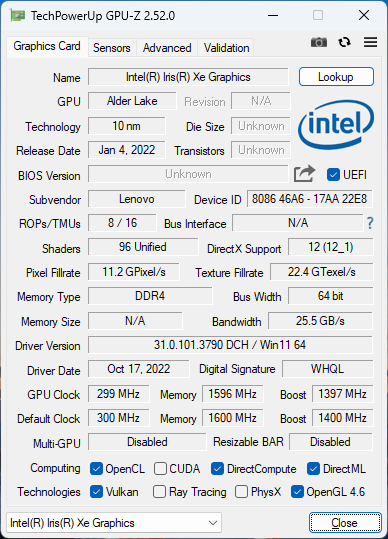
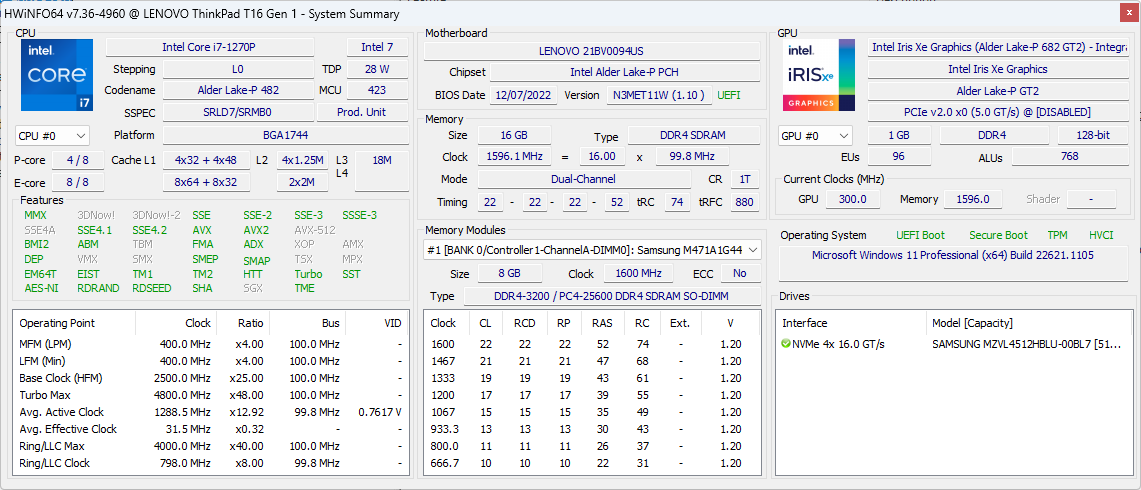
GPU-prestanda - hålls tillbaka av långsamt RAM-minne
Grafikprestandan är cirka 10 procent långsammare än den genomsnittliga bärbara datorn i vår databas som är utrustad med samma Iris Xe 96 EUs GPU. Den undermåliga prestandan kan delvis tillskrivas det långsamma DDR4-3200 RAM-minnet i förhållande till de flesta andra bärbara datorer som drivs av 12:e generationens Intel CPU:er. LG Gram 16har till exempel snabbare LPDDR5-5200 RAM som standard.
Dessutom kan grafikprestandan bli gradvis långsammare när man kör hög belastning under längre perioder. När du går på tomgång på Witcher 3 vid låga inställningar kan bildfrekvensen sjunka från 84 FPS i början av testet till ~70 FPS efter ett par minuter, vilket framgår av diagrammet nedan, på grund av systemets begränsade Turbo Boost-potential.
Uppgradering till Ryzen 5 Radeon 660M SKU av samma modell ökar grafikprestandan med cirka 10 till 15 procent.
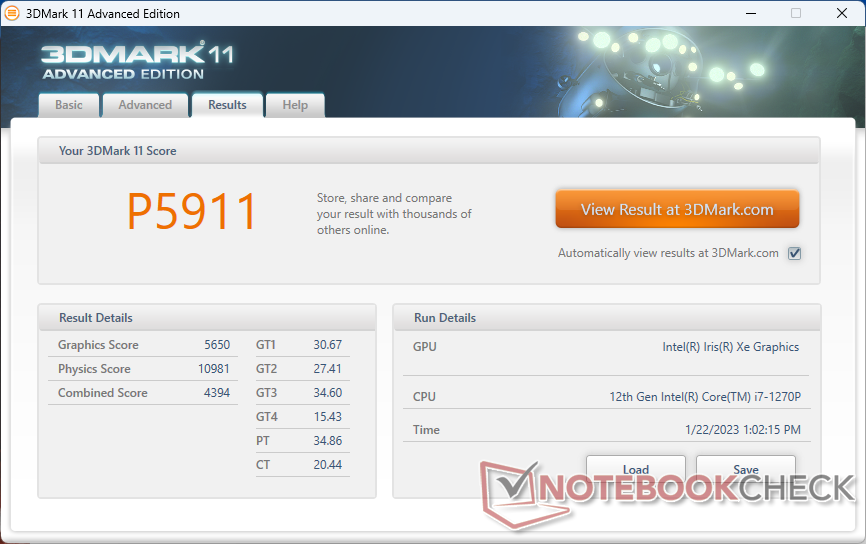
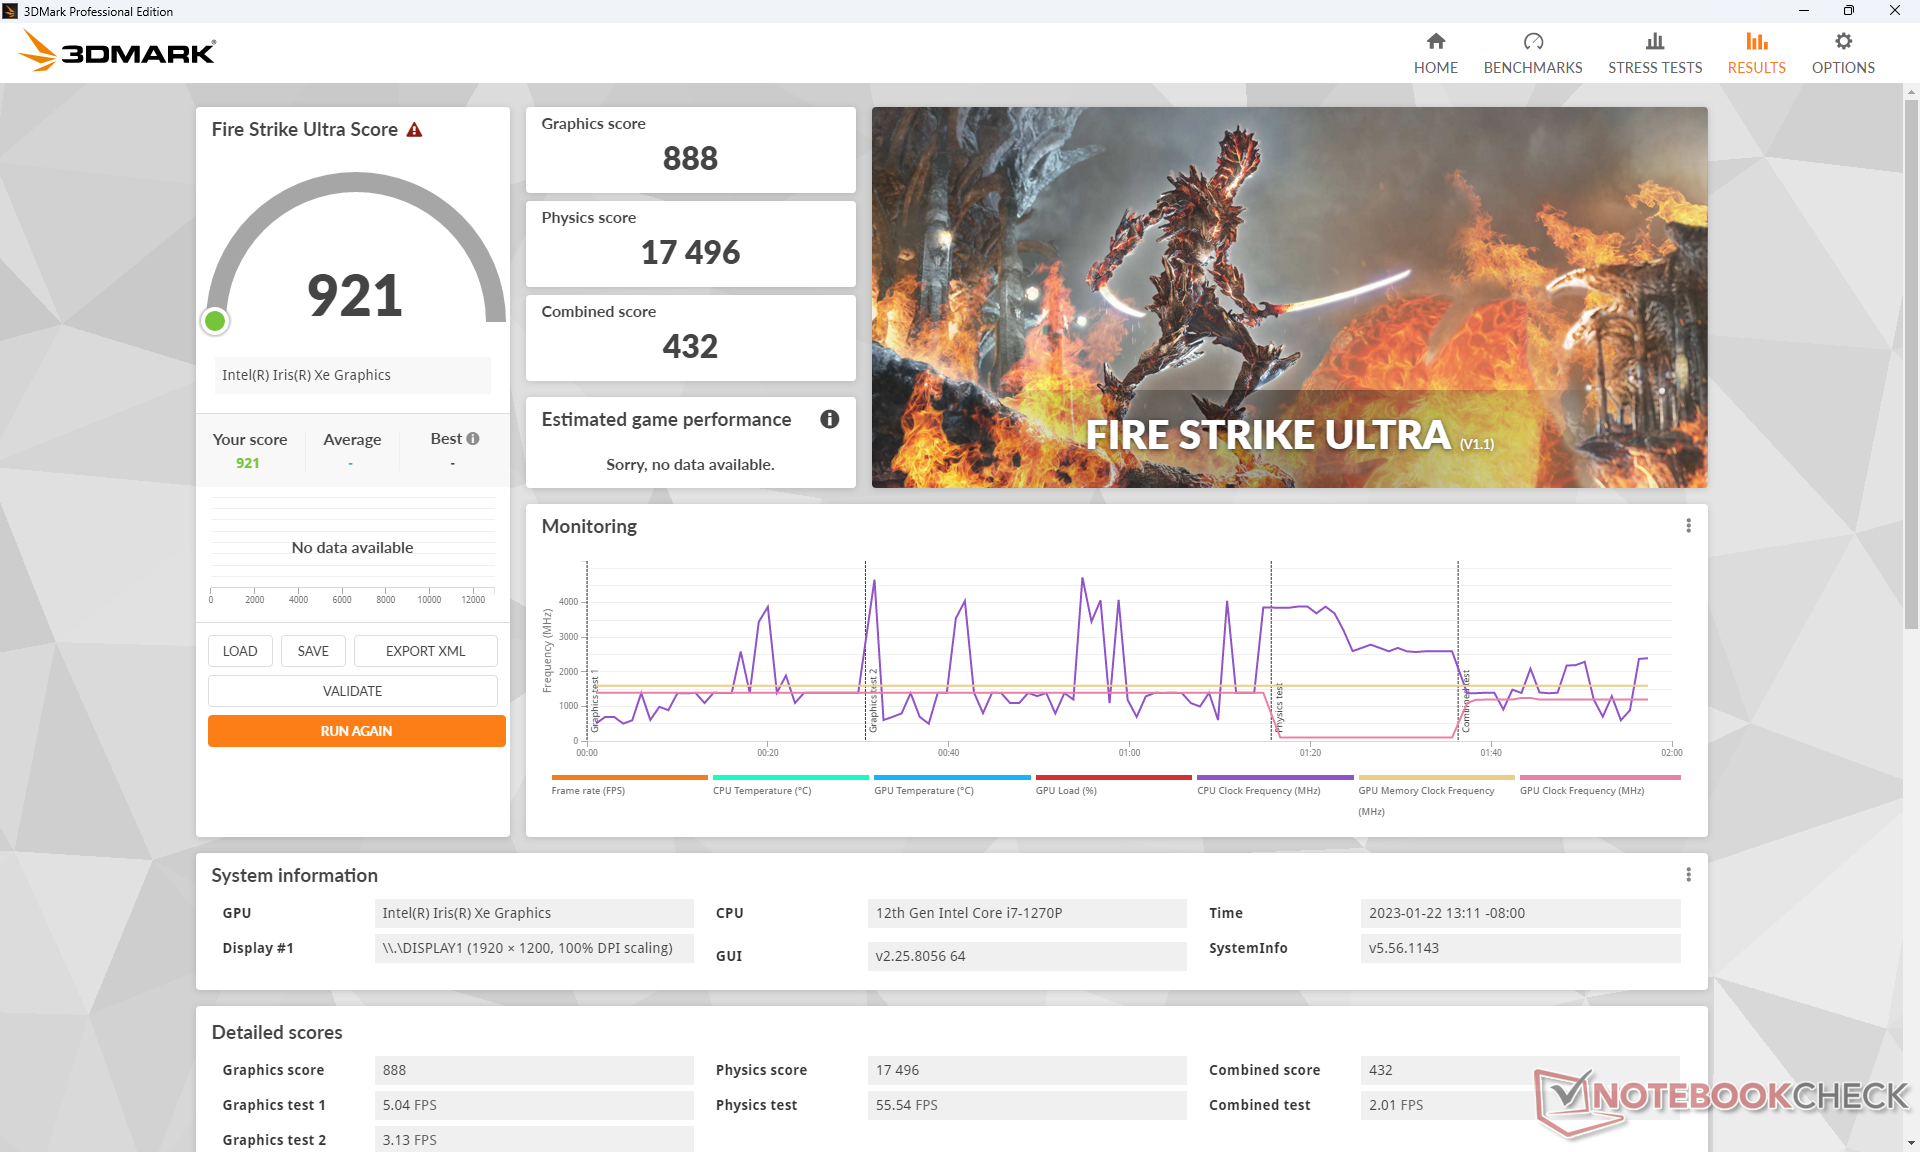
| 3DMark 11 Performance | 5911 poäng | |
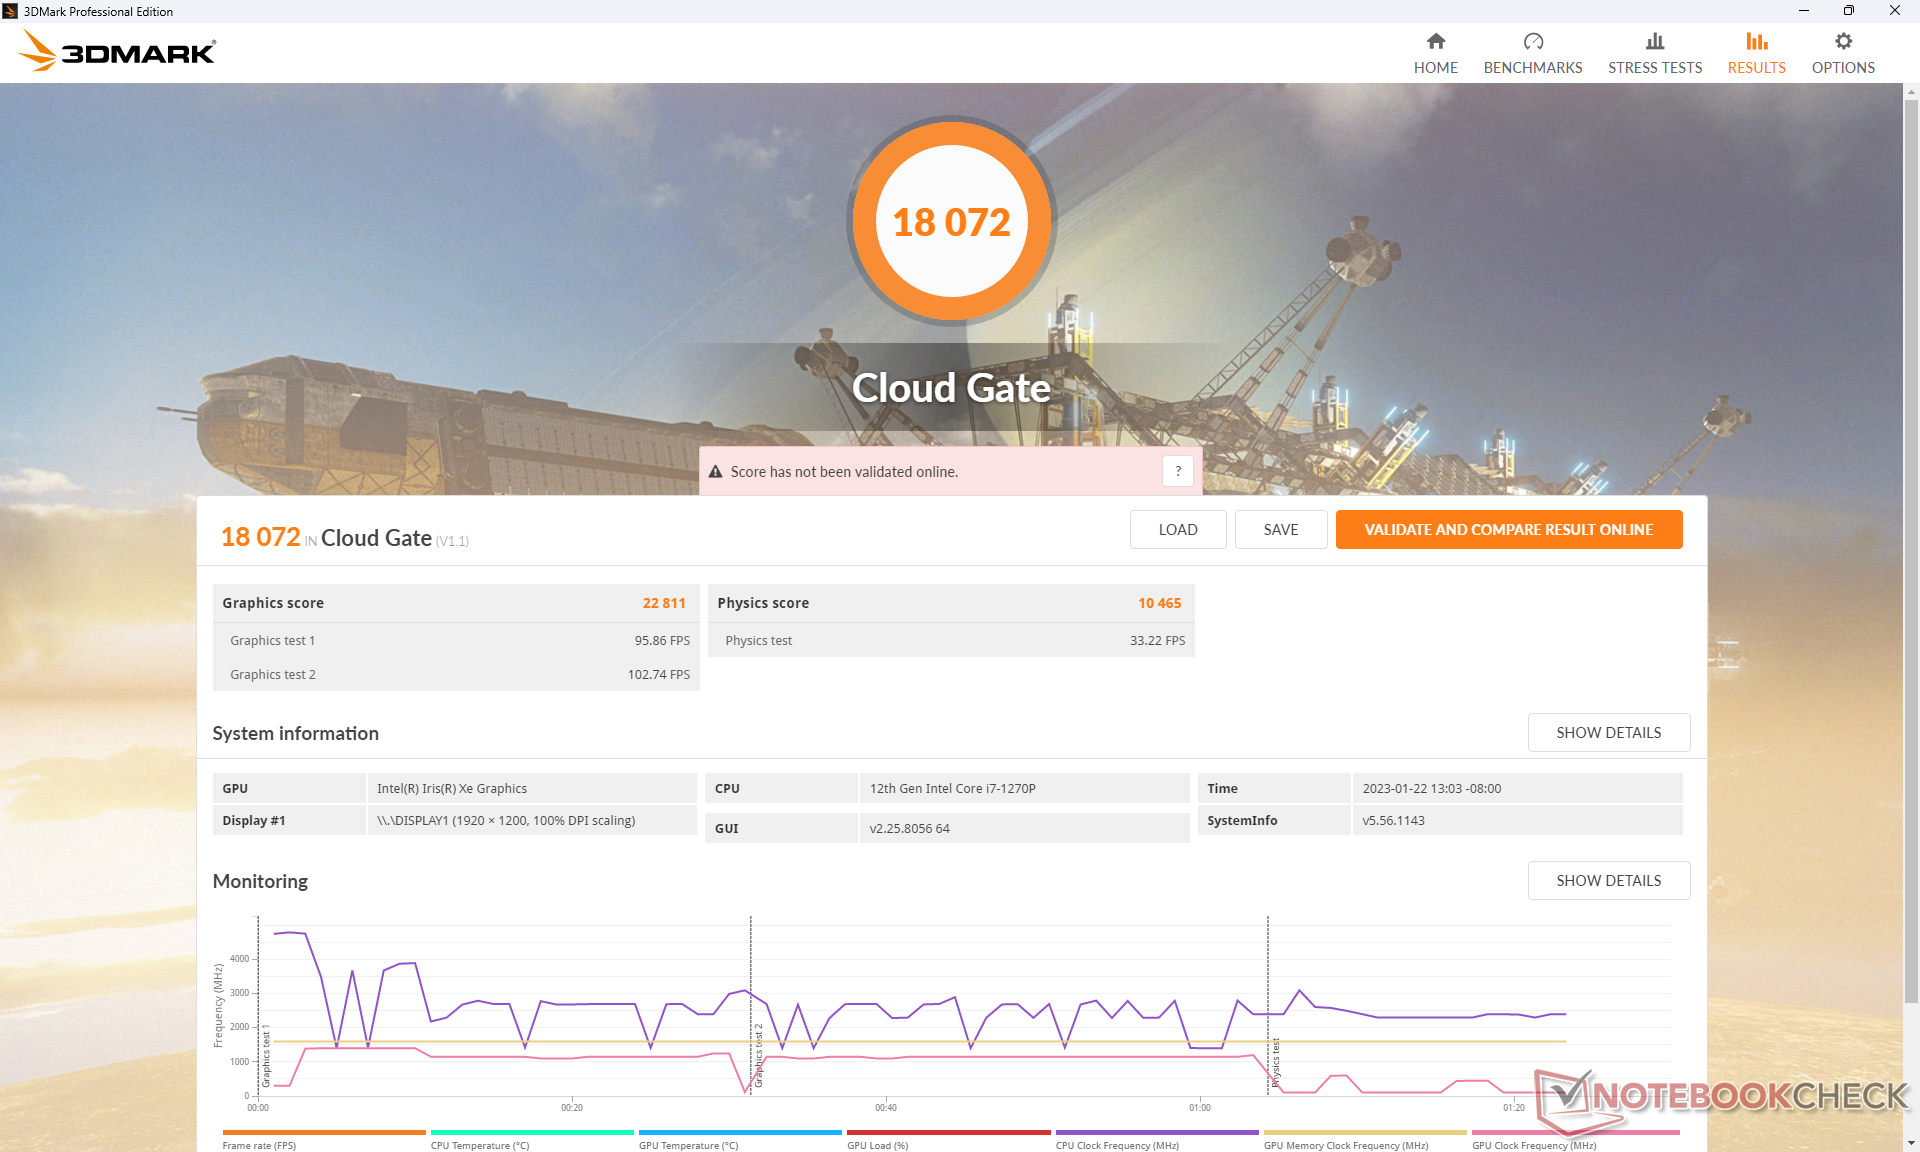
| 3DMark Cloud Gate Standard Score | 18072 poäng | |
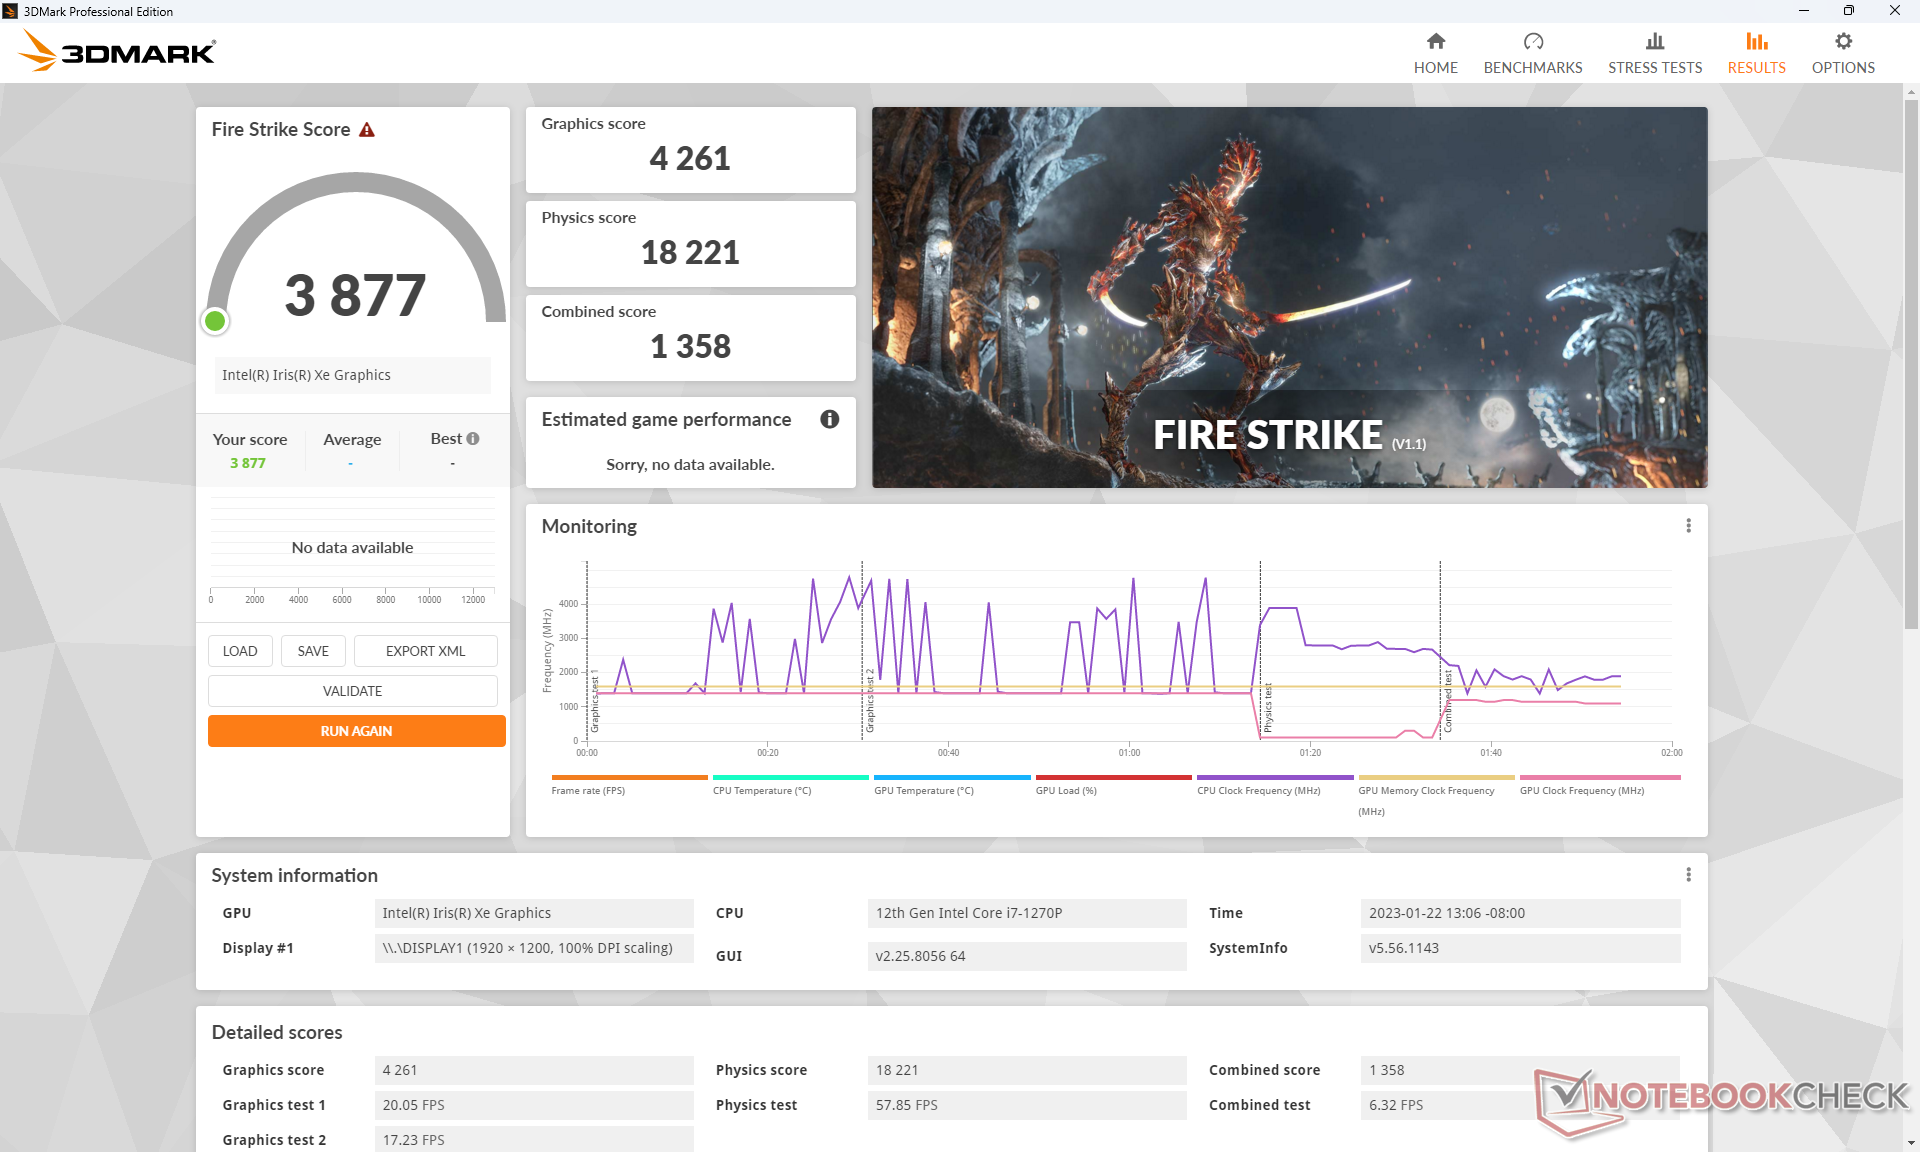
| 3DMark Fire Strike Score | 3877 poäng | |
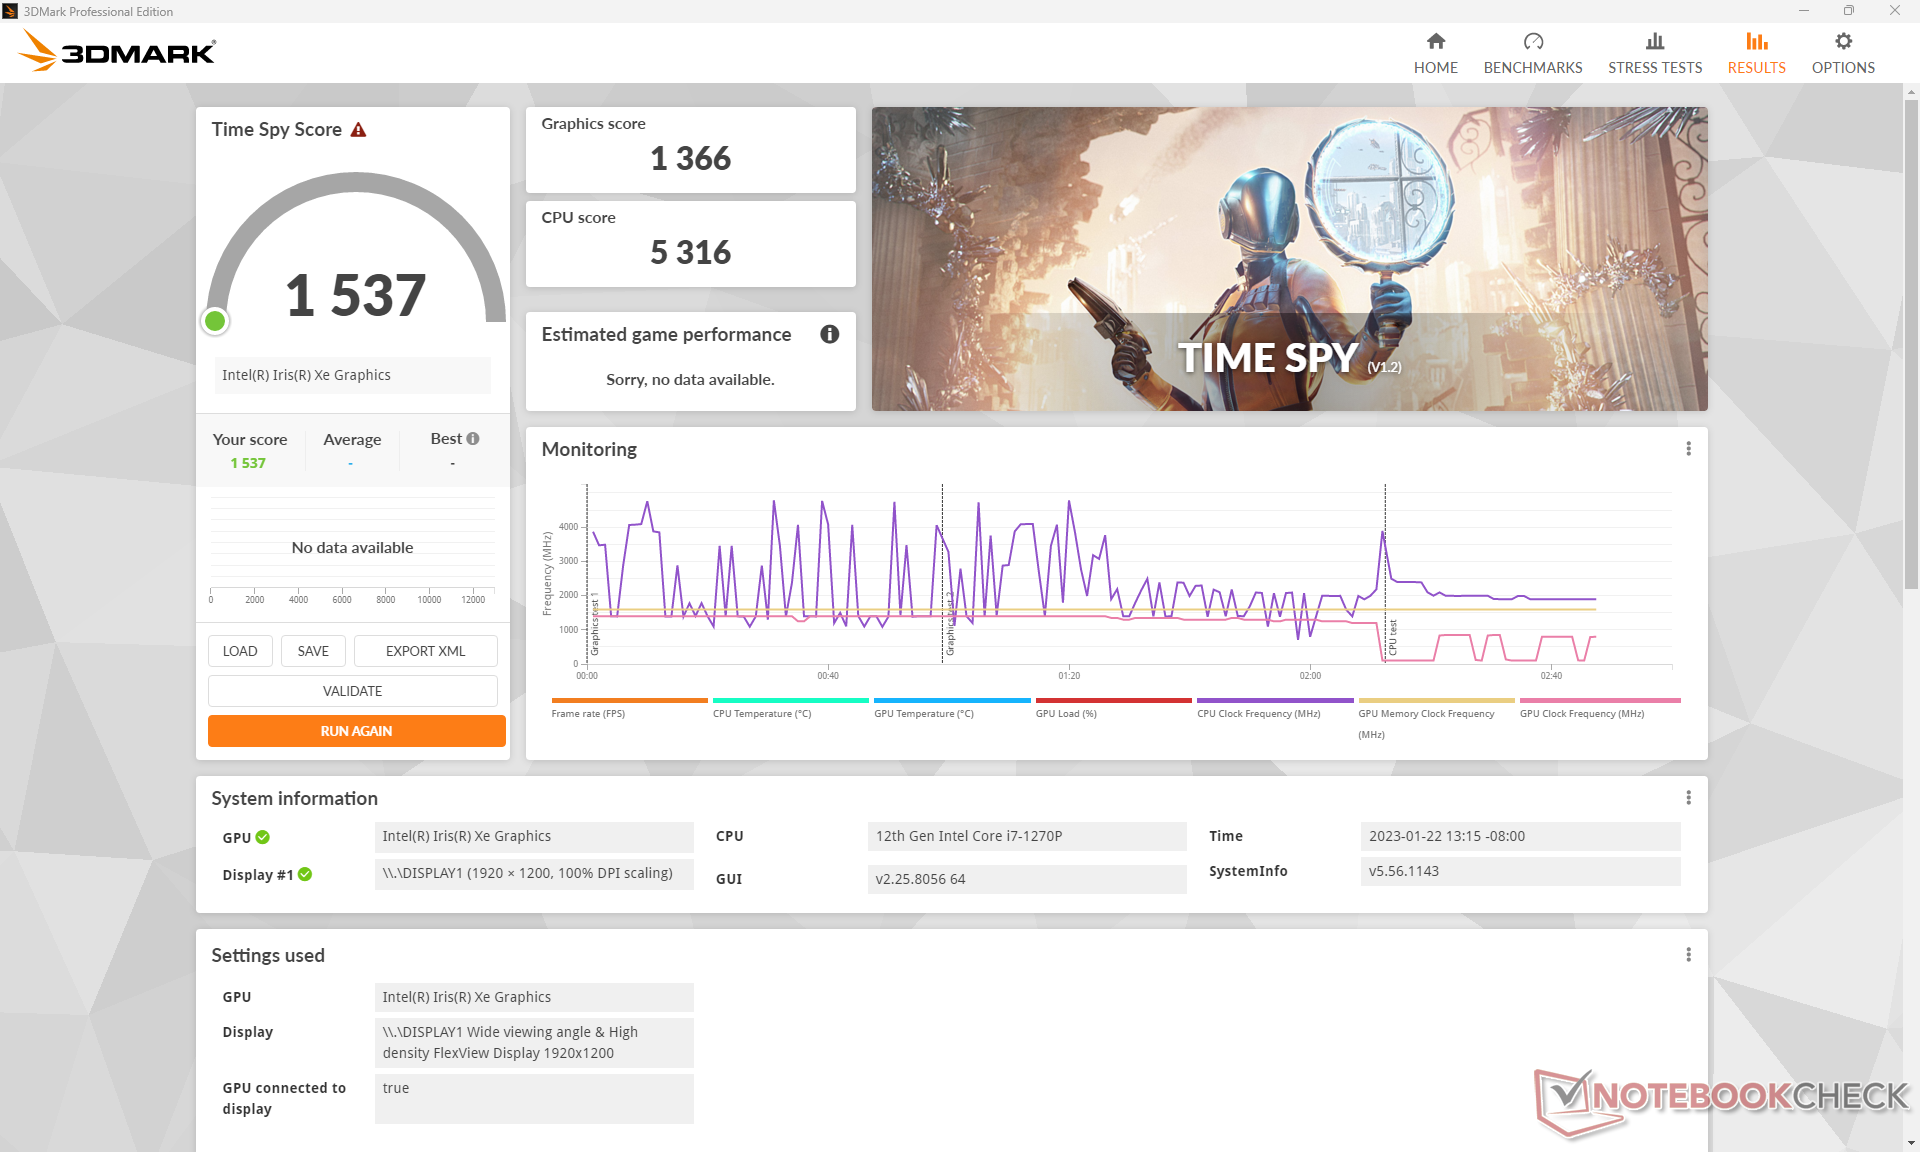
| 3DMark Time Spy Score | 1537 poäng | |
Hjälp | ||
| Cyberpunk 2077 1.6 - 1920x1080 Low Preset | |
| Lenovo Yoga 7-14ARB G7 | |
| Asus ZenBook Flip 15 Q508U | |
| Genomsnitt Intel Iris Xe Graphics G7 96EUs (13 - 25.9, n=42) | |
| Lenovo ThinkPad T16 Gen 1 Core i7-1270P | |
Witcher 3 FPS Chart
| låg | med. | hög | ultra | |
|---|---|---|---|---|
| GTA V (2015) | 97.8 | 74.8 | 14.1 | 4.85 |
| The Witcher 3 (2015) | 82.1 | 50.4 | 24.4 | 11.2 |
| Dota 2 Reborn (2015) | 110.6 | 71.9 | 48.9 | 44.6 |
| Final Fantasy XV Benchmark (2018) | 31.4 | 16.8 | 12.6 | |
| X-Plane 11.11 (2018) | 39.7 | 31.9 | 29.2 | |
| Strange Brigade (2018) | 79.2 | 29.8 | 24.2 | 19.1 |
| Cyberpunk 2077 1.6 (2022) | 18.4 |
Utsläpp
Systemljud - nästan alltid tyst
Fläktljudet är ett av de tystaste för skärmstorleken, vilket delvis förklarar processorns dåliga prestanda i benchmarks ovan. Den interna fläkten är knappt hörbar även när den är inställd på prestandaläge och kör krävande belastningar som spel. Den kan pulsera upp till 34 dB(A) under korta perioder då och då innan den återgår till nästan tystnad, men även detta maximum är tystare än på de flesta bärbara datorer. HP EliteBook 865 G9 tar ett liknande tillvägagångssätt när det gäller fläktljud för en mycket tyst användarupplevelse också. Det finns knappast någon anledning att välja något annat läge än Performance för kontroll av fläktljudet som ett resultat av detta.
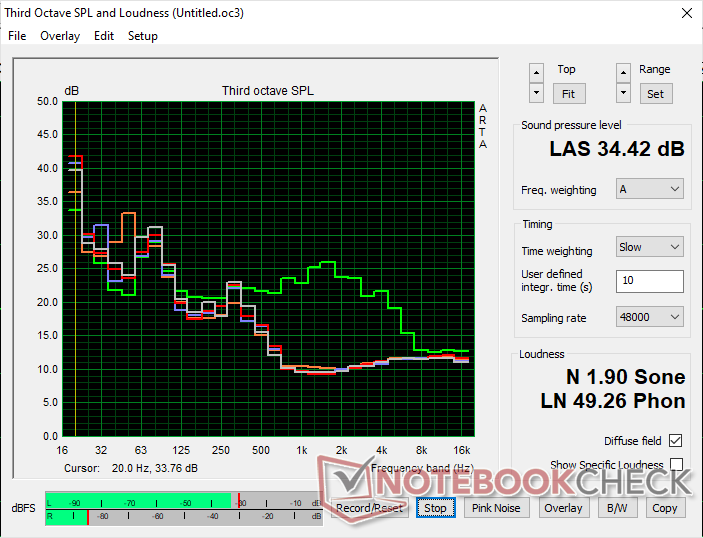
Ljudnivå
| Låg belastning |
| 24.7 / 24.7 / 24.7 dB(A) |
| Hög belastning |
| 24.5 / 34.4 dB(A) |
 | ||
30 dB tyst 40 dB(A) hörbar 50 dB(A) högt ljud |
||
min: | ||
| Lenovo ThinkPad T16 Gen 1 Core i7-1270P Iris Xe G7 96EUs, i7-1270P, Samsung PM9B1 512GB MZAL4512HBLU | Lenovo ThinkPad T16 G1 21CH004MGE Radeon 660M, R5 PRO 6650U, Micron 2450 512GB MTFDKBA512TFK | LG Gram 16Z90Q Iris Xe G7 96EUs, i7-1260P, Samsung PM9A1 MZVL21T0HCLR | HP EliteBook 865 G9 Radeon 680M, R7 PRO 6850U, Samsung PM991 MZVLQ512HBLU | Huawei MateBook 16s i7 Iris Xe G7 96EUs, i7-12700H, Silicon Motion PCIe-8 SSD | Apple MacBook Pro 16 2021 M1 Pro M1 Pro 16-Core GPU, M1 Pro, Apple SSD AP1024R | |
|---|---|---|---|---|---|---|
| Noise | -6% | -21% | -1% | -15% | -3% | |
| av / miljö * (dB) | 24.7 | 23.1 6% | 25 -1% | 23 7% | 24 3% | 24.7 -0% |
| Idle Minimum * (dB) | 24.7 | 23.1 6% | 26 -5% | 23 7% | 24 3% | 24.7 -0% |
| Idle Average * (dB) | 24.7 | 23.1 6% | 27 -9% | 23 7% | 25.2 -2% | 24.7 -0% |
| Idle Maximum * (dB) | 24.7 | 23.1 6% | 28 -13% | 23 7% | 27.2 -10% | 24.7 -0% |
| Load Average * (dB) | 24.5 | 25.4 -4% | 38 -55% | 29.1 -19% | 34.8 -42% | 26.1 -7% |
| Witcher 3 ultra * (dB) | 24.3 | 35.93 -48% | 37 -52% | 29.1 -20% | 34.8 -43% | |
| Load Maximum * (dB) | 34.4 | 39.1 -14% | 38 -10% | 32.9 4% | 39 -13% | 37.4 -9% |
* ... mindre är bättre
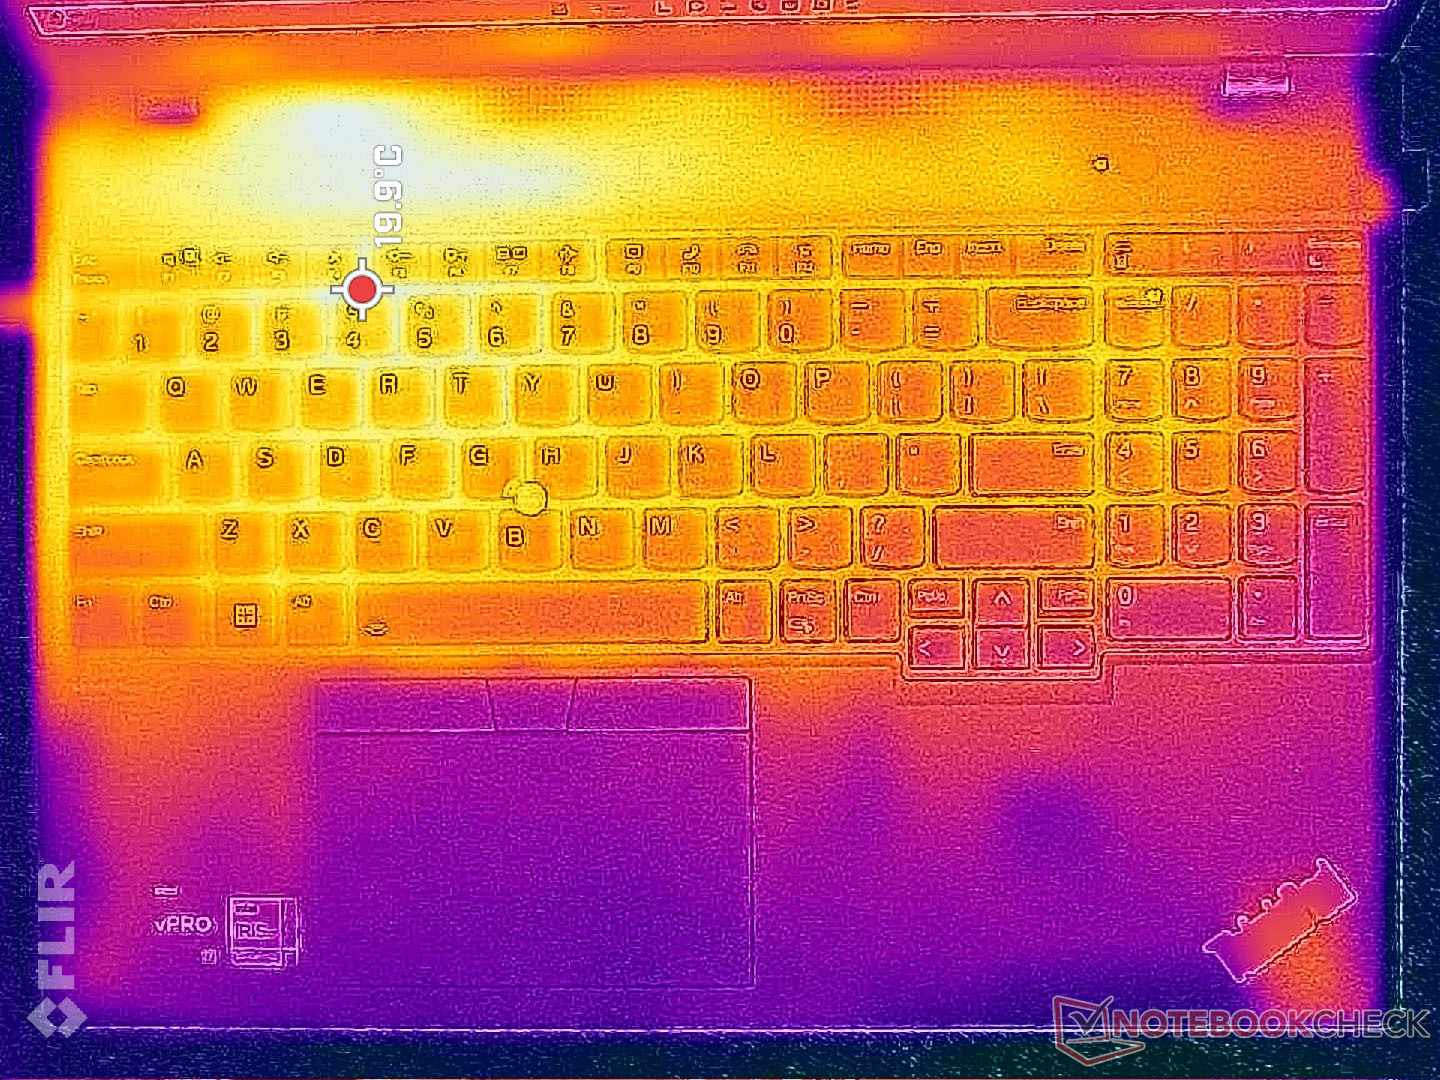
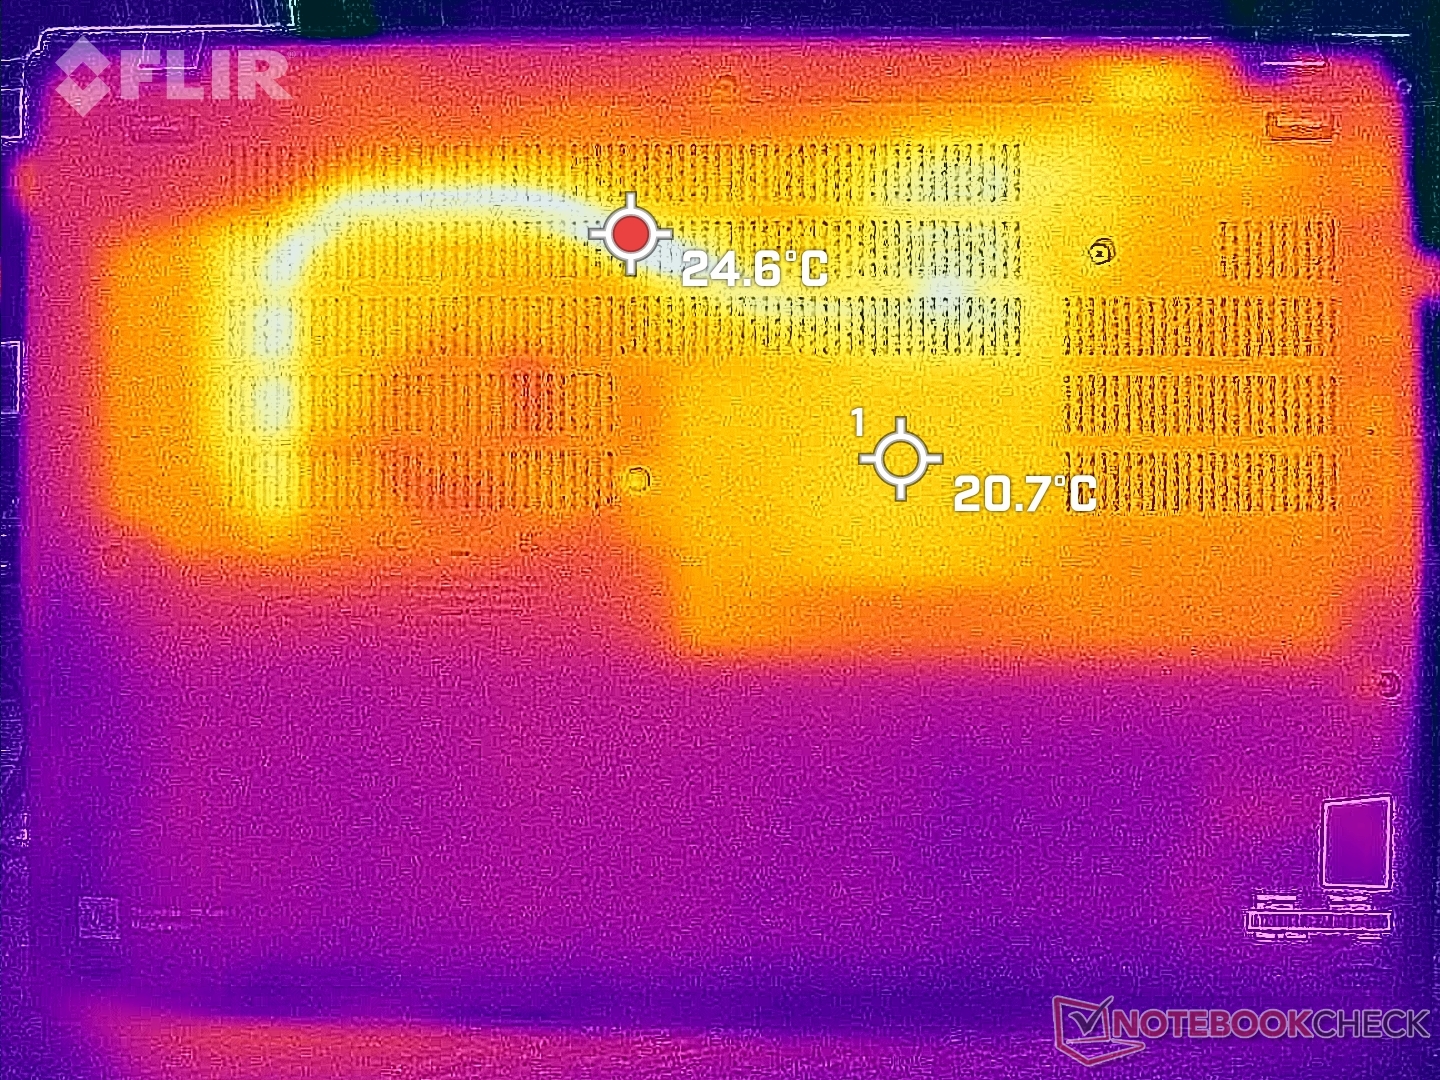
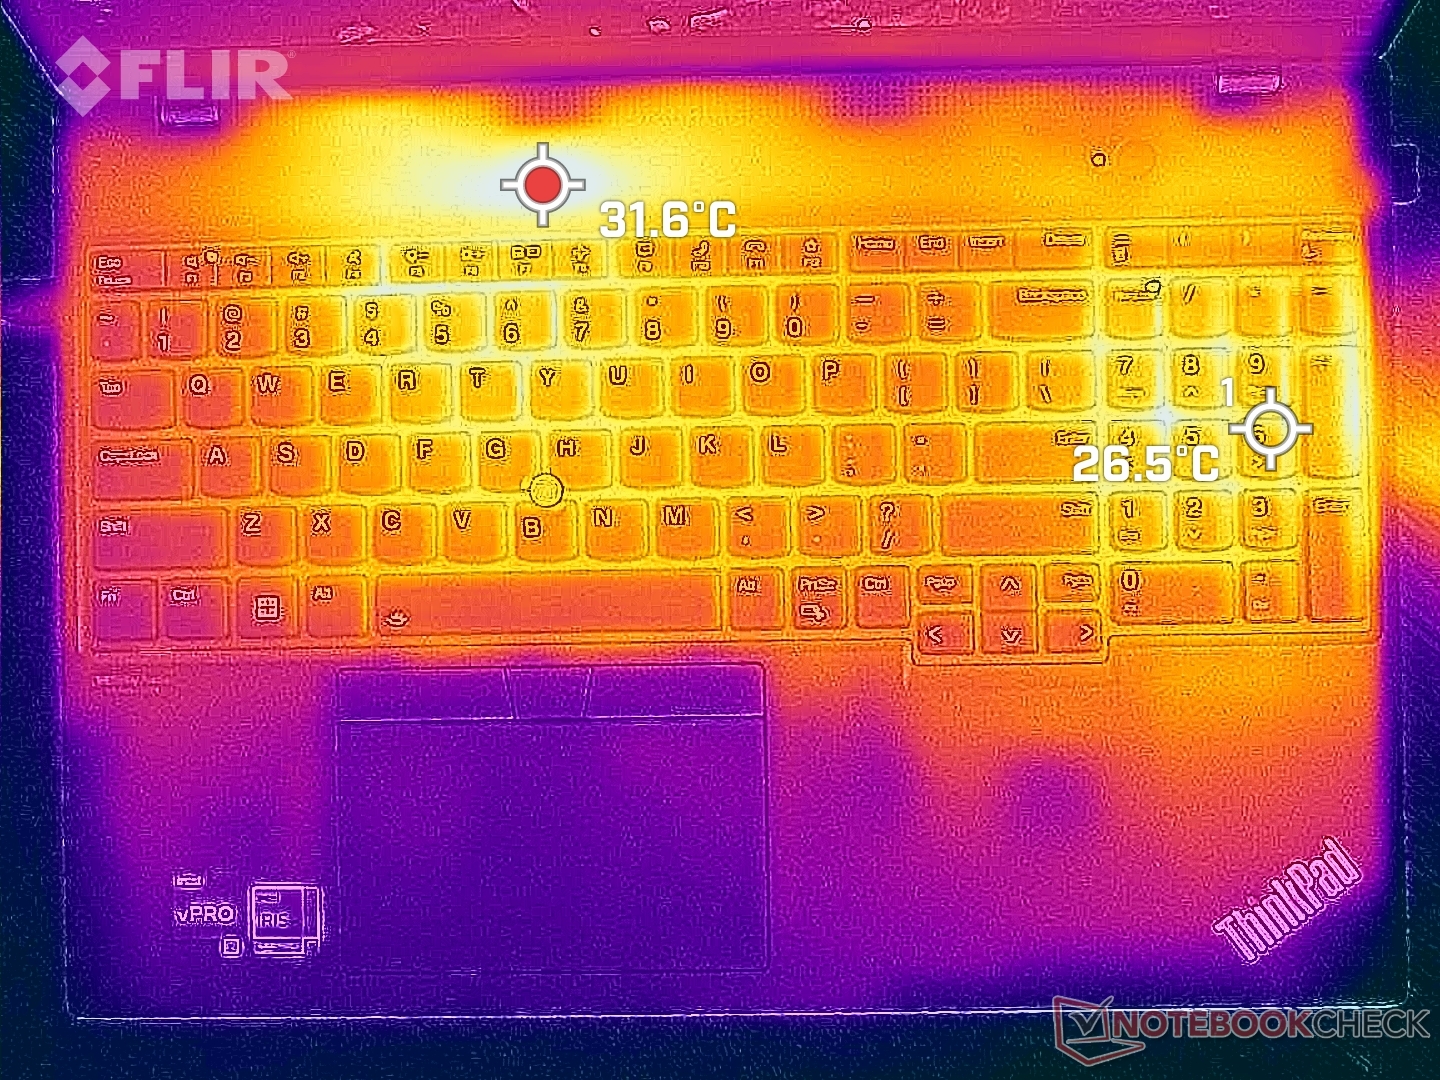
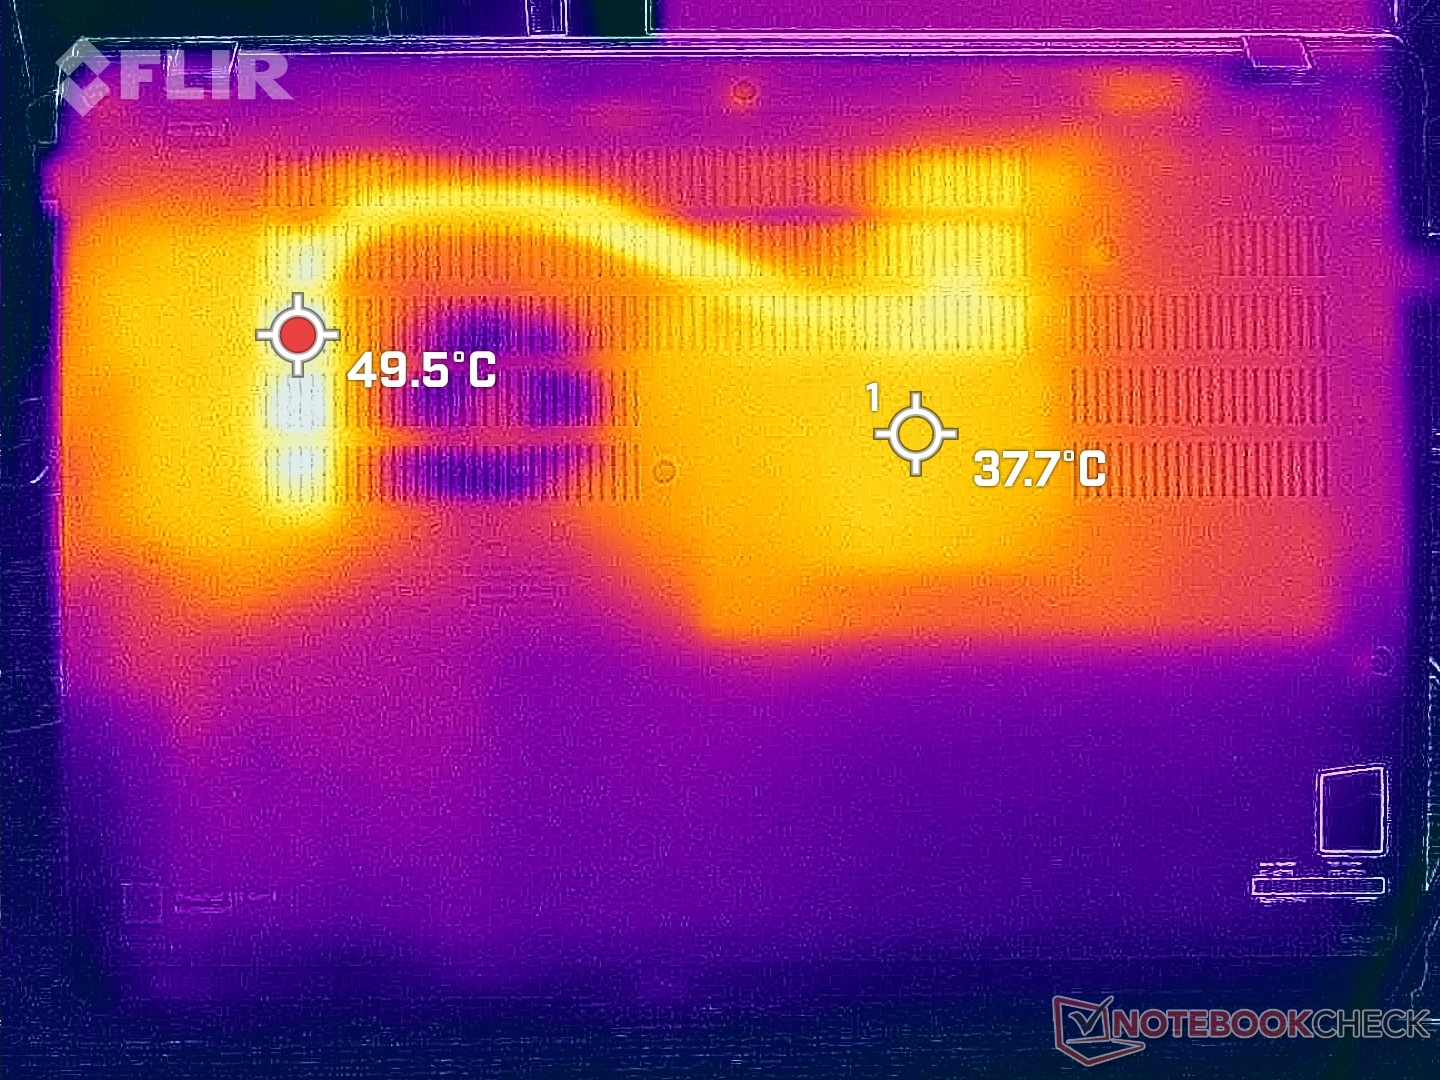
Temperatur
Yttemperaturerna är mycket svalare på övre däck än på nedre däck. Medeltemperaturen på tangentbordsdäcket och handflatorna är cirka 29 C vid krävande belastningar jämfört med 36 C på undersidan. Detta står i kontrast till de flesta andra bärbara datorer som på LG Gram 16 där tangentbordets mitt kan nå 44 C för att vara över 10 C varmare än på vår ThinkPad T16 G1.
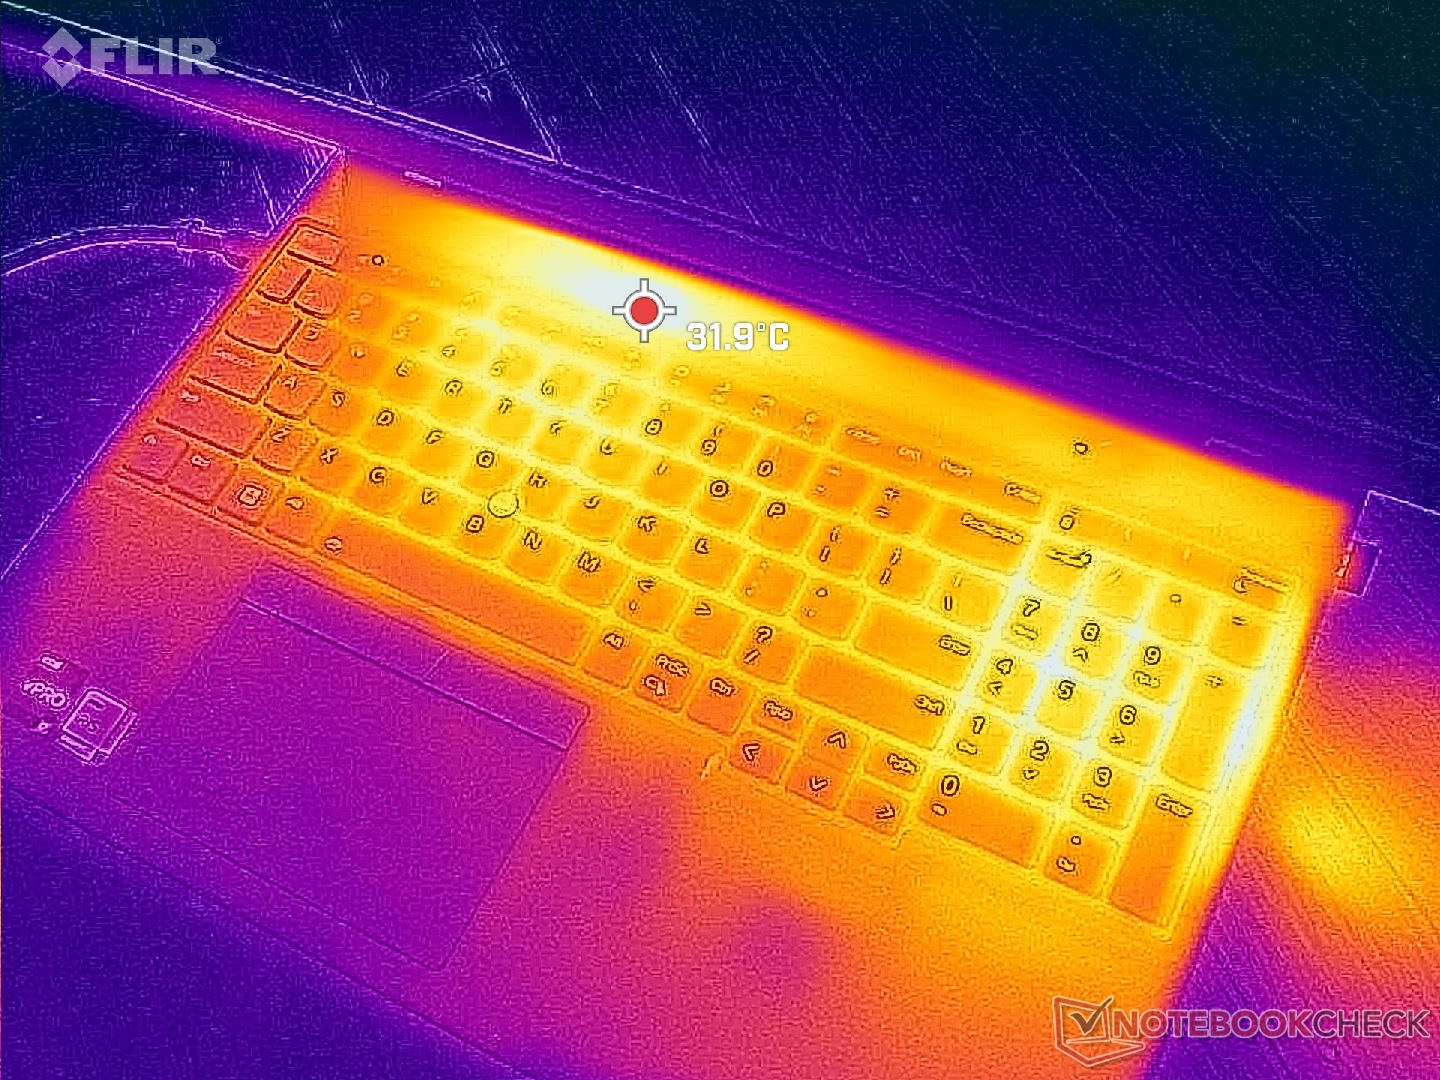
(+) Den maximala temperaturen på ovansidan är 33.8 °C / 93 F, jämfört med genomsnittet av 34.3 °C / 94 F , allt från 21.2 till 62.5 °C för klassen Office.
(-) Botten värms upp till maximalt 47 °C / 117 F, jämfört med genomsnittet av 36.8 °C / 98 F
(+) Vid tomgångsbruk är medeltemperaturen för ovansidan 22.6 °C / 73 F, jämfört med enhetsgenomsnittet på 29.5 °C / ### class_avg_f### F.
(+) Handledsstöden och pekplattan är kallare än hudtemperaturen med maximalt 24.6 °C / 76.3 F och är därför svala att ta på.
(+) Medeltemperaturen för handledsstödsområdet på liknande enheter var 27.5 °C / 81.5 F (+2.9 °C / 5.2 F).
| Lenovo ThinkPad T16 Gen 1 Core i7-1270P Intel Core i7-1270P, Intel Iris Xe Graphics G7 96EUs | Lenovo ThinkPad T16 G1 21BWS00200 Intel Core i5-1240P, Intel Iris Xe Graphics G7 80EUs | LG Gram 16Z90Q Intel Core i7-1260P, Intel Iris Xe Graphics G7 96EUs | HP EliteBook 865 G9 AMD Ryzen 7 PRO 6850U, AMD Radeon 680M | Huawei MateBook 16s i7 Intel Core i7-12700H, Intel Iris Xe Graphics G7 96EUs | Apple MacBook Pro 16 2021 M1 Pro Apple M1 Pro, Apple M1 Pro 16-Core GPU | |
|---|---|---|---|---|---|---|
| Heat | -19% | -6% | 0% | -13% | 3% | |
| Maximum Upper Side * (°C) | 33.8 | 45 -33% | 45 -33% | 39.4 -17% | 40.9 -21% | 41 -21% |
| Maximum Bottom * (°C) | 47 | 42.8 9% | 43 9% | 47.6 -1% | 48.3 -3% | 39 17% |
| Idle Upper Side * (°C) | 24.6 | 33 -34% | 26 -6% | 23.6 4% | 29.2 -19% | 24 2% |
| Idle Bottom * (°C) | 28.2 | 33.6 -19% | 26 8% | 24.1 15% | 30.4 -8% | 24 15% |
* ... mindre är bättre
Stresstest
De branta prestandaförlusterna under vår Witcher 3 och CineBench R15 xT loop-testerna ovan kan observeras med HWiNFO. När Prime95 körs, till exempel, ökar CPU-klockfrekvensen och kortets strömförbrukning till 3,5 GHz respektive 48 W. När kärntemperaturen når 97 C några sekunder senare börjar dock klockfrekvensen och kortets effektuttag att stadigt sjunka till så låga värden som 1,7 GHz respektive 22 W, för att upprätthålla en svalare kärntemperatur på 69 C. Genom att använda ThrottleStop höjs den stabila klockfrekvensen till ett högre intervall på 2-3 GHz, men till priset av varmare kärntemperaturer.
GPU-klockfrekvens och temperatur vid körning Witcher 3 skulle stabiliseras vid 998 MHz respektive 67 C, jämfört med 1100 MHz och 58 C på den mindre GPU:n HP Dragonfly Folio 13.5 G3. Att köra på batteri verkar inte påverka prestandan.
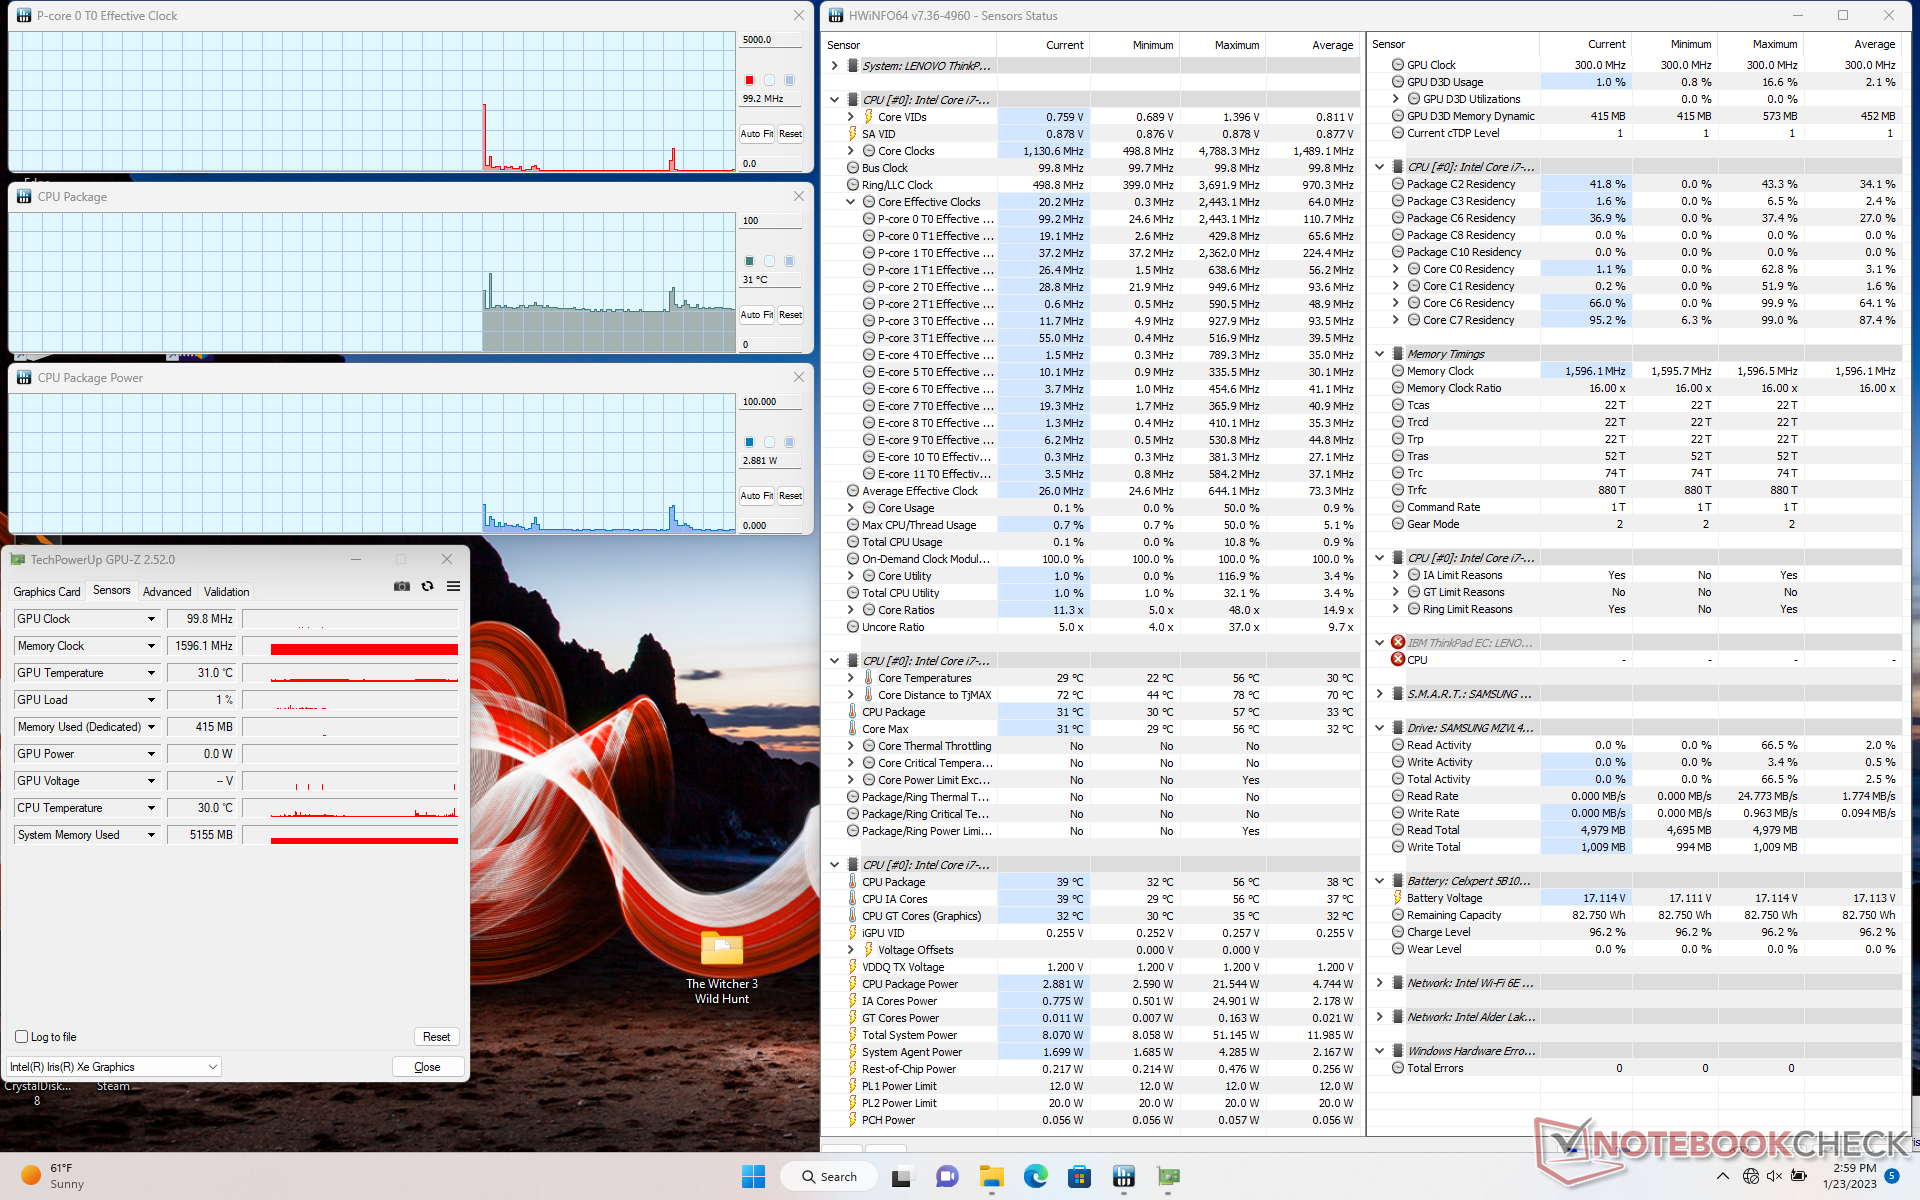
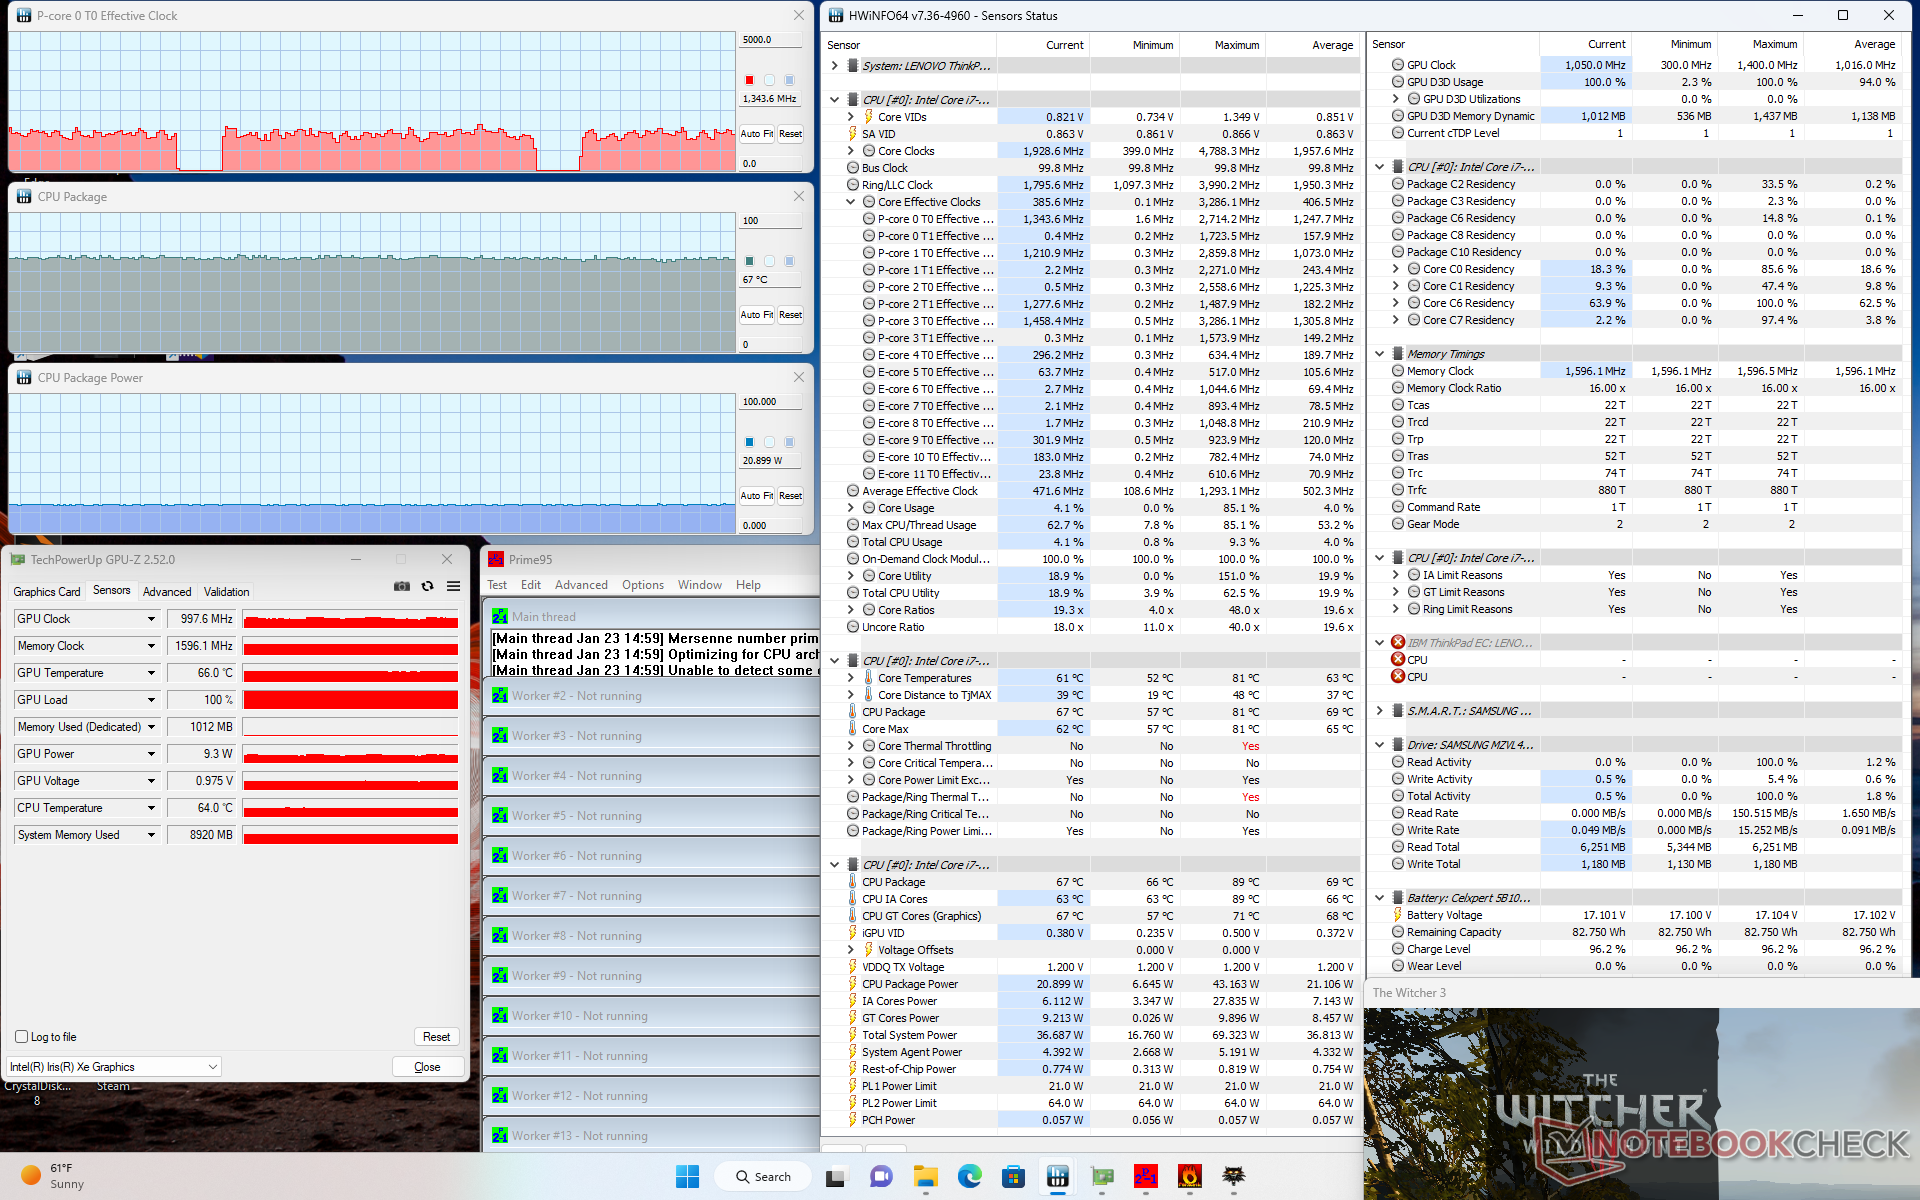
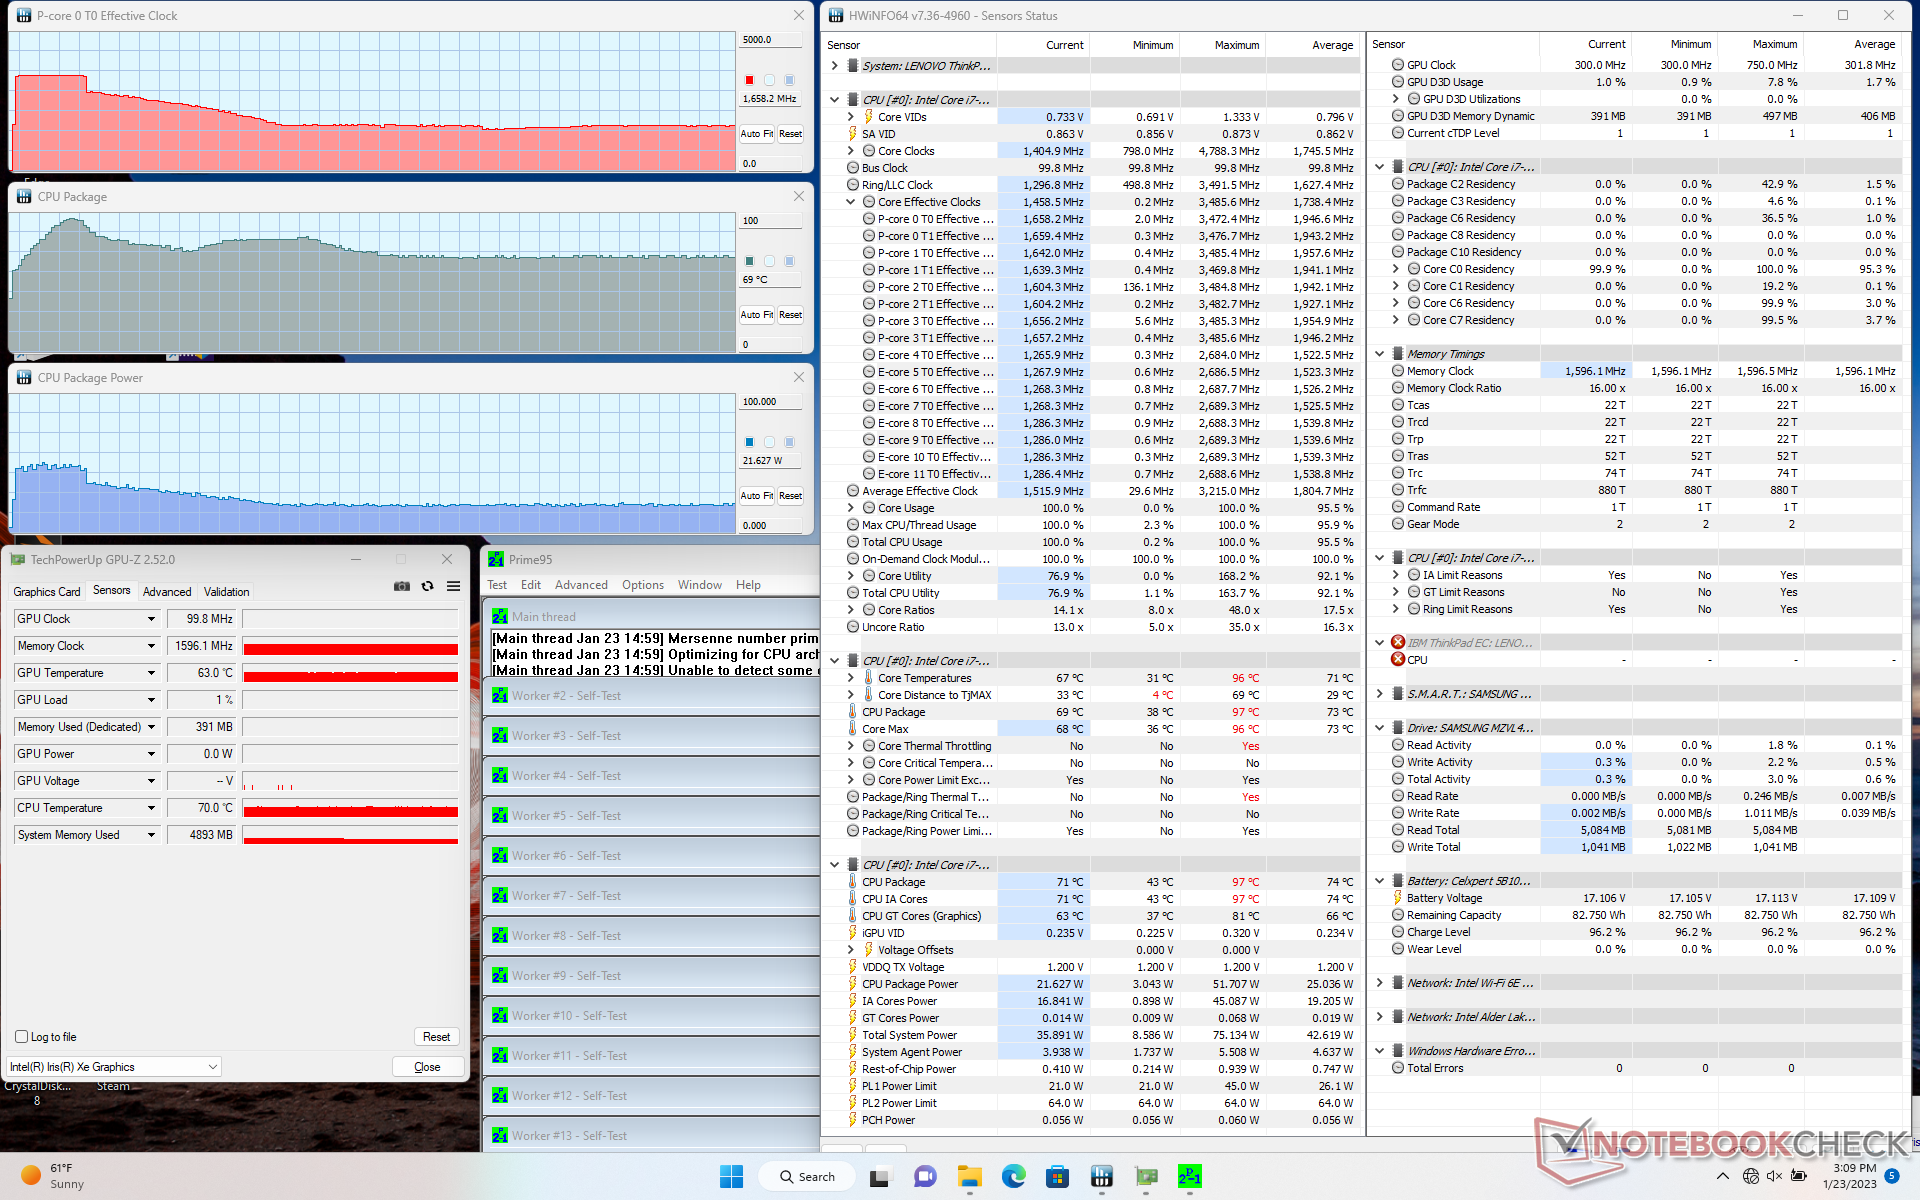
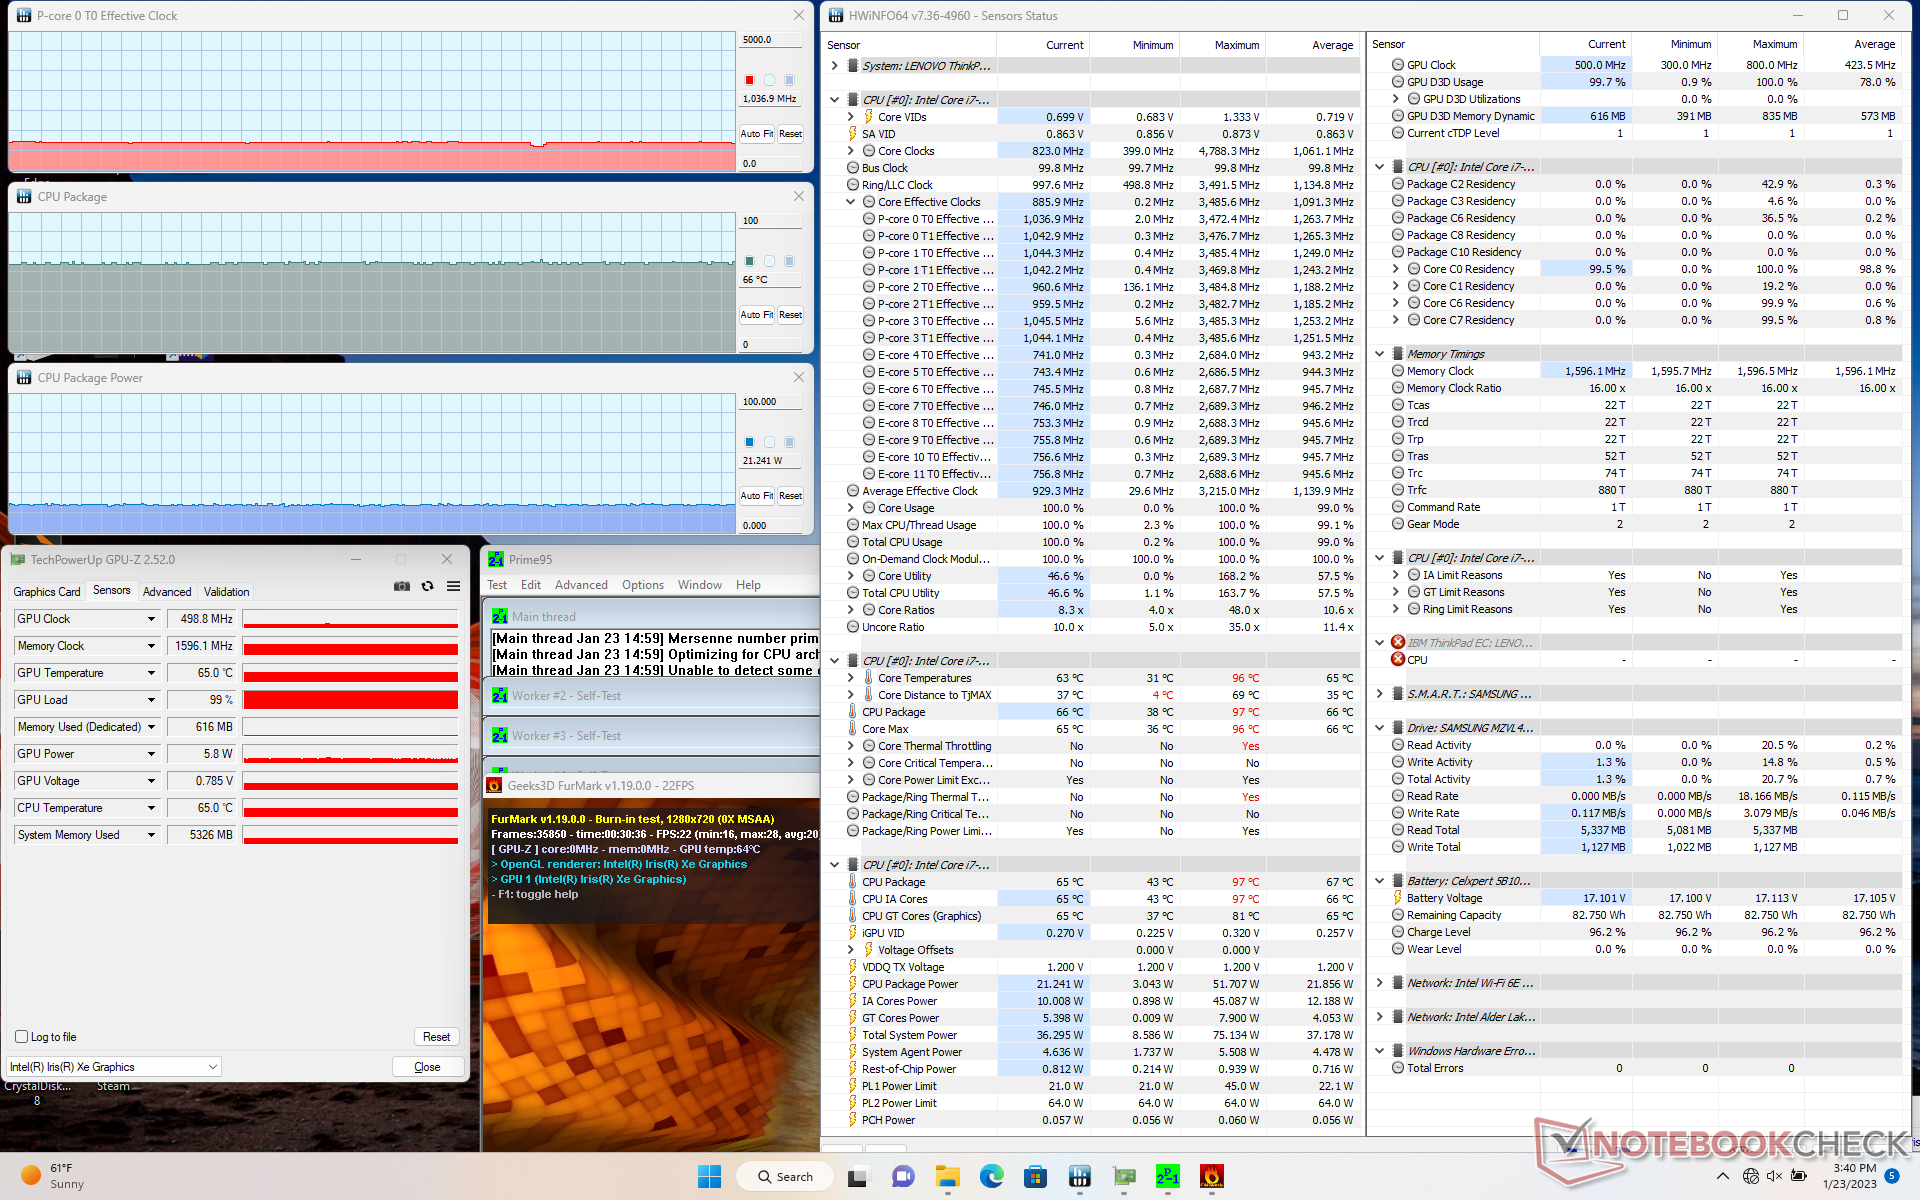
| CPU-klocka (GHz) | GPU-klocka (MHz) | Genomsnittlig CPU-temperatur (°C) | |
| Systemets tomgång | -- | -- | 31 |
| Prime95 Stress | 1.7 | -- | 69 |
| Prime95 + FurMark Stress | 1.0 | 499 | 66 |
| Witcher 3 Stress | ~1,3 | 998 | 67 |
Högtalare
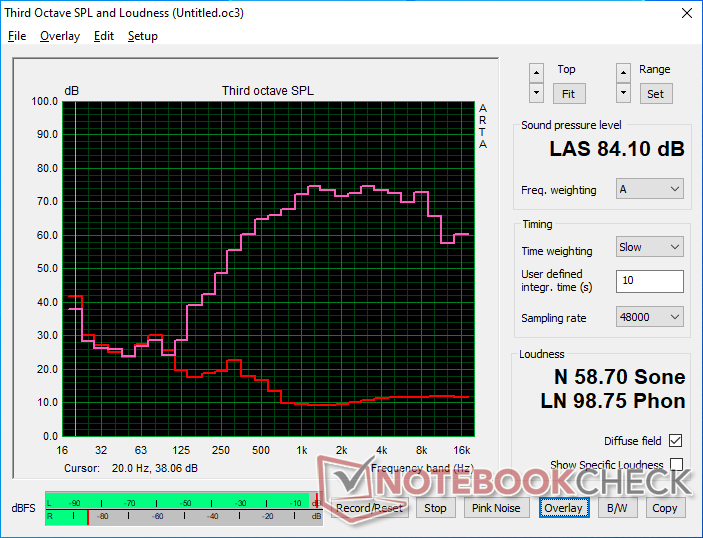
Lenovo ThinkPad T16 Gen 1 Core i7-1270P ljudanalys
(+) | högtalare kan spela relativt högt (84.1 dB)
Bas 100 - 315 Hz
(-) | nästan ingen bas - i genomsnitt 26.3% lägre än medianen
(±) | linjäriteten för basen är genomsnittlig (11.1% delta till föregående frekvens)
Mellan 400 - 2000 Hz
(+) | balanserad mellan - endast 4.5% från medianen
(+) | mids är linjära (5.1% delta till föregående frekvens)
Högsta 2 - 16 kHz
(±) | högre toppar - i genomsnitt 5.8% högre än medianen
(+) | toppar är linjära (4.8% delta till föregående frekvens)
Totalt 100 - 16 000 Hz
(±) | linjäriteten för det totala ljudet är genomsnittlig (20.1% skillnad mot median)
Jämfört med samma klass
» 42% av alla testade enheter i den här klassen var bättre, 10% liknande, 47% sämre
» Den bästa hade ett delta på 7%, genomsnittet var 21%, sämst var 53%
Jämfört med alla testade enheter
» 52% av alla testade enheter var bättre, 8% liknande, 40% sämre
» Den bästa hade ett delta på 4%, genomsnittet var 24%, sämst var 134%
Apple MacBook Pro 16 2021 M1 Pro ljudanalys
(+) | högtalare kan spela relativt högt (84.7 dB)
Bas 100 - 315 Hz
(+) | bra bas - bara 3.8% från medianen
(+) | basen är linjär (5.2% delta till föregående frekvens)
Mellan 400 - 2000 Hz
(+) | balanserad mellan - endast 1.3% från medianen
(+) | mids är linjära (2.1% delta till föregående frekvens)
Högsta 2 - 16 kHz
(+) | balanserade toppar - endast 1.9% från medianen
(+) | toppar är linjära (2.7% delta till föregående frekvens)
Totalt 100 - 16 000 Hz
(+) | det totala ljudet är linjärt (4.6% skillnad mot median)
Jämfört med samma klass
» 0% av alla testade enheter i den här klassen var bättre, 0% liknande, 100% sämre
» Den bästa hade ett delta på 5%, genomsnittet var 17%, sämst var 45%
Jämfört med alla testade enheter
» 0% av alla testade enheter var bättre, 0% liknande, 100% sämre
» Den bästa hade ett delta på 4%, genomsnittet var 24%, sämst var 134%
Energiförvaltning
Effektförbrukning
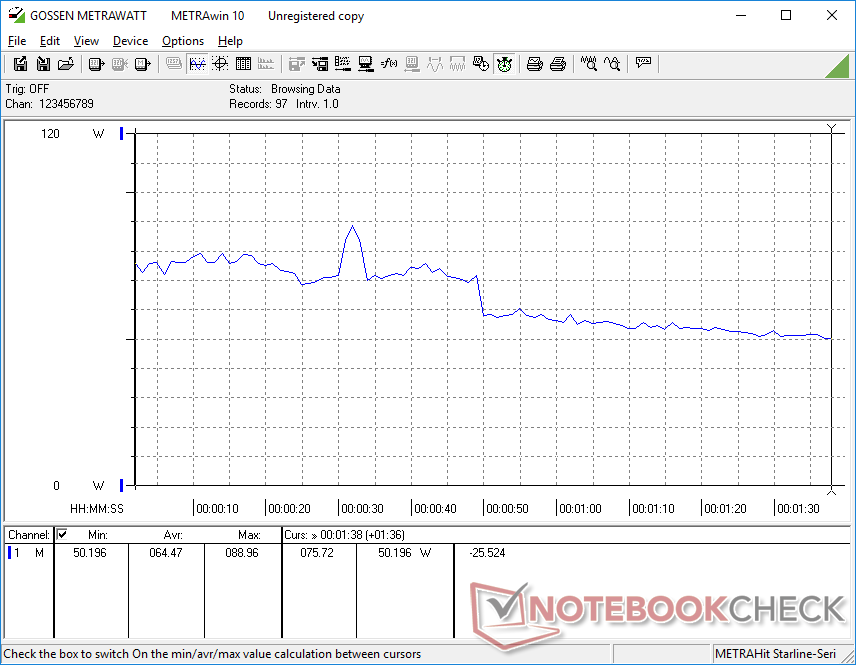
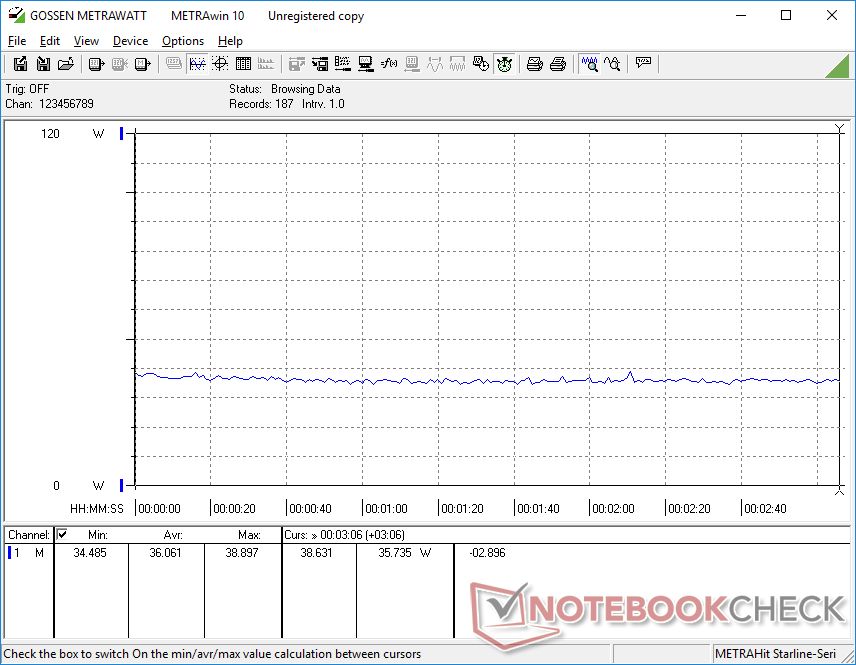
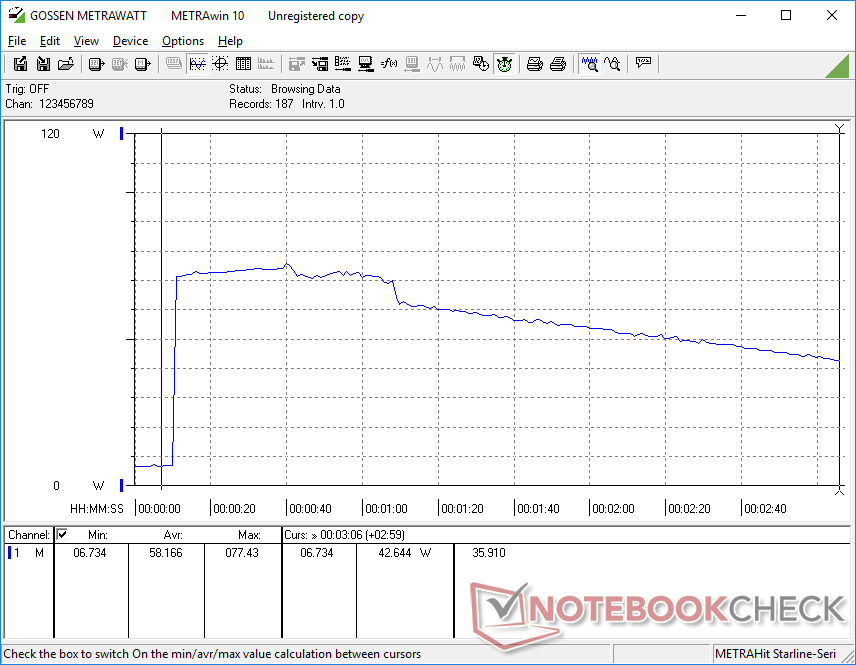
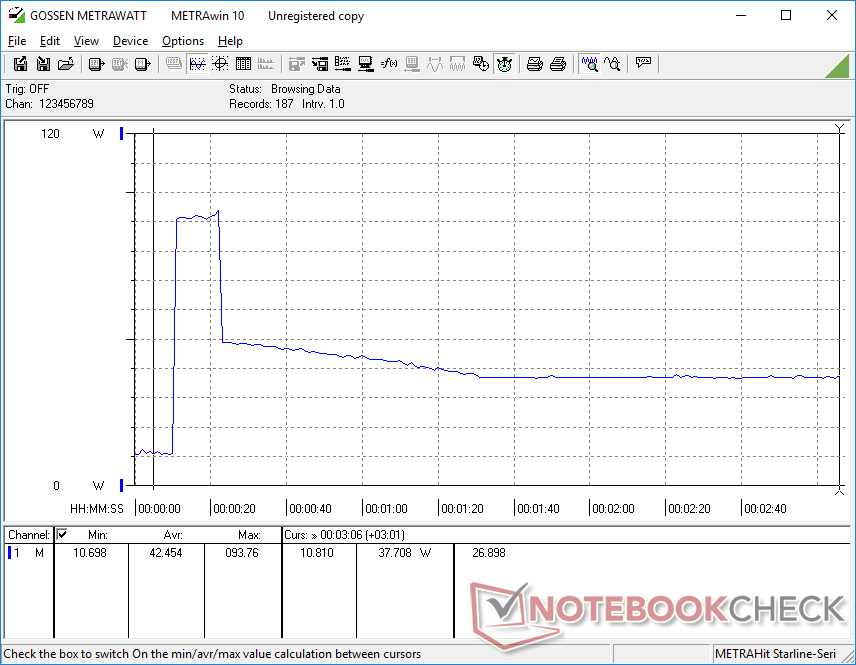
Strömförbrukningen vid högre belastning återspeglar våra observationer om klockfrekvens och prestanda ovan. Den kan nämligen vara hög under de första stunderna av belastning innan den faller ner till lägre nivåer på grund av prestandadämpning. När Prime95 körs, till exempel, skulle förbrukningen vara hög på omkring 77 W i ungefär 60 sekunder innan den faller till 42 W eller lägre med tiden. Detta skulle inträffa även om man ställde in läget Hög prestanda.
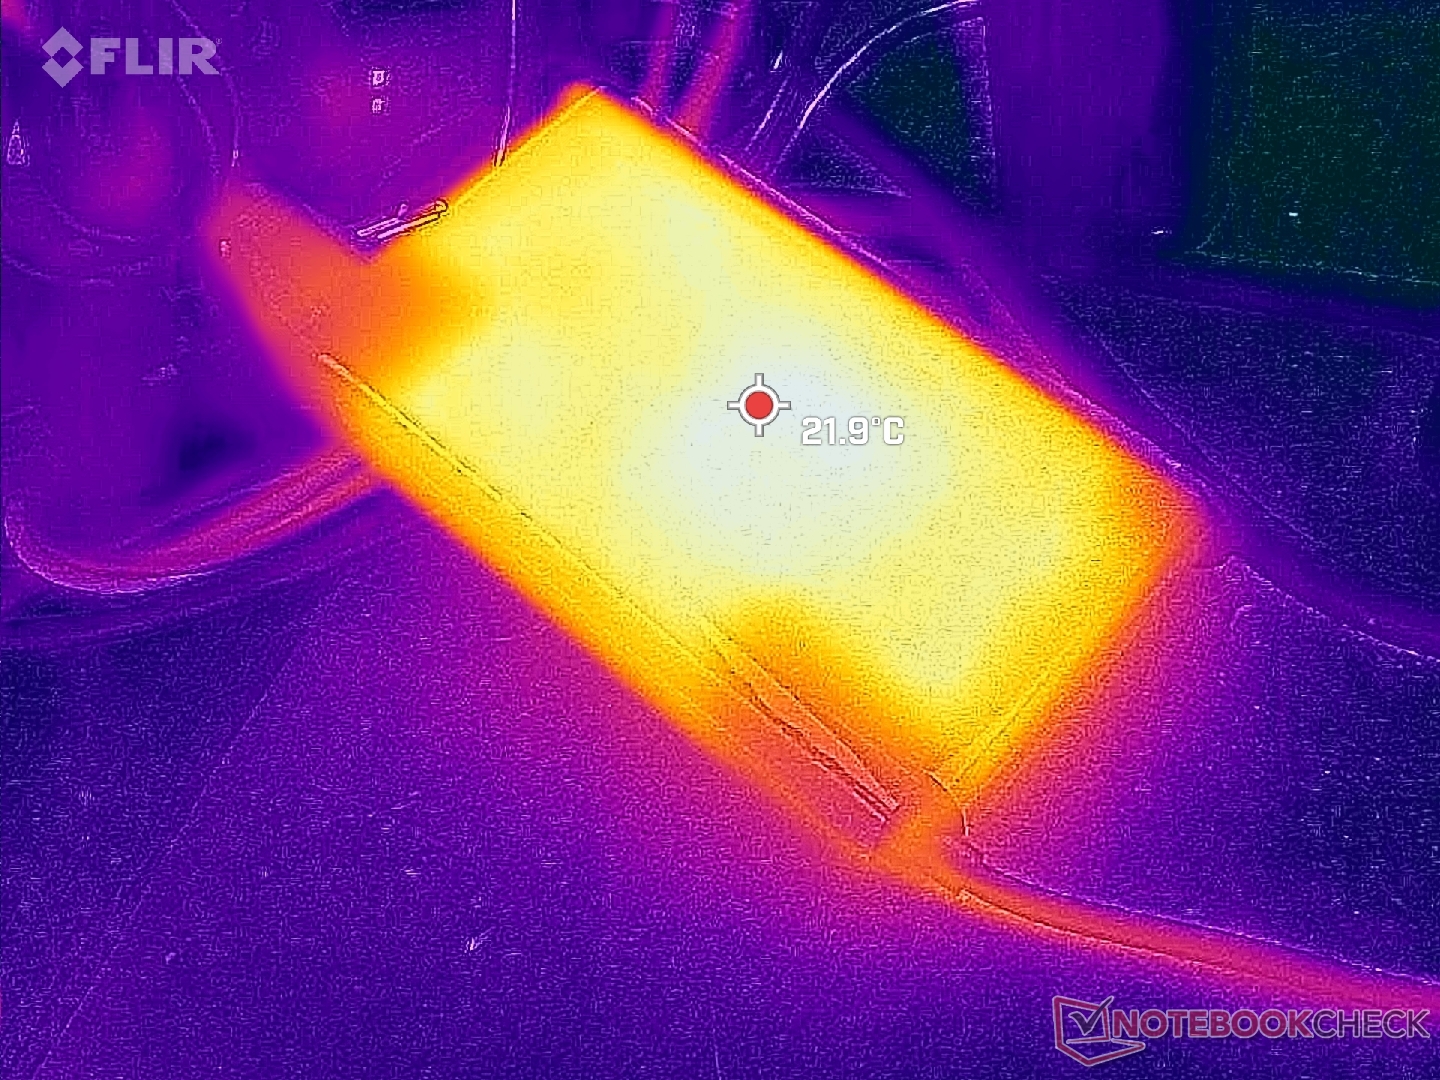
Vi kan registrera ett maximalt uttag på 94 W från den små-medelstora (~14,6 x 7,7 x 2,5 cm) 135 W USB-C-växelströmsadaptern när CPU och integrerad GPU var och en är 100 procent utnyttjad. Den här hastigheten är dock bara tillfällig, vilket framgår av grafen nedan. Den relativt höga overheadkostnaden gör det möjligt för den bärbara datorn att driva mer krävande Thunderbolt-enheter som vissa dockningsstationer och bildskärmar. Lenovo erbjuder en mindre och mer portabel 65 W AC-adapter som ett alternativ.
| Av/Standby | |
| Låg belastning | |
| Hög belastning |
|
Förklaring:
min: | |
| Lenovo ThinkPad T16 Gen 1 Core i7-1270P i7-1270P, Iris Xe G7 96EUs, Samsung PM9B1 512GB MZAL4512HBLU, IPS, 1920x1200, 16" | Lenovo ThinkPad T16 G1 21BWS00200 i5-1240P, Iris Xe G7 80EUs, Samsung PM9A1 MZVL2512HCJQ, IPS, 1920x1200, 16" | LG Gram 16Z90Q i7-1260P, Iris Xe G7 96EUs, Samsung PM9A1 MZVL21T0HCLR, IPS, 2560x1600, 16" | HP EliteBook 865 G9 R7 PRO 6850U, Radeon 680M, Samsung PM991 MZVLQ512HBLU, IPS, 1920x1200, 16" | Huawei MateBook 16s i7 i7-12700H, Iris Xe G7 96EUs, Silicon Motion PCIe-8 SSD, IPS, 2520x1680, 16" | Apple MacBook Pro 16 2021 M1 Pro M1 Pro, M1 Pro 16-Core GPU, Apple SSD AP1024R, Mini-LED, 3456x2234, 16.2" | |
|---|---|---|---|---|---|---|
| Power Consumption | 21% | -3% | -21% | -45% | -34% | |
| Idle Minimum * (Watt) | 3.5 | 2.9 17% | 5 -43% | 5.3 -51% | 6.8 -94% | 5 -43% |
| Idle Average * (Watt) | 7.4 | 6 19% | 8 -8% | 12.8 -73% | 13.2 -78% | 15.1 -104% |
| Idle Maximum * (Watt) | 10.7 | 6.9 36% | 14 -31% | 14.1 -32% | 13.8 -29% | 15.5 -45% |
| Load Average * (Watt) | 64.5 | 27.3 58% | 47 27% | 48.5 25% | 75.2 -17% | 54 16% |
| Witcher 3 ultra * (Watt) | 36.1 | 42.6 -18% | 37.8 -5% | 48.7 -35% | 56.1 -55% | |
| Load Maximum * (Watt) | 93.8 | 81.53 13% | 56 40% | 56.6 40% | 90.6 3% | 90 4% |
* ... mindre är bättre
Power Consumption Witcher 3 / Stresstest
Power Consumption external Monitor
Batteritid - Webbsurfning hela dagen
WLAN-körtiden är betydligt kortare än vad vi noterade på Core i5-versionen av Thinkpad T16 G1, vilket framgår av tabellen nedan. Vi såg till att köra testet med samma inställningar för balanserad strömprofil mellan de två konfigurationerna och resultaten förändrades inte. Trots detta är 8 timmars användning av surfning i den verkliga världen troligen tillräckligt för de flesta användare.
Att ladda från tom till full kapacitet tar cirka 90 minuter med den medföljande nätadaptern.
| Lenovo ThinkPad T16 Gen 1 Core i7-1270P i7-1270P, Iris Xe G7 96EUs, 86 Wh | Lenovo ThinkPad T16 G1 21BWS00200 i5-1240P, Iris Xe G7 80EUs, 86 Wh | LG Gram 16Z90Q i7-1260P, Iris Xe G7 96EUs, 80 Wh | HP EliteBook 865 G9 R7 PRO 6850U, Radeon 680M, 76 Wh | Huawei MateBook 16s i7 i7-12700H, Iris Xe G7 96EUs, 84 Wh | Apple MacBook Pro 16 2021 M1 Pro M1 Pro, M1 Pro 16-Core GPU, 99.6 Wh | |
|---|---|---|---|---|---|---|
| Batteridrifttid | 76% | 26% | 88% | 1% | 111% | |
| WiFi v1.3 (h) | 8 | 14.1 76% | 10.1 26% | 15 88% | 8.1 1% | 16.9 111% |
| H.264 (h) | 10.4 | 18.5 | 9.3 | 17.5 | ||
| Load (h) | 3.5 | 2.6 | 1.8 | 1.9 | ||
| Reader / Idle (h) | 18.1 |
För
Emot
Bedömning - Inte för användare med extrem prestanda
Även om ThinkPad T16 G1 inte var avsedd för högpresterande användare är det ändå en besvikelse att se så branta CPU-avstängningar när man kör mer krävande belastningar. Drosslingen är tillräckligt betydande för att prestandan hos vår Core i7-1270P kan sjunka till att vara lika långsam som den billigare Core i5-1240P SKU:n efter en viss period. Ett sådant beteende innebär att Core i7-1270P-alternativet bara är bäst för korta utbrott av hög prestanda, till exempel när man startar program eller bearbetar bilder, snarare än för långvarig videokodning eller tungt grafikarbete där strypning kan ske över tid.
Ett inbyggt alternativ för att öka processorprestandan till priset av högre fläktljud och/eller varmare temperaturer skulle ha mildrat strypningen något.
Ryzen 5 Pro 6650U-alternativet erbjuder mer konsekvent prestanda än Core i7-1270P-alternativet. Prestationsbegränsning är tyngre när man konfigurerar med en CPU i Core P-serien.
Förutom processorn bör användarna också se upp med det långsamma systemets RAM-minne och vissa av de tillgängliga bildskärmsalternativen. Det förstnämnda påverkar grafikprestandan med upp till 10 procent medan vissa av panelerna kanske inte har de färger som krävs av grafiker. De konkurrerandeHP EliteBook 865 G9 är ett smalare alternativ med alternativ som inte finns på ThinkPad T16 G1, bland annat en ljusare 1000-nit-skärm och en 5 MP-kamera med högre upplösning.
Pris och tillgänglighet
ThinkPad T16 G1 levereras nu direkt från Lenovo från 1050 USD för baskonfigurationen Core i5-1235U till 2040 USD för Core i7-1270P-konfigurationen. Newegg och Amazon har också modellen i lager i olika konfigurationer som börjar på cirka 1 500 dollar om den är konfigurerad med Core i7-1270P.
Lenovo ThinkPad T16 Gen 1 Core i7-1270P
- 01/25/2023 v7 (old)
Allen Ngo
Genomskinlighet
Valet av enheter som ska granskas görs av vår redaktion. Testprovet gavs till författaren som ett lån av tillverkaren eller återförsäljaren för denna recension. Långivaren hade inget inflytande på denna recension och inte heller fick tillverkaren en kopia av denna recension innan publiceringen. Det fanns ingen skyldighet att publicera denna recension. Som ett oberoende medieföretag är Notebookcheck inte föremål för auktoritet från tillverkare, återförsäljare eller förlag.
This is how Notebookcheck is testingEvery year, Notebookcheck independently reviews hundreds of laptops and smartphones using standardized procedures to ensure that all results are comparable. We have continuously developed our test methods for around 20 years and set industry standards in the process. In our test labs, high-quality measuring equipment is utilized by experienced technicians and editors. These tests involve a multi-stage validation process. Our complex rating system is based on hundreds of well-founded measurements and benchmarks, which maintains objectivity.
Price comparison

