MSI Titan 18 HX A14VIG laptop recension: Drakens år

På CES 2023 frågade vi MSI om varför de inte hade någon 18-tums gaminglaptop på gång när Asus, Alienware och Razer alla lanserade sina egna respektive 18-tumserbjudanden. Det var inte förrän CES 2024 som vi äntligen såg en riktig 18-tums MSI-modell i form av Titan 18 HX. Den må vara lite sen till festen, men dess specifikationer och hårdvara är precis lika konkurrenskraftiga.
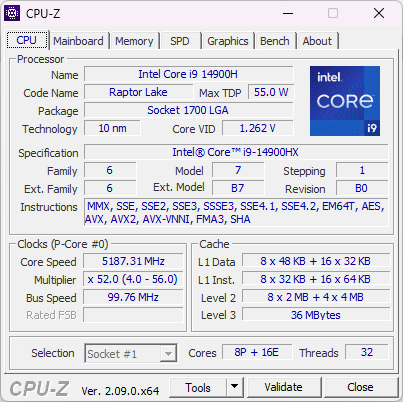
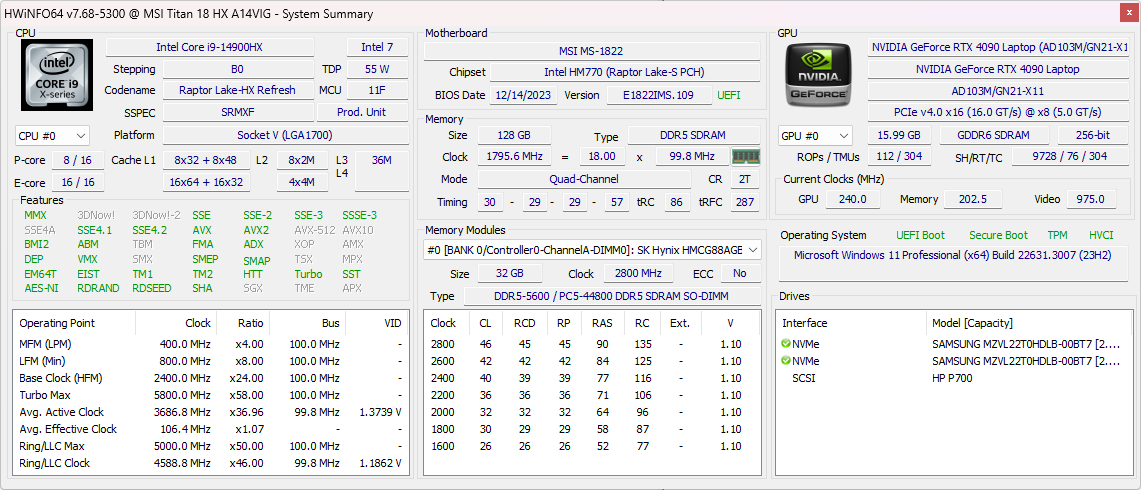
Vår testkonfiguration är utrustad med den nya 14:e generationens Intel Raptor Lake Core i9-14900HX CPU, 175 W GeForce RTX 4090 GPU och 120 Hz Mini-LED 4K-skärm (2400p) för cirka 4999 USD. Det finns inga mindre konfigurationer tillgängliga med andra processorer, GPU:er eller skärmar när detta skrivs.
Alternativ till Titan 18 HX inkluderar andra 18-tums bärbara speldatorer som Asus ROG Strix G18, Alienware m18, Razer Blade 18eller Acer Predator Helios 18.
Fler MSI recensioner:
Potentiella konkurrenter i jämförelse
Gradering | Datum | Modell | Vikt | Höjd | Storlek | Upplösning | Pris |
|---|---|---|---|---|---|---|---|
| 88.8 % v7 (old) | 01/2024 | MSI Titan 18 HX A14VIG i9-14900HX, GeForce RTX 4090 Laptop GPU | 3.6 kg | 32.1 mm | 18.00" | 3840x2400 | |
| 89 % v7 (old) | 02/2023 | MSI Titan GT77 HX 13VI i9-13950HX, GeForce RTX 4090 Laptop GPU | 3.5 kg | 23 mm | 17.30" | 3840x2160 | |
| 90.7 % v7 (old) | 04/2023 | Alienware m18 R1 i9-13980HX, GeForce RTX 4090 Laptop GPU | 3.9 kg | 26.7 mm | 18.00" | 1920x1200 | |
| 87.4 % v7 (old) | 03/2023 | Asus ROG Strix G18 G814JI i7-13650HX, GeForce RTX 4070 Laptop GPU | 3 kg | 31 mm | 18.00" | 2560x1600 | |
| 88.3 % v7 (old) | 10/2023 | Acer Predator Helios 18 N23Q2 i9-13900HX, GeForce RTX 4080 Laptop GPU | 3.2 kg | 29.15 mm | 18.00" | 2560x1600 | |
| 91.4 % v7 (old) | 02/2023 | Razer Blade 18 RTX 4070 i9-13950HX, GeForce RTX 4070 Laptop GPU | 3 kg | 21.9 mm | 18.00" | 2560x1600 |
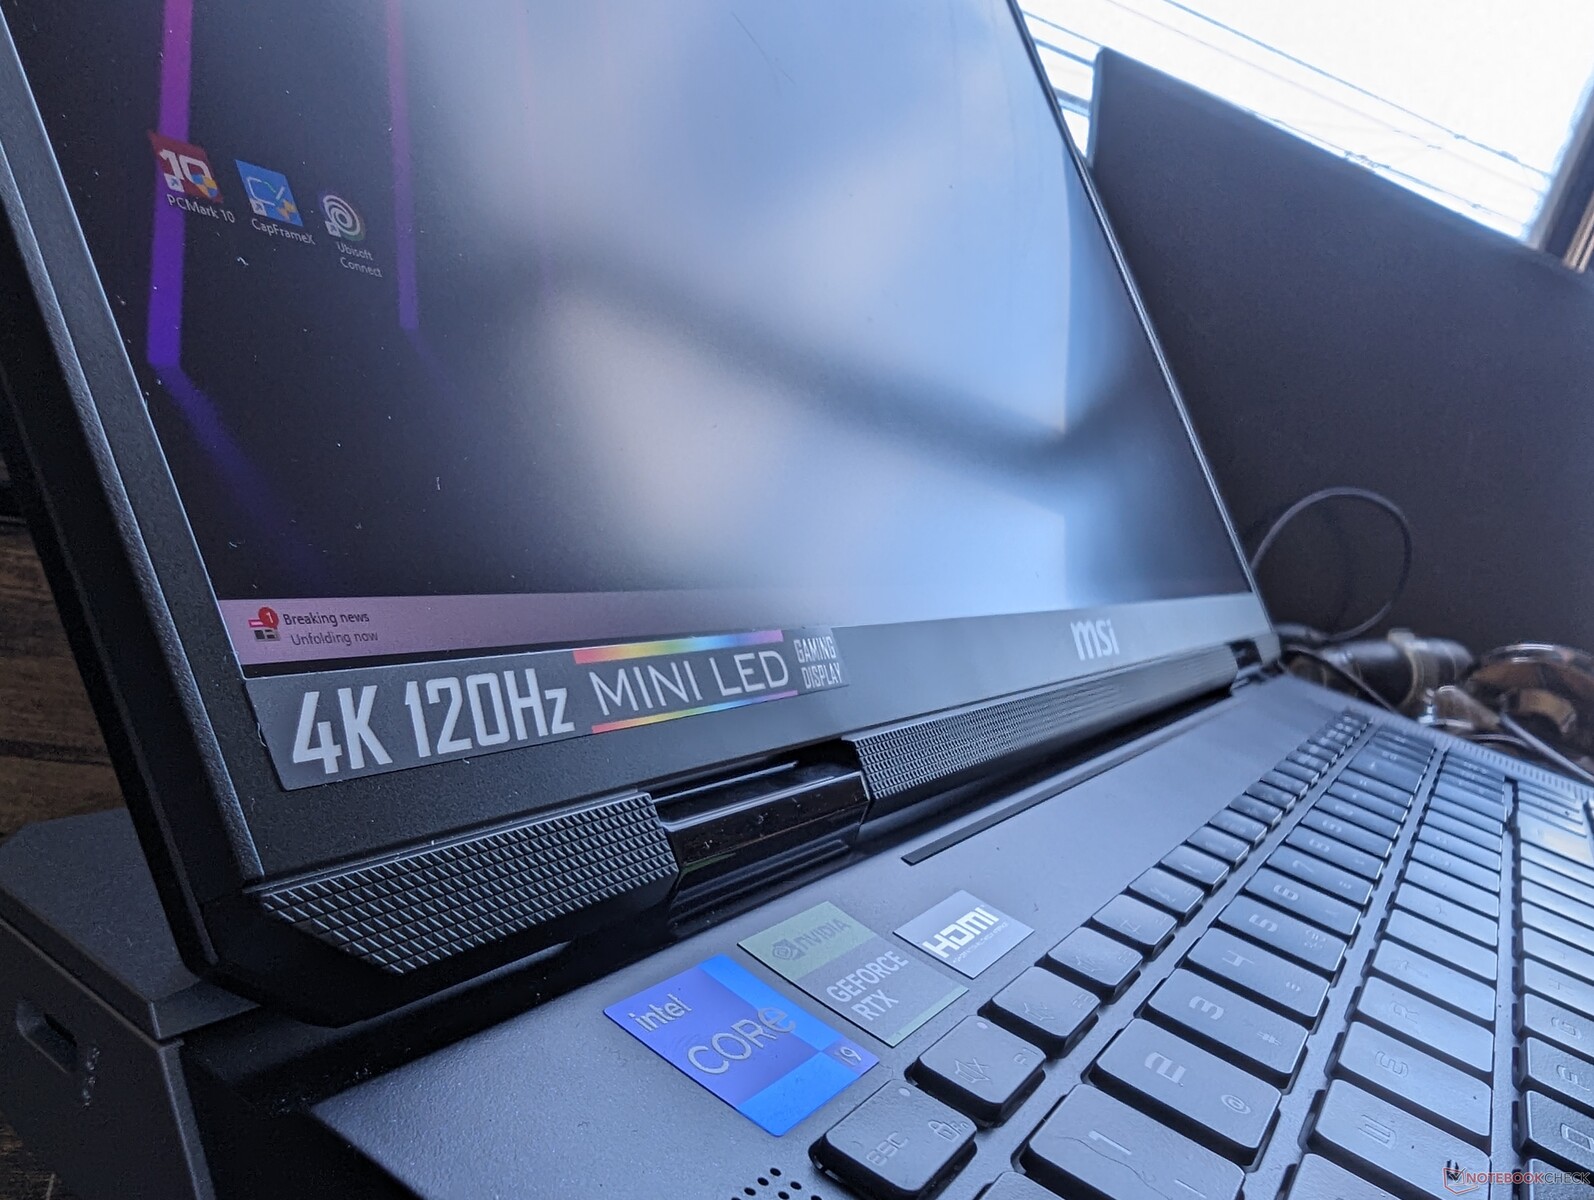
Fall - Färre RGB-lysdioder
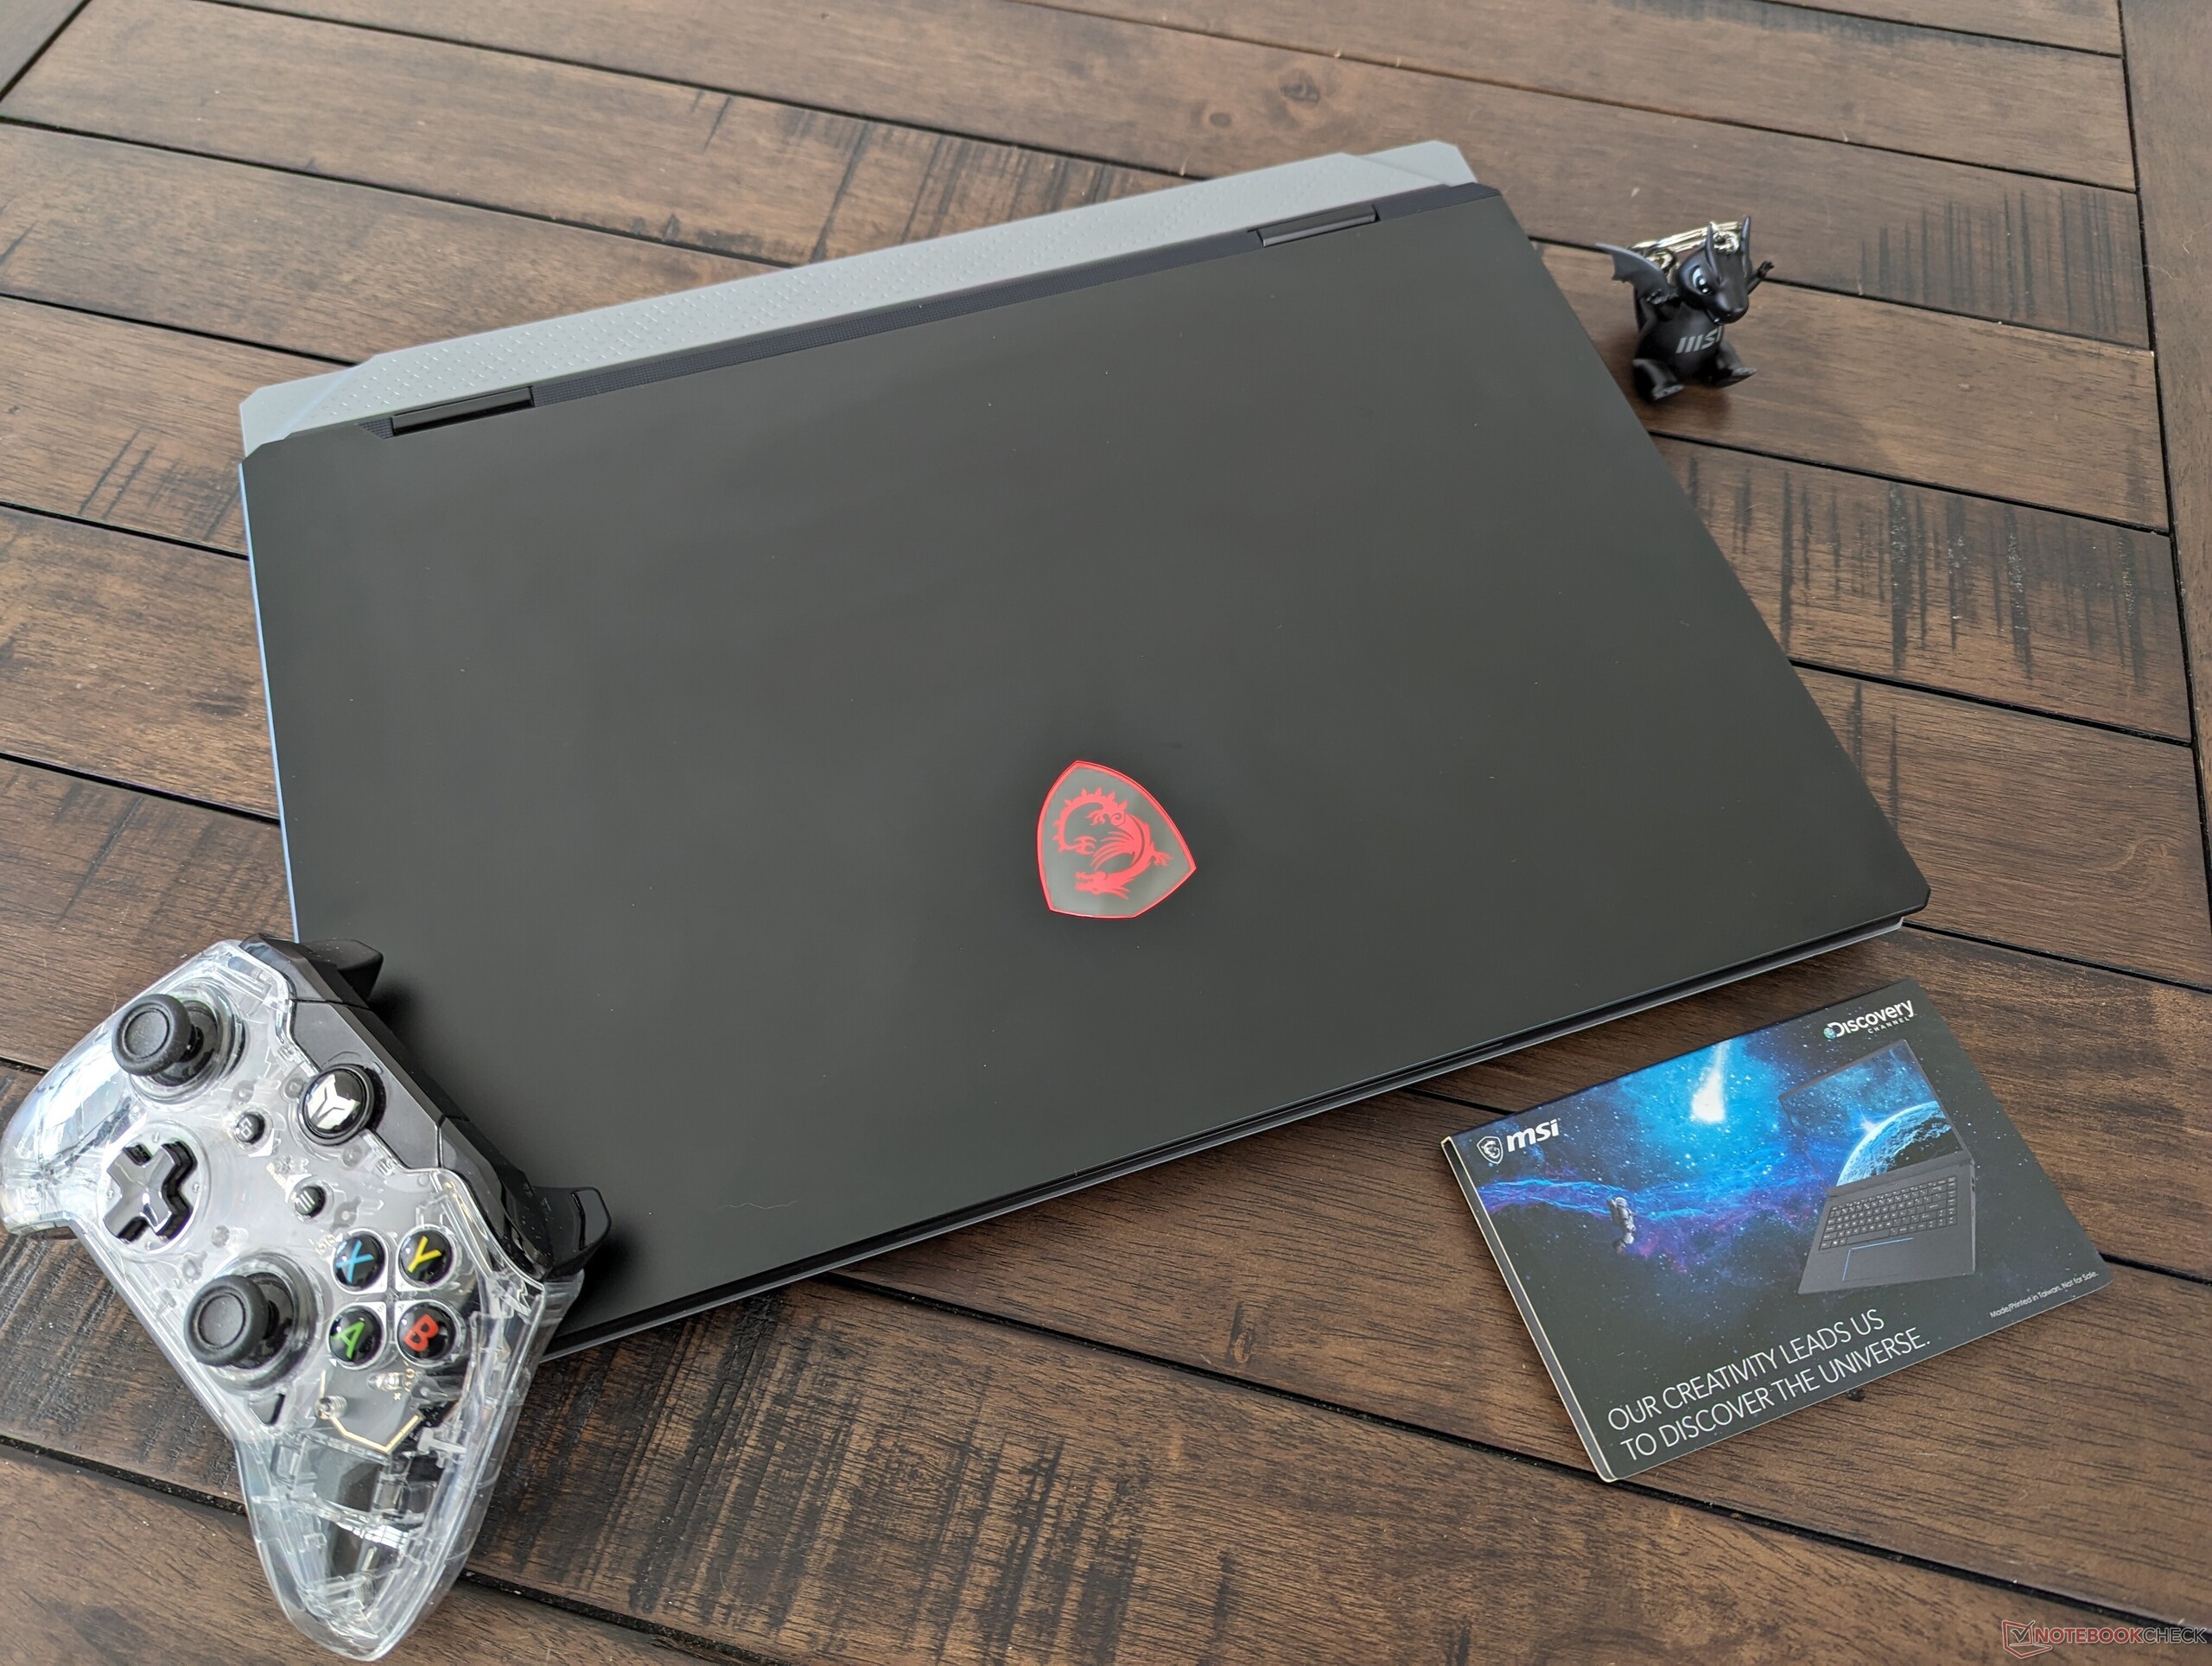
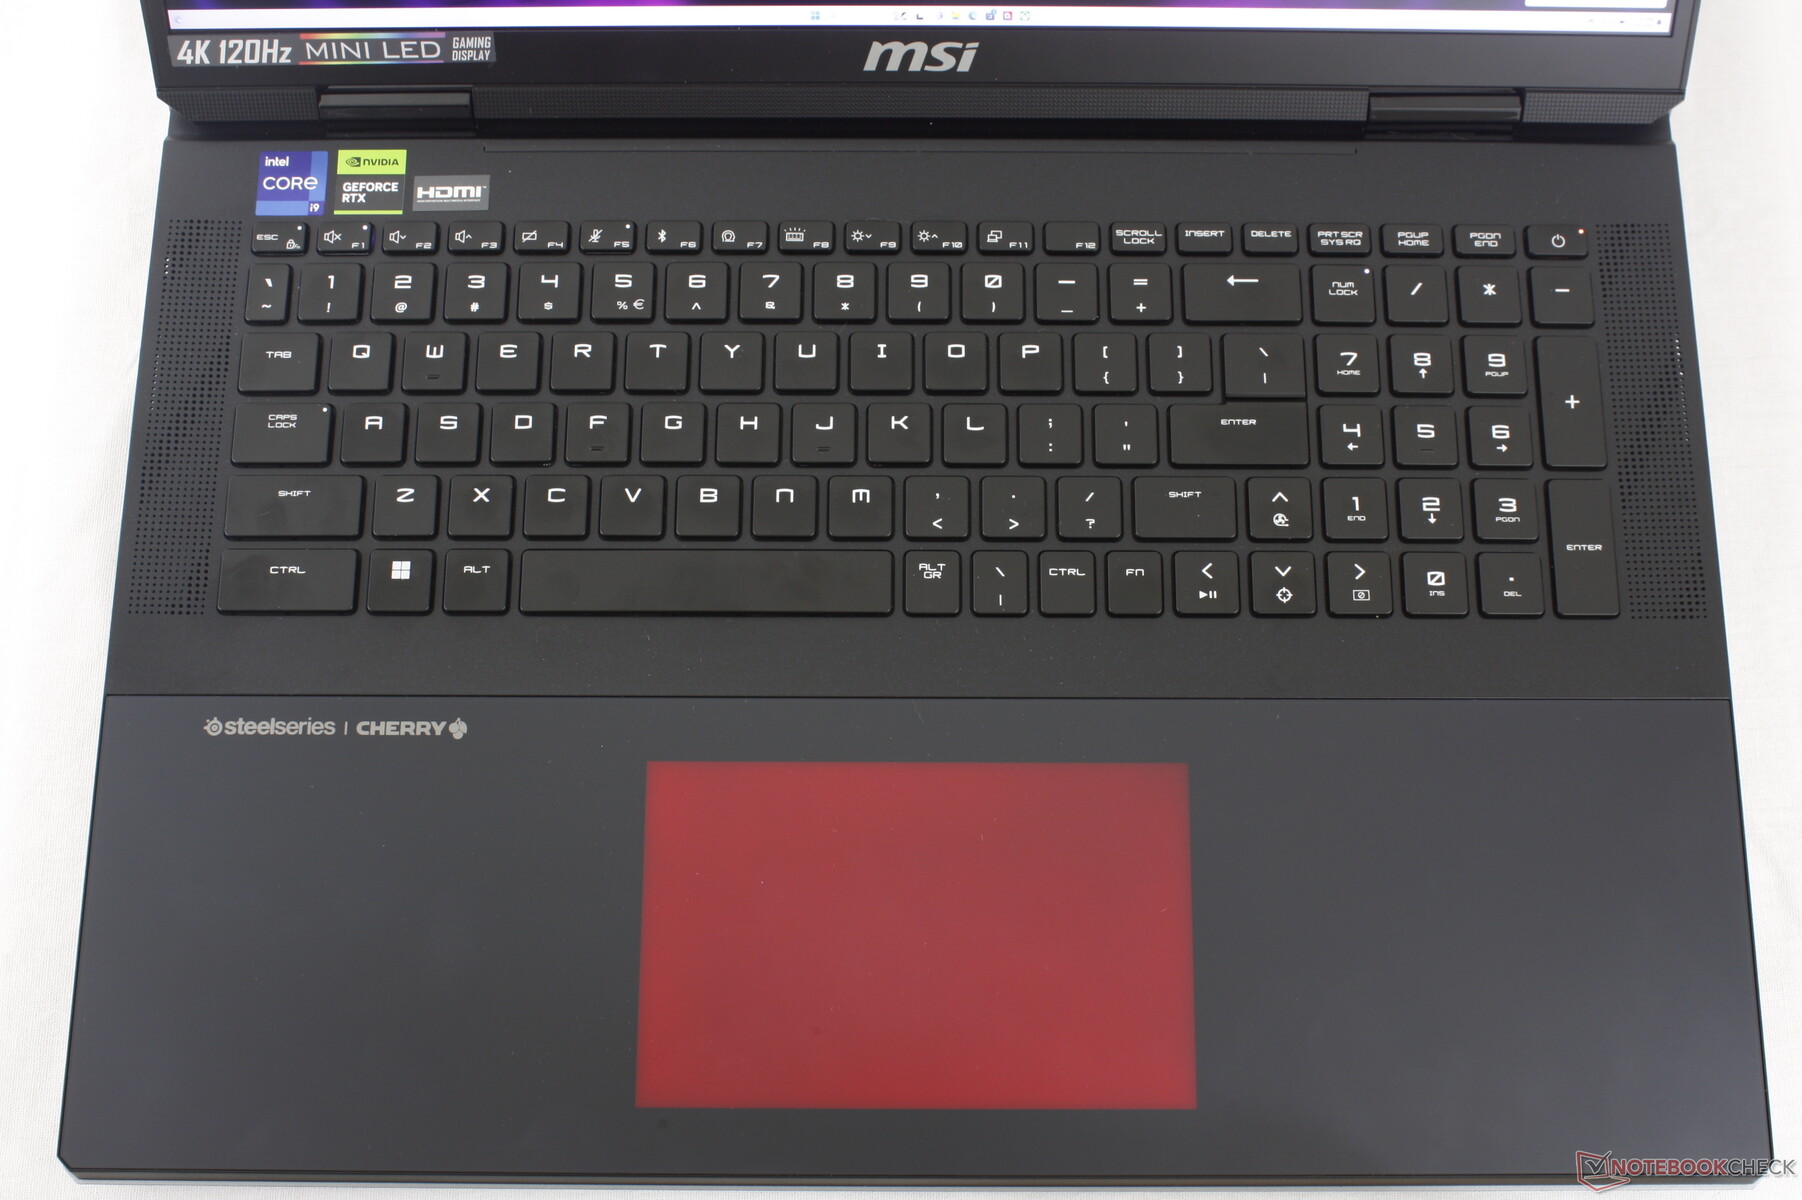
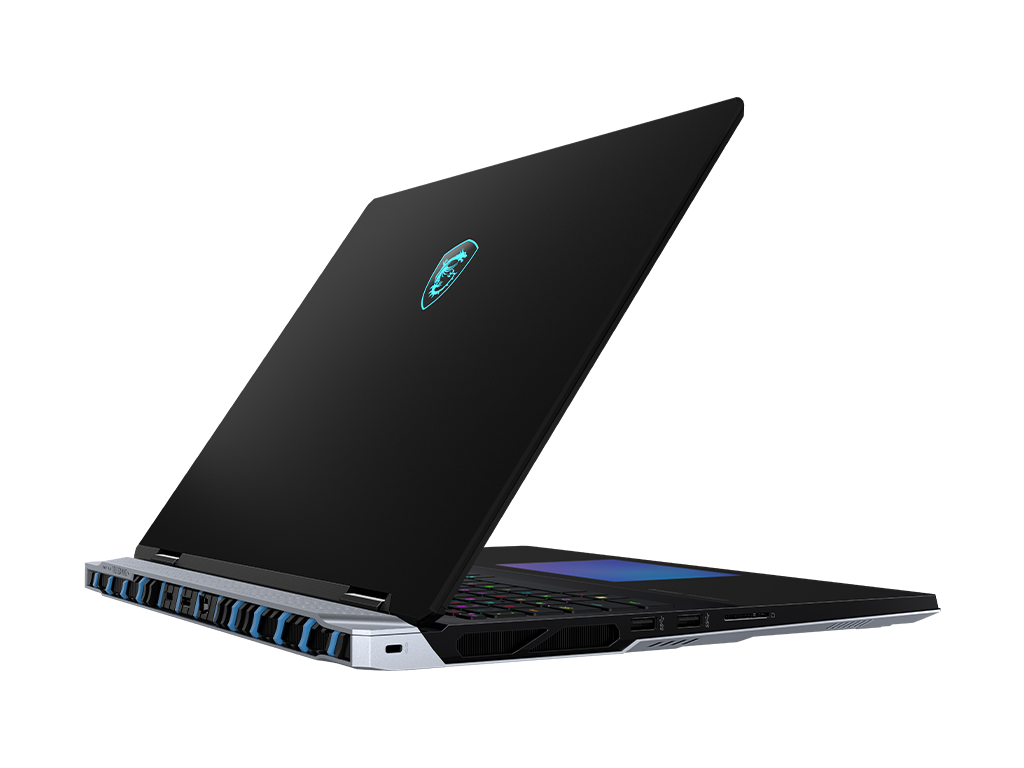
Det nya chassit är en vidareutveckling av Titan GT77 snarare än den flashigare och retroinspirerade GE78. Jämfört med GT77 har Titan 18 tvåtonade silver- och blåfärger som komplement till den annars jetsvarta exteriören. MSI undviker också "onödig" RGB-belysning genom att ta bort LED-stången längs baksidan.
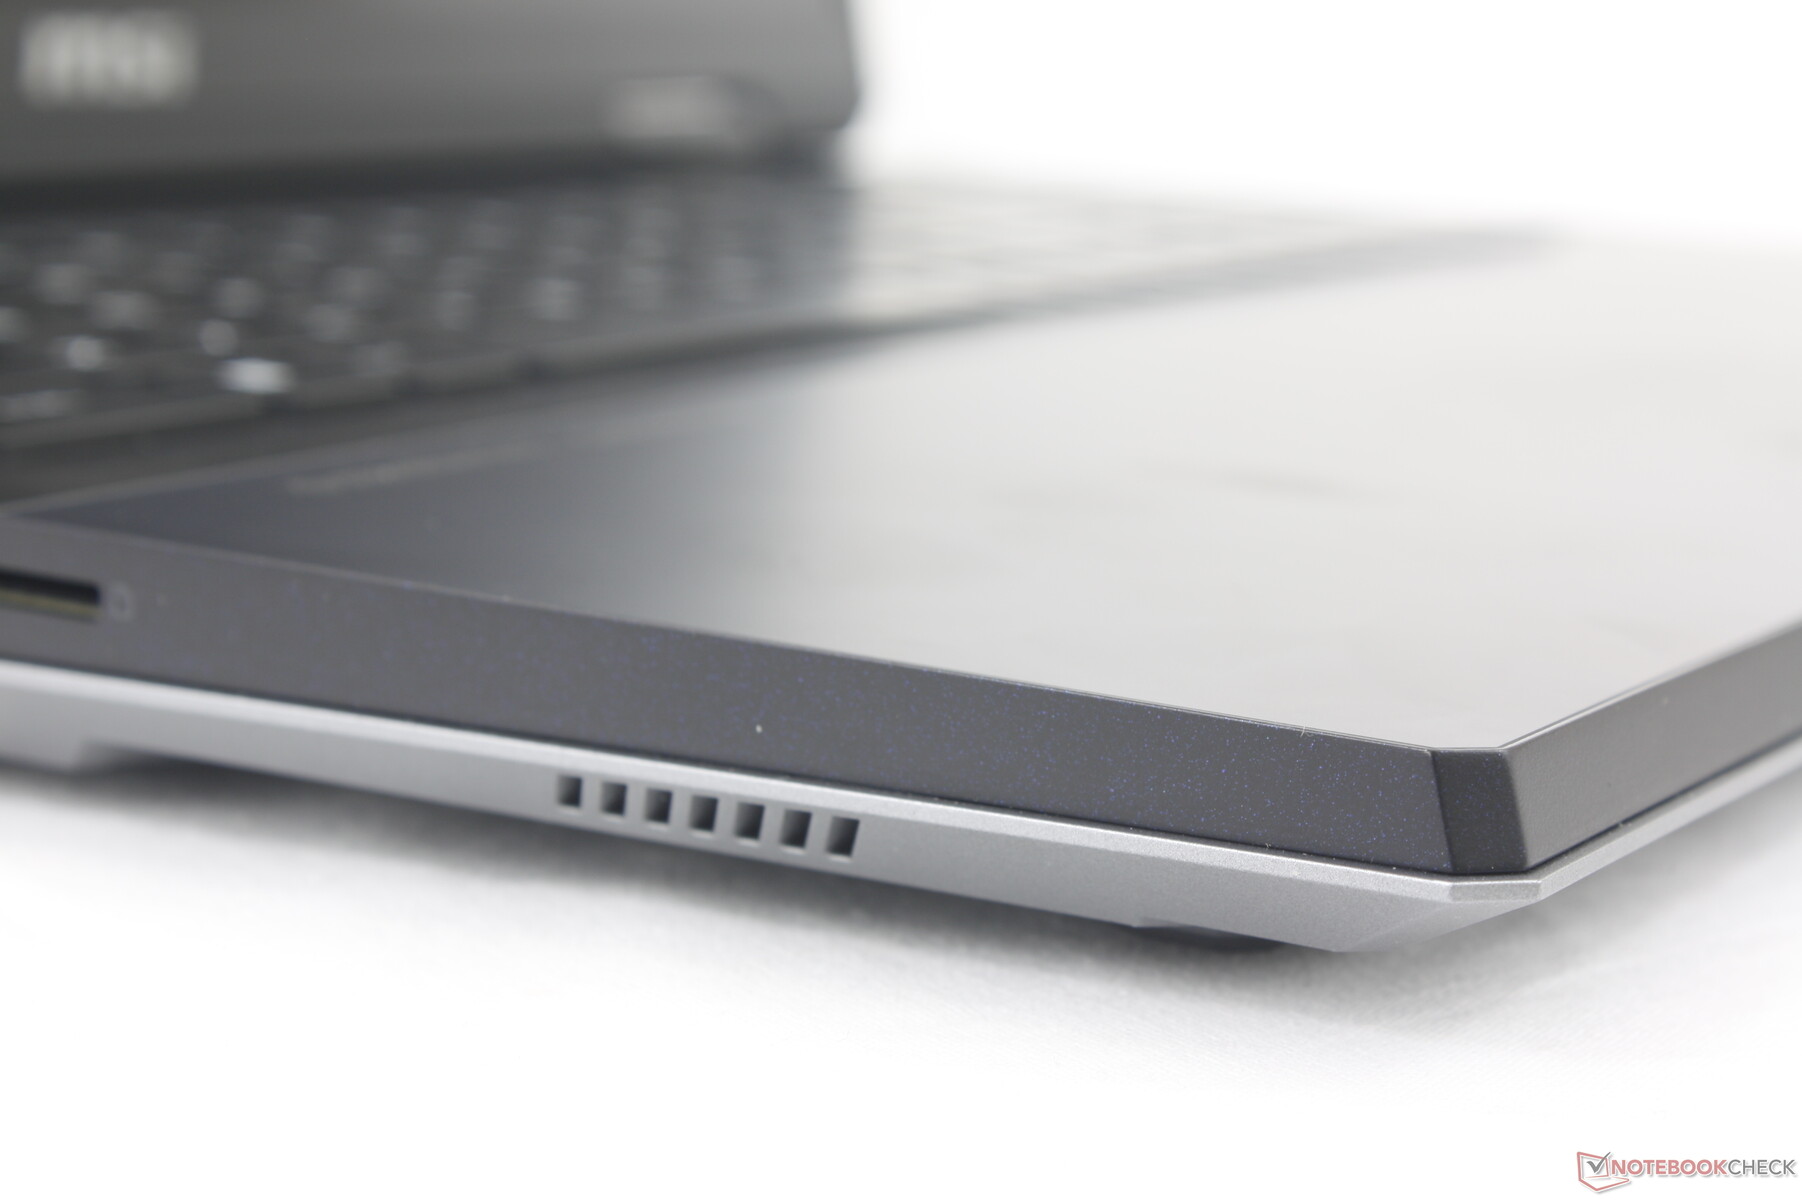
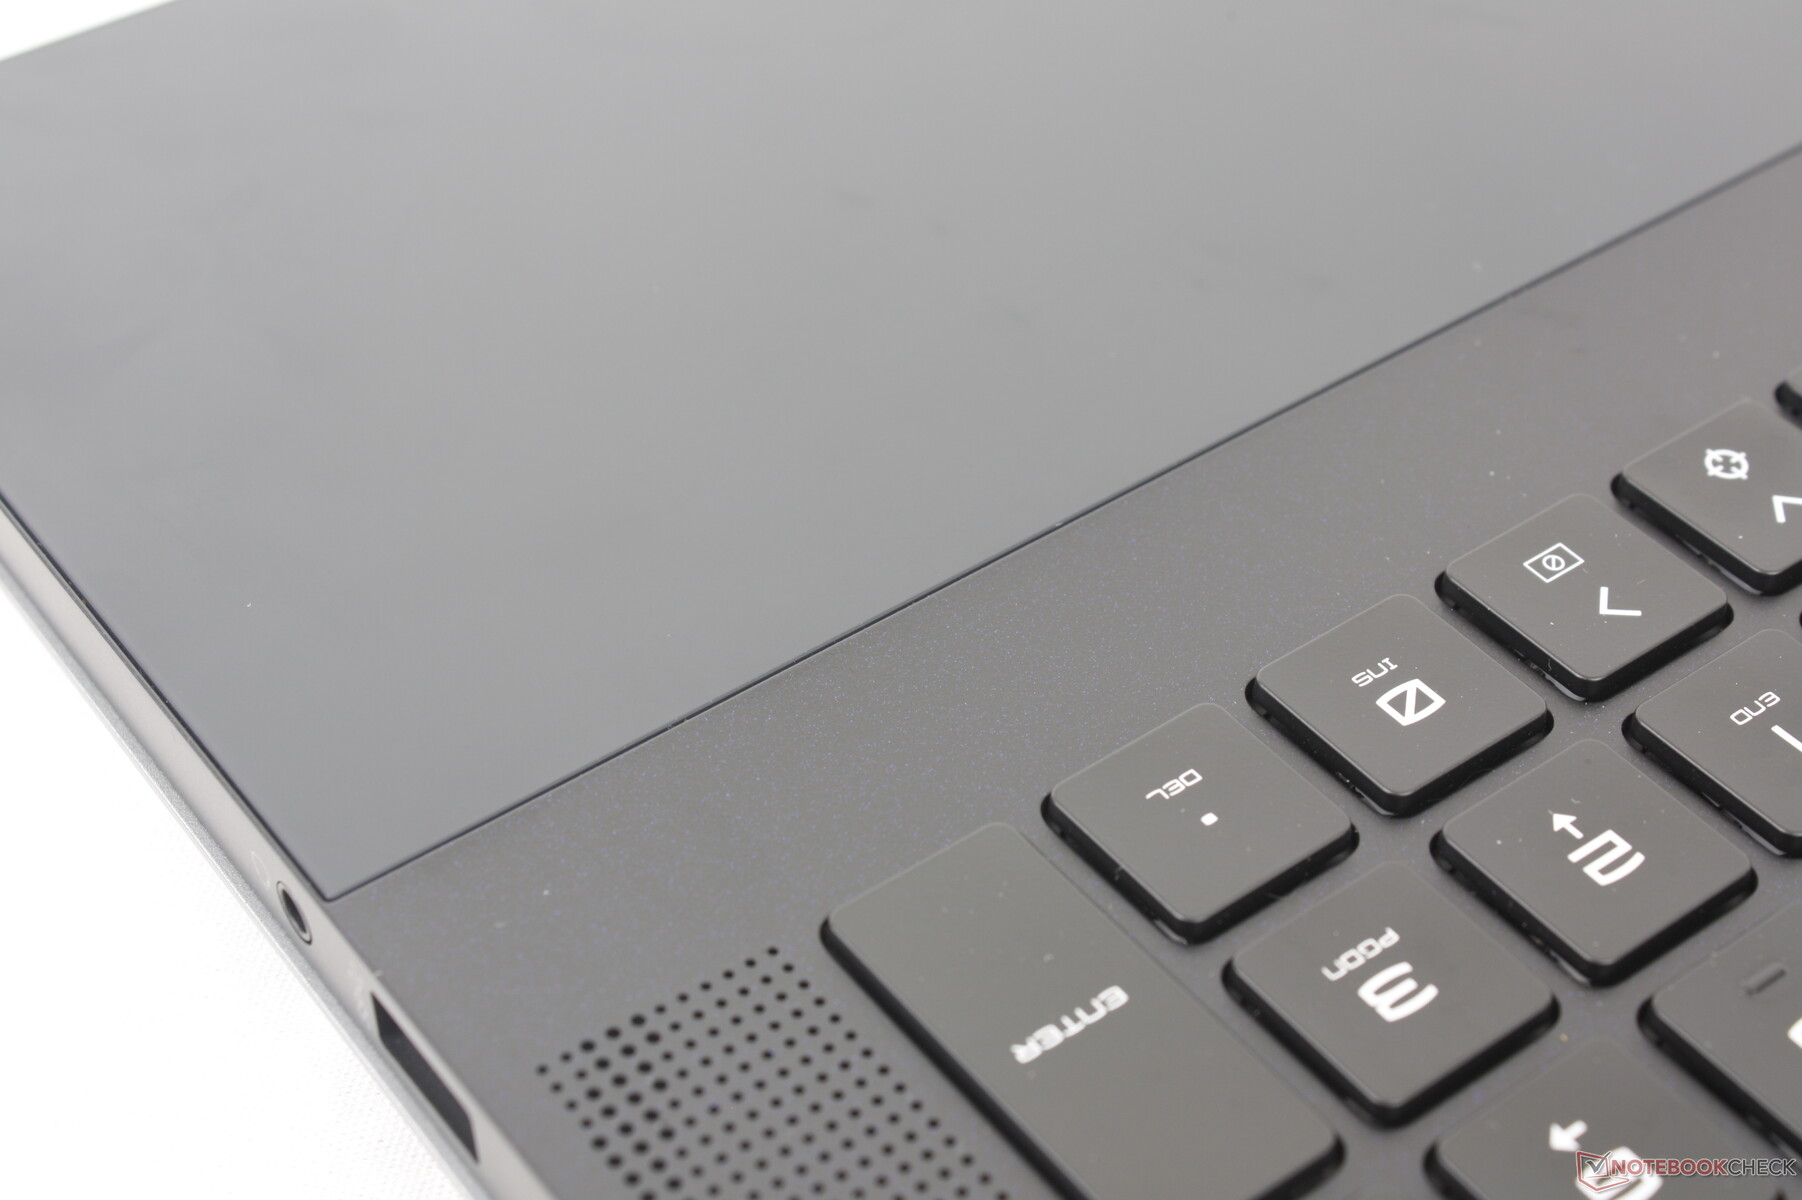
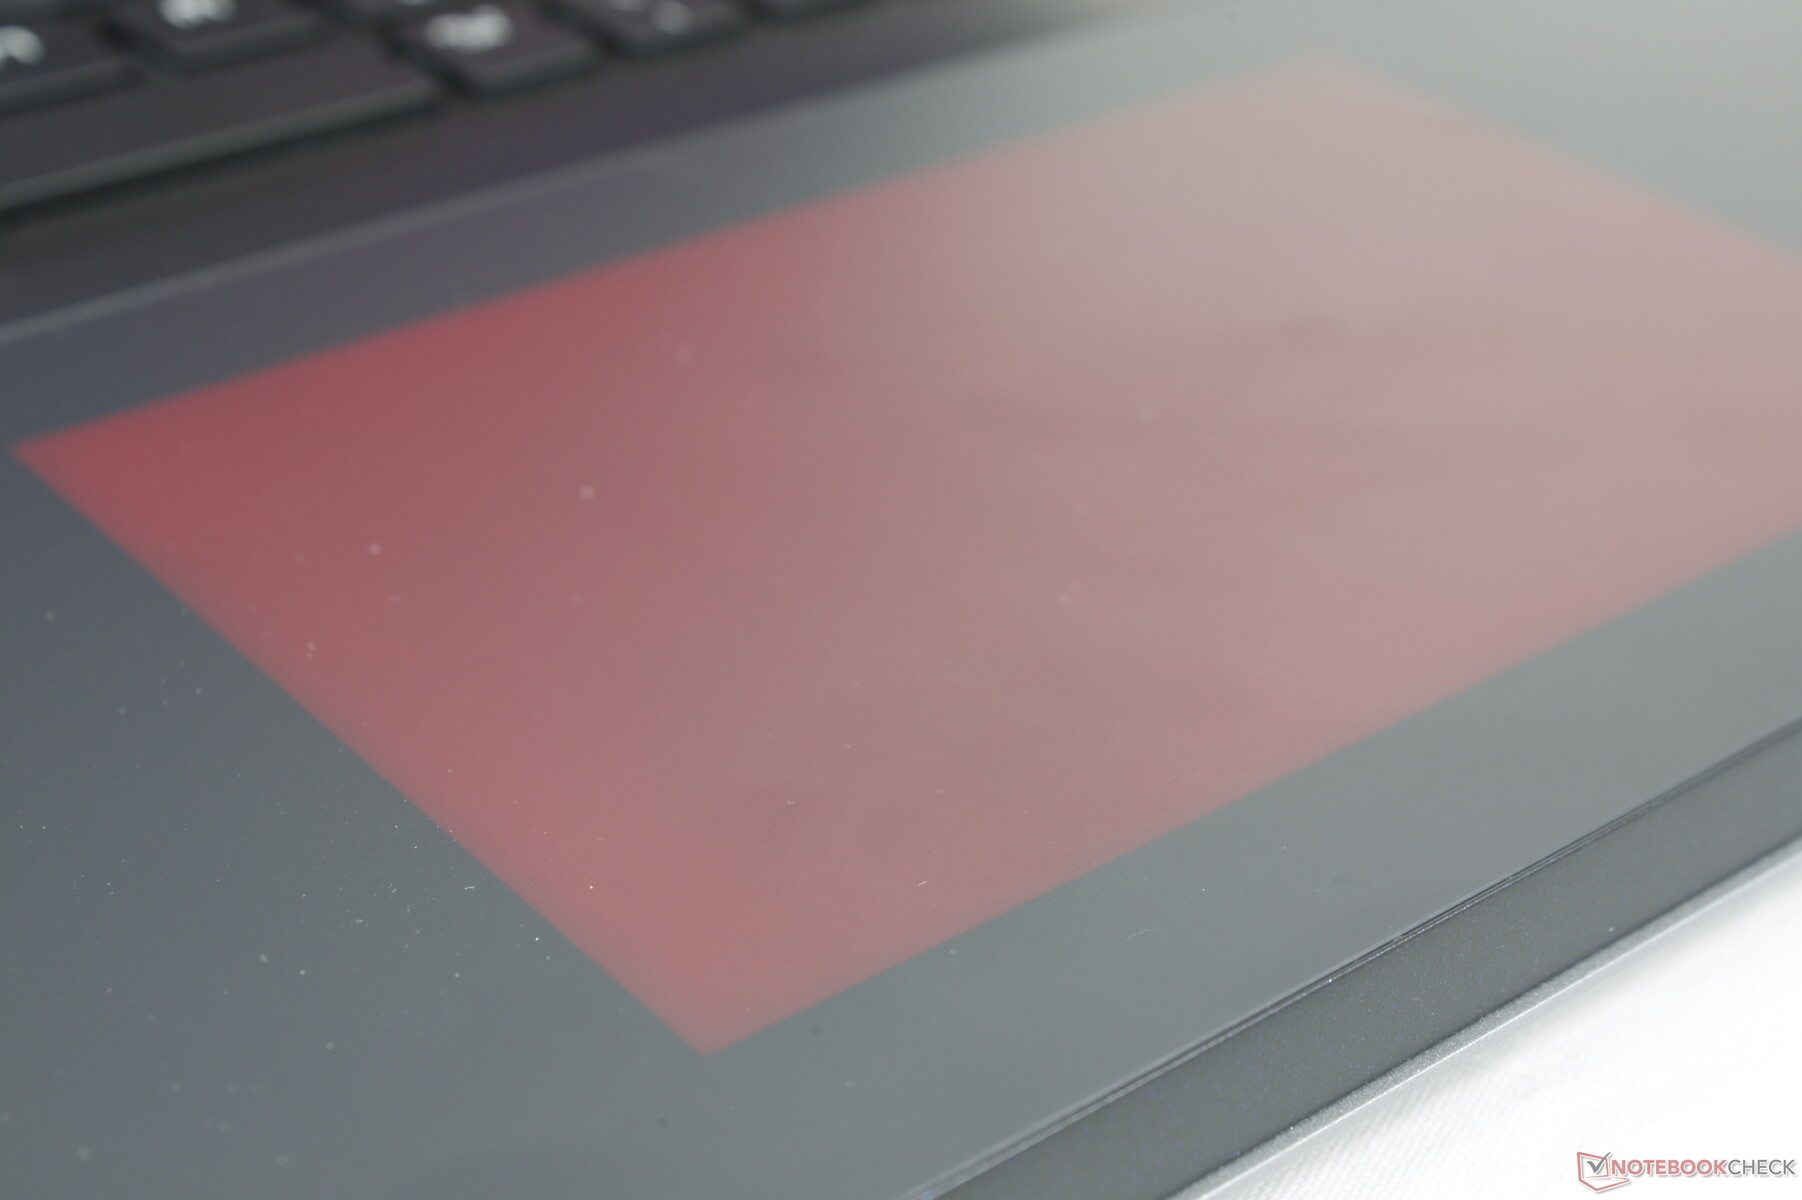
Den kanske mest igenkännbara aspekten av Titan 18 är det platta glaset som sträcker sig över handledsstöden och klickplattan. Klickplattan är därmed i jämnhöjd med handledsstöden och den är belyst med RGB-effekter. Slutresultatet är en snyggare och smidigare design som ändå behåller den avancerade gamer-estetiken.
Chassistyrkan från chassit i magnesium-aluminiumlegering är utmärkt med endast en mindre skevhet när man trycker ned tangentbordets mitt. Det känns verkligen lyxigare än de vanliga plastytorna på billigare MSI-modeller som Cyborg eller Katana. Gångjärnen kunde dock ha varit fastare för en bättre känsla av livslängd och hela systemet är en enda stor fingeravtrycksmagnet.
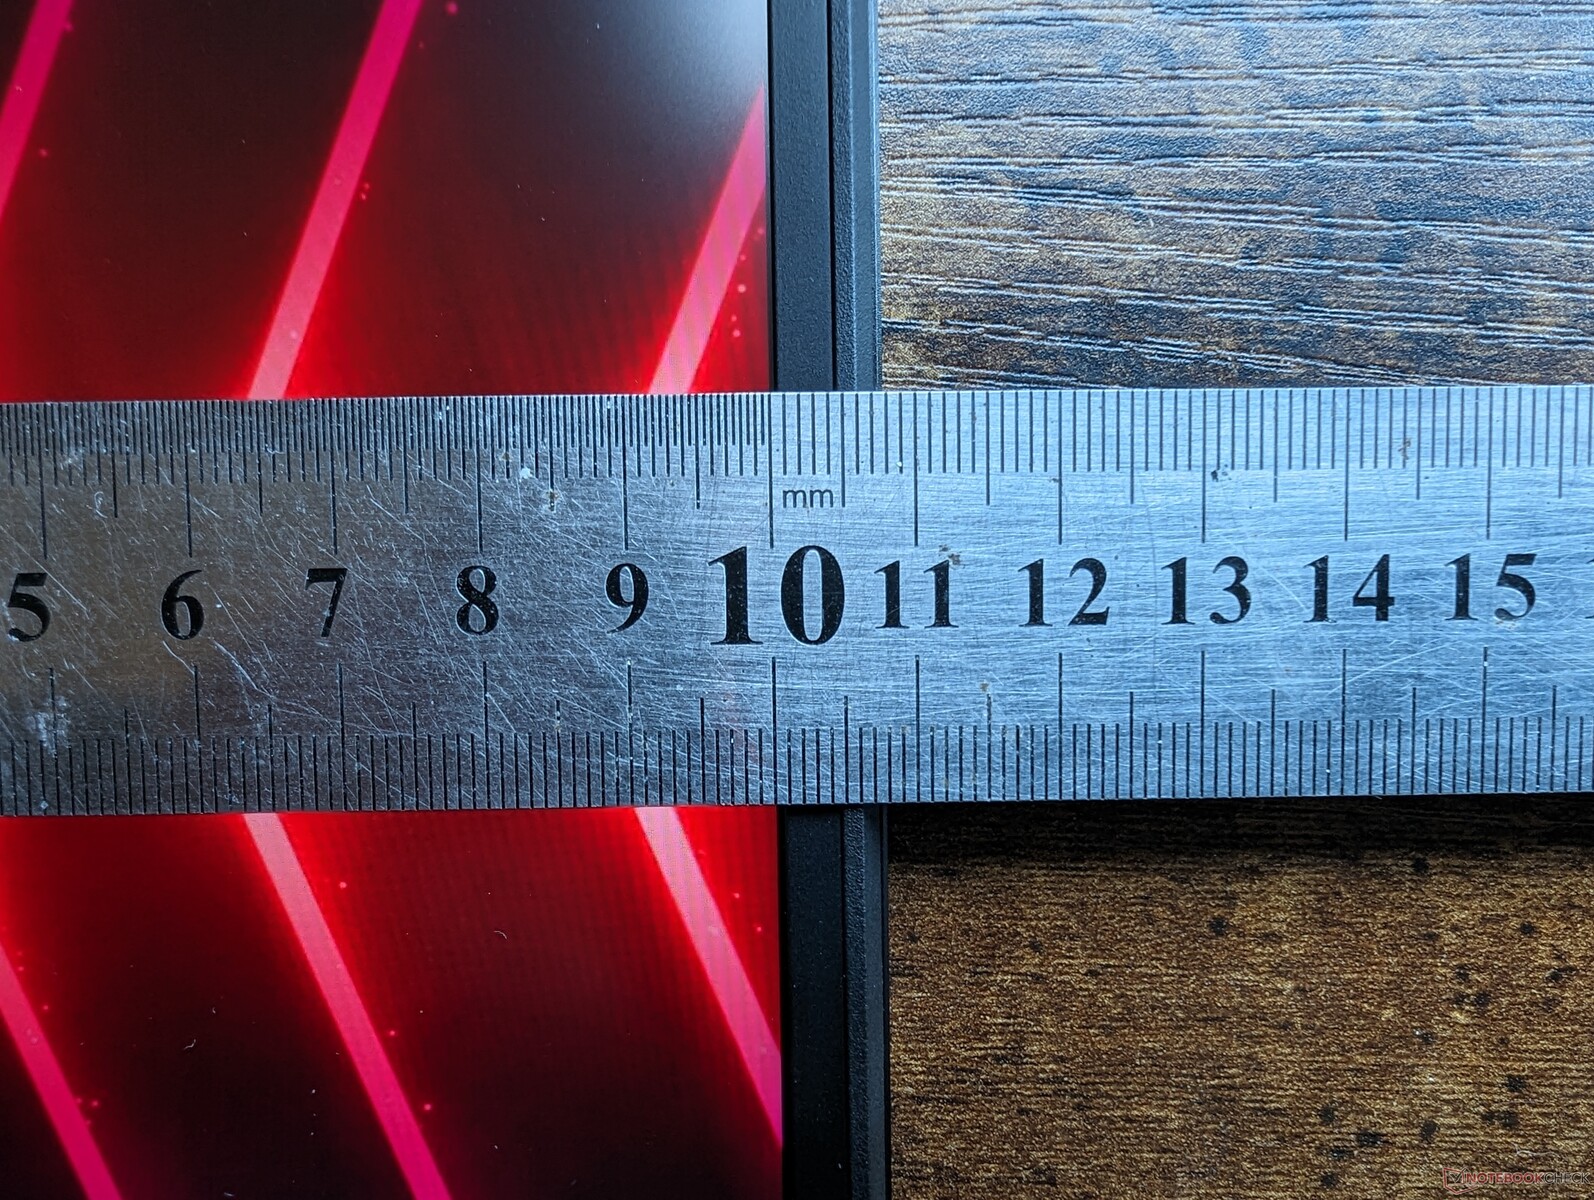
Framför allt har 16:10 18-tums Titan 18 HX ett mindre fotavtryck än 16:9 17,3-tums Titan GT77 på grund av dess kortare bakre ände. I gengäld är den nyare modellen märkbart tjockare med nästan 10 mm, vilket gör den till en av de tjockaste 18-tums gaming-laptops som finns tillgängliga. Det är inte nödvändigtvis den tyngsta eftersom den kronan går till Alienware m18 R1, men den är fortfarande märkbart tyngre än Asus ROG Strix G18 eller Razer Blade 18 med över 500 g vardera.
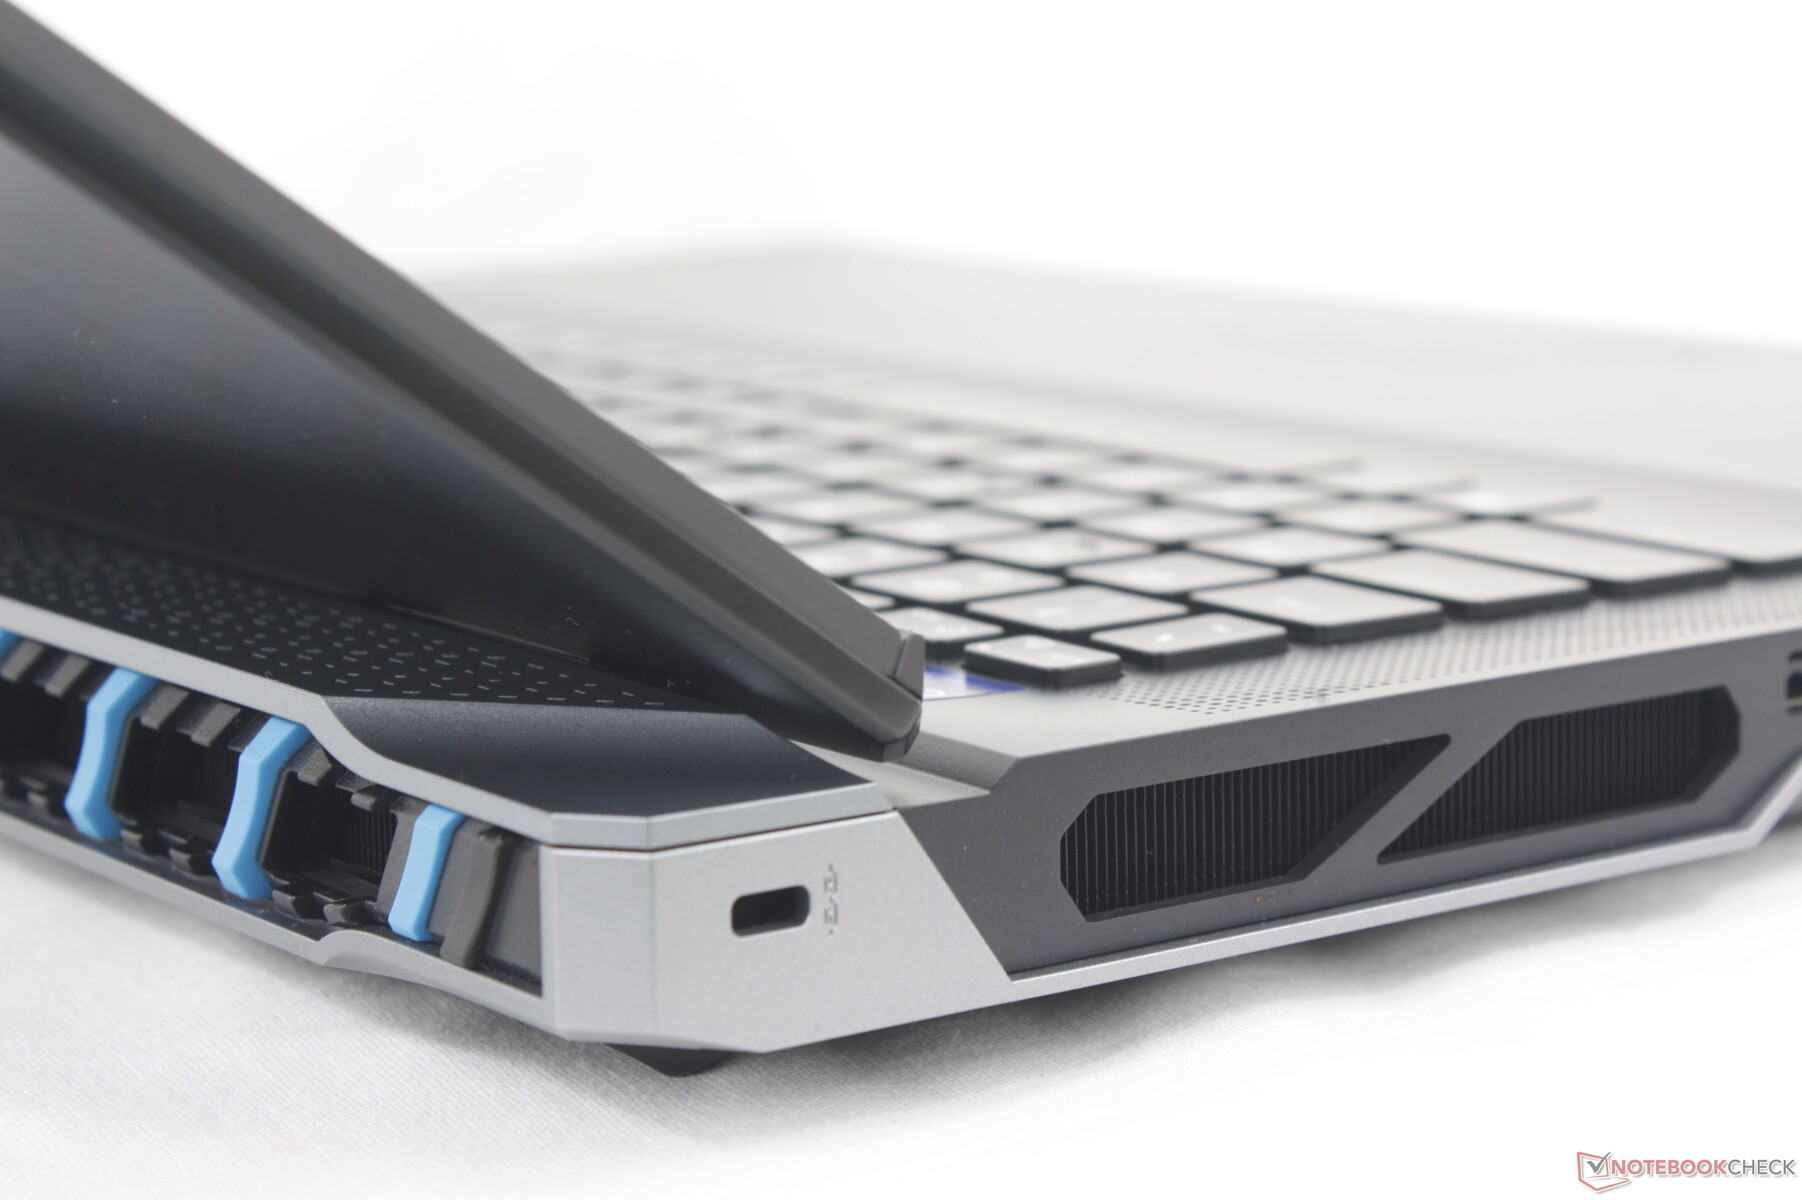
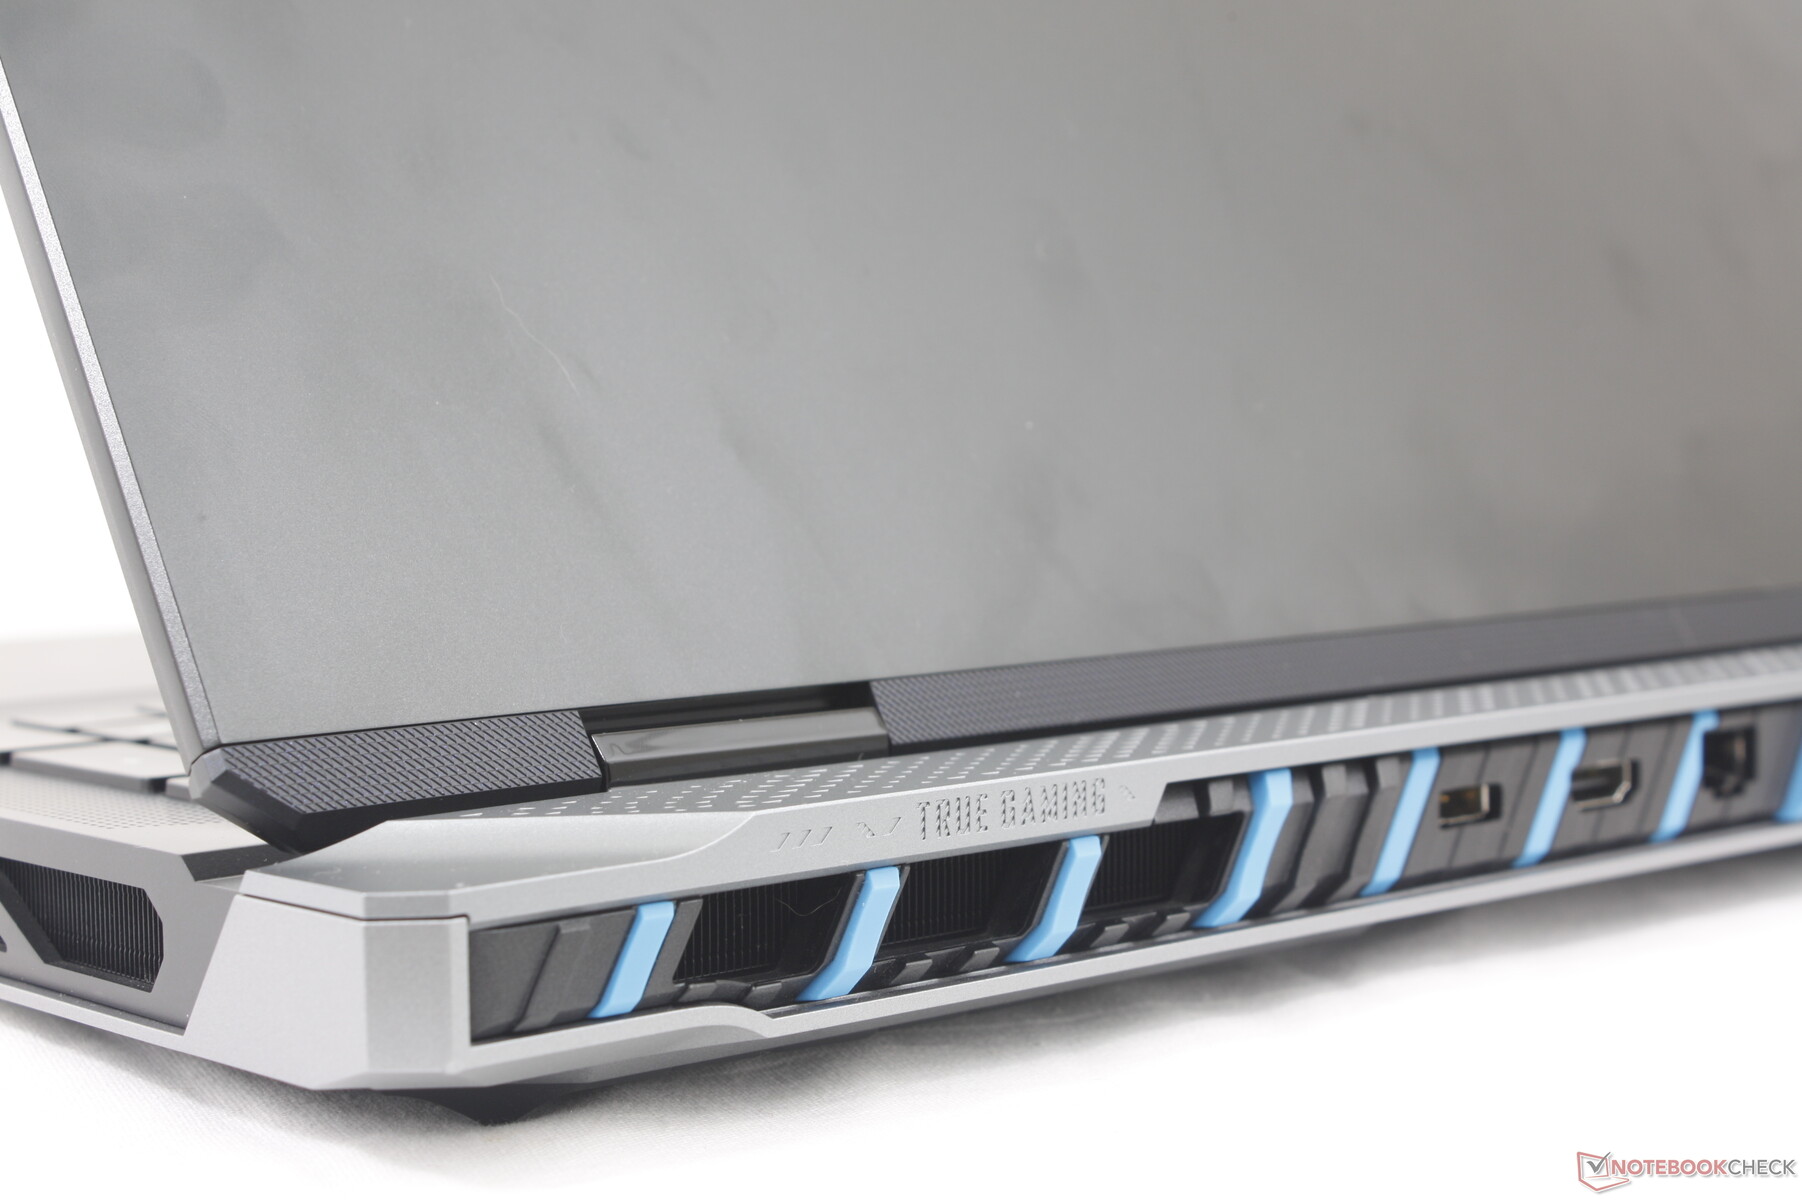
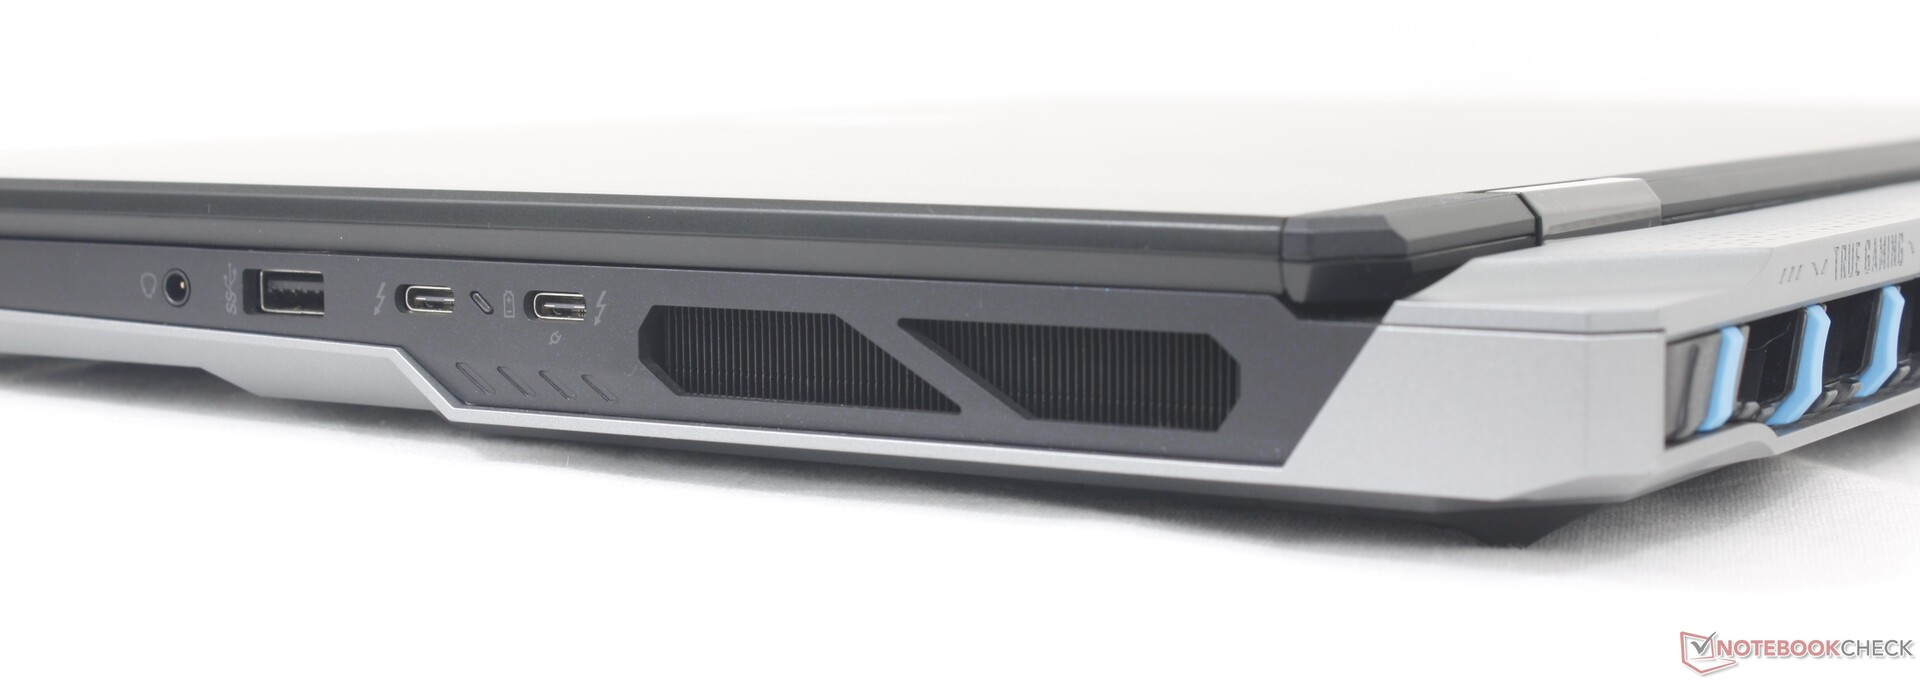
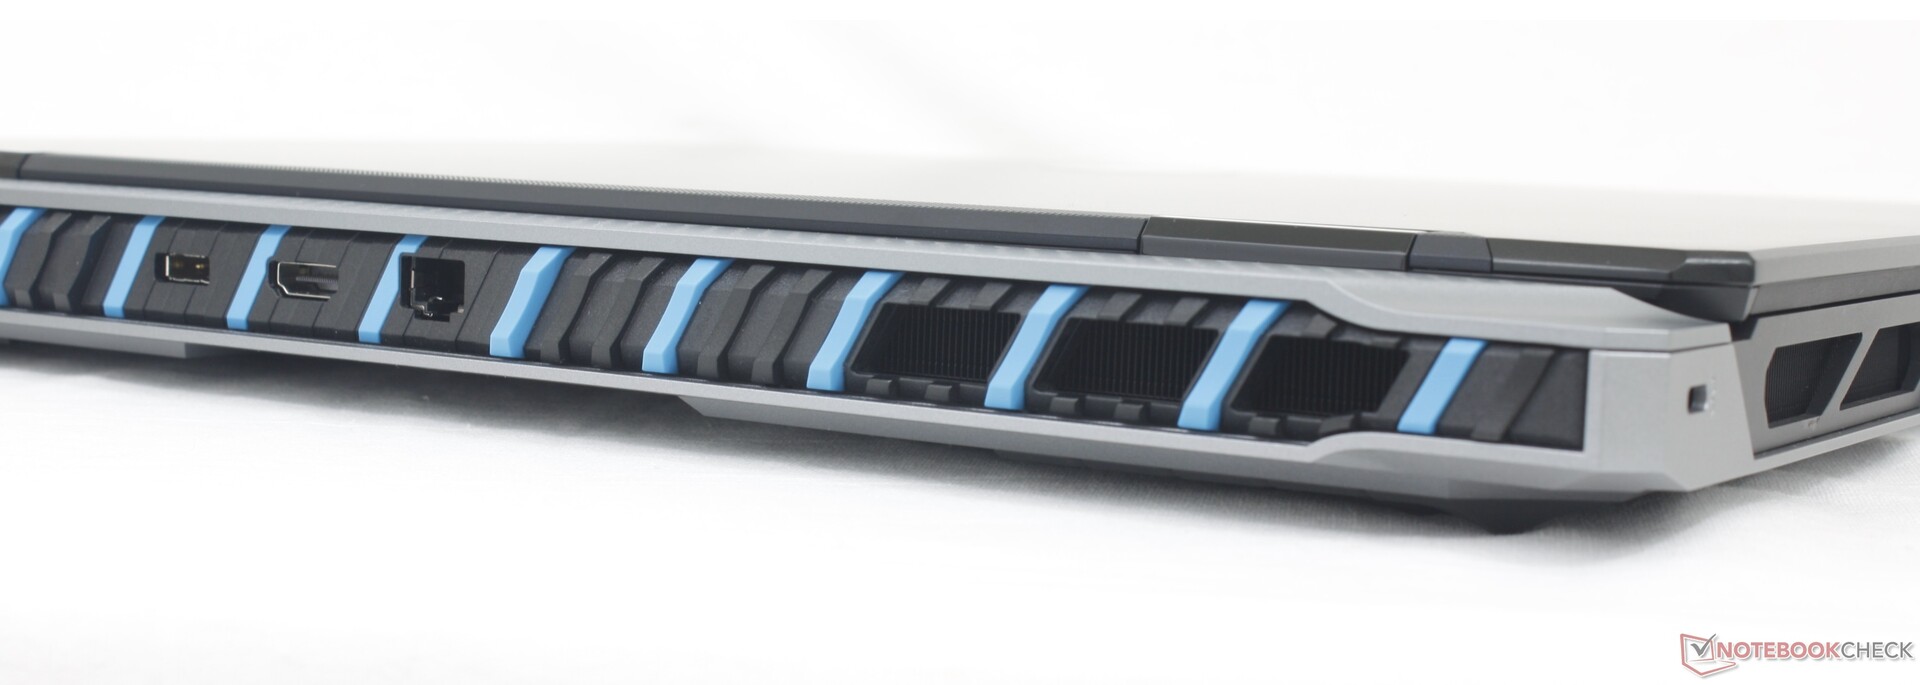
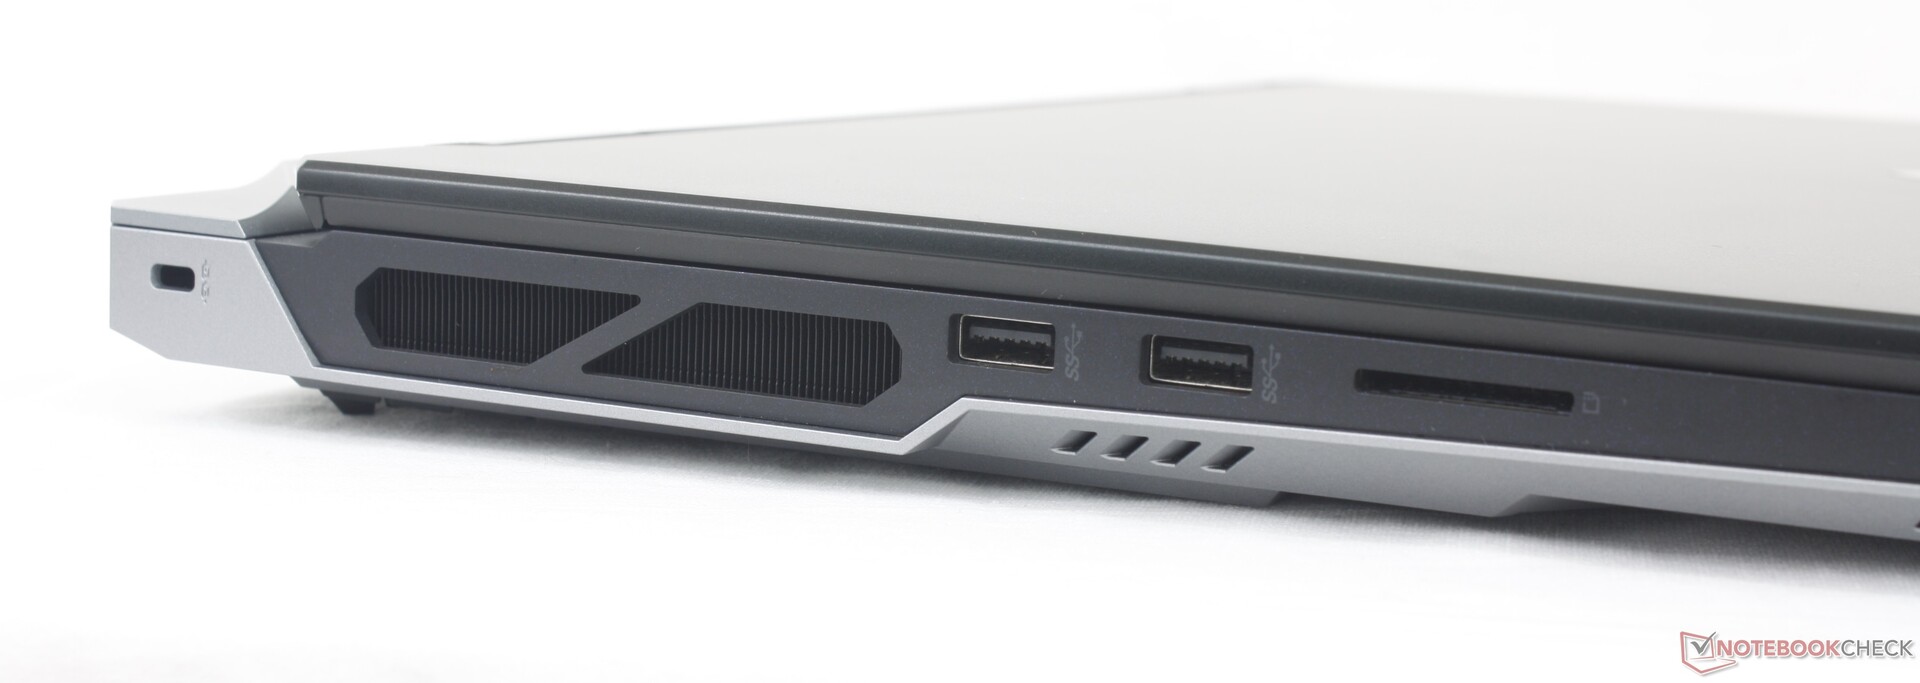
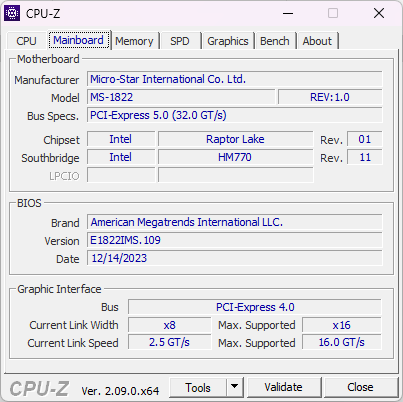
Anslutningsmöjligheter
MSI har tagit med alla portar från förra årets GT77 förutom den dedikerade mini-DisplayPort. Portarna har också omorganiserats, mest märkbart längs baksidan för att minska röran. Som jämförelse var portarna på GT77 tätt packade längs vänster och höger kant.
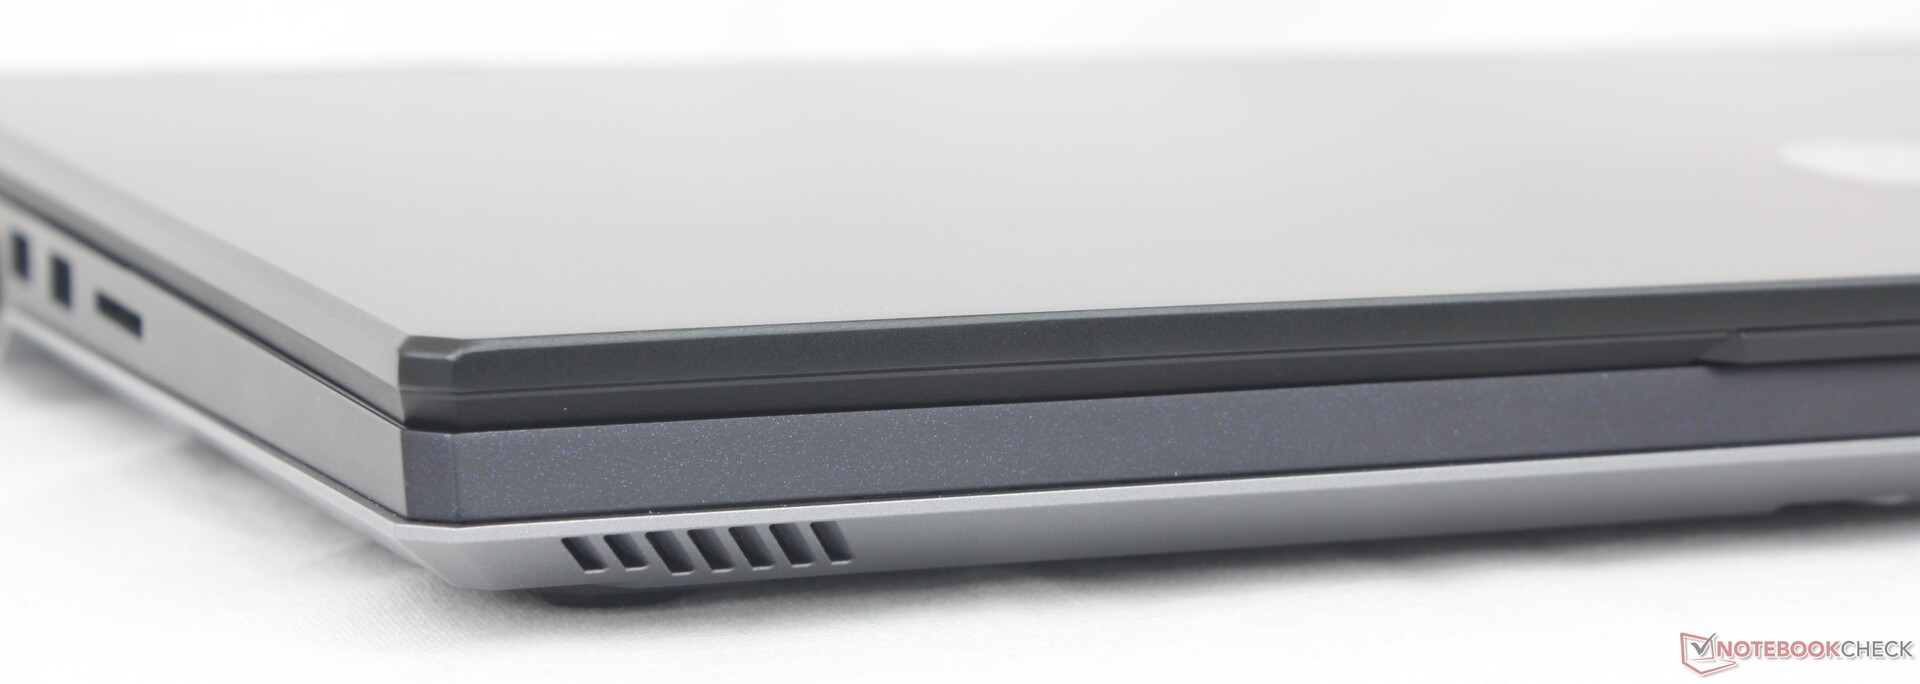
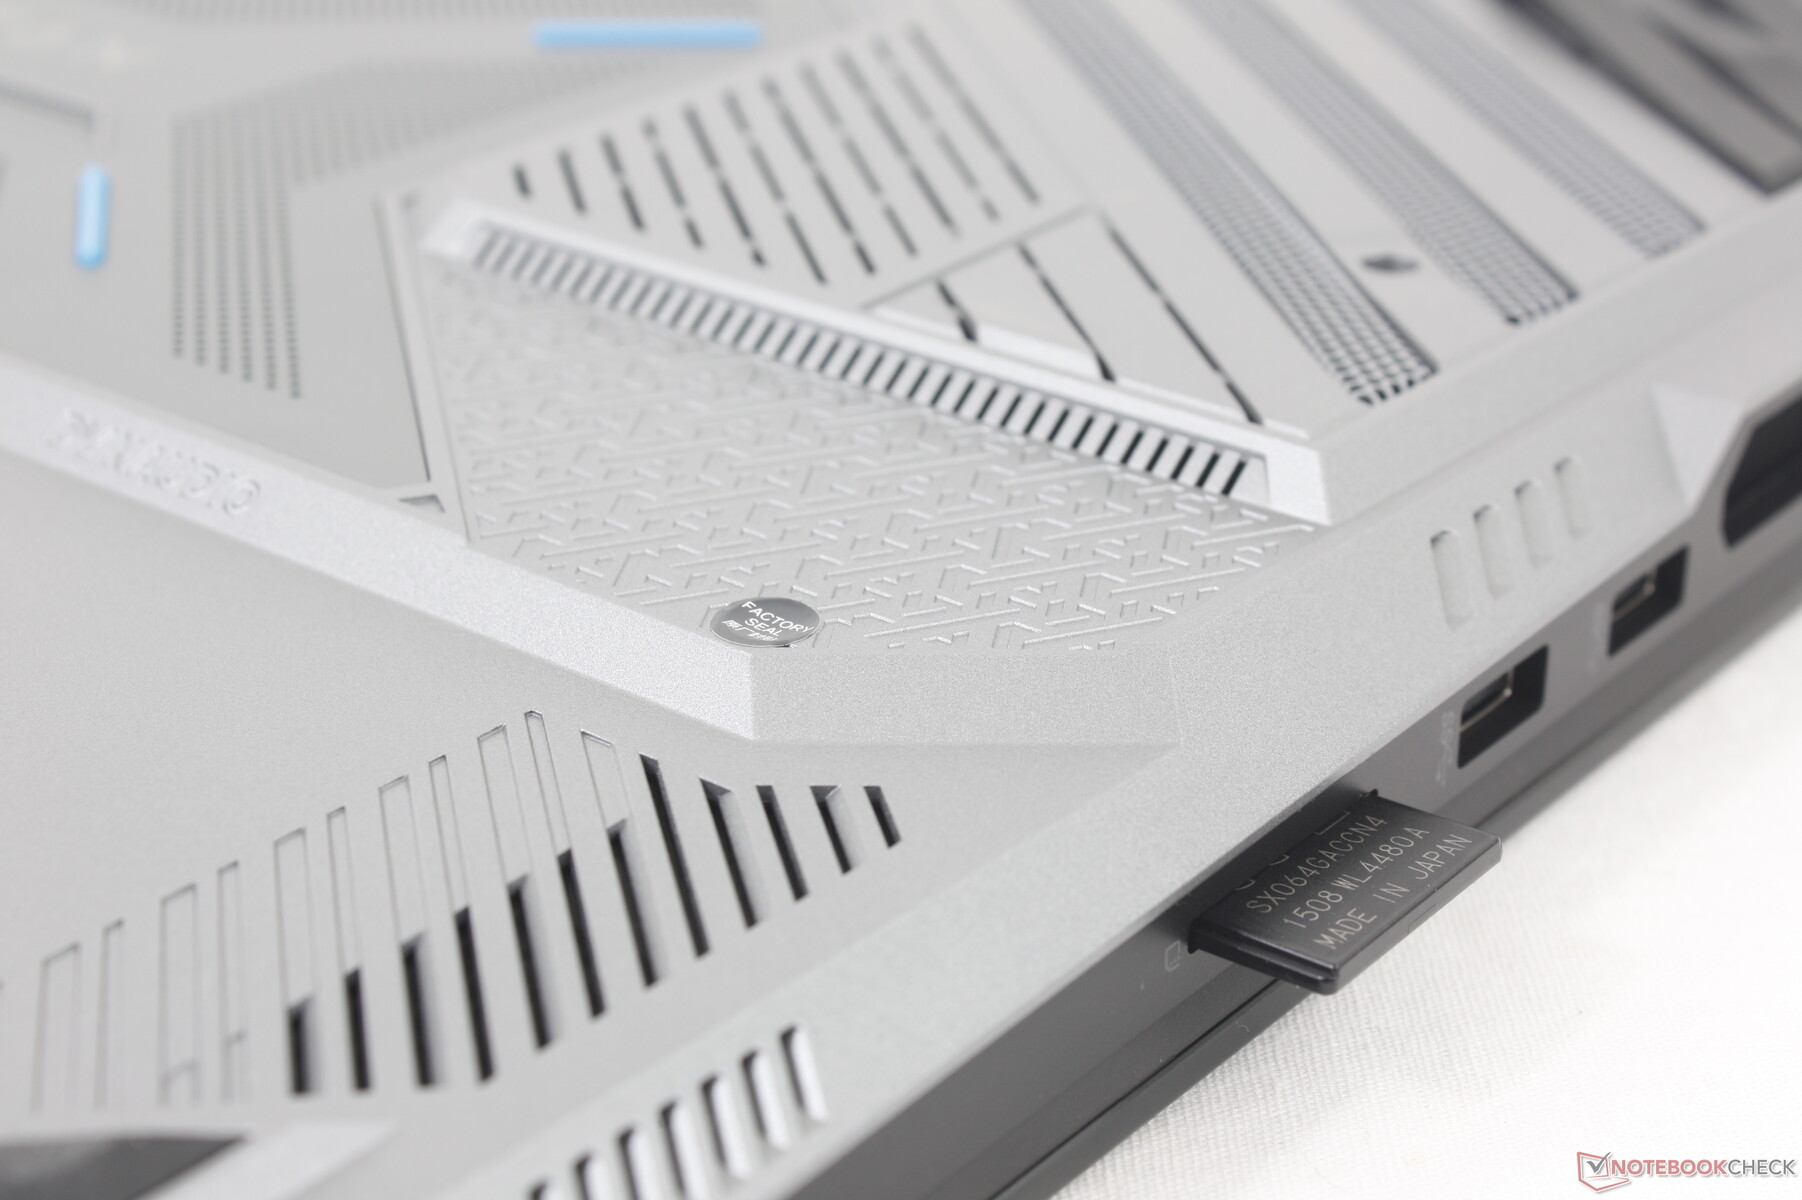
SD-kortläsare
Chassit har förnyats, men det har inte den långsamma kortläsaren. Att flytta 1 GB bilder från vårt UHS-II-testkort till skrivbordet tar cirka 12 sekunder, vilket är 2x långsammare än kortläsarna på Razer Blade 18 eller Alienware m18 R1.
| SD Card Reader | |
| average JPG Copy Test (av. of 3 runs) | |
| Razer Blade 18 RTX 4070 (Angelibird AV Pro V60) | |
| Alienware m18 R1 (Angelibird AV Pro V60) | |
| MSI Titan 18 HX A14VIG (Toshiba Exceria Pro SDXC 64 GB UHS-II) | |
| MSI Titan GT77 HX 13VI (Angelibird AV Pro V60) | |
| Acer Predator Helios 18 N23Q2 | |
| maximum AS SSD Seq Read Test (1GB) | |
| Alienware m18 R1 (Angelibird AV Pro V60) | |
| Razer Blade 18 RTX 4070 (Angelibird AV Pro V60) | |
| MSI Titan 18 HX A14VIG (Toshiba Exceria Pro SDXC 64 GB UHS-II) | |
| MSI Titan GT77 HX 13VI (Angelibird AV Pro V60) | |
| Acer Predator Helios 18 N23Q2 | |
Kommunikation
WLAN tillhandahålls av Killer BE1750x som är gamingvarianten av BE1750W. Modulen stöder Wi-Fi 7 även om Wi-Fi 7-routrar ännu inte är mainstream. Vi upplevde inga anslutningsproblem när vi parade ihop den med vår Wi-Fi 6E-testrouter.
| Networking | |
| iperf3 transmit AXE11000 | |
| Asus ROG Strix G18 G814JI | |
| MSI Titan GT77 HX 13VI | |
| Alienware m18 R1 | |
| Razer Blade 18 RTX 4070 | |
| MSI Titan 18 HX A14VIG | |
| Acer Predator Helios 18 N23Q2 | |
| iperf3 receive AXE11000 | |
| Asus ROG Strix G18 G814JI | |
| MSI Titan GT77 HX 13VI | |
| Razer Blade 18 RTX 4070 | |
| Alienware m18 R1 | |
| MSI Titan 18 HX A14VIG | |
| Acer Predator Helios 18 N23Q2 | |
| iperf3 transmit AXE11000 6GHz | |
| Acer Predator Helios 18 N23Q2 | |
| Alienware m18 R1 | |
| Razer Blade 18 RTX 4070 | |
| MSI Titan 18 HX A14VIG | |
| iperf3 receive AXE11000 6GHz | |
| Razer Blade 18 RTX 4070 | |
| Acer Predator Helios 18 N23Q2 | |
| MSI Titan 18 HX A14VIG | |
| Alienware m18 R1 | |
Webbkamera
En 2 MP webbkamera med fysisk sekretesslucka och IR-sensor ingår som standard. Kameran kan ha problem med ljusstyrkan, vilket framgår av vår bild nedan.

")
")
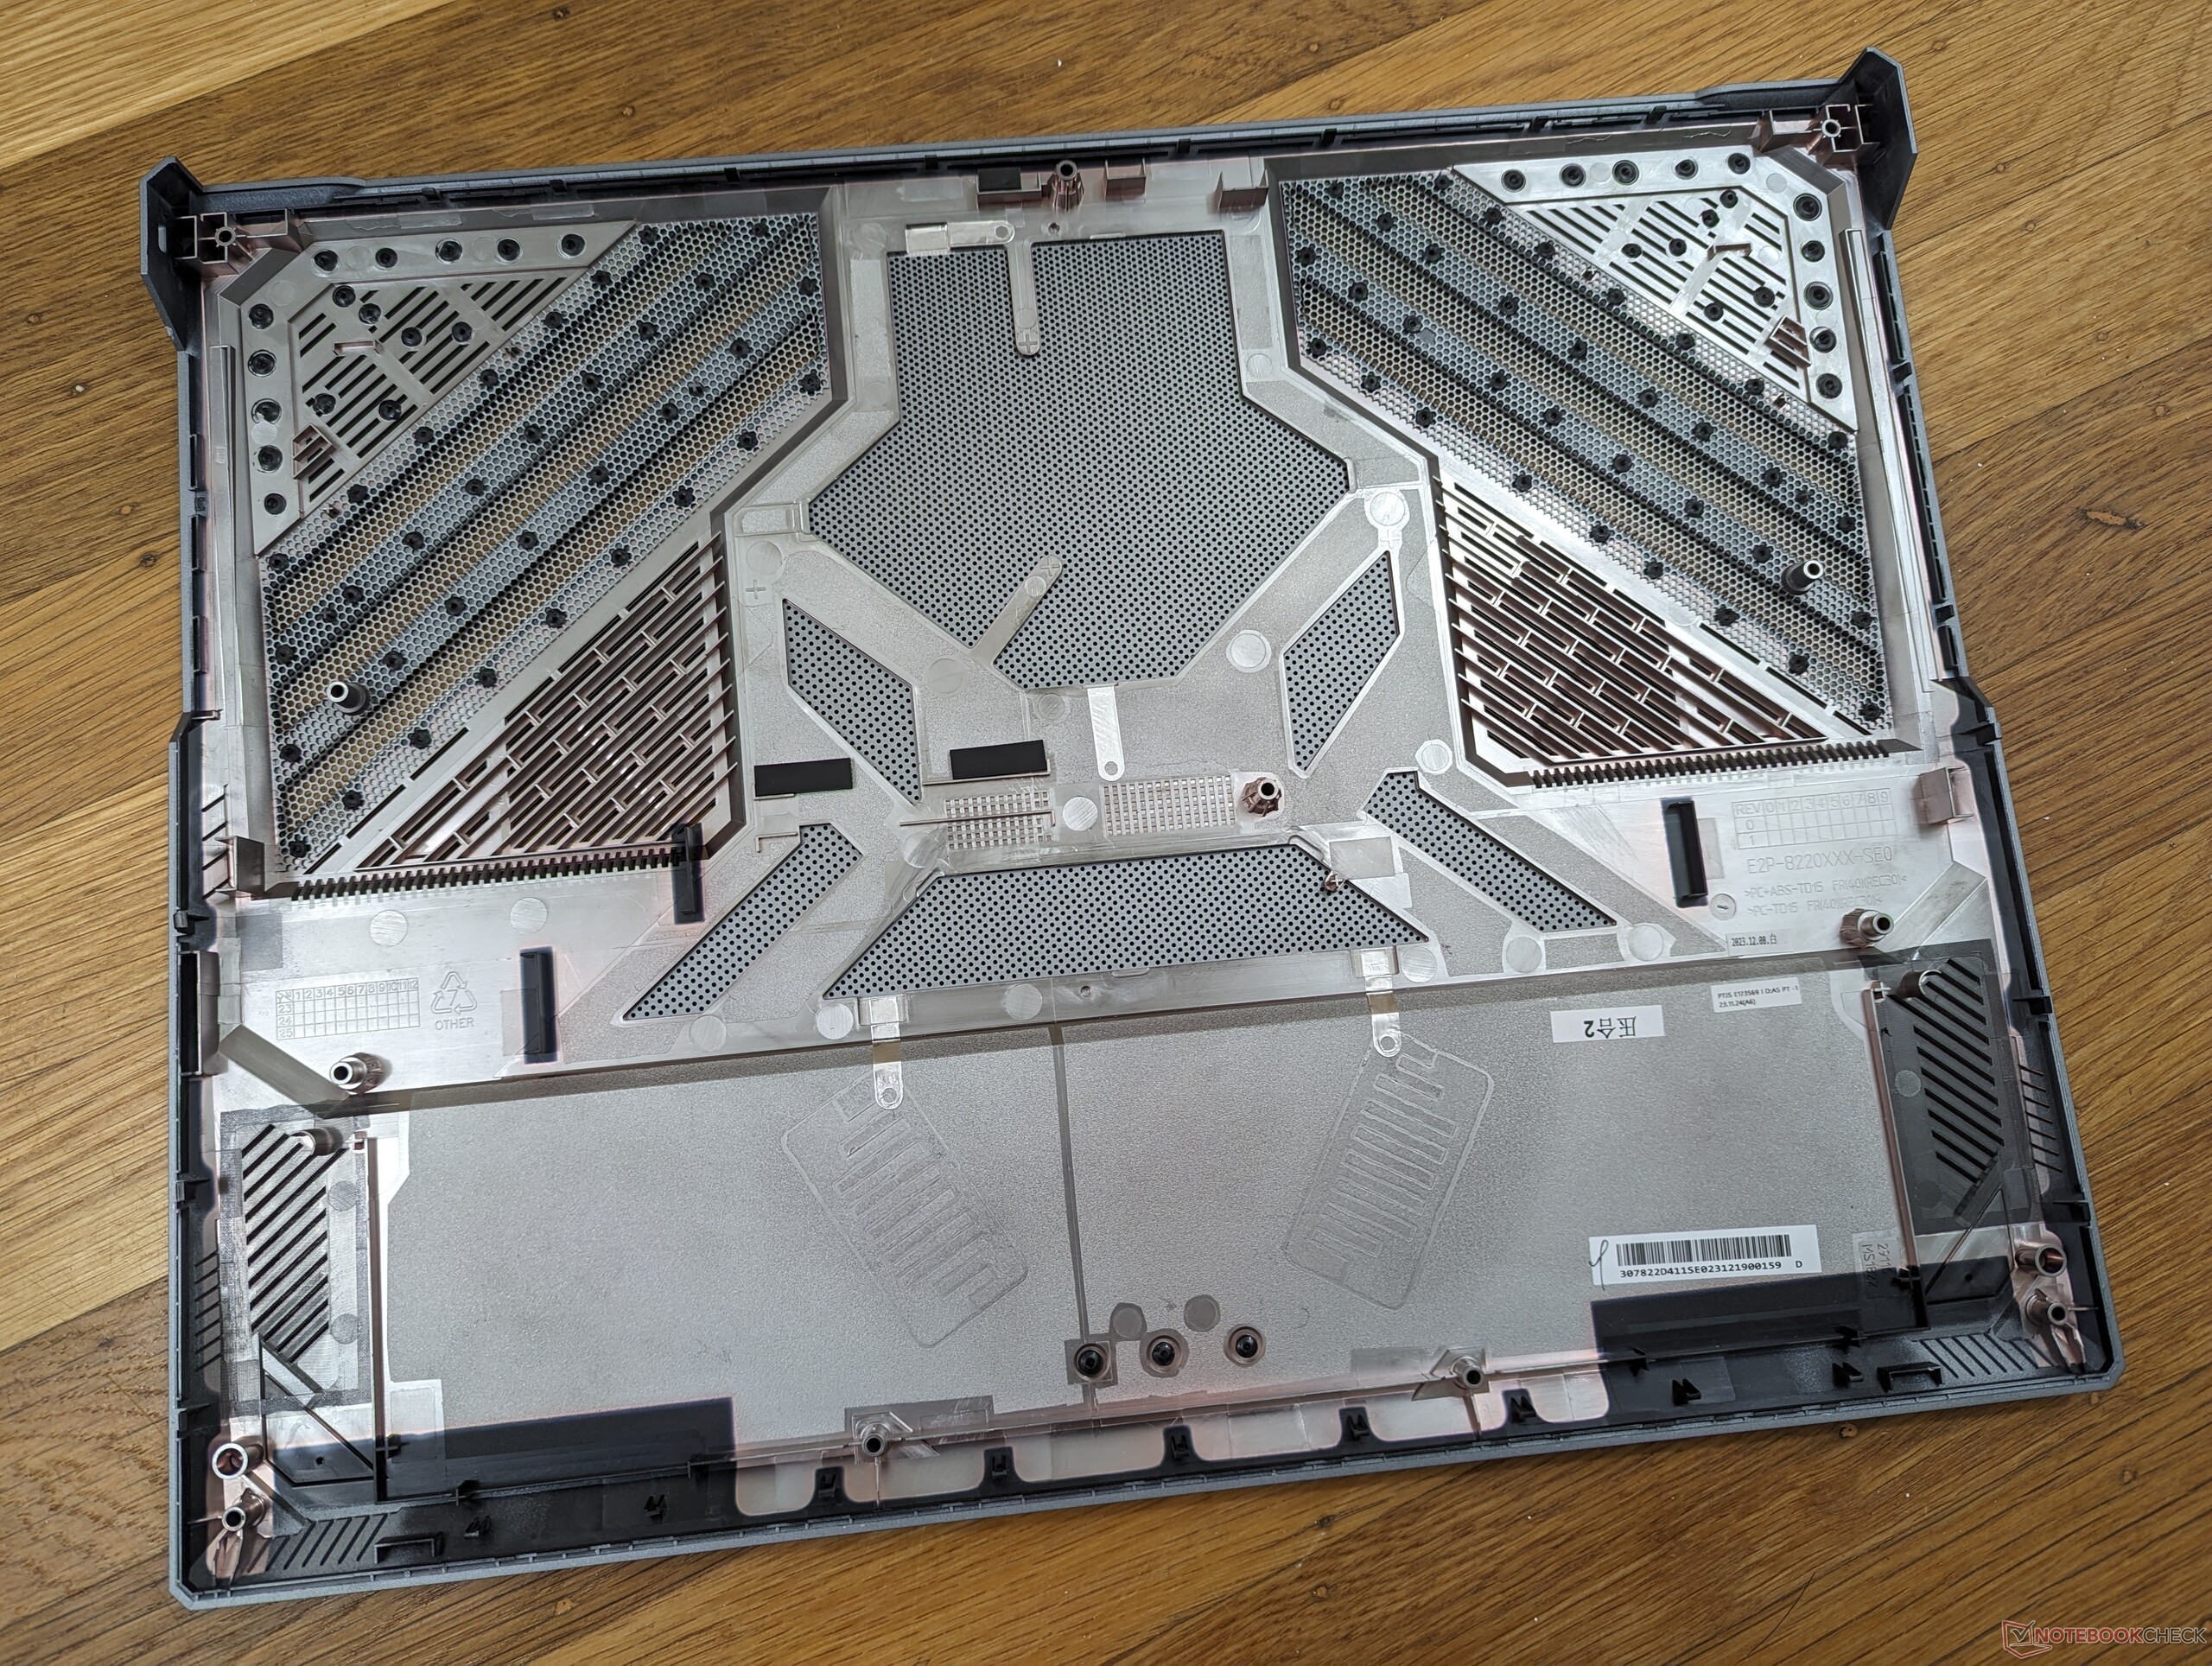
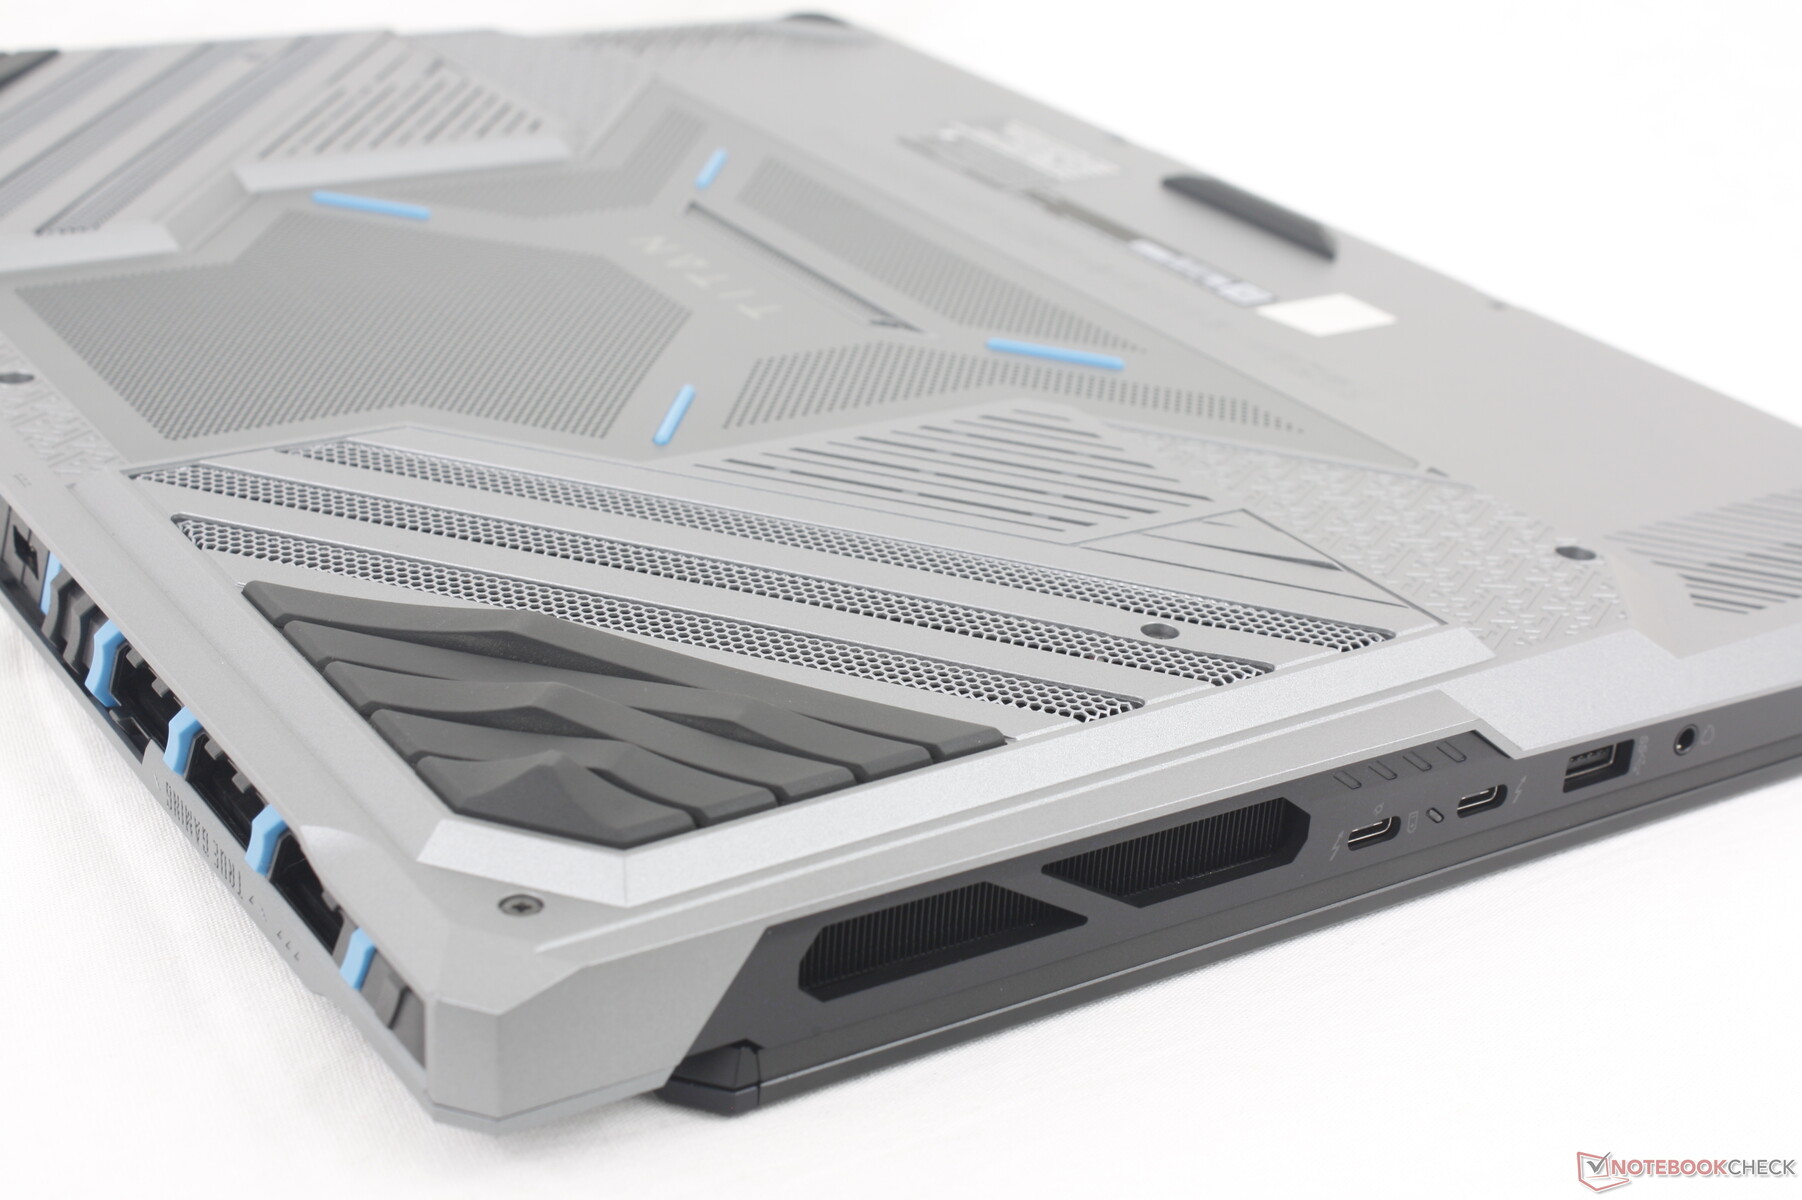
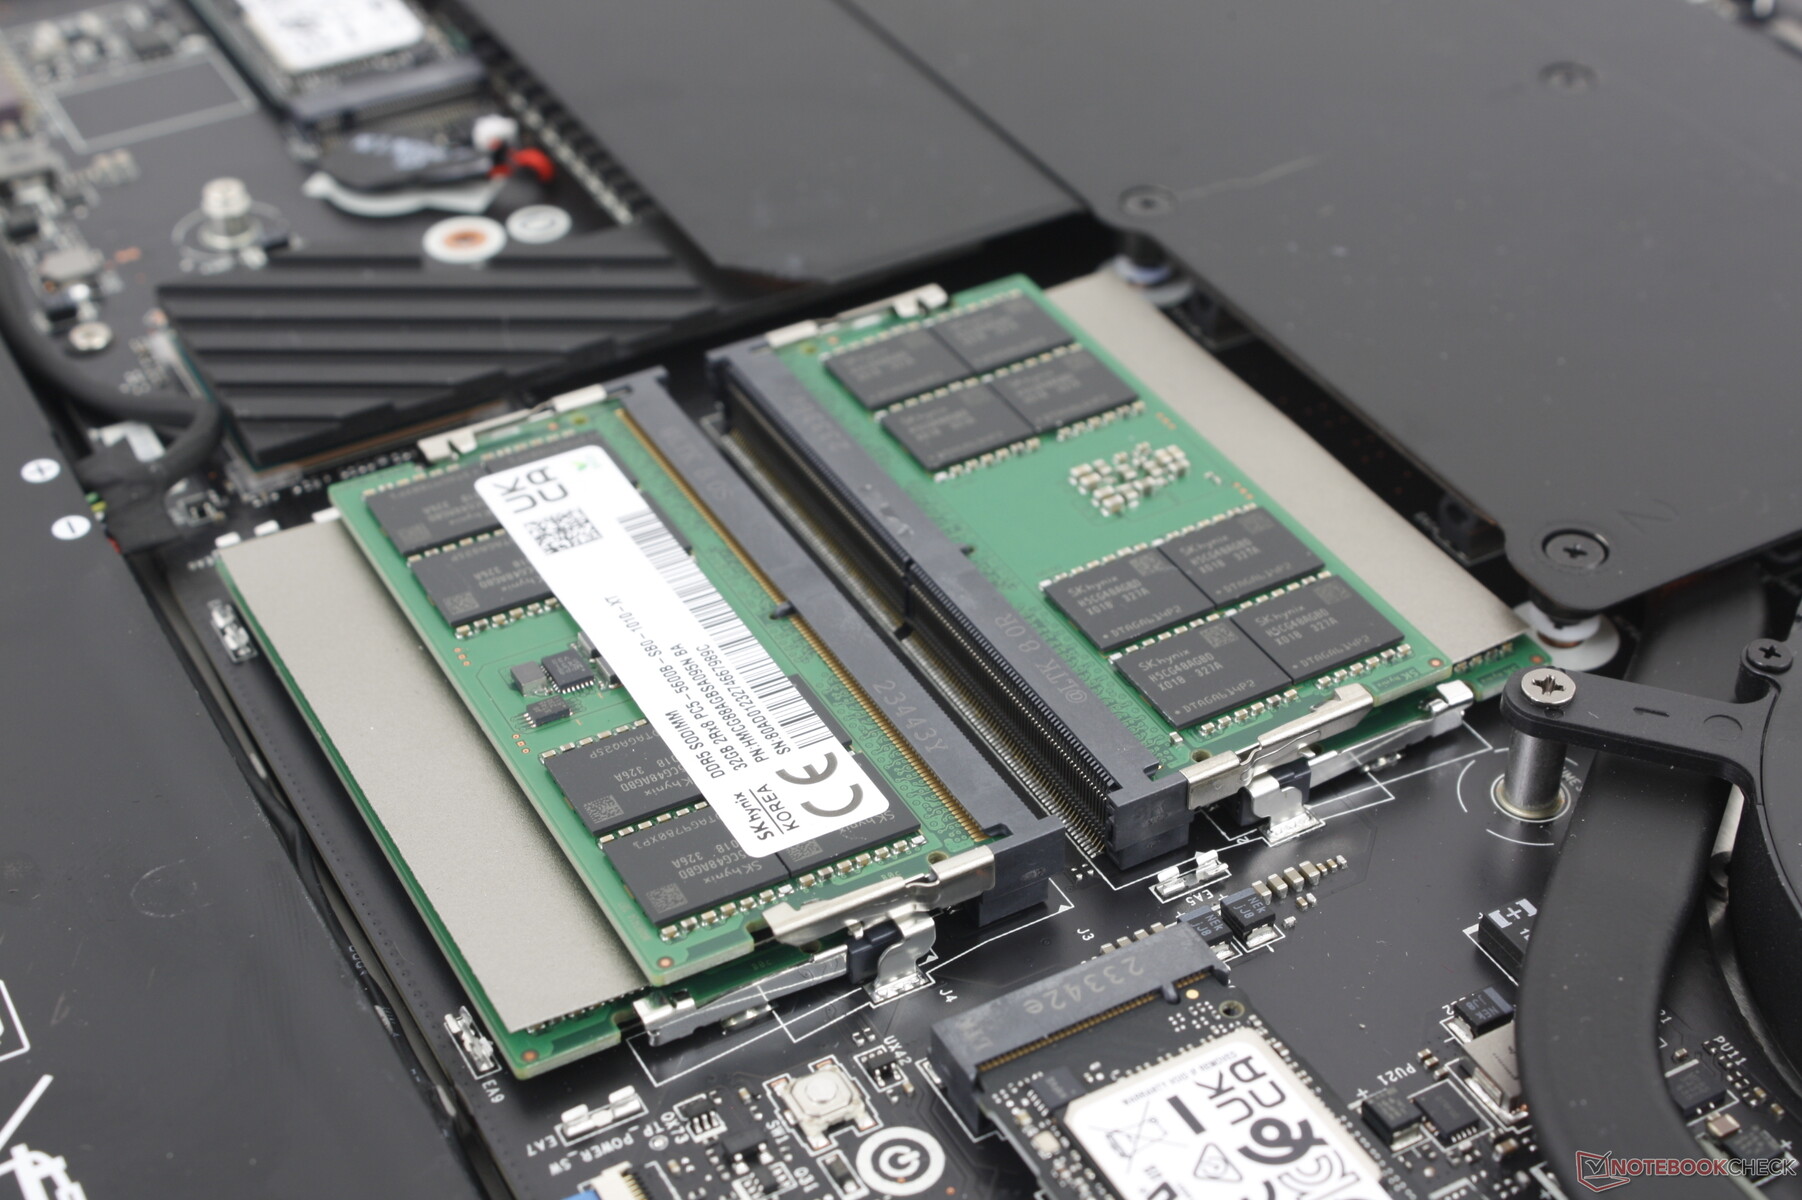
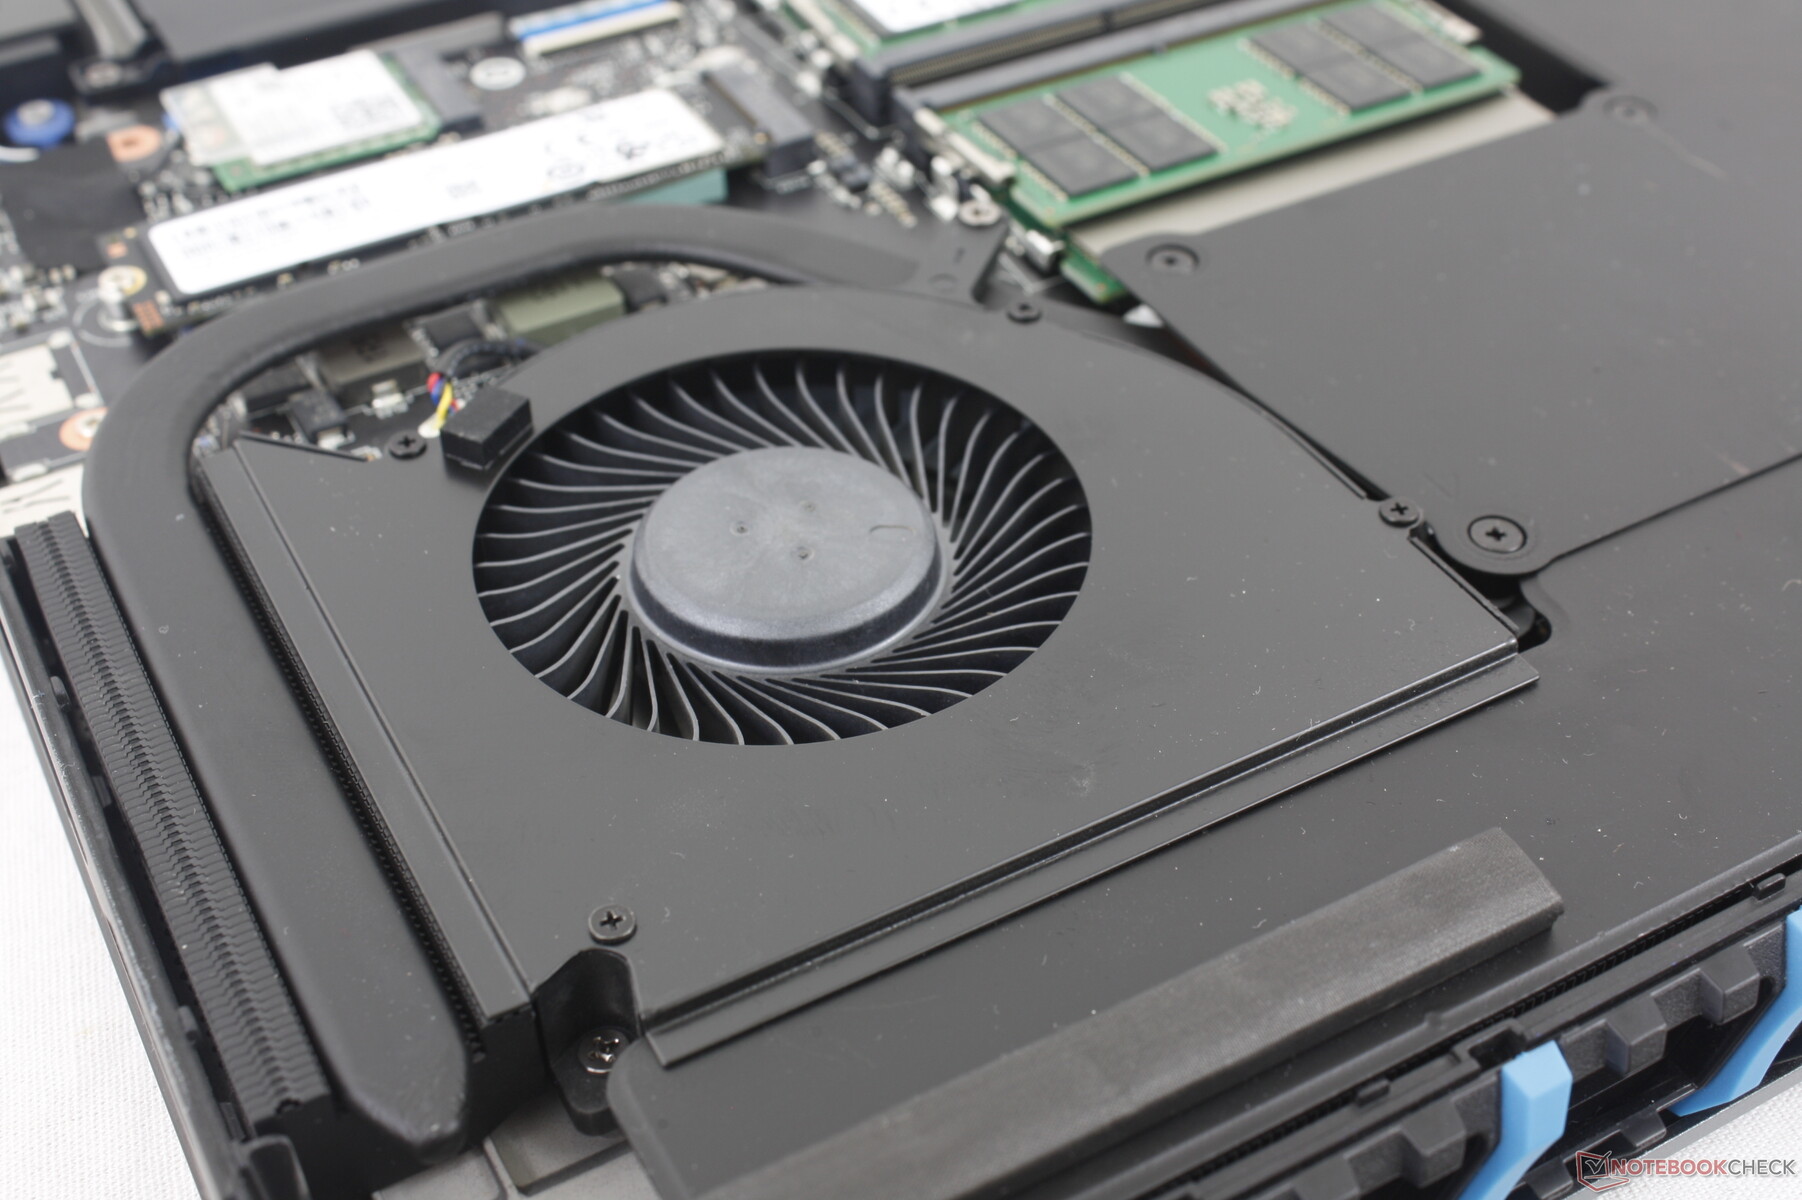
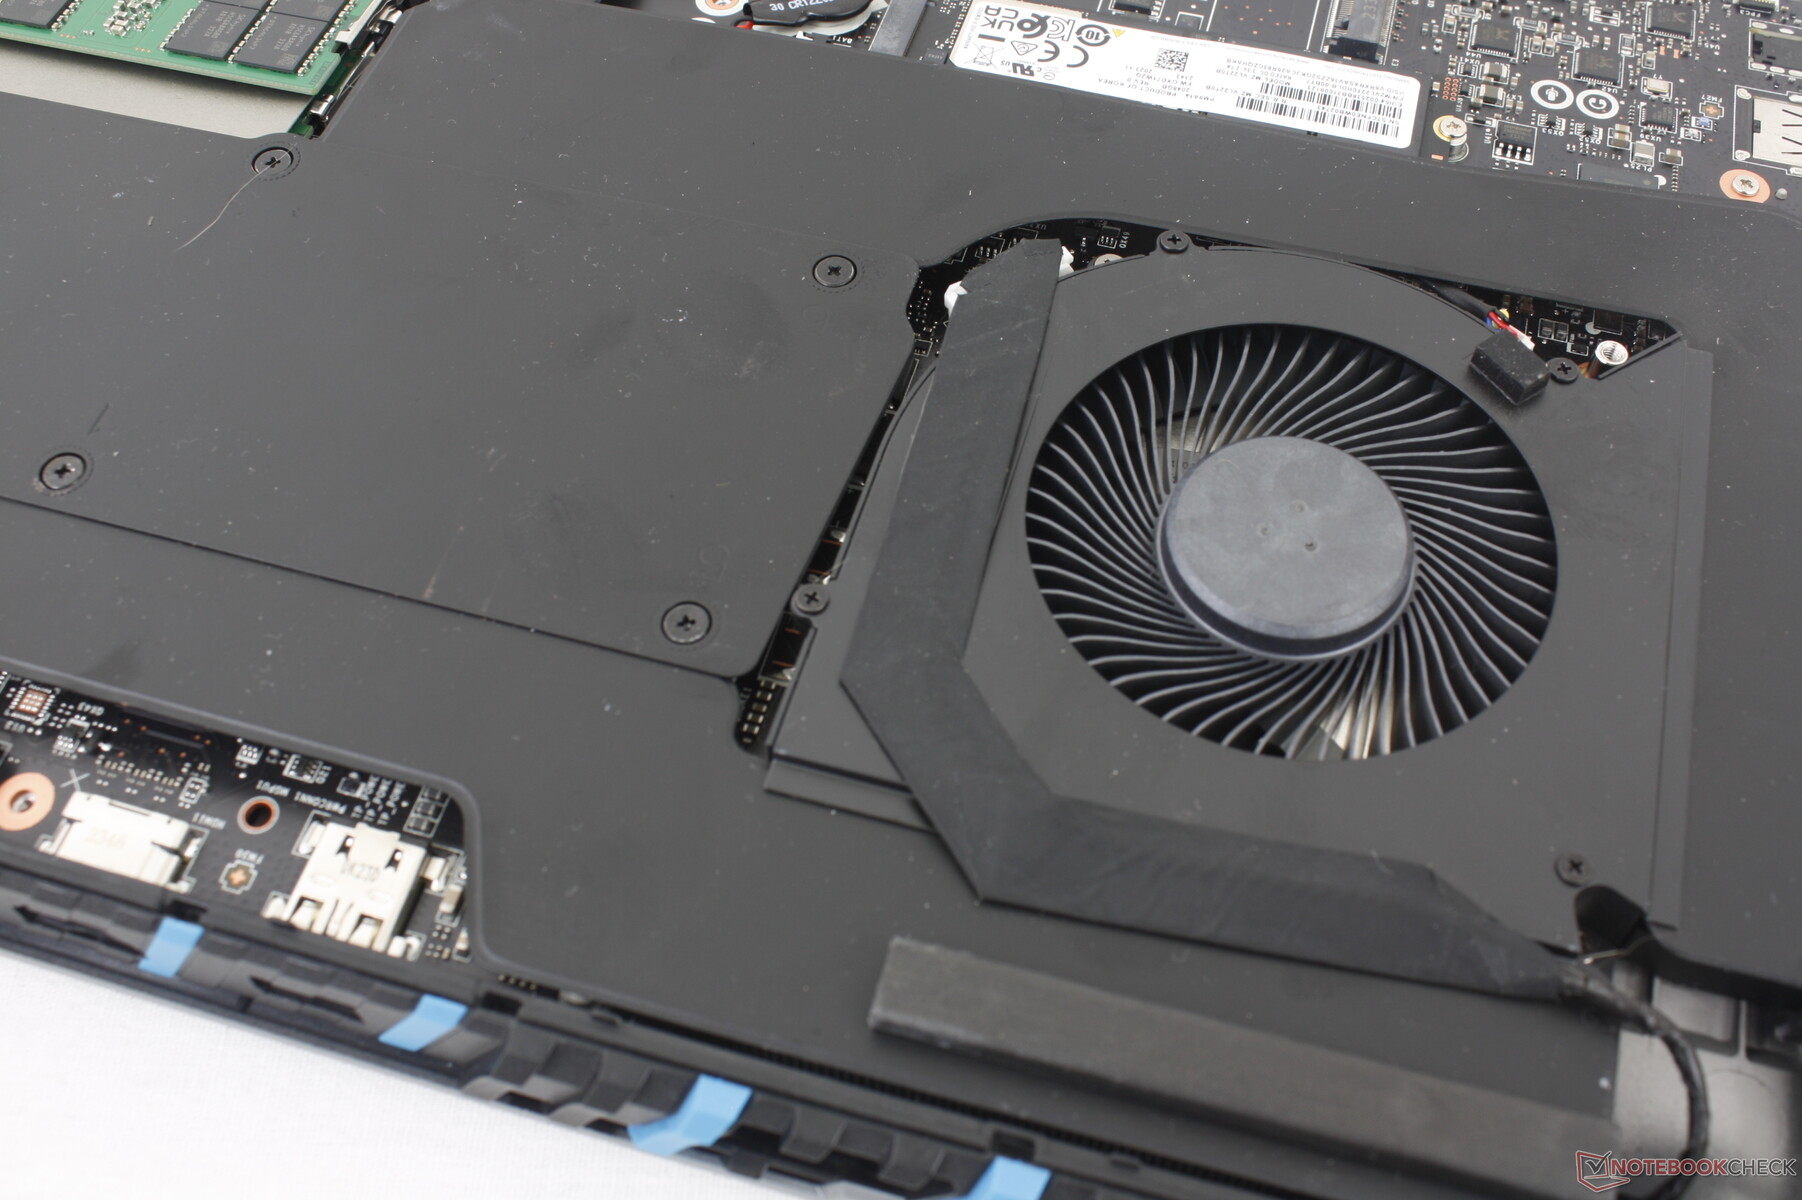
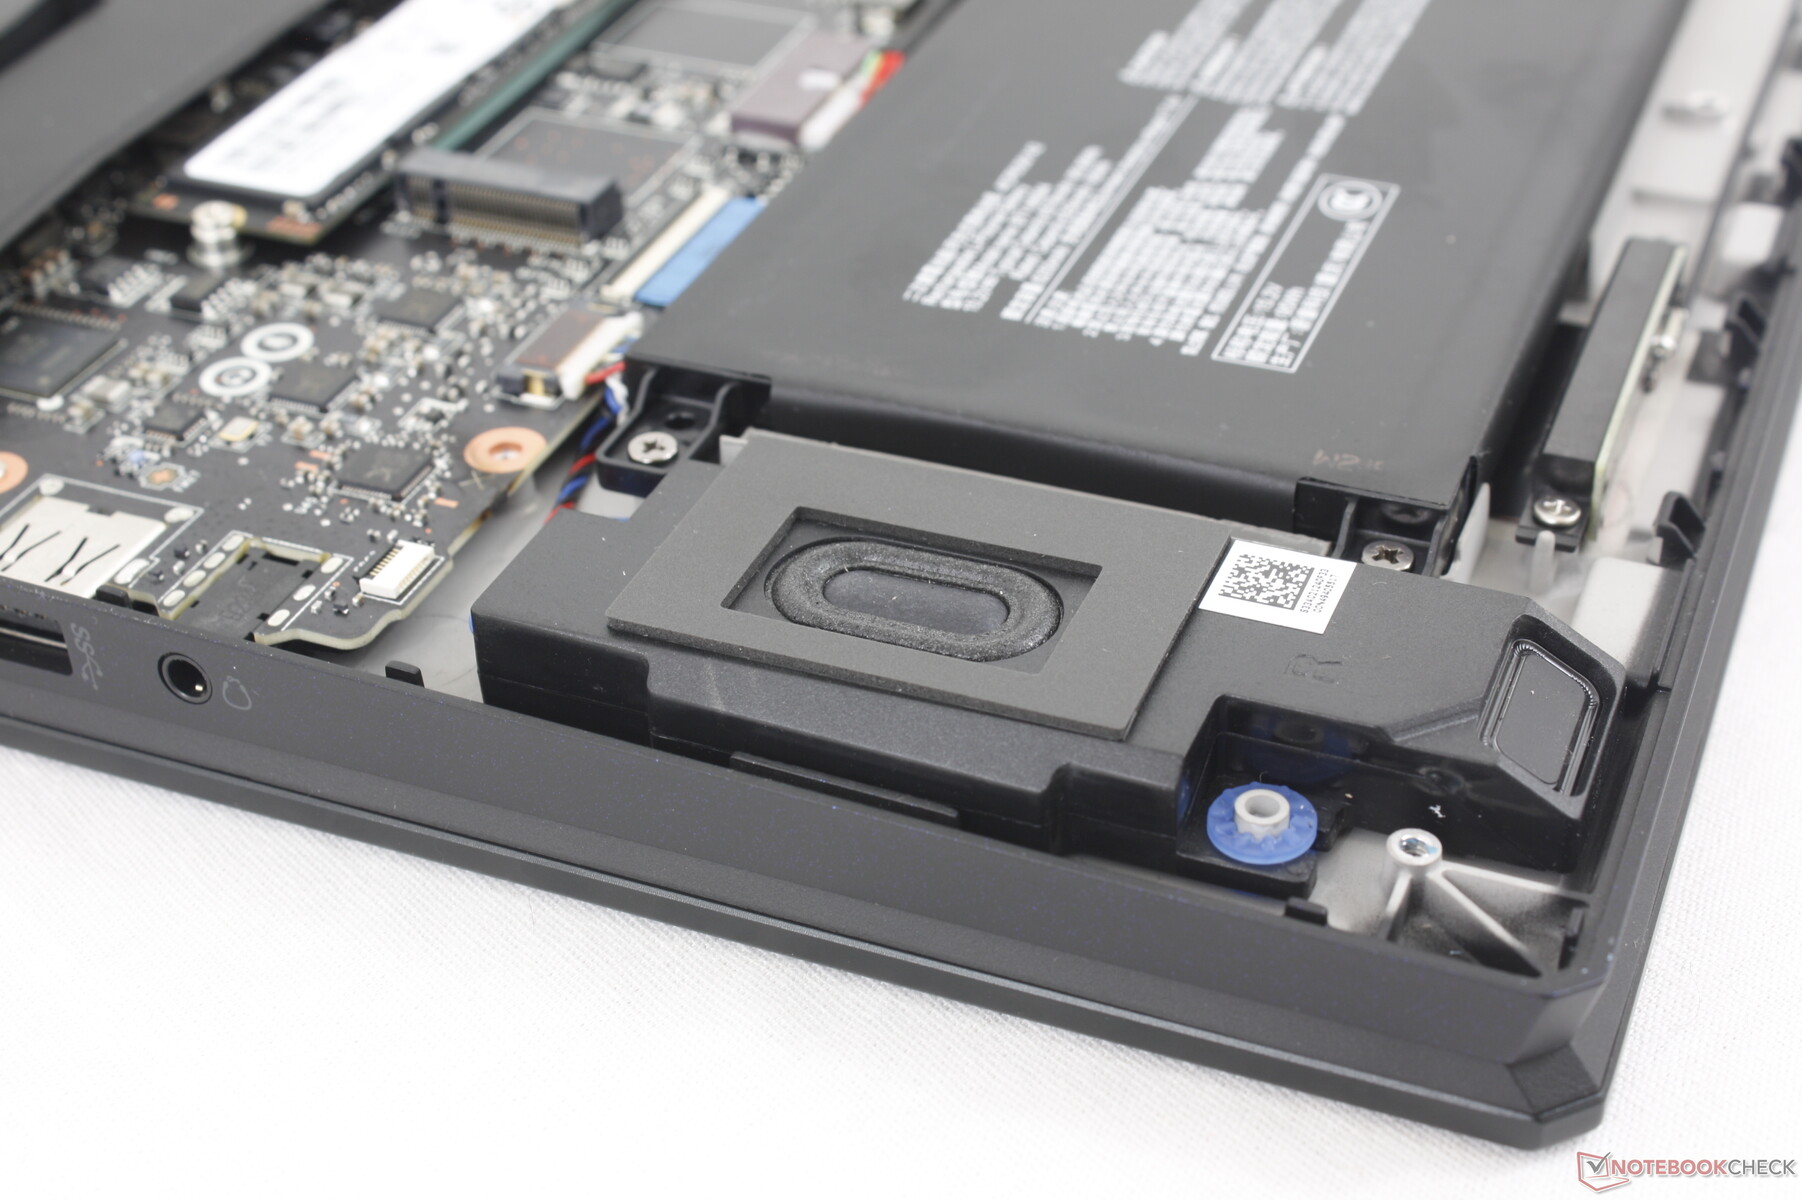
Underhåll
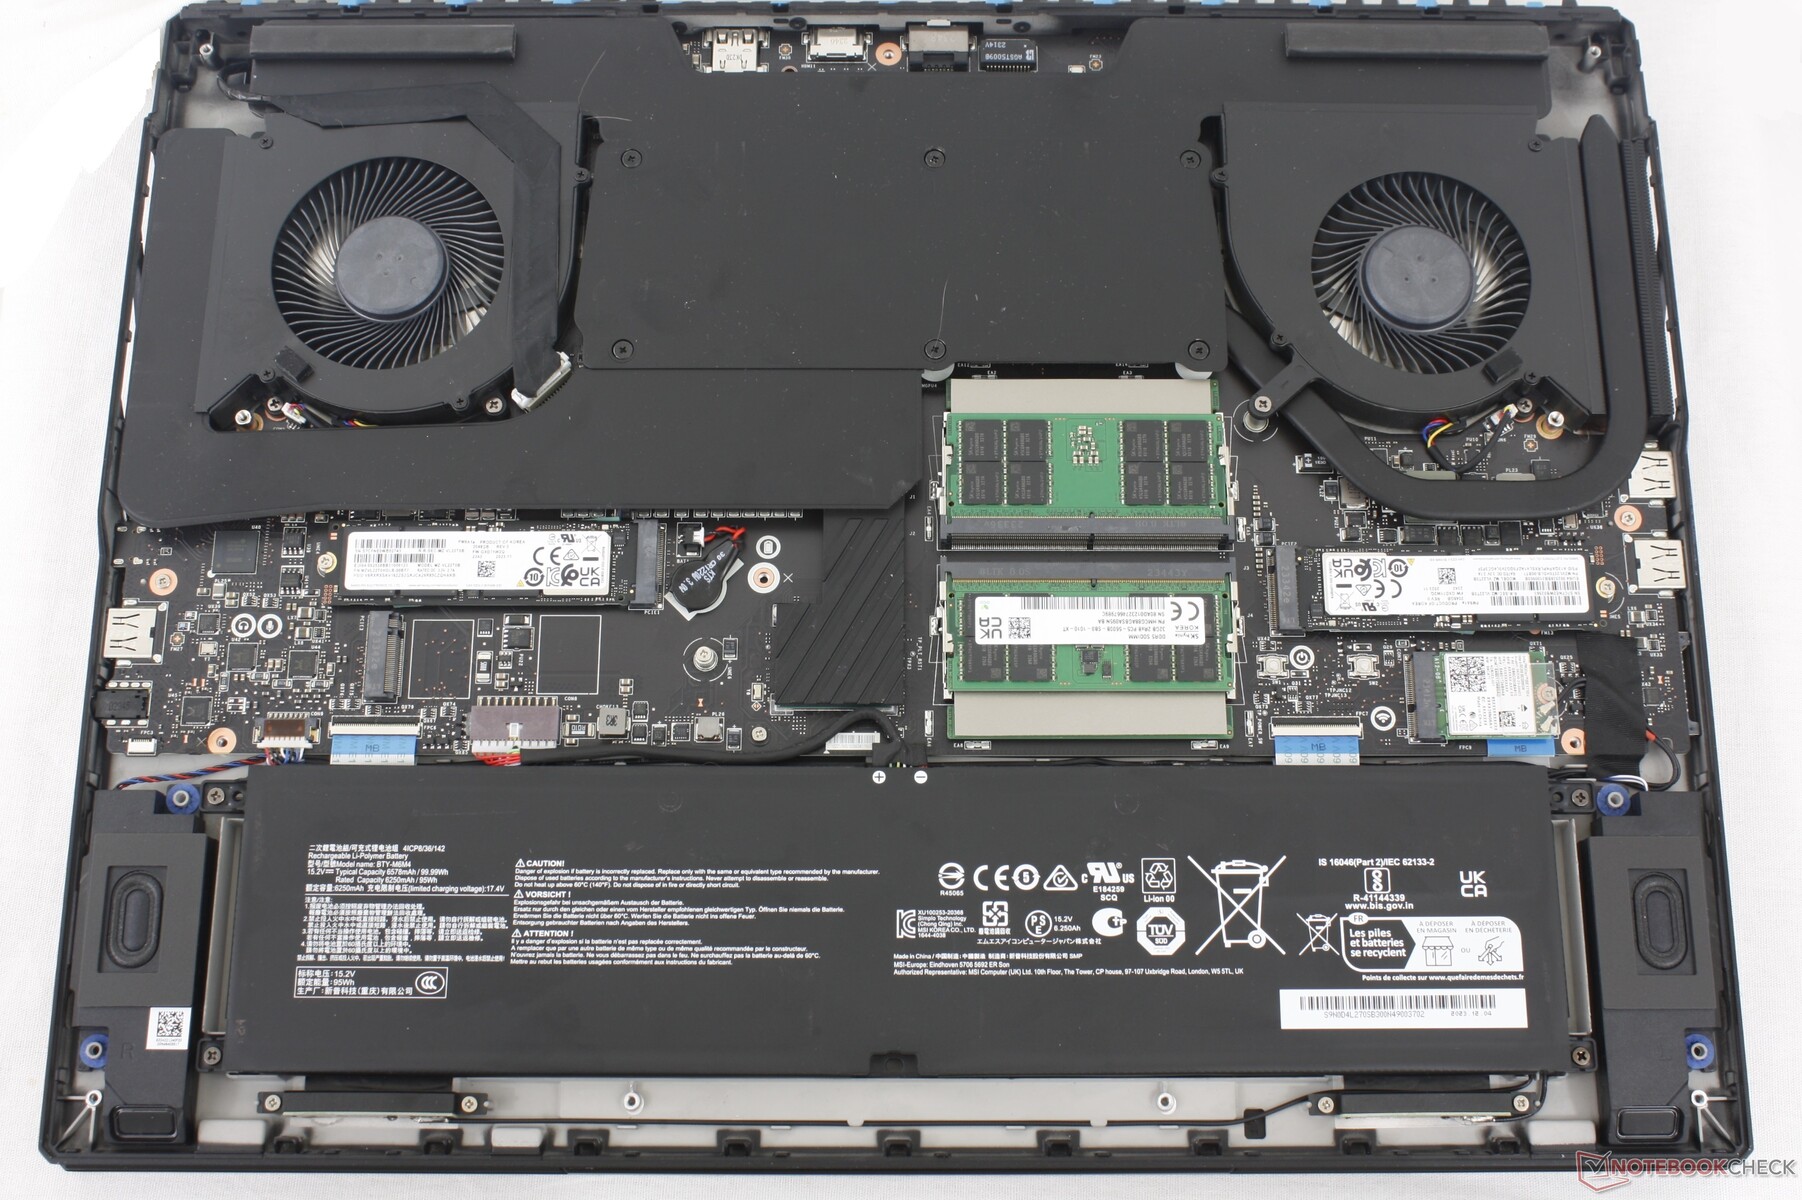
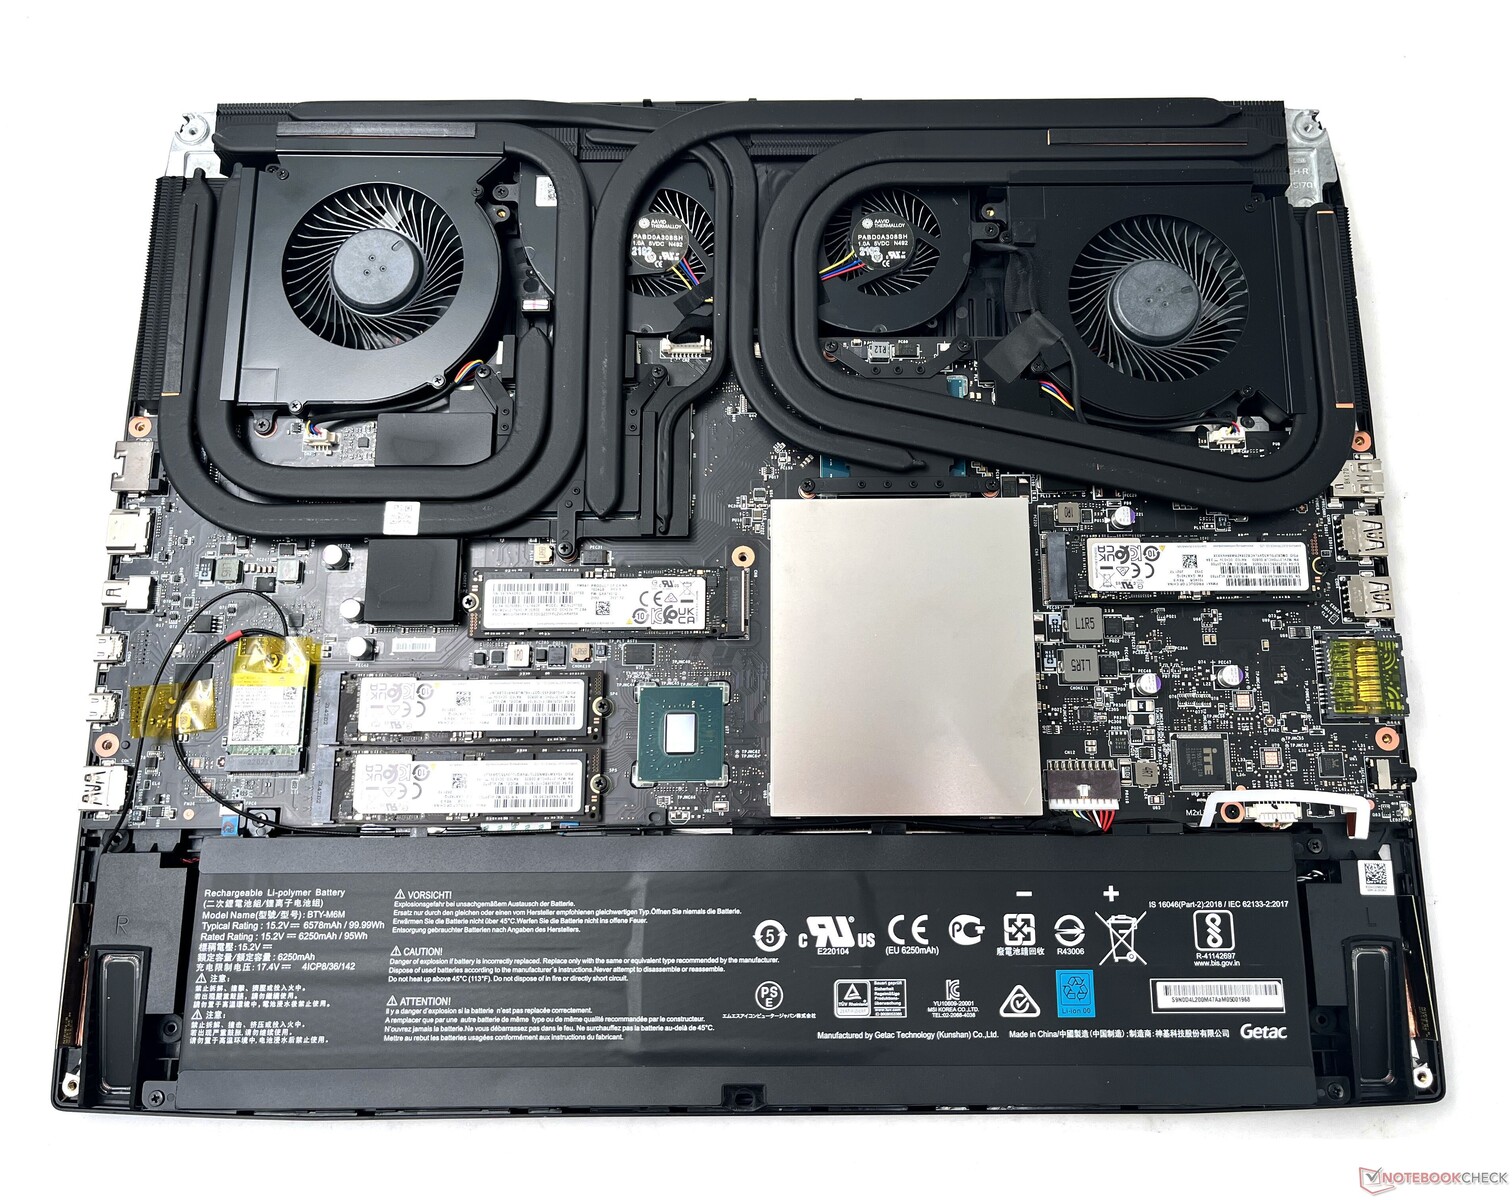
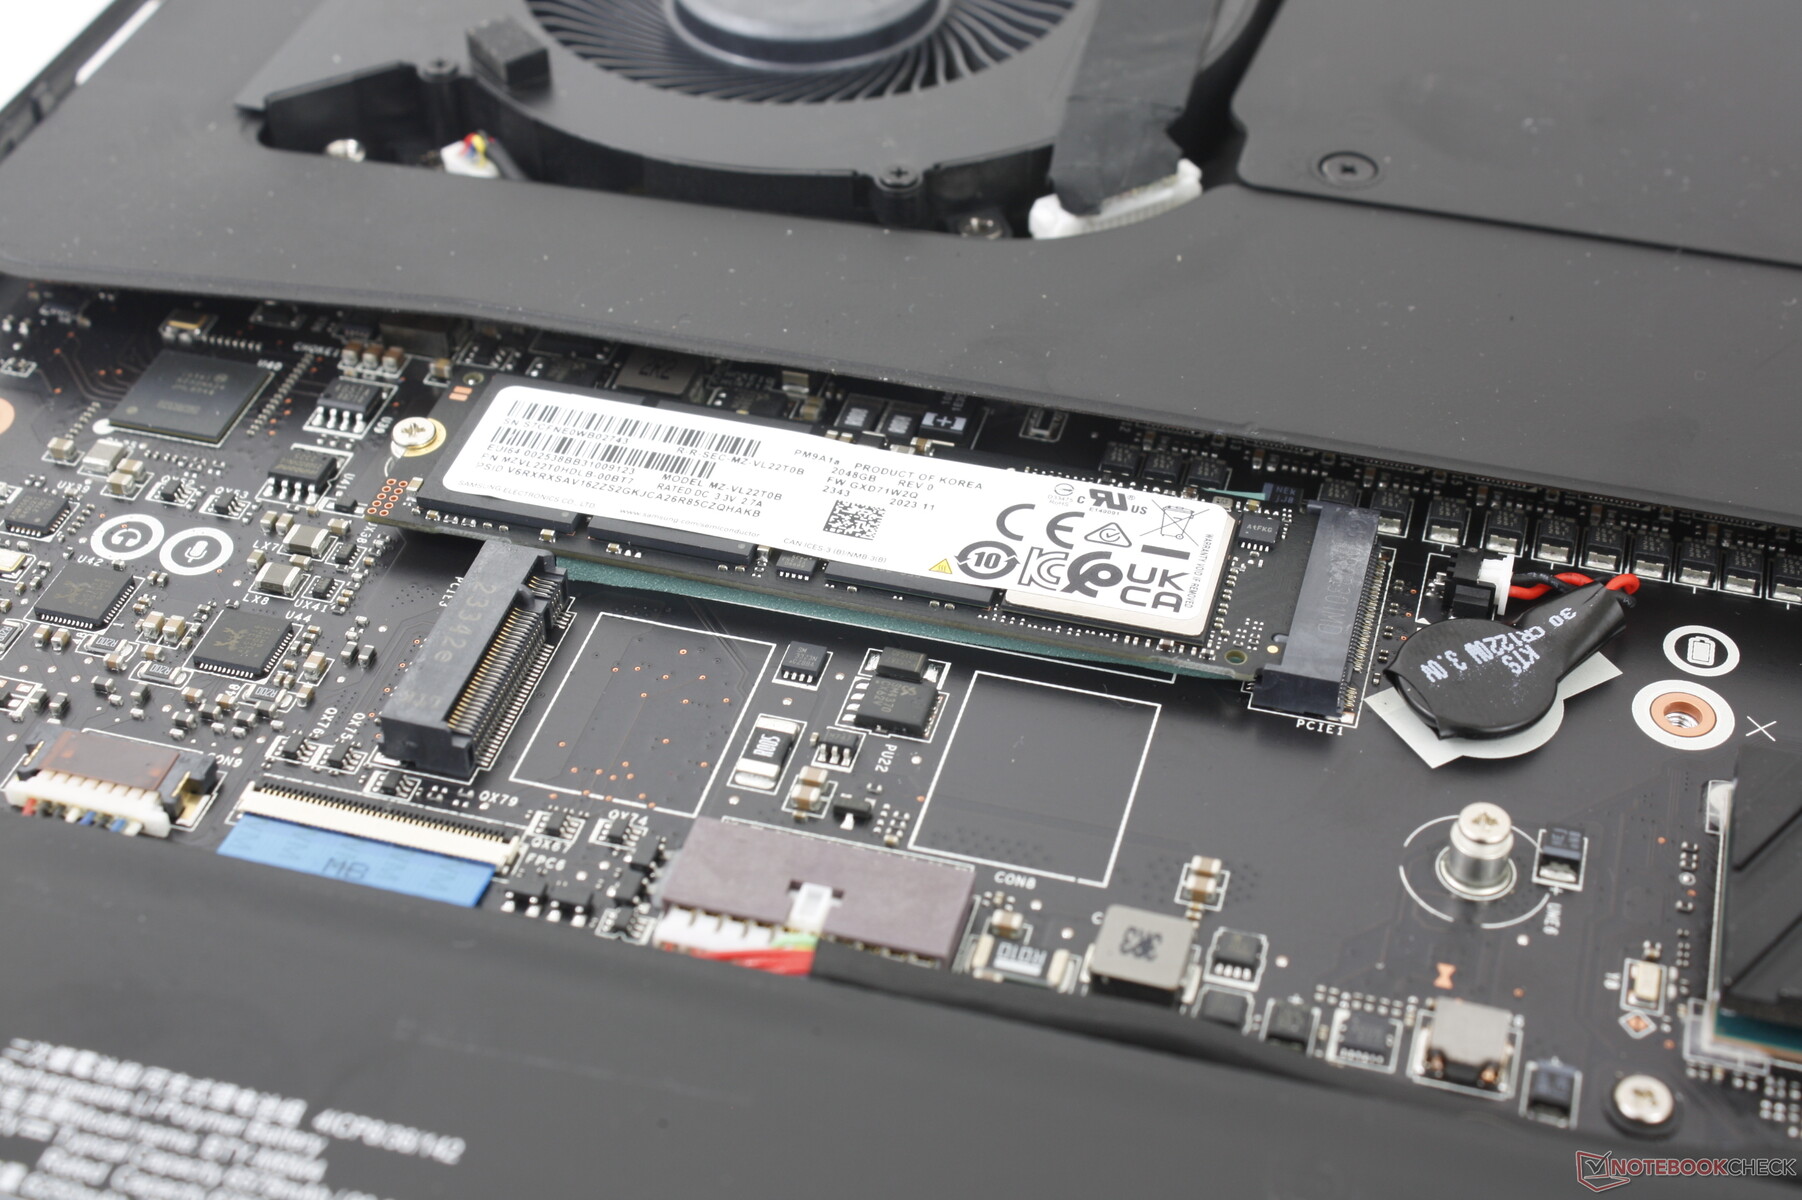
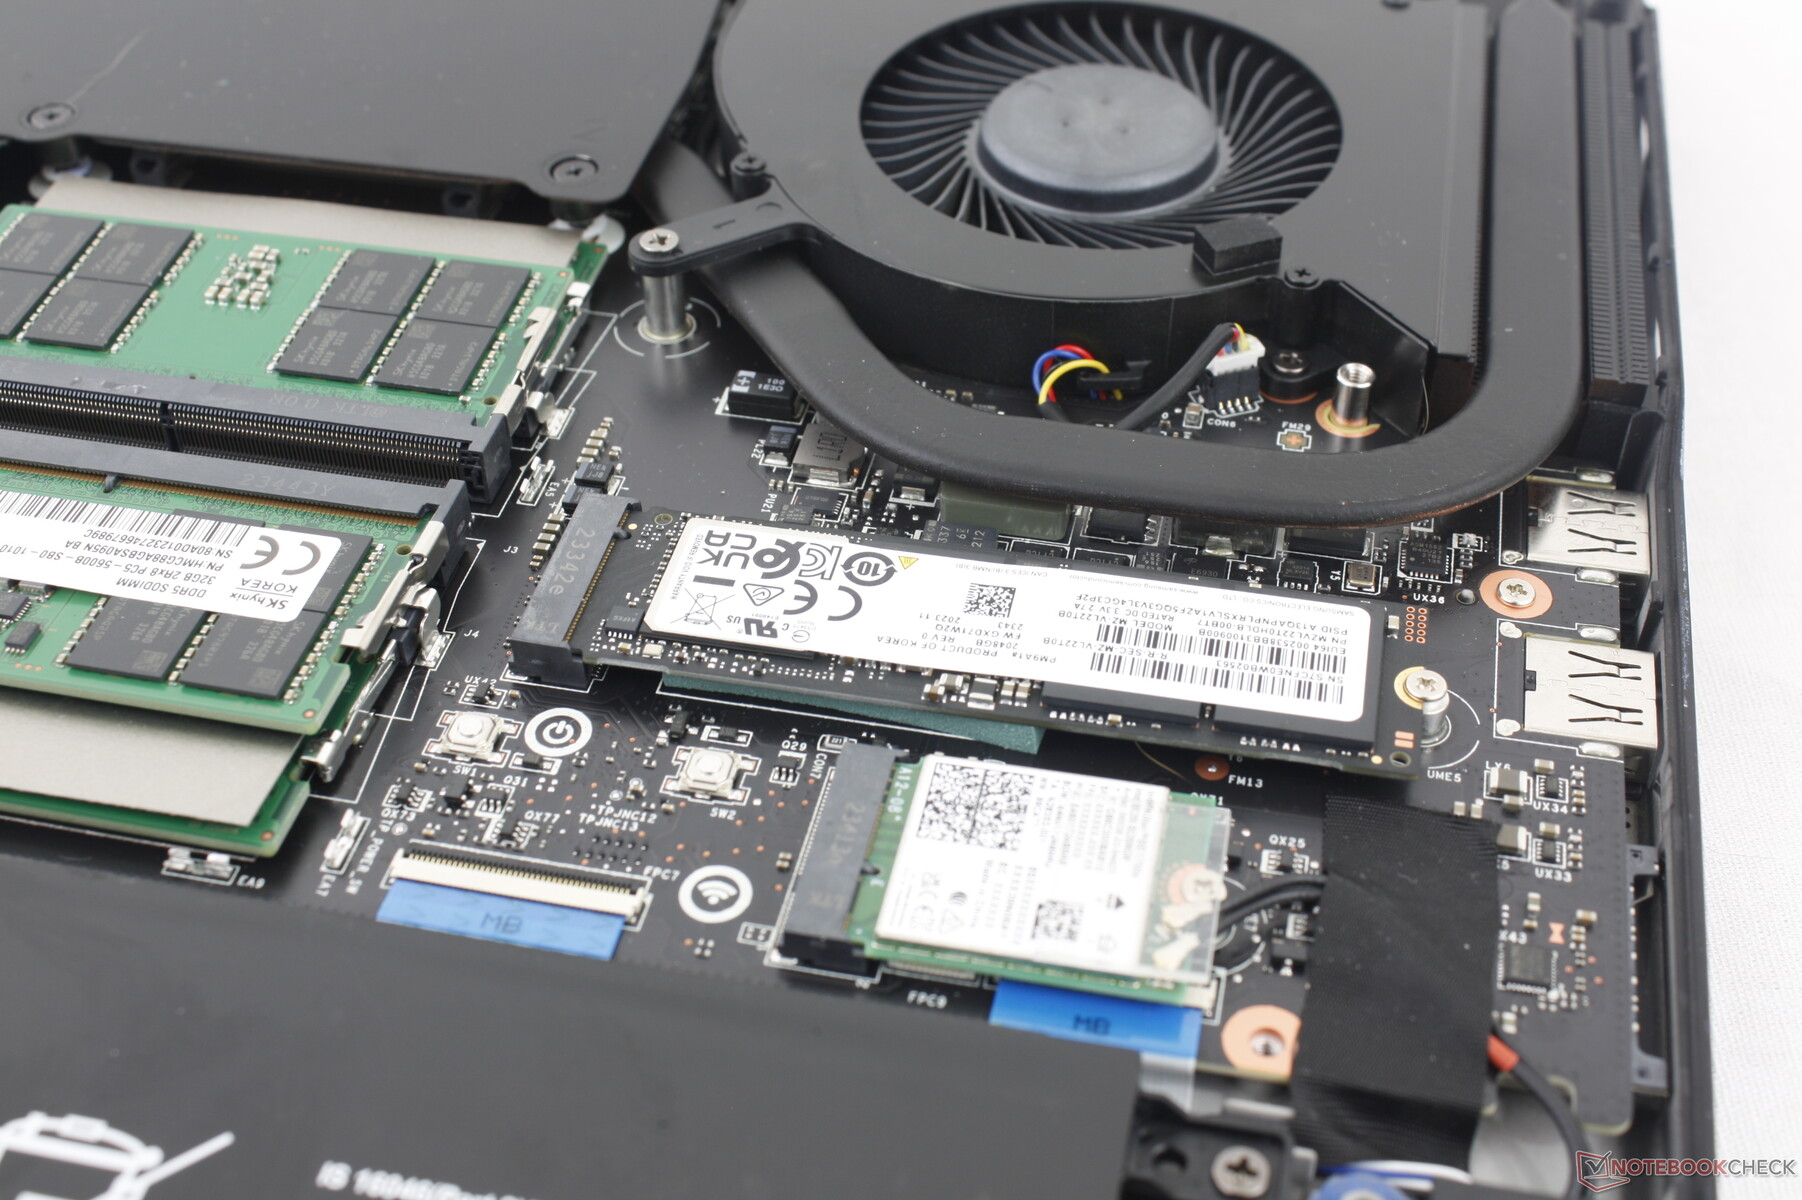
Bottenpanelen är fäst med 12 stjärnskruvar för relativt enkel service. Tänk dock på att fabriksförseglingens klistermärke måste brytas för att göra det.
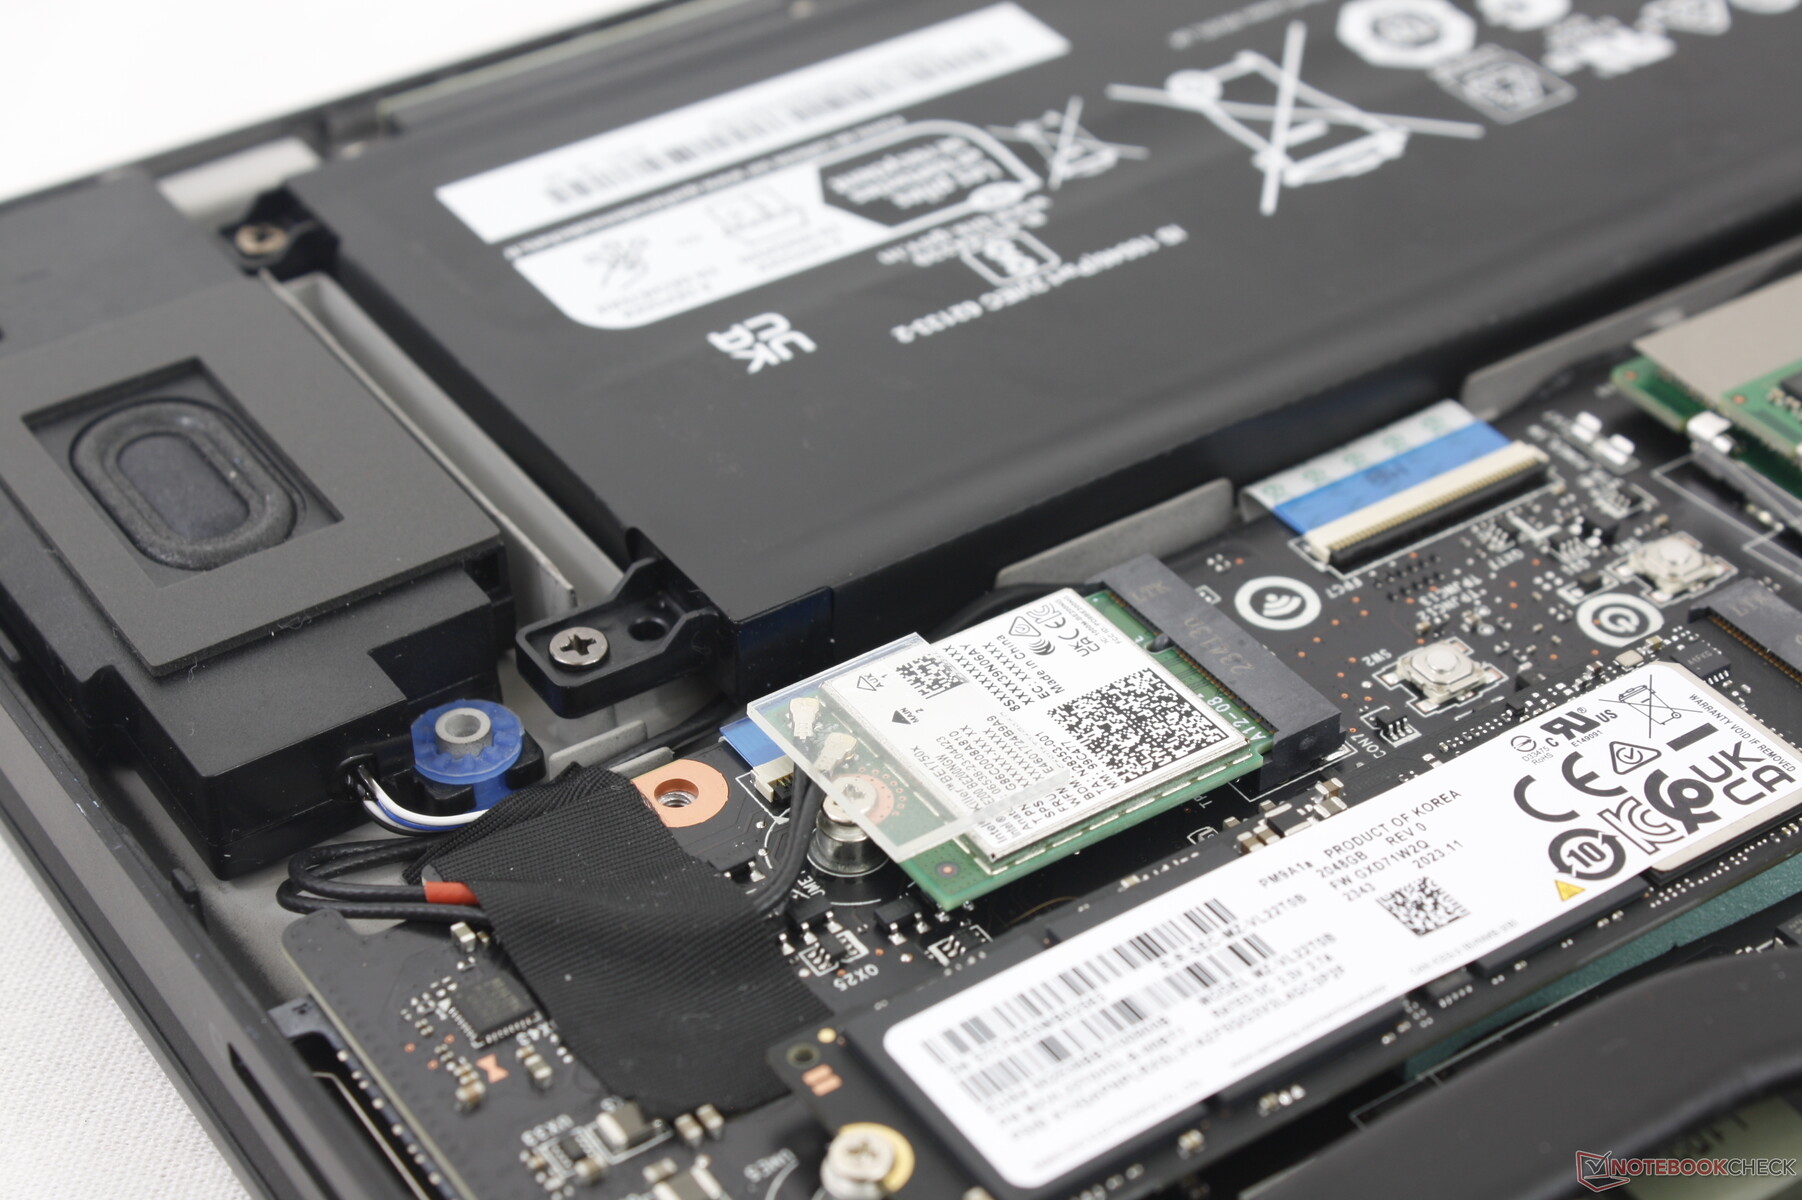
Väl på insidan har användarna direkt tillgång till 4x SODIMM-platser, 3x M.2 2280 SSD-platser (2x PCIe4 x4, 1x PCIe5 x4) och den löstagbara WLAN-modulen. Förra årets GT77 hade stöd för upp till fyra SSD-enheter i jämförelse och lagringsalternativen är därför något mer begränsade den här gången.
Tillbehör och garanti
Förpackningen innehåller en USB-mus (M99 Pro), en rengöringsduk i sammet, ett USB-minne på 256 GB och en nyckelring med Lucky the Dragon. Märkligt nog är nyckelringen svart istället för röd, vilket är hur maskoten vanligtvis avbildas.
En ettårig begränsad tillverkargaranti ingår som standard vid köp i USA.
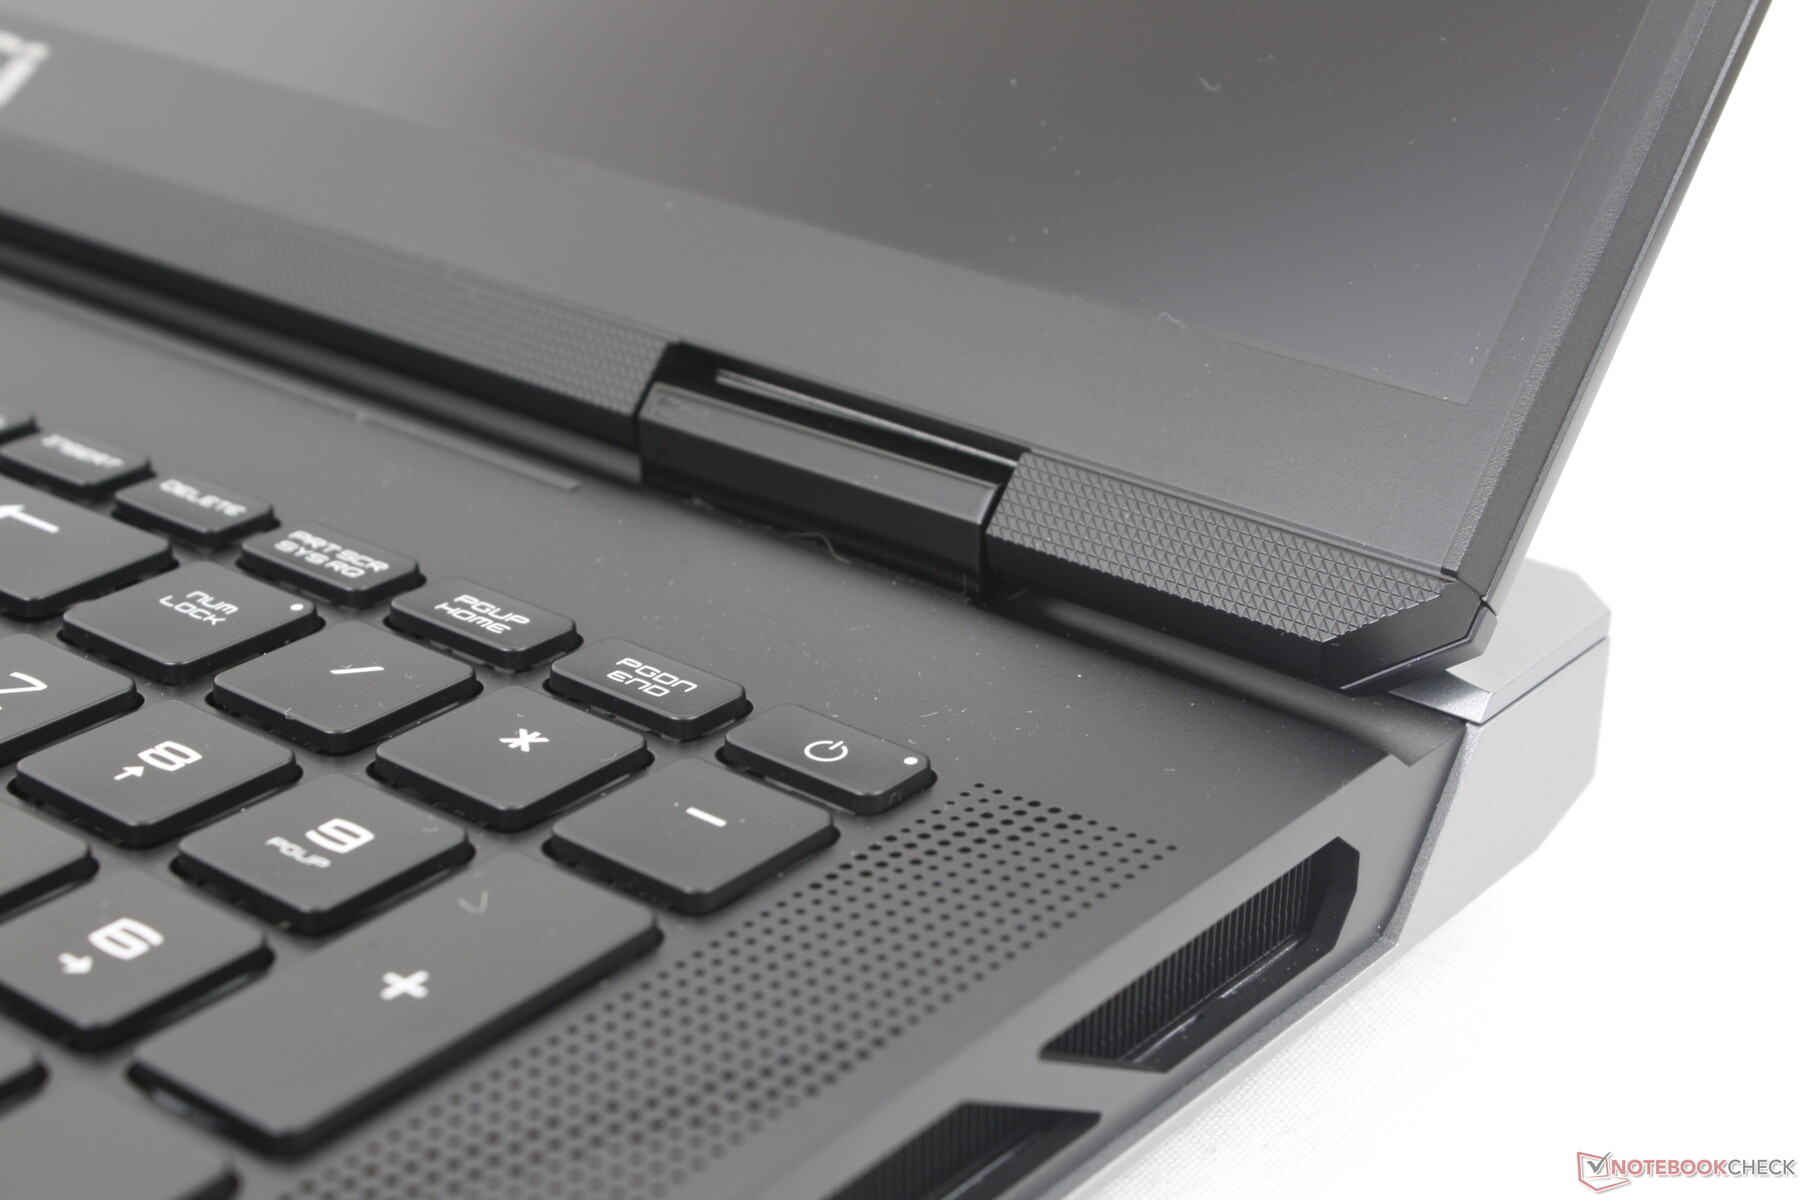
Inmatningsenheter - bekväma och klickvänliga tangenter
Tangentbord
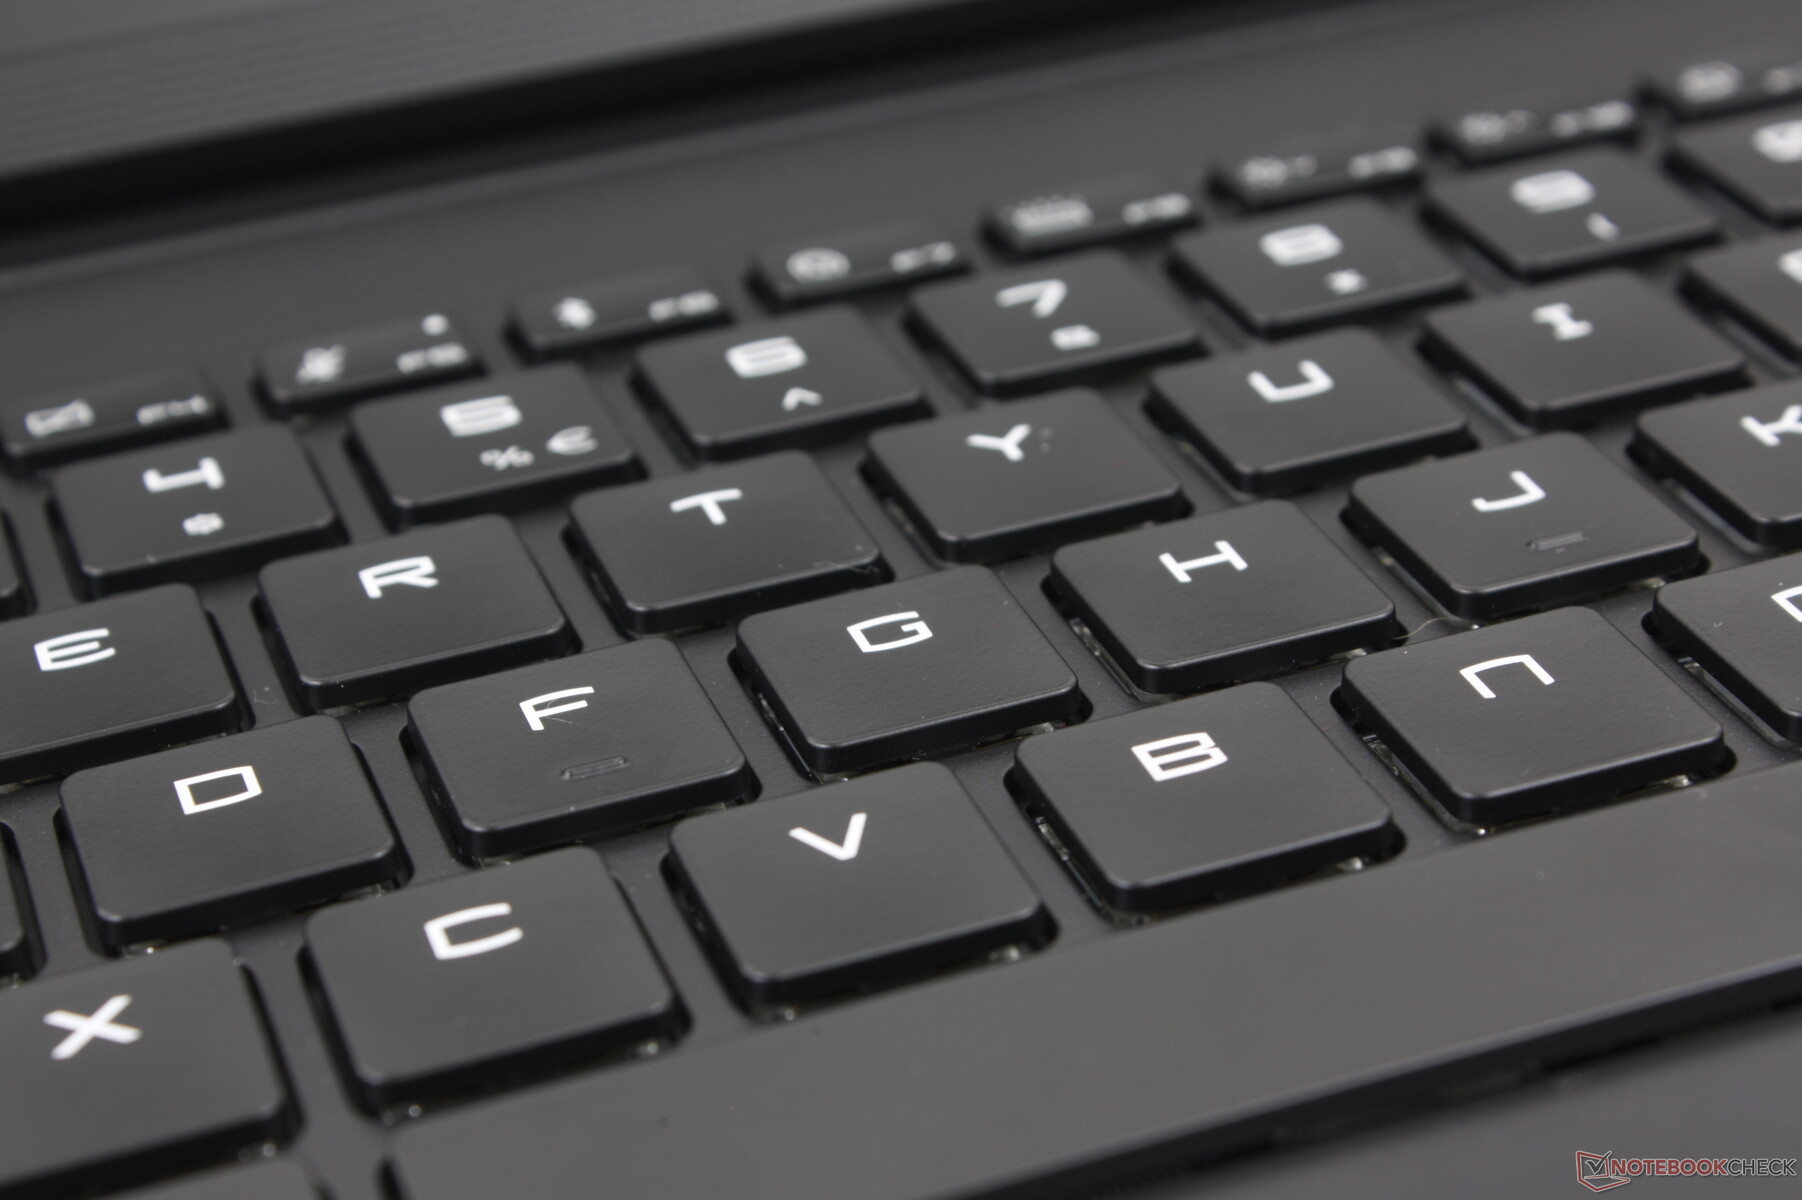
Det mekaniska Cherry RGB-tangentbordet med ultralåg profil är standard på alla konfigurationer, i likhet med vad som finns tillgängligt på vissa Alienware-modeller. Skrivupplevelsen är en av de bästa vi har haft på en bärbar dator när det gäller rörelse och återkoppling, eftersom skillnaderna märks omedelbart jämfört med vanliga membranbaserade tangenter. Den största nackdelen är naturligtvis det högre och höga ljudet, särskilt när du trycker på Enter- och Space-tangenterna. Det här är definitivt inte ett tangentbord som du vill använda i klassrum eller bibliotek.
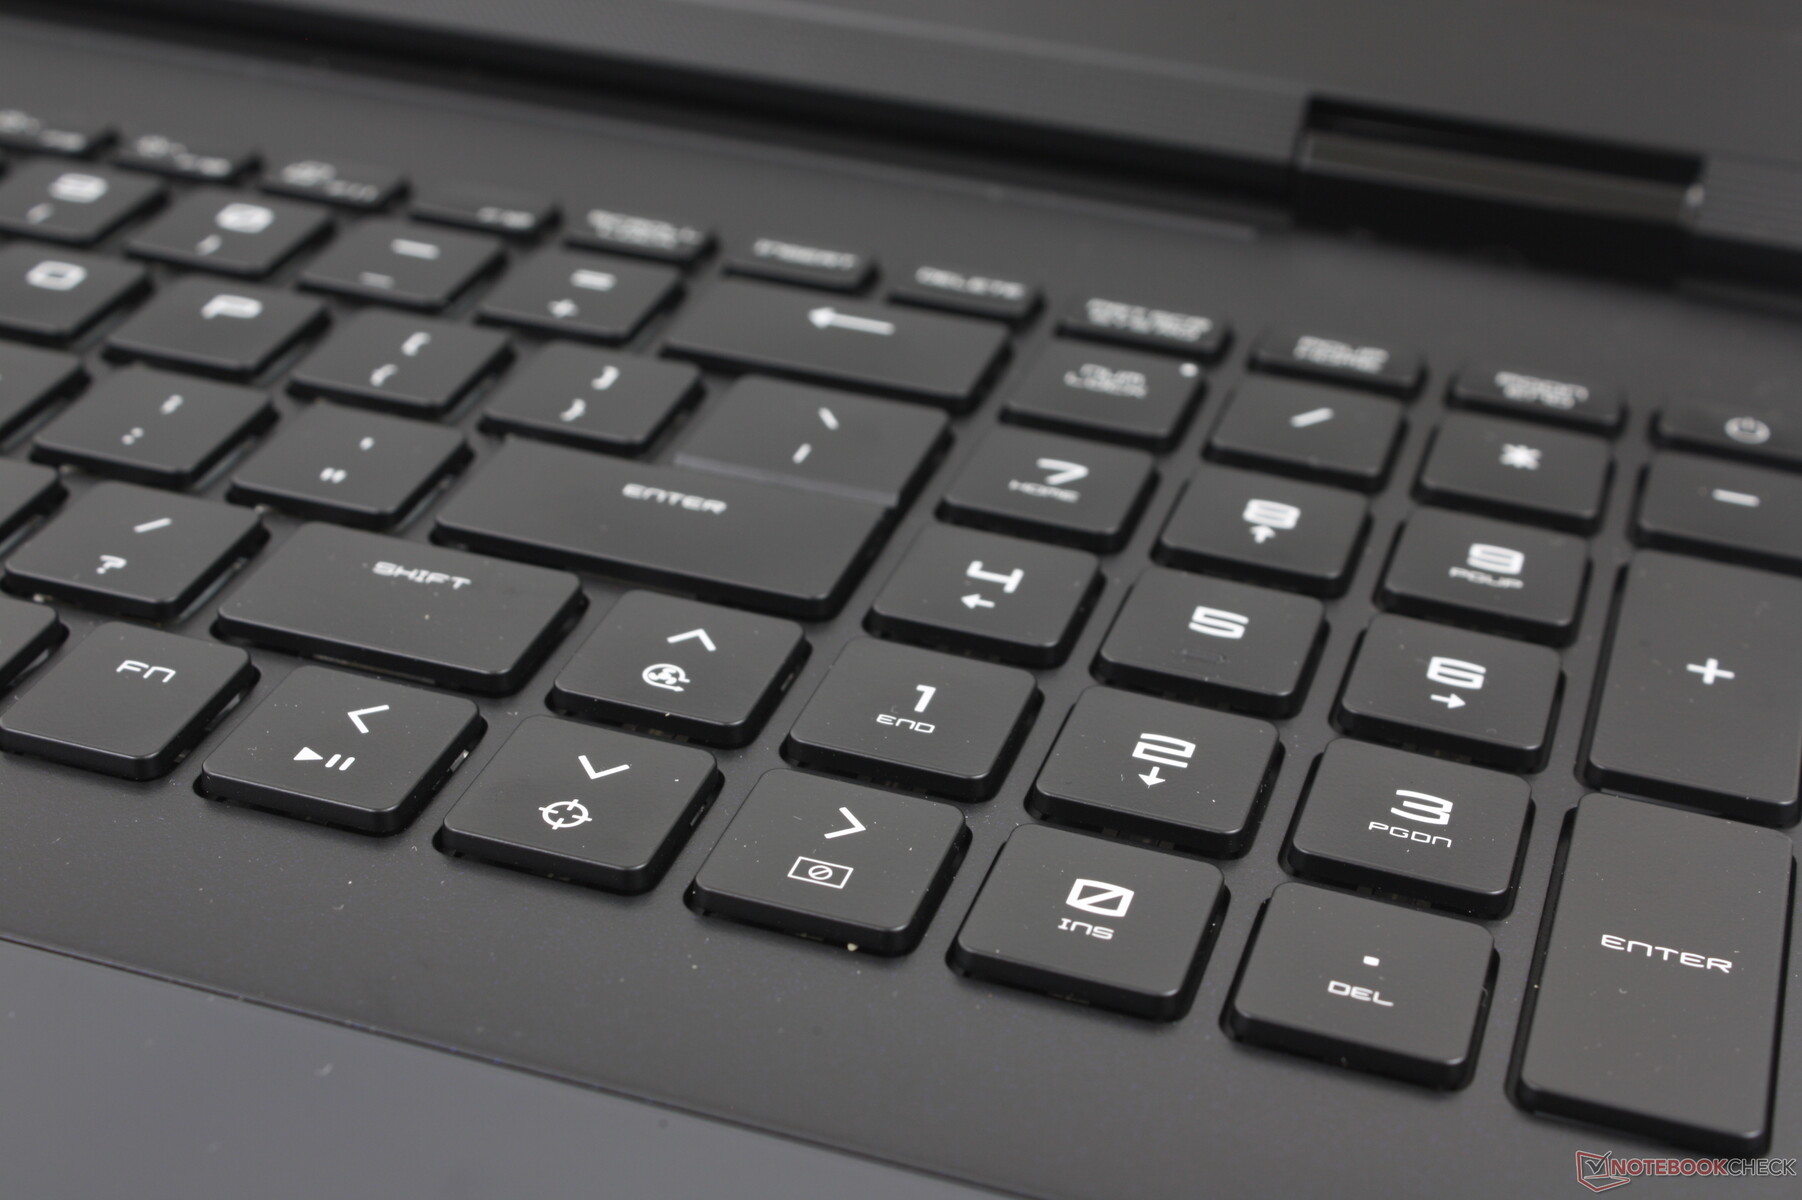
Tyvärr är inte alla tangenter mekaniska på Titan 18 HX. Numpad- och piltangenterna är istället membranbaserade och känns därför mjukare och tystare när de trycks ned.
Pekplatta
Den 13 x 8,2 cm stora klickplattan är RGB-belyst precis som på vissa Alienware-modeller. Skillnaden här är dock att MSI:s klickplatta är helt i linje med de omgivande handledsstöden för en jämn och övergångsfri yta från kant till kant. Den här metoden är snygg och sexig, men den är mindre praktisk än en traditionell klickplatta med taktila kanter och hörn. Att trycka ned musklick blir också svårare och mer opålitligt, särskilt för multi-touch-inmatningar som att dra och släppa. Standardförpackningen innehåller en gratis USB-mus och det är tydligt att MSI lutade sig mot form över funktion när de utformade klickplattan.
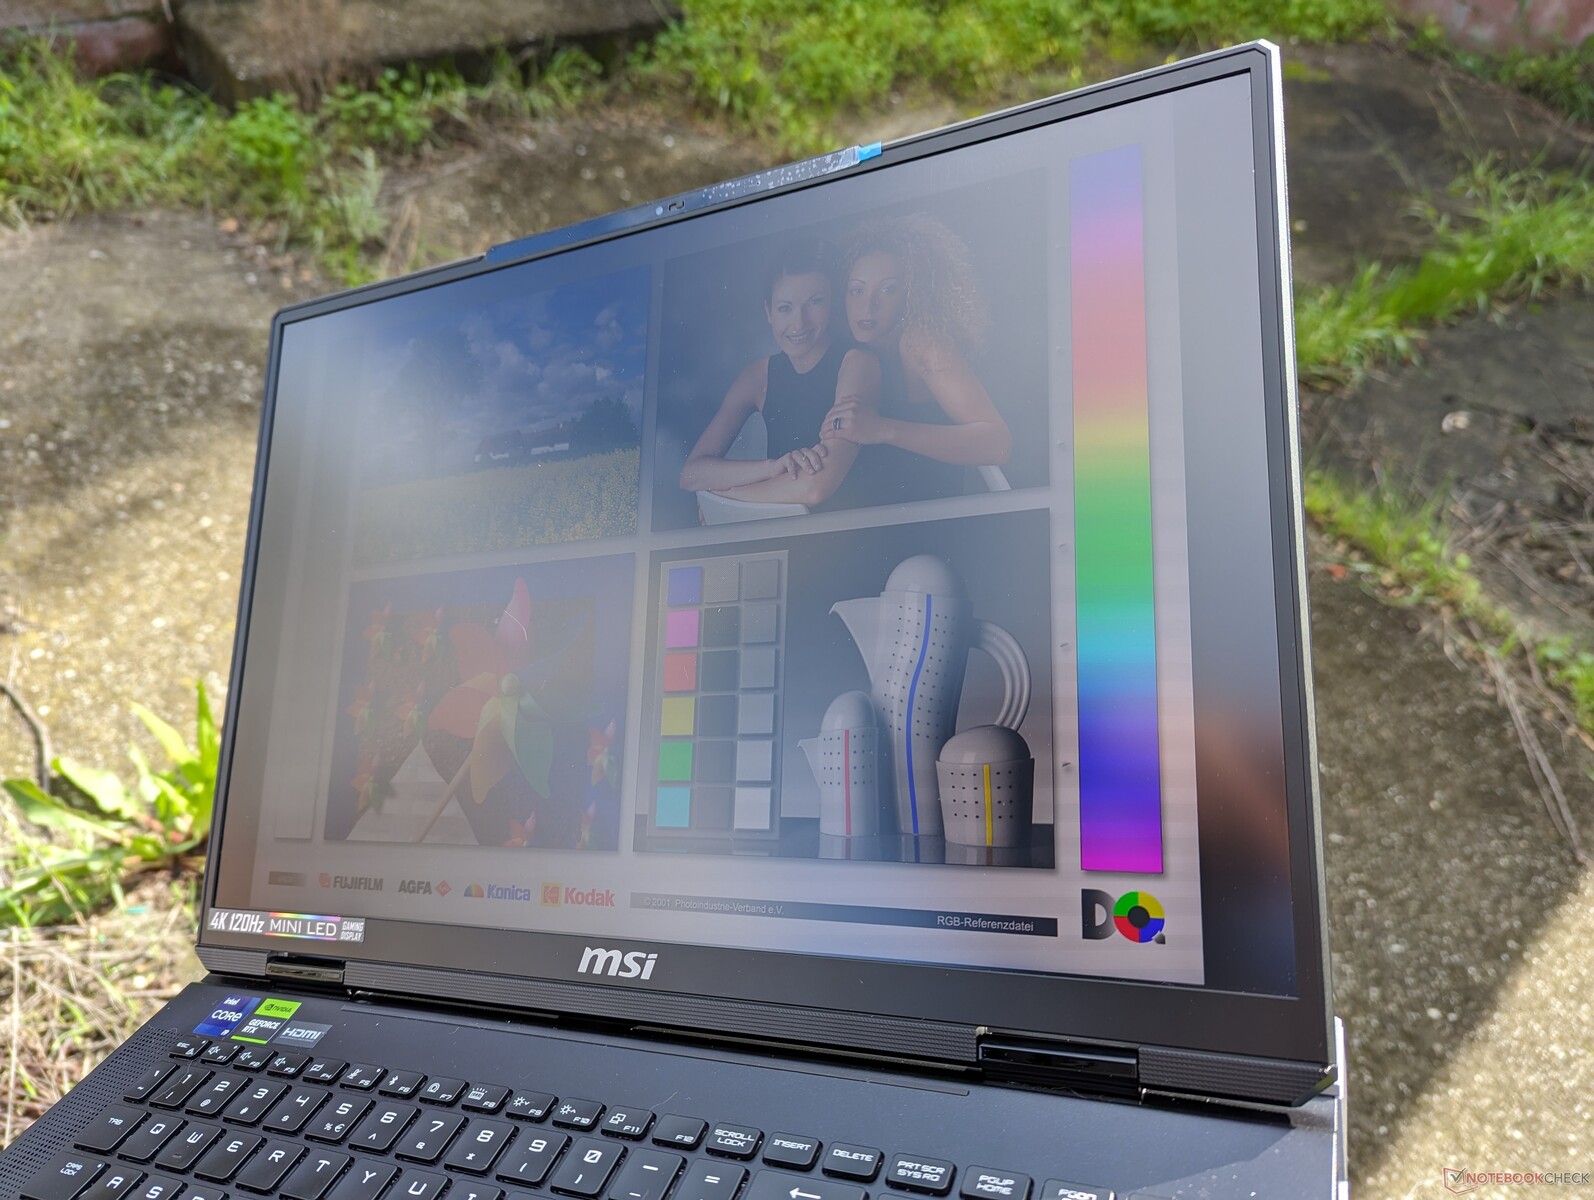
Display - helt klart den mest utmärkande egenskapen hos Titan 18 HX
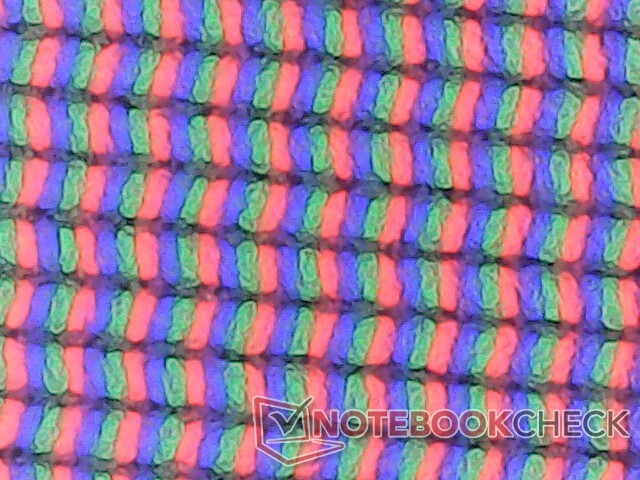
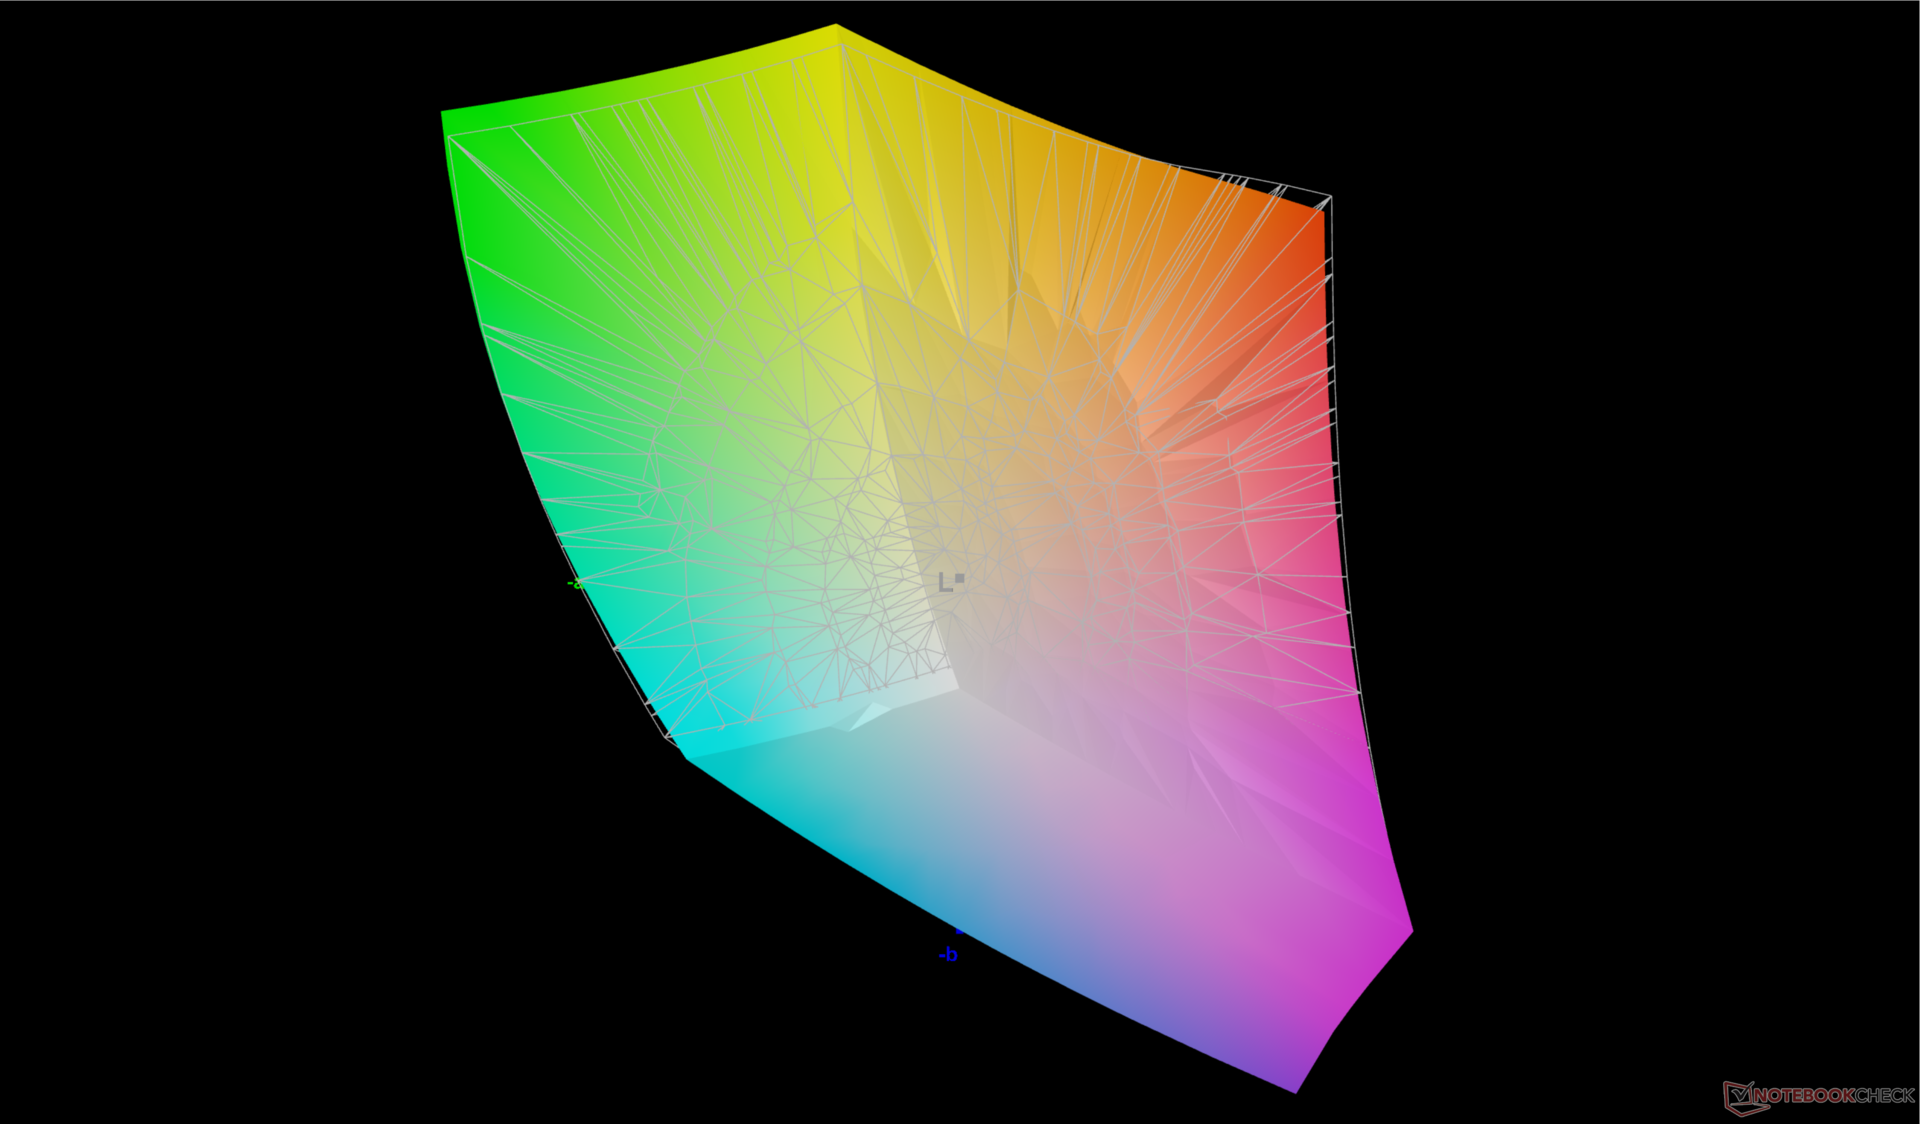
Titan 18 HX är en av de första bärbara 18-tumsdatorerna med en 120 Hz 4K mini-LED-skärm som lanseras i år. Jämfört med IPS och OLED kan mini-LED-paneler vara mycket ljusstarkare samtidigt som de fortfarande erbjuder liknande DCI-P3-färger och svartnivåer som OLED för bättre HDR-stöd. I det här fallet kan Titan 18 HX-skärmen nå upp till 1155 nits i HDR-läge enligt vår kolorimeter för att stödja uppspelning av HDR1000. I SDR-läge är skärmen begränsad till cirka 470 nits, vilket liknar många IPS-paneler.
Tänk på att HDR-läget inte är tillgängligt om du kör på batteri. Maximal ljusstyrka sjunker till endast 323 nits vid batteridrift även om skärmens strömsparfunktion är avaktiverad. Vi är inte säkra på om det senare är en bugg, men minskningen i ljusstyrka är verkligen märkbar mellan batteri- och nätdrift.
Tyvärr är den största nackdelen med skärmen att den inte stöder G-Sync eller variabel uppdateringsfrekvens (VRR). Den kan också vara mycket strömkrävande på grund av sin höga ljusstyrka, vilket framgår av vårt avsnitt om strömförbrukning nedan. Skärmen är dock fortfarande en av de bästa vi har sett på en bärbar dator för både spel- och multimediasyften.
| |||||||||||||||||||||||||
Distribution av ljusstyrkan: 90 %
Mitt på batteriet: 323 cd/m²
Kontrast: ∞:1 (Svärta: 0 cd/m²)
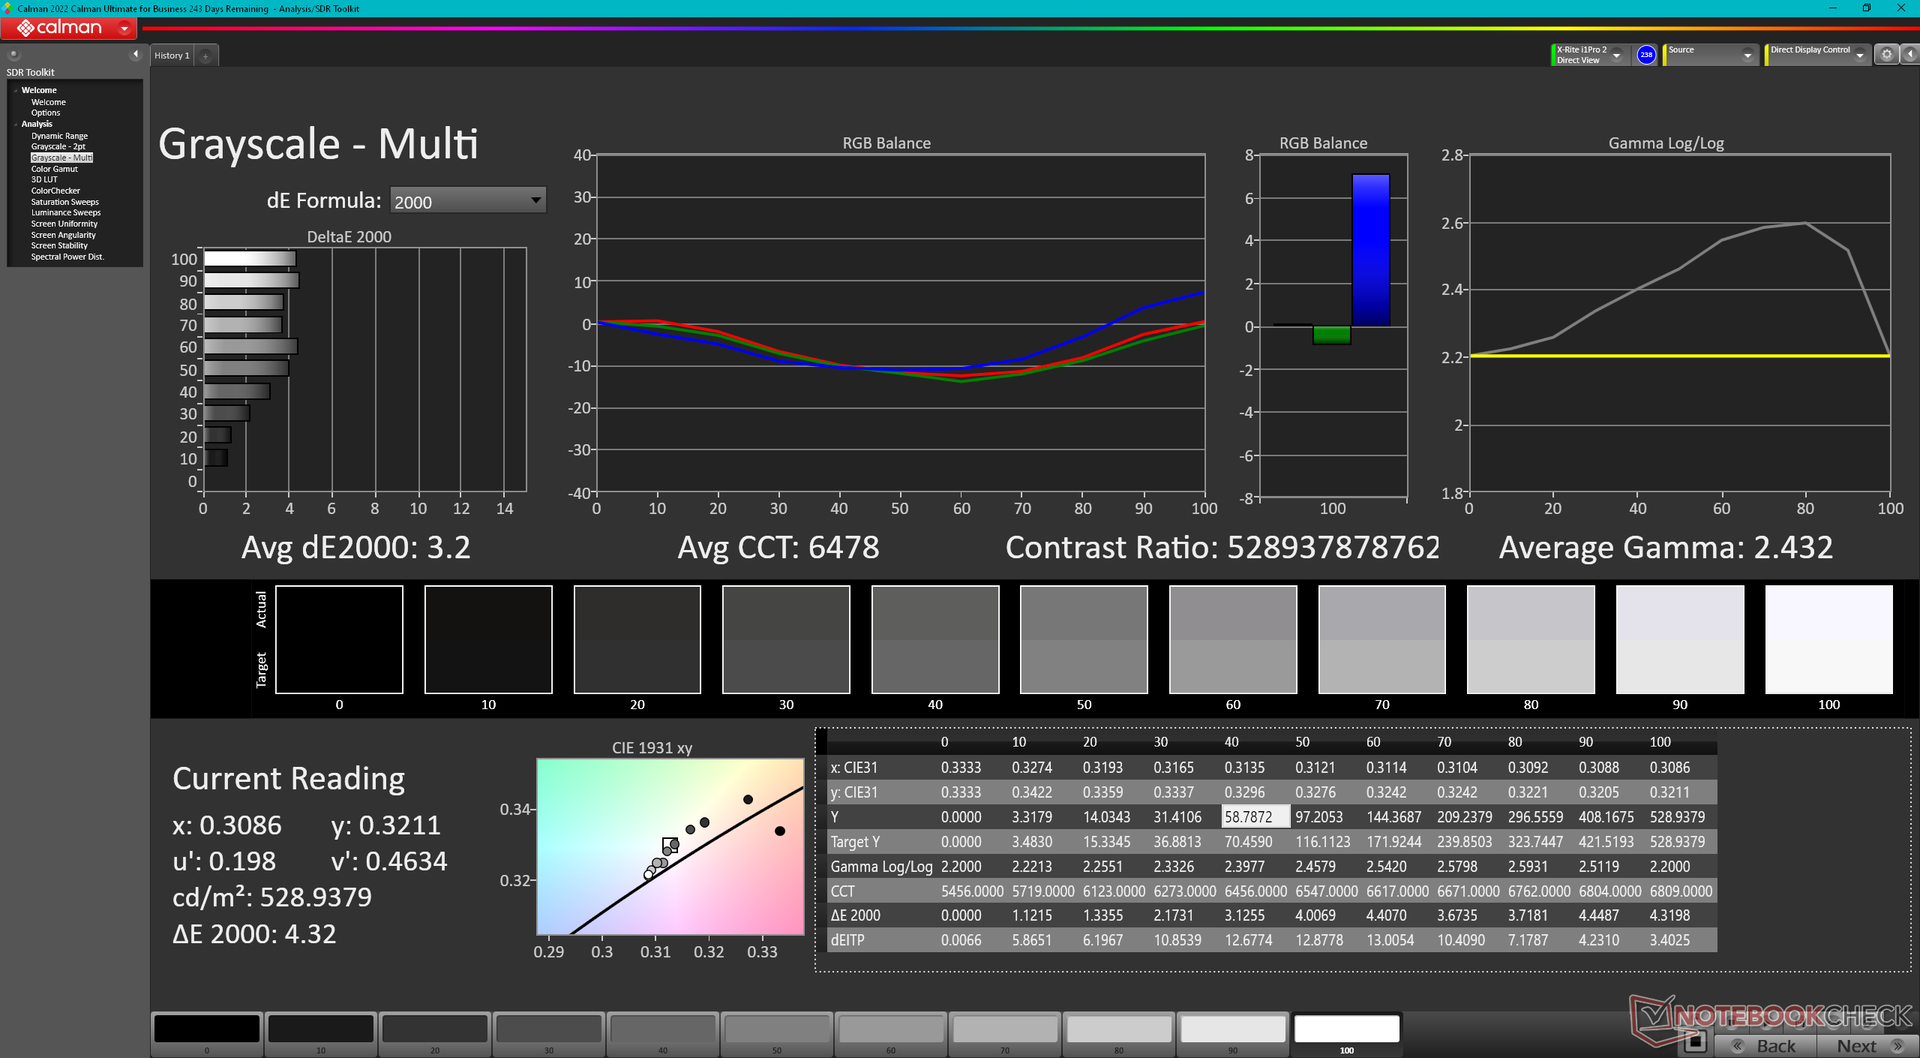
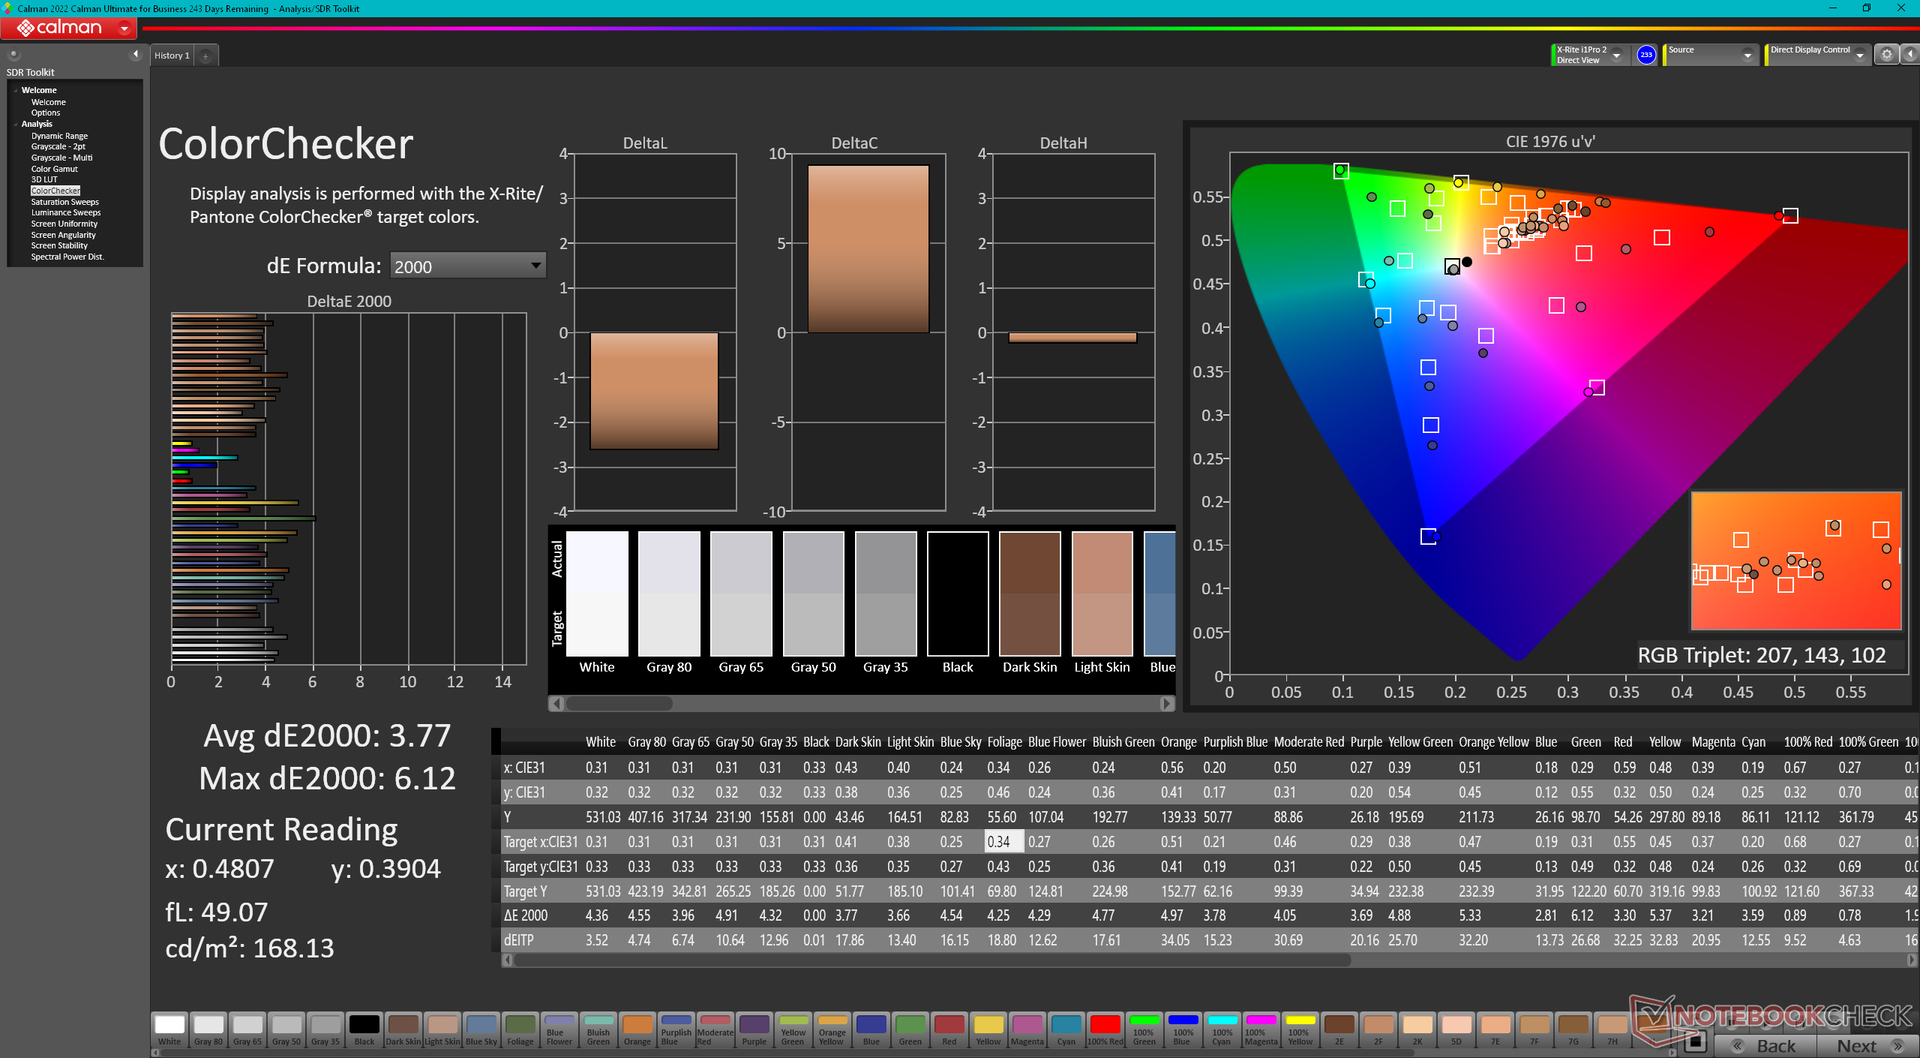
ΔE ColorChecker Calman: 3.77 | ∀{0.5-29.43 Ø4.71}
calibrated: 2.94
ΔE Greyscale Calman: 3.2 | ∀{0.09-98 Ø4.96}
86.2% AdobeRGB 1998 (Argyll 3D)
99.8% sRGB (Argyll 3D)
98.1% Display P3 (Argyll 3D)
Gamma: 2.43
CCT: 6478 K
| MSI Titan 18 HX A14VIG AU Optronics B180ZAN01.0, Mini-LED, 3840x2400, 18" | MSI Titan GT77 HX 13VI B173ZAN06.C, Mini-LED, 3840x2160, 17.3" | Alienware m18 R1 Chi Mei 180JME, IPS, 1920x1200, 18" | Asus ROG Strix G18 G814JI NE180QDM-NZ2 (BOE0B35), IPS, 2560x1600, 18" | Acer Predator Helios 18 N23Q2 AUO45A8 (B180QAN01.2), IPS, 2560x1600, 18" | Razer Blade 18 RTX 4070 AU Optronics B180QAN01.0, IPS, 2560x1600, 18" | |
|---|---|---|---|---|---|---|
| Display | 1% | 1% | -0% | 3% | -1% | |
| Display P3 Coverage (%) | 98.1 | 94.9 -3% | 97.7 0% | 98.1 0% | 99.8 2% | 96.9 -1% |
| sRGB Coverage (%) | 99.8 | 99.9 0% | 100 0% | 99.9 0% | 100 0% | 99.8 0% |
| AdobeRGB 1998 Coverage (%) | 86.2 | 92.4 7% | 89.8 4% | 85.6 -1% | 91.8 6% | 85.3 -1% |
| Response Times | -140% | 77% | 62% | 45% | 71% | |
| Response Time Grey 50% / Grey 80% * (ms) | 8.6 ? | 38.4 ? -347% | 3 ? 65% | 5.6 ? 35% | 7.6 ? 12% | 4.2 ? 51% |
| Response Time Black / White * (ms) | 81.8 ? | 26.6 ? 67% | 9.9 ? 88% | 9 ? 89% | 17.8 ? 78% | 8 ? 90% |
| PWM Frequency (Hz) | 2592 ? | 2380 ? | 2509 | |||
| Screen | -9% | 28% | 21% | -14% | 11% | |
| Brightness middle (cd/m²) | 467.5 | 606 30% | 372.8 -20% | 471 1% | 360 -23% | 549.6 18% |
| Brightness (cd/m²) | 459 | 602 31% | 367 -20% | 422 -8% | 355 -23% | 524 14% |
| Brightness Distribution (%) | 90 | 93 3% | 97 8% | 83 -8% | 92 2% | 89 -1% |
| Black Level * (cd/m²) | 0.0001 | 0.32 | 0.47 | 0.21 | 0.53 | |
| Colorchecker dE 2000 * | 3.77 | 4.8 -27% | 1.92 49% | 2.05 46% | 3.82 -1% | 3.32 12% |
| Colorchecker dE 2000 max. * | 6.12 | 8.2 -34% | 3.65 40% | 4.15 32% | 7.38 -21% | 6.63 -8% |
| Colorchecker dE 2000 calibrated * | 2.94 | 1.8 39% | 0.51 83% | 0.8 73% | 2.24 24% | 2.7 8% |
| Greyscale dE 2000 * | 3.2 | 6.5 -103% | 1.5 53% | 2.8 13% | 5.06 -58% | 2 37% |
| Gamma | 2.43 91% | 2.63 84% | 2.34 94% | 2.204 100% | 2.52 87% | 2.29 96% |
| CCT | 6478 100% | 6596 99% | 6607 98% | 7122 91% | 5657 115% | 6319 103% |
| Contrast (:1) | 6060000 | 1165 | 1002 | 1714 | 1037 | |
| Totalt genomsnitt (program/inställningar) | -49% /
-28% | 35% /
29% | 28% /
23% | 11% /
-0% | 27% /
18% |
* ... mindre är bättre
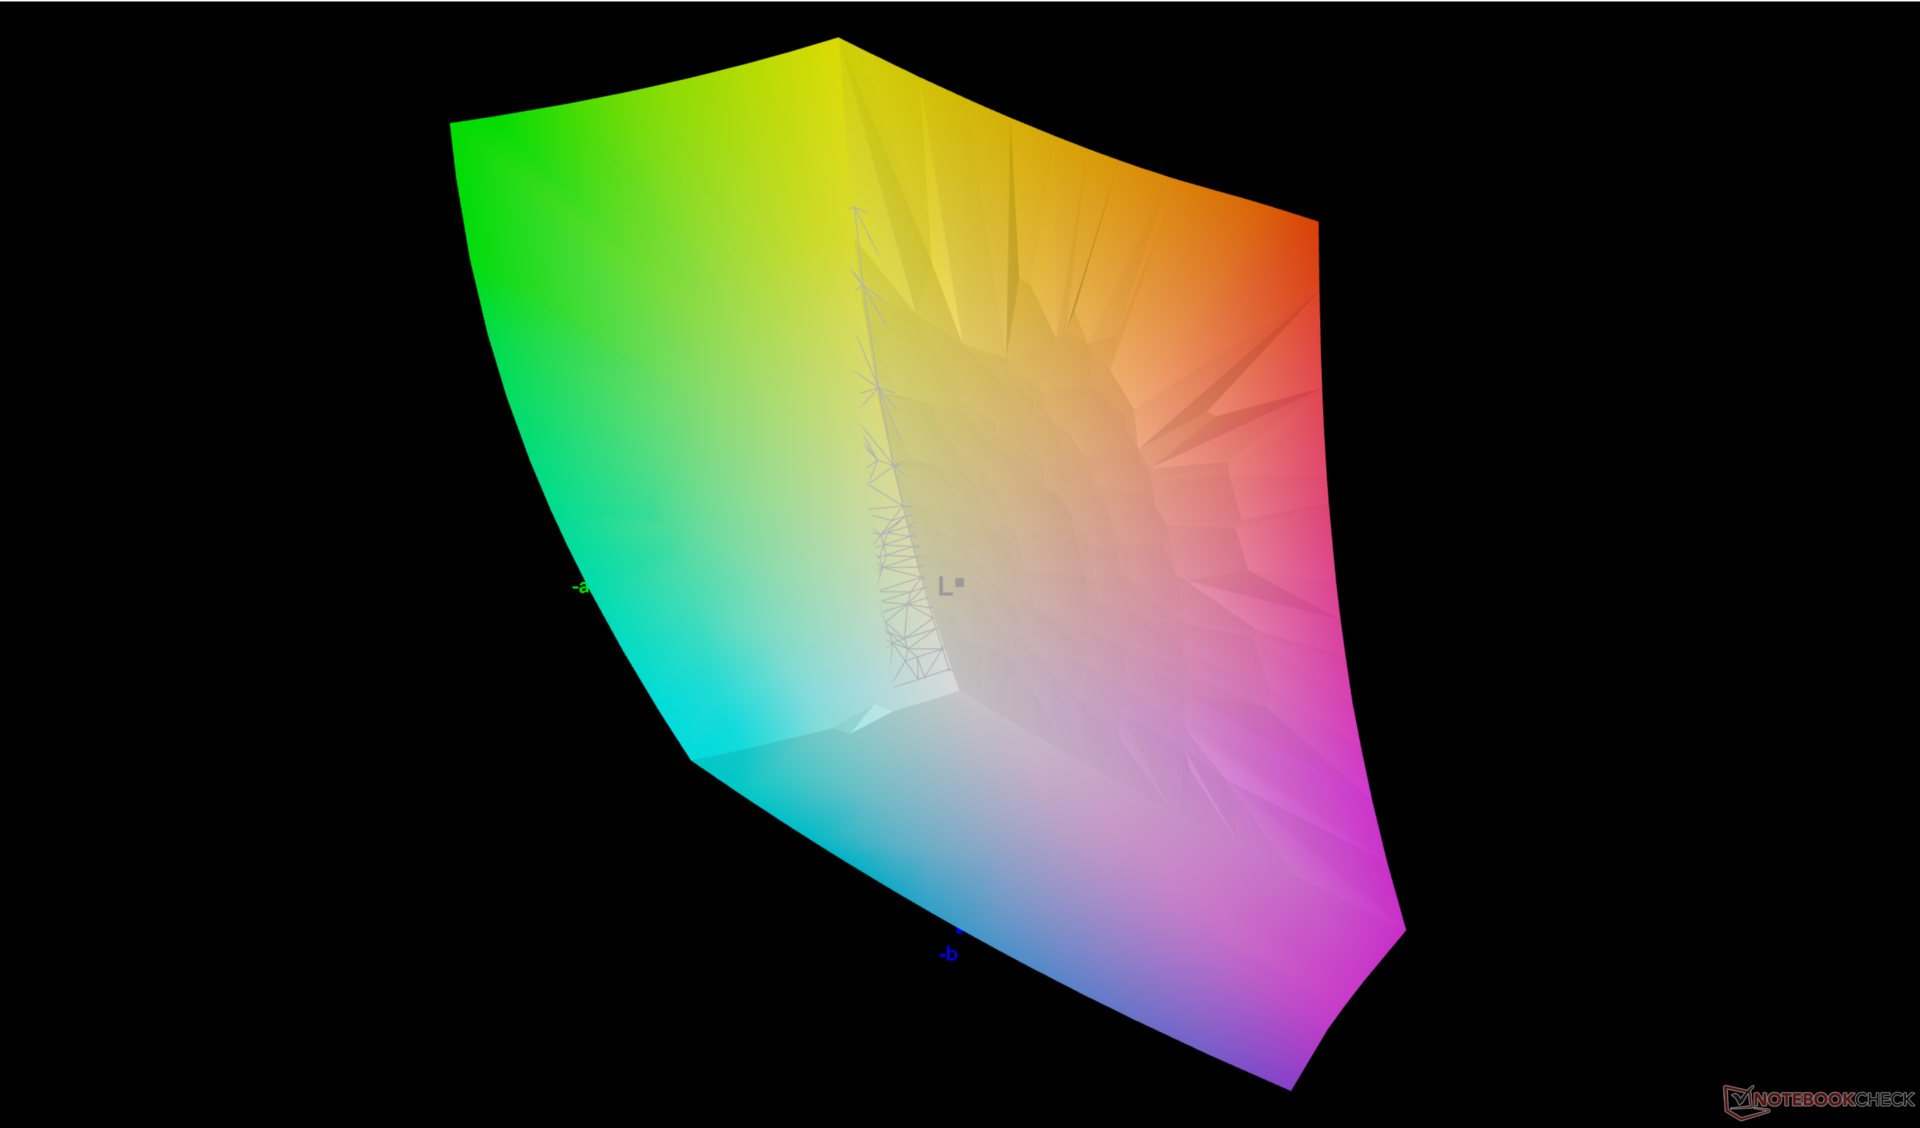
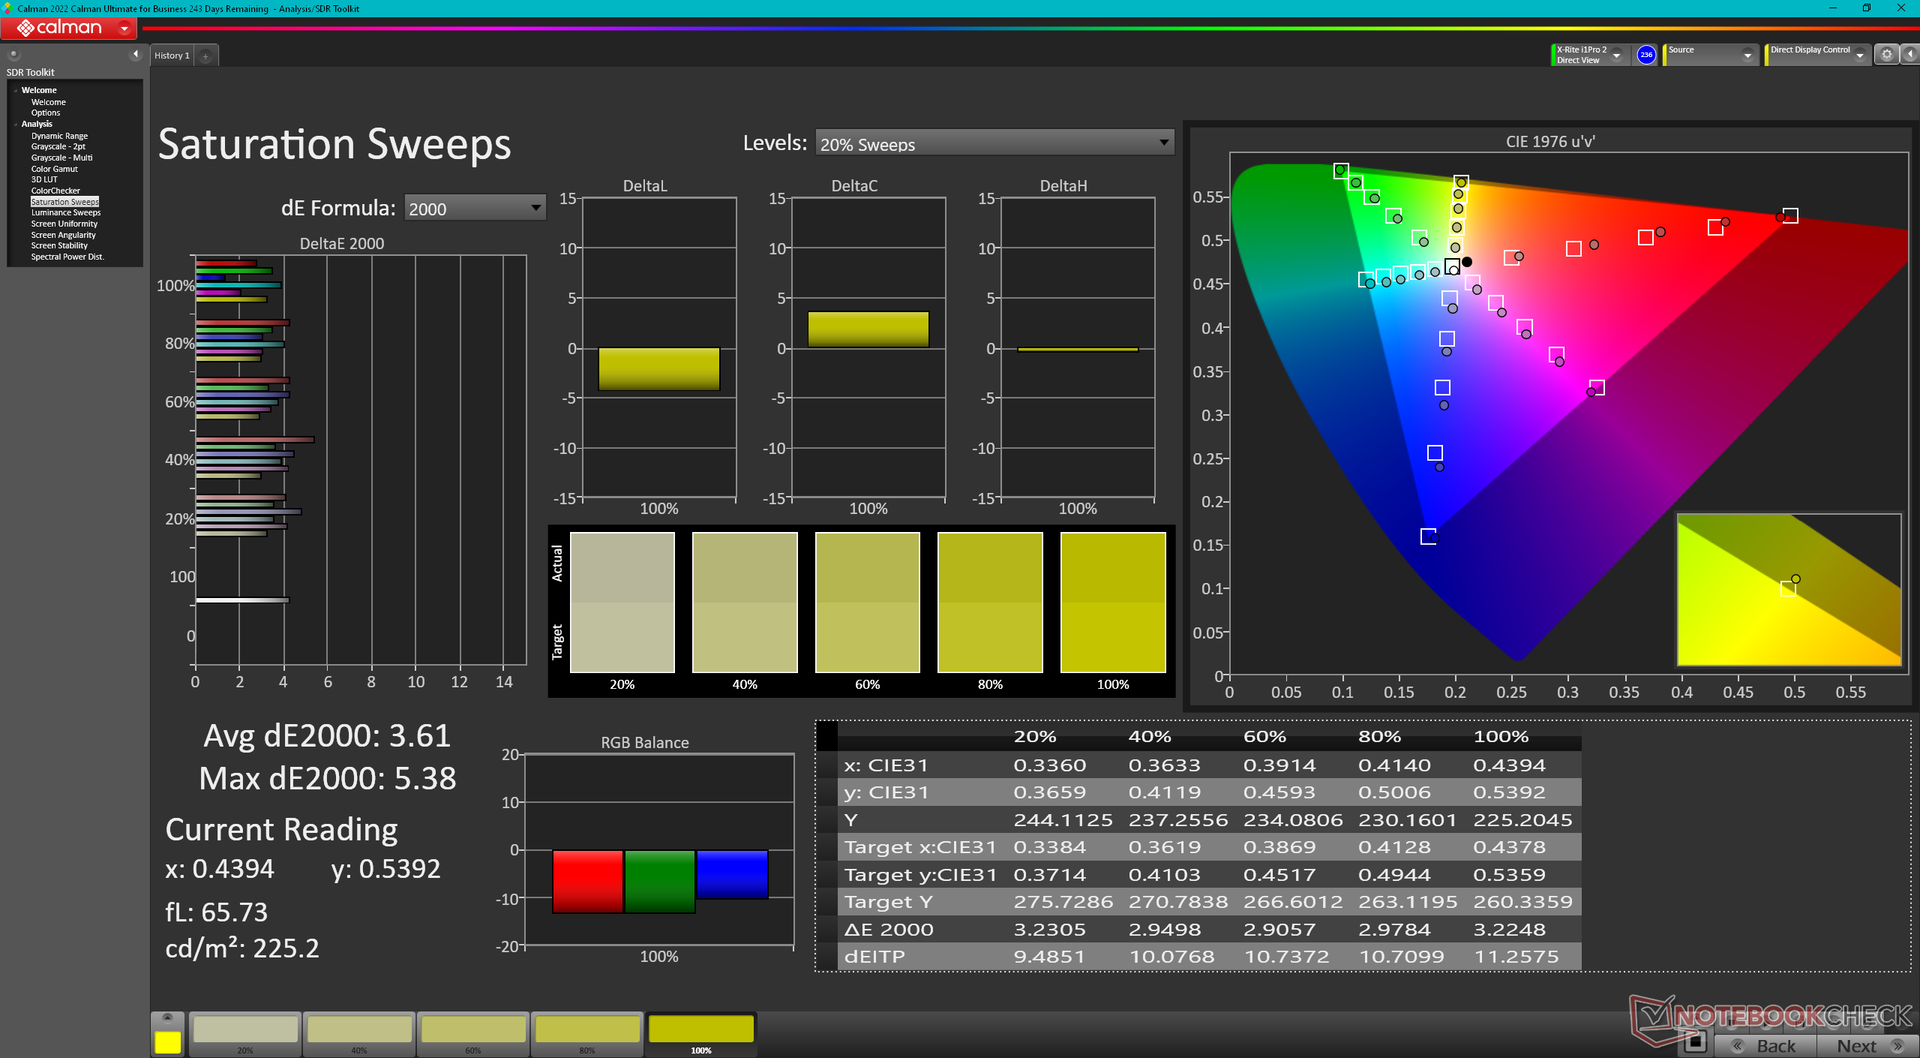
MSI annonserar inga Pantone-kalibreringsinsatser trots det höga priset på Titan. Genomsnittliga deltaE-värden för gråskala och färg är trots detta fortfarande mycket bra med 3,2 respektive 3,77.
Visa svarstider
| ↔ Svarstid svart till vitt | ||
|---|---|---|
| 81.8 ms ... stiga ↗ och falla ↘ kombinerat | ↗ 76 ms stiga | 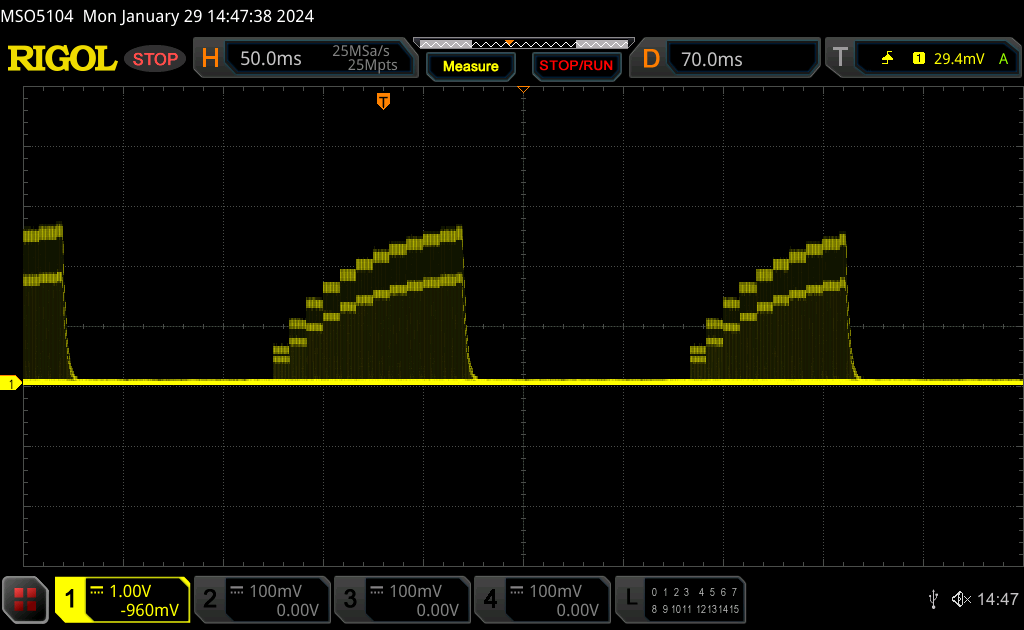 |
| ↘ 5.8 ms hösten | ||
| Skärmen visar långsamma svarsfrekvenser i våra tester och kommer att vara otillfredsställande för spelare. I jämförelse sträcker sig alla testade enheter från 0.1 (minst) till 240 (maximalt) ms. » 100 % av alla enheter är bättre. Detta innebär att den uppmätta svarstiden är sämre än genomsnittet av alla testade enheter (19.8 ms). | ||
| ↔ Svarstid 50 % grått till 80 % grått | ||
| 8.6 ms ... stiga ↗ och falla ↘ kombinerat | ↗ 4.2 ms stiga | 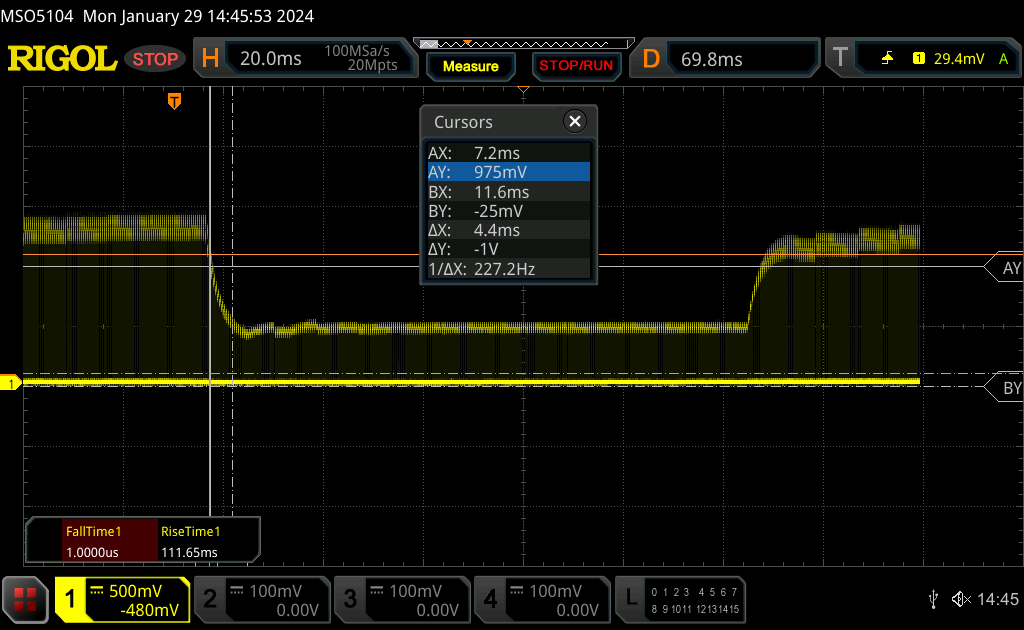 |
| ↘ 4.4 ms hösten | ||
| Skärmen visar snabba svarsfrekvenser i våra tester och bör passa för spel. I jämförelse sträcker sig alla testade enheter från 0.165 (minst) till 636 (maximalt) ms. » 22 % av alla enheter är bättre. Det betyder att den uppmätta svarstiden är bättre än genomsnittet av alla testade enheter (30.9 ms). | ||
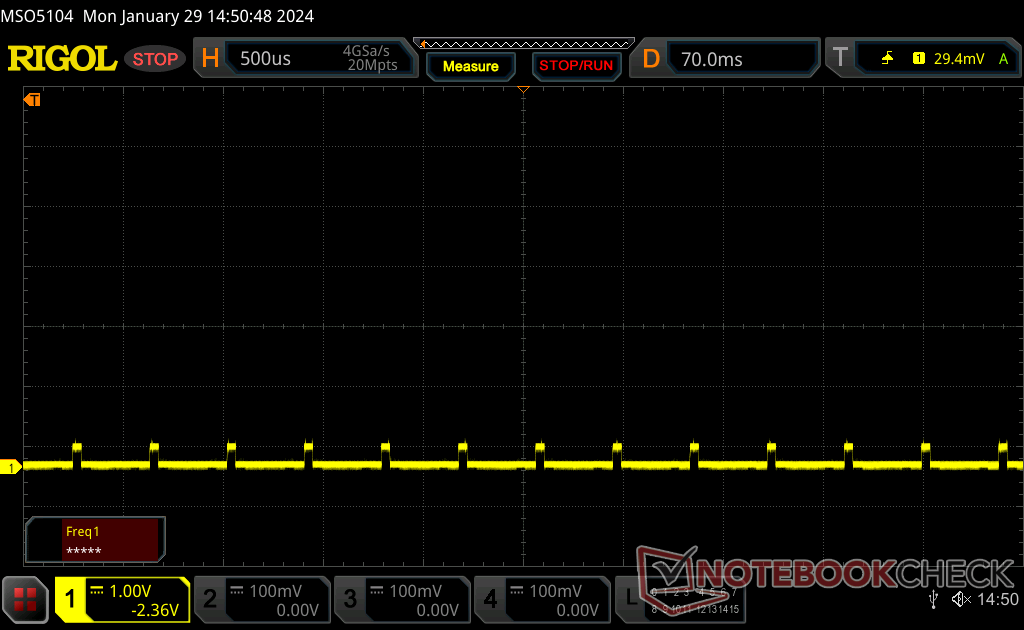
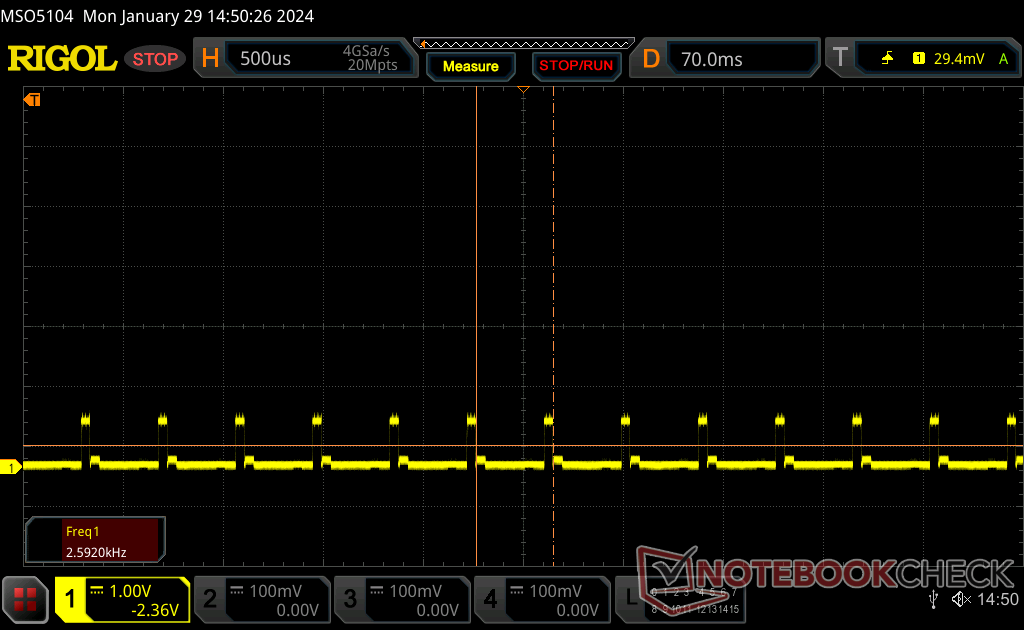
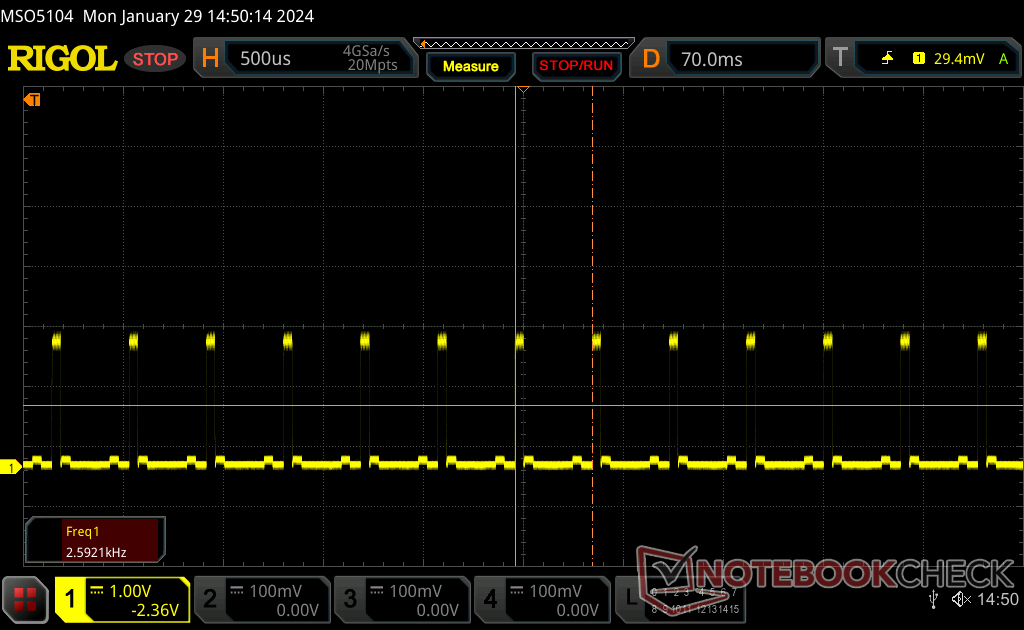
Skärmflimmer / PWM (Puls-Width Modulation)
| Skärmflimmer / PWM upptäckt | 2592 Hz | ≤ 100 % ljusstyrka inställning | 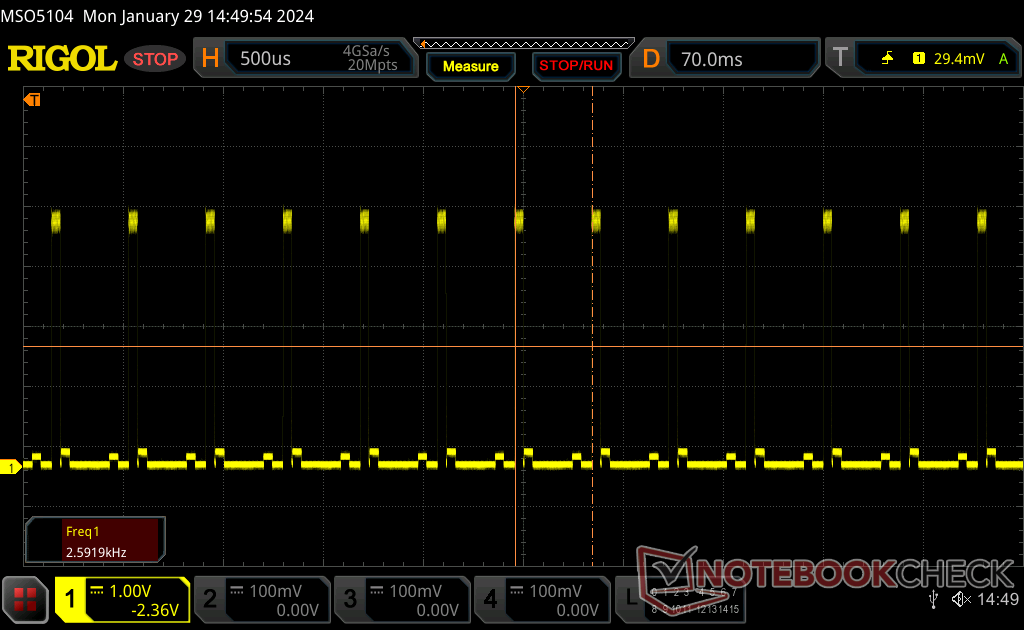 |
Displayens bakgrundsbelysning flimrar vid 2592 Hz (i värsta fall, t.ex. med PWM) Flimrande upptäckt vid en ljusstyrkeinställning på 100 % och lägre. Det ska inte finnas något flimmer eller PWM över denna ljusstyrkeinställning. Frekvensen för 2592 Hz är ganska hög, så de flesta användare som är känsliga för PWM bör inte märka något flimmer. Som jämförelse: 52 % av alla testade enheter använder inte PWM för att dämpa skärmen. Om PWM upptäcktes mättes ett medelvärde av 7744 (minst: 5 - maximum: 343500) Hz. | |||
Svarstiderna för svartvitt och grått för mini-LED är svåra att mäta med traditionella metoder. Vi kan dock säga subjektivt att spökbilder är en icke-fråga när du spelar. Snabba rörelser visas mjukt och utan utsmetning för en upplevelse som är närmare OLED eller en IPS-skärm med mycket snabba svarstider.
Flimmer förekommer med en konstant frekvens på alla ljusstyrkenivåer inklusive den maximala.

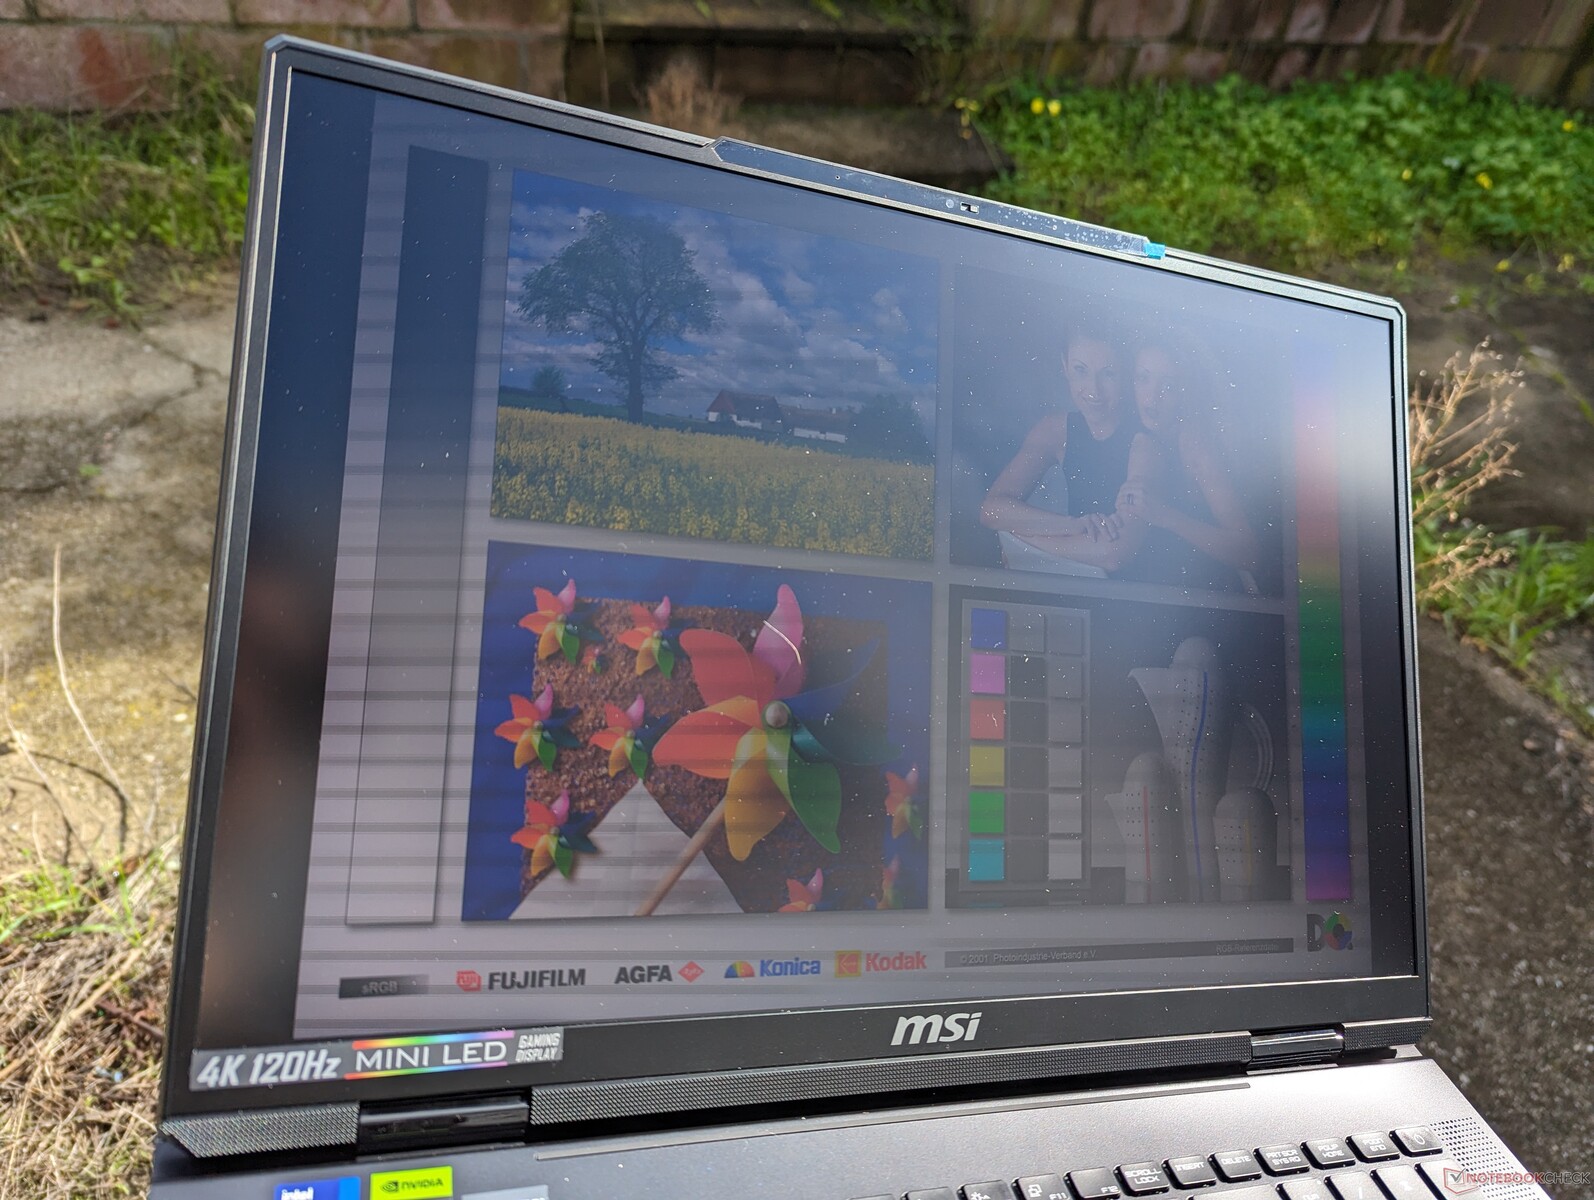
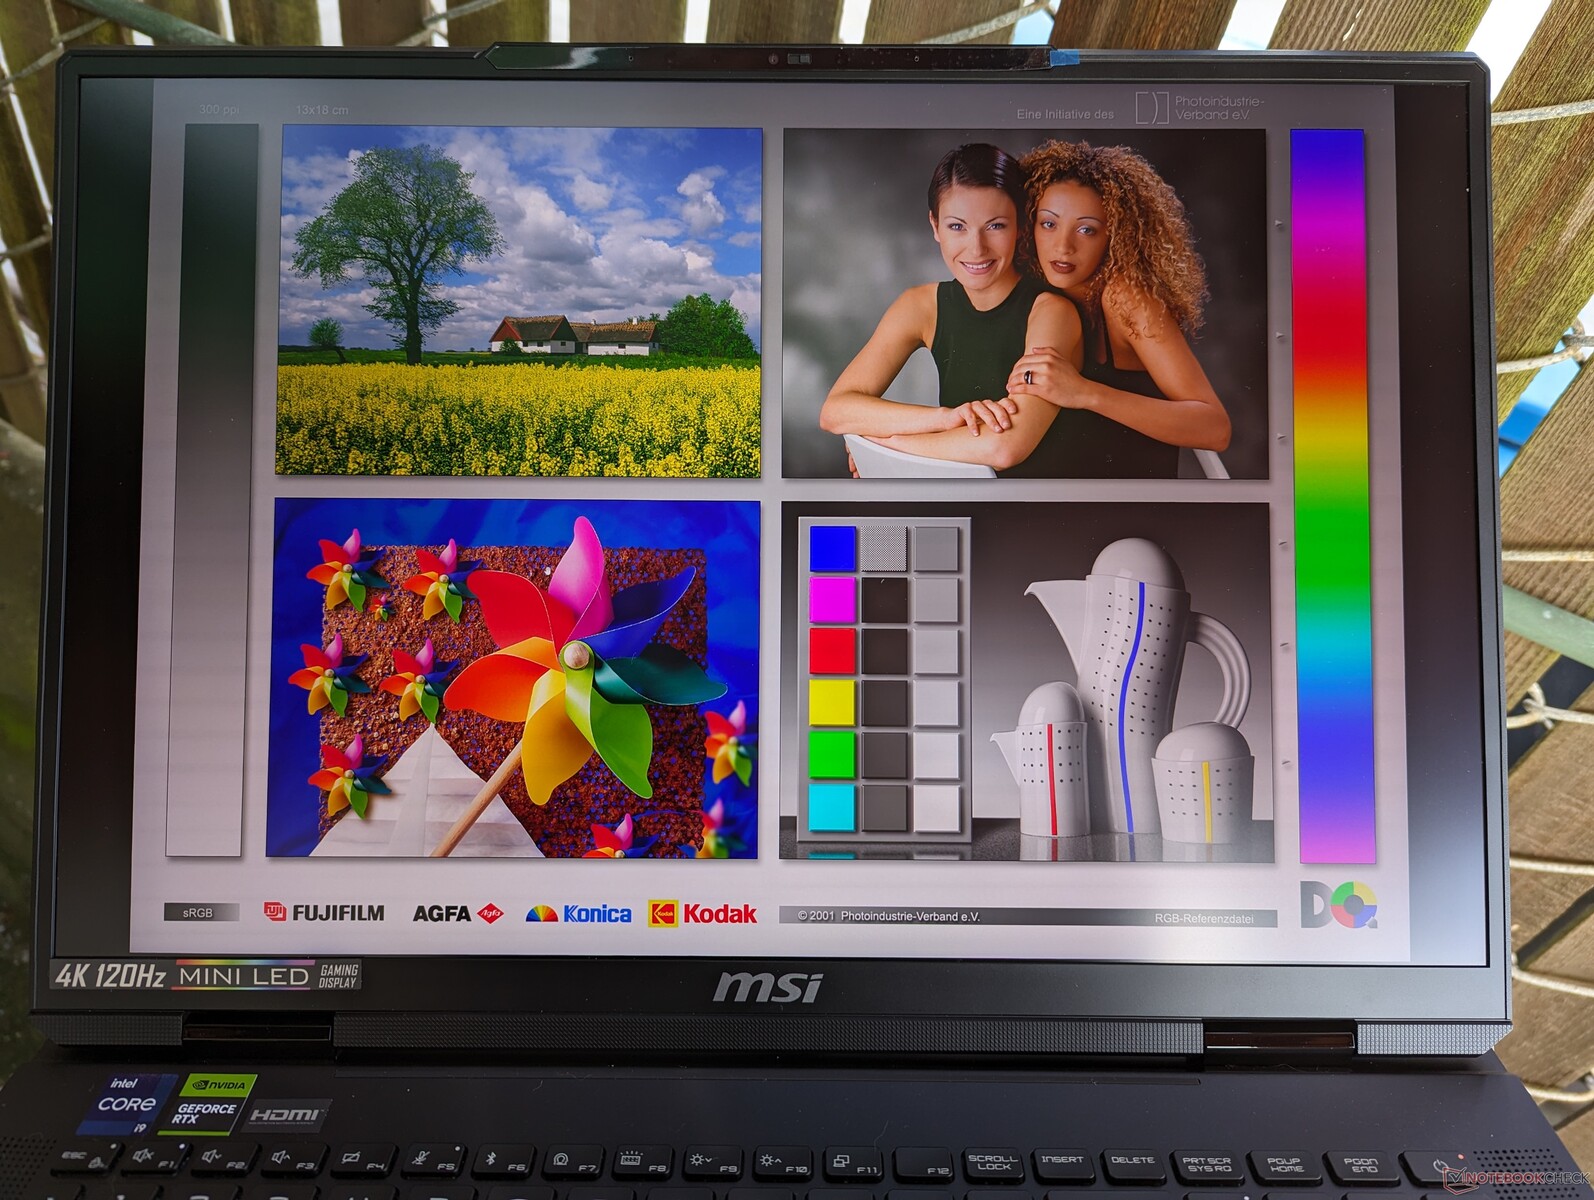
Sikten utomhus är acceptabel i skugga, men om det är ljusare blir skärmen urvattnad. Den ultraljusa bakgrundsbelysningen är ouppnåelig om man kör på batteri, som nämnts ovan.
Prestanda - 14:e generationens Raptor Lake-HX
Villkor för testning
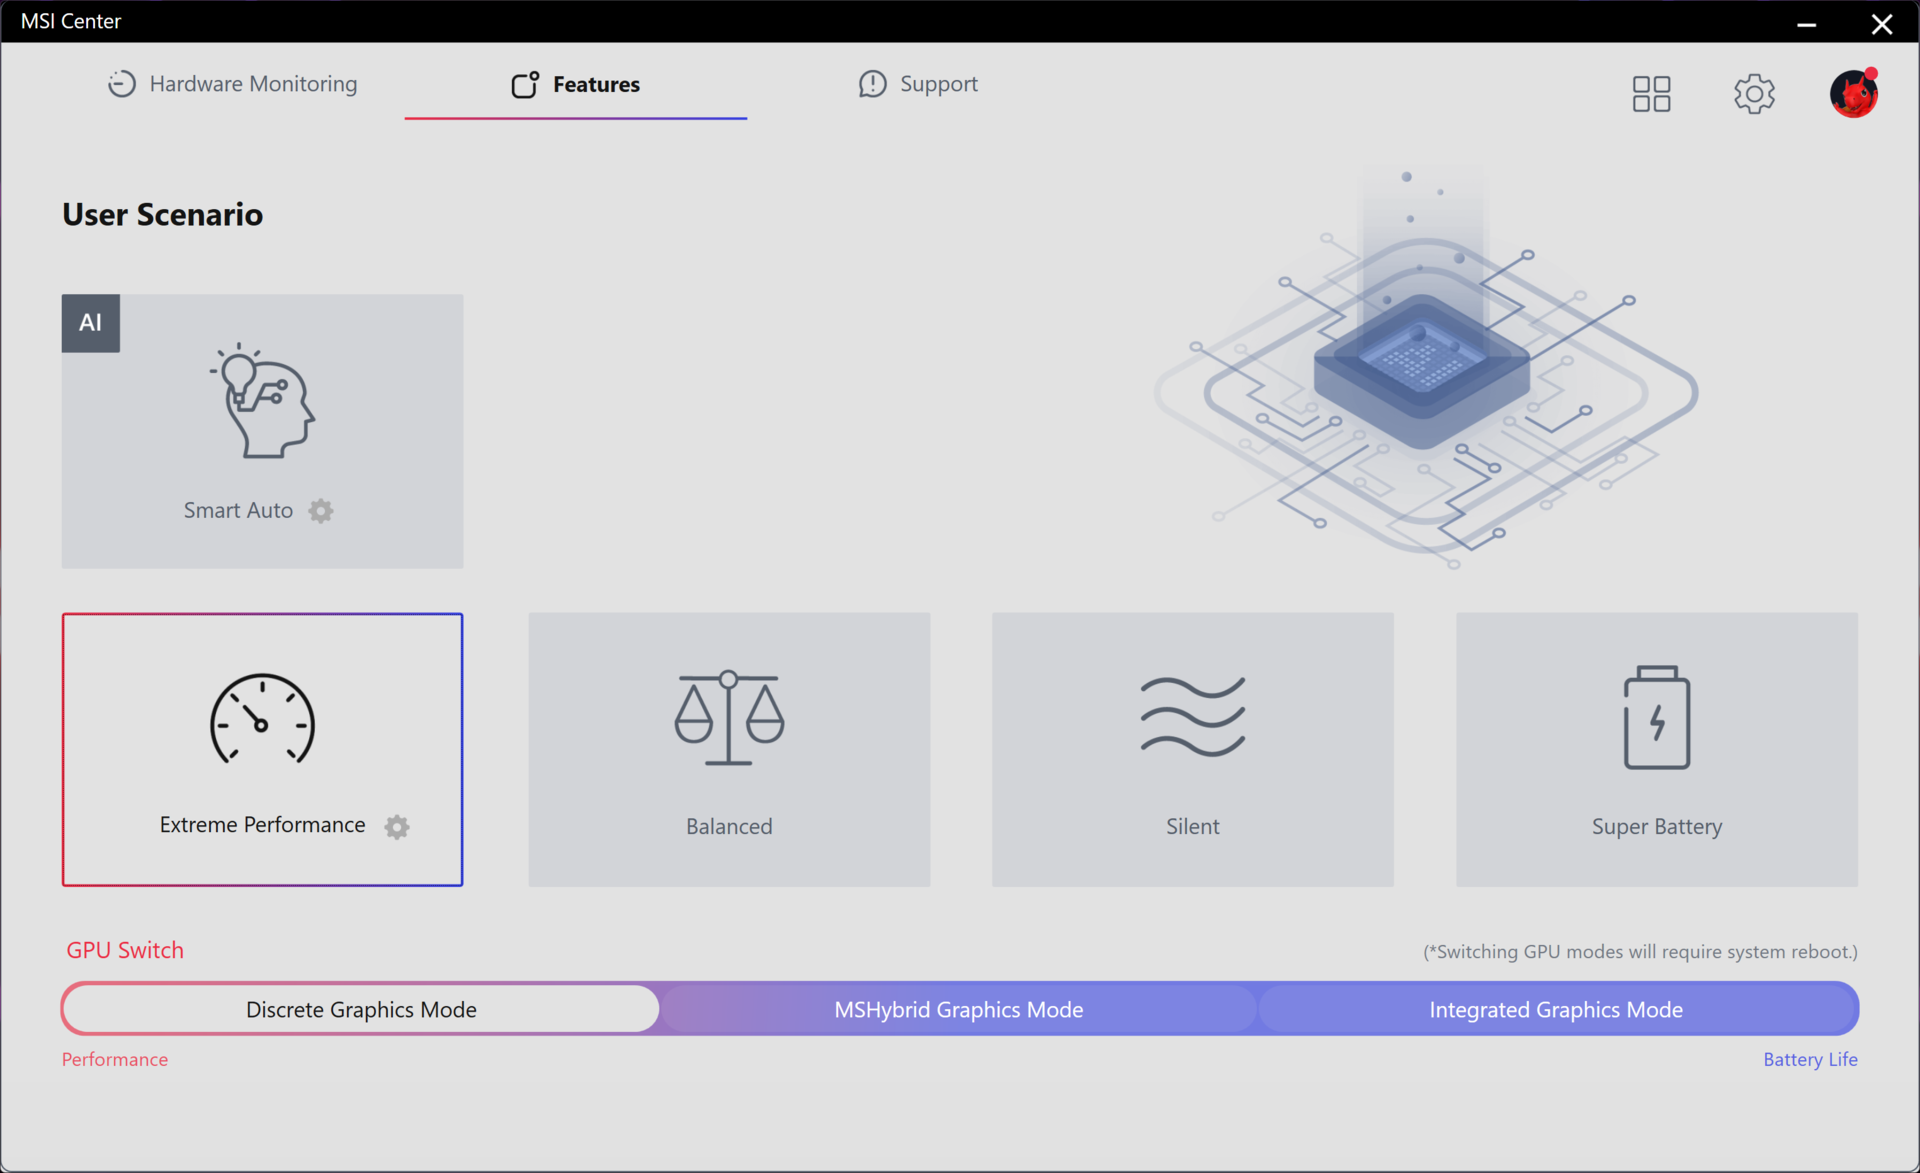
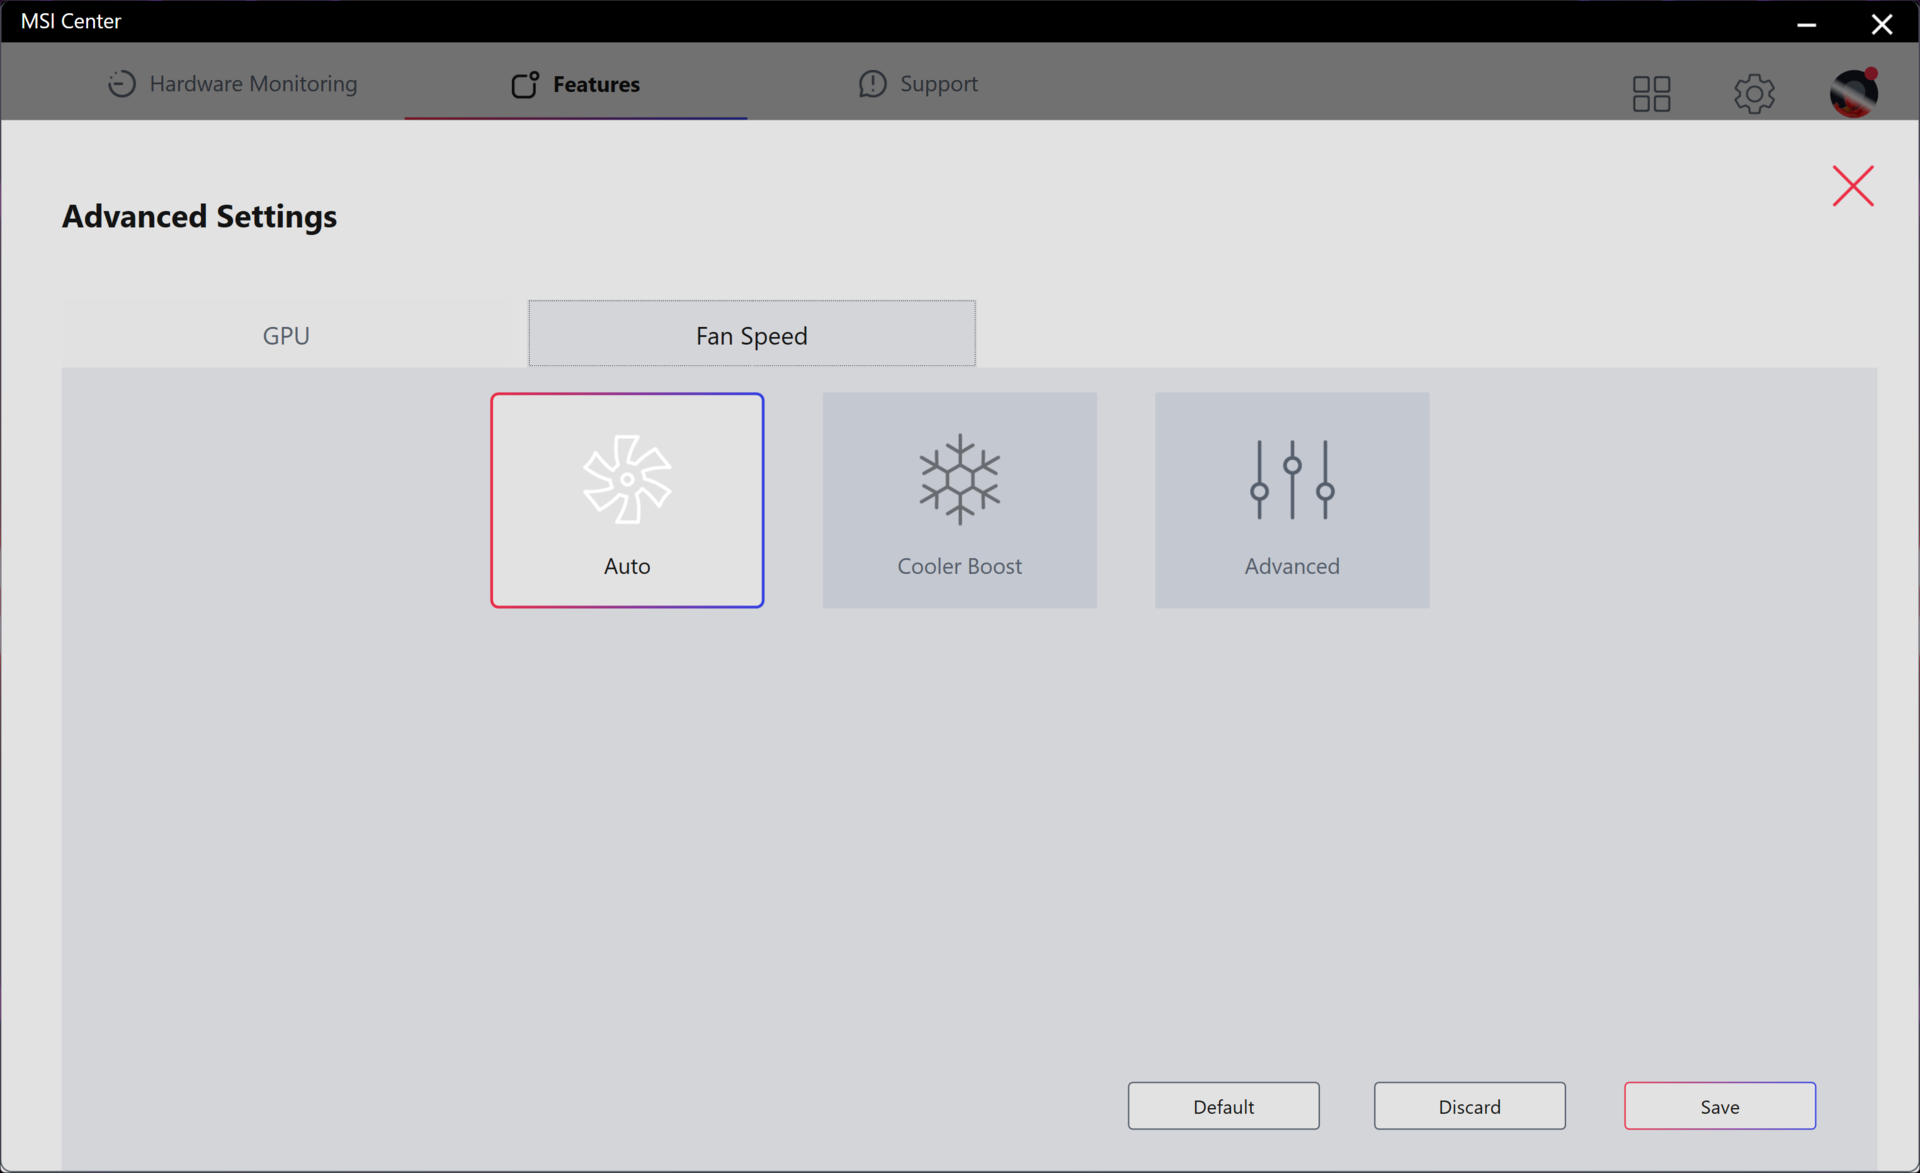
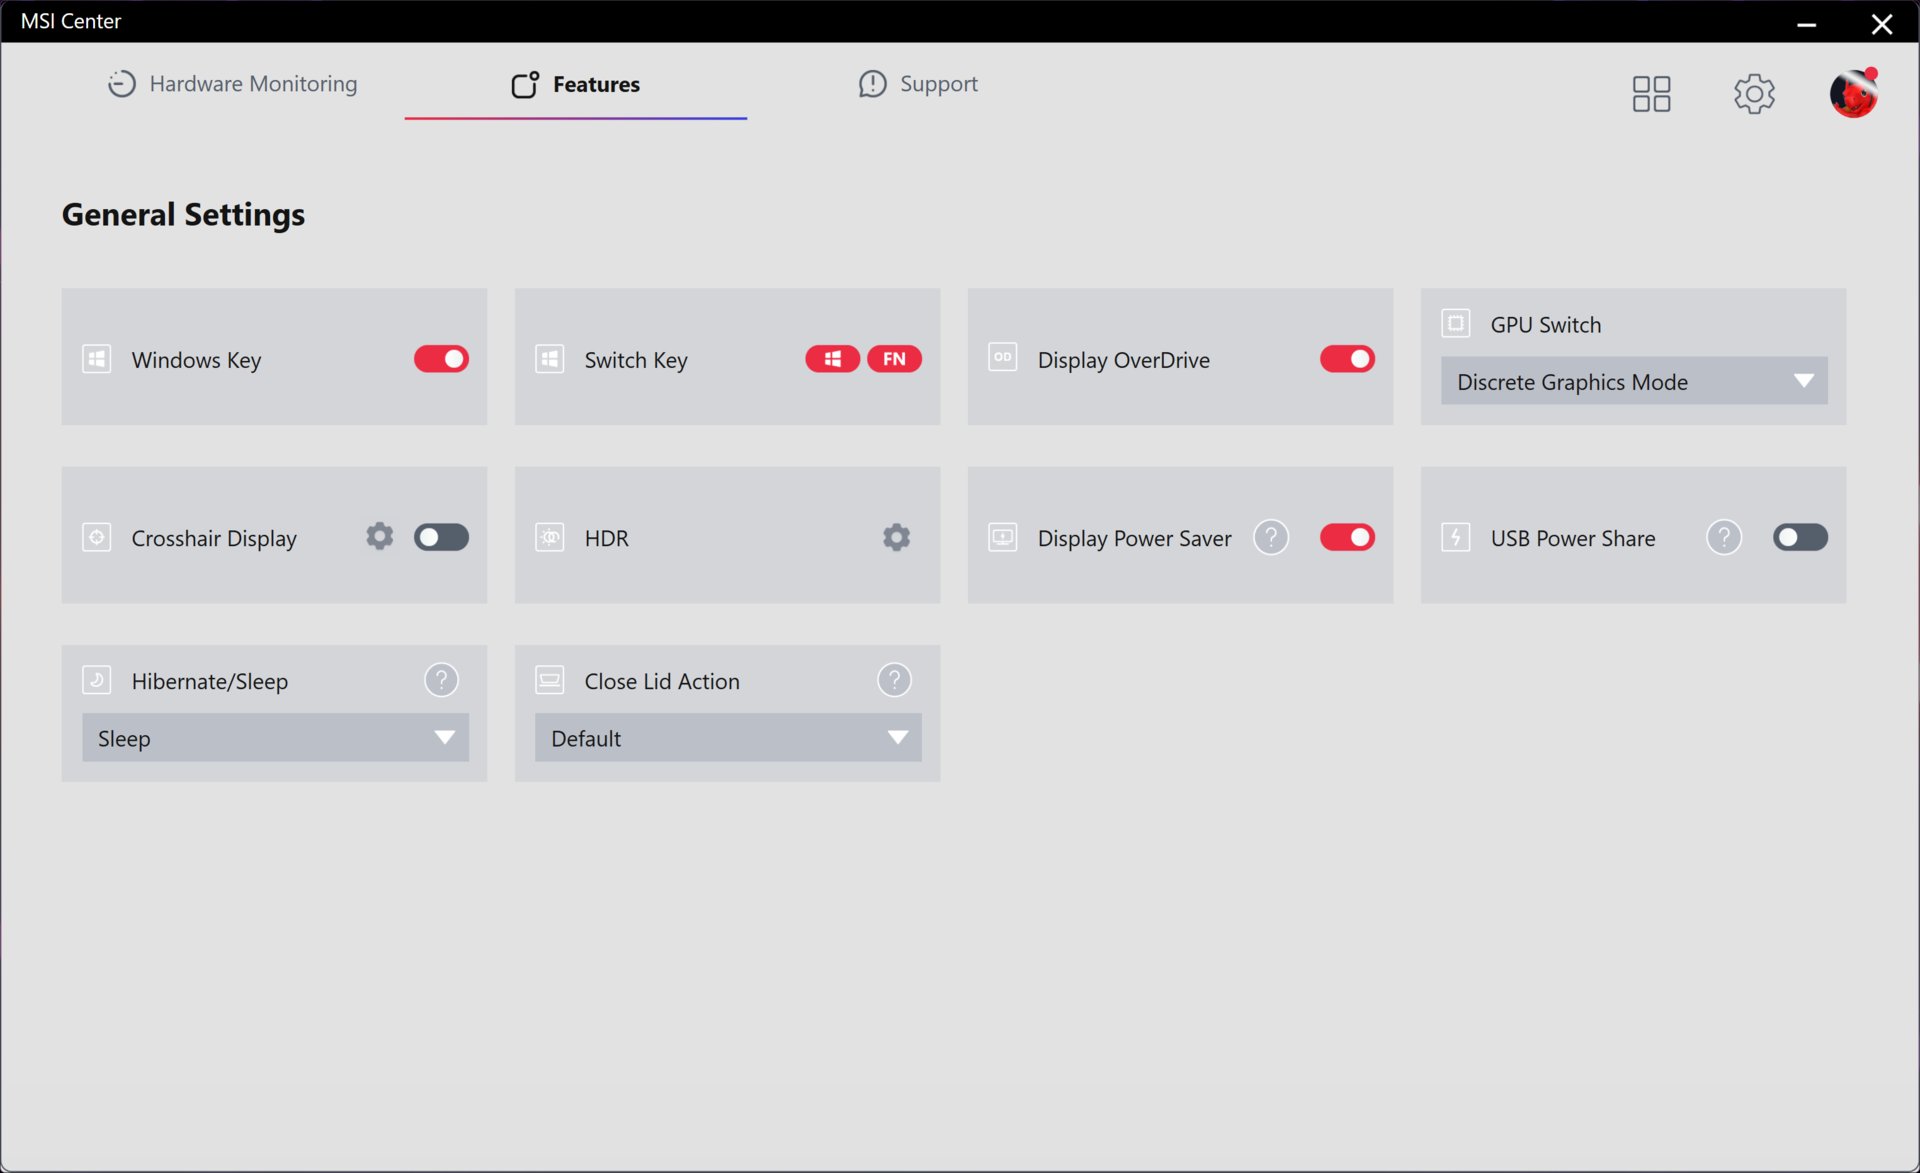
Vi ställde in MSI Center på diskret GPU-läge och Extreme Performance-läge med Cooler Boost aktivt innan vi körde riktmärkena nedan. Cooler Boost är MSI:s varumärke för läget med maximal fläkthastighet. Ägare bör bekanta sig med MSI Center eftersom det är kontrollhubben för övervakning av systemets vitala funktioner, installation av MSI-specifika uppdateringar och växling av de flesta funktioner.
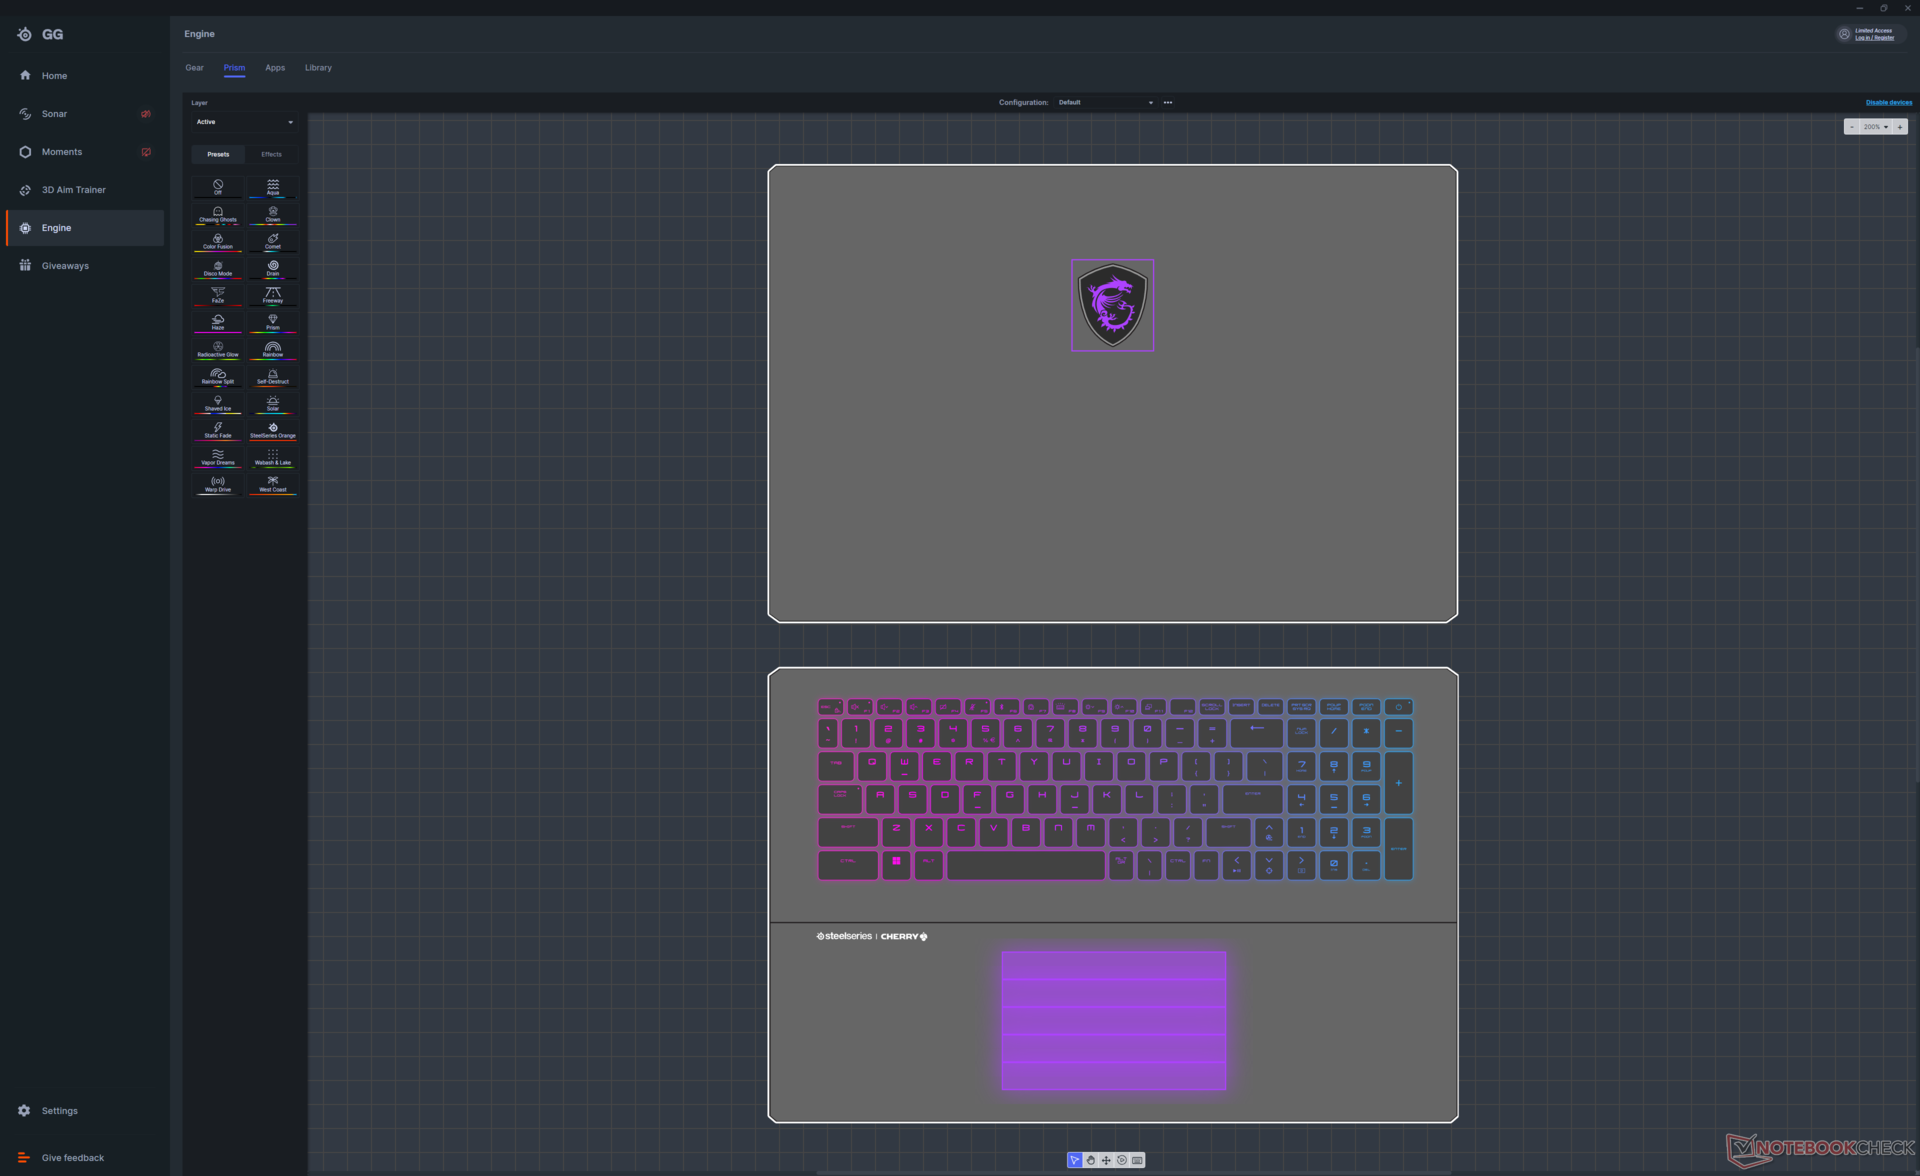
Tangentbordsbelysningen styrs av en separat förinstallerad app som heter SteelSeries GG.
Processor
Rå prestanda från vår Core i9-14900HX är i stort sett lika bra som Core i9-13950HX i förra årets GT77. Förvänta dig därför inga märkbara prestandavinster när du kör traditionella CPU-tunga applikationer. Den 14:e generationens Raptor Lake-HX-processor har inte heller några nya AI-funktioner, till skillnad från Meteor Lake-serien som integrerar en NPU.
MSI förbereder sig för att lansera sin AI Artist-app i februari för bärbara datorer utrustade med 14:e generationens Intel-processorer. Programmet utnyttjar Intels AI-acceleration för att generera konst baserat på uppmaningar på lokal nivå istället för att förlita sig på molntjänster för en snabbare användarupplevelse. Om du inte är intresserad av AI-förbättrade applikationer kan en äldre 13:e generationens Intel-processor fungera lika bra.
Cinebench R15 Multi Loop
Cinebench R23: Multi Core | Single Core
Cinebench R20: CPU (Multi Core) | CPU (Single Core)
Cinebench R15: CPU Multi 64Bit | CPU Single 64Bit
Blender: v2.79 BMW27 CPU
7-Zip 18.03: 7z b 4 | 7z b 4 -mmt1
Geekbench 6.7: Multi-Core | Single-Core
Geekbench 5.5: Multi-Core | Single-Core
HWBOT x265 Benchmark v2.2: 4k Preset
LibreOffice : 20 Documents To PDF
R Benchmark 2.5: Overall mean
| CPU Performance rating | |
| Asus ROG Strix Scar 17 G733PYV-LL053X | |
| Asus ROG Strix Scar 17 G733PY-XS96 -2! | |
| Alienware m18 R1 -2! | |
| MSI Titan GT77 HX 13VI -2! | |
| MSI Titan 18 HX A14VIG | |
| Acer Predator Helios 18 N23Q2 | |
| Genomsnitt Intel Core i9-14900HX | |
| Razer Blade 18 RTX 4070 -2! | |
| Alienware m16 R1 AMD | |
| MSI Raider GE68 HX 13VG, i7-13700HX | |
| NVIDIA GeForce RTX 4070 Super Founders Edition -15! | |
| Asus TUF Gaming A17 FA707XI-NS94 | |
| Asus ROG Strix G18 G814JI -2! | |
| MSI Stealth 16 Studio A13VG -2! | |
| Dell G16 7620 -2! | |
| Alienware m17 R5 (R9 6900HX, RX 6850M XT) -2! | |
| Cinebench R23 / Multi Core | |
| Asus ROG Strix Scar 17 G733PY-XS96 | |
| MSI Titan GT77 HX 13VI | |
| Asus ROG Strix Scar 17 G733PYV-LL053X | |
| Alienware m18 R1 | |
| MSI Titan 18 HX A14VIG | |
| Acer Predator Helios 18 N23Q2 | |
| Genomsnitt Intel Core i9-14900HX (17078 - 36249, n=37) | |
| Razer Blade 18 RTX 4070 | |
| Alienware m16 R1 AMD | |
| MSI Raider GE68 HX 13VG, i7-13700HX | |
| Asus ROG Strix G18 G814JI | |
| MSI Stealth 16 Studio A13VG | |
| Asus TUF Gaming A17 FA707XI-NS94 | |
| Dell G16 7620 | |
| Alienware m17 R5 (R9 6900HX, RX 6850M XT) | |
| Cinebench R23 / Single Core | |
| Genomsnitt Intel Core i9-14900HX (1720 - 2245, n=37) | |
| MSI Titan 18 HX A14VIG | |
| Alienware m18 R1 | |
| MSI Titan GT77 HX 13VI | |
| Acer Predator Helios 18 N23Q2 | |
| Razer Blade 18 RTX 4070 | |
| Asus ROG Strix Scar 17 G733PYV-LL053X | |
| Asus ROG Strix G18 G814JI | |
| MSI Raider GE68 HX 13VG, i7-13700HX | |
| Asus ROG Strix Scar 17 G733PY-XS96 | |
| MSI Stealth 16 Studio A13VG | |
| Alienware m16 R1 AMD | |
| Asus TUF Gaming A17 FA707XI-NS94 | |
| Dell G16 7620 | |
| Alienware m17 R5 (R9 6900HX, RX 6850M XT) | |
| Cinebench R20 / CPU (Multi Core) | |
| Asus ROG Strix Scar 17 G733PY-XS96 | |
| Asus ROG Strix Scar 17 G733PYV-LL053X | |
| MSI Titan GT77 HX 13VI | |
| Alienware m18 R1 | |
| MSI Titan 18 HX A14VIG | |
| Acer Predator Helios 18 N23Q2 | |
| Genomsnitt Intel Core i9-14900HX (6579 - 13832, n=37) | |
| Razer Blade 18 RTX 4070 | |
| Alienware m16 R1 AMD | |
| MSI Raider GE68 HX 13VG, i7-13700HX | |
| Asus ROG Strix G18 G814JI | |
| MSI Stealth 16 Studio A13VG | |
| Asus TUF Gaming A17 FA707XI-NS94 | |
| Dell G16 7620 | |
| Alienware m17 R5 (R9 6900HX, RX 6850M XT) | |
| Cinebench R20 / CPU (Single Core) | |
| Genomsnitt Intel Core i9-14900HX (657 - 859, n=37) | |
| MSI Titan 18 HX A14VIG | |
| Alienware m18 R1 | |
| Acer Predator Helios 18 N23Q2 | |
| MSI Titan GT77 HX 13VI | |
| Razer Blade 18 RTX 4070 | |
| Asus ROG Strix Scar 17 G733PYV-LL053X | |
| Asus ROG Strix G18 G814JI | |
| MSI Raider GE68 HX 13VG, i7-13700HX | |
| Asus ROG Strix Scar 17 G733PY-XS96 | |
| MSI Stealth 16 Studio A13VG | |
| Alienware m16 R1 AMD | |
| Asus TUF Gaming A17 FA707XI-NS94 | |
| Dell G16 7620 | |
| Alienware m17 R5 (R9 6900HX, RX 6850M XT) | |
| Cinebench R15 / CPU Multi 64Bit | |
| Asus ROG Strix Scar 17 G733PYV-LL053X | |
| Asus ROG Strix Scar 17 G733PY-XS96 | |
| MSI Titan GT77 HX 13VI | |
| Alienware m18 R1 | |
| MSI Titan 18 HX A14VIG | |
| Acer Predator Helios 18 N23Q2 | |
| Razer Blade 18 RTX 4070 | |
| Genomsnitt Intel Core i9-14900HX (3263 - 5589, n=38) | |
| Alienware m16 R1 AMD | |
| MSI Raider GE68 HX 13VG, i7-13700HX | |
| Asus ROG Strix G18 G814JI | |
| MSI Stealth 16 Studio A13VG | |
| Asus TUF Gaming A17 FA707XI-NS94 | |
| Dell G16 7620 | |
| Alienware m17 R5 (R9 6900HX, RX 6850M XT) | |
| Cinebench R15 / CPU Single 64Bit | |
| Asus ROG Strix Scar 17 G733PYV-LL053X | |
| Asus ROG Strix Scar 17 G733PY-XS96 | |
| Genomsnitt Intel Core i9-14900HX (247 - 323, n=37) | |
| Alienware m18 R1 | |
| MSI Titan GT77 HX 13VI | |
| MSI Titan 18 HX A14VIG | |
| Razer Blade 18 RTX 4070 | |
| Alienware m16 R1 AMD | |
| Acer Predator Helios 18 N23Q2 | |
| Asus TUF Gaming A17 FA707XI-NS94 | |
| Asus ROG Strix G18 G814JI | |
| MSI Stealth 16 Studio A13VG | |
| MSI Raider GE68 HX 13VG, i7-13700HX | |
| Alienware m17 R5 (R9 6900HX, RX 6850M XT) | |
| Dell G16 7620 | |
| 7-Zip 18.03 / 7z b 4 | |
| Asus ROG Strix Scar 17 G733PY-XS96 | |
| Asus ROG Strix Scar 17 G733PYV-LL053X | |
| Alienware m18 R1 | |
| MSI Titan GT77 HX 13VI | |
| MSI Titan 18 HX A14VIG | |
| Acer Predator Helios 18 N23Q2 | |
| Razer Blade 18 RTX 4070 | |
| Genomsnitt Intel Core i9-14900HX (66769 - 136645, n=37) | |
| Alienware m16 R1 AMD | |
| MSI Raider GE68 HX 13VG, i7-13700HX | |
| Asus ROG Strix G18 G814JI | |
| MSI Stealth 16 Studio A13VG | |
| Asus TUF Gaming A17 FA707XI-NS94 | |
| Dell G16 7620 | |
| Alienware m17 R5 (R9 6900HX, RX 6850M XT) | |
| 7-Zip 18.03 / 7z b 4 -mmt1 | |
| Asus ROG Strix Scar 17 G733PY-XS96 | |
| Asus ROG Strix Scar 17 G733PYV-LL053X | |
| Genomsnitt Intel Core i9-14900HX (5452 - 7545, n=37) | |
| Alienware m16 R1 AMD | |
| Acer Predator Helios 18 N23Q2 | |
| MSI Titan GT77 HX 13VI | |
| Alienware m18 R1 | |
| Razer Blade 18 RTX 4070 | |
| Asus TUF Gaming A17 FA707XI-NS94 | |
| MSI Titan 18 HX A14VIG | |
| MSI Raider GE68 HX 13VG, i7-13700HX | |
| Asus ROG Strix G18 G814JI | |
| MSI Stealth 16 Studio A13VG | |
| Alienware m17 R5 (R9 6900HX, RX 6850M XT) | |
| Dell G16 7620 | |
| Geekbench 6.7 / Multi-Core | |
| Acer Predator Helios 18 N23Q2 | |
| Genomsnitt Intel Core i9-14900HX (13158 - 19665, n=37) | |
| Asus ROG Strix Scar 17 G733PYV-LL053X | |
| MSI Titan 18 HX A14VIG | |
| MSI Raider GE68 HX 13VG, i7-13700HX | |
| Alienware m16 R1 AMD | |
| Asus TUF Gaming A17 FA707XI-NS94 | |
| Geekbench 6.7 / Single-Core | |
| Genomsnitt Intel Core i9-14900HX (2419 - 3129, n=37) | |
| Asus ROG Strix Scar 17 G733PYV-LL053X | |
| Acer Predator Helios 18 N23Q2 | |
| MSI Titan 18 HX A14VIG | |
| Asus TUF Gaming A17 FA707XI-NS94 | |
| Alienware m16 R1 AMD | |
| MSI Raider GE68 HX 13VG, i7-13700HX | |
| Geekbench 5.5 / Multi-Core | |
| Alienware m18 R1 | |
| MSI Titan GT77 HX 13VI | |
| Acer Predator Helios 18 N23Q2 | |
| Razer Blade 18 RTX 4070 | |
| Asus ROG Strix Scar 17 G733PYV-LL053X | |
| Genomsnitt Intel Core i9-14900HX (8618 - 23194, n=37) | |
| Asus ROG Strix Scar 17 G733PY-XS96 | |
| MSI Titan 18 HX A14VIG | |
| MSI Raider GE68 HX 13VG, i7-13700HX | |
| Alienware m16 R1 AMD | |
| Asus ROG Strix G18 G814JI | |
| MSI Stealth 16 Studio A13VG | |
| Dell G16 7620 | |
| Asus TUF Gaming A17 FA707XI-NS94 | |
| Alienware m17 R5 (R9 6900HX, RX 6850M XT) | |
| Geekbench 5.5 / Single-Core | |
| Asus ROG Strix Scar 17 G733PYV-LL053X | |
| MSI Titan 18 HX A14VIG | |
| Genomsnitt Intel Core i9-14900HX (1669 - 2210, n=37) | |
| Alienware m18 R1 | |
| Acer Predator Helios 18 N23Q2 | |
| Asus ROG Strix Scar 17 G733PY-XS96 | |
| MSI Titan GT77 HX 13VI | |
| Razer Blade 18 RTX 4070 | |
| Asus TUF Gaming A17 FA707XI-NS94 | |
| Alienware m16 R1 AMD | |
| MSI Raider GE68 HX 13VG, i7-13700HX | |
| Asus ROG Strix G18 G814JI | |
| MSI Stealth 16 Studio A13VG | |
| Dell G16 7620 | |
| Alienware m17 R5 (R9 6900HX, RX 6850M XT) | |
| HWBOT x265 Benchmark v2.2 / 4k Preset | |
| Asus ROG Strix Scar 17 G733PY-XS96 | |
| Asus ROG Strix Scar 17 G733PYV-LL053X | |
| Alienware m18 R1 | |
| MSI Titan GT77 HX 13VI | |
| Razer Blade 18 RTX 4070 | |
| MSI Titan 18 HX A14VIG | |
| Acer Predator Helios 18 N23Q2 | |
| Alienware m16 R1 AMD | |
| Genomsnitt Intel Core i9-14900HX (16.8 - 38.9, n=37) | |
| MSI Raider GE68 HX 13VG, i7-13700HX | |
| Asus ROG Strix G18 G814JI | |
| Asus TUF Gaming A17 FA707XI-NS94 | |
| MSI Stealth 16 Studio A13VG | |
| Dell G16 7620 | |
| Alienware m17 R5 (R9 6900HX, RX 6850M XT) | |
| LibreOffice / 20 Documents To PDF | |
| Asus ROG Strix G18 G814JI | |
| Alienware m17 R5 (R9 6900HX, RX 6850M XT) | |
| MSI Stealth 16 Studio A13VG | |
| Dell G16 7620 | |
| MSI Raider GE68 HX 13VG, i7-13700HX | |
| Acer Predator Helios 18 N23Q2 | |
| Asus TUF Gaming A17 FA707XI-NS94 | |
| Alienware m18 R1 | |
| MSI Titan GT77 HX 13VI | |
| MSI Titan 18 HX A14VIG | |
| Razer Blade 18 RTX 4070 | |
| Genomsnitt Intel Core i9-14900HX (19 - 85.1, n=37) | |
| Alienware m16 R1 AMD | |
| Asus ROG Strix Scar 17 G733PYV-LL053X | |
| Asus ROG Strix Scar 17 G733PY-XS96 | |
| R Benchmark 2.5 / Overall mean | |
| Dell G16 7620 | |
| Alienware m17 R5 (R9 6900HX, RX 6850M XT) | |
| MSI Stealth 16 Studio A13VG | |
| Asus ROG Strix G18 G814JI | |
| MSI Raider GE68 HX 13VG, i7-13700HX | |
| Asus TUF Gaming A17 FA707XI-NS94 | |
| Alienware m16 R1 AMD | |
| Asus ROG Strix Scar 17 G733PYV-LL053X | |
| Asus ROG Strix Scar 17 G733PY-XS96 | |
| MSI Titan GT77 HX 13VI | |
| Acer Predator Helios 18 N23Q2 | |
| Razer Blade 18 RTX 4070 | |
| Alienware m18 R1 | |
| MSI Titan 18 HX A14VIG | |
| Genomsnitt Intel Core i9-14900HX (0.3604 - 0.4859, n=37) | |
Cinebench R23: Multi Core | Single Core
Cinebench R20: CPU (Multi Core) | CPU (Single Core)
Cinebench R15: CPU Multi 64Bit | CPU Single 64Bit
Blender: v2.79 BMW27 CPU
7-Zip 18.03: 7z b 4 | 7z b 4 -mmt1
Geekbench 6.7: Multi-Core | Single-Core
Geekbench 5.5: Multi-Core | Single-Core
HWBOT x265 Benchmark v2.2: 4k Preset
LibreOffice : 20 Documents To PDF
R Benchmark 2.5: Overall mean
* ... mindre är bättre
AIDA64: FP32 Ray-Trace | FPU Julia | CPU SHA3 | CPU Queen | FPU SinJulia | FPU Mandel | CPU AES | CPU ZLib | FP64 Ray-Trace | CPU PhotoWorxx
| Performance rating | |
| Alienware m18 R1 | |
| Acer Predator Helios 18 N23Q2 | |
| MSI Titan 18 HX A14VIG | |
| MSI Titan GT77 HX 13VI | |
| Razer Blade 18 RTX 4070 | |
| Genomsnitt Intel Core i9-14900HX | |
| Asus ROG Strix G18 G814JI | |
| AIDA64 / FP32 Ray-Trace | |
| Alienware m18 R1 | |
| MSI Titan 18 HX A14VIG | |
| MSI Titan GT77 HX 13VI | |
| Acer Predator Helios 18 N23Q2 | |
| Razer Blade 18 RTX 4070 | |
| Genomsnitt Intel Core i9-14900HX (13098 - 33474, n=36) | |
| Asus ROG Strix G18 G814JI | |
| AIDA64 / FPU Julia | |
| MSI Titan 18 HX A14VIG | |
| Alienware m18 R1 | |
| MSI Titan GT77 HX 13VI | |
| Acer Predator Helios 18 N23Q2 | |
| Razer Blade 18 RTX 4070 | |
| Genomsnitt Intel Core i9-14900HX (67573 - 166040, n=36) | |
| Asus ROG Strix G18 G814JI | |
| AIDA64 / CPU SHA3 | |
| MSI Titan 18 HX A14VIG | |
| Alienware m18 R1 | |
| MSI Titan GT77 HX 13VI | |
| Acer Predator Helios 18 N23Q2 | |
| Razer Blade 18 RTX 4070 | |
| Genomsnitt Intel Core i9-14900HX (3589 - 7979, n=36) | |
| Asus ROG Strix G18 G814JI | |
| AIDA64 / CPU Queen | |
| MSI Titan 18 HX A14VIG | |
| Alienware m18 R1 | |
| MSI Titan GT77 HX 13VI | |
| Genomsnitt Intel Core i9-14900HX (118405 - 148966, n=36) | |
| Razer Blade 18 RTX 4070 | |
| Acer Predator Helios 18 N23Q2 | |
| Asus ROG Strix G18 G814JI | |
| AIDA64 / FPU SinJulia | |
| MSI Titan 18 HX A14VIG | |
| MSI Titan GT77 HX 13VI | |
| Alienware m18 R1 | |
| Razer Blade 18 RTX 4070 | |
| Acer Predator Helios 18 N23Q2 | |
| Genomsnitt Intel Core i9-14900HX (10475 - 18517, n=36) | |
| Asus ROG Strix G18 G814JI | |
| AIDA64 / FPU Mandel | |
| Alienware m18 R1 | |
| MSI Titan 18 HX A14VIG | |
| MSI Titan GT77 HX 13VI | |
| Acer Predator Helios 18 N23Q2 | |
| Razer Blade 18 RTX 4070 | |
| Genomsnitt Intel Core i9-14900HX (32543 - 83662, n=36) | |
| Asus ROG Strix G18 G814JI | |
| AIDA64 / CPU AES | |
| Acer Predator Helios 18 N23Q2 | |
| Genomsnitt Intel Core i9-14900HX (86964 - 241777, n=36) | |
| MSI Titan 18 HX A14VIG | |
| MSI Titan GT77 HX 13VI | |
| Alienware m18 R1 | |
| Razer Blade 18 RTX 4070 | |
| Asus ROG Strix G18 G814JI | |
| AIDA64 / CPU ZLib | |
| MSI Titan 18 HX A14VIG | |
| MSI Titan GT77 HX 13VI | |
| Alienware m18 R1 | |
| Acer Predator Helios 18 N23Q2 | |
| Razer Blade 18 RTX 4070 | |
| Genomsnitt Intel Core i9-14900HX (1054 - 2292, n=36) | |
| Asus ROG Strix G18 G814JI | |
| AIDA64 / FP64 Ray-Trace | |
| Alienware m18 R1 | |
| MSI Titan 18 HX A14VIG | |
| MSI Titan GT77 HX 13VI | |
| Acer Predator Helios 18 N23Q2 | |
| Razer Blade 18 RTX 4070 | |
| Genomsnitt Intel Core i9-14900HX (6809 - 18349, n=36) | |
| Asus ROG Strix G18 G814JI | |
| AIDA64 / CPU PhotoWorxx | |
| Alienware m18 R1 | |
| Acer Predator Helios 18 N23Q2 | |
| Razer Blade 18 RTX 4070 | |
| Genomsnitt Intel Core i9-14900HX (23903 - 54702, n=36) | |
| Asus ROG Strix G18 G814JI | |
| MSI Titan GT77 HX 13VI | |
| MSI Titan 18 HX A14VIG | |
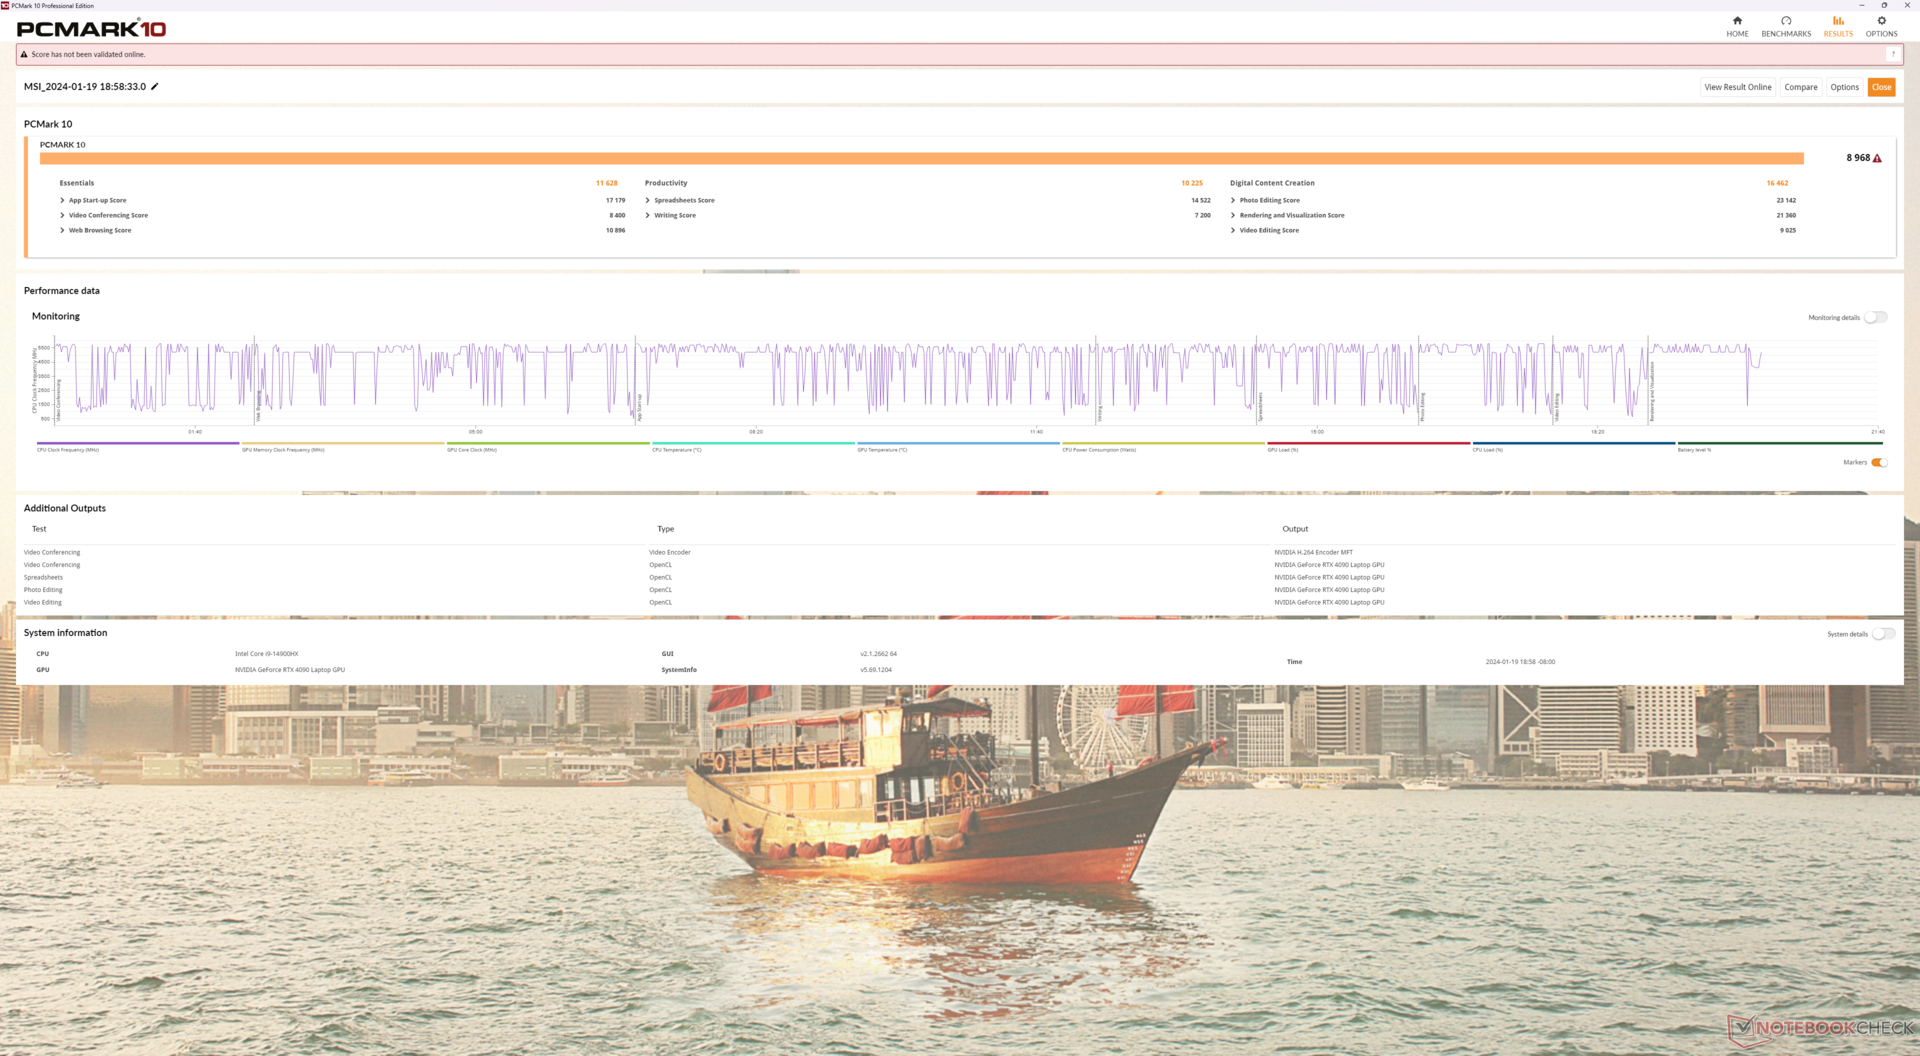
Systemets prestanda
PCMark-resultaten ligger inom bara några få procentenheter från förra årets GT77, vilket tyder på att det inte finns några större prestandaskillnader mellan deras processorer och GPU:er när man kör vardagliga uppgifter.
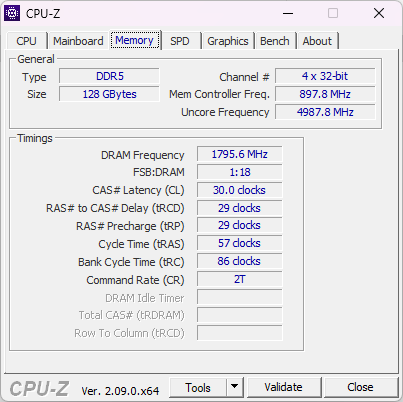
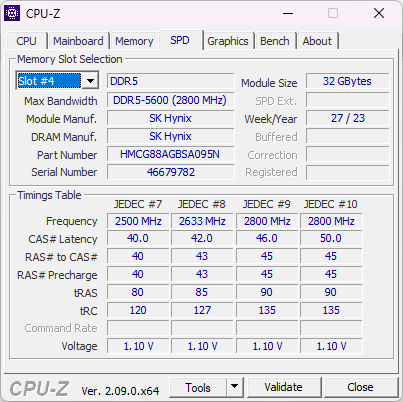
Observera att RAM-prestandan är långsammare från vår 128 GB-konfiguration med upp till 30 till 40 procent jämfört med 32 GB-konfigurationen av Alienware m18 R1. Detta är att förvänta eftersom RAM-prestanda vid högre kapaciteter begränsas av det åldrande SODIMM-gränssnittet.
CrossMark: Overall | Productivity | Creativity | Responsiveness
WebXPRT 3: Overall
WebXPRT 4: Overall
Mozilla Kraken 1.1: Total
| PCMark 10 / Score | |
| MSI Titan 18 HX A14VIG | |
| MSI Titan GT77 HX 13VI | |
| Alienware m18 R1 | |
| Genomsnitt Intel Core i9-14900HX, NVIDIA GeForce RTX 4090 Laptop GPU (8230 - 9234, n=13) | |
| Acer Predator Helios 18 N23Q2 | |
| Razer Blade 18 RTX 4070 | |
| Asus ROG Strix G18 G814JI | |
| PCMark 10 / Essentials | |
| MSI Titan GT77 HX 13VI | |
| Razer Blade 18 RTX 4070 | |
| MSI Titan 18 HX A14VIG | |
| Alienware m18 R1 | |
| Genomsnitt Intel Core i9-14900HX, NVIDIA GeForce RTX 4090 Laptop GPU (10778 - 11628, n=13) | |
| Acer Predator Helios 18 N23Q2 | |
| Asus ROG Strix G18 G814JI | |
| PCMark 10 / Productivity | |
| Genomsnitt Intel Core i9-14900HX, NVIDIA GeForce RTX 4090 Laptop GPU (9458 - 11759, n=13) | |
| Acer Predator Helios 18 N23Q2 | |
| MSI Titan 18 HX A14VIG | |
| Alienware m18 R1 | |
| MSI Titan GT77 HX 13VI | |
| Razer Blade 18 RTX 4070 | |
| Asus ROG Strix G18 G814JI | |
| PCMark 10 / Digital Content Creation | |
| MSI Titan 18 HX A14VIG | |
| MSI Titan GT77 HX 13VI | |
| Alienware m18 R1 | |
| Genomsnitt Intel Core i9-14900HX, NVIDIA GeForce RTX 4090 Laptop GPU (13219 - 16462, n=13) | |
| Acer Predator Helios 18 N23Q2 | |
| Razer Blade 18 RTX 4070 | |
| Asus ROG Strix G18 G814JI | |
| CrossMark / Overall | |
| Acer Predator Helios 18 N23Q2 | |
| Alienware m18 R1 | |
| MSI Titan GT77 HX 13VI | |
| Razer Blade 18 RTX 4070 | |
| Genomsnitt Intel Core i9-14900HX, NVIDIA GeForce RTX 4090 Laptop GPU (1877 - 2344, n=10) | |
| MSI Titan 18 HX A14VIG | |
| CrossMark / Productivity | |
| Acer Predator Helios 18 N23Q2 | |
| Alienware m18 R1 | |
| MSI Titan GT77 HX 13VI | |
| Razer Blade 18 RTX 4070 | |
| Genomsnitt Intel Core i9-14900HX, NVIDIA GeForce RTX 4090 Laptop GPU (1738 - 2162, n=10) | |
| MSI Titan 18 HX A14VIG | |
| CrossMark / Creativity | |
| Alienware m18 R1 | |
| MSI Titan GT77 HX 13VI | |
| Acer Predator Helios 18 N23Q2 | |
| Razer Blade 18 RTX 4070 | |
| Genomsnitt Intel Core i9-14900HX, NVIDIA GeForce RTX 4090 Laptop GPU (2195 - 2660, n=10) | |
| MSI Titan 18 HX A14VIG | |
| CrossMark / Responsiveness | |
| Acer Predator Helios 18 N23Q2 | |
| Alienware m18 R1 | |
| Razer Blade 18 RTX 4070 | |
| Genomsnitt Intel Core i9-14900HX, NVIDIA GeForce RTX 4090 Laptop GPU (1478 - 2327, n=10) | |
| MSI Titan GT77 HX 13VI | |
| MSI Titan 18 HX A14VIG | |
| WebXPRT 3 / Overall | |
| Razer Blade 18 RTX 4070 | |
| Alienware m18 R1 | |
| MSI Titan 18 HX A14VIG | |
| Genomsnitt Intel Core i9-14900HX, NVIDIA GeForce RTX 4090 Laptop GPU (279 - 339, n=10) | |
| MSI Titan GT77 HX 13VI | |
| Acer Predator Helios 18 N23Q2 | |
| Asus ROG Strix G18 G814JI | |
| Asus ROG Strix G18 G814JI | |
| WebXPRT 4 / Overall | |
| Alienware m18 R1 | |
| Razer Blade 18 RTX 4070 | |
| MSI Titan GT77 HX 13VI | |
| Genomsnitt Intel Core i9-14900HX, NVIDIA GeForce RTX 4090 Laptop GPU (246 - 309, n=8) | |
| MSI Titan 18 HX A14VIG | |
| Asus ROG Strix G18 G814JI | |
| Asus ROG Strix G18 G814JI | |
| Mozilla Kraken 1.1 / Total | |
| Asus ROG Strix G18 G814JI | |
| Asus ROG Strix G18 G814JI | |
| MSI Titan GT77 HX 13VI | |
| Razer Blade 18 RTX 4070 | |
| Alienware m18 R1 | |
| Acer Predator Helios 18 N23Q2 | |
| Genomsnitt Intel Core i9-14900HX, NVIDIA GeForce RTX 4090 Laptop GPU (428 - 535, n=11) | |
| MSI Titan 18 HX A14VIG | |
* ... mindre är bättre
| PCMark 10 Score | 8968 poäng | |
Hjälp | ||
| AIDA64 / Memory Copy | |
| Alienware m18 R1 | |
| Acer Predator Helios 18 N23Q2 | |
| Razer Blade 18 RTX 4070 | |
| Genomsnitt Intel Core i9-14900HX (38028 - 83392, n=36) | |
| Asus ROG Strix G18 G814JI | |
| MSI Titan GT77 HX 13VI | |
| MSI Titan 18 HX A14VIG | |
| AIDA64 / Memory Read | |
| Alienware m18 R1 | |
| Acer Predator Helios 18 N23Q2 | |
| Razer Blade 18 RTX 4070 | |
| Genomsnitt Intel Core i9-14900HX (43306 - 87568, n=36) | |
| Asus ROG Strix G18 G814JI | |
| MSI Titan GT77 HX 13VI | |
| MSI Titan 18 HX A14VIG | |
| AIDA64 / Memory Write | |
| Alienware m18 R1 | |
| Razer Blade 18 RTX 4070 | |
| Acer Predator Helios 18 N23Q2 | |
| Genomsnitt Intel Core i9-14900HX (37146 - 80589, n=36) | |
| MSI Titan GT77 HX 13VI | |
| Asus ROG Strix G18 G814JI | |
| MSI Titan 18 HX A14VIG | |
| AIDA64 / Memory Latency | |
| MSI Titan 18 HX A14VIG | |
| MSI Titan GT77 HX 13VI | |
| Genomsnitt Intel Core i9-14900HX (76.1 - 105, n=36) | |
| Razer Blade 18 RTX 4070 | |
| Asus ROG Strix G18 G814JI | |
| Acer Predator Helios 18 N23Q2 | |
| Alienware m18 R1 | |
* ... mindre är bättre
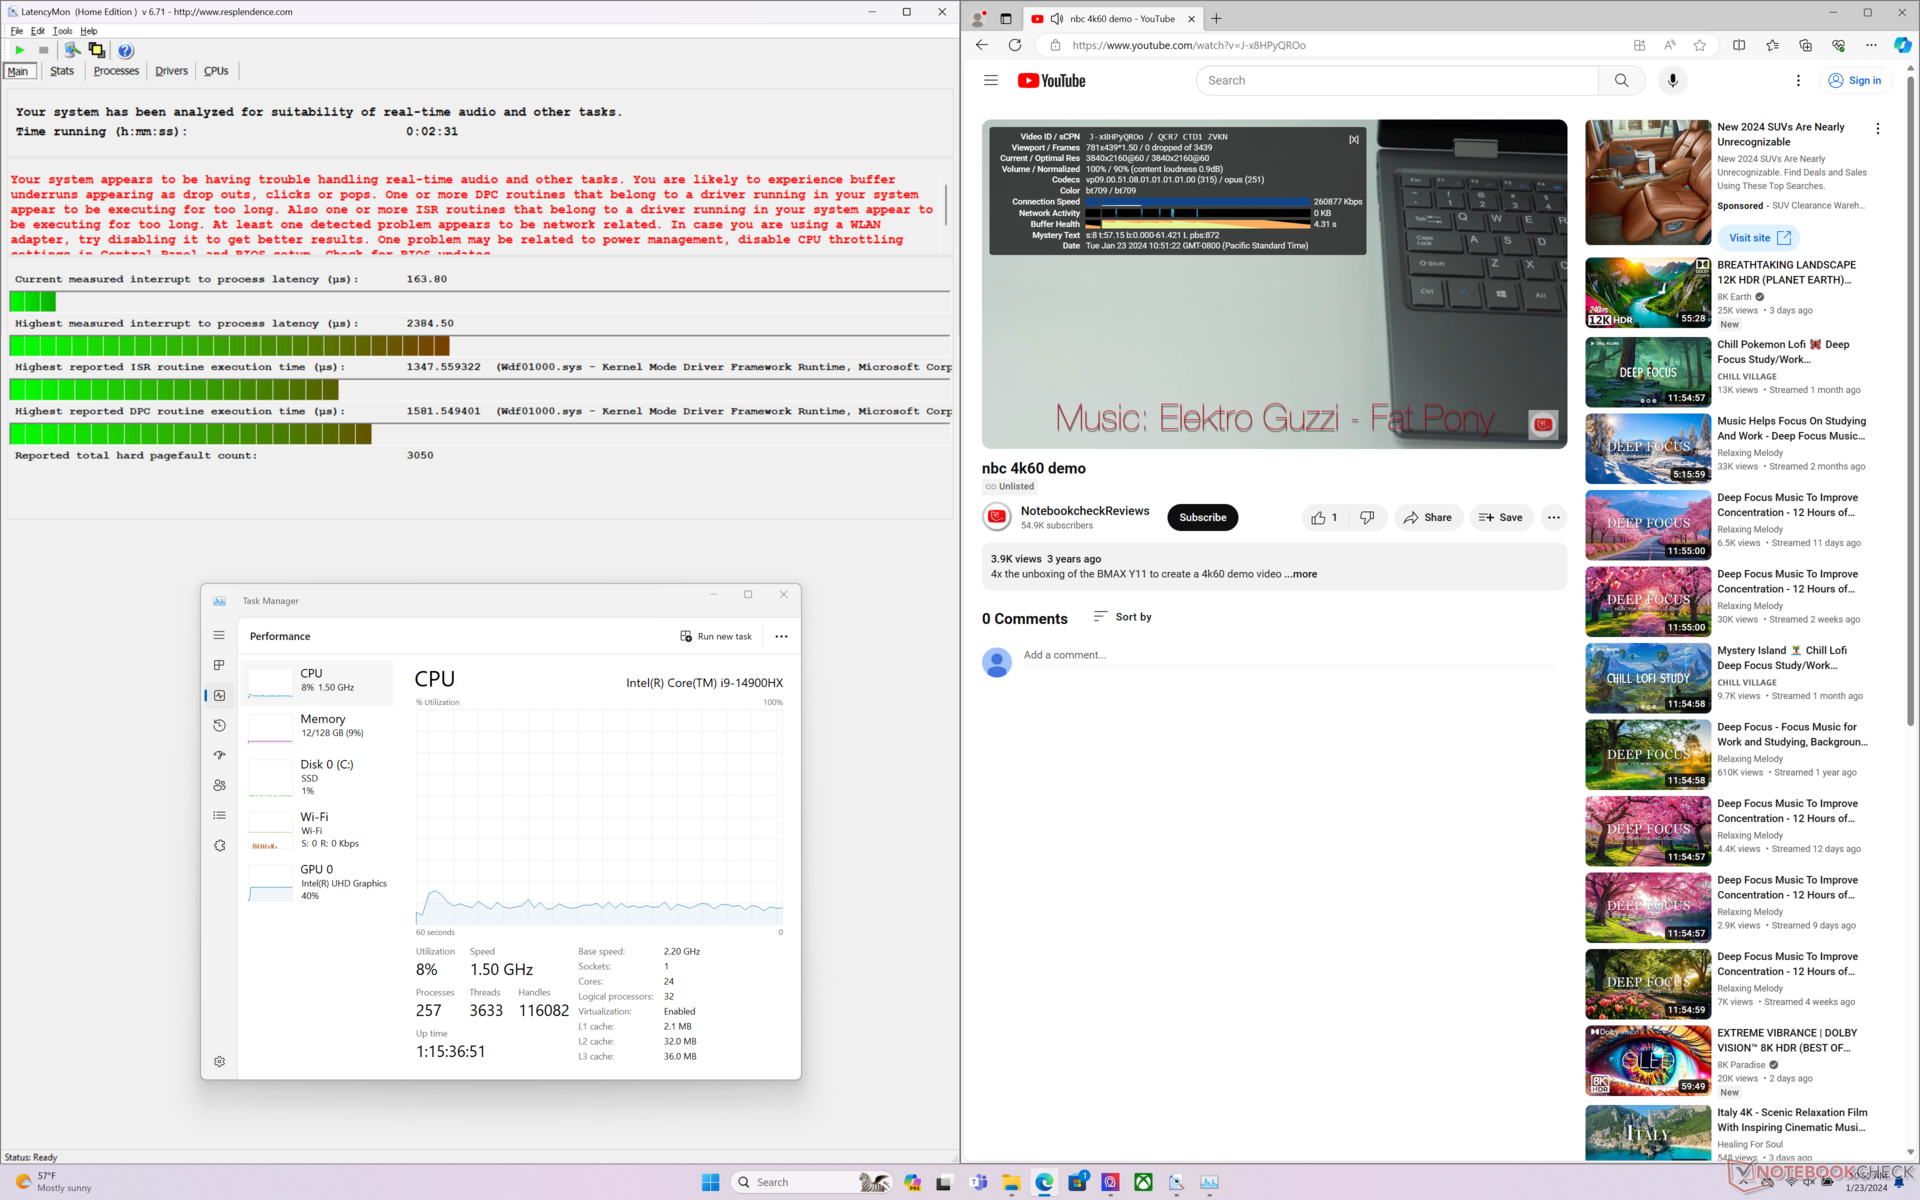
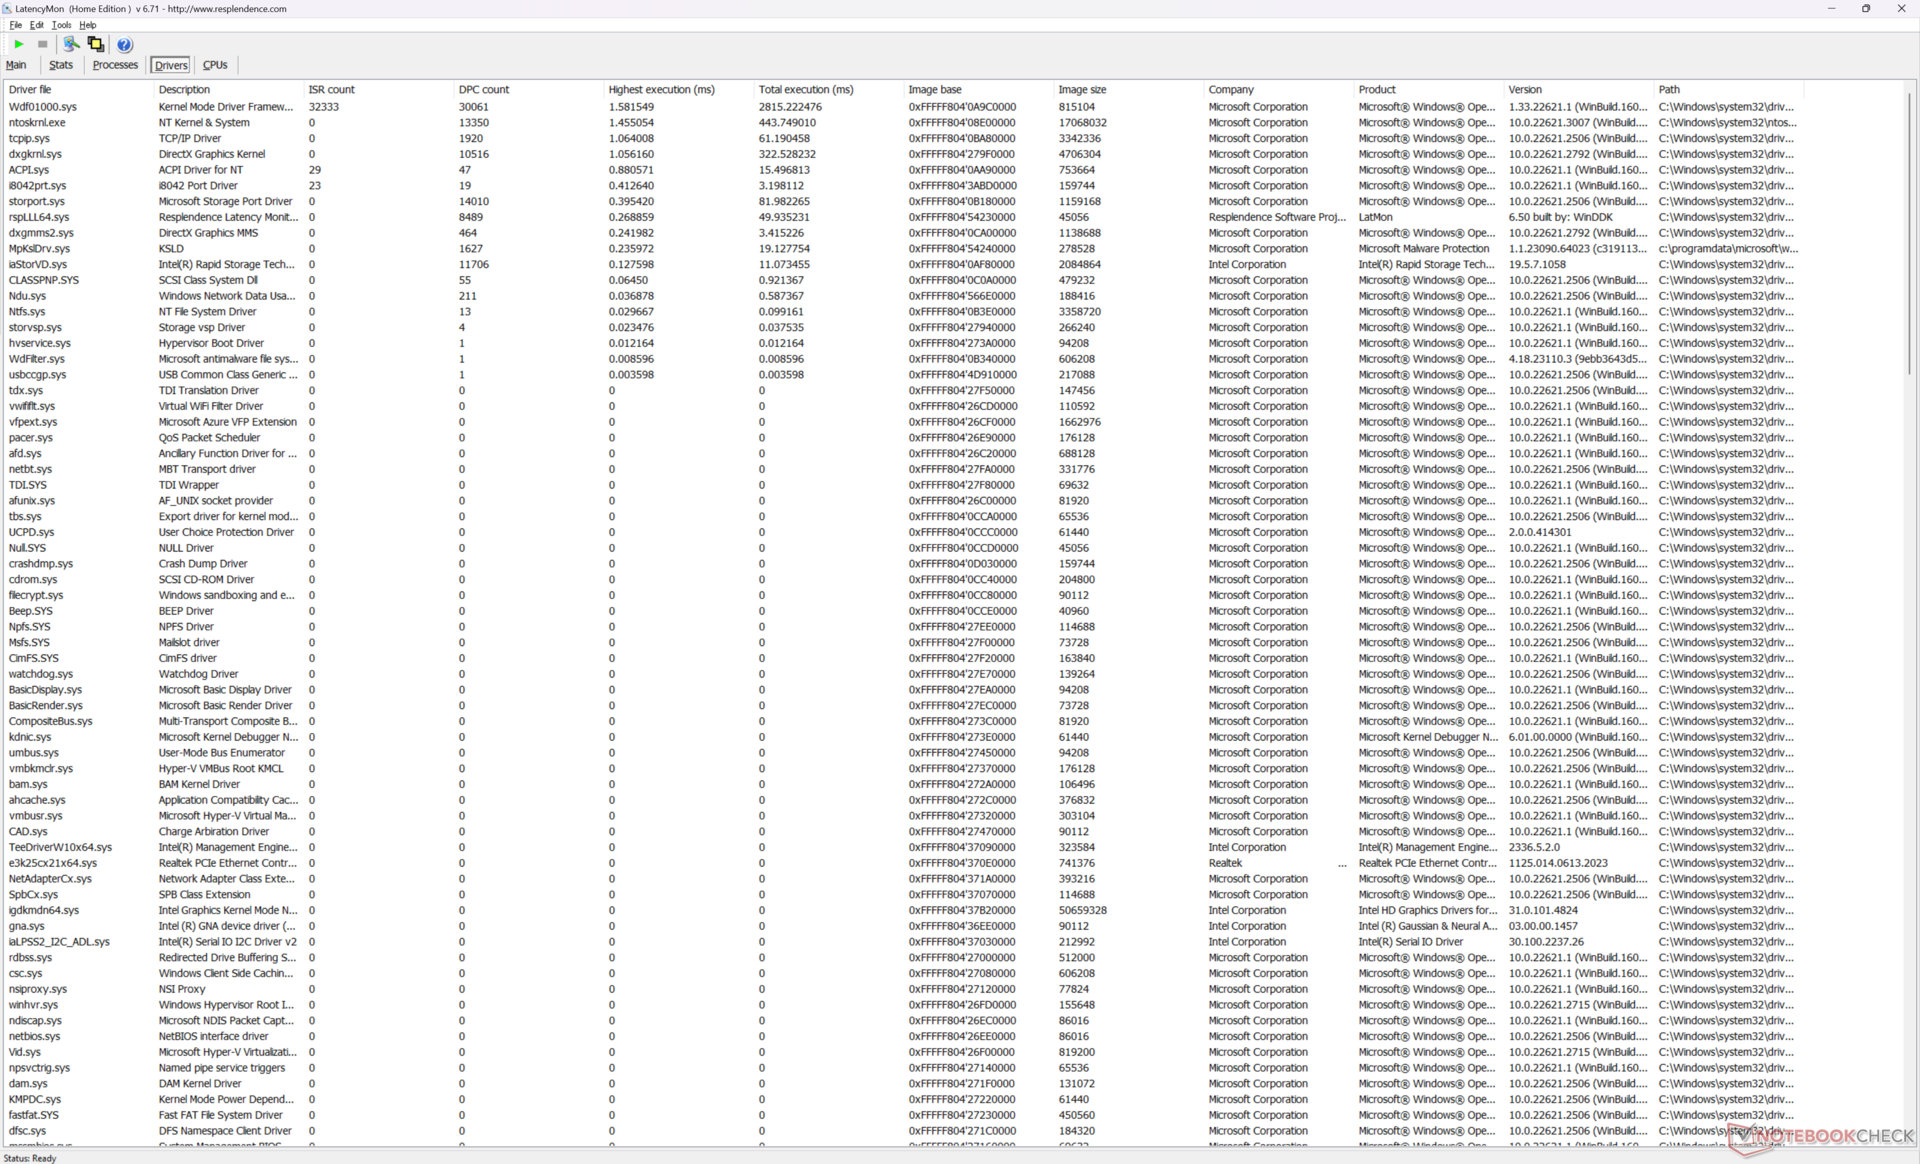
DPC-fördröjning
LatencyMon visar DPC-problem när flera webbläsarflikar öppnas på vår hemsida. uppspelning av 4K-video med 60 FPS i iGPU-läge är annars perfekt och inga tappade bildrutor registreras.
| DPC Latencies / LatencyMon - interrupt to process latency (max), Web, Youtube, Prime95 | |
| Acer Predator Helios 18 N23Q2 | |
| MSI Titan GT77 HX 13VI | |
| Alienware m18 R1 | |
| MSI Titan 18 HX A14VIG | |
| Razer Blade 18 RTX 4070 | |
| Asus ROG Strix G18 G814JI | |
* ... mindre är bättre
Lagringsenheter
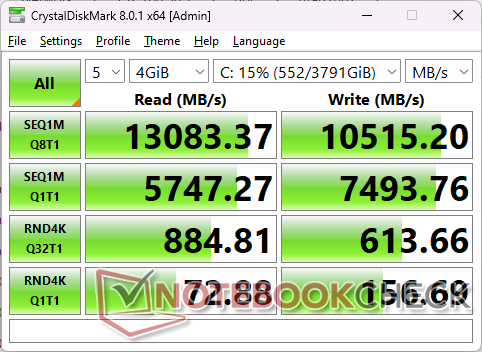
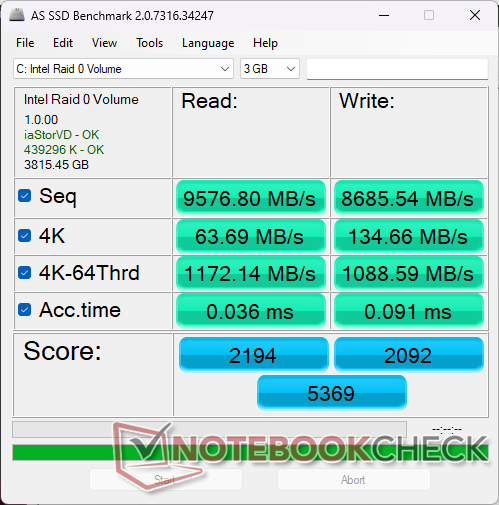
Vår enhet levereras med två Samsung MZVL22T0HDLB PM9A1a PCIe4 x4 NVMe SSD-enheter i RAID 0-konfiguration för överföringshastigheter som närmar sig 13000 MB/s istället för de vanliga ~7000 MB/s för de flesta enskilda PCIe4 x4 SSD-enheter. Enheterna uppvisade inga problem med strypning när de belastades med DiskSpd i flera minuter.
Titan 18 HX kan även stödja en PCIe5 M.2 SSD-enhet, men sådana enheter är fortfarande begränsade i lager och därför levereras de flesta konfigurationer för närvarande med PCIe4 x4-enheter istället.

| Drive Performance rating - Percent | |
| Alienware m18 R1 | |
| Acer Predator Helios 18 N23Q2 | |
| Razer Blade 18 RTX 4070 | |
| MSI Titan GT77 HX 13VI | |
| MSI Titan 18 HX A14VIG | |
| Asus ROG Strix G18 G814JI | |
* ... mindre är bättre
Disk Throttling: DiskSpd Read Loop, Queue Depth 8
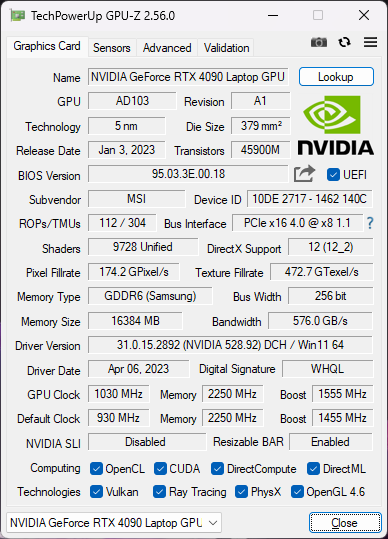
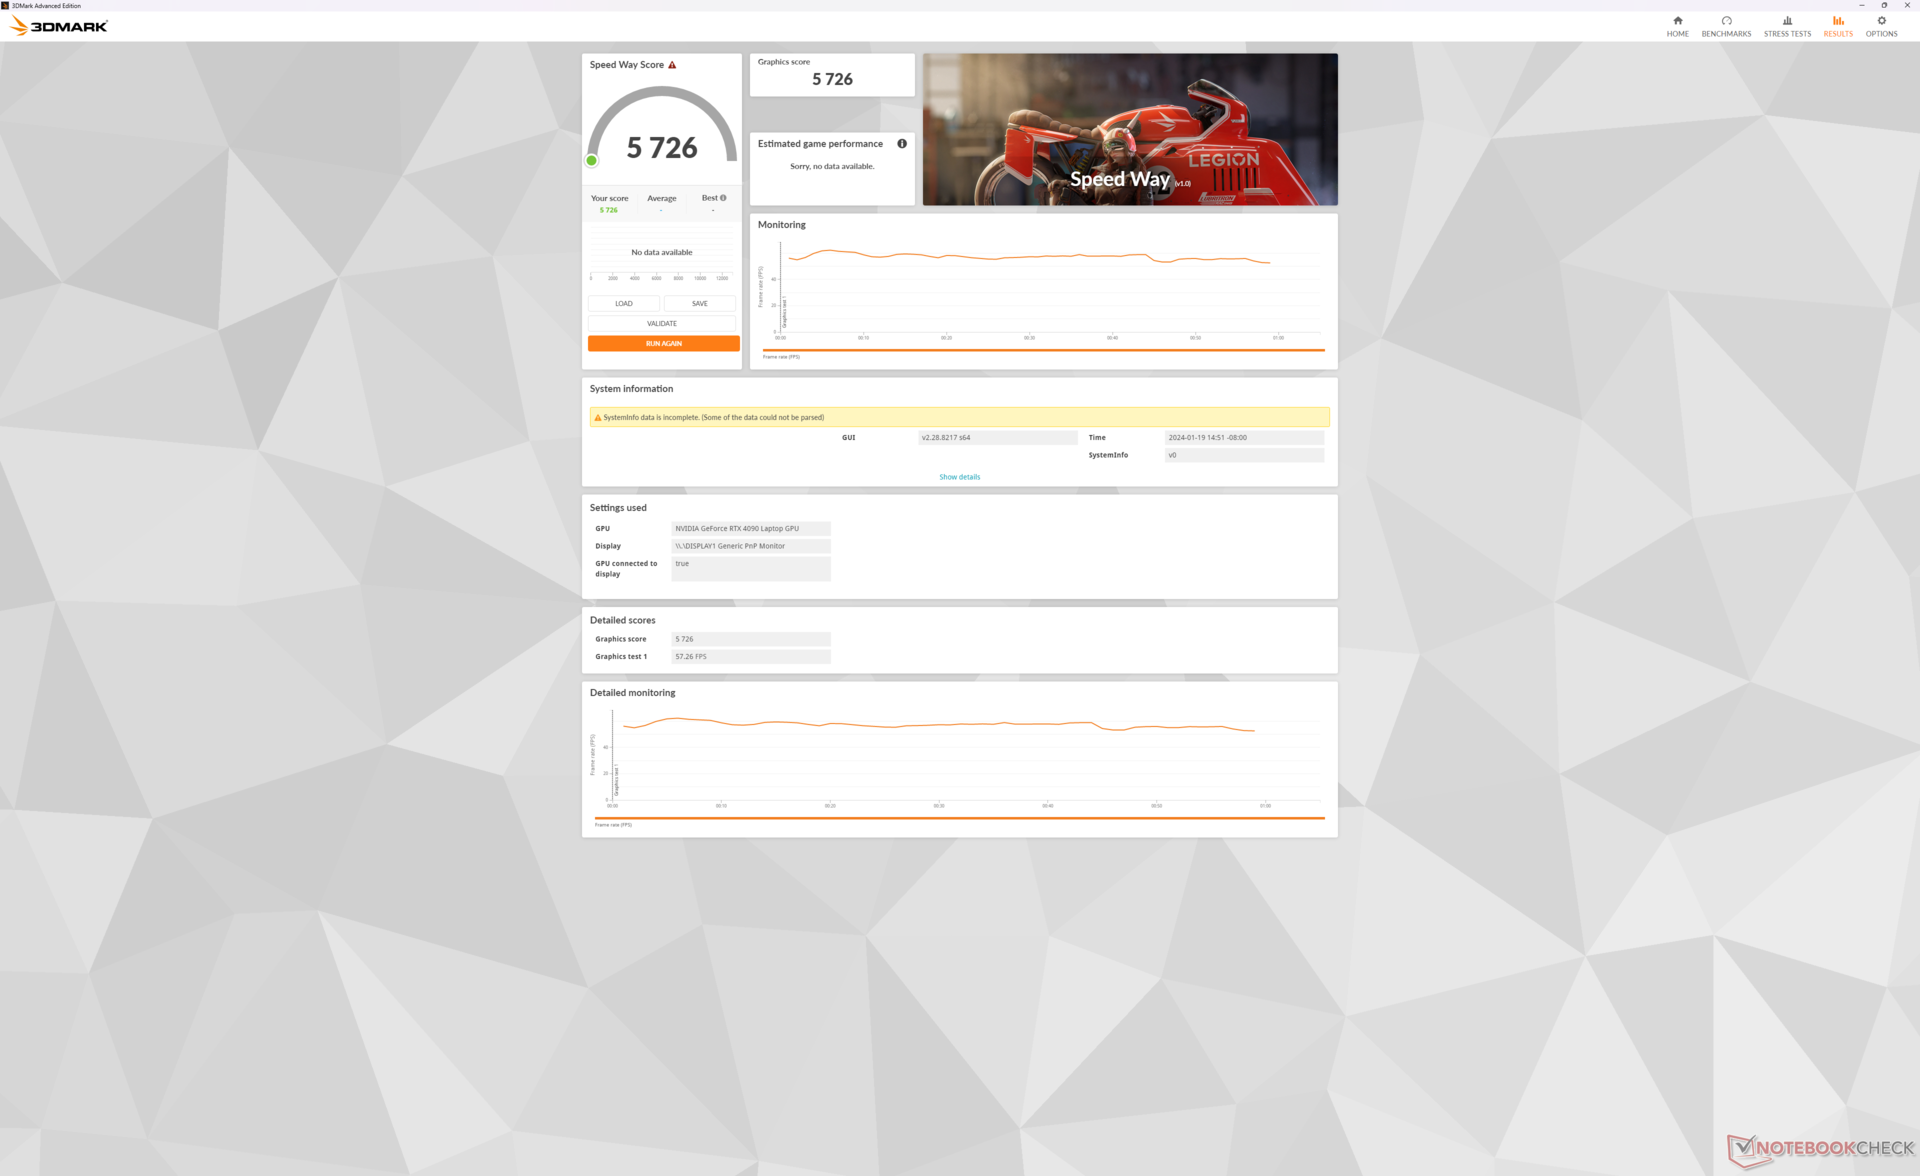
GPU-prestanda - 175 W grafik + 95 W processor
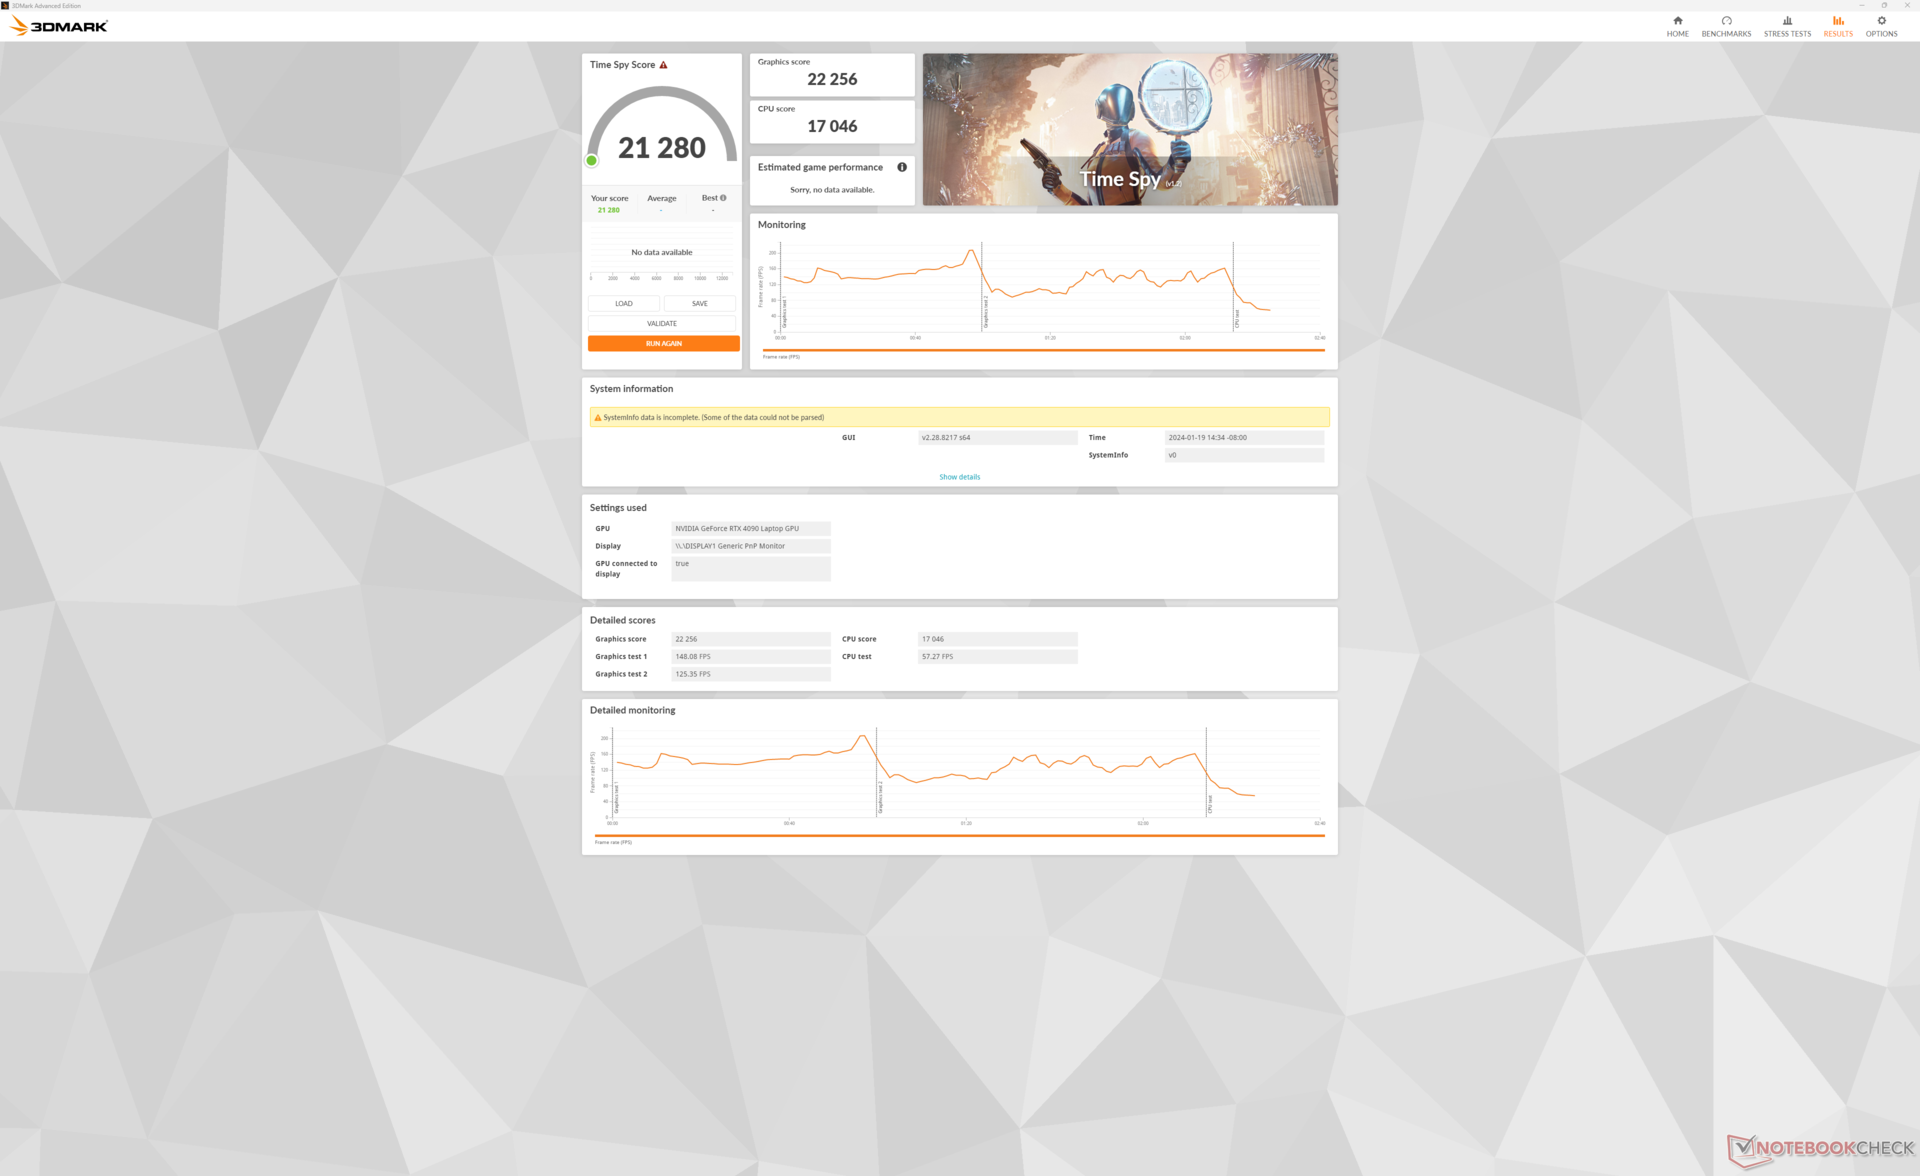
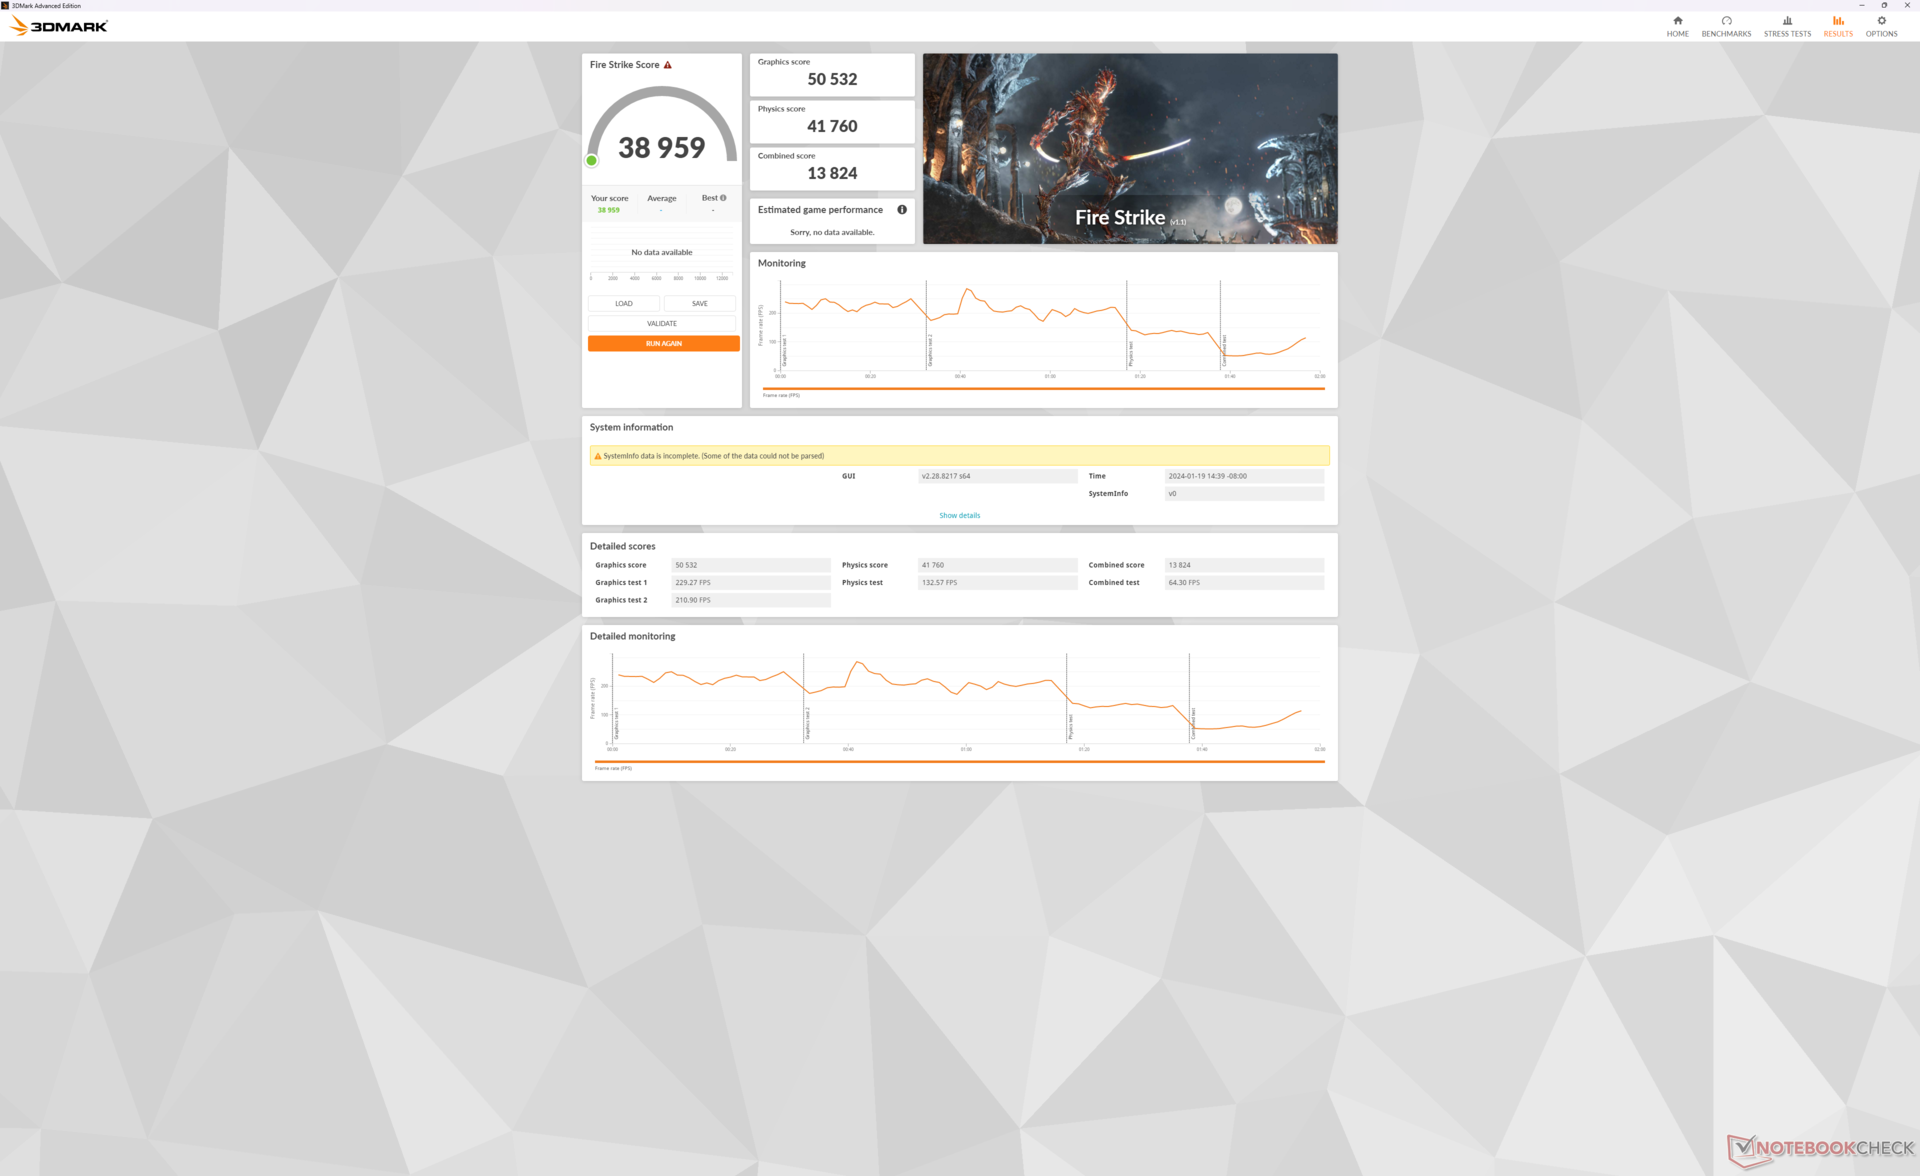
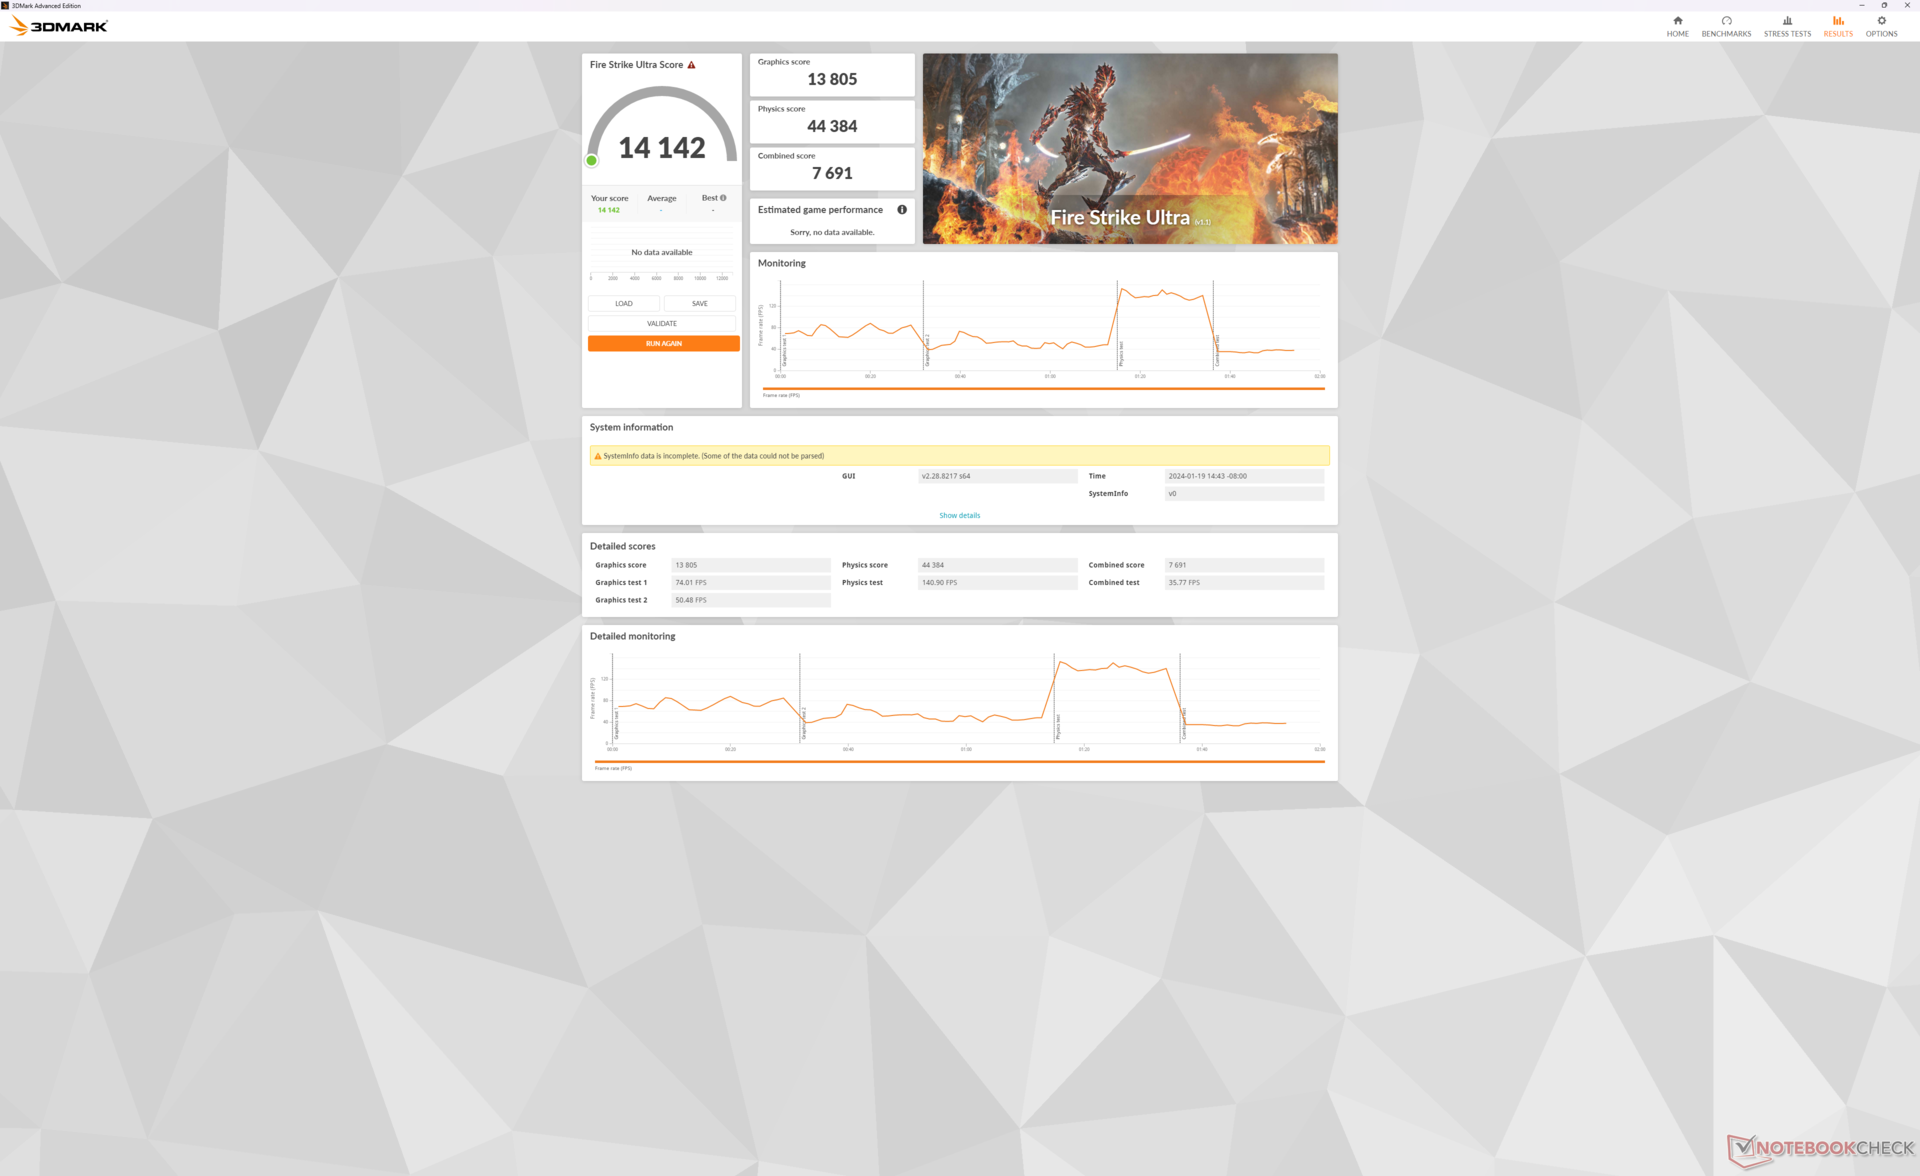
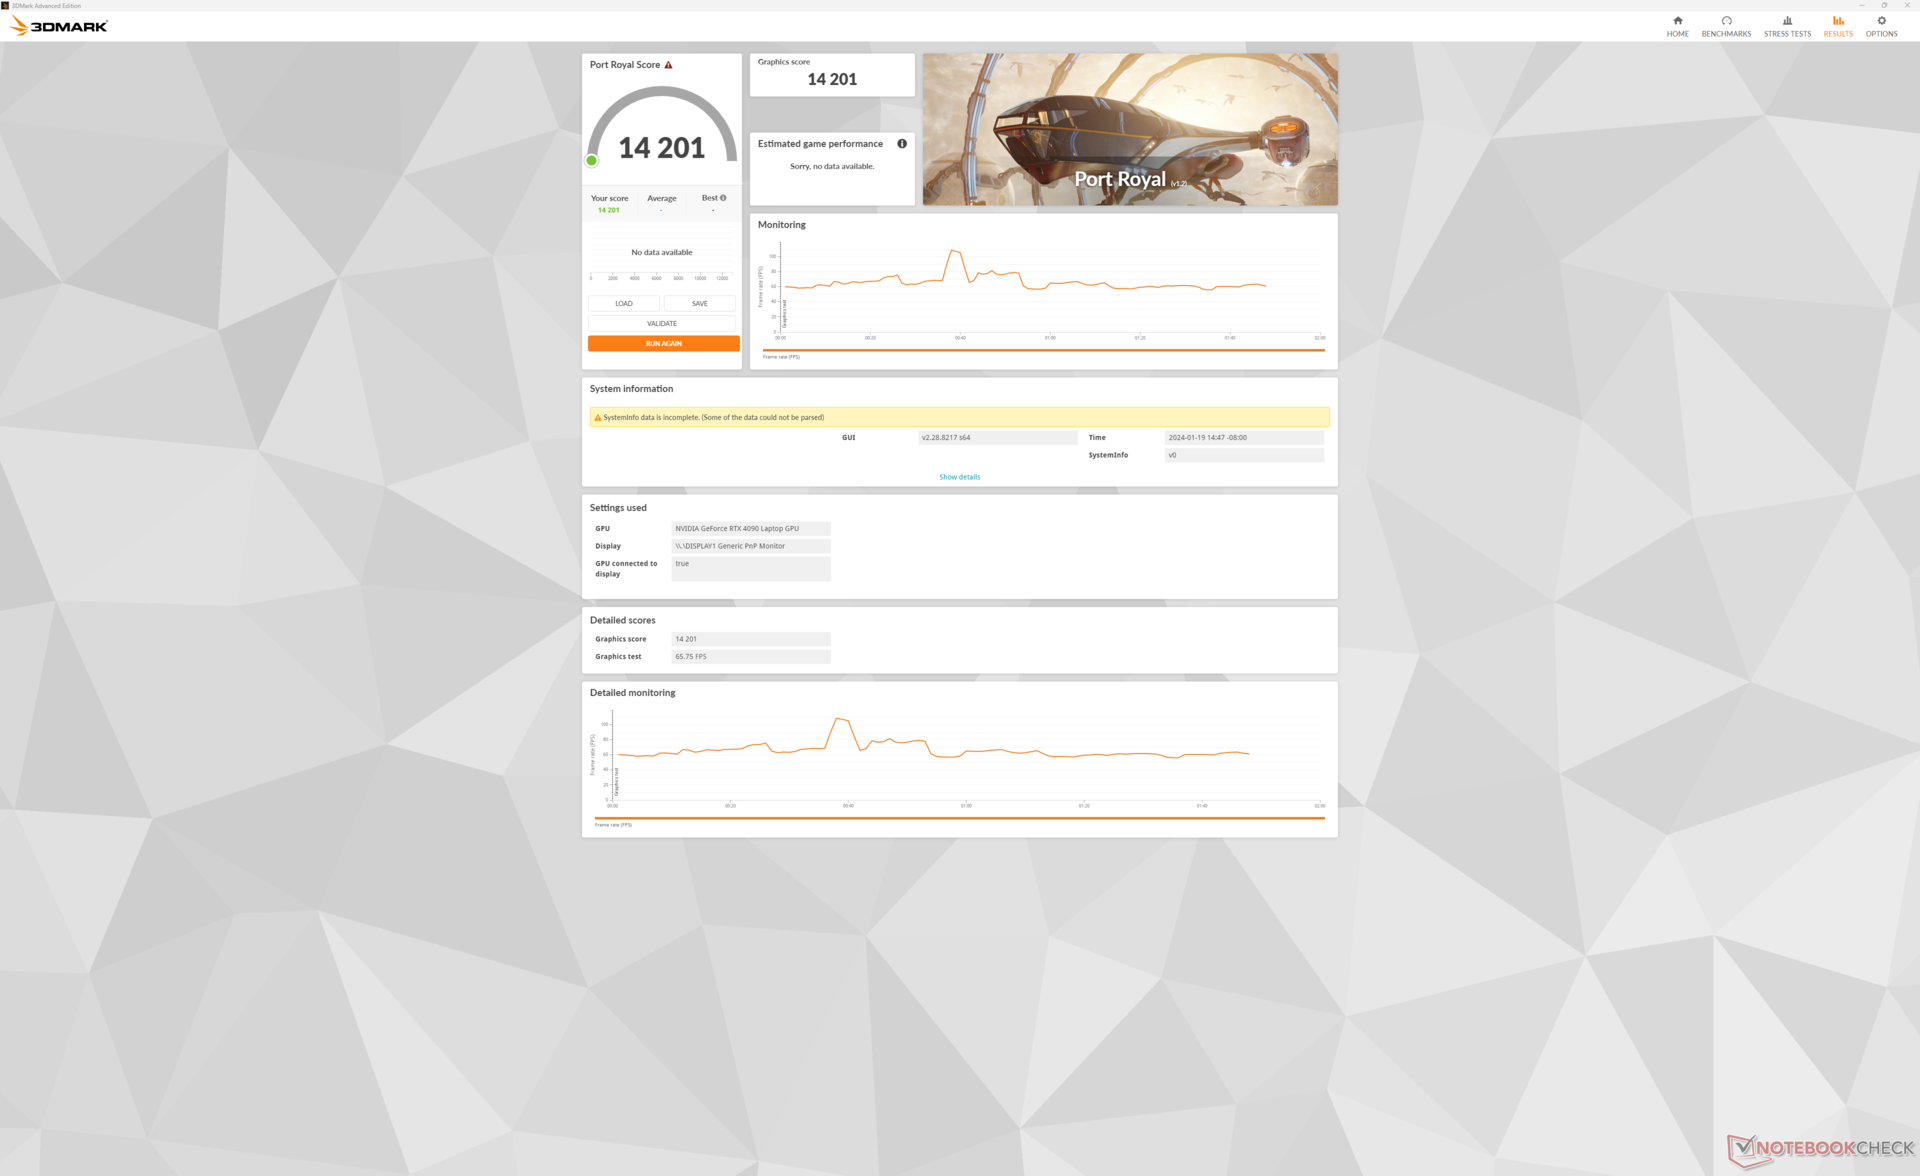
175 W mobil GeForce RTX 4090 GPU i vår Titan 18 HX skulle ge nästan identiska 3DMark-poäng som förra årets GT77 som är utrustad med samma GPU. Med andra ord, förvänta dig inte att det nya MSI-systemet ska prestera snabbare än tidigare trots den nya snygga externa designen. Det är ändå en av de snabbaste bärbara speldatorerna på marknaden med prestandanivåer som mest liknar de stationära GeForce RTX 4070 Super.
Aktivering eller inaktivering av Cooler Boost verkar inte påverka prestandan nämnvärt, vilket framgår av vår Time Spy resultattabell nedan, även om det finns betydande skillnader i fläktljud mellan de två lägena. Cooler Boost rekommenderas därför endast om kärntemperaturen är ett problem eller vid överklockning. Att köra i läget Balanserad istället för läget Extrem prestanda skulle dock minska grafikprestandan med cirka 10 procent.
| Kraftprofil | Poäng för grafik | Poäng för CPU | Totalt resultat |
| Extrem prestanda (Cooler Boost på) | 22256 | 17046 | 21280 |
| Extrem prestanda (kylarförstärkning av) | 22097 (-1%) | 16608 (-3%) | 21053 (-1%) |
| Balanserat läge | 20121 (-10%) | 16532 (-3%) | 19486 (-8%) |
| Batteridrift | 6480 (-71%) | 6999 (-59%) | 6552 (-69%) |
| 3DMark Performance rating - Percent | |
| AMD Ryzen 9 7900 -2! | |
| MSI Titan GT77 HX 13VI | |
| MSI Titan 18 HX A14VIG | |
| NVIDIA GeForce RTX 4070 Super Founders Edition | |
| Genomsnitt NVIDIA GeForce RTX 4090 Laptop GPU | |
| Alienware m18 R1 AMD -1! | |
| Acer Predator Helios 18 N23Q2 -1! | |
| Asus ROG Strix Scar 17 SE G733CX-LL014W | |
| Alienware m17 R5 (R9 6900HX, RX 6850M XT) -1! | |
| Razer Blade 18 RTX 4070 | |
| MSI Raider GE68 HX 13VG, i7-13700HX -1! | |
| Asus ROG Strix G18 G814JI -1! | |
| Asus ROG Zephyrus M16 GU603Z -1! | |
| Dell G16 7620 -1! | |
| Lenovo ThinkPad Z16 Gen 2 -1! | |
| 3DMark 11 Performance | 46238 poäng | |
| 3DMark Fire Strike Score | 38959 poäng | |
| 3DMark Time Spy Score | 21280 poäng | |
Hjälp | ||
* ... mindre är bättre
Spelprestanda
Alla aktuella titlar körs smidigt på den mobila RTX 4090 även med de flesta inställningarna på max. GPU:n börjar dock kämpa lite vid 4K med F1 22 och Cyberpunk 2077 med i genomsnitt endast 44 FPS vardera. I dessa scenarier är det rekommenderat att aktivera DLSS, särskilt eftersom skärmen inte stöder G-Sync. Om du till exempel kör Cyberpunk 2077 med inbyggd 4K och Ultra RT-inställningar blir genomsnittet bara 21,6 FPS medan aktivering av DLSS Auto och Frame Generation ökar genomsnittet till 89 FPS.
| Performance rating - Percent | |
| Alienware m18 R1 | |
| MSI Titan GT77 HX 13VI | |
| MSI Titan 18 HX A14VIG | |
| Acer Predator Helios 18 N23Q2 | |
| Razer Blade 18 RTX 4070 | |
| Asus ROG Strix G18 G814JI | |
| The Witcher 3 - 1920x1080 Ultra Graphics & Postprocessing (HBAO+) | |
| Alienware m18 R1 | |
| MSI Titan 18 HX A14VIG | |
| MSI Titan GT77 HX 13VI | |
| Acer Predator Helios 18 N23Q2 | |
| Asus ROG Strix G18 G814JI | |
| Razer Blade 18 RTX 4070 | |
| GTA V - 1920x1080 Highest AA:4xMSAA + FX AF:16x | |
| Acer Predator Helios 18 N23Q2 | |
| Alienware m18 R1 | |
| MSI Titan GT77 HX 13VI | |
| MSI Titan 18 HX A14VIG | |
| Razer Blade 18 RTX 4070 | |
| Asus ROG Strix G18 G814JI | |
| Final Fantasy XV Benchmark - 1920x1080 High Quality | |
| Alienware m18 R1 | |
| MSI Titan GT77 HX 13VI | |
| MSI Titan 18 HX A14VIG | |
| Acer Predator Helios 18 N23Q2 | |
| Asus ROG Strix G18 G814JI | |
| Razer Blade 18 RTX 4070 | |
| Strange Brigade - 1920x1080 ultra AA:ultra AF:16 | |
| MSI Titan 18 HX A14VIG | |
| MSI Titan GT77 HX 13VI | |
| Alienware m18 R1 | |
| Acer Predator Helios 18 N23Q2 | |
| Asus ROG Strix G18 G814JI | |
| Razer Blade 18 RTX 4070 | |
| Dota 2 Reborn - 1920x1080 ultra (3/3) best looking | |
| Alienware m18 R1 | |
| Acer Predator Helios 18 N23Q2 | |
| MSI Titan GT77 HX 13VI | |
| Razer Blade 18 RTX 4070 | |
| MSI Titan 18 HX A14VIG | |
| Asus ROG Strix G18 G814JI | |
| X-Plane 11.11 - 1920x1080 high (fps_test=3) | |
| Alienware m18 R1 | |
| Acer Predator Helios 18 N23Q2 | |
| Razer Blade 18 RTX 4070 | |
| MSI Titan GT77 HX 13VI | |
| MSI Titan GT77 HX 13VI | |
| MSI Titan 18 HX A14VIG | |
| Asus ROG Strix G18 G814JI | |
| The Witcher 3 | |
| 1920x1080 Ultra Graphics & Postprocessing (HBAO+) | |
| AMD Ryzen 9 7900 | |
| MSI Titan 18 HX A14VIG | |
| MSI Titan GT77 HX 13VI | |
| Genomsnitt NVIDIA GeForce RTX 4090 Laptop GPU (139.2 - 216, n=35) | |
| NVIDIA GeForce RTX 4070 Super Founders Edition | |
| Acer Predator Helios 18 N23Q2 | |
| Alienware m18 R1 AMD | |
| Alienware m17 R5 (R9 6900HX, RX 6850M XT) | |
| MSI Raider GE68 HX 13VG, i7-13700HX | |
| Asus ROG Strix G18 G814JI | |
| Asus ROG Strix Scar 17 SE G733CX-LL014W | |
| Razer Blade 18 RTX 4070 | |
| Asus ROG Zephyrus M16 GU603Z | |
| Dell G16 7620 | |
| Lenovo ThinkPad Z16 Gen 2 | |
| 3840x2160 High Graphics & Postprocessing (Nvidia HairWorks Off) | |
| AMD Ryzen 9 7900 | |
| MSI Titan 18 HX A14VIG | |
| MSI Titan GT77 HX 13VI | |
| Genomsnitt NVIDIA GeForce RTX 4090 Laptop GPU (96.3 - 167.6, n=19) | |
| NVIDIA GeForce RTX 4070 Super Founders Edition | |
| Alienware m18 R1 AMD | |
| Razer Blade 18 RTX 4070 | |
| Alienware m17 R5 (R9 6900HX, RX 6850M XT) | |
| Tiny Tina's Wonderlands | |
| 1920x1080 Badass Preset (DX12) | |
| MSI Titan GT77 HX 13VI | |
| MSI Titan 18 HX A14VIG | |
| Genomsnitt NVIDIA GeForce RTX 4090 Laptop GPU (141.1 - 189.4, n=14) | |
| Alienware m18 R1 AMD | |
| Lenovo ThinkPad Z16 Gen 2 | |
| 2560x1440 Badass Preset (DX12) | |
| MSI Titan GT77 HX 13VI | |
| MSI Titan 18 HX A14VIG | |
| Genomsnitt NVIDIA GeForce RTX 4090 Laptop GPU (103.4 - 137.8, n=14) | |
| Alienware m18 R1 AMD | |
| Lenovo ThinkPad Z16 Gen 2 | |
| 3840x2160 Badass Preset (DX12) | |
| MSI Titan 18 HX A14VIG | |
| MSI Titan GT77 HX 13VI | |
| Genomsnitt NVIDIA GeForce RTX 4090 Laptop GPU (53.3 - 73.7, n=12) | |
| Alienware m18 R1 AMD | |
| Cyberpunk 2077 | |
| 1920x1080 Ultra Preset (FSR off) | |
| NVIDIA GeForce RTX 4070 Super Founders Edition | |
| MSI Titan 18 HX A14VIG | |
| Alienware m18 R1 AMD | |
| Acer Predator Helios 18 N23Q2 | |
| Genomsnitt NVIDIA GeForce RTX 4090 Laptop GPU (93.1 - 158, n=21) | |
| Lenovo ThinkPad Z16 Gen 2 | |
| 2560x1440 Ultra Preset (FSR off) | |
| MSI Titan 18 HX A14VIG | |
| Genomsnitt NVIDIA GeForce RTX 4090 Laptop GPU (68.1 - 103.9, n=21) | |
| Alienware m18 R1 AMD | |
| NVIDIA GeForce RTX 4070 Super Founders Edition | |
| Acer Predator Helios 18 N23Q2 | |
| Lenovo ThinkPad Z16 Gen 2 | |
| 3840x2160 Ultra Preset (FSR off) | |
| MSI Titan 18 HX A14VIG | |
| Genomsnitt NVIDIA GeForce RTX 4090 Laptop GPU (31.6 - 50.6, n=11) | |
| NVIDIA GeForce RTX 4070 Super Founders Edition | |
| Alienware m18 R1 AMD | |
| 3840x2160 Ray Tracing Ultra Preset (DLSS off, no Path Tracing) | |
| Genomsnitt NVIDIA GeForce RTX 4090 Laptop GPU (20.2 - 22.3, n=4) | |
| NVIDIA GeForce RTX 4070 Super Founders Edition | |
| F1 22 | |
| 1920x1080 Ultra High Preset AA:T AF:16x | |
| AMD Ryzen 9 7900 | |
| MSI Titan GT77 HX 13VI | |
| MSI Titan 18 HX A14VIG | |
| NVIDIA GeForce RTX 4070 Super Founders Edition | |
| Genomsnitt NVIDIA GeForce RTX 4090 Laptop GPU (70.3 - 144.7, n=25) | |
| Alienware m18 R1 AMD | |
| MSI Raider GE68 HX 13VG, i7-13700HX | |
| Asus ROG Strix Scar 17 SE G733CX-LL014W | |
| Lenovo ThinkPad Z16 Gen 2 | |
| 2560x1440 Ultra High Preset AA:T AF:16x | |
| AMD Ryzen 9 7900 | |
| MSI Titan 18 HX A14VIG | |
| MSI Titan GT77 HX 13VI | |
| Genomsnitt NVIDIA GeForce RTX 4090 Laptop GPU (65.9 - 92.2, n=25) | |
| NVIDIA GeForce RTX 4070 Super Founders Edition | |
| Alienware m18 R1 AMD | |
| Asus ROG Strix Scar 17 SE G733CX-LL014W | |
| MSI Raider GE68 HX 13VG, i7-13700HX | |
| Lenovo ThinkPad Z16 Gen 2 | |
| 3840x2160 Ultra High Preset AA:T AF:16x | |
| AMD Ryzen 9 7900 | |
| MSI Titan GT77 HX 13VI | |
| MSI Titan 18 HX A14VIG | |
| Genomsnitt NVIDIA GeForce RTX 4090 Laptop GPU (36.8 - 46.1, n=18) | |
| NVIDIA GeForce RTX 4070 Super Founders Edition | |
| Alienware m18 R1 AMD | |
| MSI Raider GE68 HX 13VG, i7-13700HX | |
Witcher 3 FPS Chart
| låg | med. | hög | ultra | QHD | 4K | |
|---|---|---|---|---|---|---|
| GTA V (2015) | 139.2 | |||||
| The Witcher 3 (2015) | 595.3 | 506.6 | 412.2 | 211.2 | 160.7 | |
| Dota 2 Reborn (2015) | 218 | 196.3 | 186.5 | 174.5 | 168.3 | |
| Final Fantasy XV Benchmark (2018) | 229 | 216 | 184 | 158 | 93.6 | |
| X-Plane 11.11 (2018) | 184.9 | 161.8 | 126.1 | 106.5 | ||
| Far Cry 5 (2018) | 191 | 164 | 158 | 155 | 152 | 112 |
| Strange Brigade (2018) | 511 | 423 | 406 | 385 | 307 | 156.1 |
| Tiny Tina's Wonderlands (2022) | 324.7 | 279.8 | 223.7 | 182 | 130.8 | 71 |
| F1 22 (2022) | 307 | 297 | 280 | 132.7 | 90.5 | 44.6 |
| Baldur's Gate 3 (2023) | 246.7 | 226.9 | 208.6 | 207.7 | 155.2 | 80.8 |
| Cyberpunk 2077 (2023) | 155.7 | 145.4 | 135.9 | 129.8 | 94.5 | 43.9 |
| Avatar Frontiers of Pandora (2023) | 103 | 69 | 35 |
Utsläpp
Buller från systemet
Fläktljud och fläktbeteende är direkt kopplade till MSI Centers effektprofiler: Extreme Performance med Cooler Boost på, Extreme Performance med Cooler Boost av, Balanced och Silent. Spel med Cooler Boost på kan vara så högljudda som 63 dB(A) jämfört med 57,3 dB(A) om Cooler Boost är av. Eftersom prestandaskillnaderna mellan de två lägena är mycket små, som nämnts ovan, rekommenderas dock att du spelar med Cooler Boost av för att undvika att datorn låter som en hårtork.
Fläktljudet när du spelar i läget Balanserad uppgår till 53 dB(A), vilket är märkbart tystare än i något av de två Extreme Performance-lägena. Var dock medveten om att prestandaförlusten är större om du kör i balanserat läge, som nämnts ovan. Var beredd på ett mycket högljutt system oavsett när du spelar.
Ljudnivå
| Låg belastning |
| 23.8 / 23.8 / 28 dB(A) |
| Hög belastning |
| 38 / 62.8 dB(A) |
 | ||
30 dB tyst 40 dB(A) hörbar 50 dB(A) högt ljud |
||
min: | ||
| MSI Titan 18 HX A14VIG GeForce RTX 4090 Laptop GPU, i9-14900HX, 2x Samsung PM9A1a MZVL22T0HDLB (RAID 0) | MSI Titan GT77 HX 13VI GeForce RTX 4090 Laptop GPU, i9-13950HX, Samsung PM9A1 MZVL22T0HBLB | Alienware m18 R1 GeForce RTX 4090 Laptop GPU, i9-13980HX, SK hynix PC801 HFS001TEJ9X101N | Asus ROG Strix G18 G814JI GeForce RTX 4070 Laptop GPU, i7-13650HX, Micron 2400 MTFDKBA1T0QFM | Acer Predator Helios 18 N23Q2 GeForce RTX 4080 Laptop GPU, i9-13900HX, Samsung PM9A1 MZVL22T0HBLB | Razer Blade 18 RTX 4070 GeForce RTX 4070 Laptop GPU, i9-13950HX, SSSTC CA6-8D1024 | |
|---|---|---|---|---|---|---|
| Noise | -12% | 7% | 0% | 1% | 5% | |
| av / miljö * (dB) | 22.8 | 24.6 -8% | 22.8 -0% | 25 -10% | 23 -1% | 23.5 -3% |
| Idle Minimum * (dB) | 23.8 | 29.2 -23% | 23 3% | 26 -9% | 23 3% | 23.8 -0% |
| Idle Average * (dB) | 23.8 | 29.2 -23% | 23 3% | 28 -18% | 23 3% | 23.8 -0% |
| Idle Maximum * (dB) | 28 | 29.2 -4% | 23 18% | 29 -4% | 23 18% | 26.8 4% |
| Load Average * (dB) | 38 | 50.7 -33% | 35.6 6% | 41 -8% | 45.26 -19% | 37.3 2% |
| Witcher 3 ultra * (dB) | 57.3 | 53.3 7% | 51.3 10% | 44 23% | 59.82 -4% | 48 16% |
| Load Maximum * (dB) | 62.8 | 61 3% | 56.7 10% | 46 27% | 59.94 5% | 53.5 15% |
* ... mindre är bättre
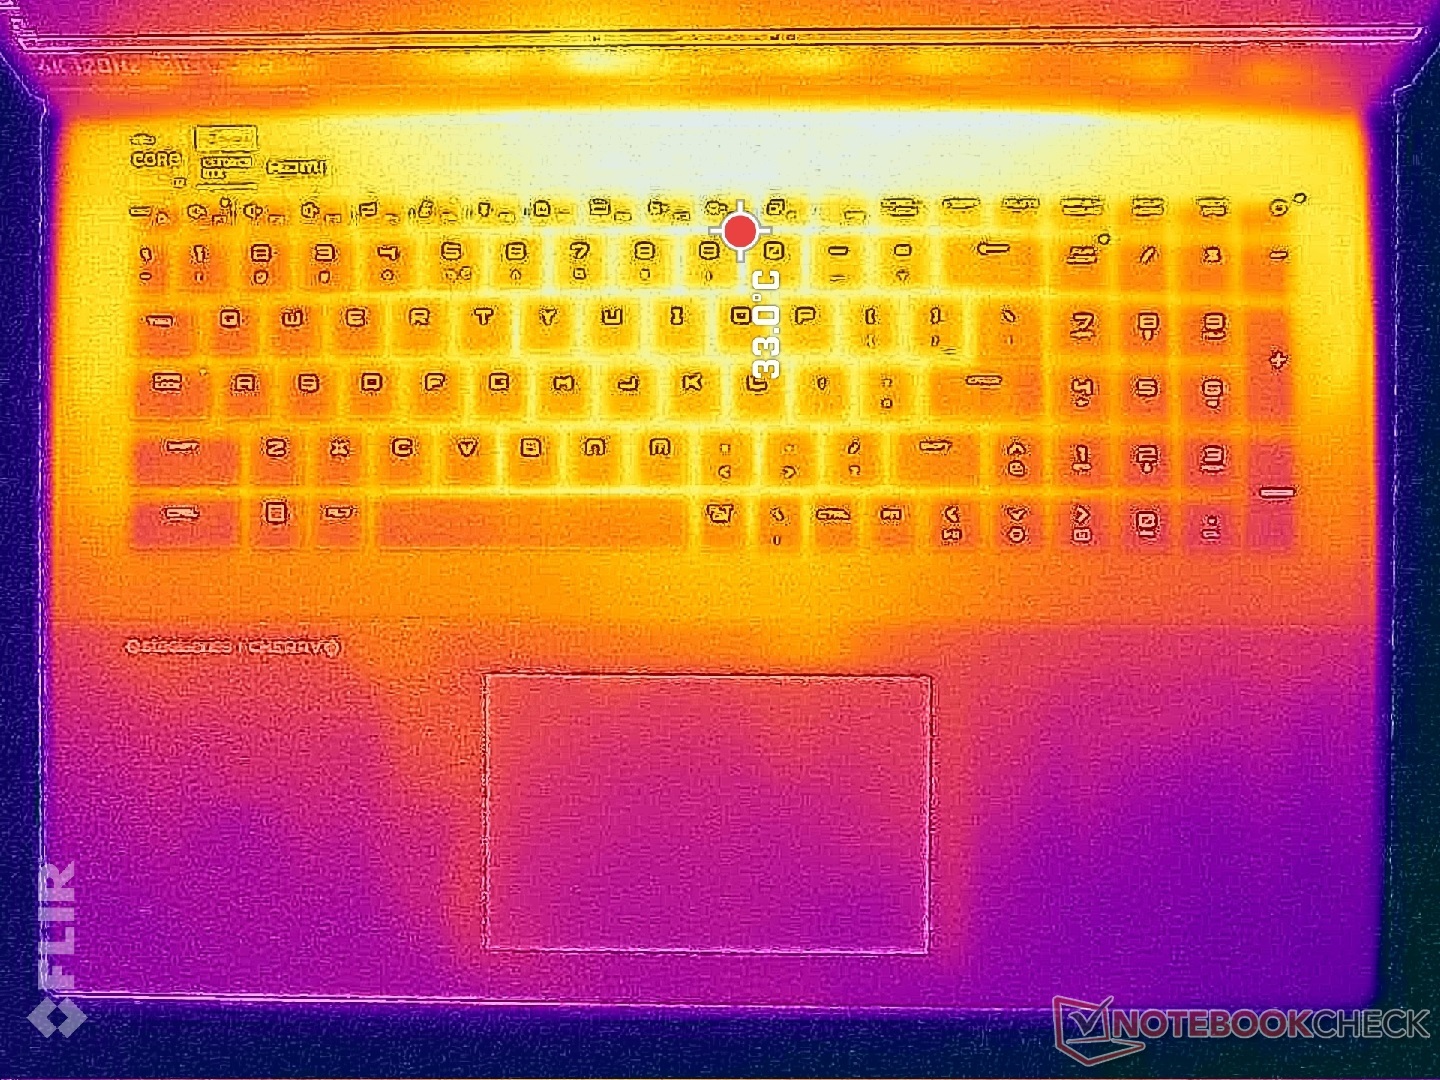
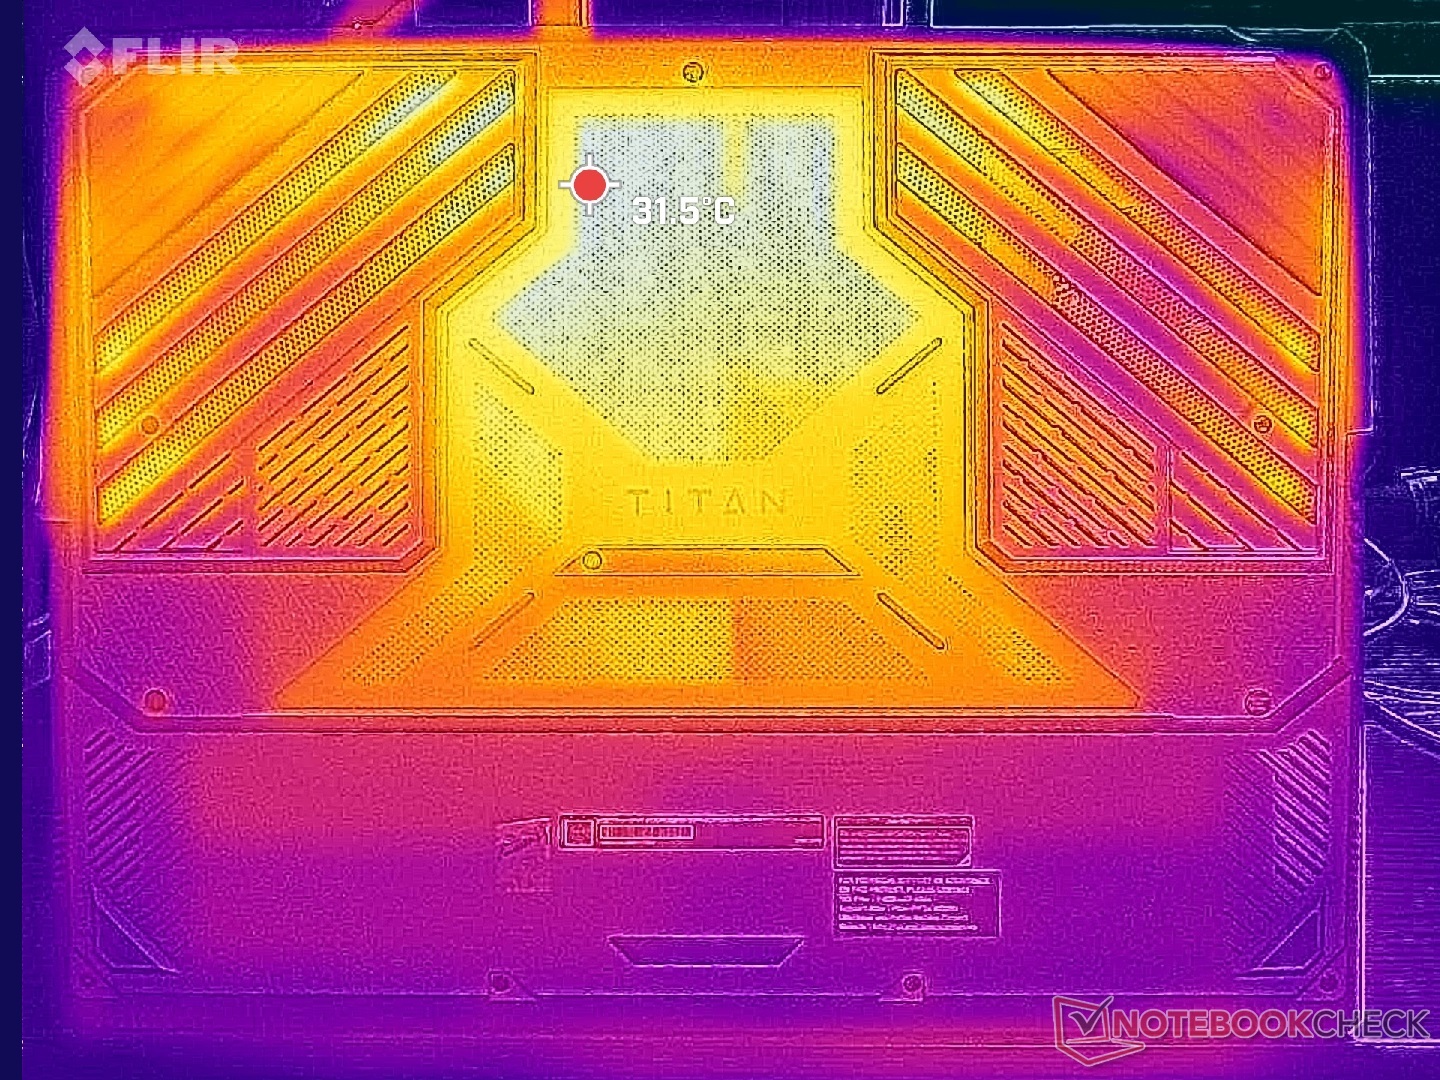
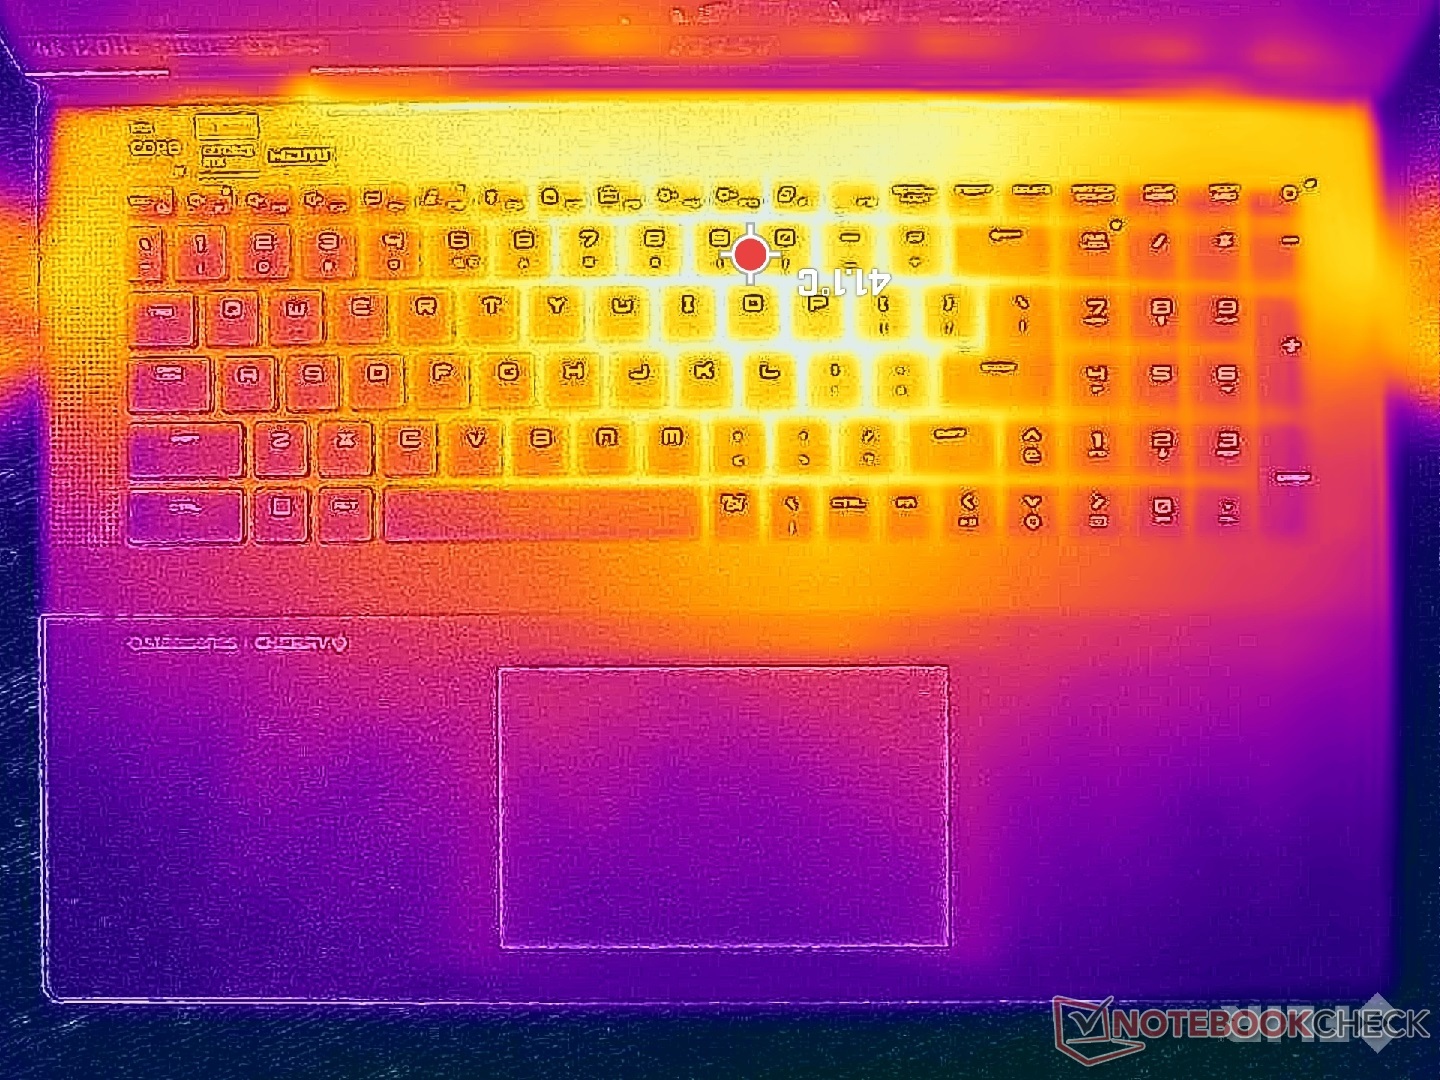
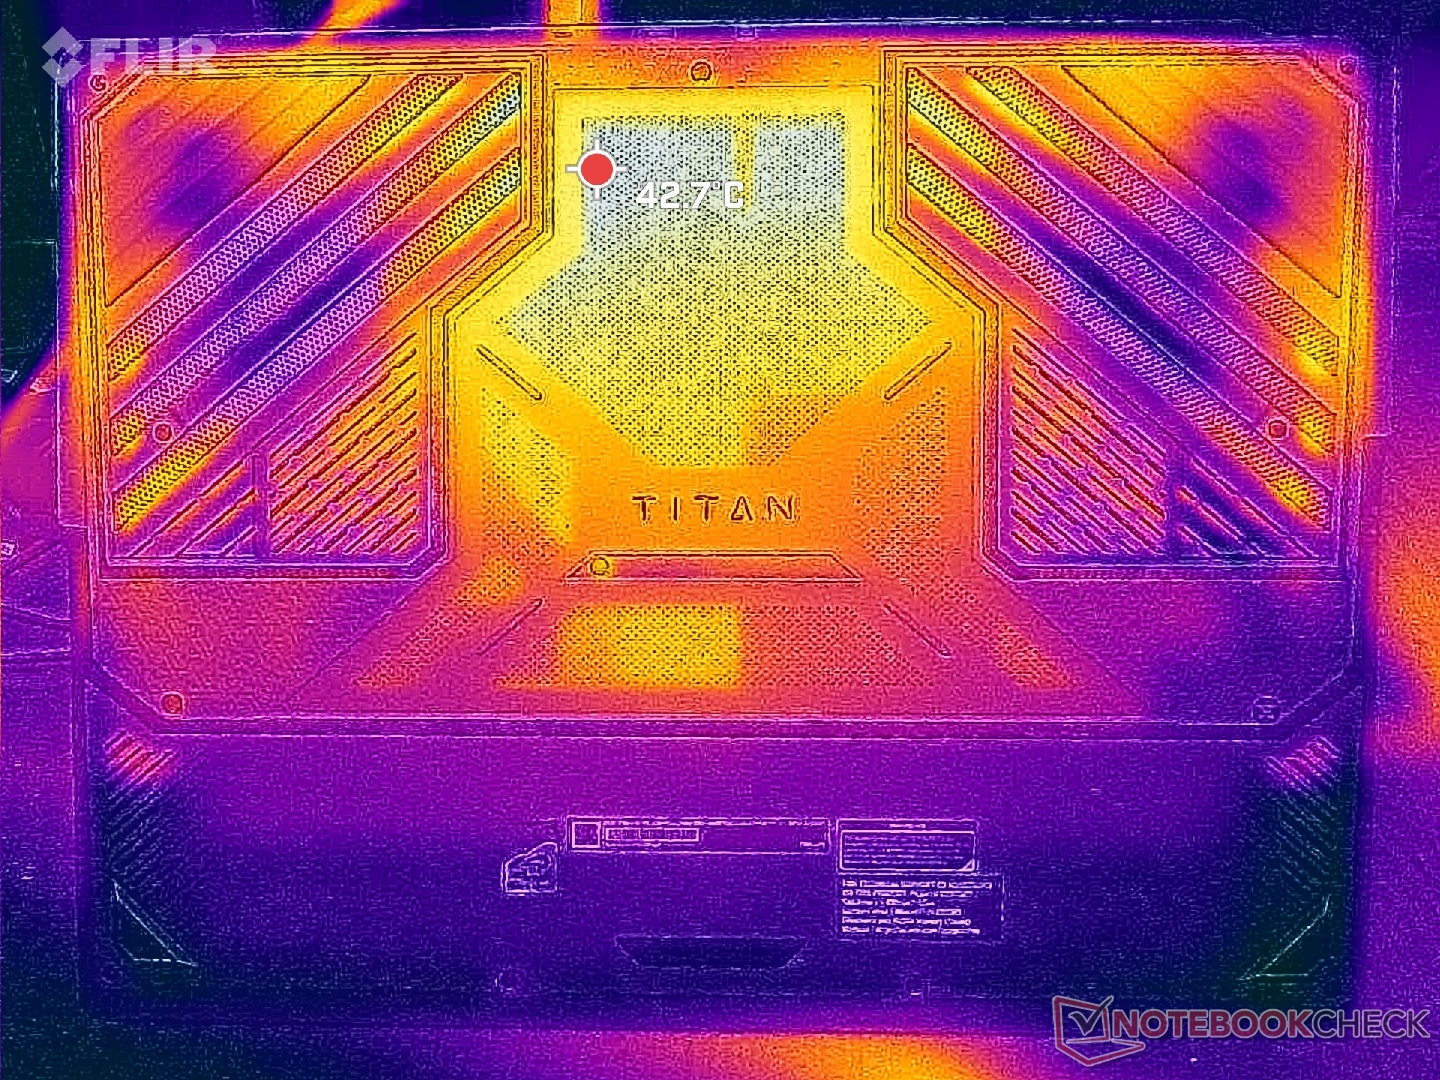
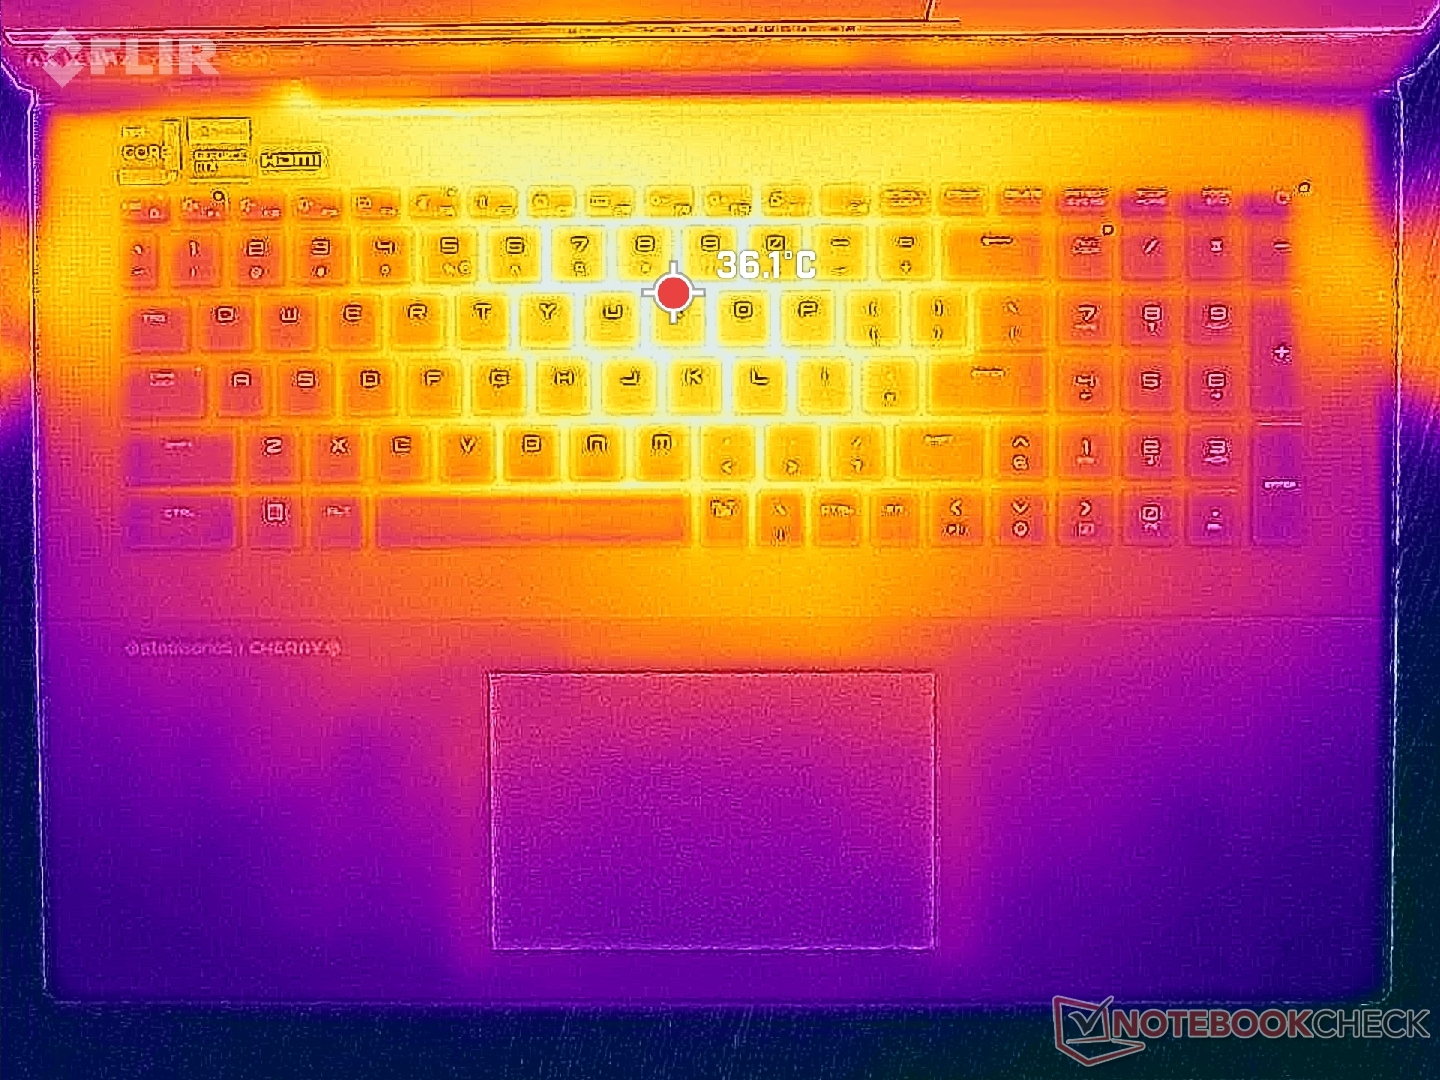
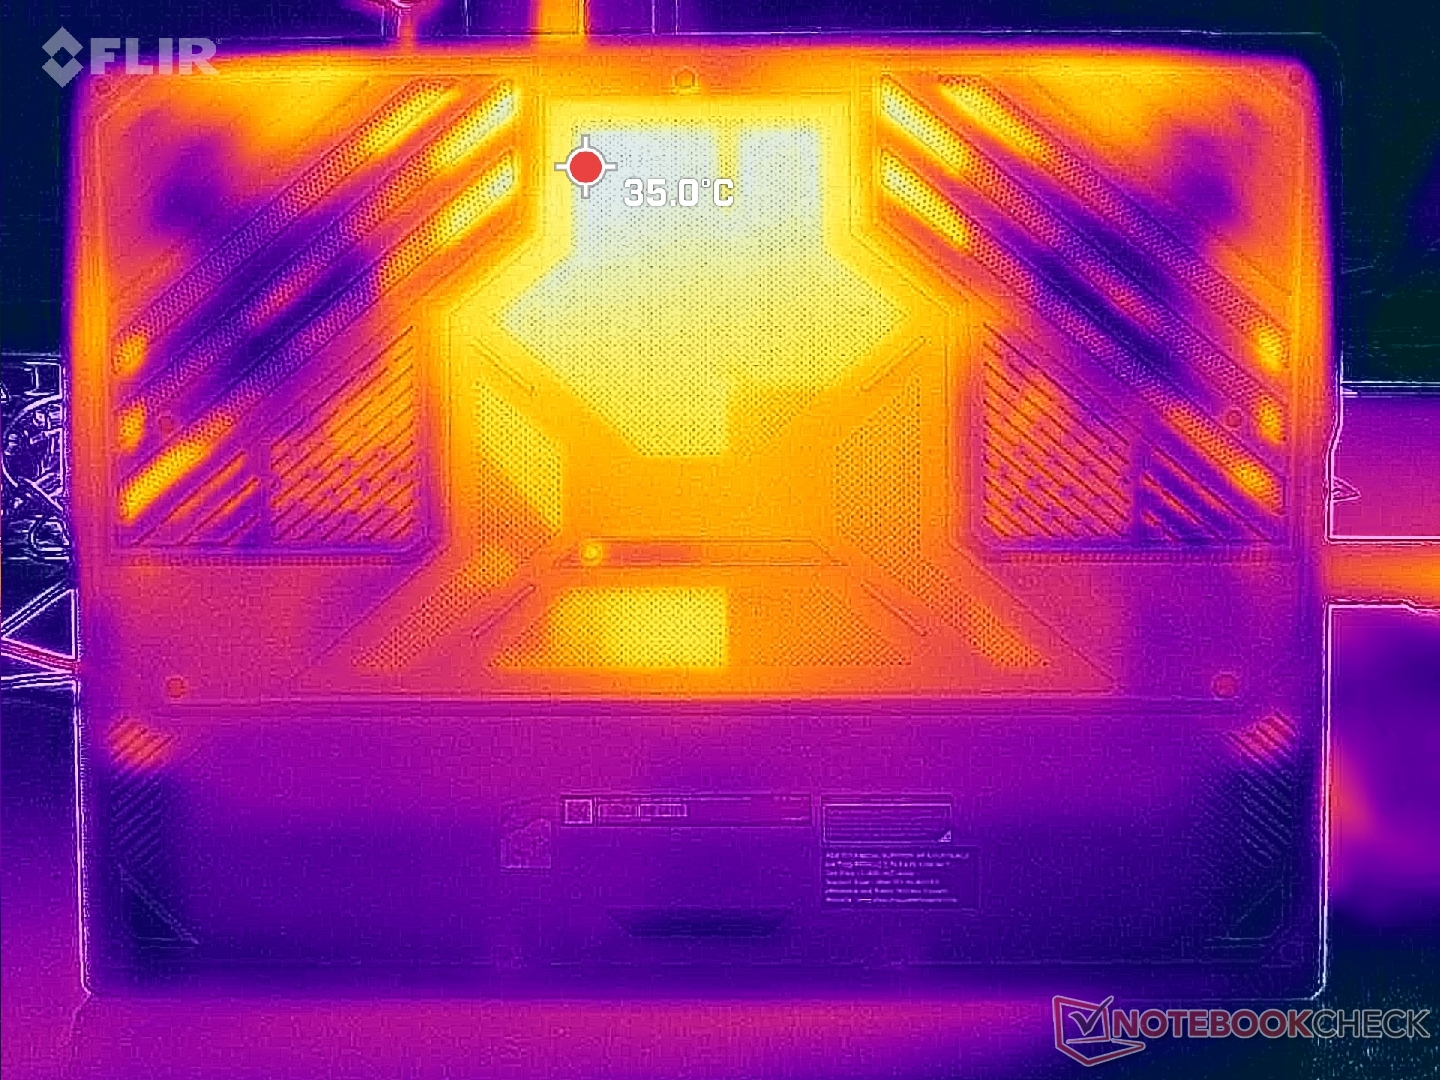
Temperatur
Överraskande nog är yttemperaturerna här något varmare än vad vi registrerade på unibody Razer Blade 18 trots den tjockare designen hos MSI. Heta punkter skulle nå strax över 41 C och 37 C med Cooler Boost aktiv respektive inaktiv. jämfört med 35 C till 40 C på Razer. De heta punkterna finns tack och lov på baksidan av systemet där det är osannolikt att händer och fingrar kommer i kontakt med dem. Vi upplevde aldrig att handledsstöden eller tangenterna blev obehagligt varma när vi spelade.
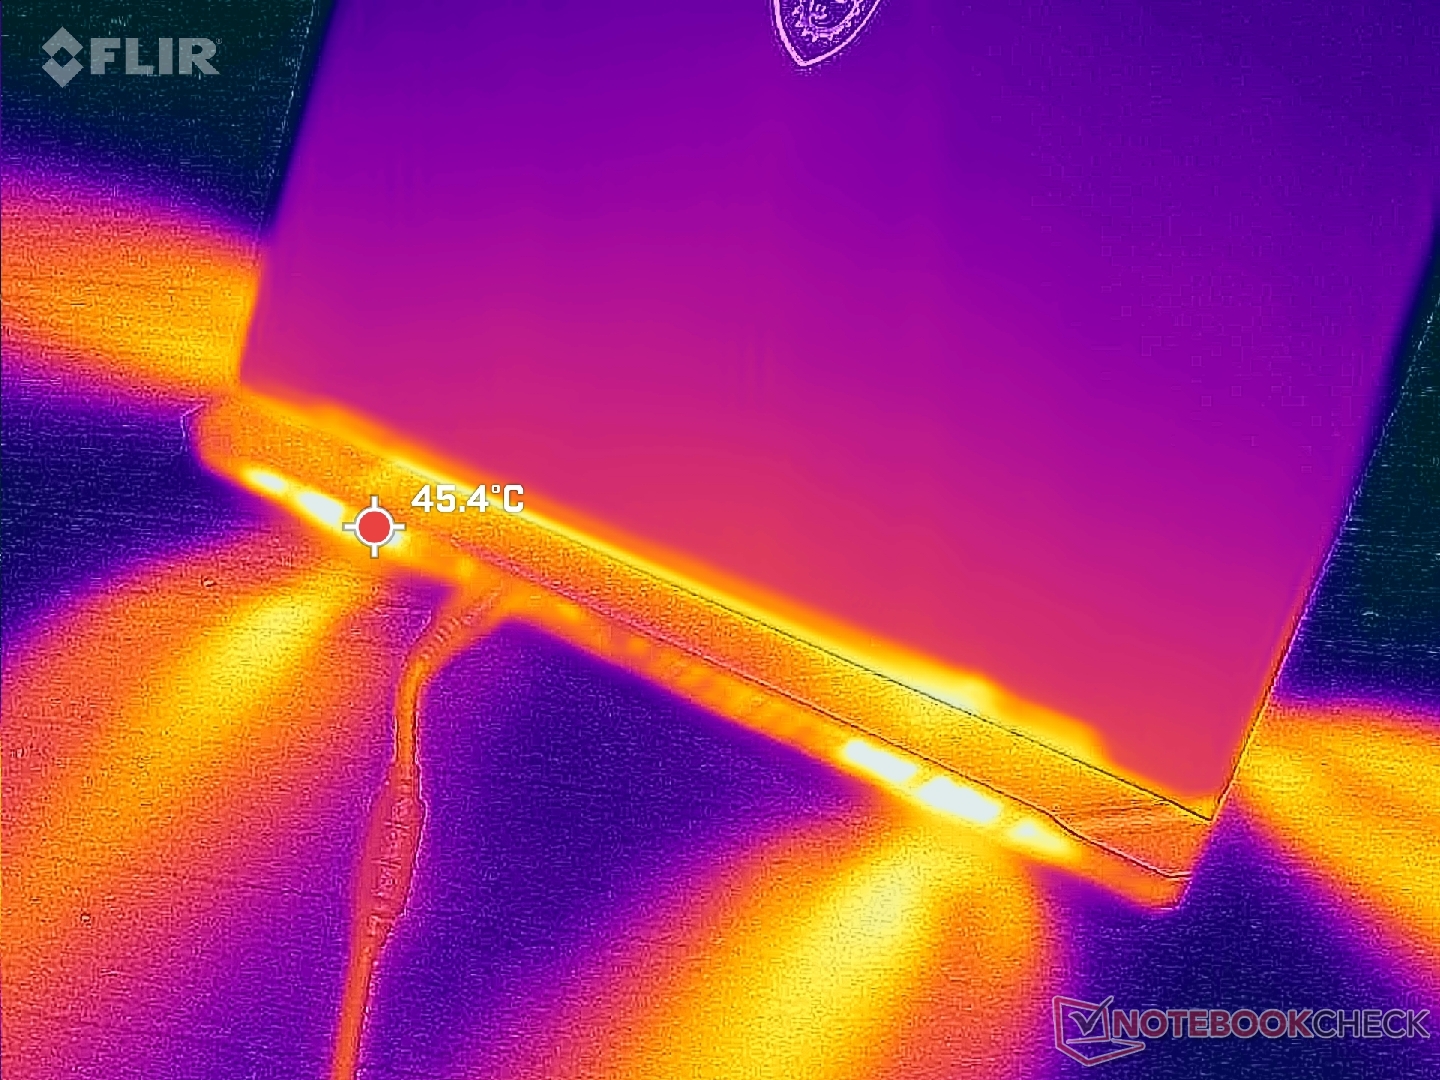
(+) Den maximala temperaturen på ovansidan är 37.8 °C / 100 F, jämfört med genomsnittet av 40.4 °C / 105 F , allt från 21.2 till 68.8 °C för klassen Gaming.
(+) Botten värms upp till maximalt 37.6 °C / 100 F, jämfört med genomsnittet av 43.2 °C / 110 F
(+) Vid tomgångsbruk är medeltemperaturen för ovansidan 29.8 °C / 86 F, jämfört med enhetsgenomsnittet på 33.9 °C / ### class_avg_f### F.
(±) När du spelar The Witcher 3 är medeltemperaturen för ovansidan 32.3 °C / 90 F, jämfört med enhetsgenomsnittet på 33.9 °C / ## #class_avg_f### F.
(+) Handledsstöden och pekplattan är kallare än hudtemperaturen med maximalt 25.6 °C / 78.1 F och är därför svala att ta på.
(+) Medeltemperaturen för handledsstödsområdet på liknande enheter var 28.8 °C / 83.8 F (+3.2 °C / 5.7 F).
| MSI Titan 18 HX A14VIG Intel Core i9-14900HX, NVIDIA GeForce RTX 4090 Laptop GPU | MSI Titan GT77 HX 13VI Intel Core i9-13950HX, NVIDIA GeForce RTX 4090 Laptop GPU | Alienware m18 R1 Intel Core i9-13980HX, NVIDIA GeForce RTX 4090 Laptop GPU | Asus ROG Strix G18 G814JI Intel Core i7-13650HX, NVIDIA GeForce RTX 4070 Laptop GPU | Acer Predator Helios 18 N23Q2 Intel Core i9-13900HX, NVIDIA GeForce RTX 4080 Laptop GPU | Razer Blade 18 RTX 4070 Intel Core i9-13950HX, NVIDIA GeForce RTX 4070 Laptop GPU | |
|---|---|---|---|---|---|---|
| Heat | 6% | 10% | -3% | -12% | 5% | |
| Maximum Upper Side * (°C) | 37.8 | 40.6 -7% | 39 -3% | 45 -19% | 35 7% | 39.2 -4% |
| Maximum Bottom * (°C) | 37.6 | 41.1 -9% | 36.4 3% | 47 -25% | 56 -49% | 35.6 5% |
| Idle Upper Side * (°C) | 34.8 | 26.2 25% | 29.2 16% | 28 20% | 34 2% | 31.8 9% |
| Idle Bottom * (°C) | 36 | 30.3 16% | 27.8 23% | 31 14% | 39 -8% | 33.2 8% |
* ... mindre är bättre
Stresstest
CPU-temperaturen under belastning kan bli varmare än förväntat även om Cooler Boost är aktiverat. Om man t.ex. kör Witcher 3 för att representera typiska spelbelastningar stabiliseras CPU:n vid 97 C och 90 C med Cooler Boost av respektive på. Samtidigt stabiliseras GPU:n på den mer rimliga nivån 60 C. Om man upprepar detta test på Razer Blade 18 eller Alienware m18 R1 skulle man få liknande GPU-temperaturer men svalare CPU-temperaturer i det låga 80 C-intervallet istället.
Observera att det inte finns några större prestandaskillnader mellan Cooler Boost på och Cooler Boost av, i likhet med vad vi observerade i vårt avsnitt om GPU-prestanda ovan. Både GPU-klockfrekvenserna och kortets strömförbrukning när Witcher 3 körs skulle förbli relativt konstanta vid 2370 MHz respektive 169 W.
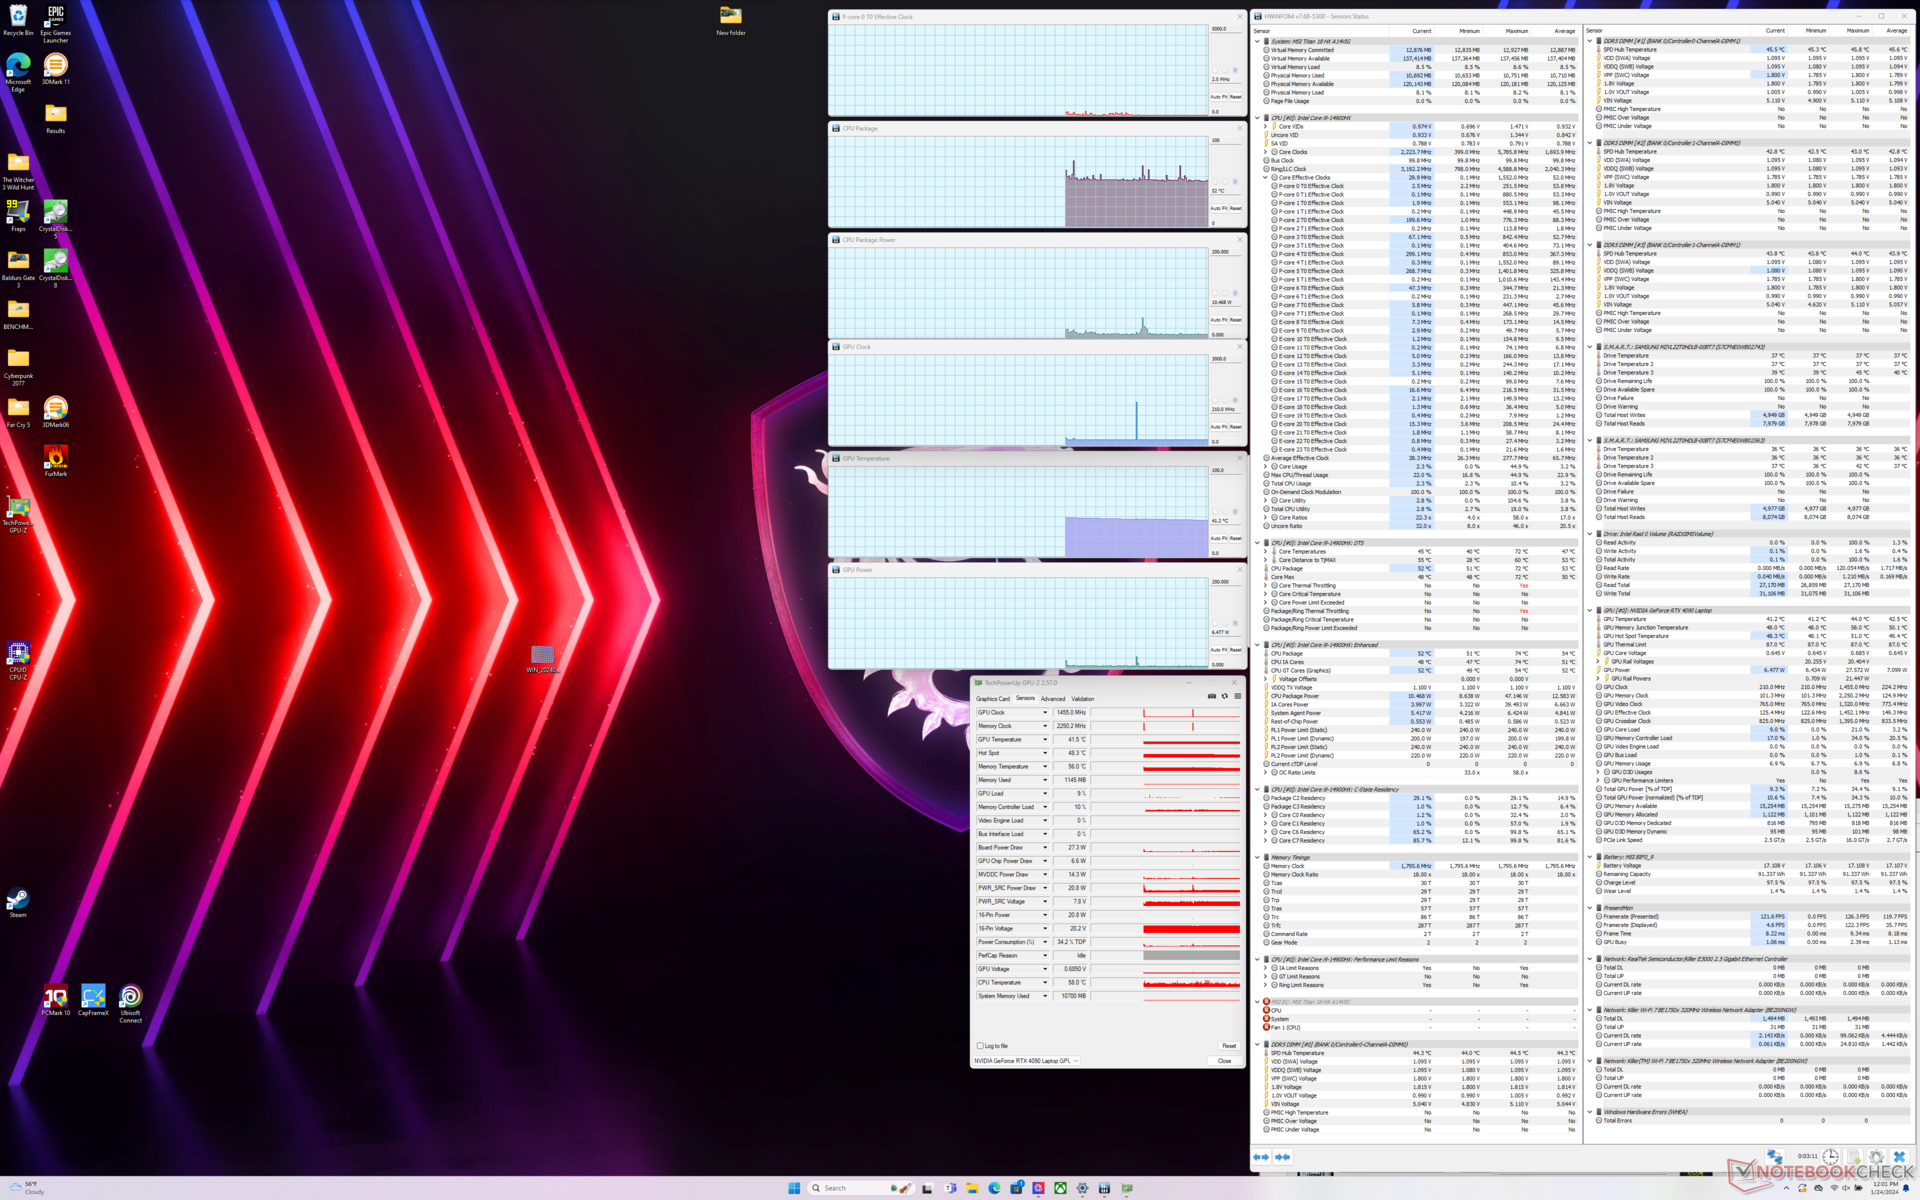
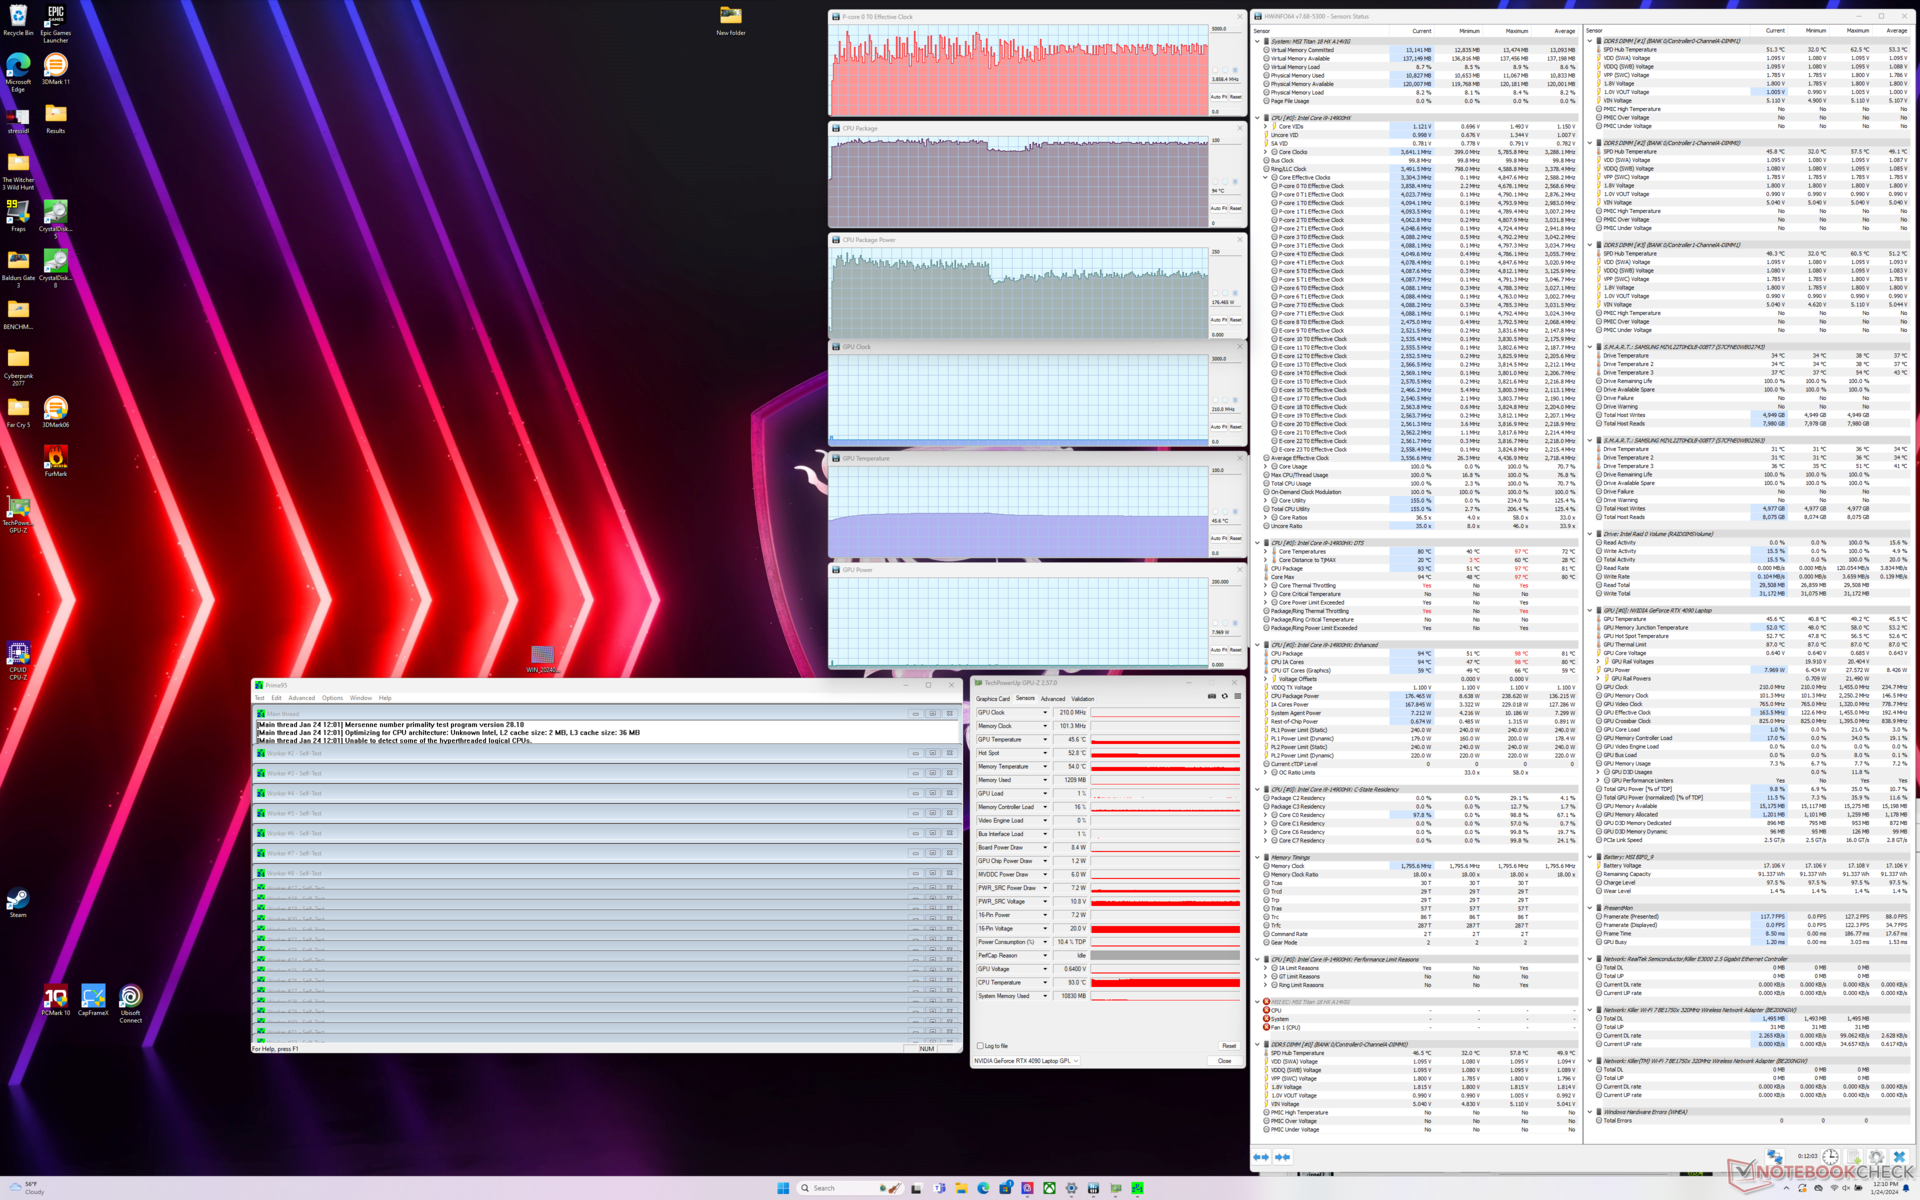
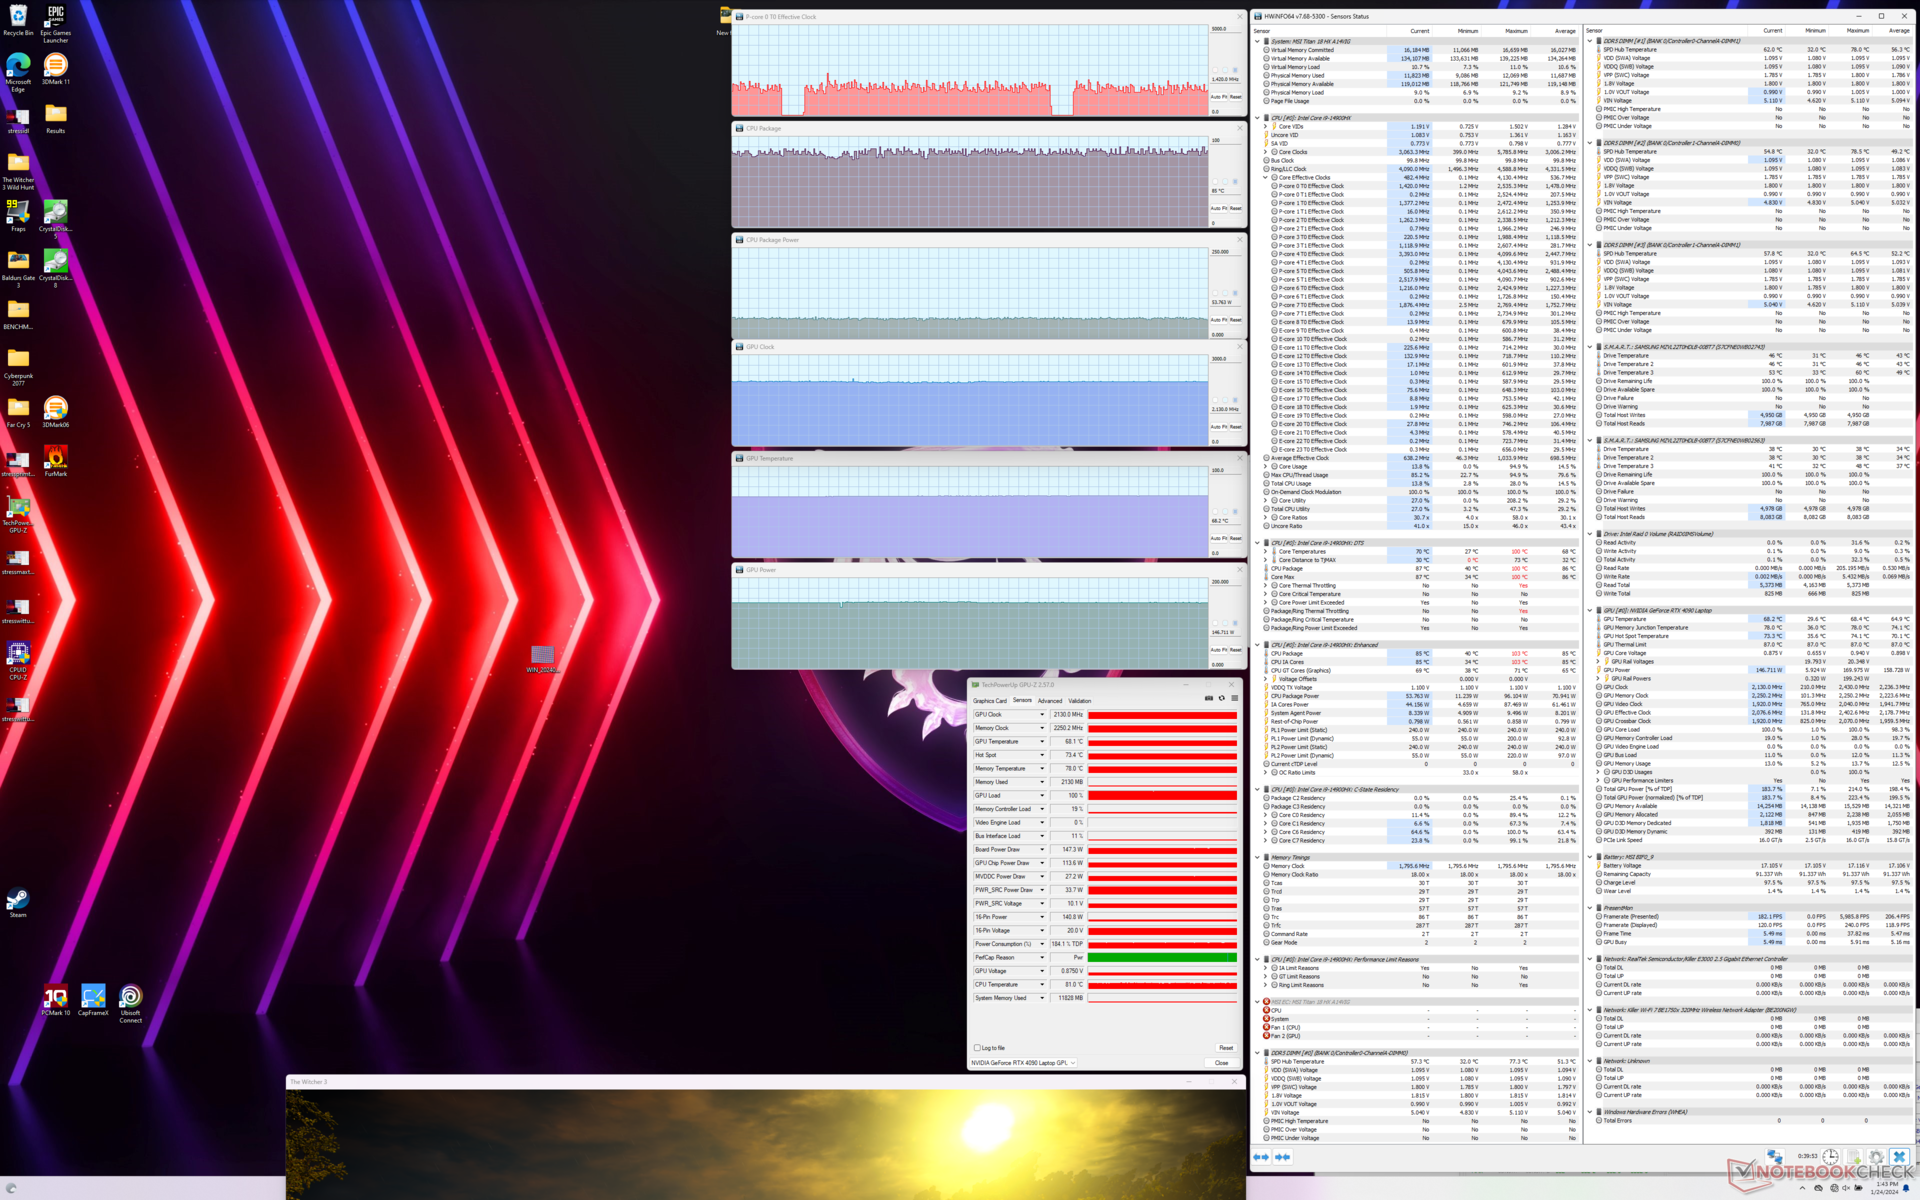
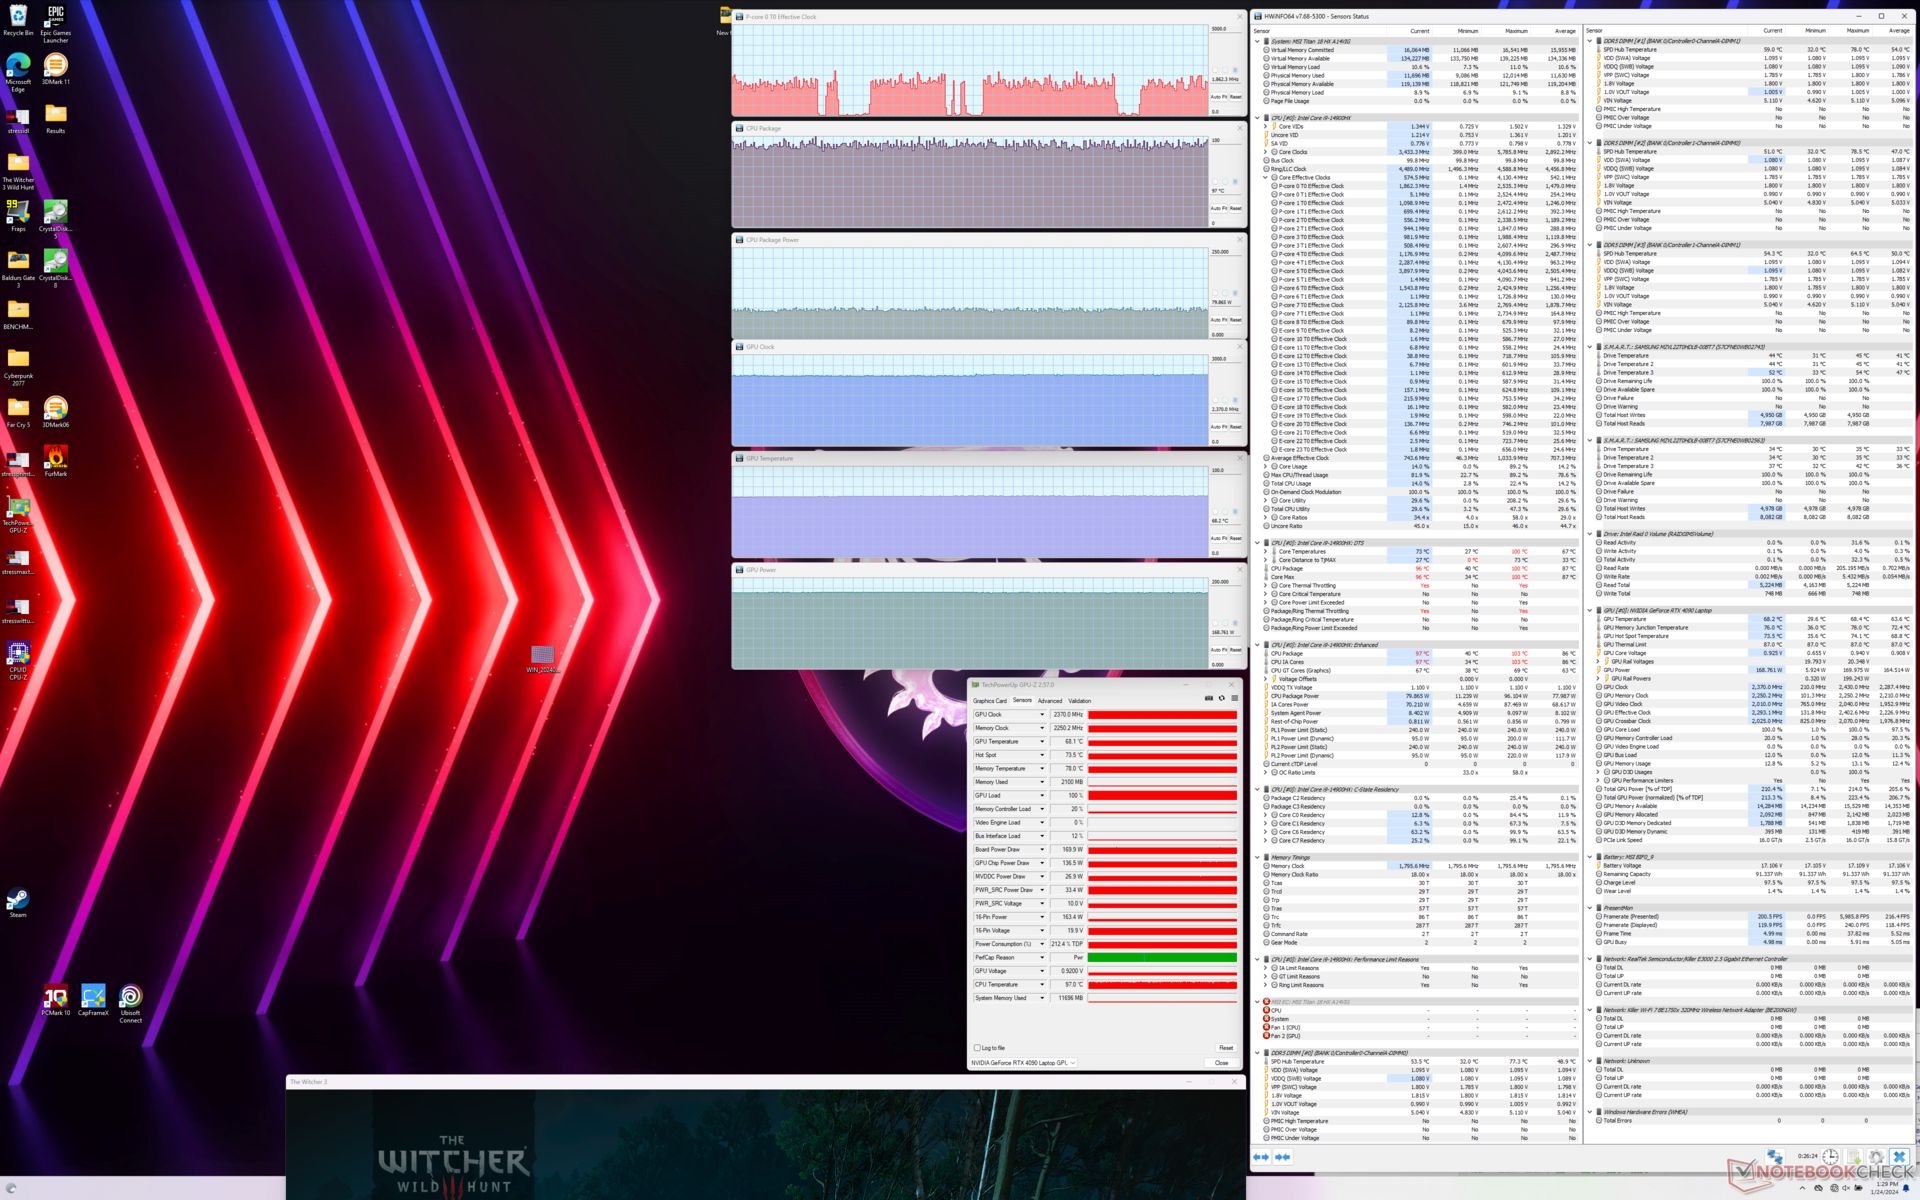
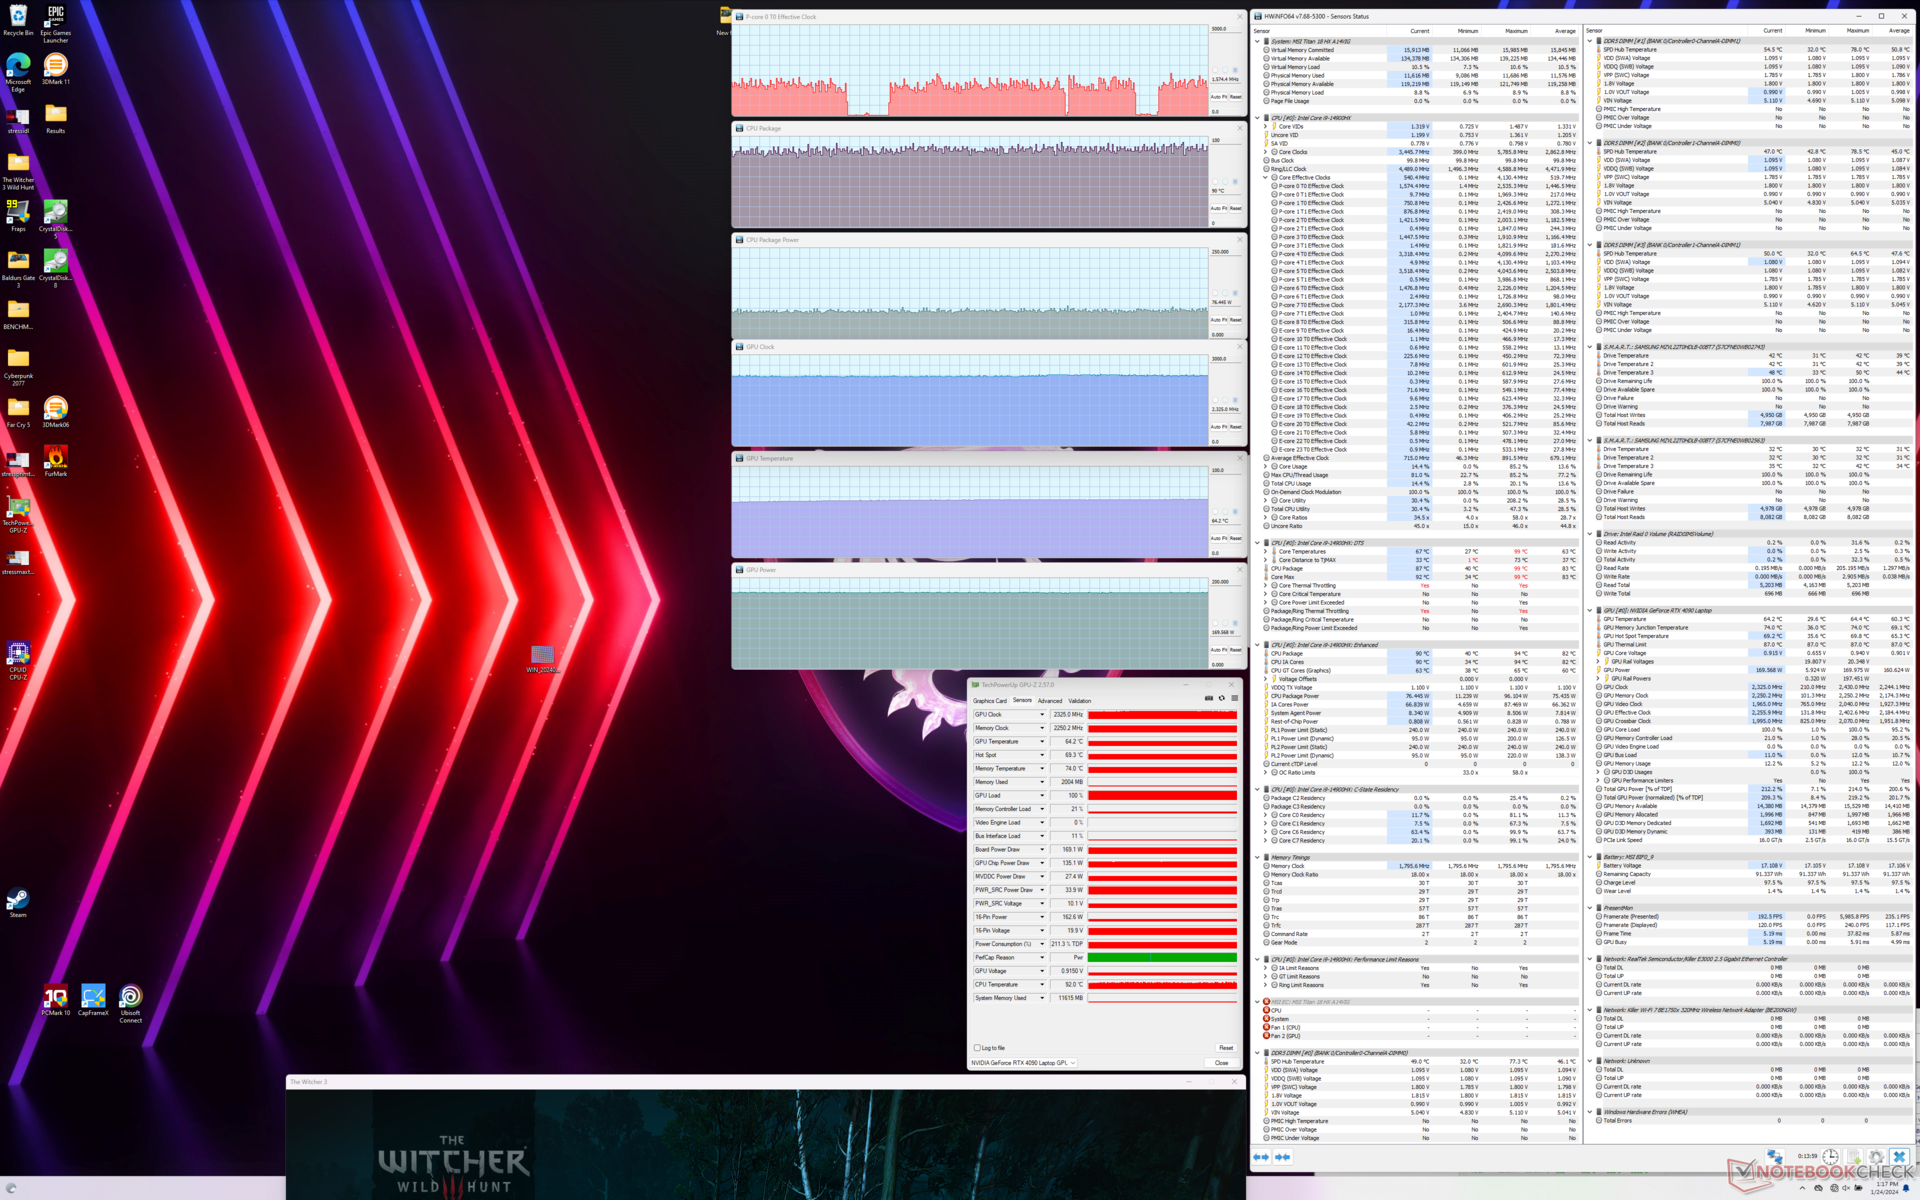
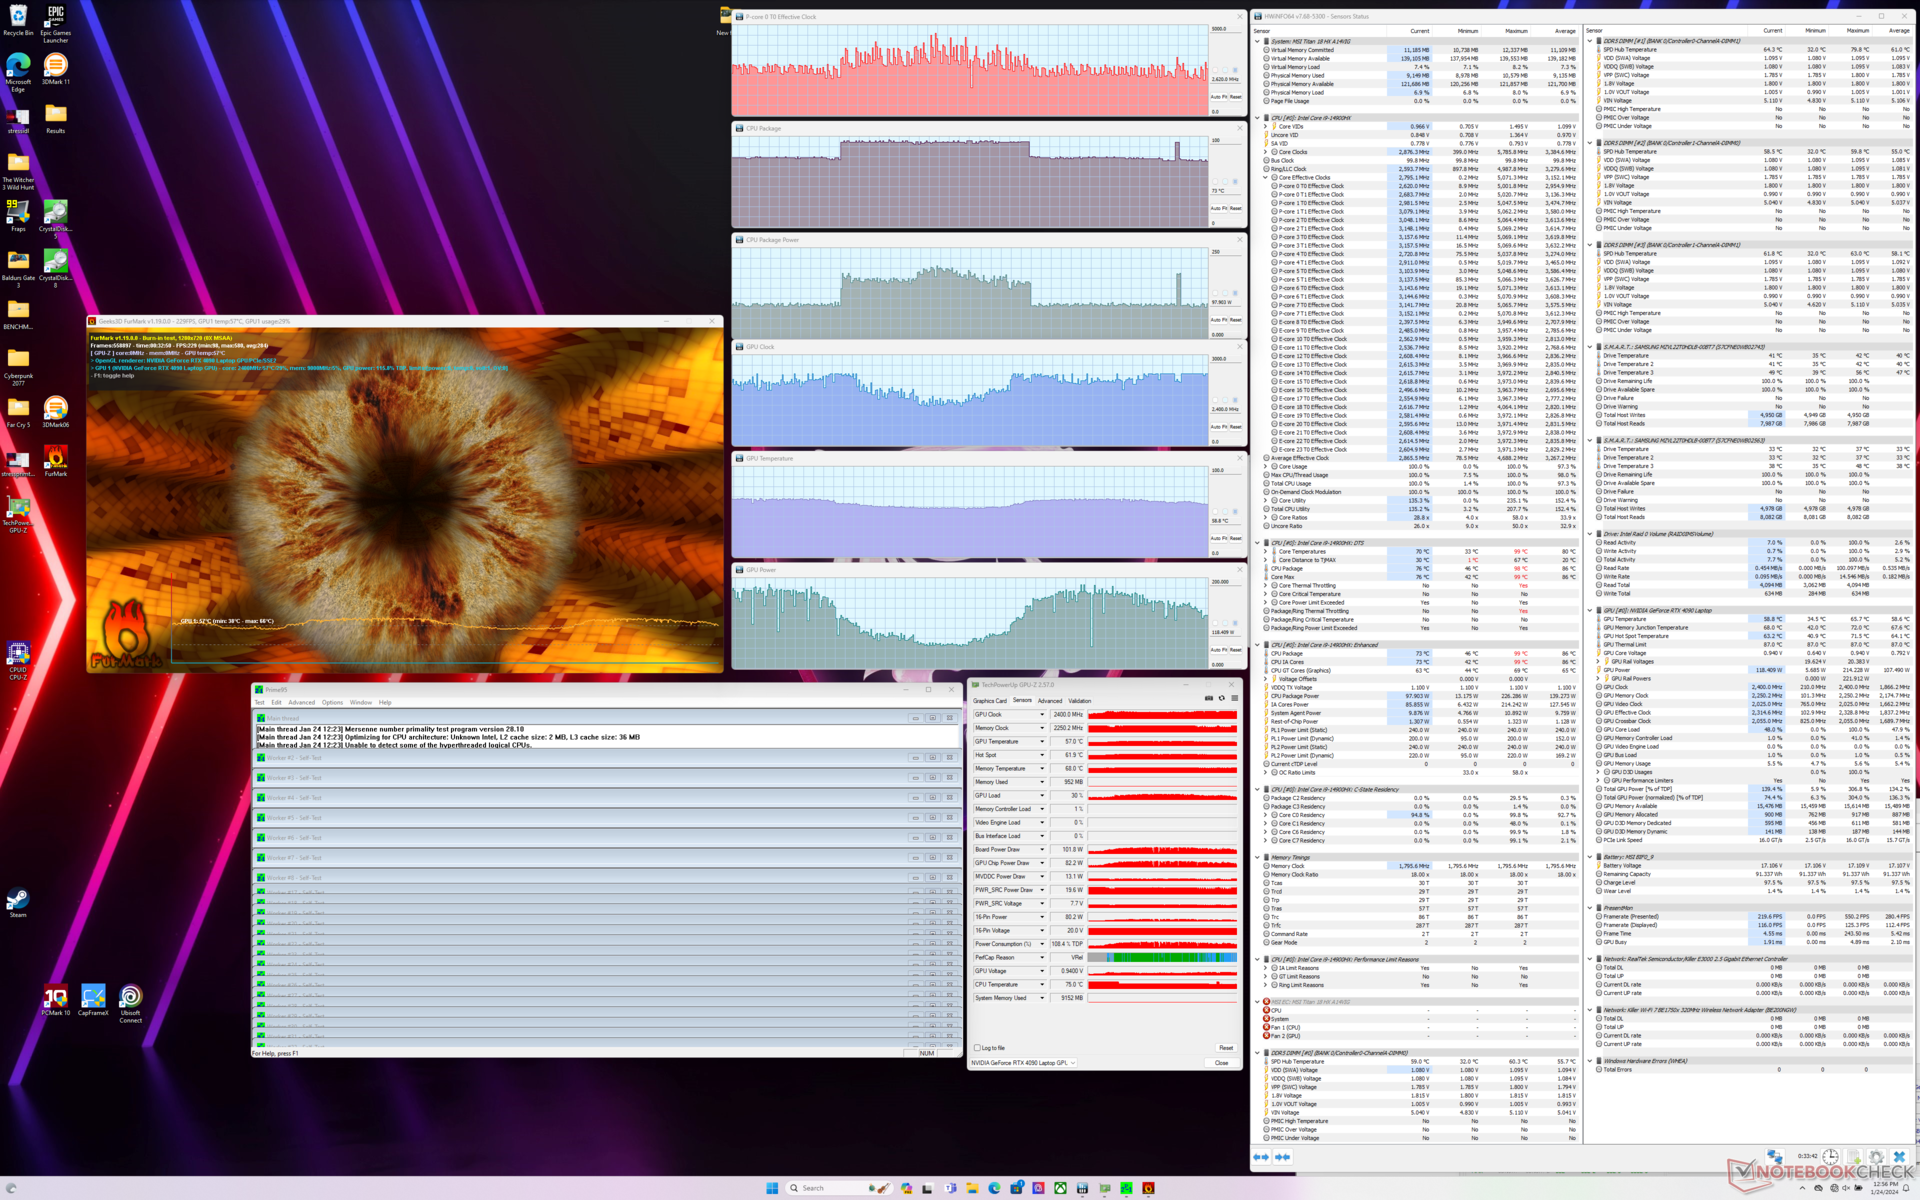
| CPU-klocka (GHz) | GPU-klocka (MHz) | Genomsnittlig CPU-temperatur (°C) | Genomsnittlig GPU-temperatur (°C) | |
| System i viloläge | -- | -- | 52 | 41 |
| Prime95 Stress | ~3.8 | -- | 94 | 46 |
| Prime95 + FurMark Stress | ~2,6 - ~4,3 | 1300 - 2400 | 73 - 95 | 55 - 65 |
| Witcher 3 Stress (balanserat läge) | ~1,4 | 2130 | 85 | 68 |
| Witcher 3 Stress (Extreme Performance Cooler Boost off) | ~1.8 | 2370 | 97 | 68 |
| Witcher 3 Stress(Extreme Performance Cooler Boost on) | ~1.8 | 2325 | 90 | 64 |
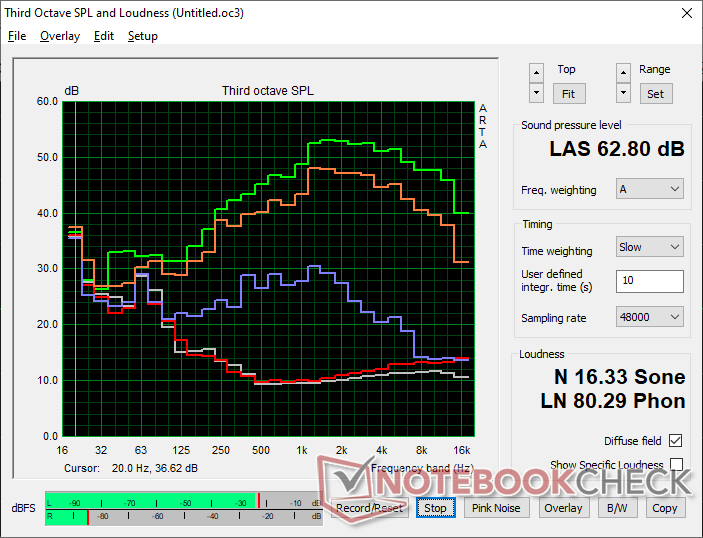
Högtalare
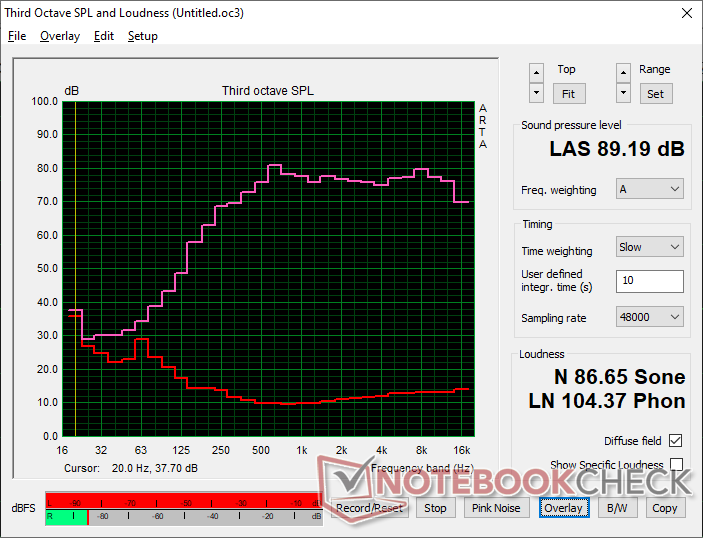
MSI Titan 18 HX A14VIG ljudanalys
(+) | högtalare kan spela relativt högt (89.2 dB)
Bas 100 - 315 Hz
(-) | nästan ingen bas - i genomsnitt 17.6% lägre än medianen
(±) | linjäriteten för basen är genomsnittlig (8% delta till föregående frekvens)
Mellan 400 - 2000 Hz
(+) | balanserad mellan - endast 1.8% från medianen
(+) | mids är linjära (3.7% delta till föregående frekvens)
Högsta 2 - 16 kHz
(+) | balanserade toppar - endast 1.2% från medianen
(+) | toppar är linjära (2% delta till föregående frekvens)
Totalt 100 - 16 000 Hz
(+) | det totala ljudet är linjärt (9.9% skillnad mot median)
Jämfört med samma klass
» 5% av alla testade enheter i den här klassen var bättre, 2% liknande, 94% sämre
» Den bästa hade ett delta på 6%, genomsnittet var 18%, sämst var 132%
Jämfört med alla testade enheter
» 4% av alla testade enheter var bättre, 1% liknande, 95% sämre
» Den bästa hade ett delta på 4%, genomsnittet var 23%, sämst var 134%
Apple MacBook Pro 16 2021 M1 Pro ljudanalys
(+) | högtalare kan spela relativt högt (84.7 dB)
Bas 100 - 315 Hz
(+) | bra bas - bara 3.8% från medianen
(+) | basen är linjär (5.2% delta till föregående frekvens)
Mellan 400 - 2000 Hz
(+) | balanserad mellan - endast 1.3% från medianen
(+) | mids är linjära (2.1% delta till föregående frekvens)
Högsta 2 - 16 kHz
(+) | balanserade toppar - endast 1.9% från medianen
(+) | toppar är linjära (2.7% delta till föregående frekvens)
Totalt 100 - 16 000 Hz
(+) | det totala ljudet är linjärt (4.6% skillnad mot median)
Jämfört med samma klass
» 0% av alla testade enheter i den här klassen var bättre, 0% liknande, 100% sämre
» Den bästa hade ett delta på 5%, genomsnittet var 17%, sämst var 45%
Jämfört med alla testade enheter
» 0% av alla testade enheter var bättre, 0% liknande, 100% sämre
» Den bästa hade ett delta på 4%, genomsnittet var 23%, sämst var 134%
Energiförvaltning
Strömförbrukning
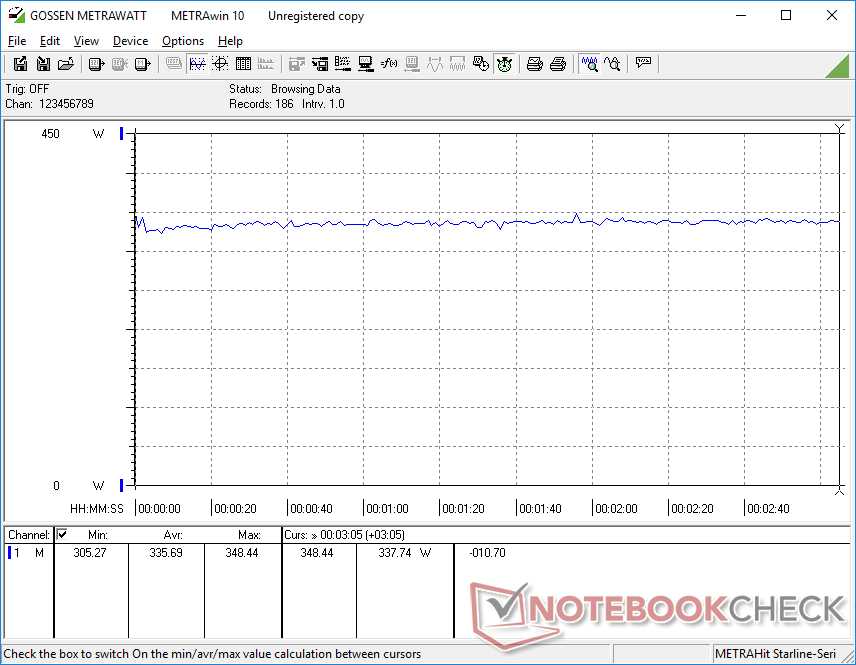
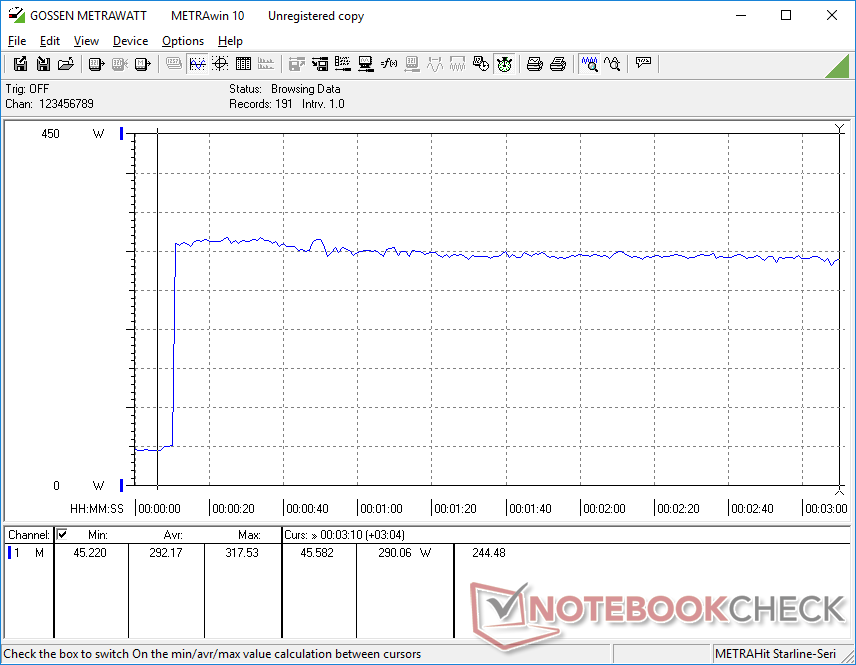
Den totala strömförbrukningen är generellt högre än andra 18-tums bärbara speldatorer på grund av den krävande 95 W CPU, 175 W GPU och den ultraklara 4K 120 Hz mini-LED-skärmen. Att bara köra på tomgång på skrivbordet skulle dra mellan 13 W och 54 W beroende på ljusstyrka och dGPU/iGPU-inställning, vilket är ett mycket bredare intervall än på Asus ROG Strix G18 eller Acer Predator Helios 18, båda med standard IPS-paneler.
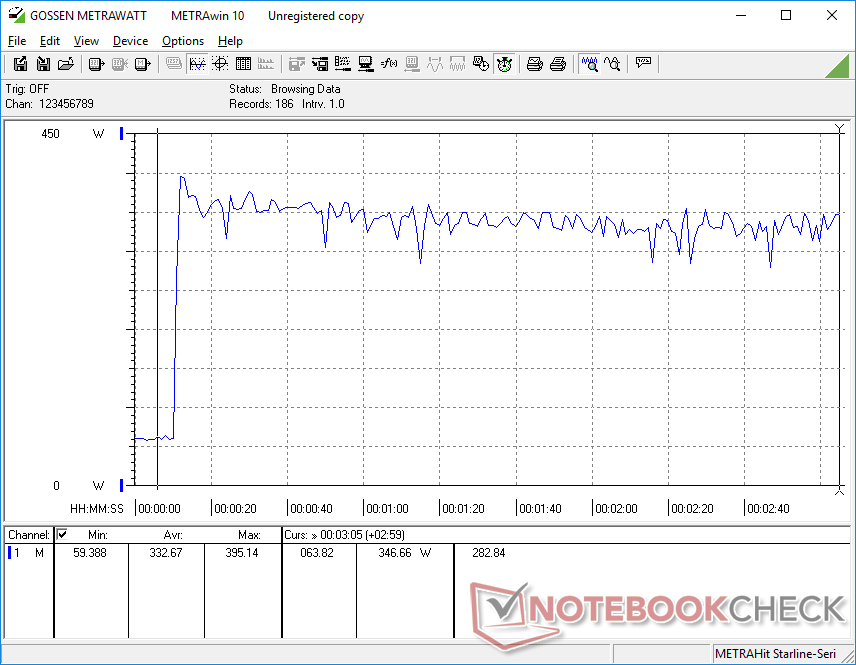
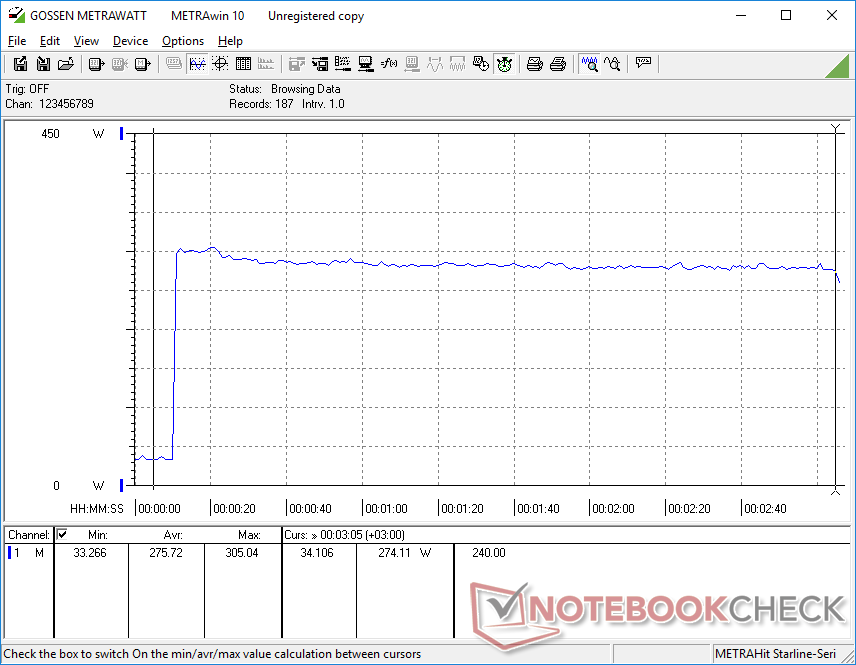
För spel fortsätter MSI-systemet att vara en av de mest krävande bärbara datorerna. Att köra Witcher 3 skulle dra nästan 340 W jämfört med bara 265 W och 311 W från förra årets GT77 eller Alienware m18 R1, alla med samma RTX 4090 GPU.
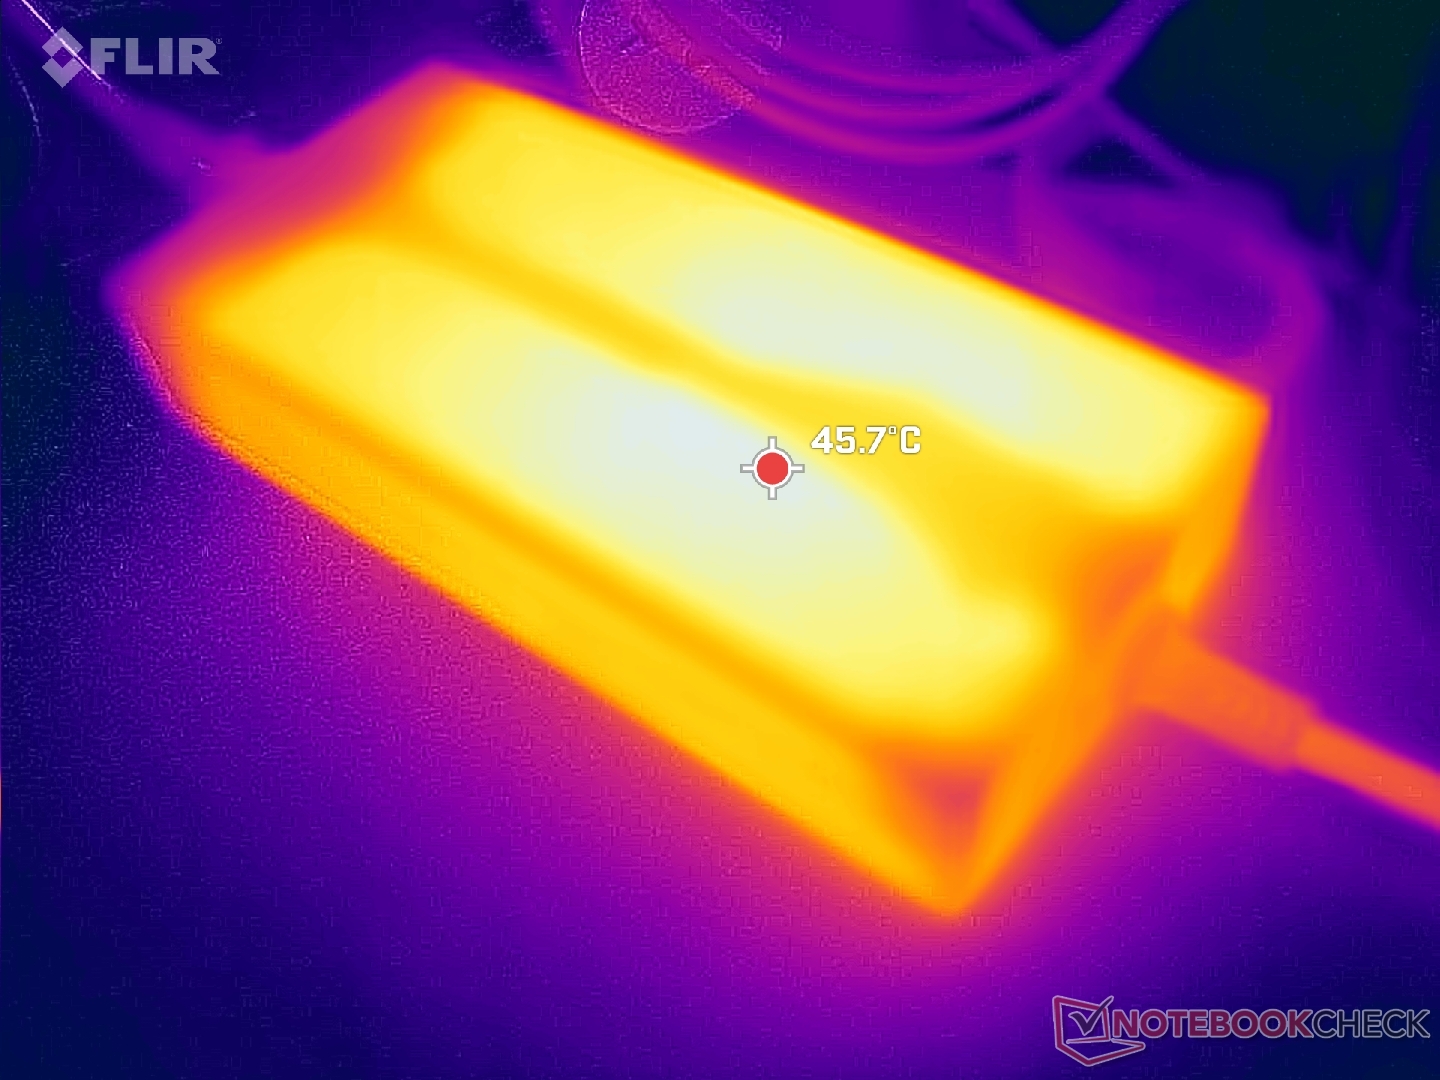
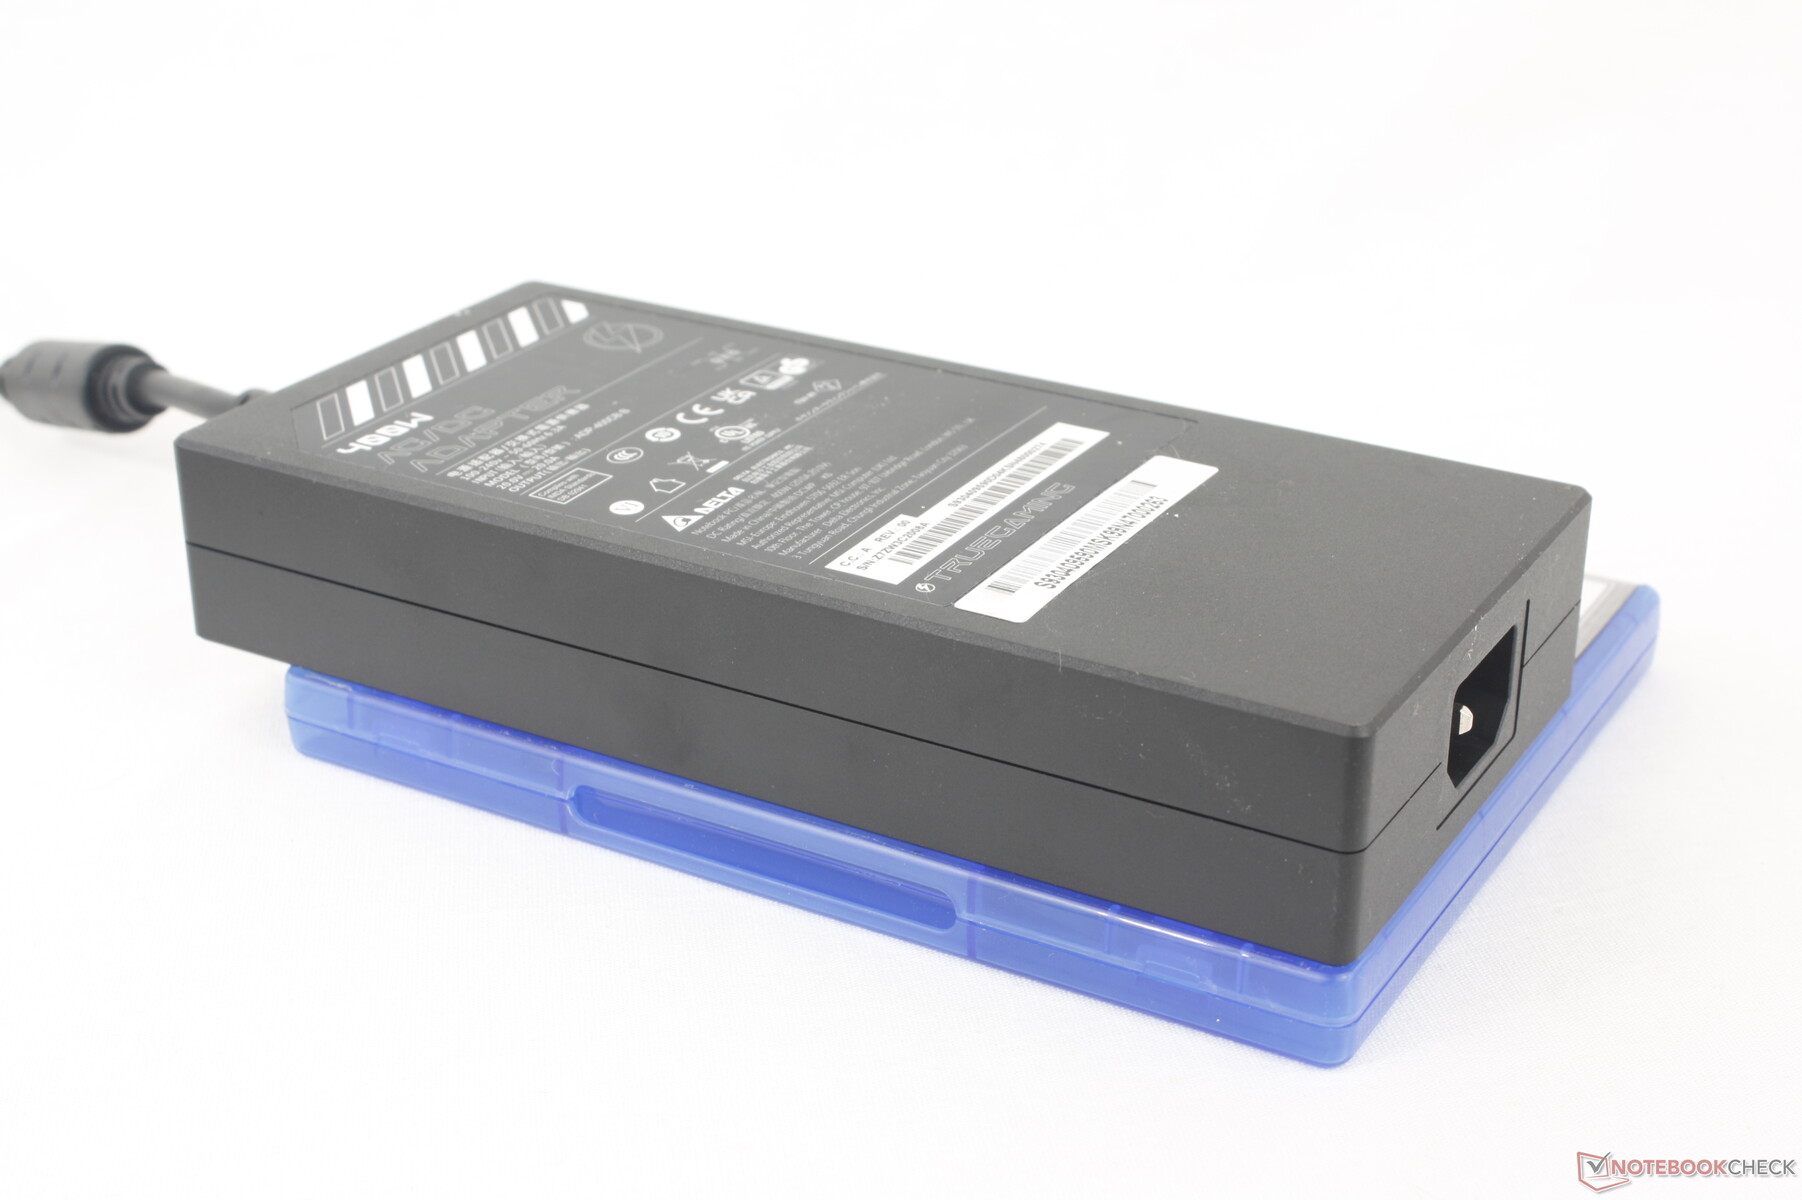
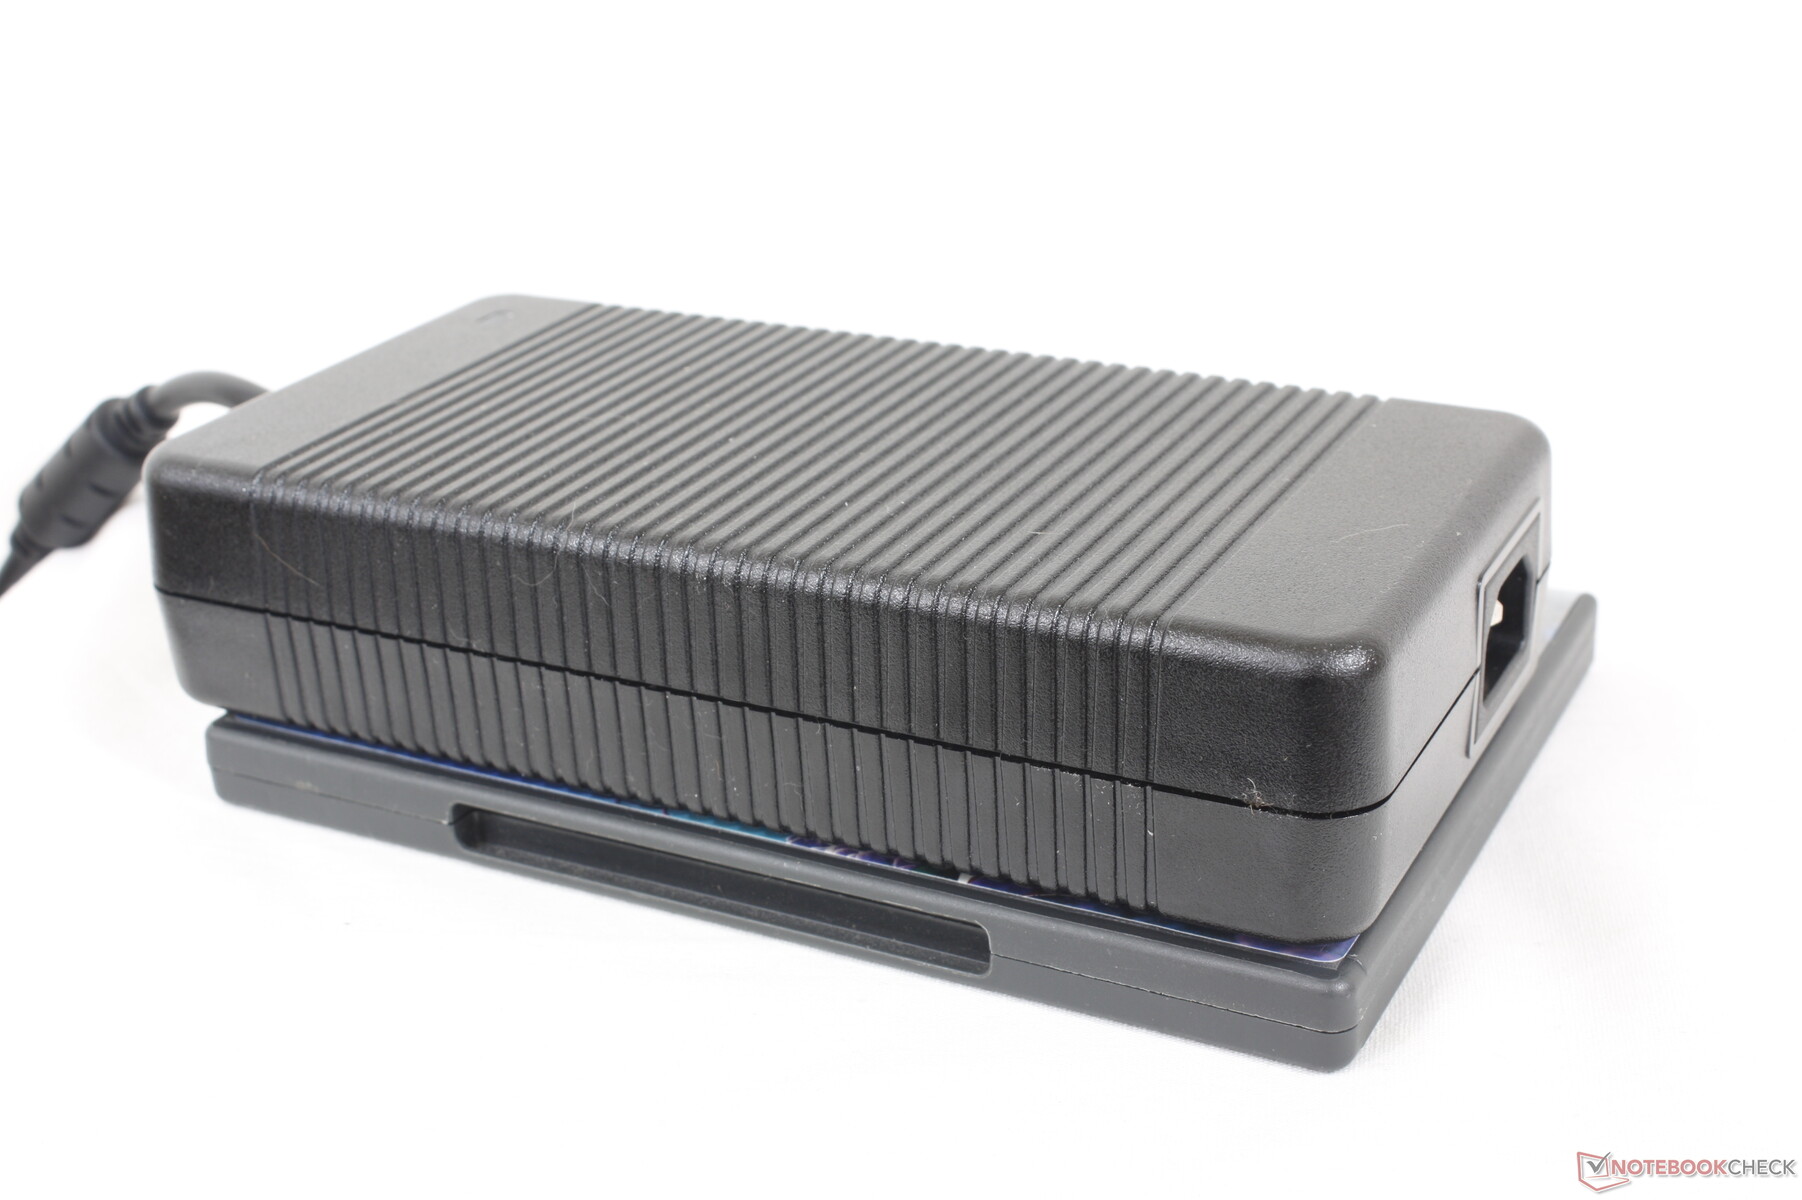
Nytt för MSI:s bärbara datorer i år är den omdesignade nätadaptern som nu är både smalare och kraftfullare än tidigare. Tidigare AC-adaptrar var ganska stora, särskilt 330 W-versionen som levererades med kraftfulla bärbara datorer som Raider GE78. Titan 16 HX använder en 400 W AC-adapter (~18,8 x 8,8 x 3,2 cm) som är ca 35 procent mindre för högre effekt per volym. Adaptern med högre kapacitet ger mer konsekventa prestanda och laddningshastigheter vid krävande belastning. Som jämförelse kan nämnas att de flesta andra högpresterande bärbara speldatorer fortfarande levereras med endast 330 W eller mindre AC-adaptrar.
| Av/Standby | |
| Låg belastning | |
| Hög belastning |
|
Förklaring:
min: | |
| MSI Titan 18 HX A14VIG i9-14900HX, GeForce RTX 4090 Laptop GPU, 2x Samsung PM9A1a MZVL22T0HDLB (RAID 0), Mini-LED, 3840x2400, 18" | MSI Titan GT77 HX 13VI i9-13950HX, GeForce RTX 4090 Laptop GPU, Samsung PM9A1 MZVL22T0HBLB, Mini-LED, 3840x2160, 17.3" | Alienware m18 R1 i9-13980HX, GeForce RTX 4090 Laptop GPU, SK hynix PC801 HFS001TEJ9X101N, IPS, 1920x1200, 18" | Asus ROG Strix G18 G814JI i7-13650HX, GeForce RTX 4070 Laptop GPU, Micron 2400 MTFDKBA1T0QFM, IPS, 2560x1600, 18" | Acer Predator Helios 18 N23Q2 i9-13900HX, GeForce RTX 4080 Laptop GPU, Samsung PM9A1 MZVL22T0HBLB, IPS, 2560x1600, 18" | Razer Blade 18 RTX 4070 i9-13950HX, GeForce RTX 4070 Laptop GPU, SSSTC CA6-8D1024, IPS, 2560x1600, 18" | |
|---|---|---|---|---|---|---|
| Power Consumption | 16% | -9% | 41% | 19% | -5% | |
| Idle Minimum * (Watt) | 13.2 | 14 -6% | 21.6 -64% | 8 39% | 16 -21% | 24.5 -86% |
| Idle Average * (Watt) | 25.4 | 21.6 15% | 25.2 1% | 15 41% | 19 25% | 34.1 -34% |
| Idle Maximum * (Watt) | 53.5 | 24.8 54% | 56.7 -6% | 26 51% | 21.3 60% | 47.7 11% |
| Load Average * (Watt) | 151.4 | 122.5 19% | 164.1 -8% | 102 33% | 124 18% | 140 8% |
| Witcher 3 ultra * (Watt) | 336 | 265 21% | 311 7% | 178.6 47% | 289 14% | 202 40% |
| Load Maximum * (Watt) | 395.2 | 418 -6% | 338.9 14% | 267 32% | 319 19% | 261 34% |
* ... mindre är bättre
Power Consumption Witcher 3 / Stresstest
Power Consumption external Monitor
Batteritid
Vi kunde spela in drygt 4 timmars verklig surfning i balanserat läge med dGPU:n inaktiv. Det är inte särskilt lång tid, men det är vad man kan förvänta sig av ett 18-tums kraftpaket med en 120 Hz mini-LED-skärm. Även tomgångskörning i MSI:s batterisparläge med den lägsta ljusstyrkan för ett bästa scenario skulle räcka i knappt 6 timmar. Resultaten från Alienware m18 R1 eller Razer Blade 18 är liknande.
Laddning från tom till full kapacitet med den medföljande nätadaptern tar cirka 2 till 2,5 timmar. Systemet kan också laddas med USB-C-adaptrar från tredje part, om än mycket långsammare. Tänk på att endast en av de två USB-C-portarna stöder USB-C Power Delivery.
| MSI Titan 18 HX A14VIG i9-14900HX, GeForce RTX 4090 Laptop GPU, 99.9 Wh | MSI Titan GT77 HX 13VI i9-13950HX, GeForce RTX 4090 Laptop GPU, 99.9 Wh | Alienware m18 R1 i9-13980HX, GeForce RTX 4090 Laptop GPU, 97 Wh | Asus ROG Strix G18 G814JI i7-13650HX, GeForce RTX 4070 Laptop GPU, 90 Wh | Acer Predator Helios 18 N23Q2 i9-13900HX, GeForce RTX 4080 Laptop GPU, 90 Wh | Razer Blade 18 RTX 4070 i9-13950HX, GeForce RTX 4070 Laptop GPU, 91.7 Wh | |
|---|---|---|---|---|---|---|
| Batteridrifttid | 22% | -15% | 64% | 24% | 7% | |
| Reader / Idle (h) | 5.9 | 5.6 -5% | 11.7 98% | 7 19% | ||
| WiFi v1.3 (h) | 4.2 | 5.3 26% | 4.3 2% | 8.1 93% | 4.4 5% | 4 -5% |
| Load (h) | 1.2 | 1.4 17% | 0.7 -42% | 1.2 0% | 1.7 42% | 1.3 8% |
| H.264 (h) | 6 | 4.8 |
För
Emot
Dom - Ny yttre design, samma inre prestanda
Med ingen ny Nvidia GPU i år för bärbara datorer var MSI tvungna att uppdatera allt som omger grafikkortet för att kompensera för det. Användarna får en ny 18-tums chassidesign, ny 14:e generationens Intel HX CPU, ny AC-adapter, större tangenter och en ny 120 Hz HDR1000 mini-LED 4K-skärm för att ackompanjera den höga prislappen. De flesta av dessa förändringar är ett steg upp från förra årets GT77men i slutändan får användarna samma spelprestanda från båda modellerna.
Höjdpunkterna i Titan 18 inkluderar dess mini-LED-skärm och Core i9-14900HX CPU. Den förstnämnda är utan tvekan imponerande och ett av de bästa sätten att titta på HDR-innehåll på en bärbar dator, men bristen på G-Sync-stöd är svår att ignorera, särskilt på en flaggskeppsmodell för spel. Samtidigt presterar den nya processorn nästan identiskt med 13:e generationens Core i9-13950HX som finns i GT77, vilket gör att det känns som inget annat än ett nytt varumärke. Titan 18 kan därför betraktas som ett stort steg framåt mot GT77 på grund av alla externa förändringar, men Intel- och Nvidia-interndelarna känns stillastående i jämförelse.
MSI Titan 18 HX är en av årets snabbaste bärbara speldatorer med en lika imponerande 4K mini-LED-skärm. Den presterar dock nästan identiskt med förra årets GT77.
Om du dras till den stora och ultraljusa 18-tums mini-LED-skärmen är Titan 18 HX en av de enda platserna där du kan hitta en i skrivande stund. Om inte, då alternativ som Alienware m18 R1, Asus ROG Strix G18, eller Razer Blade 18 erbjuder alla G-Sync, snabbare uppdateringsfrekvenser och samma GeForce RTX 4090-alternativ i tunnare och ofta lättare chassidesign.
Pris och tillgänglighet
Titan 18 HX som granskats levereras nu på Amazon för $ 5800. MSI erbjuder också modellen direkt via sin officiella webbplats till lägre startpriser.
MSI Titan 18 HX A14VIG
- 01/30/2024 v7 (old)
Allen Ngo
Genomskinlighet
Valet av enheter som ska granskas görs av vår redaktion. Testprovet gavs till författaren som ett lån av tillverkaren eller återförsäljaren för denna recension. Långivaren hade inget inflytande på denna recension och inte heller fick tillverkaren en kopia av denna recension innan publiceringen. Det fanns ingen skyldighet att publicera denna recension. Som ett oberoende medieföretag är Notebookcheck inte föremål för auktoritet från tillverkare, återförsäljare eller förlag.
This is how Notebookcheck is testingEvery year, Notebookcheck independently reviews hundreds of laptops and smartphones using standardized procedures to ensure that all results are comparable. We have continuously developed our test methods for around 20 years and set industry standards in the process. In our test labs, high-quality measuring equipment is utilized by experienced technicians and editors. These tests involve a multi-stage validation process. Our complex rating system is based on hundreds of well-founded measurements and benchmarks, which maintains objectivity.
Price comparison

