Razer Blade 18 laptop recension: Mindre än många bärbara 17-tums gamingdatorer
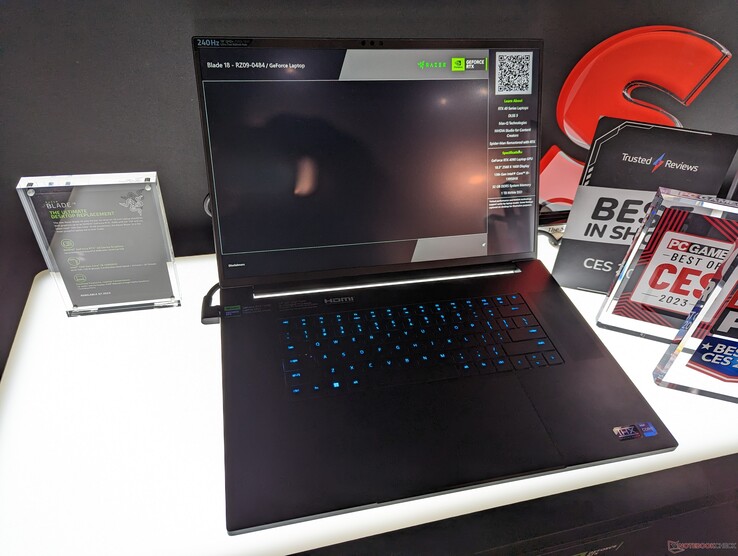
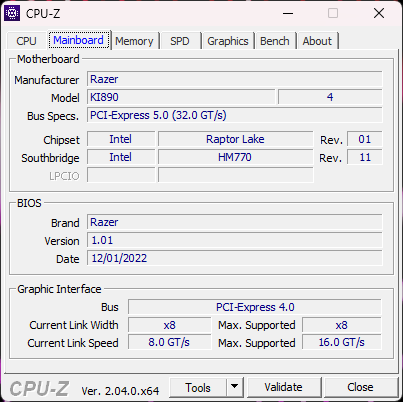
Blade 18, som presenterades på CES 2023, har den största skärmstorleken hittills för en bärbar Blade-dator och har den välkända Razer-chassidesignen. Lanseringen av modellen sammanfaller med lanseringen av den mobila 13:e generationens Intel Core-serie och den mobila Nvidia GeForce 40 Ada Lovelace-serien, precis som med den nyligen lanserade Blade 16.
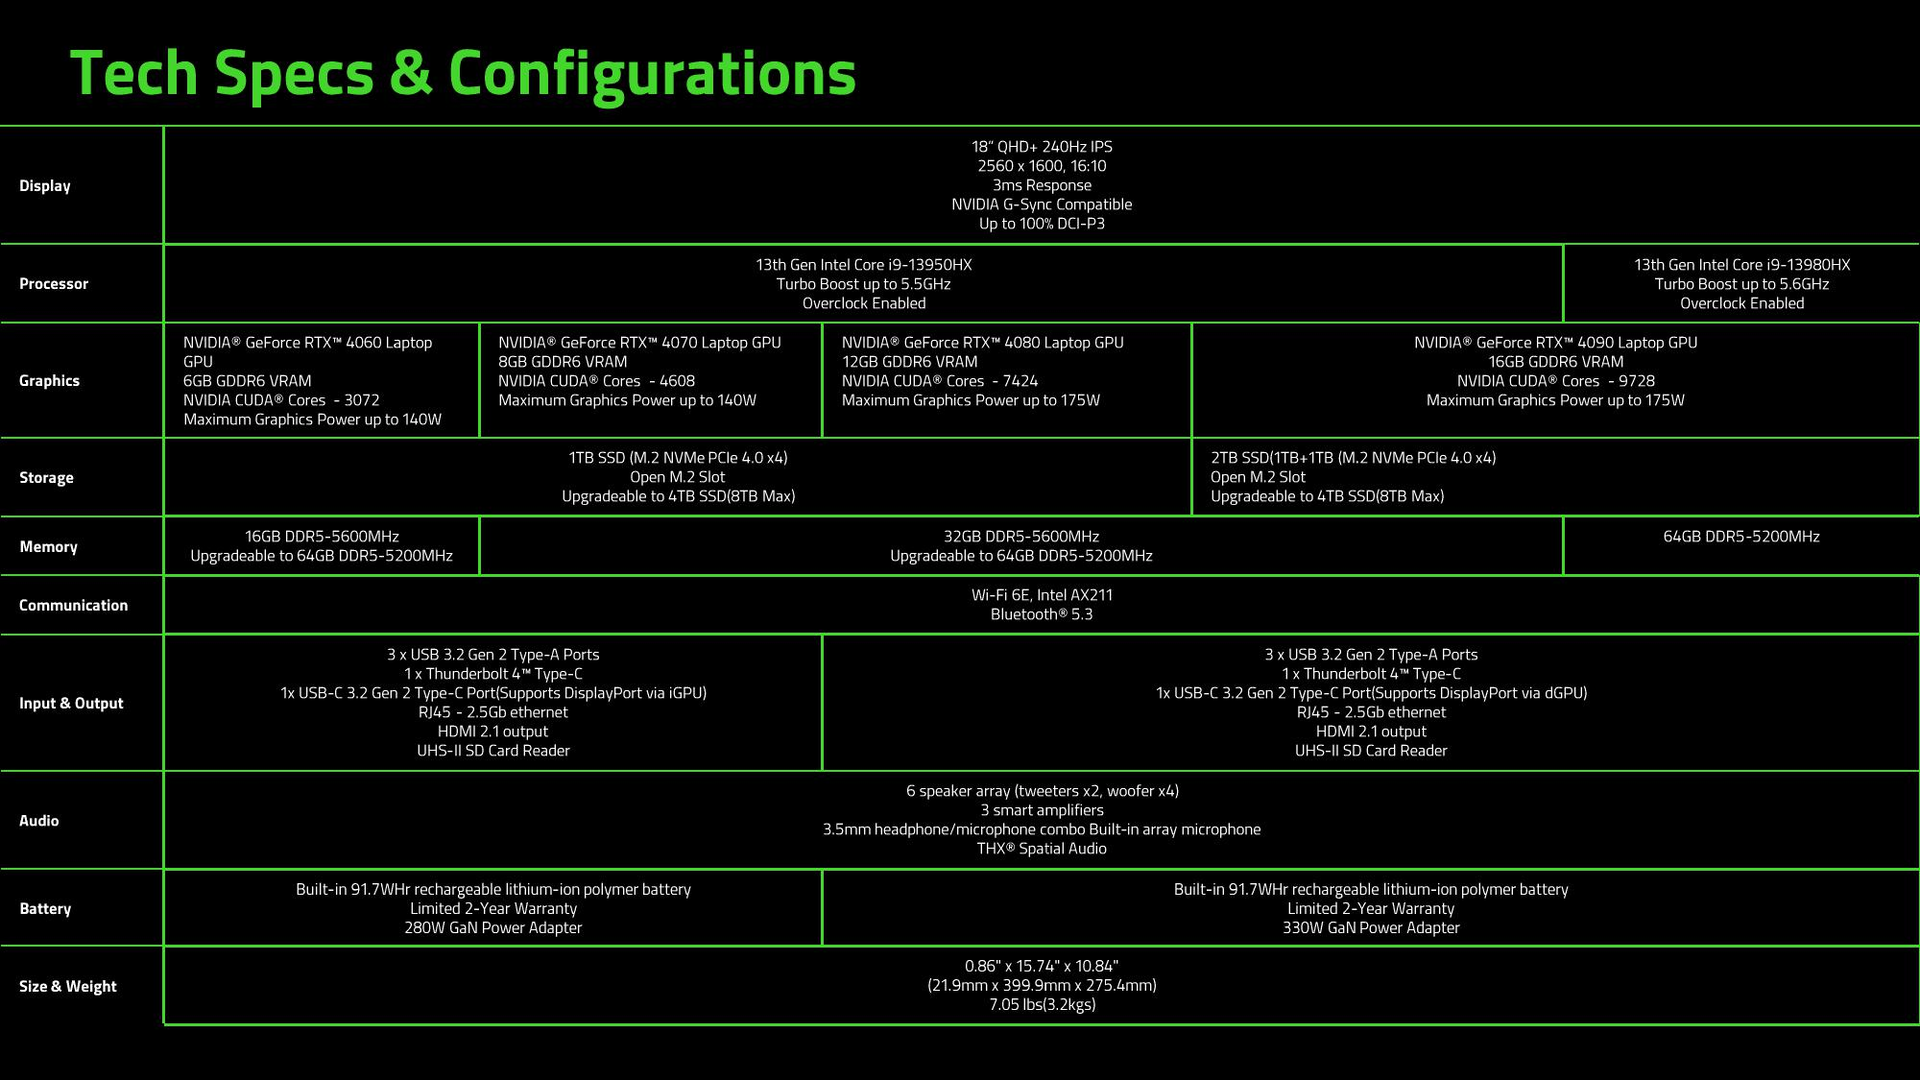
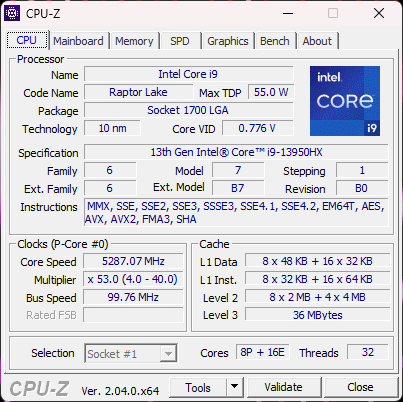
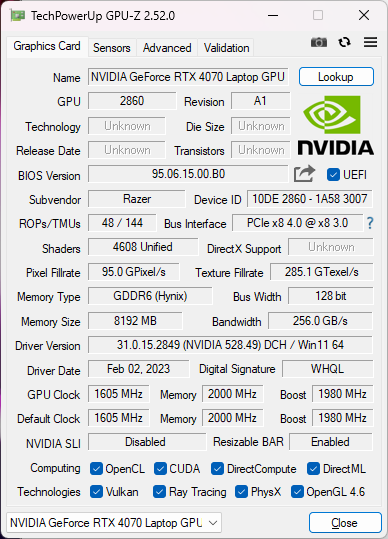
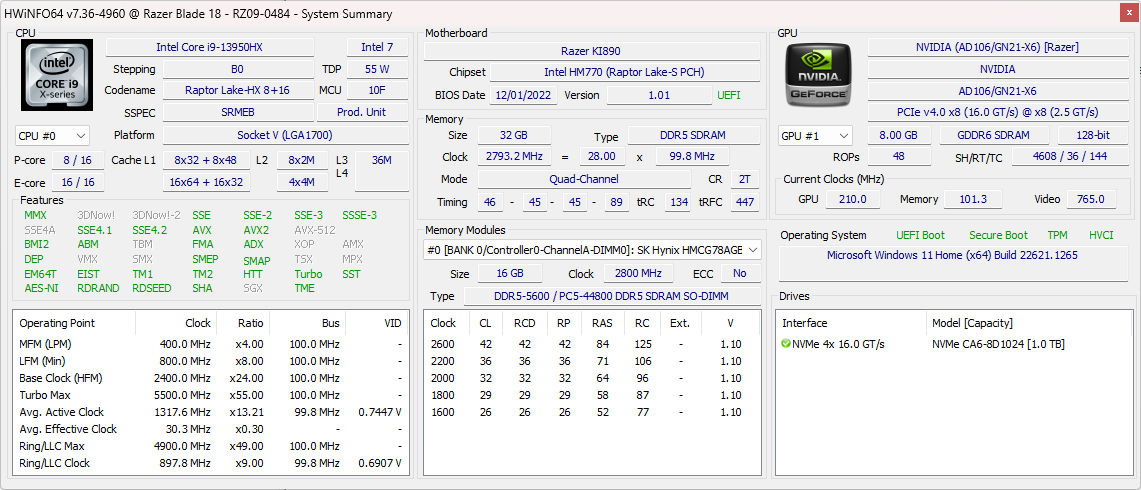
Konfigurationer sträcker sig från Core i9-13950HX CPU och 140 W GeForce RTX 4060 GPU upp till Core i9-13980HX och 175 W RTX 4090. Alla konfigurationer levereras annars med samma 16:10 QHD+ 240 Hz IPS-panel. Vår specifika granskningsenhet är en mellankonfiguration med 140 W RTX 4070 som säljs för cirka 3200 USD.
bärbara datorer på 18 tum är ovanliga med den 6 år gamla MSI GT83 Titan som ett anmärkningsvärt exempel. Asus och Dell förväntas lansera ROG Strix Scar 18 och Alienware m18, för att konkurrera direkt mot Razer Blade 18.
Fler recensioner av Razer:
Potentiella konkurrenter i jämförelse
Gradering | Datum | Modell | Vikt | Höjd | Storlek | Upplösning | Pris |
|---|---|---|---|---|---|---|---|
| 91.4 % v7 (old) | 02/2023 | Razer Blade 18 RTX 4070 i9-13950HX, GeForce RTX 4070 Laptop GPU | 3 kg | 21.9 mm | 18.00" | 2560x1600 | |
| 89.9 % v7 (old) | 07/2022 | Razer Blade 17 Early 2022 i9-12900H, GeForce RTX 3080 Ti Laptop GPU | 2.8 kg | 19.9 mm | 17.30" | 3840x2160 | |
| 89 % v7 (old) | 02/2023 | MSI Titan GT77 HX 13VI i9-13950HX, GeForce RTX 4090 Laptop GPU | 3.5 kg | 23 mm | 17.30" | 3840x2160 | |
| 83.3 % v7 (old) | 01/2023 | Gigabyte G7 KE i5-12500H, GeForce RTX 3060 Laptop GPU | 2.6 kg | 25 mm | 17.30" | 1920x1080 | |
| 86.1 % v7 (old) | 01/2023 | Alienware m17 R5 (R9 6900HX, RX 6850M XT) R9 6900HX, Radeon RX 6850M XT | 3.4 kg | 26.7 mm | 17.00" | 3840x2160 | |
| 86.9 % v7 (old) | 11/2022 | Asus ROG Strix Scar 17 SE G733CX-LL014W i9-12950HX, GeForce RTX 3080 Ti Laptop GPU | 2.9 kg | 28.3 mm | 17.30" | 2560x1440 |
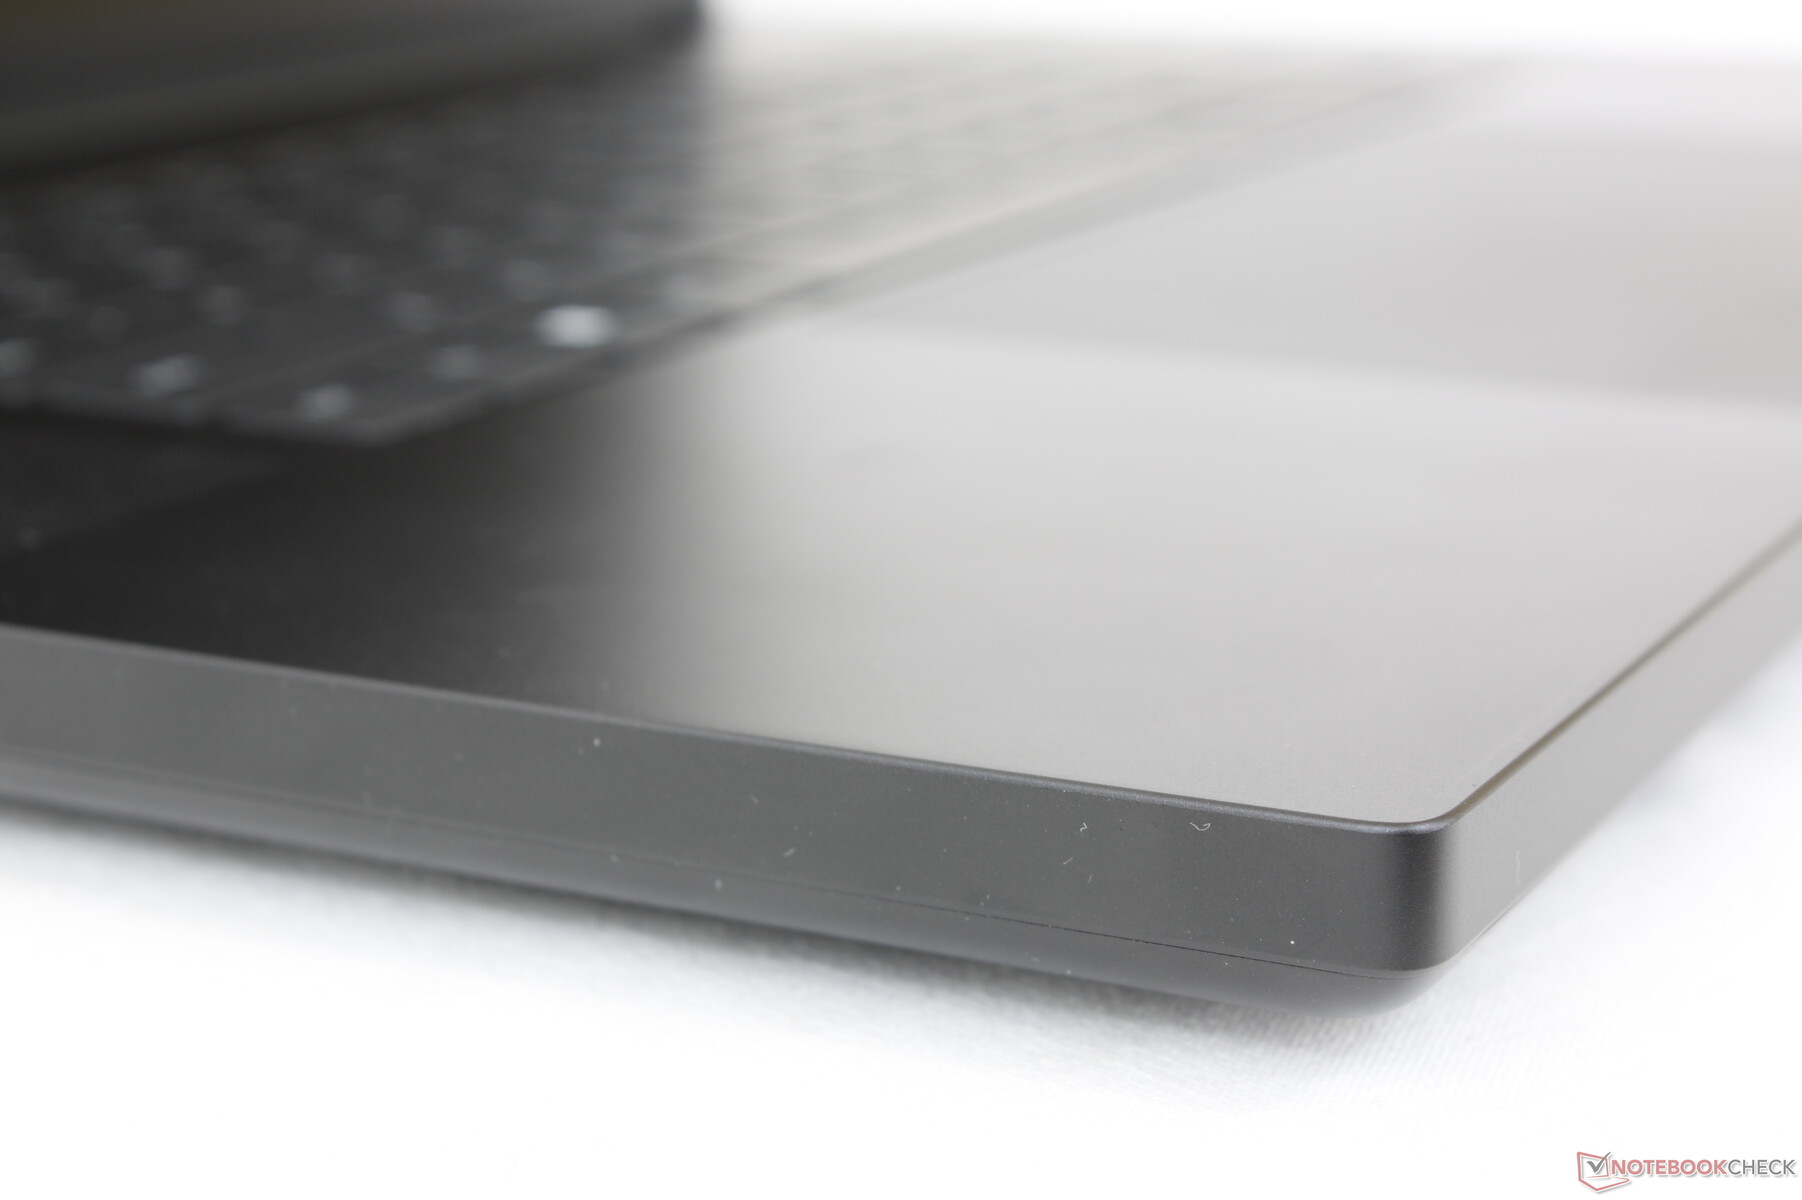
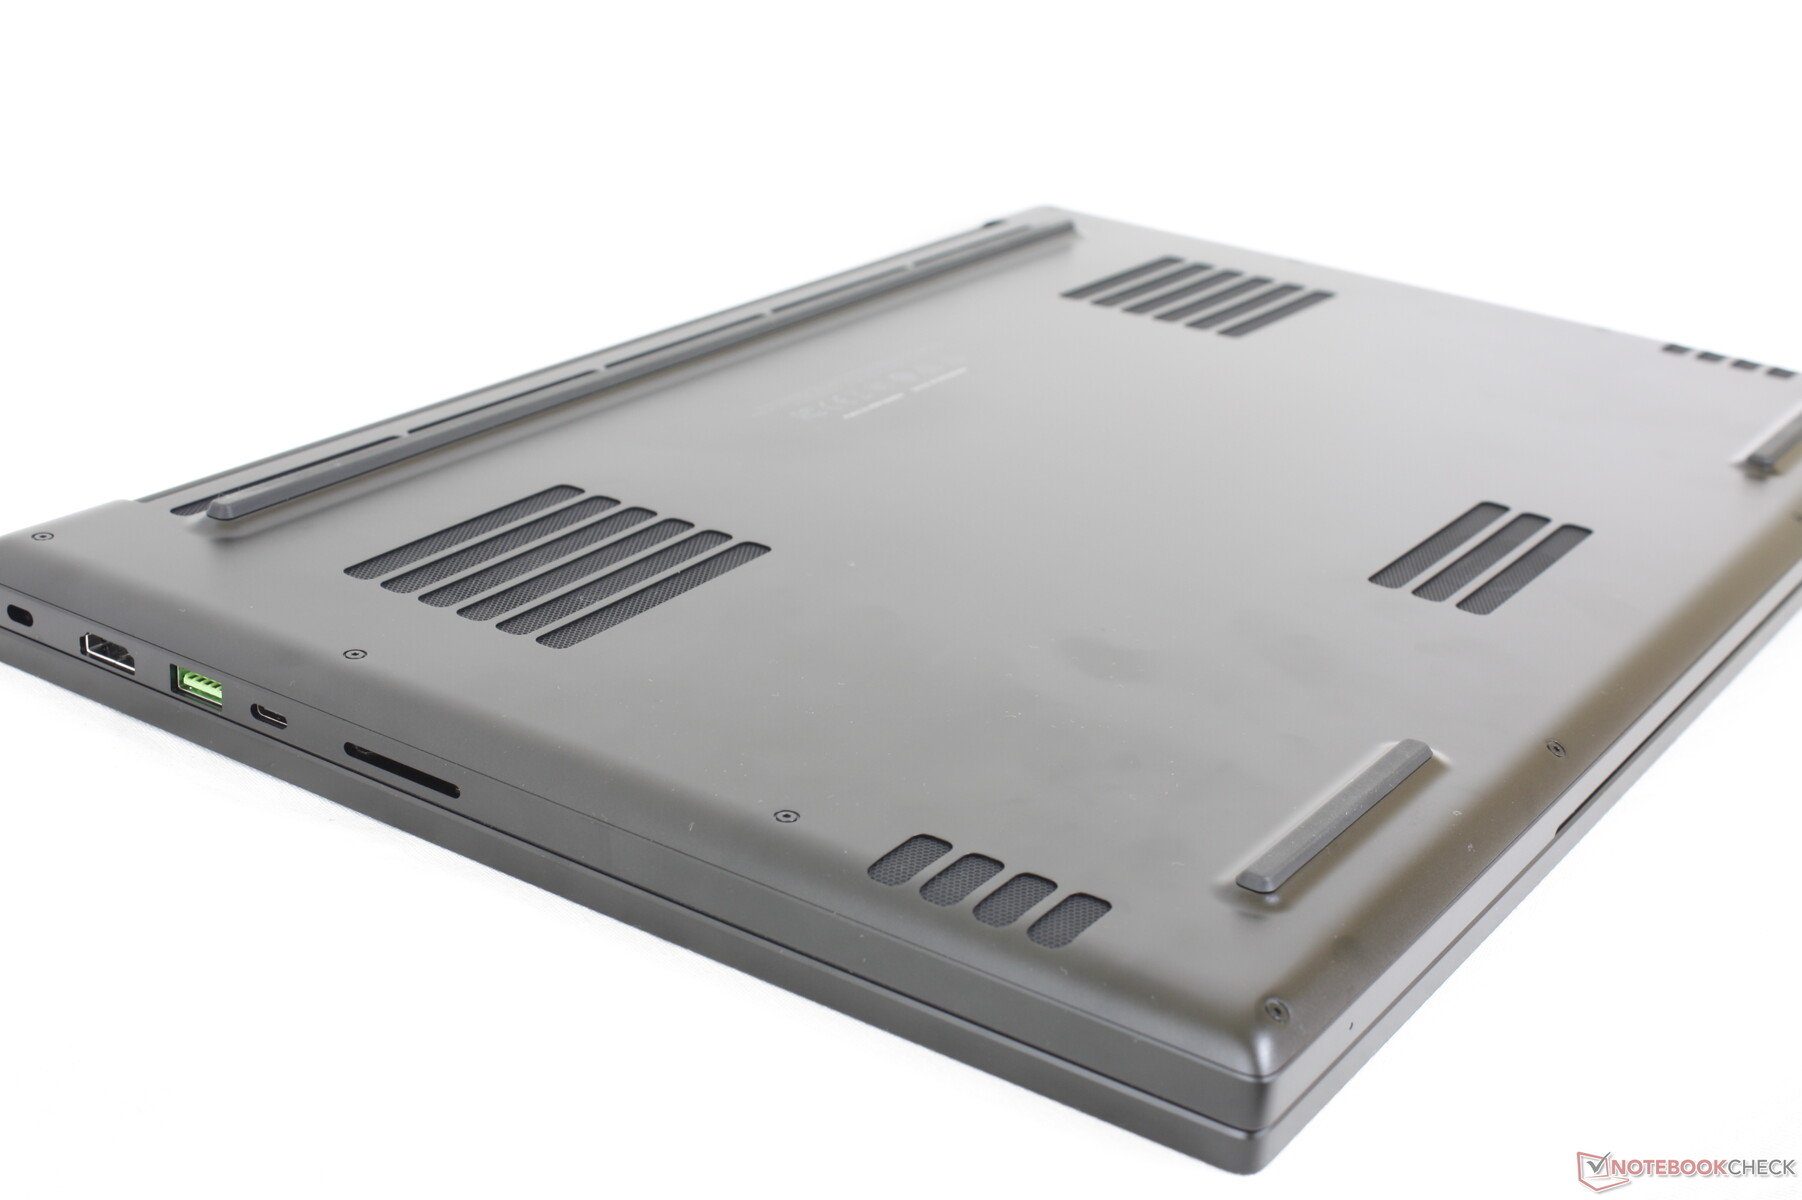
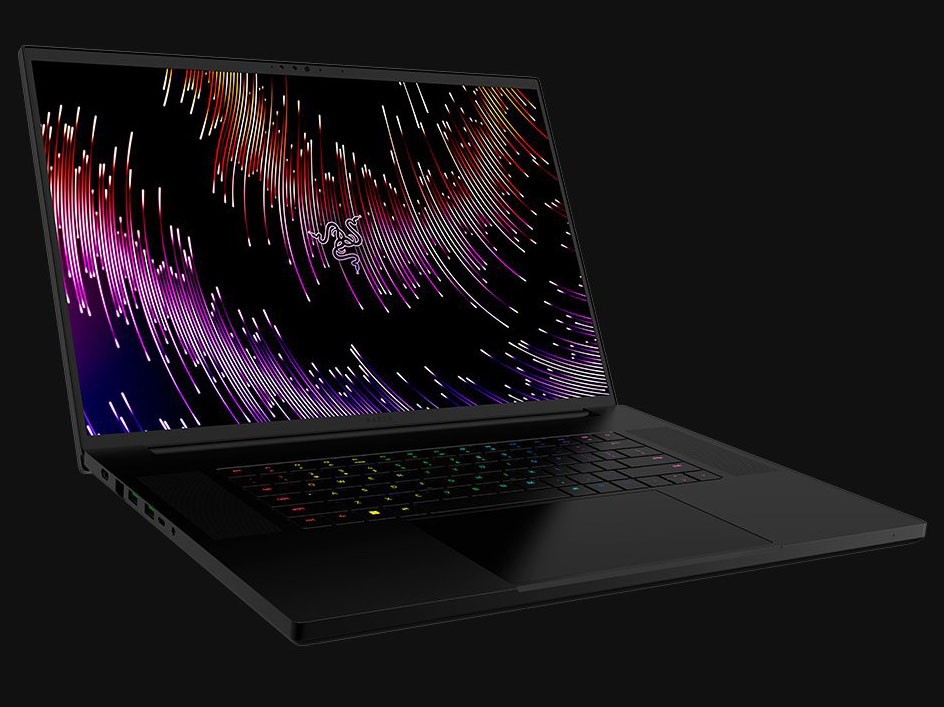
Case - Knappt större än Blade 17
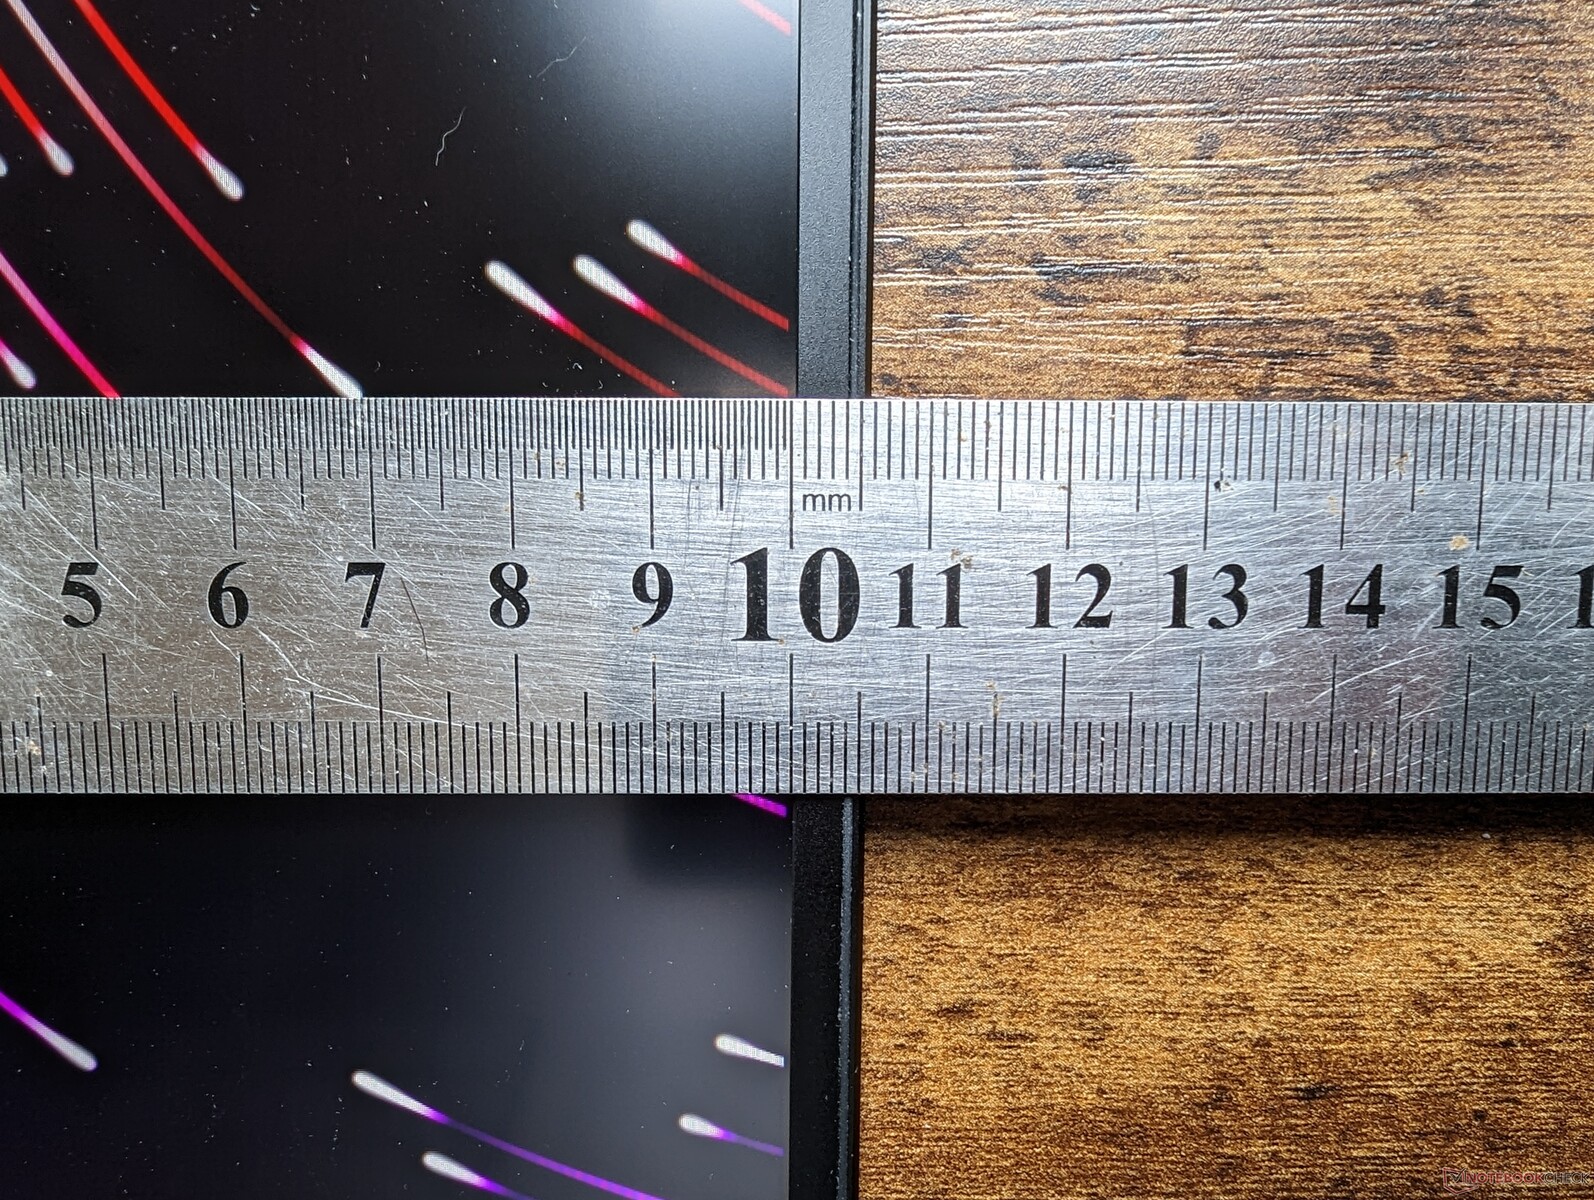
Blade 18 må vara en ny skärmstorlek, men den innehåller inga nya överraskningar när det gäller chassidesignen. Modellen ser ut och känns som en Blade 17 från topp till tå. Den största visuella skillnaden gäller den mycket mindre hakramen på Blade 18 jämfört med Blade 17 för ett högre förhållande mellan skärm och kropp.
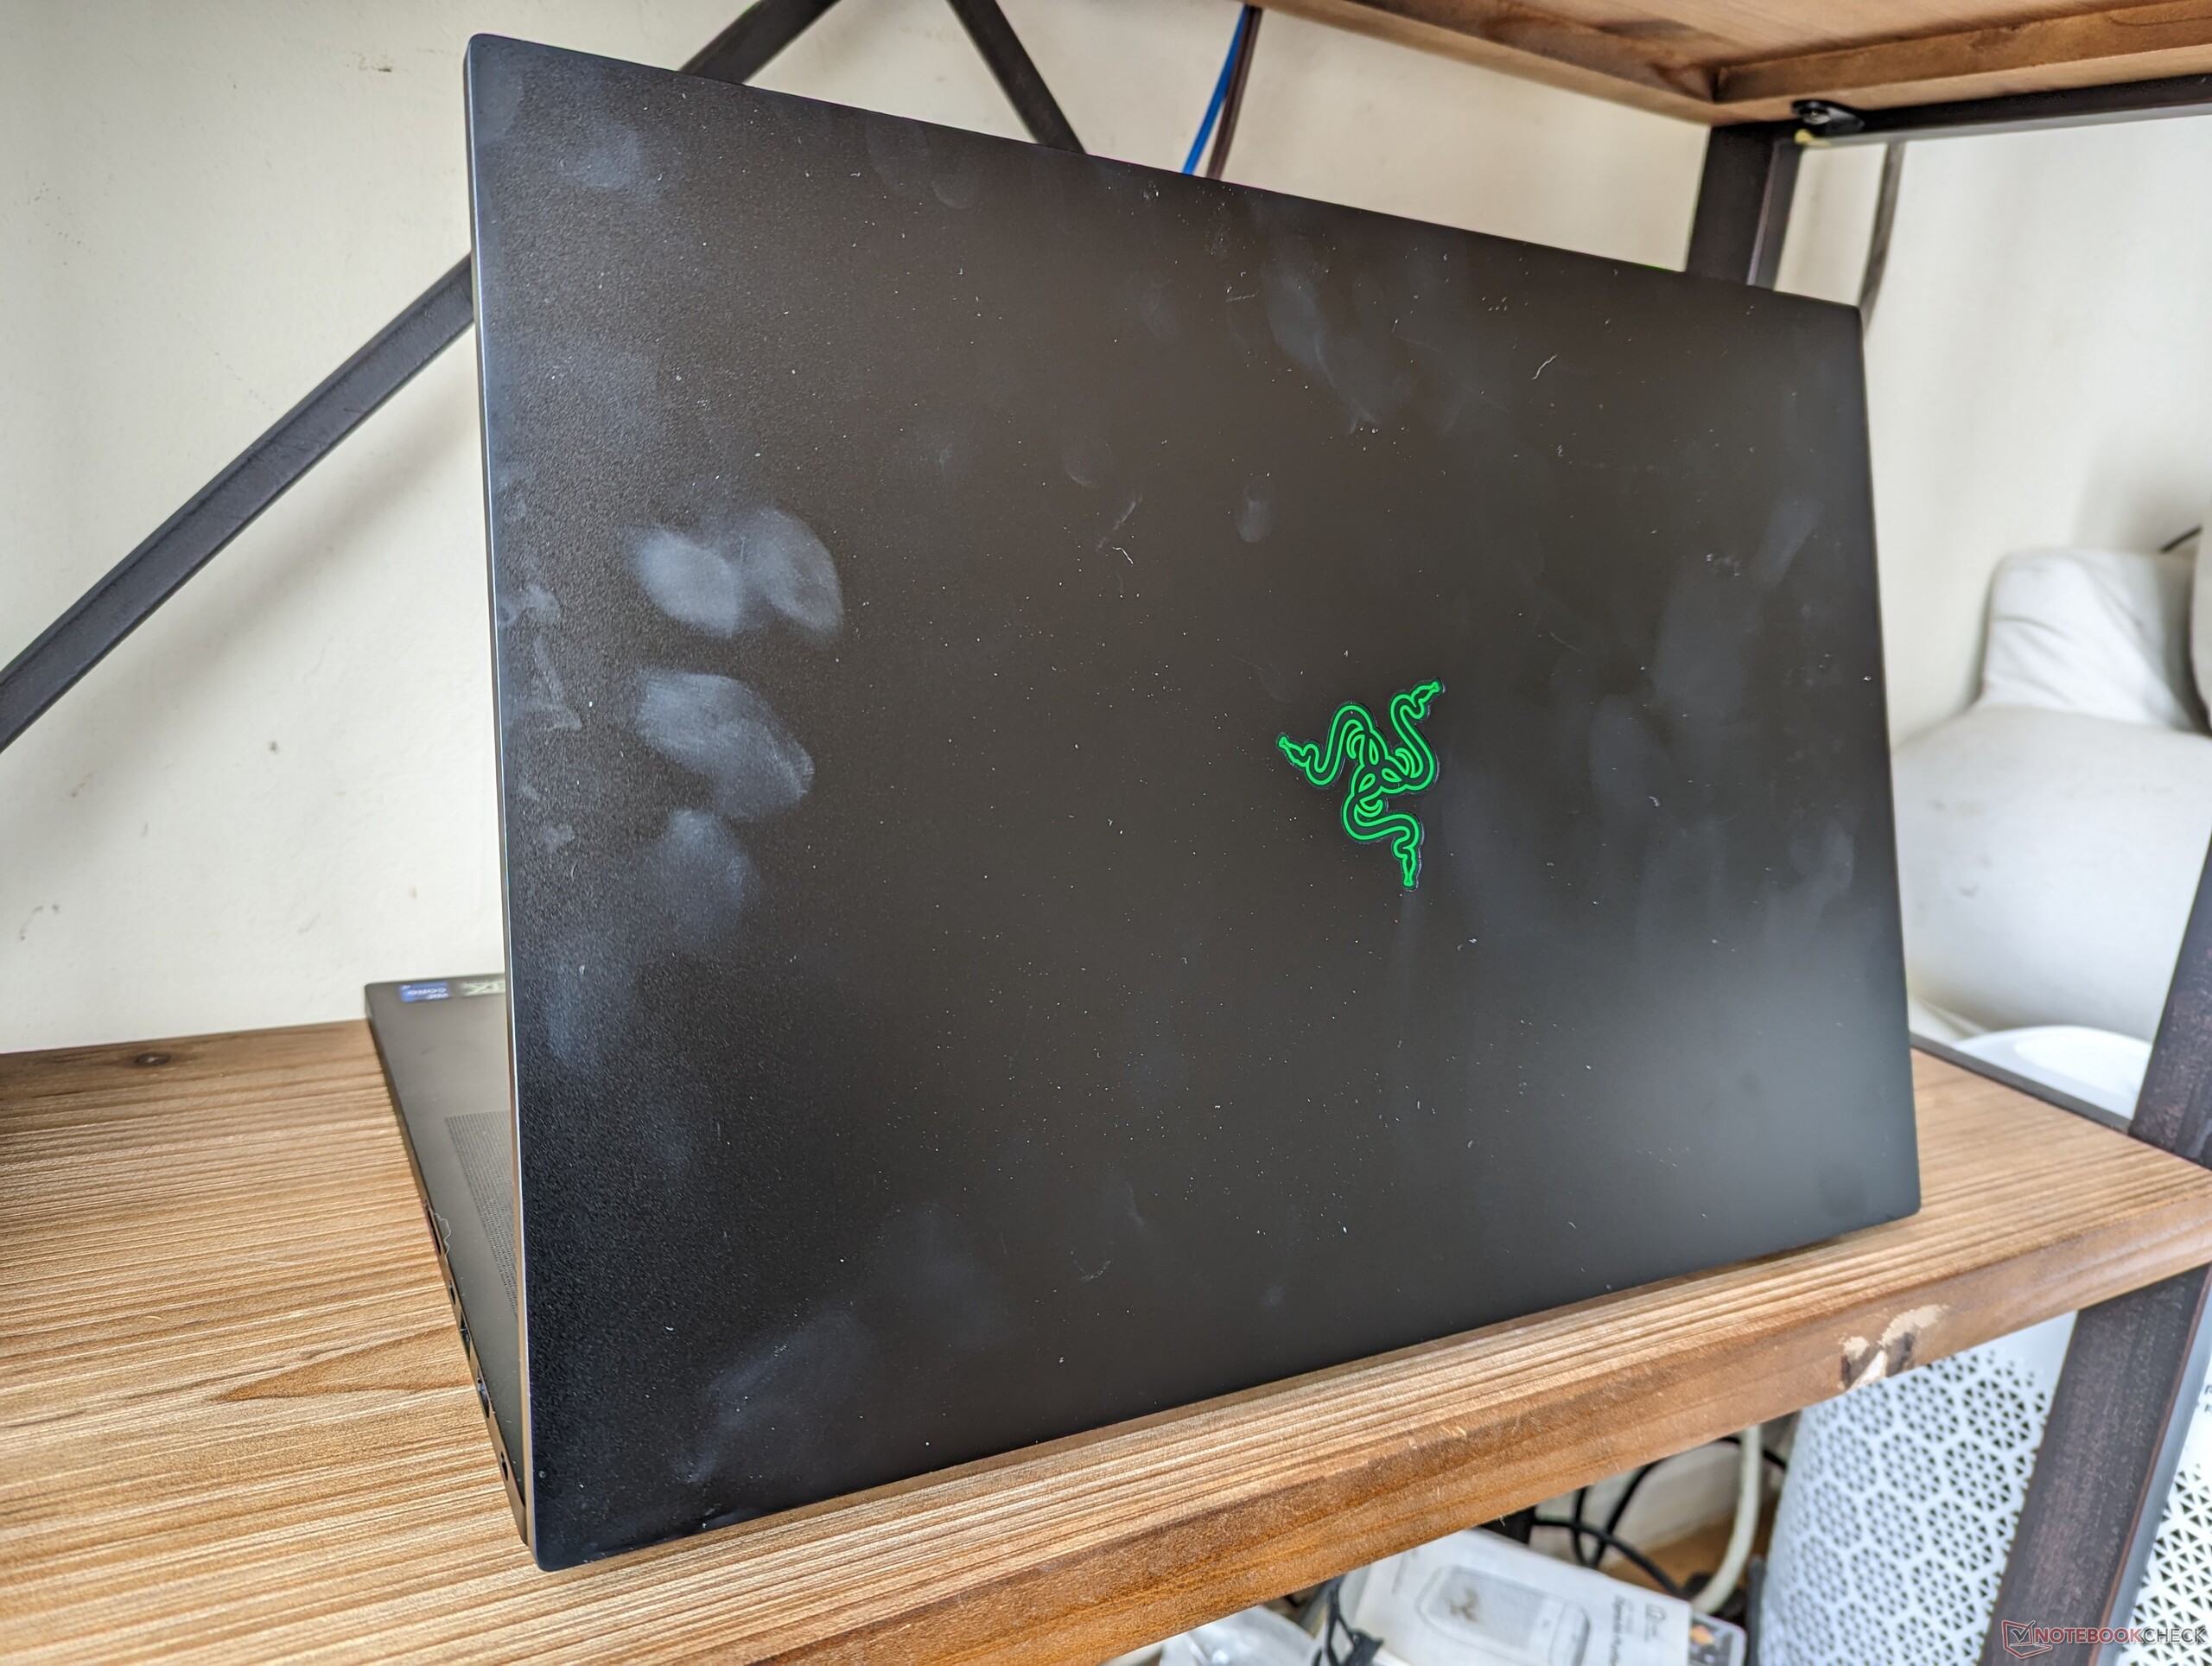
Den större 18-tums formfaktorn påverkar tack och lov inte styvheten i chassit. Både basen och locket är lika solida som på Blade 17 för starka MacBook Pro-liknande intryck. Särskilt gångjärnen håller bra trots den stora skärmen, men deras maximala vinkel är fortfarande långt under hela 180 grader. Den svagaste punkten på den bärbara datorn är kanske längst in på mitten av det yttre locket där ytan lättare vrider sig vid applicerat tryck.
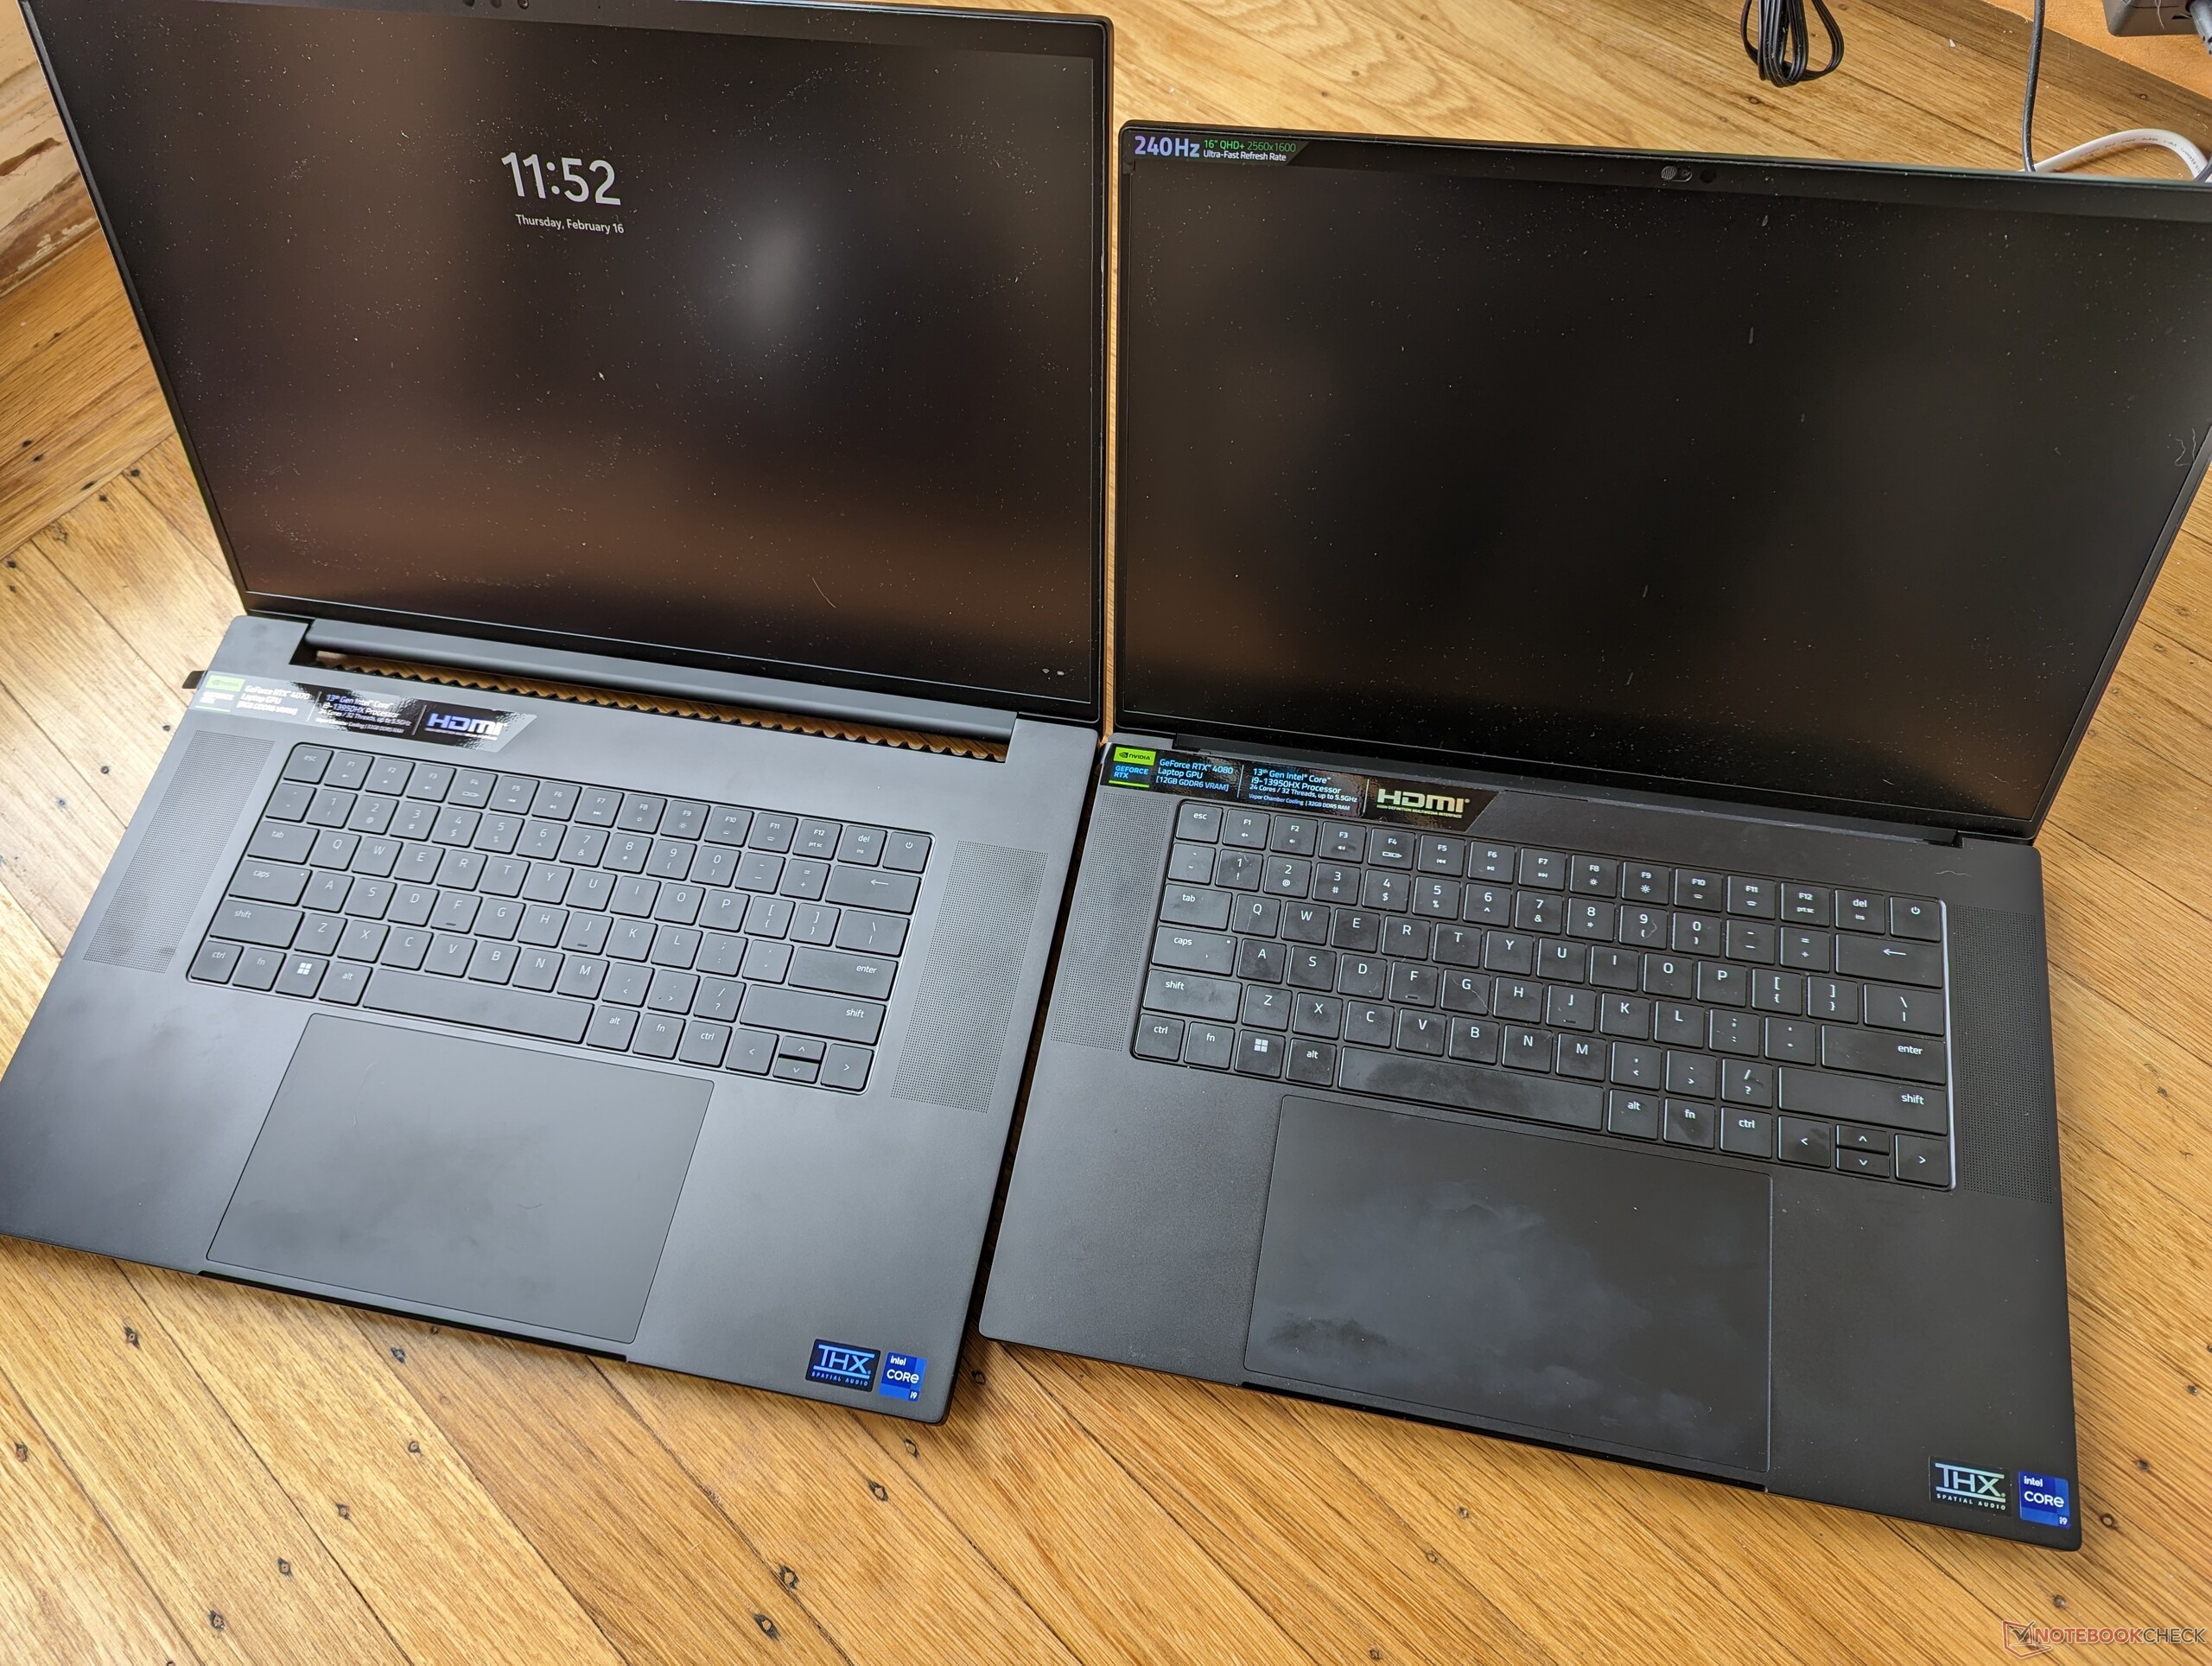
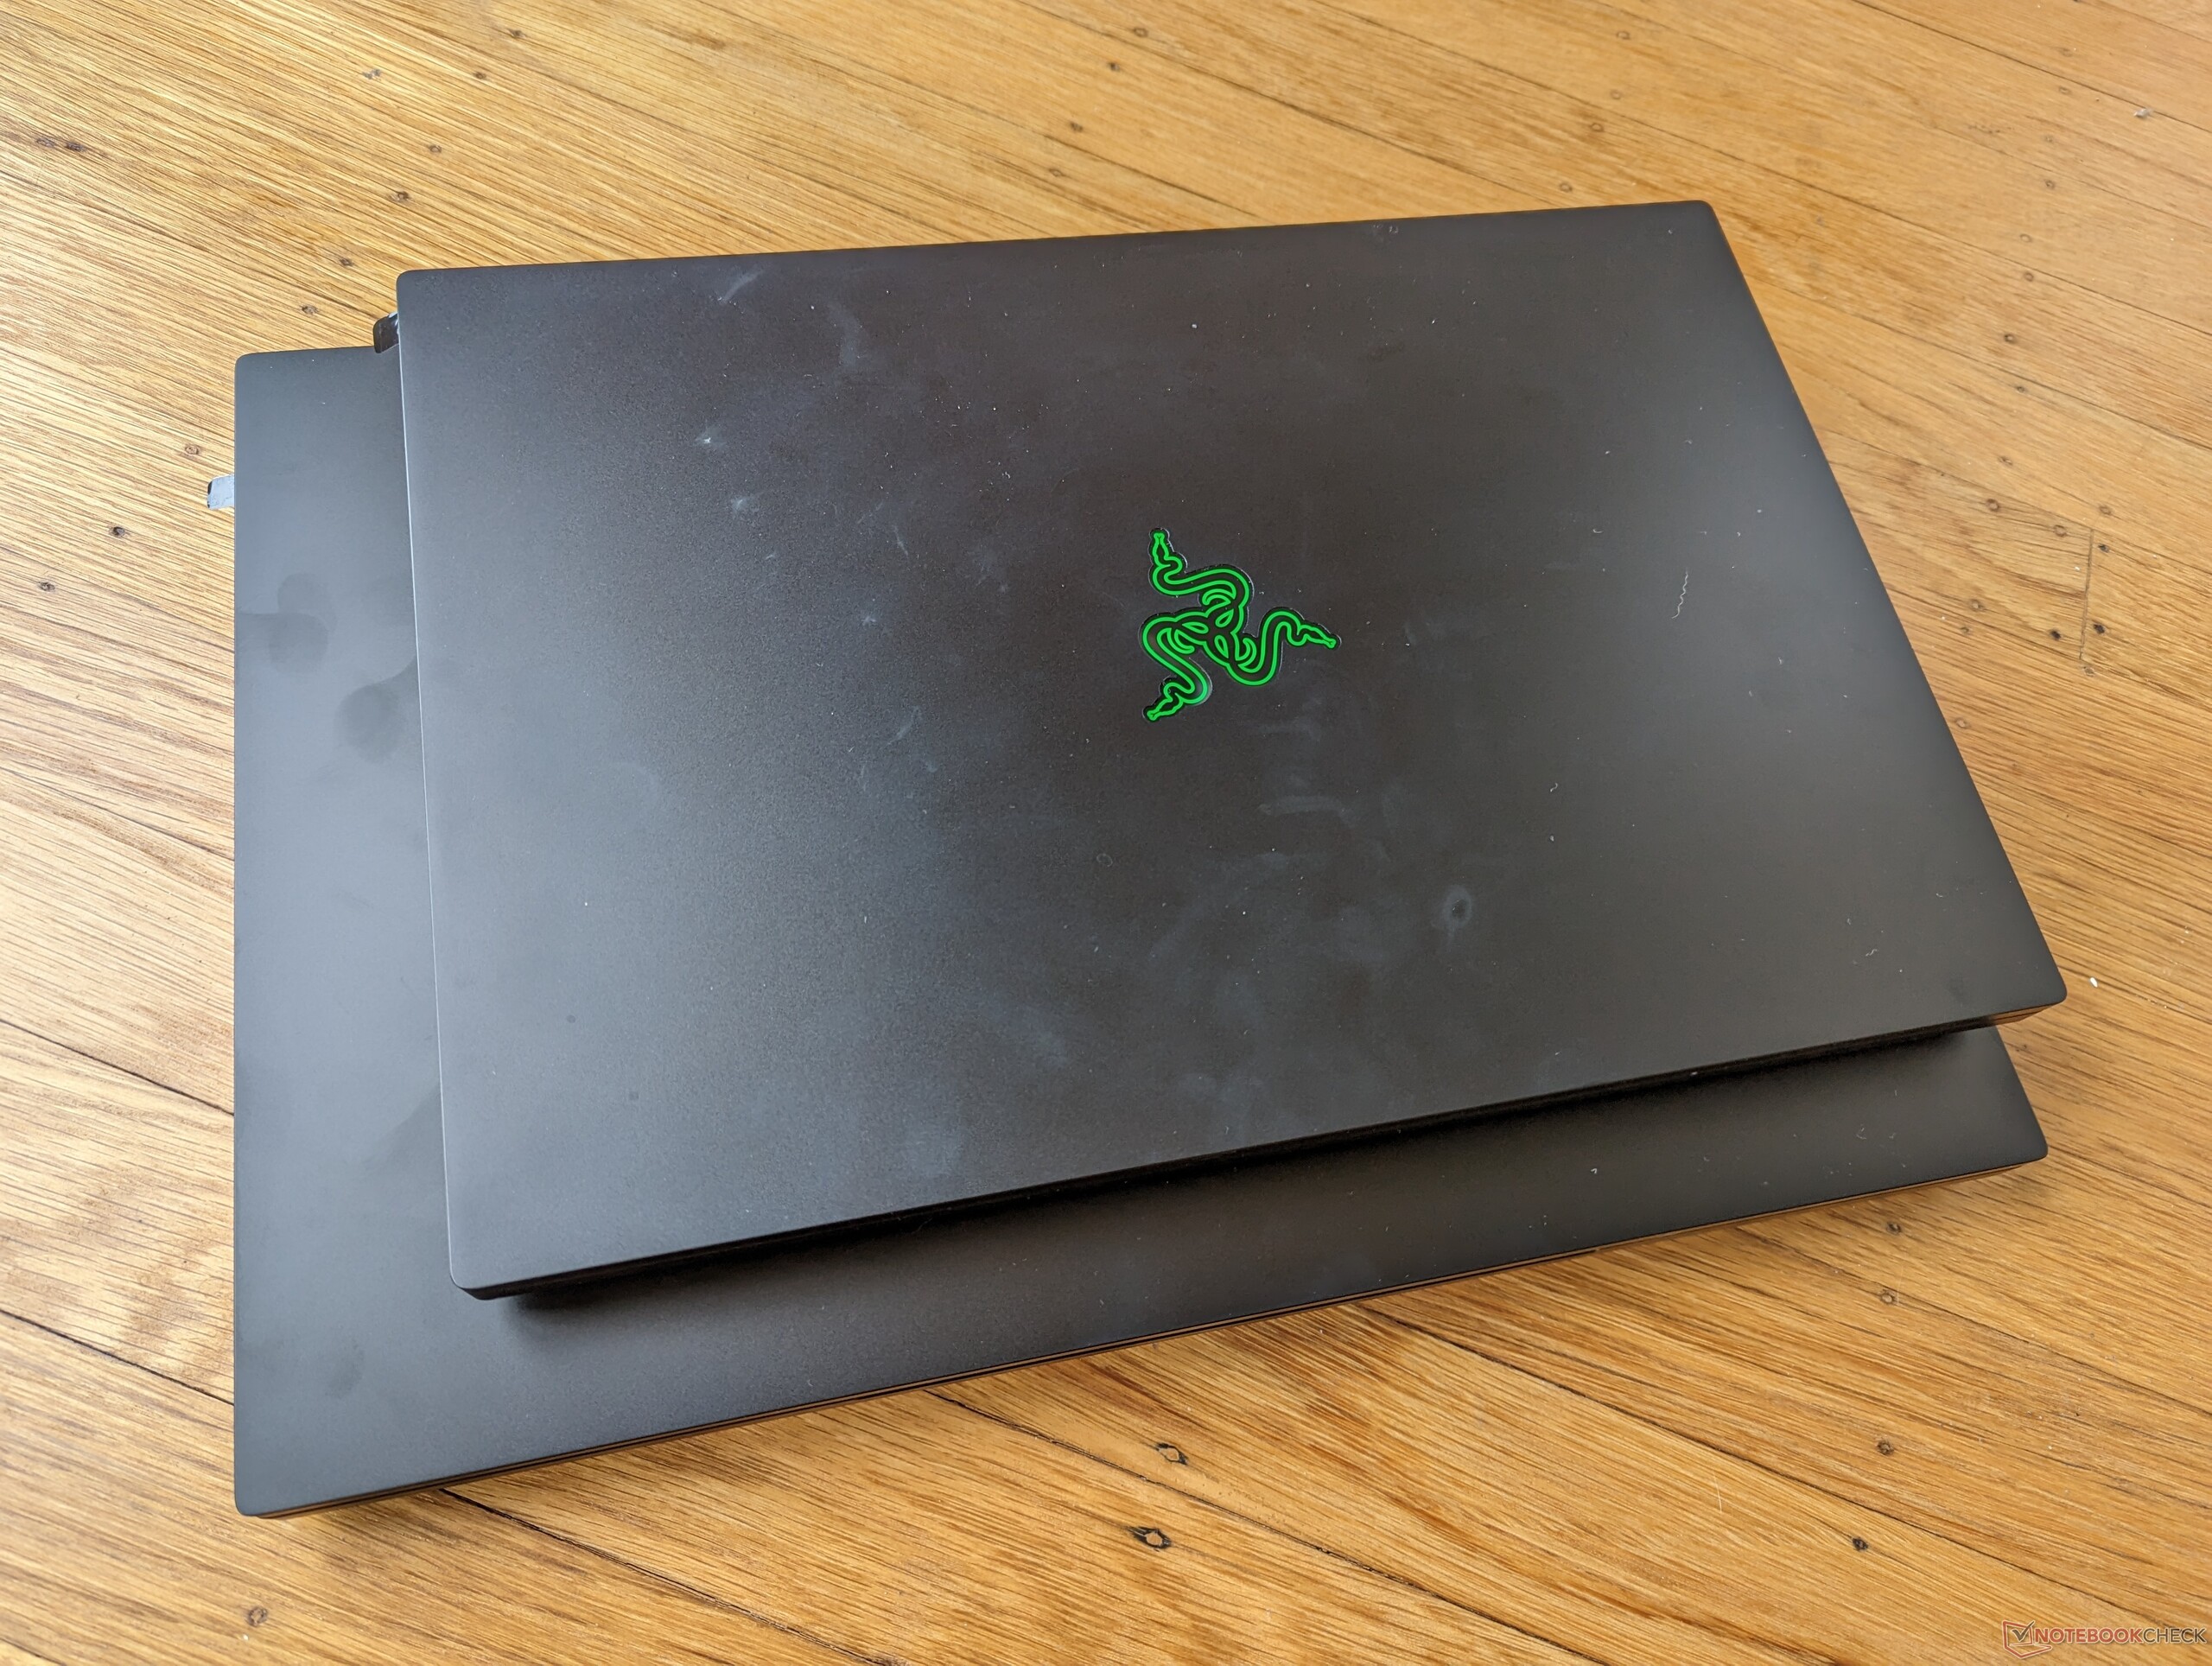
Razer påpekar stolt att Blade 18 endast är 18 procent större i volym och 7 procent tyngre än Blade 17 från 2022, trots att skärmstorlekarna skiljer sig åt. Den nya 18-tumsmodellen känns alltså inte så skrymmande som man först skulle kunna förvänta sig. Faktum är att vissa bärbara 17,3-tums gamingdatorer är större eller till och med tyngre än Blade 18, inklusive följande.Asus ROG Strix Scar 17 SE eller Alienware m17 R5.
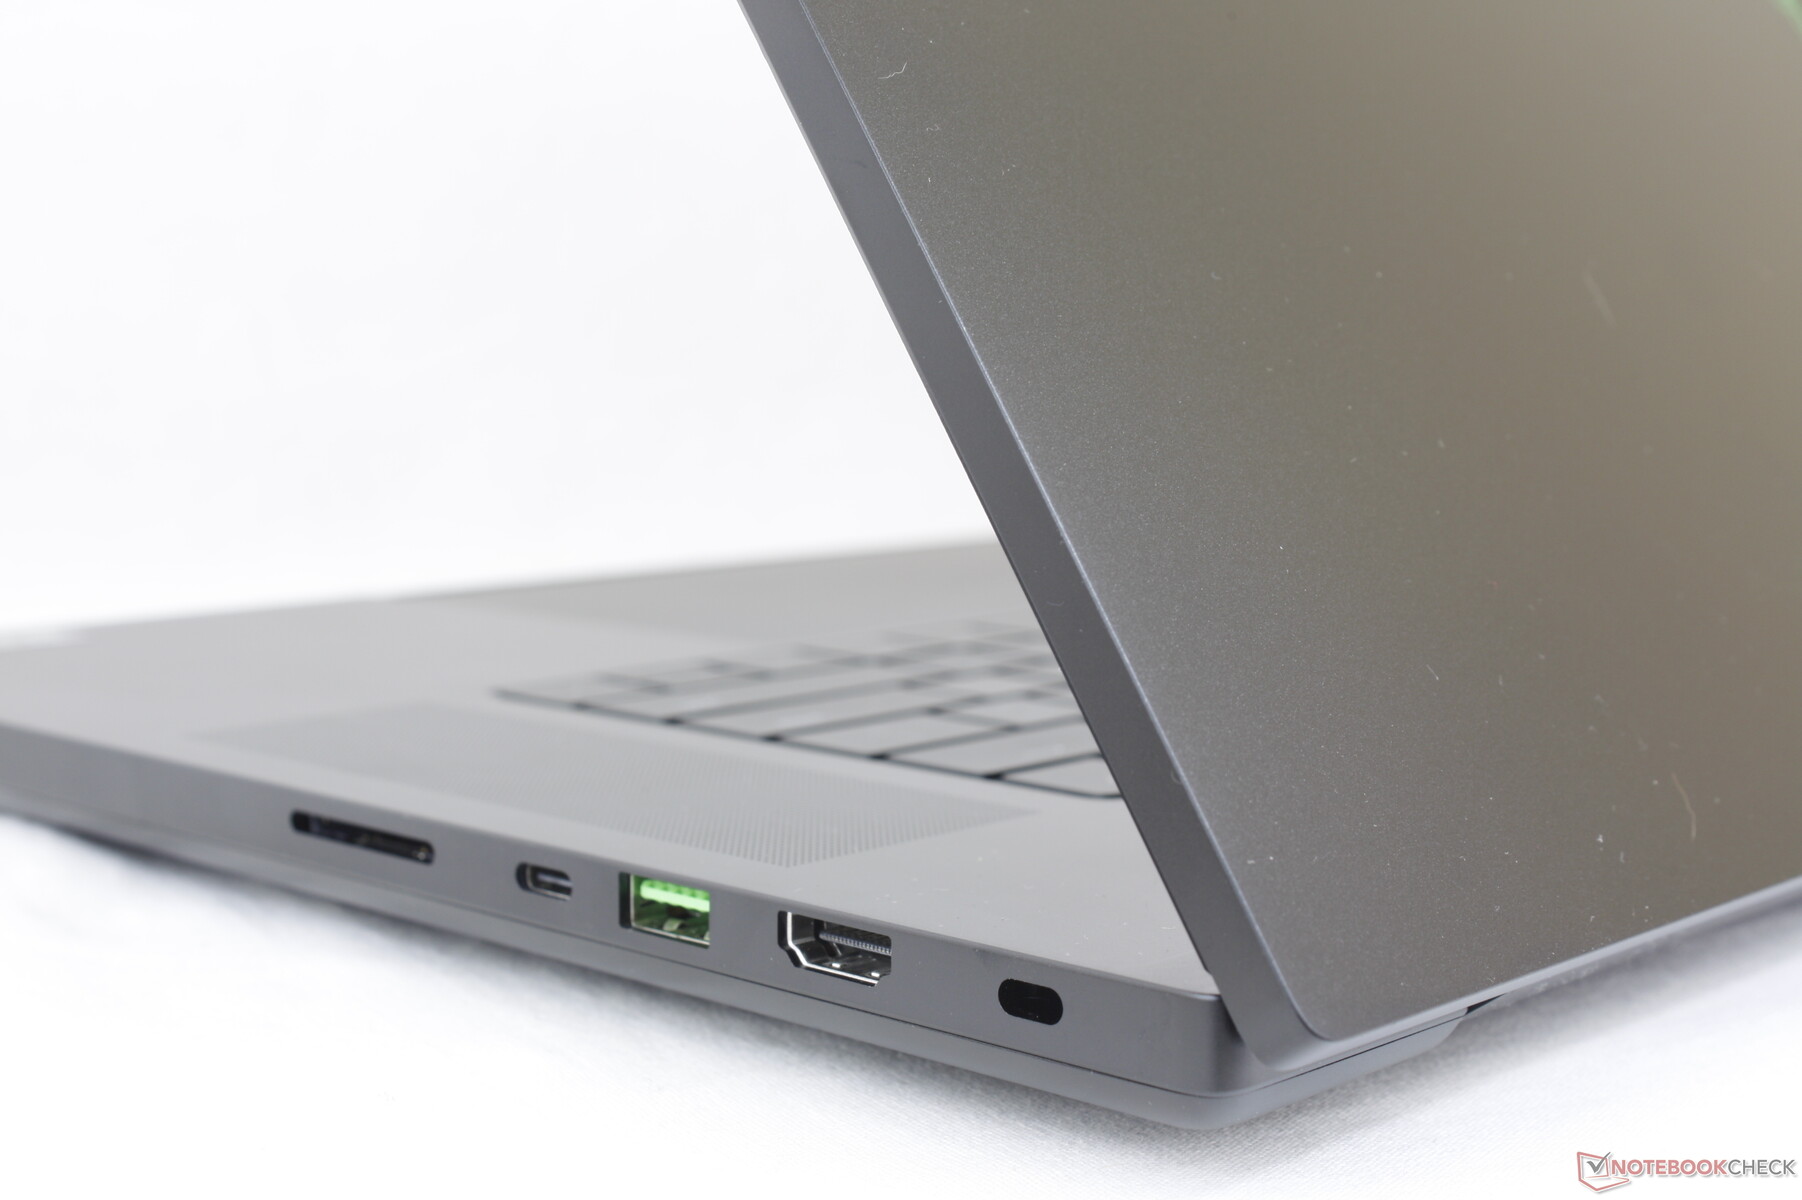
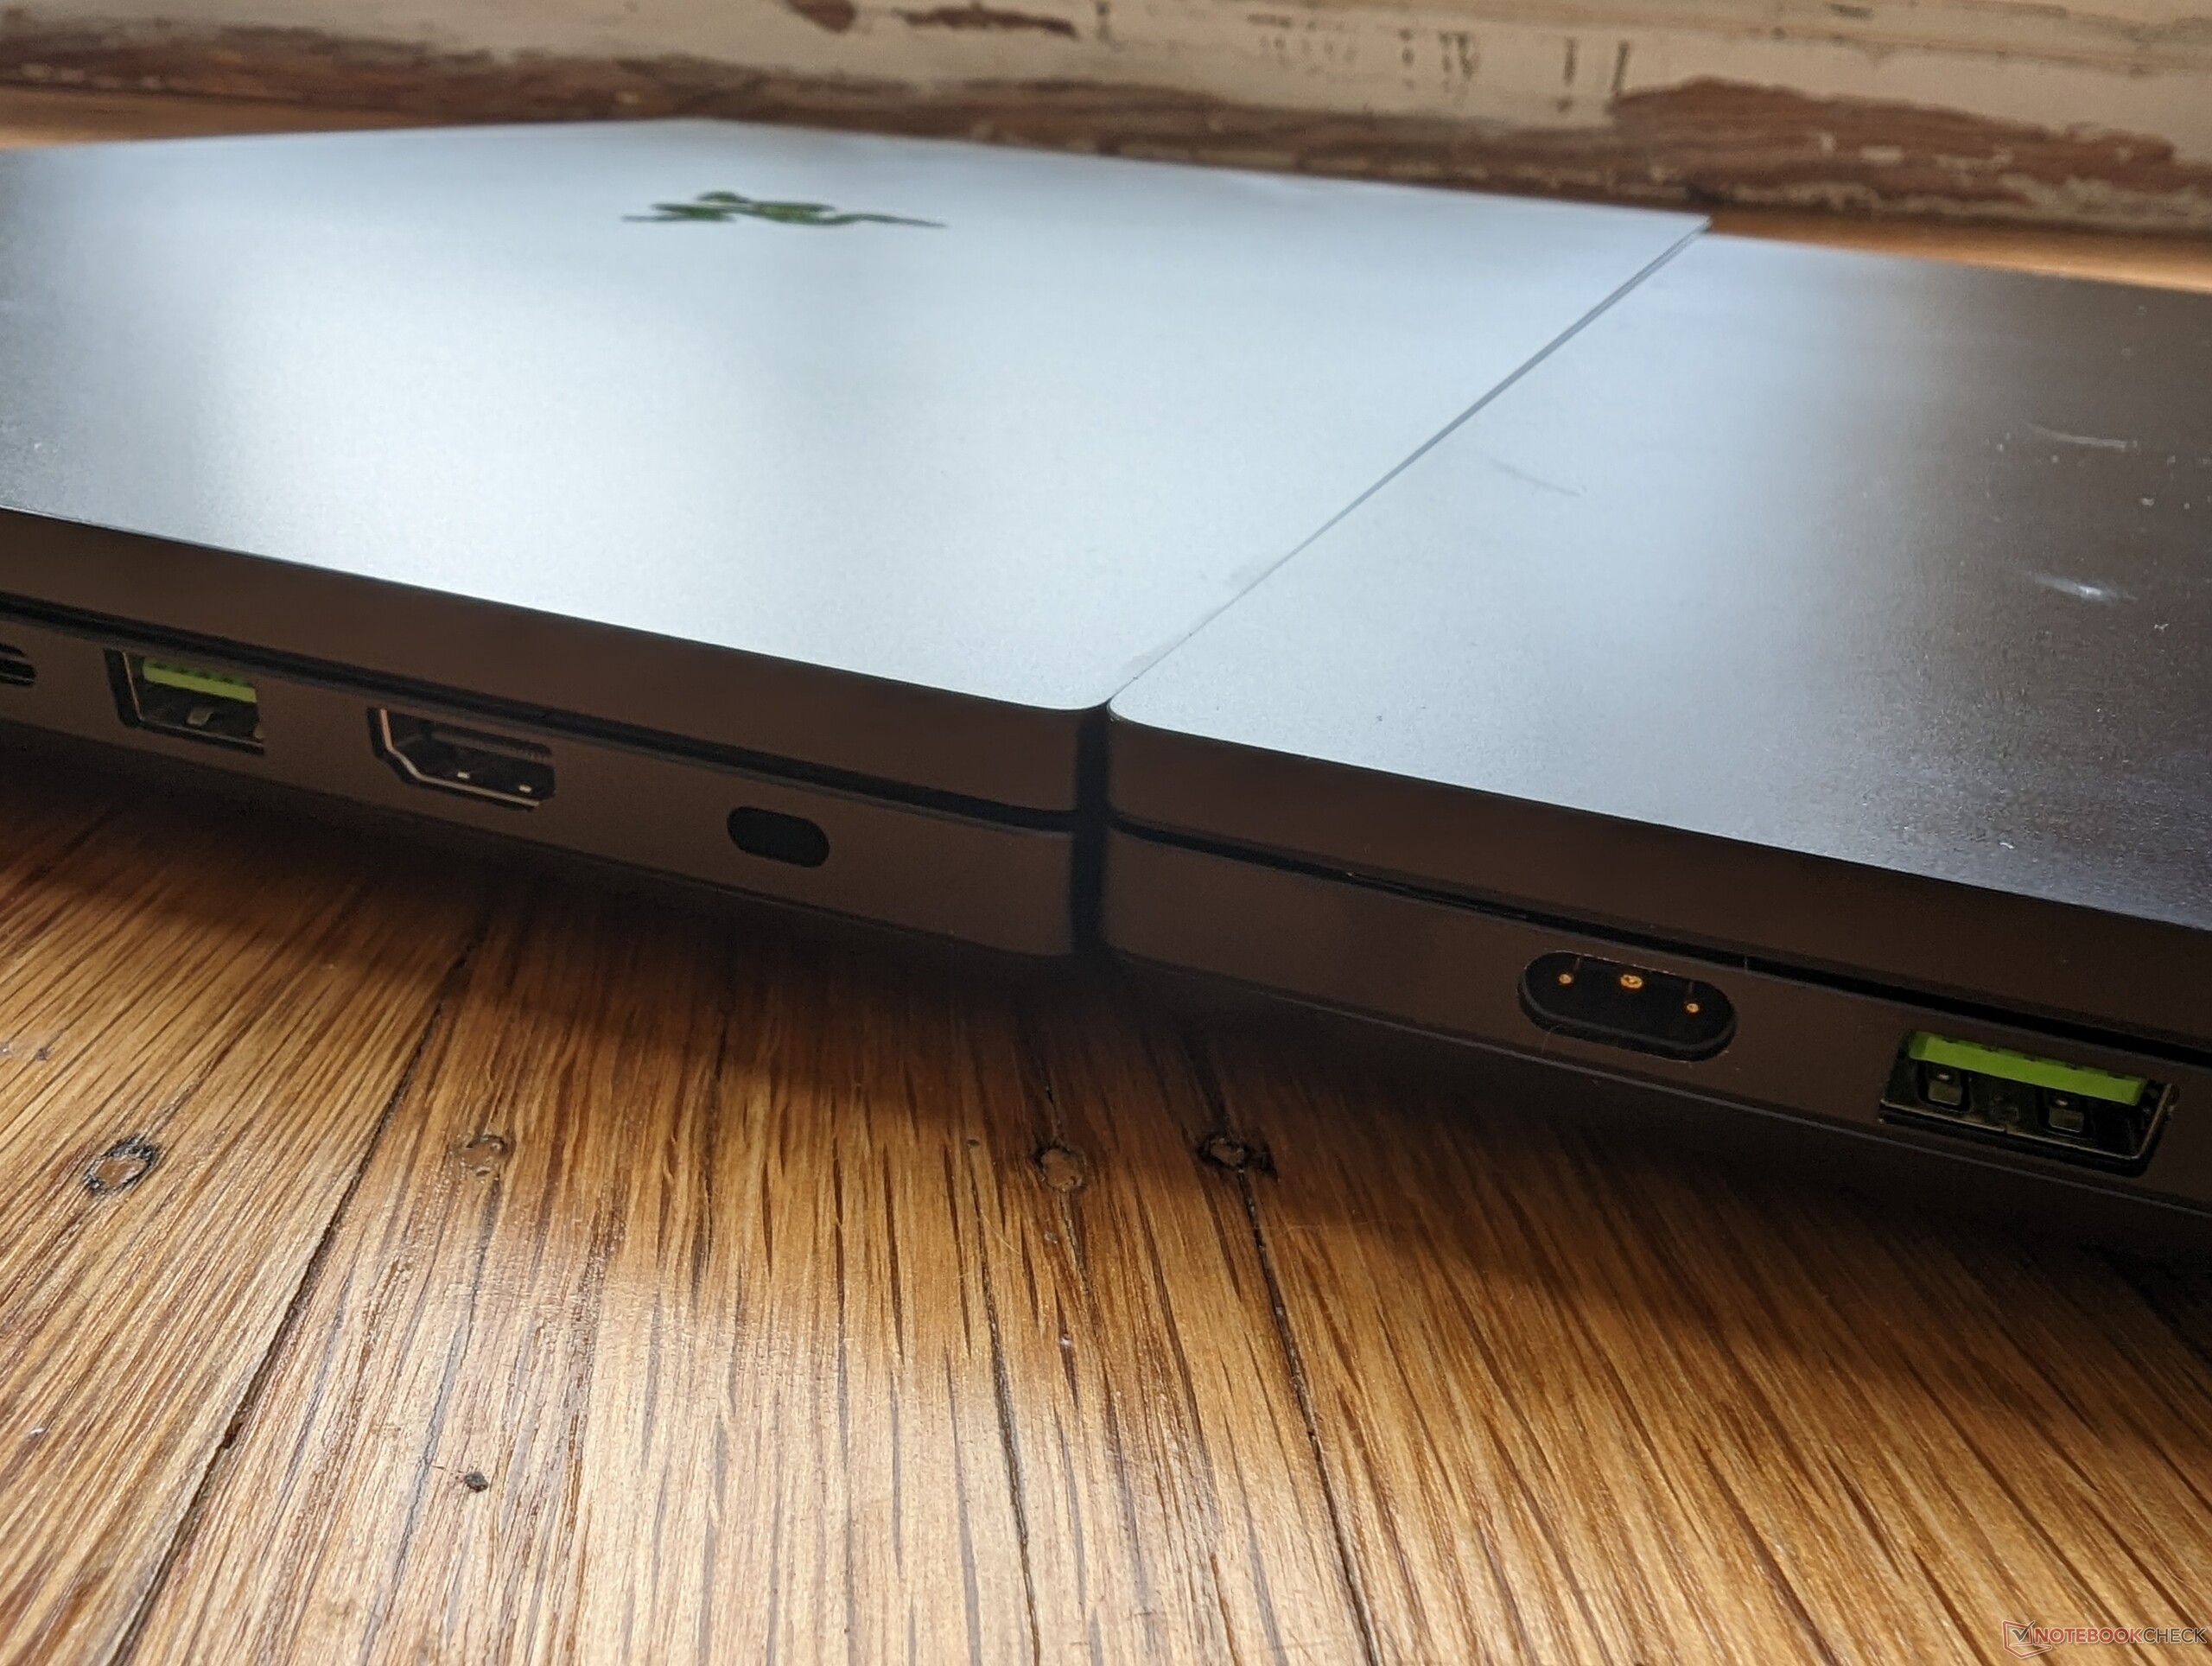
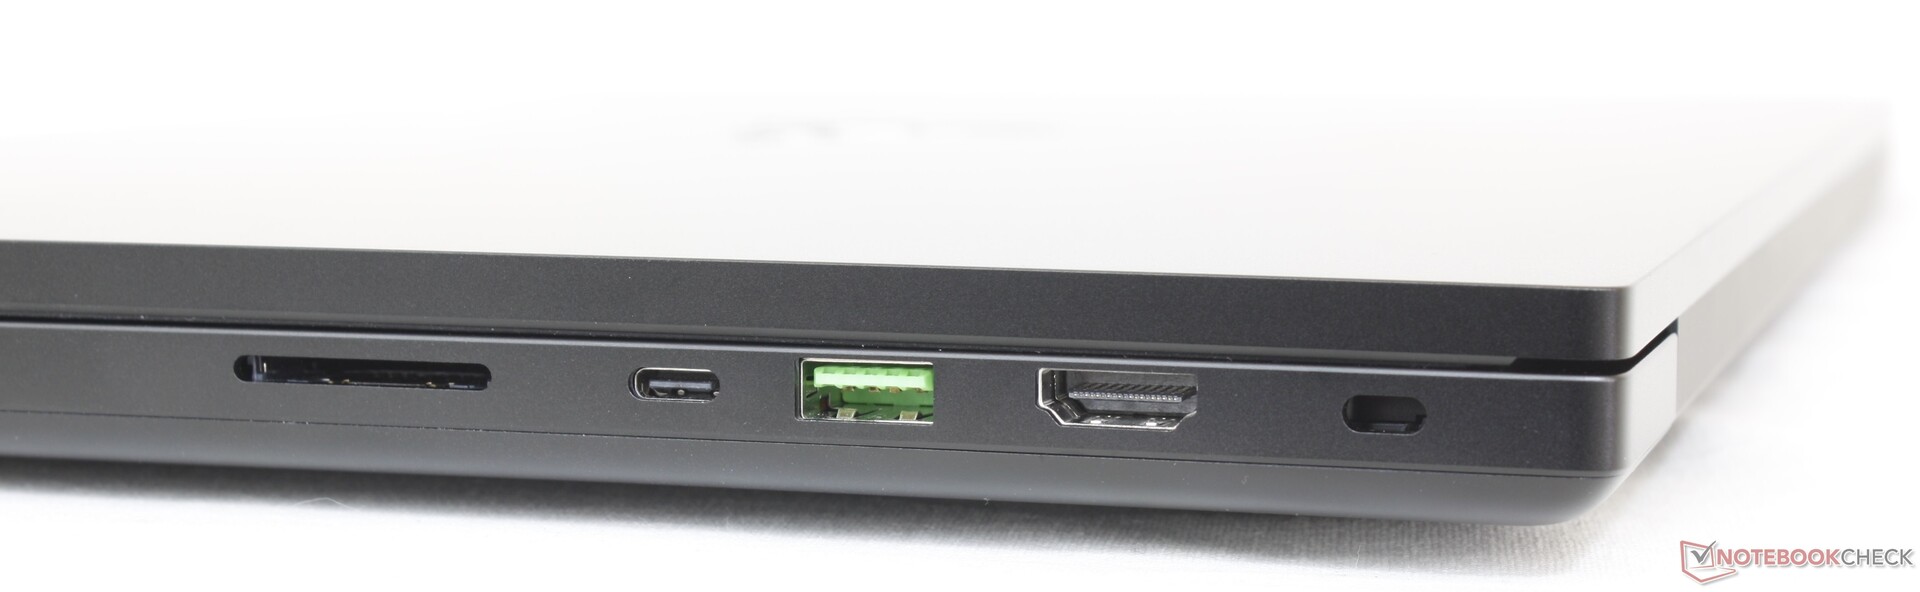
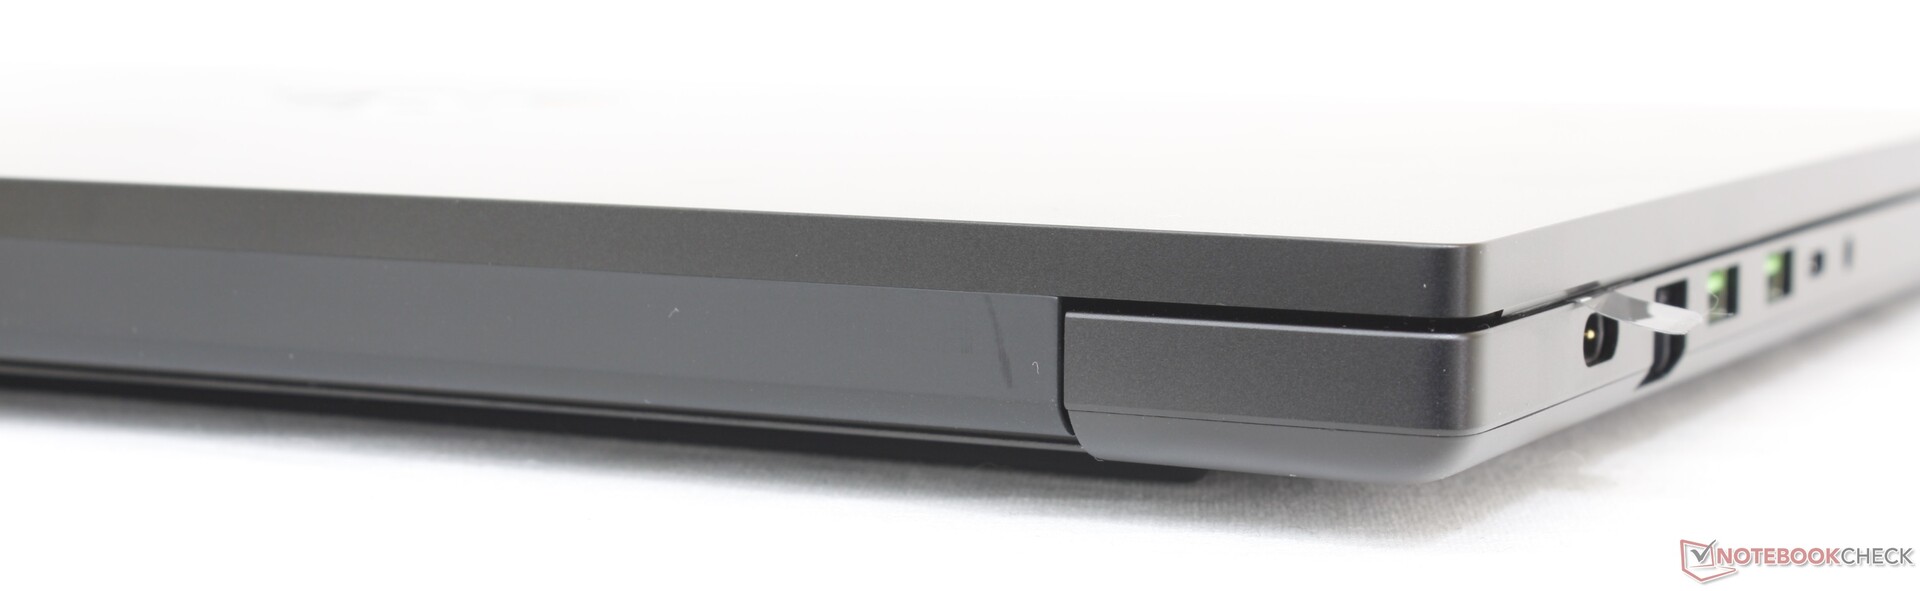
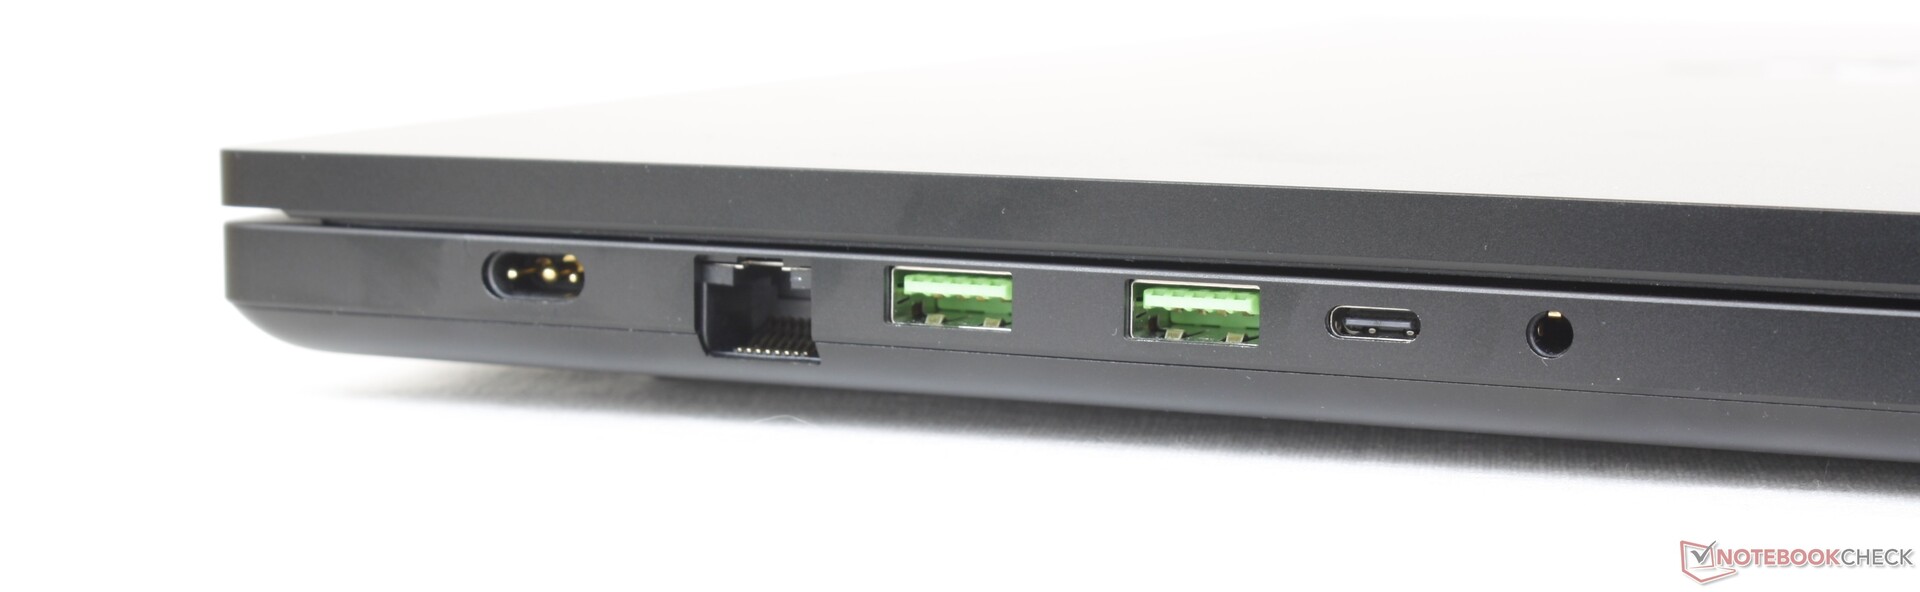
Anslutningsmöjligheter - det vanliga
Den nya modellen ärver alla portar från Blade 17 för att ge ett stort urval av anslutningsmöjligheter. Trots det skulle vi vilja se lite mer för att bättre skilja Blade 18 från sina mindre syskon. Till exempel skulle en HDMI-in-port ha gett mer mångsidighet till den rymliga 18-tumsskärmen.
Tänk på att endast en av de två USB-C-portarna är kompatibel med Thunderbolt-enheter.
SD-kortläsare
Vi kan flytta 1 GB bilder från vårt UHS-II-testkort till skrivbordet på bara 5 sekunder, jämfört med ~13 sekunder påMSI Titan GT77.
| SD Card Reader | |
| average JPG Copy Test (av. of 3 runs) | |
| Razer Blade 18 RTX 4070 (Angelibird AV Pro V60) | |
| Razer Blade 17 Early 2022 (AV PRO microSD 128 GB V60) | |
| Razer Blade 16 Early 2023 (AV PRO microSD 128 GB V60) | |
| MSI Titan GT77 HX 13VI (Angelibird AV Pro V60) | |
| maximum AS SSD Seq Read Test (1GB) | |
| Razer Blade 18 RTX 4070 (Angelibird AV Pro V60) | |
| Razer Blade 16 Early 2023 (AV PRO microSD 128 GB V60) | |
| Gigabyte G7 KE (AV PRO microSD 128 GB V60) | |
| MSI Titan GT77 HX 13VI (Angelibird AV Pro V60) | |
Kommunikation
En Intel AX211 är standard för Wi-Fi 6E och Bluetooth 5.3, medan Blade 17 levereras med Killer AX1690i som jämförelse. Killer AX1690i är det spelspecifika derivatet av Intel AX211 och därför bör användarna inte se några betydande prestandaskillnader mellan de två.
| Networking | |
| iperf3 transmit AXE11000 6GHz | |
| Asus ROG Strix Scar 17 SE G733CX-LL014W | |
| Razer Blade 18 RTX 4070 | |
| iperf3 receive AXE11000 6GHz | |
| Asus ROG Strix Scar 17 SE G733CX-LL014W | |
| Razer Blade 18 RTX 4070 | |
| iperf3 receive AXE11000 | |
| Razer Blade 17 Early 2022 | |
| Gigabyte G7 KE | |
| MSI Titan GT77 HX 13VI | |
| Razer Blade 18 RTX 4070 | |
| Alienware m17 R5 (R9 6900HX, RX 6850M XT) | |
| iperf3 transmit AXE11000 | |
| Gigabyte G7 KE | |
| MSI Titan GT77 HX 13VI | |
| Razer Blade 18 RTX 4070 | |
| Alienware m17 R5 (R9 6900HX, RX 6850M XT) | |
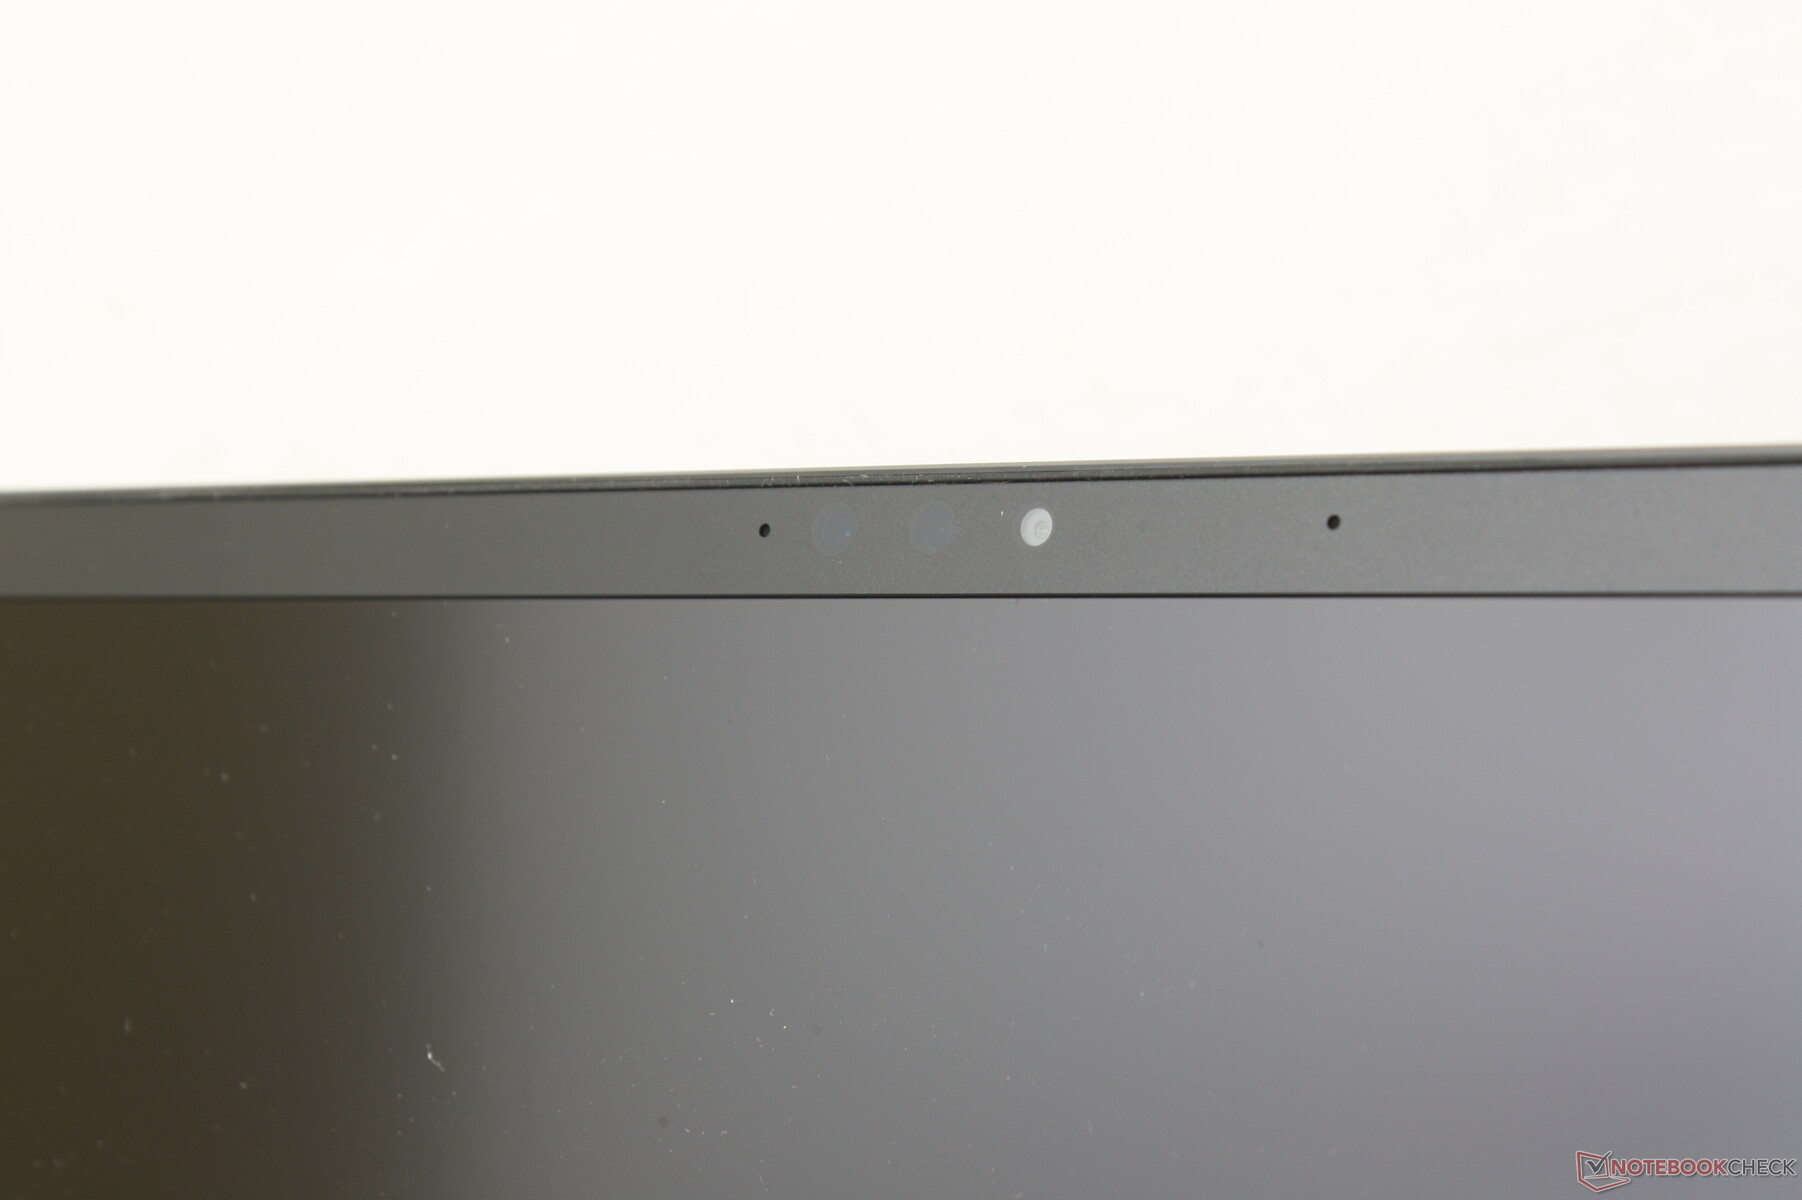
Webbkamera - Nu med 5 MP
Razer har uppgraderat webbkameran från 2 MP på Blade 17 till 5 MP på Blade 18. Vi förväntar oss helt och hållet att tillverkaren börjar uppdatera sina mindre Blade-modeller med samma 5 MP-sensor någon gång inom en snar framtid. Bilderna är skarpare med 5 MP-sensorn medan färgerna inte har förändrats så mycket. IR är standard för stöd för Windows Hello.
Märkligt nog finns det ingen fysisk sekretesslucka för webbkameran trots att den Blade 16 har en sådan. Det finns inte ens en digital kill-switch eller en snabbtangent.


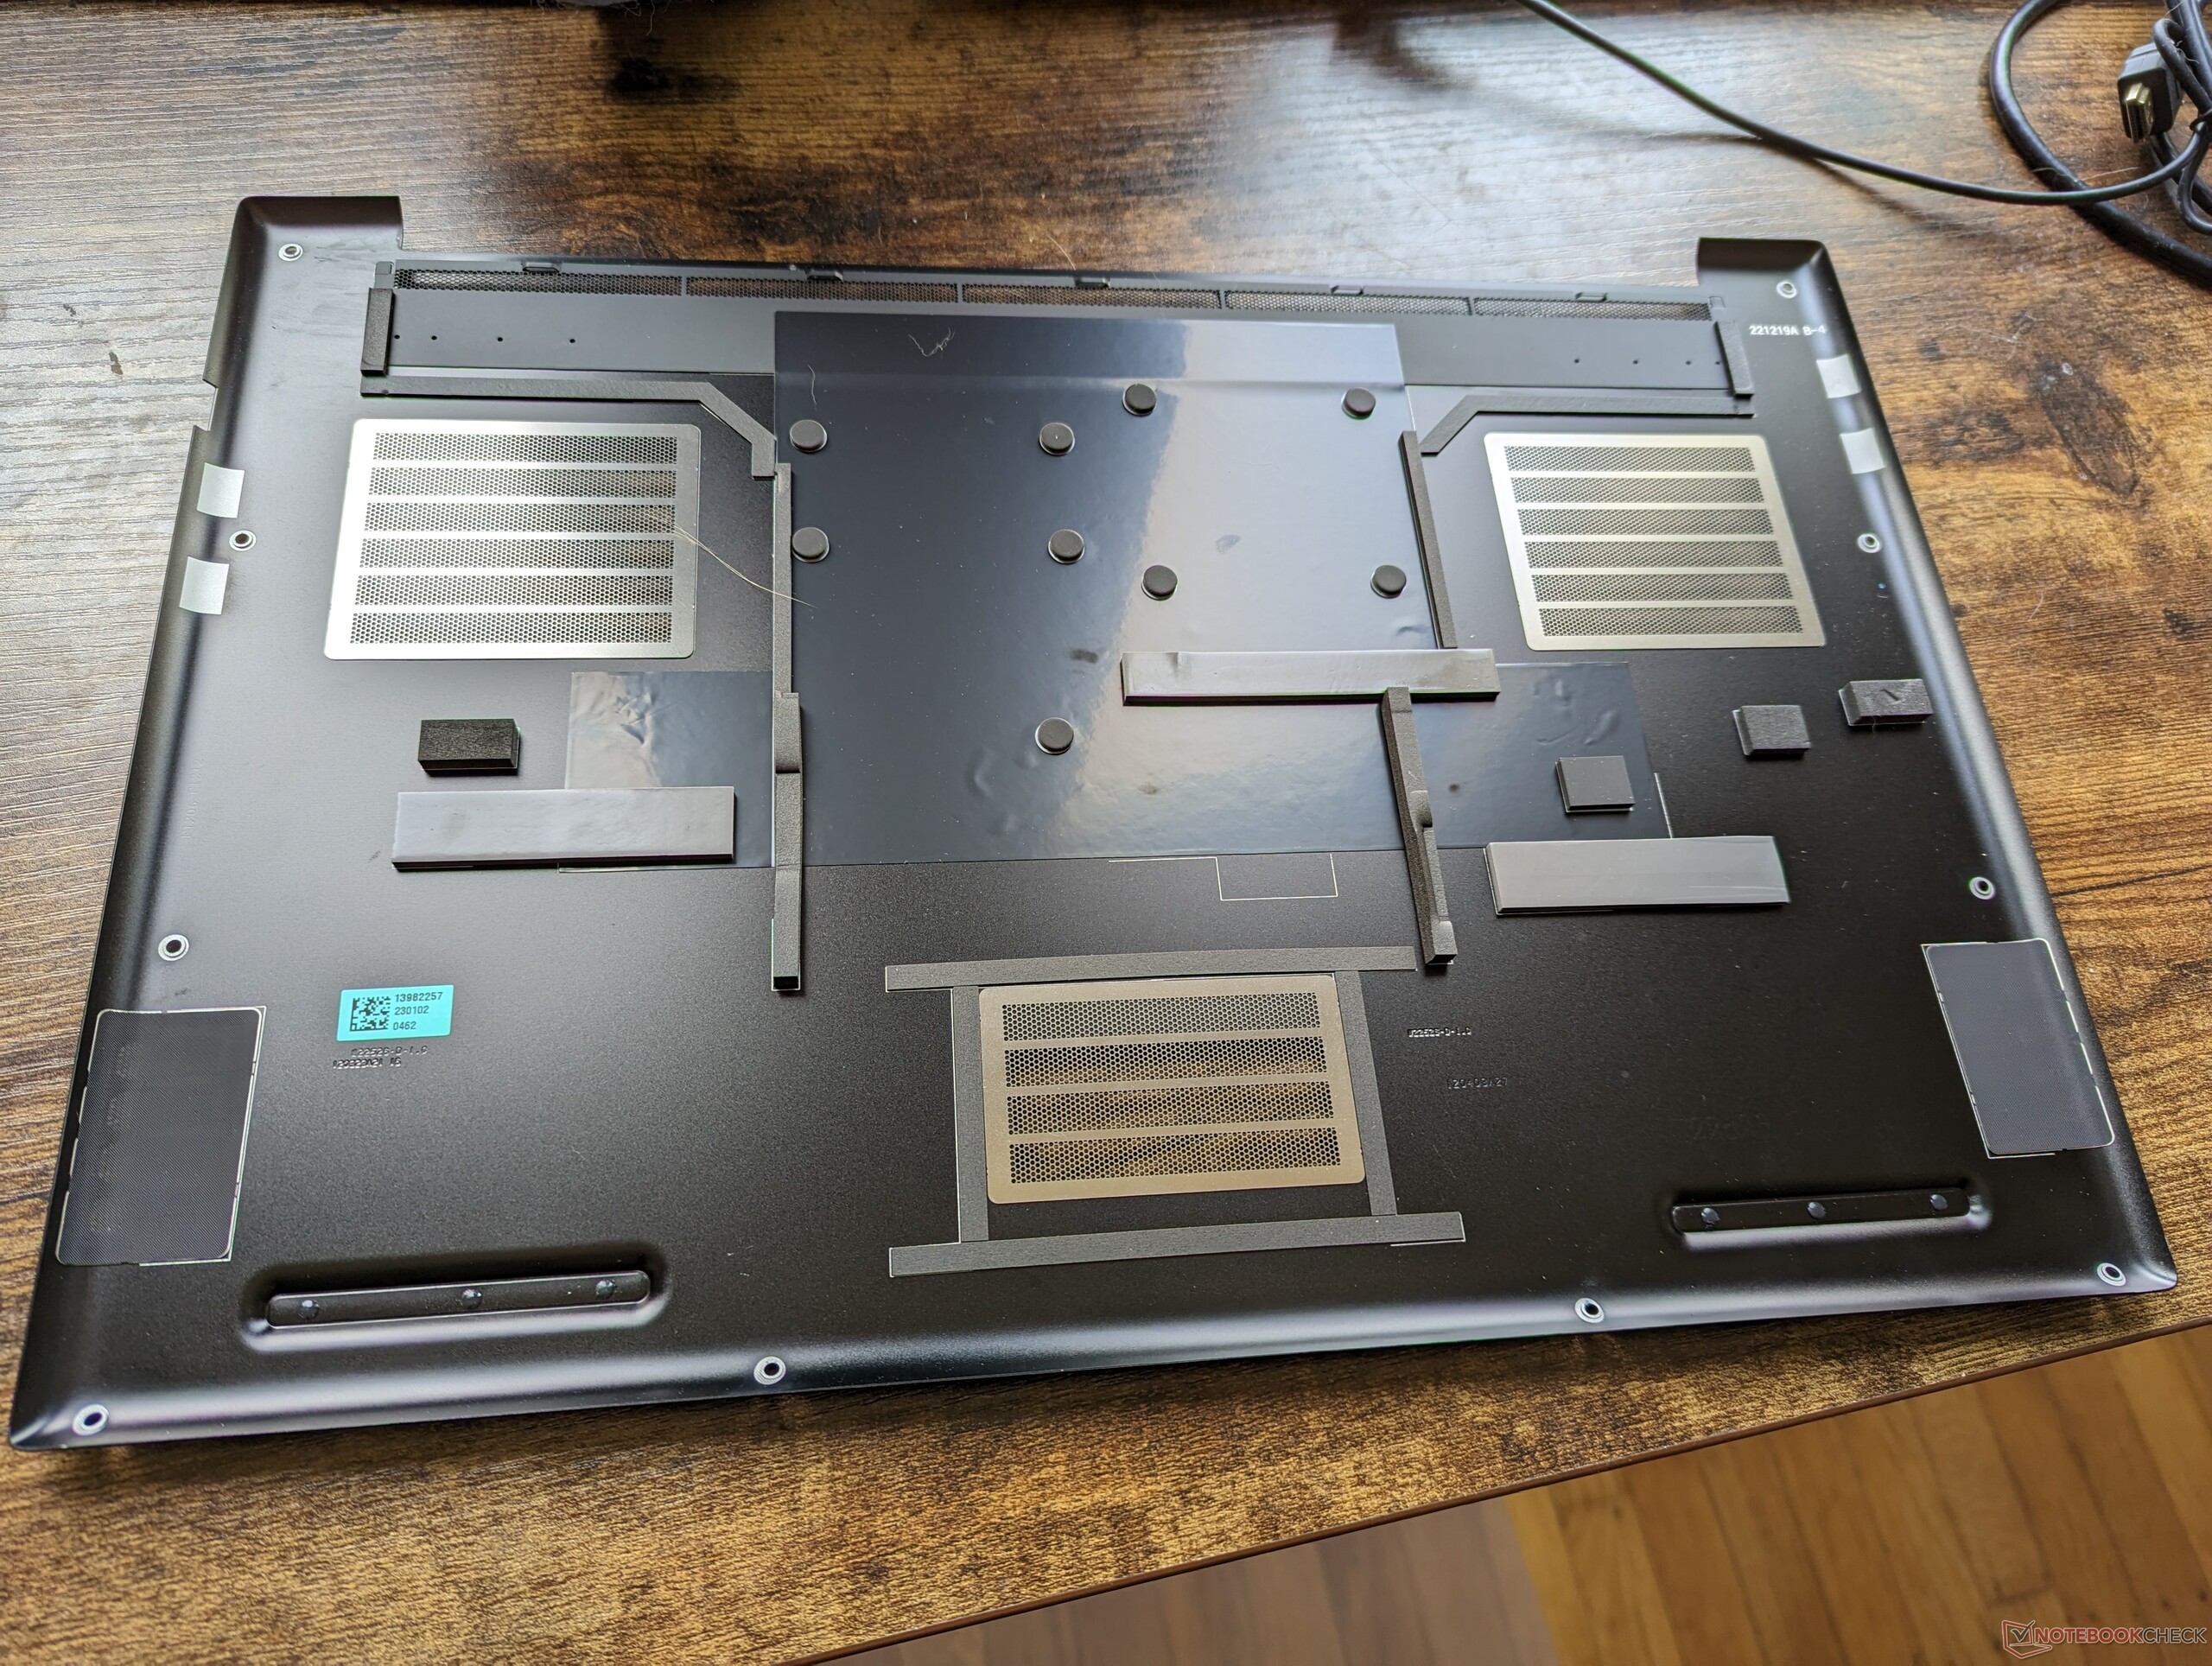
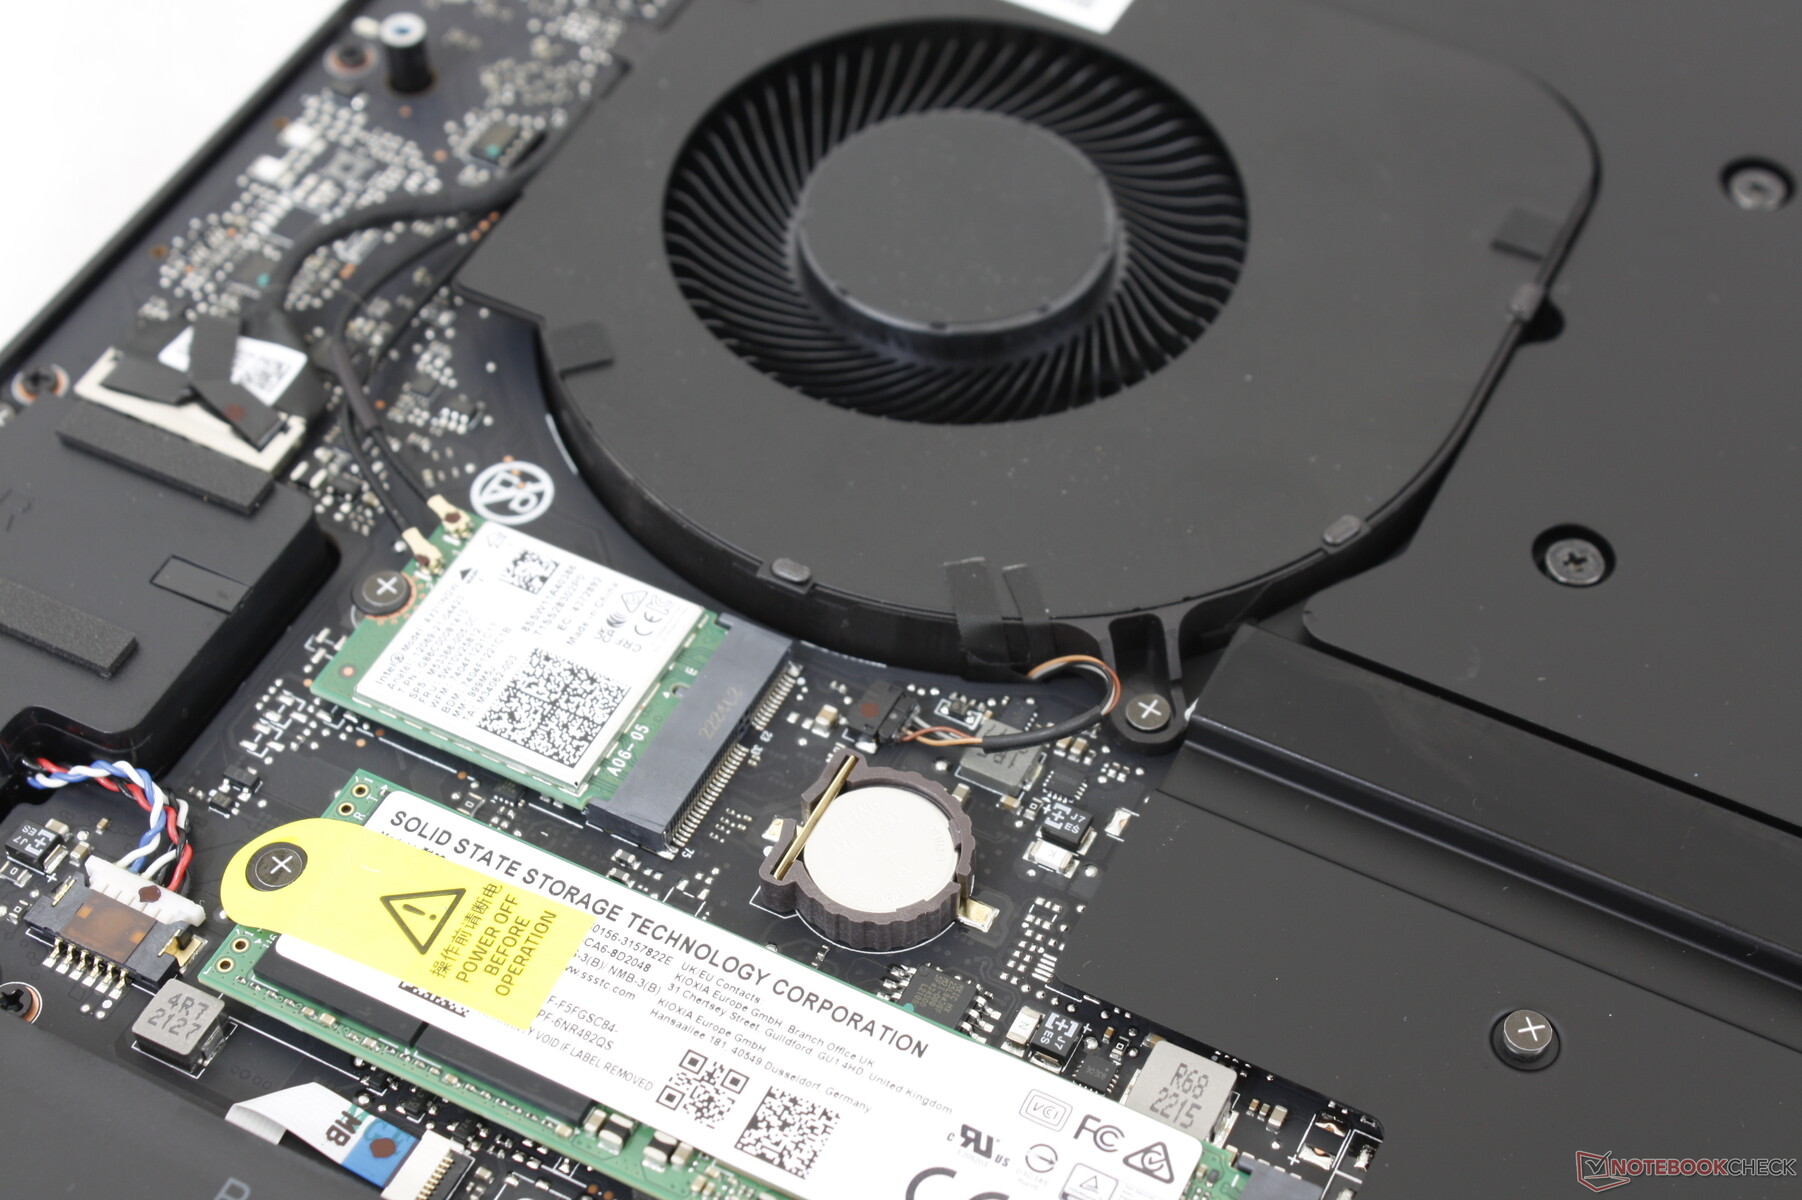
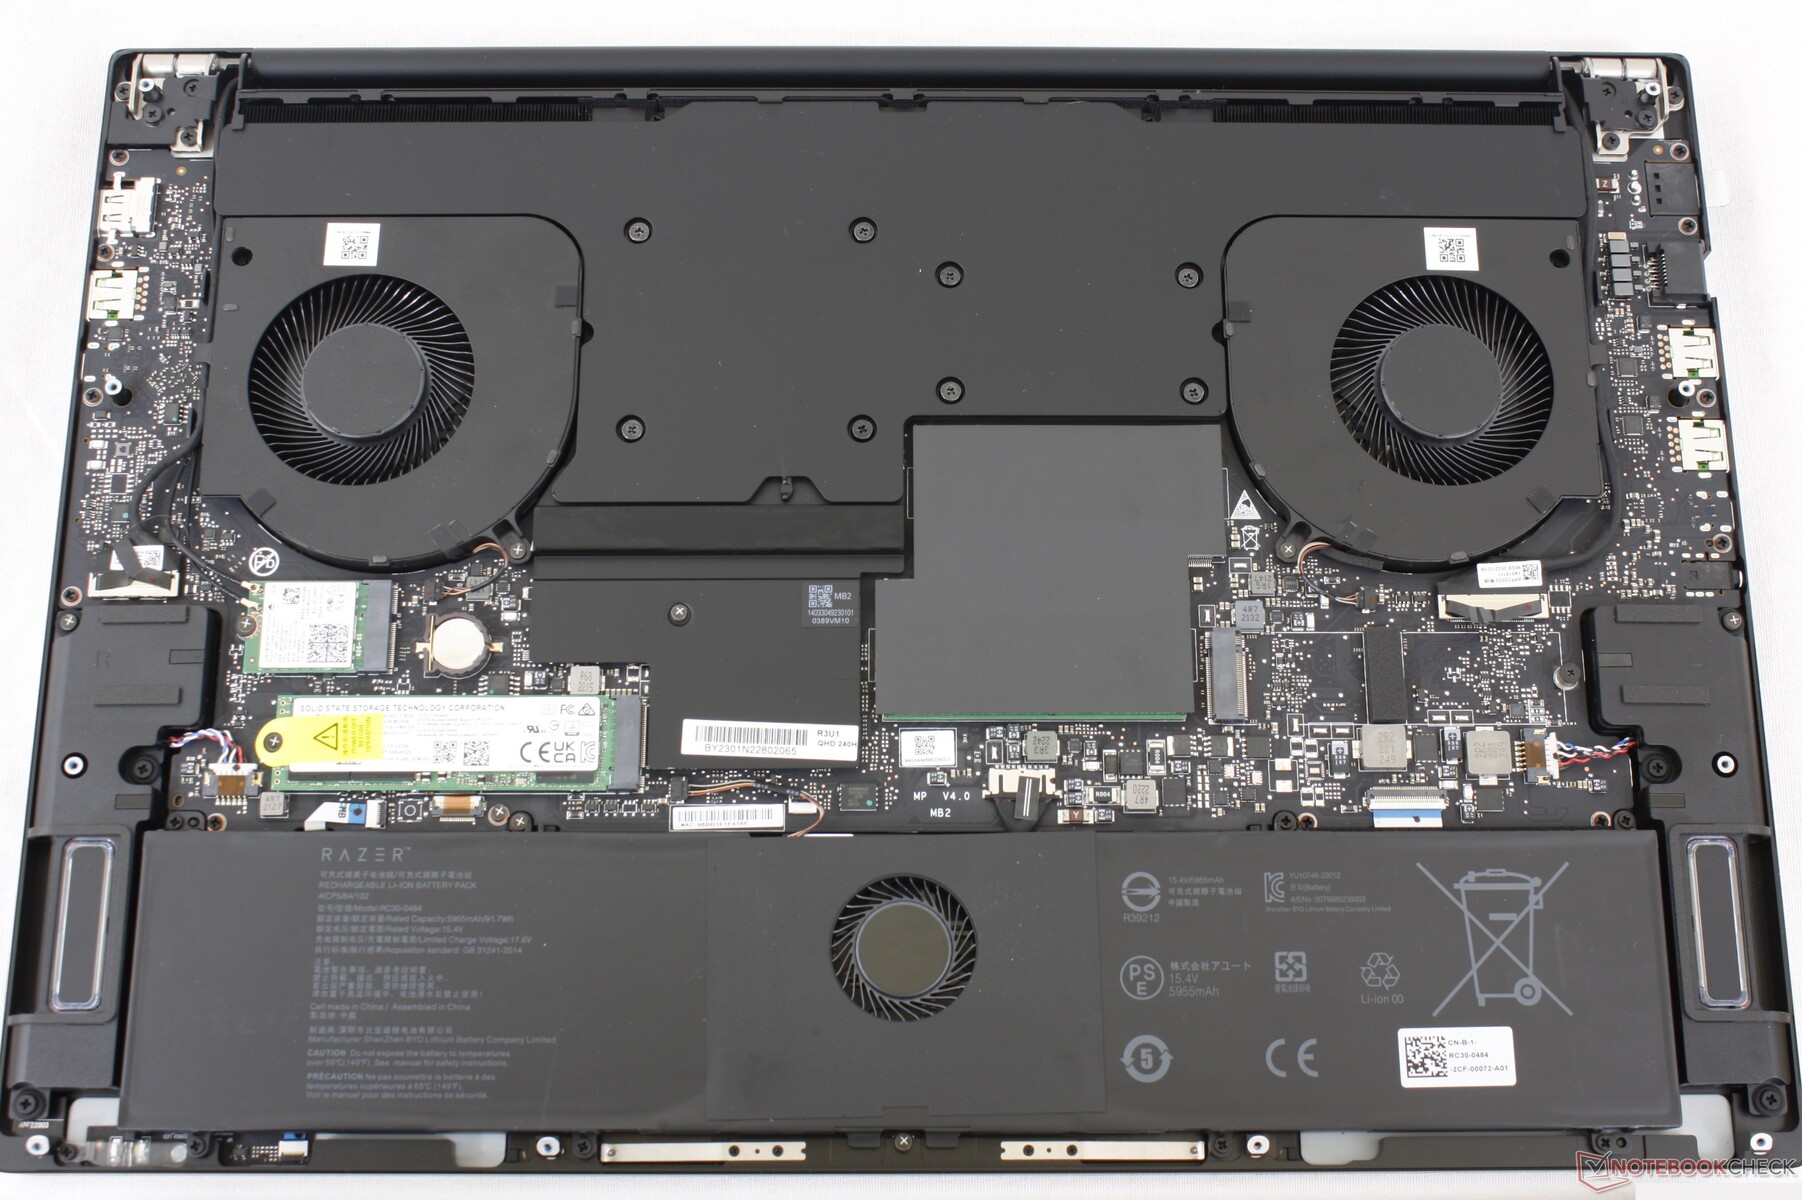
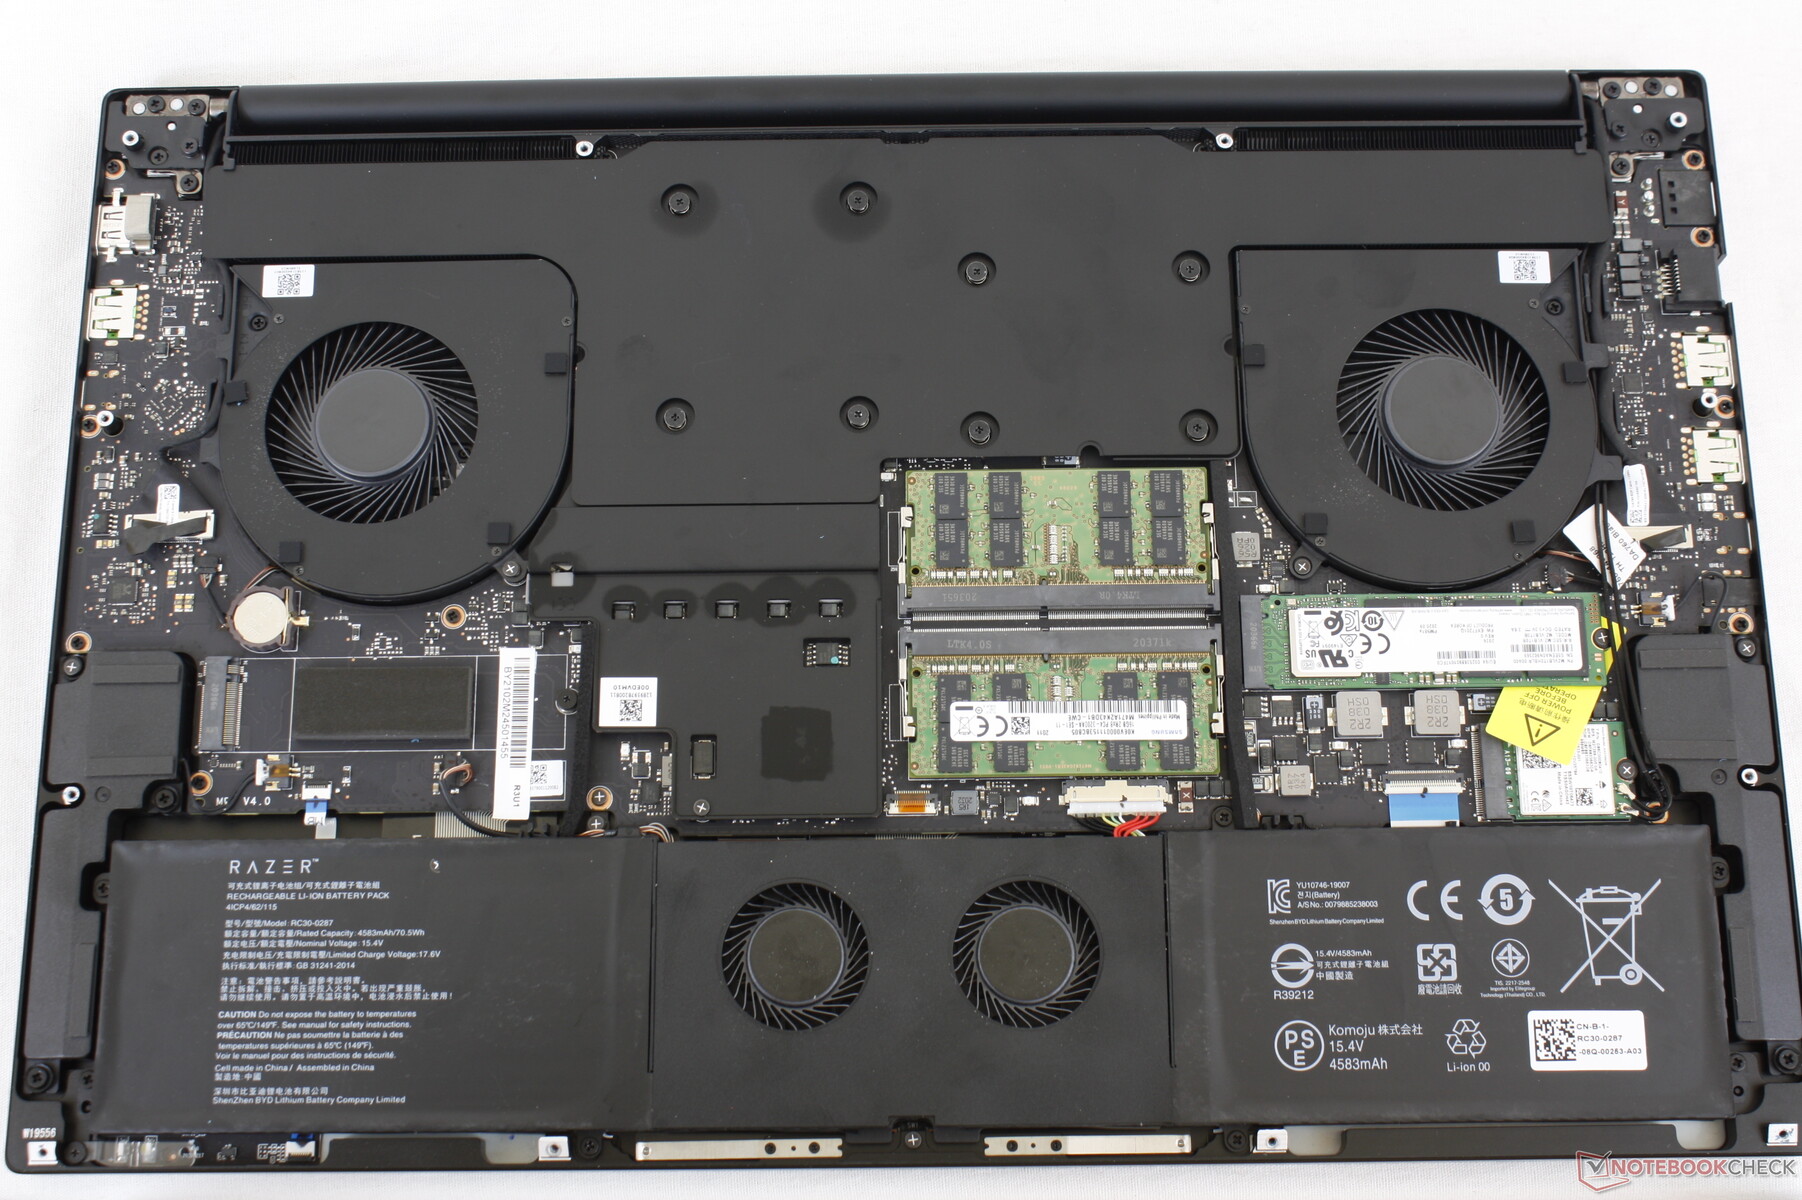
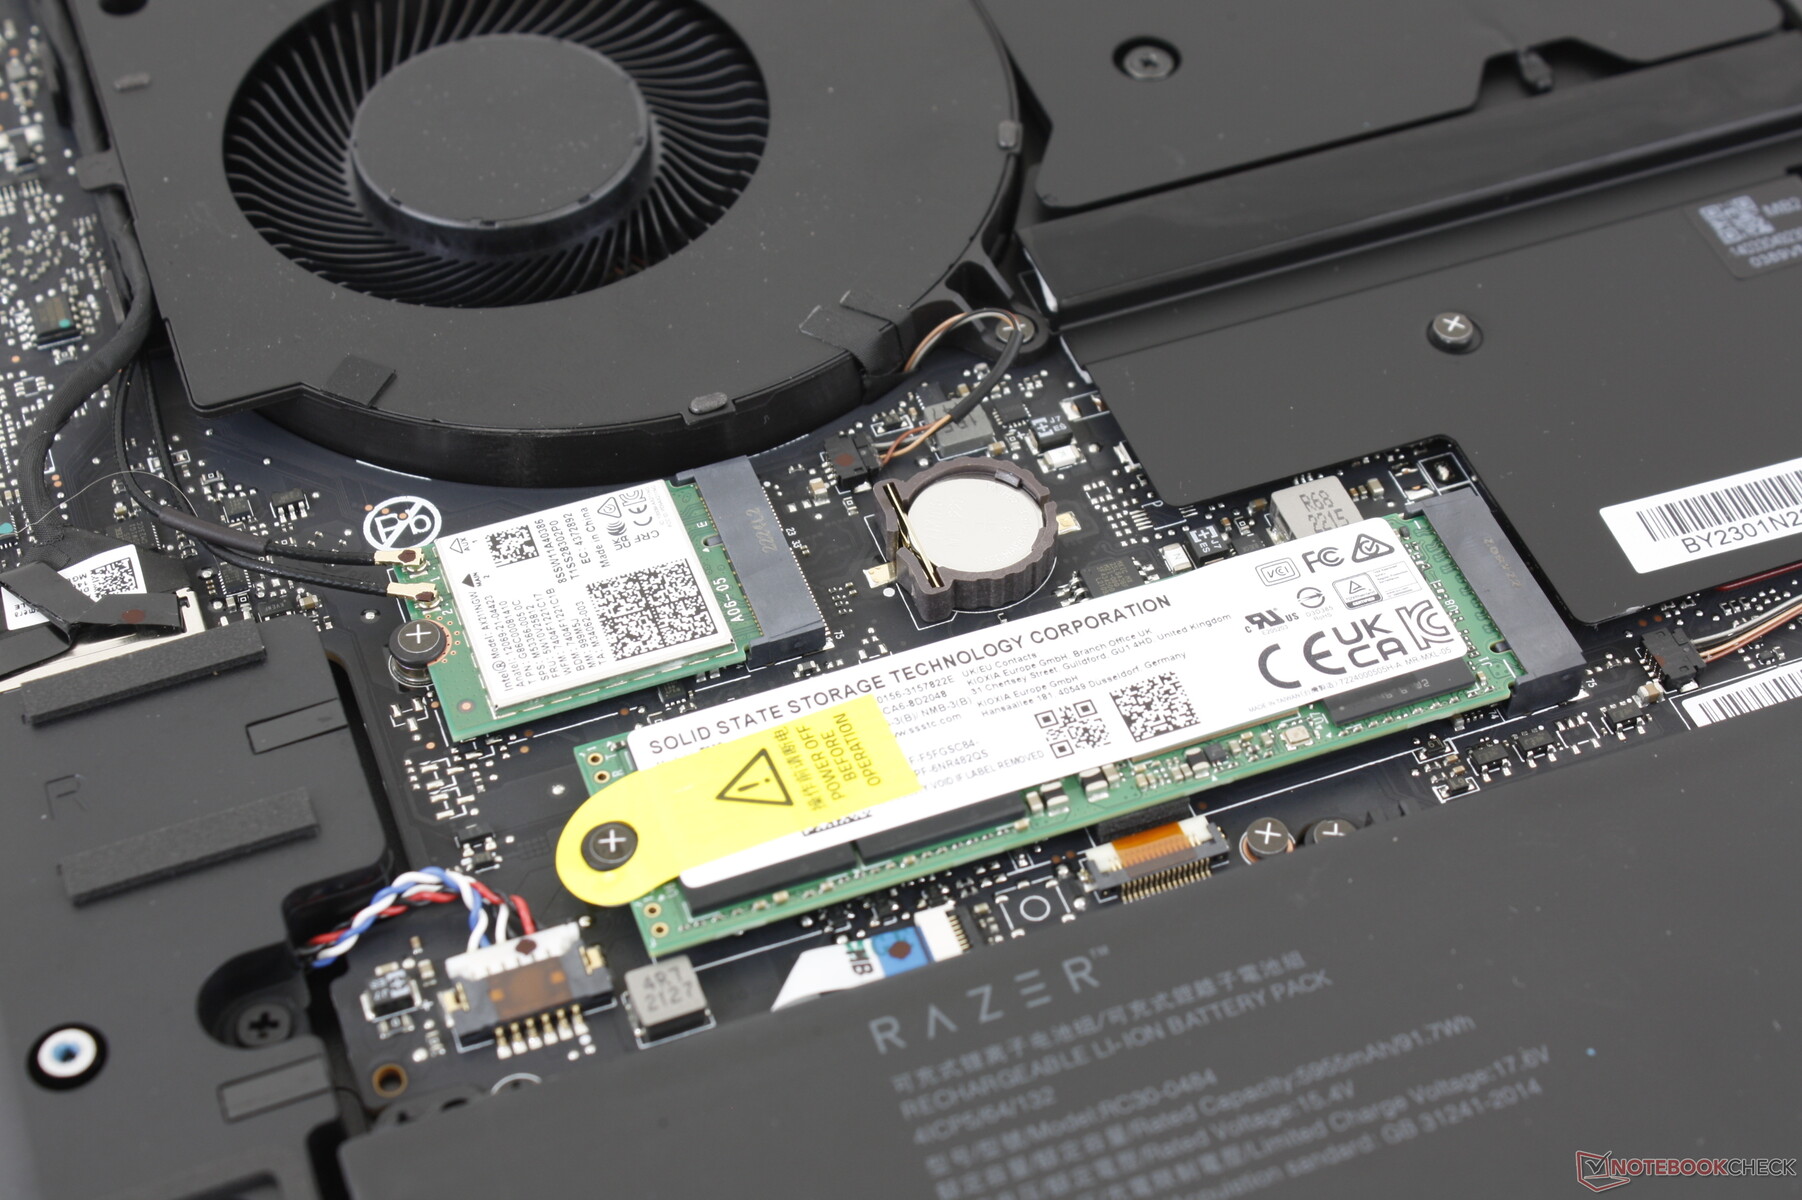
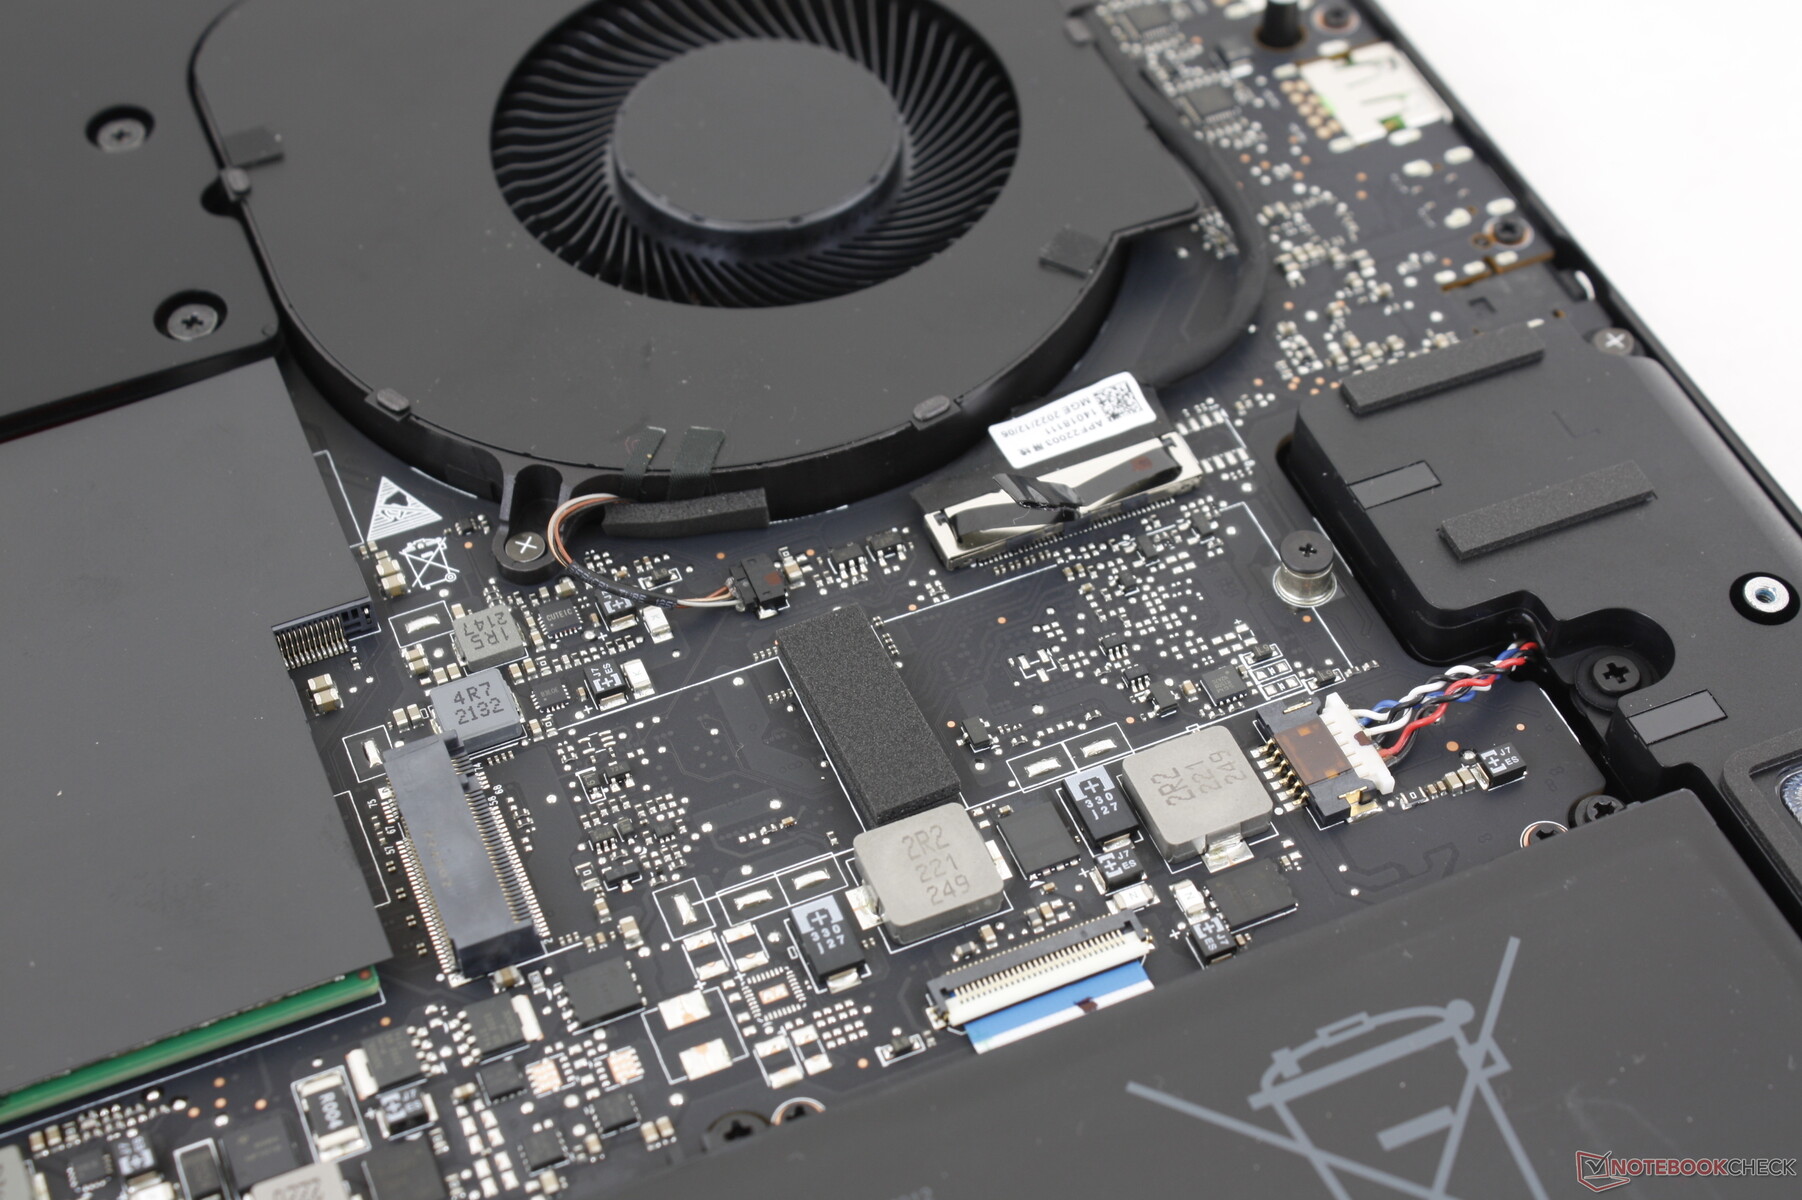
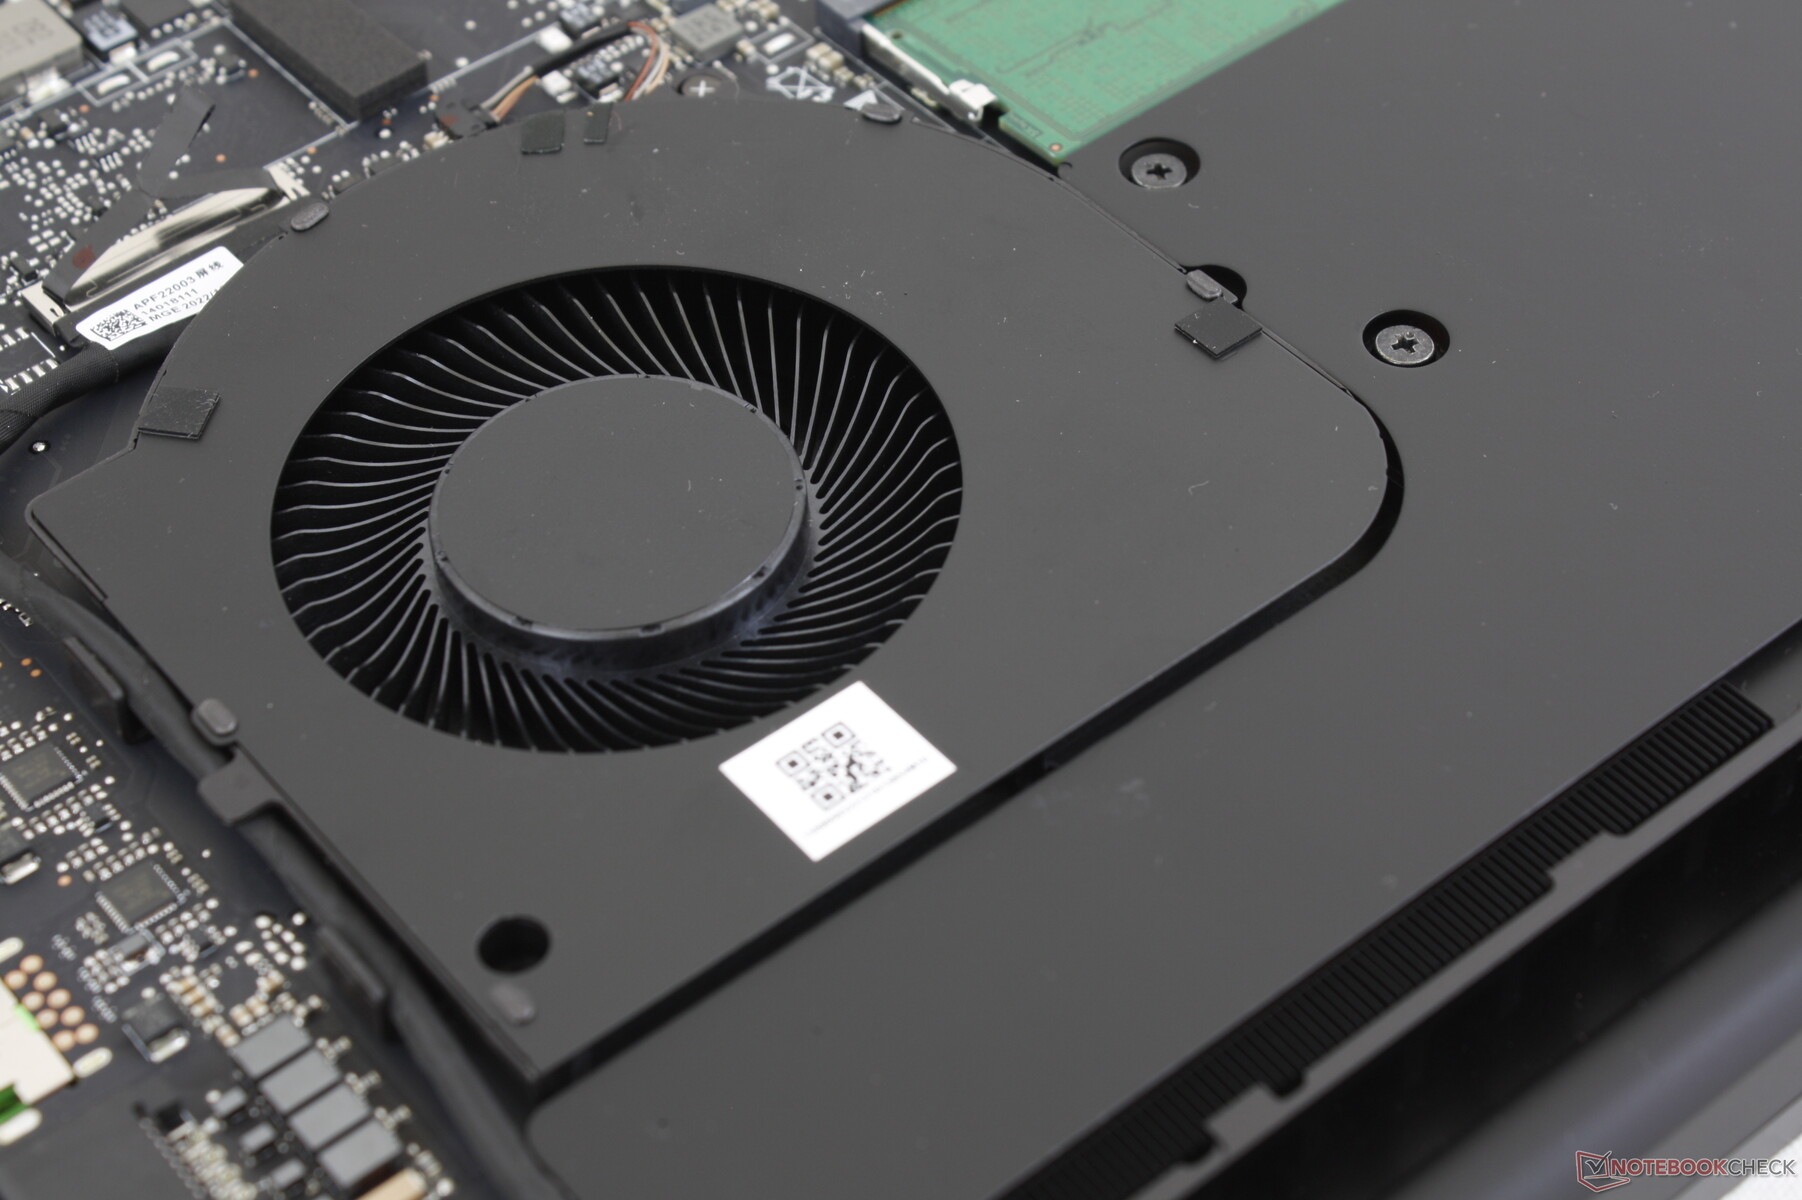
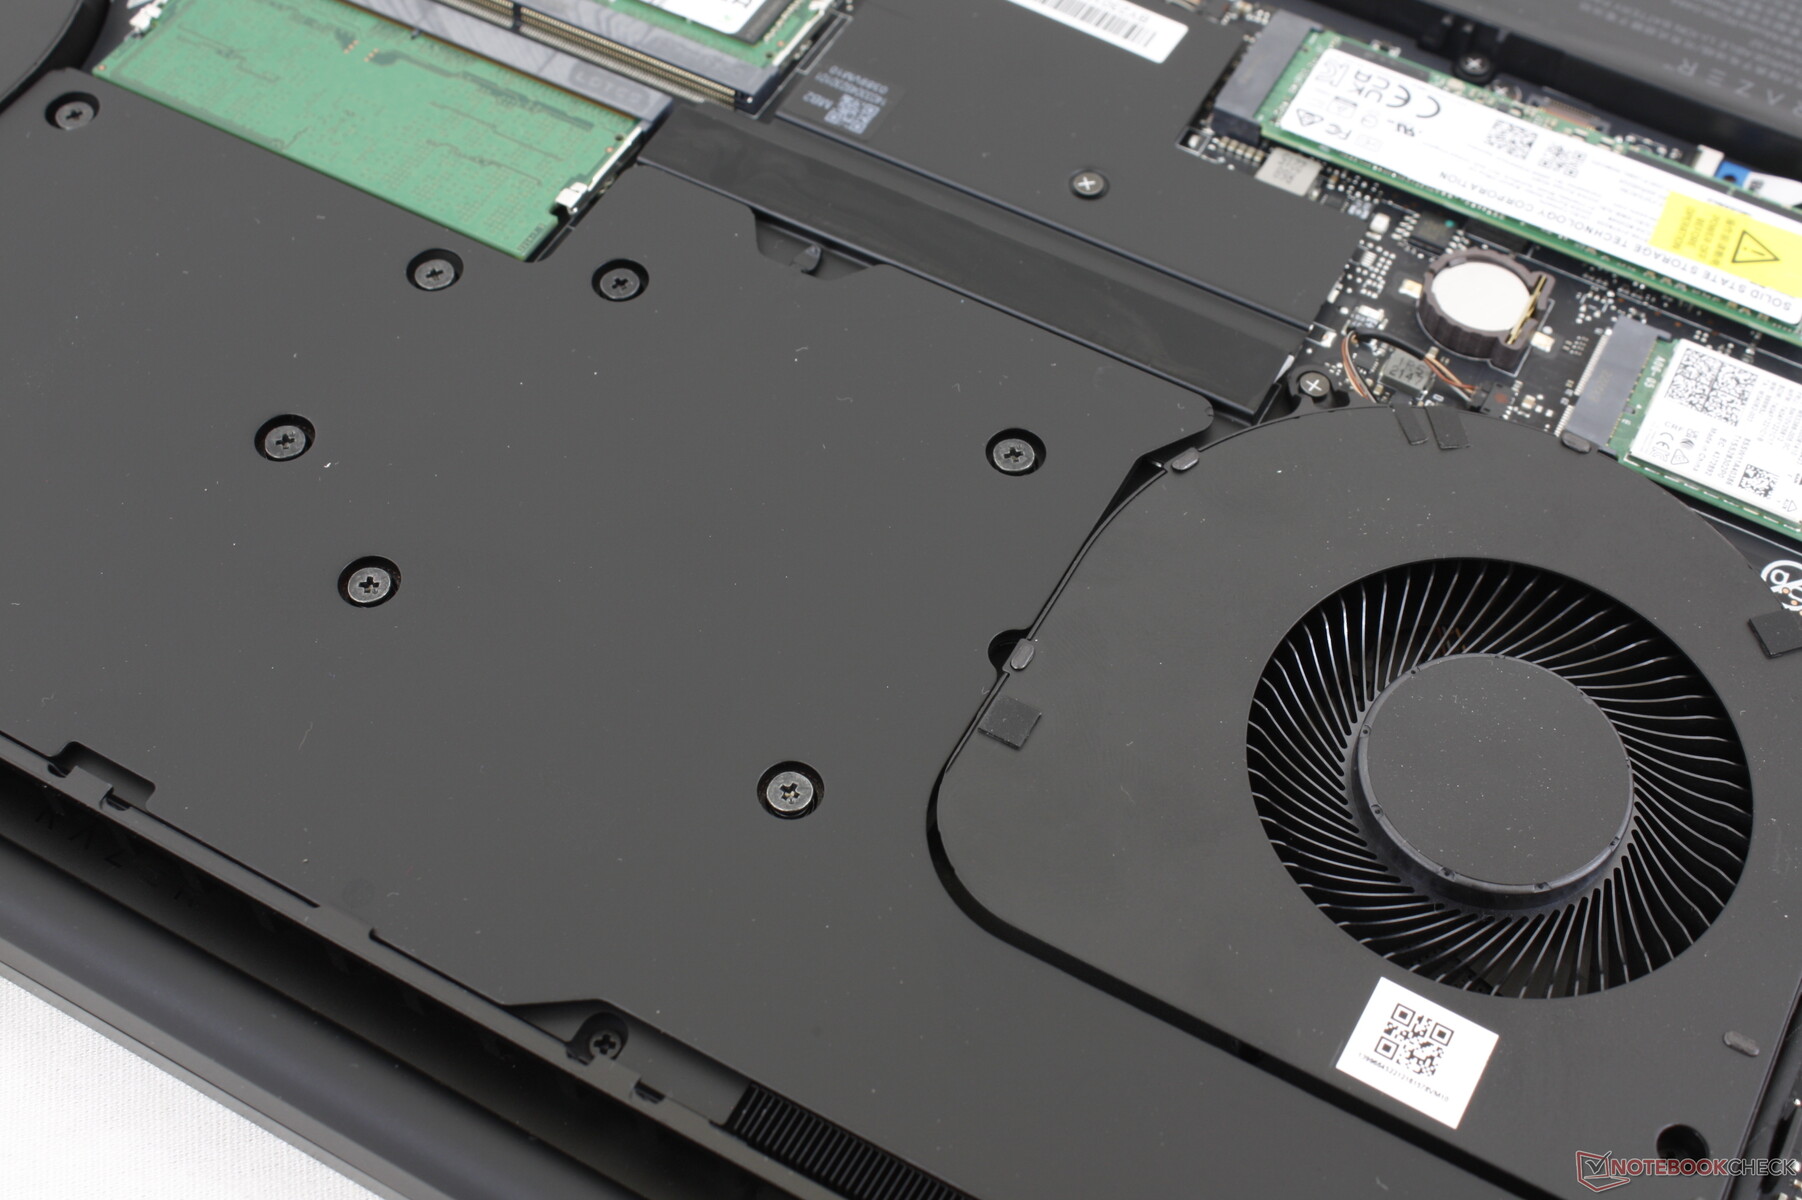
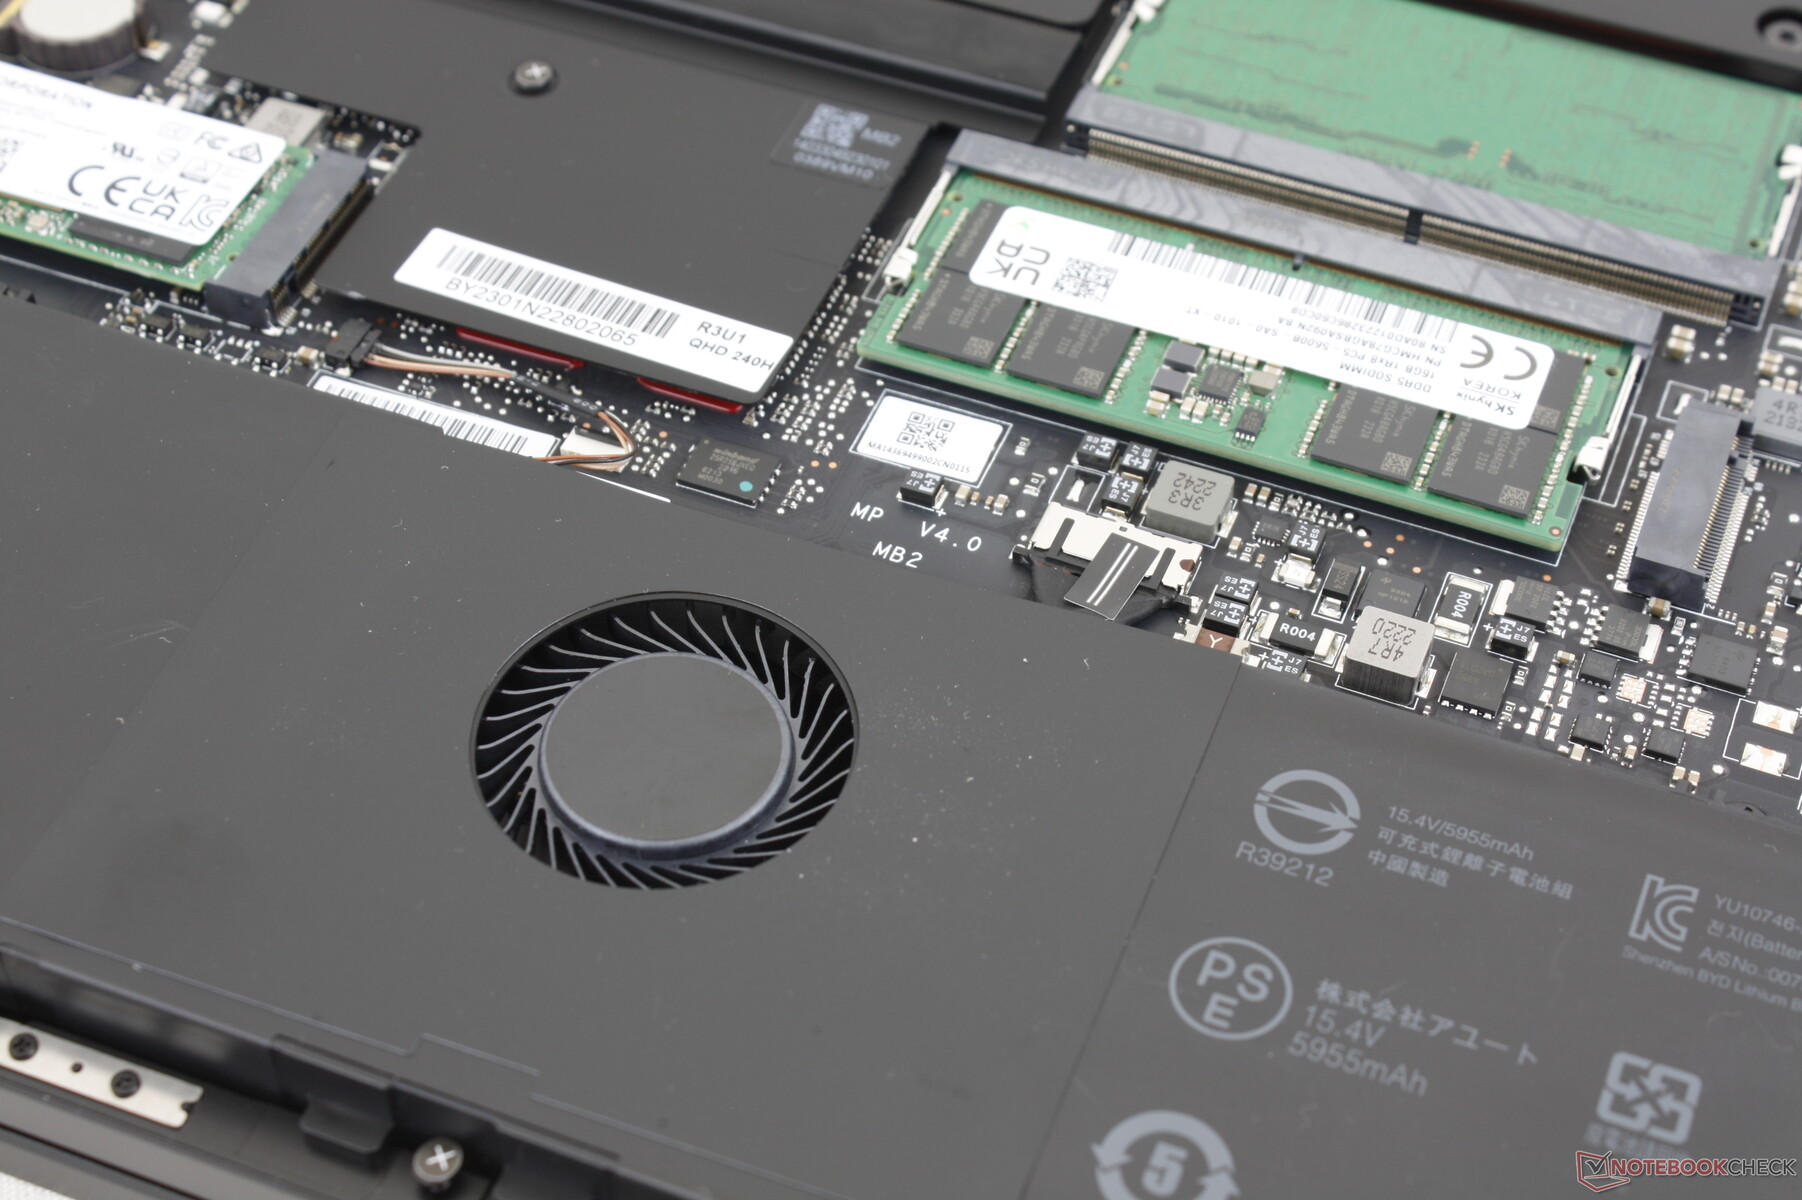
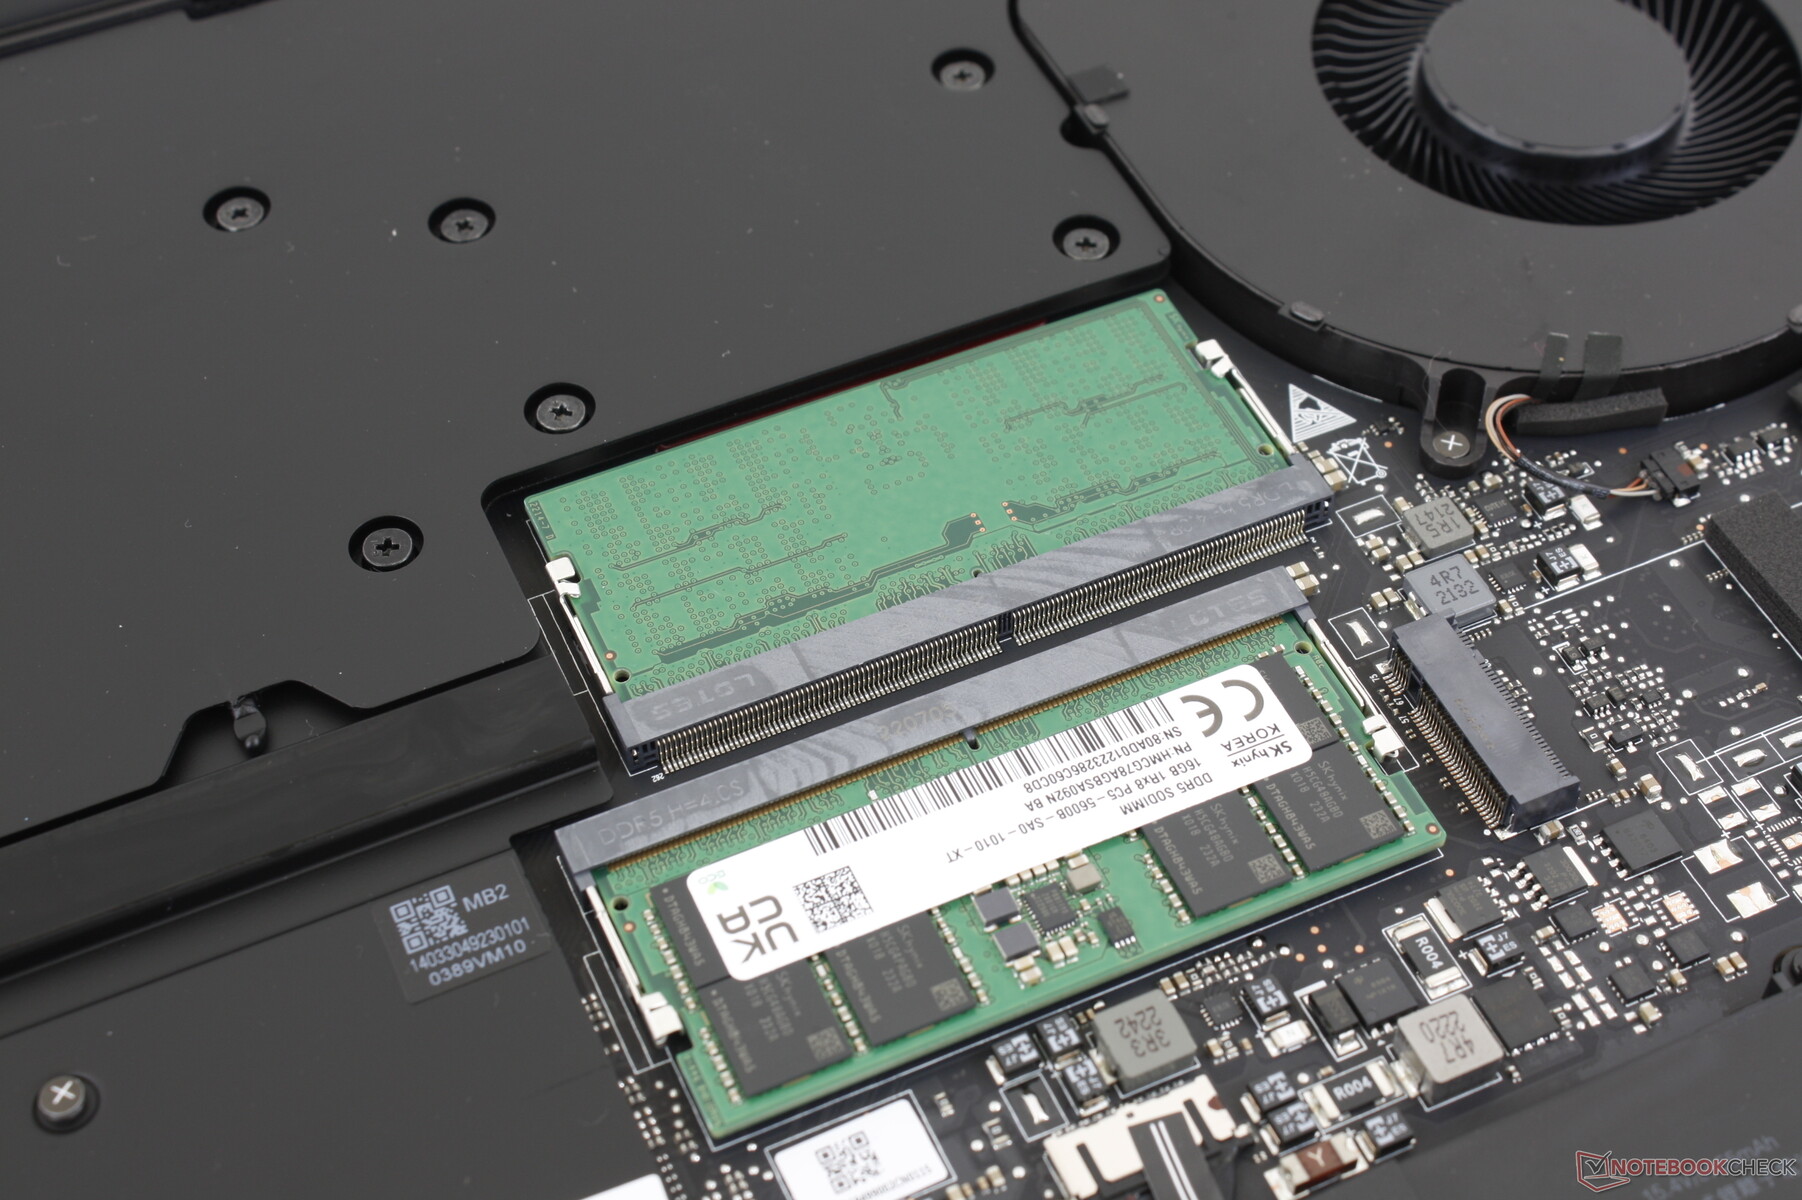
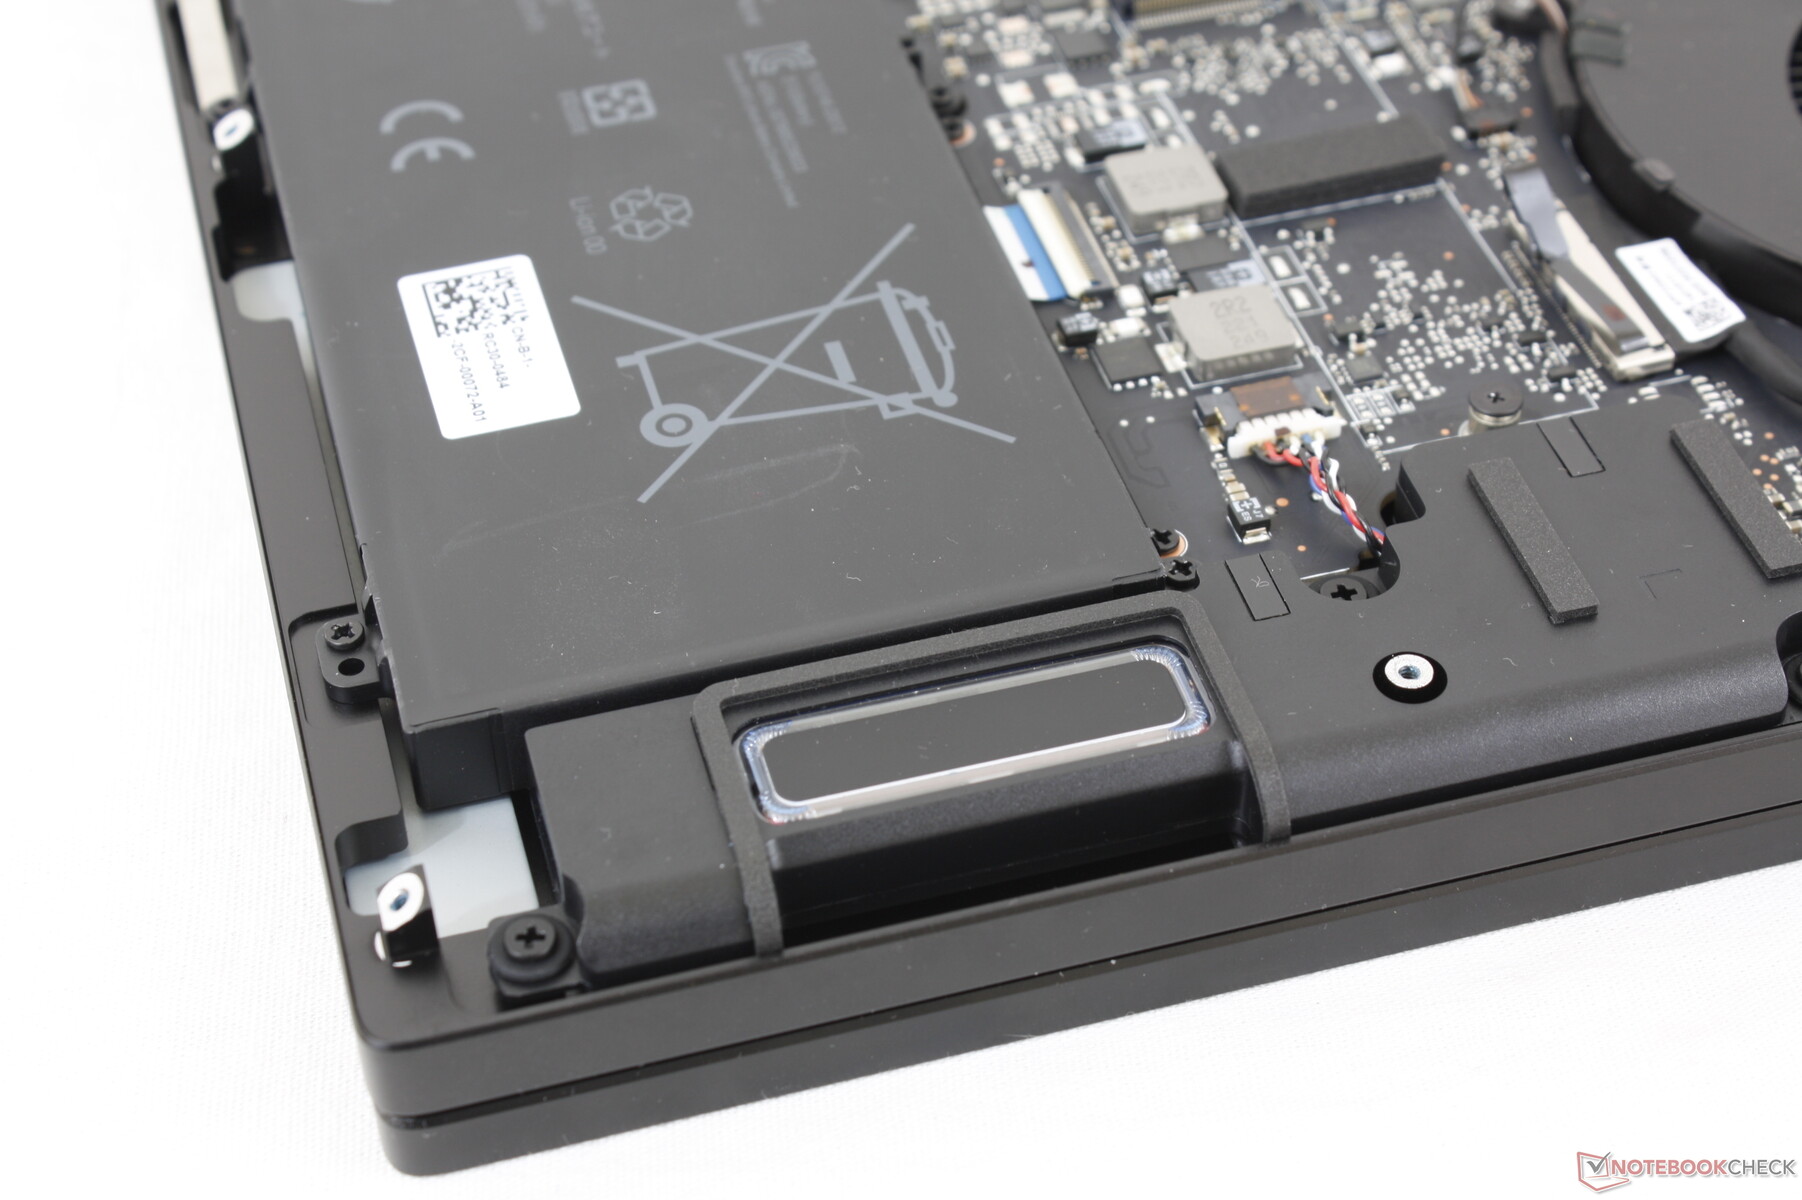
Underhåll
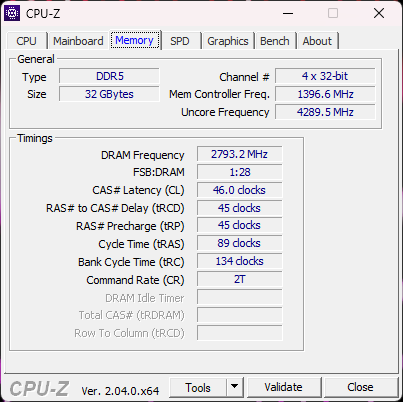
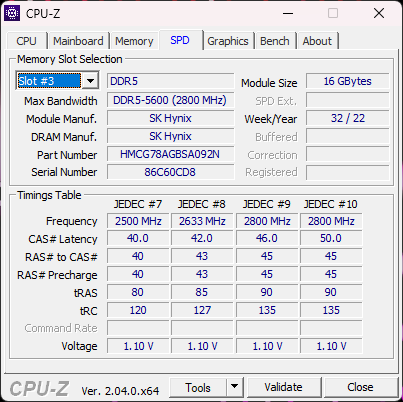
Bottenpanelen är säkrad med tio T5 Torx-skruvar för enkel service. Användarna har direkt tillgång till två M.2 2280 SSD-fack, två SODIMM-fack för upp till 32 GB DDR5-5600 eller 64 GB DDR5-5200 och den avtagbara WLAN-modulen. Mest anmärkningsvärt är att den nuvarande Blade 18-designen innehåller en extra fläkt direkt under klickplattan i likhet med äldre Blade 17-designs.
Tillbehör och garanti
Det finns inga extrafunktioner i förpackningen. En ettårig begränsad tillverkargaranti gäller medan det interna batteriet har en separat tvåårig garanti om det köps i USA.
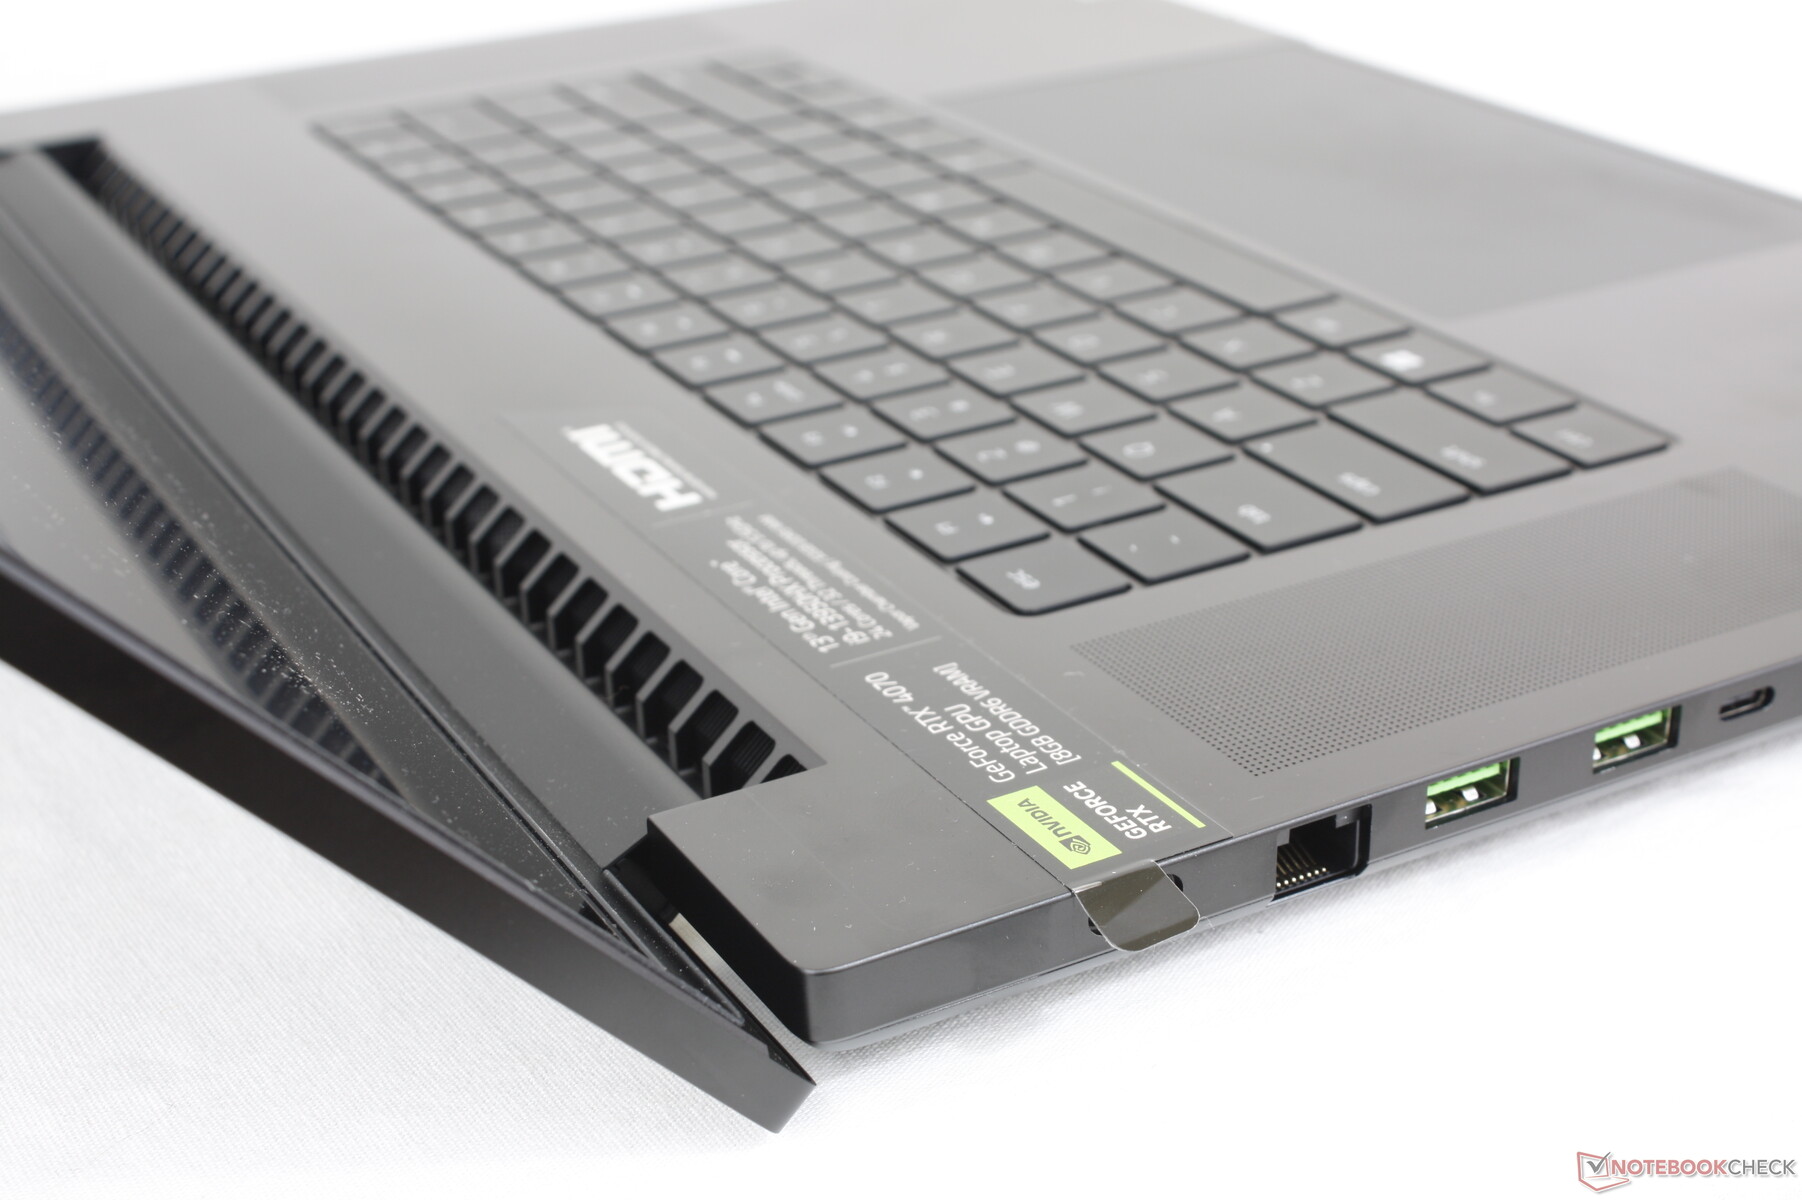
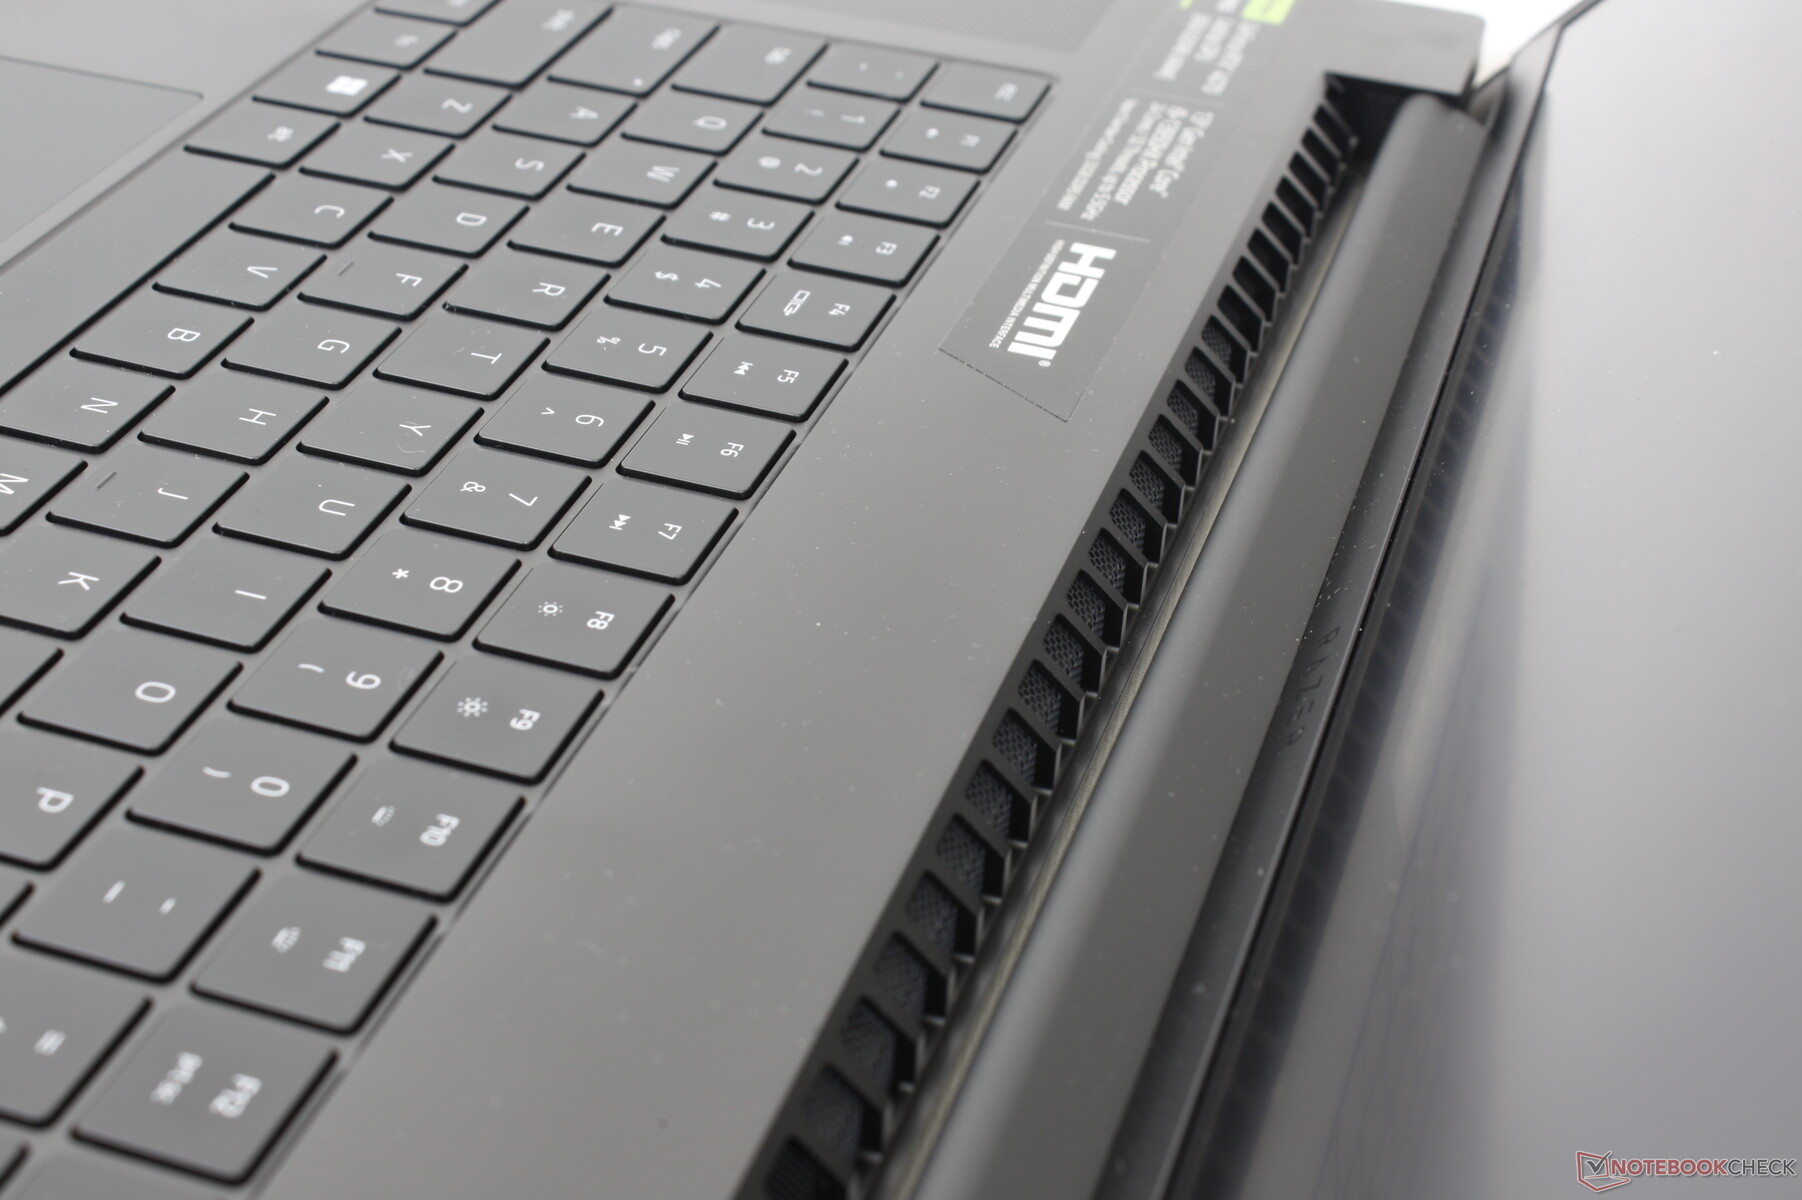
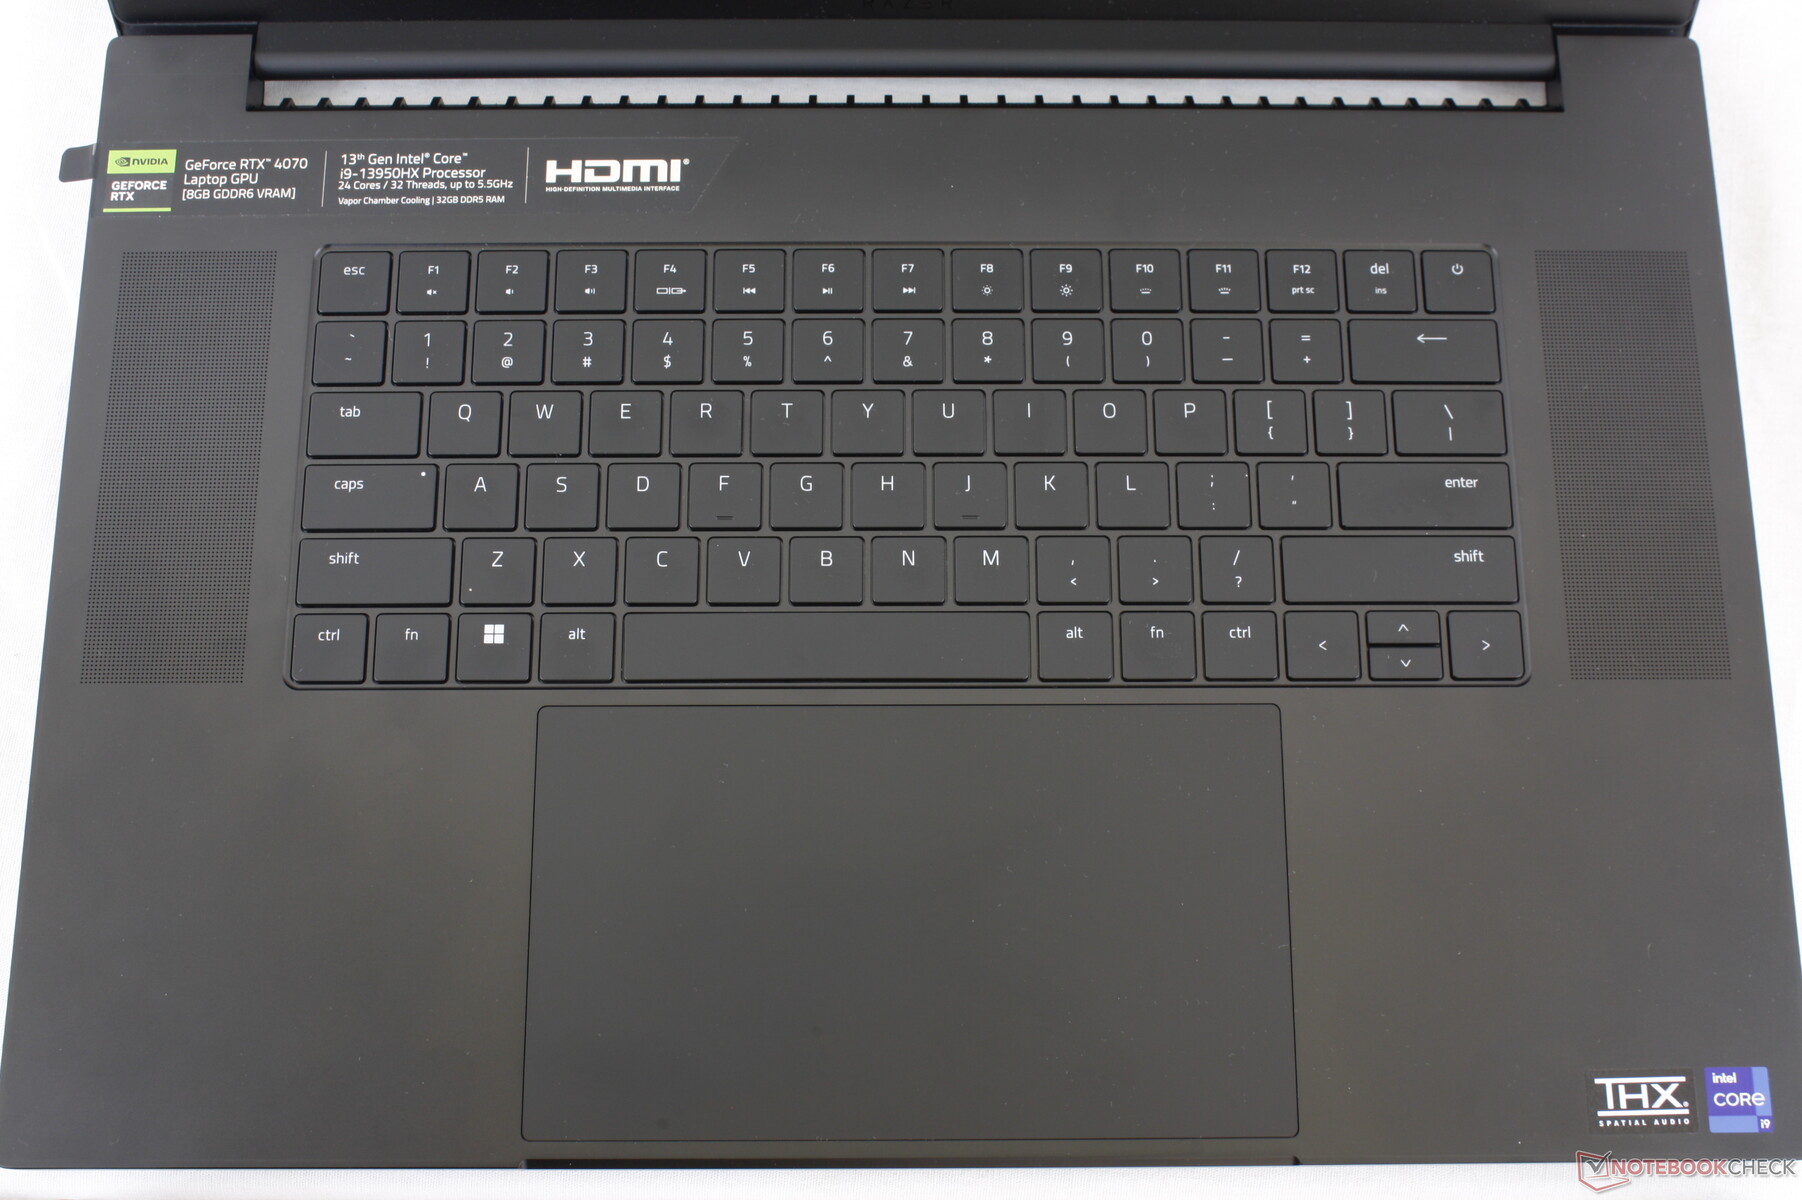
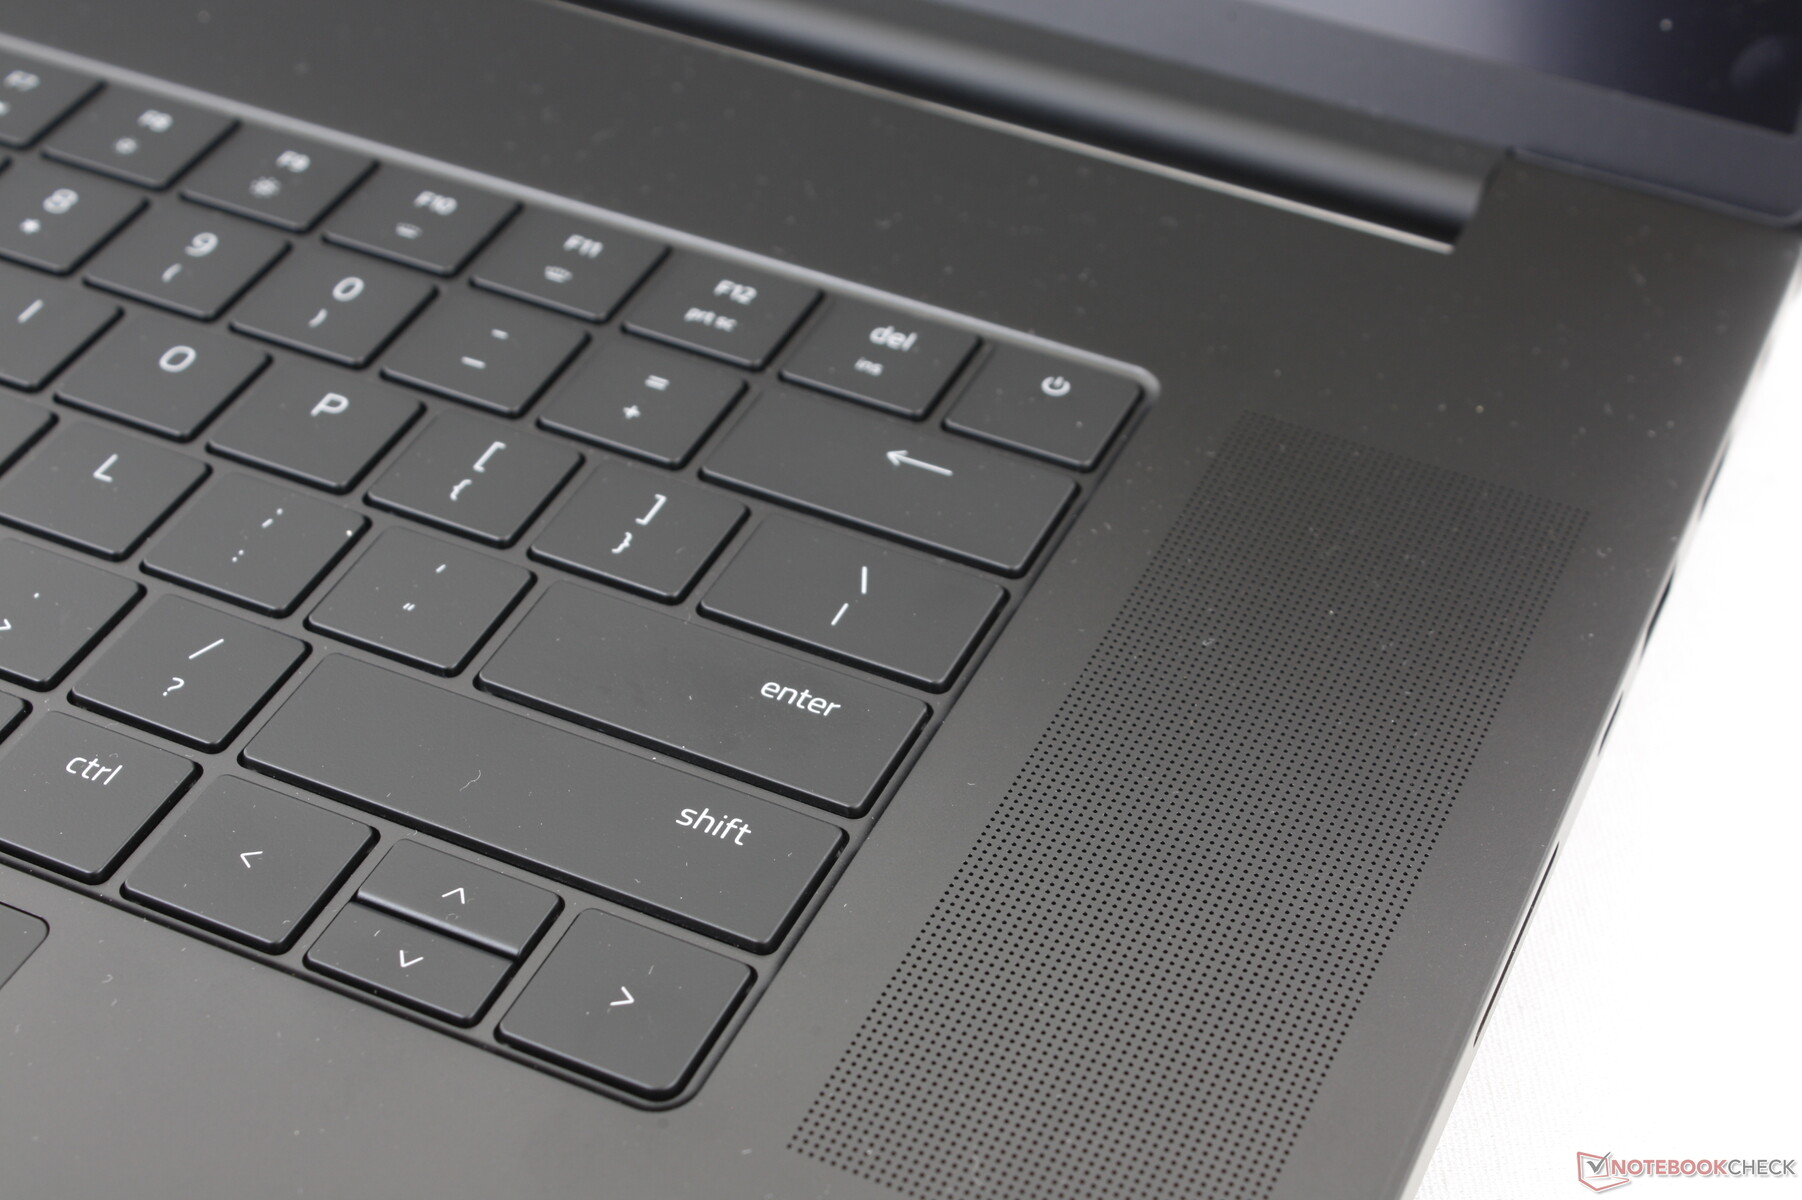
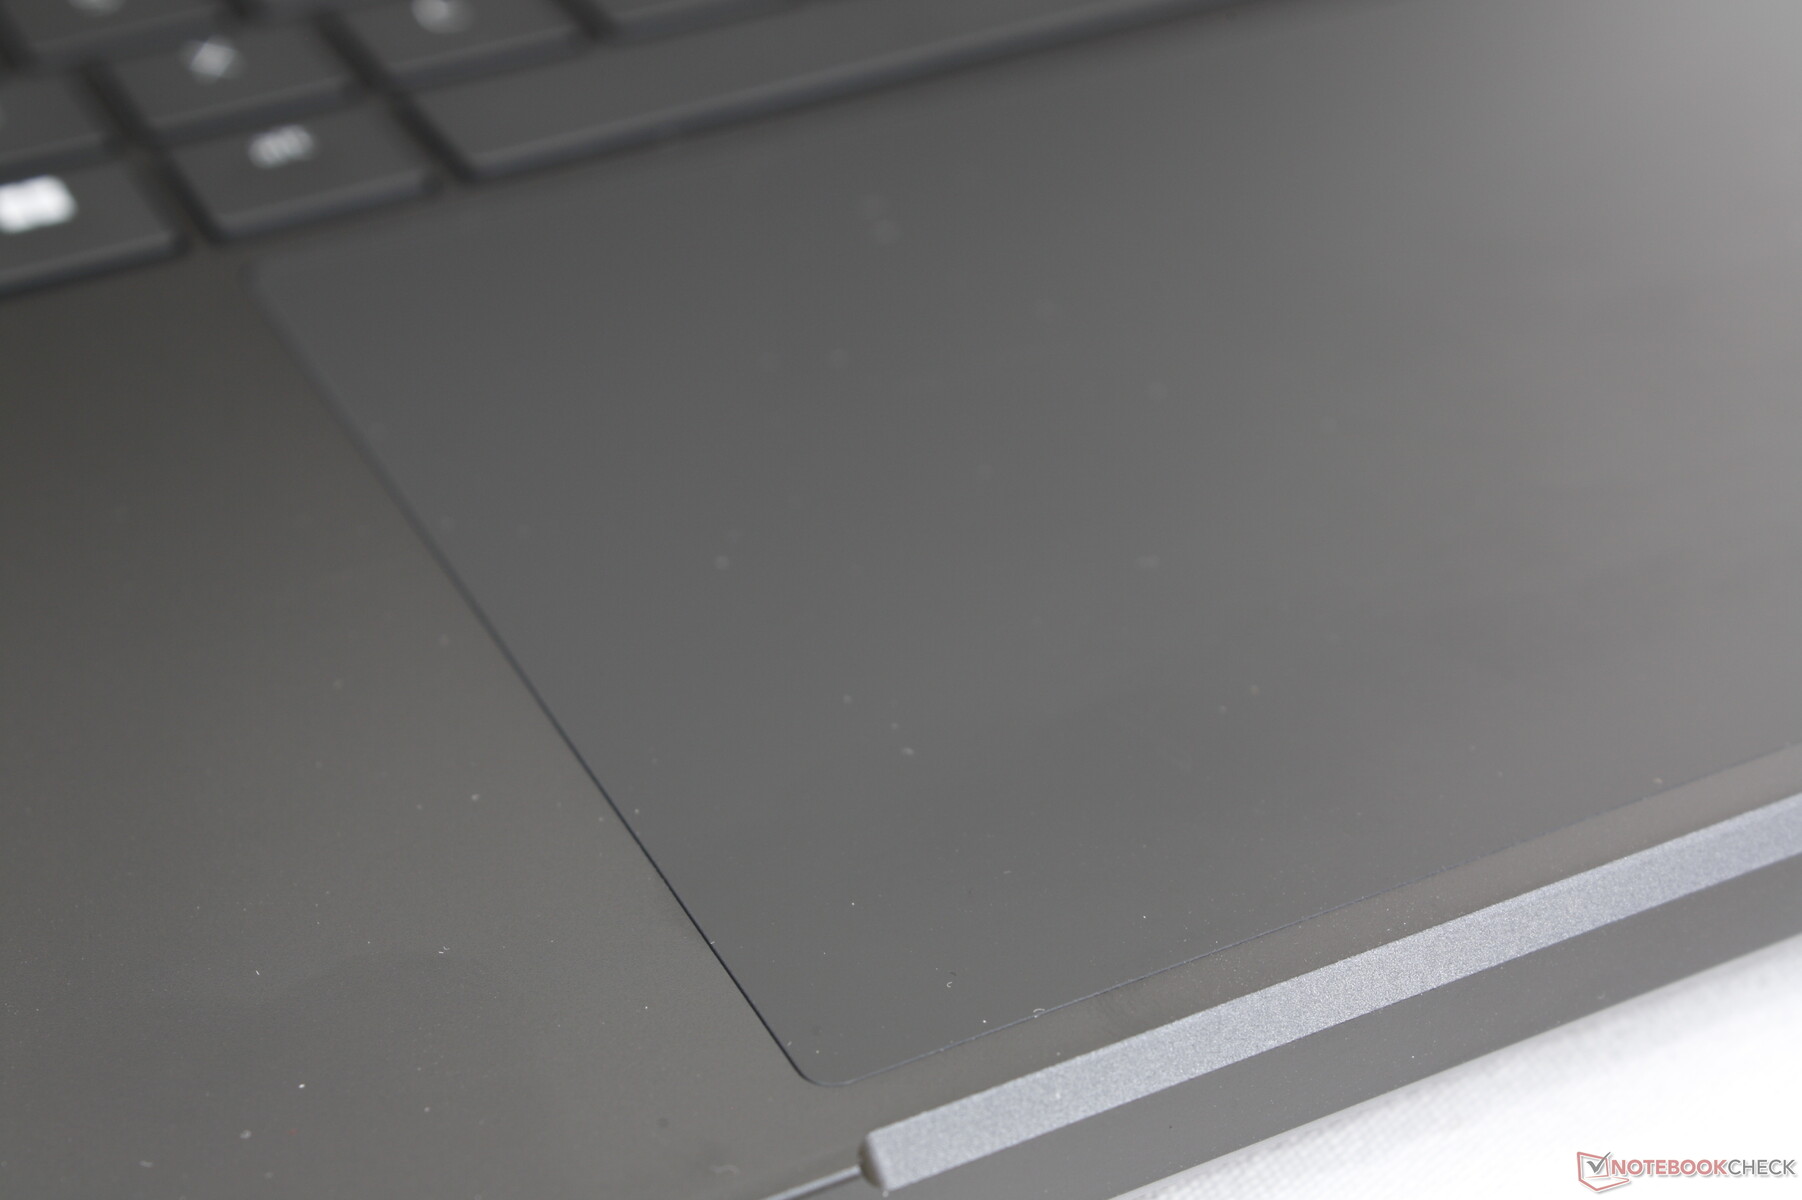
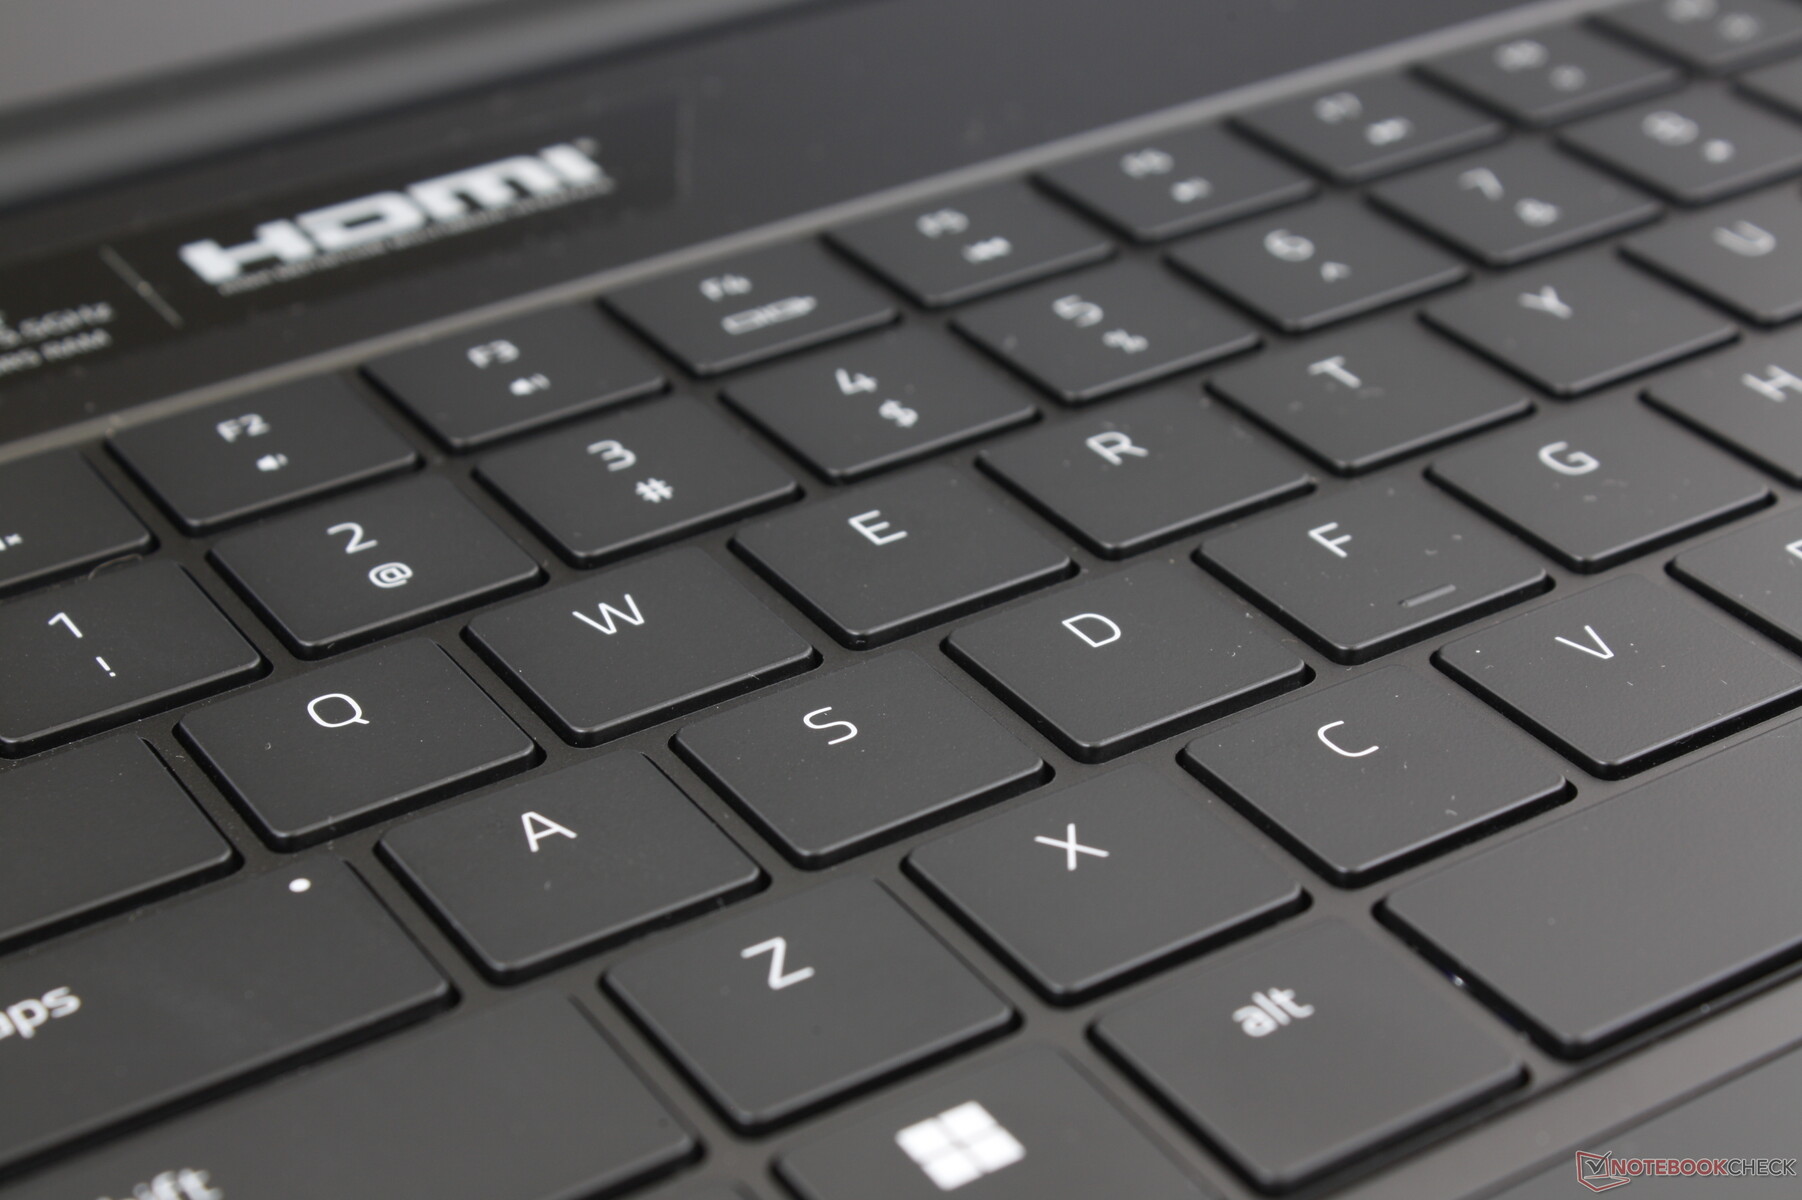
Inmatningsenheter - identiska med Blade 16
Tangentbord och pekplatta
Både tangentbordet och klickplattan är desamma som på Blade 16, trots att skärmen skiljer sig åt mellan de två modellerna. Till och med måtten på klickplattan (17 x 9,7 cm) och tangentbordet har inte ändrats och därför har vår befintliga kommentarer om skrivupplevelsen på Blade 16 gäller här på Blade 18. Det är synd att Razer inte utnyttjade den extra ytan för större piltangenter eller en potentiell numpad.
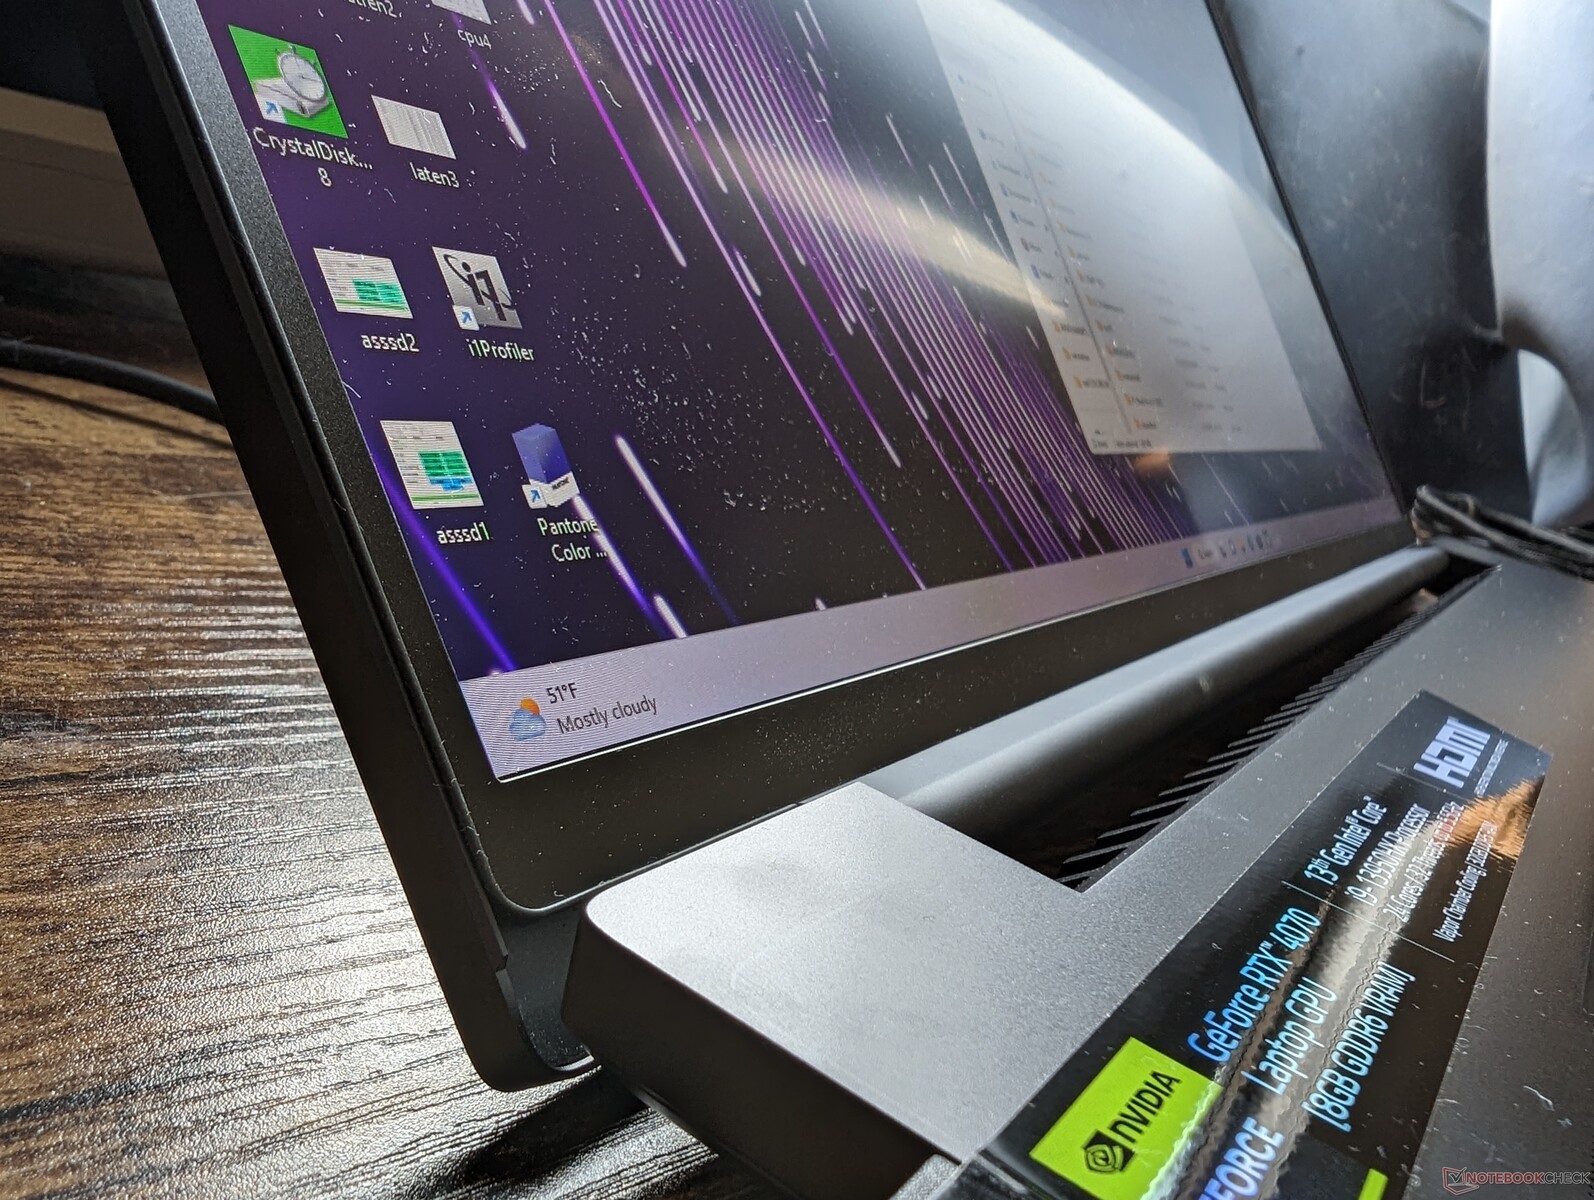
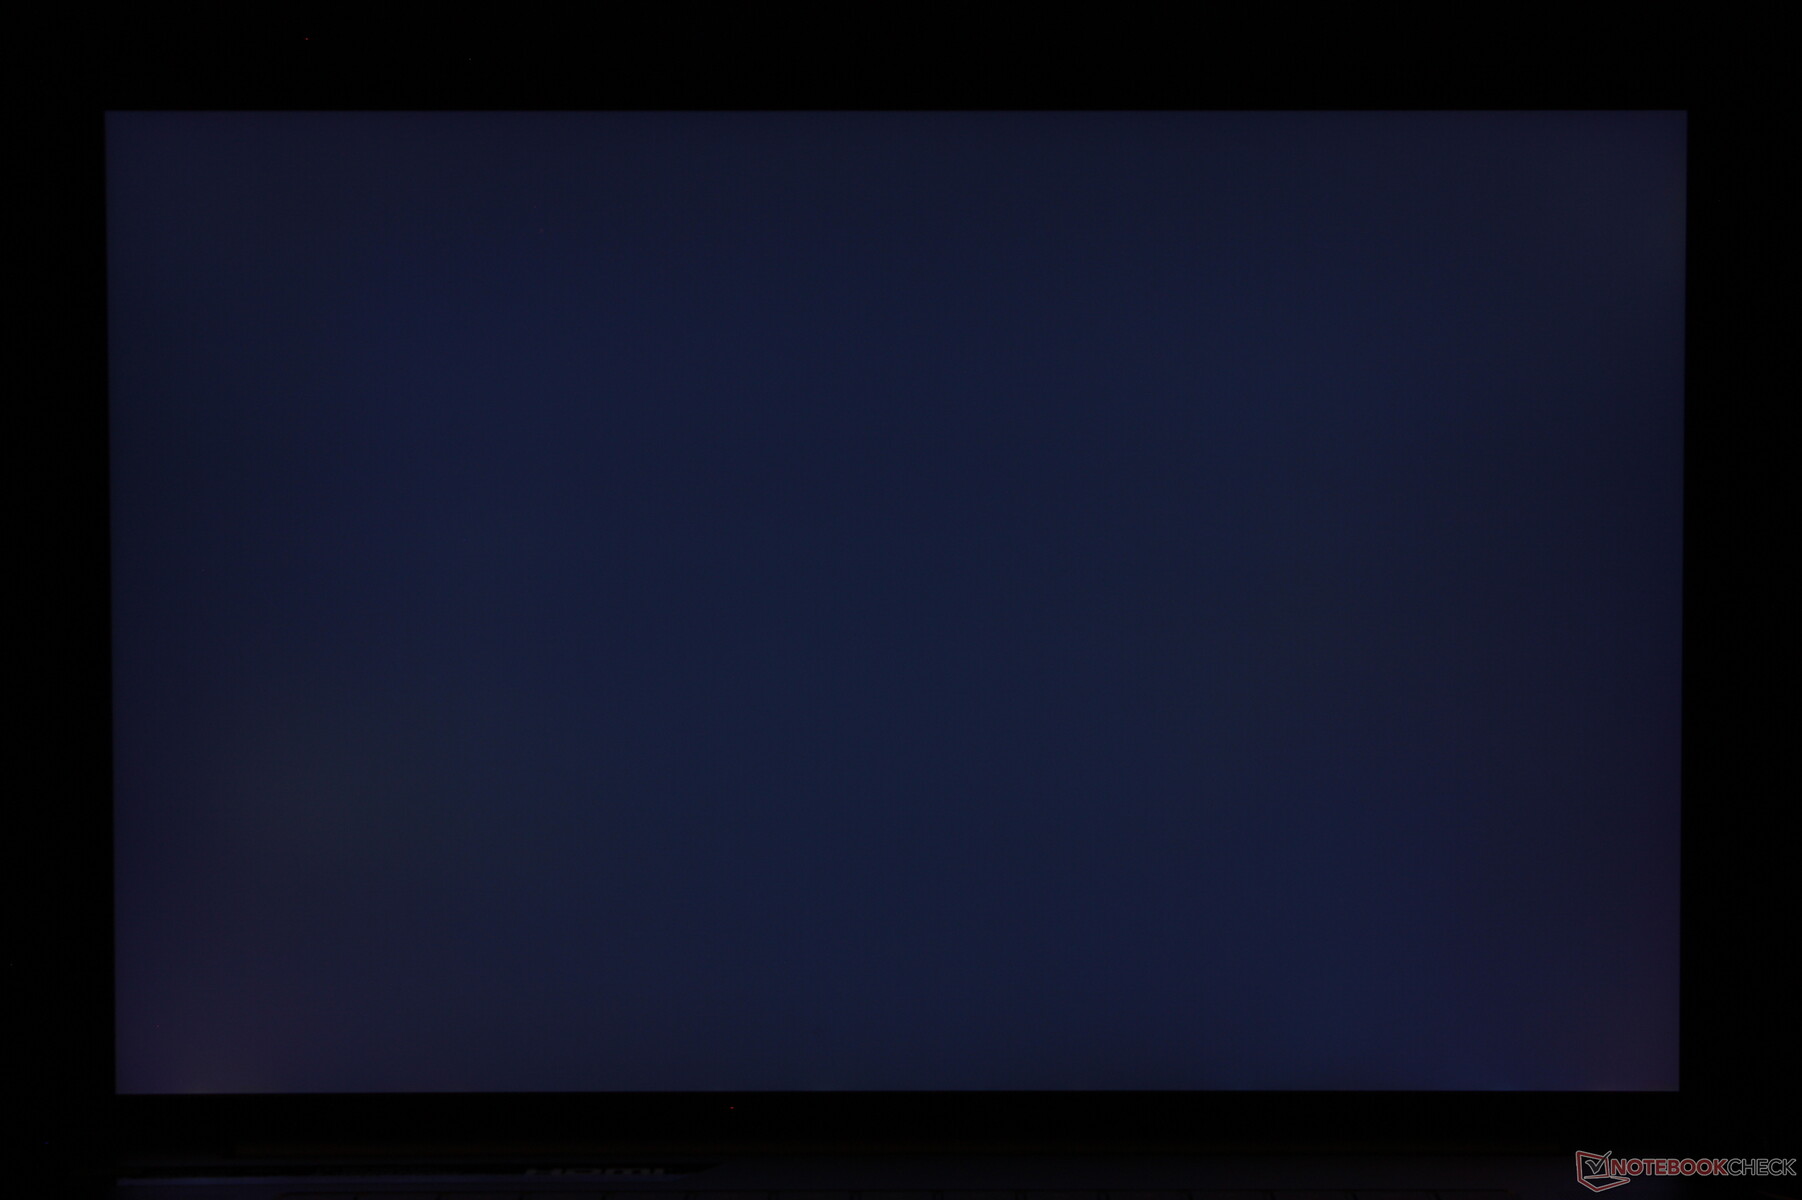
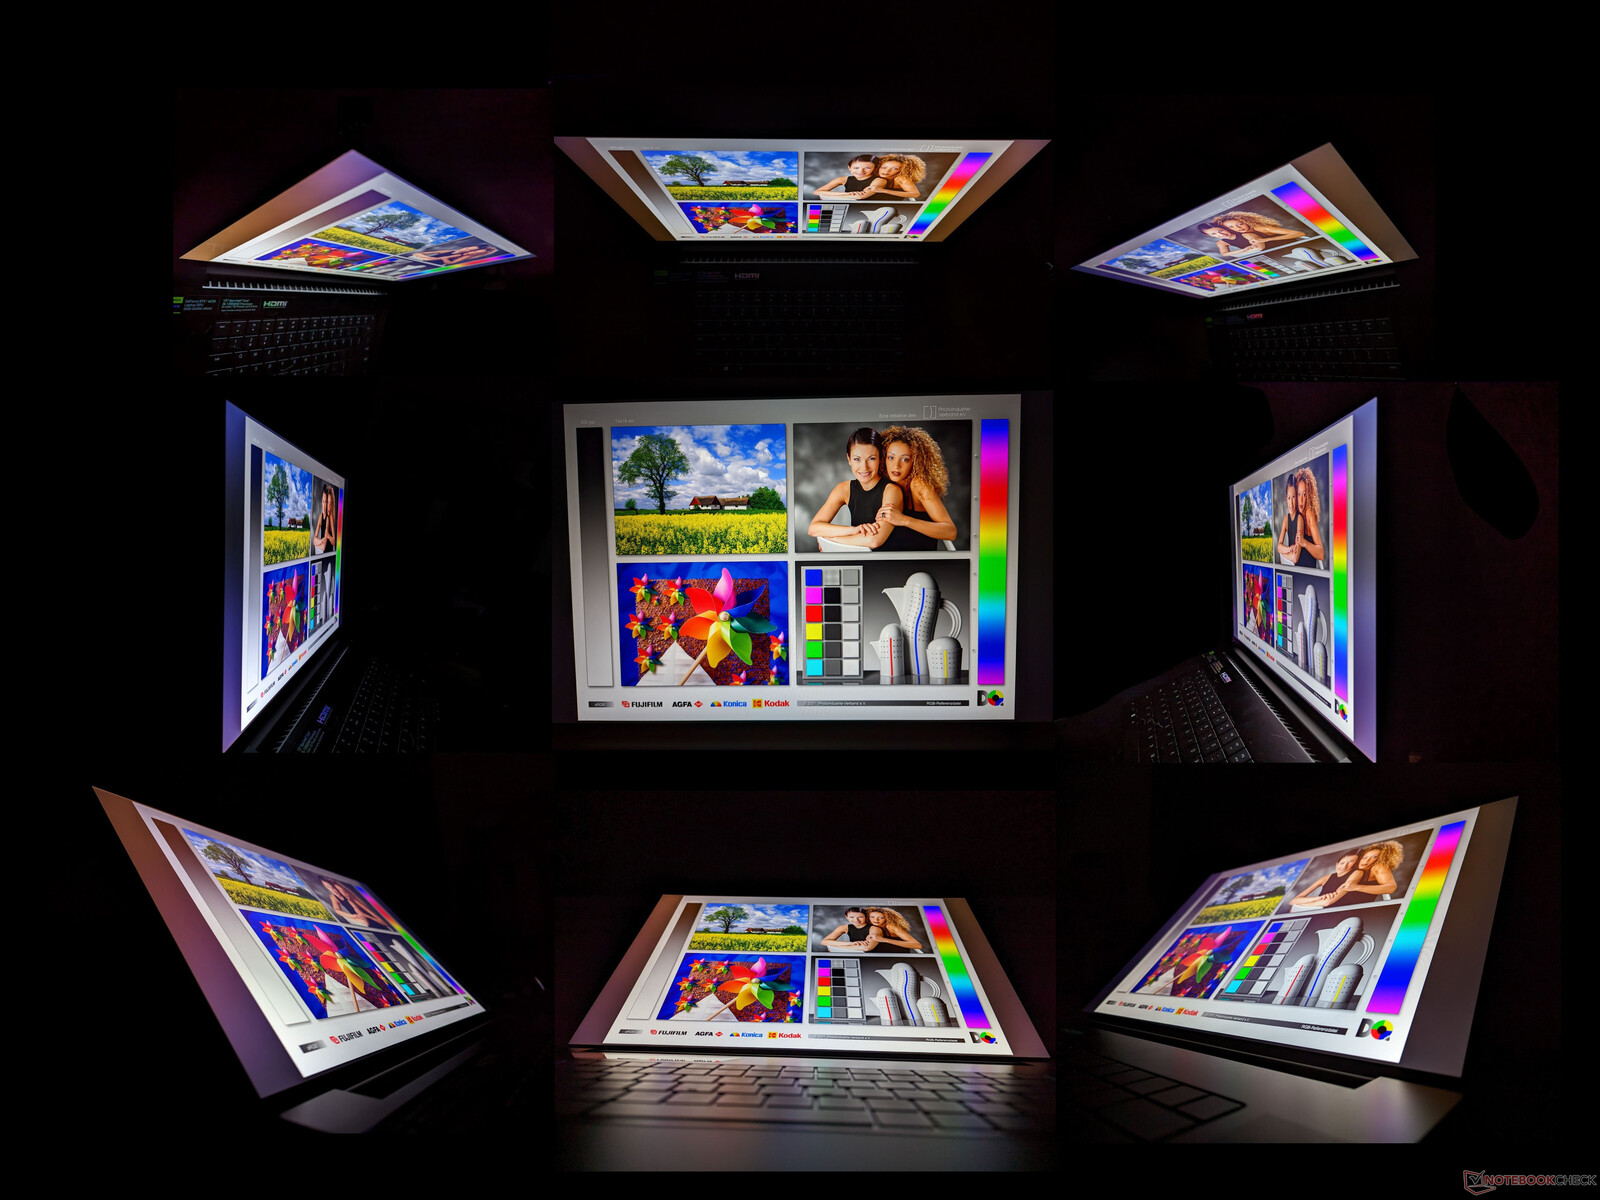
Display - Mycket rymlig
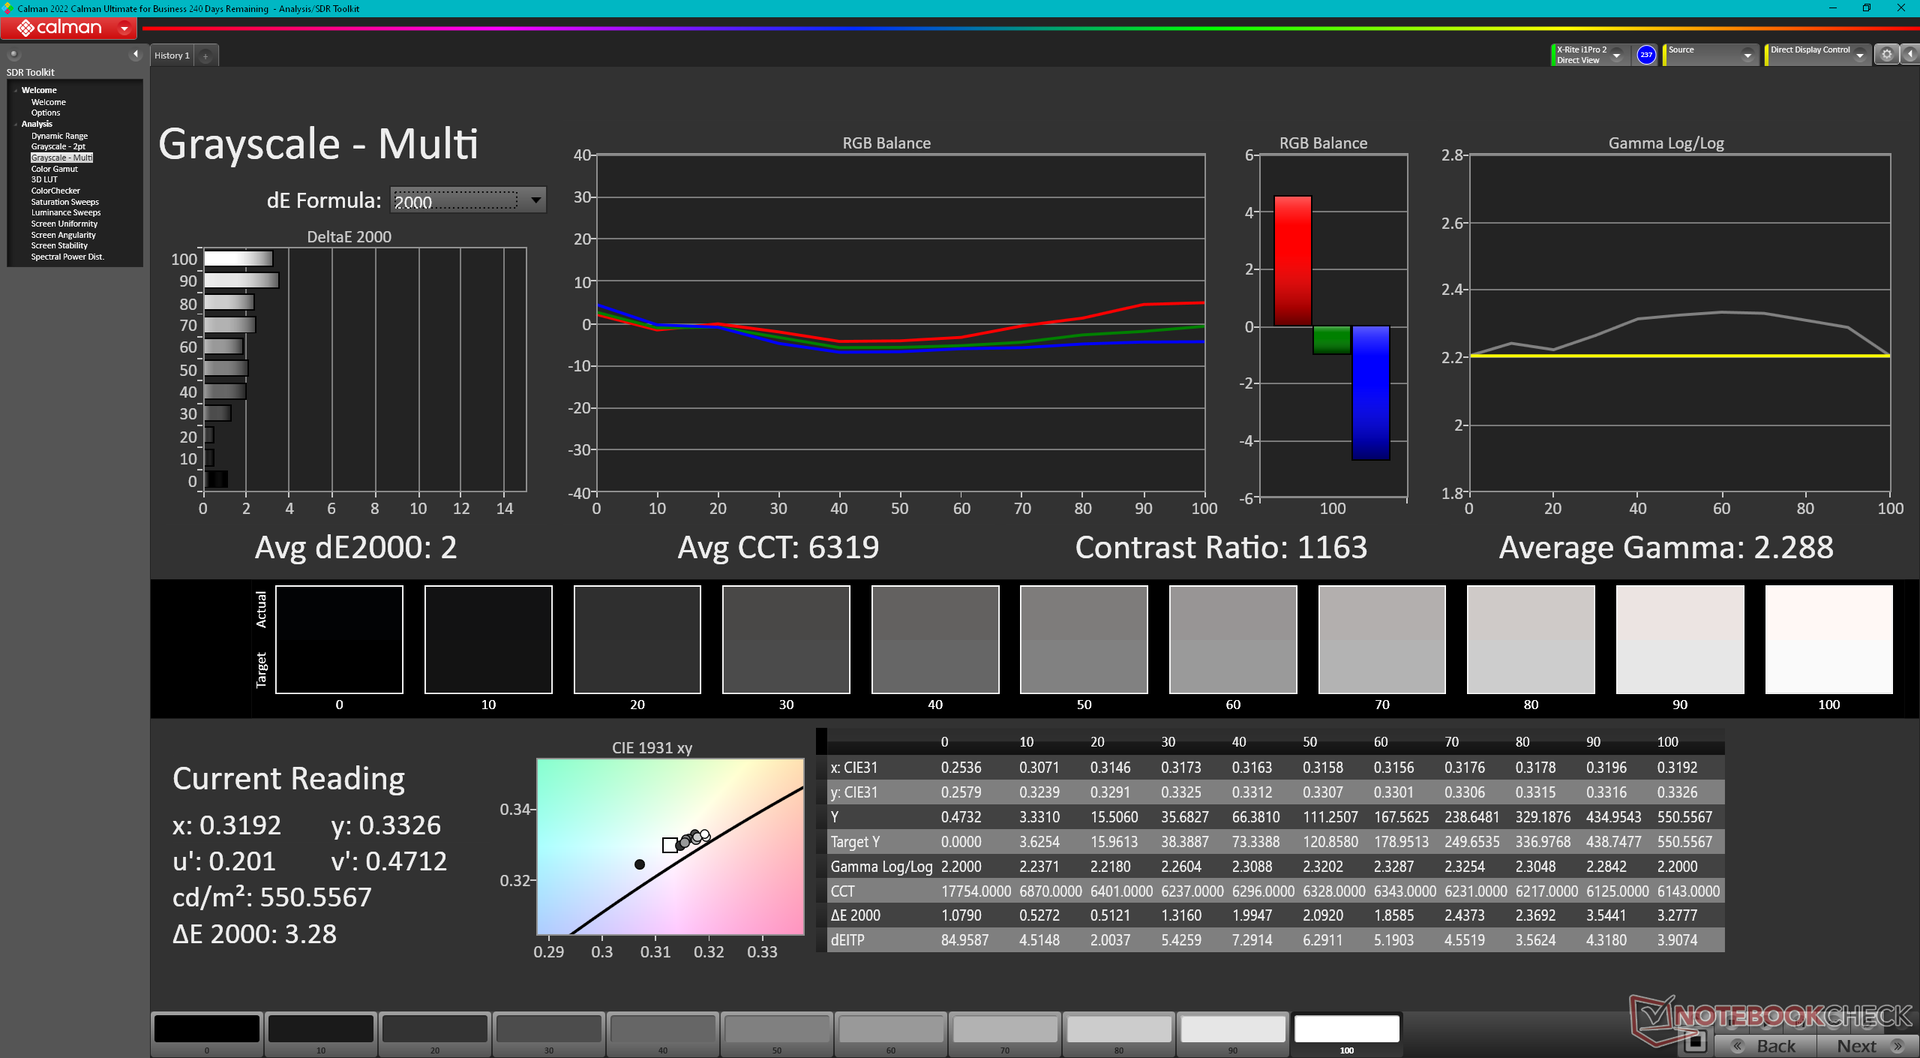
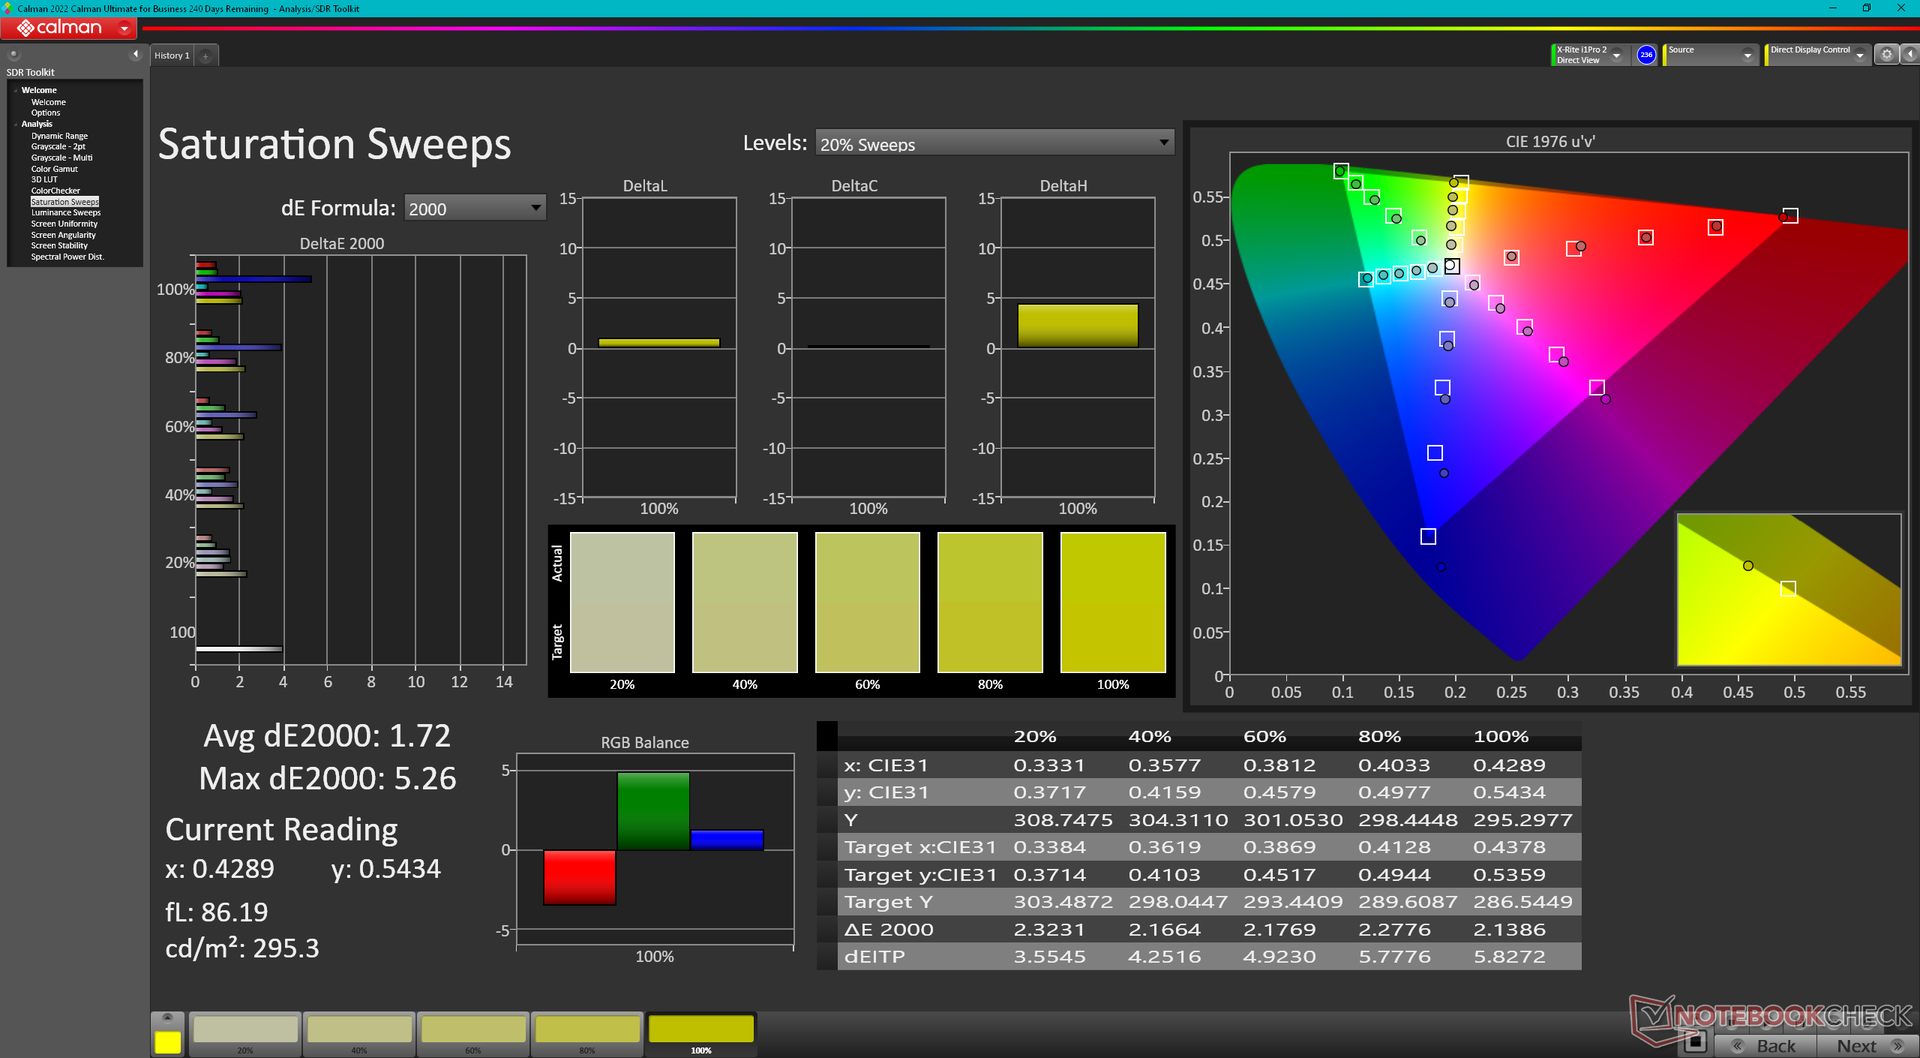
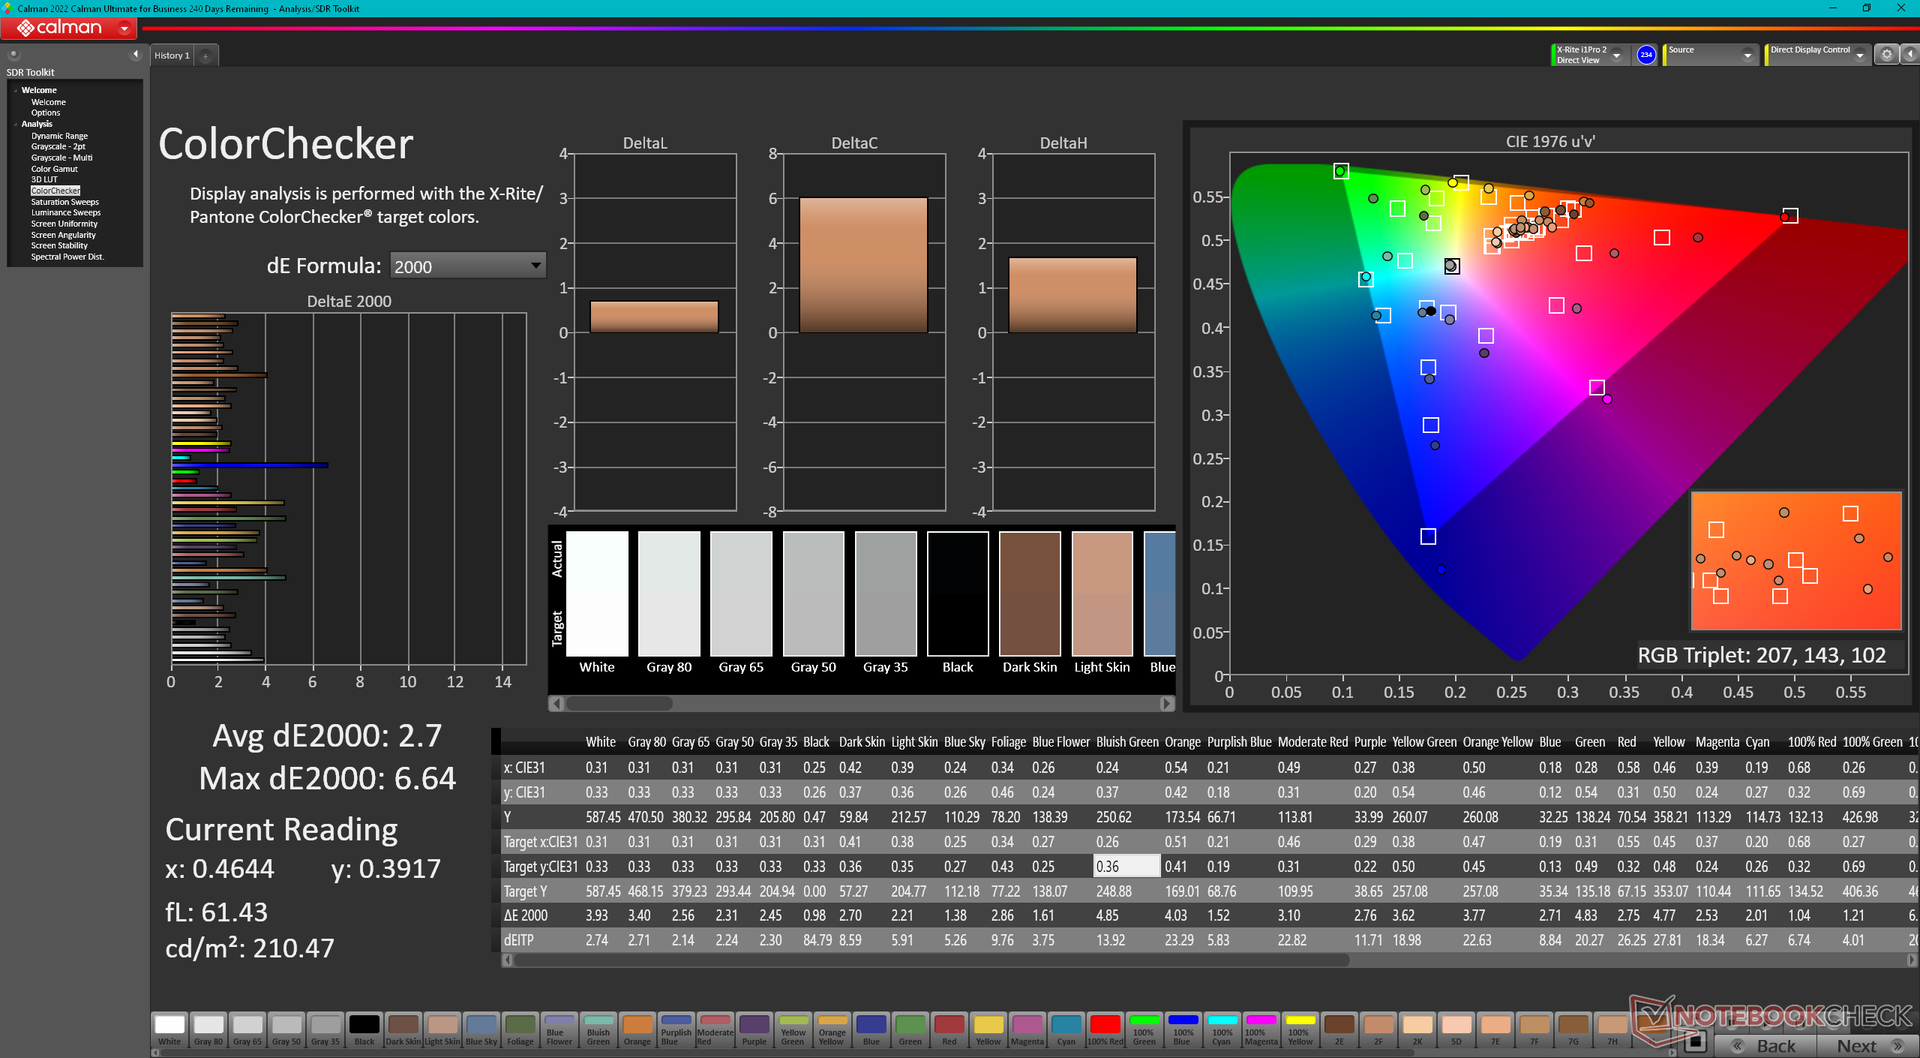
Blade 18 har inget alternativ för en andra panel vid lanseringen, troligen på grund av begränsad tillgång. Faktum är att Asus ROG Strix Scar 18 på 18,0 tum förmodligen kommer att använda samma AU Optronics B180QAN01.0 IPS-panel som på Blade 18. Med det sagt är detta fortfarande en högkvalitativ panel med de vanliga funktionerna som är vanliga på bärbara datorer för spel i toppklass, inklusive den snabba uppdateringsfrekvensen 240 Hz native refresh rate, snabba svarstider på 3 ms, full DCI-P3 färgtäckning, 500 nit ljusstyrka och fabrikskalibrering. Våra oberoende mätningar med en X-Rite-kolorimeter och ett oscilloskop har bekräftat dessa påståenden.
Tyvärr flimrade skärmen på vår testenhet ibland mellan olika ljusstyrkor till synes utan anledning. Flimret har inget samband med pulsbreddsmodulering eftersom panelen inte använder PWM för ljusstyrning. Detta är sannolikt ett fel på skärmen, men vi kan ännu inte bekräfta om det är ett mjukvaru- eller hårdvaruproblem. Enligt uppgift har vissa konsumenter som redan har köpt Blade 18 har också upplevt liknande problem med flimmer. Det här avsnittet kommer att uppdateras när vi har fått ett officiellt besked från Razer.
| |||||||||||||||||||||||||
Distribution av ljusstyrkan: 89 %
Mitt på batteriet: 549.6 cd/m²
Kontrast: 1037:1 (Svärta: 0.53 cd/m²)
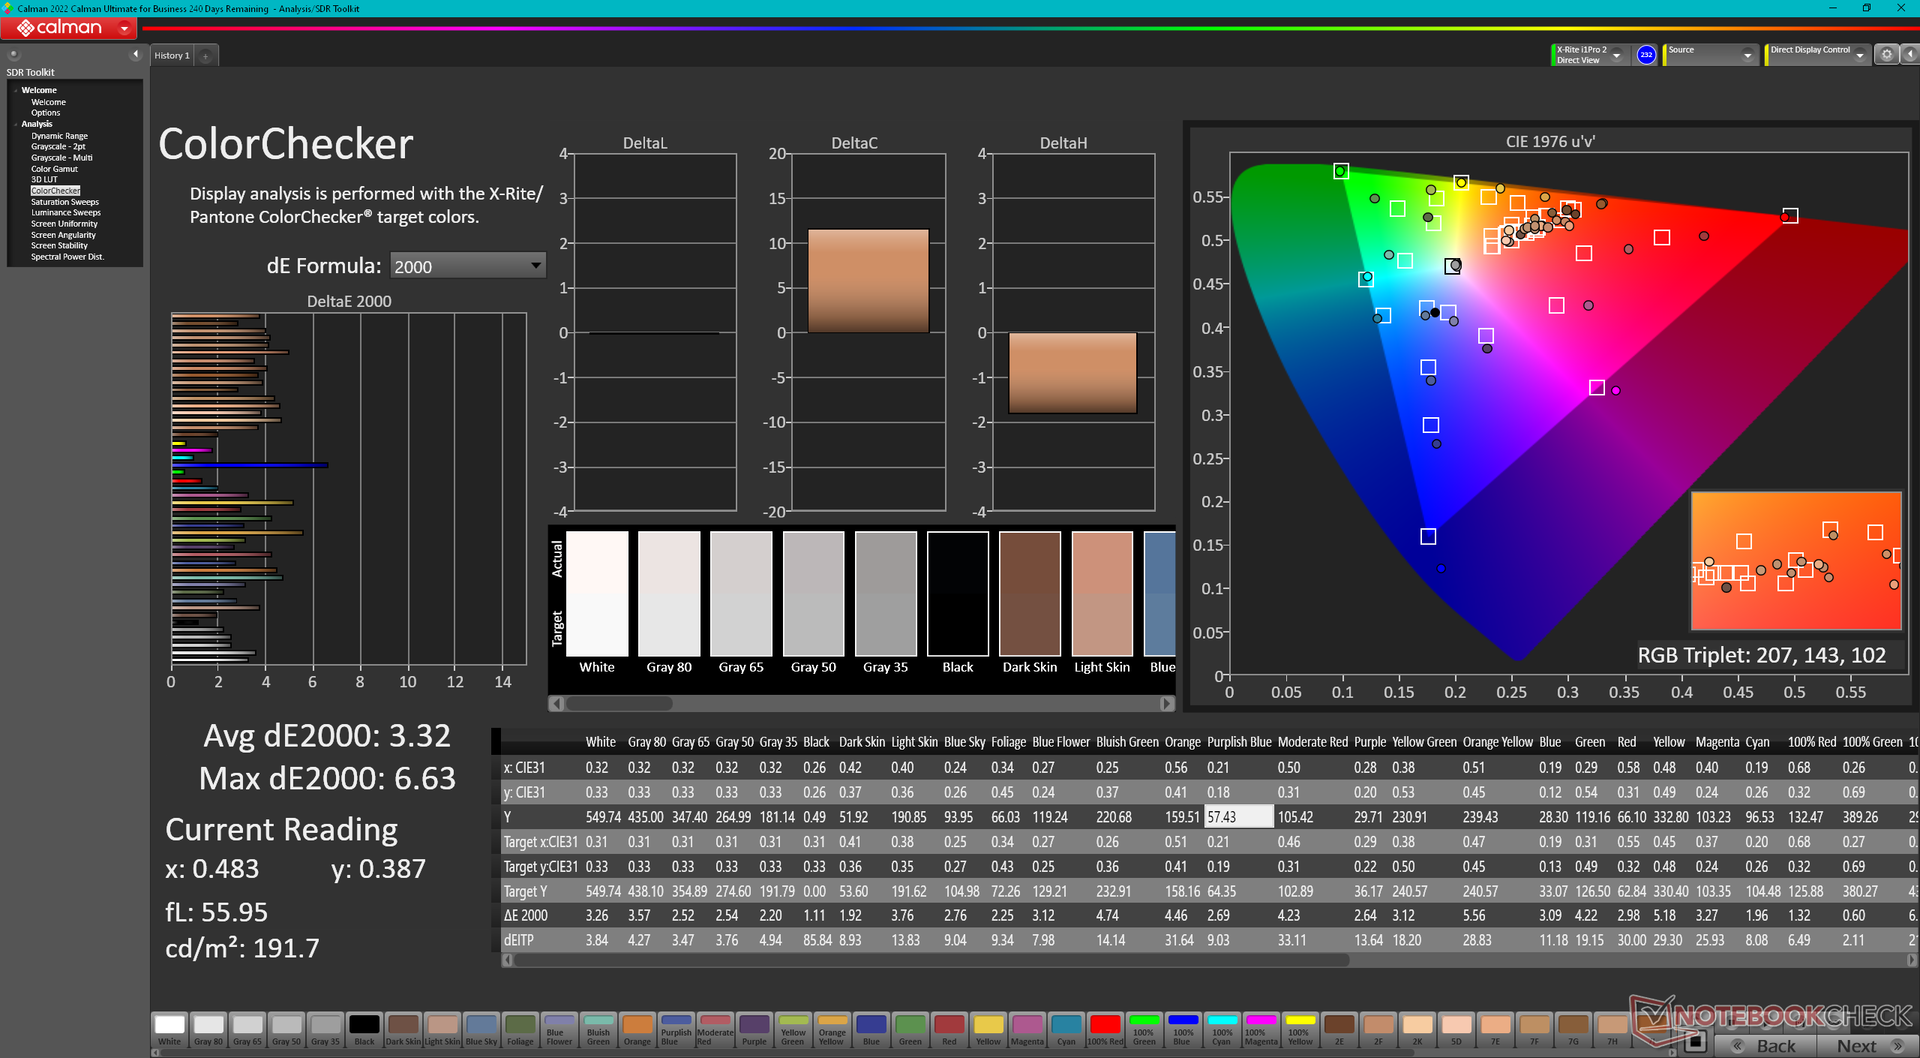
ΔE ColorChecker Calman: 3.32 | ∀{0.5-29.43 Ø4.71}
calibrated: 2.7
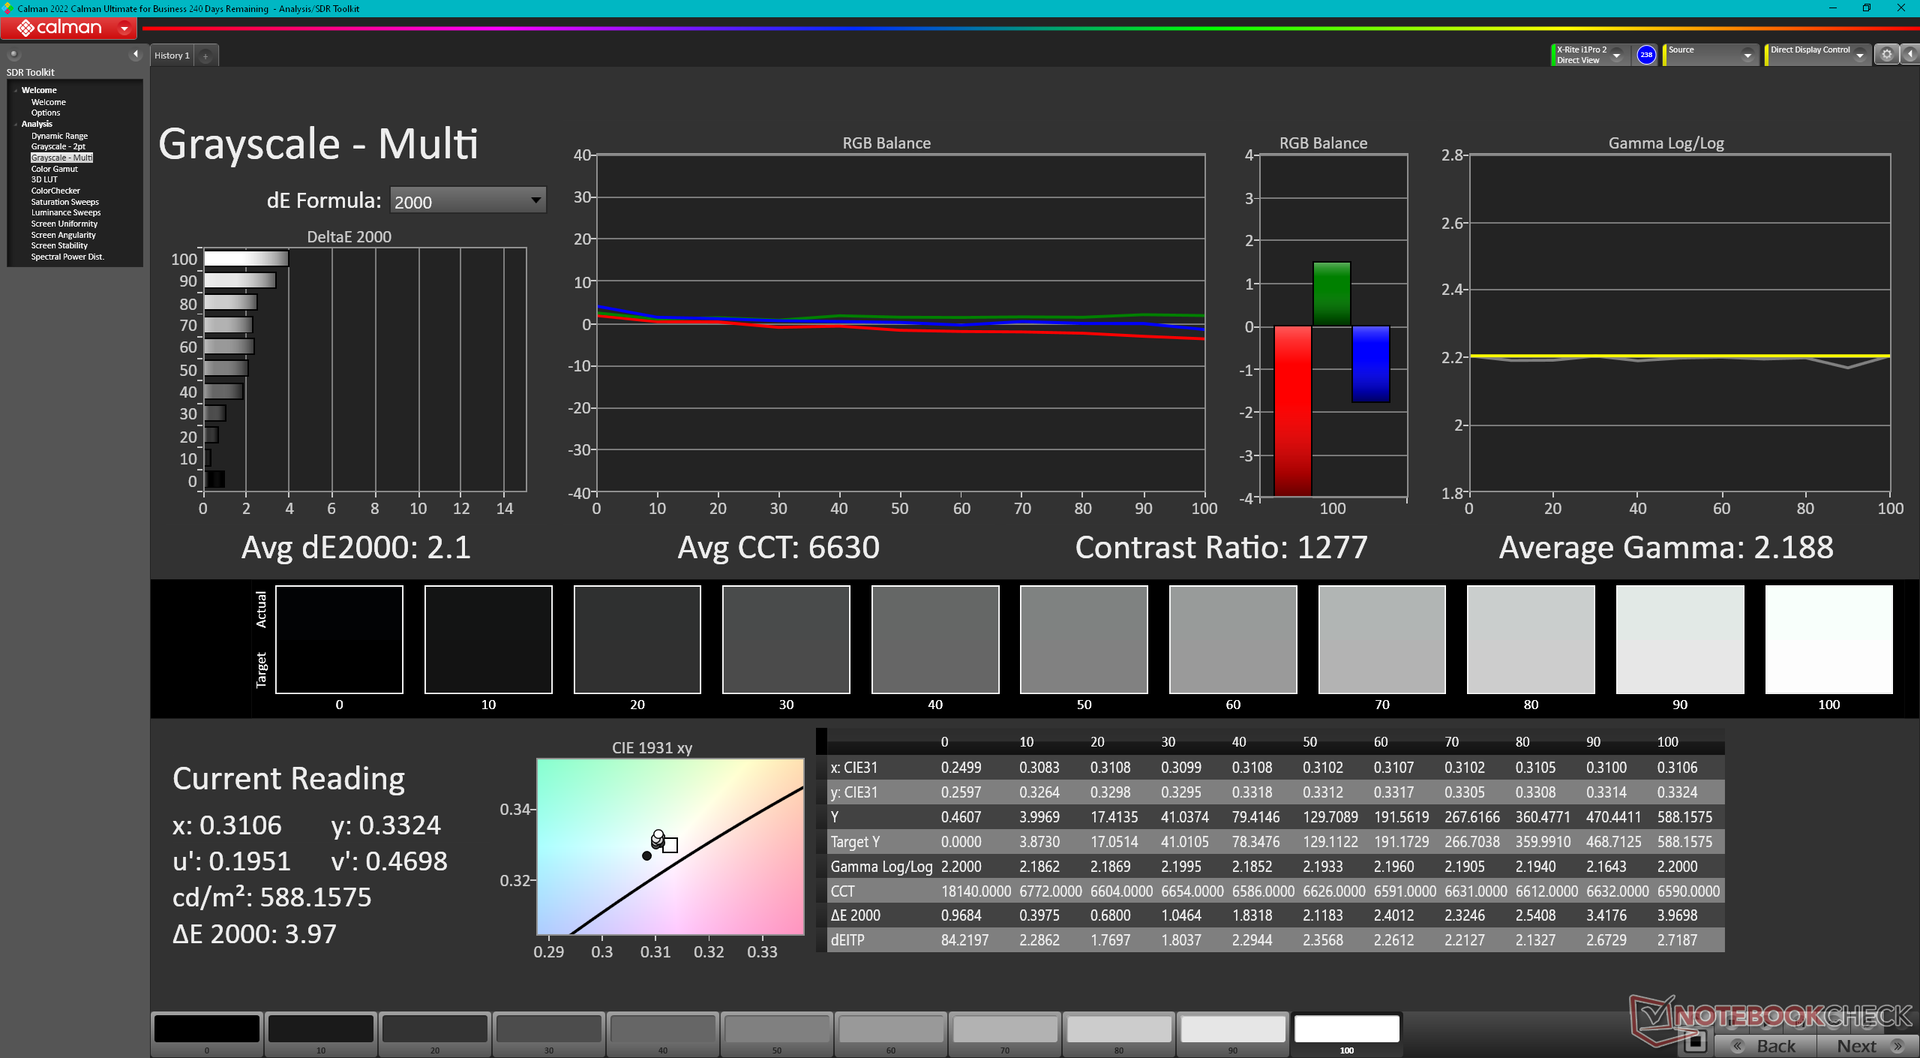
ΔE Greyscale Calman: 2 | ∀{0.09-98 Ø4.96}
85.3% AdobeRGB 1998 (Argyll 3D)
99.8% sRGB (Argyll 3D)
96.9% Display P3 (Argyll 3D)
Gamma: 2.29
CCT: 6319 K
| Razer Blade 18 RTX 4070 AU Optronics B180QAN01.0, IPS, 2560x1600, 18" | Razer Blade 17 Early 2022 AU Optronics B173ZAN06.9, IPS, 3840x2160, 17.3" | MSI Titan GT77 HX 13VI B173ZAN06.C, Mini-LED, 3840x2160, 17.3" | Gigabyte G7 KE AU Optronics B173HAN05.1, IPS, 1920x1080, 17.3" | Alienware m17 R5 (R9 6900HX, RX 6850M XT) AU Optronics AUODBA3, IPS, 3840x2160, 17" | Asus ROG Strix Scar 17 SE G733CX-LL014W NE173QHM-NZ2, IPS, 2560x1440, 17.3" | |
|---|---|---|---|---|---|---|
| Display | 2% | 2% | -14% | 1% | -0% | |
| Display P3 Coverage (%) | 96.9 | 99.4 3% | 94.9 -2% | 70.4 -27% | 97.2 0% | 97.1 0% |
| sRGB Coverage (%) | 99.8 | 100 0% | 99.9 0% | 99.8 0% | 99.6 0% | 99.9 0% |
| AdobeRGB 1998 Coverage (%) | 85.3 | 87.3 2% | 92.4 8% | 71.7 -16% | 88.4 4% | 84.8 -1% |
| Response Times | -25% | -524% | -12% | -168% | -31% | |
| Response Time Grey 50% / Grey 80% * (ms) | 4.2 ? | 7.5 ? -79% | 38.4 ? -814% | 5 ? -19% | 16.4 ? -290% | 5.7 ? -36% |
| Response Time Black / White * (ms) | 8 ? | 5.6 ? 30% | 26.6 ? -233% | 8.3 ? -4% | 11.6 ? -45% | 10.1 ? -26% |
| PWM Frequency (Hz) | 2380 ? | |||||
| Screen | 24% | 64905% | 19% | -40% | 16% | |
| Brightness middle (cd/m²) | 549.6 | 503 -8% | 606 10% | 307 -44% | 484 -12% | 320 -42% |
| Brightness (cd/m²) | 524 | 486 -7% | 602 15% | 301 -43% | 449 -14% | 303 -42% |
| Brightness Distribution (%) | 89 | 84 -6% | 93 4% | 93 4% | 87 -2% | 87 -2% |
| Black Level * (cd/m²) | 0.53 | 0.44 17% | 0.0001 100% | 0.2 62% | 0.55 -4% | 0.3 43% |
| Contrast (:1) | 1037 | 1143 10% | 6060000 584278% | 1535 48% | 880 -15% | 1067 3% |
| Colorchecker dE 2000 * | 3.32 | 1.08 67% | 4.8 -45% | 1.32 60% | 4.8 -45% | 1.1 67% |
| Colorchecker dE 2000 max. * | 6.63 | 4.54 32% | 8.2 -24% | 4.6 31% | 7.48 -13% | 2.7 59% |
| Colorchecker dE 2000 calibrated * | 2.7 | 0.6 78% | 1.8 33% | 1.03 62% | 4.74 -76% | |
| Greyscale dE 2000 * | 2 | 1.3 35% | 6.5 -225% | 2.1 -5% | 5.5 -175% | 1.1 45% |
| Gamma | 2.29 96% | 2.151 102% | 2.63 84% | 2.247 98% | 2.42 91% | 2.13 103% |
| CCT | 6319 103% | 6541 99% | 6596 99% | 6815 95% | 6148 106% | 6599 98% |
| Totalt genomsnitt (program/inställningar) | 0% /
12% | 21461% /
41650% | -2% /
8% | -69% /
-49% | -5% /
5% |
* ... mindre är bättre
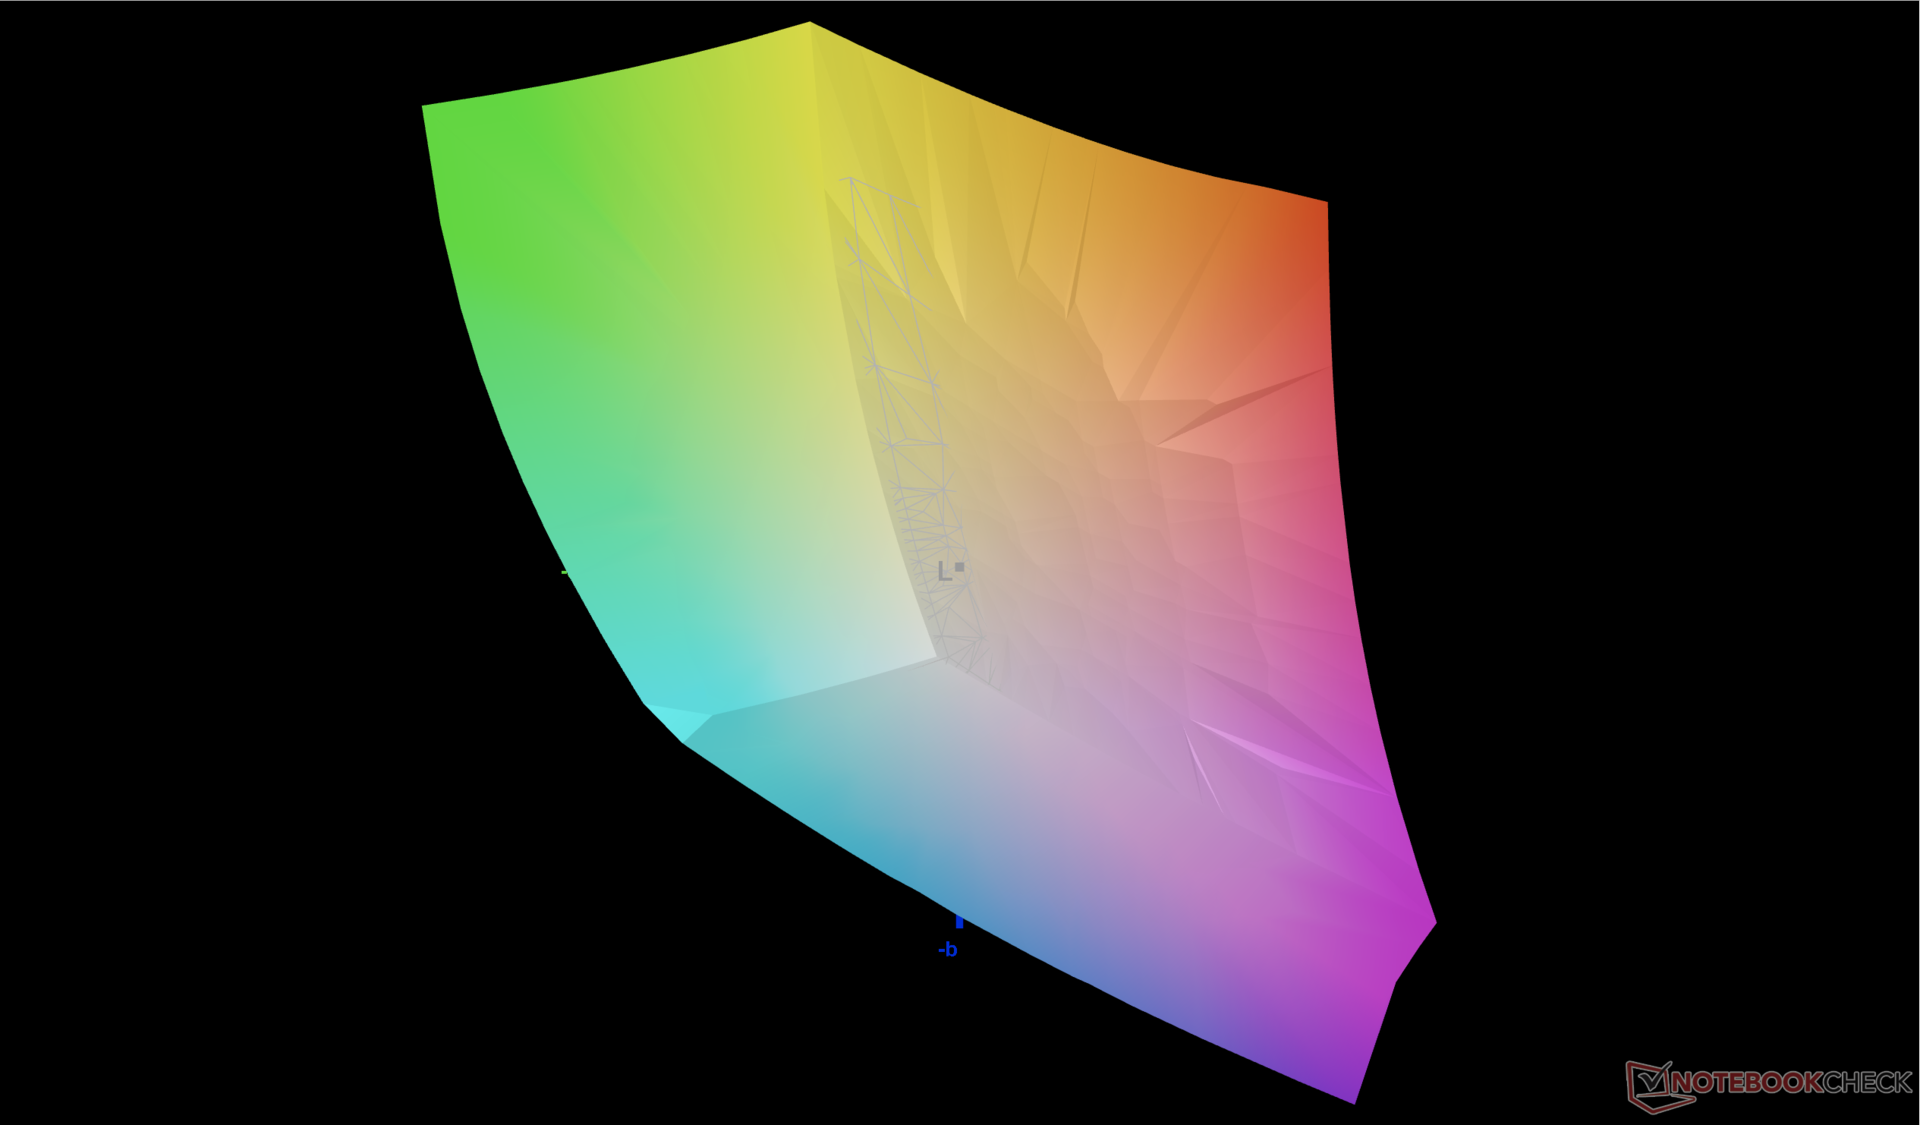
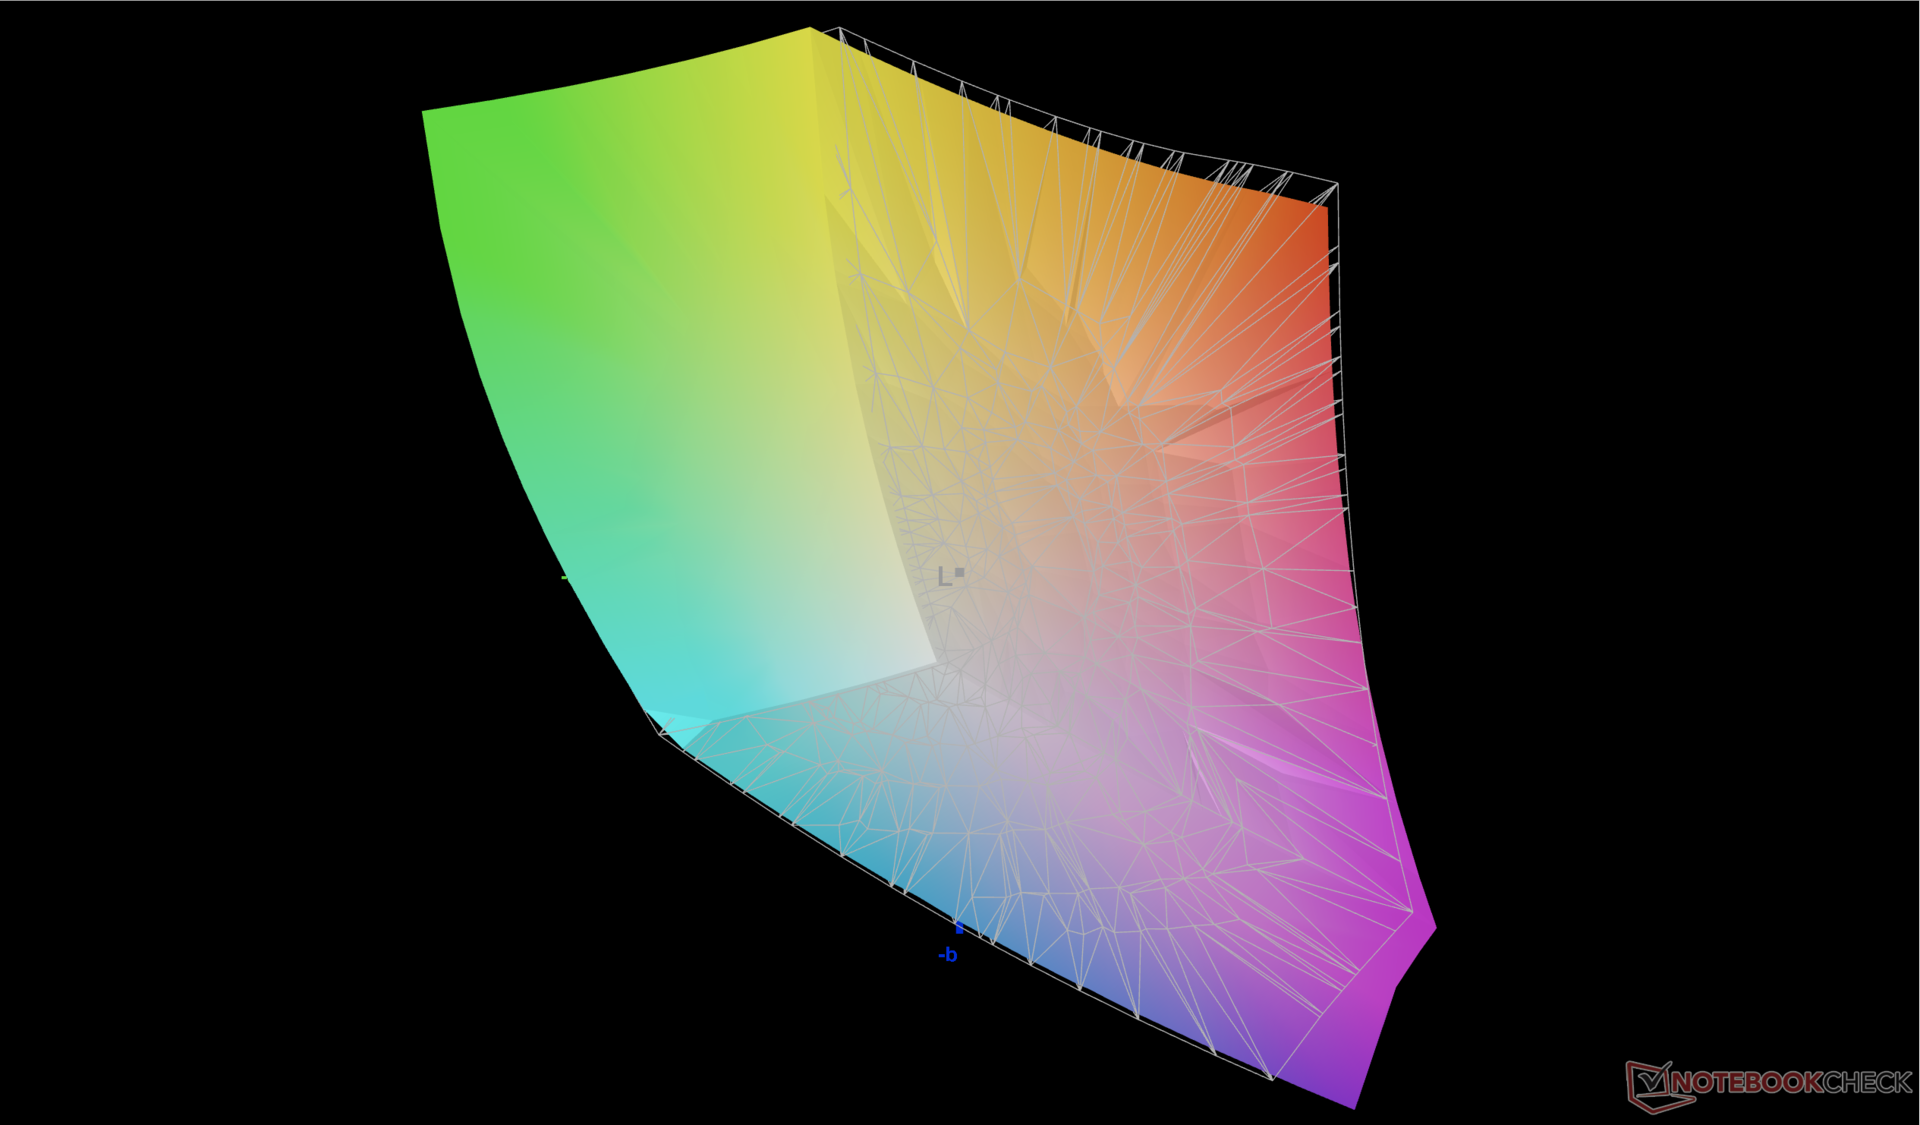
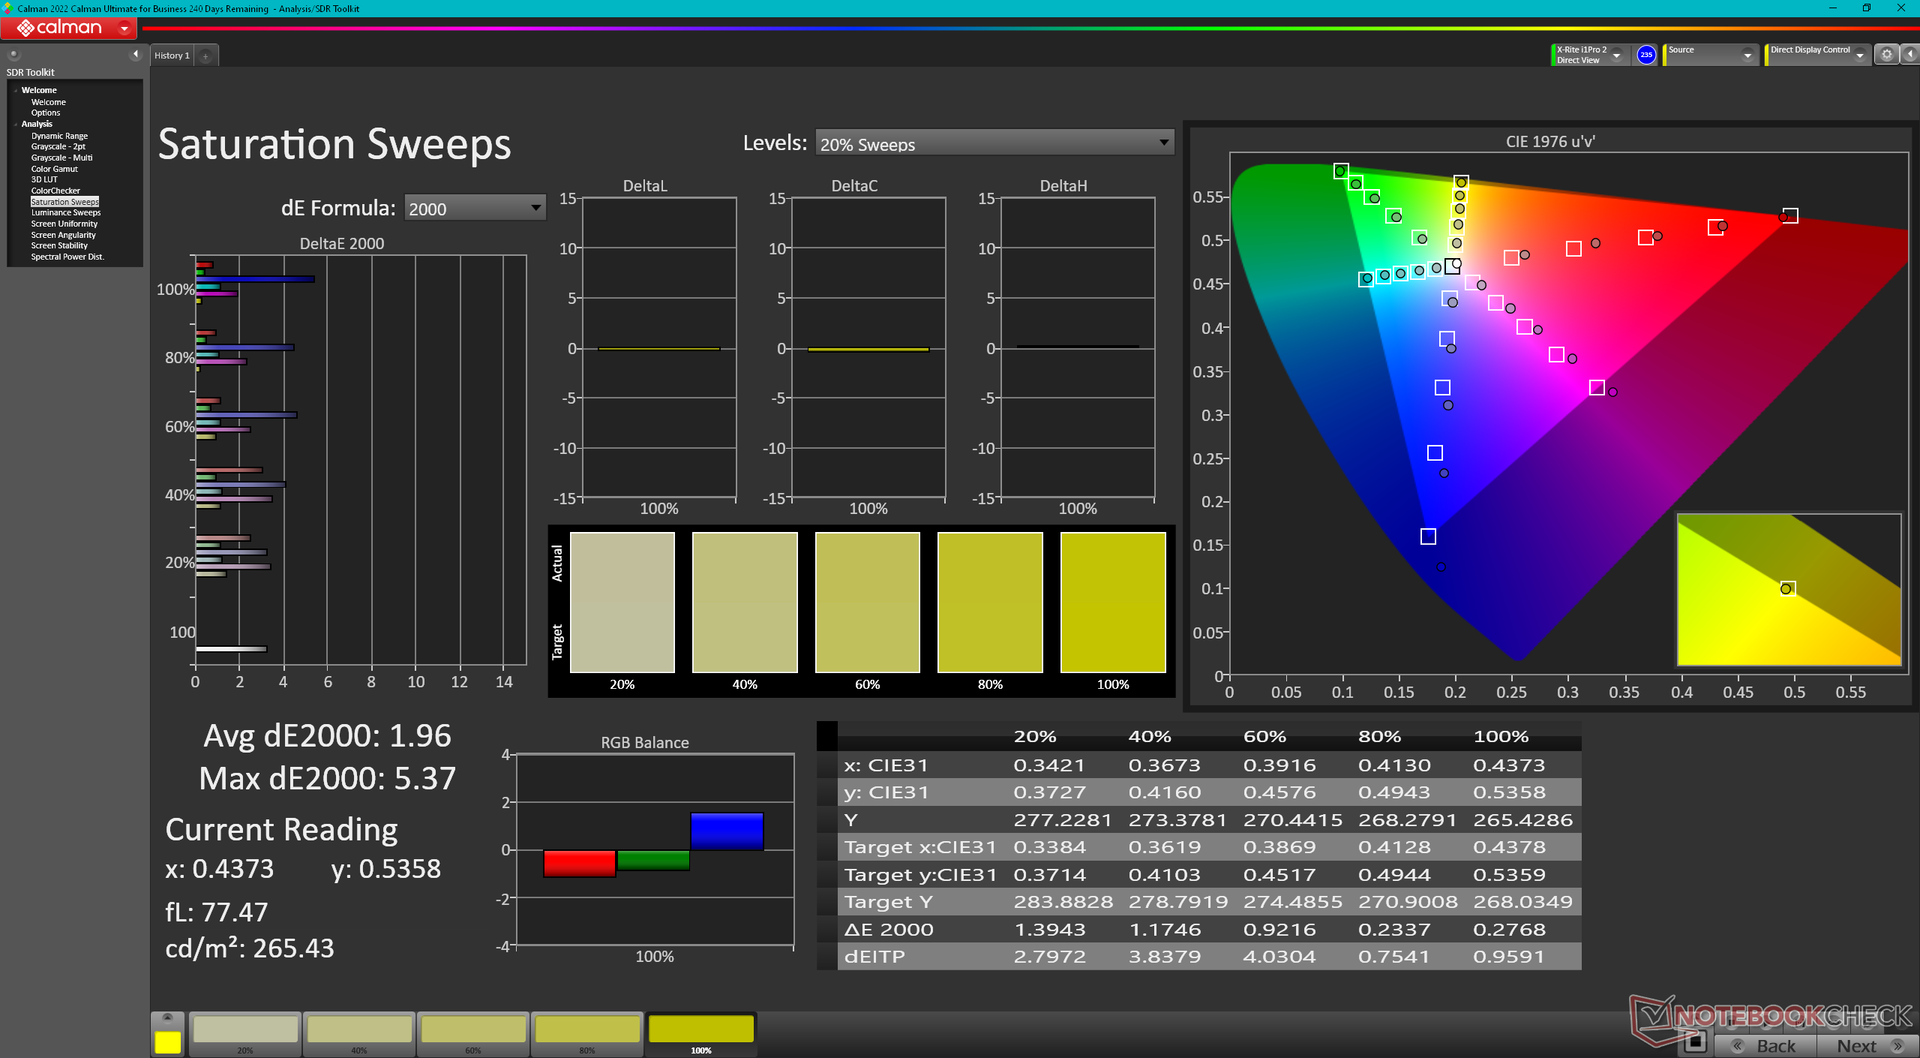
Genomsnittliga deltaE-värden för gråskala och färg är endast 2,0 respektive 3,32, eftersom panelen är förkalibrerad mot P3-standarden. Att försöka kalibrera panelen ytterligare själva skulle inte förbättra färgerna nämnvärt. Blått verkar dock representeras mer felaktigt än alla andra primära eller sekundära färger.
Visa svarstider
| ↔ Svarstid svart till vitt | ||
|---|---|---|
| 8 ms ... stiga ↗ och falla ↘ kombinerat | ↗ 3.8 ms stiga | 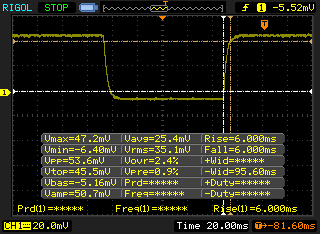 |
| ↘ 4.2 ms hösten | ||
| Skärmen visar snabba svarsfrekvenser i våra tester och bör passa för spel. I jämförelse sträcker sig alla testade enheter från 0.1 (minst) till 240 (maximalt) ms. » 22 % av alla enheter är bättre. Det betyder att den uppmätta svarstiden är bättre än genomsnittet av alla testade enheter (19.8 ms). | ||
| ↔ Svarstid 50 % grått till 80 % grått | ||
| 4.2 ms ... stiga ↗ och falla ↘ kombinerat | ↗ 2.1 ms stiga | 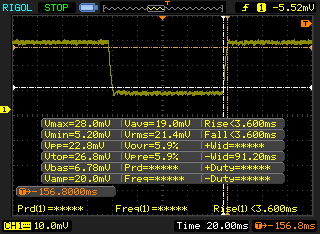 |
| ↘ 2.1 ms hösten | ||
| Skärmen visar väldigt snabba svarsfrekvenser i våra tester och borde vara mycket väl lämpad för fartfyllt spel. I jämförelse sträcker sig alla testade enheter från 0.165 (minst) till 636 (maximalt) ms. » 16 % av alla enheter är bättre. Det betyder att den uppmätta svarstiden är bättre än genomsnittet av alla testade enheter (31 ms). | ||
Skärmflimmer / PWM (Puls-Width Modulation)
| Skärmflimmer / PWM upptäcktes inte | 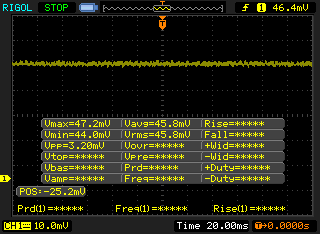 | ||
Som jämförelse: 52 % av alla testade enheter använder inte PWM för att dämpa skärmen. Om PWM upptäcktes mättes ett medelvärde av 7754 (minst: 5 - maximum: 343500) Hz. | |||
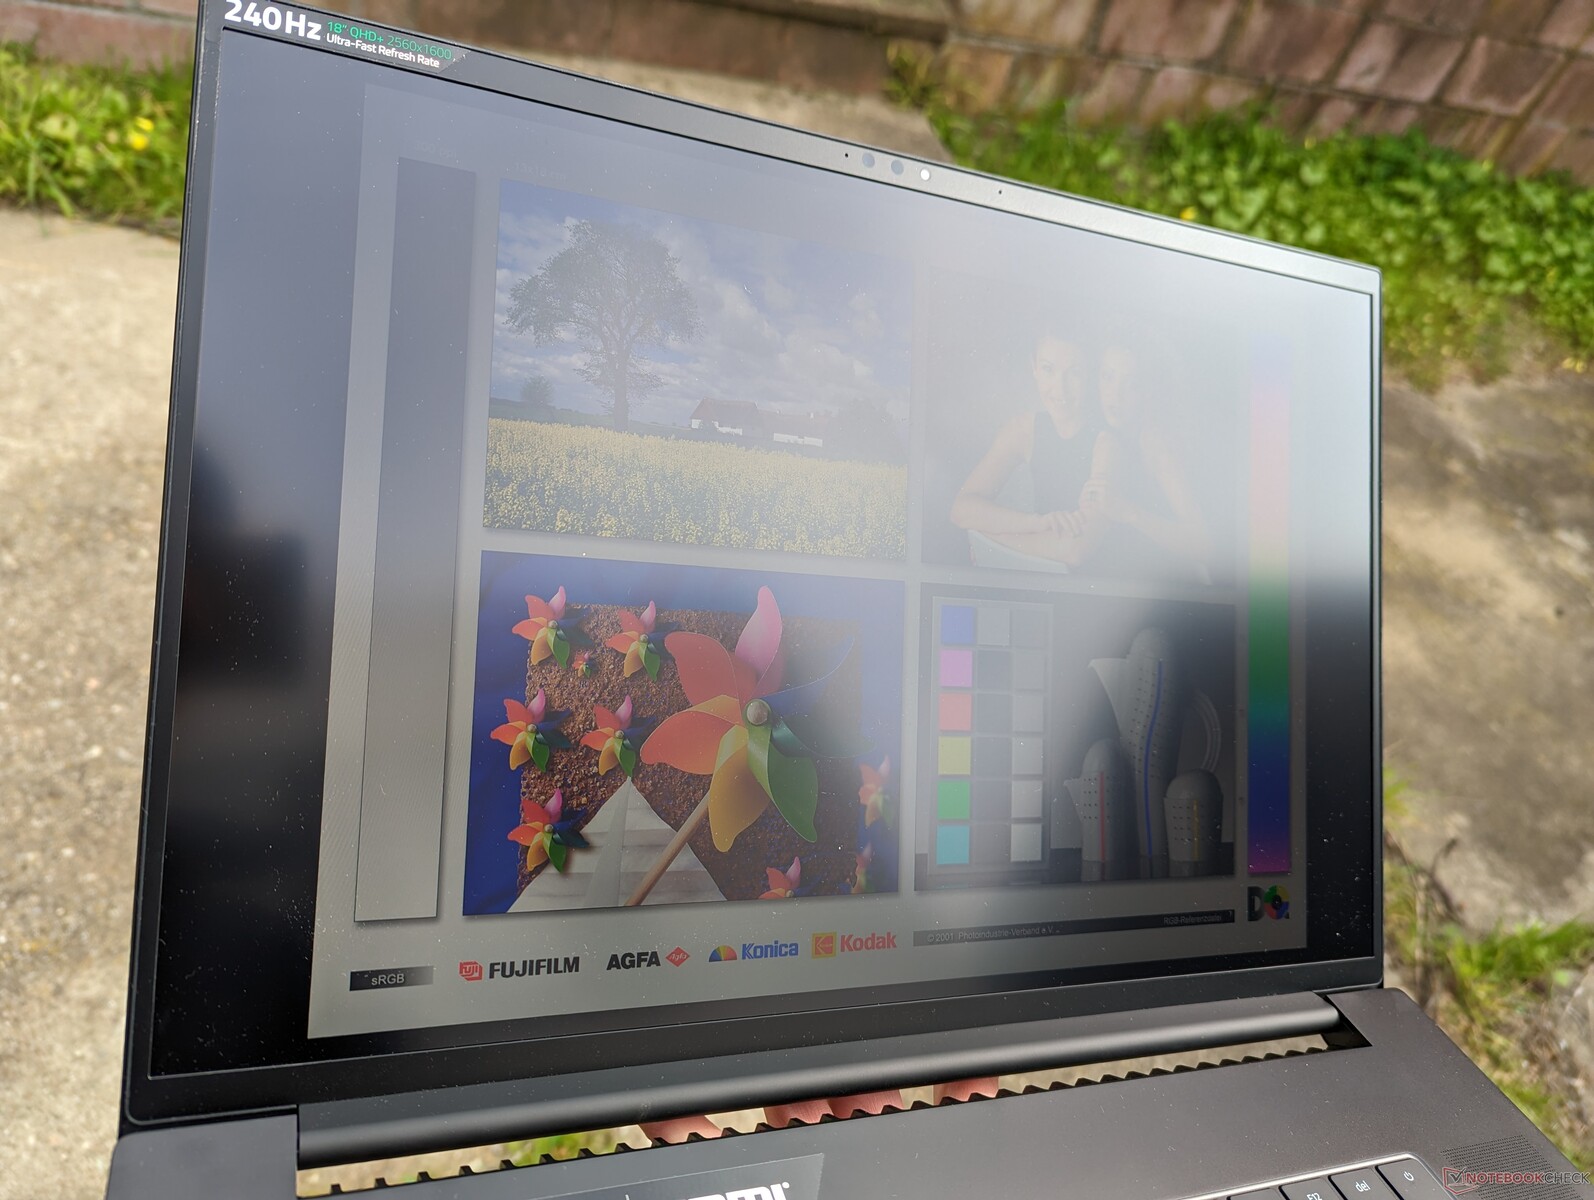
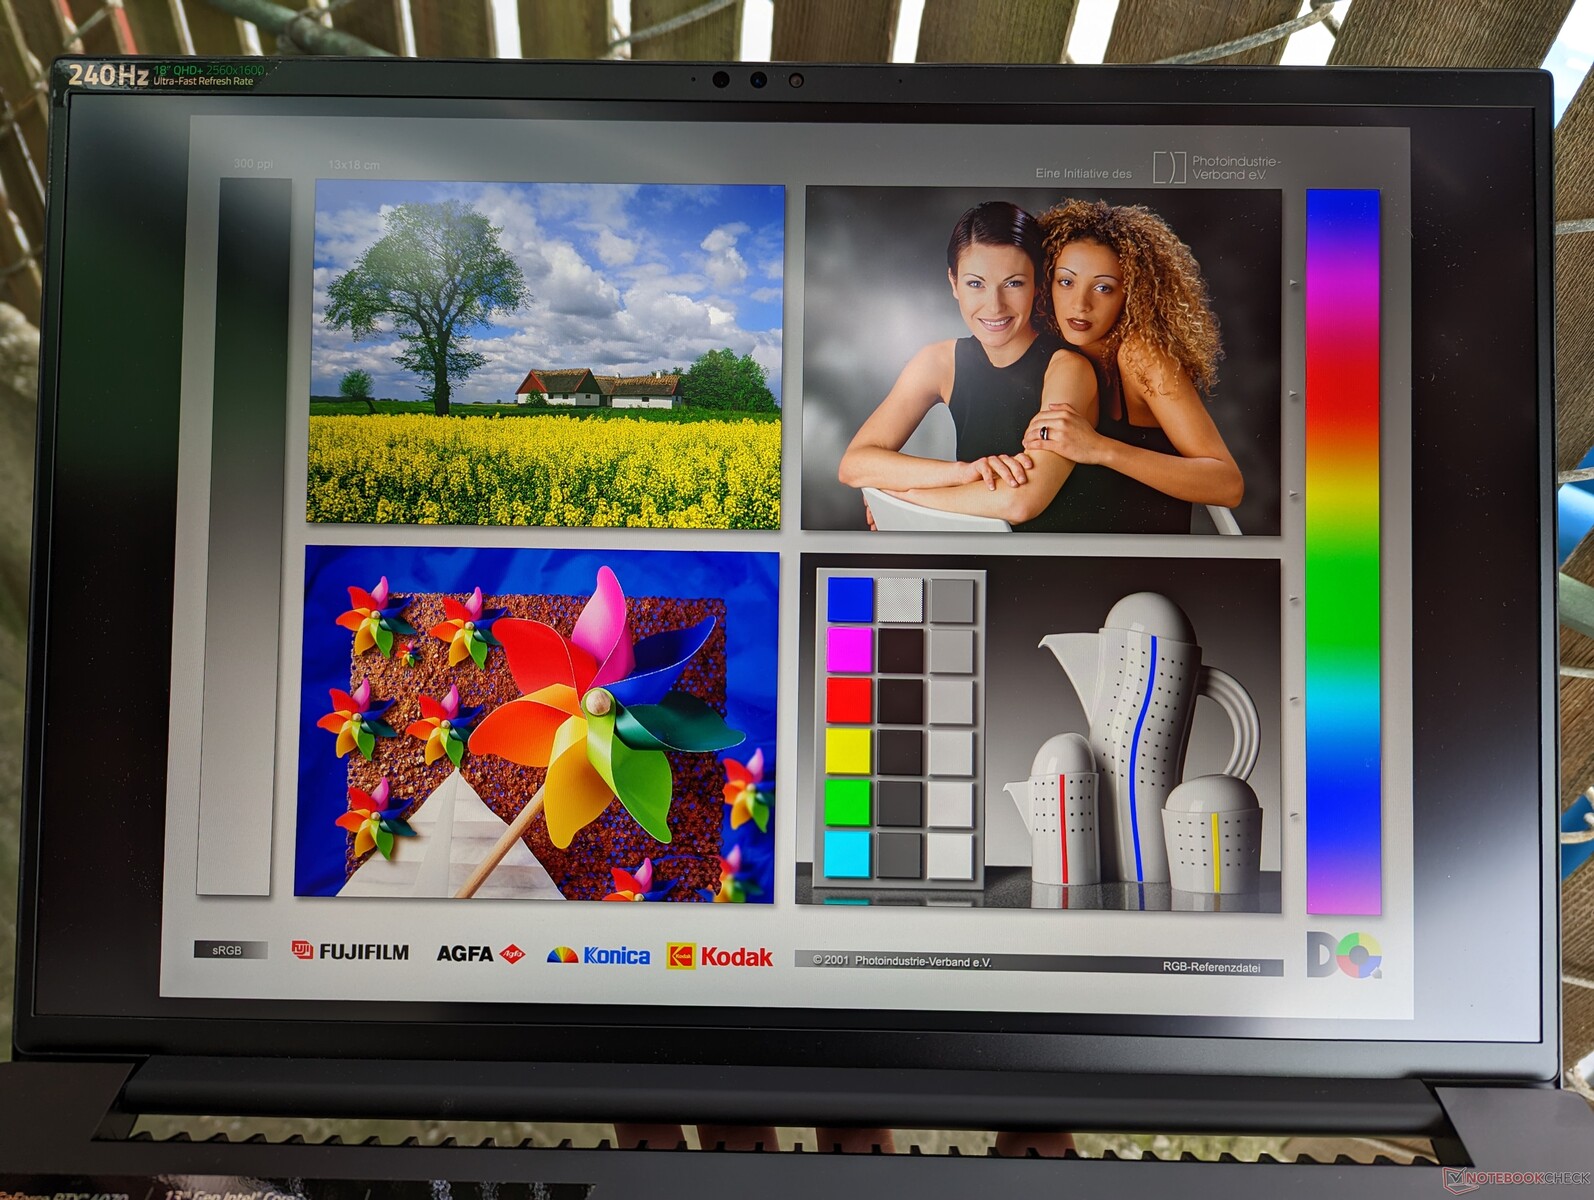
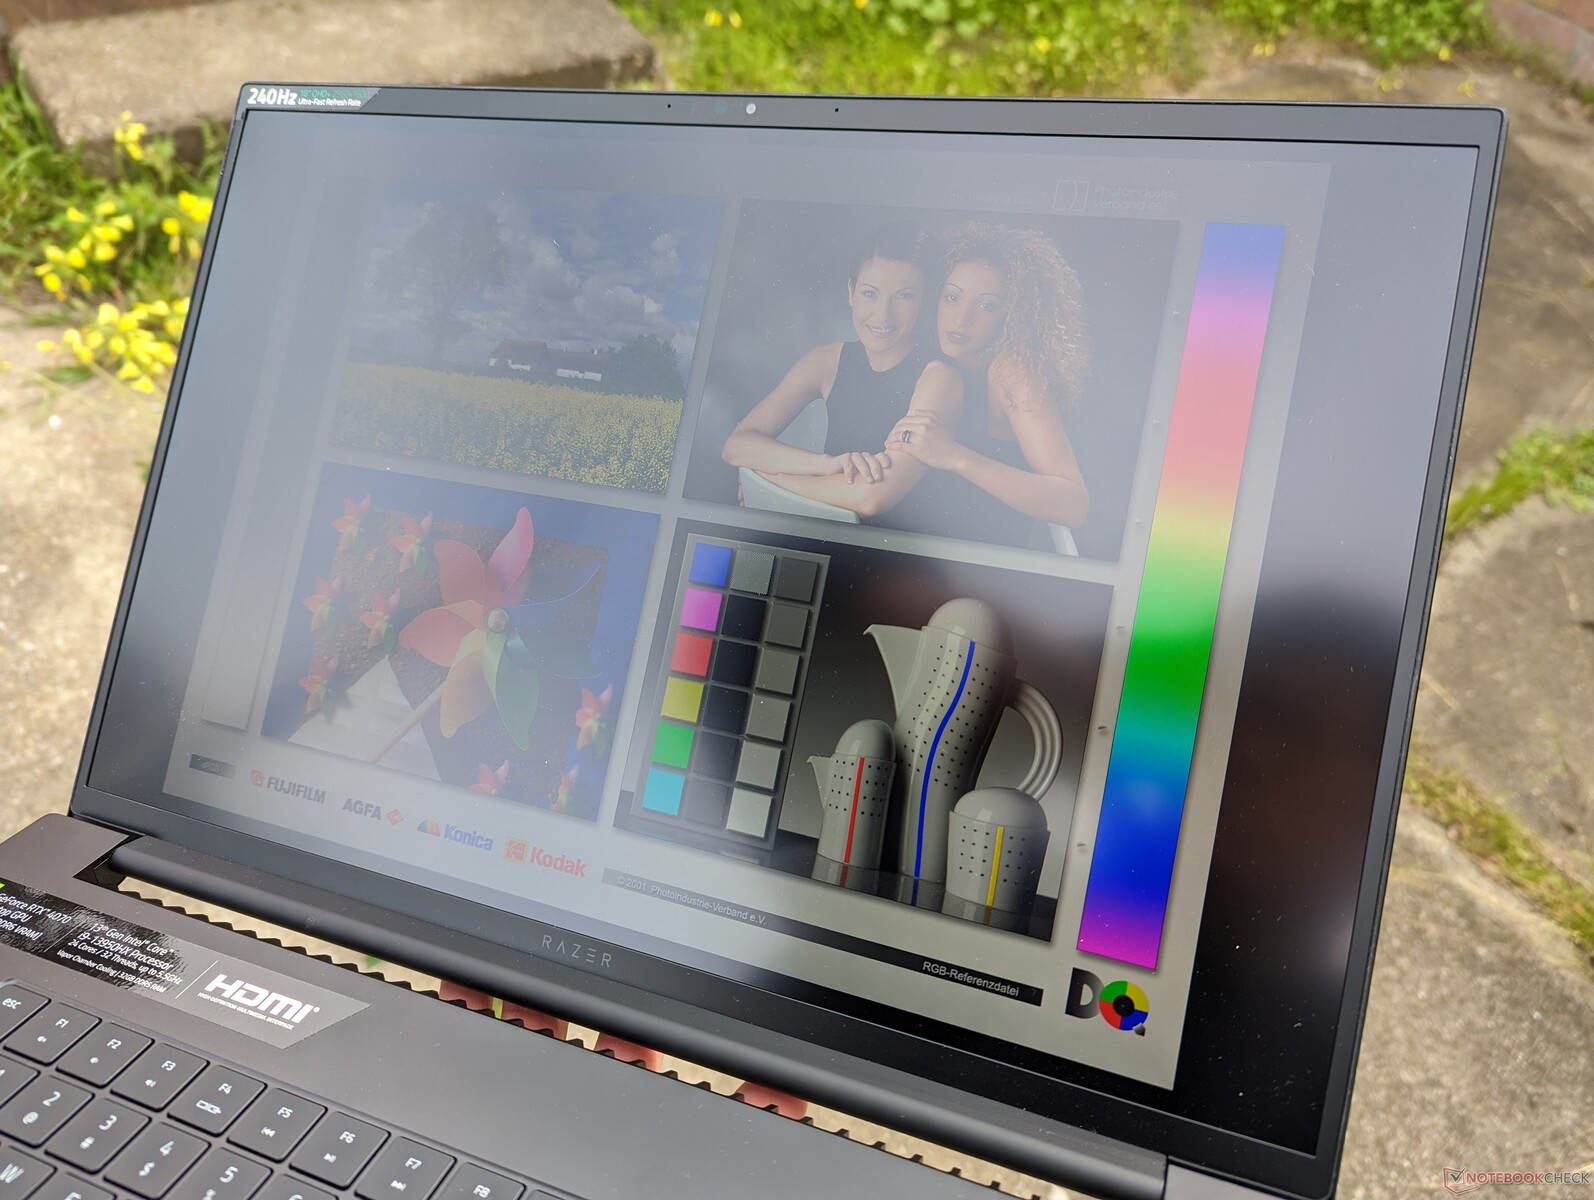
Synligheten utomhus är likadan som för Blade 17, eftersom displayerna har en maximal ljusstyrka på 500 nit. Skugga rekommenderas alltid för optimala färger och för att minska bländningen så mycket som möjligt.
Visningsvinklarna är breda som förväntat från en IPS-panel. Färger och kontrast ändras endast om du tittar från extrema vinklar.
Prestanda - Intel Raptor Lake + Nvidia Ada Lovelace
Provningsförhållanden
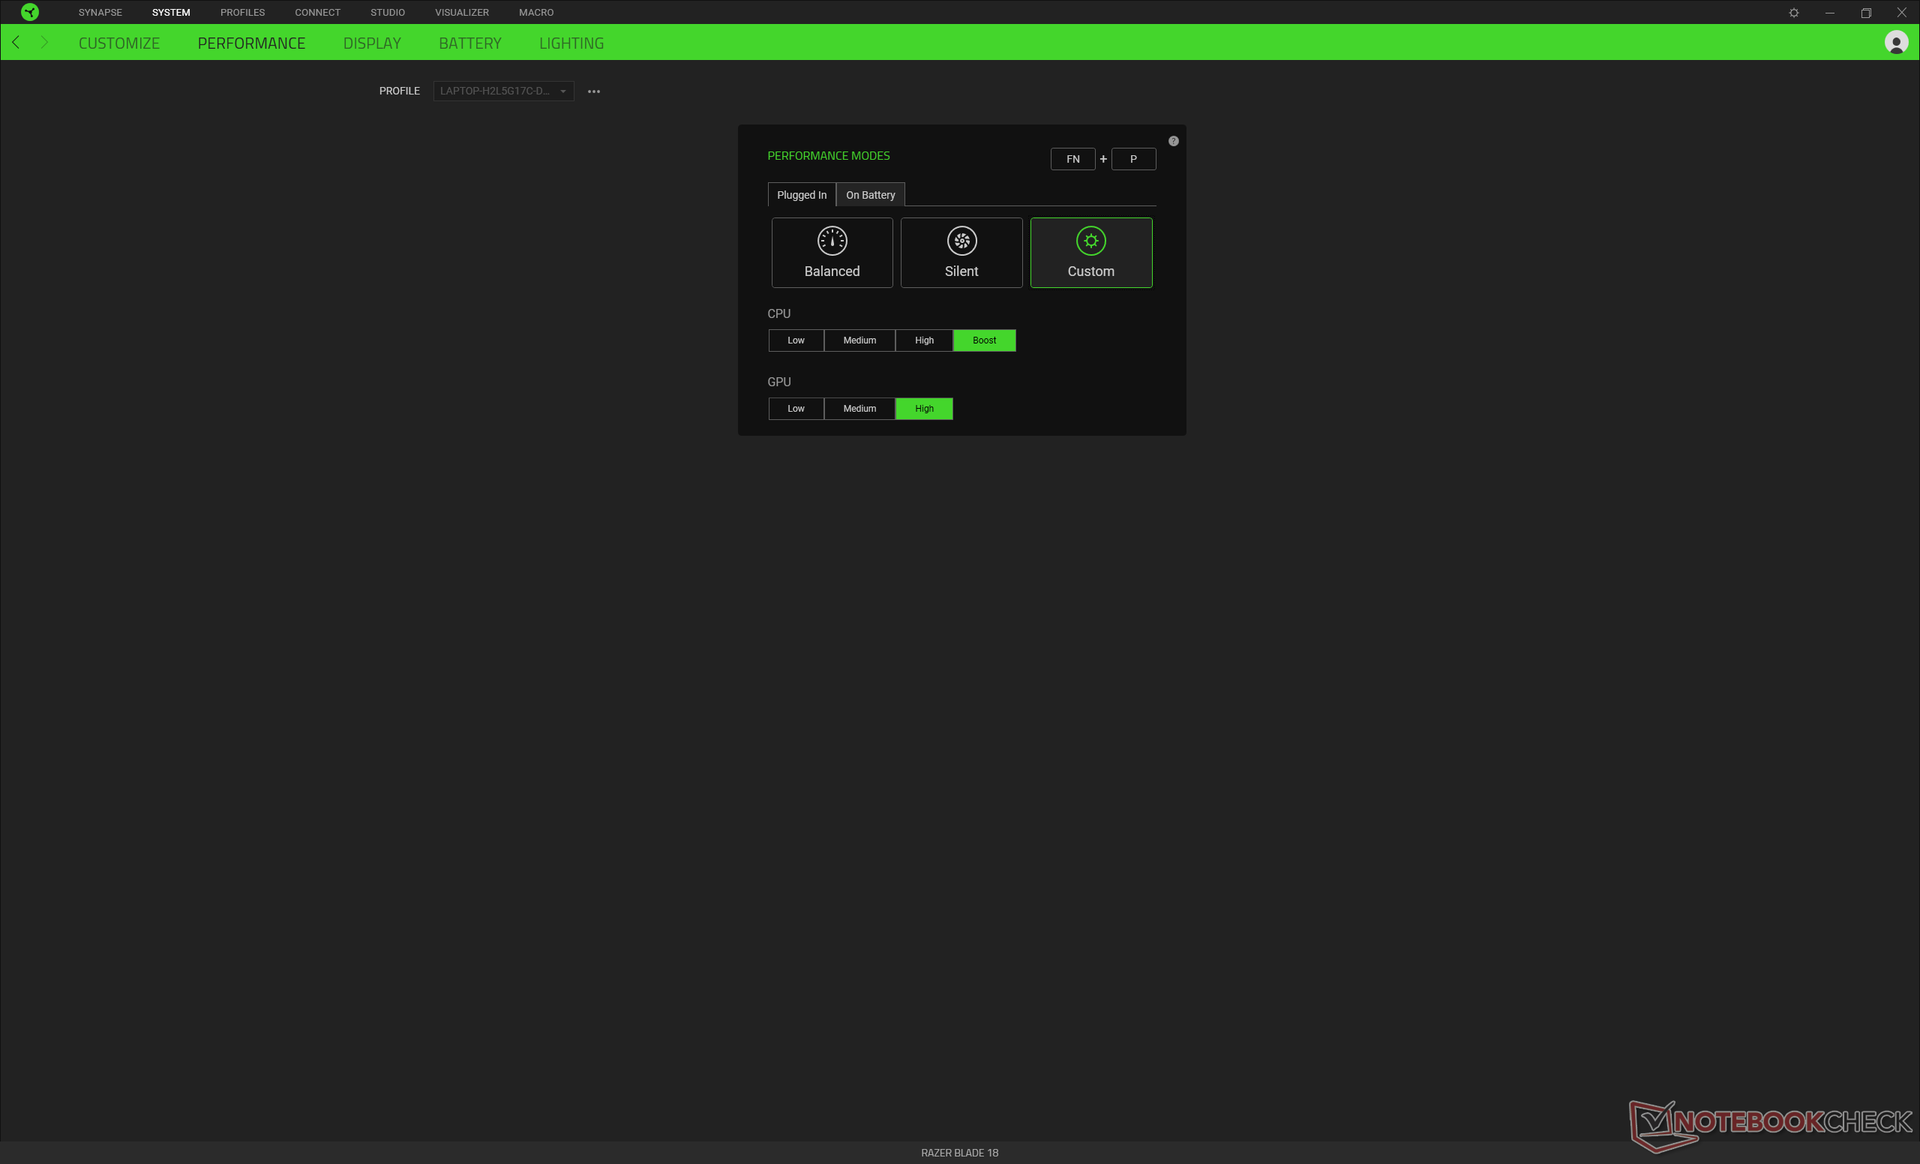
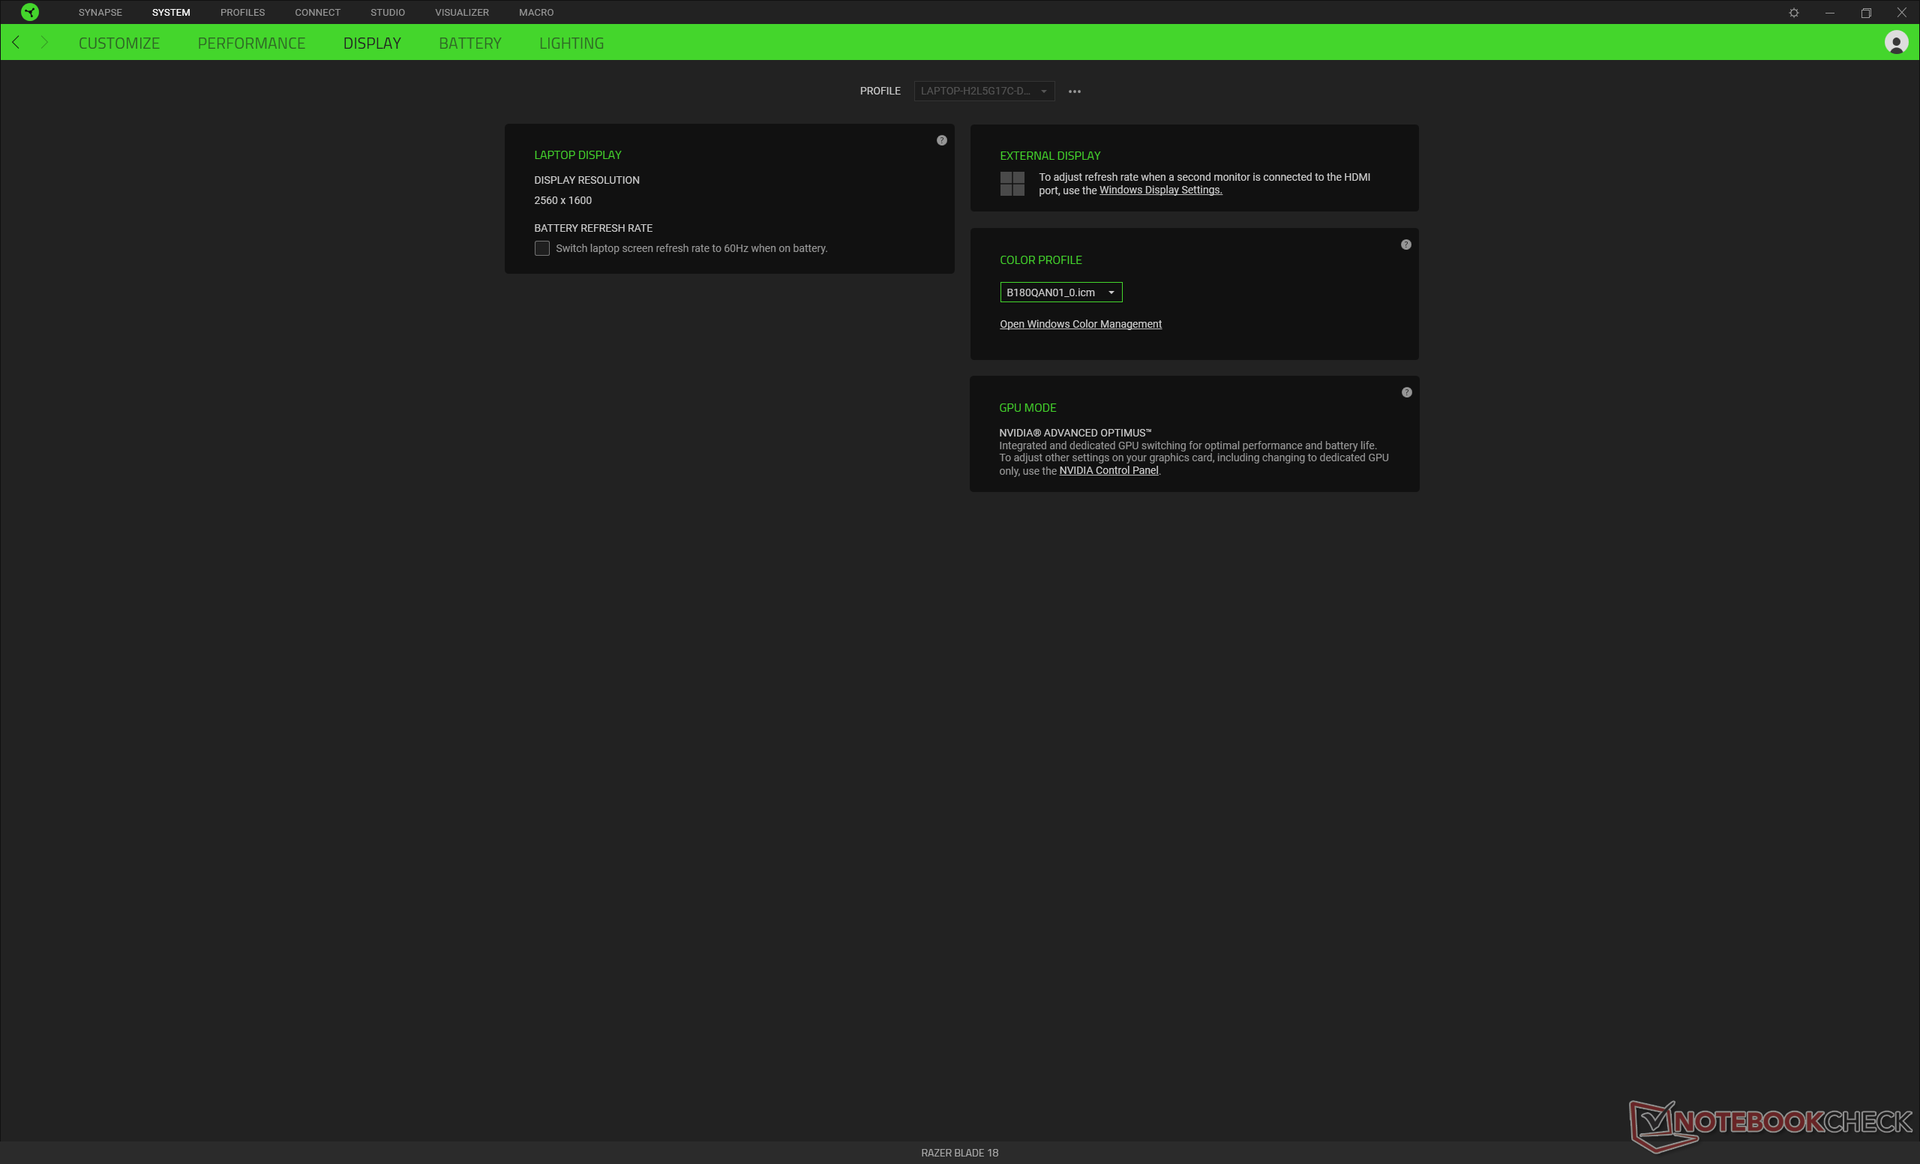
Vi ställde vår enhet till prestandaläge via Windows och ställde CPU och GPU till Boost respektive High via Razer Synapse-programvaran, vilket visas nedan. Det rekommenderas att användarna bekantar sig med Synapse eftersom det är navet för att justera alla RGB-ljuseffekter, prestandaprofiler, makron och andra hjälpfunktioner. Programvaran är tyvärr inte alltid tillförlitlig, eftersom den ibland inte svarar eller inte startar alls om det inte finns någon internetuppkoppling.
Blade 18 har inte stöd för MUX eller Advanced Optimus till skillnad från Blade 16. Vår enhet skulle inte heller stödja G-Sync trots vad Razer annonserar. Vi har kontaktat Razer angående bristen på G-Sync och kommer att uppdatera det här avsnittet när det är lämpligt.
Processor
CPU-prestanda ligger inom bara några få procentenheter från Blade 16 eller GT77, som båda är utrustade med samma Core i9-13950HX processor. CPU:n här verkar alltså inte lida av några större strypningsproblem. Flertrådsprestanda är ungefär 45 procent snabbare än föregående generation.Core i9-12950HX för att vara i nivå med en stationär dator i standardutförande Core i9-12900K. Prestandasprånget från generation till generation är betydande i detta avseende.
Våra vanliga CineBench R15 xT loop-testresultat ingår inte nedan eftersom resultaten är ovanligt låga och inte representativa för processorns prestanda. Att köra CineBench R15 aktiverar både CPU och dGPU och därför kan CPU:ns prestanda ibland vara effektbegränsad av dGPU:n. Det här problemet kan observeras på några andra bärbara datorer också. CineBench R23 är ett rent CPU-benchmark som inte aktiverar dGPU:n och därför ges dessa resultat nedan istället.
Cinebench R23 Multi Loop
Cinebench R23: Multi Core | Single Core
Cinebench R20: CPU (Multi Core) | CPU (Single Core)
Cinebench R15: CPU Multi 64Bit | CPU Single 64Bit
Blender: v2.79 BMW27 CPU
7-Zip 18.03: 7z b 4 | 7z b 4 -mmt1
Geekbench 5.5: Multi-Core | Single-Core
HWBOT x265 Benchmark v2.2: 4k Preset
LibreOffice : 20 Documents To PDF
R Benchmark 2.5: Overall mean
* ... mindre är bättre
AIDA64: FP32 Ray-Trace | FPU Julia | CPU SHA3 | CPU Queen | FPU SinJulia | FPU Mandel | CPU AES | CPU ZLib | FP64 Ray-Trace | CPU PhotoWorxx
| Performance rating | |
| MSI Titan GT77 HX 13VI | |
| Razer Blade 18 RTX 4070 | |
| Genomsnitt Intel Core i9-13950HX | |
| Asus ROG Strix Scar 17 SE G733CX-LL014W | |
| Alienware m17 R5 (R9 6900HX, RX 6850M XT) | |
| Gigabyte G7 KE | |
| Razer Blade 17 Early 2022 | |
| AIDA64 / FP32 Ray-Trace | |
| MSI Titan GT77 HX 13VI | |
| Razer Blade 18 RTX 4070 | |
| Genomsnitt Intel Core i9-13950HX (17993 - 28957, n=9) | |
| Asus ROG Strix Scar 17 SE G733CX-LL014W | |
| Alienware m17 R5 (R9 6900HX, RX 6850M XT) | |
| Gigabyte G7 KE | |
| Razer Blade 17 Early 2022 | |
| AIDA64 / FPU Julia | |
| MSI Titan GT77 HX 13VI | |
| Razer Blade 18 RTX 4070 | |
| Genomsnitt Intel Core i9-13950HX (89362 - 144303, n=9) | |
| Alienware m17 R5 (R9 6900HX, RX 6850M XT) | |
| Asus ROG Strix Scar 17 SE G733CX-LL014W | |
| Gigabyte G7 KE | |
| Razer Blade 17 Early 2022 | |
| AIDA64 / CPU SHA3 | |
| MSI Titan GT77 HX 13VI | |
| Razer Blade 18 RTX 4070 | |
| Genomsnitt Intel Core i9-13950HX (4518 - 7093, n=9) | |
| Asus ROG Strix Scar 17 SE G733CX-LL014W | |
| Alienware m17 R5 (R9 6900HX, RX 6850M XT) | |
| Gigabyte G7 KE | |
| Razer Blade 17 Early 2022 | |
| AIDA64 / CPU Queen | |
| MSI Titan GT77 HX 13VI | |
| Razer Blade 18 RTX 4070 | |
| Genomsnitt Intel Core i9-13950HX (131931 - 140103, n=8) | |
| Alienware m17 R5 (R9 6900HX, RX 6850M XT) | |
| Asus ROG Strix Scar 17 SE G733CX-LL014W | |
| Razer Blade 17 Early 2022 | |
| Gigabyte G7 KE | |
| AIDA64 / FPU SinJulia | |
| MSI Titan GT77 HX 13VI | |
| Razer Blade 18 RTX 4070 | |
| Genomsnitt Intel Core i9-13950HX (12318 - 17057, n=9) | |
| Alienware m17 R5 (R9 6900HX, RX 6850M XT) | |
| Asus ROG Strix Scar 17 SE G733CX-LL014W | |
| Gigabyte G7 KE | |
| Razer Blade 17 Early 2022 | |
| AIDA64 / FPU Mandel | |
| MSI Titan GT77 HX 13VI | |
| Razer Blade 18 RTX 4070 | |
| Genomsnitt Intel Core i9-13950HX (44372 - 71038, n=9) | |
| Alienware m17 R5 (R9 6900HX, RX 6850M XT) | |
| Asus ROG Strix Scar 17 SE G733CX-LL014W | |
| Gigabyte G7 KE | |
| Razer Blade 17 Early 2022 | |
| AIDA64 / CPU AES | |
| Asus ROG Strix Scar 17 SE G733CX-LL014W | |
| Genomsnitt Intel Core i9-13950HX (99981 - 204491, n=9) | |
| MSI Titan GT77 HX 13VI | |
| Razer Blade 18 RTX 4070 | |
| Gigabyte G7 KE | |
| Alienware m17 R5 (R9 6900HX, RX 6850M XT) | |
| Razer Blade 17 Early 2022 | |
| AIDA64 / CPU ZLib | |
| MSI Titan GT77 HX 13VI | |
| Razer Blade 18 RTX 4070 | |
| Genomsnitt Intel Core i9-13950HX (1263 - 2069, n=9) | |
| Asus ROG Strix Scar 17 SE G733CX-LL014W | |
| Gigabyte G7 KE | |
| Alienware m17 R5 (R9 6900HX, RX 6850M XT) | |
| Razer Blade 17 Early 2022 | |
| AIDA64 / FP64 Ray-Trace | |
| MSI Titan GT77 HX 13VI | |
| Razer Blade 18 RTX 4070 | |
| Genomsnitt Intel Core i9-13950HX (9649 - 15573, n=9) | |
| Asus ROG Strix Scar 17 SE G733CX-LL014W | |
| Alienware m17 R5 (R9 6900HX, RX 6850M XT) | |
| Gigabyte G7 KE | |
| Razer Blade 17 Early 2022 | |
| AIDA64 / CPU PhotoWorxx | |
| Razer Blade 18 RTX 4070 | |
| Genomsnitt Intel Core i9-13950HX (40233 - 50864, n=9) | |
| Asus ROG Strix Scar 17 SE G733CX-LL014W | |
| MSI Titan GT77 HX 13VI | |
| Razer Blade 17 Early 2022 | |
| Alienware m17 R5 (R9 6900HX, RX 6850M XT) | |
| Gigabyte G7 KE | |
Systemets prestanda
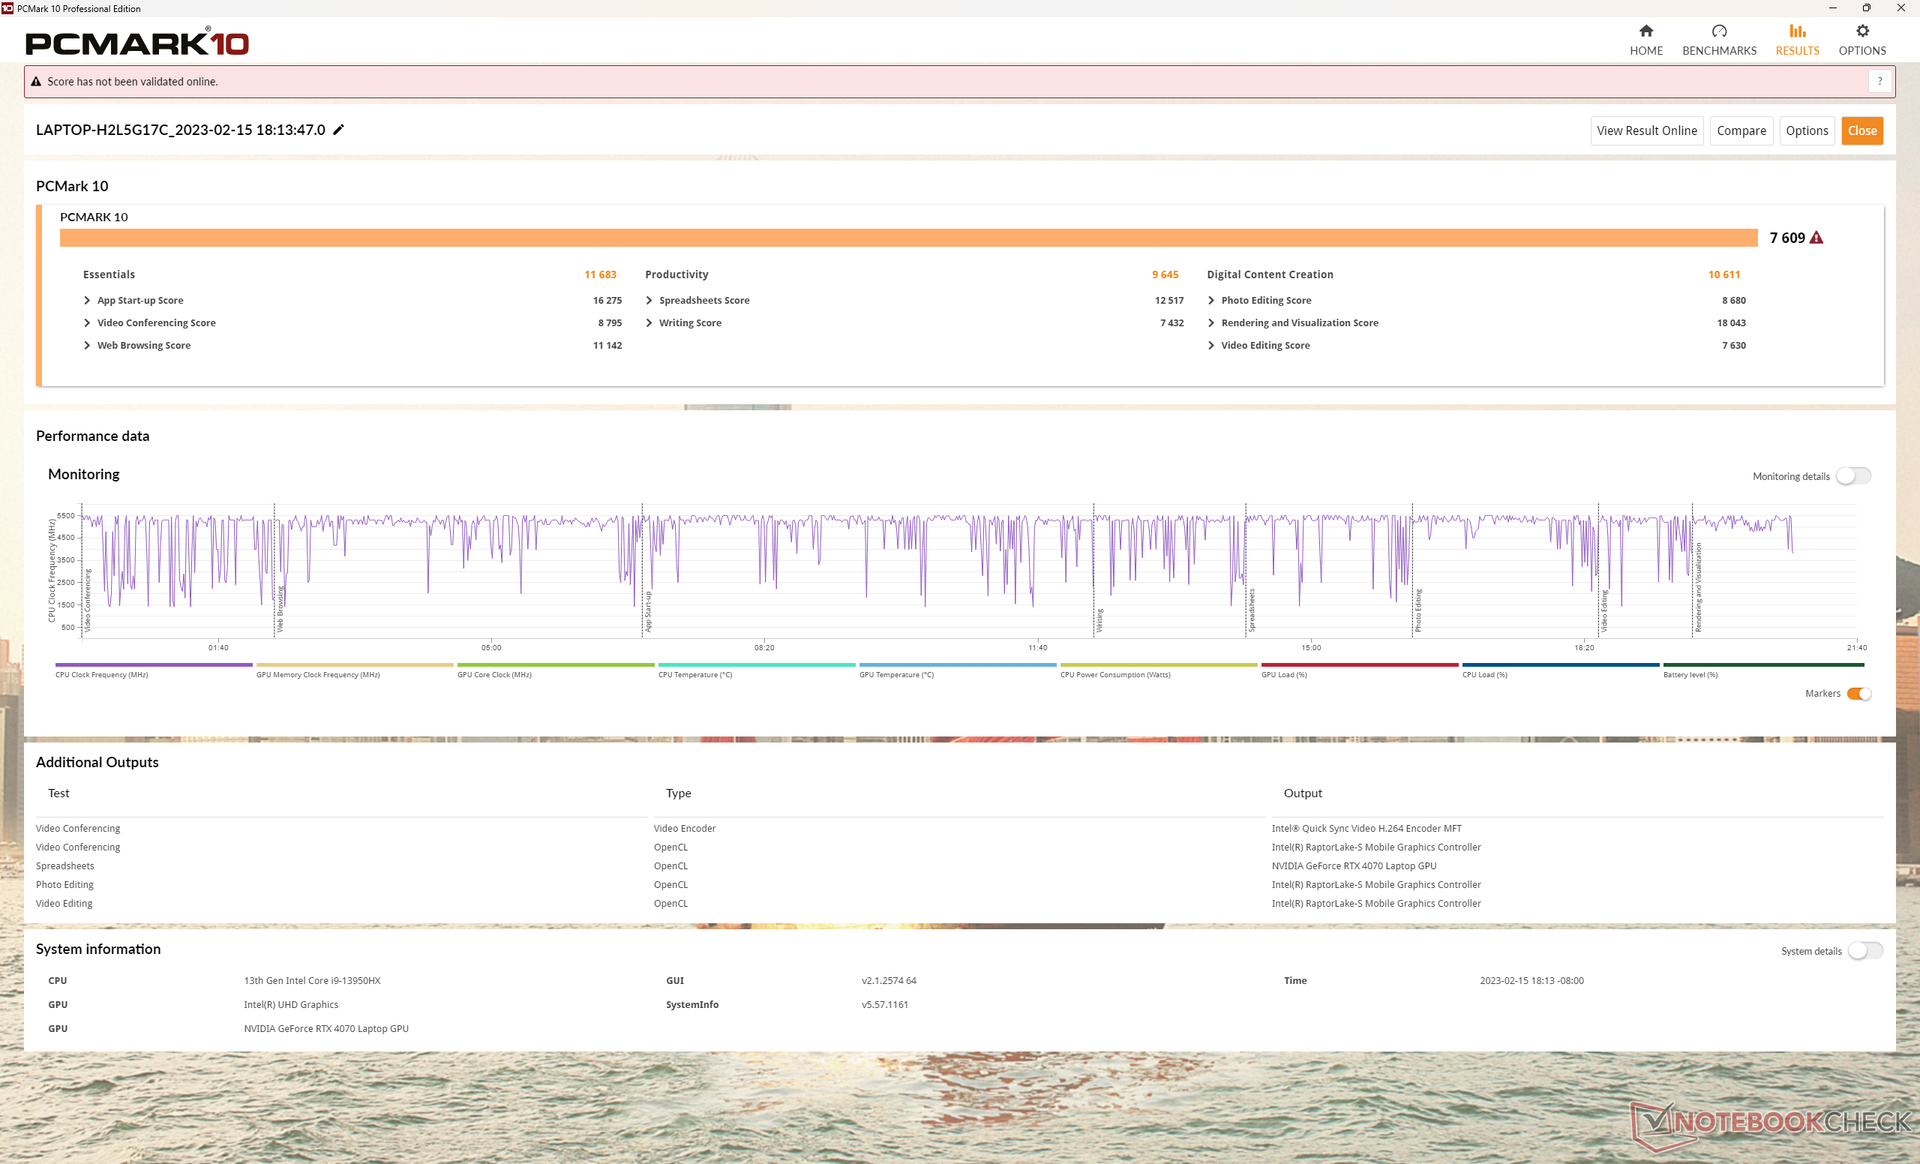
PCMark 10-resultaten är genomgående högre än på 2022 Blade 17 även om marginalerna är små. The Blade 16 och MSI GT77 får bättre resultat eftersom de har snabbare RTX 4080- respektive 4090-GPU:er.
CrossMark: Overall | Productivity | Creativity | Responsiveness
| PCMark 10 / Score | |
| MSI Titan GT77 HX 13VI | |
| Razer Blade 18 RTX 4070 | |
| Genomsnitt Intel Core i9-13950HX, NVIDIA GeForce RTX 4070 Laptop GPU (n=1) | |
| Alienware m17 R5 (R9 6900HX, RX 6850M XT) | |
| Asus ROG Strix Scar 17 SE G733CX-LL014W | |
| Razer Blade 17 Early 2022 | |
| Gigabyte G7 KE | |
| PCMark 10 / Essentials | |
| MSI Titan GT77 HX 13VI | |
| Razer Blade 18 RTX 4070 | |
| Genomsnitt Intel Core i9-13950HX, NVIDIA GeForce RTX 4070 Laptop GPU (n=1) | |
| Asus ROG Strix Scar 17 SE G733CX-LL014W | |
| Gigabyte G7 KE | |
| Razer Blade 17 Early 2022 | |
| Alienware m17 R5 (R9 6900HX, RX 6850M XT) | |
| PCMark 10 / Productivity | |
| Asus ROG Strix Scar 17 SE G733CX-LL014W | |
| MSI Titan GT77 HX 13VI | |
| Razer Blade 18 RTX 4070 | |
| Genomsnitt Intel Core i9-13950HX, NVIDIA GeForce RTX 4070 Laptop GPU (n=1) | |
| Razer Blade 17 Early 2022 | |
| Alienware m17 R5 (R9 6900HX, RX 6850M XT) | |
| Gigabyte G7 KE | |
| PCMark 10 / Digital Content Creation | |
| MSI Titan GT77 HX 13VI | |
| Alienware m17 R5 (R9 6900HX, RX 6850M XT) | |
| Razer Blade 18 RTX 4070 | |
| Genomsnitt Intel Core i9-13950HX, NVIDIA GeForce RTX 4070 Laptop GPU (n=1) | |
| Razer Blade 17 Early 2022 | |
| Asus ROG Strix Scar 17 SE G733CX-LL014W | |
| Gigabyte G7 KE | |
| CrossMark / Overall | |
| MSI Titan GT77 HX 13VI | |
| Razer Blade 18 RTX 4070 | |
| Genomsnitt Intel Core i9-13950HX, NVIDIA GeForce RTX 4070 Laptop GPU (n=1) | |
| Asus ROG Strix Scar 17 SE G733CX-LL014W | |
| Gigabyte G7 KE | |
| Razer Blade 17 Early 2022 | |
| Alienware m17 R5 (R9 6900HX, RX 6850M XT) | |
| CrossMark / Productivity | |
| MSI Titan GT77 HX 13VI | |
| Razer Blade 18 RTX 4070 | |
| Genomsnitt Intel Core i9-13950HX, NVIDIA GeForce RTX 4070 Laptop GPU (n=1) | |
| Asus ROG Strix Scar 17 SE G733CX-LL014W | |
| Gigabyte G7 KE | |
| Razer Blade 17 Early 2022 | |
| Alienware m17 R5 (R9 6900HX, RX 6850M XT) | |
| CrossMark / Creativity | |
| MSI Titan GT77 HX 13VI | |
| Razer Blade 18 RTX 4070 | |
| Genomsnitt Intel Core i9-13950HX, NVIDIA GeForce RTX 4070 Laptop GPU (n=1) | |
| Asus ROG Strix Scar 17 SE G733CX-LL014W | |
| Razer Blade 17 Early 2022 | |
| Gigabyte G7 KE | |
| Alienware m17 R5 (R9 6900HX, RX 6850M XT) | |
| CrossMark / Responsiveness | |
| Gigabyte G7 KE | |
| Asus ROG Strix Scar 17 SE G733CX-LL014W | |
| Razer Blade 18 RTX 4070 | |
| Genomsnitt Intel Core i9-13950HX, NVIDIA GeForce RTX 4070 Laptop GPU (n=1) | |
| MSI Titan GT77 HX 13VI | |
| Razer Blade 17 Early 2022 | |
| Alienware m17 R5 (R9 6900HX, RX 6850M XT) | |
| PCMark 10 Score | 7609 poäng | |
Hjälp | ||
| AIDA64 / Memory Copy | |
| Razer Blade 18 RTX 4070 | |
| Genomsnitt Intel Core i9-13950HX (61938 - 78813, n=9) | |
| MSI Titan GT77 HX 13VI | |
| Asus ROG Strix Scar 17 SE G733CX-LL014W | |
| Razer Blade 17 Early 2022 | |
| Alienware m17 R5 (R9 6900HX, RX 6850M XT) | |
| Gigabyte G7 KE | |
| AIDA64 / Memory Read | |
| Razer Blade 18 RTX 4070 | |
| Genomsnitt Intel Core i9-13950HX (62368 - 86831, n=9) | |
| Asus ROG Strix Scar 17 SE G733CX-LL014W | |
| MSI Titan GT77 HX 13VI | |
| Razer Blade 17 Early 2022 | |
| Alienware m17 R5 (R9 6900HX, RX 6850M XT) | |
| Gigabyte G7 KE | |
| AIDA64 / Memory Write | |
| Razer Blade 18 RTX 4070 | |
| Genomsnitt Intel Core i9-13950HX (59501 - 80441, n=9) | |
| Asus ROG Strix Scar 17 SE G733CX-LL014W | |
| MSI Titan GT77 HX 13VI | |
| Razer Blade 17 Early 2022 | |
| Alienware m17 R5 (R9 6900HX, RX 6850M XT) | |
| Gigabyte G7 KE | |
| AIDA64 / Memory Latency | |
| Alienware m17 R5 (R9 6900HX, RX 6850M XT) | |
| MSI Titan GT77 HX 13VI | |
| Gigabyte G7 KE | |
| Genomsnitt Intel Core i9-13950HX (84.4 - 99.5, n=9) | |
| Asus ROG Strix Scar 17 SE G733CX-LL014W | |
| Razer Blade 18 RTX 4070 | |
* ... mindre är bättre
DPC-latenstid
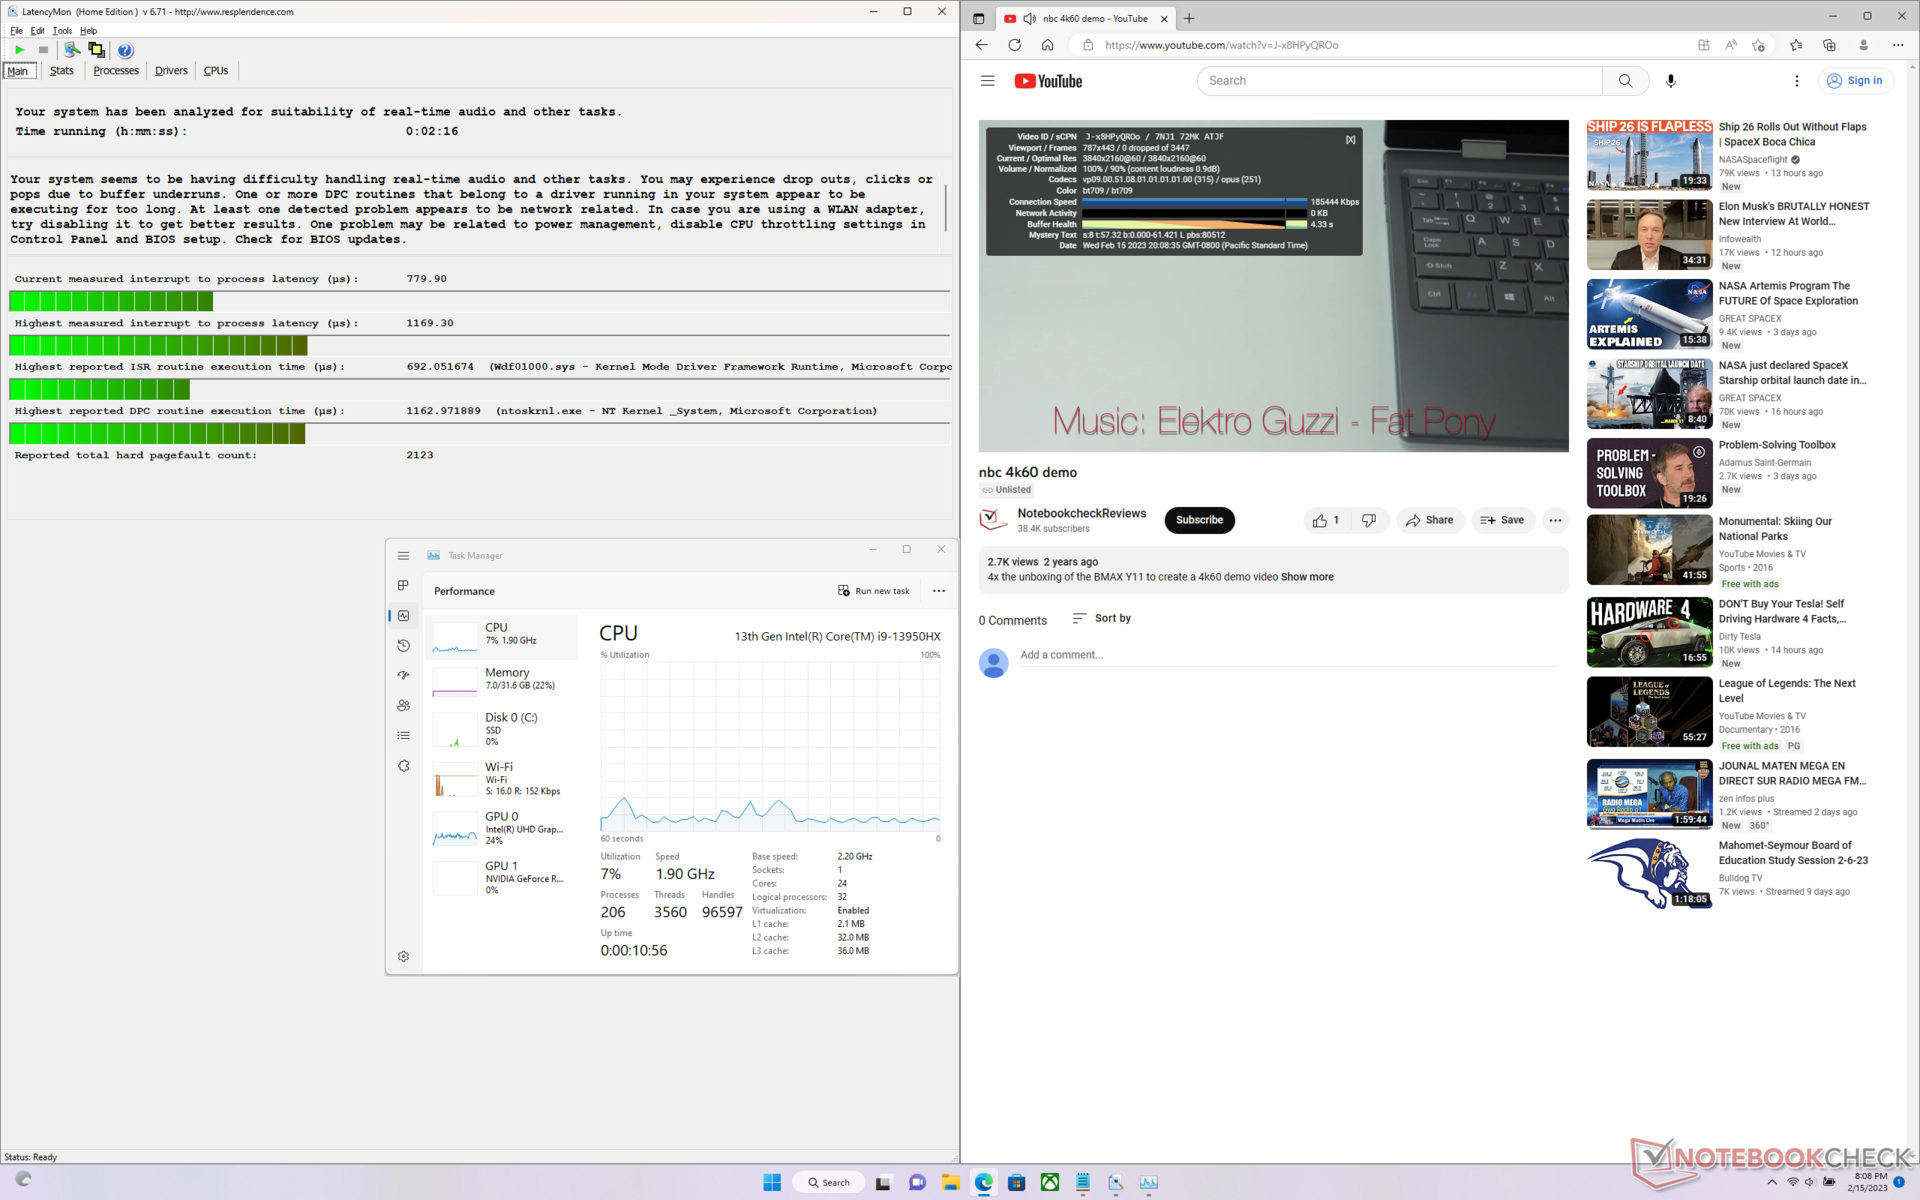
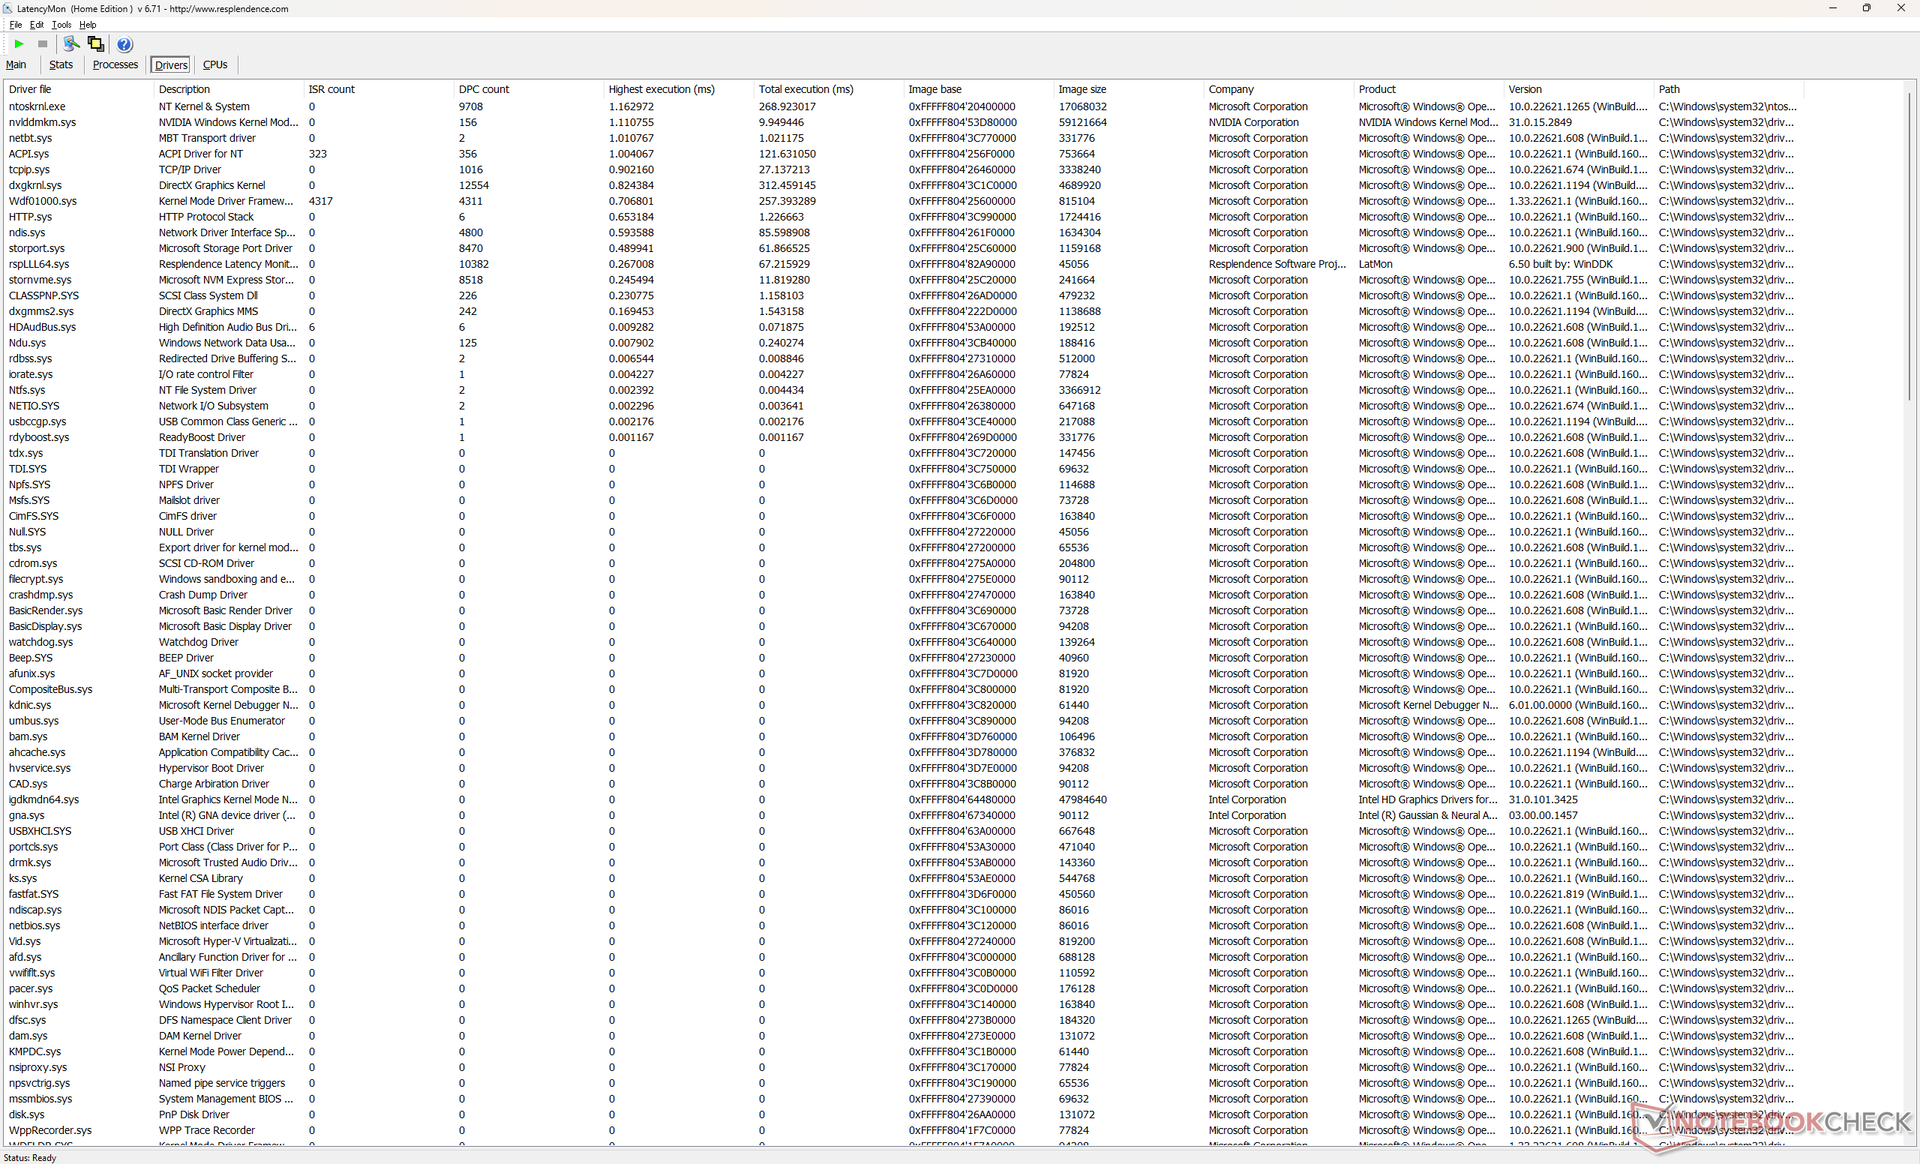
LatencyMon avslöjar små DPC-problem när du öppnar flera webbläsarflikar på vår hemsida. uppspelning av 4K-video vid 60 FPS är annars felfri med både låg CPU- och GPU-användning.
| DPC Latencies / LatencyMon - interrupt to process latency (max), Web, Youtube, Prime95 | |
| MSI Titan GT77 HX 13VI | |
| Asus ROG Strix Scar 17 SE G733CX-LL014W | |
| Gigabyte G7 KE | |
| Alienware m17 R5 (R9 6900HX, RX 6850M XT) | |
| Razer Blade 18 RTX 4070 | |
| Razer Blade 17 Early 2022 | |
* ... mindre är bättre
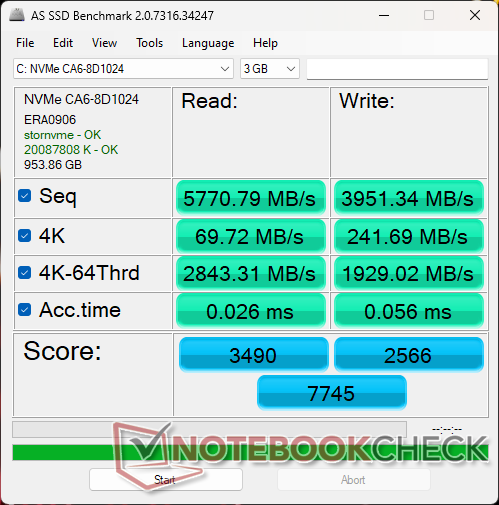
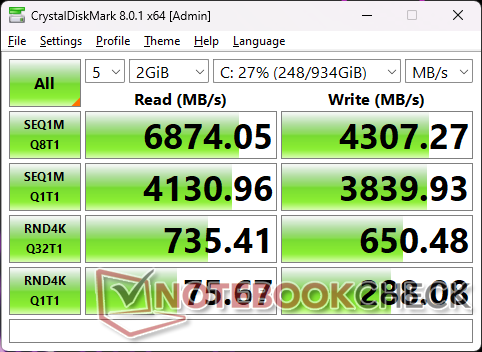
Lagringsenheter - upp till två SSD-enheter
Vår testenhet levereras med samma 1 TB SSSTC CA6-8D1024 PCIe4 x4 NVMe SSD som finns på Alienware m17 R5. Överföringshastigheten är jämförbar med den populära Samsung PM9A1 med stabila sekventiella läs- och skrivhastigheter som närmar sig 6900 MB/s respektive 4300 MB/s. Razer inkluderar en termisk kudde för var och en av de två SSD-platserna för att avleda värme till metallbottenpanelen.

| Drive Performance rating - Percent | |
| Asus ROG Strix Scar 17 SE G733CX-LL014W | |
| Gigabyte G7 KE | |
| Razer Blade 17 Early 2022 | |
| MSI Titan GT77 HX 13VI | |
| Razer Blade 18 RTX 4070 | |
| Alienware m17 R5 (R9 6900HX, RX 6850M XT) | |
* ... mindre är bättre
Disk Throttling: DiskSpd Read Loop, Queue Depth 8
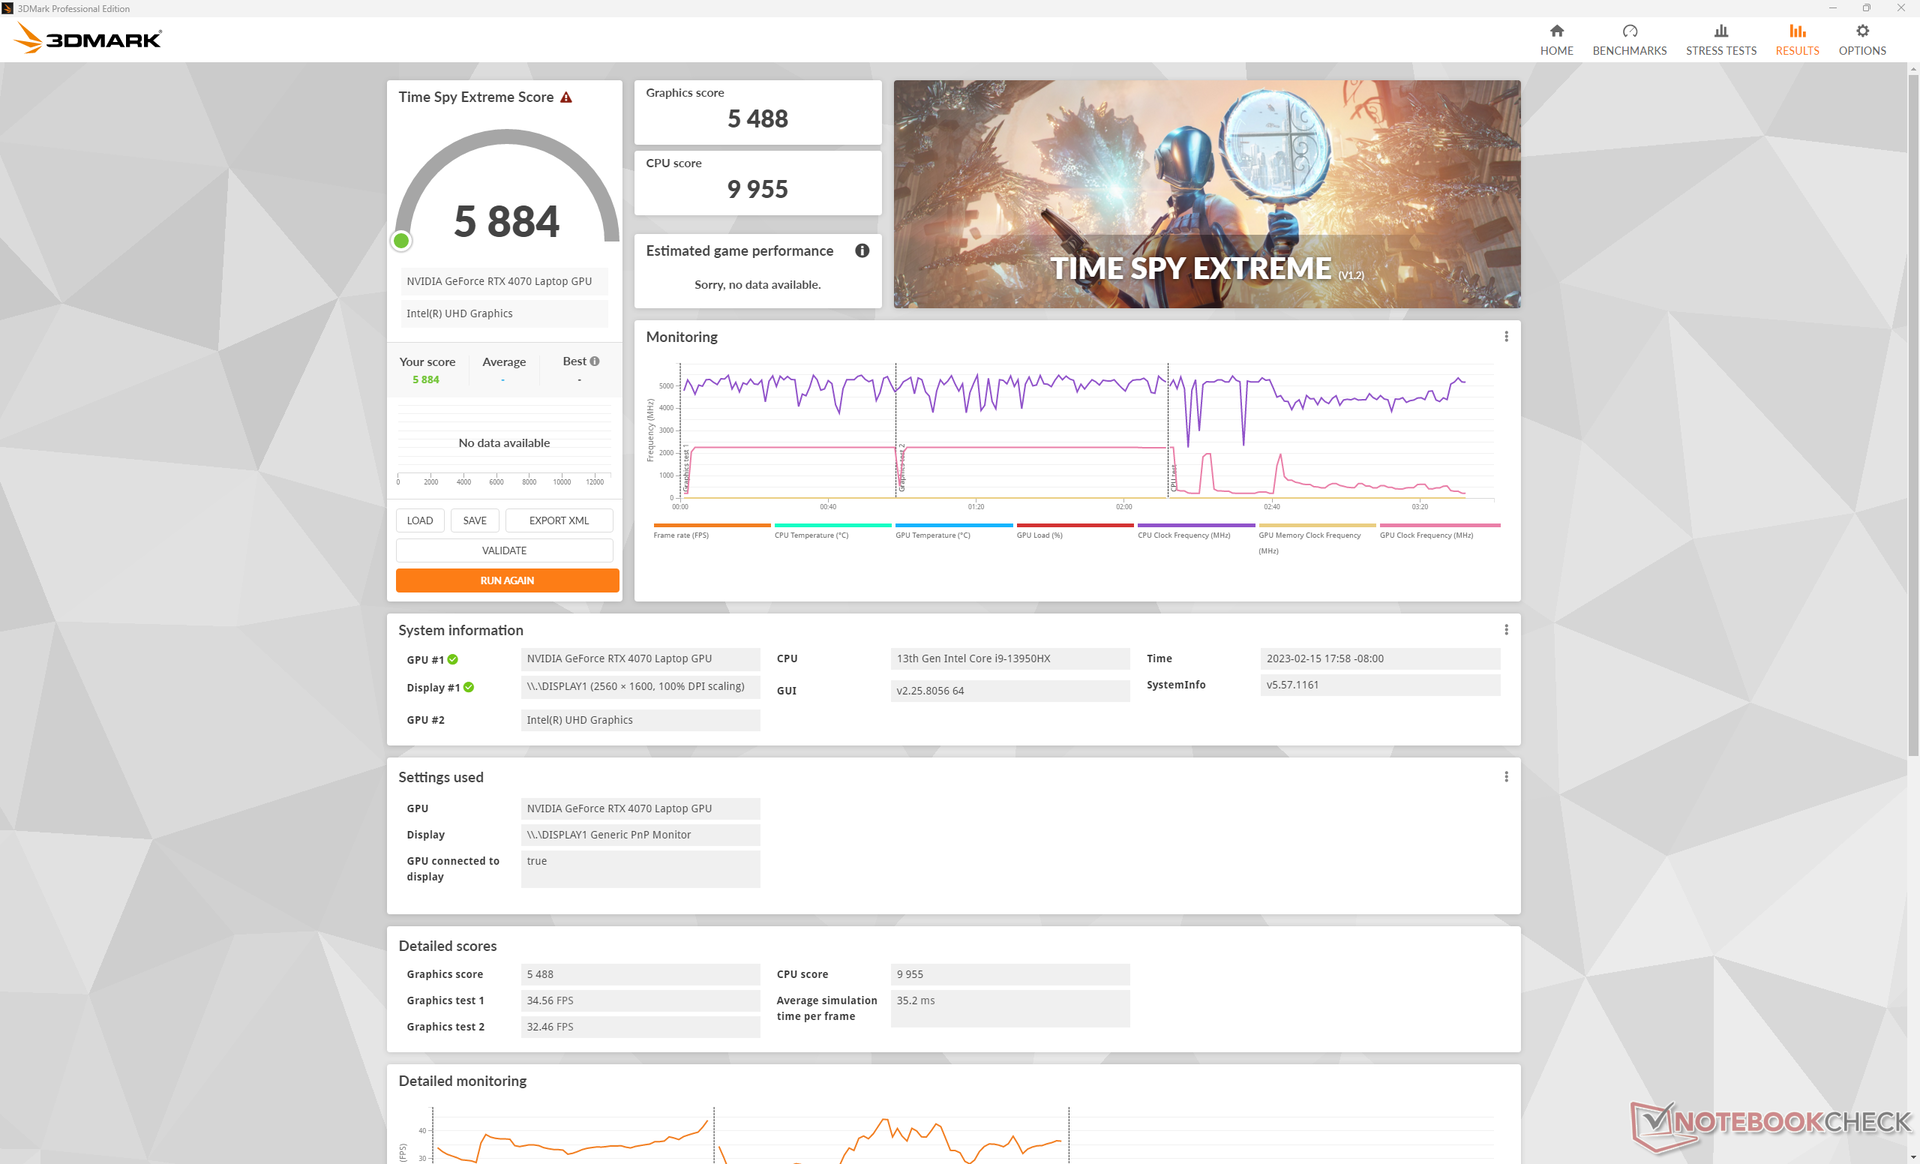
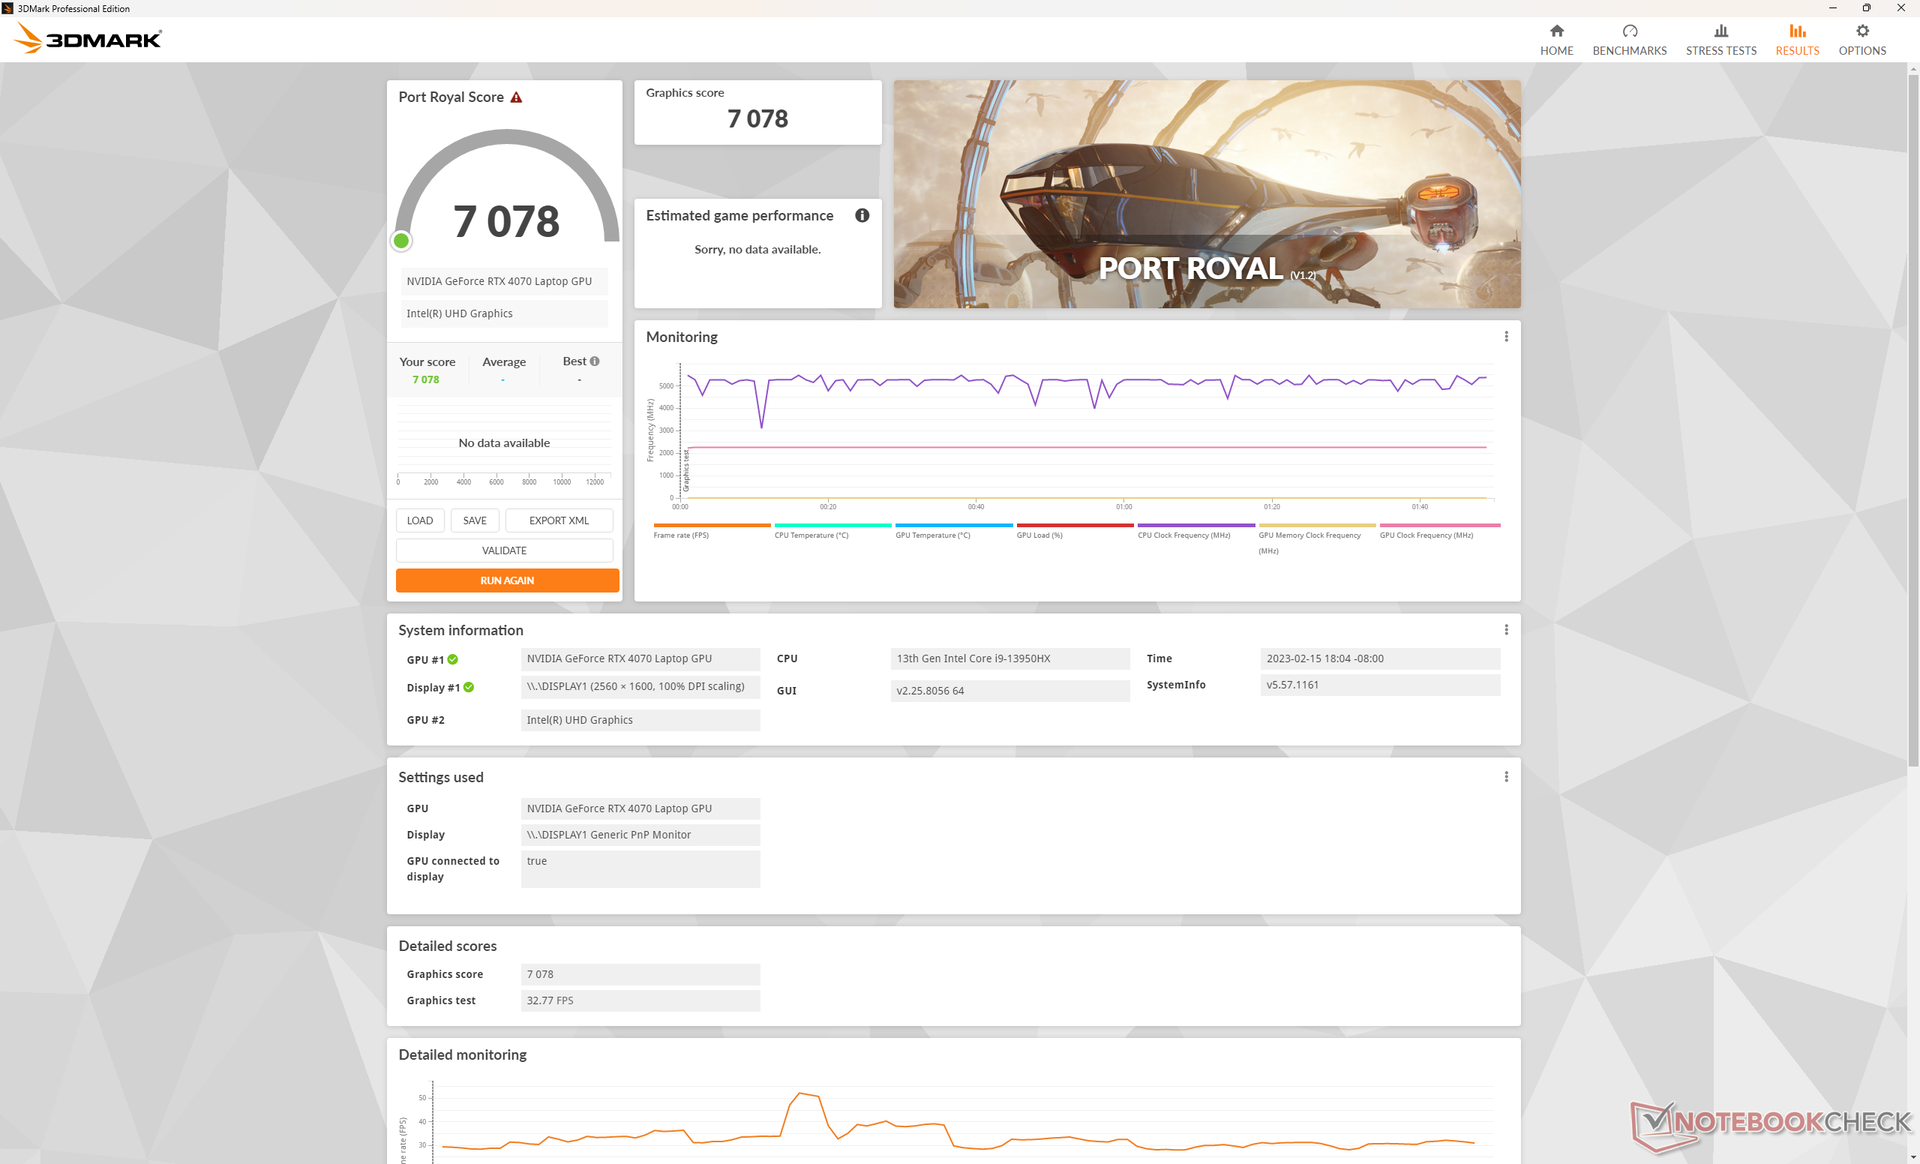
GPU-prestanda - liknande prestanda som en stationär GeForce RTX 3070
Den 140 Wmobil GeForce RTX 4070 sitter bekvämt mellan mobila RTX 3080 ochmobila RTX 3080 Ti när det gäller rå prestanda. Det är bara cirka 10-20 procent snabbare än den utgående mobila RTX 3070, vilket dock är en liten besvikelse när man betänker att mobila RTX 4080 är cirka 40-50 procent snabbare än mobila RTX 3080. Detta innebär att prestandaklyftan mellan mobila RTX 4070 och mobila RTX 4080 är mer betydande vid 40 till 60 procent.
Jämfört med stationära GPU:er är mobila RTX 4070 cirka 5-10 procent långsammare än mobila RTX 4070 stationära RTX 3070 som lanserades för tre år sedan.
Ett stort försäljningsargument för GeForce 40 GPU:er är deras stöd för ramgenerering eller DLSS 3. Tyvärr uppvisade vår Blade 18 RTX 4070-testenhet problem när den körde spel som stöds med DLSS 3 aktiverat på en extern HDMI- eller USB-C 4K-skärm. Bildfrekvensen sjönk till <30 FPS på alla testade titlar utan anledning, medan Blade 16 RTX 4080 inte hade några sådana problem. Märkligt nog kördes DLSS 3 helt okej på den interna Blade 18-skärmen. Vi har kontaktat Razer för att hitta en möjlig lösning och kommer att uppdatera det här avsnittet när det är lämpligt. För tillfället vill du dock spela spel på den interna skärmen om DLSS 3 är aktiverat.
Ytterligare spel kommer att benchmarkas under de kommande dagarna.
| 3DMark Performance rating - Percent | |
| KFA2 GeForce RTX 4080 SG | |
| KFA2 GeForce RTX 4070 Ti SG | |
| MSI Titan GT77 HX 13VI | |
| Razer Blade 16 Early 2023 | |
| MSI GeForce RTX 3070 Gaming X Trio -1! | |
| Alienware m17 R5 (R9 6900HX, RX 6850M XT) -3! | |
| Razer Blade 17 Early 2022 -1! | |
| Alienware x17 RTX 3080 P48E -1! | |
| Genomsnitt NVIDIA GeForce RTX 4070 Laptop GPU | |
| Razer Blade 18 RTX 4070 | |
| MSI Pulse GL76 12UGK | |
| Gigabyte G7 KE | |
| MSI GL75 10SFR -1! | |
| 3DMark 11 - 1280x720 Performance GPU | |
| KFA2 GeForce RTX 4080 SG | |
| KFA2 GeForce RTX 4070 Ti SG | |
| MSI Titan GT77 HX 13VI | |
| Razer Blade 16 Early 2023 | |
| Razer Blade 17 Early 2022 | |
| Alienware x17 RTX 3080 P48E | |
| Alienware m17 R5 (R9 6900HX, RX 6850M XT) | |
| MSI GeForce RTX 3070 Gaming X Trio | |
| Genomsnitt NVIDIA GeForce RTX 4070 Laptop GPU (24229 - 46434, n=67) | |
| Razer Blade 18 RTX 4070 | |
| MSI Pulse GL76 12UGK | |
| Gigabyte G7 KE | |
| MSI GL75 10SFR | |
| 3DMark 11 Performance | 34754 poäng | |
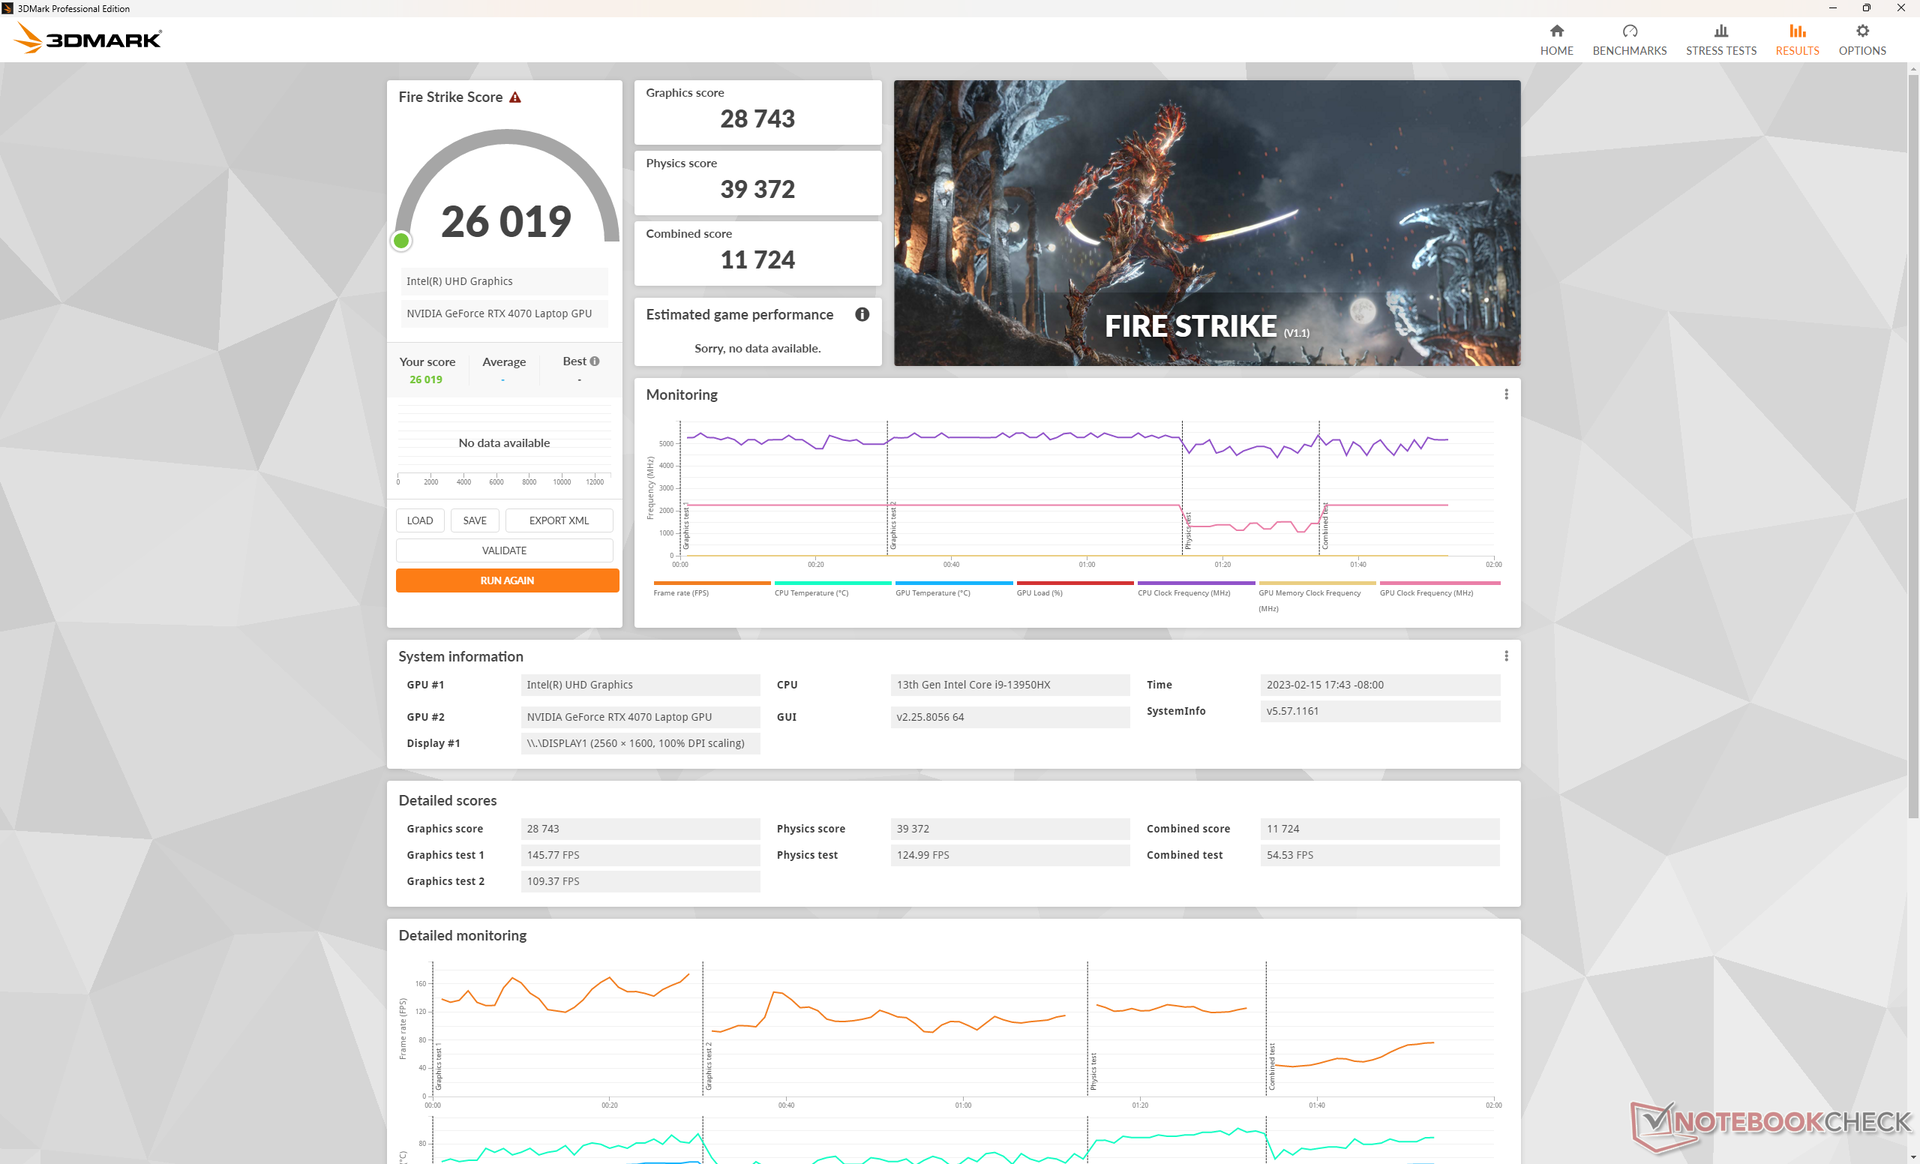
| 3DMark Fire Strike Score | 26019 poäng | |
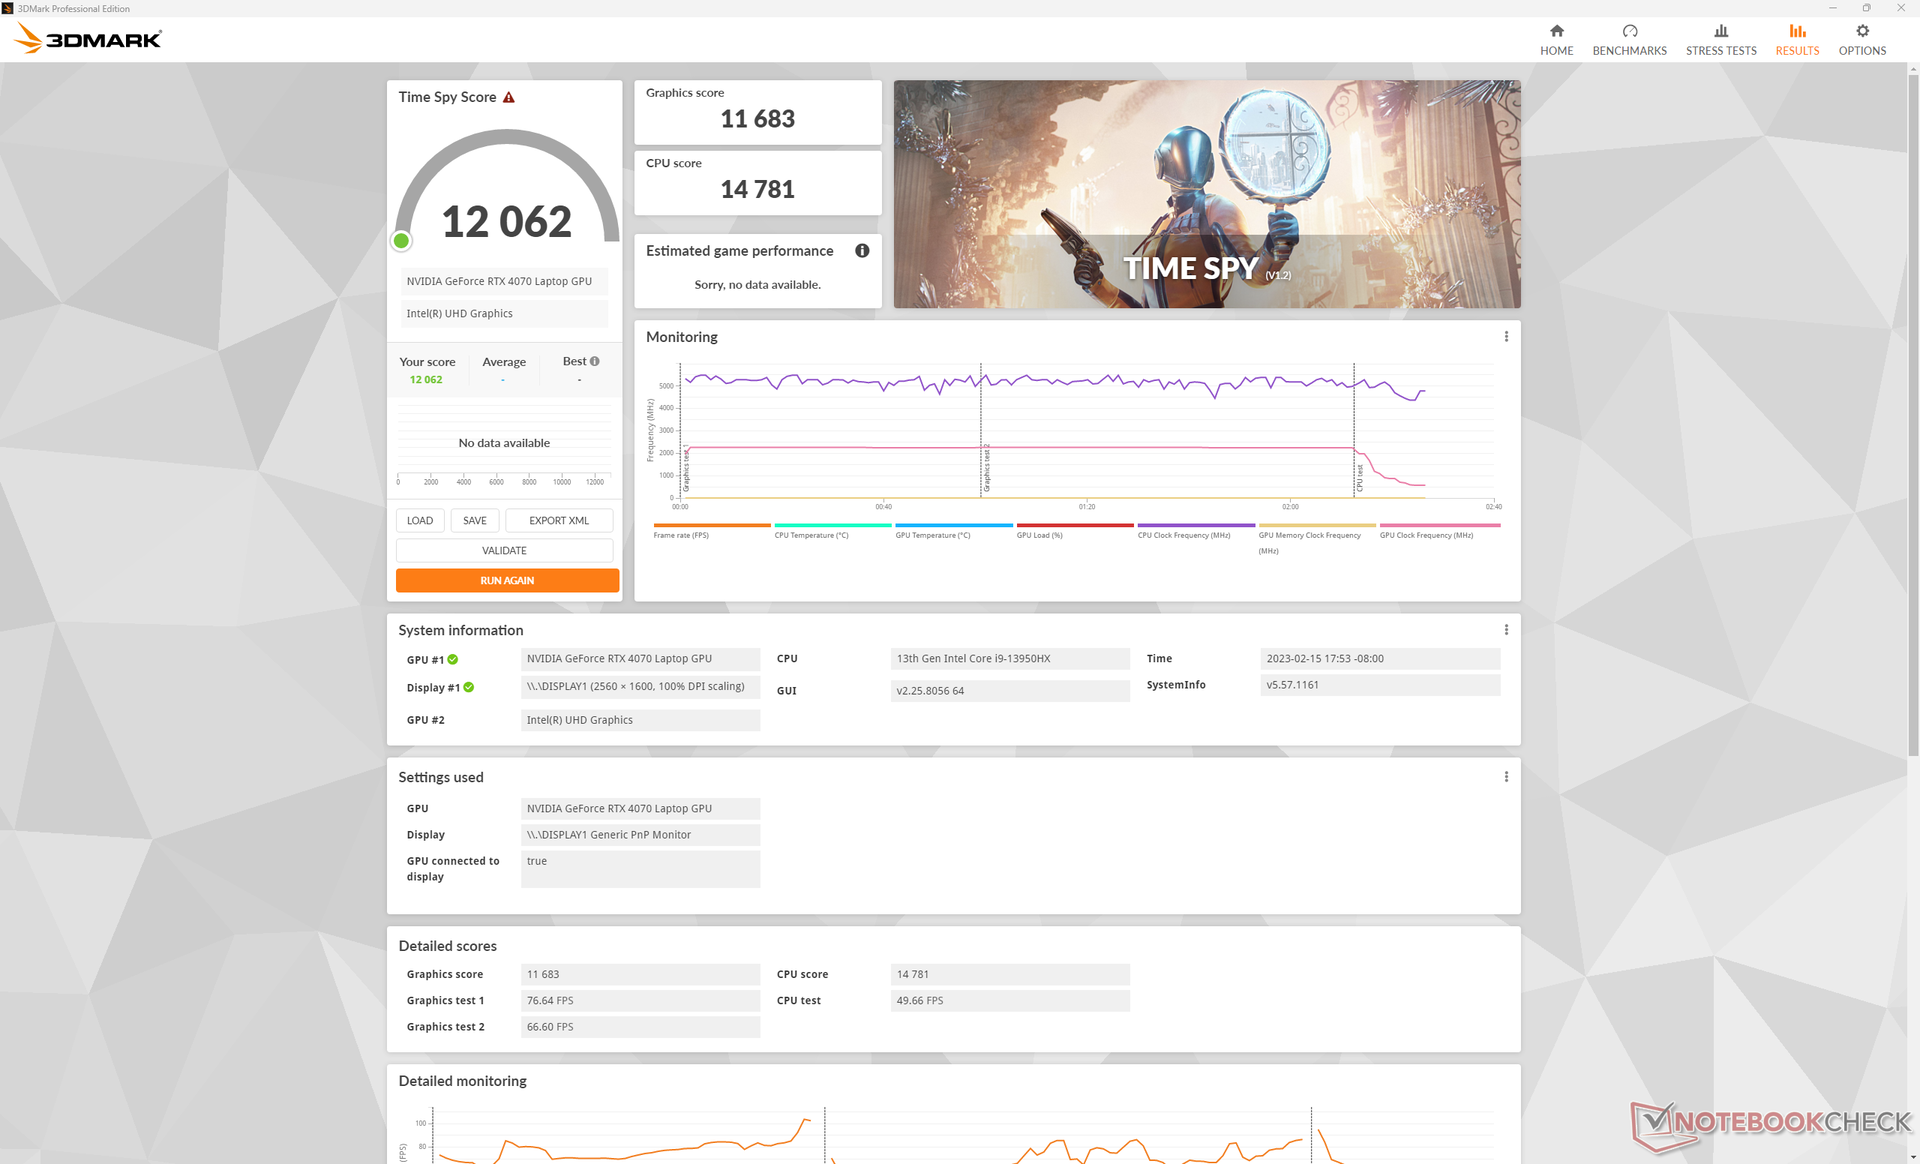
| 3DMark Time Spy Score | 12062 poäng | |
Hjälp | ||
* ... mindre är bättre
Tomgångskörning på Witcher 3 i en timme skulle ge stabila bildfrekvenser utan återkommande nedgångar i prestanda, vilket tyder på att bakgrundsprogrammen inte avbryts och att det inte förekommer någon större strypning.
Witcher 3 FPS Chart
| låg | med. | hög | ultra | QHD | 4K | |
|---|---|---|---|---|---|---|
| GTA V (2015) | 186.1 | 184.7 | 181.6 | 121.4 | 87.6 | 88.5 |
| The Witcher 3 (2015) | 617 | 405.9 | 240.9 | 113.9 | 72.5 | |
| Dota 2 Reborn (2015) | 225 | 200 | 191 | 178.6 | 145.5 | |
| Final Fantasy XV Benchmark (2018) | 231 | 166.9 | 115.2 | 82 | 46.6 | |
| X-Plane 11.11 (2018) | 203 | 178.9 | 137.9 | 117.7 | ||
| Strange Brigade (2018) | 464 | 315 | 243 | 208 | 136.7 | 71.9 |
| Metro Exodus (2019) | 208.9 | 139.8 | 109.7 | 86.8 | 69 | 44 |
| Borderlands 3 (2019) | 258.5 | 200.1 | 131.8 | 100.3 | 68.7 | 35.7 |
| Hitman 3 (2021) | 294.3 | 234 | 208.4 | 197.4 | 129.9 | 68.5 |
| Cyberpunk 2077 1.6 (2022) | 147.8 | 125.7 | 111.5 | 92.1 | 54 | 23.3 |
Utsläpp
Systemljud - tyst när du inte spelar
De interna fläktarna är tysta när du kör kravlös belastning som videostreaming eller webbsurfning. Fläktljudet ligger vanligtvis strax under 27 dB(A) mot en tyst bakgrund på 23,5 dB(A) och är i princip ohörbart under de flesta förhållanden. Detta är tystare än väntat med tanke på den enorma storleken och hästkrafterna under trädet.
Om man kör högre belastningar som spel ökar fläktens varvtal långsamt men stadigt innan den stabiliseras vid 48 dB(A). Vid stress till 100 procent användning kan fläktljudet till och med nå upp till 54 dB(A). Det låga 50 dB(A) intervallet är typiskt för de flesta bärbara datorer för spel, inklusive GT77 eller Razers egen Blade 17. Blade 18 är ungefär lika högljudd som sina mindre syskon när den spelar trots storleksskillnaderna.
Ljudnivå
| Låg belastning |
| 23.8 / 23.8 / 26.8 dB(A) |
| Hög belastning |
| 37.3 / 53.5 dB(A) |
 | ||
30 dB tyst 40 dB(A) hörbar 50 dB(A) högt ljud |
||
min: | ||
| Razer Blade 18 RTX 4070 GeForce RTX 4070 Laptop GPU, i9-13950HX, SSSTC CA6-8D1024 | Razer Blade 17 Early 2022 GeForce RTX 3080 Ti Laptop GPU, i9-12900H, Samsung PM9A1 MZVL21T0HCLR | MSI Titan GT77 HX 13VI GeForce RTX 4090 Laptop GPU, i9-13950HX, Samsung PM9A1 MZVL22T0HBLB | Gigabyte G7 KE GeForce RTX 3060 Laptop GPU, i5-12500H, Gigabyte AG470S1TB-SI B10 | Alienware m17 R5 (R9 6900HX, RX 6850M XT) Radeon RX 6850M XT, R9 6900HX, SSSTC CA6-8D1024 | Asus ROG Strix Scar 17 SE G733CX-LL014W GeForce RTX 3080 Ti Laptop GPU, i9-12950HX, Samsung PM9A1 MZVL22T0HBLB | |
|---|---|---|---|---|---|---|
| Noise | -12% | -17% | -26% | 0% | 5% | |
| av / miljö * (dB) | 23.5 | 26 -11% | 24.6 -5% | 27 -15% | 23 2% | 23.9 -2% |
| Idle Minimum * (dB) | 23.8 | 26 -9% | 29.2 -23% | 27 -13% | 23 3% | 23.9 -0% |
| Idle Average * (dB) | 23.8 | 27 -13% | 29.2 -23% | 35 -47% | 28.11 -18% | 23.9 -0% |
| Idle Maximum * (dB) | 26.8 | 32 -19% | 29.2 -9% | 38 -42% | 28.11 -5% | 23.9 11% |
| Load Average * (dB) | 37.3 | 50 -34% | 50.7 -36% | 52 -39% | 30.62 18% | 34.3 8% |
| Witcher 3 ultra * (dB) | 48 | 51 -6% | 53.3 -11% | 56 -17% | 49.75 -4% | |
| Load Maximum * (dB) | 53.5 | 51 5% | 61 -14% | 59 -10% | 50.17 6% | 45.9 14% |
* ... mindre är bättre
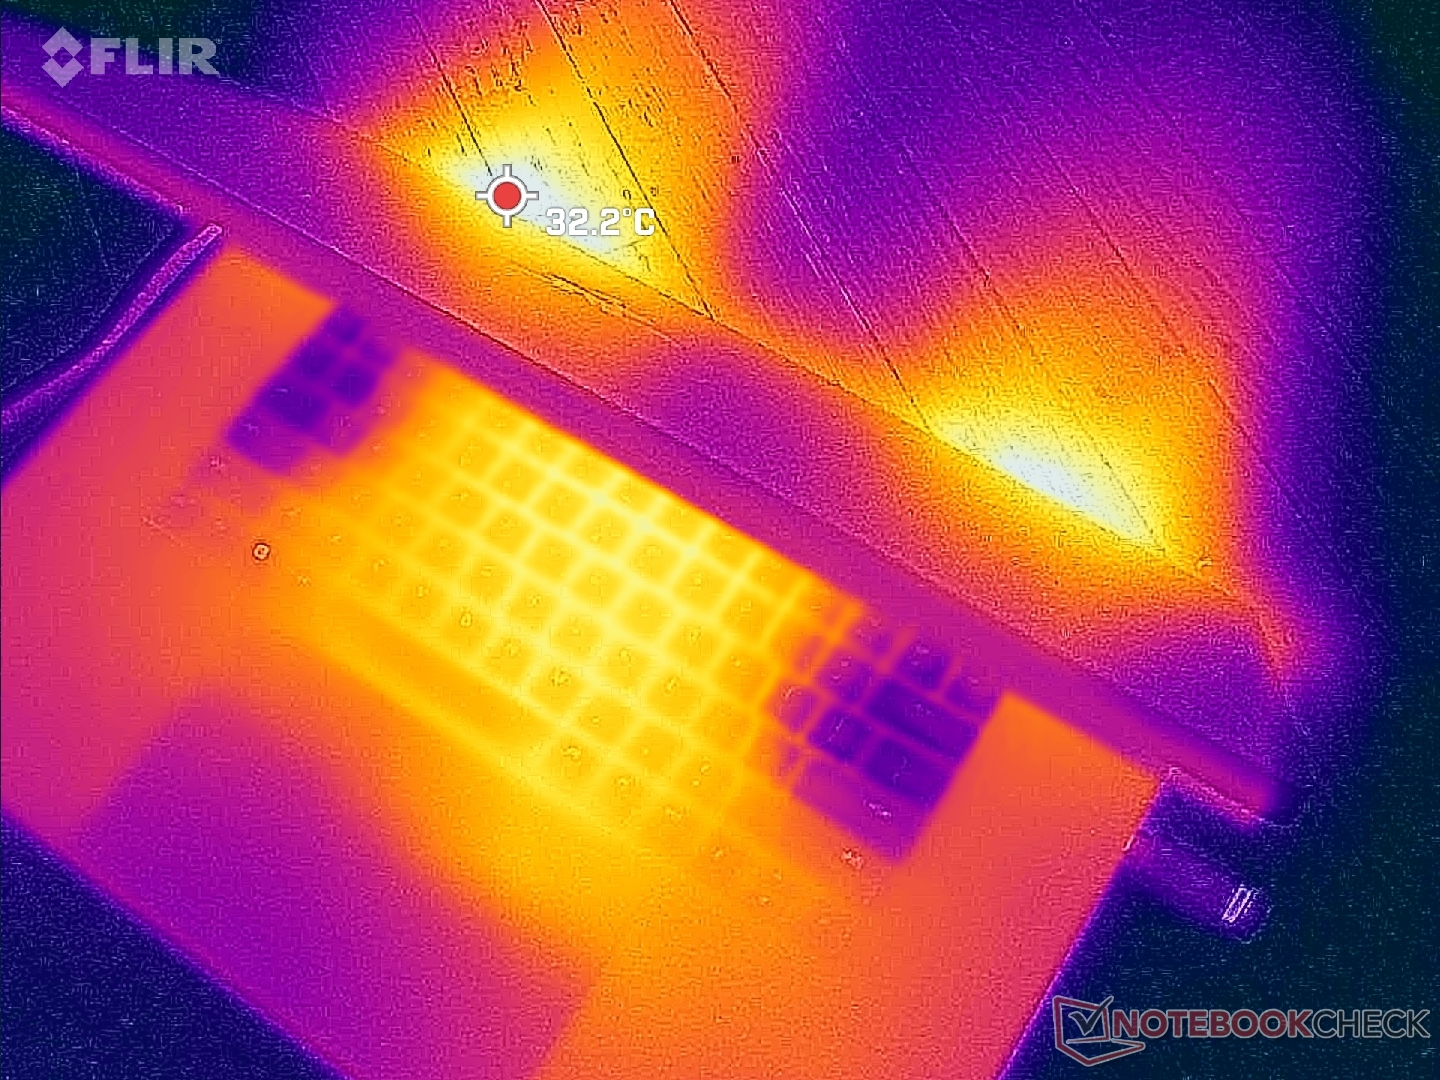
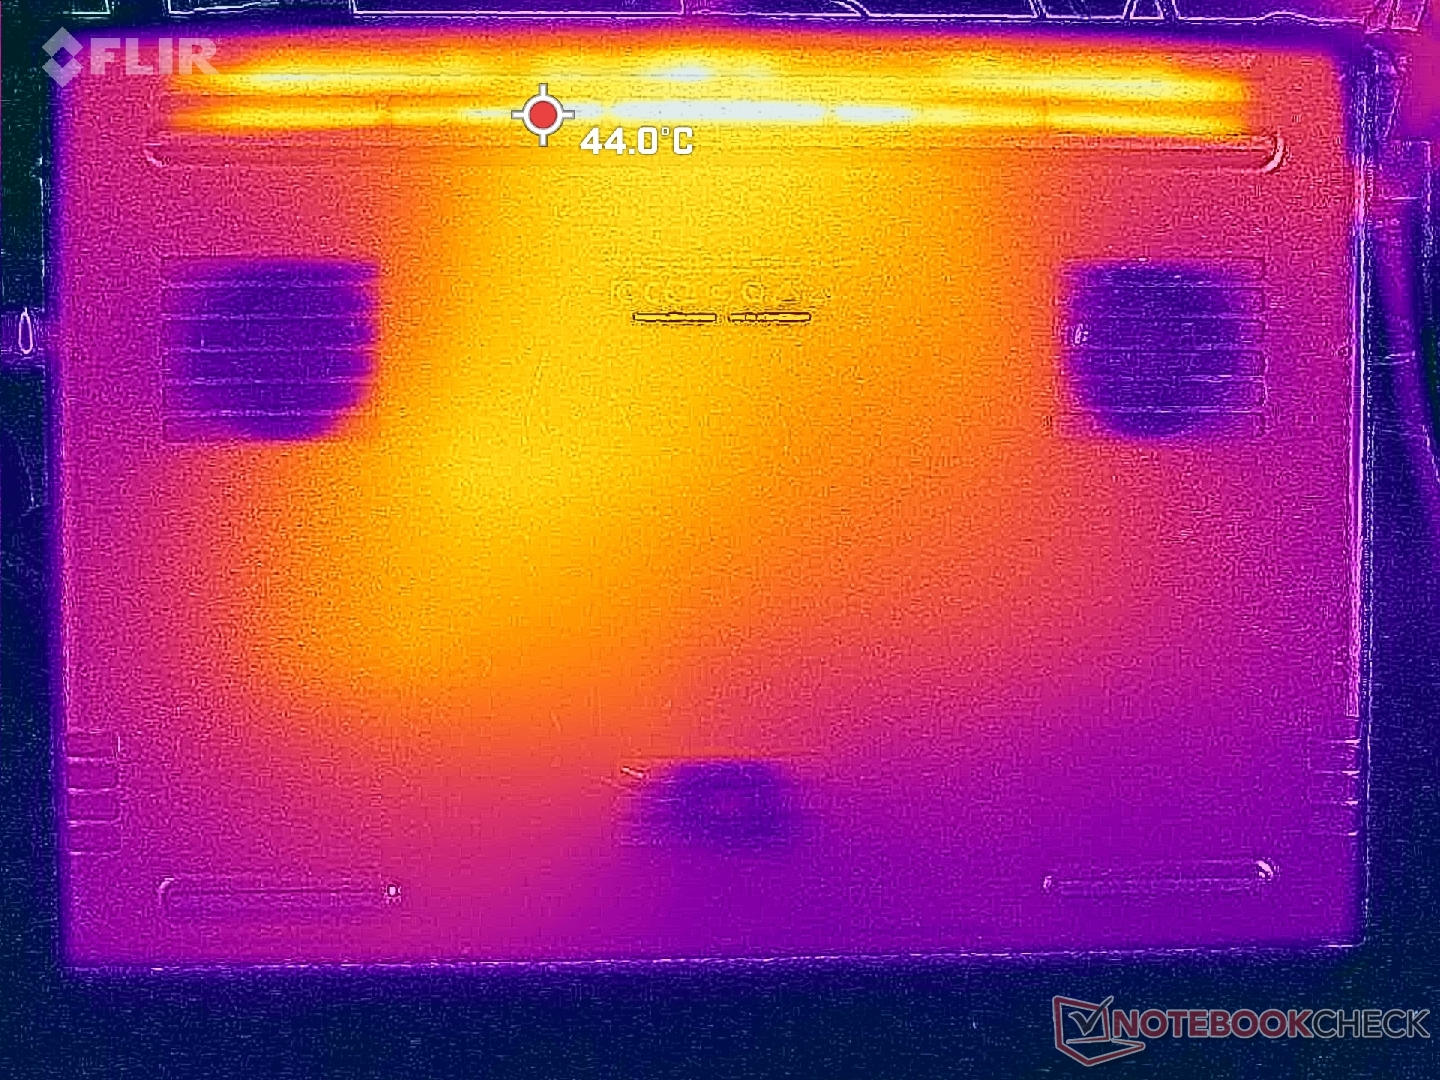
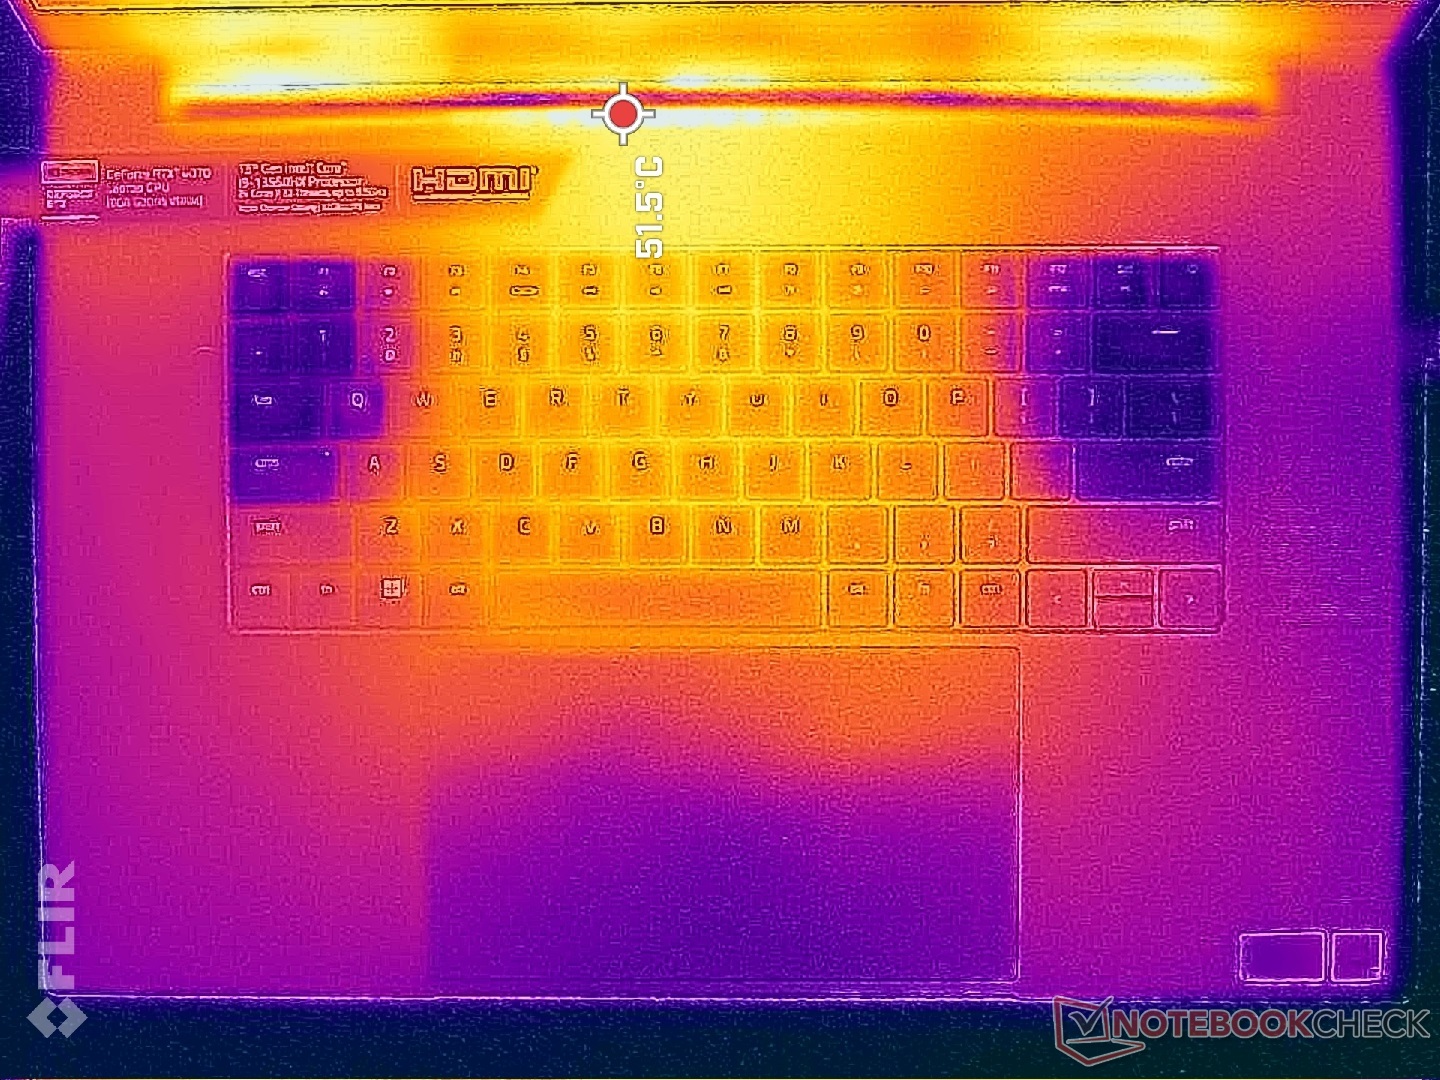
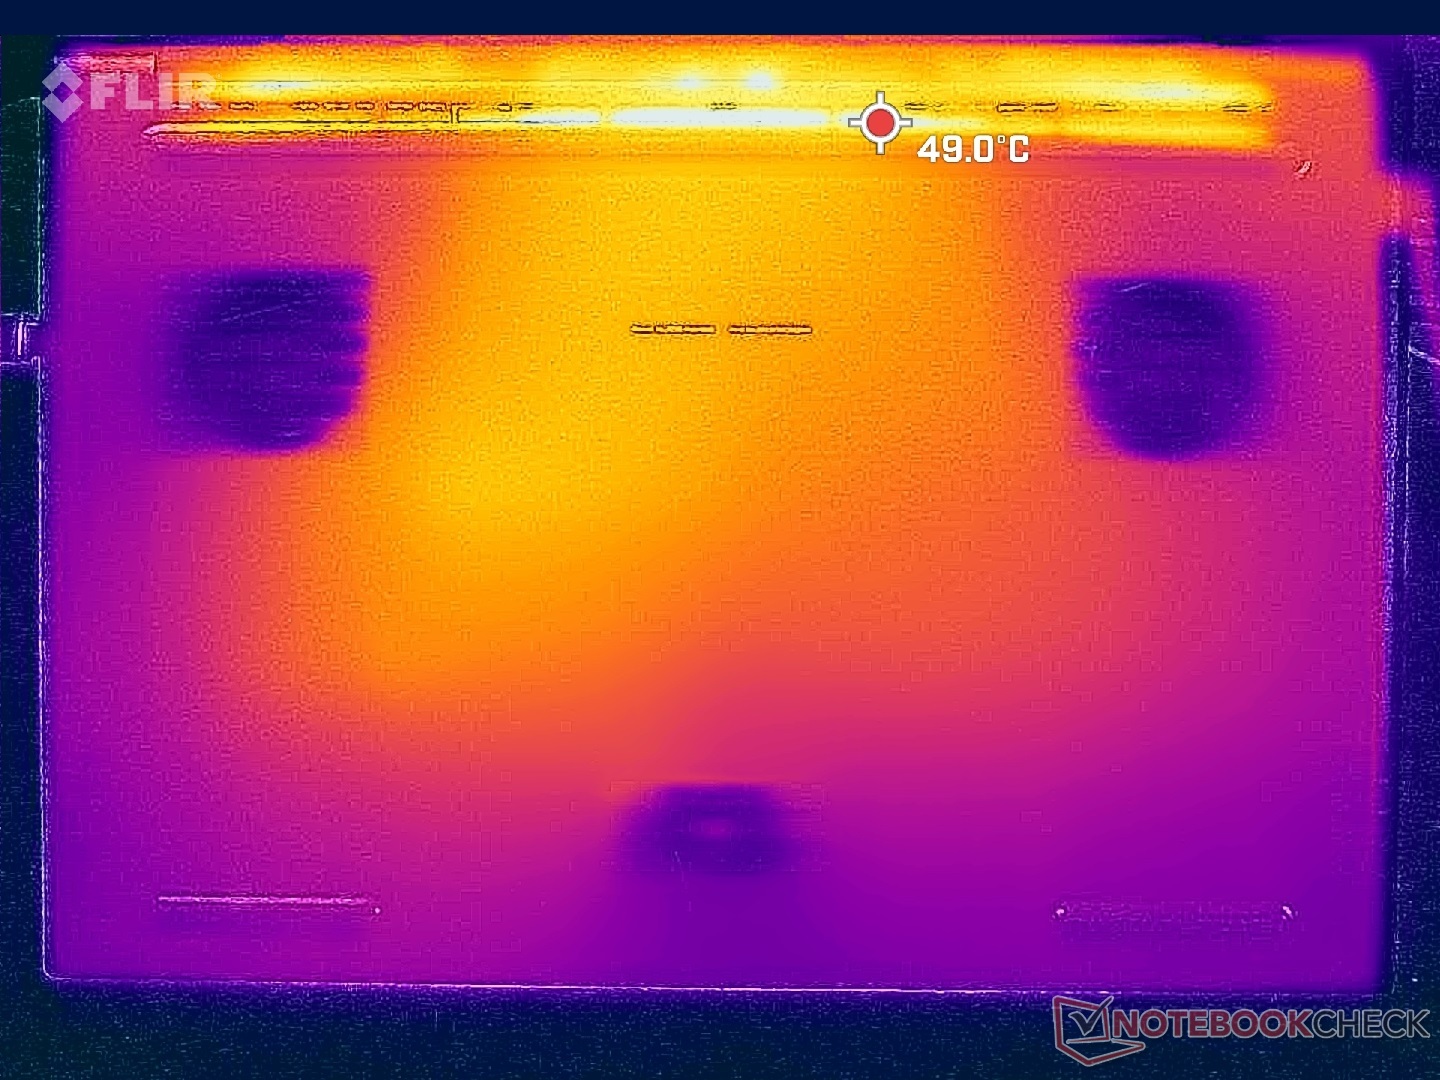
Temperatur
Yttemperaturerna är relativt svala för en bärbar dator för spel, vilket troligen beror på den stora 18-tumsformfaktorn, kylaren med tre fläktar i ångkammaren och den 140 W starka TGP GPU:n. Snabbare RTX 4080- eller 4090-konfigurationer kommer troligen att köra varmare än vad vi har registrerat här eftersom de båda har ett högre 175 W-tak.
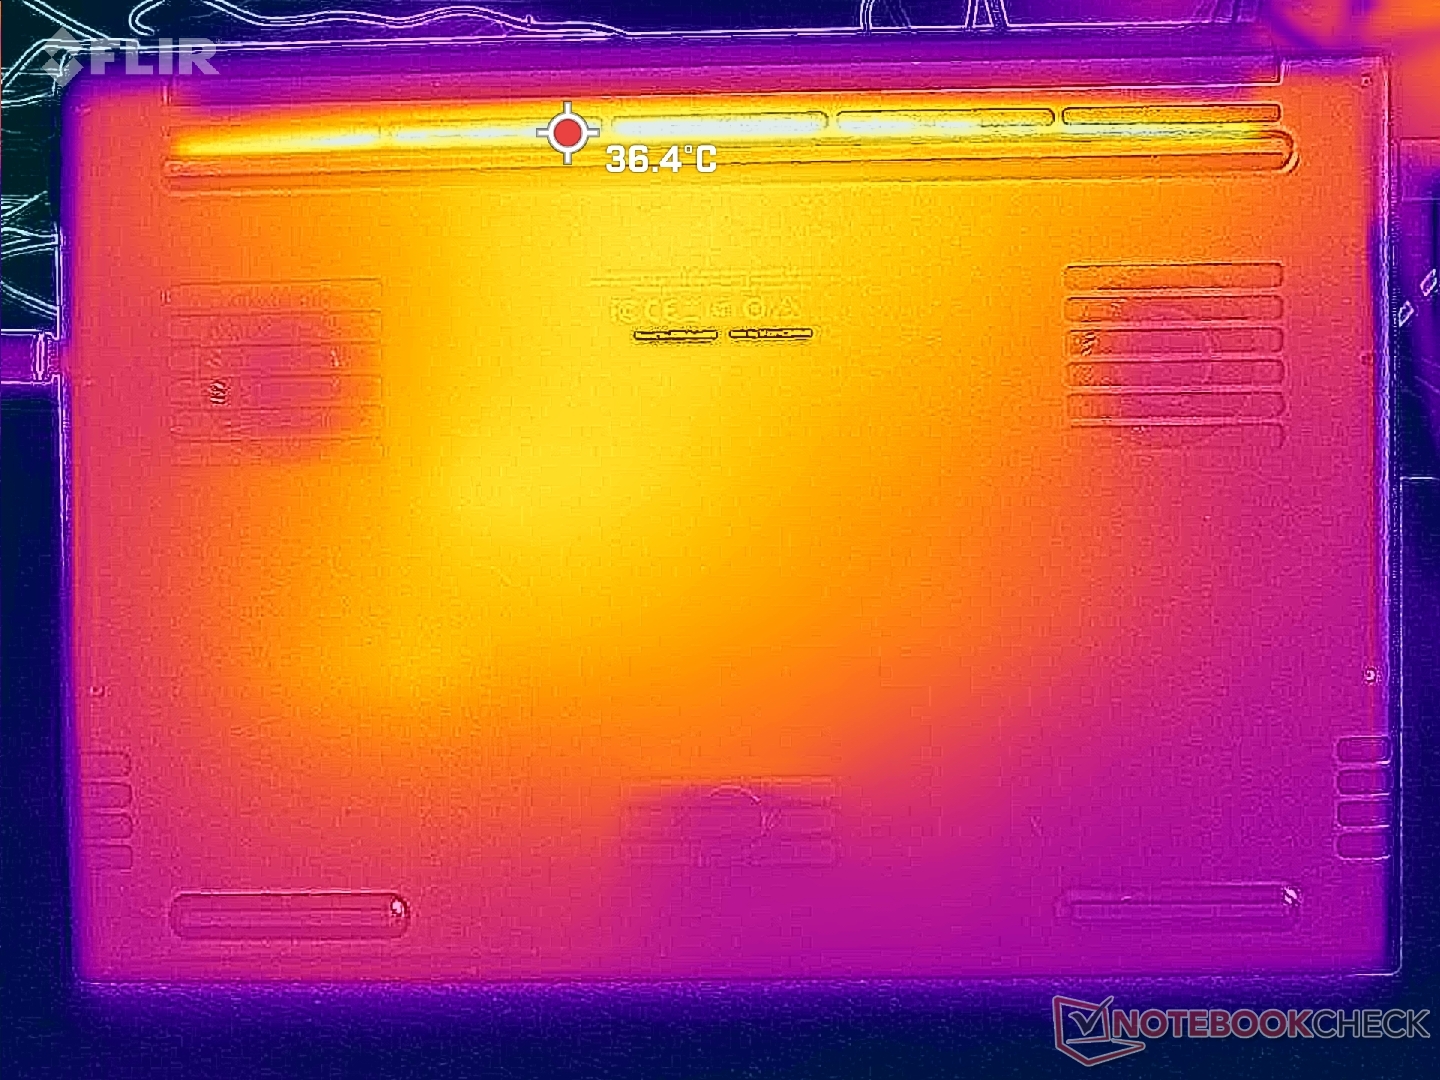
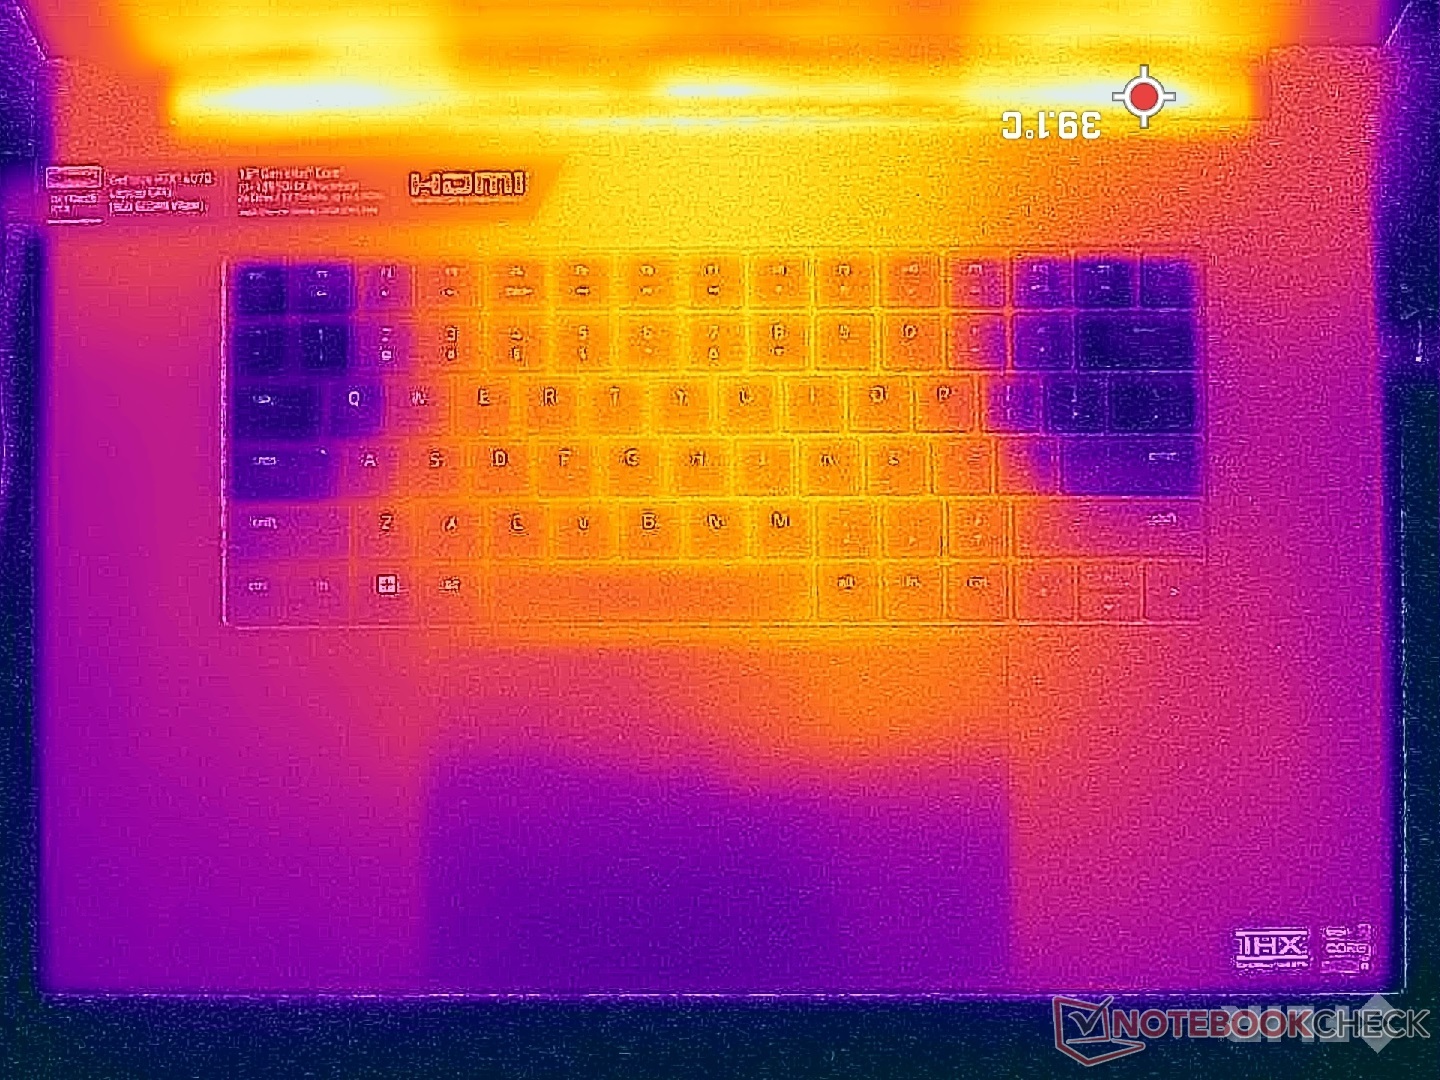
Varma fläckar vid körning Witcher 3 toppar upp till bara 36 C på toppen och 33 C på botten jämfört med 50 C till 57 C på Alienware m17 R5. Blade 18 med RTX 4070 är en av de svalaste bärbara speldatorer vi hittills har testat och det är tydligt att chassit är byggt för att hantera kraftfullare alternativ än vår RTX 4070-konfiguration.
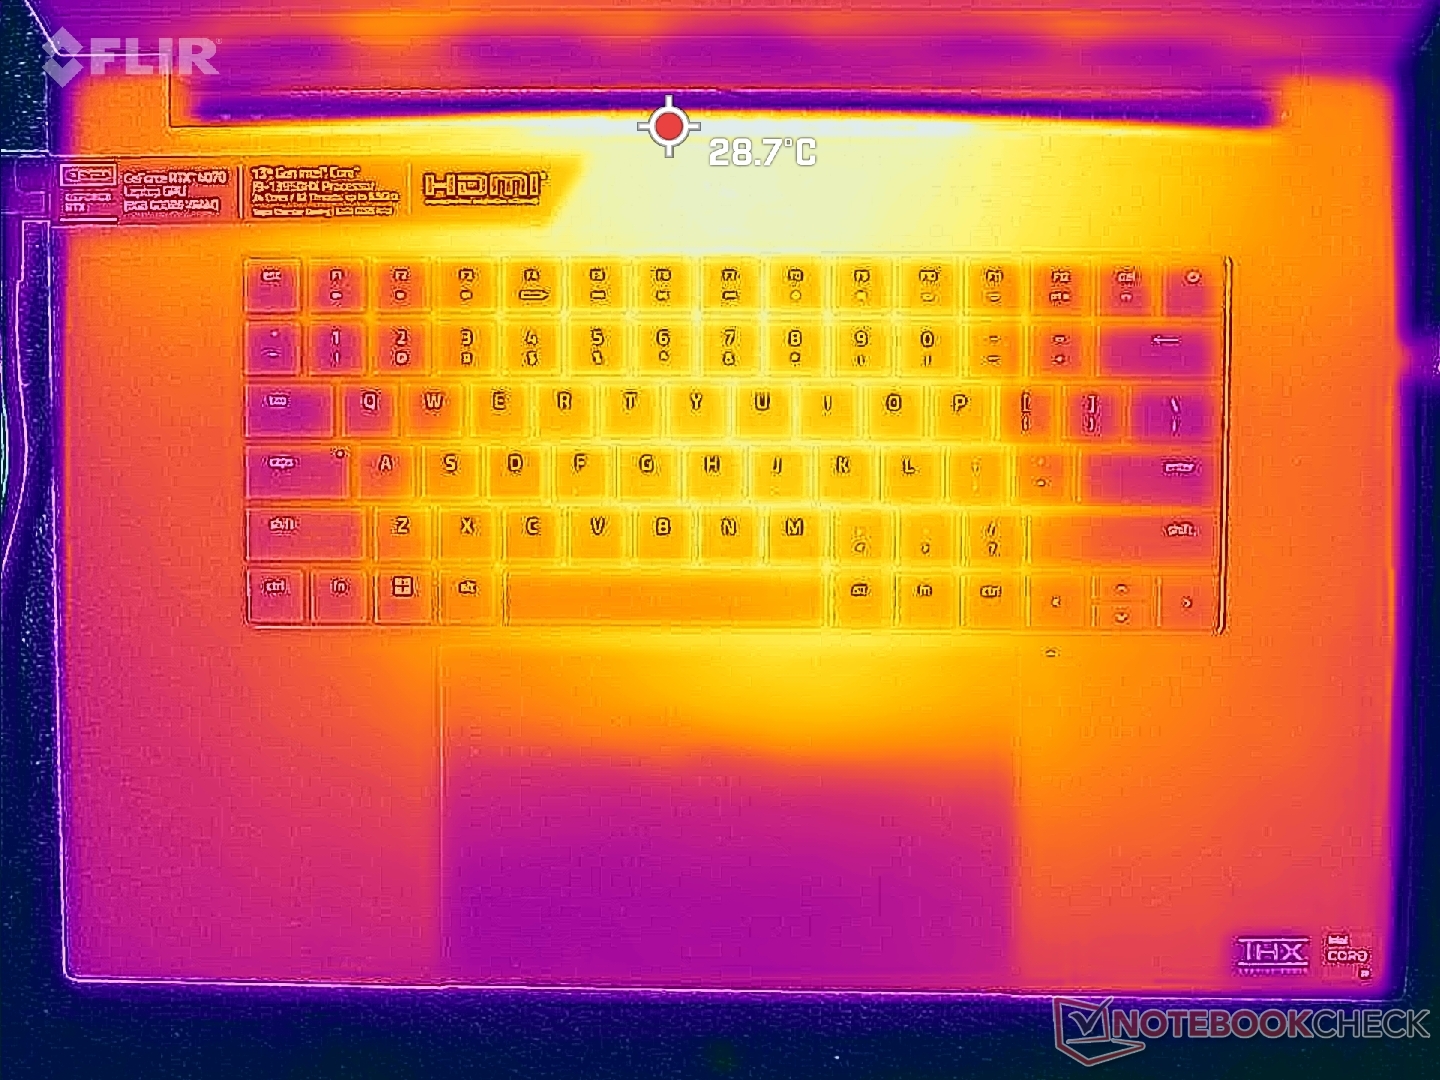
Yttemperaturerna vid tomgång är något varmare än förväntat eftersom fläktarna tenderar att gå på tomgång vid låg belastning. Blade 18 blir aldrig obekväm mot huden så länge bakre kanten är väl ventilerad.
(+) Den maximala temperaturen på ovansidan är 39.2 °C / 103 F, jämfört med genomsnittet av 40.4 °C / 105 F , allt från 21.2 till 68.8 °C för klassen Gaming.
(+) Botten värms upp till maximalt 35.6 °C / 96 F, jämfört med genomsnittet av 43.2 °C / 110 F
(+) Vid tomgångsbruk är medeltemperaturen för ovansidan 28.1 °C / 83 F, jämfört med enhetsgenomsnittet på 33.9 °C / ### class_avg_f### F.
(+) När du spelar The Witcher 3 är medeltemperaturen för ovansidan 28.9 °C / 84 F, jämfört med enhetsgenomsnittet på 33.9 °C / ## #class_avg_f### F.
(+) Handledsstöden och pekplattan är kallare än hudtemperaturen med maximalt 26 °C / 78.8 F och är därför svala att ta på.
(+) Medeltemperaturen för handledsstödsområdet på liknande enheter var 28.8 °C / 83.8 F (+2.8 °C / 5 F).
| Razer Blade 18 RTX 4070 Intel Core i9-13950HX, NVIDIA GeForce RTX 4070 Laptop GPU | Razer Blade 17 Early 2022 Intel Core i9-12900H, NVIDIA GeForce RTX 3080 Ti Laptop GPU | MSI Titan GT77 HX 13VI Intel Core i9-13950HX, NVIDIA GeForce RTX 4090 Laptop GPU | Gigabyte G7 KE Intel Core i5-12500H, NVIDIA GeForce RTX 3060 Laptop GPU | Alienware m17 R5 (R9 6900HX, RX 6850M XT) AMD Ryzen 9 6900HX, AMD Radeon RX 6850M XT | Asus ROG Strix Scar 17 SE G733CX-LL014W Intel Core i9-12950HX, NVIDIA GeForce RTX 3080 Ti Laptop GPU | |
|---|---|---|---|---|---|---|
| Heat | -28% | 2% | -17% | -18% | -18% | |
| Maximum Upper Side * (°C) | 39.2 | 50 -28% | 40.6 -4% | 52 -33% | 53 -35% | 48.8 -24% |
| Maximum Bottom * (°C) | 35.6 | 56 -57% | 41.1 -15% | 54 -52% | 56 -57% | 52.4 -47% |
| Idle Upper Side * (°C) | 31.8 | 36 -13% | 26.2 18% | 28 12% | 30 6% | 30.4 4% |
| Idle Bottom * (°C) | 33.2 | 38 -14% | 30.3 9% | 32 4% | 29 13% | 34.1 -3% |
* ... mindre är bättre
Stresstest
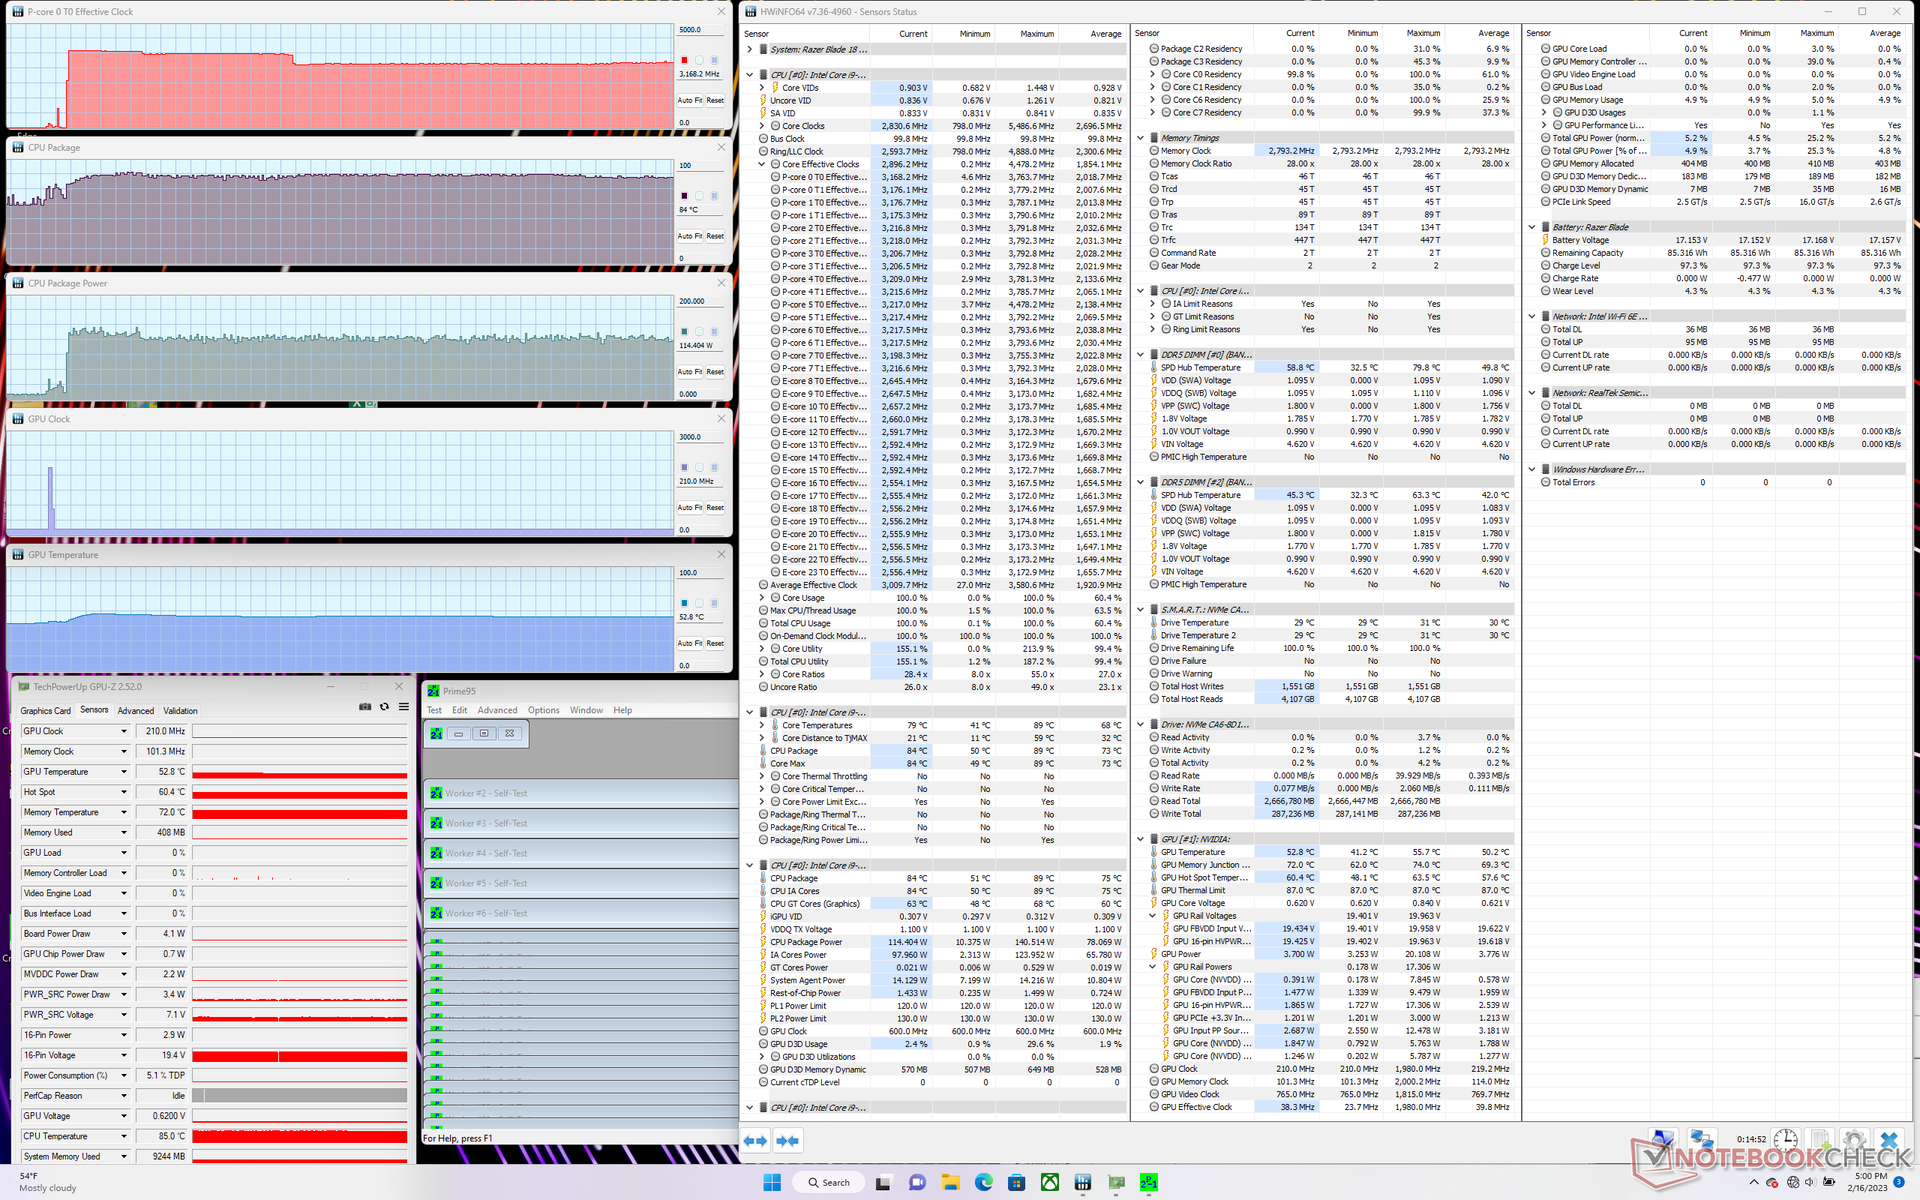
När Prime95 kördes för att stressa CPU:n, steg klockfrekvensen och strömförbrukningen på kortet till 3,8 GHz respektive 140 W, för att sedan sjunka till 3,1 GHz och 110-120 W cirka 70 sekunder senare. Kärnans temperatur stabiliserades vid 87 C jämfört med 82 C på Blade 16 med samma CPU.
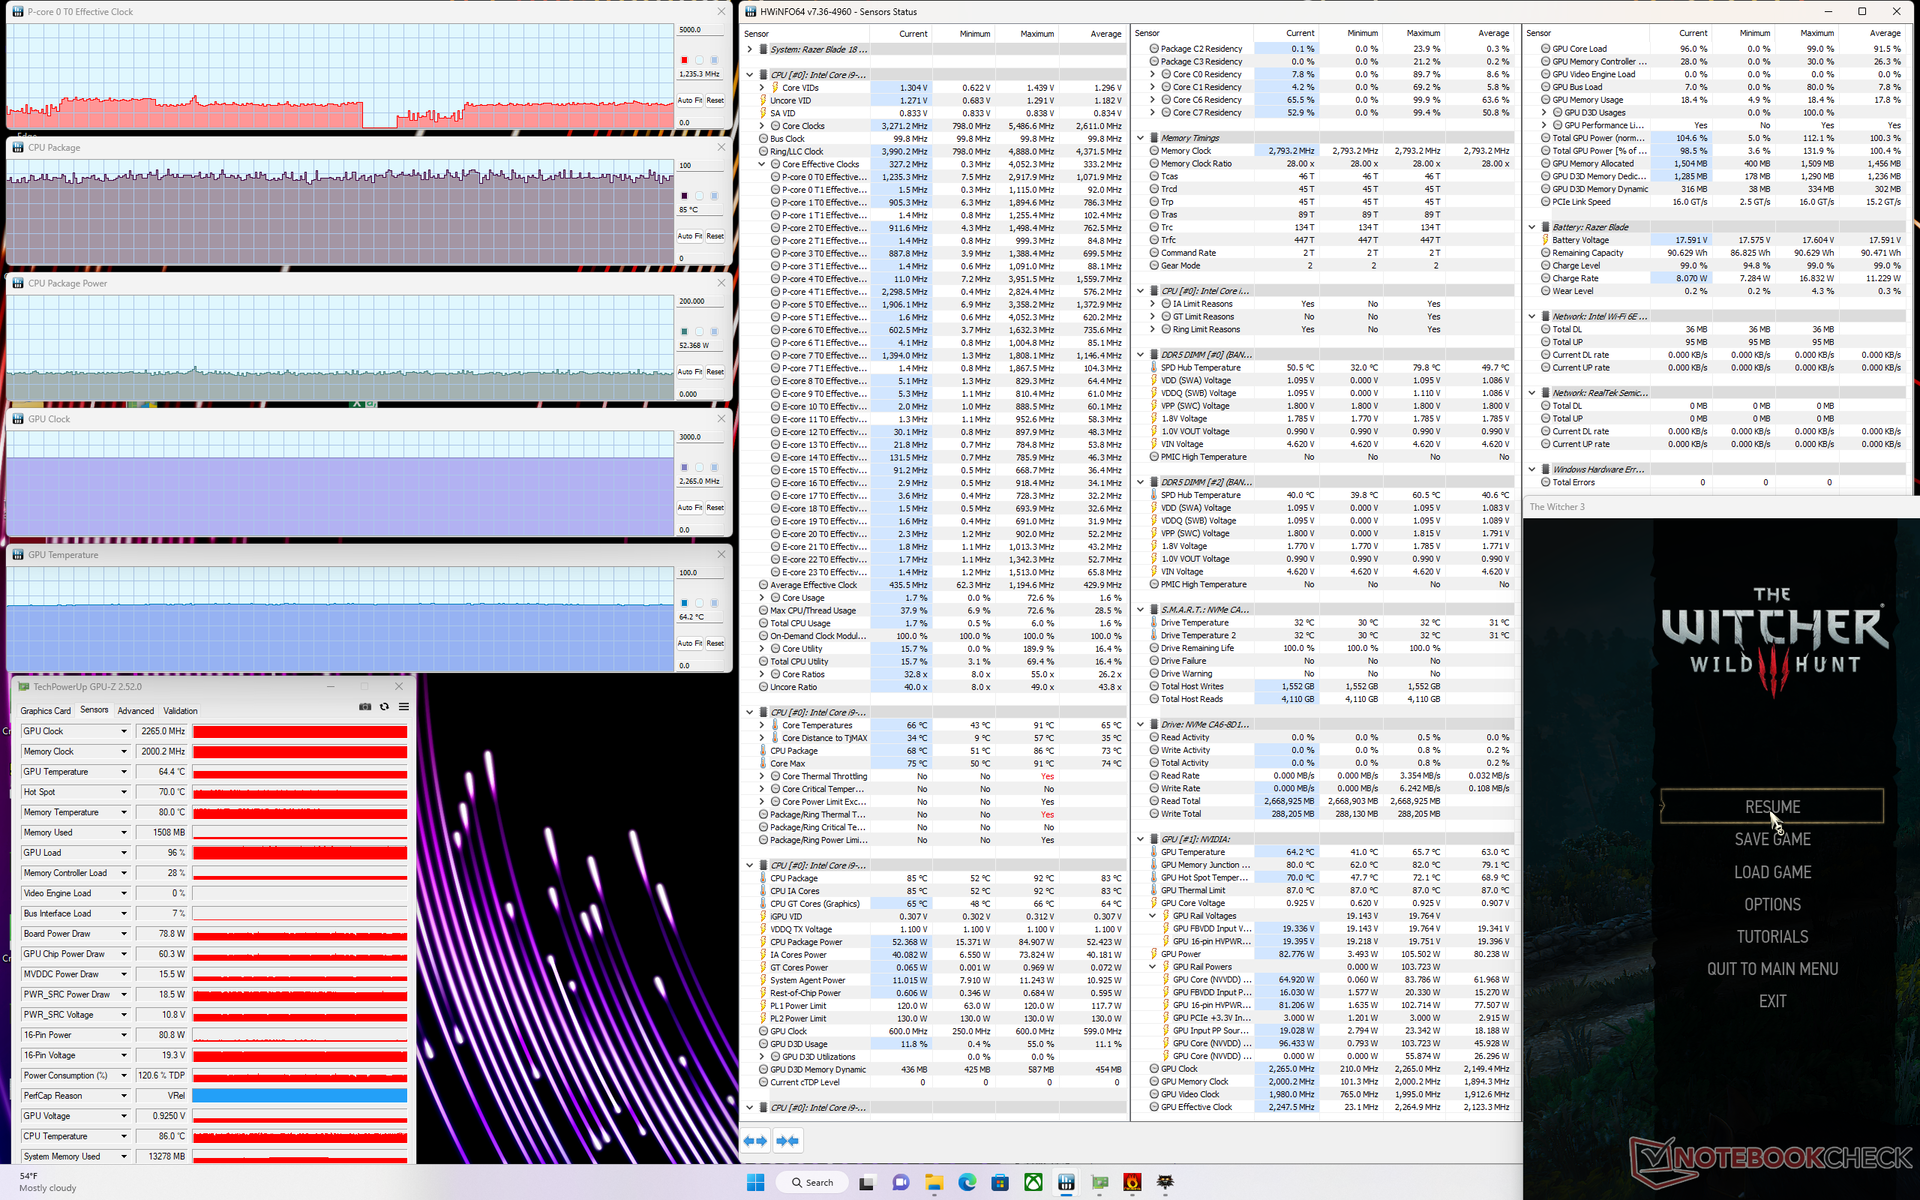
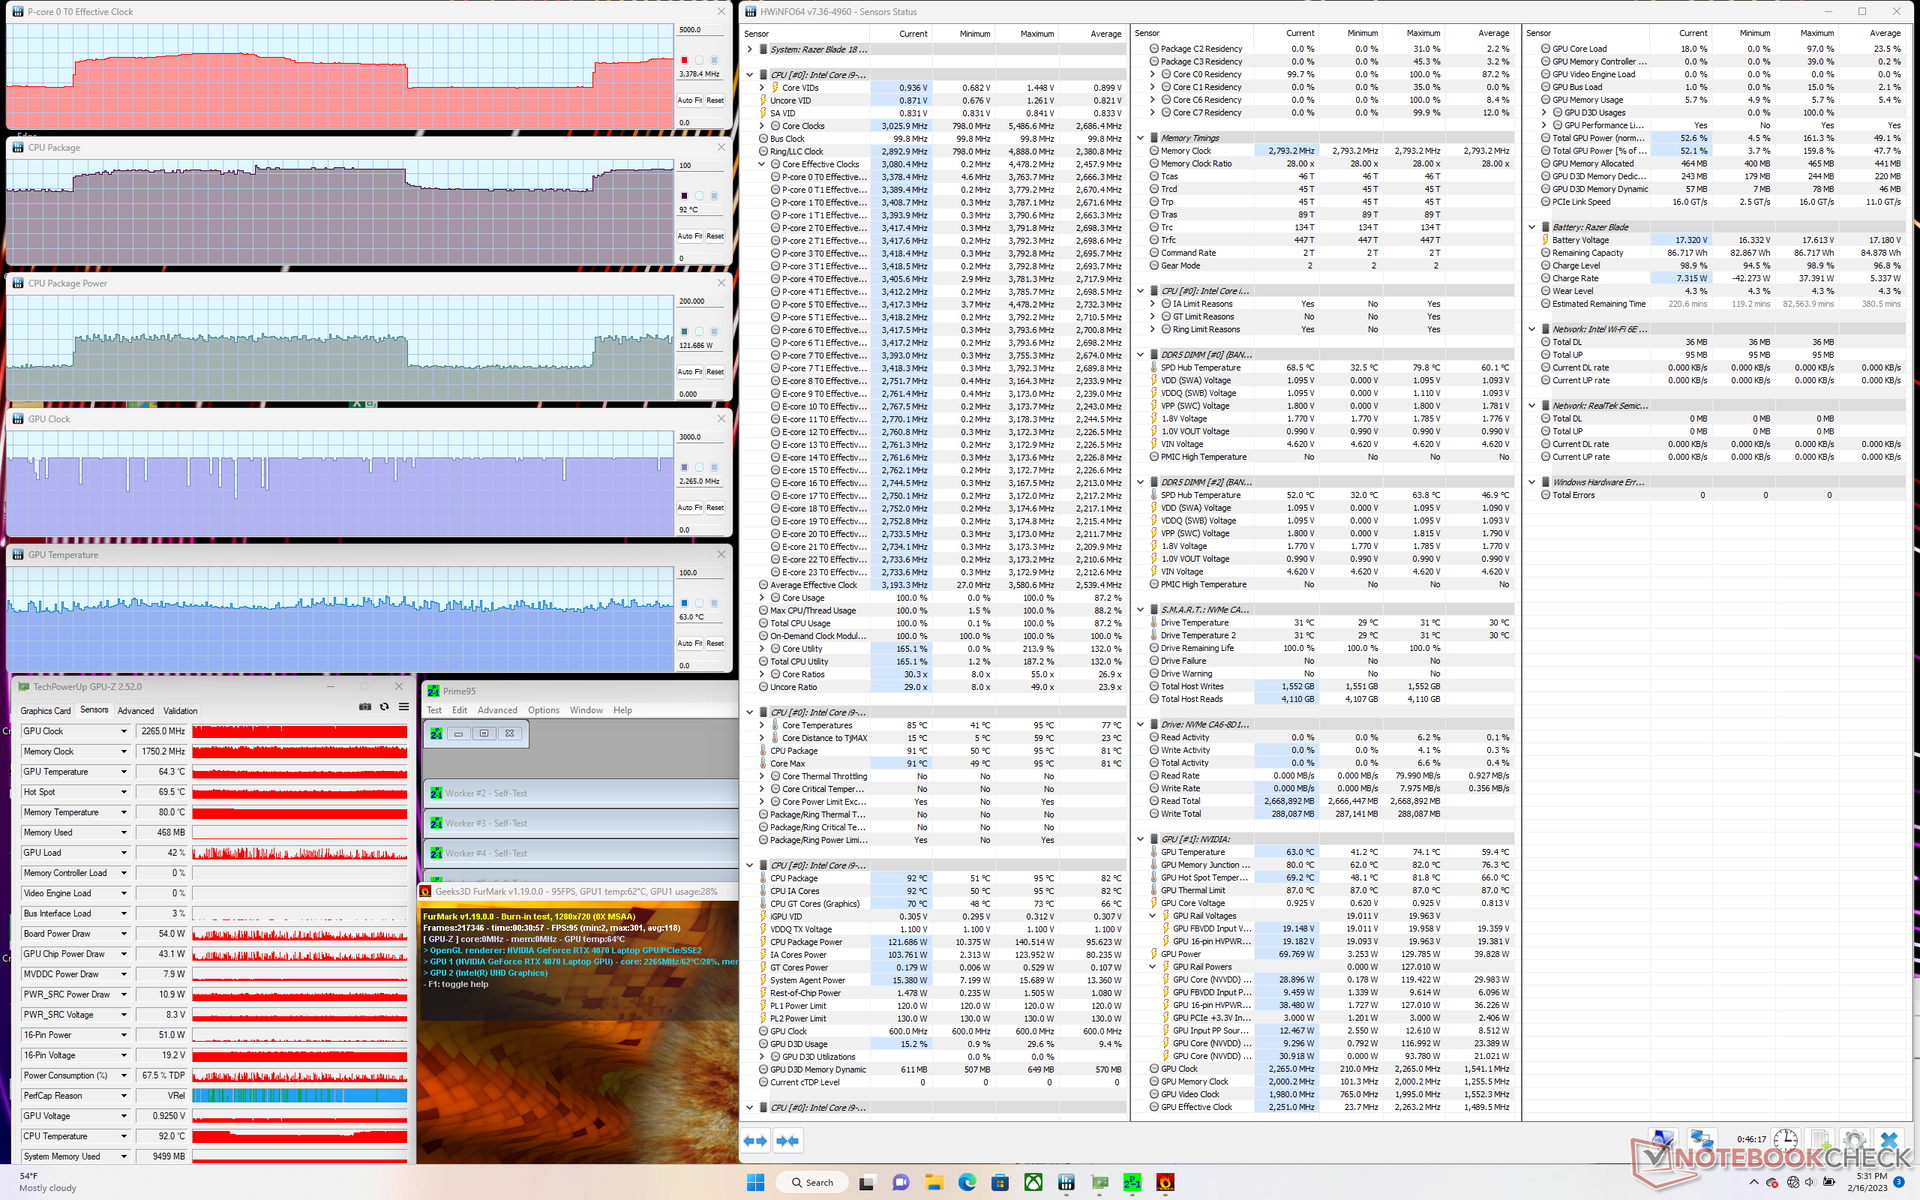
GPU:s klockfrekvens, temperatur och strömförbrukning på kortet stabiliseras vid 2265 MHz, 64 C respektive 80-90 W när den körs på Witcher 3. GPU:n i sig är dimensionerad för en 140 W TGP och därför är intervallet ~80 W mycket lägre än förväntat, även när den är inställd på prestandaläge. Vi kan bara nå en topp på 100 W för GPU:n när vi kör ett mer krävande spel som Cyberpunk 2077. Som jämförelse kan nämnas att RTX 4080 GPU:n i Blade 16 skulle stabilisera sig på ~160 W mot målet 175 W TGP när samma spel körs Witcher 3 testet.
Att köra på batteri begränsar prestandan. Ett 3DMark 11-test på batterier skulle ge fysik- och grafikresultat på 10336 respektive 18043 poäng, jämfört med 25874 och 39733 poäng när det är på strömförsörjning.
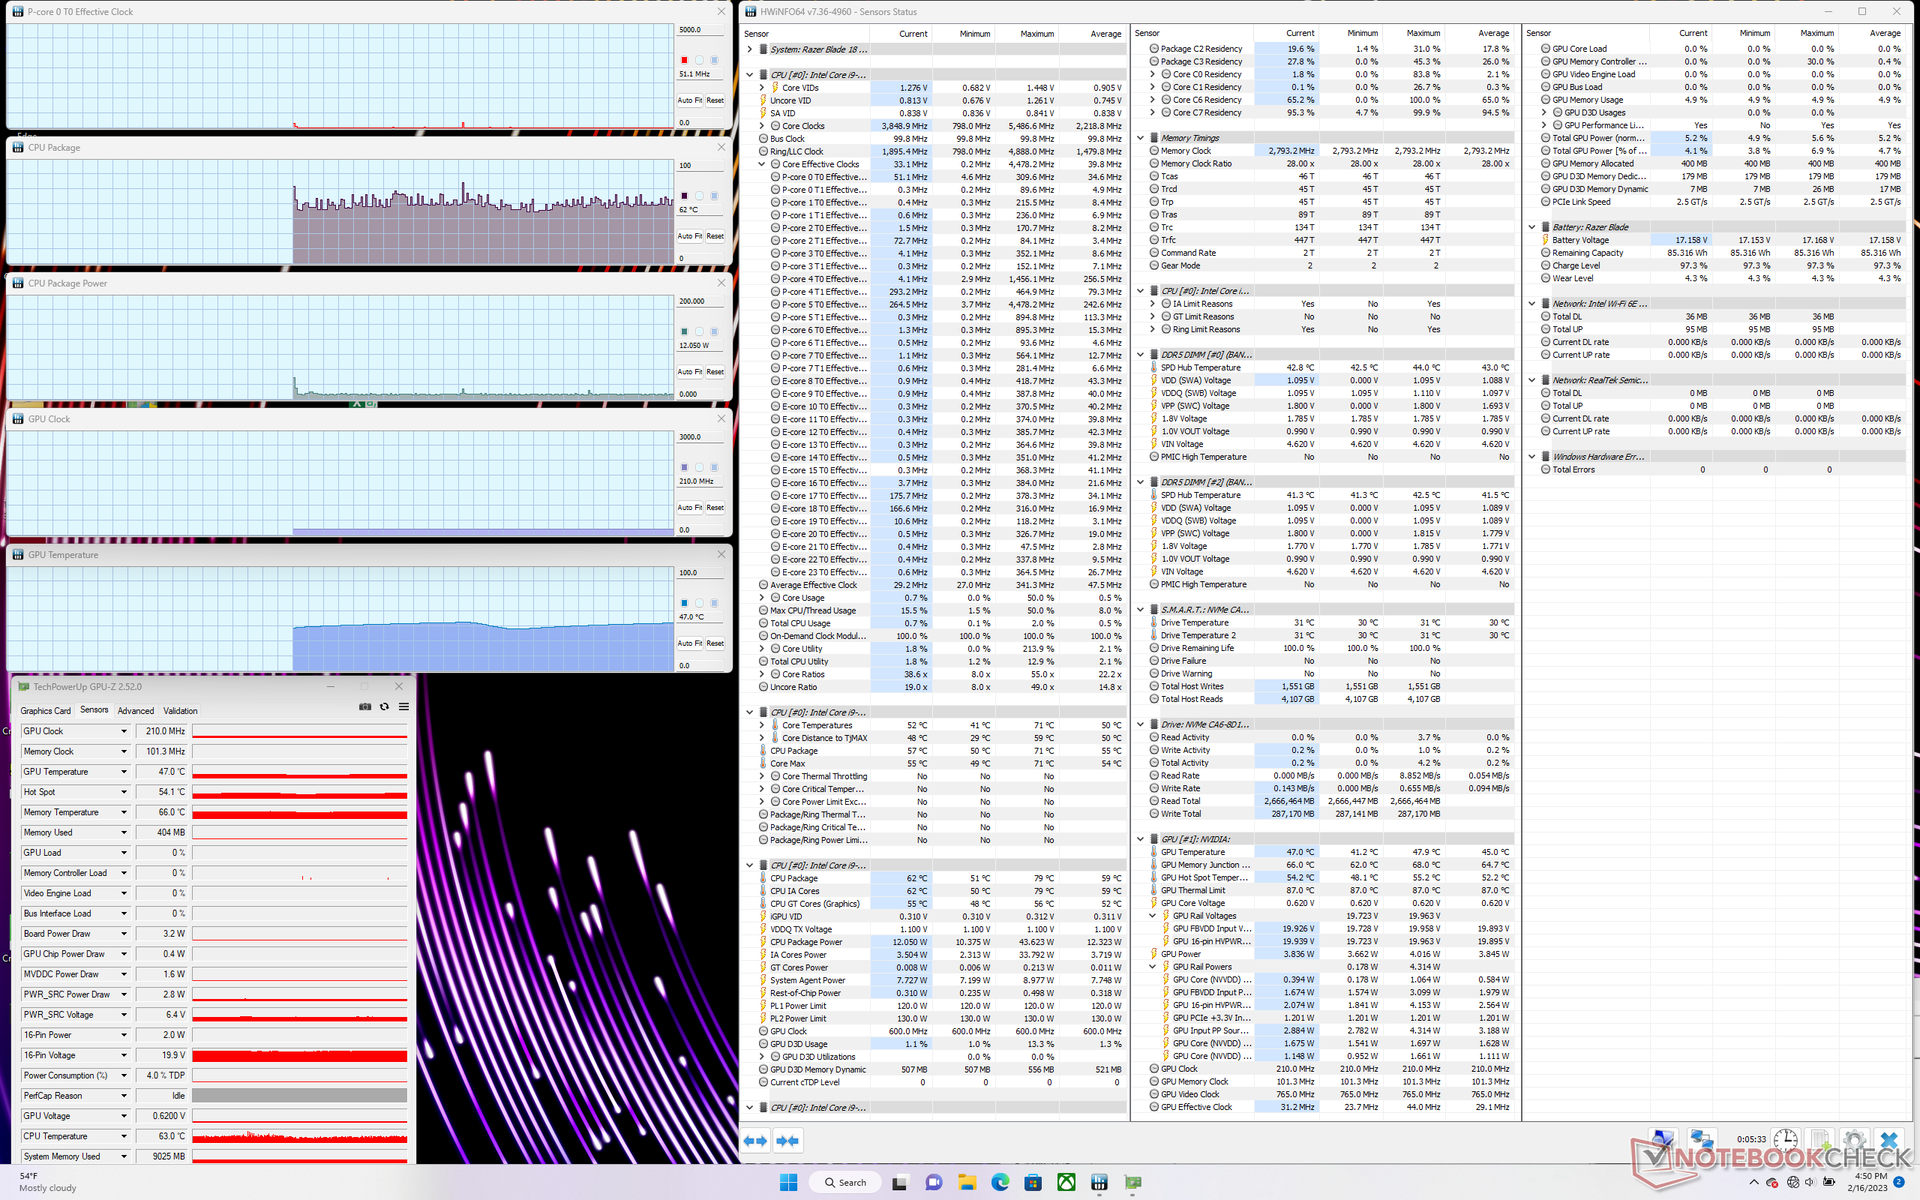
| CPU-klocka (GHz) | GPU-klocka (MHz) | Genomsnittlig CPU-temperatur (°C) | Genomsnittlig GPU-temperatur (°C) | |
| System Idle | -- | -- | 62 | 47 |
| Prime95 Stress | 3.2 | -- | 84 | 53 |
| Prime95 + FurMark Stress | 2.0 - 3.7 | 2265 | 70 - 91 | 63 |
| Witcher 3 Stress | ~1,2 | 2265 | 85 | 64 |
Högtalare
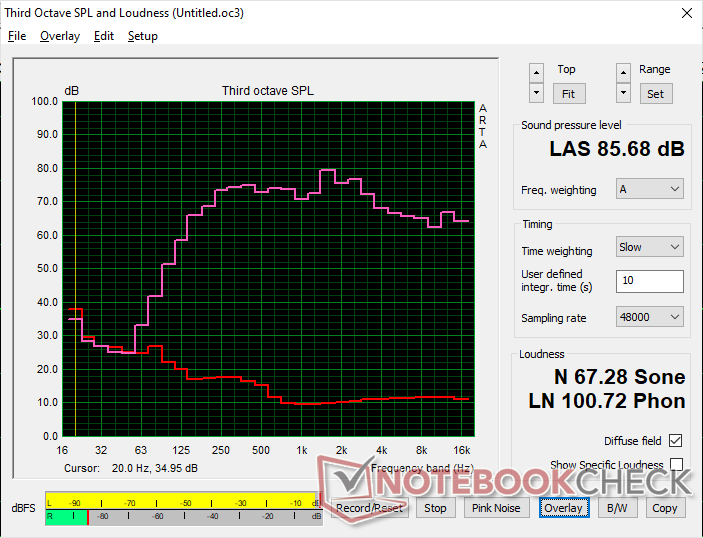
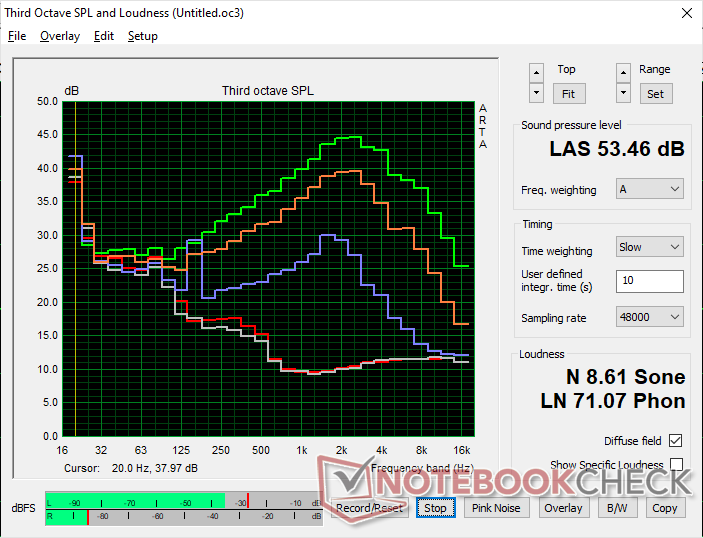
Razer Blade 18 RTX 4070 ljudanalys
(+) | högtalare kan spela relativt högt (85.7 dB)
Bas 100 - 315 Hz
(±) | reducerad bas - i genomsnitt 7.5% lägre än medianen
(±) | linjäriteten för basen är genomsnittlig (9.2% delta till föregående frekvens)
Mellan 400 - 2000 Hz
(+) | balanserad mellan - endast 3.5% från medianen
(+) | mids är linjära (4.1% delta till föregående frekvens)
Högsta 2 - 16 kHz
(+) | balanserade toppar - endast 4.8% från medianen
(+) | toppar är linjära (3.8% delta till föregående frekvens)
Totalt 100 - 16 000 Hz
(+) | det totala ljudet är linjärt (9.2% skillnad mot median)
Jämfört med samma klass
» 3% av alla testade enheter i den här klassen var bättre, 1% liknande, 96% sämre
» Den bästa hade ett delta på 6%, genomsnittet var 18%, sämst var 132%
Jämfört med alla testade enheter
» 3% av alla testade enheter var bättre, 1% liknande, 96% sämre
» Den bästa hade ett delta på 4%, genomsnittet var 23%, sämst var 134%
Apple MacBook Pro 16 2021 M1 Pro ljudanalys
(+) | högtalare kan spela relativt högt (84.7 dB)
Bas 100 - 315 Hz
(+) | bra bas - bara 3.8% från medianen
(+) | basen är linjär (5.2% delta till föregående frekvens)
Mellan 400 - 2000 Hz
(+) | balanserad mellan - endast 1.3% från medianen
(+) | mids är linjära (2.1% delta till föregående frekvens)
Högsta 2 - 16 kHz
(+) | balanserade toppar - endast 1.9% från medianen
(+) | toppar är linjära (2.7% delta till föregående frekvens)
Totalt 100 - 16 000 Hz
(+) | det totala ljudet är linjärt (4.6% skillnad mot median)
Jämfört med samma klass
» 0% av alla testade enheter i den här klassen var bättre, 0% liknande, 100% sämre
» Den bästa hade ett delta på 5%, genomsnittet var 17%, sämst var 45%
Jämfört med alla testade enheter
» 0% av alla testade enheter var bättre, 0% liknande, 100% sämre
» Den bästa hade ett delta på 4%, genomsnittet var 23%, sämst var 134%
Energihantering - Stor skärm, stora strömbehov
Effektförbrukning
Strömförbrukningen vid tomgång på skrivbordet varierar mellan 24 W och 48 W beroende på inställd ljusstyrka och strömprofil. Skillnaden mellan den lägsta och högsta ljusstyrkan är faktiskt så hög som 10 W. Det här intervallet är märkbart högre än på de flesta andra mindre bärbara datorer, vilket kan förklara de ojämna resultaten för batteritiden i nästa avsnitt.
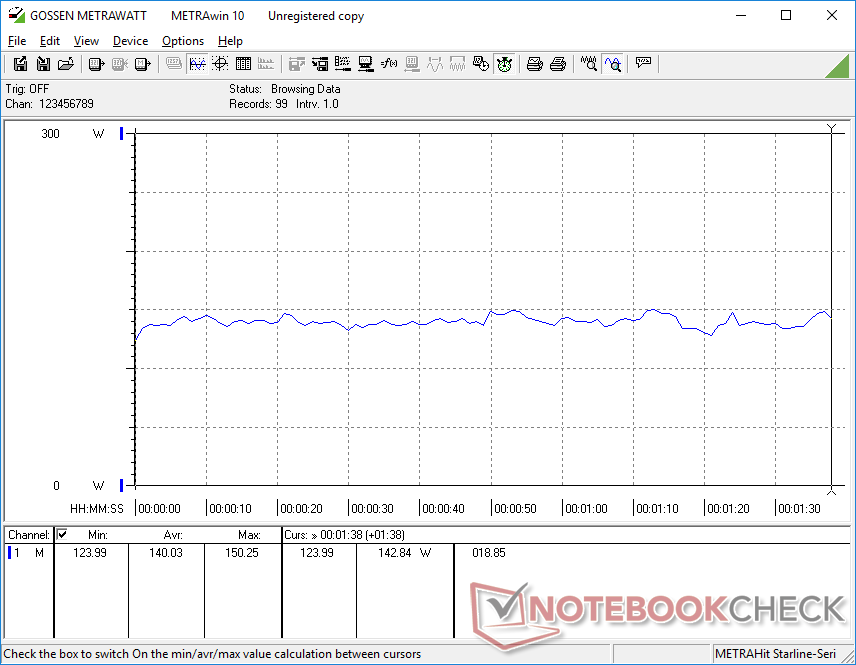
När du kör Witcher 3 för att representera typiska spelbelastningar skulle systemet kräva i genomsnitt 202 W jämfört med 229 W eller 225 W på RTX 3080 Ti-drivna Blade 17 ellerAsus ROG Strix Scar 17 SErespektive. Vårt 18-tums RTX 4070-drivna system drar alltså cirka 10 procent mindre ström samtidigt som det erbjuder nästan samma grafikprestanda som den senaste generationens mobila RTX 3080 Ti. En uppgradering till RTX 4080- eller RTX 4090-konfigurationen kommer troligen att dra cirka 40 W till 50 W mer ström i likhet med vad vi observerade på Blade 16.
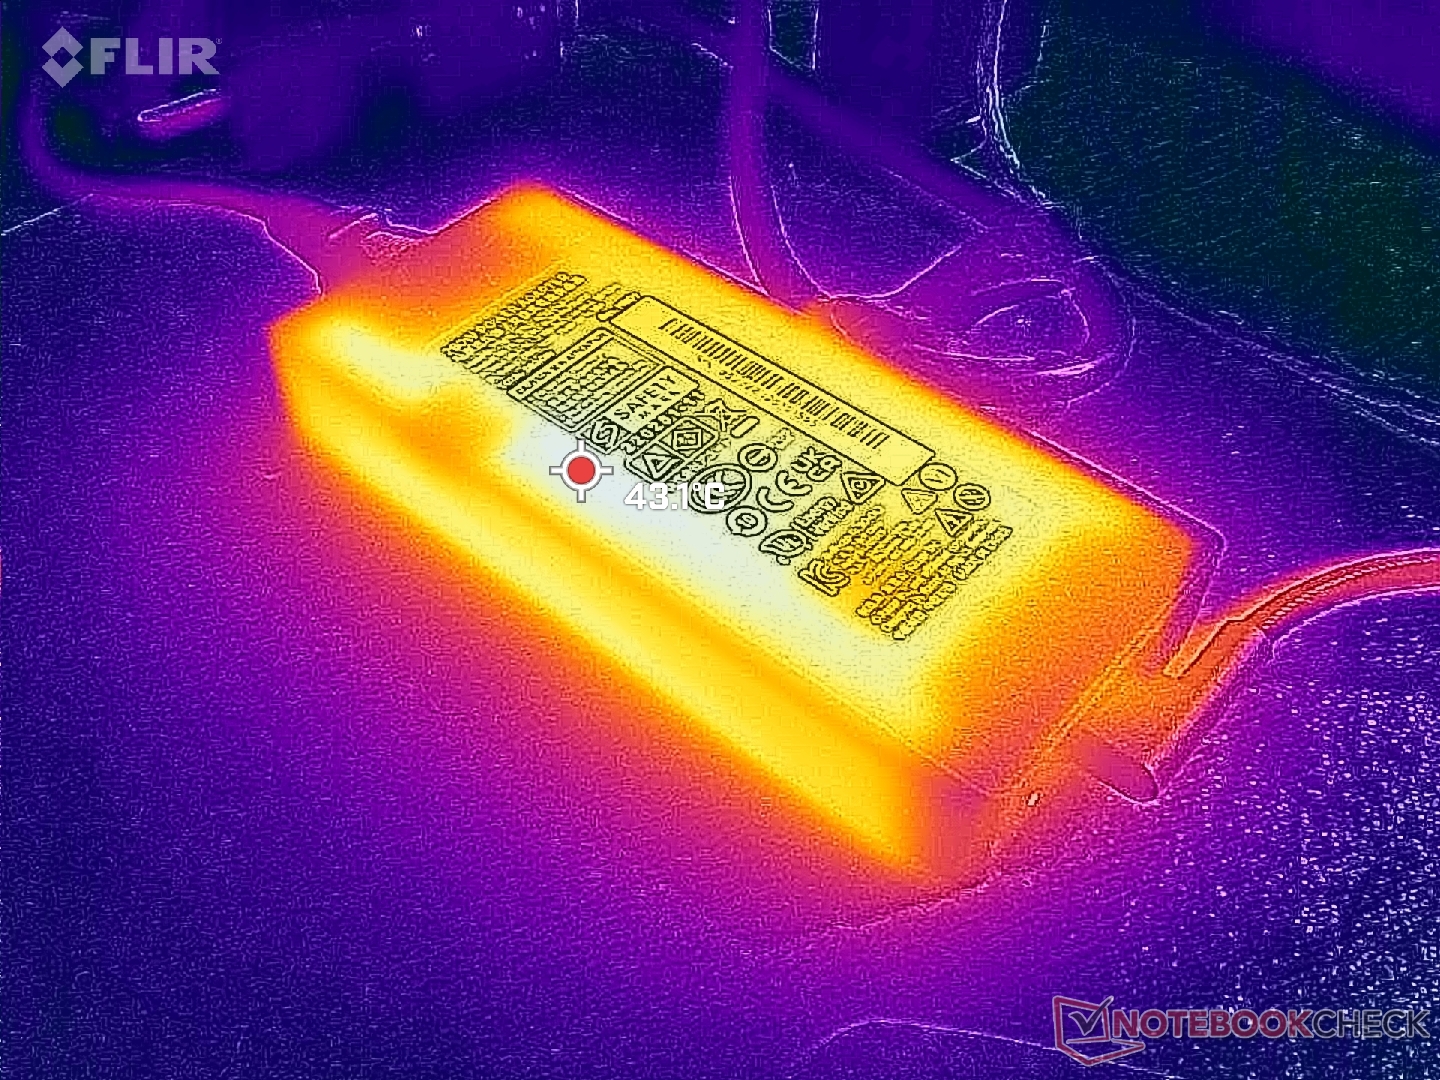
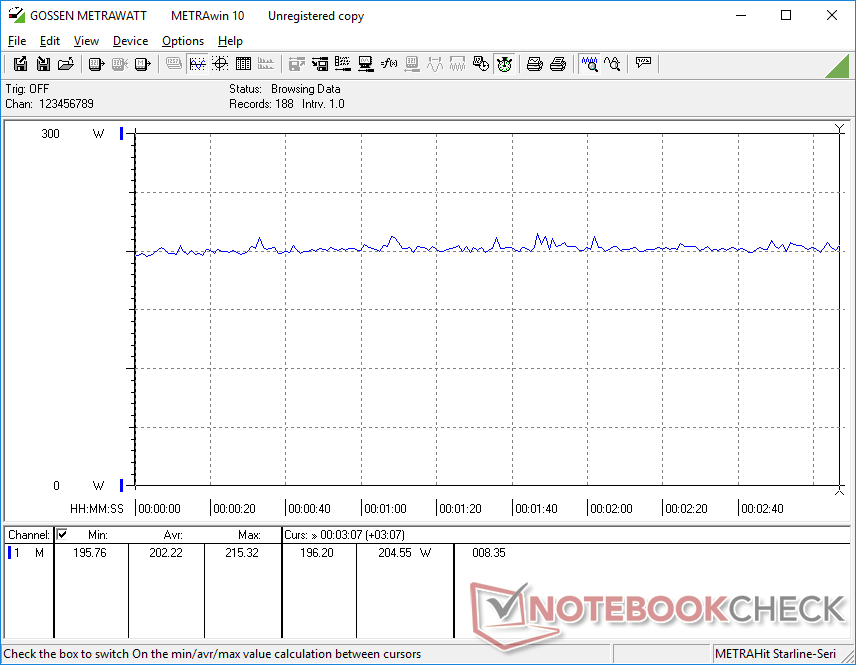
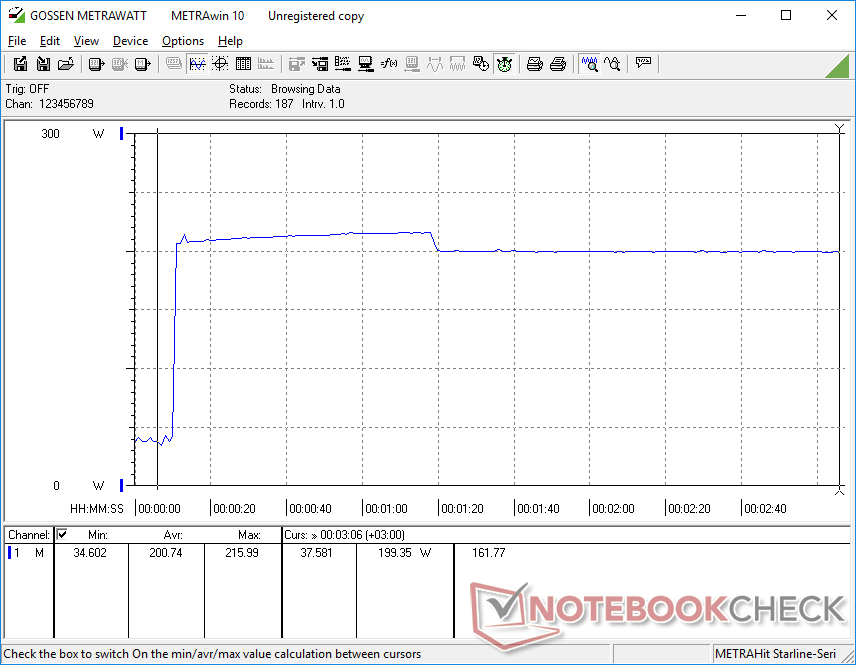
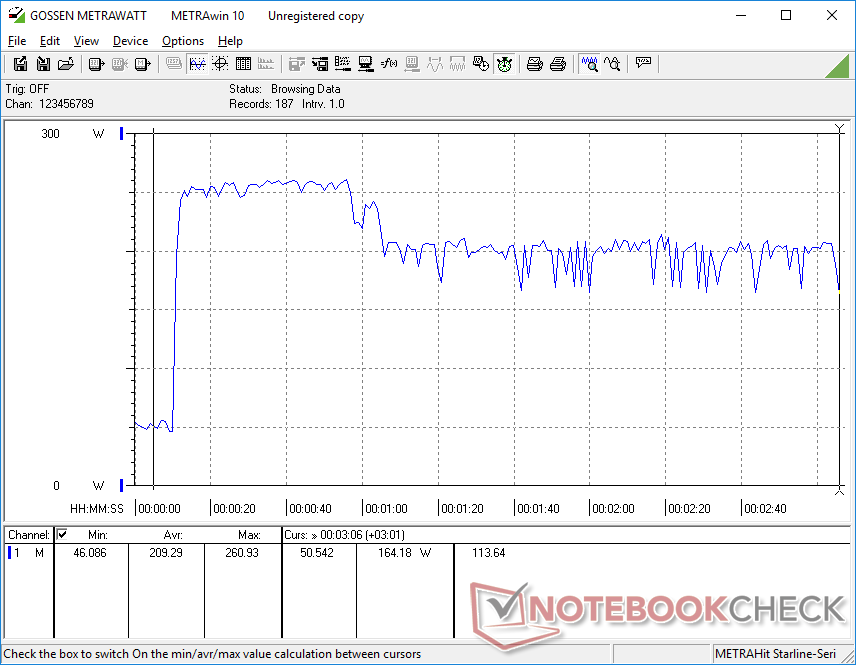
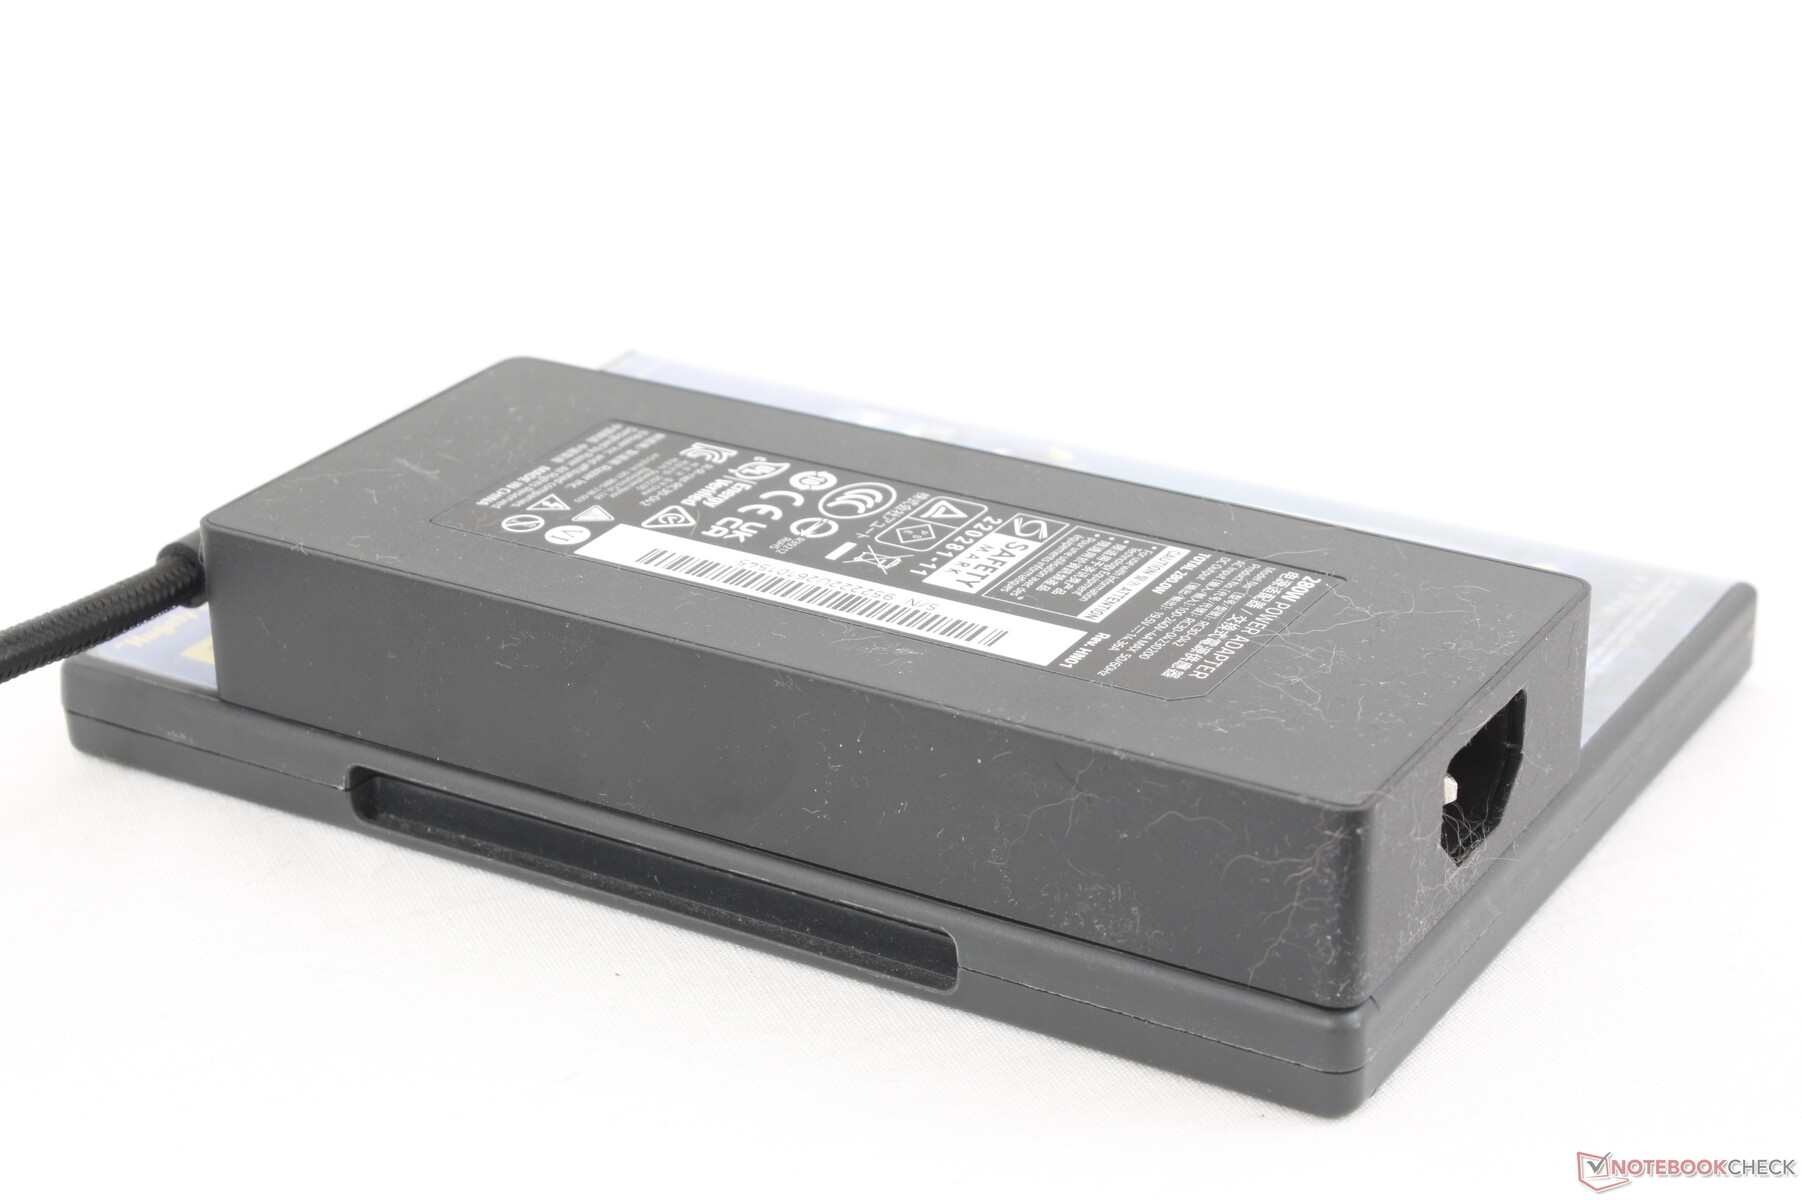
Vi kan registrera ett tillfälligt maximalt uttag på 261 W från den små-medelstora (~16,3 x 7 x 2,5 cm) 280 W GaN AC-adaptern när vi körde både Prime95 och FurMark samtidigt. Tänk på att det finns två olika AC-adaptrar beroende på konfiguration: en mindre 280 W-adapter för RTX 4060 och 4070 SKU och en större 330 W-adapter för RTX 4080 och 4090 SKU.
| Av/Standby | |
| Låg belastning | |
| Hög belastning |
|
Förklaring:
min: | |
| Razer Blade 18 RTX 4070 i9-13950HX, GeForce RTX 4070 Laptop GPU, SSSTC CA6-8D1024, IPS, 2560x1600, 18" | Razer Blade 17 Early 2022 i9-12900H, GeForce RTX 3080 Ti Laptop GPU, Samsung PM9A1 MZVL21T0HCLR, IPS, 3840x2160, 17.3" | MSI Titan GT77 HX 13VI i9-13950HX, GeForce RTX 4090 Laptop GPU, Samsung PM9A1 MZVL22T0HBLB, Mini-LED, 3840x2160, 17.3" | Gigabyte G7 KE i5-12500H, GeForce RTX 3060 Laptop GPU, Gigabyte AG470S1TB-SI B10, IPS, 1920x1080, 17.3" | Alienware m17 R5 (R9 6900HX, RX 6850M XT) R9 6900HX, Radeon RX 6850M XT, SSSTC CA6-8D1024, IPS, 3840x2160, 17" | Asus ROG Strix Scar 17 SE G733CX-LL014W i9-12950HX, GeForce RTX 3080 Ti Laptop GPU, Samsung PM9A1 MZVL22T0HBLB, IPS, 2560x1440, 17.3" | |
|---|---|---|---|---|---|---|
| Power Consumption | 17% | 8% | 32% | 31% | 9% | |
| Idle Minimum * (Watt) | 24.5 | 17 31% | 14 43% | 15 39% | 13 47% | 19.3 21% |
| Idle Average * (Watt) | 34.1 | 23 33% | 21.6 37% | 17 50% | 16.5 52% | 26.5 22% |
| Idle Maximum * (Watt) | 47.7 | 34 29% | 24.8 48% | 24 50% | 17 64% | 27.1 43% |
| Load Average * (Watt) | 140 | 120 14% | 122.5 12% | 111 21% | 93 34% | 141 -1% |
| Witcher 3 ultra * (Watt) | 202 | 229 -13% | 265 -31% | 174.1 14% | 239 -18% | 225 -11% |
| Load Maximum * (Watt) | 261 | 243 7% | 418 -60% | 208 20% | 251 4% | 307.9 -18% |
* ... mindre är bättre
Power Consumption Witcher 3 / Stresstest
Power Consumption external Monitor
Batteritid
Det är ingen tillfällighet att den största Blade-modellen också har den största batterikapaciteten i familjen med 91,7 Wh. Batteritiden är dock inte nödvändigtvis längre, och den kan till och med vara kortare i många scenarier. Vi kan surfa på webben på den balanserade strömprofilen i 4 timmar innan vi behöver ladda, vilket är nästan en hel timme kortare än på förra årets Blade 15. Att sänka skärmens uppdateringsfrekvens till 60 Hz i stället för 240 Hz kan förlänga batteritiden bara marginellt.
Att ladda från tomt till fullt batteri tar cirka 90 minuter. Användare kan också ladda systemet via USB-C om än i en långsammare takt.
| Razer Blade 18 RTX 4070 i9-13950HX, GeForce RTX 4070 Laptop GPU, 91.7 Wh | Razer Blade 17 Early 2022 i9-12900H, GeForce RTX 3080 Ti Laptop GPU, 82 Wh | MSI Titan GT77 HX 13VI i9-13950HX, GeForce RTX 4090 Laptop GPU, 99.9 Wh | Gigabyte G7 KE i5-12500H, GeForce RTX 3060 Laptop GPU, 54 Wh | Alienware m17 R5 (R9 6900HX, RX 6850M XT) R9 6900HX, Radeon RX 6850M XT, 97 Wh | Asus ROG Strix Scar 17 SE G733CX-LL014W i9-12950HX, GeForce RTX 3080 Ti Laptop GPU, 90 Wh | |
|---|---|---|---|---|---|---|
| Batteridrifttid | 9% | 21% | 11% | 29% | 5% | |
| Reader / Idle (h) | 7 | 7.1 1% | 7.1 1% | |||
| WiFi v1.3 (h) | 4 | 3.8 -5% | 5.3 33% | 5.3 33% | 4.8 20% | 4.2 5% |
| Load (h) | 1.3 | 1.7 31% | 1.4 8% | 1.3 0% | 1.8 38% | |
| H.264 (h) | 4.8 | 6 | 2.2 | 4.9 |
För
Emot
Bedömning - Älskar hårdvaran, hatar buggarna
Vi gick därifrån imponerade av Blade 16men samma sak kan inte sägas om Blade 18. Vår enhet uppvisade stora problem, bland annat buggig DLSS 3-prestanda på en extern bildskärm, bristande G-Sync-stöd när G-Sync ska ha ingått och en potentiellt felaktig flimrande bildskärm. Vi övervägde att hålla tillbaka den här recensionen tills dessa problem kunde åtgärdas, men Blade 18 levereras redan till kunder och därför kände vi att det var rätt att informera våra läsare som kanske är på marknaden för en sådan. Den här sidan kommer att uppdateras med ett slutbetyg på plats när vi har en ordentlig lösning från tillverkaren.
Blade 18 visar potential att bli ännu ett utmärkt tillägg till Blade-familjen när man ser bortom ovanstående problem. Den 18-tums skärmen är underbar och massiv i förhållande till fotavtrycket och vikten. Det faktum att systemet inte är så mycket större eller tyngre än Blade 17 bör göra det mycket tilltalande för användare som kanske redan överväger en Blade 17 eller någon annan 17-tums bärbar dator för spel. Dess relativt lilla GaN AC-adapter bidrar ytterligare till Blade 18:s bärbara-DTR-hybridkaraktär.
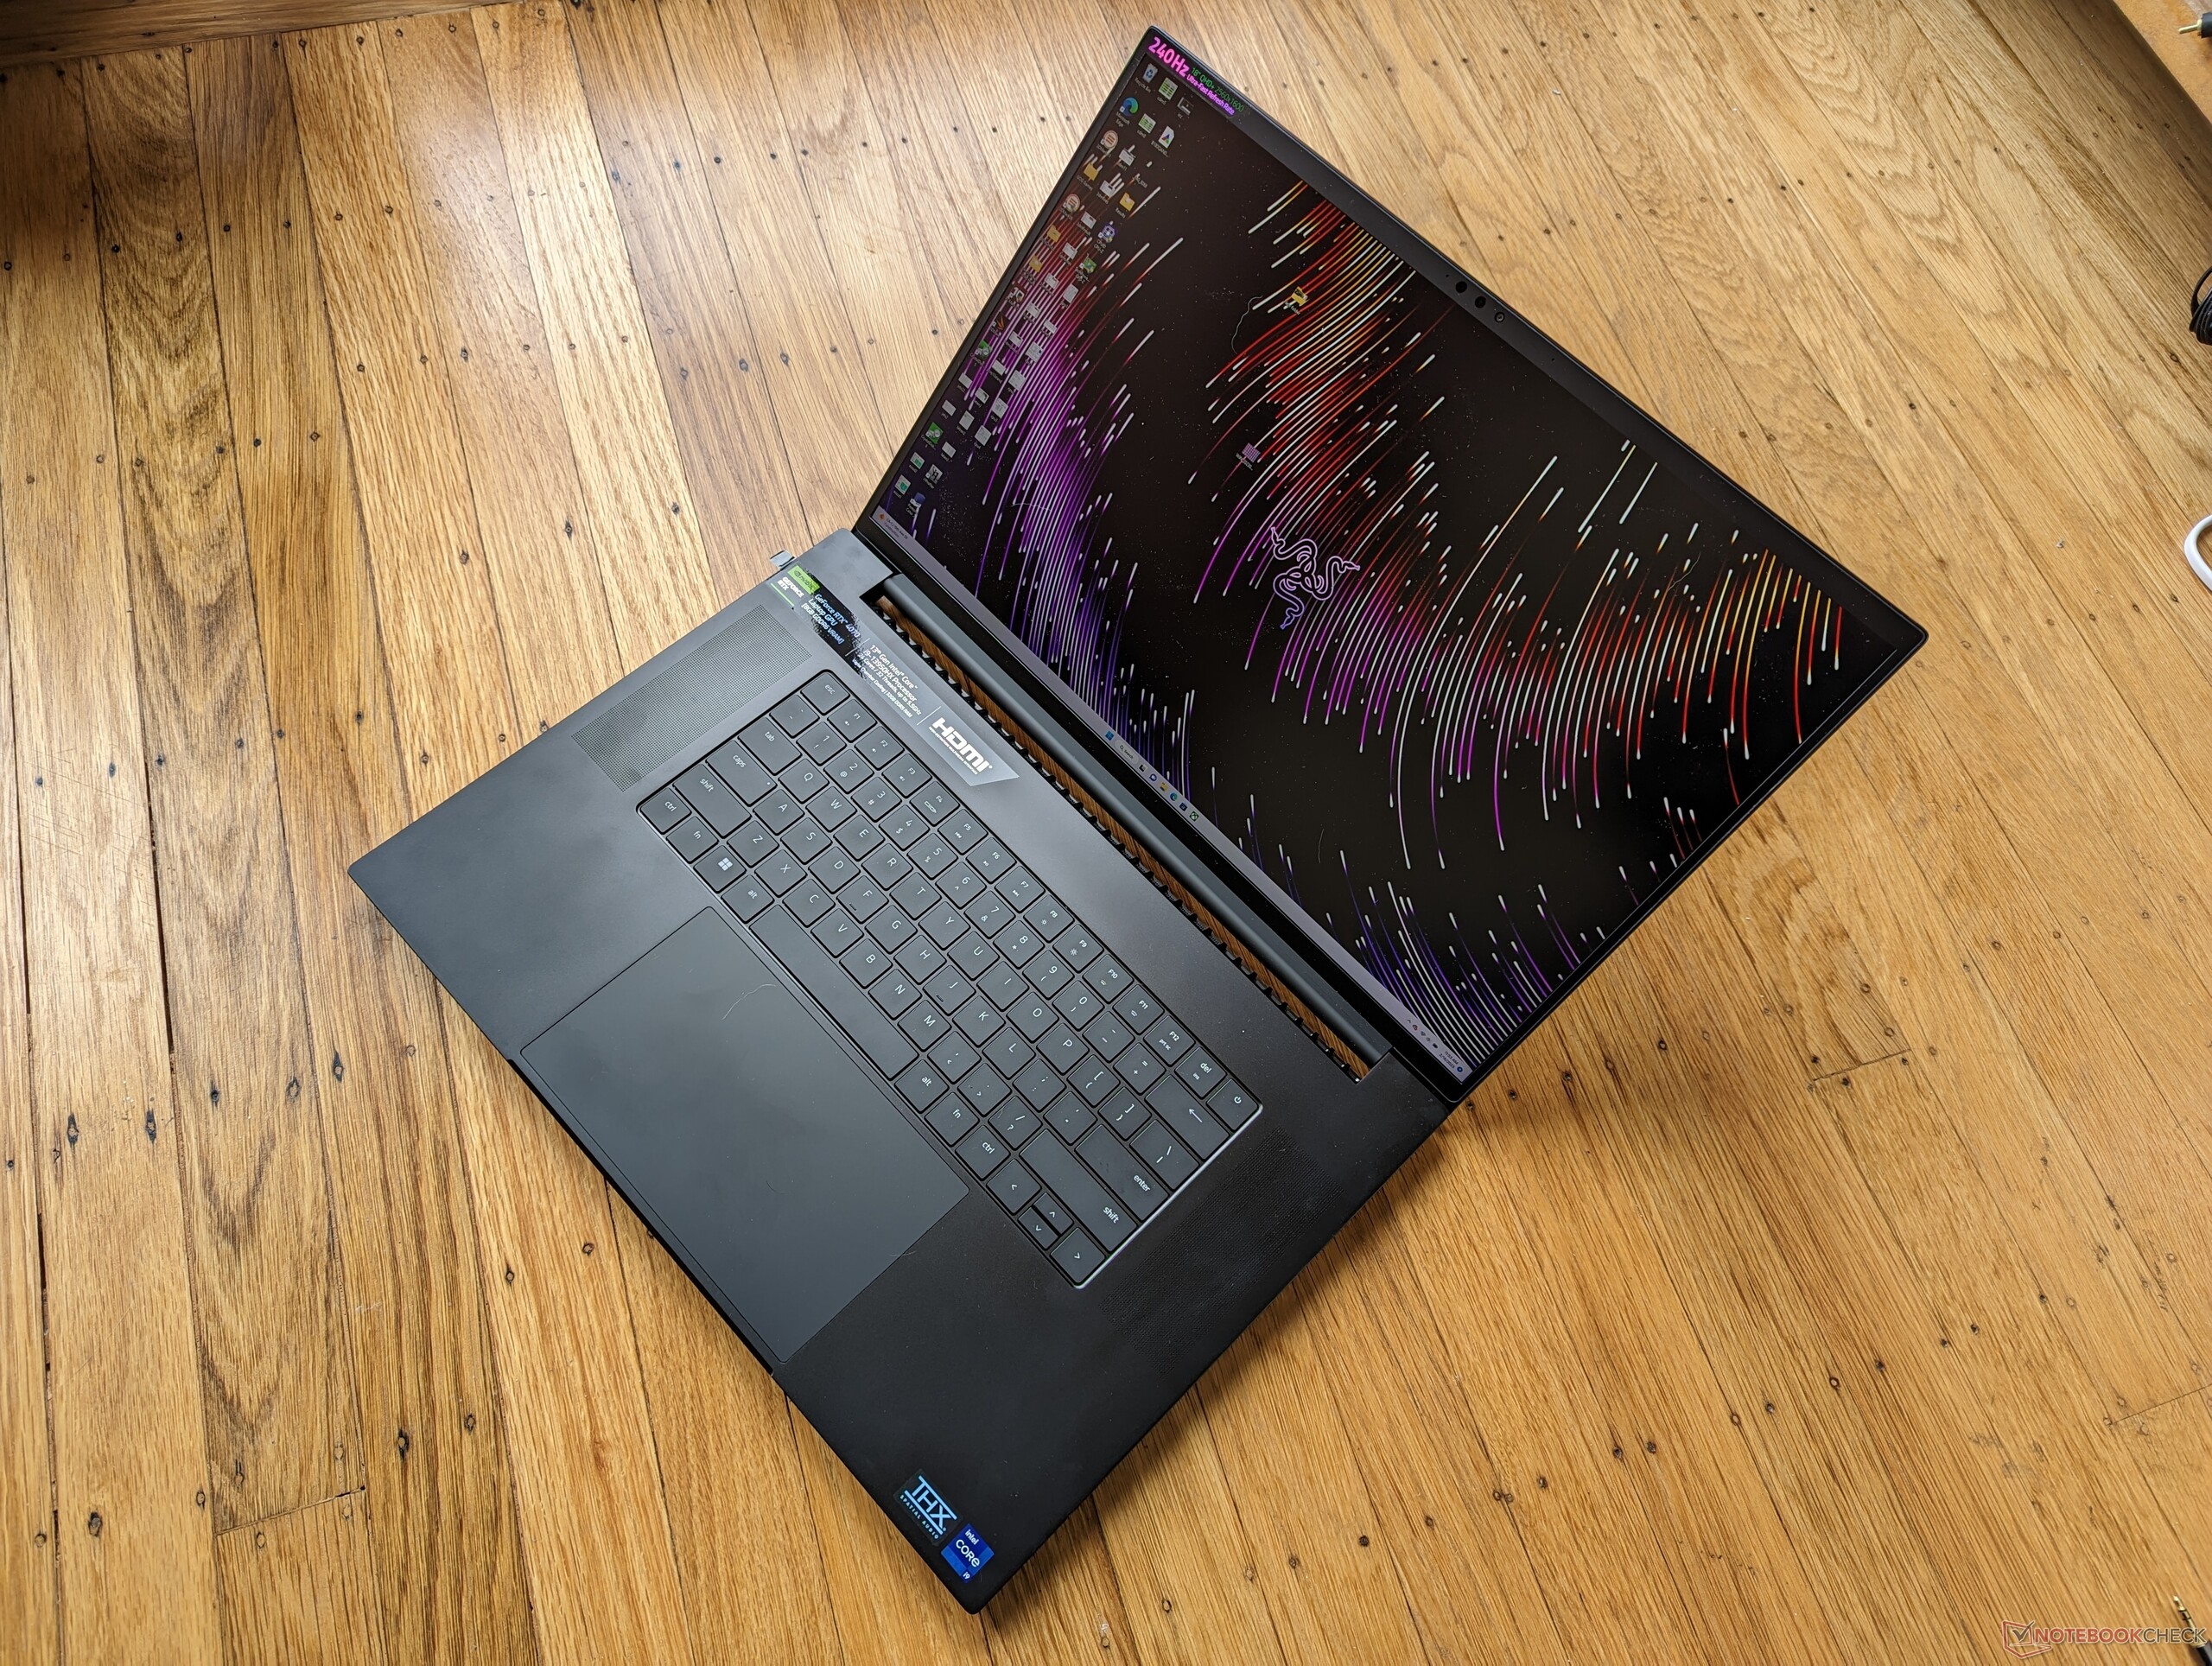
Blade 18 kan låta gigantiskt vid första anblicken, men den är egentligen inte så mycket större än den befintliga Blade 17. Dess stora skärm och höga förhållande mellan skärm och kropp är imponerande.
När det gäller det mobila RTX 4070 kan dess prestanda vara undermålig beroende på spel. Titlar som stöder DLSS 3 går som smör på det mobila RTX 4070. I övrigt får du räkna med att prestandan liknar förra årets mobila RTX 3080 eller ett stationärt RTX 3070. Lyckligtvis har listan över titlar som stöder DLSS 3 stadigt utökats.
Det är en överlag stark start för den 18-tums Blade-serien som störs av några anmärkningsvärda lanseringsproblem. De kommande Asus ROG Strix Scar 18 och Dell Alienware m18 kan innebära problem för Blade 18 om vissa nyckelproblem inte åtgärdas.
Pris och tillgänglighet
Genomskinlighet
Valet av enheter som ska granskas görs av vår redaktion. Testprovet gavs till författaren som ett lån av tillverkaren eller återförsäljaren för denna recension. Långivaren hade inget inflytande på denna recension och inte heller fick tillverkaren en kopia av denna recension innan publiceringen. Det fanns ingen skyldighet att publicera denna recension. Som ett oberoende medieföretag är Notebookcheck inte föremål för auktoritet från tillverkare, återförsäljare eller förlag.
This is how Notebookcheck is testingEvery year, Notebookcheck independently reviews hundreds of laptops and smartphones using standardized procedures to ensure that all results are comparable. We have continuously developed our test methods for around 20 years and set industry standards in the process. In our test labs, high-quality measuring equipment is utilized by experienced technicians and editors. These tests involve a multi-stage validation process. Our complex rating system is based on hundreds of well-founded measurements and benchmarks, which maintains objectivity.
Price comparison

