MSI Katana 15 laptop recension: Budget gamer med RTX 4050 och Alder Lake CPU
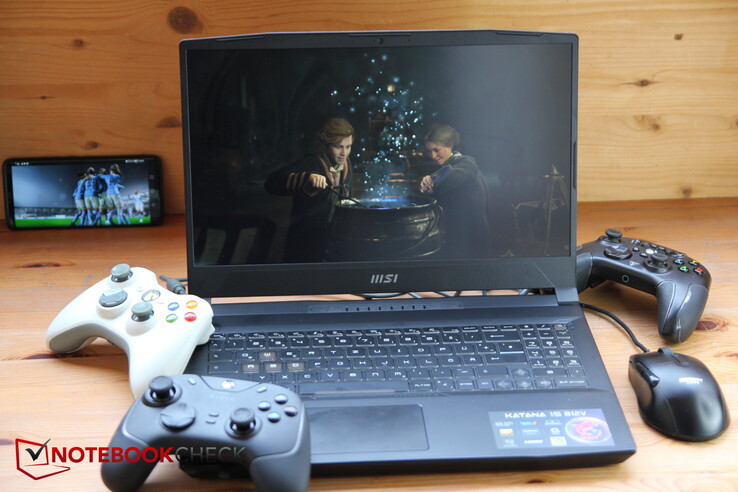
MSI har en serie bärbara datorer som ser väldigt lika ut. Förra året recenserade vi den 15,6-tums kvasi-förföljaren, denMSI Katana GF66 12UGS, men den Pulse GL66eller MSI Sword är också visuellt sett likadana. Vår nuvarande granskningskonfiguration är intressant eftersom MSI har beslutat att kombinera en "gammal" Alder Lake-processor med en ny RTX 4050 för att eventuellt vara bland de första att släppa en bärbar dator för spel med ett RTX 40xx-kort. Benämningen är Katana 15 B12, medan Katana 15 B13 redan har en Intel Gen13 och ett RTX 40xx. Vi ska ta en titt på hur de två CPU/GPU-generationerna förhåller sig till varandra i vår B12-modell.
Eftersom Katana 15 är en av de första bärbara datorerna med en RTX 4050 som recenseras, faller vi i stort sett tillbaka på den tidigare generationen för instegs- och mellanklassspelare medRTX 3060som jämförelse. Dessa inkluderar Lenovo Legion 5, den Schenker XMG Core 15, den MSI Pulse GL66 och Asus TUF Gaming F15föregångaren är också med för jämförelse, men läsarna bör notera att den var utrustad med den starkare RTX 3070 Ti.
Potentiella konkurrenter i jämförelse
Gradering | Datum | Modell | Vikt | Höjd | Storlek | Upplösning | Pris |
|---|---|---|---|---|---|---|---|
| 82.9 % v7 (old) | 03/2023 | MSI Katana 15 B12VEK i7-12650H, GeForce RTX 4050 Laptop GPU | 2.3 kg | 24.9 mm | 15.60" | 1920x1080 | |
| 80.3 % v7 (old) | 06/2022 | MSI Katana GF66 12UGS i7-12700H, GeForce RTX 3070 Ti Laptop GPU | 2.3 kg | 27.5 mm | 15.60" | 1920x1080 | |
| 80.7 % v7 (old) | 04/2022 | MSI Pulse GL66 12UEK i9-12900H, GeForce RTX 3060 Laptop GPU | 2.3 kg | 25 mm | 15.60" | 1920x1080 | |
| 87.5 % v7 (old) | 11/2022 | Lenovo Legion 5 15IAH7H 82RB i7-12700H, GeForce RTX 3060 Laptop GPU | 2.4 kg | 19.99 mm | 15.60" | 1920x1080 | |
| 87.2 % v7 (old) | 03/2022 | Asus TUF Gaming F15 FX507ZM i7-12700H, GeForce RTX 3060 Laptop GPU | 2.1 kg | 24.95 mm | 15.60" | 1920x1080 | |
| 87.9 % v7 (old) | 01/2023 | Schenker XMG Core 15 (M22) R7 6800H, GeForce RTX 3060 Laptop GPU | 2.1 kg | 23 mm | 15.60" | 2560x1440 |
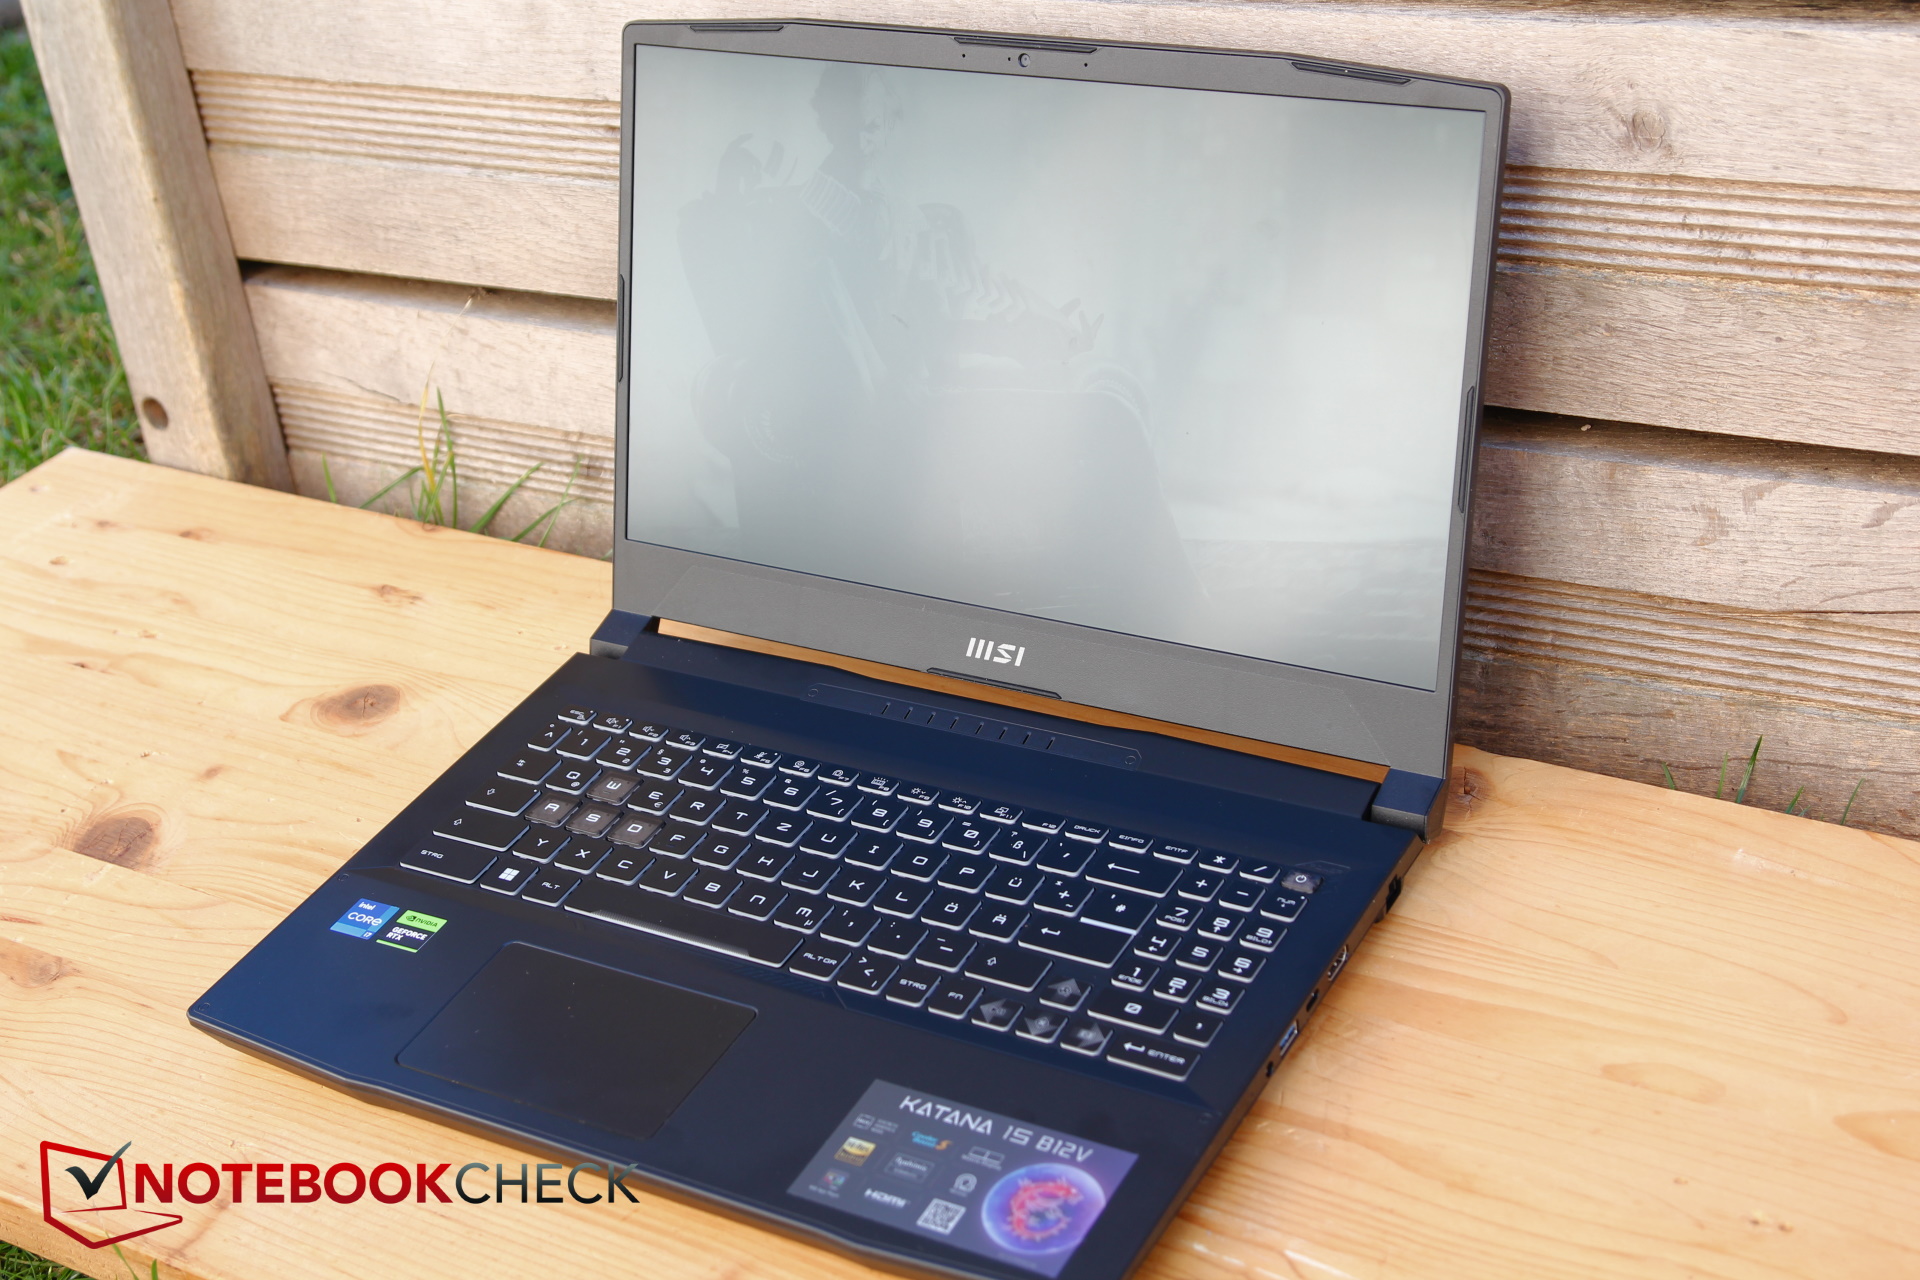
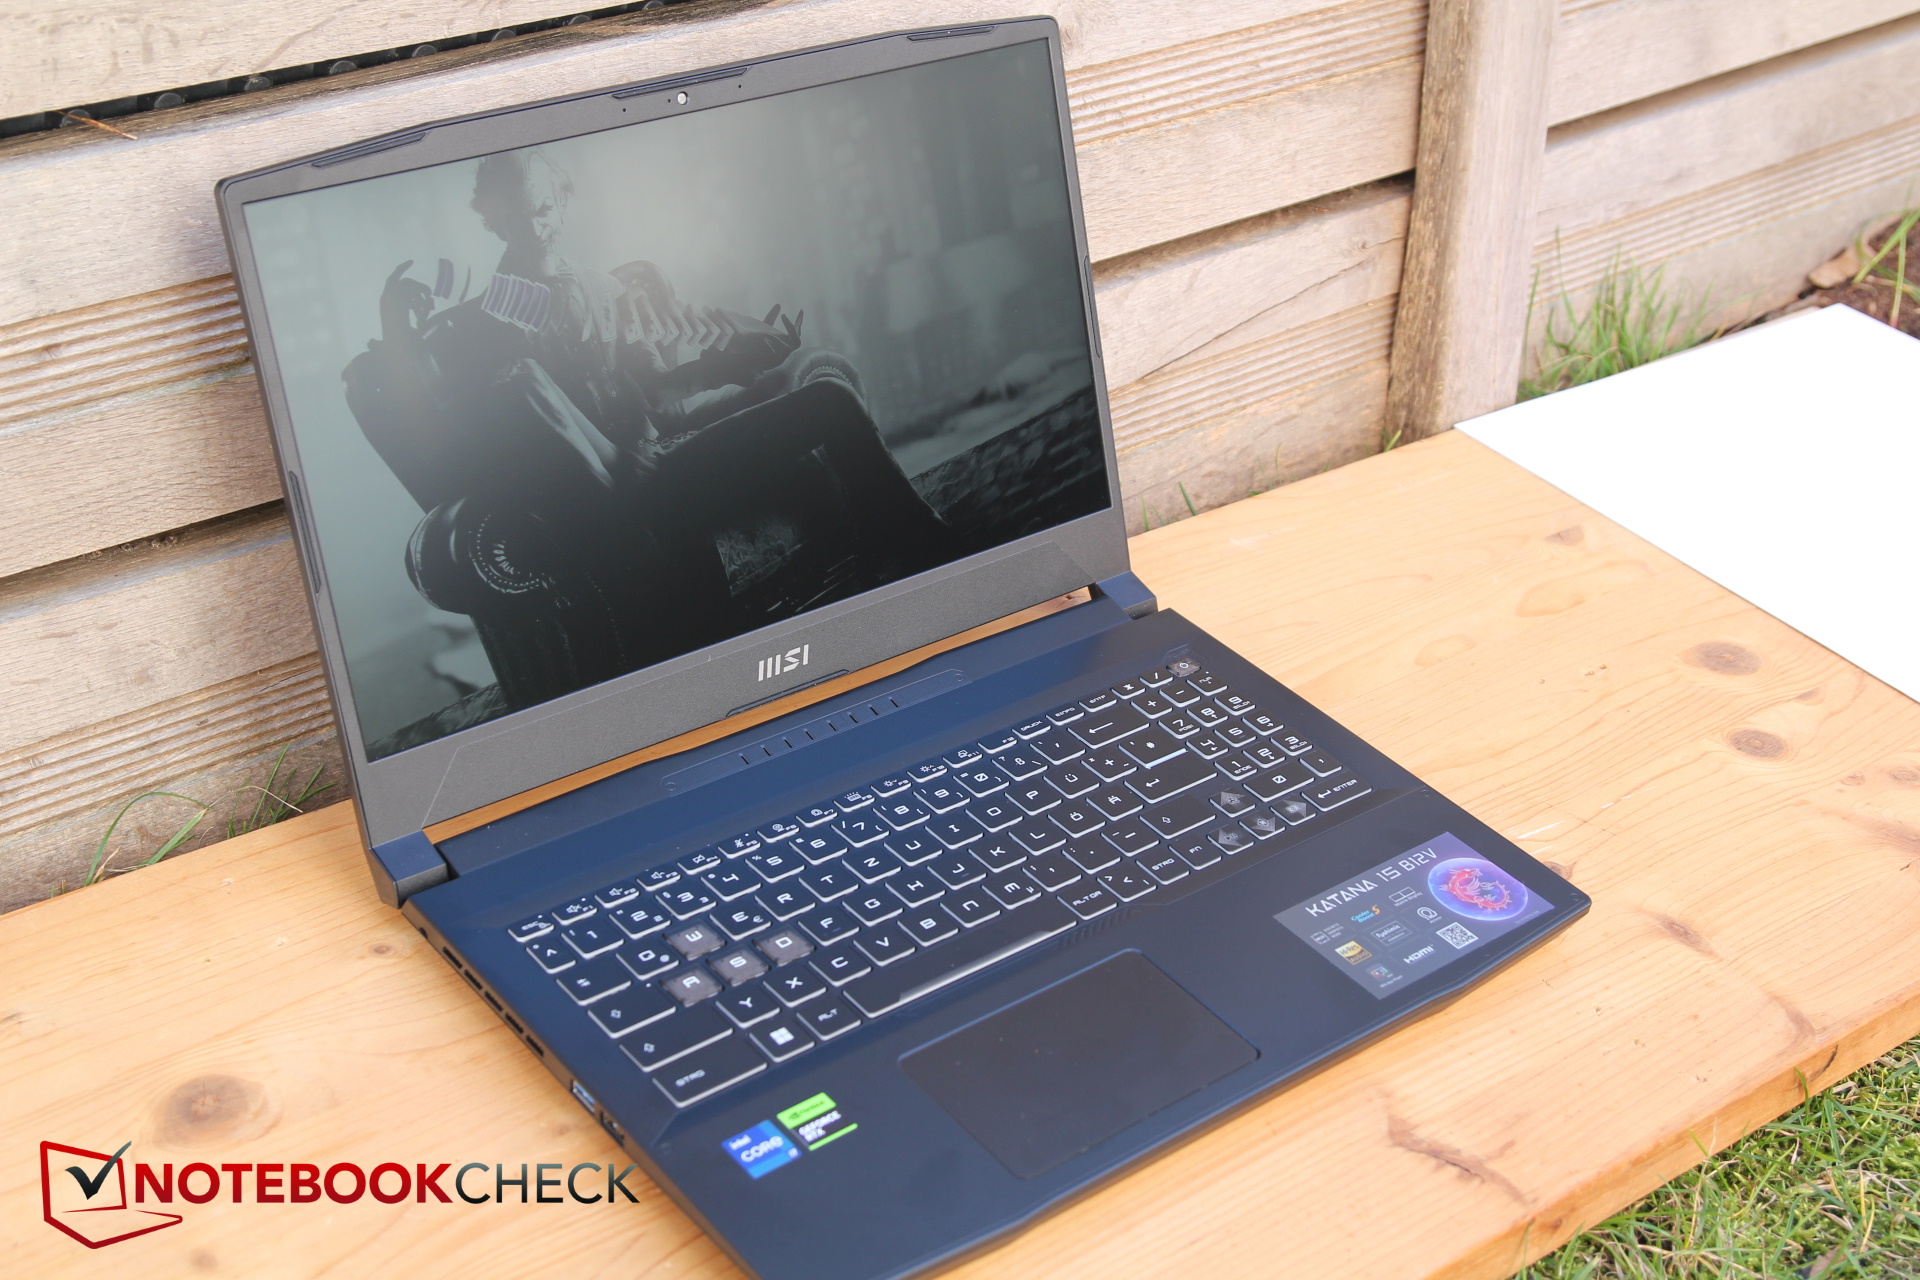
Fodral - Katana i plast
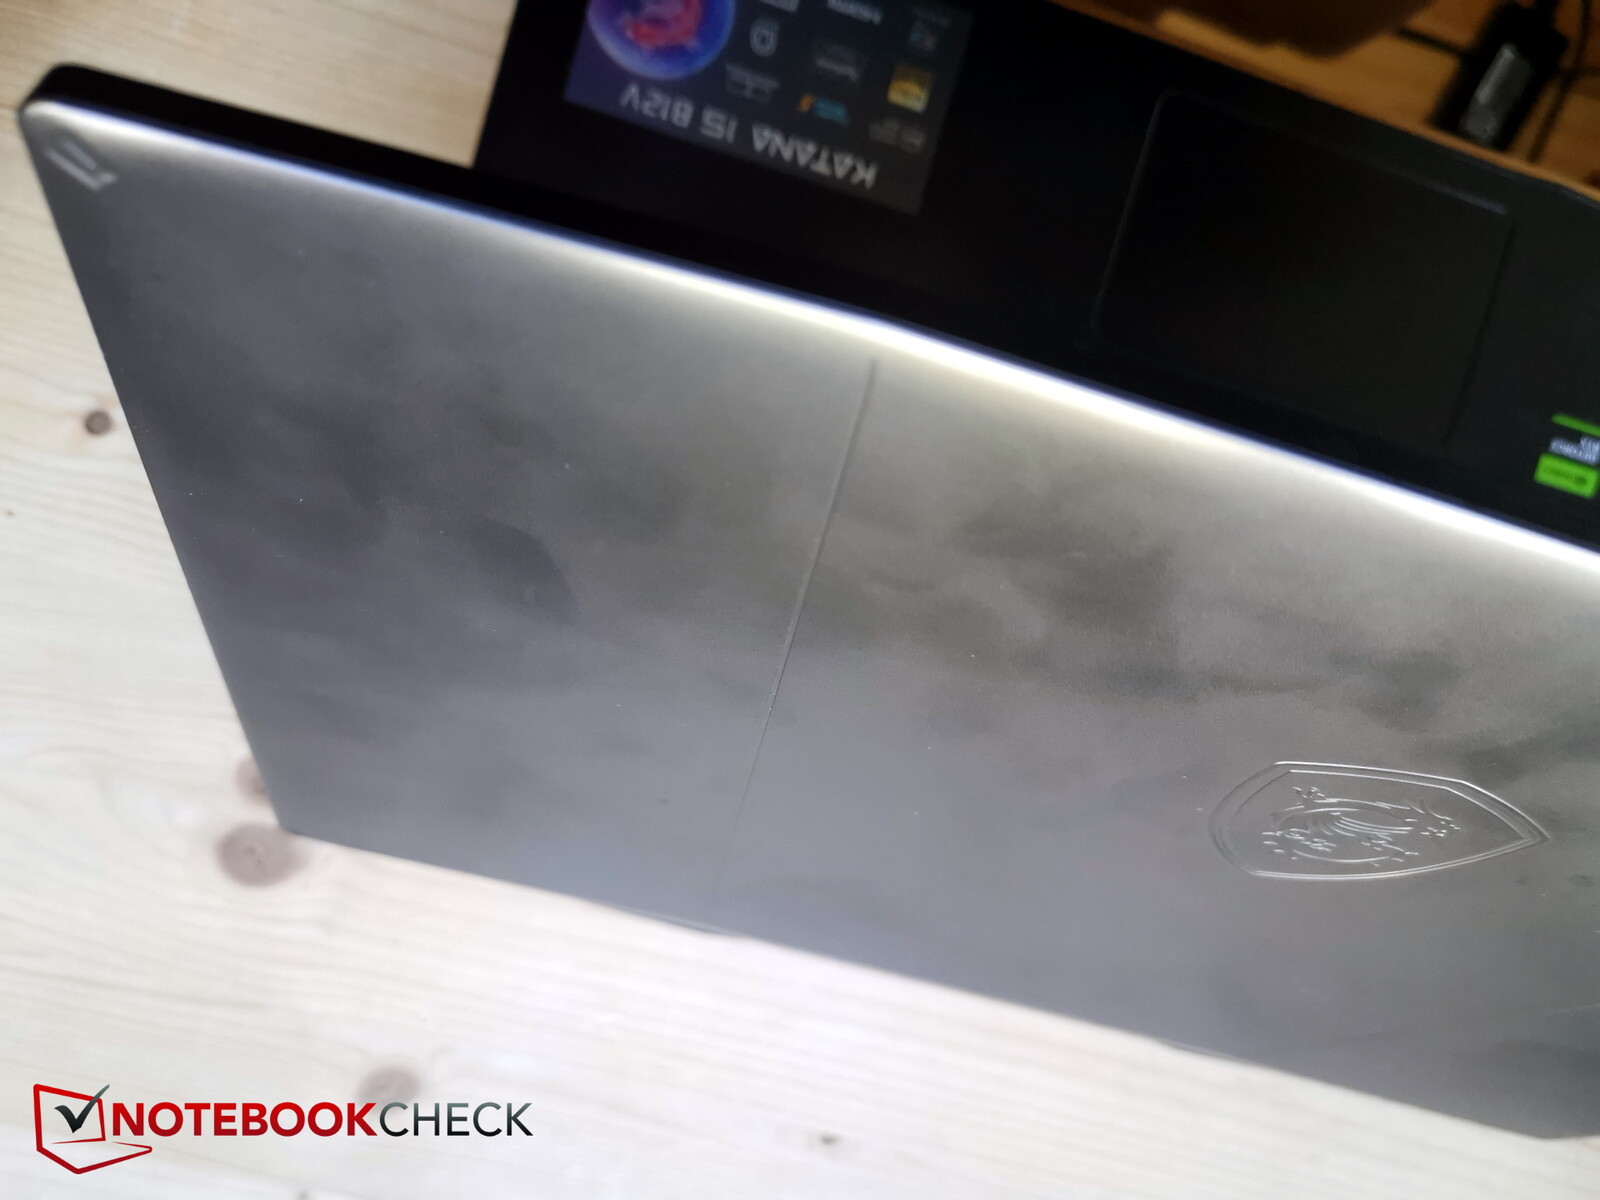
Katana 15:s hölje är helt av plast, även om de släta ytmaterialen på displaylocket och basen nästan ser ut som metall. Sidorna visar nu ett svart och grått mönster. Tyvärr visar sig fodralet också vara mycket känsligt för fingeravtryck
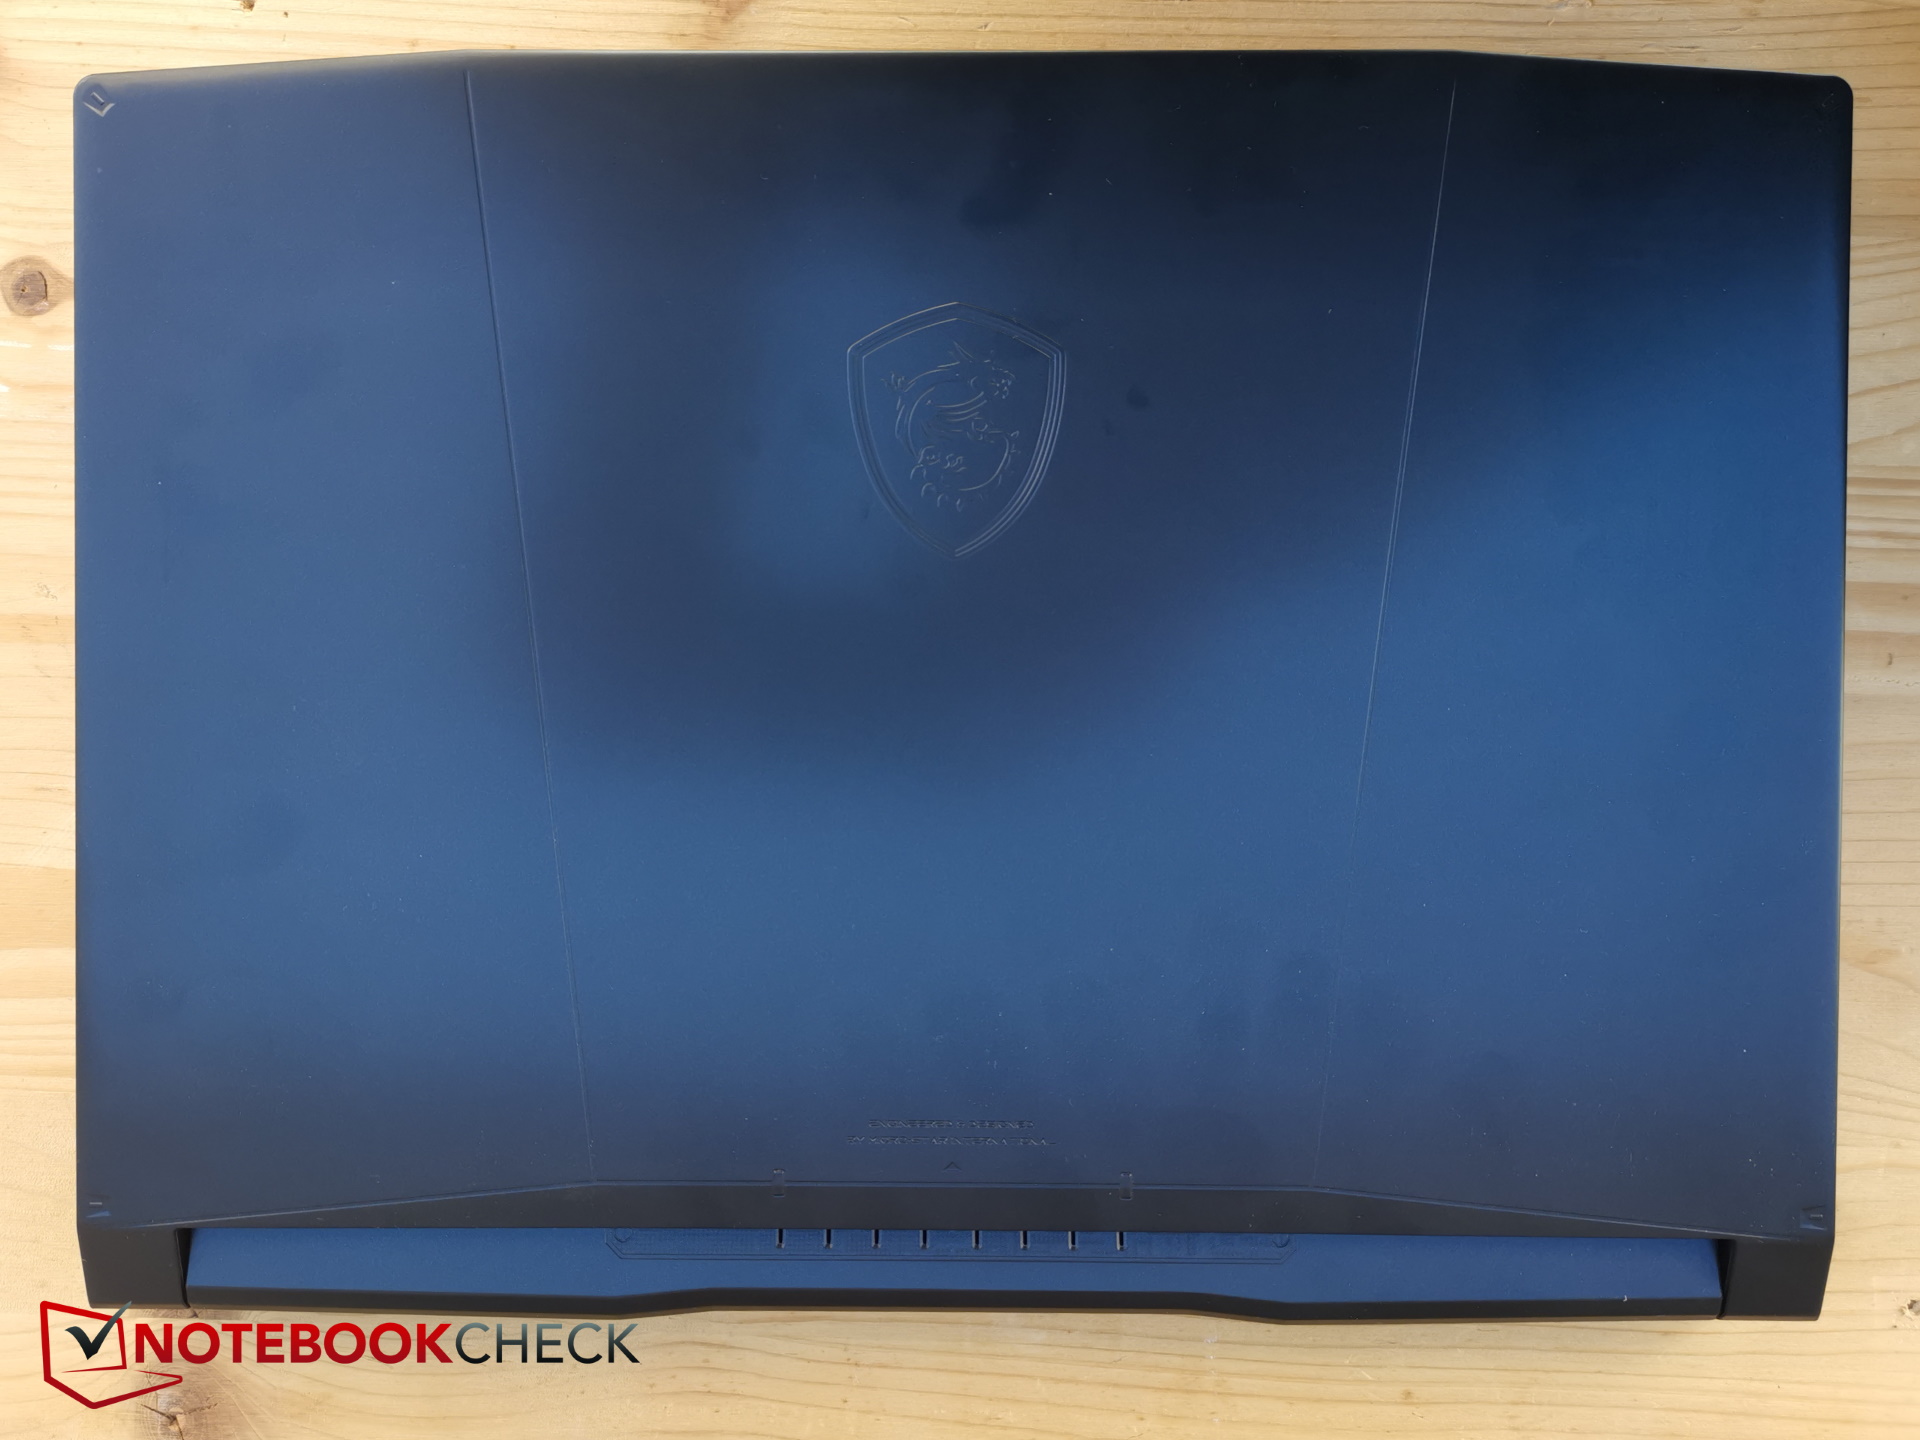
Öppningsvinkeln är 180 grader. Bredvid logotypen pryder några linjer och stansningar den blanksvarta ytan på locket. Skärmen vinglar längre än vanligt efter öppning eller justering av vinkeln
Undersidan är tillverkad av mjukare plast. Basen är relativt vridstyv, men avger några knackande ljud. Locket är däremot mycket lättare att böja och avger ett knarrande ljud. Skärmkanterna är smala på sidorna, men ganska breda upptill och nedtill med dagens mått mätt.
2023 Katana 15 är något tunnare än fjolårets Katana GF66och har samma mått och vikt som Pulse GL66Legion 5 är återigen ännu tunnare, men det är Core 15 också, om än minimalt.
Utrustning - Senaste senaste generationen
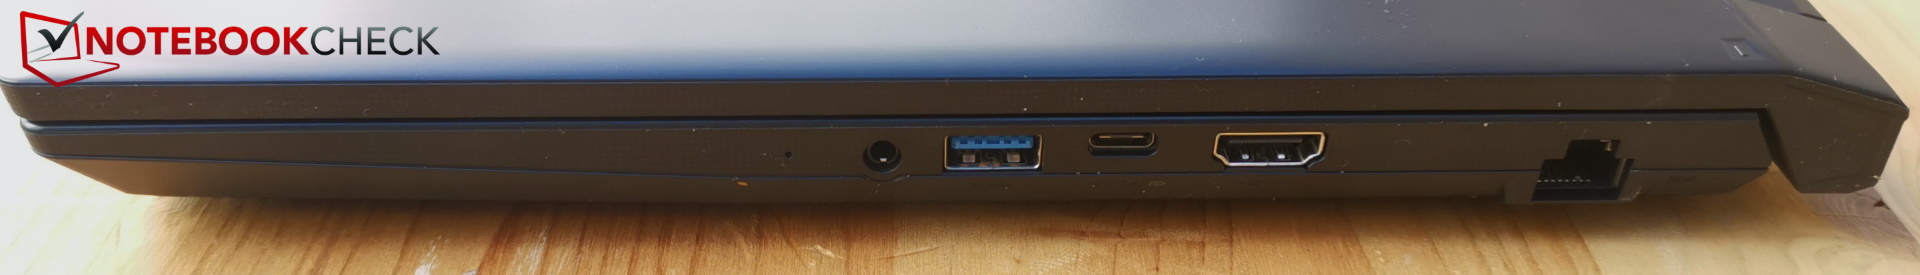
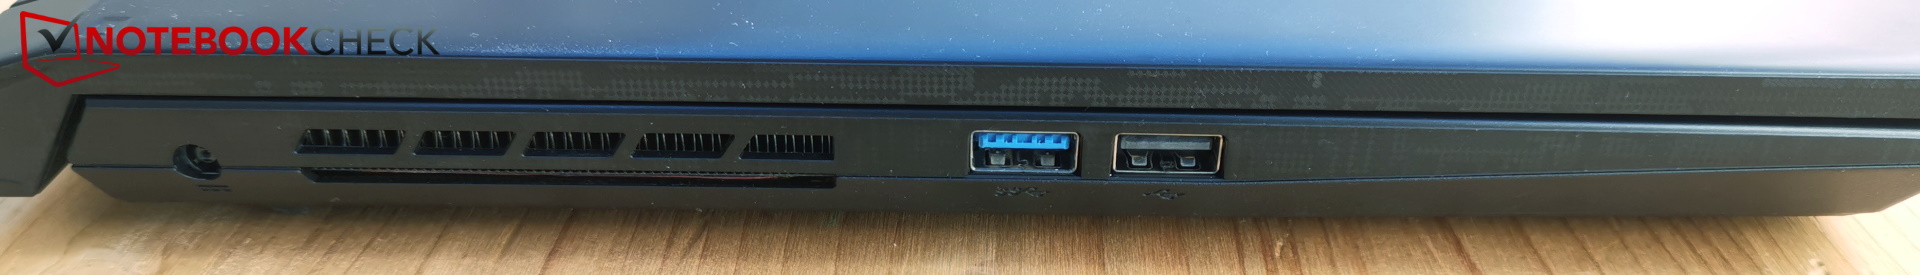
Portarrangemanget är detsamma för alla tre MSI-modellerna. Faktum är att en av de tre USB-A-portarna fortfarande är av typ 2.0, vilket inte riktigt hör hemma i dagens tid. Detsamma gäller den ena USB-C-platsen, som inte stöder Thunderbolt och endast erbjuder 3.0-hastighet.
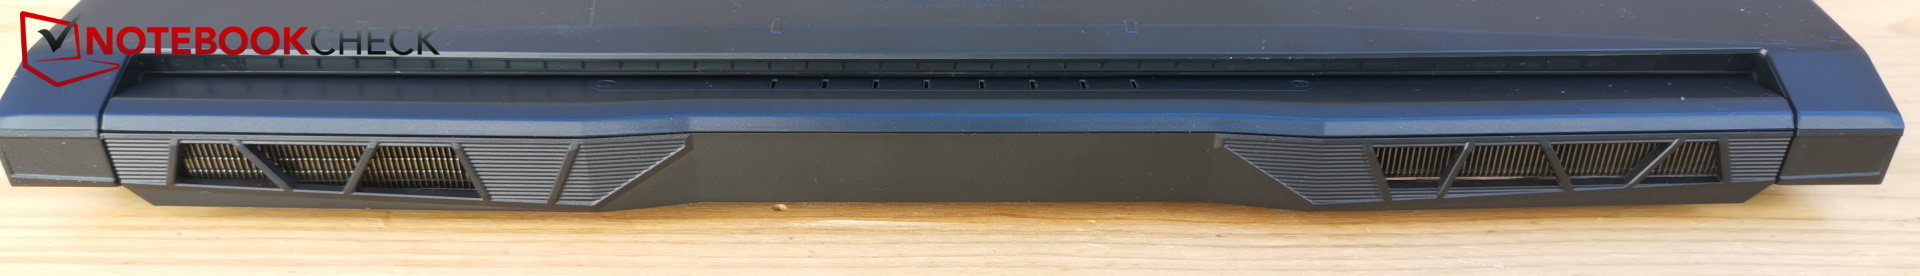
En SD-läsare saknas, men åtminstone LAN och HDMI finns ombord. Headsetuttaget är ovanligt nog placerat på höger sida, precis som HDMI-porten, vilket båda kan störa mushanden. Trots tillräckligt med utrymme finns det inga portar på baksidan.
Kommunikation
MSI har installerat WLAN-modulen Intel Wi-Fi 6 AX201, som ännu inte stöder Wi-Fi 6E, så anslutning till 6 GHz-nätverket är för närvarande inte möjlig. Men den fungerar i 5 GHz-området (och naturligtvis 2,4 GHz) och detta är fortfarande ganska snabbt.
Webbkamera
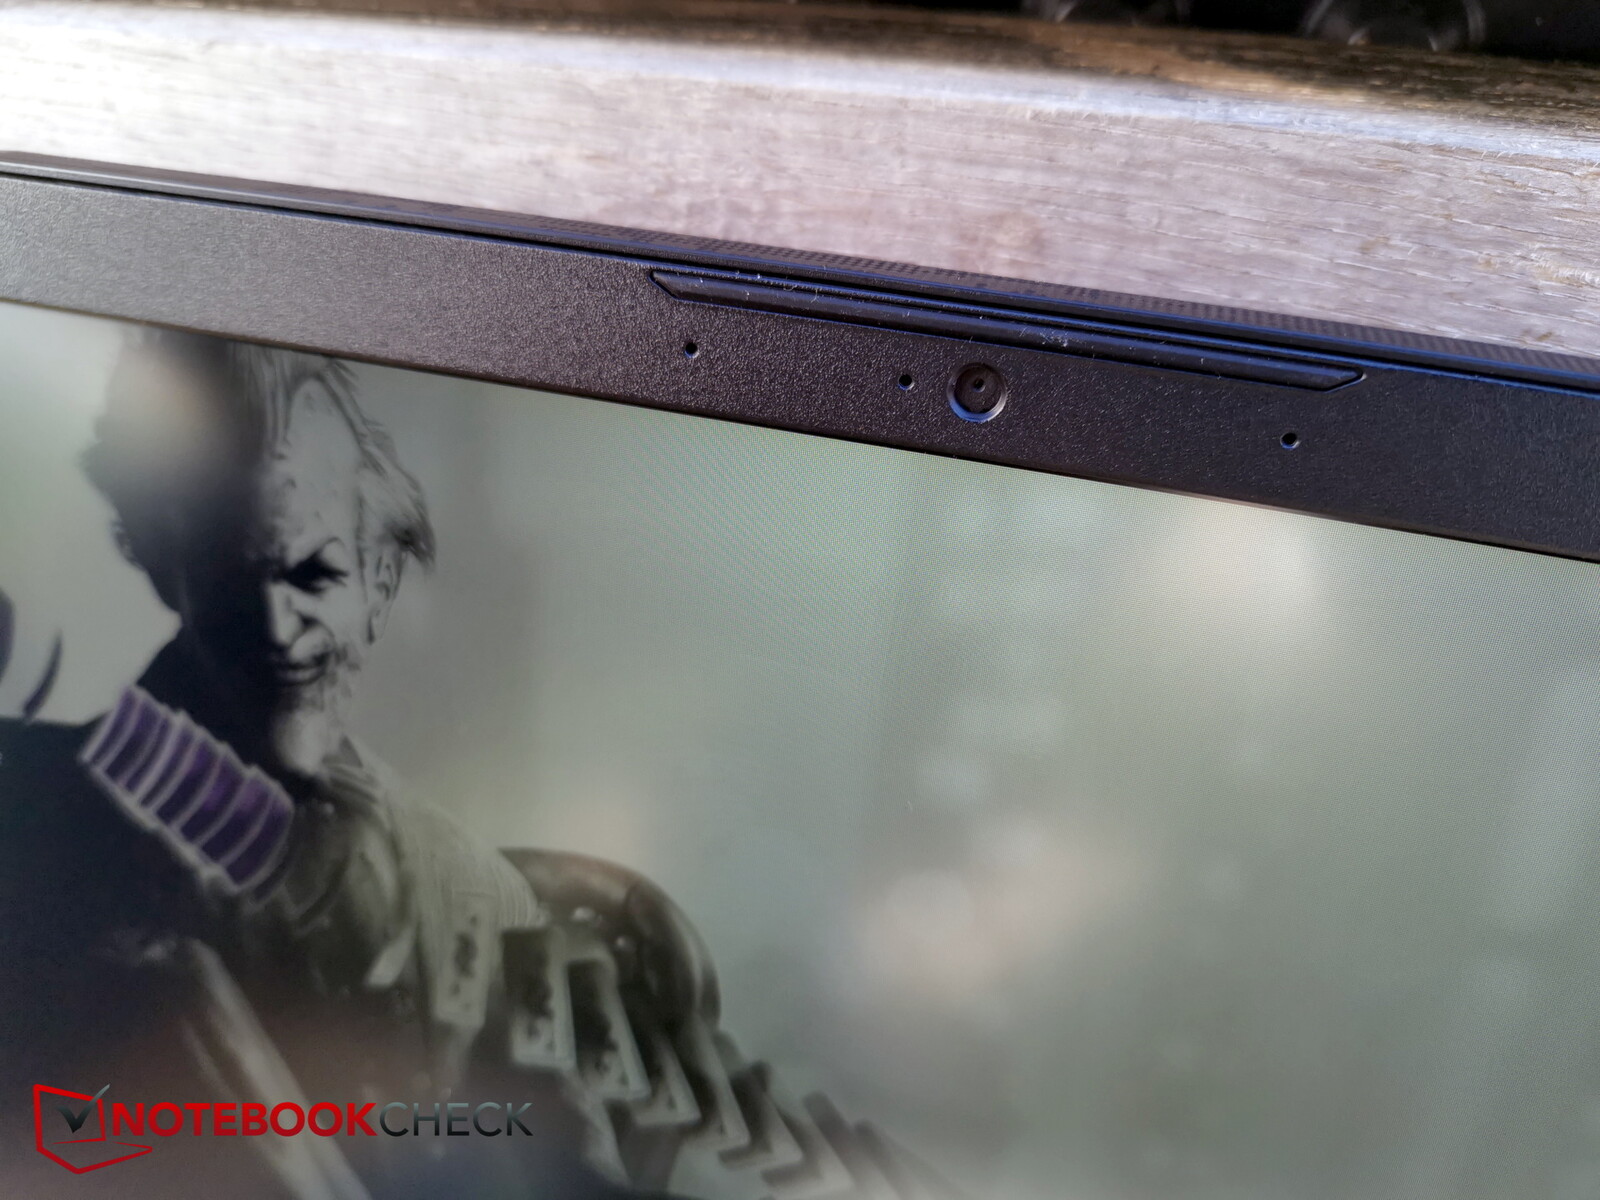
Webbkameran är också av den senaste generationen med en upplösning på 720p. Även den nyare B13 har fortfarande en 720p-kamera. Denna kan slås på och av via fn+F6.
Färgavvikelserna är generellt sett ganska stora och bildkvaliteten ganska suboptimal.


Säkerhet
TPM finns ombord, annars saknas en Kensington-plats. Det finns inte heller någon fingeravtryckssensor.
Tillbehör och garanti
Billiga bärbara datorer har vanligtvis inga extrafunktioner. Så är också fallet med Katana 15.
MSI erbjuder en 24-månaders garanti och en hämtnings- och returtjänst ingår.
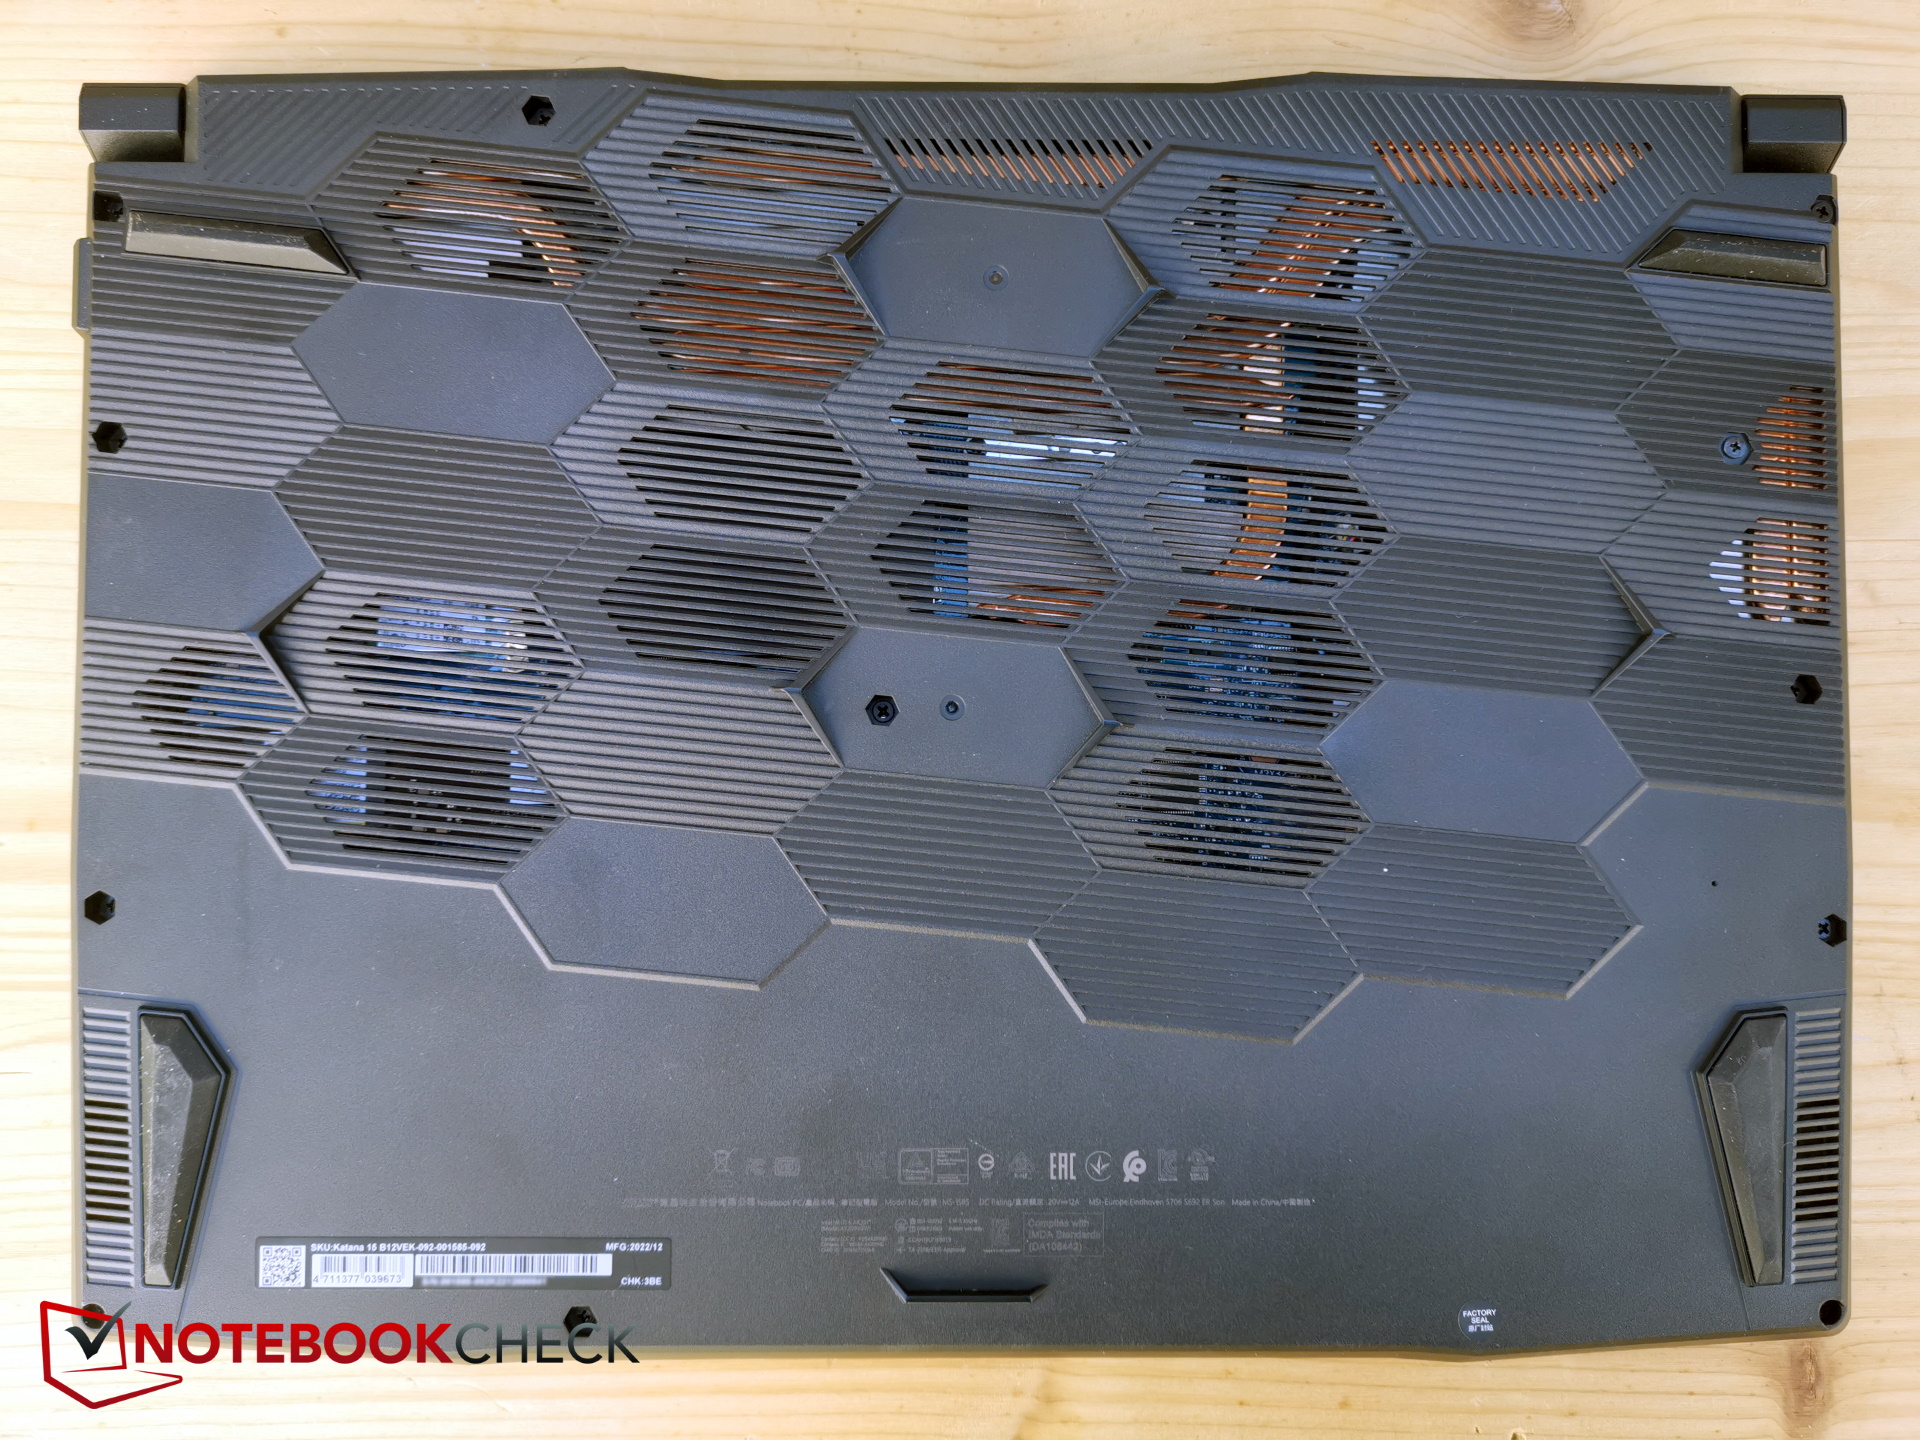
Underhåll
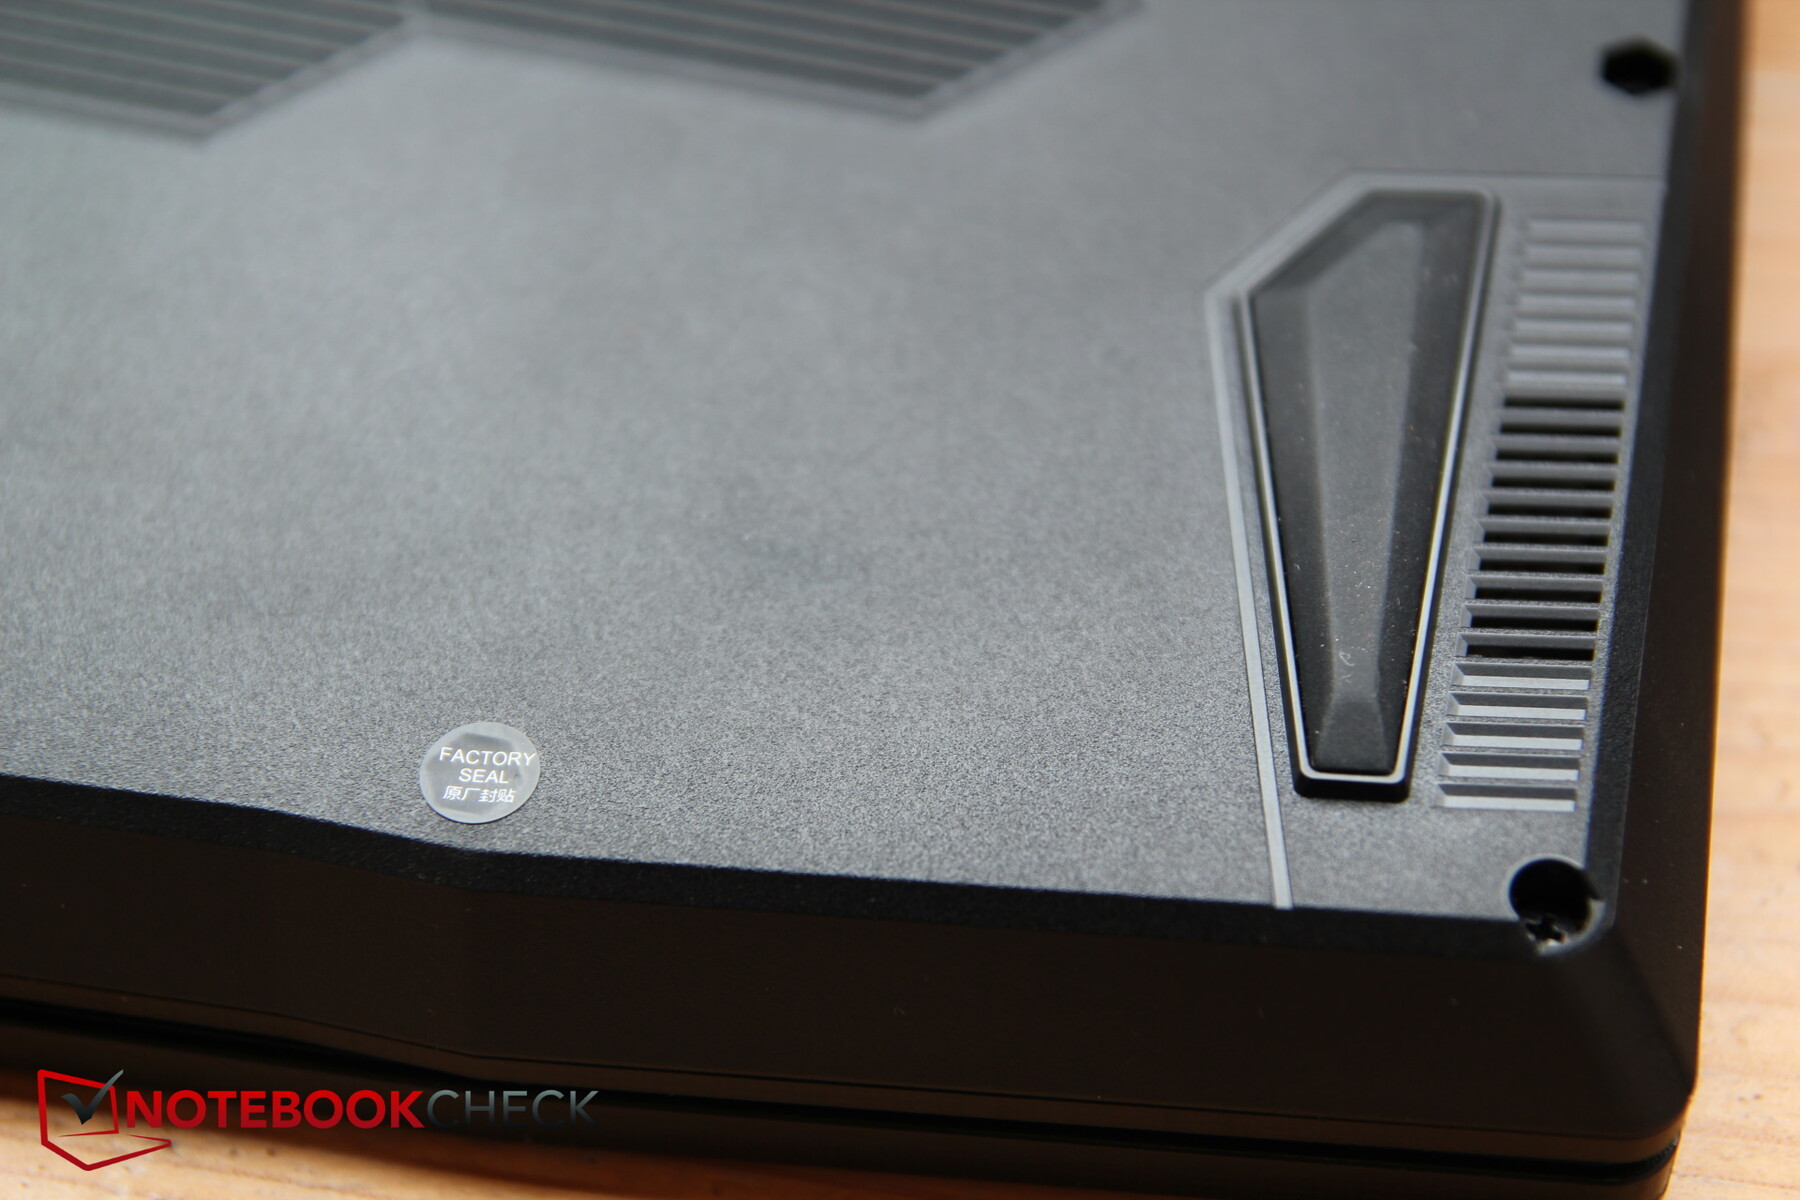
Tyvärr använder MSI ett förseglingsmärke för att avgöra om användaren redan har öppnat enheten själv. Eftersom vår testmodell kommer från Cyberport avstod vi från att öppna den för att inte skada enheten för vårt lån.
Enligt MSI kan enheten även öppnas av ägaren för underhållsändamål. Så länge detta görs "professionellt" påverkas inte enhetens garanti.
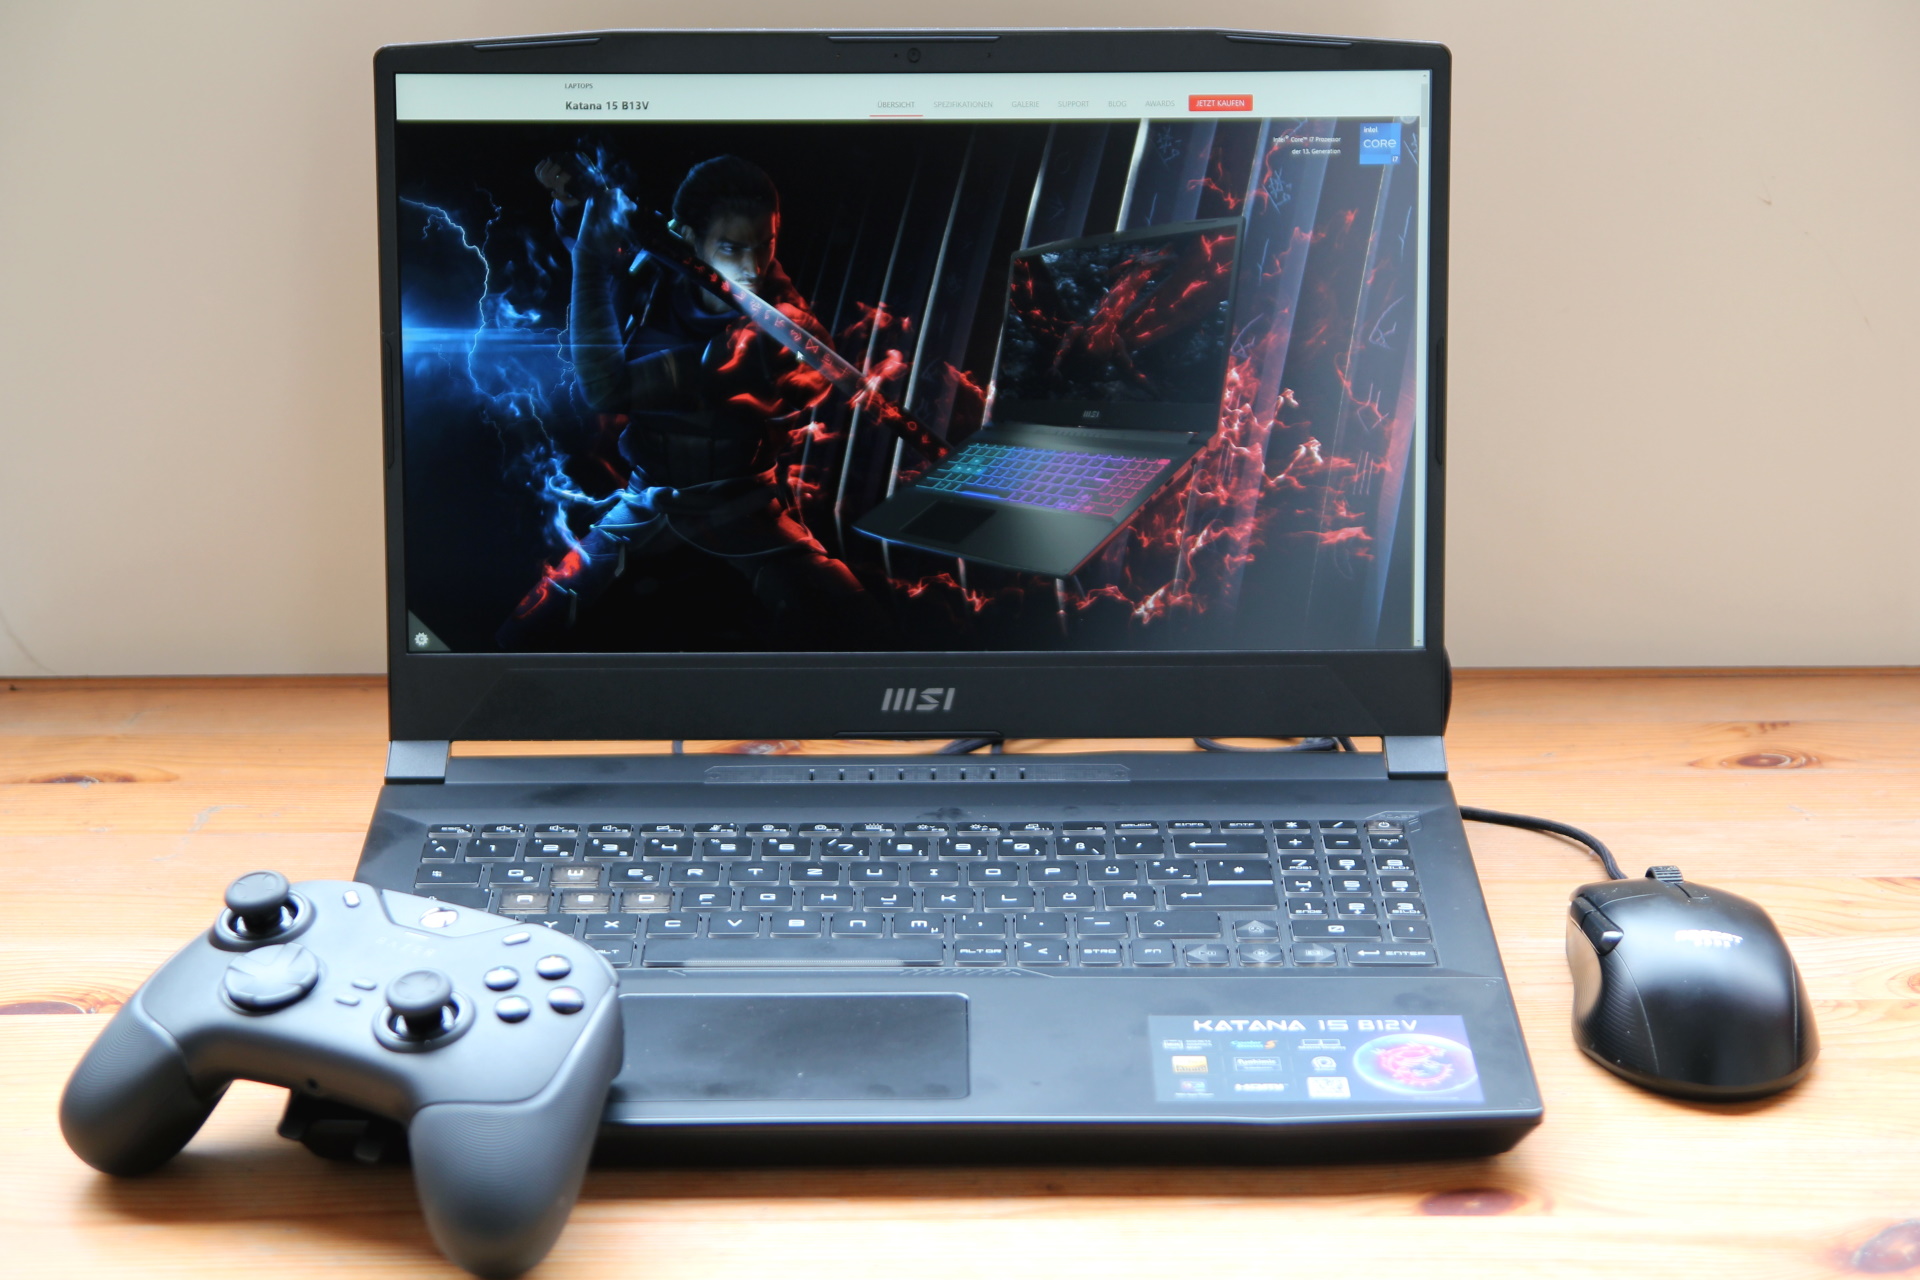
Inmatningsenheter - Bra tangentbord, liten pekplatta
Tangentbord
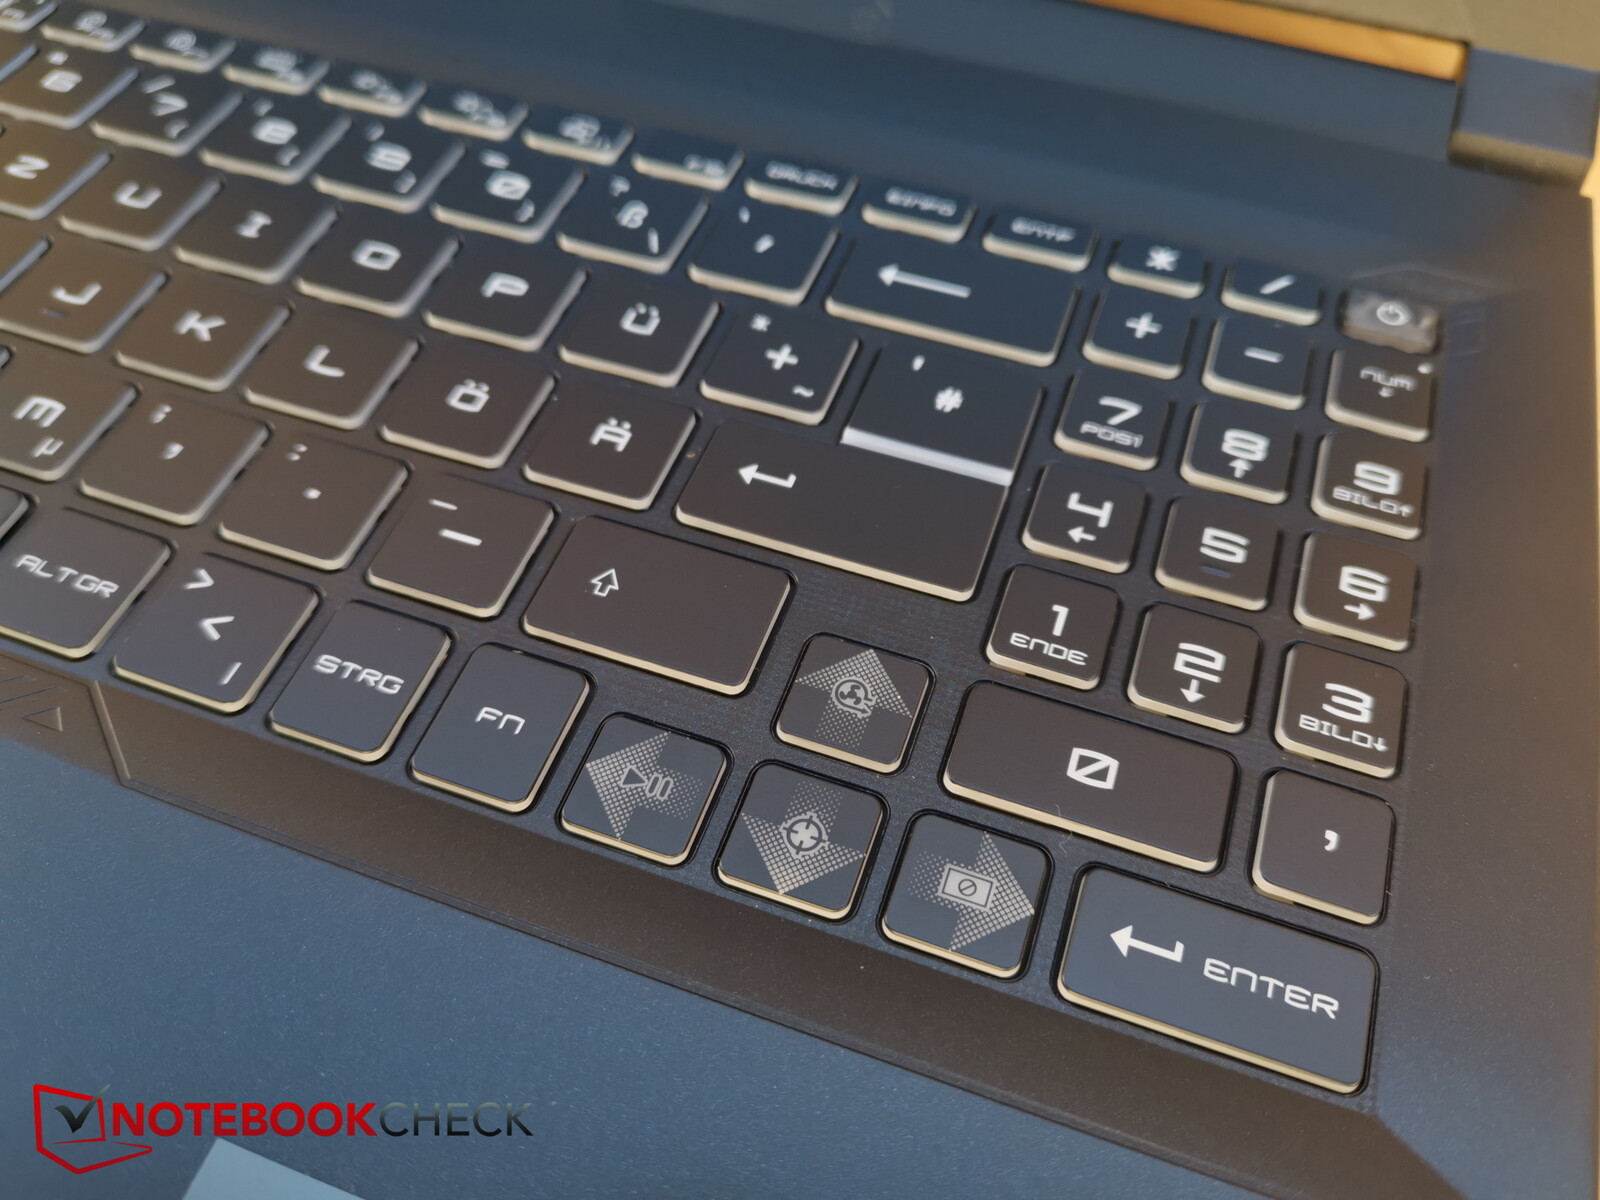
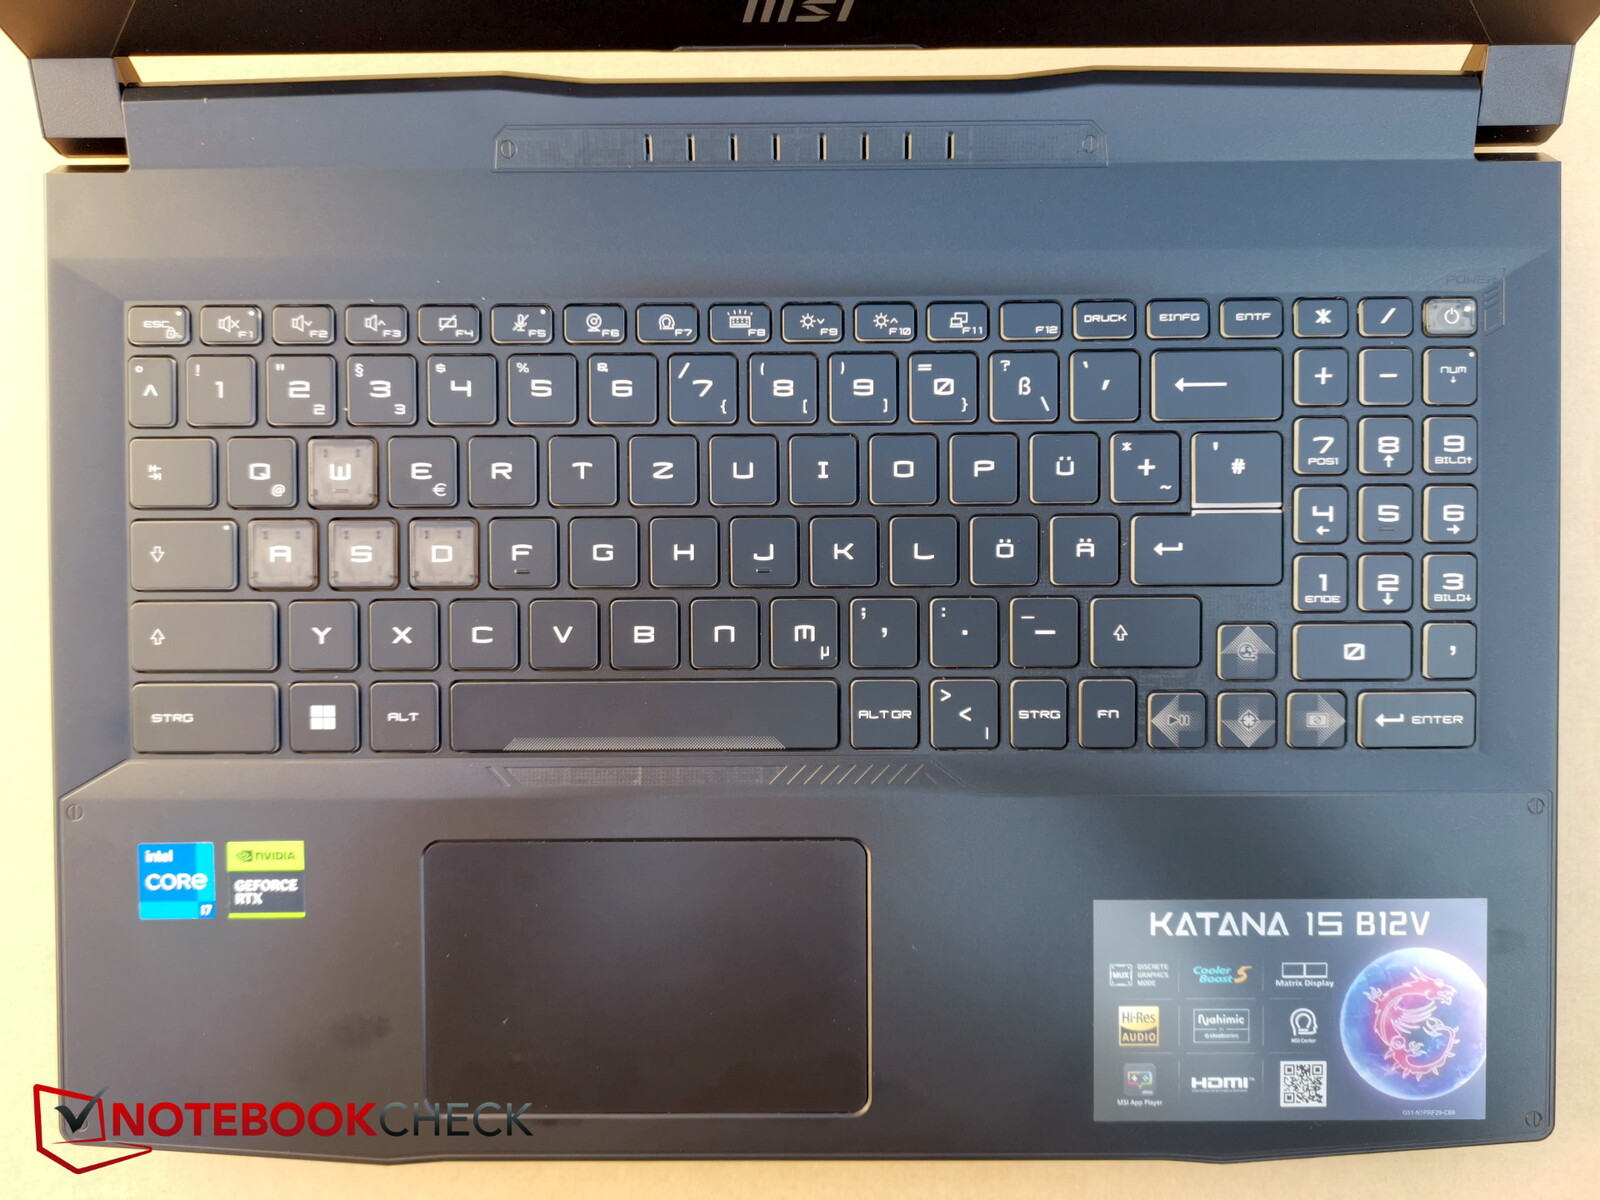
Layouten är mycket likartad för alla Katana-modeller: den ser mycket snygg ut, men numblocket på höger sida ser illa ut, men det finns i alla fall ett.
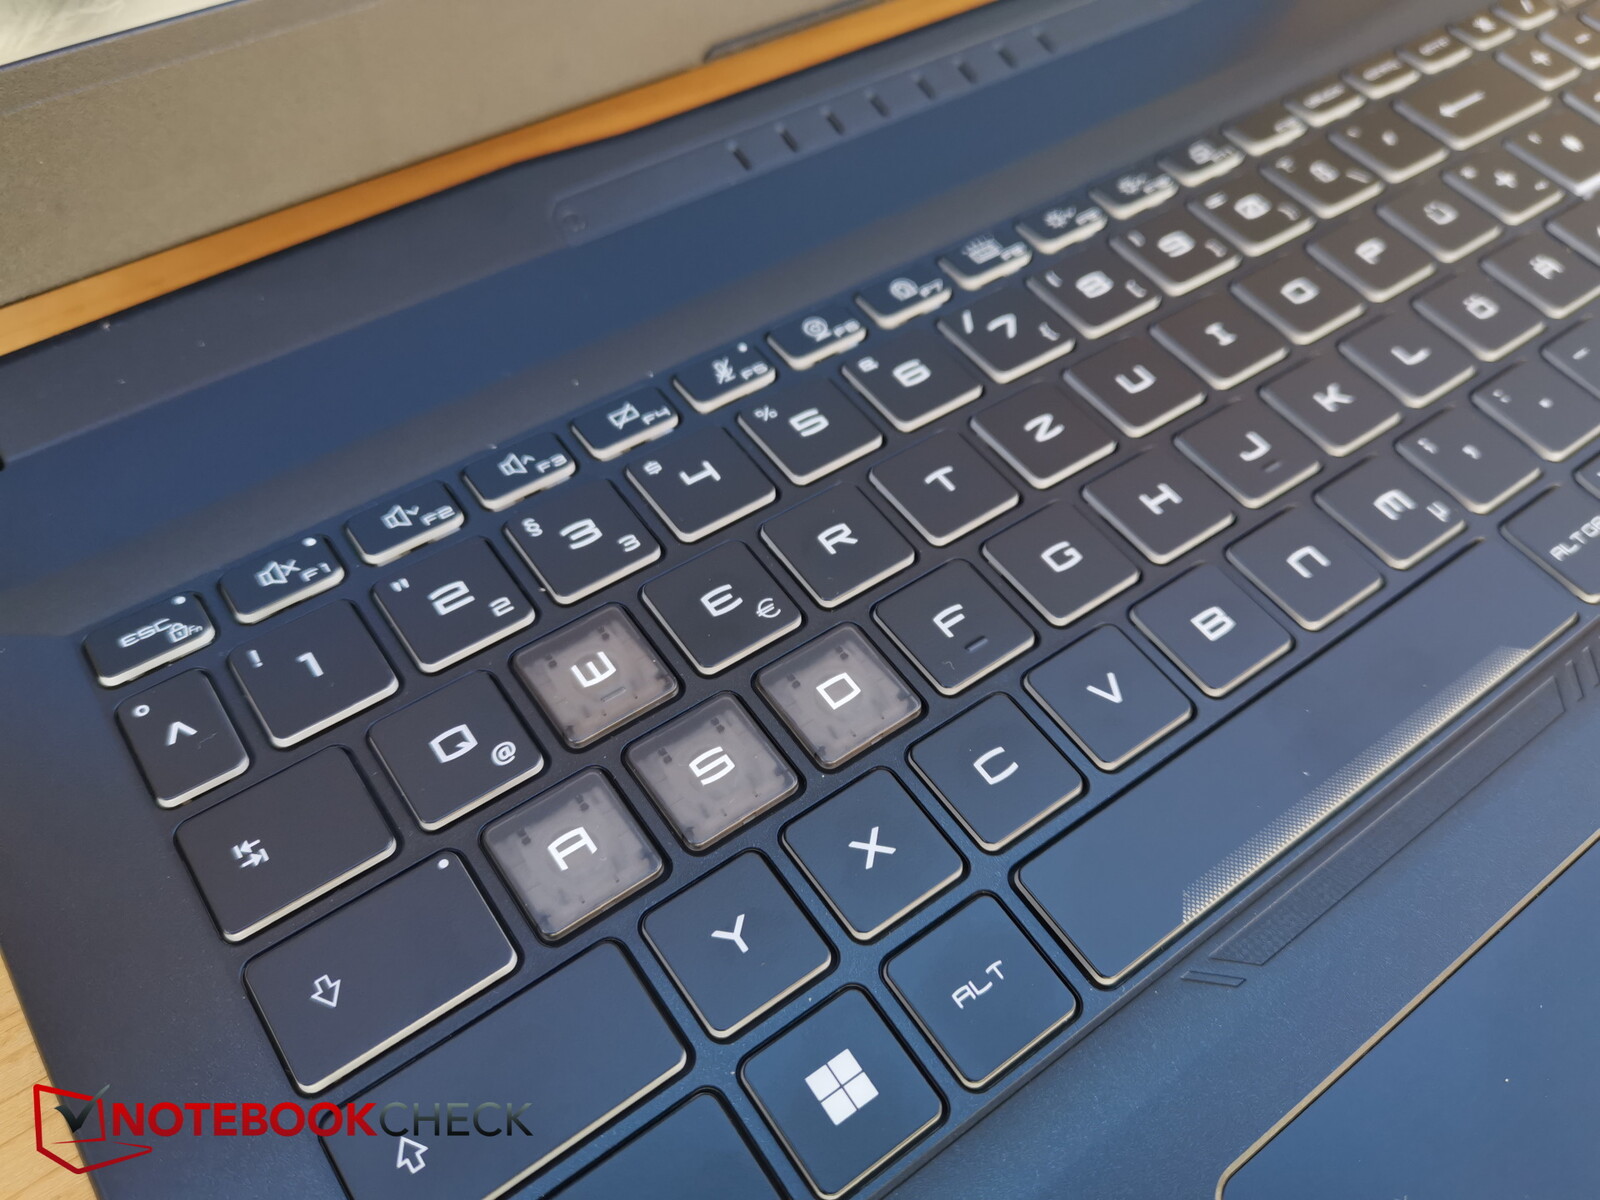
Piltangenterna däremellan är inte halverade i höjd, vilket ofta är fallet, utan är något mindre totalt sett i längd och höjd. WASD-tangenterna är genomskinliga och sticker därför ut i färgen. F- och specialtangenterna är också mycket små.
MSI har tyvärr flyttat fn-tangenten till höger om mellanslagstangenten igen, vilket kräver lite tillvänjning. Det är märkligt varför MSI fortsätter att gå sin egen väg. Vid behov kan man byta funktionerna på fn- och Windows-tangenterna, men då har man samma problem med Windows-tangenten, som ligger till höger i stället för fn-tangenten.
Tangenternas resväg är ganska kort, men återkopplingen är tydligt märkbar, så att det känns ganska snabbt att skriva. Tangentljudet är måttligt, och basen förblir stabil och böjer sig inte när man skriver.
Bakgrundsbelysningen på tangentbordet erbjuder fyra zoner, där varje zon har fyra nivåer av justerbar ljusstyrka.
Pekplatta
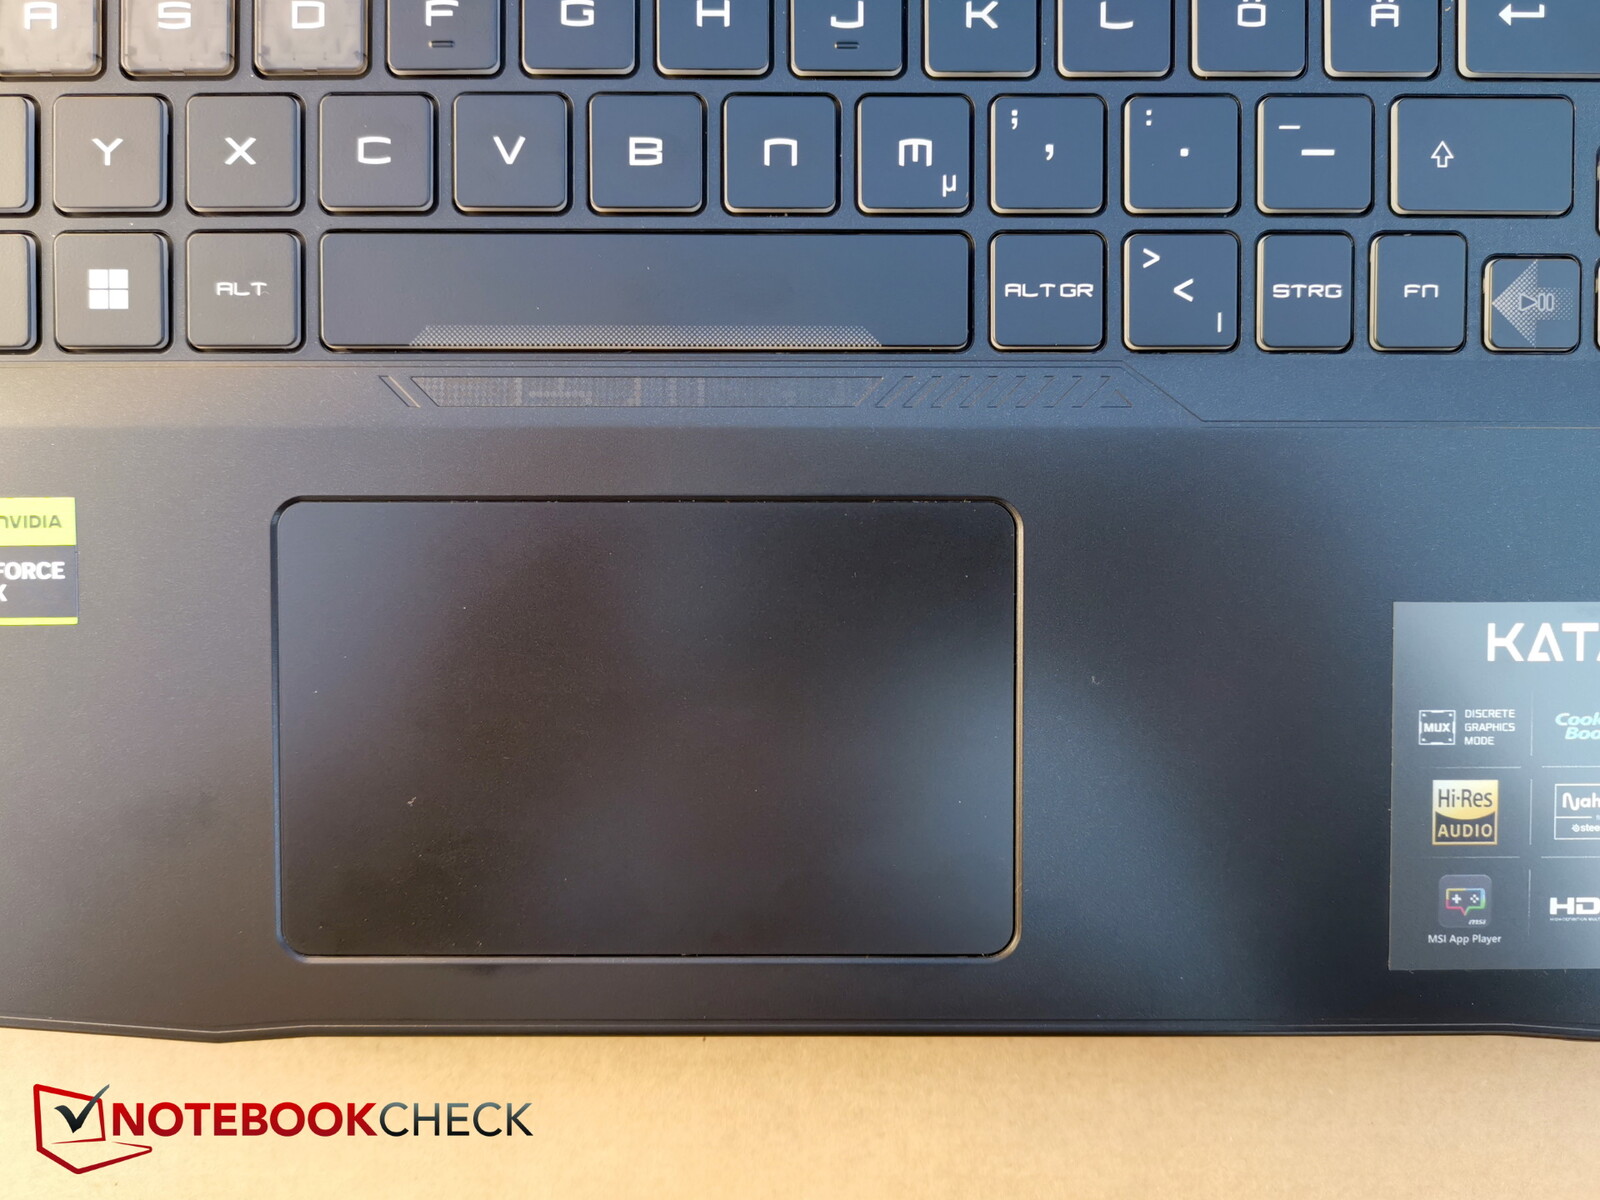
Katana 15 har vad som känns som en av de minsta pekplattorna på marknaden. Det ser lite retro ut. Visst, spelare ansluter oftast en mus ändå, men en större pekplatta är helt enkelt bekvämare att använda när man är på språng
Pekplattan ligger precis under mellanslagstangenten och därmed väldigt långt till vänster i layouten. En något mer central placering hade varit mer fördelaktig
Klickarna på de integrerade tangenterna är något högre och verkar inte alltför högkvalitativa, men de reagerar tillförlitligt och exakt.
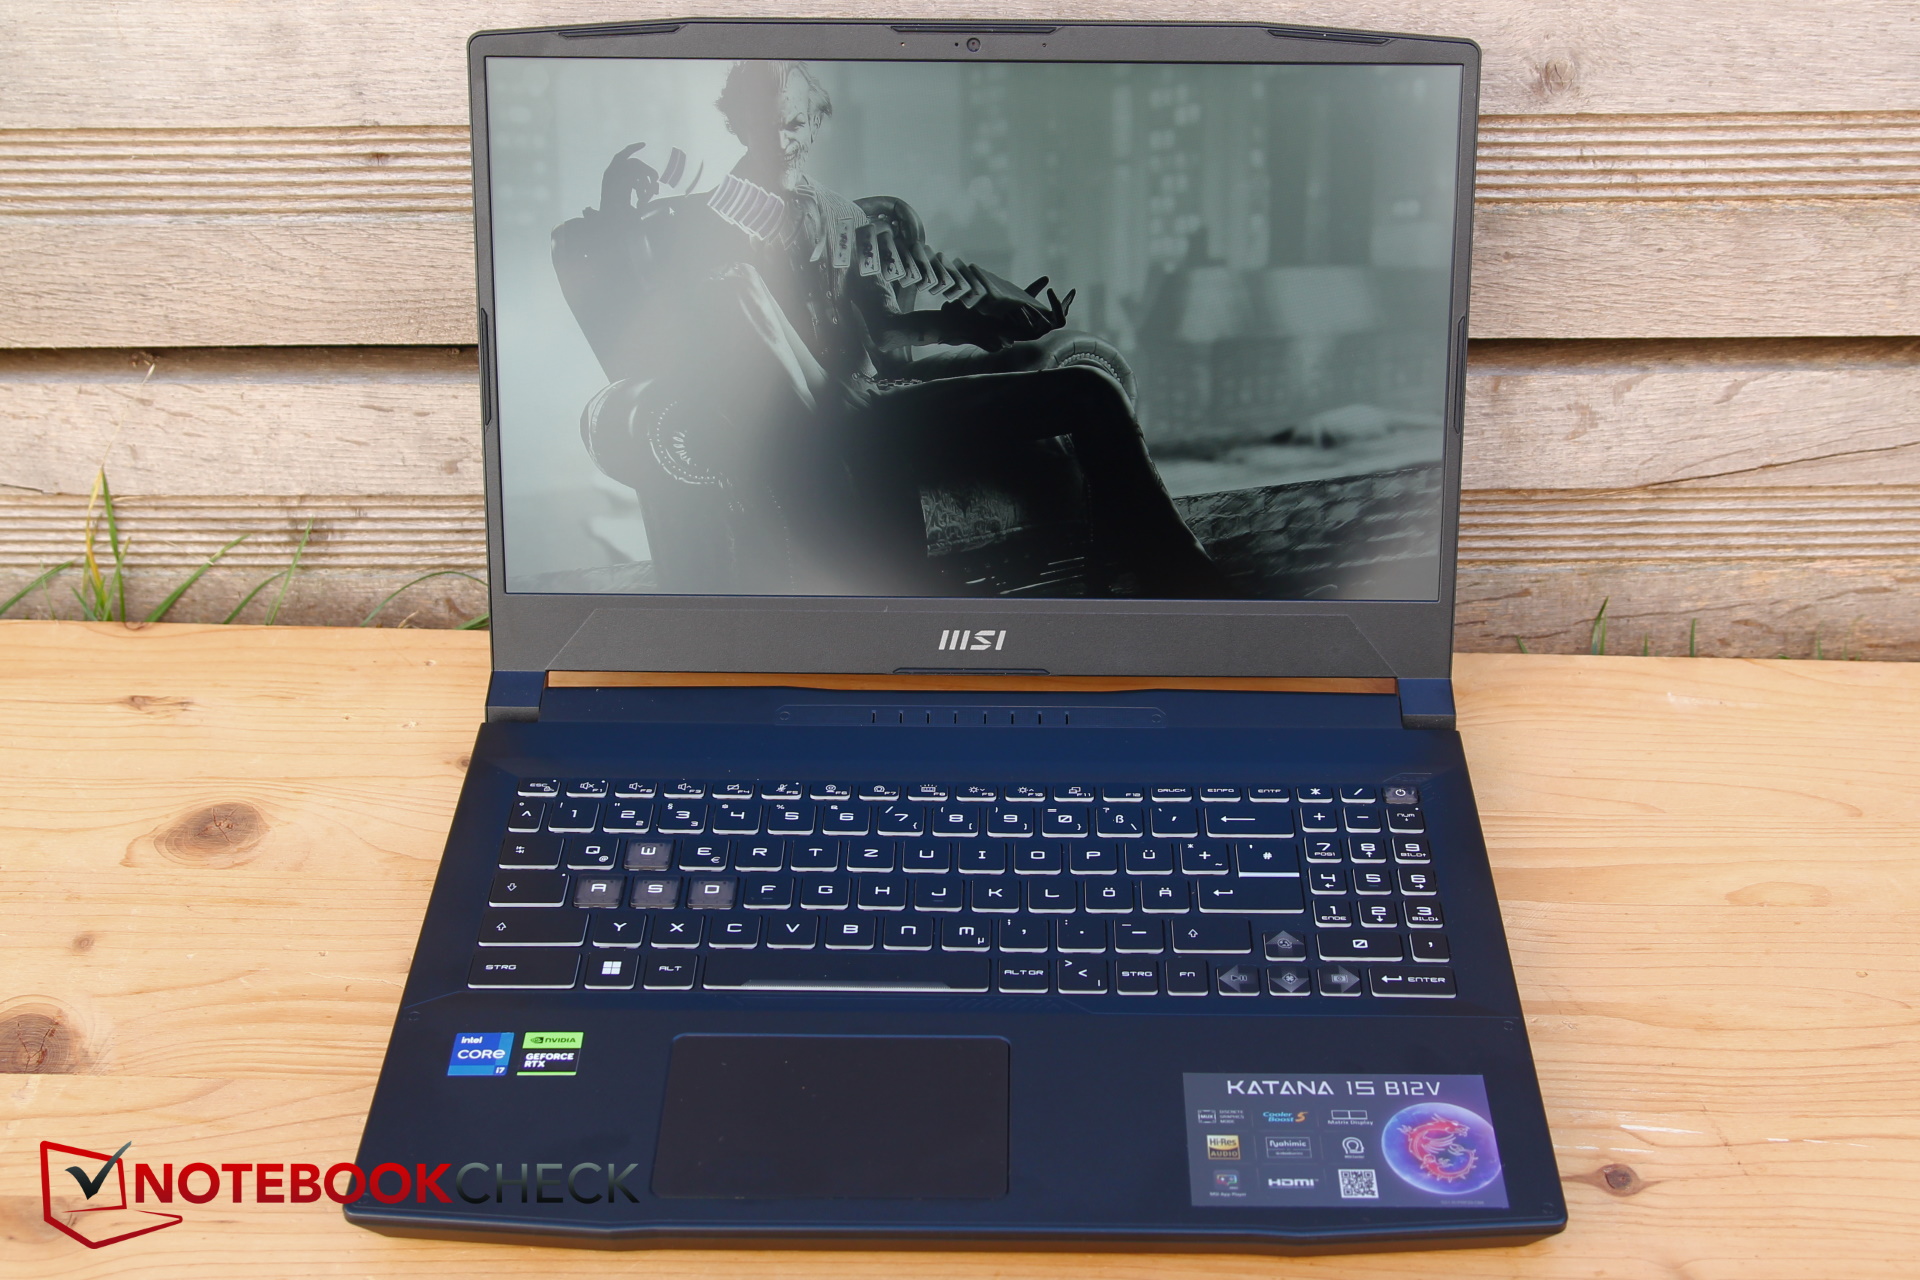
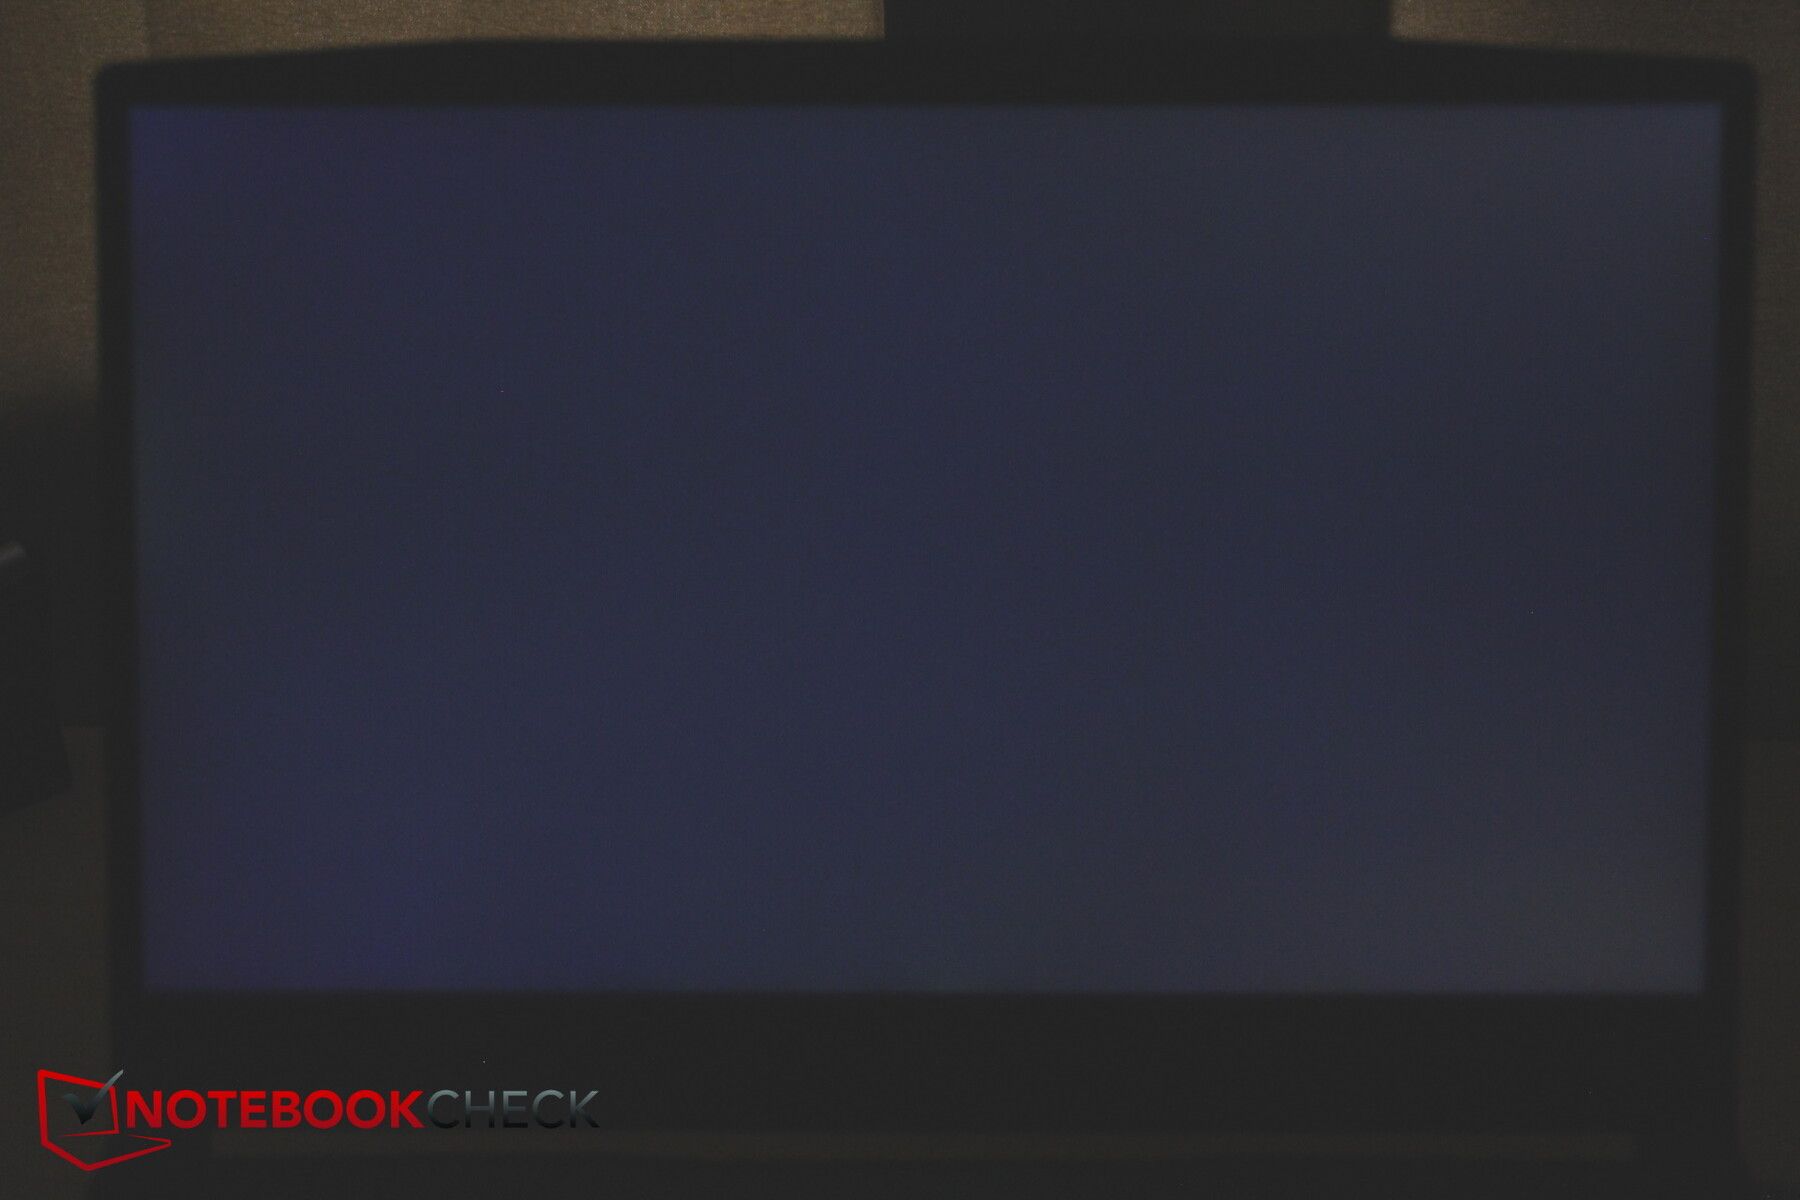
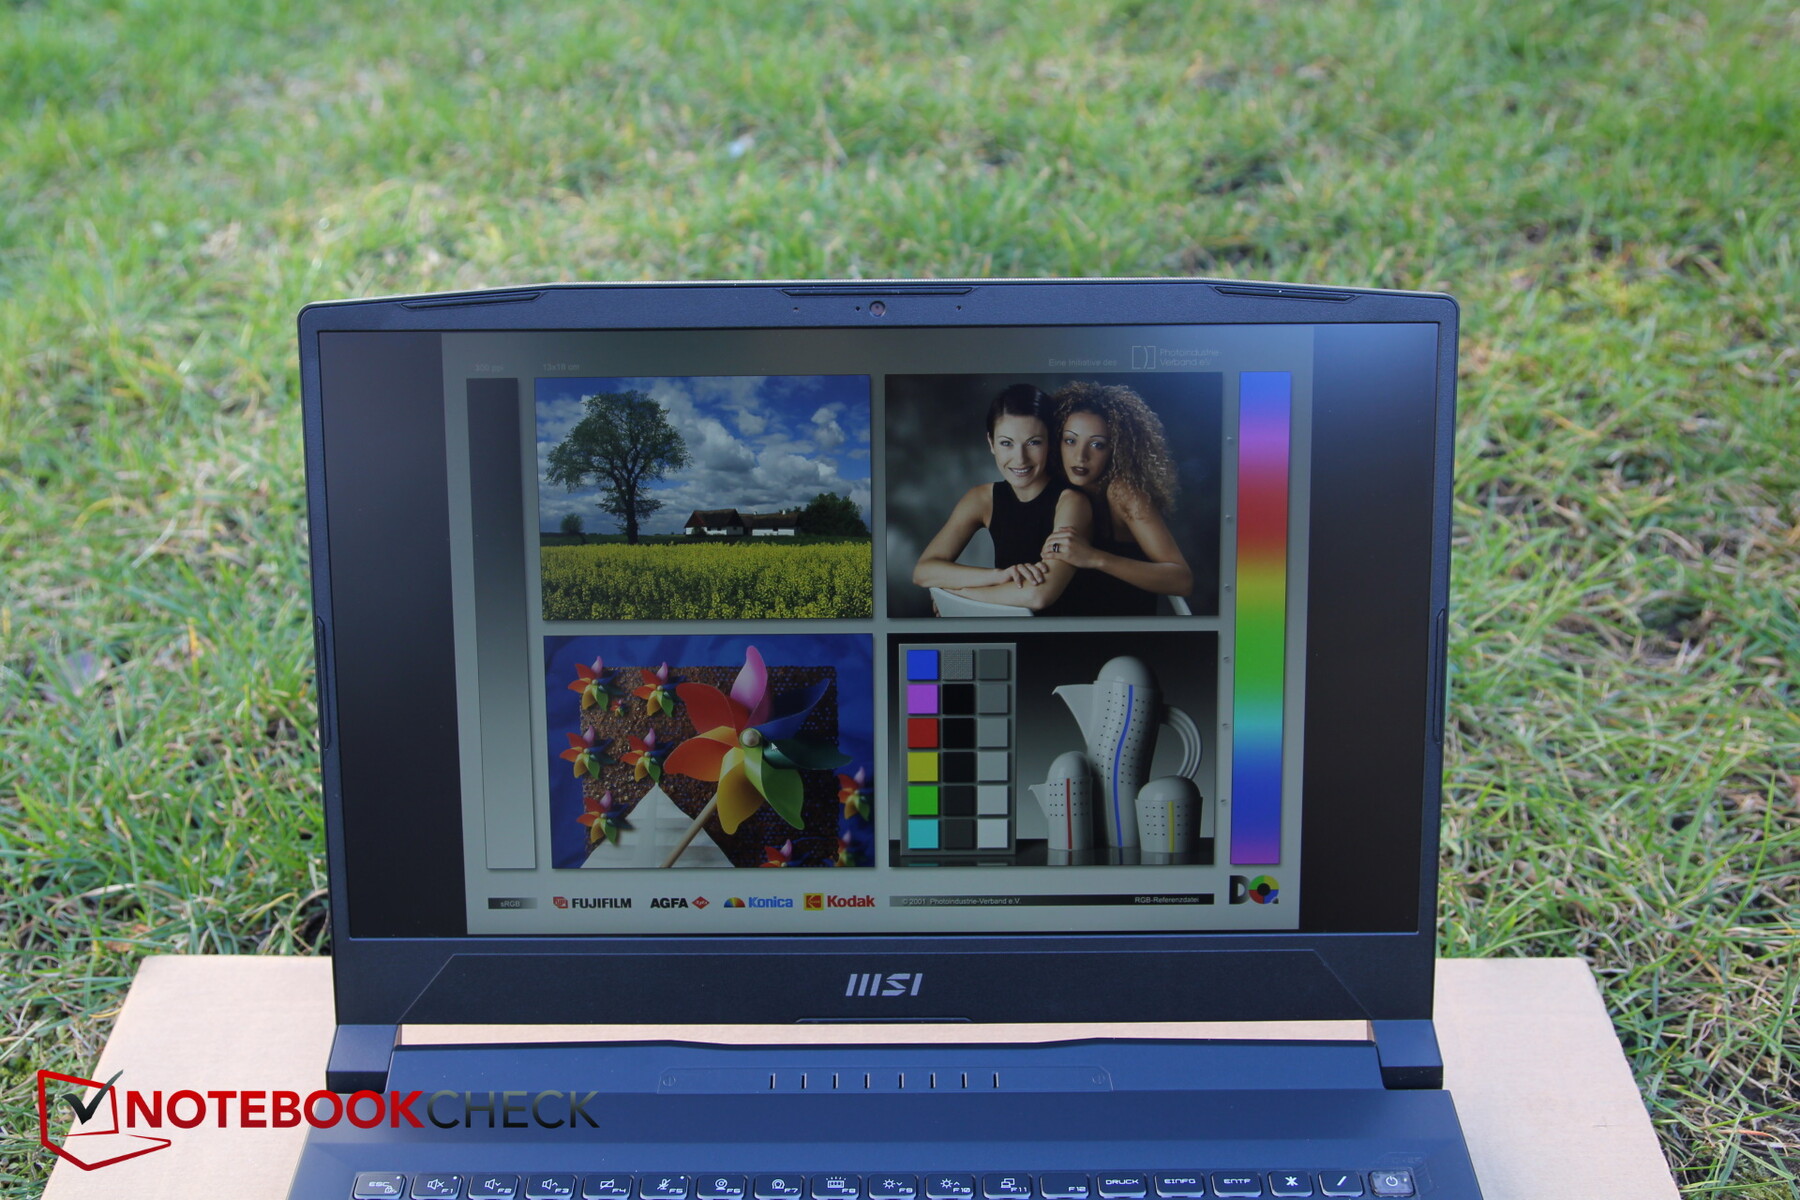
Skärm - 250 nits och 57 % sRGB är budgetvärden
MSI fortsätter att använda en Full HD-skärm för Katana, medan många konkurrenter redan använder QHD eller högre. Detta är inte nödvändigtvis ett problem, eftersom upplösningen och 144 Hz bör passa bra ihop med RTX 4050. Än så länge verkar det inte heller finnas några alternativa skärmalternativ för B13. I slutändan är det samma panel som i Katana GF66 och Pulse GL66.
Tyvärr är den genomsnittliga ljusstyrkan på 258 nits ganska under genomsnittet nuförtiden, eftersom de flesta konkurrerande bärbara datorer erbjuder ljusare skärmar. Belysningen på 92 procent är i alla fall ganska jämn, och ljusstyrkan minskar något nedåt till höger
Svarstiderna är ganska suboptimala till mediokra för en gamer. PWM är åtminstone inget problem i vår modell. Skärmblödningen är endast liten och märks inte i de flesta situationer.
| |||||||||||||||||||||||||
Distribution av ljusstyrkan: 92 %
Mitt på batteriet: 257 cd/m²
Kontrast: 1374:1 (Svärta: 0.19 cd/m²)
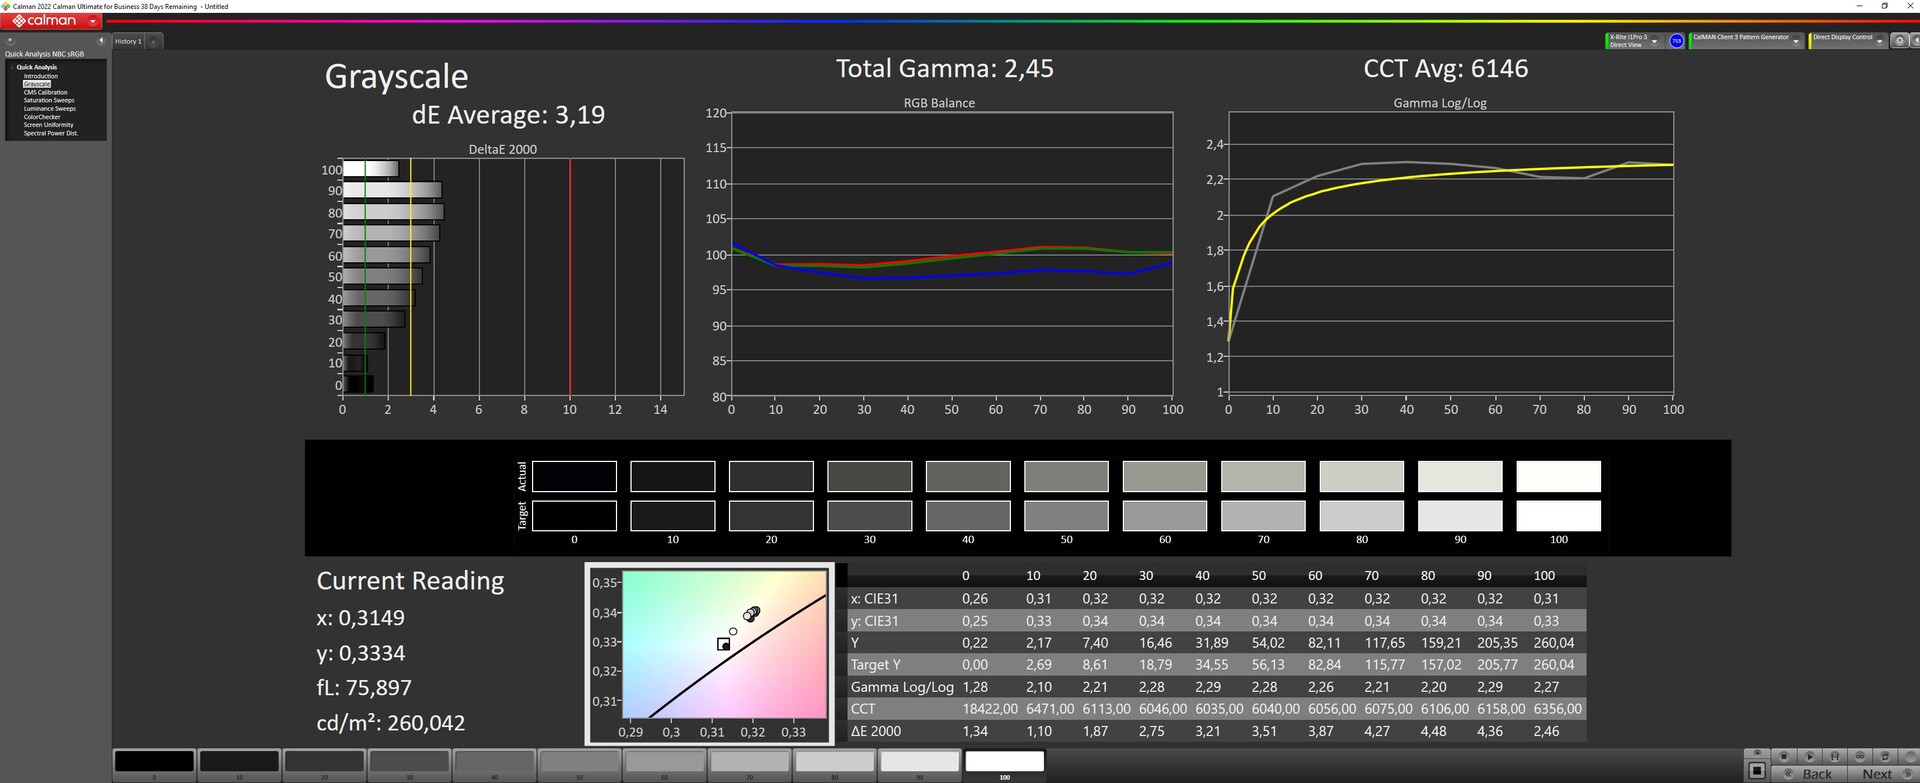
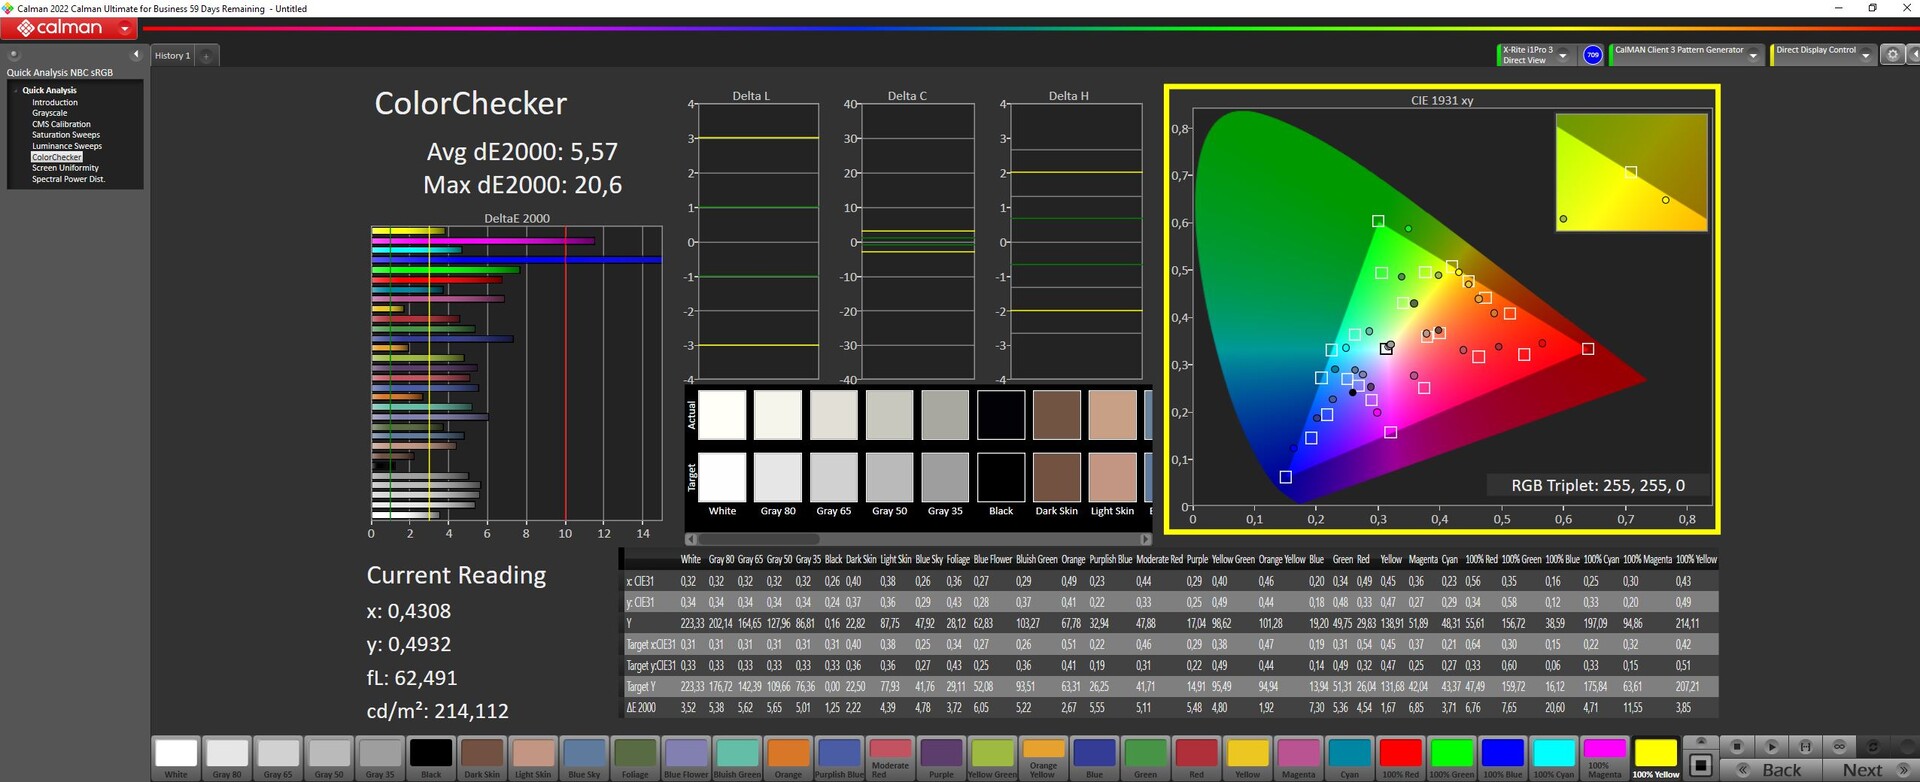
ΔE ColorChecker Calman: 5.57 | ∀{0.5-29.43 Ø4.71}
calibrated: 4.63
ΔE Greyscale Calman: 3.19 | ∀{0.09-98 Ø4.96}
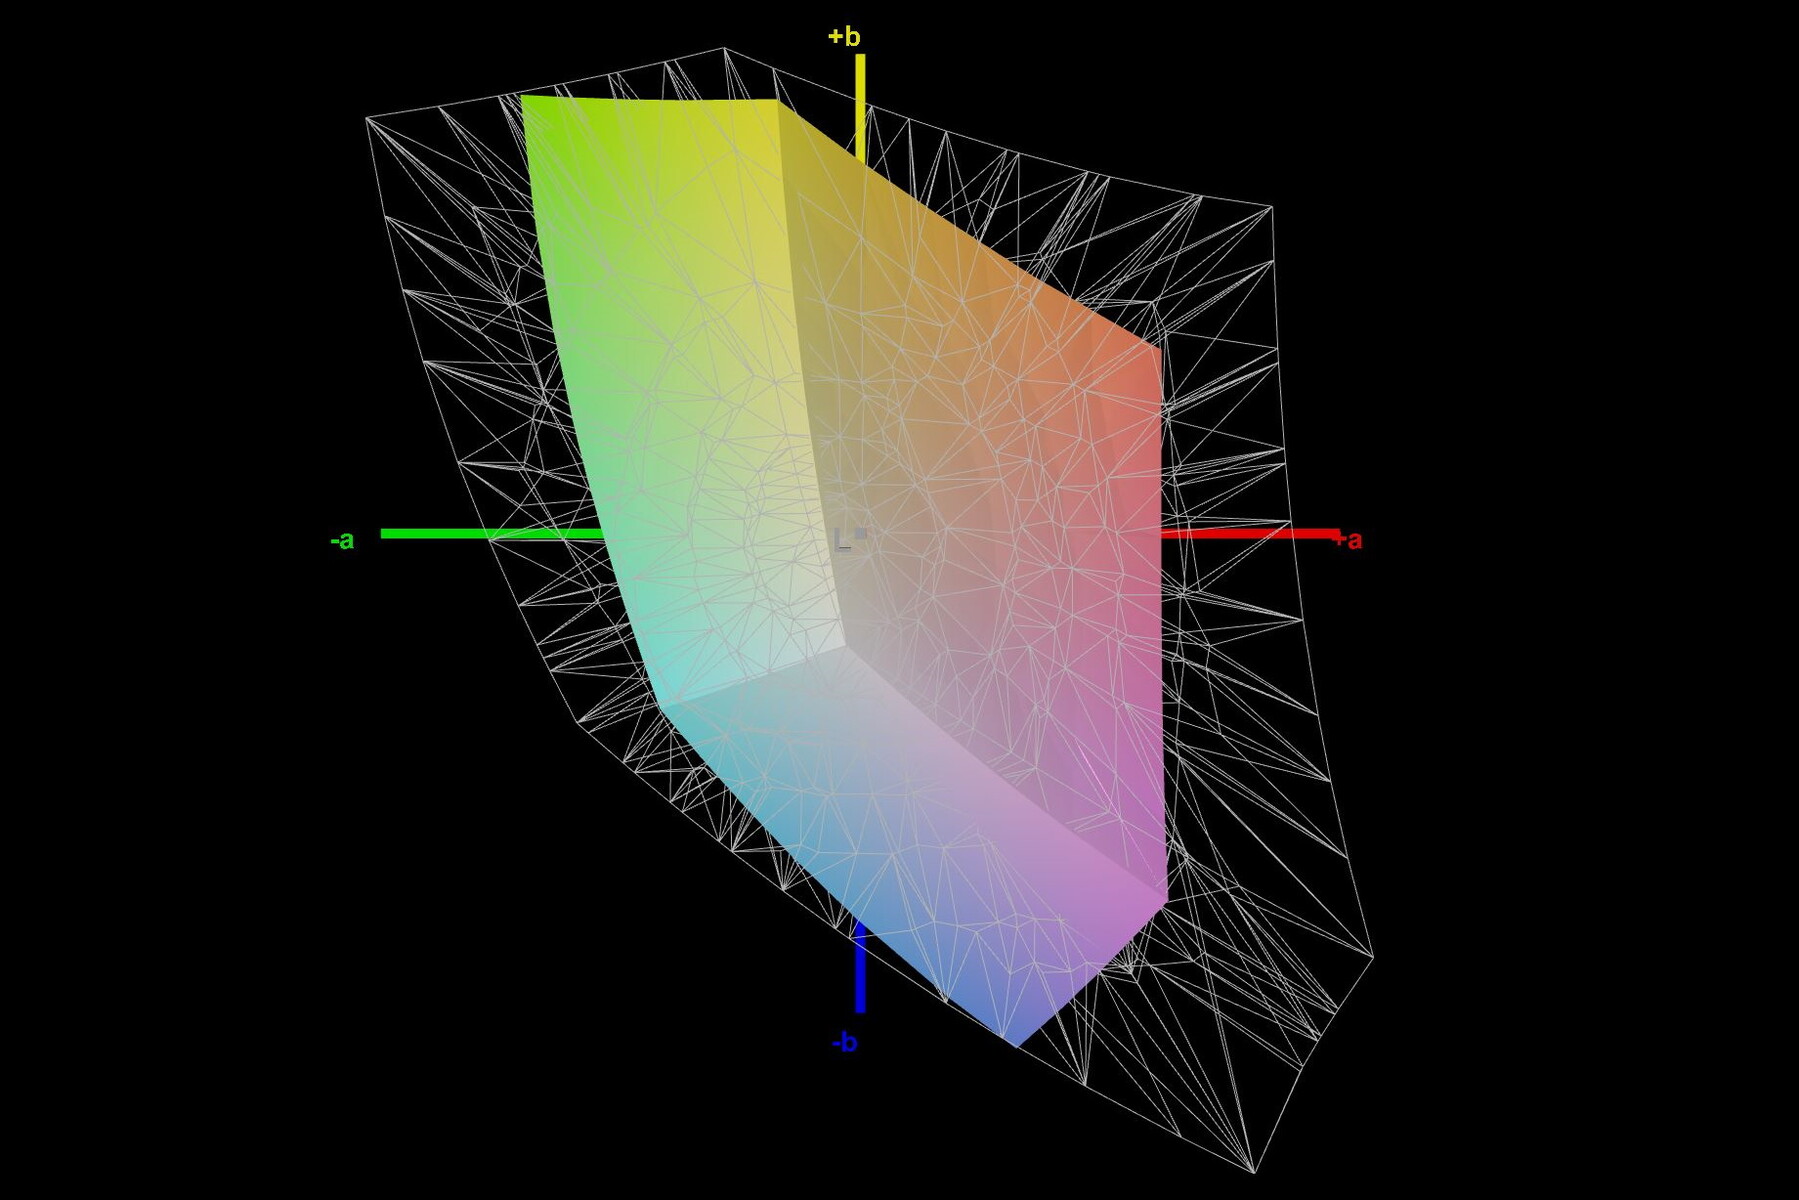
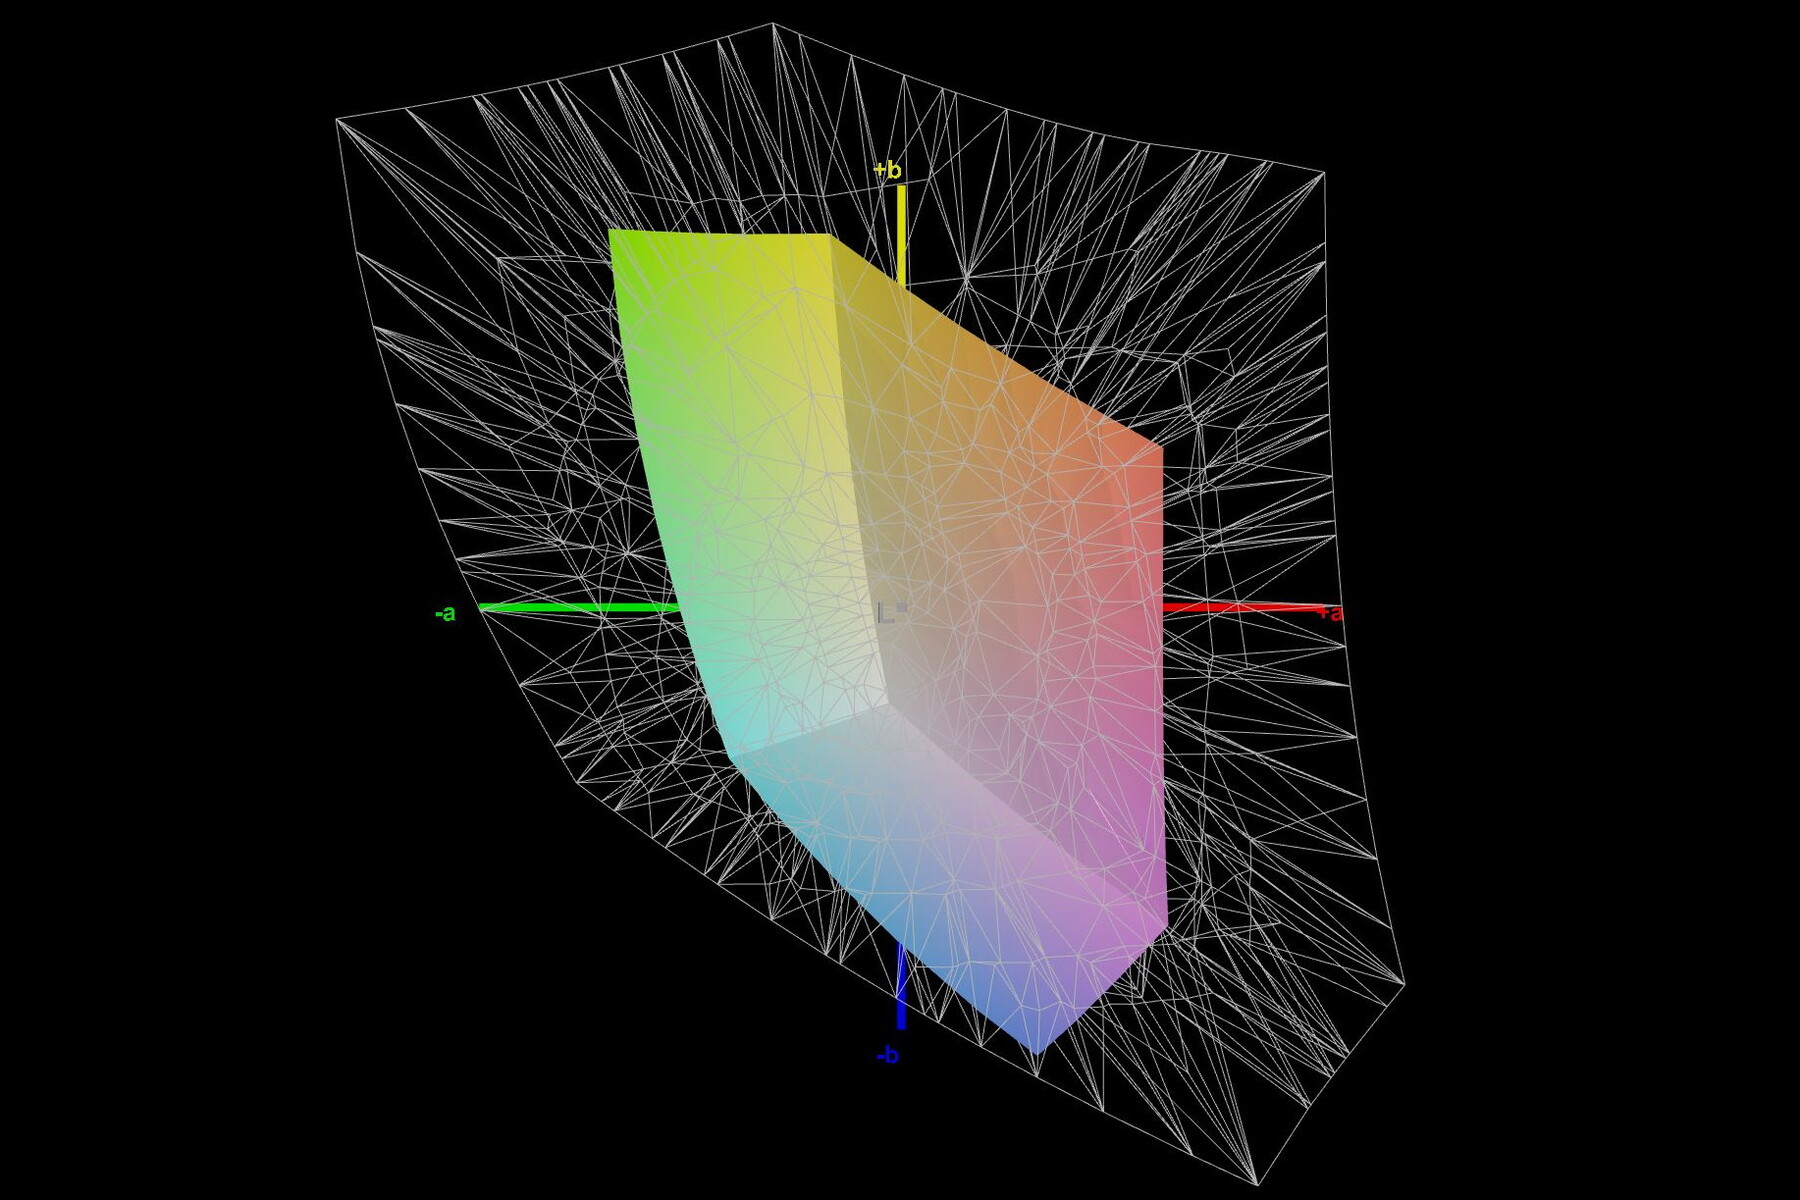
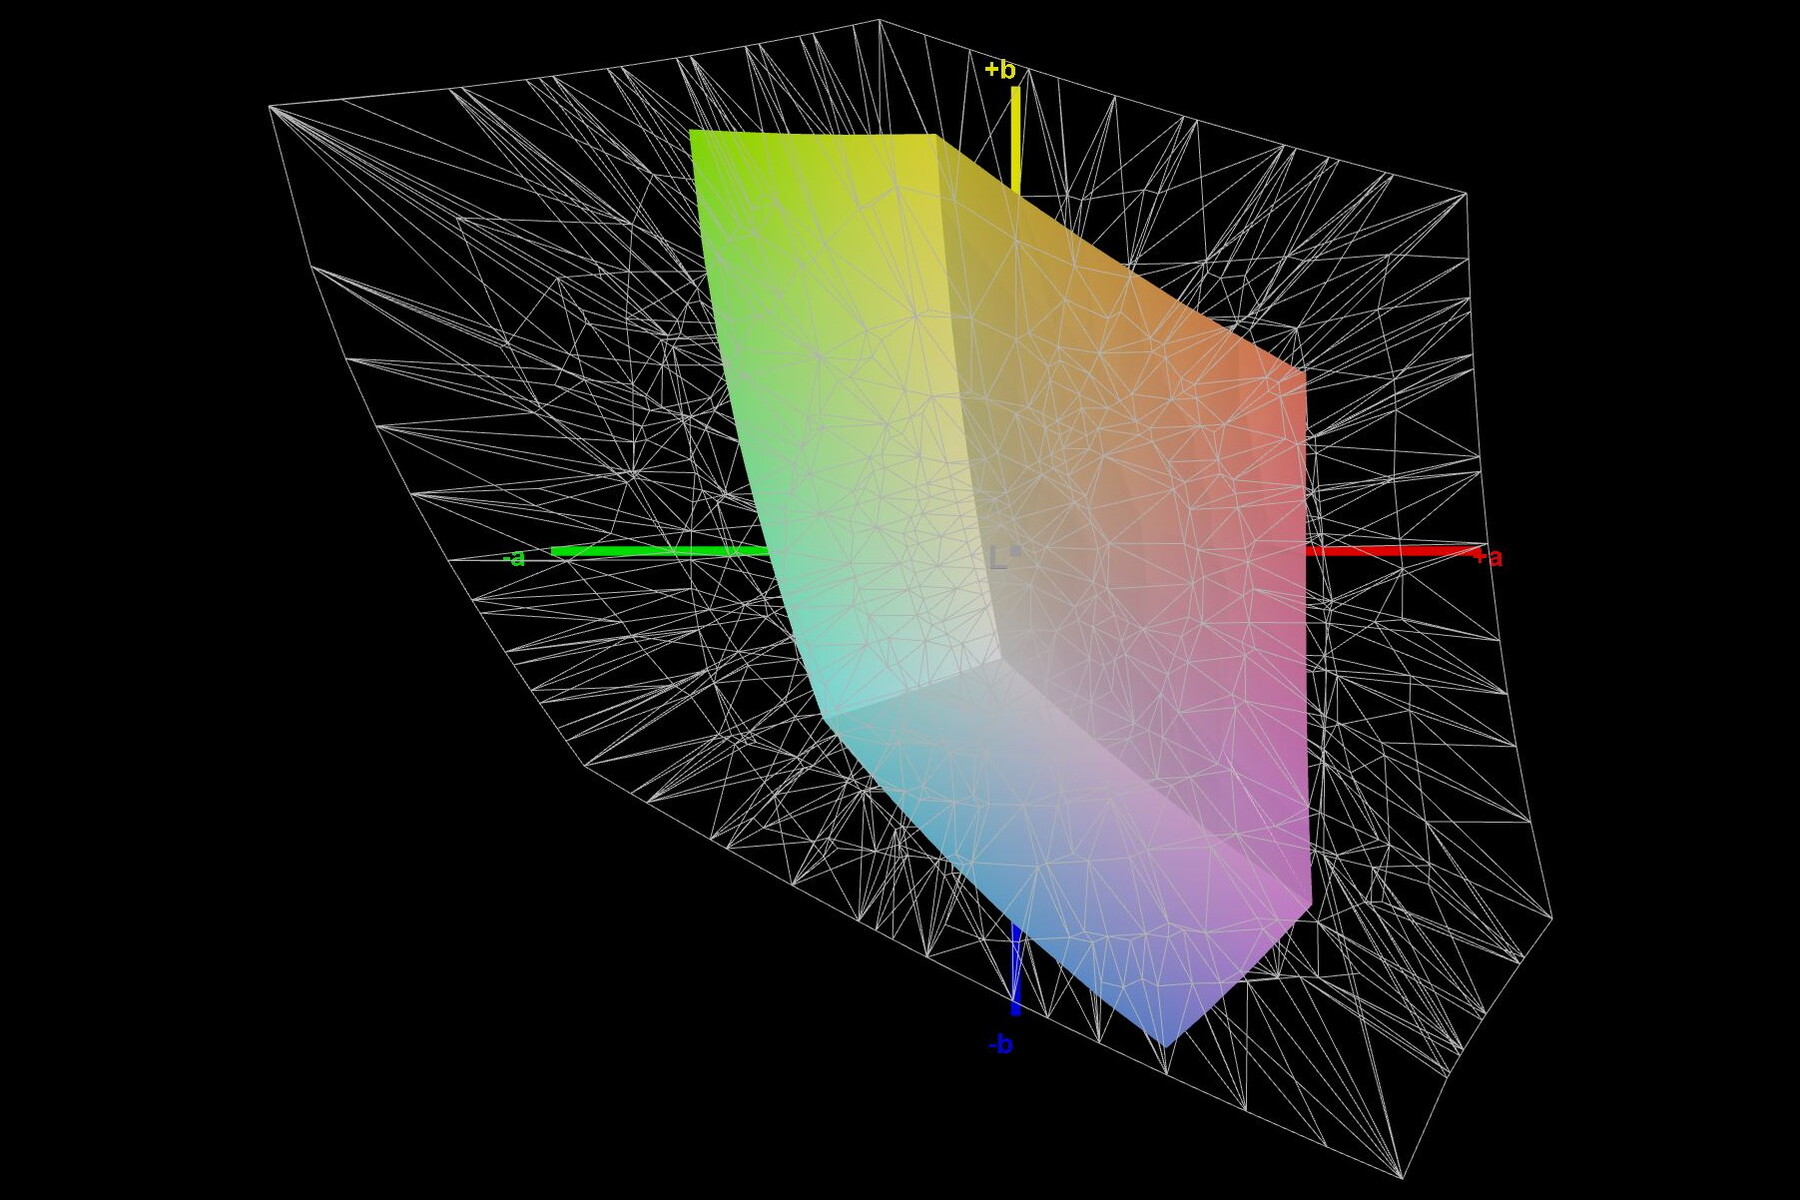
39.3% AdobeRGB 1998 (Argyll 3D)
56.8% sRGB (Argyll 3D)
38.1% Display P3 (Argyll 3D)
Gamma: 2.45
CCT: 6146 K
| MSI Katana 15 B12VEK AUOAF90 (B156HAN08.4), IPS, 1920x1080, 15.6" | MSI Katana GF66 12UGS AU Optronics AUOAF90, IPS, 1920x1080, 15.6" | MSI Pulse GL66 12UEK AU Optronics B156HAN08.4 (AUOAF90), IPS, 1920x1080, 15.6" | Lenovo Legion 5 15IAH7H 82RB CSOT MNF601CA1-3, IPS, 1920x1080, 15.6" | Asus TUF Gaming F15 FX507ZM TL156VDXP0101, IPS, 1920x1080, 15.6" | Schenker XMG Core 15 (M22) CSOT MNF601CA1-1, IPS, 2560x1440, 15.6" | |
|---|---|---|---|---|---|---|
| Display | 3% | 3% | 78% | 73% | 78% | |
| Display P3 Coverage (%) | 38.1 | 39.1 3% | 39 2% | 69.1 81% | 66.4 74% | 68.8 81% |
| sRGB Coverage (%) | 56.8 | 58.3 3% | 58.4 3% | 99.5 75% | 97 71% | 99.3 75% |
| AdobeRGB 1998 Coverage (%) | 39.3 | 40.4 3% | 40.3 3% | 70 78% | 68.5 74% | 69.9 78% |
| Response Times | -5% | -2% | 59% | 69% | 66% | |
| Response Time Grey 50% / Grey 80% * (ms) | 38.8 ? | 40 ? -3% | 38.8 ? -0% | 14.8 ? 62% | 5.6 ? 86% | 16 ? 59% |
| Response Time Black / White * (ms) | 26.8 ? | 28.4 ? -6% | 28 ? -4% | 12 ? 55% | 12.8 ? 52% | 7.6 ? 72% |
| PWM Frequency (Hz) | ||||||
| Screen | 1% | 29% | 1% | 26% | 15% | |
| Brightness middle (cd/m²) | 261 | 227 -13% | 248 -5% | 363.5 39% | 353.7 36% | 378 45% |
| Brightness (cd/m²) | 258 | 225 -13% | 245 -5% | 350 36% | 340 32% | 371 44% |
| Brightness Distribution (%) | 92 | 90 -2% | 86 -7% | 89 -3% | 89 -3% | 93 1% |
| Black Level * (cd/m²) | 0.19 | 0.21 -11% | 0.13 32% | 0.39 -105% | 0.34 -79% | 0.33 -74% |
| Contrast (:1) | 1374 | 1081 -21% | 1908 39% | 932 -32% | 1040 -24% | 1145 -17% |
| Colorchecker dE 2000 * | 5.57 | 4.19 25% | 3.14 44% | 3.68 34% | 1.74 69% | 2.84 49% |
| Colorchecker dE 2000 max. * | 20.6 | 17.45 15% | 5.82 72% | 8.92 57% | 3.63 82% | 5.51 73% |
| Colorchecker dE 2000 calibrated * | 4.63 | 3.81 18% | 3.14 32% | 0.53 89% | 0.5 89% | 2.75 41% |
| Greyscale dE 2000 * | 3.19 | 2.7 15% | 1.2 62% | 6.5 -104% | 2.1 34% | 4.08 -28% |
| Gamma | 2.45 90% | 2.208 100% | 2.49 88% | 2.2 100% | 2.3 96% | 2.4 92% |
| CCT | 6146 106% | 6176 105% | 6468 100% | 5995 108% | 6257 104% | 5841 111% |
| Totalt genomsnitt (program/inställningar) | -0% /
1% | 10% /
19% | 46% /
26% | 56% /
42% | 53% /
36% |
* ... mindre är bättre
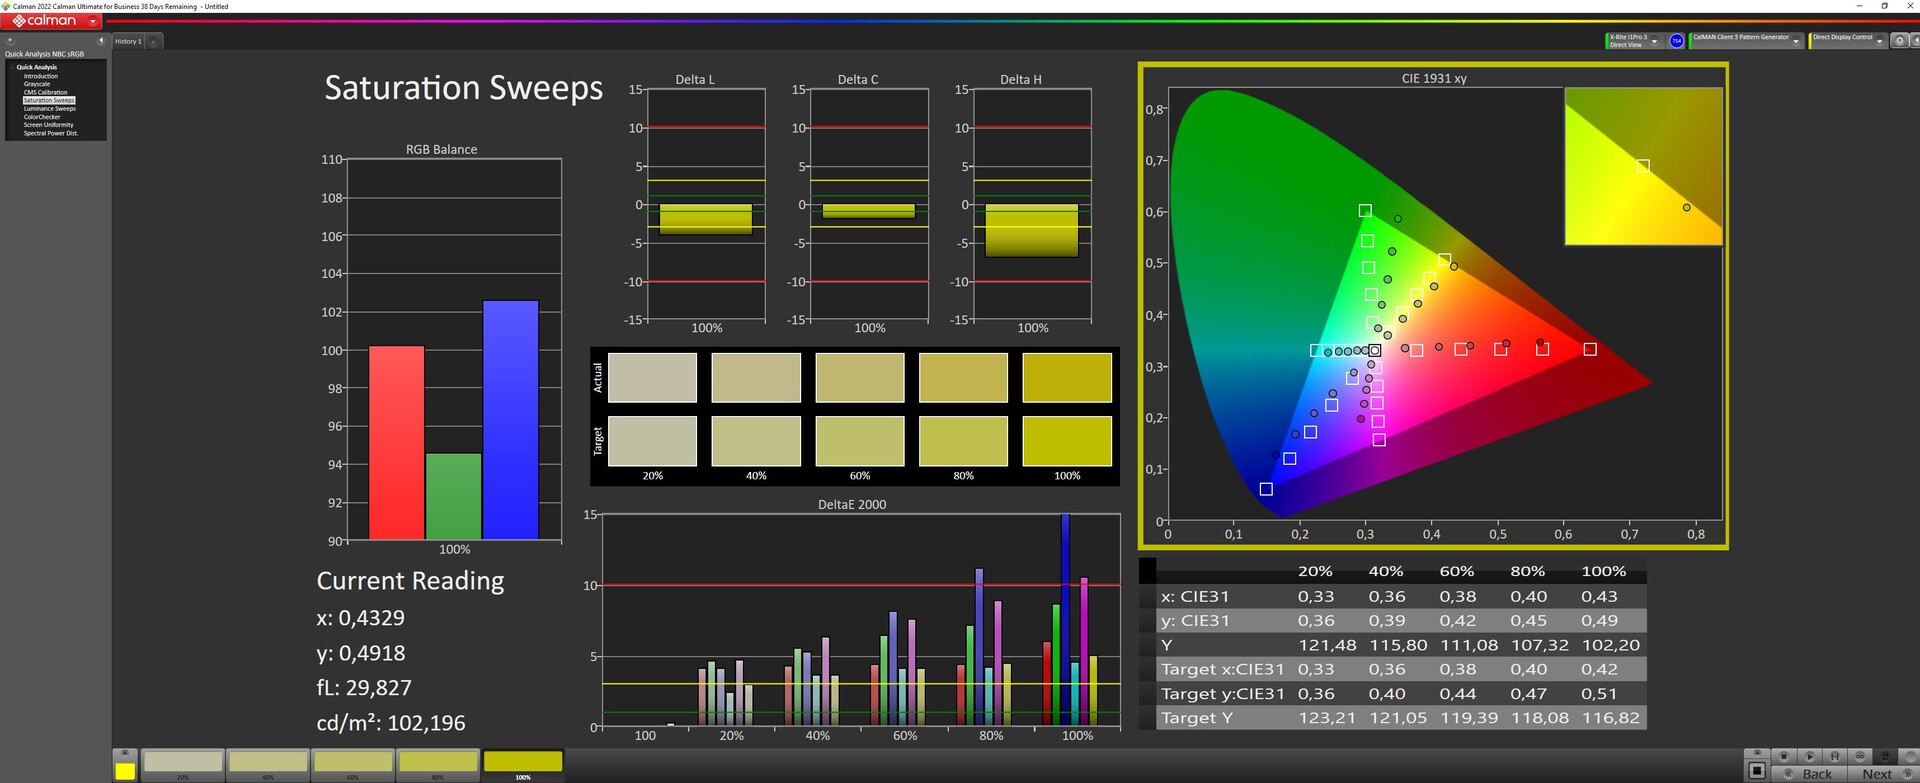
Tillverkaren ger ingen information om färgområdestäckningen. Vi uppmätte knappt 57 procent i sRGB och cirka 39 procent i AdobeRGB och DisplayP3. Även här är Katana 15:s budgetkaraktär tydlig; konkurrenterna erbjuder högre färgrymdstäckning.
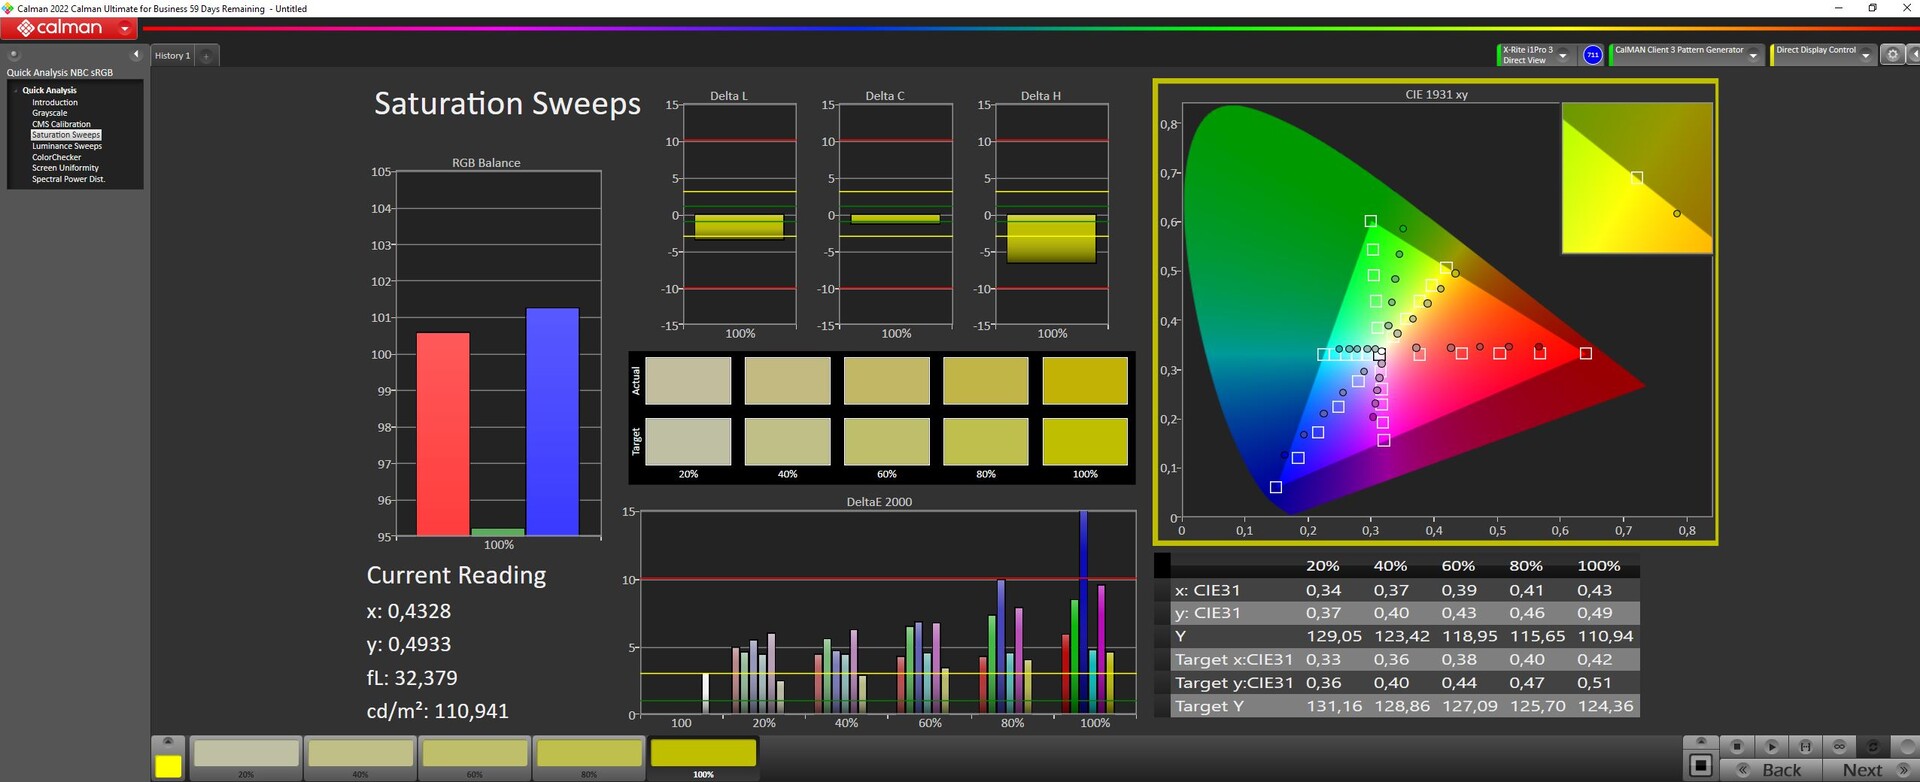
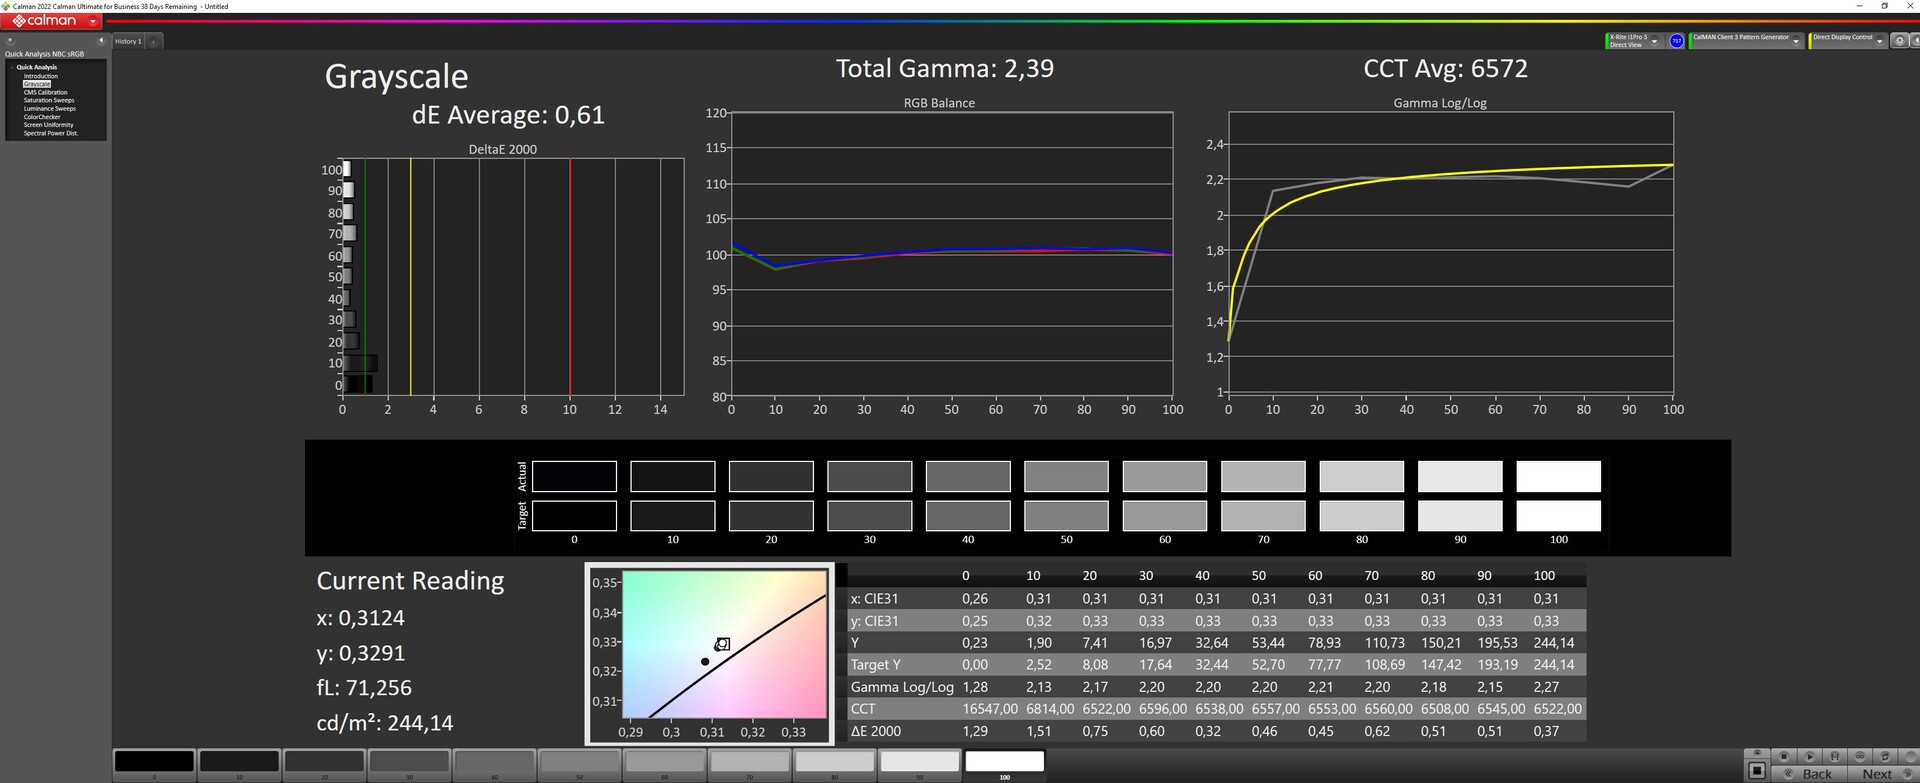
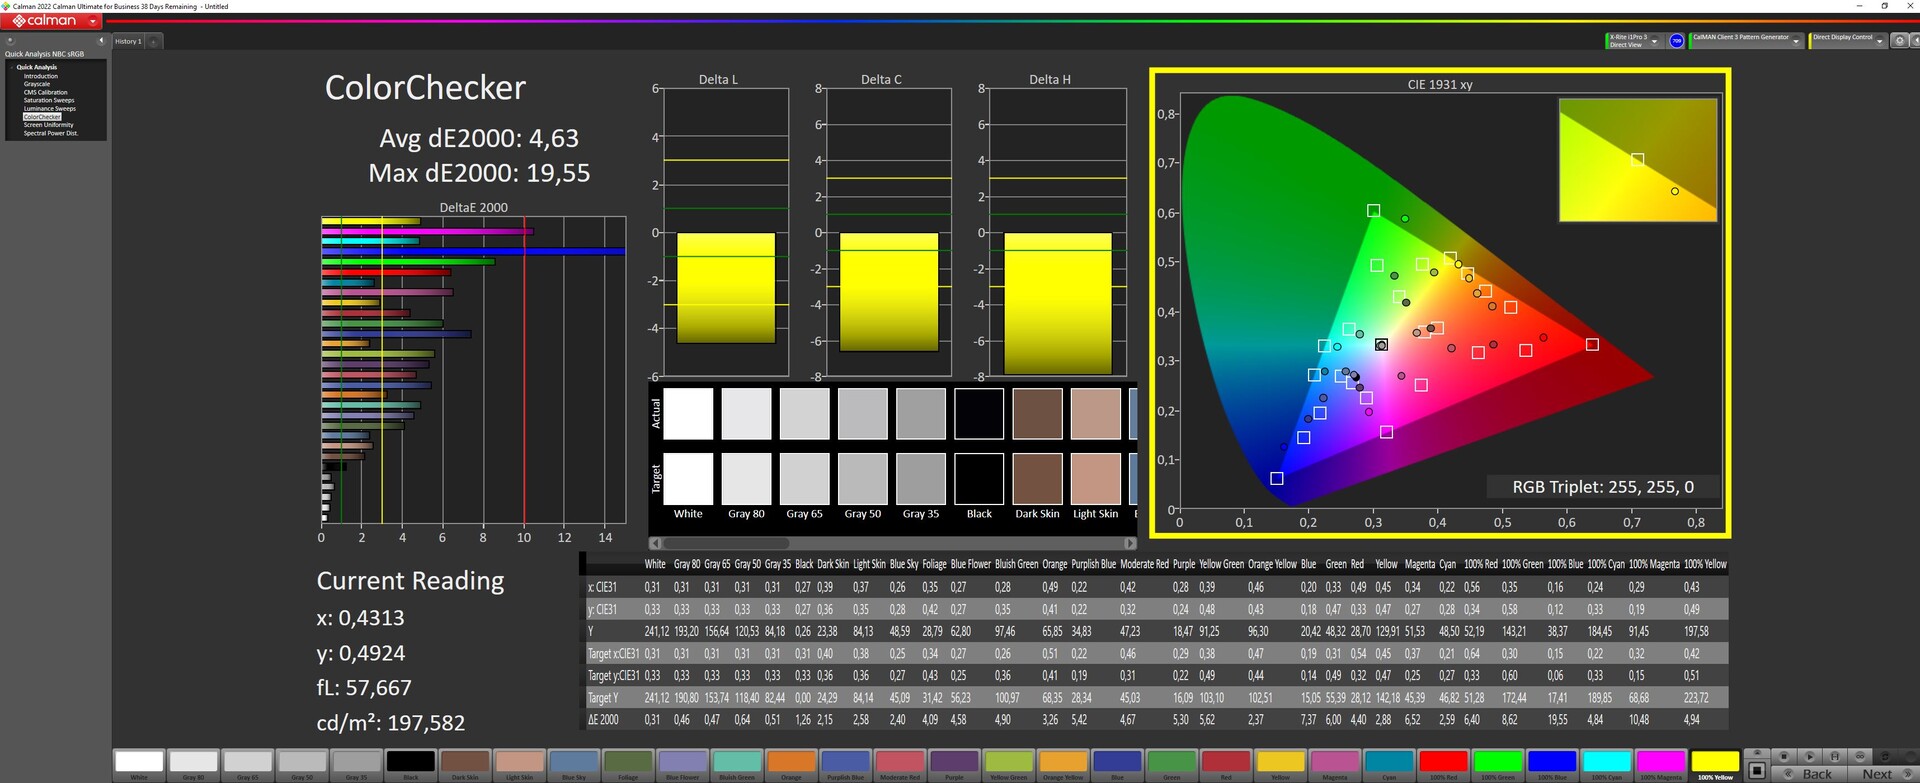
Skärmen är inte så bra justerad från fabrik. Vi mäter endast mot sRGB-standarden här. En minskning av ljusstyrkan sänker DeltaE-värdet för grånivåerna endast något, men det ligger fortfarande strax under 3. Calman ColorChecker visar dock på stora färgavvikelser.
Manuell kalibrering minimerar gråskalans avvikelser till drygt 0,61, men ColorCheckers DeltaE-värde på 4,63 är fortfarande alldeles för högt. Skärmen verkar inte kunna klara av mer. Vår kalibrerade icc-färgprofil kan laddas ner ovan.
Visa svarstider
| ↔ Svarstid svart till vitt | ||
|---|---|---|
| 26.8 ms ... stiga ↗ och falla ↘ kombinerat | ↗ 14.2 ms stiga | 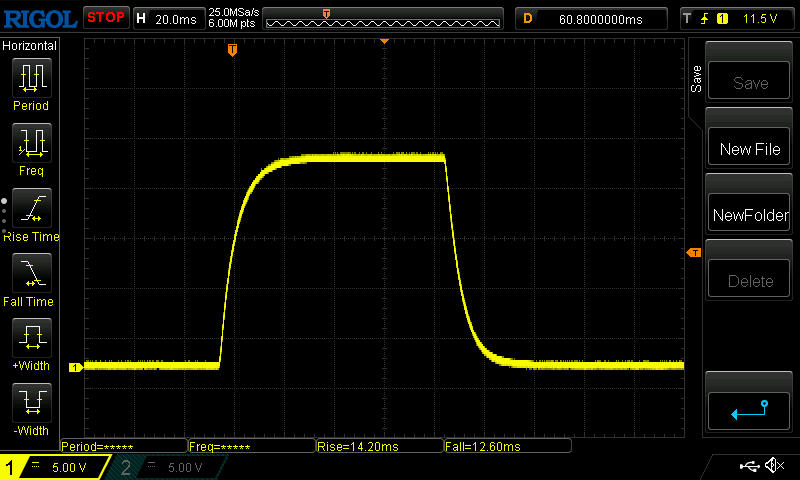 |
| ↘ 12.6 ms hösten | ||
| Skärmen visar relativt långsamma svarsfrekvenser i våra tester och kan vara för långsam för spelare. I jämförelse sträcker sig alla testade enheter från 0.1 (minst) till 240 (maximalt) ms. » 67 % av alla enheter är bättre. Detta innebär att den uppmätta svarstiden är sämre än genomsnittet av alla testade enheter (19.8 ms). | ||
| ↔ Svarstid 50 % grått till 80 % grått | ||
| 38.8 ms ... stiga ↗ och falla ↘ kombinerat | ↗ 18.6 ms stiga | 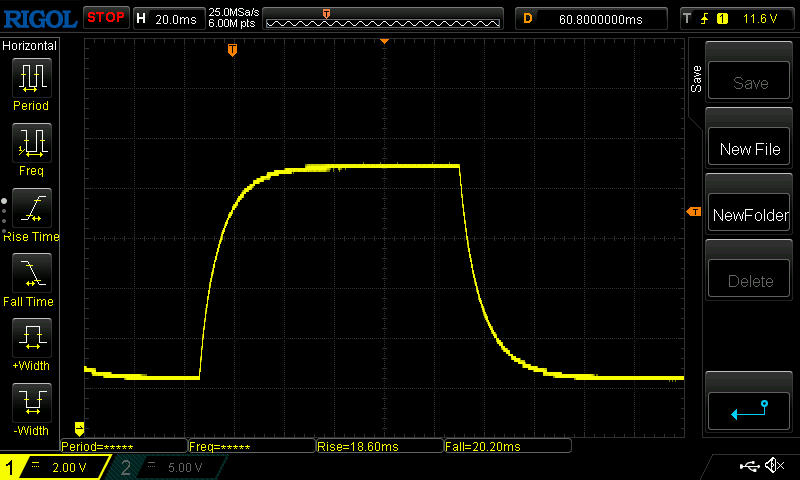 |
| ↘ 20.2 ms hösten | ||
| Skärmen visar långsamma svarsfrekvenser i våra tester och kommer att vara otillfredsställande för spelare. I jämförelse sträcker sig alla testade enheter från 0.165 (minst) till 636 (maximalt) ms. » 58 % av alla enheter är bättre. Detta innebär att den uppmätta svarstiden är sämre än genomsnittet av alla testade enheter (31 ms). | ||
Skärmflimmer / PWM (Puls-Width Modulation)
| Skärmflimmer / PWM upptäcktes inte | 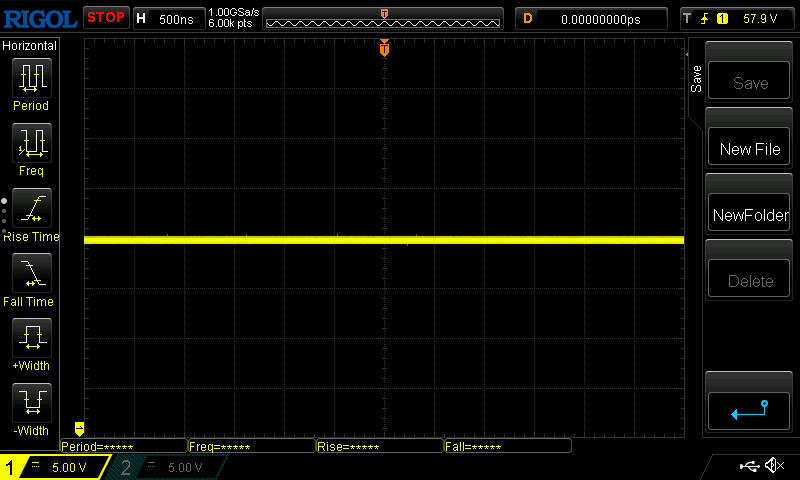 | ||
Som jämförelse: 52 % av alla testade enheter använder inte PWM för att dämpa skärmen. Om PWM upptäcktes mättes ett medelvärde av 7757 (minst: 5 - maximum: 343500) Hz. | |||
Den matta ytan filtrerar bort aggressiva reflektioner utomhus. Panelens svaga ljusstyrka kräver dock definitivt en plats i skuggan.
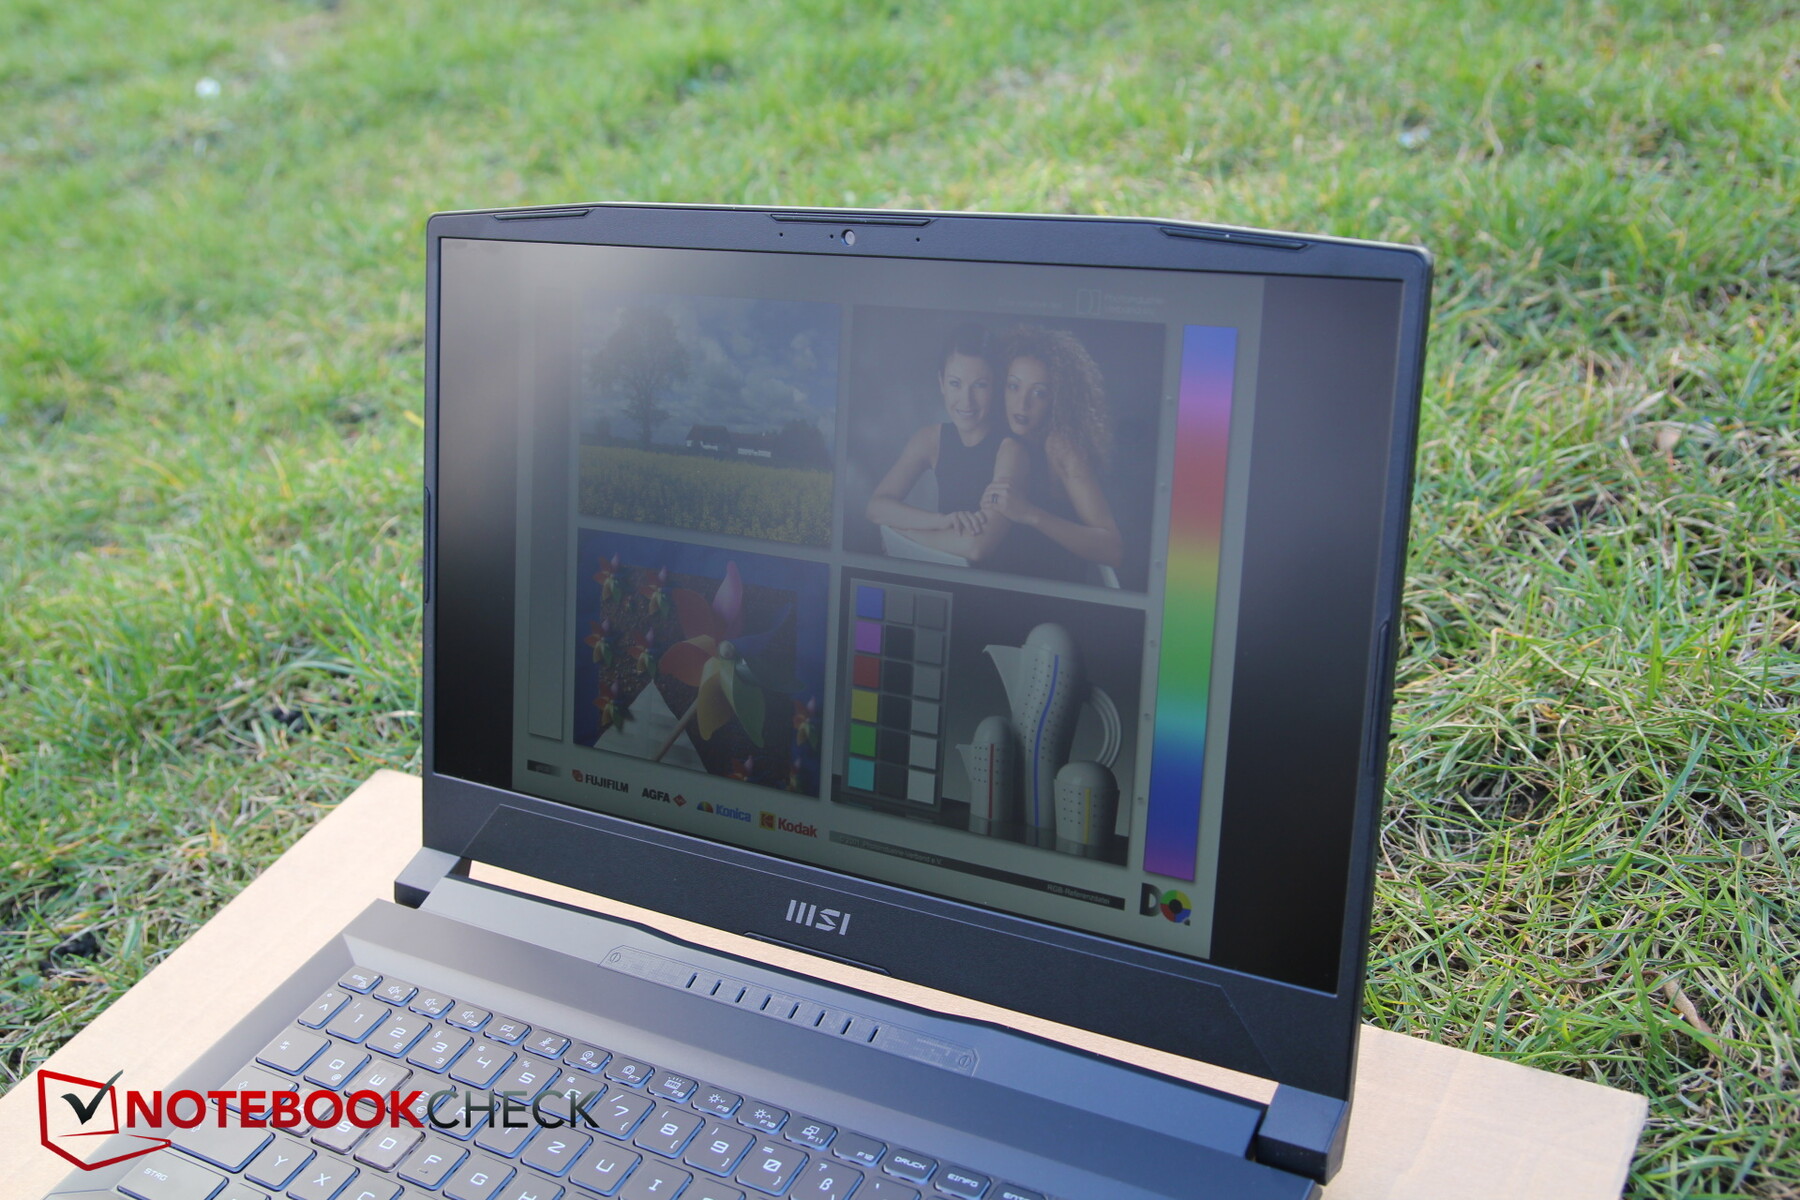
Stabiliteten i betraktningsvinkeln är okej. En minskning av ljusstyrkan är endast synlig vid extrema betraktningsvinklar.

Prestanda - Katana 15 på samma nivå som RTX 3060
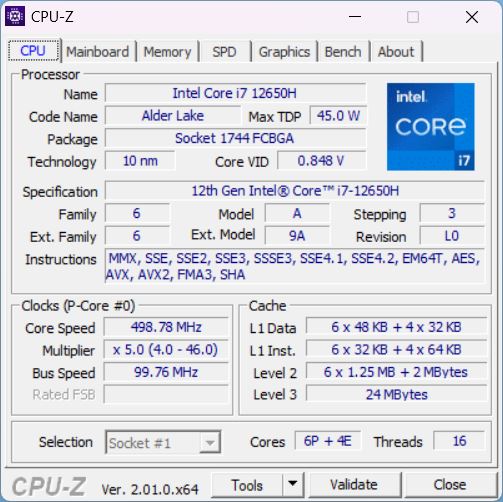
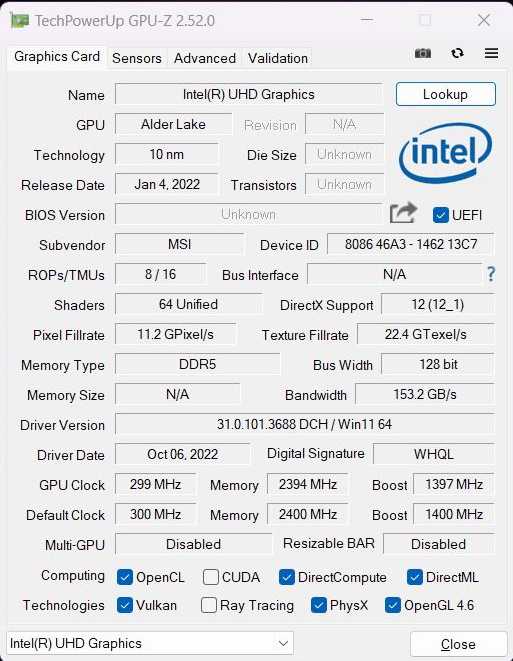
MSI Katana 15 marknadsförs som en bärbar dator för spel, och även om dessCore i7-12650Htillhör förra årets Alder Lake-serie är den definitivt en del av det lägre segmentet.
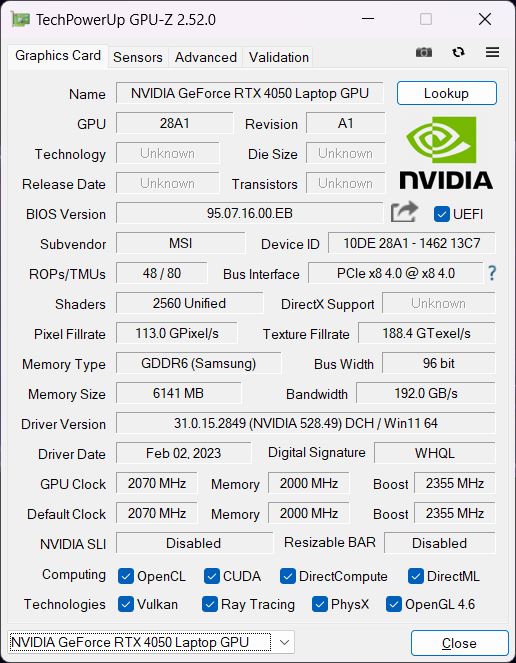
Processorn kombineras med enNvidia RTX 4050, instegskortet bland de nya RTX 40xx-modellerna. I Katana kan det förbruka upp till 105 W. 16 GB RAM-minne är den (lägre) standarden för en gamer nuförtiden.
Provningsförhållanden
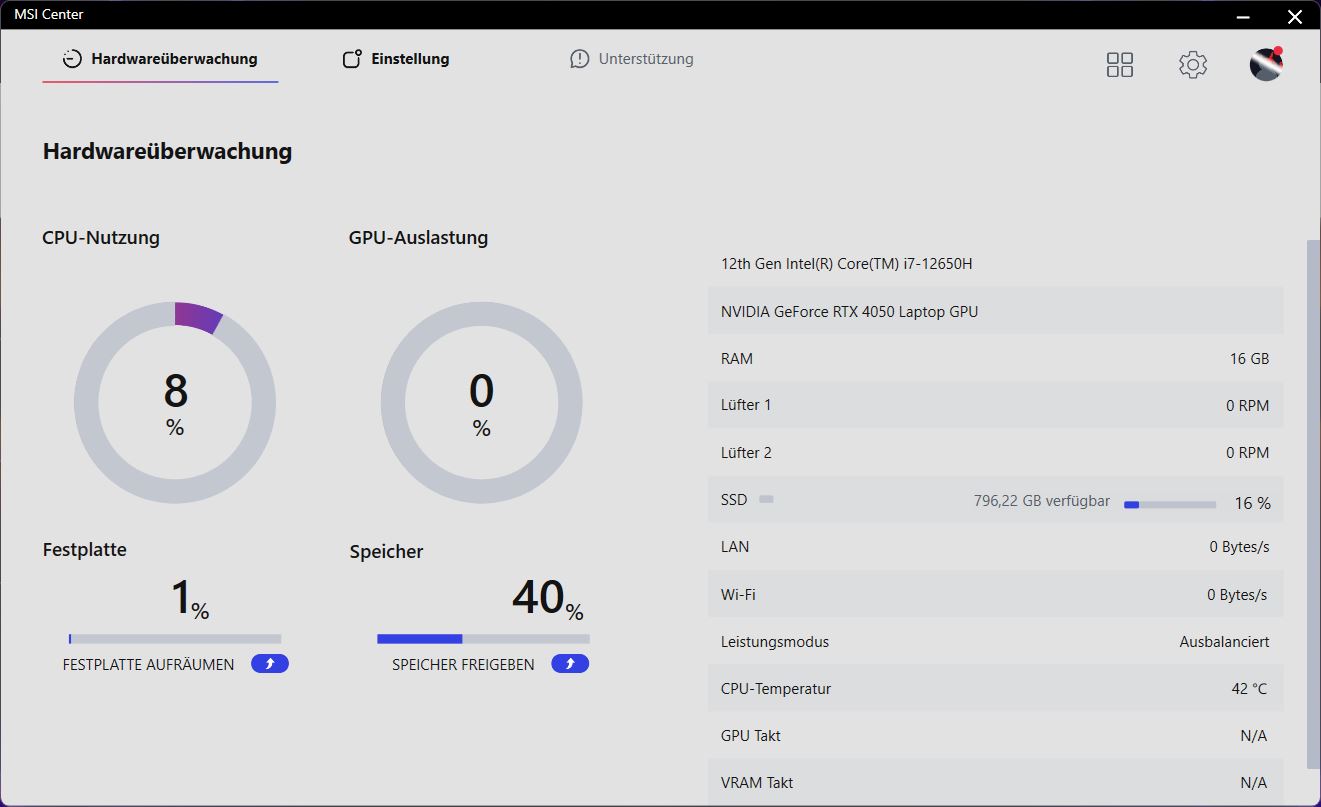
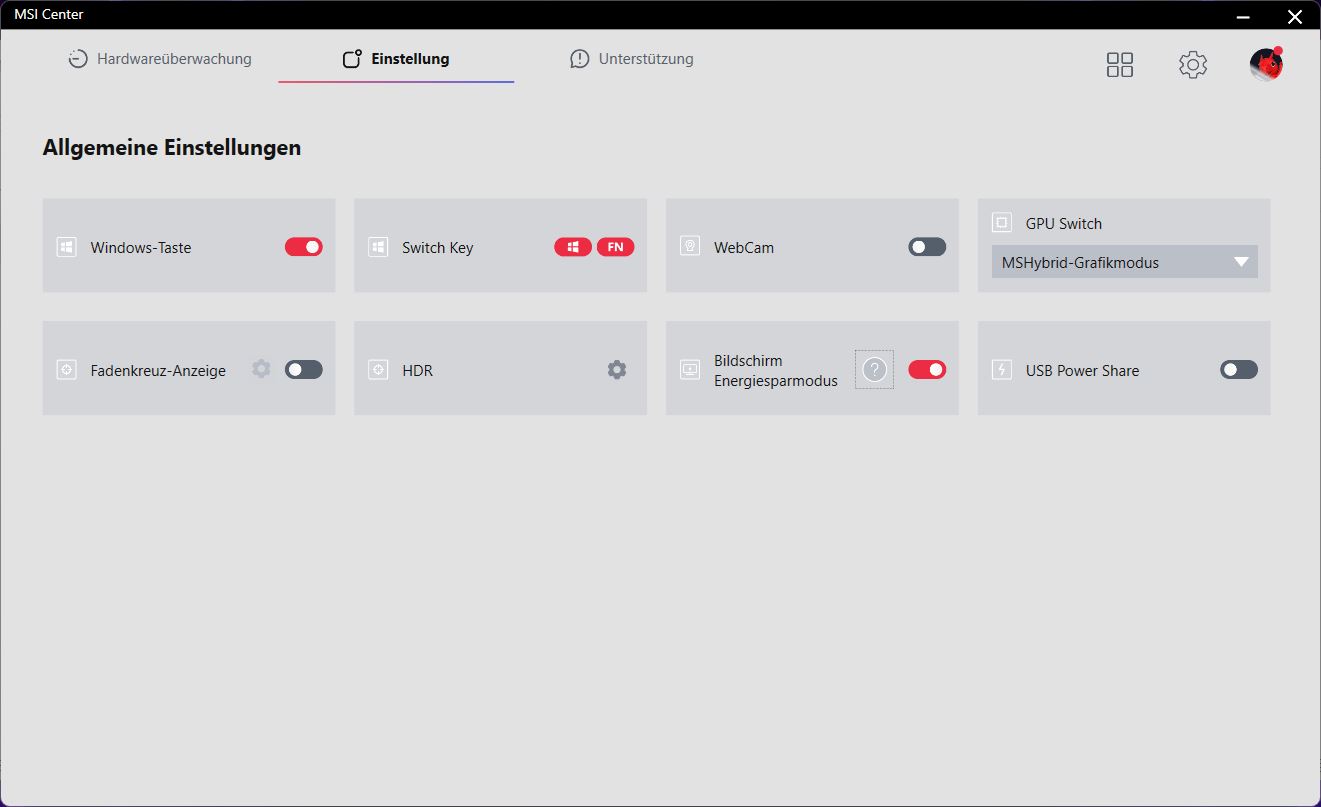
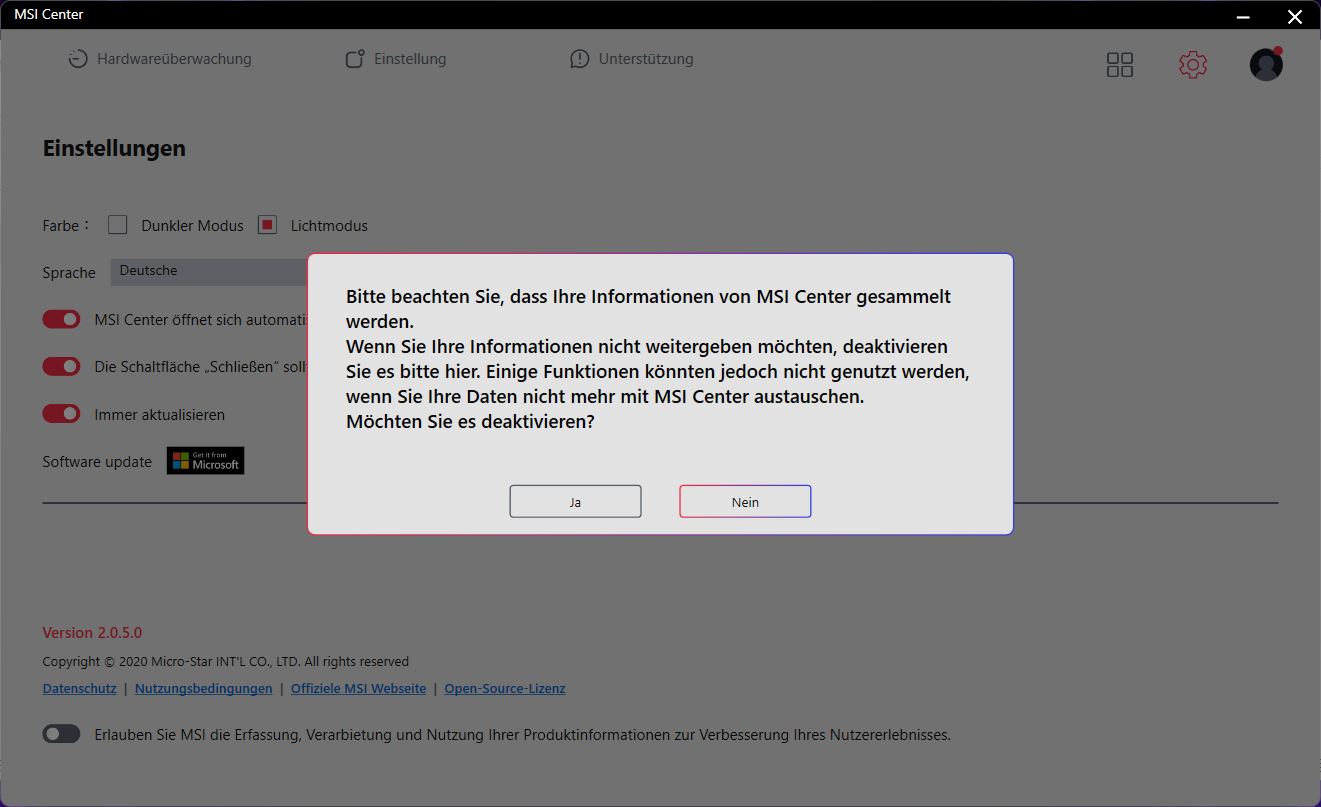
MSI Center är ett kontrollcenter som tillverkaren använder för att samla in olika typer av data. Här justeras bland annat prestandainställningarna. AI-läget är förinställt som standard här, vilket automatiskt justerar prestandavärdena beroende på den applicerade belastningen. Vi satte vår tilltro till AI:s kompetens och körde alla benchmarks i detta läge.
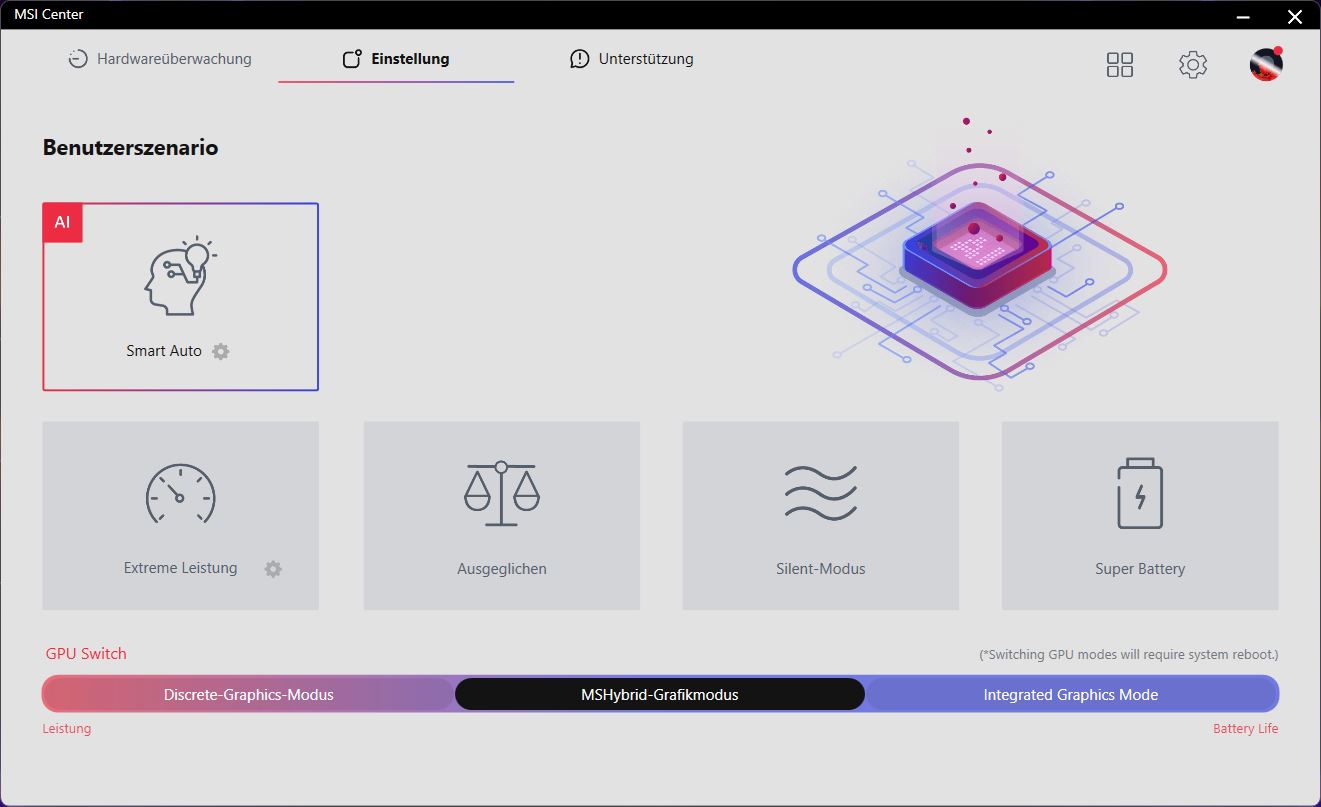
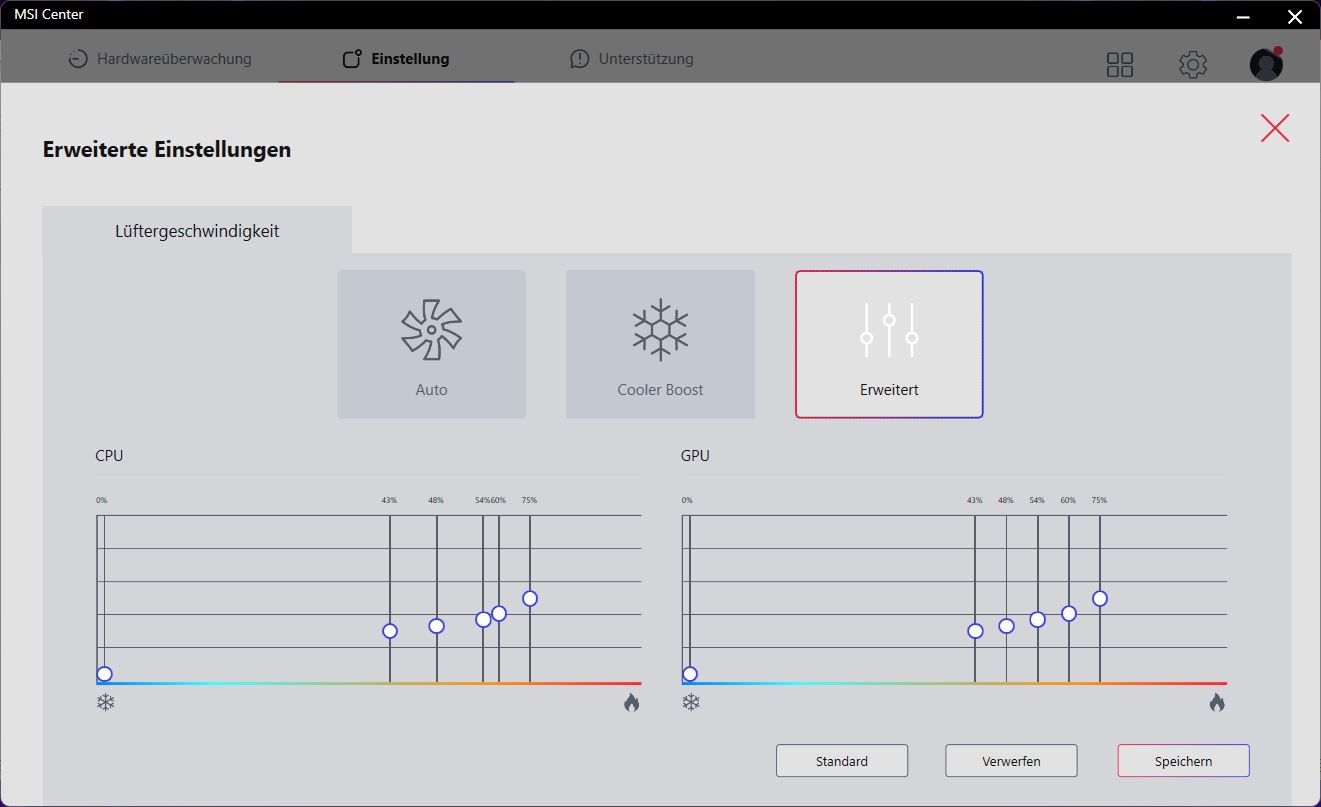
Förutom prestanda kan även andra inställningar justeras i MSI Center. Du byter till exempel funktionerna för fn- och Windows-tangenterna, justerar manuellt fläktkurvorna i läget Extreme Performance eller byter iGPU och dGPU. Verktyget har problem med vissa upplösningar
För det mesta var GPU-hybridläget aktiverat i MSI Center, som automatiskt växlar mellan iGPU och dGPU. Detta fungerade dock inte tillförlitligt i våra benchmarks. Vi var till exempel tvungna att manuellt aktivera dGPU för Blender eftersom testet automatiskt bara kördes med iGPU och gav mycket dåliga resultat.
Processor
I motsats till den allmänt användai7-12700H, är i7-12650H endast 4 av de 8 E-kärnorna, men de 6 P-kärnorna är desamma. De sistnämnda klockar upp till 4,7 GHz. CPU:n tillhör den lägre toppklassen i den senaste Intelgenerationen. Alternativt finns nu även Katana 15 B13 med en Gen13 CPU från Intel, vars pris sannolikt är högre.
I Cinebench-slingan ser vi en liten nedgång i prestanda under de två första körningarna. Därefter är prestandan i stort sett konstant, men inte överdrivet hög överlag. Vår Katana har en nackdel jämfört med konkurrenterna med i7-12700H, och den slås även av Ryzen 7 6800H.
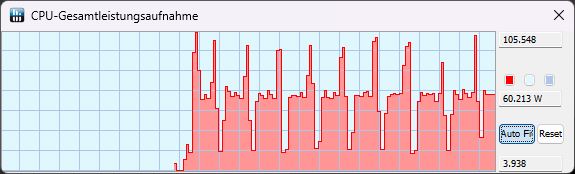
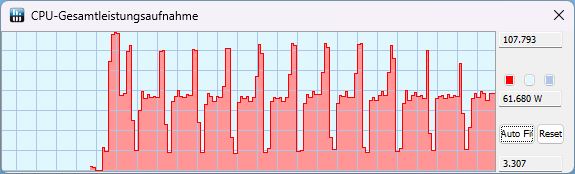
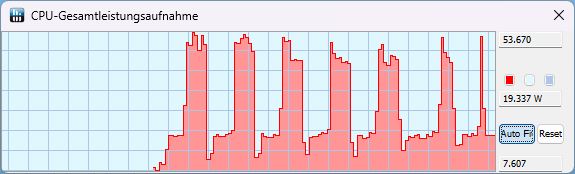
TDP förblir nästan densamma i både KI- och Extreme-läget: vi uppmätte cirka 105 W i början respektive slutet av en körning, och strömförbrukningen sjunker till 60 W under loppet av körningen. I batteriläge är toppvärdet endast 53 W, annars är endast 19 W tillgängligt
Överlag ligger CPU-prestandan på den förväntade nivån, men Katanas enkärniga prestanda är något svagare.
Cinebench R15 Multi Sustained Load
Cinebench R23: Multi Core | Single Core
Cinebench R20: CPU (Multi Core) | CPU (Single Core)
Cinebench R15: CPU Multi 64Bit | CPU Single 64Bit
Blender: v2.79 BMW27 CPU
7-Zip 18.03: 7z b 4 | 7z b 4 -mmt1
Geekbench 5.5: Multi-Core | Single-Core
HWBOT x265 Benchmark v2.2: 4k Preset
LibreOffice : 20 Documents To PDF
R Benchmark 2.5: Overall mean
| CPU Performance rating | |
| Genomsnitt av klass Gaming | |
| Lenovo Legion 5 15IAH7H 82RB | |
| MSI Pulse GL66 12UEK | |
| Asus TUF Gaming F15 FX507ZM | |
| MSI Katana GF66 12UGS | |
| MSI Katana 15 B12VEK | |
| Schenker XMG Core 15 (M22) | |
| Genomsnitt Intel Core i7-12650H | |
| Cinebench R23 / Multi Core | |
| Genomsnitt av klass Gaming (10488 - 42661, n=107, senaste 2 åren) | |
| Lenovo Legion 5 15IAH7H 82RB | |
| Asus TUF Gaming F15 FX507ZM | |
| MSI Pulse GL66 12UEK | |
| MSI Katana GF66 12UGS | |
| MSI Katana 15 B12VEK | |
| Schenker XMG Core 15 (M22) | |
| Genomsnitt Intel Core i7-12650H (5362 - 15537, n=14) | |
| Cinebench R23 / Single Core | |
| Genomsnitt av klass Gaming (1166 - 2415, n=107, senaste 2 åren) | |
| MSI Pulse GL66 12UEK | |
| MSI Katana GF66 12UGS | |
| Lenovo Legion 5 15IAH7H 82RB | |
| Asus TUF Gaming F15 FX507ZM | |
| Genomsnitt Intel Core i7-12650H (1428 - 1808, n=14) | |
| MSI Katana 15 B12VEK | |
| Schenker XMG Core 15 (M22) | |
| Cinebench R20 / CPU (Multi Core) | |
| Genomsnitt av klass Gaming (4029 - 16433, n=106, senaste 2 åren) | |
| Lenovo Legion 5 15IAH7H 82RB | |
| Asus TUF Gaming F15 FX507ZM | |
| MSI Pulse GL66 12UEK | |
| MSI Katana GF66 12UGS | |
| MSI Katana 15 B12VEK | |
| Schenker XMG Core 15 (M22) | |
| Genomsnitt Intel Core i7-12650H (2106 - 6009, n=14) | |
| Cinebench R20 / CPU (Single Core) | |
| Genomsnitt av klass Gaming (442 - 913, n=106, senaste 2 åren) | |
| MSI Pulse GL66 12UEK | |
| MSI Katana GF66 12UGS | |
| Lenovo Legion 5 15IAH7H 82RB | |
| Asus TUF Gaming F15 FX507ZM | |
| Genomsnitt Intel Core i7-12650H (552 - 696, n=14) | |
| MSI Katana 15 B12VEK | |
| Schenker XMG Core 15 (M22) | |
| Cinebench R15 / CPU Multi 64Bit | |
| Genomsnitt av klass Gaming (1578 - 6330, n=105, senaste 2 åren) | |
| Lenovo Legion 5 15IAH7H 82RB | |
| Asus TUF Gaming F15 FX507ZM | |
| MSI Pulse GL66 12UEK | |
| MSI Katana GF66 12UGS | |
| MSI Katana GF66 12UGS | |
| Schenker XMG Core 15 (M22) | |
| MSI Katana 15 B12VEK | |
| Genomsnitt Intel Core i7-12650H (753 - 2253, n=14) | |
| Cinebench R15 / CPU Single 64Bit | |
| Genomsnitt av klass Gaming (188.8 - 350, n=106, senaste 2 åren) | |
| MSI Pulse GL66 12UEK | |
| MSI Katana GF66 12UGS | |
| MSI Katana GF66 12UGS | |
| Lenovo Legion 5 15IAH7H 82RB | |
| Asus TUF Gaming F15 FX507ZM | |
| Schenker XMG Core 15 (M22) | |
| MSI Katana 15 B12VEK | |
| Genomsnitt Intel Core i7-12650H (206 - 261, n=14) | |
| Blender / v2.79 BMW27 CPU | |
| Genomsnitt Intel Core i7-12650H (222 - 553, n=15) | |
| MSI Katana GF66 12UGS | |
| MSI Katana 15 B12VEK | |
| Schenker XMG Core 15 (M22) | |
| MSI Pulse GL66 12UEK | |
| Asus TUF Gaming F15 FX507ZM | |
| Lenovo Legion 5 15IAH7H 82RB | |
| Genomsnitt av klass Gaming (79 - 330, n=104, senaste 2 åren) | |
| 7-Zip 18.03 / 7z b 4 | |
| Genomsnitt av klass Gaming (33491 - 148086, n=105, senaste 2 åren) | |
| Lenovo Legion 5 15IAH7H 82RB | |
| Asus TUF Gaming F15 FX507ZM | |
| MSI Pulse GL66 12UEK | |
| Schenker XMG Core 15 (M22) | |
| MSI Katana 15 B12VEK | |
| MSI Katana GF66 12UGS | |
| Genomsnitt Intel Core i7-12650H (27053 - 59034, n=14) | |
| 7-Zip 18.03 / 7z b 4 -mmt1 | |
| Genomsnitt av klass Gaming (4199 - 7436, n=105, senaste 2 åren) | |
| MSI Pulse GL66 12UEK | |
| MSI Katana GF66 12UGS | |
| Lenovo Legion 5 15IAH7H 82RB | |
| Schenker XMG Core 15 (M22) | |
| Genomsnitt Intel Core i7-12650H (5265 - 6116, n=14) | |
| MSI Katana 15 B12VEK | |
| Asus TUF Gaming F15 FX507ZM | |
| Geekbench 5.5 / Multi-Core | |
| Genomsnitt av klass Gaming (6460 - 28263, n=105, senaste 2 åren) | |
| Lenovo Legion 5 15IAH7H 82RB | |
| Asus TUF Gaming F15 FX507ZM | |
| MSI Pulse GL66 12UEK | |
| MSI Katana GF66 12UGS | |
| MSI Katana 15 B12VEK | |
| Schenker XMG Core 15 (M22) | |
| Genomsnitt Intel Core i7-12650H (6478 - 11284, n=16) | |
| Geekbench 5.5 / Single-Core | |
| Genomsnitt av klass Gaming (986 - 2474, n=105, senaste 2 åren) | |
| MSI Pulse GL66 12UEK | |
| MSI Katana GF66 12UGS | |
| Lenovo Legion 5 15IAH7H 82RB | |
| Asus TUF Gaming F15 FX507ZM | |
| Genomsnitt Intel Core i7-12650H (1590 - 1797, n=16) | |
| MSI Katana 15 B12VEK | |
| Schenker XMG Core 15 (M22) | |
| HWBOT x265 Benchmark v2.2 / 4k Preset | |
| Genomsnitt av klass Gaming (11.5 - 44.4, n=105, senaste 2 åren) | |
| Lenovo Legion 5 15IAH7H 82RB | |
| Asus TUF Gaming F15 FX507ZM | |
| MSI Pulse GL66 12UEK | |
| Schenker XMG Core 15 (M22) | |
| MSI Katana 15 B12VEK | |
| Genomsnitt Intel Core i7-12650H (6.62 - 17.4, n=16) | |
| MSI Katana GF66 12UGS | |
| LibreOffice / 20 Documents To PDF | |
| Schenker XMG Core 15 (M22) | |
| Asus TUF Gaming F15 FX507ZM | |
| Genomsnitt av klass Gaming (33.2 - 88.8, n=105, senaste 2 åren) | |
| MSI Katana 15 B12VEK | |
| Genomsnitt Intel Core i7-12650H (35.1 - 58.5, n=14) | |
| MSI Pulse GL66 12UEK | |
| Lenovo Legion 5 15IAH7H 82RB | |
| MSI Katana GF66 12UGS | |
| R Benchmark 2.5 / Overall mean | |
| MSI Katana 15 B12VEK | |
| Schenker XMG Core 15 (M22) | |
| Genomsnitt Intel Core i7-12650H (0.4584 - 0.515, n=14) | |
| Asus TUF Gaming F15 FX507ZM | |
| Lenovo Legion 5 15IAH7H 82RB | |
| MSI Katana GF66 12UGS | |
| Genomsnitt av klass Gaming (0.3439 - 0.759, n=106, senaste 2 åren) | |
| MSI Pulse GL66 12UEK | |
* ... mindre är bättre
AIDA64: FP32 Ray-Trace | FPU Julia | CPU SHA3 | CPU Queen | FPU SinJulia | FPU Mandel | CPU AES | CPU ZLib | FP64 Ray-Trace | CPU PhotoWorxx
| Performance rating | |
| Genomsnitt av klass Gaming | |
| Lenovo Legion 5 15IAH7H 82RB | |
| Schenker XMG Core 15 (M22) | |
| MSI Katana 15 B12VEK | |
| MSI Pulse GL66 12UEK | |
| Asus TUF Gaming F15 FX507ZM | |
| MSI Katana GF66 12UGS | |
| Genomsnitt Intel Core i7-12650H | |
| AIDA64 / FP32 Ray-Trace | |
| Genomsnitt av klass Gaming (10227 - 85542, n=105, senaste 2 åren) | |
| Lenovo Legion 5 15IAH7H 82RB | |
| Schenker XMG Core 15 (M22) | |
| MSI Katana 15 B12VEK | |
| Genomsnitt Intel Core i7-12650H (5422 - 15620, n=14) | |
| Asus TUF Gaming F15 FX507ZM | |
| MSI Pulse GL66 12UEK | |
| MSI Katana GF66 12UGS | |
| AIDA64 / FPU Julia | |
| Genomsnitt av klass Gaming (51376 - 238426, n=105, senaste 2 åren) | |
| Schenker XMG Core 15 (M22) | |
| Lenovo Legion 5 15IAH7H 82RB | |
| MSI Katana 15 B12VEK | |
| Genomsnitt Intel Core i7-12650H (26386 - 76434, n=14) | |
| Asus TUF Gaming F15 FX507ZM | |
| MSI Pulse GL66 12UEK | |
| MSI Katana GF66 12UGS | |
| AIDA64 / CPU SHA3 | |
| Genomsnitt av klass Gaming (2180 - 10115, n=105, senaste 2 åren) | |
| Lenovo Legion 5 15IAH7H 82RB | |
| Schenker XMG Core 15 (M22) | |
| Asus TUF Gaming F15 FX507ZM | |
| MSI Katana 15 B12VEK | |
| MSI Pulse GL66 12UEK | |
| MSI Katana GF66 12UGS | |
| Genomsnitt Intel Core i7-12650H (1479 - 3244, n=14) | |
| AIDA64 / CPU Queen | |
| Genomsnitt av klass Gaming (49785 - 173351, n=90, senaste 2 åren) | |
| MSI Pulse GL66 12UEK | |
| Lenovo Legion 5 15IAH7H 82RB | |
| MSI Katana GF66 12UGS | |
| Asus TUF Gaming F15 FX507ZM | |
| Schenker XMG Core 15 (M22) | |
| MSI Katana 15 B12VEK | |
| Genomsnitt Intel Core i7-12650H (59278 - 89537, n=14) | |
| AIDA64 / FPU SinJulia | |
| Genomsnitt av klass Gaming (4424 - 33636, n=105, senaste 2 åren) | |
| Schenker XMG Core 15 (M22) | |
| Lenovo Legion 5 15IAH7H 82RB | |
| MSI Pulse GL66 12UEK | |
| Asus TUF Gaming F15 FX507ZM | |
| MSI Katana GF66 12UGS | |
| MSI Katana 15 B12VEK | |
| Genomsnitt Intel Core i7-12650H (4690 - 8726, n=14) | |
| AIDA64 / FPU Mandel | |
| Genomsnitt av klass Gaming (25115 - 128721, n=105, senaste 2 åren) | |
| Schenker XMG Core 15 (M22) | |
| Lenovo Legion 5 15IAH7H 82RB | |
| MSI Katana 15 B12VEK | |
| Genomsnitt Intel Core i7-12650H (15001 - 37738, n=14) | |
| Asus TUF Gaming F15 FX507ZM | |
| MSI Pulse GL66 12UEK | |
| MSI Katana GF66 12UGS | |
| AIDA64 / CPU AES | |
| Lenovo Legion 5 15IAH7H 82RB | |
| Genomsnitt av klass Gaming (39258 - 247074, n=105, senaste 2 åren) | |
| MSI Pulse GL66 12UEK | |
| MSI Katana GF66 12UGS | |
| Schenker XMG Core 15 (M22) | |
| MSI Katana 15 B12VEK | |
| Asus TUF Gaming F15 FX507ZM | |
| Genomsnitt Intel Core i7-12650H (32702 - 92530, n=14) | |
| AIDA64 / CPU ZLib | |
| Genomsnitt av klass Gaming (574 - 2531, n=105, senaste 2 åren) | |
| Asus TUF Gaming F15 FX507ZM | |
| Lenovo Legion 5 15IAH7H 82RB | |
| MSI Pulse GL66 12UEK | |
| MSI Katana GF66 12UGS | |
| Schenker XMG Core 15 (M22) | |
| MSI Katana 15 B12VEK | |
| Genomsnitt Intel Core i7-12650H (443 - 891, n=14) | |
| AIDA64 / FP64 Ray-Trace | |
| Genomsnitt av klass Gaming (5509 - 45446, n=105, senaste 2 åren) | |
| Lenovo Legion 5 15IAH7H 82RB | |
| Schenker XMG Core 15 (M22) | |
| MSI Katana 15 B12VEK | |
| Genomsnitt Intel Core i7-12650H (3096 - 8448, n=14) | |
| Asus TUF Gaming F15 FX507ZM | |
| MSI Pulse GL66 12UEK | |
| MSI Katana GF66 12UGS | |
| AIDA64 / CPU PhotoWorxx | |
| Genomsnitt av klass Gaming (12271 - 89891, n=105, senaste 2 åren) | |
| MSI Katana 15 B12VEK | |
| Lenovo Legion 5 15IAH7H 82RB | |
| Asus TUF Gaming F15 FX507ZM | |
| Genomsnitt Intel Core i7-12650H (22046 - 44164, n=14) | |
| Schenker XMG Core 15 (M22) | |
| MSI Katana GF66 12UGS | |
| MSI Pulse GL66 12UEK | |
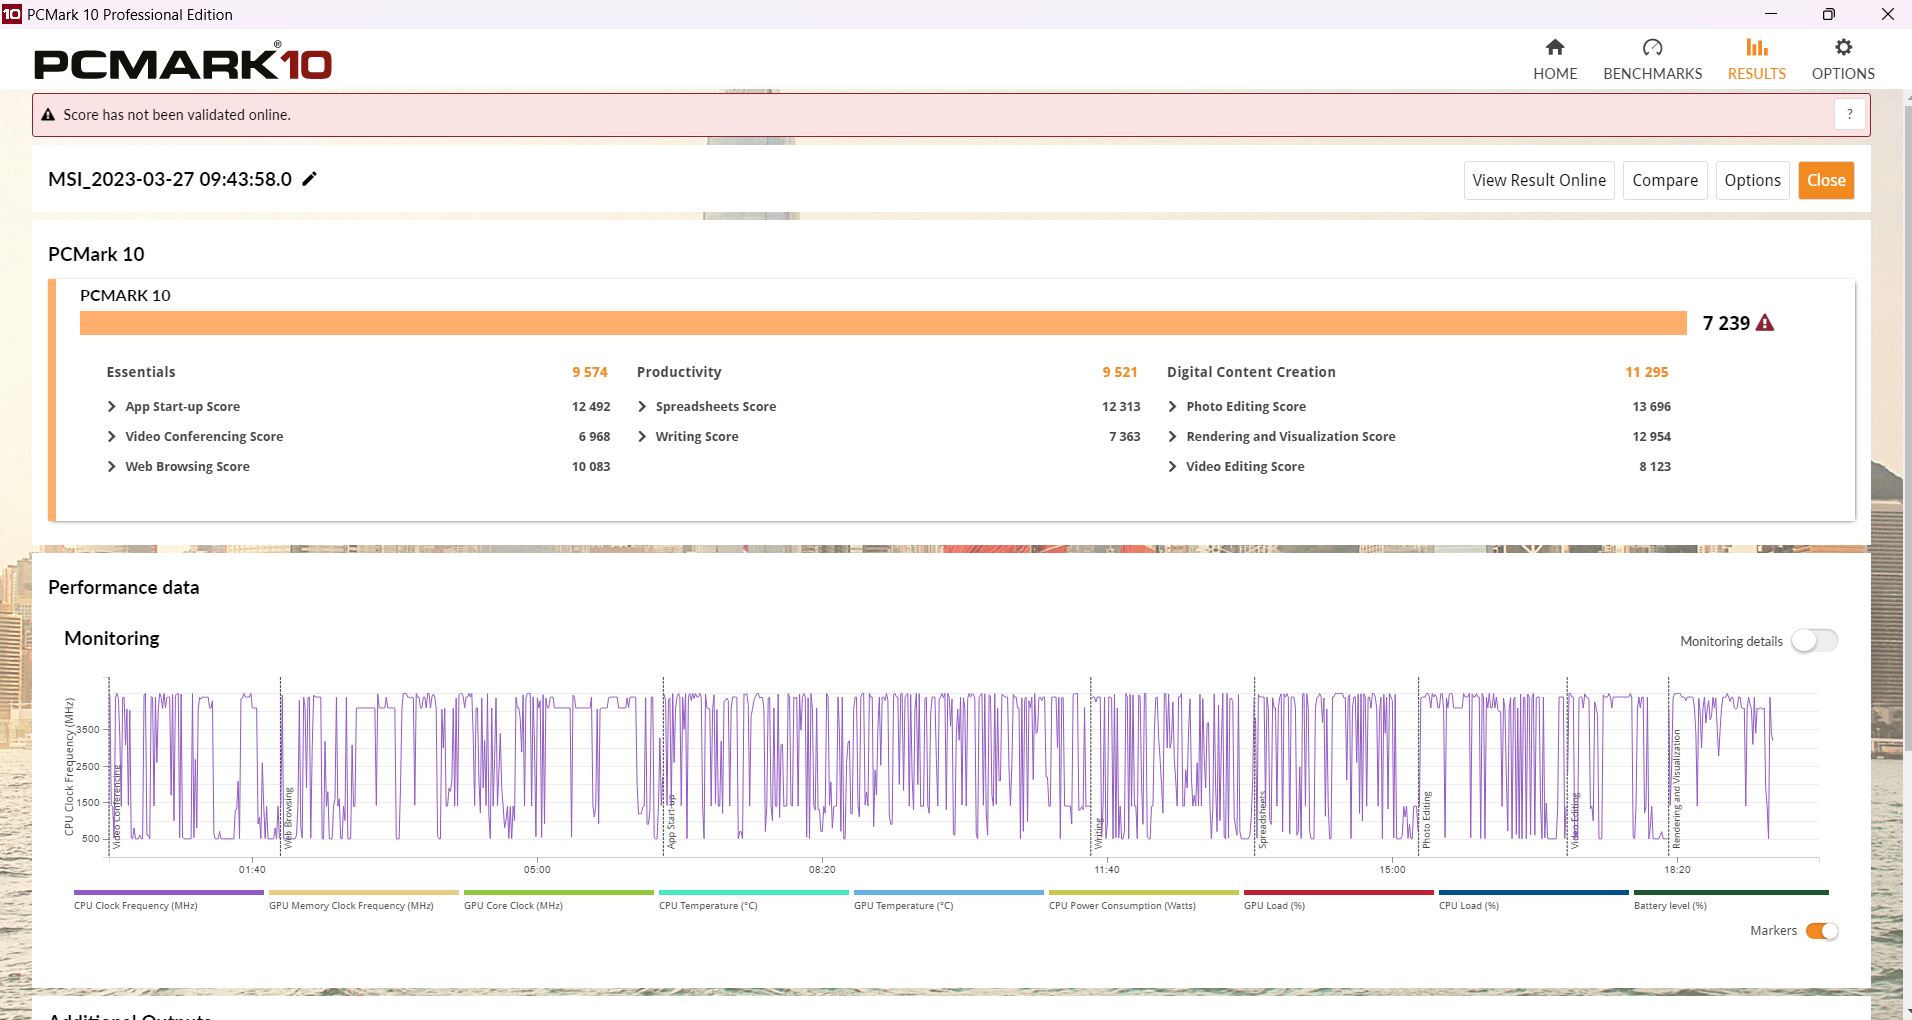
Systemets prestanda
CrossMark: Overall | Productivity | Creativity | Responsiveness
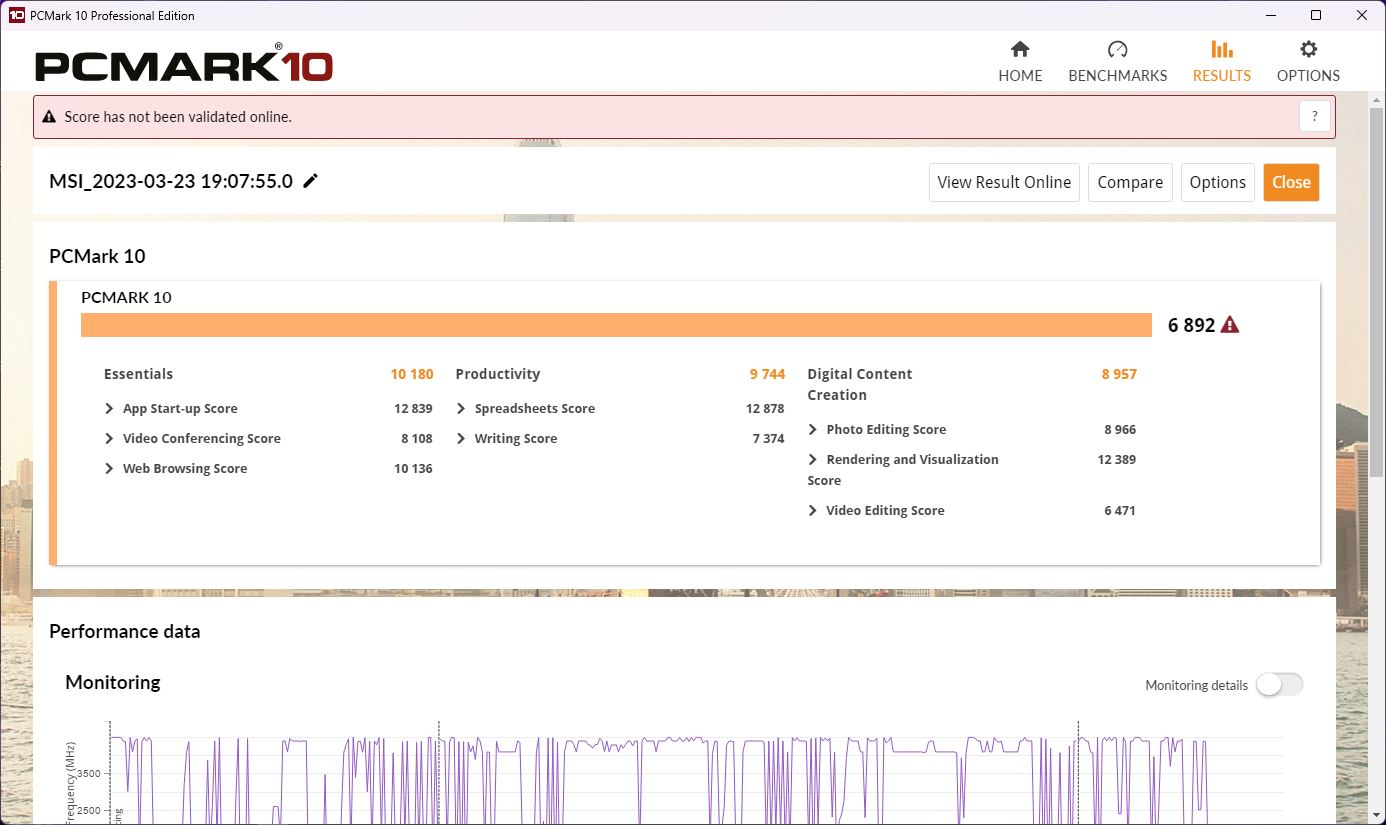
| PCMark 10 / Score | |
| Genomsnitt av klass Gaming (5828 - 12414, n=93, senaste 2 åren) | |
| Lenovo Legion 5 15IAH7H 82RB | |
| MSI Katana GF66 12UGS | |
| Asus TUF Gaming F15 FX507ZM | |
| Schenker XMG Core 15 (M22) | |
| MSI Pulse GL66 12UEK | |
| MSI Katana 15 B12VEK | |
| Genomsnitt Intel Core i7-12650H, NVIDIA GeForce RTX 4050 Laptop GPU (n=1) | |
| PCMark 10 / Essentials | |
| Lenovo Legion 5 15IAH7H 82RB | |
| Schenker XMG Core 15 (M22) | |
| Genomsnitt av klass Gaming (8810 - 11935, n=97, senaste 2 åren) | |
| Asus TUF Gaming F15 FX507ZM | |
| MSI Pulse GL66 12UEK | |
| MSI Katana GF66 12UGS | |
| MSI Katana 15 B12VEK | |
| Genomsnitt Intel Core i7-12650H, NVIDIA GeForce RTX 4050 Laptop GPU (n=1) | |
| PCMark 10 / Productivity | |
| Genomsnitt av klass Gaming (6845 - 25323, n=95, senaste 2 åren) | |
| Lenovo Legion 5 15IAH7H 82RB | |
| MSI Katana GF66 12UGS | |
| MSI Pulse GL66 12UEK | |
| MSI Katana 15 B12VEK | |
| Genomsnitt Intel Core i7-12650H, NVIDIA GeForce RTX 4050 Laptop GPU (n=1) | |
| Schenker XMG Core 15 (M22) | |
| Asus TUF Gaming F15 FX507ZM | |
| PCMark 10 / Digital Content Creation | |
| Genomsnitt av klass Gaming (7602 - 19954, n=95, senaste 2 åren) | |
| Lenovo Legion 5 15IAH7H 82RB | |
| Asus TUF Gaming F15 FX507ZM | |
| MSI Katana GF66 12UGS | |
| Schenker XMG Core 15 (M22) | |
| MSI Pulse GL66 12UEK | |
| MSI Katana 15 B12VEK | |
| Genomsnitt Intel Core i7-12650H, NVIDIA GeForce RTX 4050 Laptop GPU (n=1) | |
| CrossMark / Overall | |
| MSI Pulse GL66 12UEK | |
| Lenovo Legion 5 15IAH7H 82RB | |
| Genomsnitt av klass Gaming (1366 - 2409, n=94, senaste 2 åren) | |
| MSI Katana GF66 12UGS | |
| MSI Katana 15 B12VEK | |
| Genomsnitt Intel Core i7-12650H, NVIDIA GeForce RTX 4050 Laptop GPU (n=1) | |
| Schenker XMG Core 15 (M22) | |
| CrossMark / Productivity | |
| MSI Pulse GL66 12UEK | |
| Lenovo Legion 5 15IAH7H 82RB | |
| MSI Katana GF66 12UGS | |
| Genomsnitt av klass Gaming (1386 - 2254, n=94, senaste 2 åren) | |
| MSI Katana 15 B12VEK | |
| Genomsnitt Intel Core i7-12650H, NVIDIA GeForce RTX 4050 Laptop GPU (n=1) | |
| Schenker XMG Core 15 (M22) | |
| CrossMark / Creativity | |
| Genomsnitt av klass Gaming (1343 - 2786, n=94, senaste 2 åren) | |
| MSI Pulse GL66 12UEK | |
| Lenovo Legion 5 15IAH7H 82RB | |
| MSI Katana GF66 12UGS | |
| MSI Katana 15 B12VEK | |
| Genomsnitt Intel Core i7-12650H, NVIDIA GeForce RTX 4050 Laptop GPU (n=1) | |
| Schenker XMG Core 15 (M22) | |
| CrossMark / Responsiveness | |
| MSI Pulse GL66 12UEK | |
| Lenovo Legion 5 15IAH7H 82RB | |
| MSI Katana GF66 12UGS | |
| Genomsnitt av klass Gaming (1226 - 2334, n=94, senaste 2 åren) | |
| MSI Katana 15 B12VEK | |
| Genomsnitt Intel Core i7-12650H, NVIDIA GeForce RTX 4050 Laptop GPU (n=1) | |
| Schenker XMG Core 15 (M22) | |
| PCMark 10 Score | 6892 poäng | |
Hjälp | ||
| AIDA64 / Memory Copy | |
| Genomsnitt av klass Gaming (21750 - 129946, n=105, senaste 2 åren) | |
| MSI Katana 15 B12VEK | |
| Asus TUF Gaming F15 FX507ZM | |
| Lenovo Legion 5 15IAH7H 82RB | |
| Genomsnitt Intel Core i7-12650H (43261 - 69735, n=14) | |
| Schenker XMG Core 15 (M22) | |
| MSI Katana GF66 12UGS | |
| MSI Pulse GL66 12UEK | |
| AIDA64 / Memory Read | |
| Genomsnitt av klass Gaming (22956 - 118858, n=105, senaste 2 åren) | |
| MSI Katana 15 B12VEK | |
| Lenovo Legion 5 15IAH7H 82RB | |
| Asus TUF Gaming F15 FX507ZM | |
| Genomsnitt Intel Core i7-12650H (47313 - 67412, n=14) | |
| Schenker XMG Core 15 (M22) | |
| MSI Pulse GL66 12UEK | |
| MSI Katana GF66 12UGS | |
| AIDA64 / Memory Write | |
| Genomsnitt av klass Gaming (22297 - 135096, n=105, senaste 2 åren) | |
| Lenovo Legion 5 15IAH7H 82RB | |
| Asus TUF Gaming F15 FX507ZM | |
| MSI Katana 15 B12VEK | |
| Schenker XMG Core 15 (M22) | |
| Genomsnitt Intel Core i7-12650H (45617 - 59361, n=14) | |
| MSI Katana GF66 12UGS | |
| MSI Pulse GL66 12UEK | |
| AIDA64 / Memory Latency | |
| Genomsnitt av klass Gaming (75.3 - 259, n=105, senaste 2 åren) | |
| Lenovo Legion 5 15IAH7H 82RB | |
| MSI Katana GF66 12UGS | |
| MSI Katana 15 B12VEK | |
| MSI Pulse GL66 12UEK | |
| Schenker XMG Core 15 (M22) | |
| Genomsnitt Intel Core i7-12650H (71.6 - 103.9, n=14) | |
| Asus TUF Gaming F15 FX507ZM | |
* ... mindre är bättre
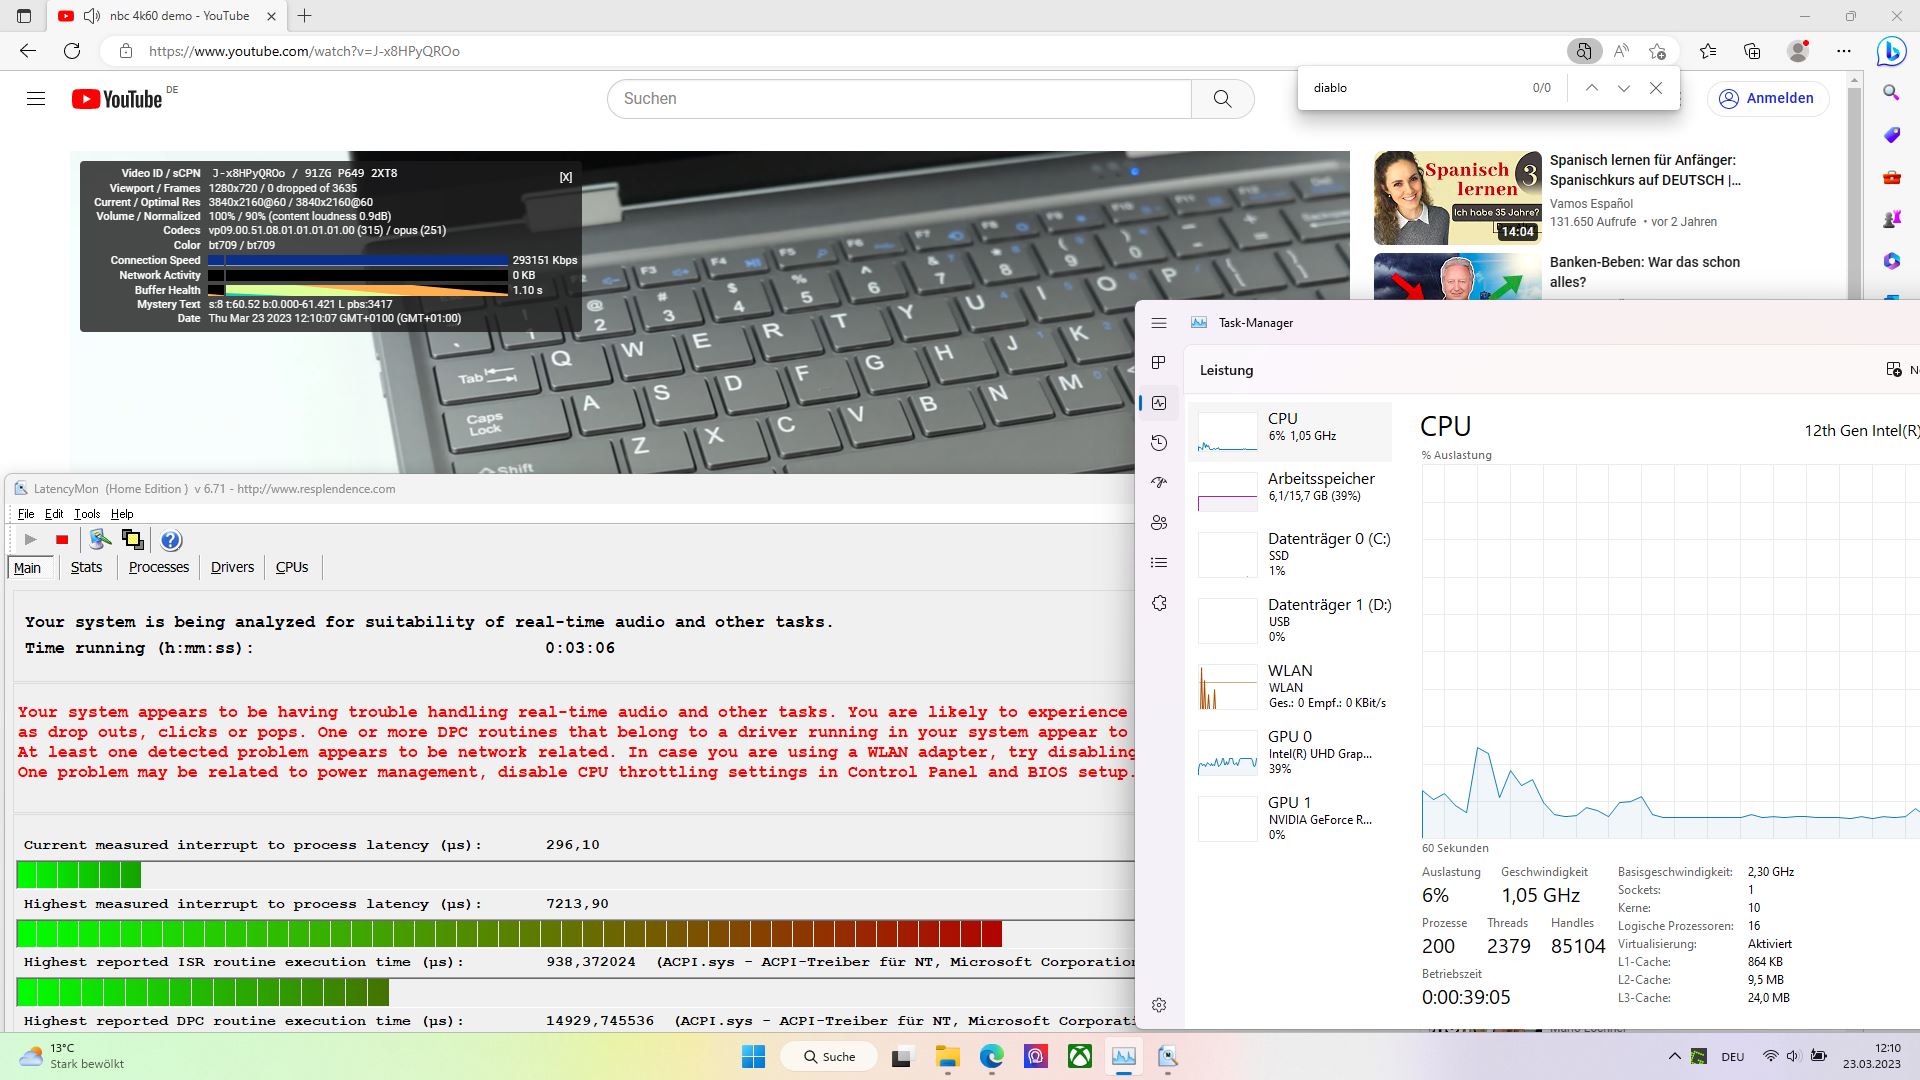
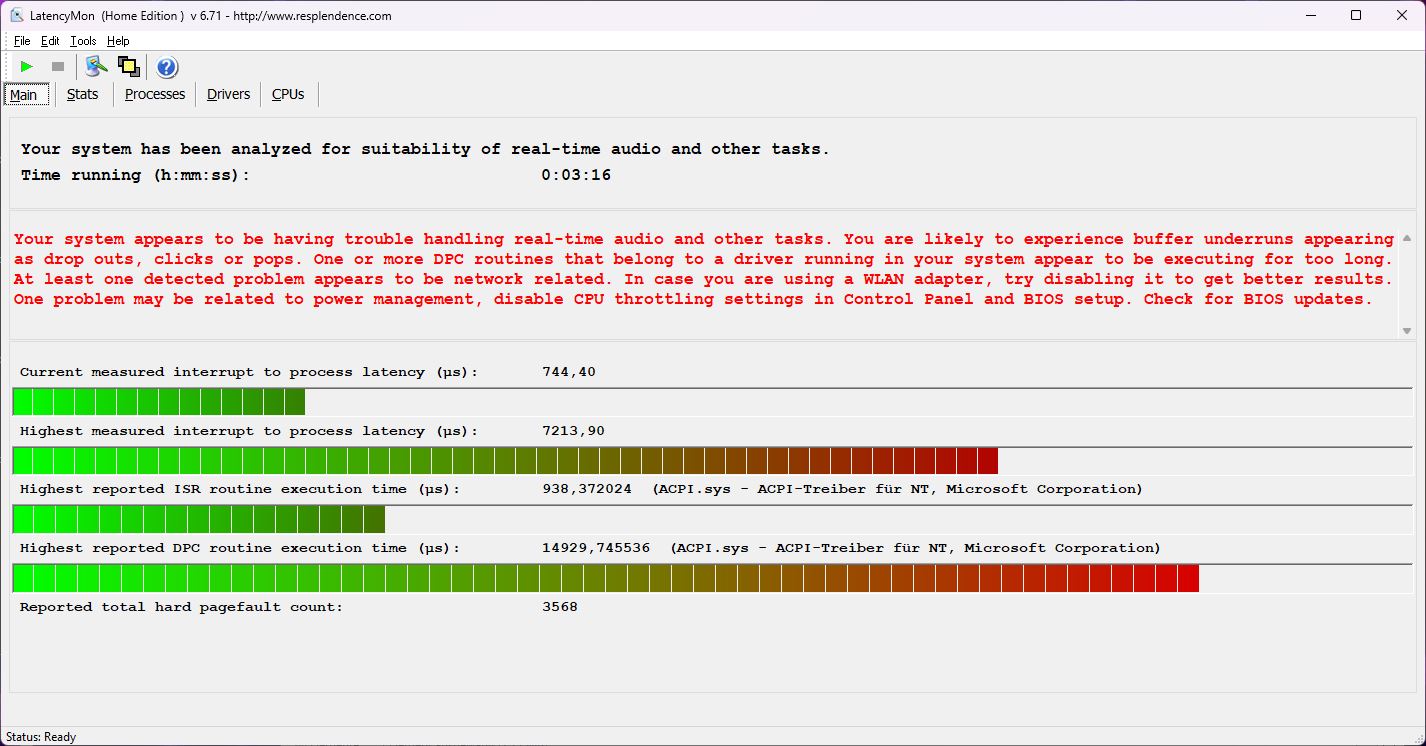
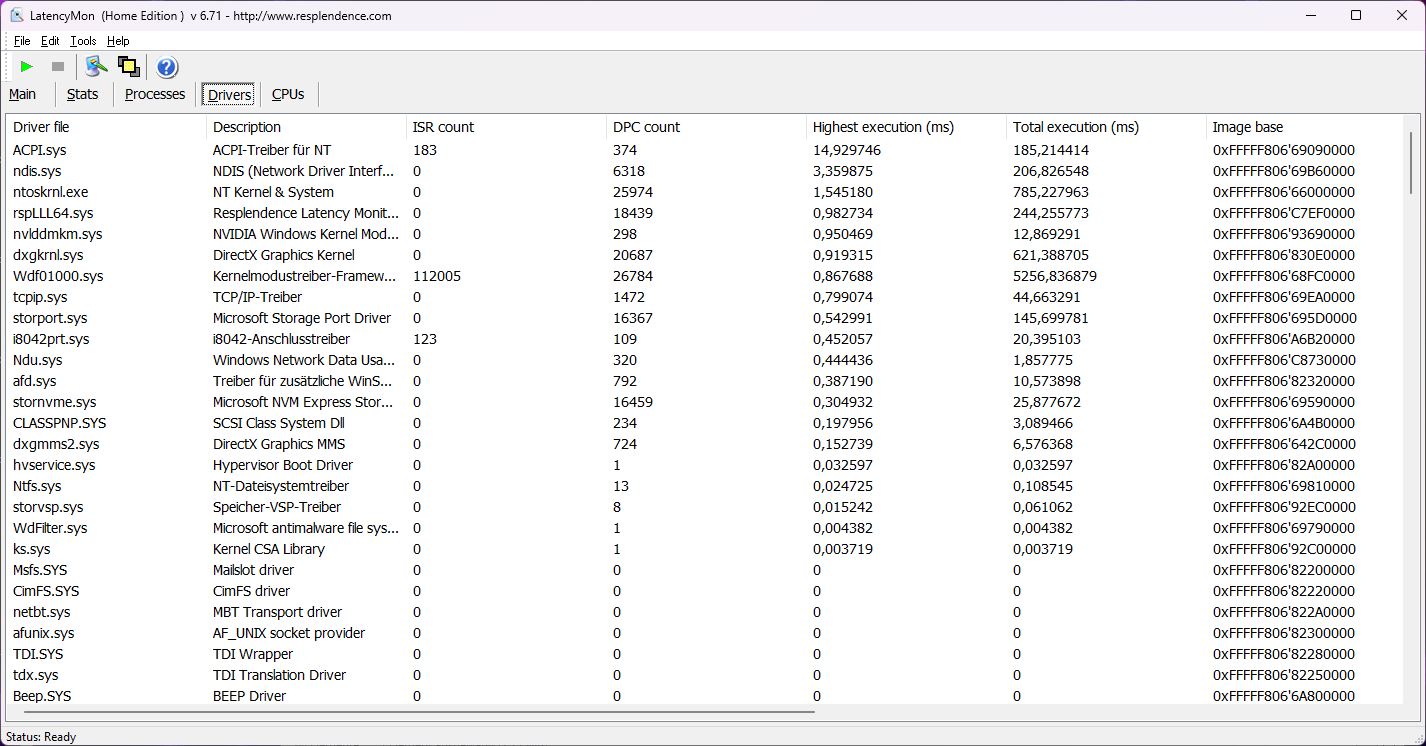
DPC-latenstid
För närvarande har Nvidias drivrutiner för bärbara datorer med RTX 40xx-kort fortfarande mycket höga latenser i LatencyMon och vår Katana är inget undantag. De första latenserna uppstår omedelbart efter att verktyget startats. Att öppna flera webbläsarflikar och spela upp vår YouTube-video i 4K/60 fps driver värdet kraftigt uppåt. Men det fanns inga överhoppade ramar.
| DPC Latencies / LatencyMon - interrupt to process latency (max), Web, Youtube, Prime95 | |
| MSI Katana 15 B12VEK | |
| Schenker XMG Core 15 (M22) | |
| MSI Pulse GL66 12UEK | |
| Lenovo Legion 5 15IAH7H 82RB | |
| Asus TUF Gaming F15 FX507ZM | |
| MSI Katana GF66 12UGS | |
* ... mindre är bättre
Lagringsenheter
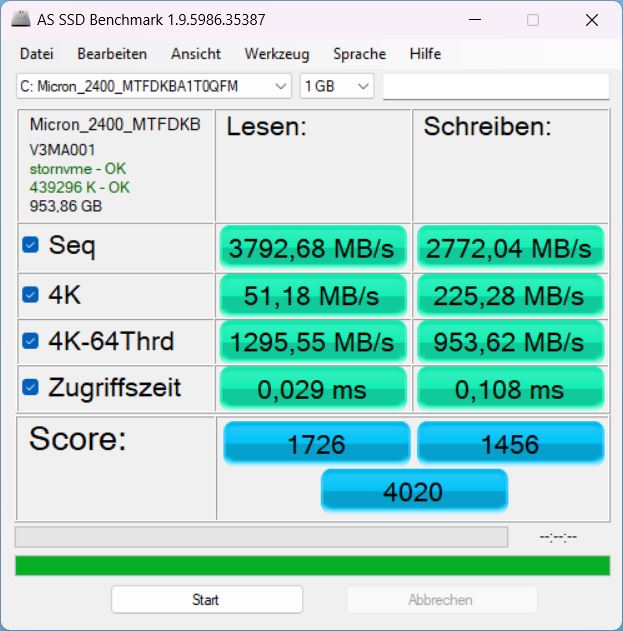
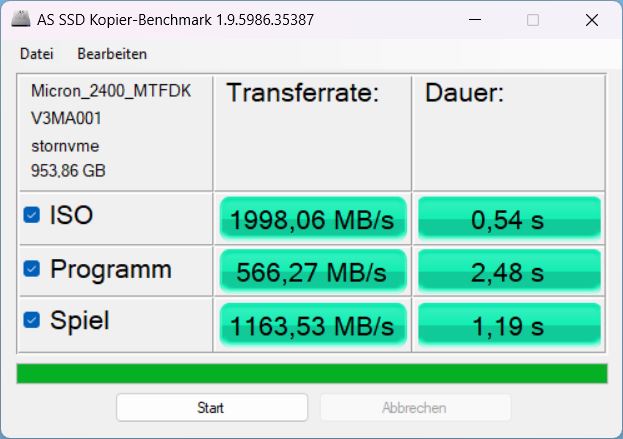
En 1 TB PCIe 4.0 x4 NVMe SSD från Micron fungerar som huvudlagringsenhet. I Katana utnyttjar den inte fullt ut sin prestandapotential och ligger långt efter Micron 2450-modellerna i fråga omKatana GF66 eller Pulse GL66.
Den har åtminstone en relativt konstant prestanda som bara minskar minimalt efter längre tidsperioder. Du hittar mer information om modellen i vår SSD-bästsäljarlista.

* ... mindre är bättre
Sustained Read Performance: DiskSpd Read Loop, Queue Depth 8
Grafikkort
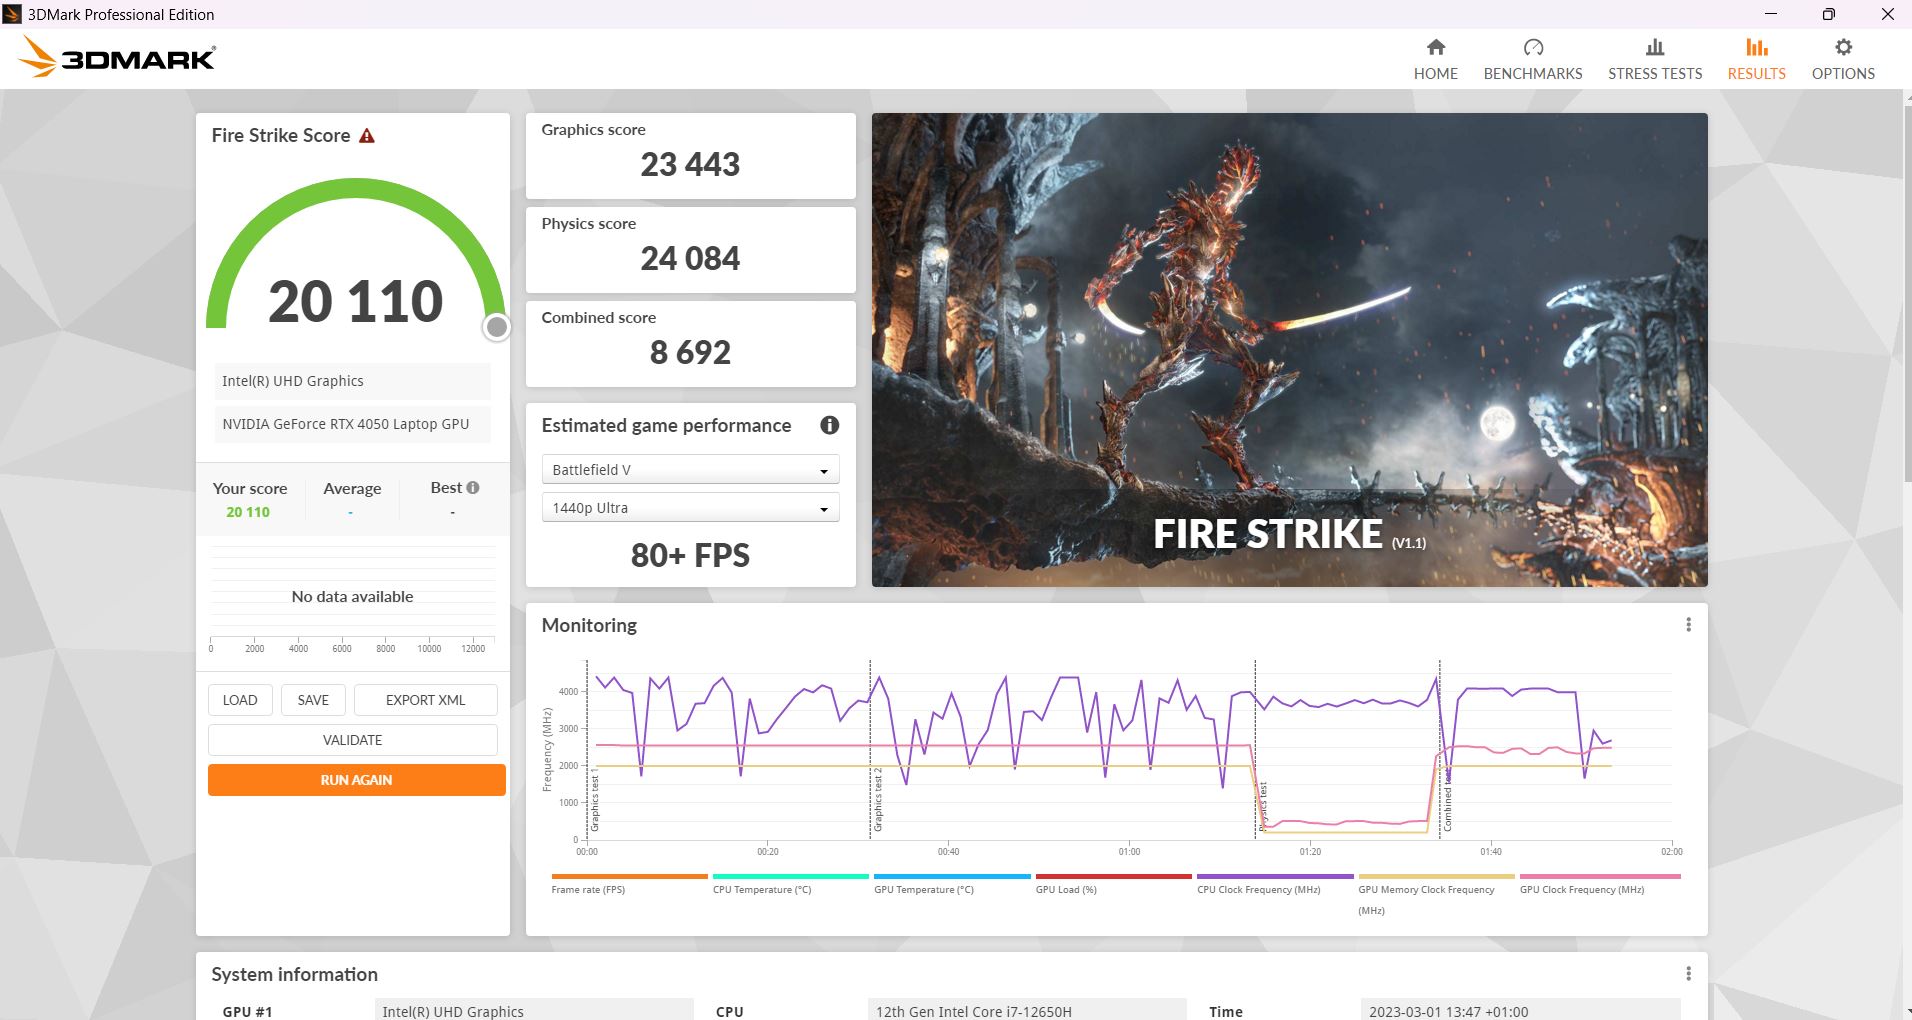
The Nvidia Geforce RTX 4050är det första kortet i den nya RTX 40xx-generationen. Prestandan bör vara ungefär i nivå med ett äldre RTX 3060beroende på den TGP som väljs (här 105 W), även om nuvarande riktmärken tyder på att kortet knappast drar nytta av mer än 100 W.
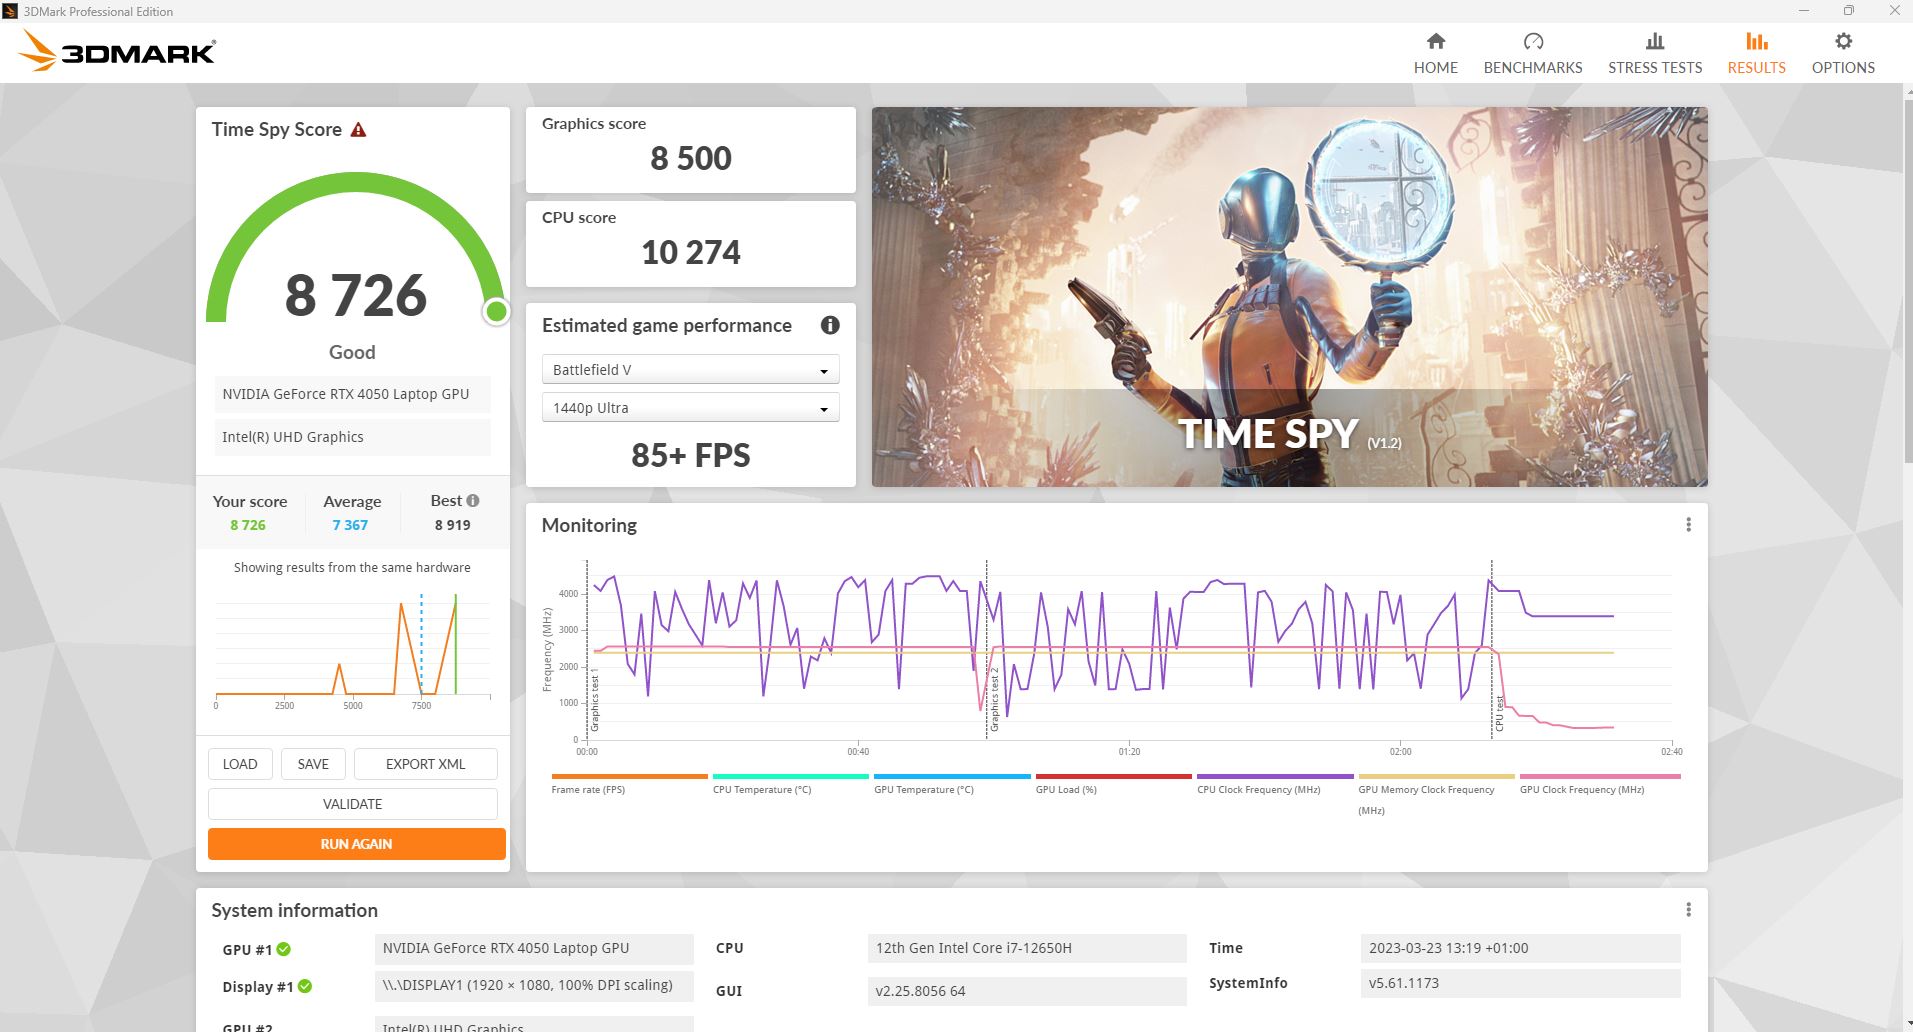
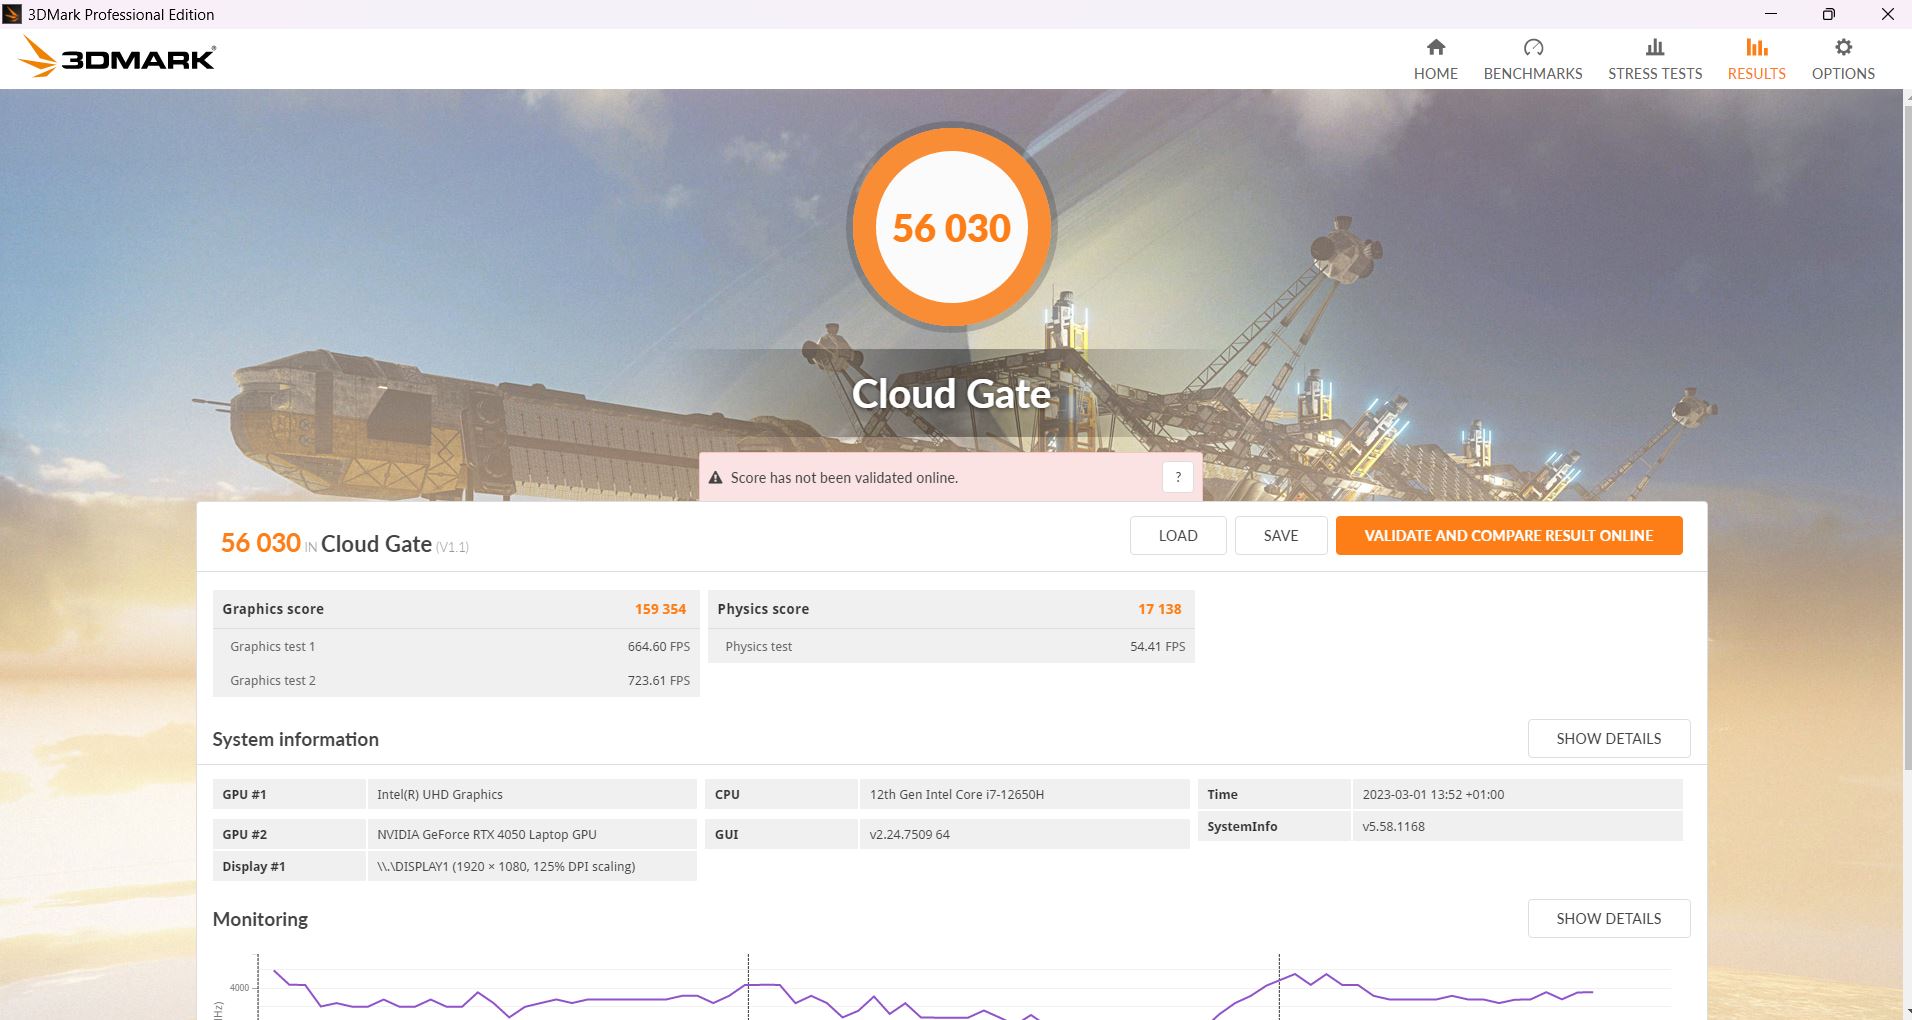
I det syntetiska 3DMarks presterar GPU:n ganska mycket på den förväntade nivån och ligger strax före förra årets konkurrens med RTX 3060. TheKatana GF66 med RTX 3070 Tiligger bara cirka 10 procent före.
Utanför sockeln försämras naturligtvis prestandan. I en annan Fire Strike -körning i batteriläge uppnådde Katana endast 14 446 grafikpoäng i stället för de 23 443 poängen när den är inkopplad.
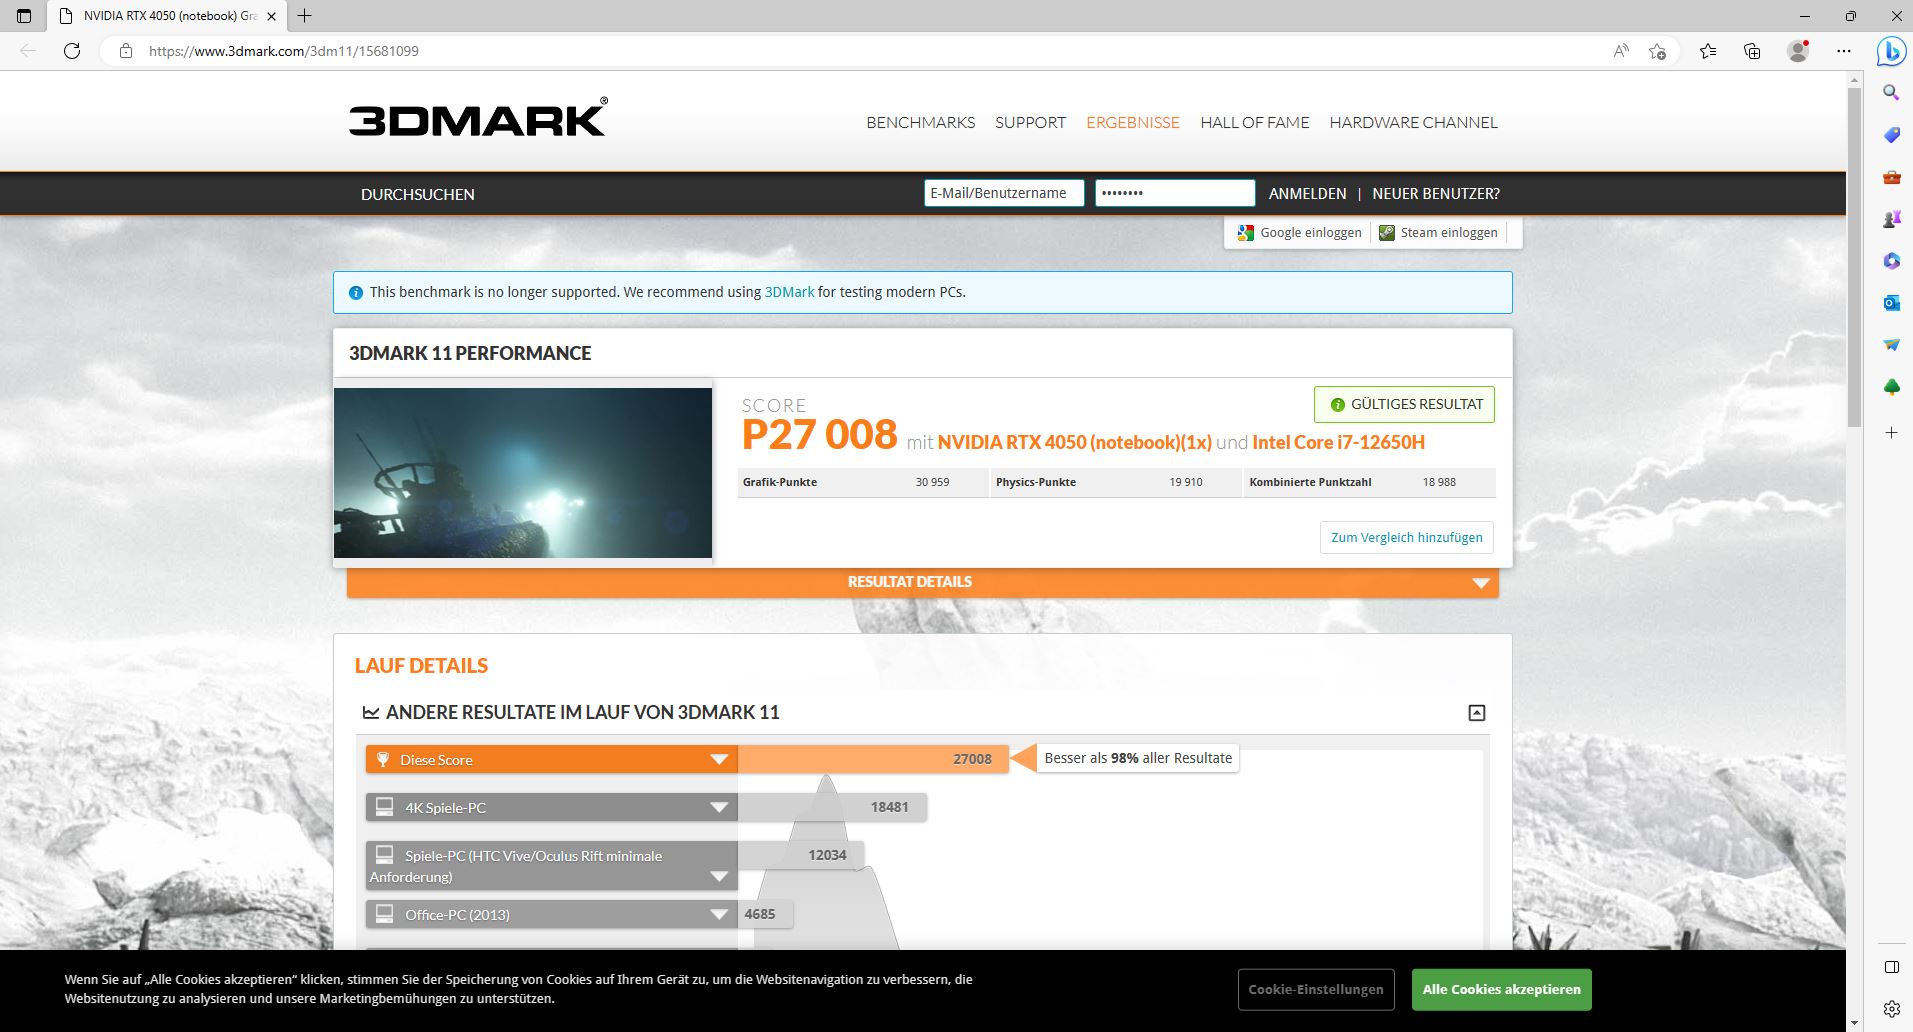
| 3DMark 11 Performance | 27008 poäng | |
| 3DMark Cloud Gate Standard Score | 56030 poäng | |
| 3DMark Fire Strike Score | 20110 poäng | |
| 3DMark Time Spy Score | 8726 poäng | |
Hjälp | ||
* ... mindre är bättre
Spelprestanda
I speljämförelserna tenderar Katana 15 att hamna på en lägre plats jämfört med den direkta konkurrensen. EndastXMG Core 15 med sin RTX 3060är något långsammare, medan Pulse GL66 med RTX 3060 är ungefär lika snabb. The Legion 5 i synnerhet, även den med RTX 3060, är märkbart snabbare.
I Far Cry 5 däremot ligger Katana till och med något före konkurrenterna. Det beror alltså också mycket på vilket spel du spelar.
| The Witcher 3 - 1920x1080 Ultra Graphics & Postprocessing (HBAO+) | |
| Genomsnitt av klass Gaming (104.7 - 240, n=7, senaste 2 åren) | |
| MSI Katana GF66 12UGS | |
| Asus TUF Gaming F15 FX507ZM | |
| Lenovo Legion 5 15IAH7H 82RB | |
| MSI Katana 15 B12VEK | |
| Schenker XMG Core 15 (M22) | |
| MSI Pulse GL66 12UEK | |
| GTA V - 1920x1080 Highest AA:4xMSAA + FX AF:16x | |
| Genomsnitt av klass Gaming (48.3 - 186.9, n=94, senaste 2 åren) | |
| Lenovo Legion 5 15IAH7H 82RB | |
| MSI Katana GF66 12UGS | |
| Asus TUF Gaming F15 FX507ZM | |
| Schenker XMG Core 15 (M22) | |
| MSI Katana 15 B12VEK | |
| Final Fantasy XV Benchmark - 1920x1080 High Quality | |
| Genomsnitt av klass Gaming (41 - 215, n=95, senaste 2 åren) | |
| Lenovo Legion 5 15IAH7H 82RB | |
| Asus TUF Gaming F15 FX507ZM | |
| Schenker XMG Core 15 (M22) | |
| MSI Katana GF66 12UGS | |
| MSI Katana 15 B12VEK | |
| Strange Brigade - 1920x1080 ultra AA:ultra AF:16 | |
| Genomsnitt av klass Gaming (76.3 - 458, n=87, senaste 2 åren) | |
| MSI Katana GF66 12UGS | |
| Lenovo Legion 5 15IAH7H 82RB | |
| Asus TUF Gaming F15 FX507ZM | |
| Schenker XMG Core 15 (M22) | |
| MSI Katana 15 B12VEK | |
| Dota 2 Reborn - 1920x1080 ultra (3/3) best looking | |
| Lenovo Legion 5 15IAH7H 82RB | |
| Genomsnitt av klass Gaming (84.8 - 248, n=107, senaste 2 åren) | |
| Asus TUF Gaming F15 FX507ZM | |
| MSI Pulse GL66 12UEK | |
| MSI Katana 15 B12VEK | |
| MSI Katana GF66 12UGS | |
| Schenker XMG Core 15 (M22) | |
Det finns en MUX-omkopplare som gör att du kan välja antingen iGPU eller dGPU i MSI Center, vilket alltid innebär en omstart.
Bildfrekvensen på Witcher 3 förblir stabil inom de vanliga svängningarna (dag/natt-cykel i spelet). Men konkurrerande bärbara datorer är ofta något snabbare, även de med RTX 3060.
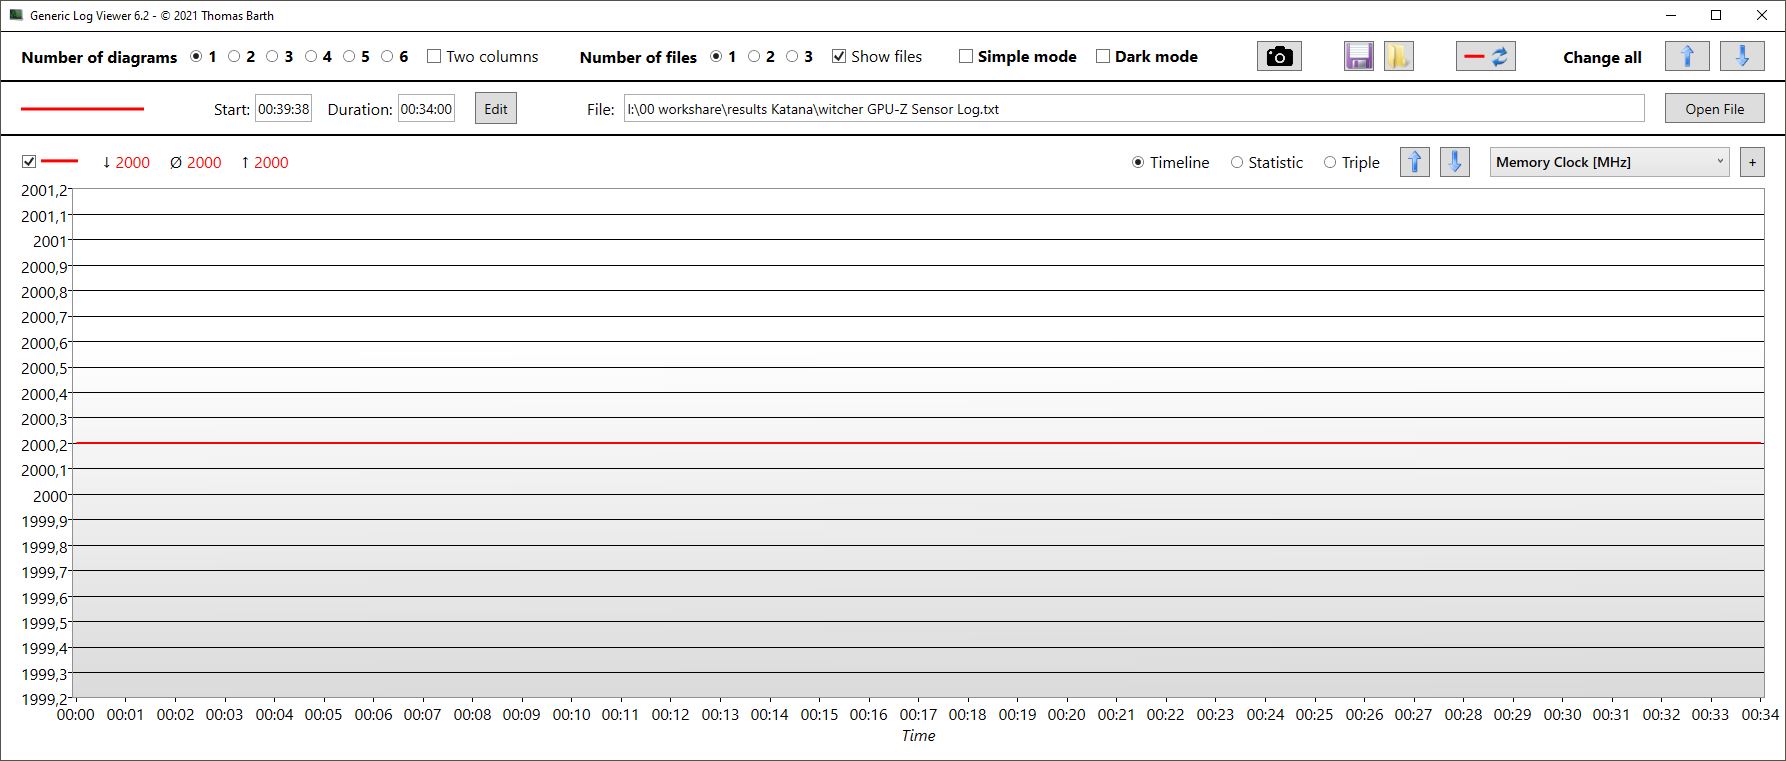
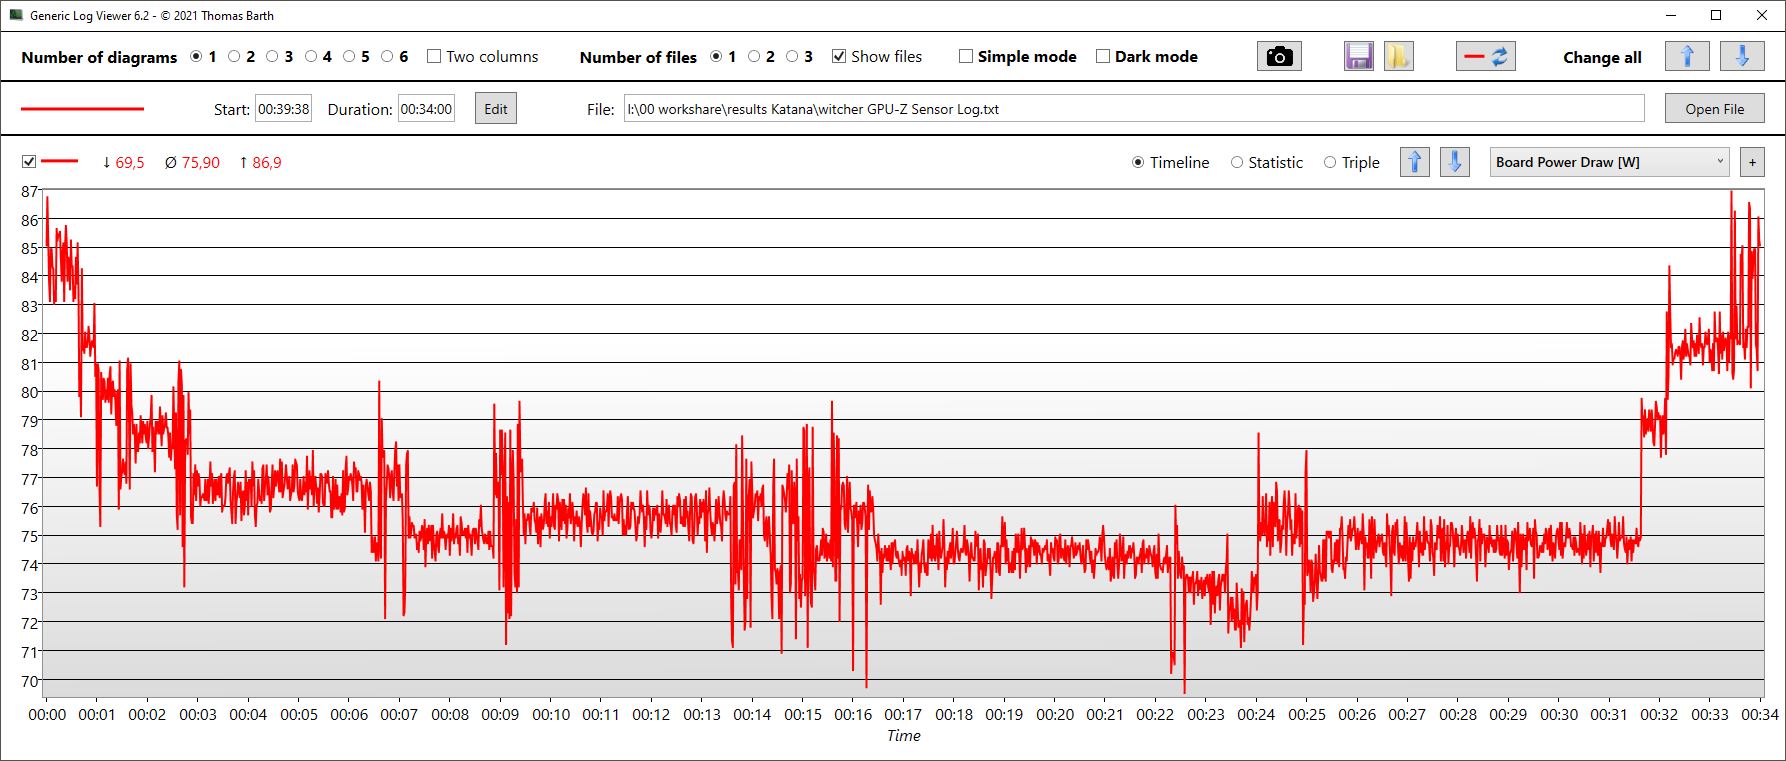
GPU-klockfrekvensen är ganska stabil på 2,4 GHz, och minnesklockan är också konstant på 2 GHz. GPU-temperaturerna överstiger inte 76 °C och ligger i genomsnitt runt 75 °C. Strömförbrukningen på 76 W i genomsnitt är långt ifrån de angivna 105 W.
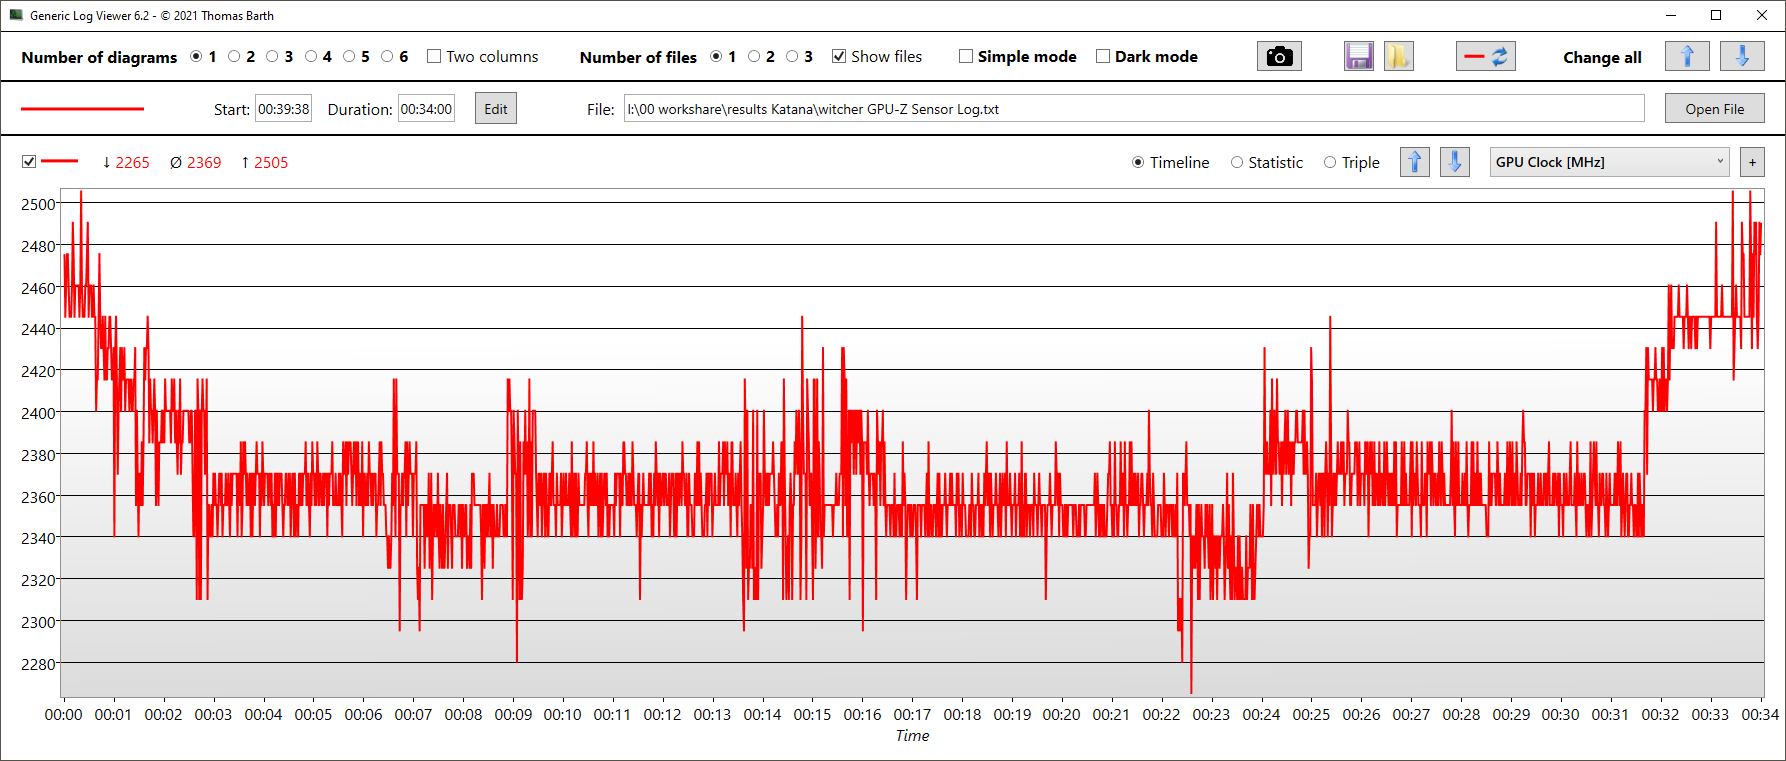
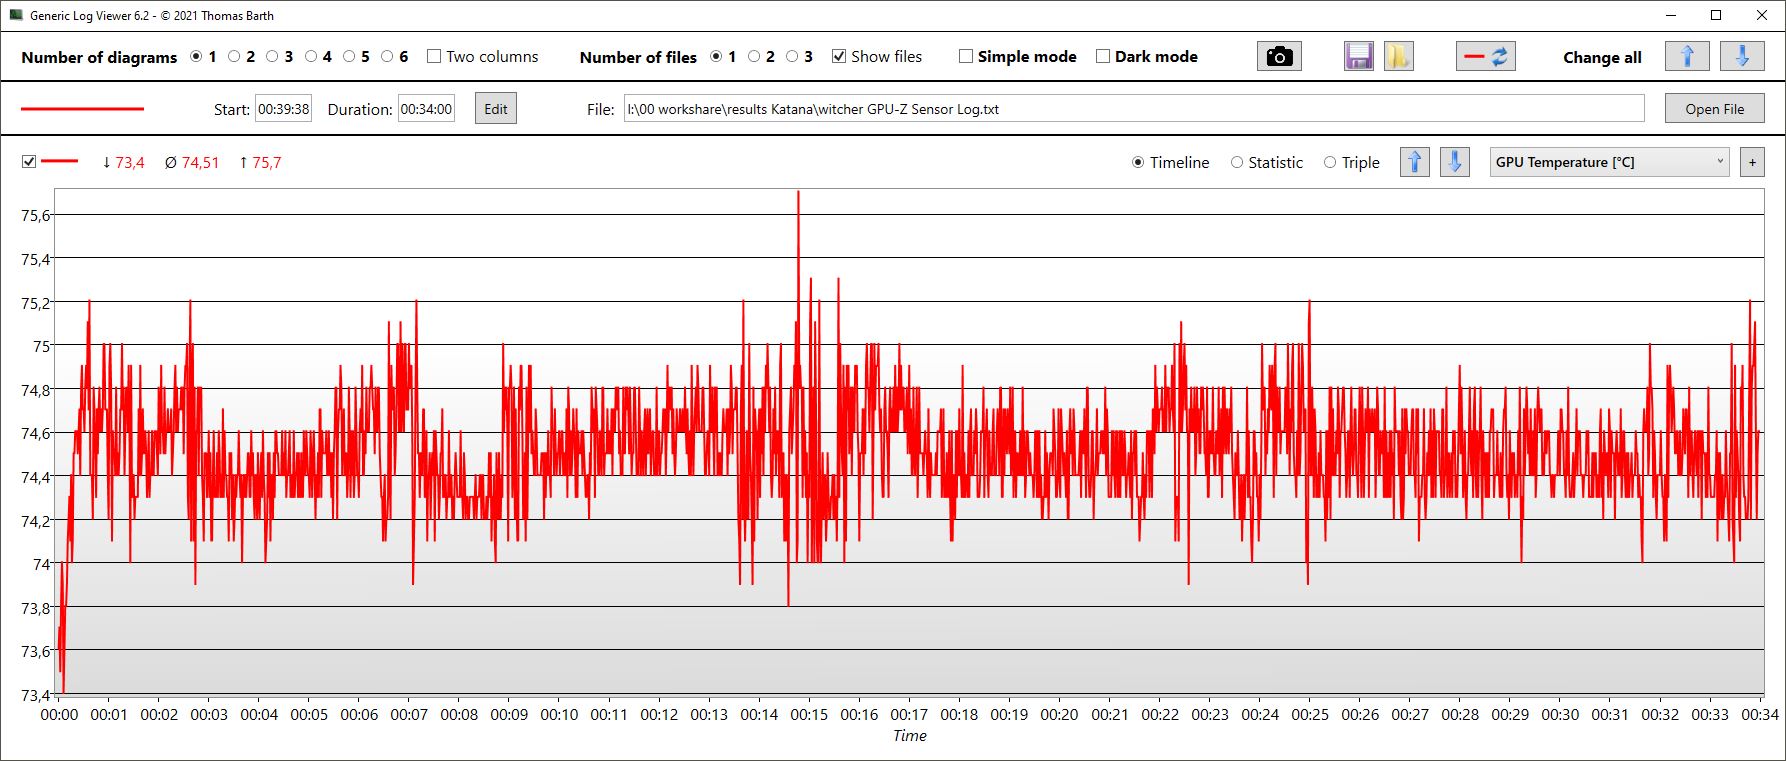
Witcher 3 FPS Chart
| låg | med. | hög | ultra | |
|---|---|---|---|---|
| GTA V (2015) | 183.5 | 176.6 | 172.7 | 92.2 |
| The Witcher 3 (2015) | 395 | 293 | 161 | 83 |
| Dota 2 Reborn (2015) | 175.1 | 158.1 | 150.5 | 142.5 |
| Final Fantasy XV Benchmark (2018) | 188 | 120.7 | 82.8 | |
| X-Plane 11.11 (2018) | 139.9 | 122.4 | 97 | |
| Far Cry 5 (2018) | 170 | 135 | 126 | 119 |
| Strange Brigade (2018) | 214 | 173 | 148.7 | |
| Dying Light 2 (2022) | 122.1 | 75.2 | 62.4 |
Utsläpp - I lugnet ligger svärdets makt
Buller
Vid tomgång på skrivbordet är fläktarna oftast tysta, även i Extreme Performance-läget, vilket är ovanligt. Och även i 3DMark06 startar fläktarna relativt sent och når endast 37,7 dB i slutet av det första benchmark-scenariot. Endast Legion 5är tystare, den Asus TUF Gaming är lika tyst, medan systermodellerna och XMG Core är högre.
Den måttliga ljudutvecklingen är också tydlig i spel (AI-läge), och Katana blir bara högljudd vid kombinerad CPU/GPU-belastning.
Ljudnivå
| Låg belastning |
| 24 / 24 / 24 dB(A) |
| Hög belastning |
| 37.71 / 54.55 dB(A) |
 | ||
30 dB tyst 40 dB(A) hörbar 50 dB(A) högt ljud |
||
min: | ||
| MSI Katana 15 B12VEK GeForce RTX 4050 Laptop GPU, i7-12650H, Micron 2400 MTFDKBA1T0QFM | MSI Katana GF66 12UGS GeForce RTX 3070 Ti Laptop GPU, i7-12700H, Micron 2450 1TB MTFDKBA1T0TFK | MSI Pulse GL66 12UEK GeForce RTX 3060 Laptop GPU, i9-12900H, Micron 2450 512GB MTFDKBA512TFK | Lenovo Legion 5 15IAH7H 82RB GeForce RTX 3060 Laptop GPU, i7-12700H | Asus TUF Gaming F15 FX507ZM GeForce RTX 3060 Laptop GPU, i7-12700H, SK Hynix HFM001TD3JX013N | Schenker XMG Core 15 (M22) GeForce RTX 3060 Laptop GPU, R7 6800H, Samsung SSD 980 Pro 1TB MZ-V8P1T0BW | |
|---|---|---|---|---|---|---|
| Noise | -9% | -11% | 1% | -3% | -2% | |
| av / miljö * (dB) | 24 | 26 -8% | 23 4% | 23.3 3% | 23.2 3% | 23 4% |
| Idle Minimum * (dB) | 24 | 27 -13% | 23 4% | 23.5 2% | 23.6 2% | 23 4% |
| Idle Average * (dB) | 24 | 28 -17% | 27 -13% | 23.5 2% | 23.6 2% | 23 4% |
| Idle Maximum * (dB) | 24 | 31 -29% | 27 -13% | 26.8 -12% | 25.4 -6% | 23 4% |
| Load Average * (dB) | 37.71 | 44 -17% | 48.2 -28% | 29.3 22% | 38 -1% | 42.41 -12% |
| Witcher 3 ultra * (dB) | 45.75 | 44 4% | 56.9 -24% | 51.4 -12% | 54.1 -18% | 54.71 -20% |
| Load Maximum * (dB) | 54.55 | 45 18% | 56.94 -4% | 53 3% | 57.2 -5% | 55.05 -1% |
* ... mindre är bättre
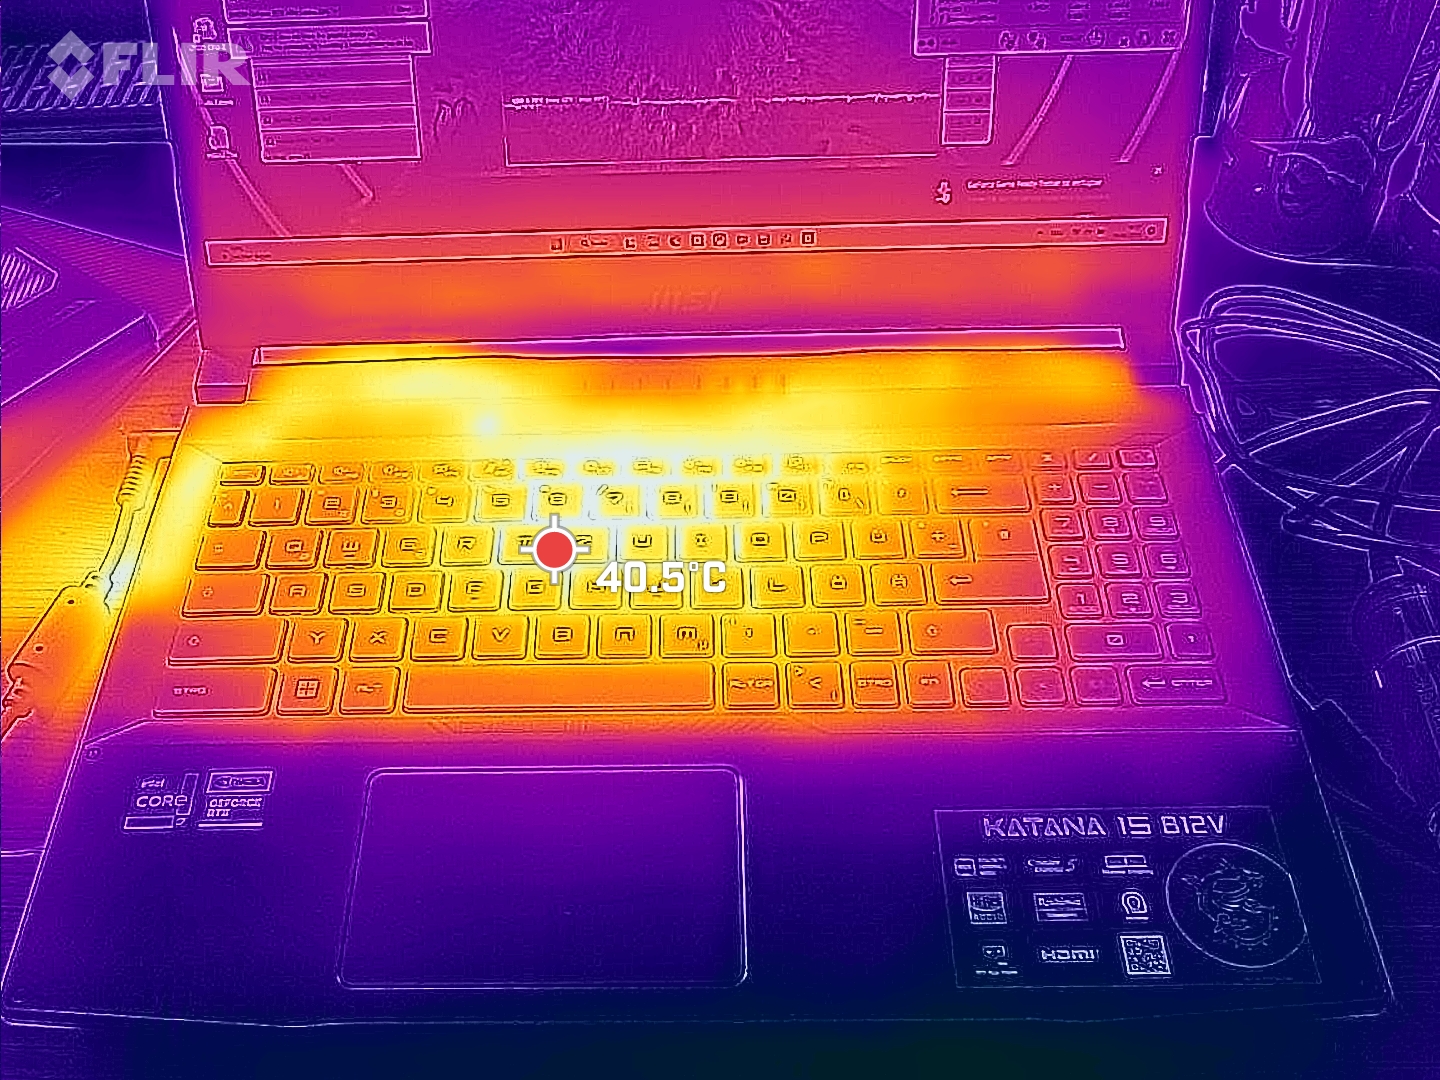
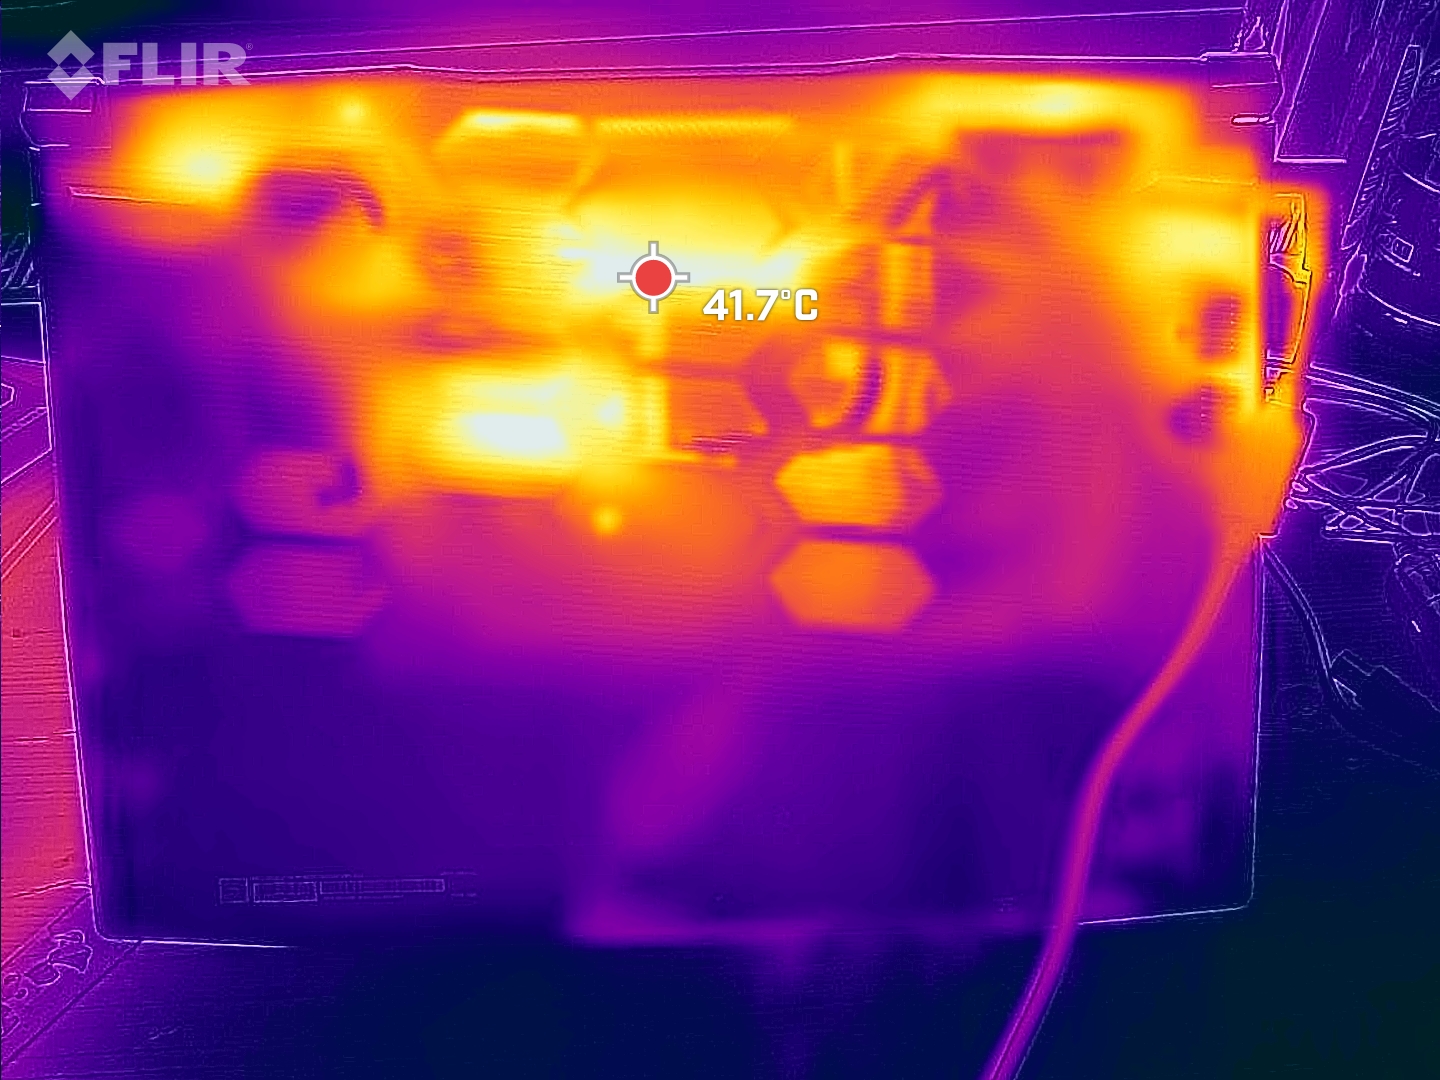
Temperatur
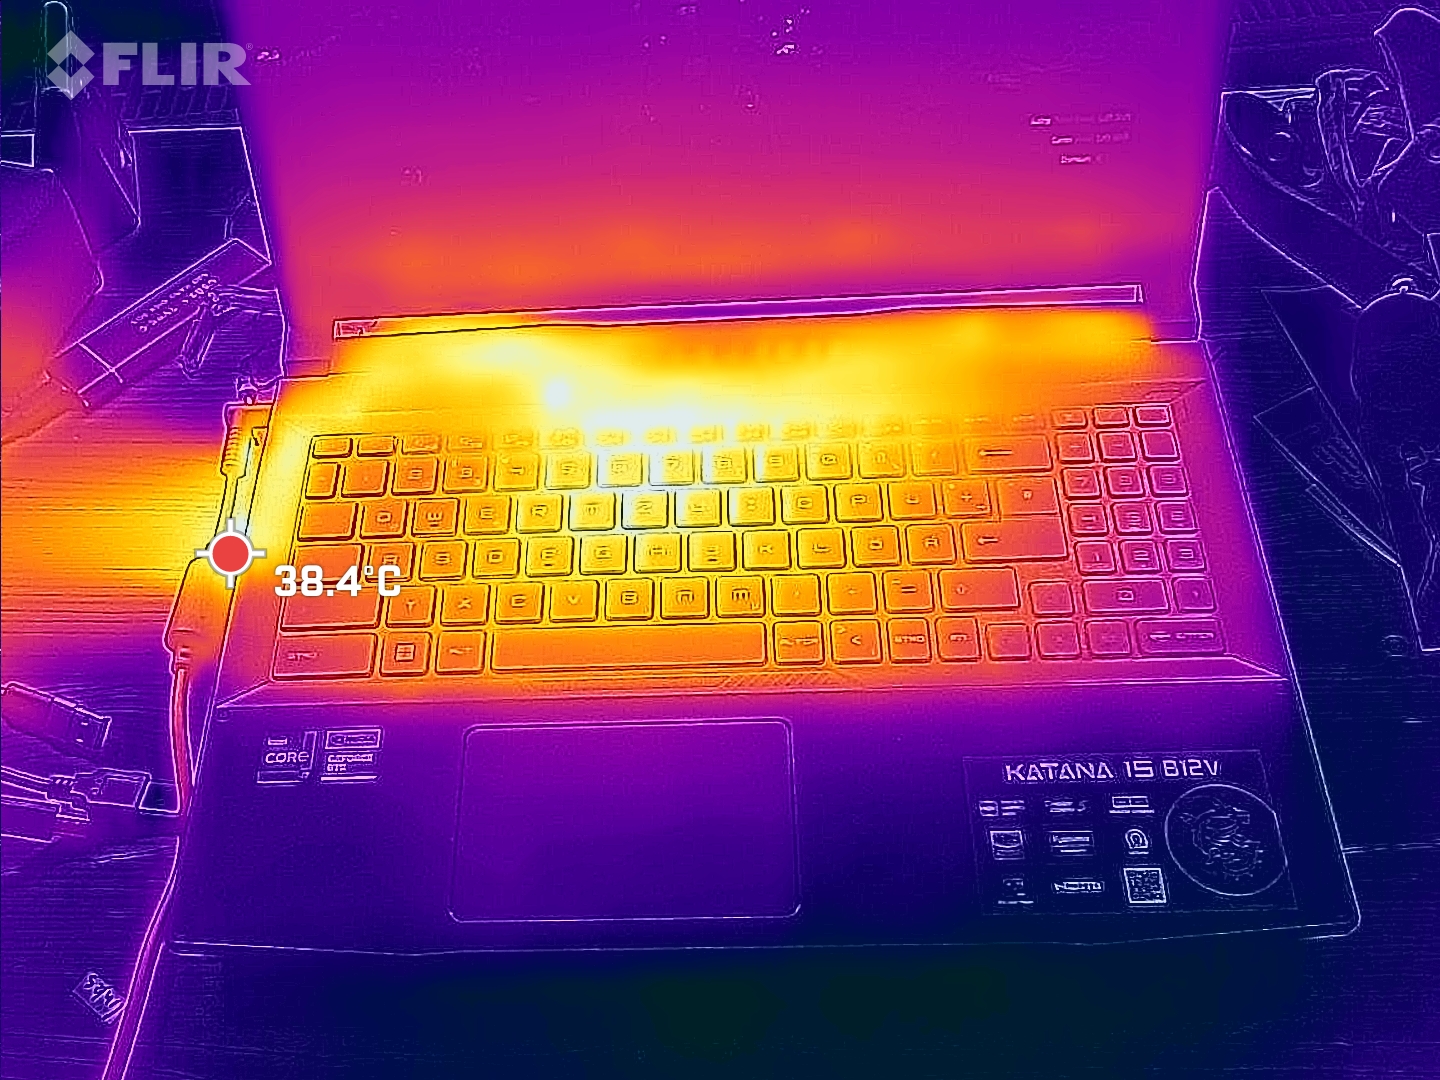
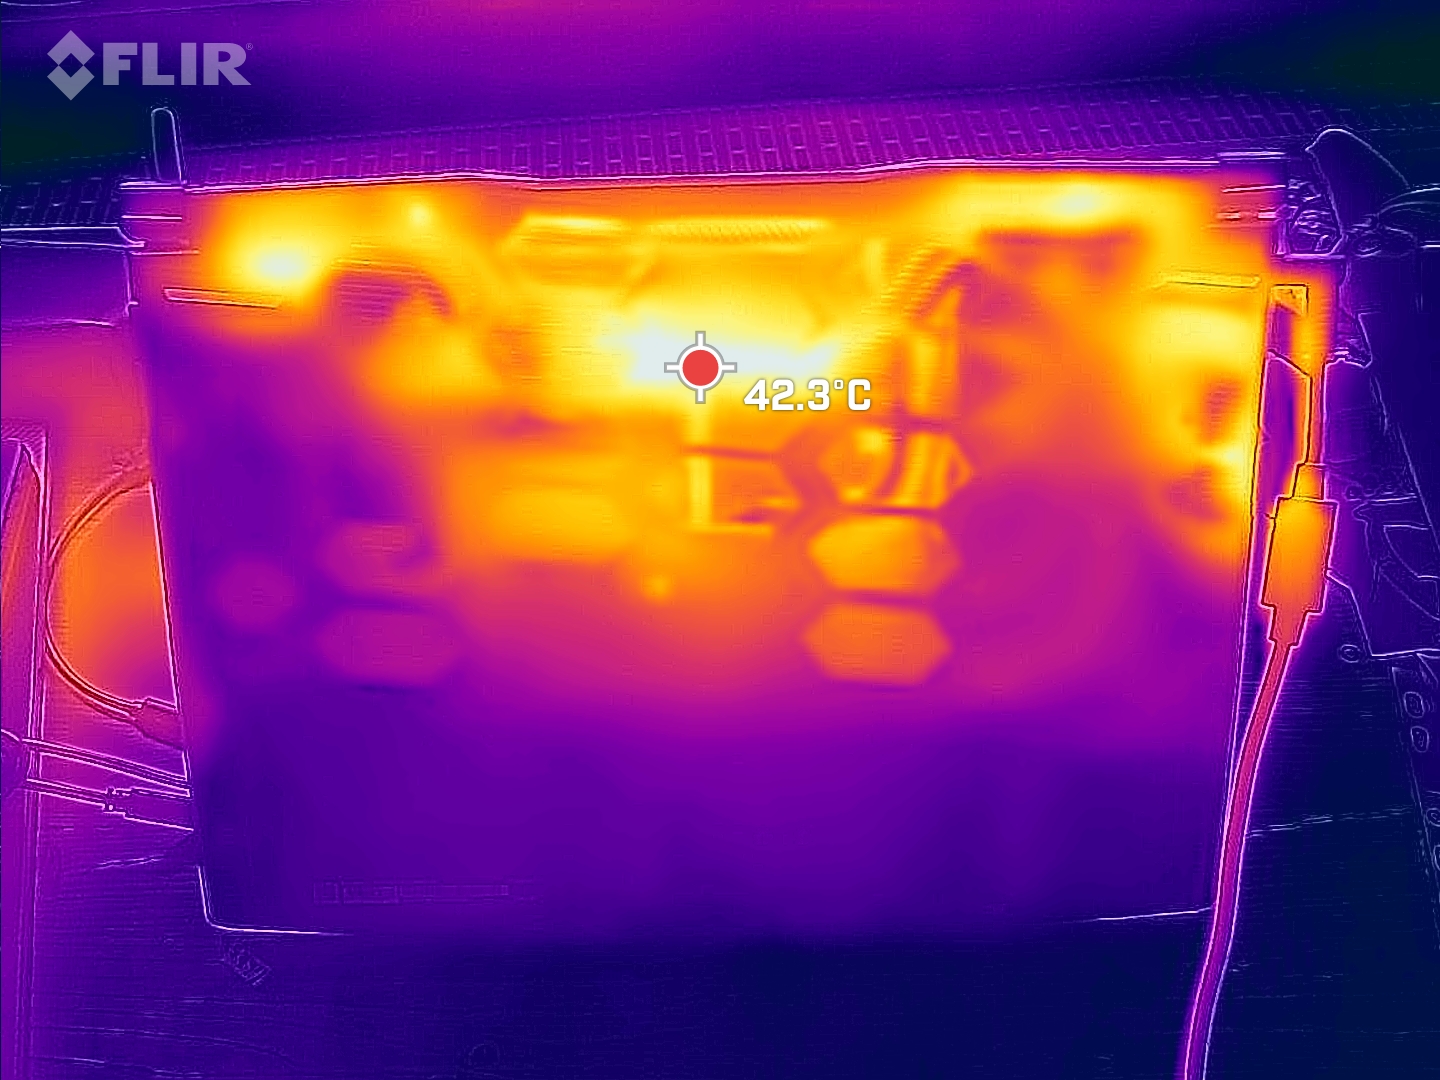
De heta punkterna ligger strax under 50 °C i mitten mot baksidan. Handflatorna förblir svala hela tiden, men WASD-tangenterna kan hetta upp lite obehagligt vid kraftig belastning.
(-) Den maximala temperaturen på ovansidan är 47 °C / 117 F, jämfört med genomsnittet av 40.4 °C / 105 F , allt från 21.2 till 68.8 °C för klassen Gaming.
(-) Botten värms upp till maximalt 48 °C / 118 F, jämfört med genomsnittet av 43.2 °C / 110 F
(+) Vid tomgångsbruk är medeltemperaturen för ovansidan 29 °C / 84 F, jämfört med enhetsgenomsnittet på 33.9 °C / ### class_avg_f### F.
(±) När du spelar The Witcher 3 är medeltemperaturen för ovansidan 35 °C / 95 F, jämfört med enhetsgenomsnittet på 33.9 °C / ## #class_avg_f### F.
(+) Handledsstöden och pekplattan är kallare än hudtemperaturen med maximalt 23 °C / 73.4 F och är därför svala att ta på.
(+) Medeltemperaturen för handledsstödsområdet på liknande enheter var 28.8 °C / 83.8 F (+5.8 °C / 10.4 F).
| MSI Katana 15 B12VEK Intel Core i7-12650H, NVIDIA GeForce RTX 4050 Laptop GPU | MSI Katana GF66 12UGS Intel Core i7-12700H, NVIDIA GeForce RTX 3070 Ti Laptop GPU | MSI Pulse GL66 12UEK Intel Core i9-12900H, NVIDIA GeForce RTX 3060 Laptop GPU | Lenovo Legion 5 15IAH7H 82RB Intel Core i7-12700H, NVIDIA GeForce RTX 3060 Laptop GPU | Asus TUF Gaming F15 FX507ZM Intel Core i7-12700H, NVIDIA GeForce RTX 3060 Laptop GPU | Schenker XMG Core 15 (M22) AMD Ryzen 7 6800H, NVIDIA GeForce RTX 3060 Laptop GPU | |
|---|---|---|---|---|---|---|
| Heat | -17% | -2% | 16% | -2% | 6% | |
| Maximum Upper Side * (°C) | 47 | 61 -30% | 50 -6% | 37.8 20% | 44.4 6% | 48 -2% |
| Maximum Bottom * (°C) | 48 | 55 -15% | 47 2% | 51 -6% | 48.8 -2% | 51 -6% |
| Idle Upper Side * (°C) | 35 | 43 -23% | 36 -3% | 25.8 26% | 37.8 -8% | 28 20% |
| Idle Bottom * (°C) | 38 | 38 -0% | 38 -0% | 28.8 24% | 39.6 -4% | 33 13% |
* ... mindre är bättre
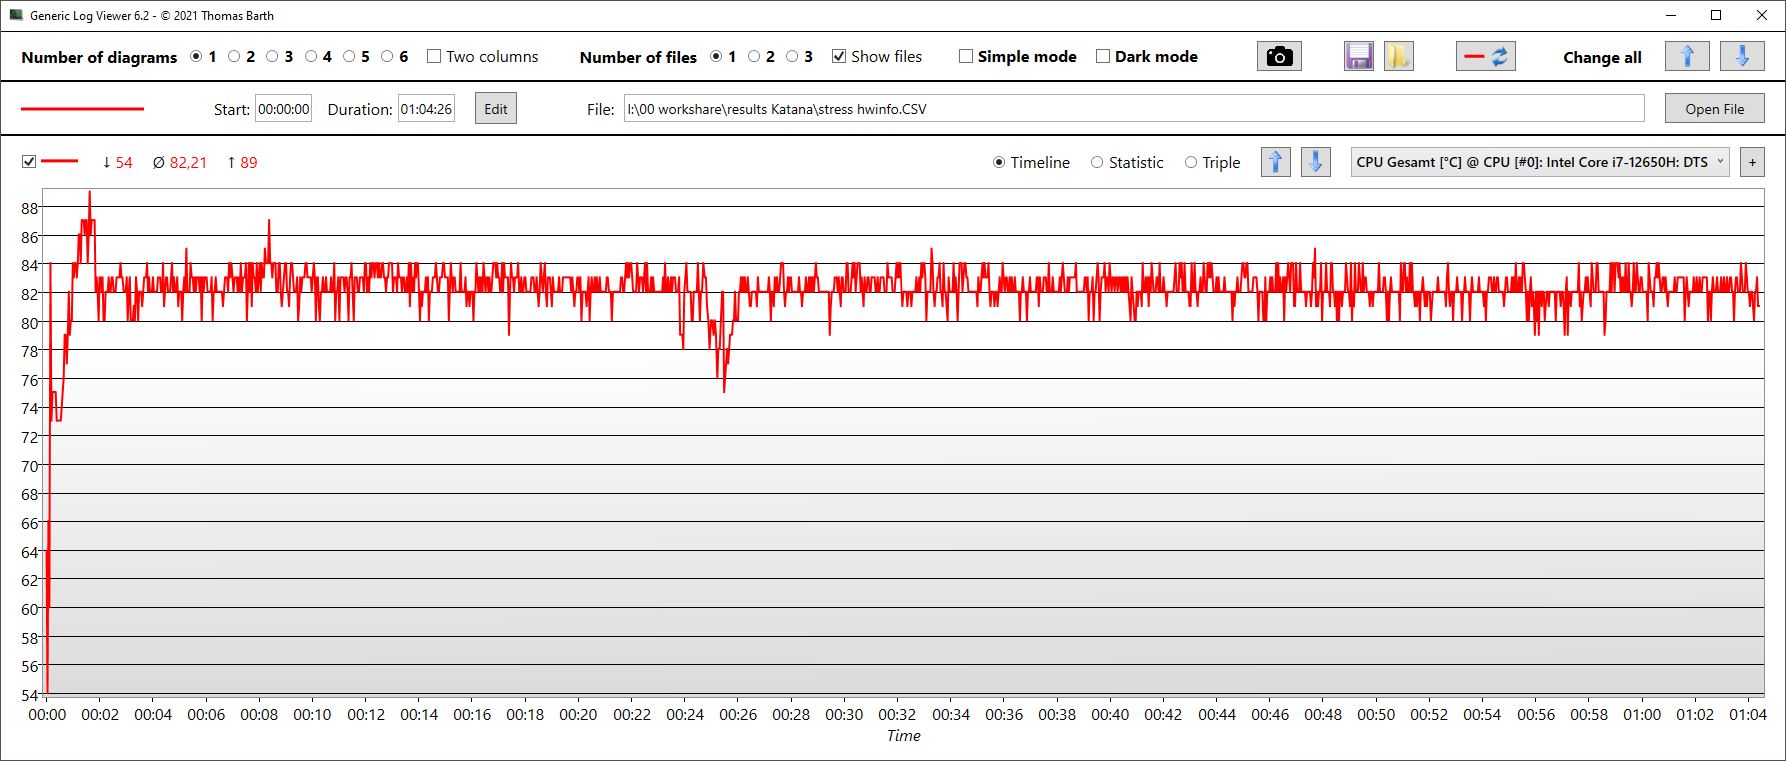
Stresstest
Kärnorna börjar vårt stresstest på 3,1 GHz mycket kortvarigt. Efter några sekunder stiger kärntemperaturen till 89 °C, varefter klockfrekvenserna sjunker och når i genomsnitt stabila 2,5 GHz. Strömförbrukningen är i genomsnitt 50 W. Temperaturerna stabiliseras vid cirka 82 °C
GPU-klockan fluktuerar mellan 2 och 2,5 GHz. Genomsnittstemperaturer på 75 °C uppnås, medan strömförbrukningen endast är cirka 62 W.
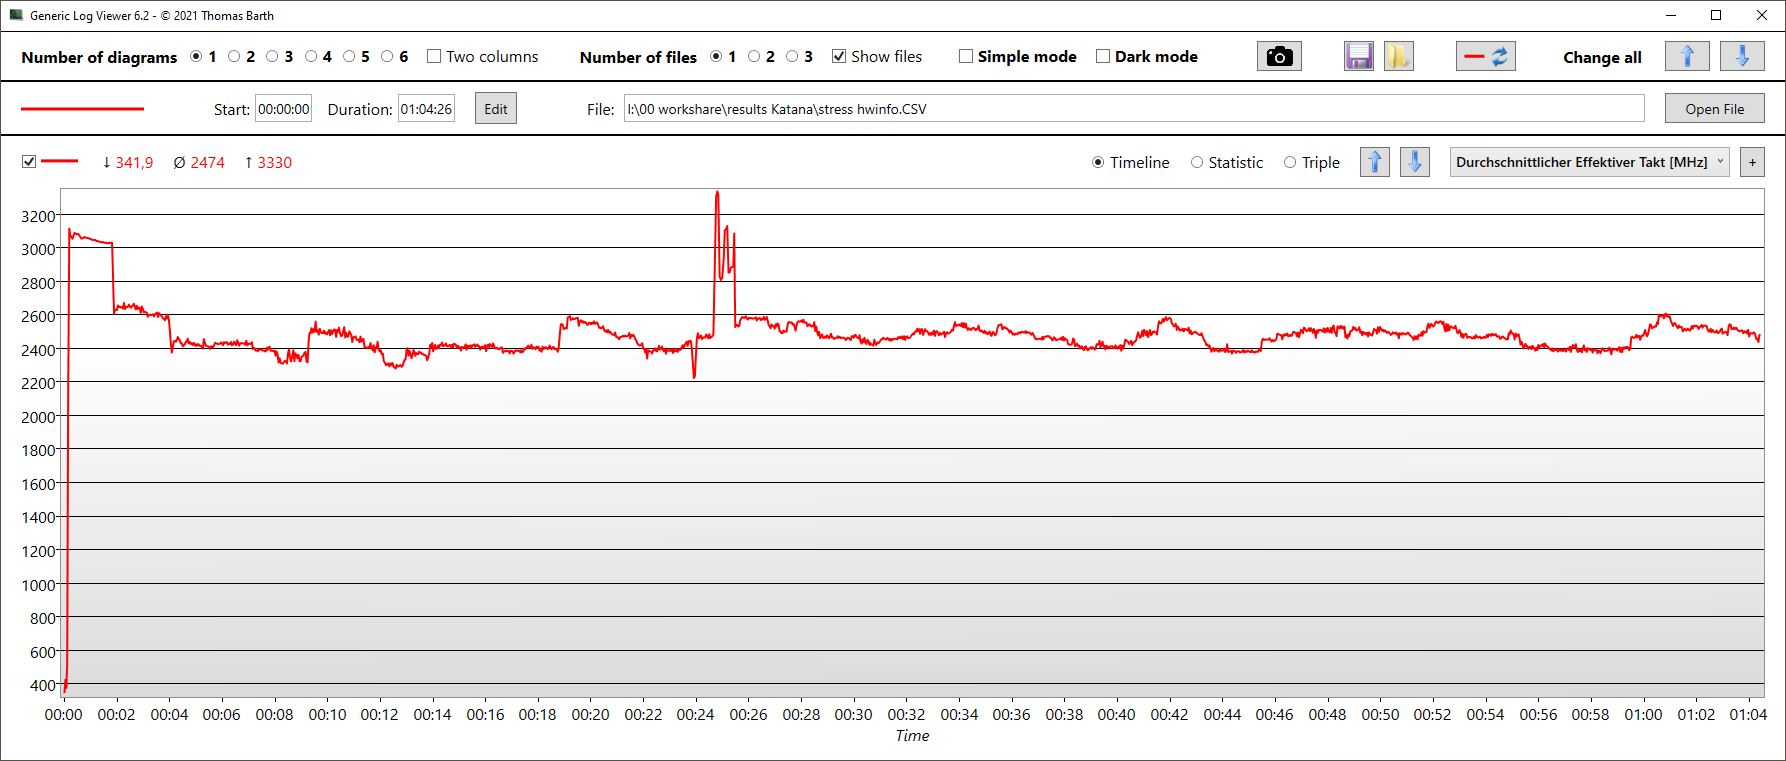
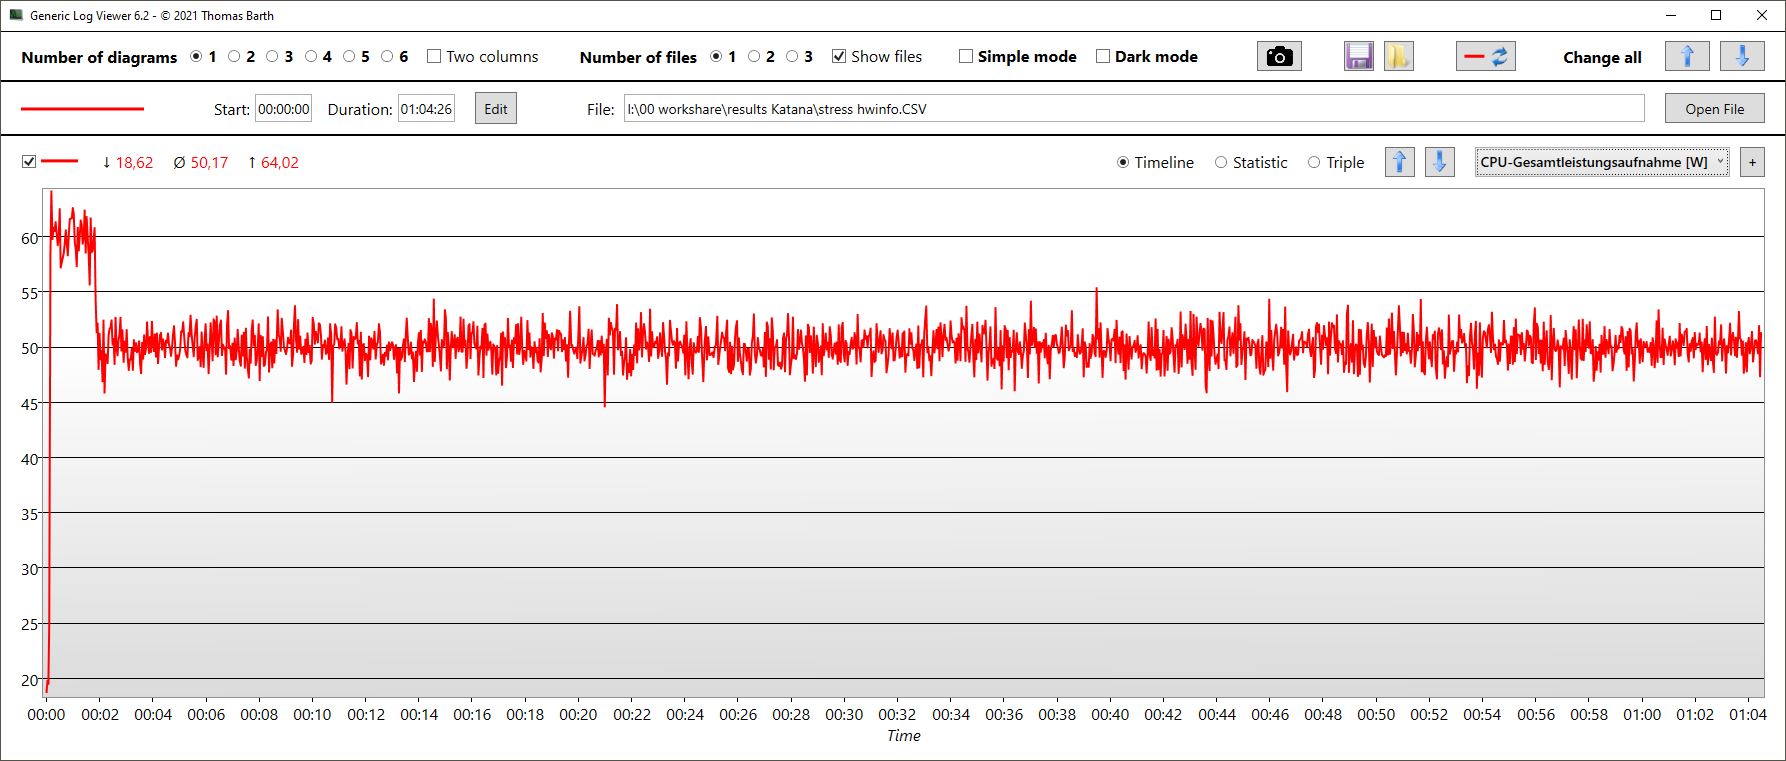
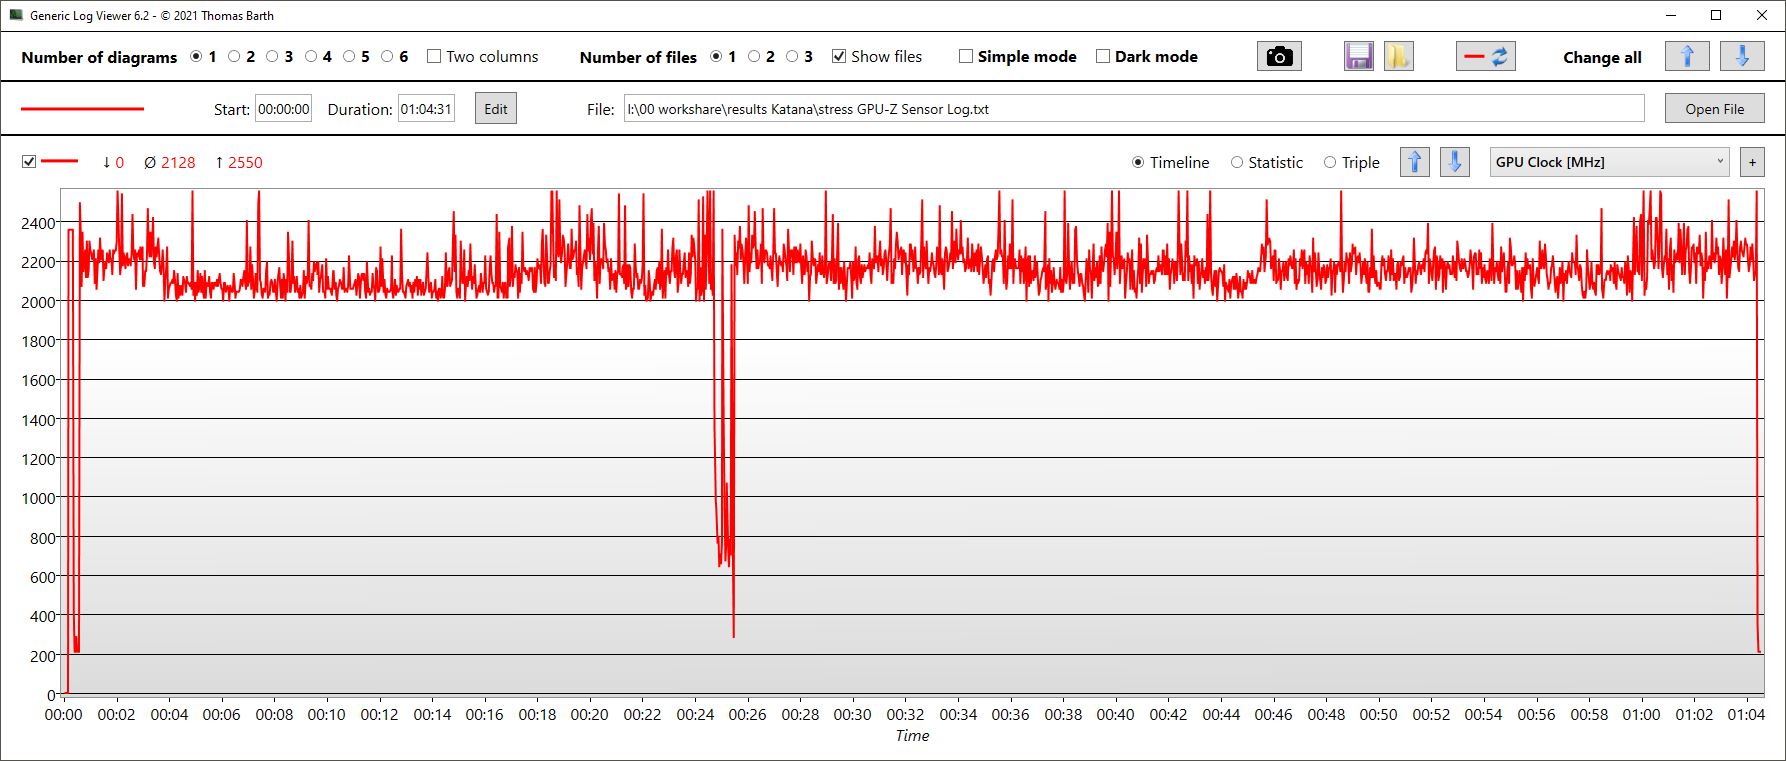
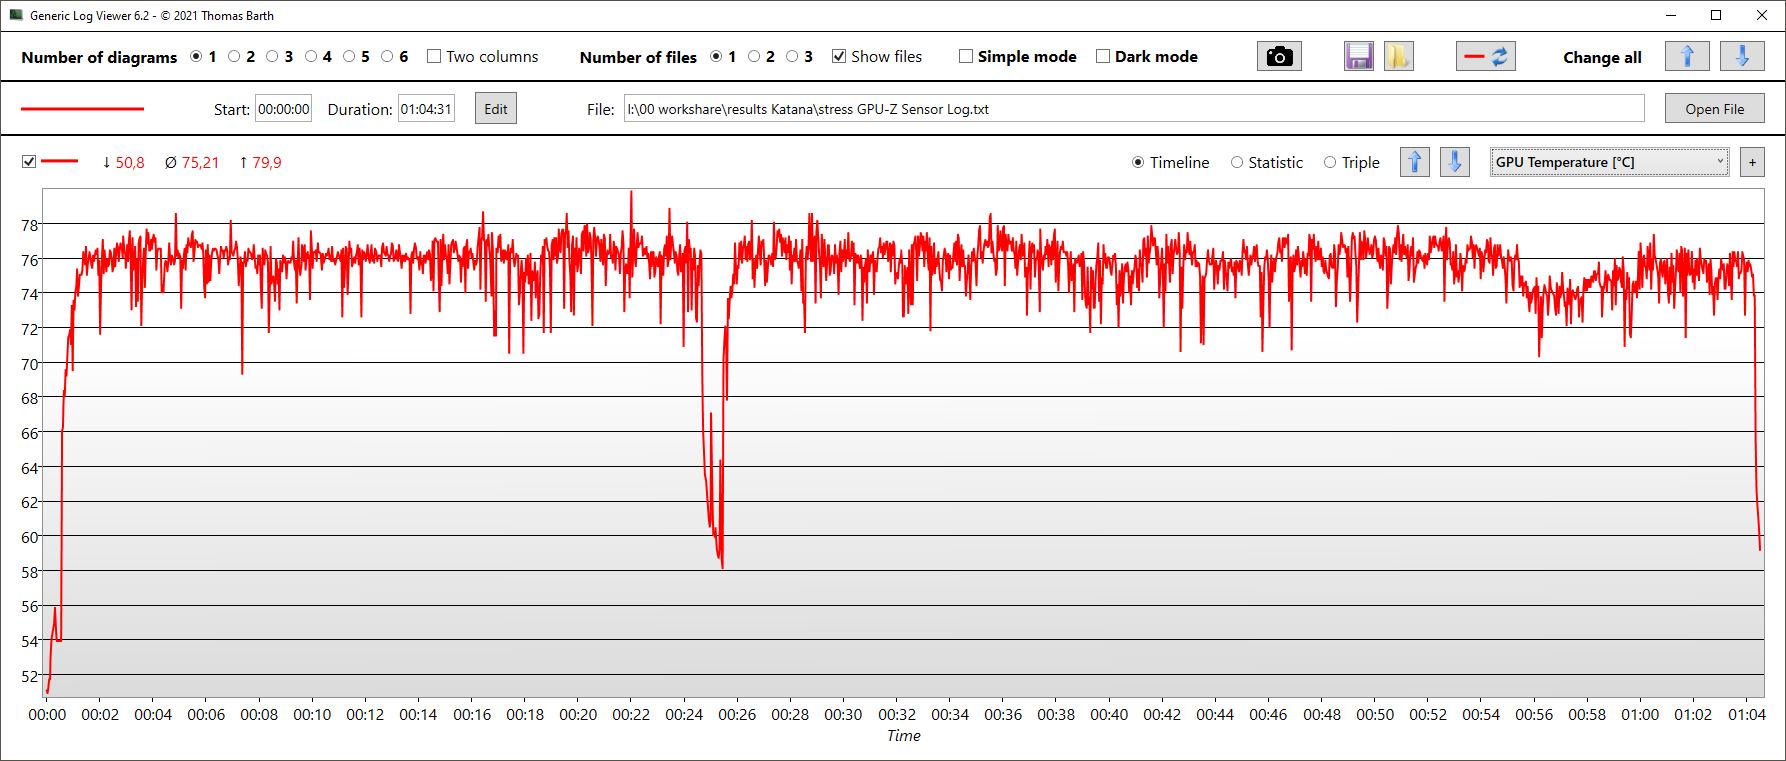
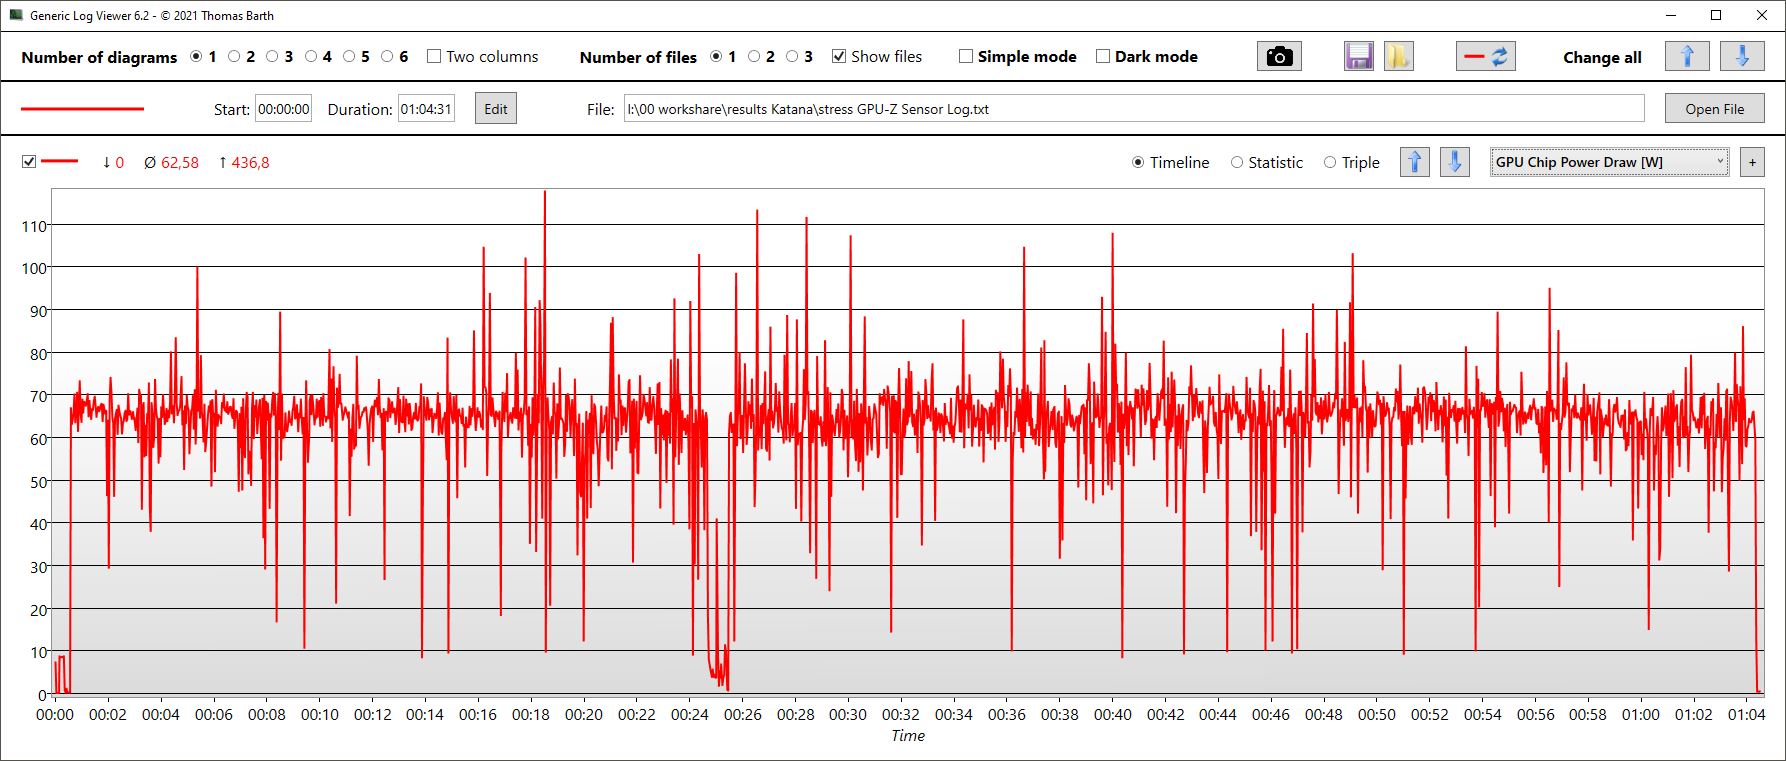
| CPU-klocka (GHz) | GPU-klocka (MHz) | Genomsnittlig CPU-temperatur (°C) | Genomsnittlig GPU-temperatur (°C) | |
| Prime95 + FurMark Stress | 2,5 | 2.121 | 82 | 75 |
| Witcher 3 Stress | 0,6 | 2,400 | 75 | 75 |
Högtalare
Stereohögtalarna erbjuder balanserade mellan- och högljudda ljud, men knappt någon bas och högst medelhög volym. Hörlursuttaget är perfekt för analoga enheter.
MSI Katana 15 B12VEK ljudanalys
(±) | högtalarljudstyrkan är genomsnittlig men bra (75.69 dB)
Bas 100 - 315 Hz
(-) | nästan ingen bas - i genomsnitt 21.5% lägre än medianen
(±) | linjäriteten för basen är genomsnittlig (8.8% delta till föregående frekvens)
Mellan 400 - 2000 Hz
(+) | balanserad mellan - endast 4.1% från medianen
(+) | mids är linjära (4.8% delta till föregående frekvens)
Högsta 2 - 16 kHz
(+) | balanserade toppar - endast 2.3% från medianen
(+) | toppar är linjära (4% delta till föregående frekvens)
Totalt 100 - 16 000 Hz
(±) | linjäriteten för det totala ljudet är genomsnittlig (17.3% skillnad mot median)
Jämfört med samma klass
» 47% av alla testade enheter i den här klassen var bättre, 12% liknande, 41% sämre
» Den bästa hade ett delta på 6%, genomsnittet var 18%, sämst var 132%
Jämfört med alla testade enheter
» 32% av alla testade enheter var bättre, 8% liknande, 59% sämre
» Den bästa hade ett delta på 4%, genomsnittet var 23%, sämst var 134%
Lenovo Legion 5 15IAH7H 82RB ljudanalys
(+) | högtalare kan spela relativt högt (83.3 dB)
Bas 100 - 315 Hz
(-) | nästan ingen bas - i genomsnitt 28.2% lägre än medianen
(±) | linjäriteten för basen är genomsnittlig (12.9% delta till föregående frekvens)
Mellan 400 - 2000 Hz
(±) | högre mellan - i genomsnitt 5.7% högre än median
(±) | linjäriteten för mids är genomsnittlig (7.4% delta till föregående frekvens)
Högsta 2 - 16 kHz
(+) | balanserade toppar - endast 3.3% från medianen
(+) | toppar är linjära (6.4% delta till föregående frekvens)
Totalt 100 - 16 000 Hz
(±) | linjäriteten för det totala ljudet är genomsnittlig (23.6% skillnad mot median)
Jämfört med samma klass
» 86% av alla testade enheter i den här klassen var bättre, 4% liknande, 10% sämre
» Den bästa hade ett delta på 6%, genomsnittet var 18%, sämst var 132%
Jämfört med alla testade enheter
» 71% av alla testade enheter var bättre, 6% liknande, 23% sämre
» Den bästa hade ett delta på 4%, genomsnittet var 23%, sämst var 134%
Energihantering - Effektivt RTX 4050 i MSI Katana
Effektförbrukning
När det gäller strömförbrukning är den nya Katana 15 mer sparsam än konkurrenterna med en GPU av den senaste generationen. Vår testmodell har bra hastigheter när den går på tomgång, och förblir så även när den spelar eller är hårt belastad. Även om 3D-prestandan också är något lägre är skillnaden i förbrukning mycket större än skillnaden i prestanda.
Till exempel förbrukar både Legion 5 och XMG Core 15 upp till Asus TUF Gaming F15 nästan 50 procent mer när de spelar med Witcher 3 än vår Katana 15! Men Katana GF66 med sitt RTX 3070 Ti förbrukar också bara 16 procent mer vid spel.
Vi uppmätte en kortsiktig maximal förbrukning på upp till 189 W. Chicony-standardnätdelen, som är konstruerad för 240 W, bör kunna hantera detta mycket väl.
| Av/Standby | |
| Låg belastning | |
| Hög belastning |
|
Förklaring:
min: | |
| MSI Katana 15 B12VEK i7-12650H, GeForce RTX 4050 Laptop GPU, Micron 2400 MTFDKBA1T0QFM, IPS, 1920x1080, 15.6" | MSI Katana GF66 12UGS i7-12700H, GeForce RTX 3070 Ti Laptop GPU, Micron 2450 1TB MTFDKBA1T0TFK, IPS, 1920x1080, 15.6" | MSI Pulse GL66 12UEK i9-12900H, GeForce RTX 3060 Laptop GPU, Micron 2450 512GB MTFDKBA512TFK, IPS, 1920x1080, 15.6" | Lenovo Legion 5 15IAH7H 82RB i7-12700H, GeForce RTX 3060 Laptop GPU, , IPS, 1920x1080, 15.6" | Asus TUF Gaming F15 FX507ZM i7-12700H, GeForce RTX 3060 Laptop GPU, SK Hynix HFM001TD3JX013N, IPS, 1920x1080, 15.6" | Schenker XMG Core 15 (M22) R7 6800H, GeForce RTX 3060 Laptop GPU, Samsung SSD 980 Pro 1TB MZ-V8P1T0BW, IPS, 2560x1440, 15.6" | Genomsnitt NVIDIA GeForce RTX 4050 Laptop GPU | Genomsnitt av klass Gaming | |
|---|---|---|---|---|---|---|---|---|
| Power Consumption | -26% | -6% | -121% | -34% | -34% | -30% | -65% | |
| Idle Minimum * (Watt) | 8.5 | 9 -6% | 7 18% | 19.8 -133% | 6.3 26% | 11.8 -39% | 9.95 ? -17% | 13 ? -53% |
| Idle Average * (Watt) | 10.2 | 13 -27% | 13 -27% | 26.2 -157% | 9.8 4% | 14.7 -44% | 15.8 ? -55% | 19 ? -86% |
| Idle Maximum * (Watt) | 11.3 | 20 -77% | 13.7 -21% | 48.2 -327% | 26.5 -135% | 15 -33% | 20.1 ? -78% | 24.6 ? -118% |
| Load Average * (Watt) | 84 | 100 -19% | 48.4 42% | 102.9 -23% | 103.8 -24% | 100 -19% | 88 ? -5% | 110.7 ? -32% |
| Witcher 3 ultra * (Watt) | 128 | 149 -16% | 148 -16% | 186.7 -46% | 189 -48% | 184 -44% | ||
| Load Maximum * (Watt) | 189 | 212 -12% | 244 -29% | 268 -42% | 241.9 -28% | 237 -25% | 176.3 ? 7% | 259 ? -37% |
* ... mindre är bättre
Power Consumption Witcher 3 / Stresstest
Power Consumption with an External Monitor
Batteritid
Var annars sparar bärbara datorer med budgetpris pengar? Just det, batteriet. Modellen i Katana 15 har bara 53 Wh, vilket är standard i Katana eller Pulse. Resten av konkurrenterna har batterier som sträcker sig från 62 till 90 Wh. Följaktligen är löptiderna ganska mediokra, trots den jämförelsevis goda energieffektiviteten.
En filmkväll kan planeras för cirka 4 timmar och 20 minuter. Vårt WLAN-test ger betydligt olika resultat, beroende på valt läge. I balanserat läge med maximal ljusstyrka (258 nits) räcker batteriet endast 2 timmar och 20 minuter. I Power Saver vid 150 nits mätte vi däremot ungefär samma tid som i videotestet.
| MSI Katana 15 B12VEK i7-12650H, GeForce RTX 4050 Laptop GPU, 53.5 Wh | MSI Katana GF66 12UGS i7-12700H, GeForce RTX 3070 Ti Laptop GPU, 52 Wh | MSI Pulse GL66 12UEK i9-12900H, GeForce RTX 3060 Laptop GPU, 53.5 Wh | Lenovo Legion 5 15IAH7H 82RB i7-12700H, GeForce RTX 3060 Laptop GPU, 80 Wh | Asus TUF Gaming F15 FX507ZM i7-12700H, GeForce RTX 3060 Laptop GPU, 90 Wh | Schenker XMG Core 15 (M22) R7 6800H, GeForce RTX 3060 Laptop GPU, 62 Wh | Genomsnitt av klass Gaming | |
|---|---|---|---|---|---|---|---|
| Batteridrifttid | -26% | 9% | -6% | -8% | 27% | 51% | |
| H.264 (h) | 4.4 | 4 -9% | 8.32 ? 89% | ||||
| WiFi v1.3 (h) | 4.3 | 2.4 -44% | 5 16% | 4.8 12% | 7.8 81% | 7.11 ? 65% | |
| Load (h) | 1.5 | 1.4 -7% | 1.9 27% | 1.1 -27% | 1.1 -27% | 1.1 -27% | 1.502 ? 0% |
| Reader / Idle (h) | 8.1 | 15.8 | 8.27 ? |
För
Emot
Bedömning - Budget RTX 4050 är fortfarande för dyrt

MSI Katana 15 B12 kombinerar en Gen12-processor med en RTX 4050vilket faktiskt inte är någon dålig idé för en budgetspelare. CPU:n är allt annat än dålig och GPU:n i Katana 15 visar sig vara betydligt effektivare än förra årets modeller.
Vår främsta kritikpunkt för budgetspelare är dock priset: Medan du kan få budgetlaptops med RTX 3060 från cirka 800 dollar betalar du här hela 1 499,99 dollar! Effektivitetsfördelarna med RTX 4050 motiverar inte denna prispremie. Ännu mer eftersom nästan alla andra komponenter i Katana 15 helt klart tillhör budgetklassen, allt från de delvis föråldrade portarna till den ganska mörka Full HD-skärmen och det jämförelsevis lilla batteriet. Till detta kommer det faktum att den bärbara datorns prestanda tenderar att hamna bakom de flesta RTX 3060-spelare och RTX 4050 missar klart sitt TGP-mål på 105.
MSI Katana 15 B12 kombinerar en bra CPU av sista generationen med ett aktuellt RTX 4050, men misslyckas med att sätta ett pris som är rimligt för de många budgetkomponenterna. I dagsläget är Katana 15 helt enkelt för dyrt.
Det finns trots allt gott om alternativ. Om du vill ha mer prestanda och färre budgetkomponenter till ett ännu lägre pris, är ditt bästa val Lenovo Legion 5 med sin RTX 3060. Men de flesta andra RTX 3060-spelare borde också vara billigare, bättre utrustade och oftast snabbare.
Pris och tillgänglighet
I MSI:s officiella webbutik US kostar Katana 15 B12VGK-082 1 499,99 dollar. Intresserade köpare (beroende på var de befinner sig) kan hitta samma modell till billigare priser på andra ställen hos återförsäljare som Amazon.
MSI Katana 15 B12VEK
- 03/28/2023 v7 (old)
Christian Hintze
Genomskinlighet
Valet av enheter som ska granskas görs av vår redaktion. Testprovet gavs till författaren som ett lån av tillverkaren eller återförsäljaren för denna recension. Långivaren hade inget inflytande på denna recension och inte heller fick tillverkaren en kopia av denna recension innan publiceringen. Det fanns ingen skyldighet att publicera denna recension. Som ett oberoende medieföretag är Notebookcheck inte föremål för auktoritet från tillverkare, återförsäljare eller förlag.
This is how Notebookcheck is testingEvery year, Notebookcheck independently reviews hundreds of laptops and smartphones using standardized procedures to ensure that all results are comparable. We have continuously developed our test methods for around 20 years and set industry standards in the process. In our test labs, high-quality measuring equipment is utilized by experienced technicians and editors. These tests involve a multi-stage validation process. Our complex rating system is based on hundreds of well-founded measurements and benchmarks, which maintains objectivity.
Price comparison

