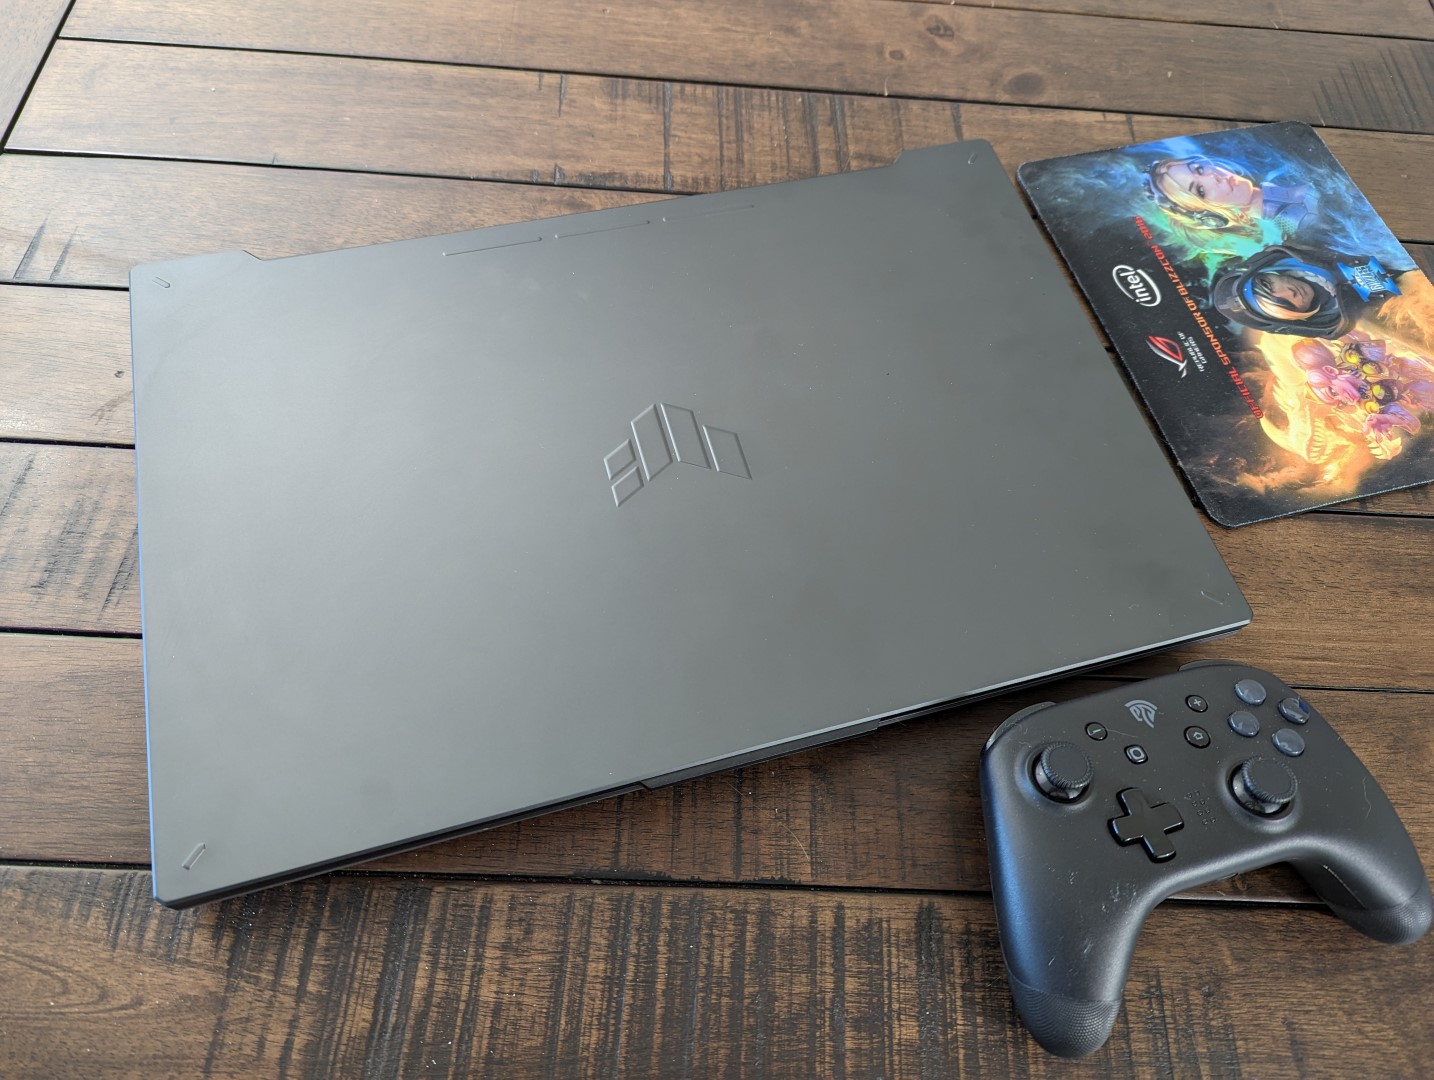
Asus TUF Gaming A17 FA707XI laptop recension: 140 W GeForce RTX 4070 för $1400

Asus TUF Gaming A17 FA707 är AMD-versionen av den Intel-baserade TUF Gaming F17 FX707. TUF-serien består av bärbara speldatorer i mellanklassen som kontrast till den dyrare och mer avancerade ROG-serien.
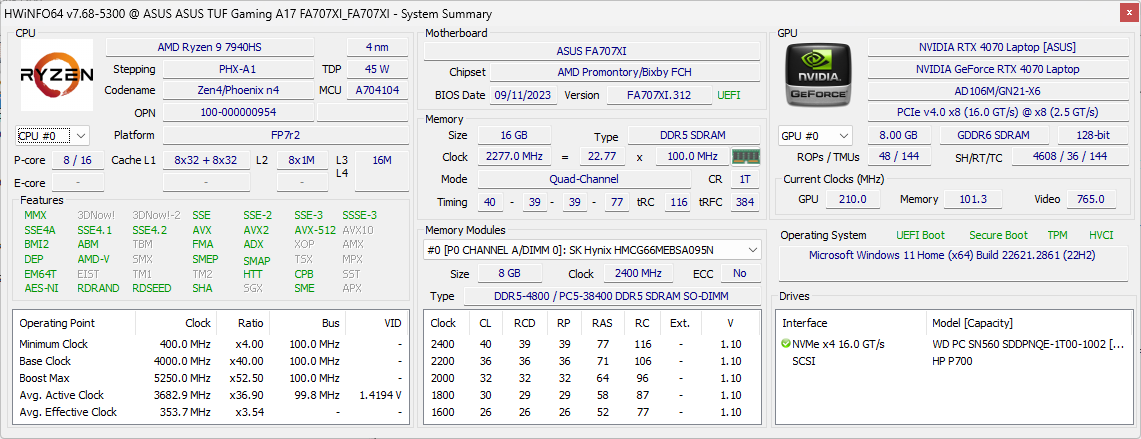
Vår konfiguration är den senaste SKU:n med Zen 4 Ryzen 9 7940HS CPU, 140 W GeForce RTX 4070 GPU och 1080p 144 Hz IPS-skärm för cirka 1400 USD i detaljhandel. Andra SKU:er av denna modell levereras med den långsammare Ryzen 7 7735HS, GeForce RTX 4050 eller 4060, eller 1440p-skärm med högre upplösning med ännu snabbare 240 Hz eller 360 Hz uppdateringsfrekvens.
Alternativ till TUF Gaming A17 inkluderar andra bärbara speldatorer i mellanklassen som MSI Pulse 17, HP Pavilion Gaming 17, Lenovo Legion 5-serieneller Acer Nitro 17-serien.
Fler recensioner av Asus:
Potentiella konkurrenter i jämförelse
Gradering | Datum | Modell | Vikt | Höjd | Storlek | Upplösning | Pris |
|---|---|---|---|---|---|---|---|
| 85.6 % v7 (old) | 01/2024 | Asus TUF Gaming A17 FA707XI-NS94 R9 7940HS, GeForce RTX 4070 Laptop GPU | 2.5 kg | 25.4 mm | 17.30" | 1920x1080 | |
| 84.1 % v7 (old) | 04/2022 | Asus TUF Gaming F17 FX707Z-HX011W i7-12700H, GeForce RTX 3060 Laptop GPU | 2.5 kg | 25 mm | 17.30" | 1920x1080 | |
| 86.3 % v7 (old) | 07/2023 | MSI Pulse 17 B13VGK i7-13700H, GeForce RTX 4070 Laptop GPU | 2.7 kg | 27.2 mm | 17.30" | 1920x1080 | |
| 82.1 % v7 (old) | 02/2023 | MSI Katana 17 B13VFK i7-13620H, GeForce RTX 4060 Laptop GPU | 2.8 kg | 25.2 mm | 17.30" | 1920x1080 | |
| 90.1 % v7 (old) | 05/2022 | Razer Blade 17 (i7-12800H, RTX 3070 Ti) i7-12800H, GeForce RTX 3070 Ti Laptop GPU | 2.8 kg | 19.9 mm | 17.30" | 2560x1440 | |
| 82.7 % v7 (old) | 09/2022 | HP Pavilion Gaming 17-cd2146ng i5-11300H, GeForce RTX 3050 Ti Laptop GPU | 2.8 kg | 25 mm | 17.30" | 1920x1080 |
Fall
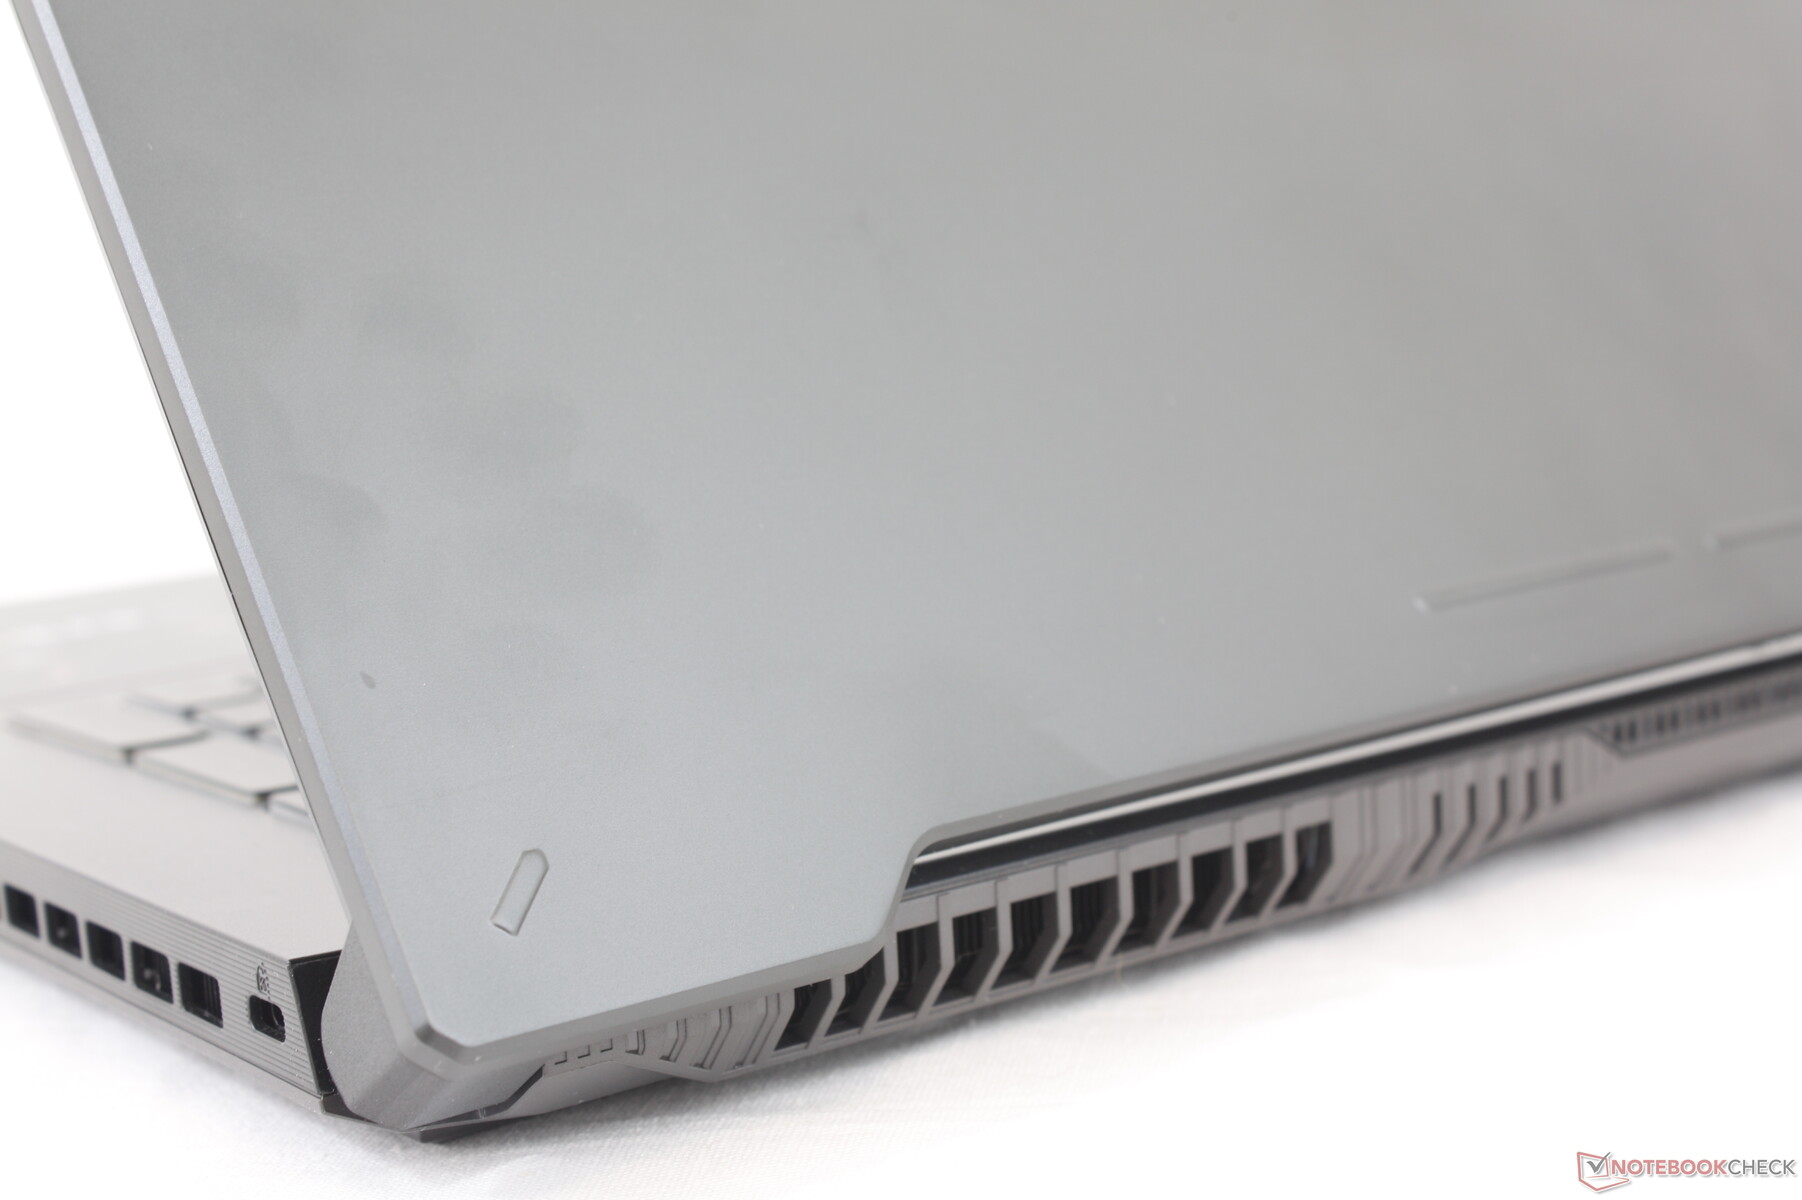
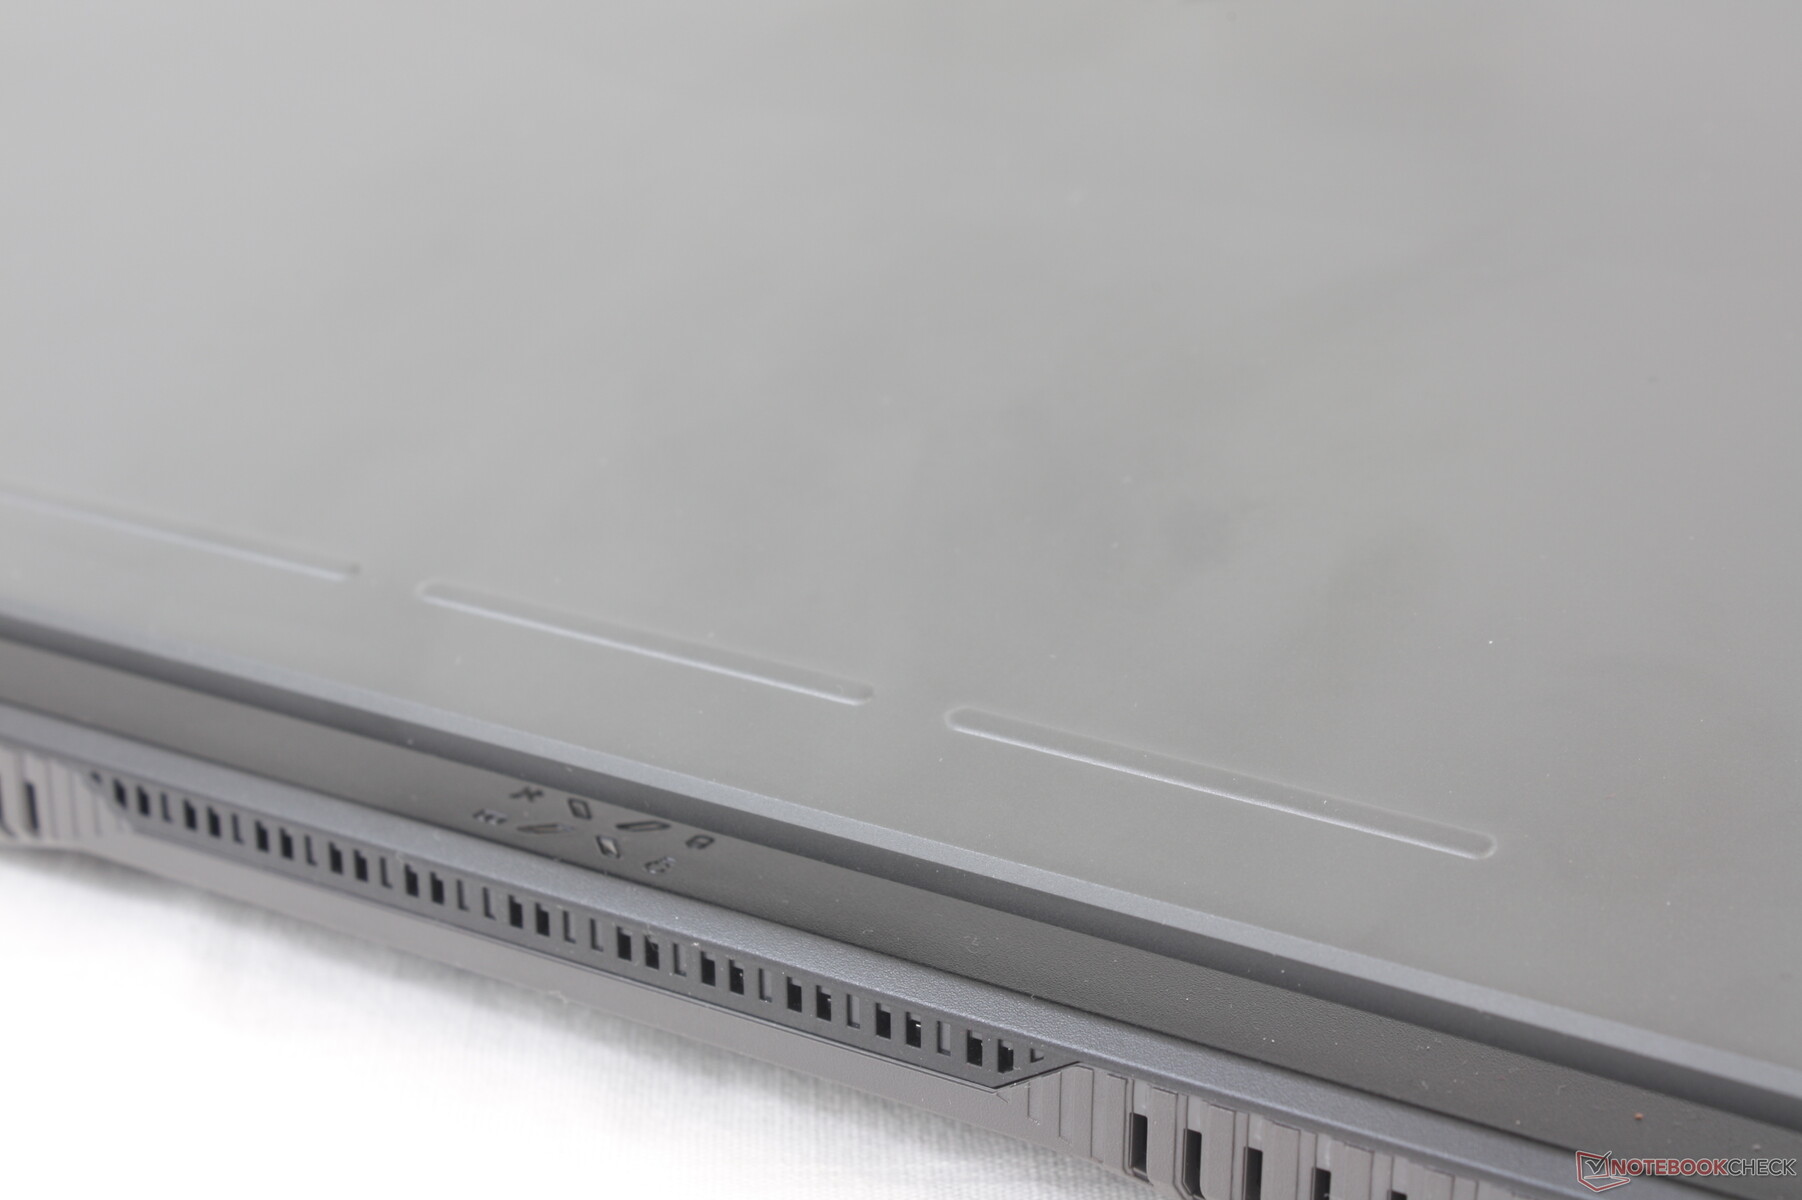
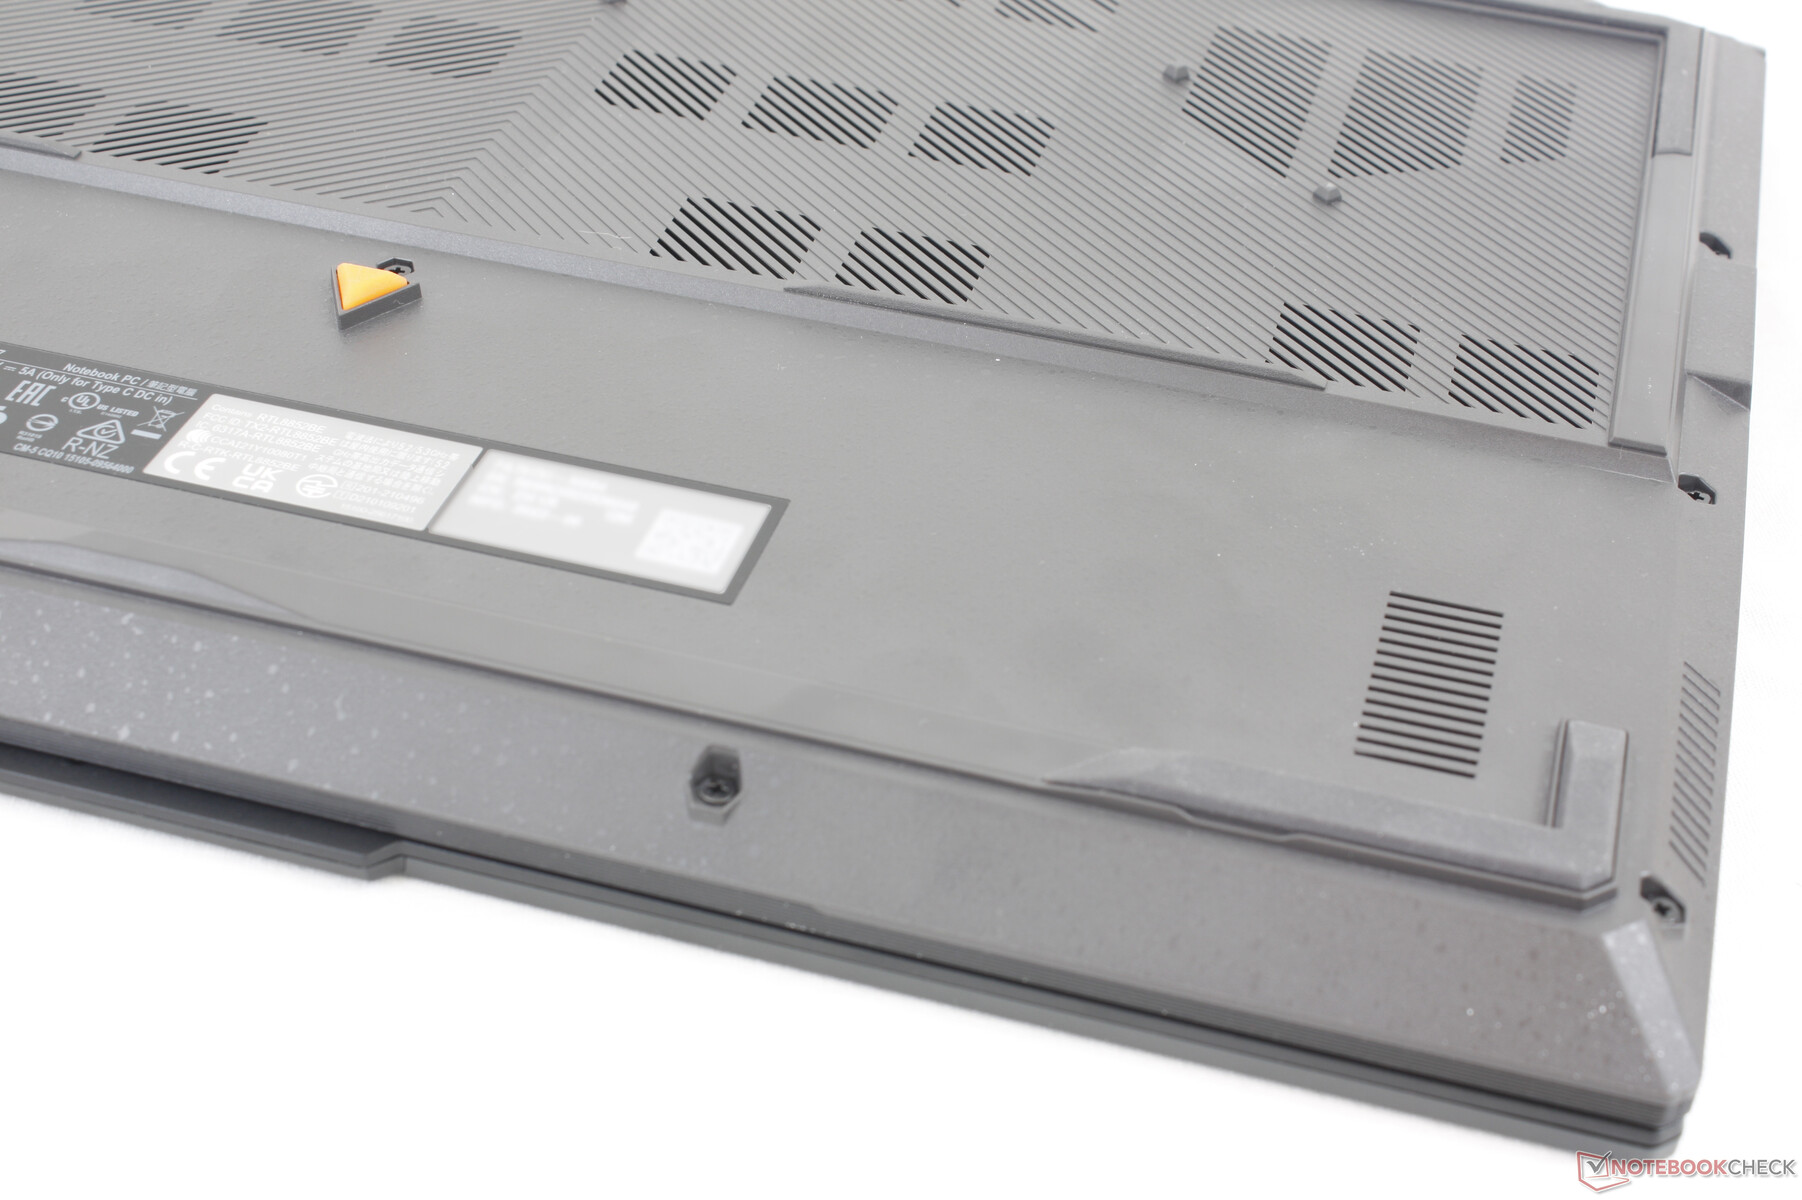
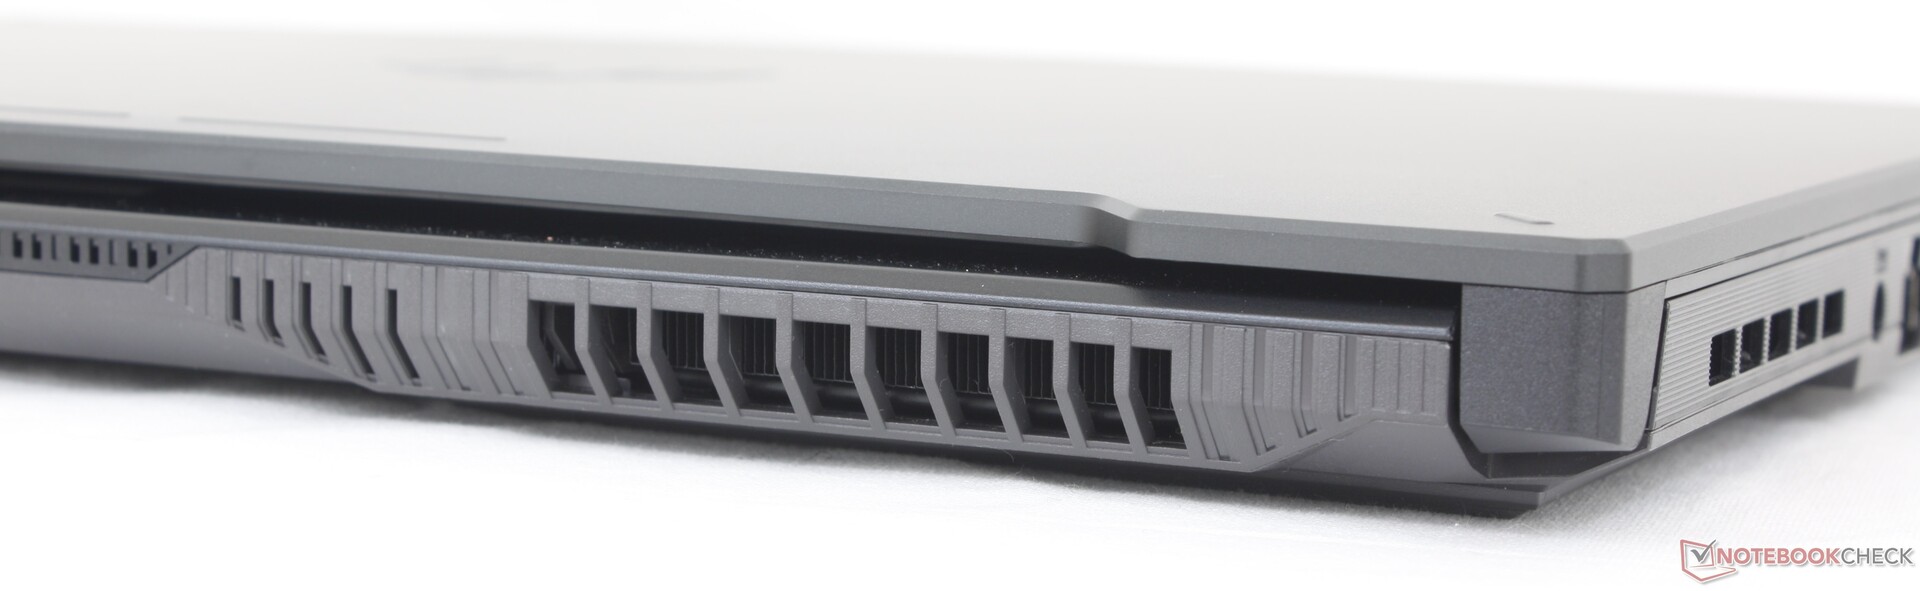
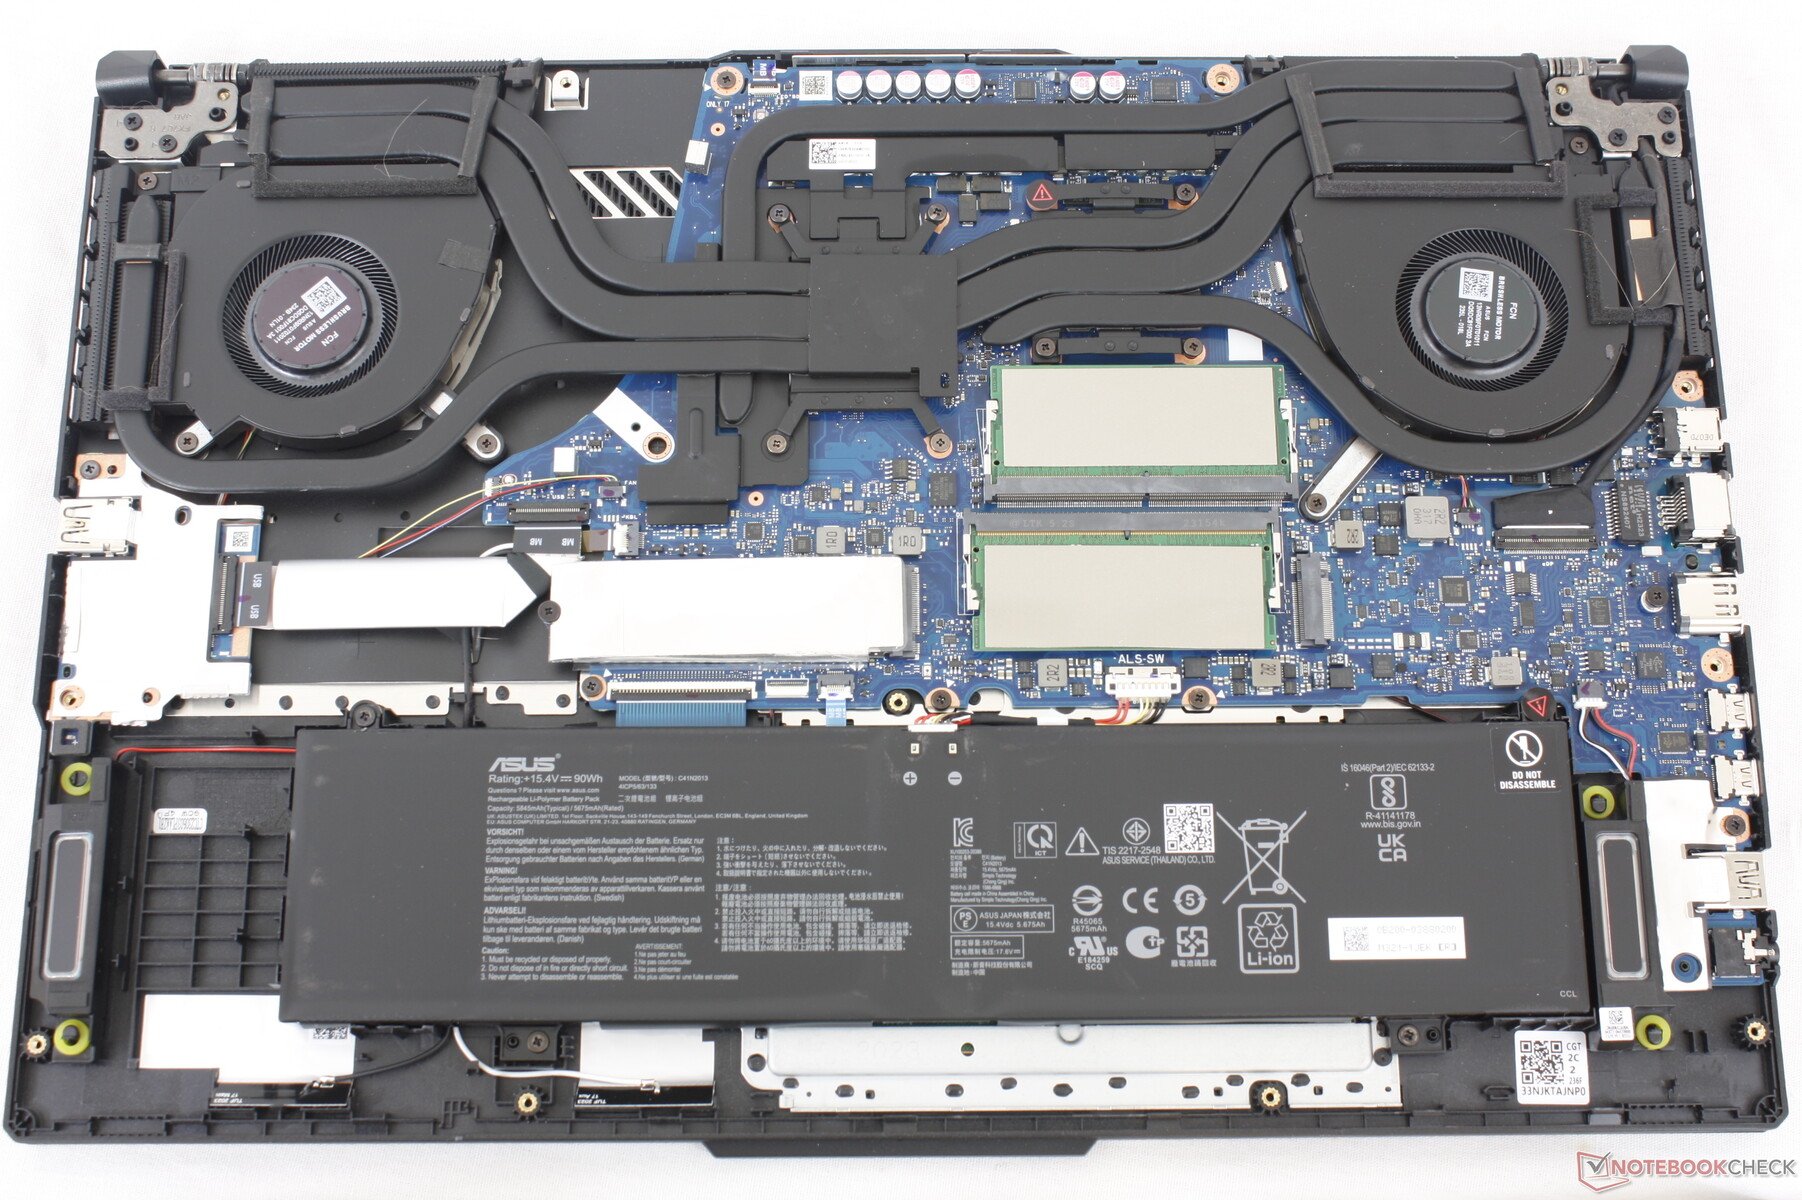
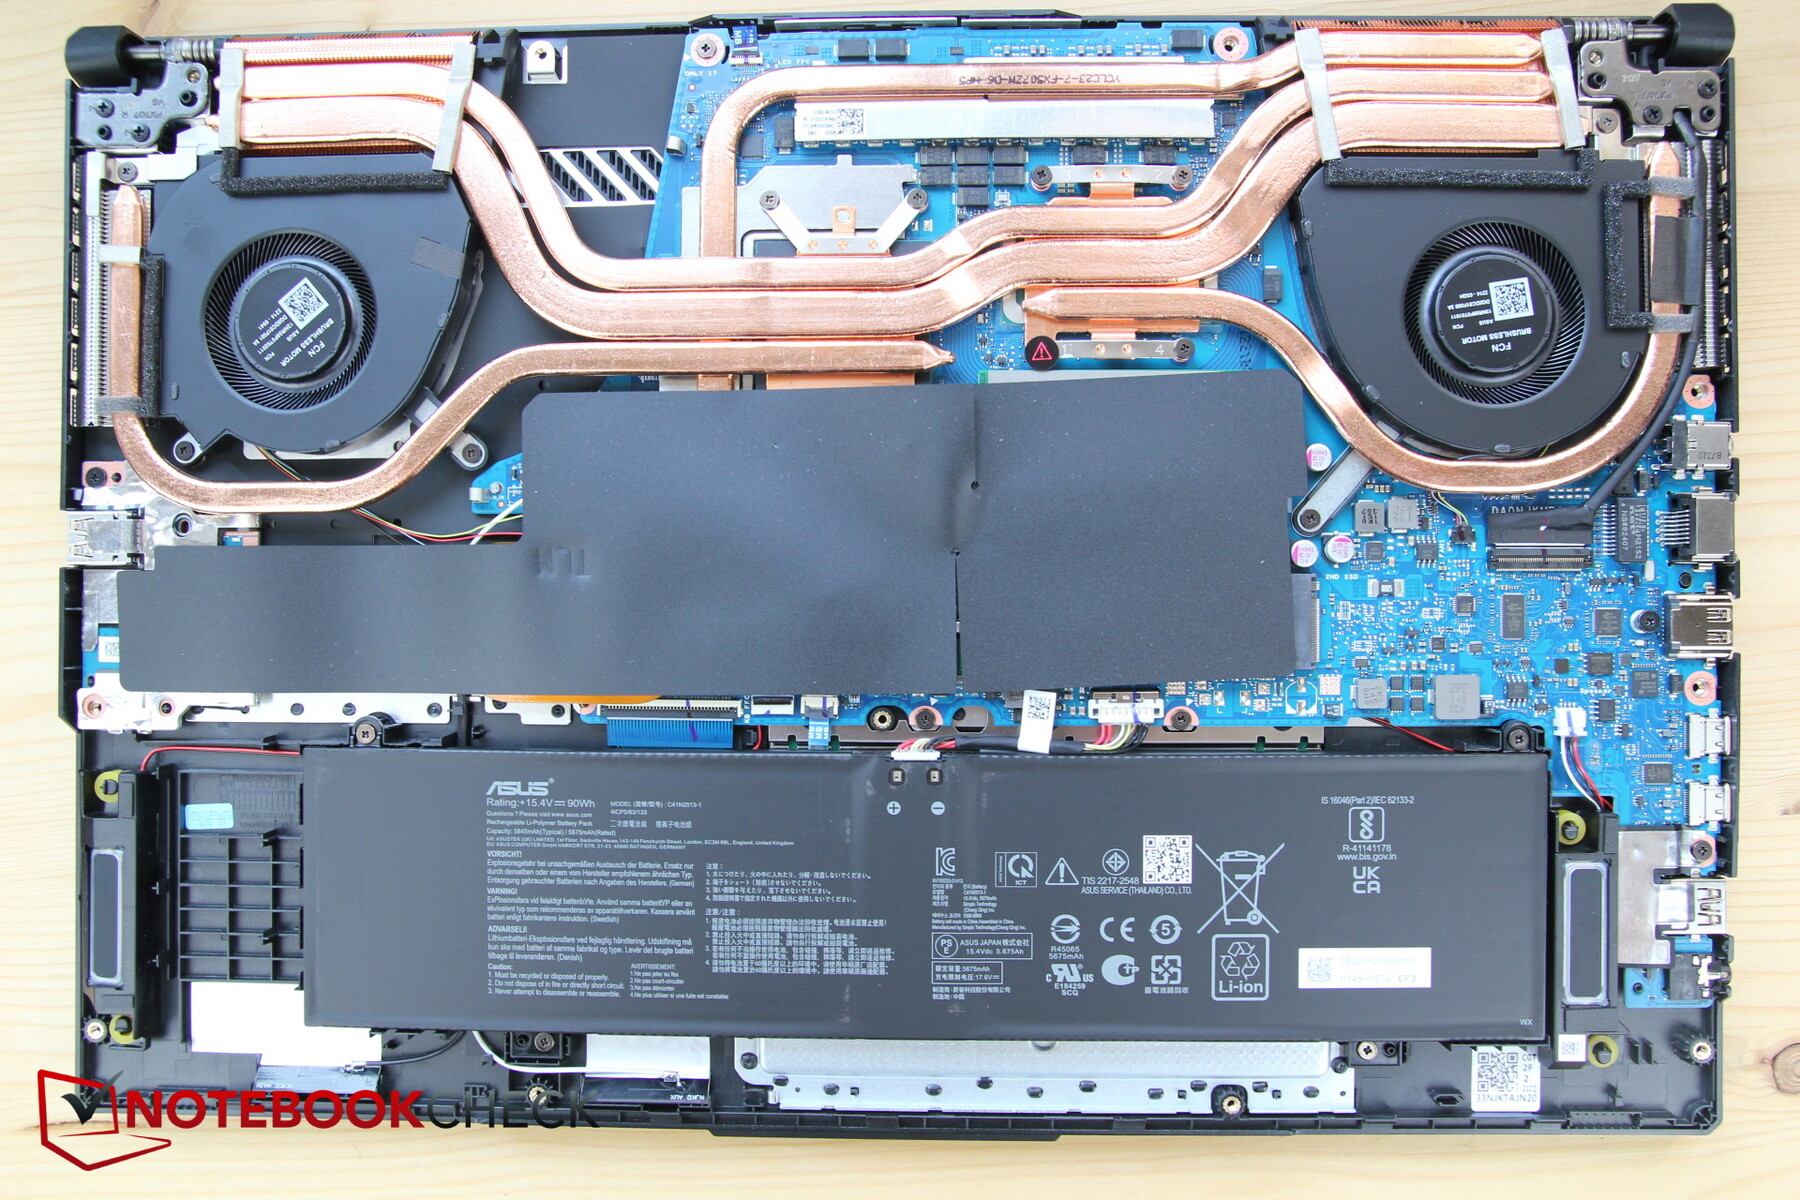
Chassit är i stort sett identiskt med TUF Gaming F17 FX707 inklusive placeringen av portarna och metall- och plastmaterialen för det yttre locket respektive basen. Det finns dock små ytliga skillnader på det yttre locket som hjälper till att visuellt skilja TUF Gaming A17 från TUF Gaming F17. Hörncirklarna på F17 är till exempel nu diagonala linjer. Det finns också ytterligare märken längs lockets nedre kant medan dessa saknas helt på F17. Om den vänds upp och ner är gummitriangeln på undersidan av chassit nu orange istället för röd.
Våra intryck av byggkvaliteten på den Intel-baserade F17 gäller här för den AMD-baserade A17.
Trots sin ospännande visuella design är TUF Gaming A17 fortfarande tunnare och lättare än många andra 17,3-tums bärbara speldatorer i mellanklassen, t.ex HP Pavilion Gaming 17acer Nitro 17 eller MSI Pulse 17 med 200 till 500 gram vardera beroende på modell. Skillnaderna är tillräckligt stora för att märkas när du reser och därför kan Asus relativt lilla storlek vara en tydlig fördel.
Anslutningsmöjligheter
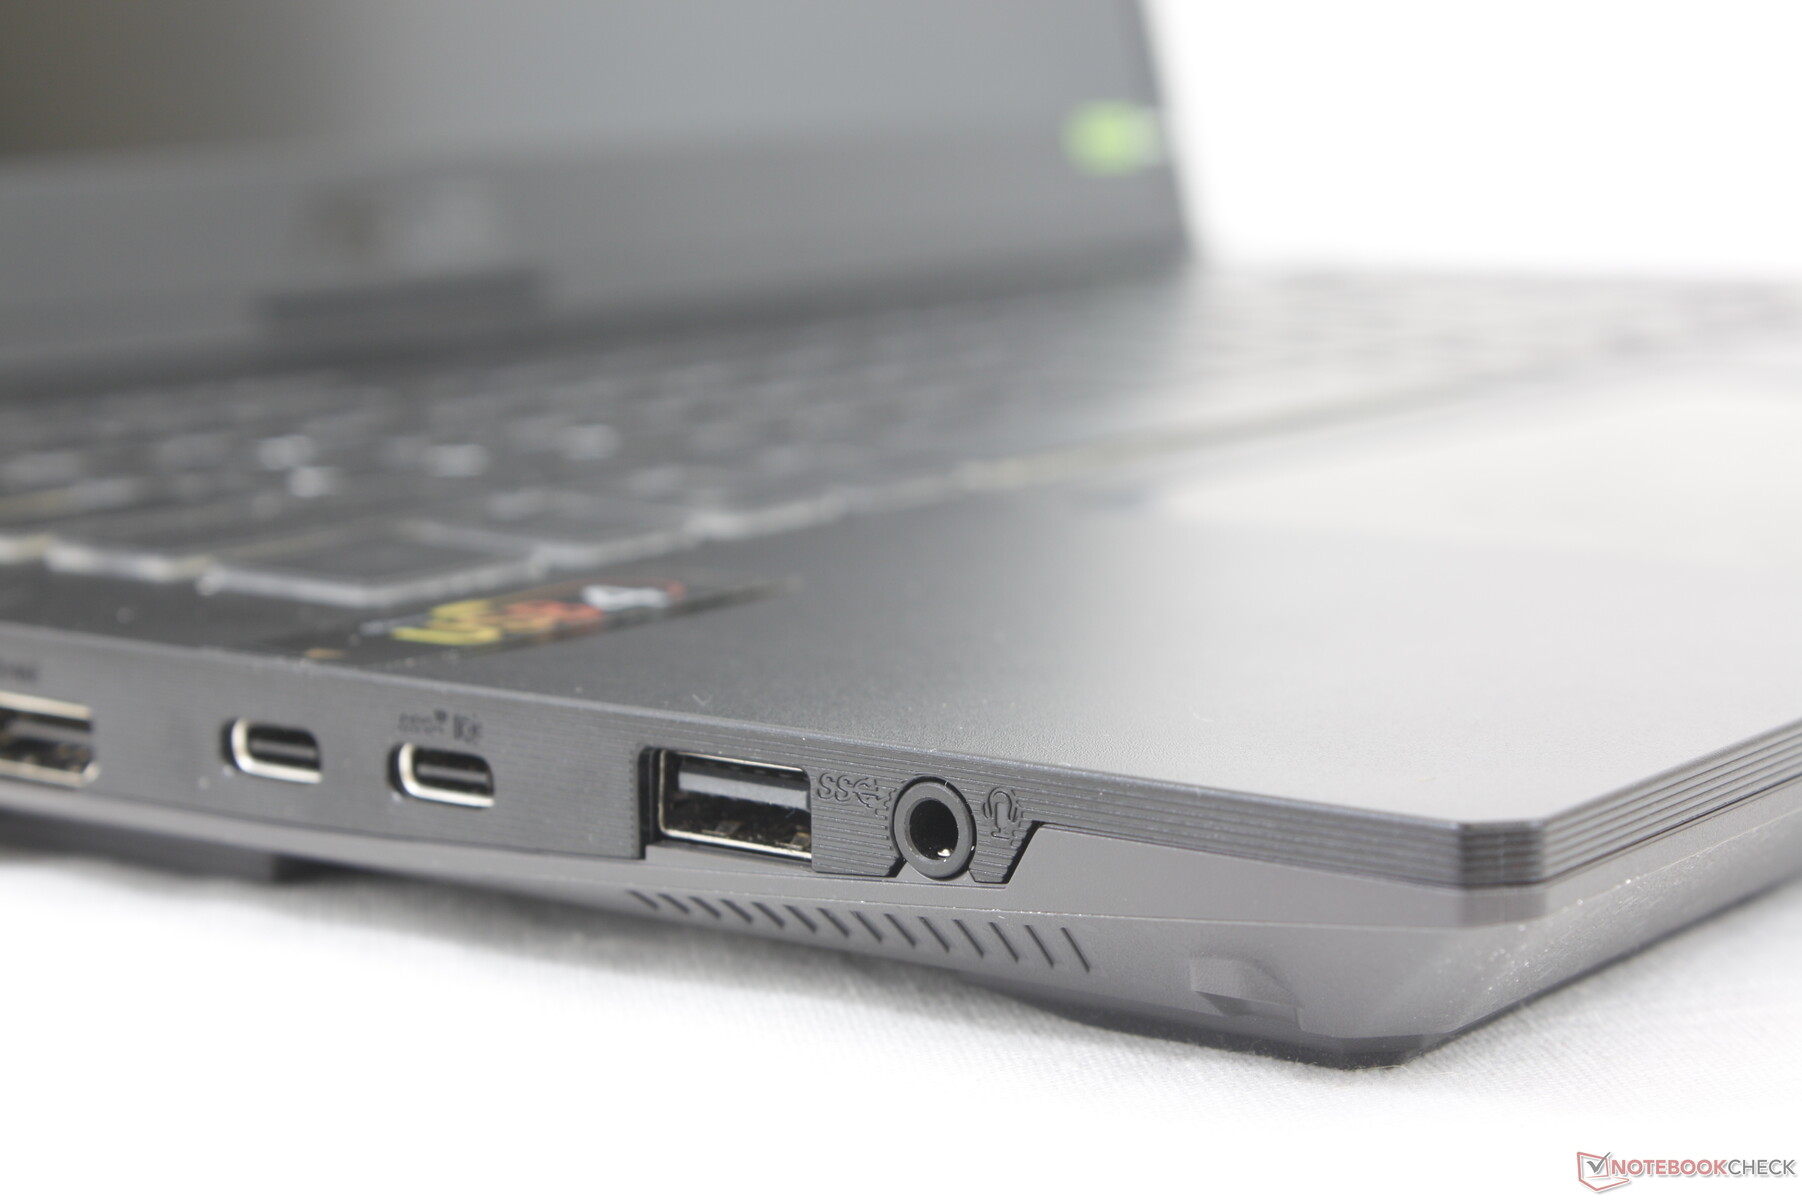
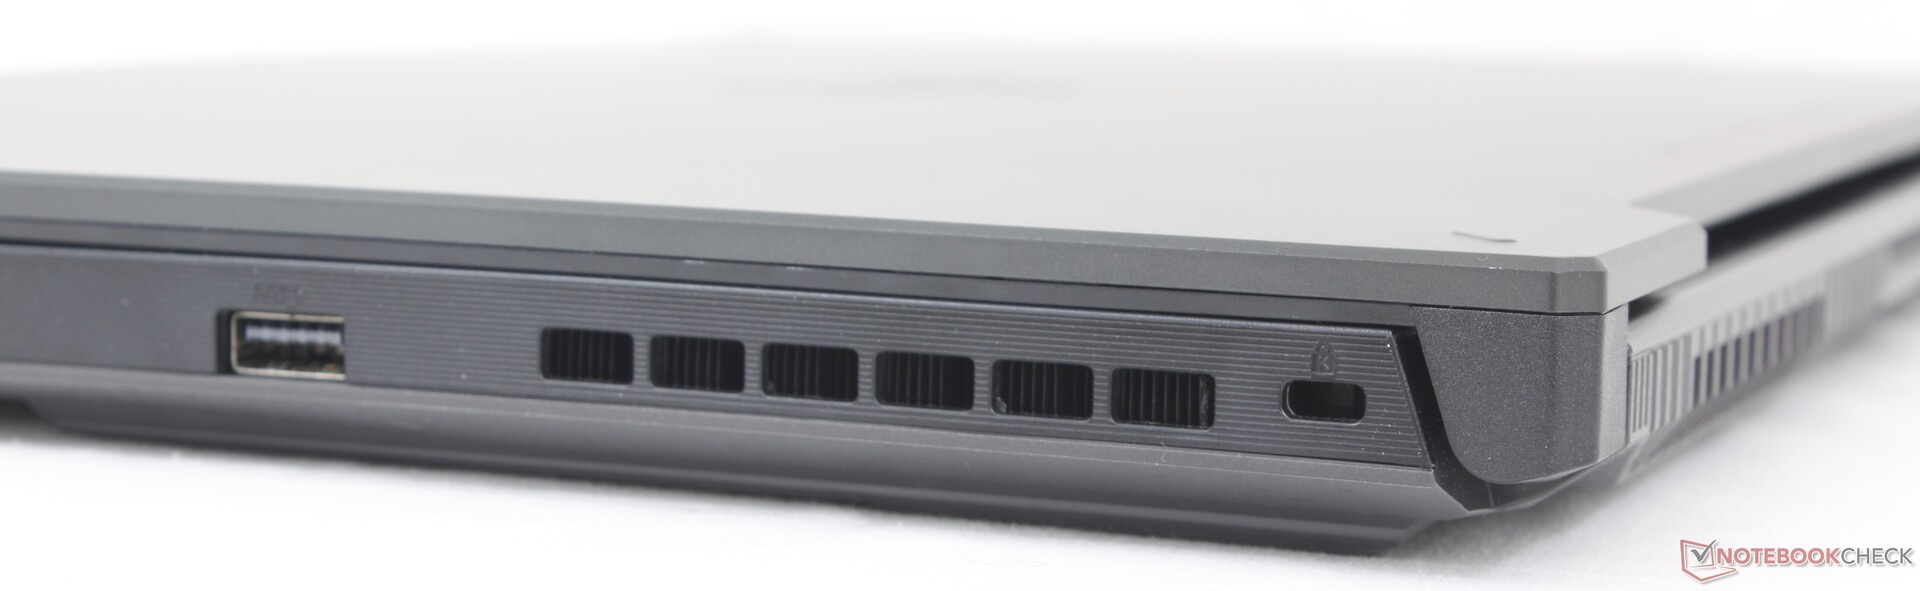
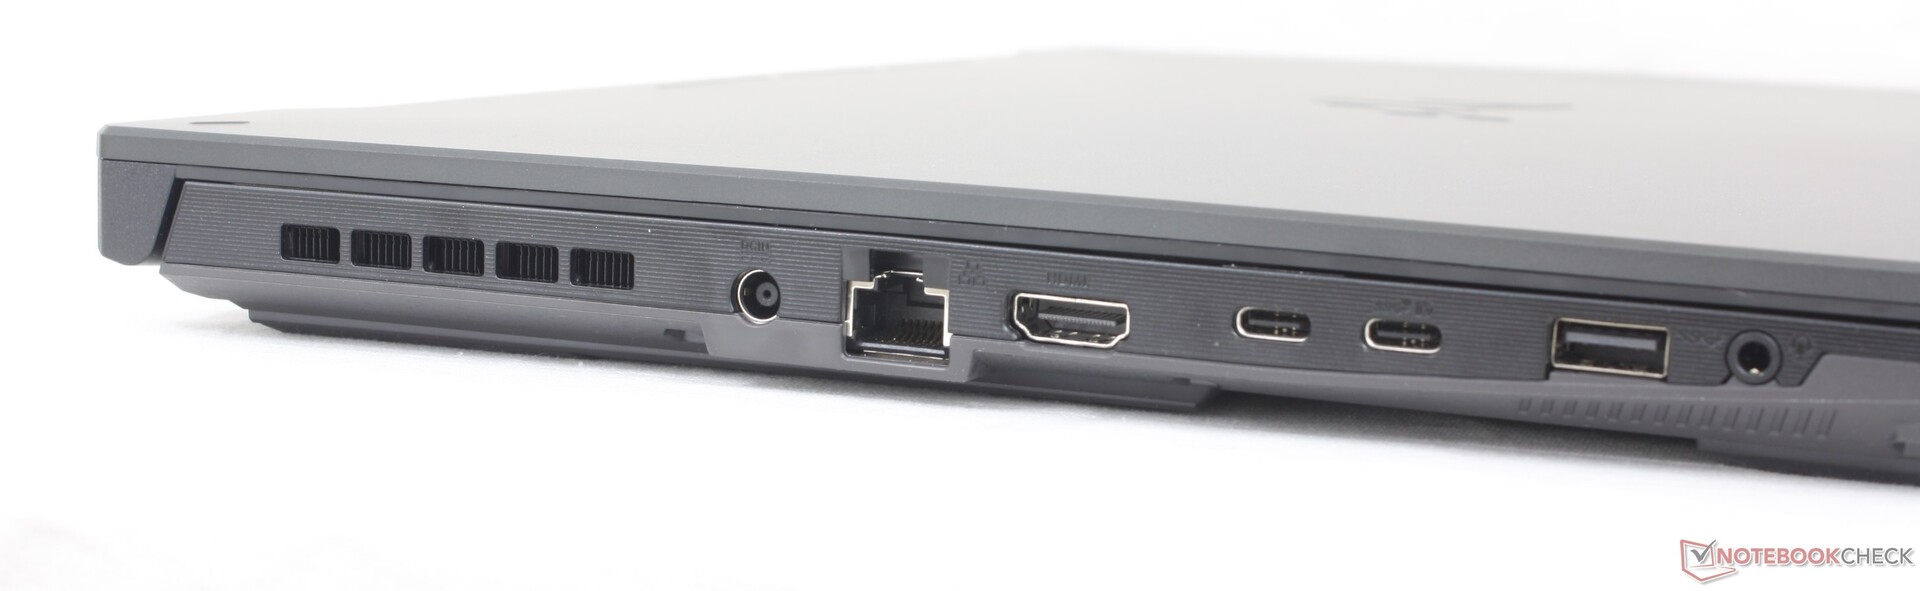
Vår modell har alla portar som finns på F17 FX707 men med ett litet undantag: Thunderbolt 4-porten har bytts ut mot USB-C 4. De flesta Thunderbolt-enheter är dock kompatibla med USB4 och därför bör denna lilla skillnad inte påverka de allra flesta användare.
Observera att det finns två USB-C-portar på systemet, men endast den som är närmast framkanten är kompatibel med USB-C-växelströmsadaptrar. Till exempel kunde vår 135 W USB-C Lenovo-adapter ladda Asus via den ena USB-C-porten men inte den andra. Systemet måste också vara i dGPU-läge för att stödja externa USB-C-skärmar.
Intressant nog fungerade vår externa bildskärm bara med en av de två USB-C-portarna, trots att Asus hävdar att båda portarna ska vara kompatibla.
Kommunikation
En Realtek RTL8852BE är standard för Wi-Fi 6 och Bluetooth 5.3-anslutning. Det finns inga konfigurationer med Wi-Fi 6E eller Intel AX-serien, sannolikt för att spara på kostnader. Vi upplevde dock inga problem med anslutningen när vi parade ihop den med vårt Wi-Fi 6-nätverk, även om den genomgående är långsammare än väntat.
| Networking | |
| iperf3 transmit AX12 | |
| Asus TUF Gaming F17 FX707Z-HX011W | |
| iperf3 receive AX12 | |
| Asus TUF Gaming F17 FX707Z-HX011W | |
| iperf3 transmit AXE11000 | |
| MSI Katana 17 B13VFK | |
| MSI Pulse 17 B13VGK | |
| Asus TUF Gaming A17 FA707XI-NS94 | |
| iperf3 receive AXE11000 | |
| MSI Katana 17 B13VFK | |
| MSI Pulse 17 B13VGK | |
| HP Pavilion Gaming 17-cd2146ng | |
| Asus TUF Gaming A17 FA707XI-NS94 | |
| iperf3 transmit AXE11000 6GHz | |
| Razer Blade 17 (i7-12800H, RTX 3070 Ti) | |
| iperf3 receive AXE11000 6GHz | |
| Razer Blade 17 (i7-12800H, RTX 3070 Ti) | |
Webbkamera
Modellen har en webbkamera på 1 MP eller 720p medan de flesta andra bärbara speldatorer redan har gått över till 2 MP eller 1080p. Även om det är bättre än ingenting, är det tydligt att TUF Gaming A17 inte var utformad för Zoom-samtal.


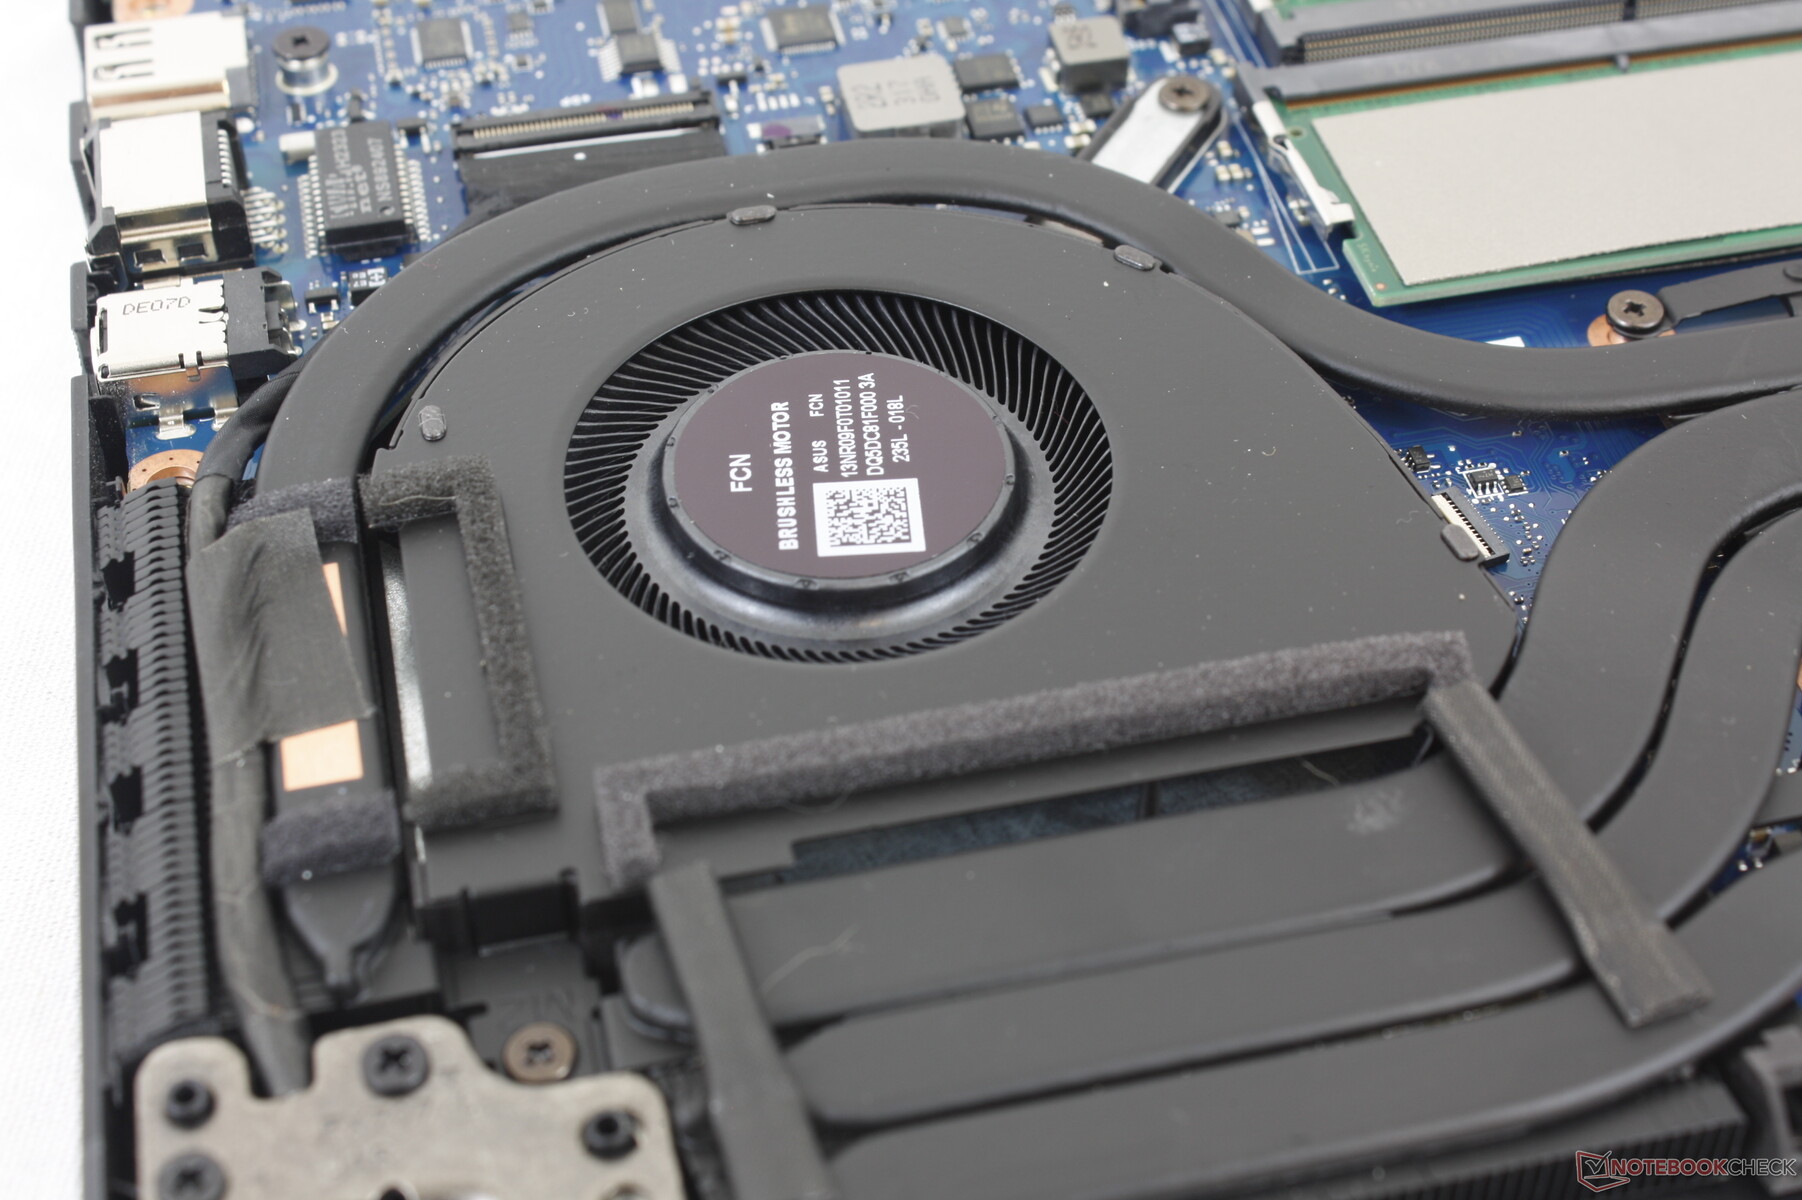
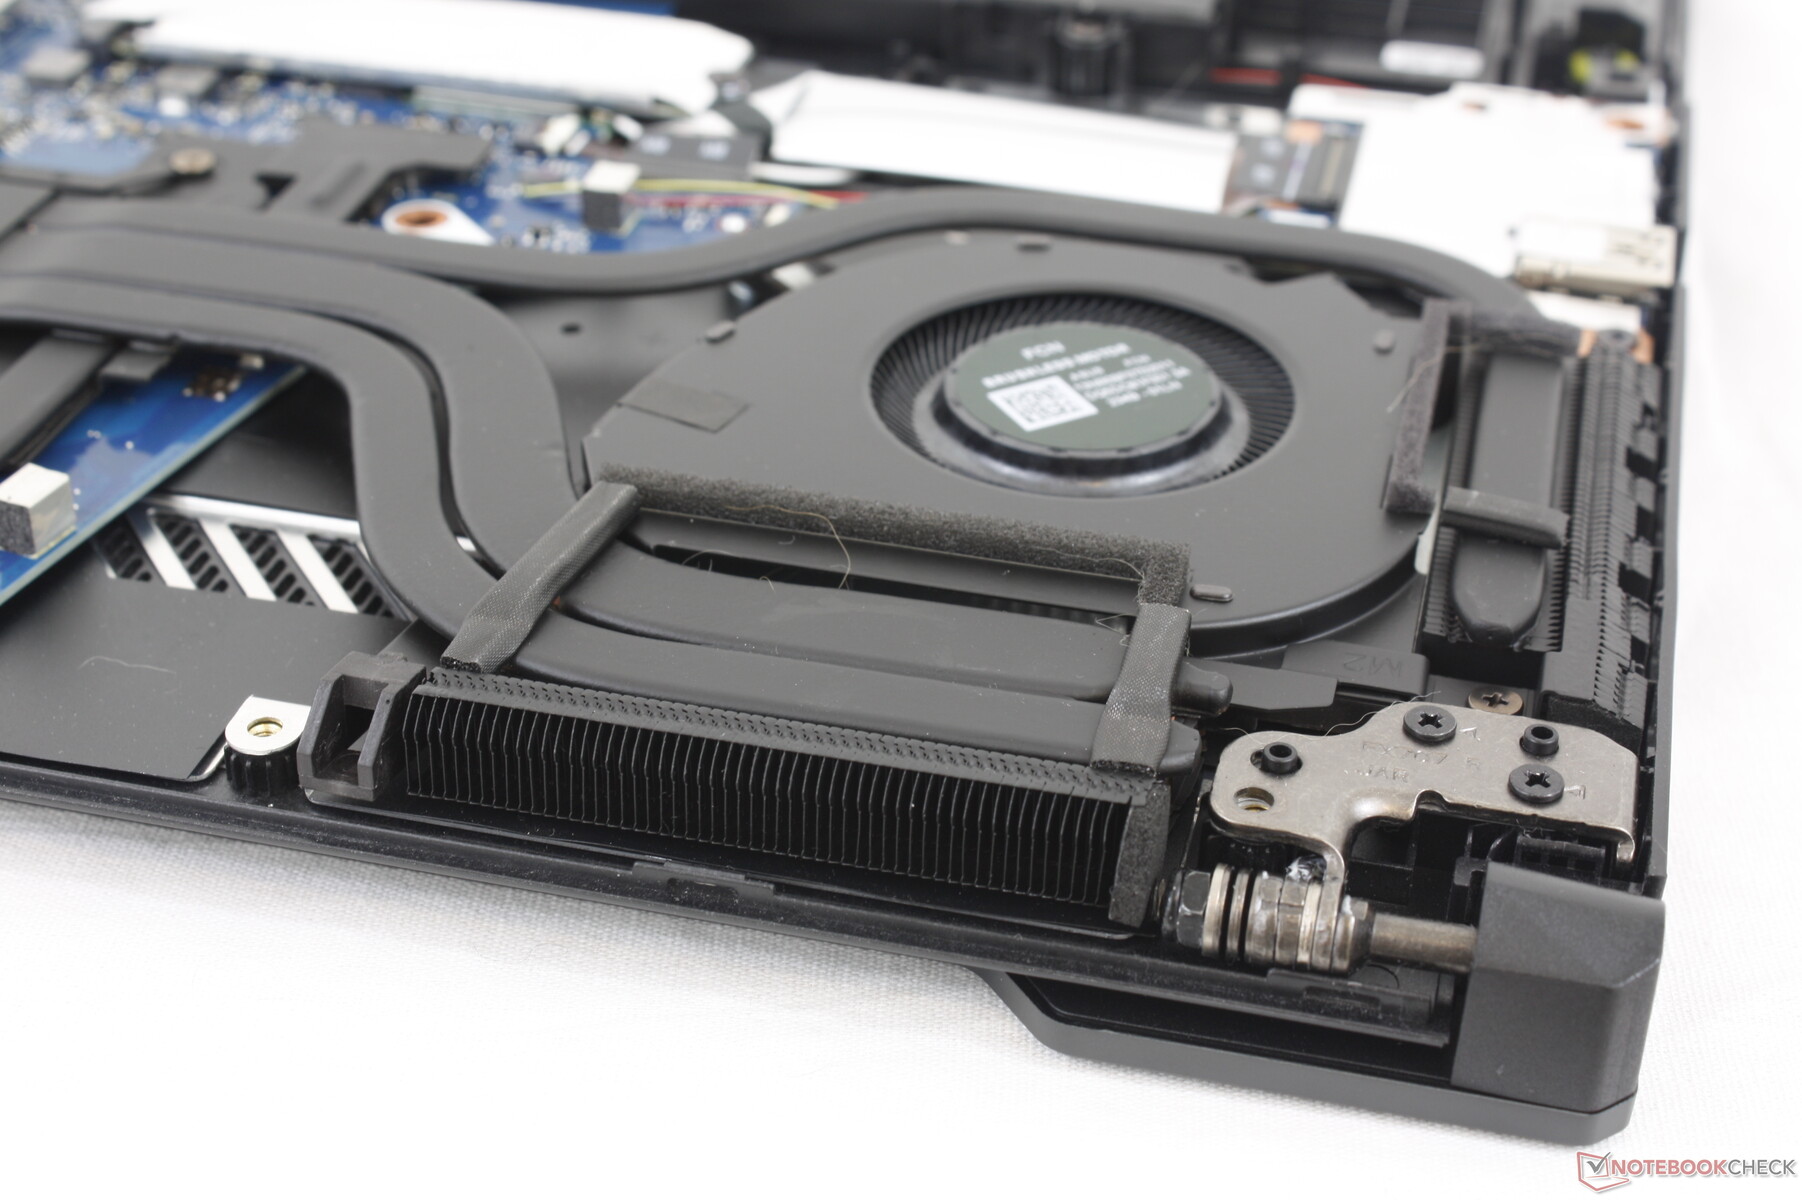
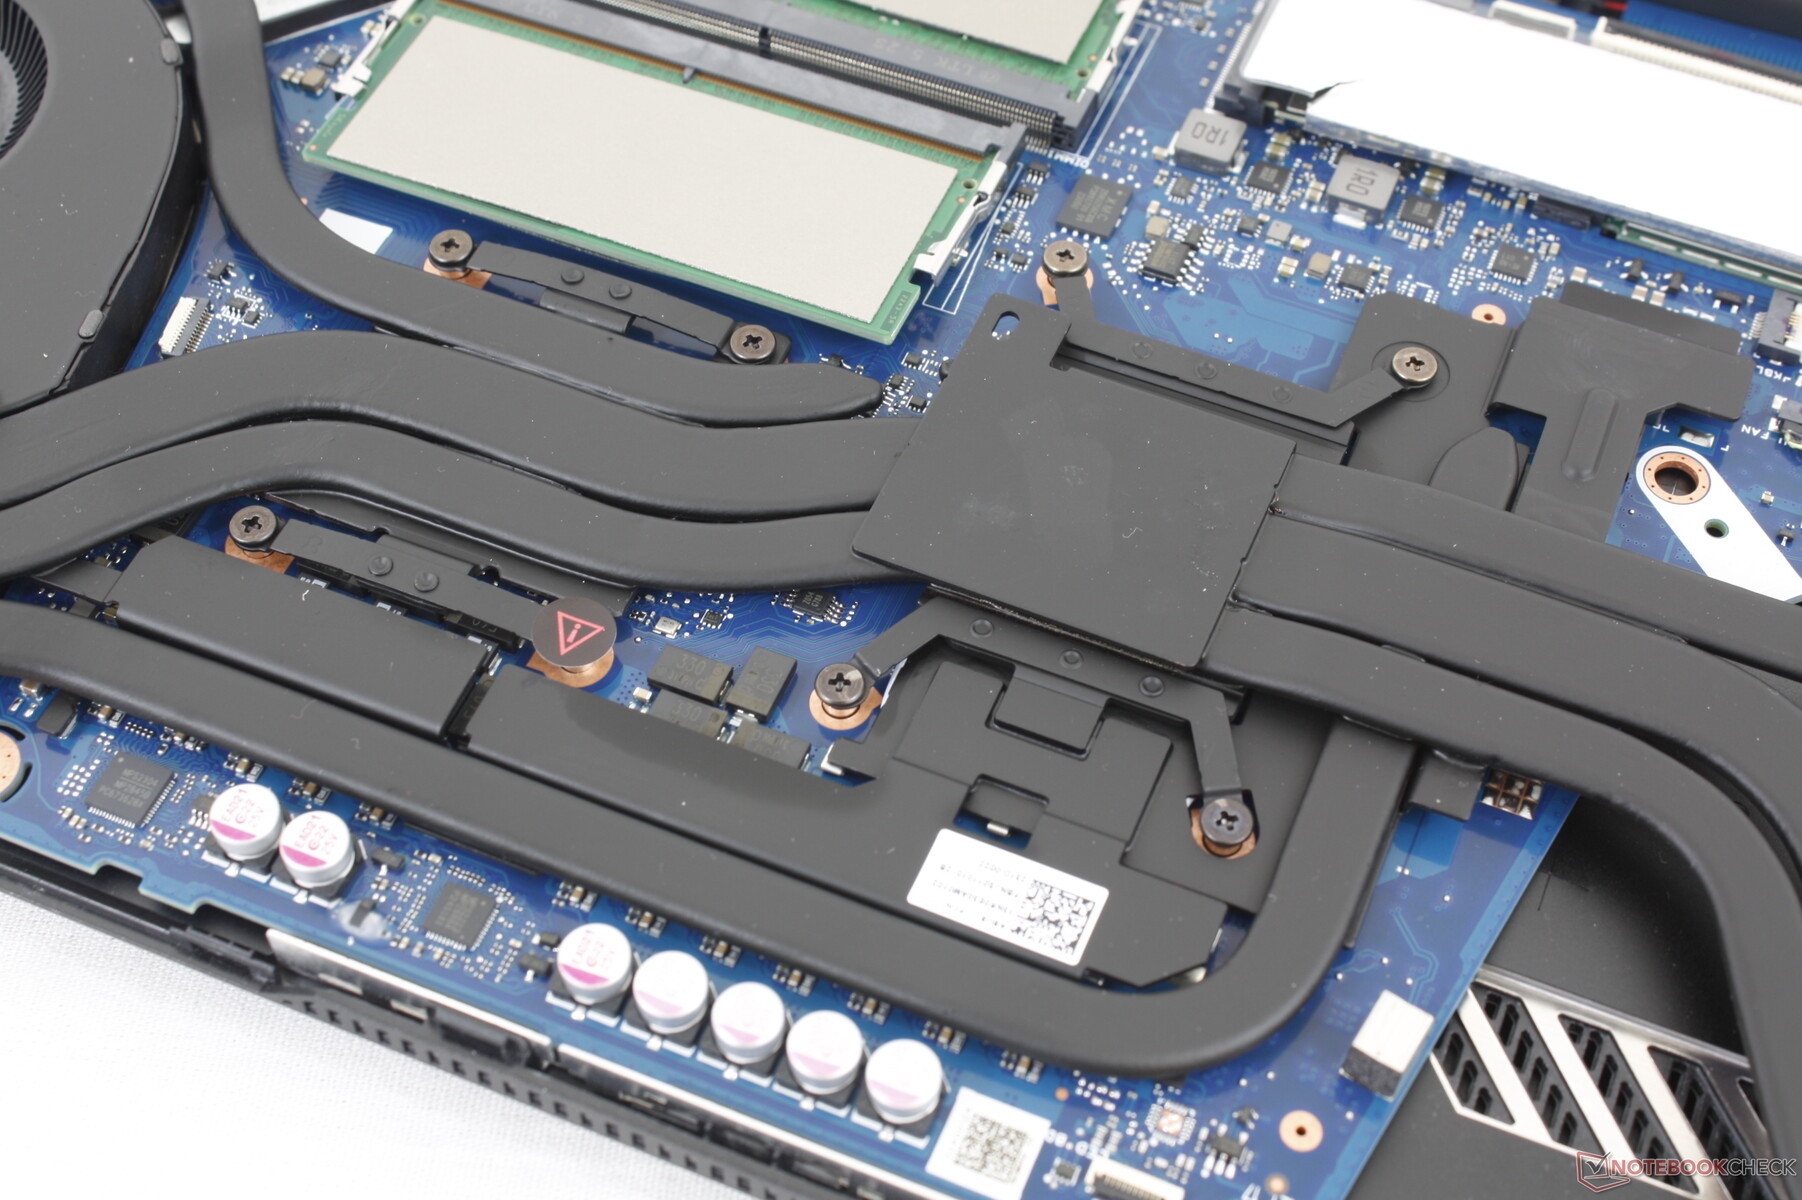
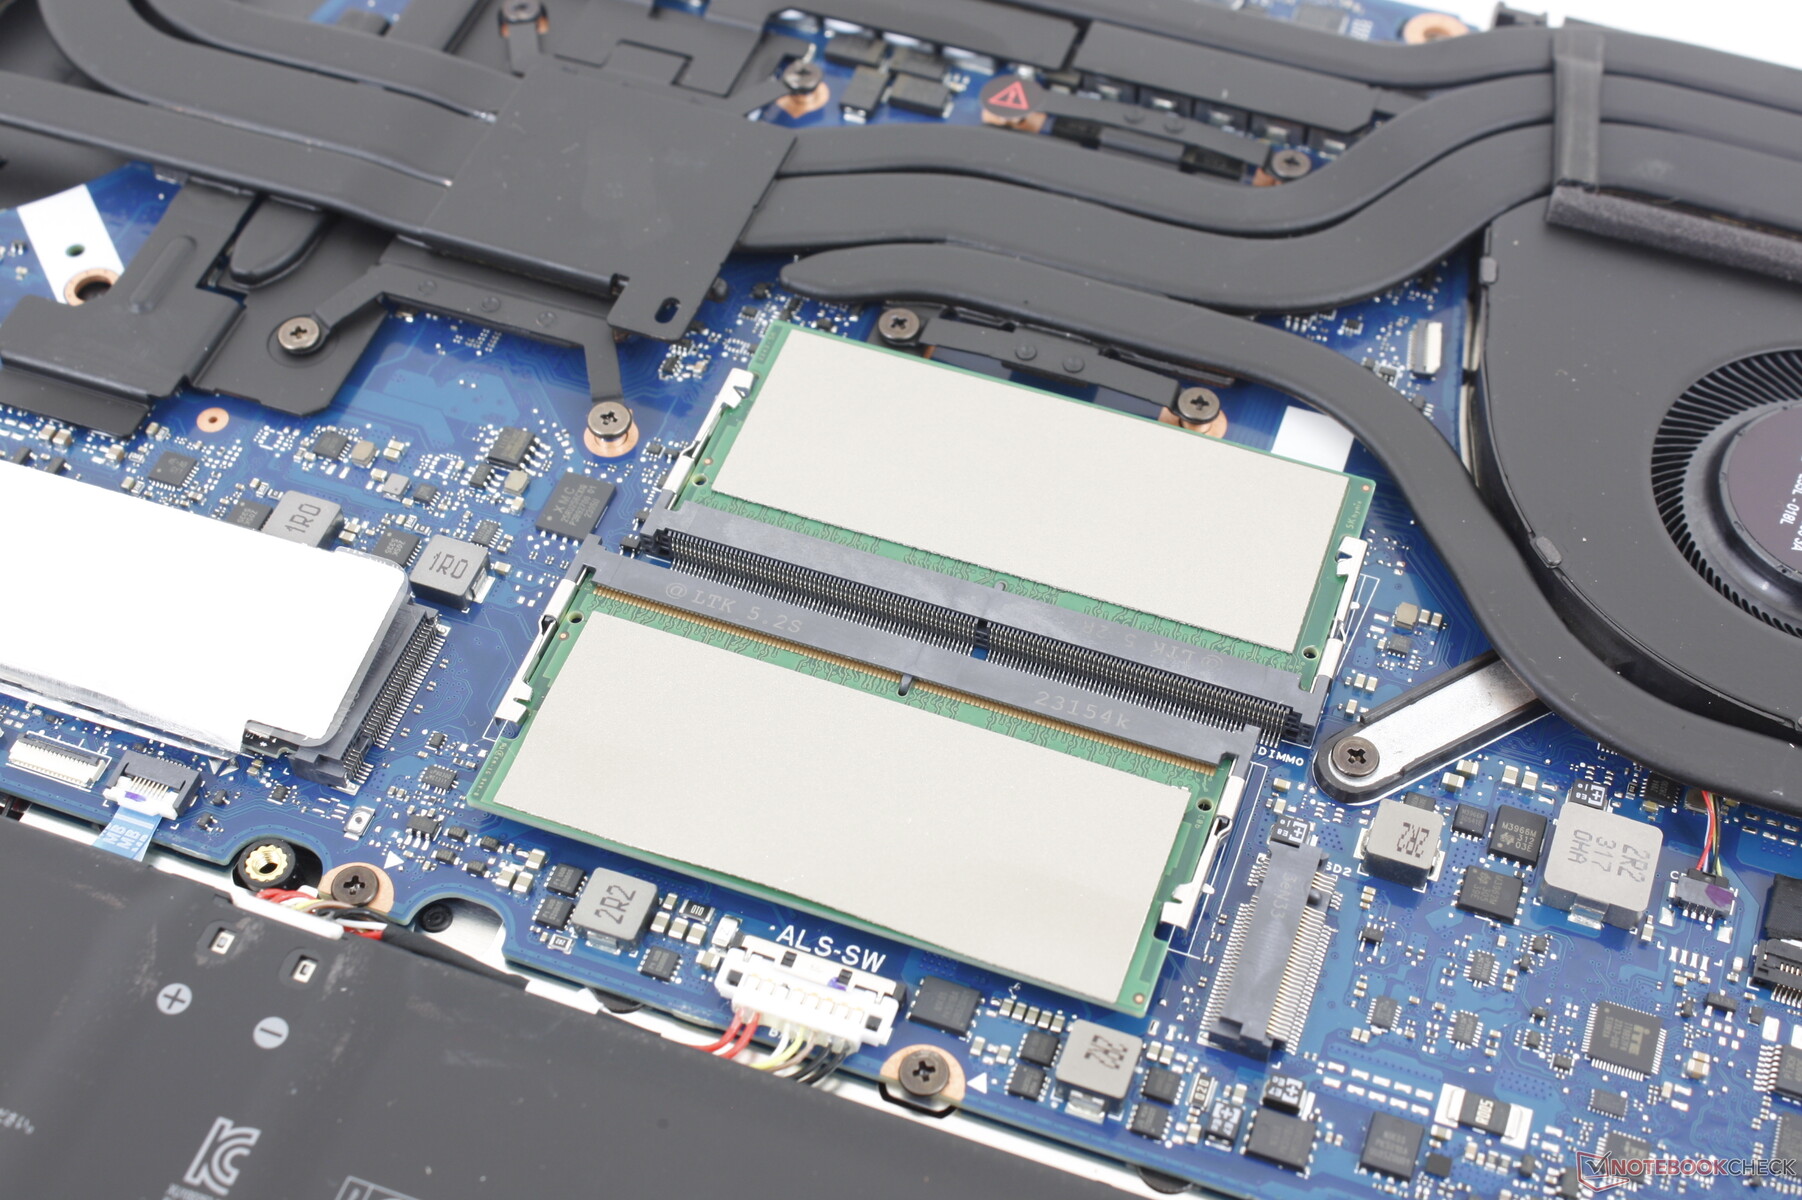
Underhåll
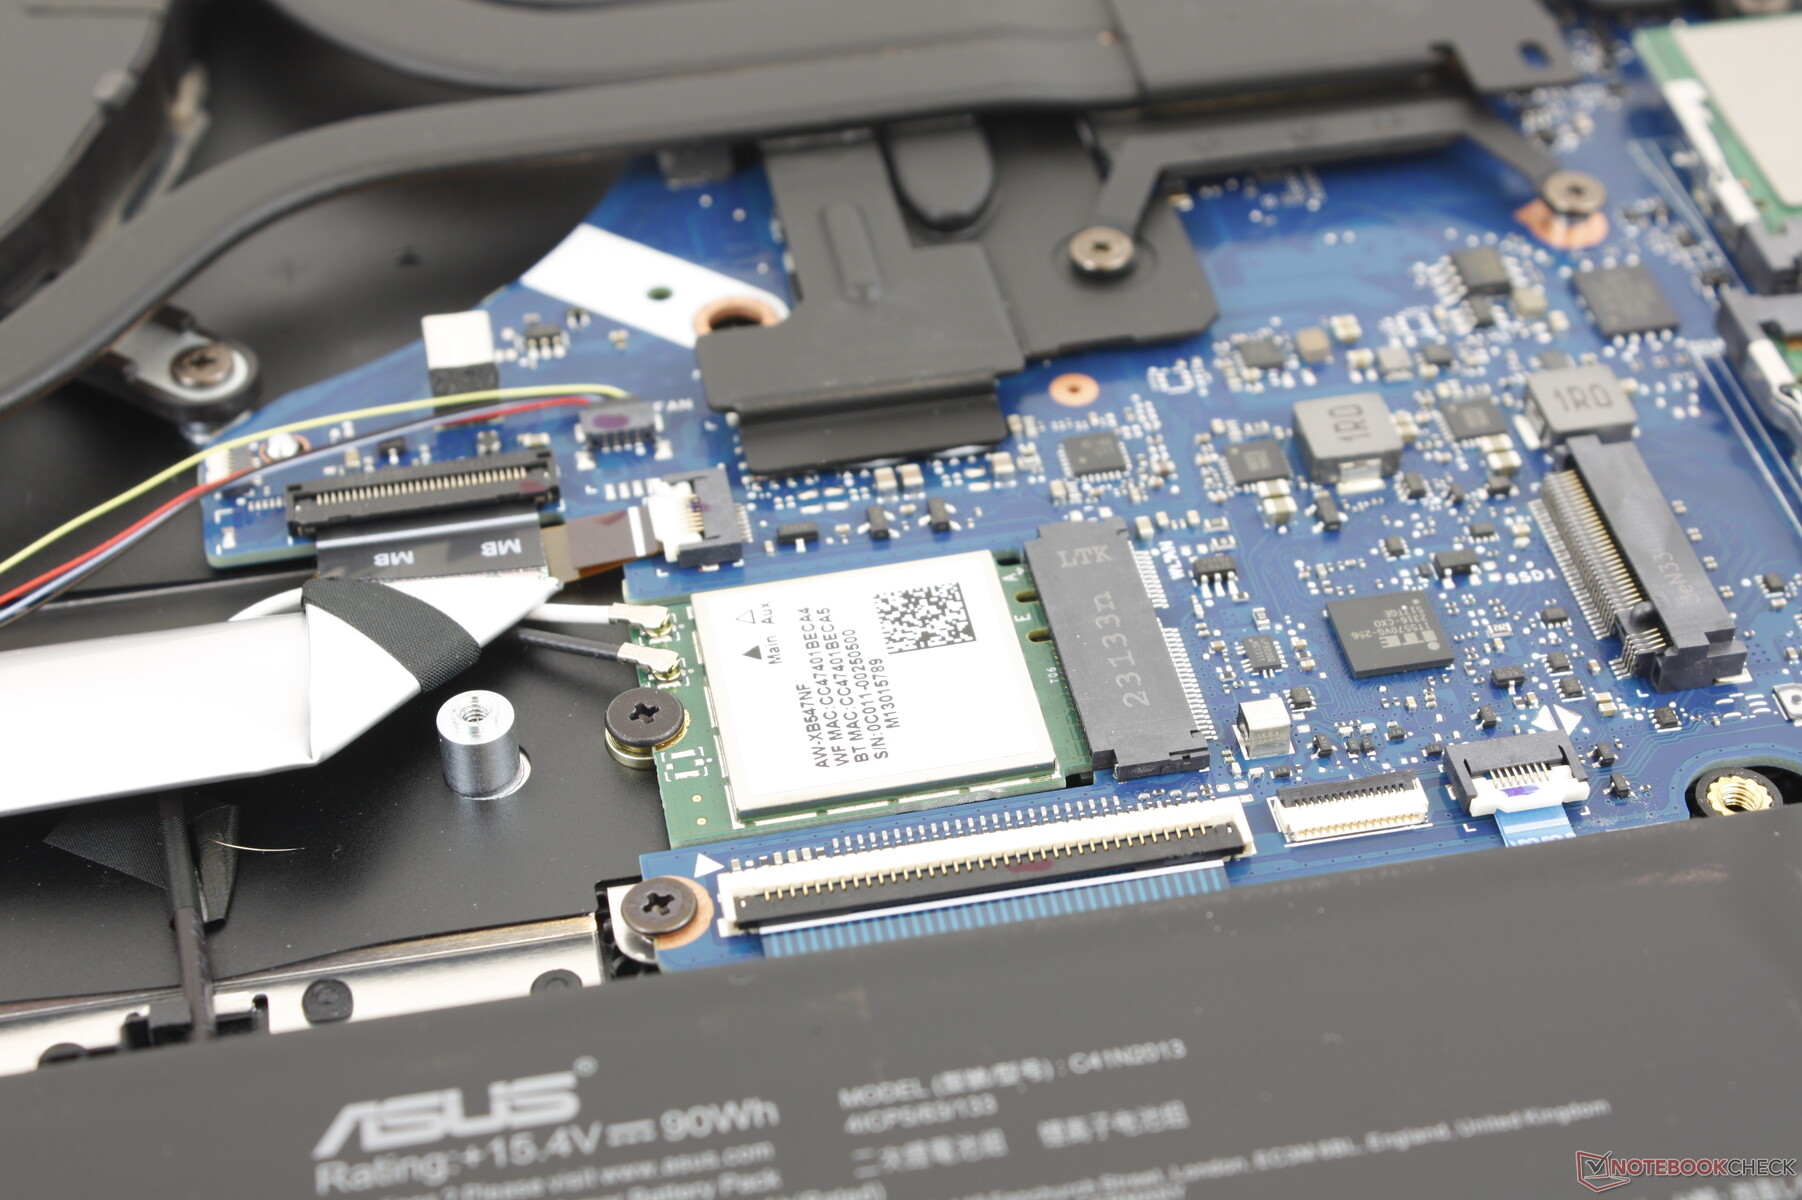
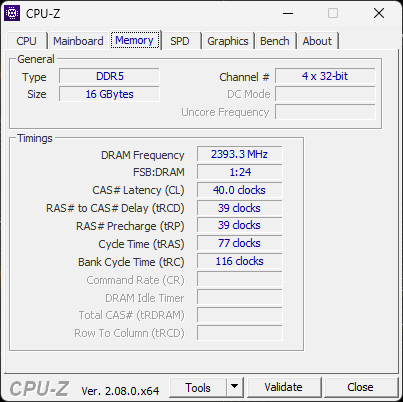
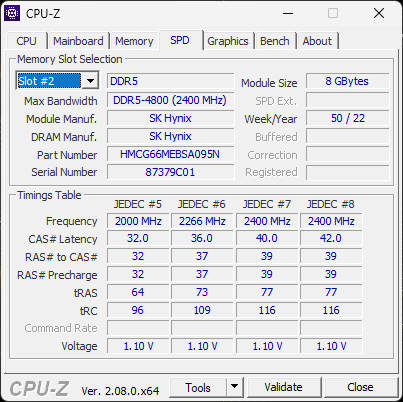
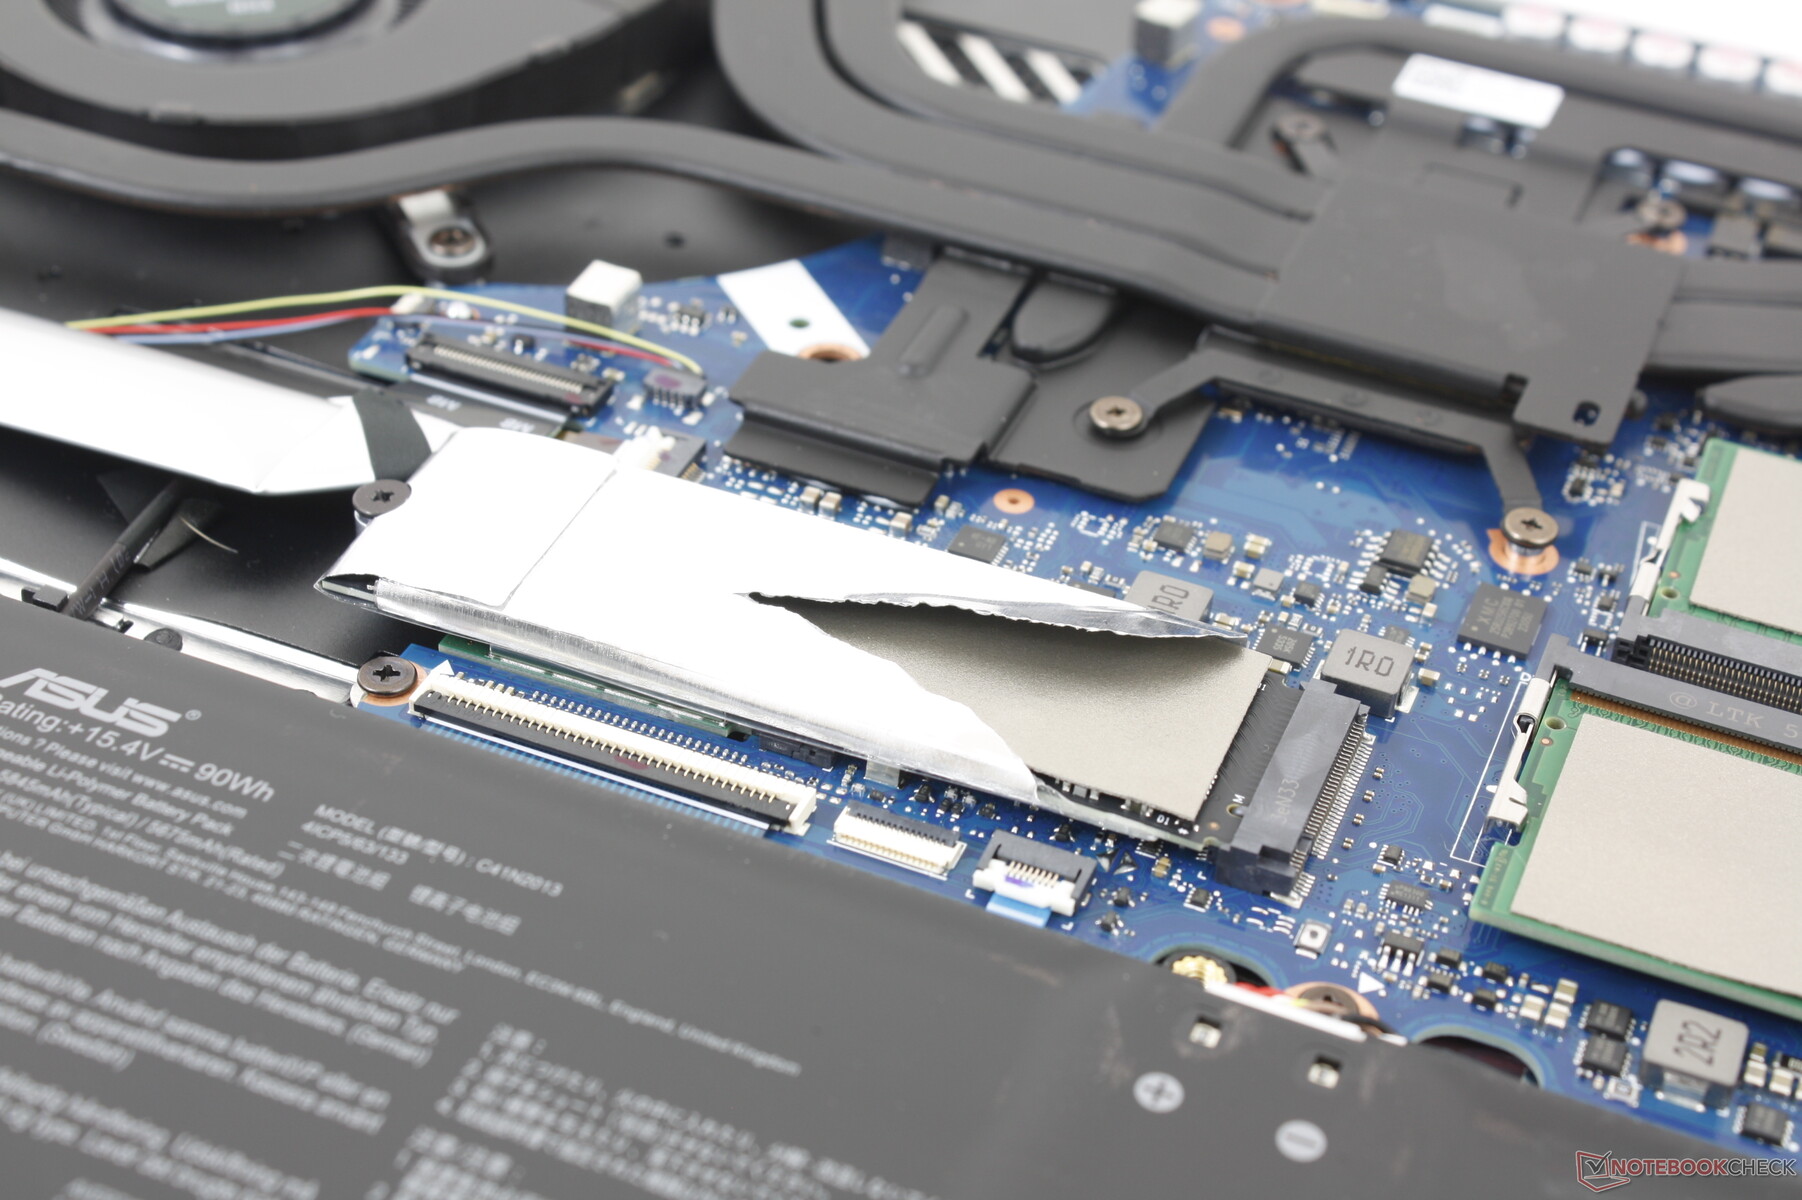
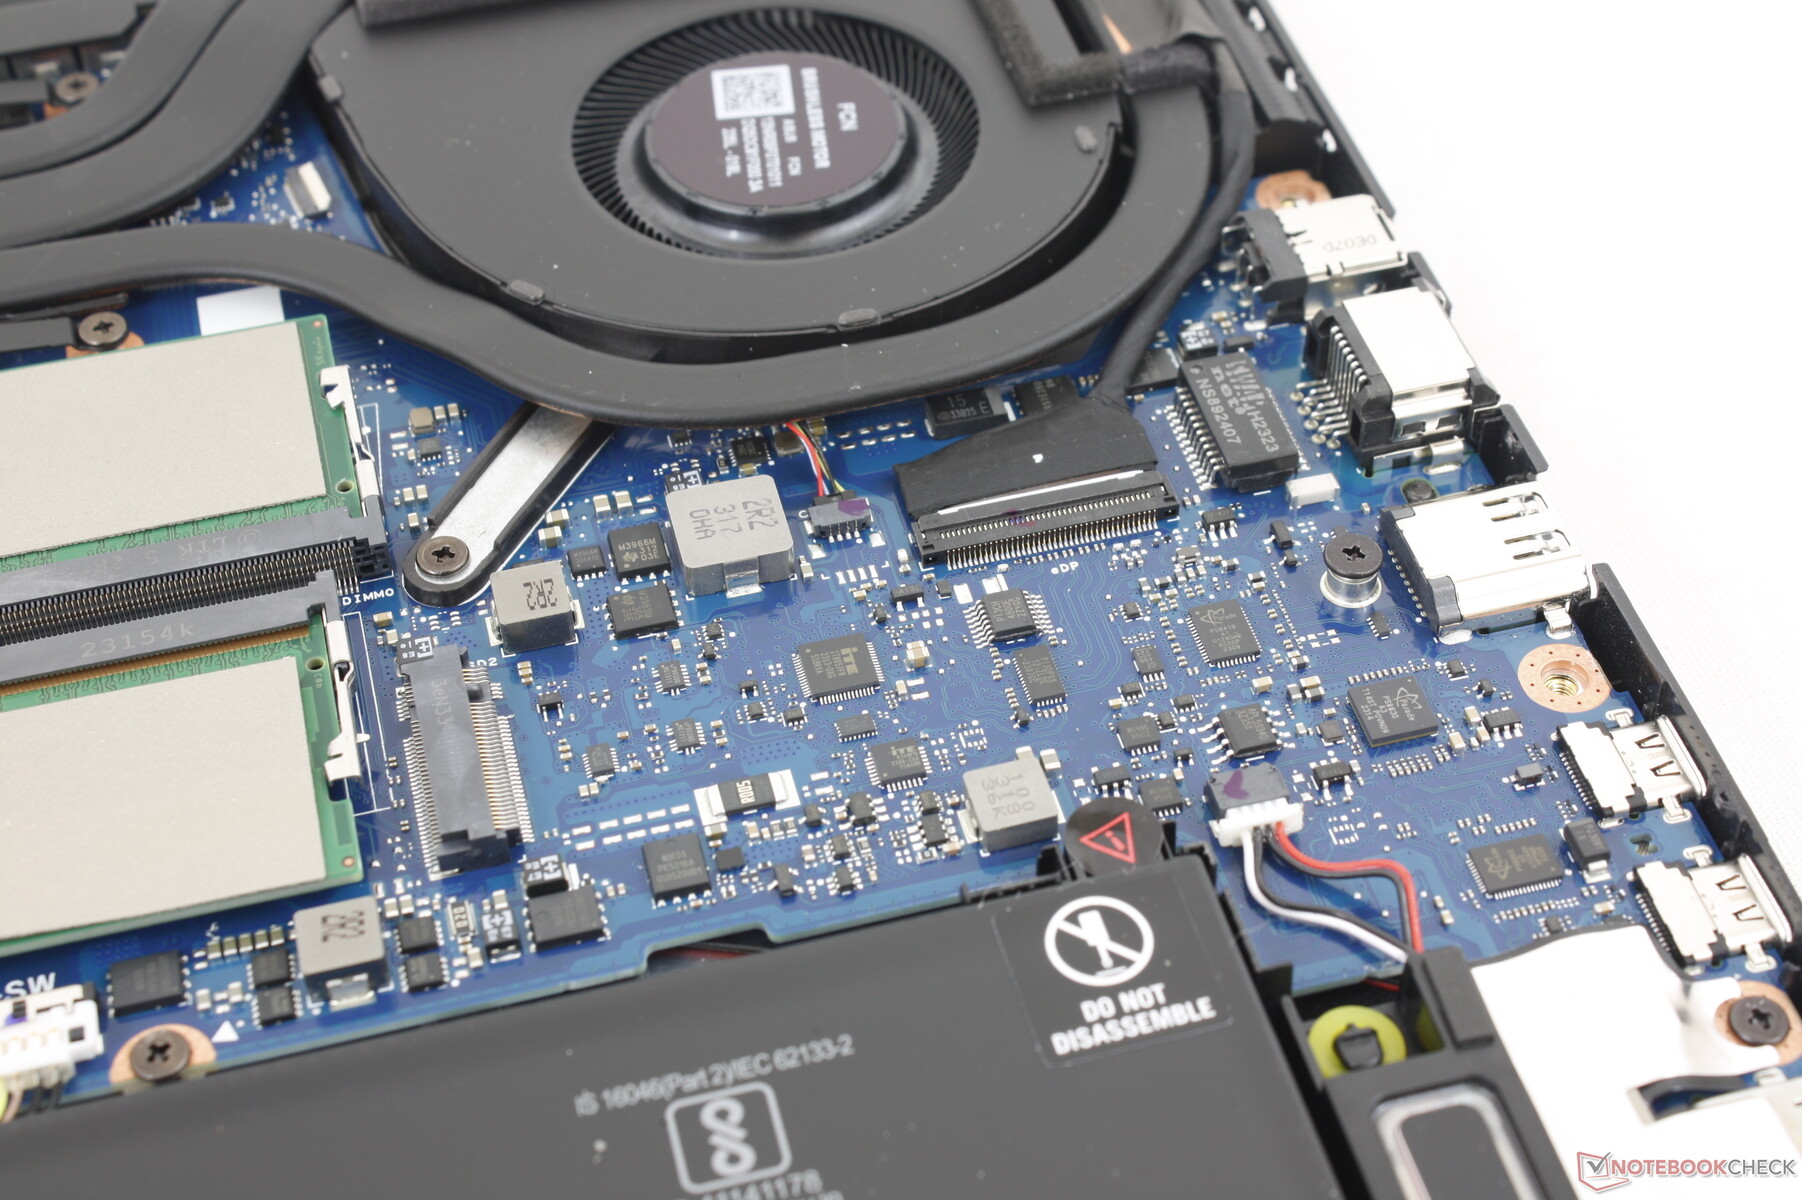
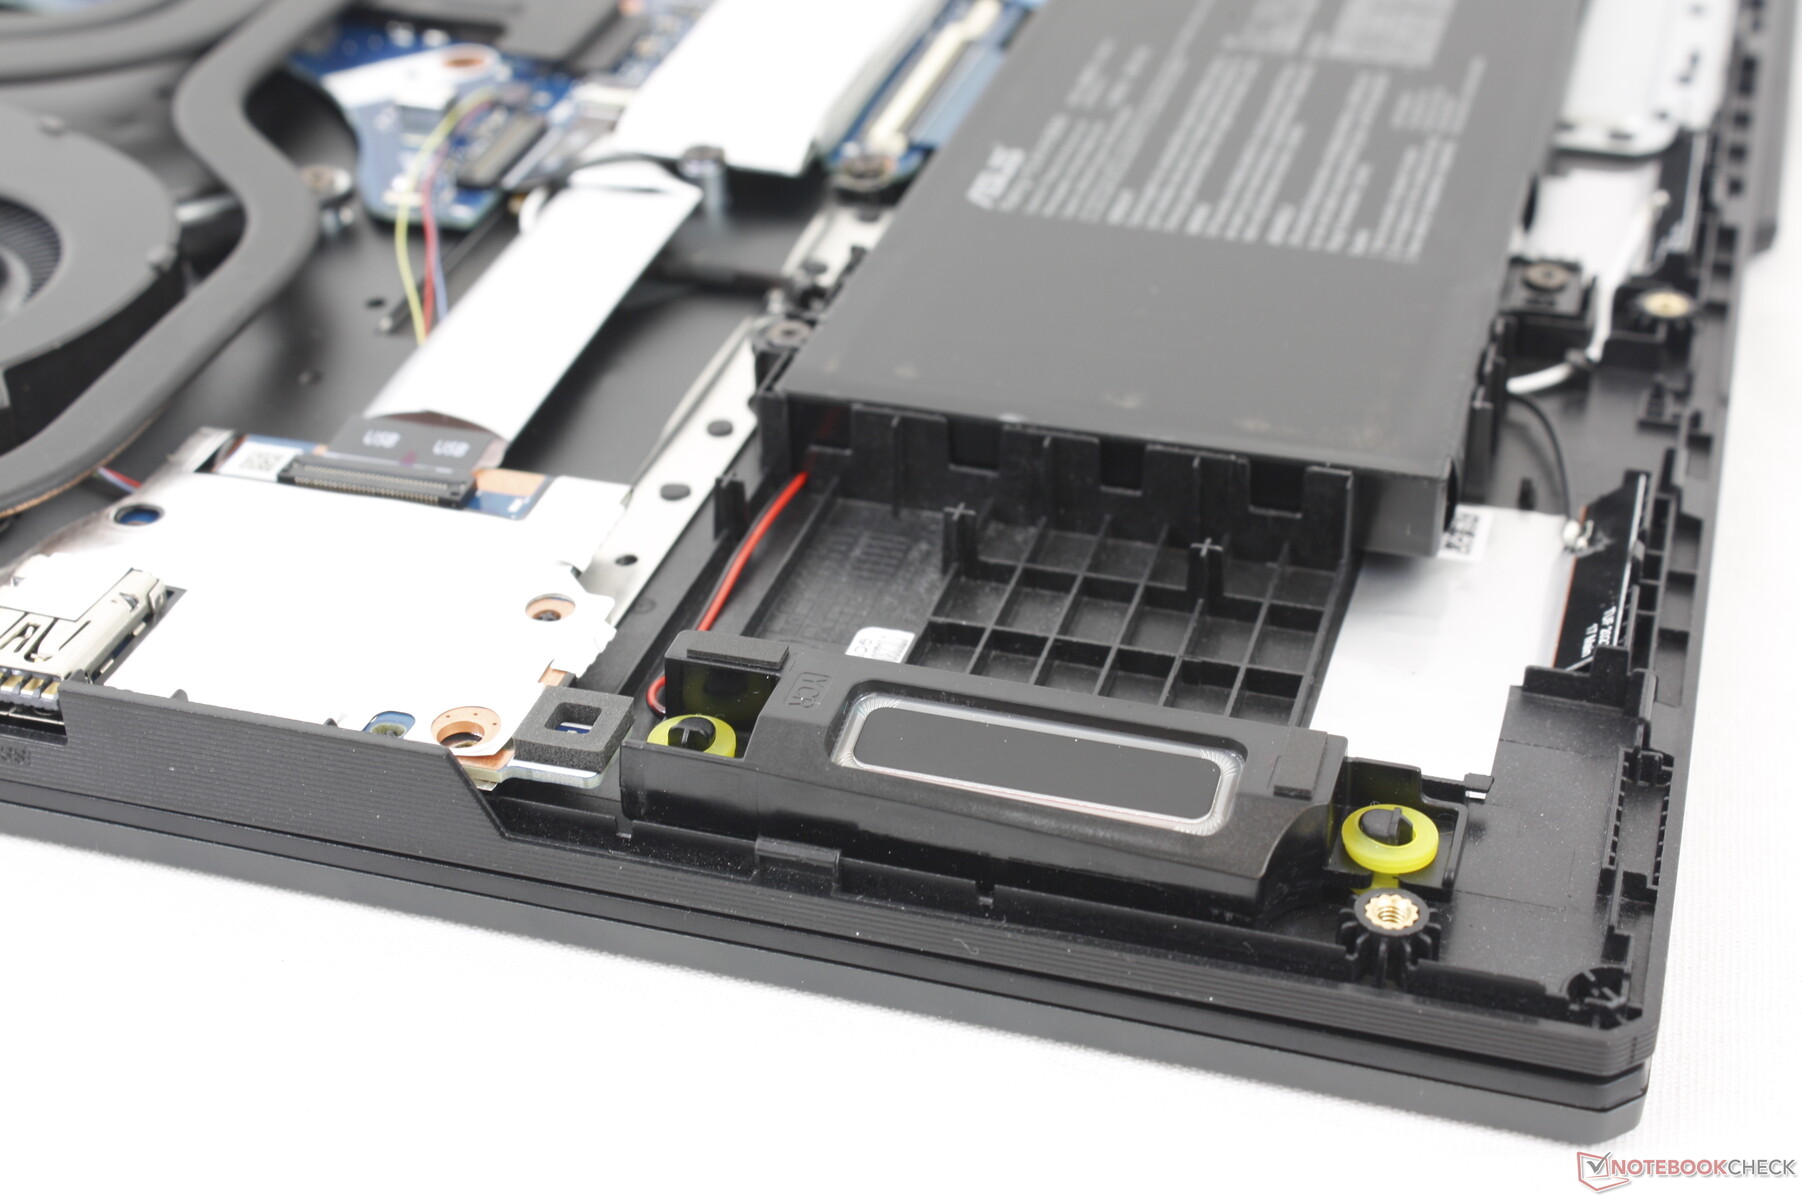
Den nedre panelen lossnar relativt enkelt efter att de 12 Phillips-skruvarna har tagits bort. Det finns inga större interna skillnader mellan Intel- och AMD-versionerna, så användarna får fortfarande två M.2 SSD-platser och två SODIMM-platser. RAM-minnet är begränsat till 4800 MHz.
Tillbehör och garanti
Det finns inget extra i förpackningen förutom nätadapter och pappersarbete. Den vanliga ettåriga begränsade garantin gäller vid köp i USA.
Inmatningsenheter
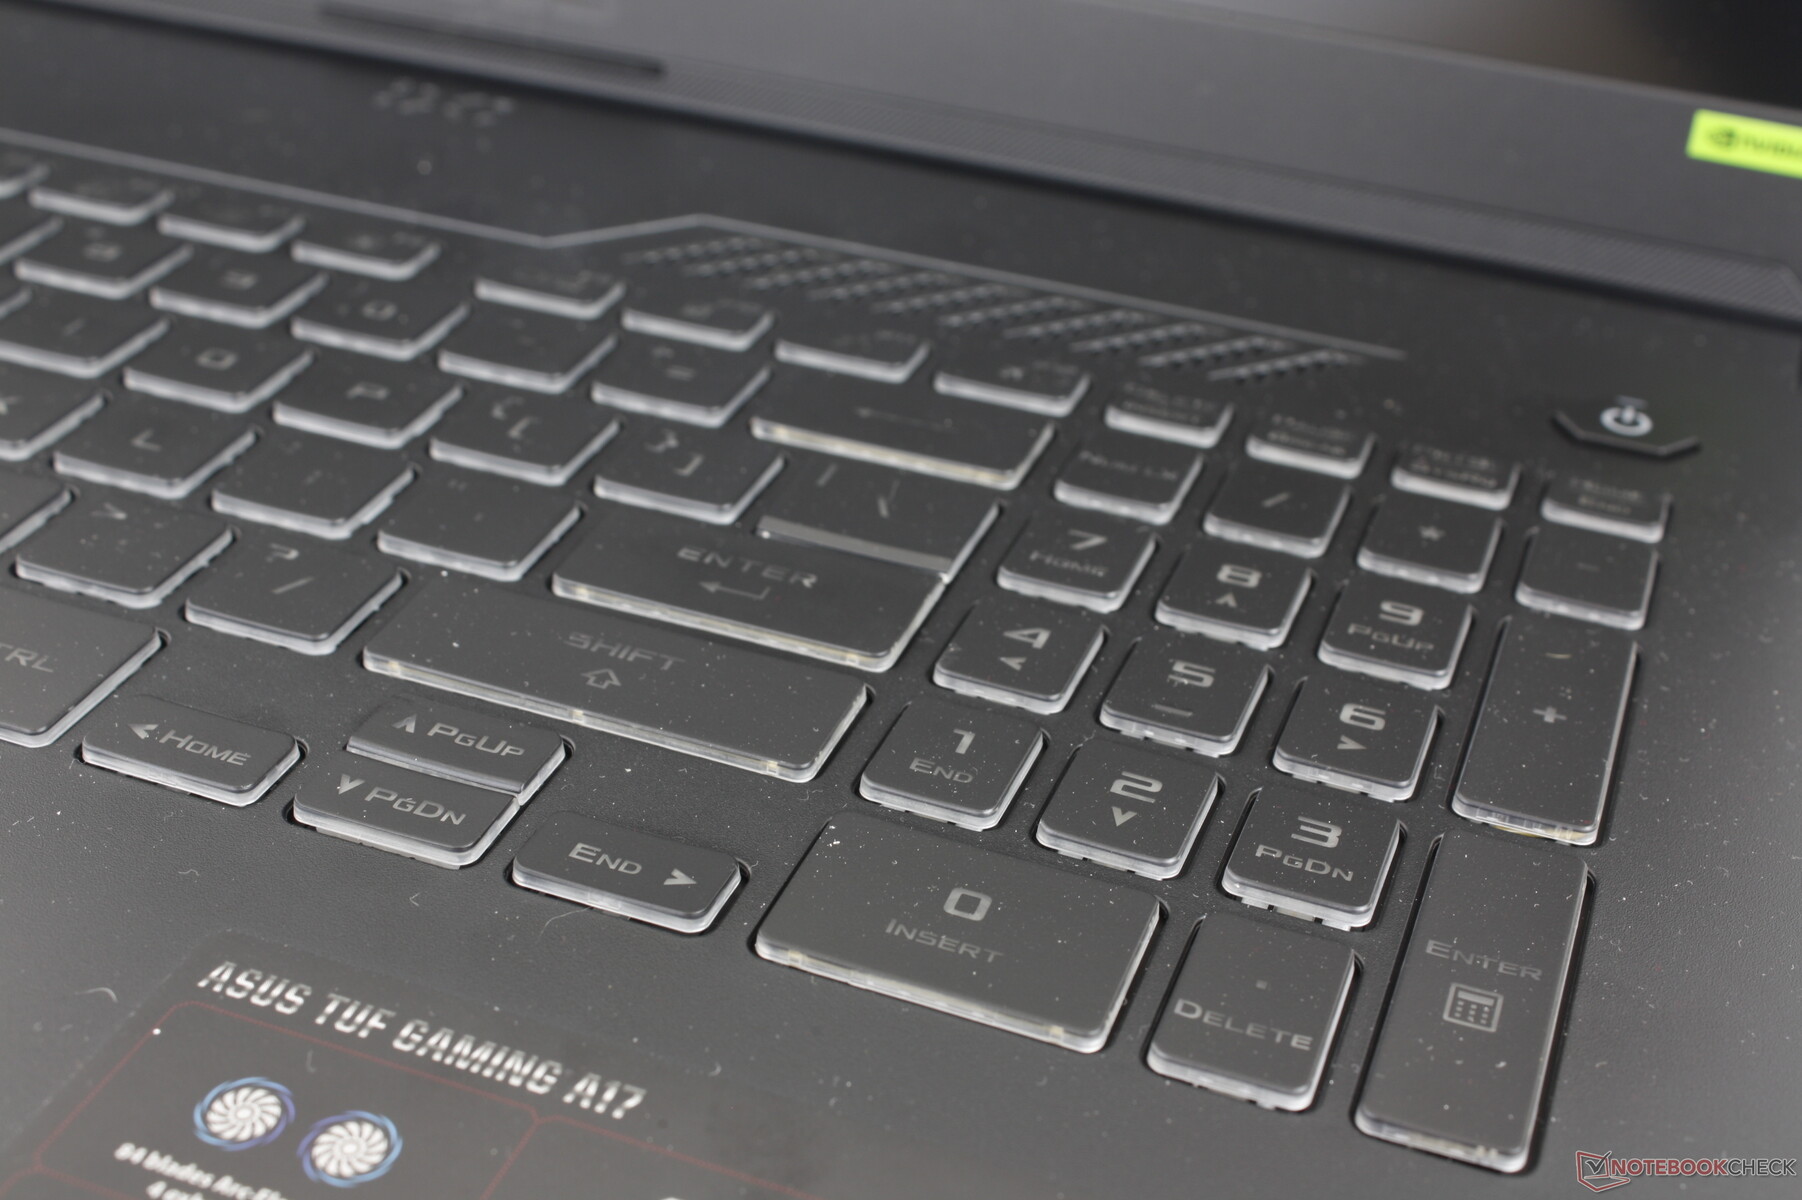
Tangentbord
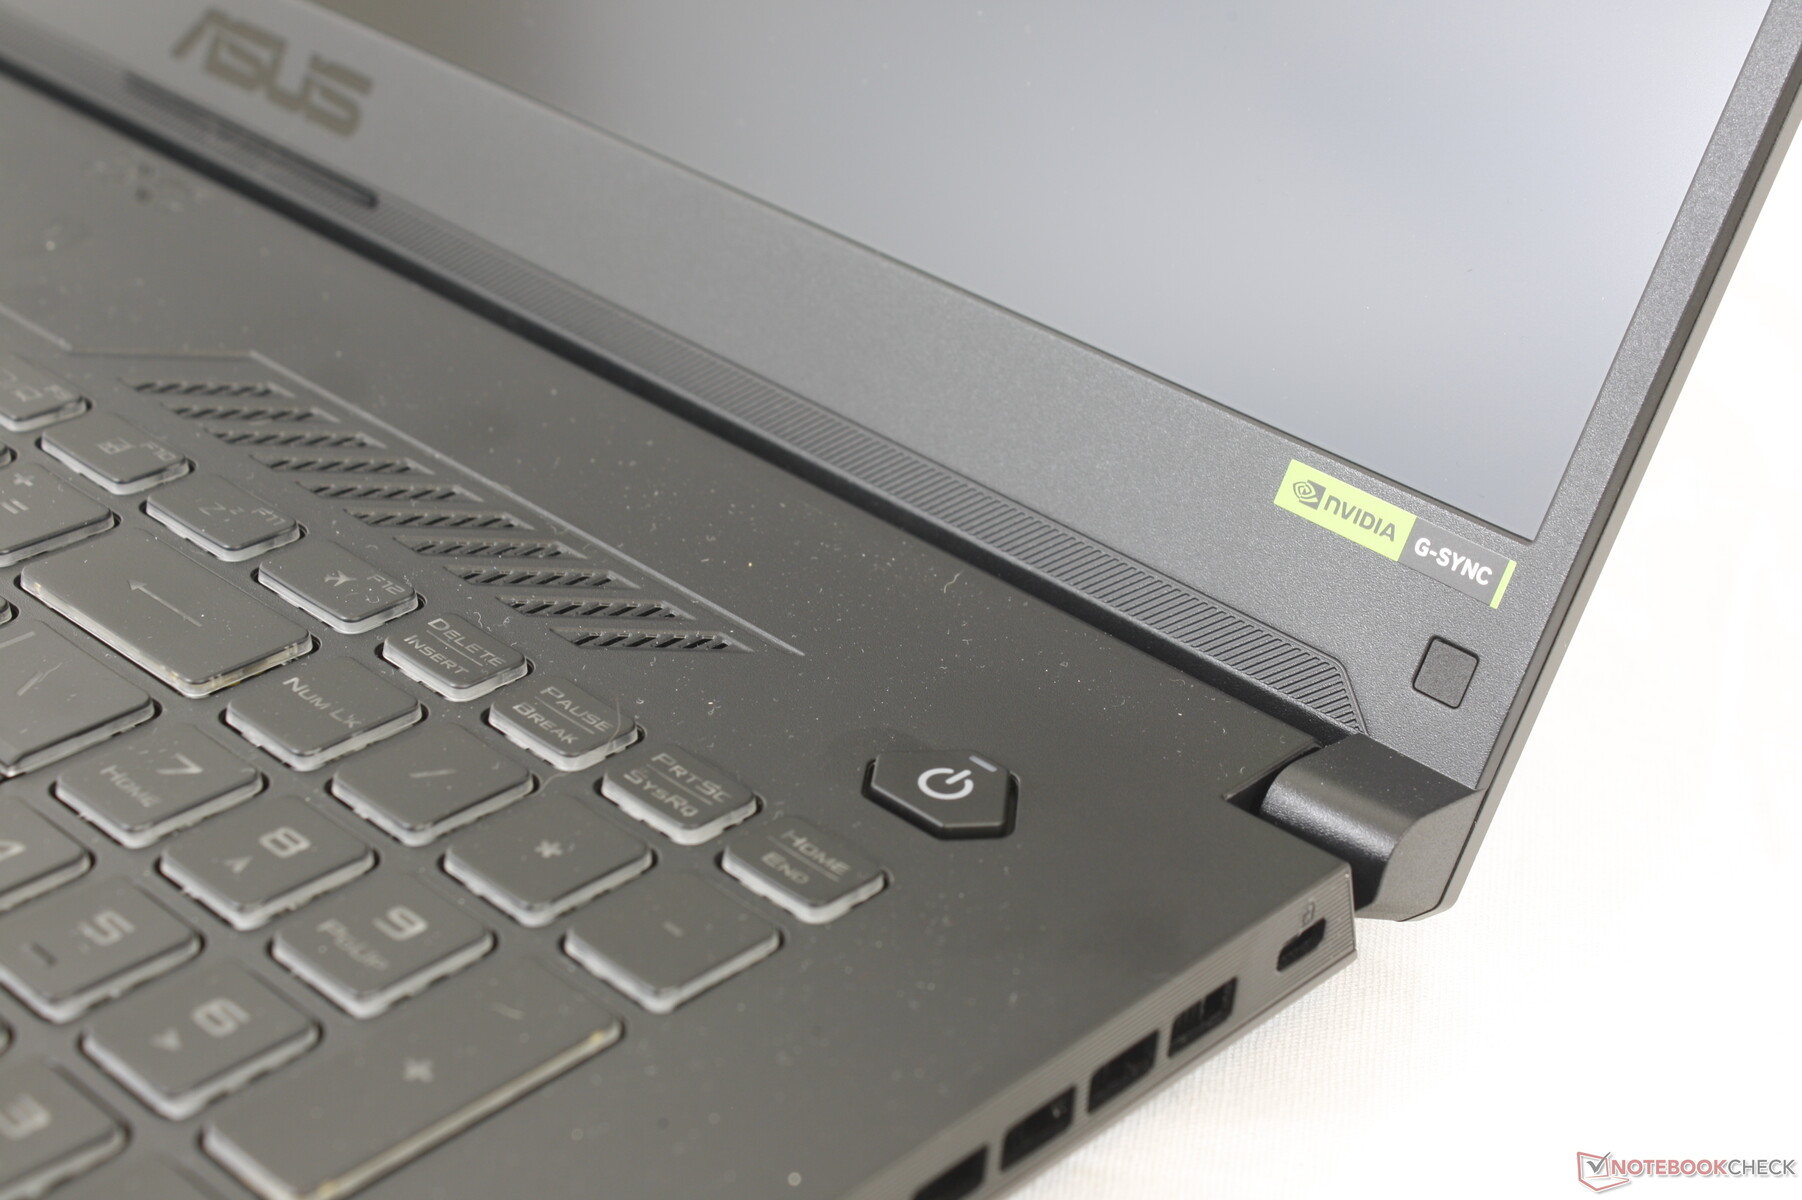
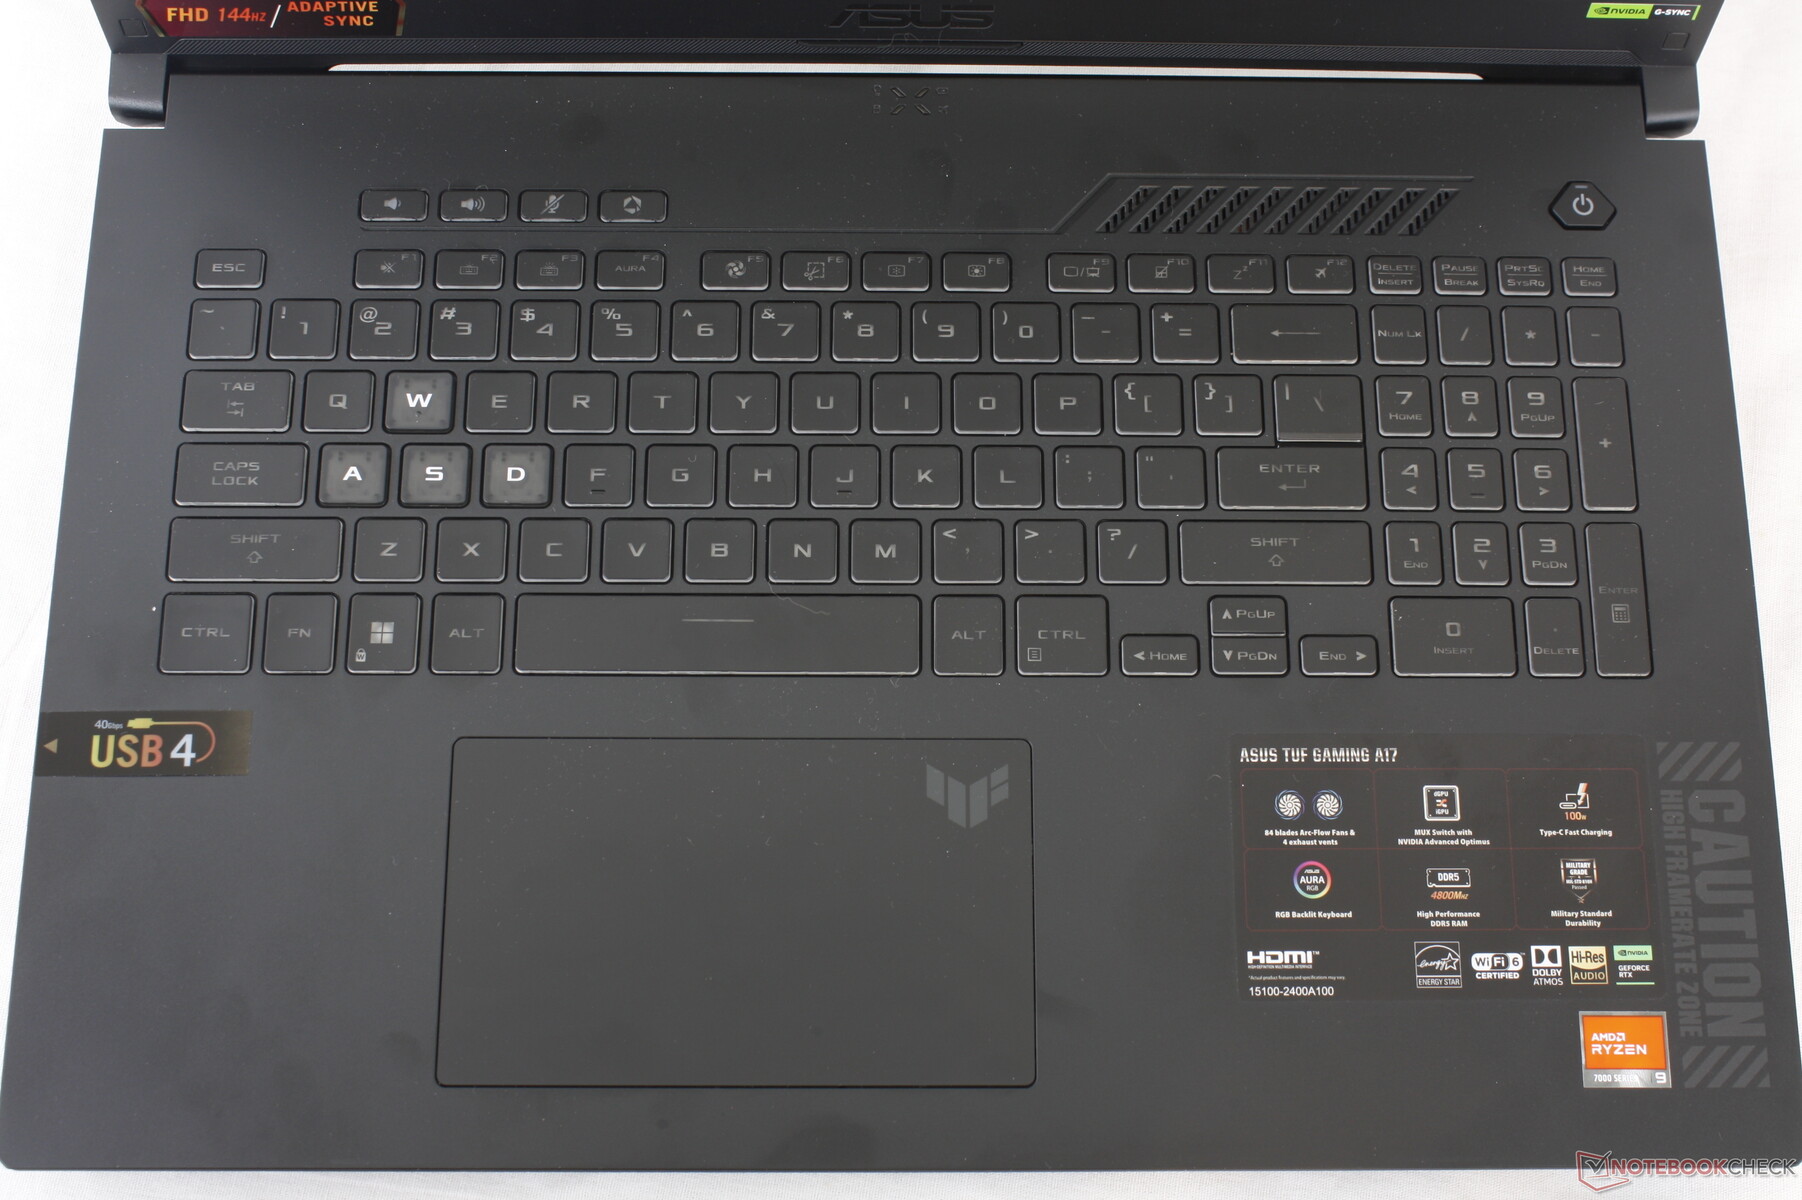
RGB-tangentbordet med tre zoner ger 1,7 mm slaglängd för att vara något djupare än tangenterna på de flesta Ultrabooks. Skrivupplevelsen är trevlig för en bärbar speldator så länge du kan förlåta de trånga piltangenterna och numpaden.
Tangenternas synlighet är inte bra eftersom det mörkgrå teckensnittet kontrasterar dåligt med de svarta tangentkåporna. Det är ett bisarrt beslut av Asus att bara markera WASD-bokstäverna i vitt medan alla andra symboler är mycket mörkare. Detta tvingar användaren att aktivera tangentbordets bakgrundsbelysning för bättre läsbarhet även under ljusa förhållanden eller om batteritiden är ett bekymmer.
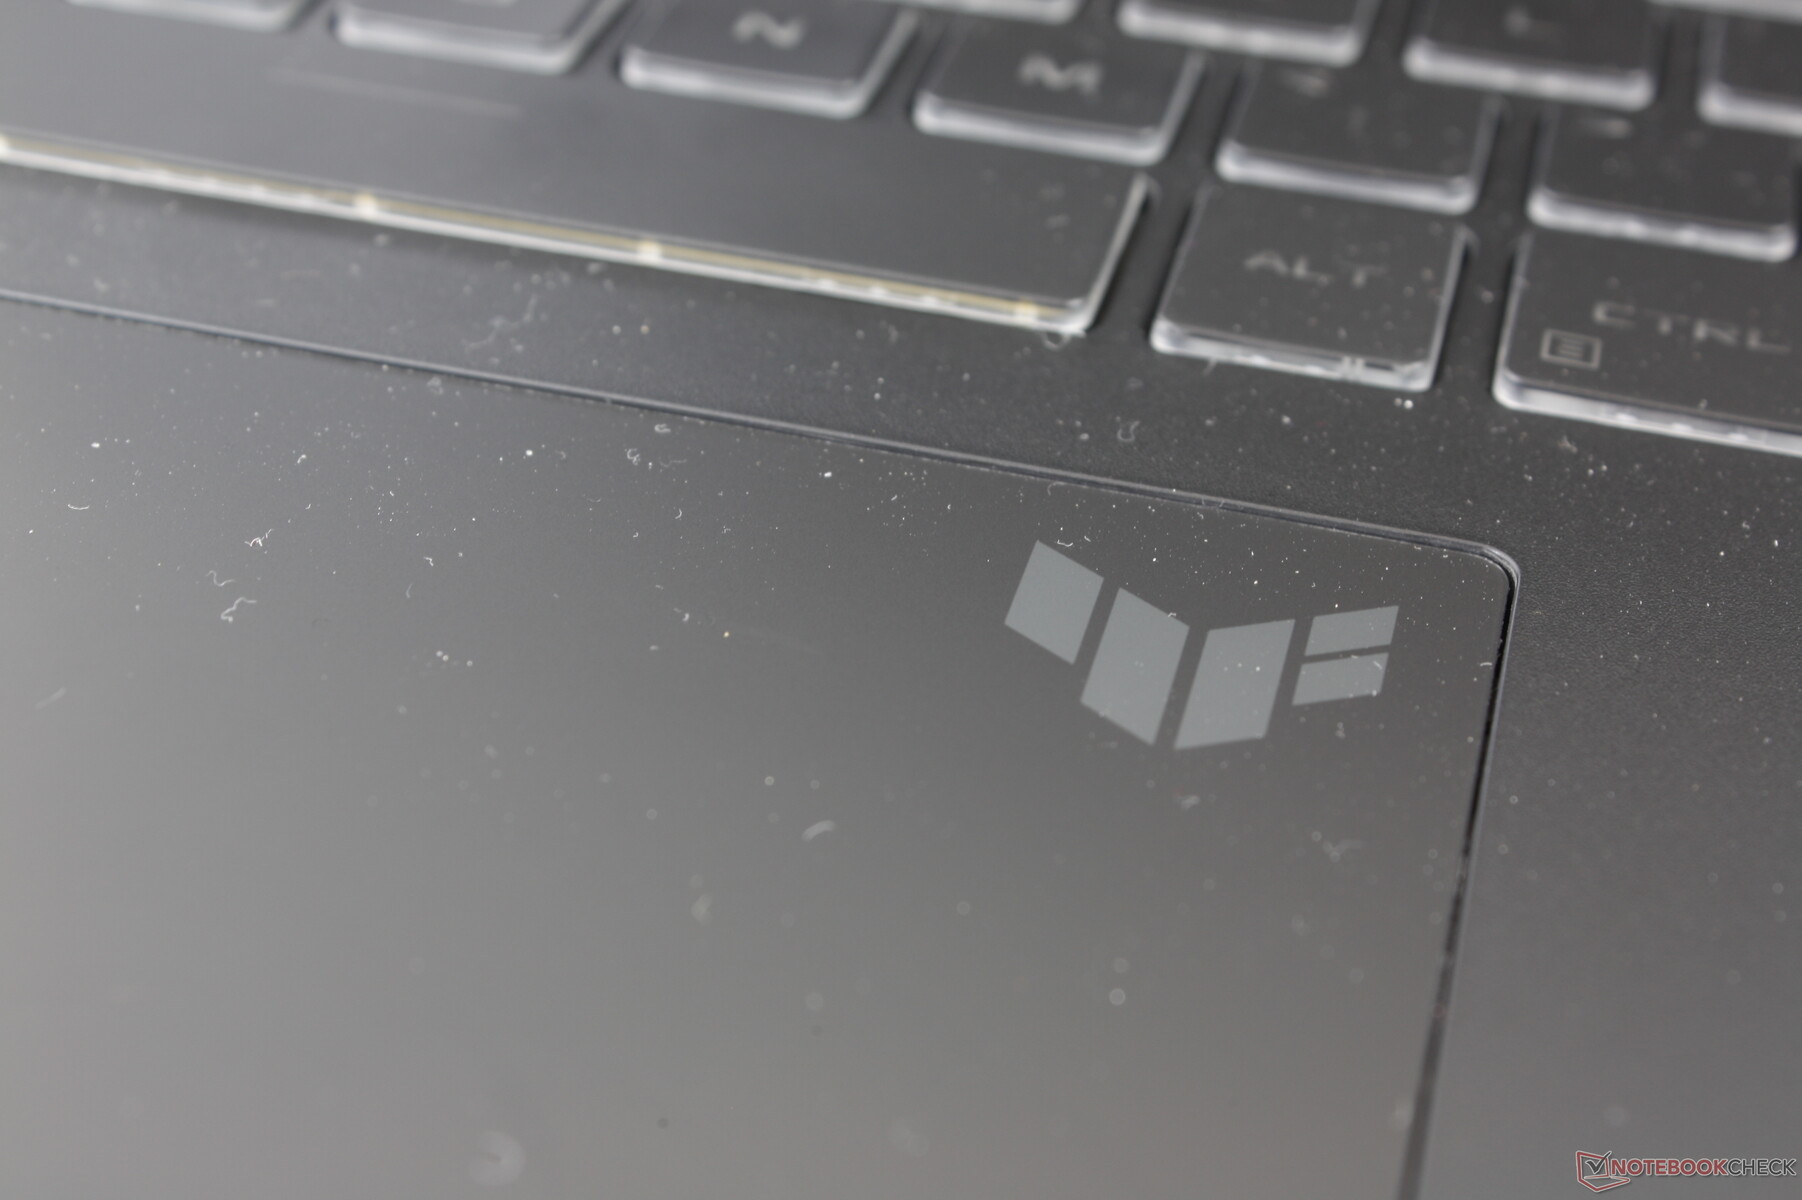
Pekplatta
Med 13 x 7,7 cm är klickplattan densamma som på TUF Gaming F17. Vi kan dock inte märka några problem med vår klickplatta här medan den på vår Intel-version hade en "död punkt" nära det nedre högra hörnet. Feedback är anständig om inte något på den mjuka sidan när den trycks in.

Display
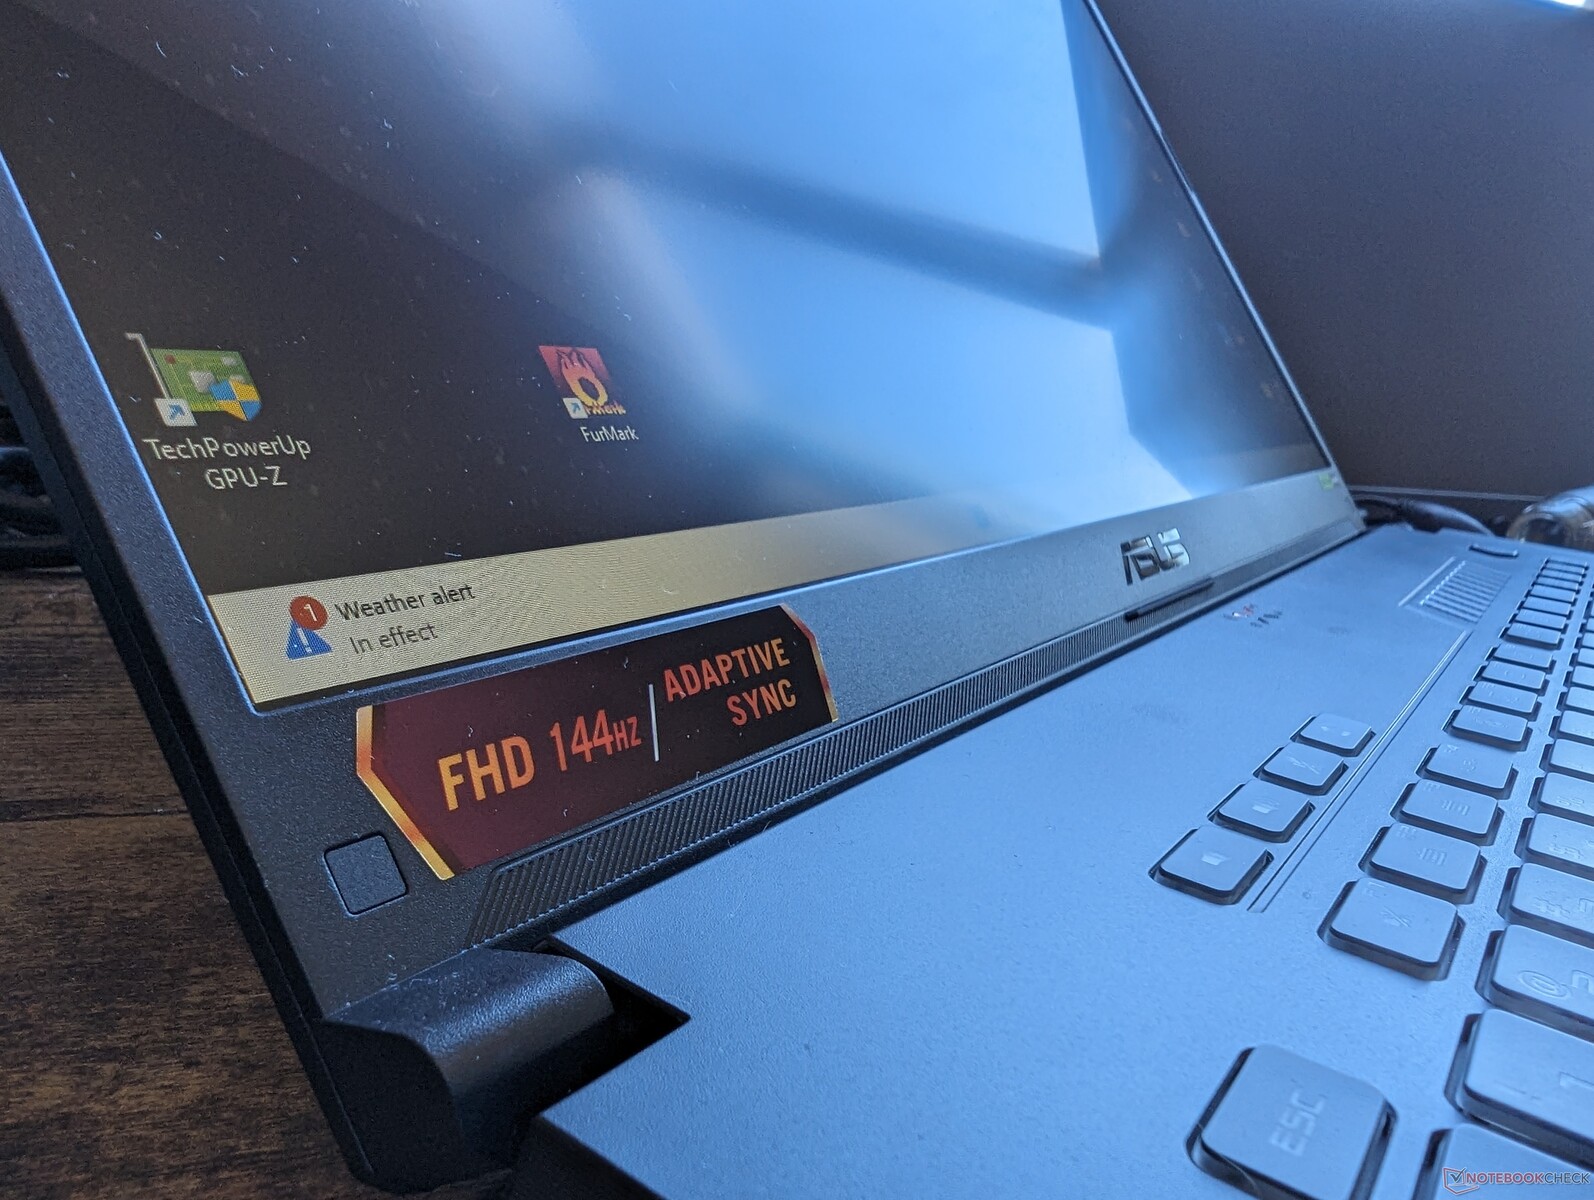
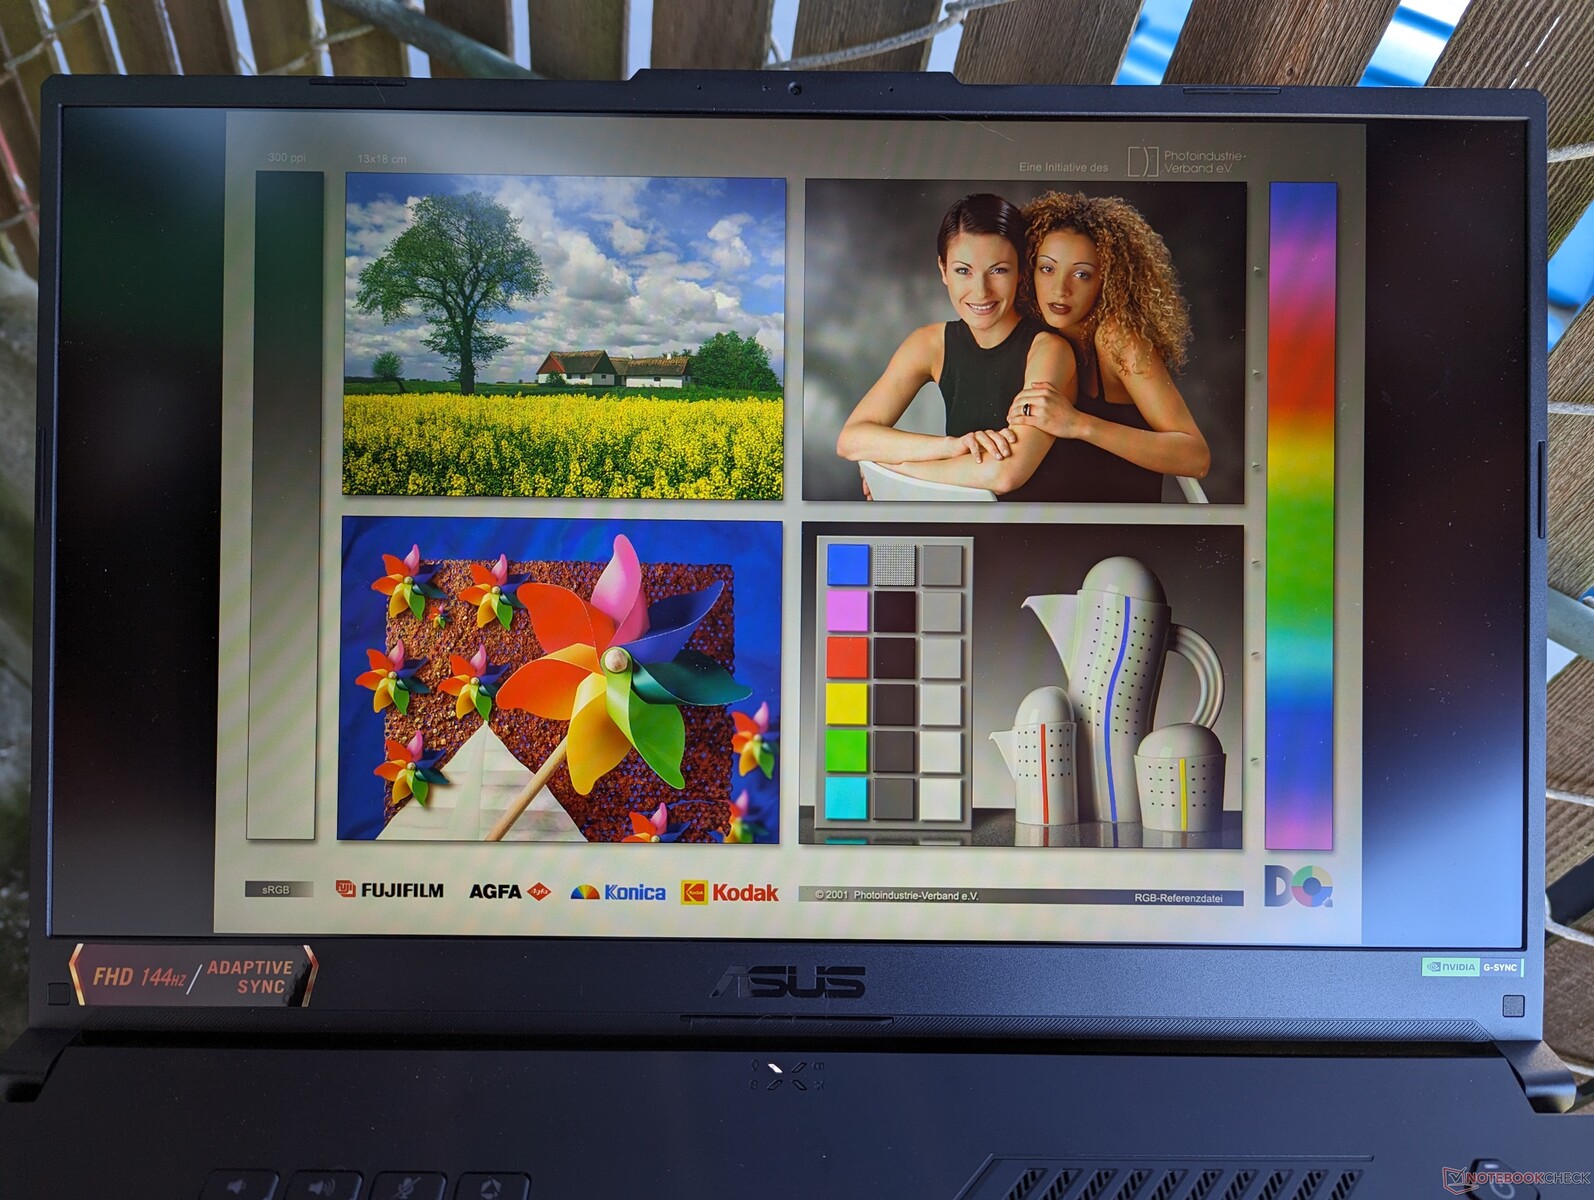
Vår 1080p AU Optronics B173HAN04.9 IPS-panel är en instegsskärm som finns på många andra bärbara speldatorer, inklusive MSI Pulse 17 eller Katana 17. Det är vanligtvis det billigaste och lägsta alternativet som kännetecknas av sin dåliga ~60% sRGB-färgåtergivning och långsamma svartvita svarstider. Tack och lov erbjuder Asus totalt tre skärmar att välja mellan för sin FA707-serie:
- 1920 x 1080, IPS, ~60% sRGB, 144 Hz
- 2560 x 1440, IPS, 100% DCI-P3, 240 Hz
- 2560 x 1440, IPS, 100% sRGB, 360 Hz
Det finns inga OLED- eller mini-LED-alternativ, men vi rekommenderar starkt någon av de två 1440p-panelerna eftersom de alla erbjuder betydligt bättre färger än 1080p-baspanelen samtidigt som de bibehåller både adaptiv synkronisering och Advanced Optimus.

| |||||||||||||||||||||||||
Distribution av ljusstyrkan: 91 %
Mitt på batteriet: 255.9 cd/m²
Kontrast: 1219:1 (Svärta: 0.21 cd/m²)
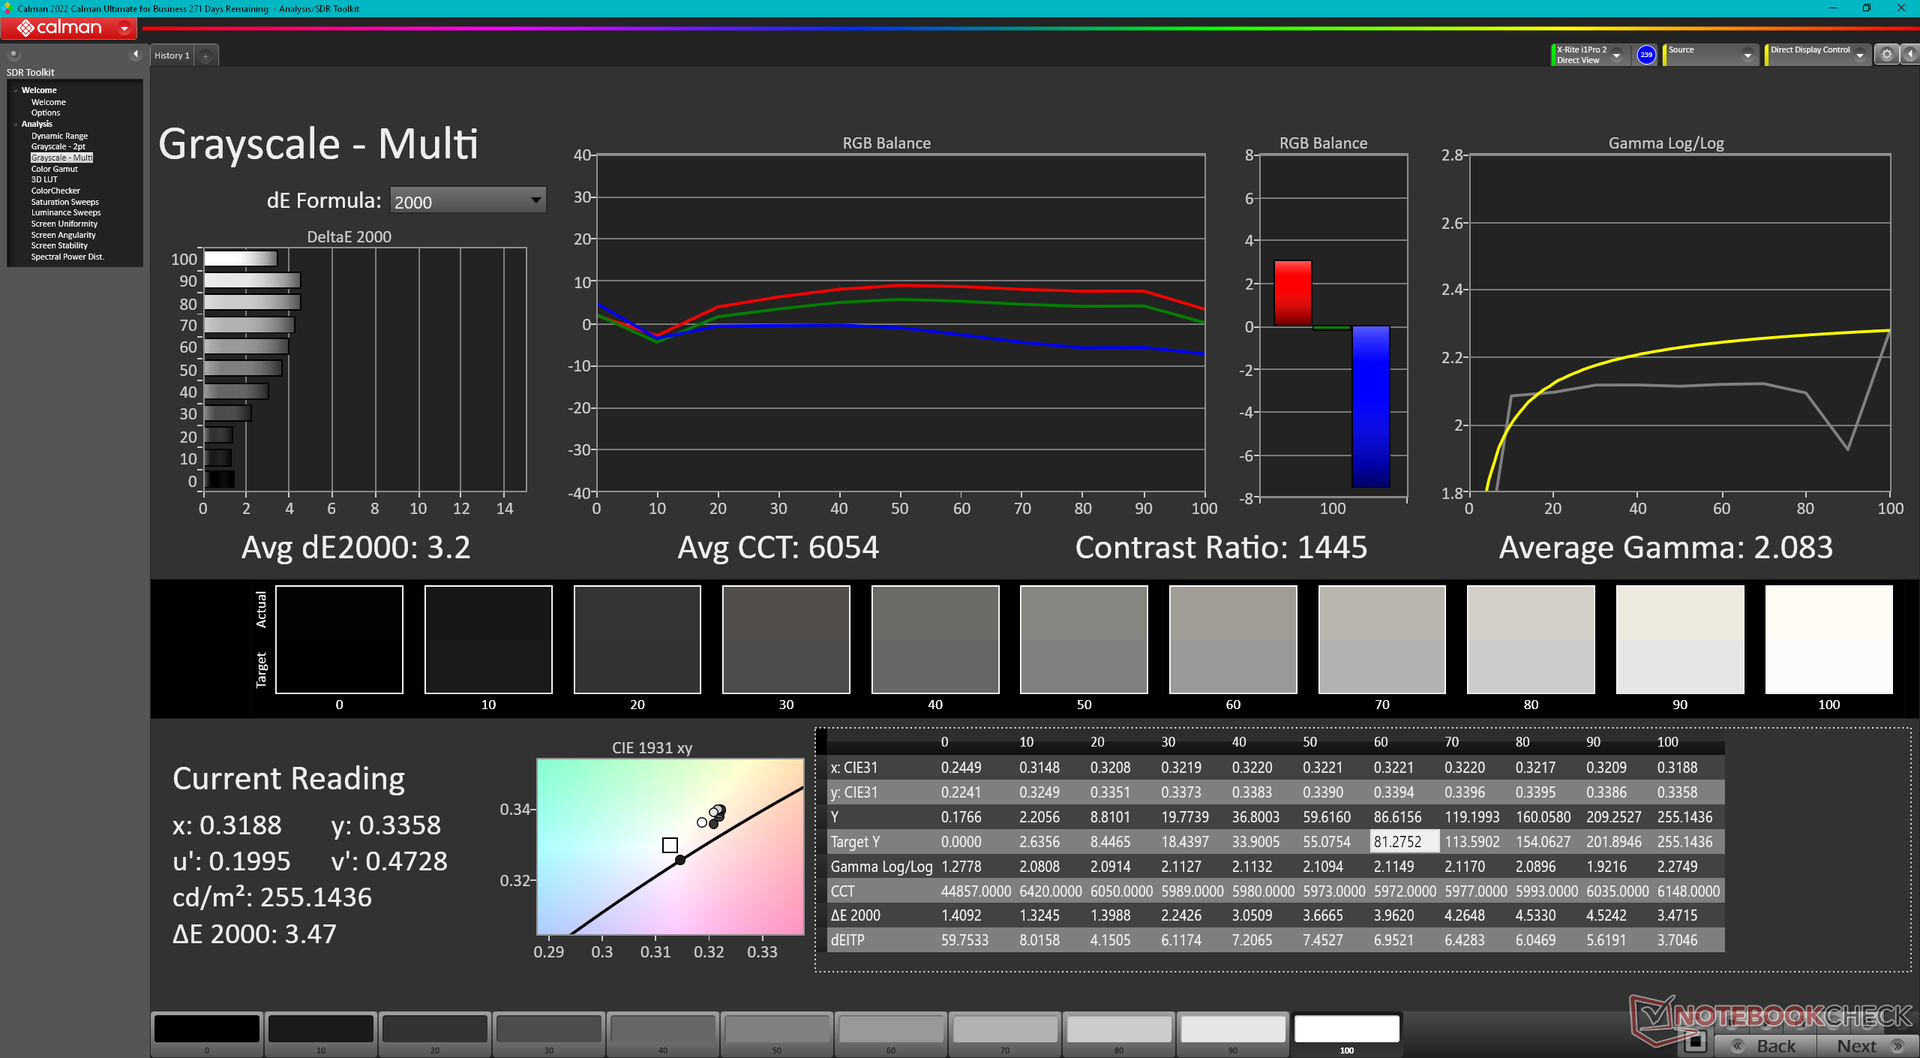
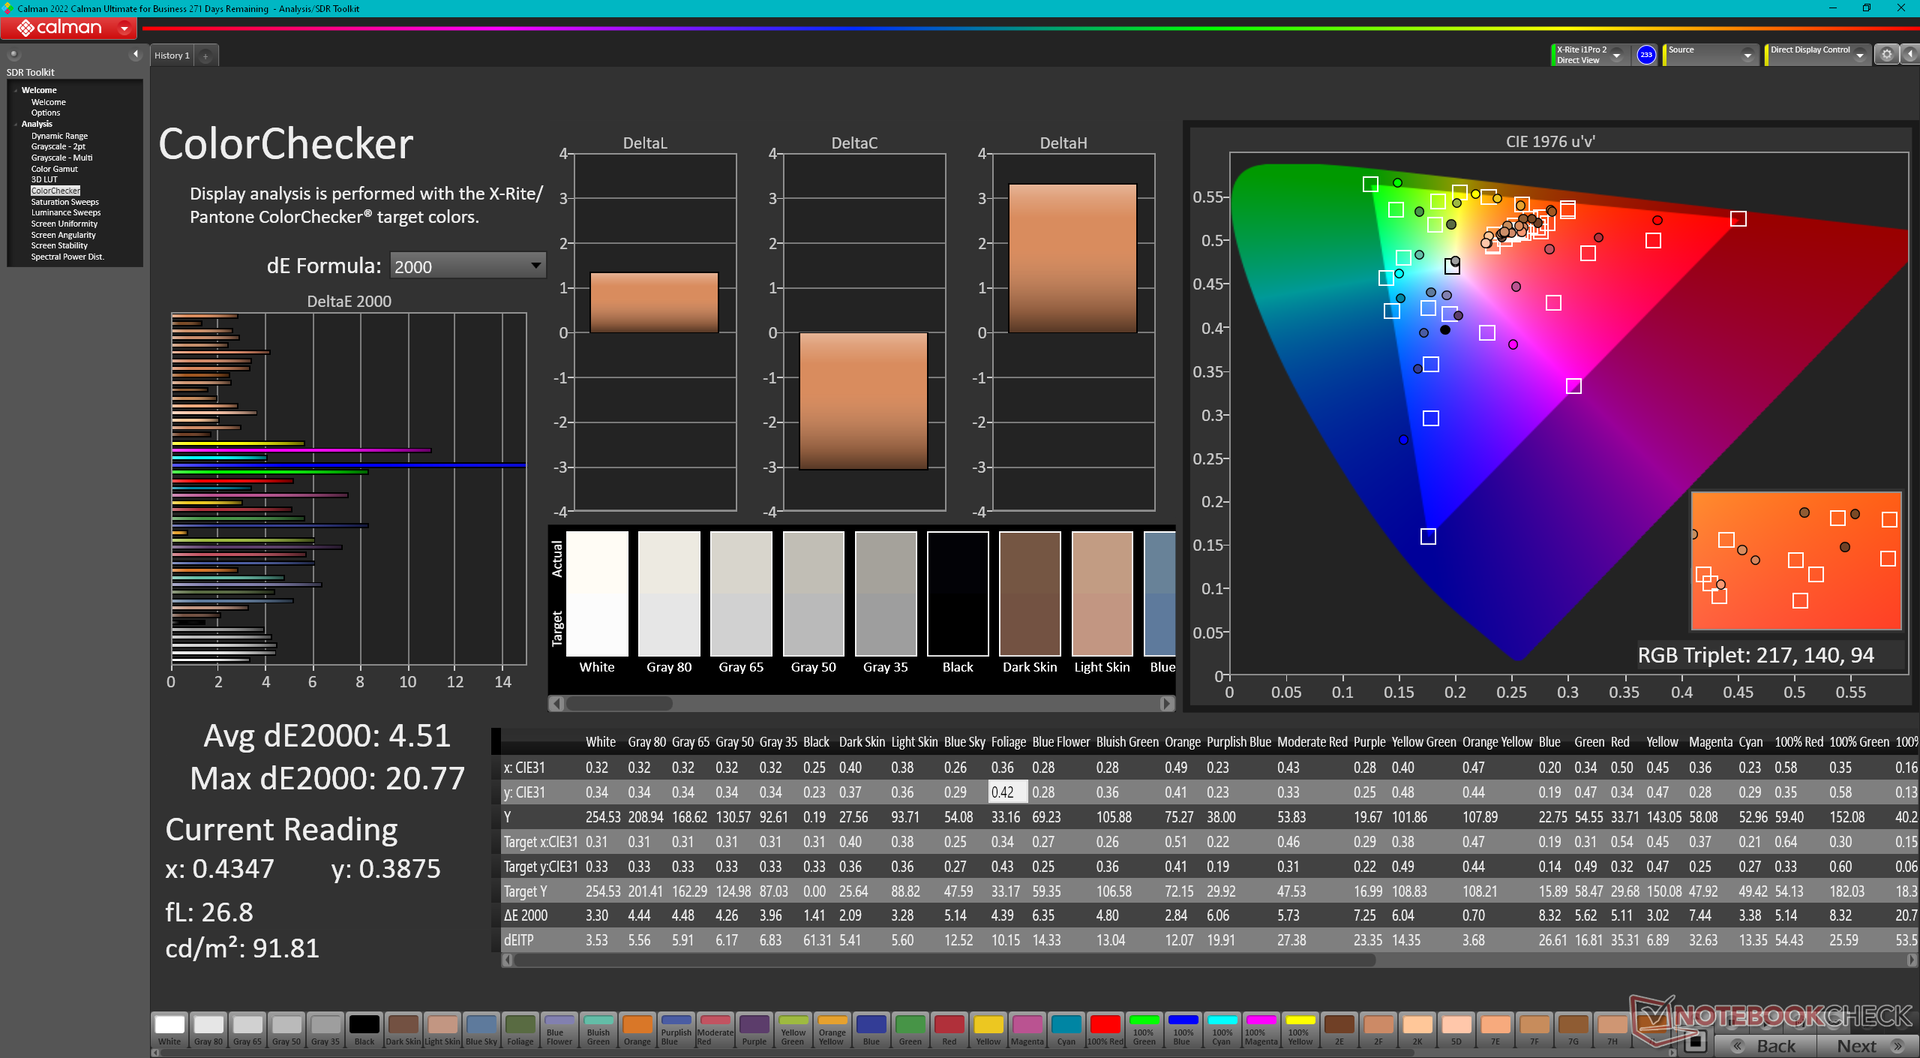
ΔE ColorChecker Calman: 4.51 | ∀{0.5-29.43 Ø4.71}
calibrated: 1.82
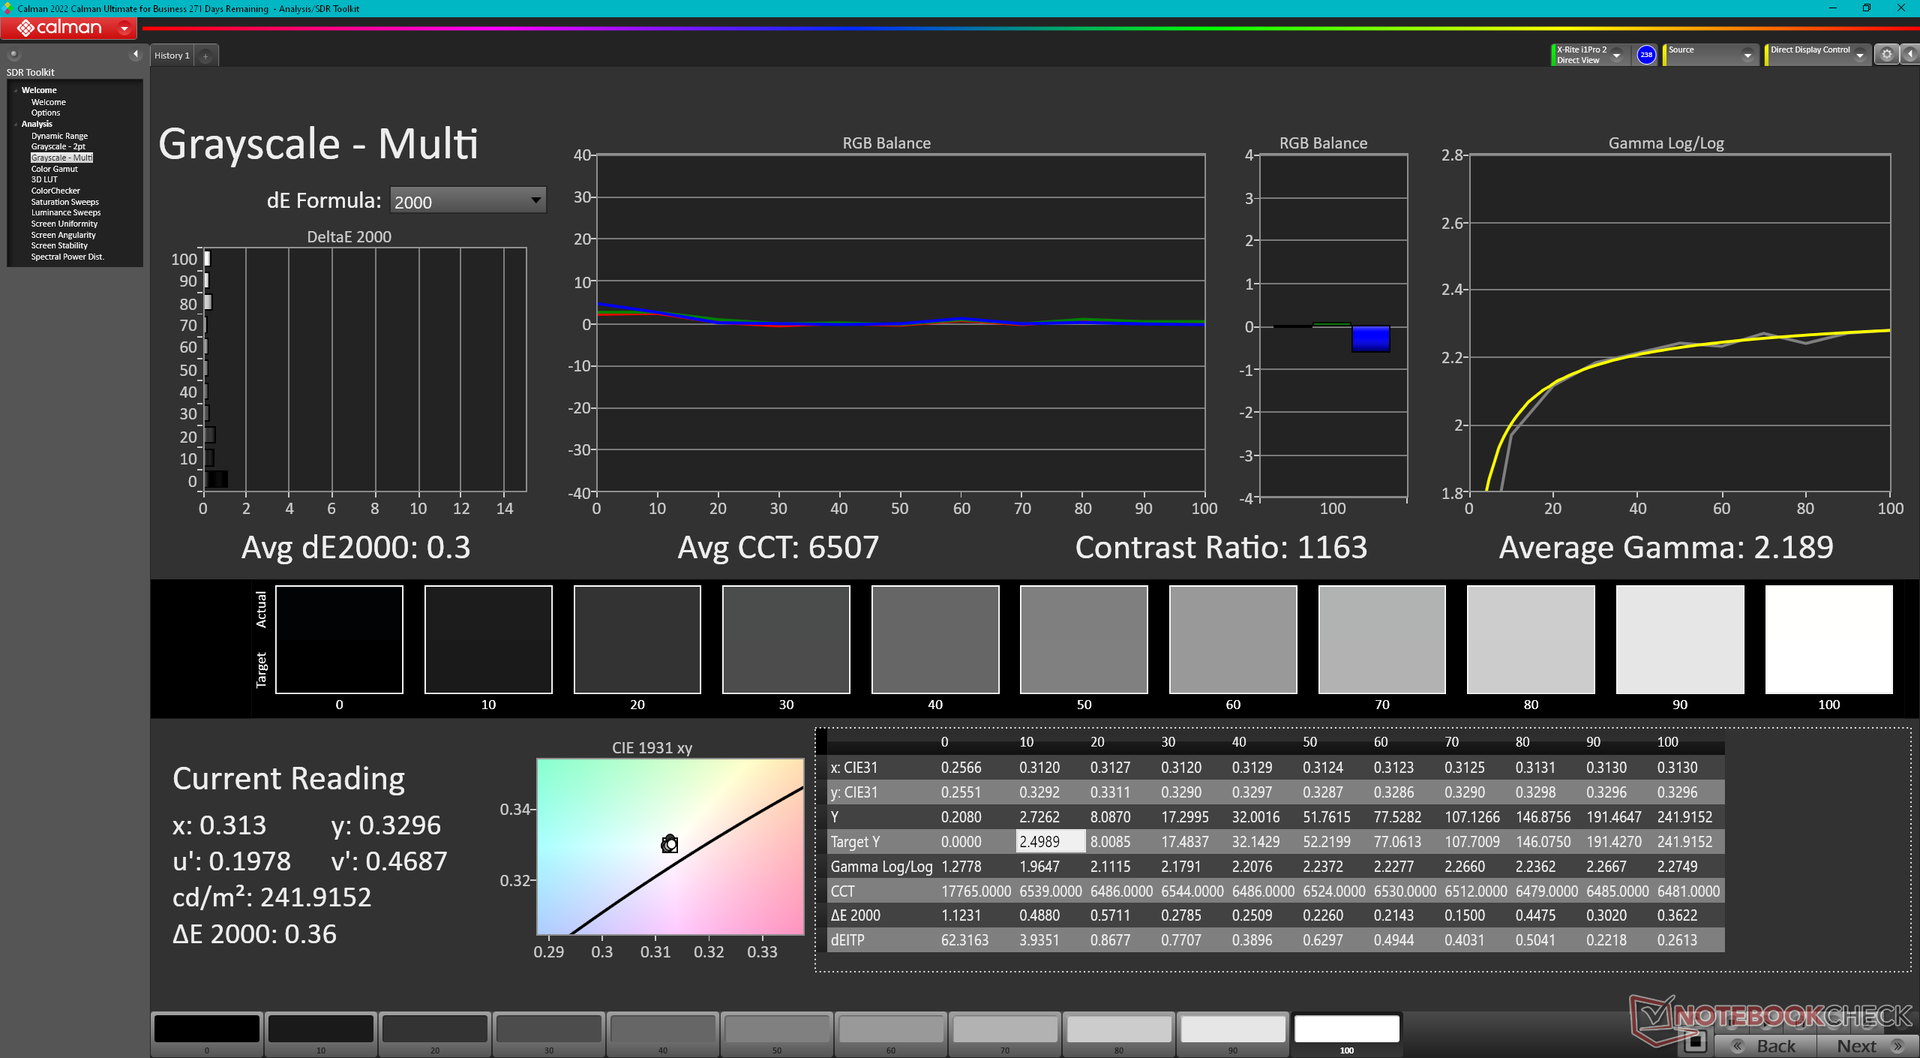
ΔE Greyscale Calman: 3.2 | ∀{0.09-98 Ø4.96}
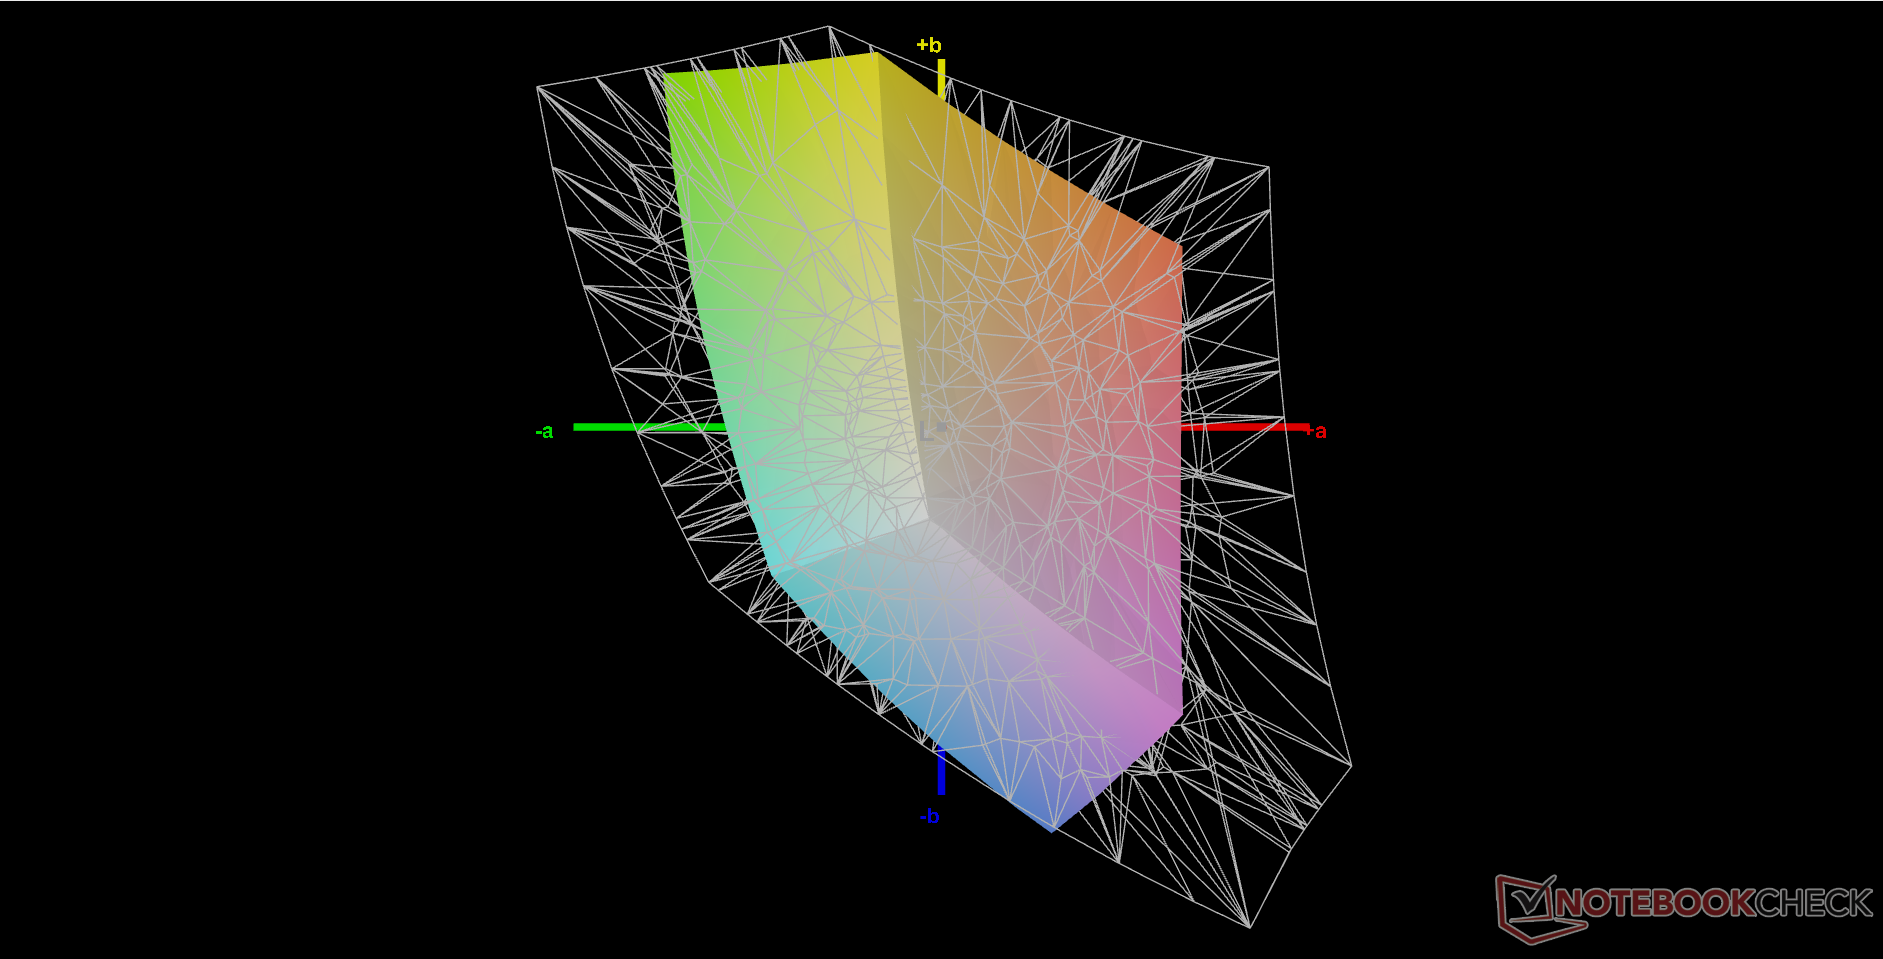
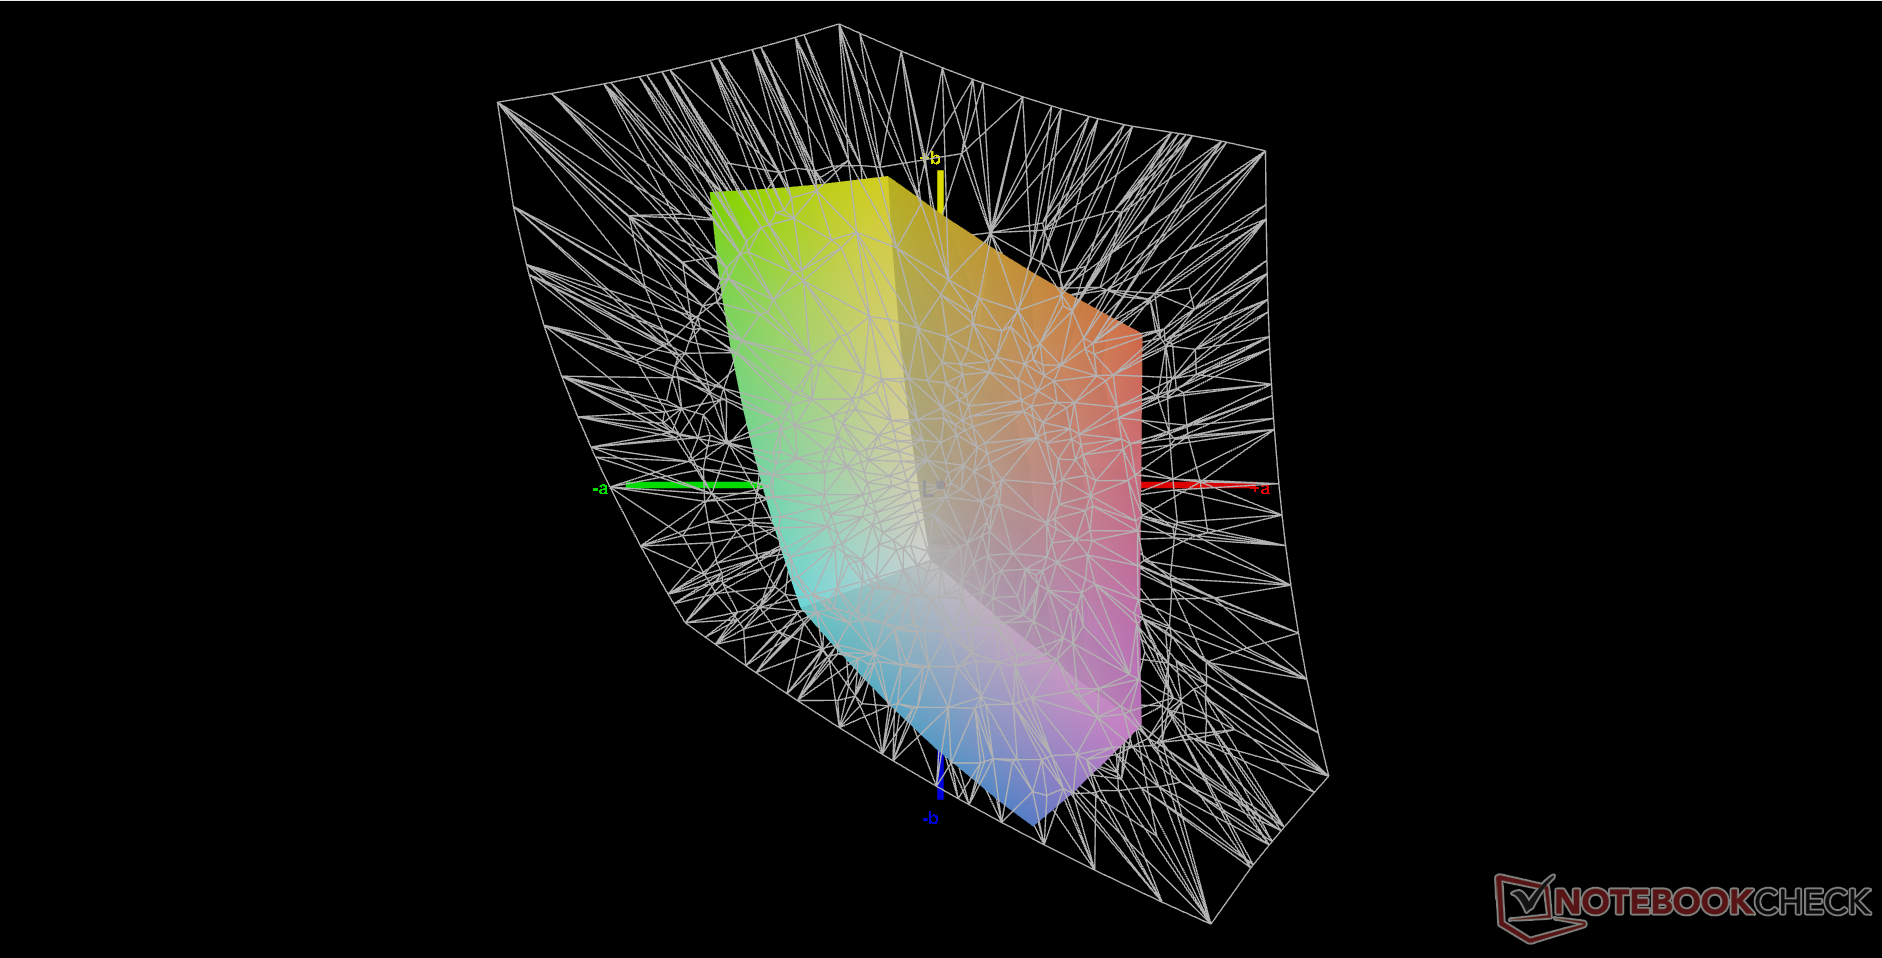
41% AdobeRGB 1998 (Argyll 3D)
59.1% sRGB (Argyll 3D)
39.7% Display P3 (Argyll 3D)
Gamma: 2.08
CCT: 6054 K
| Asus TUF Gaming A17 FA707XI-NS94 AU Optronics B173HAN04.9, IPS, 1920x1080, 17.3" | Asus TUF Gaming F17 FX707Z-HX011W AU Optronics B173HAN04.9 (AUO4B9D), IPS, 1920x1080, 17.3" | MSI Pulse 17 B13VGK AU Optronics B173HAN04.9, IPS, 1920x1080, 17.3" | MSI Katana 17 B13VFK B173HAN04.9, IPS LED, 1920x1080, 17.3" | Razer Blade 17 (i7-12800H, RTX 3070 Ti) BOE CQ NE173QHM-NZ1 (BOE09F9), IPS, 2560x1440, 17.3" | HP Pavilion Gaming 17-cd2146ng LGD0611, IPS, 1920x1080, 17.3" | |
|---|---|---|---|---|---|---|
| Display | 1% | -3% | 3% | 108% | 63% | |
| Display P3 Coverage (%) | 39.7 | 40.2 1% | 38.4 -3% | 40.8 3% | 97.9 147% | 64.8 63% |
| sRGB Coverage (%) | 59.1 | 59.7 1% | 57.5 -3% | 61 3% | 99.9 69% | 96.8 64% |
| AdobeRGB 1998 Coverage (%) | 41 | 41.5 1% | 39.7 -3% | 42.2 3% | 85.5 109% | 66.5 62% |
| Response Times | -6% | 16% | 9% | 60% | 68% | |
| Response Time Grey 50% / Grey 80% * (ms) | 39 ? | 39.2 ? -1% | 31.2 ? 20% | 33 ? 15% | 15.2 ? 61% | 12.7 ? 67% |
| Response Time Black / White * (ms) | 26.9 ? | 29.6 ? -10% | 23.6 ? 12% | 26 ? 3% | 11.2 ? 58% | 8.7 ? 68% |
| PWM Frequency (Hz) | ||||||
| Screen | -10% | 0% | -9% | -18% | 16% | |
| Brightness middle (cd/m²) | 255.9 | 287 12% | 254 -1% | 267 4% | 341 33% | 328 28% |
| Brightness (cd/m²) | 248 | 268 8% | 250 1% | 256 3% | 308 24% | 317 28% |
| Brightness Distribution (%) | 91 | 89 -2% | 91 0% | 93 2% | 82 -10% | 94 3% |
| Black Level * (cd/m²) | 0.21 | 0.17 19% | 0.14 33% | 0.21 -0% | 0.45 -114% | 0.23 -10% |
| Contrast (:1) | 1219 | 1688 38% | 1814 49% | 1271 4% | 758 -38% | 1426 17% |
| Colorchecker dE 2000 * | 4.51 | 5.1 -13% | 4.52 -0% | 4.7 -4% | 4.16 8% | 3.83 15% |
| Colorchecker dE 2000 max. * | 20.77 | 8.72 58% | 21.22 -2% | 20.4 2% | 8.14 61% | 8.51 59% |
| Colorchecker dE 2000 calibrated * | 1.82 | 5.1 -180% | 4.52 -148% | 4.5 -147% | 3 -65% | 0.83 54% |
| Greyscale dE 2000 * | 3.2 | 4.24 -33% | 1 69% | 1.5 53% | 5.09 -59% | 4.9 -53% |
| Gamma | 2.08 106% | 2.44 90% | 2.44 90% | 2.12 104% | 2.48 89% | 2.177 101% |
| CCT | 6054 107% | 6008 108% | 6502 100% | 6552 99% | 6884 94% | 7881 82% |
| Totalt genomsnitt (program/inställningar) | -5% /
-7% | 4% /
2% | 1% /
-4% | 50% /
20% | 49% /
33% |
* ... mindre är bättre
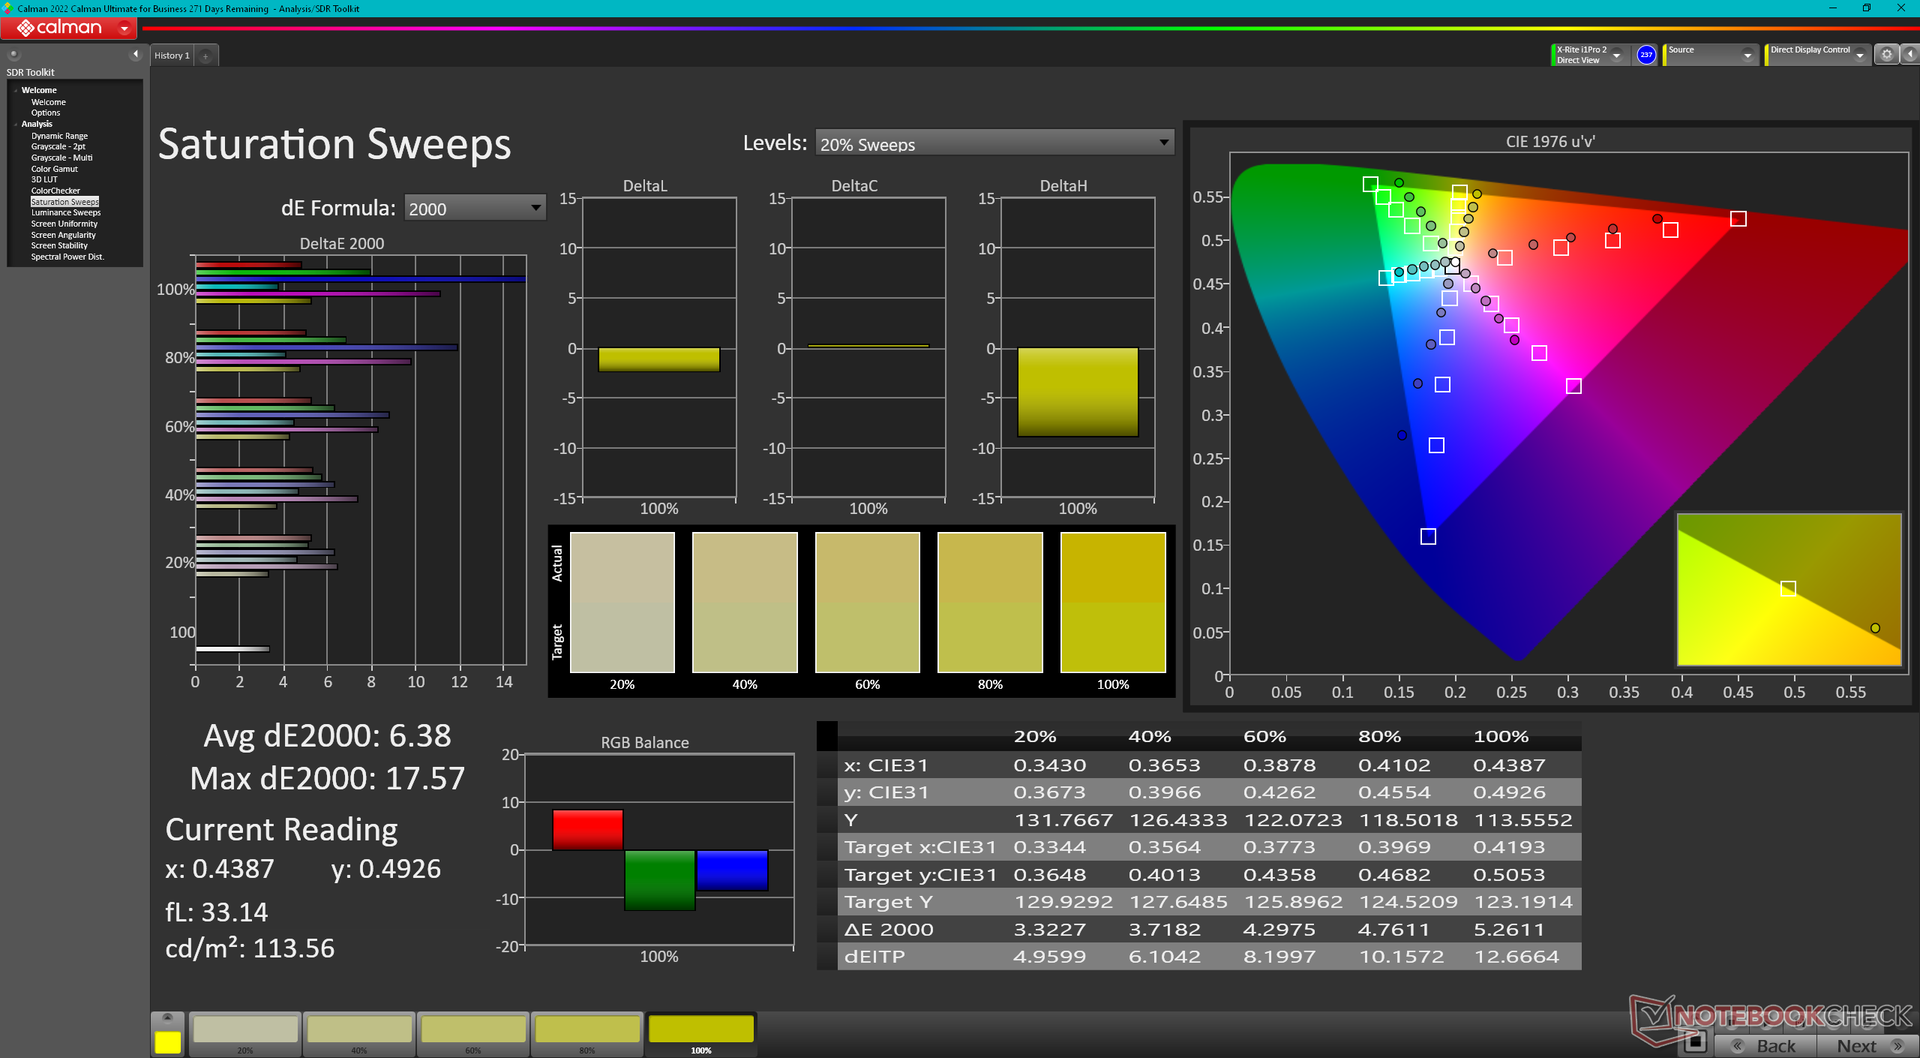
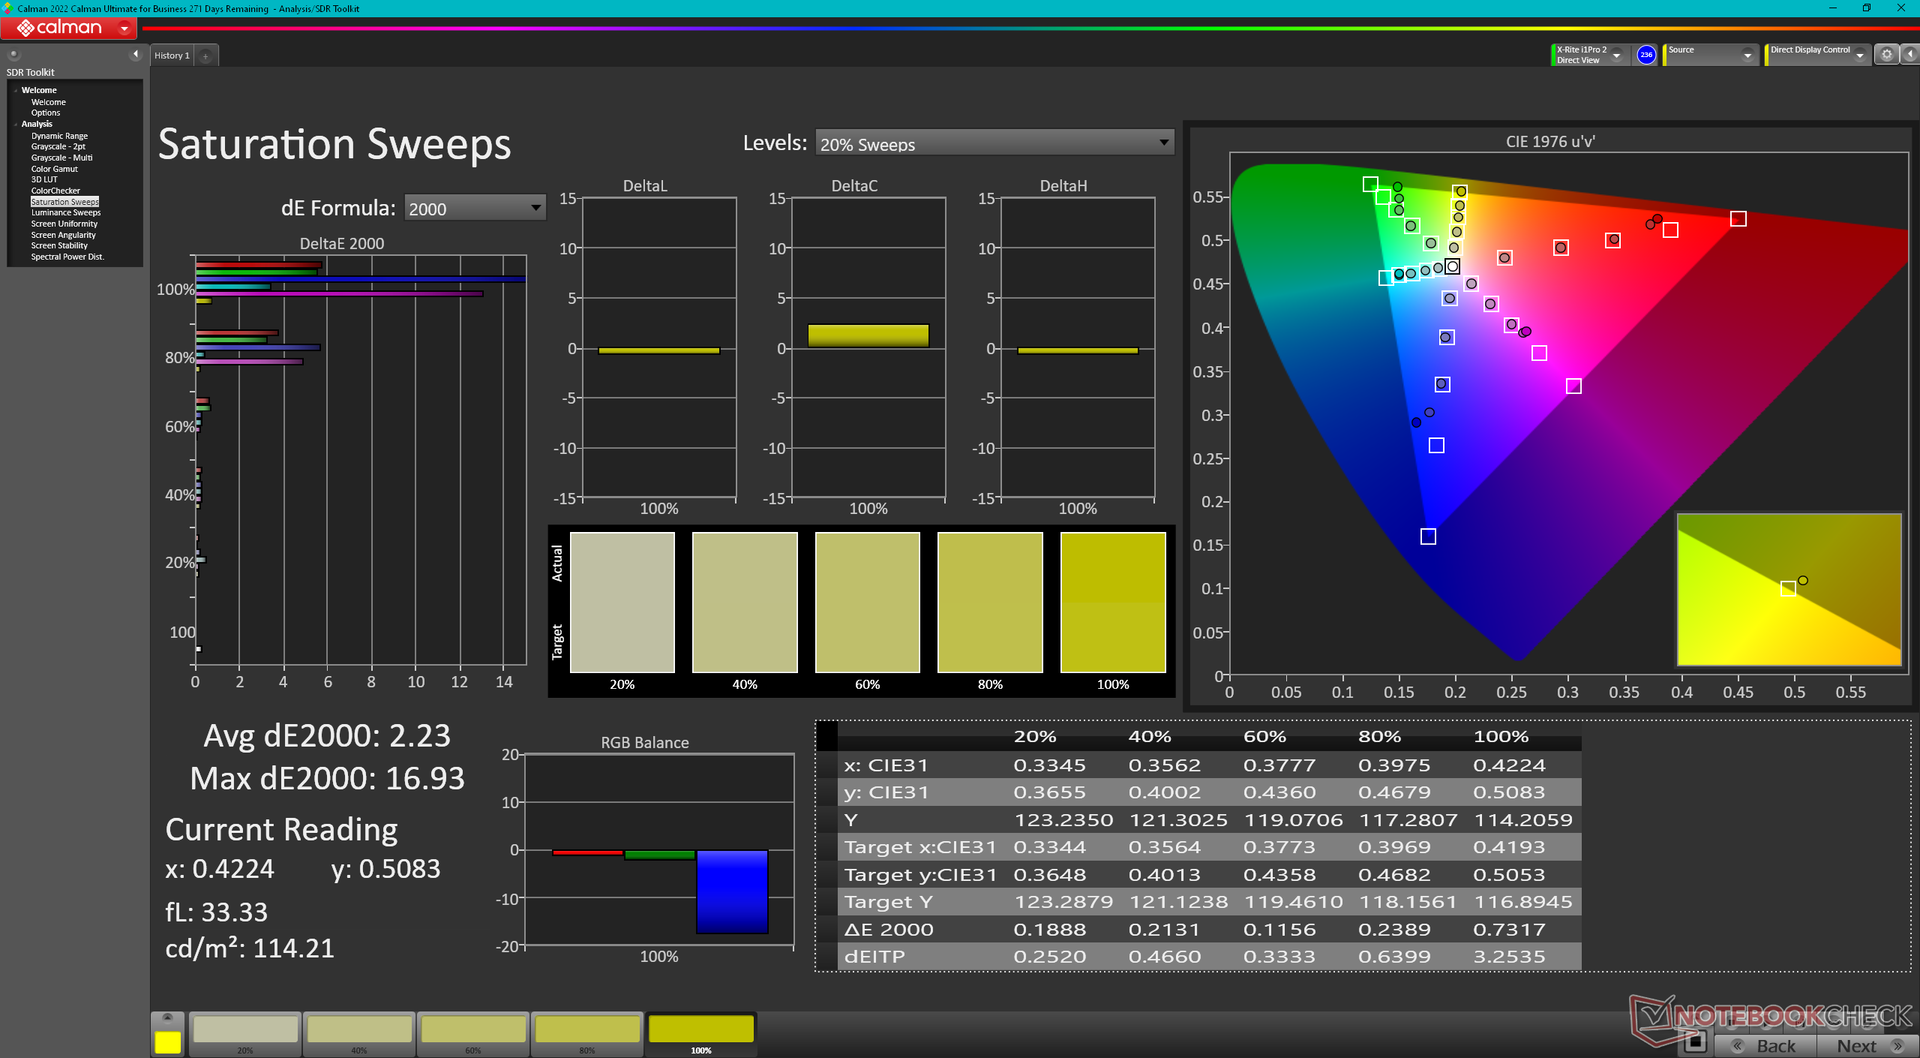
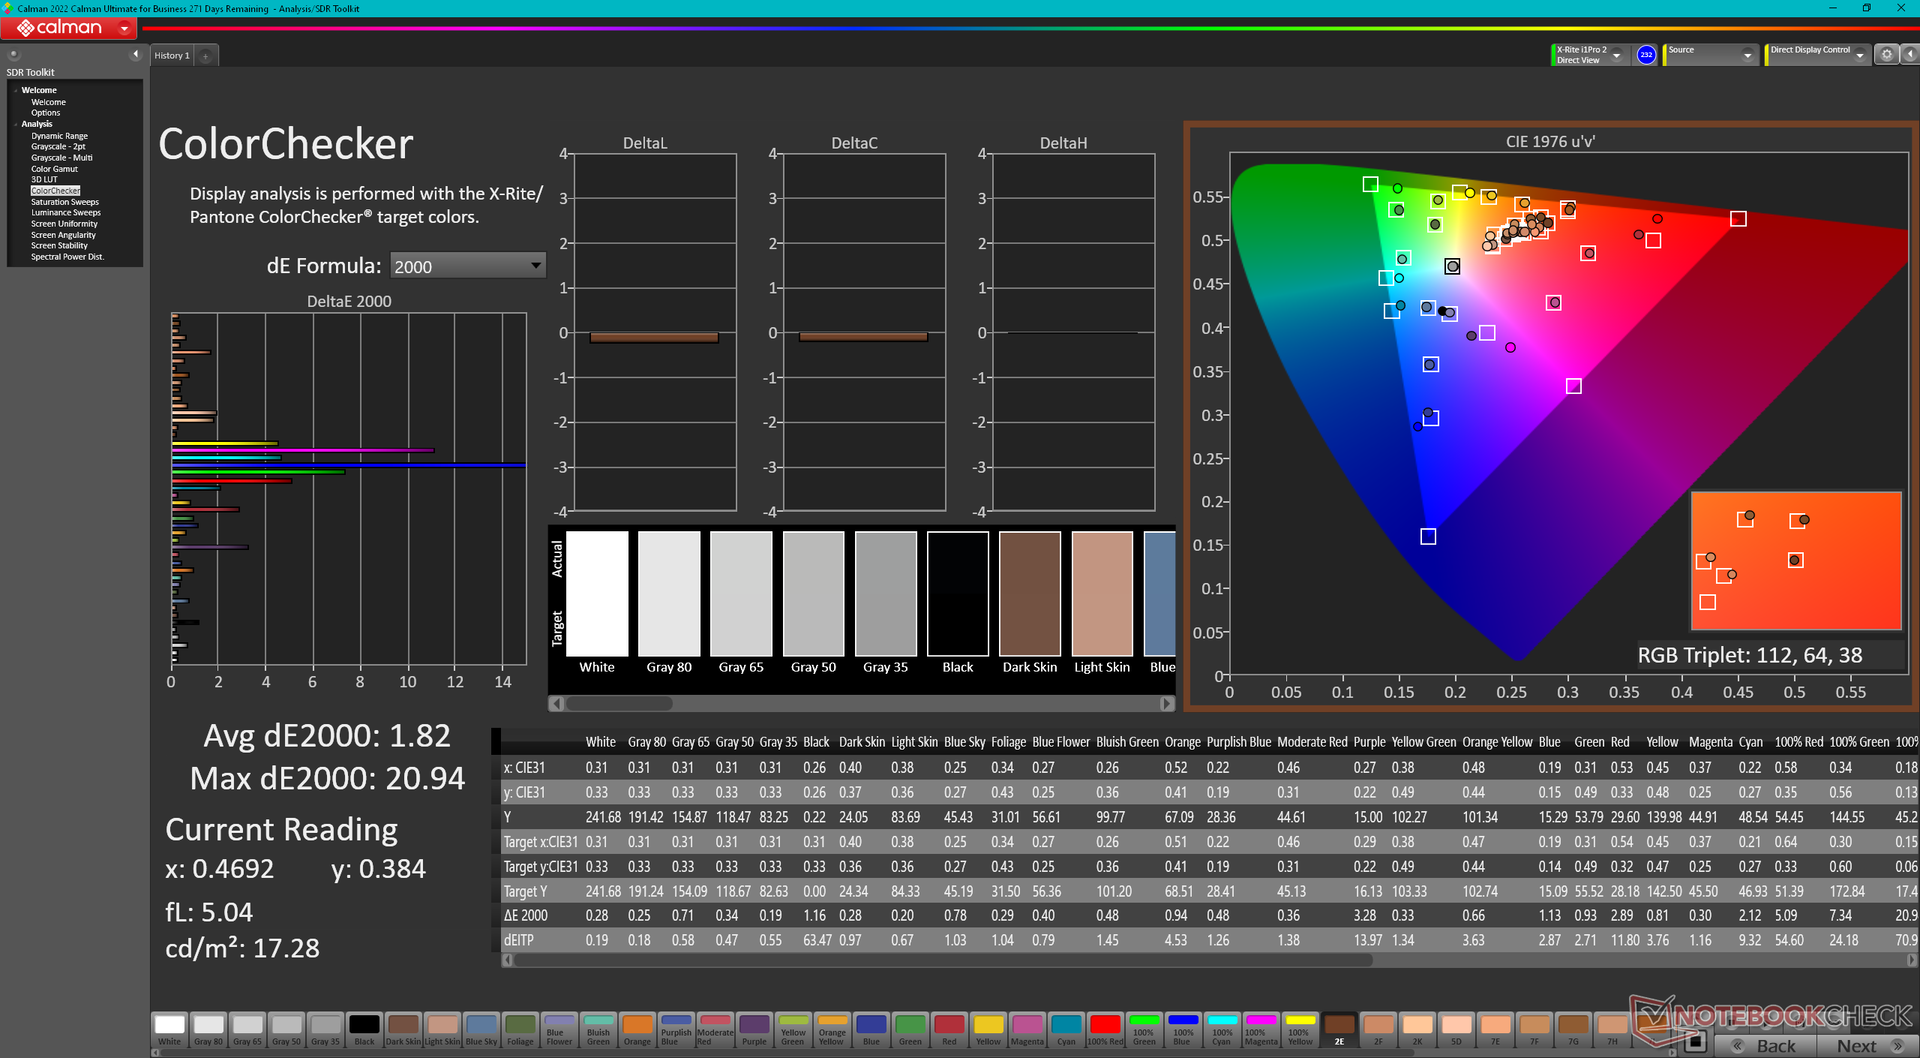
Skärmen är inte kalibrerad med sina genomsnittliga deltaE-värden för gråskala och färg på 3,2 respektive 4,51. Om vi kalibrerar skärmen själva med en X-Rite-kolorimeter skulle dessa respektive medelvärden förbättras till bara 0,3 och 1,82. Färgerna blir dock fortfarande alltmer felaktiga vid högre mättnadsnivåer på grund av den begränsade färgrymden som nämnts ovan. Blått har till exempel ett mycket högt deltaE på 20,94 även efter kalibrering.
Vår kalibrerade ICM-profil finns tillgänglig för gratis nedladdning ovan.
Visa svarstider
| ↔ Svarstid svart till vitt | ||
|---|---|---|
| 26.9 ms ... stiga ↗ och falla ↘ kombinerat | ↗ 13.8 ms stiga | 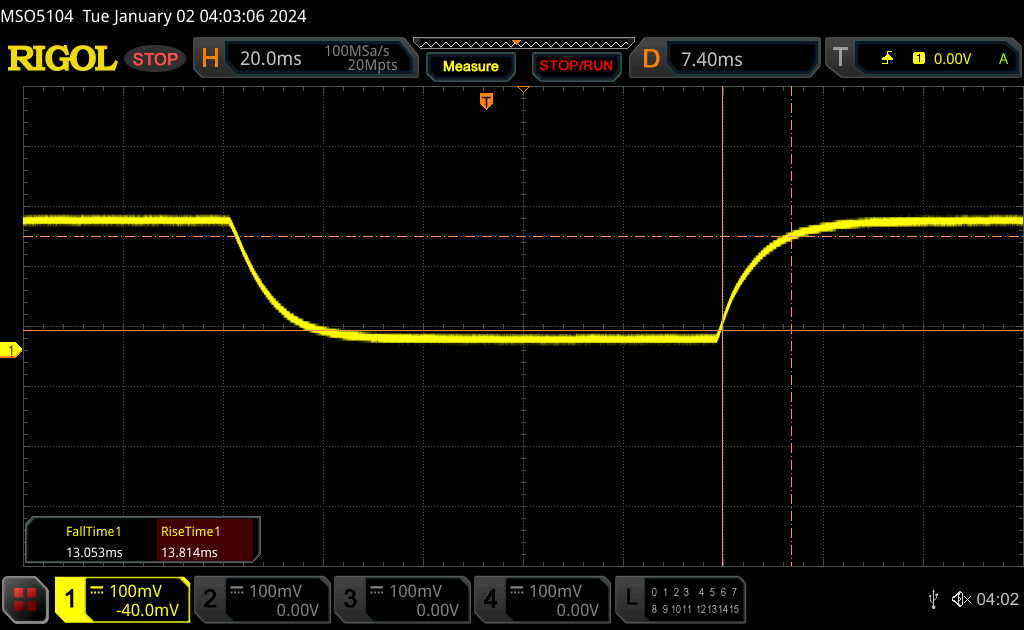 |
| ↘ 13.1 ms hösten | ||
| Skärmen visar relativt långsamma svarsfrekvenser i våra tester och kan vara för långsam för spelare. I jämförelse sträcker sig alla testade enheter från 0.1 (minst) till 240 (maximalt) ms. » 67 % av alla enheter är bättre. Detta innebär att den uppmätta svarstiden är sämre än genomsnittet av alla testade enheter (19.8 ms). | ||
| ↔ Svarstid 50 % grått till 80 % grått | ||
| 39 ms ... stiga ↗ och falla ↘ kombinerat | ↗ 18 ms stiga | 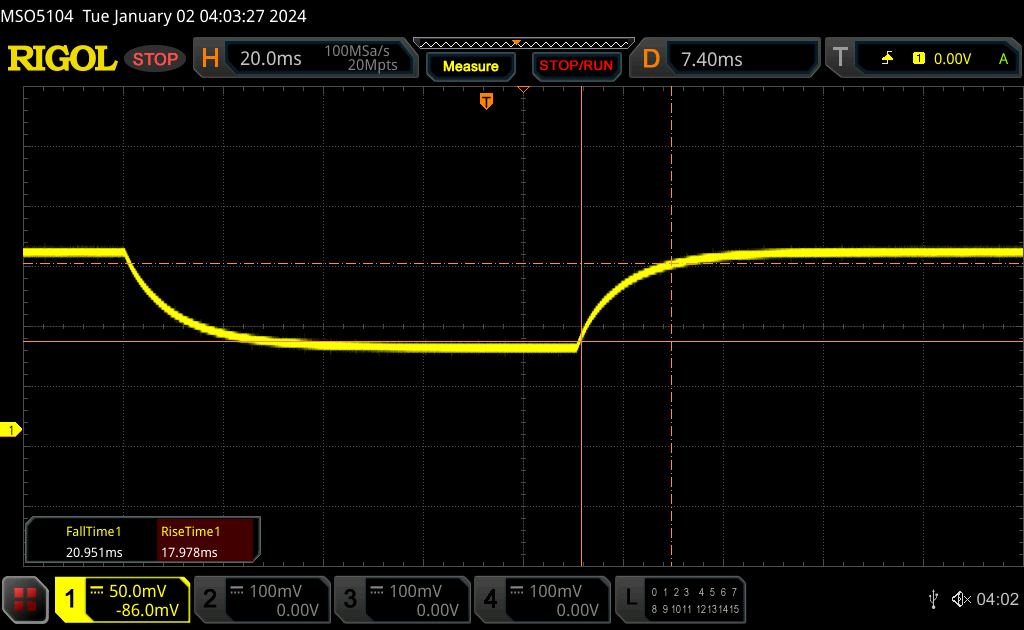 |
| ↘ 21 ms hösten | ||
| Skärmen visar långsamma svarsfrekvenser i våra tester och kommer att vara otillfredsställande för spelare. I jämförelse sträcker sig alla testade enheter från 0.165 (minst) till 636 (maximalt) ms. » 59 % av alla enheter är bättre. Detta innebär att den uppmätta svarstiden är sämre än genomsnittet av alla testade enheter (31 ms). | ||
Skärmflimmer / PWM (Puls-Width Modulation)
| Skärmflimmer / PWM upptäcktes inte |  | ||
Som jämförelse: 52 % av alla testade enheter använder inte PWM för att dämpa skärmen. Om PWM upptäcktes mättes ett medelvärde av 7754 (minst: 5 - maximum: 343500) Hz. | |||
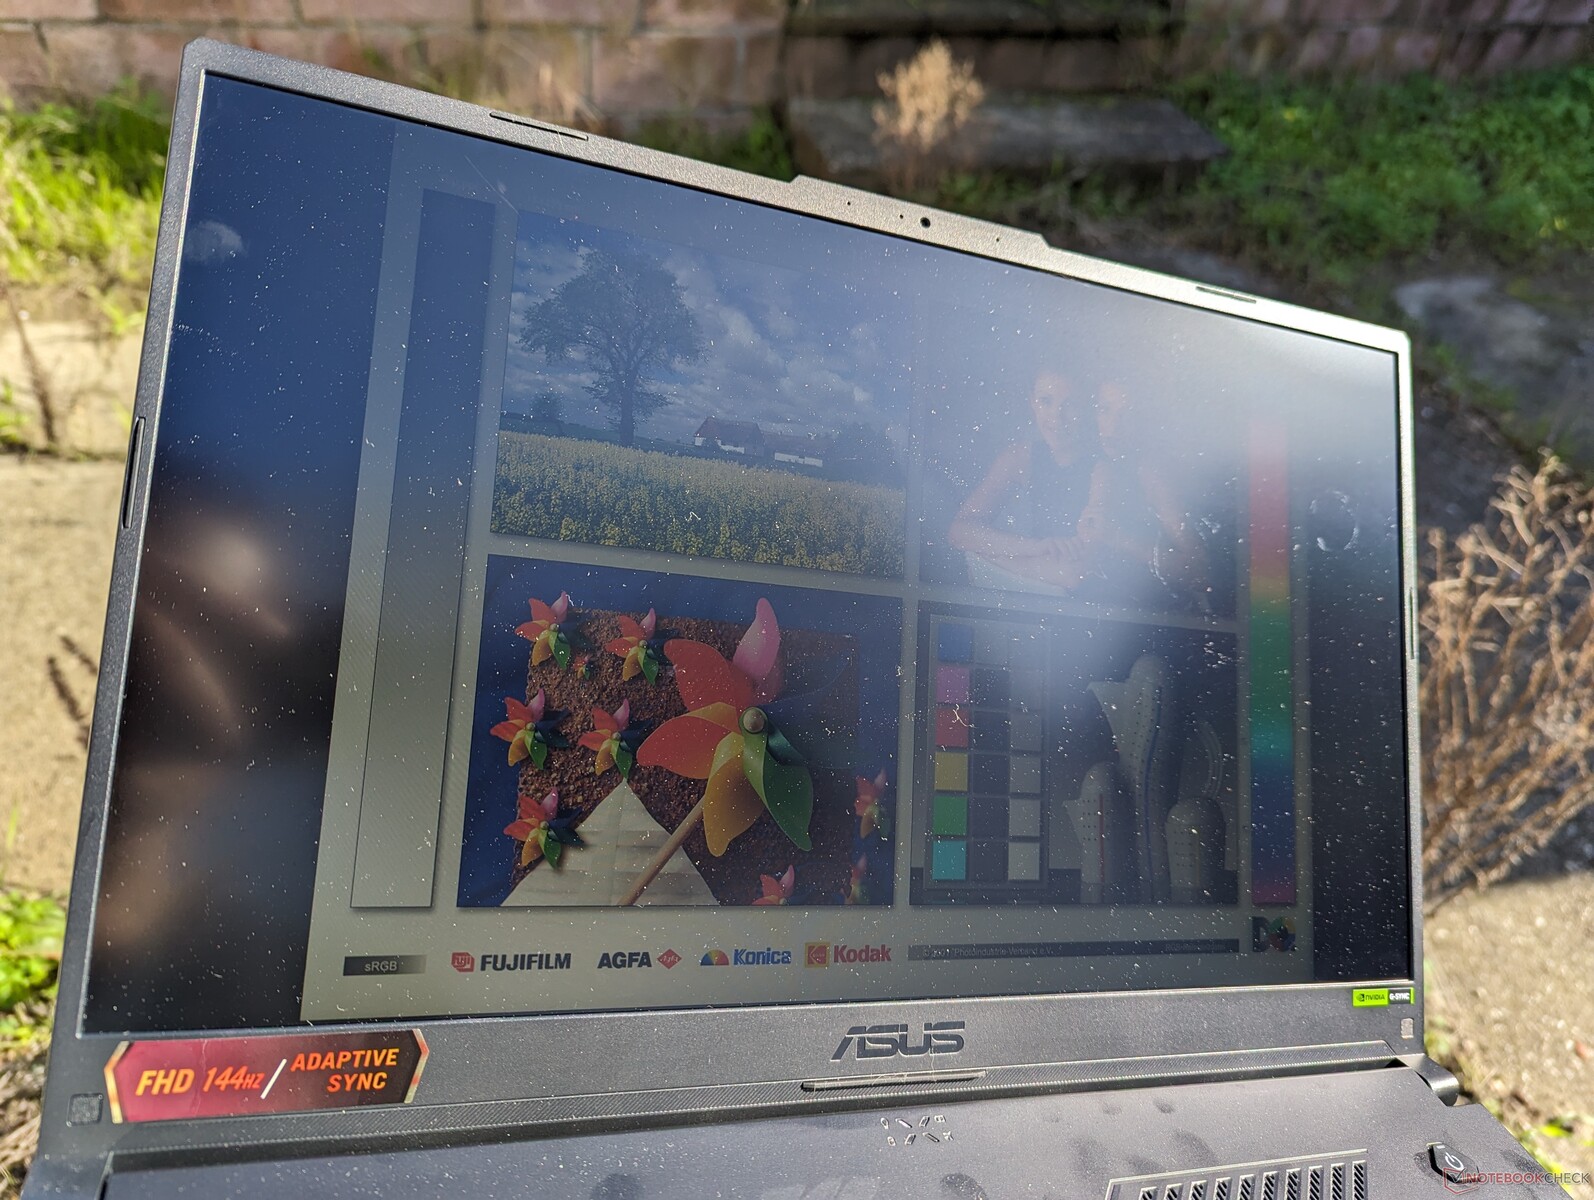
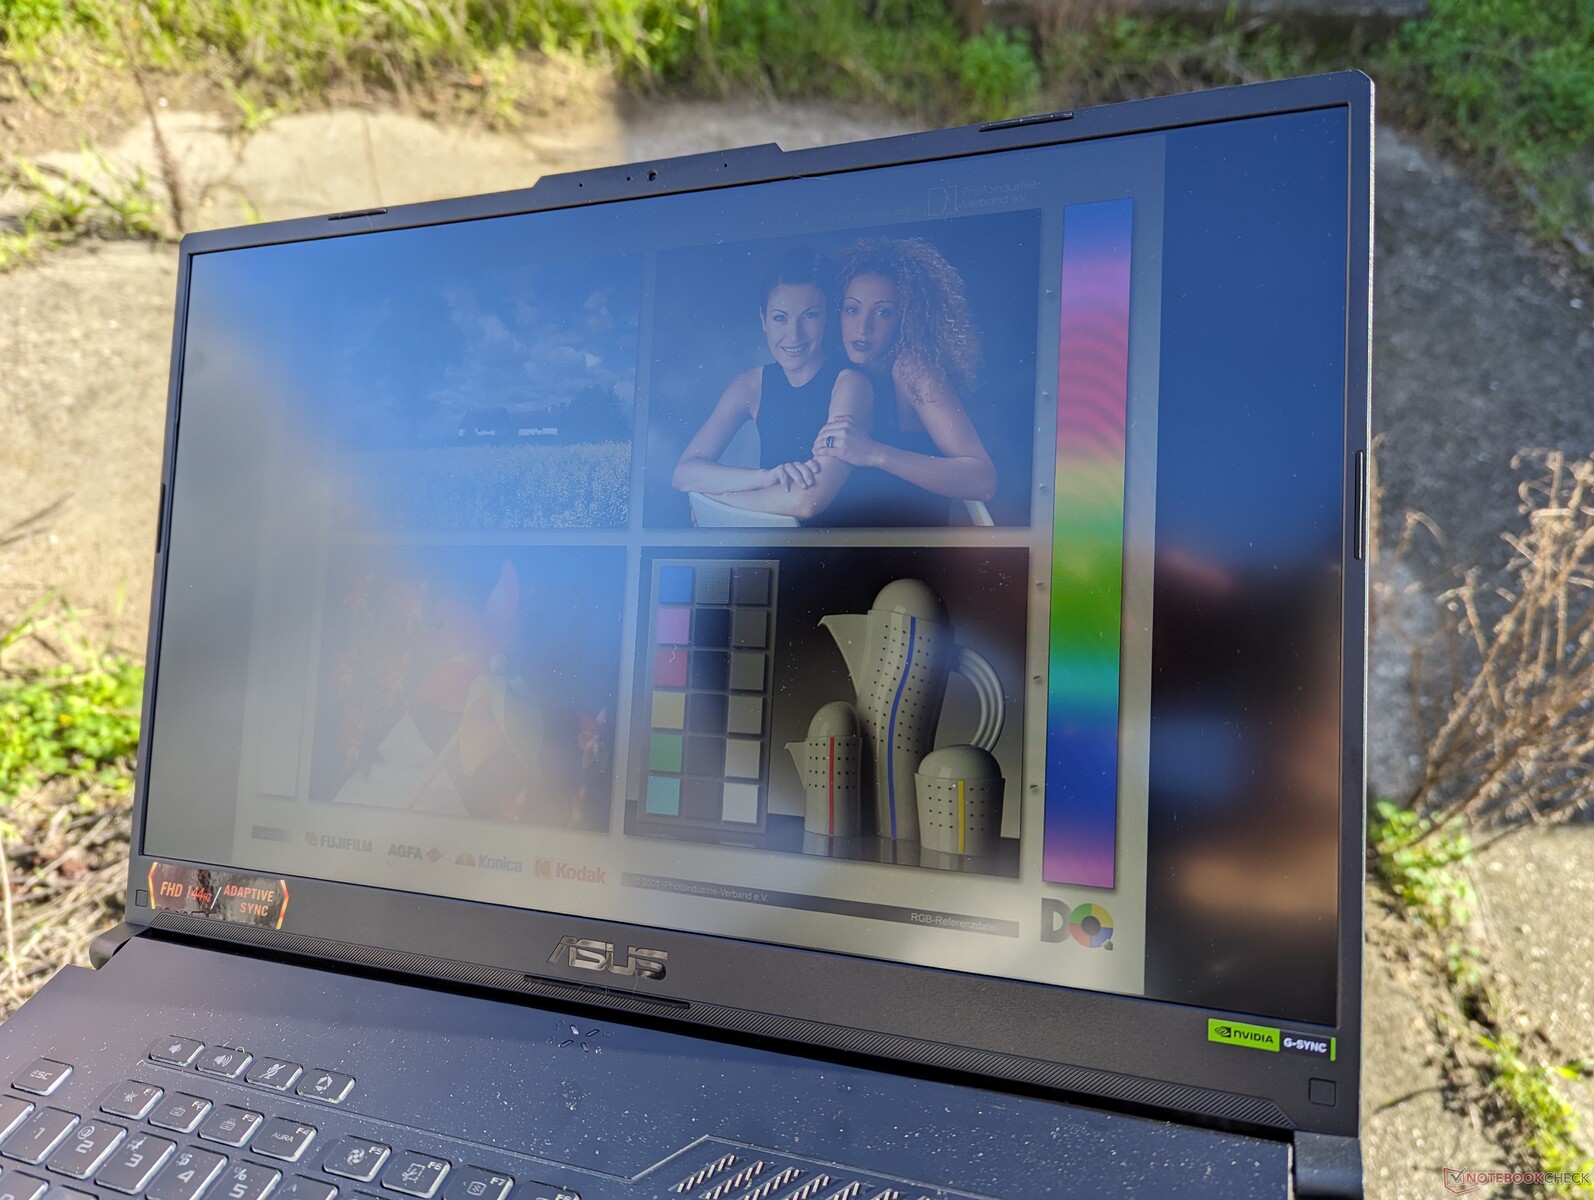
Sikten utomhus är relativt dålig trots den matta panelen för att minska bländning. Maximal ljusstyrka är bara cirka 250 till 300 nits jämfört med nästan dubbelt så mycket på bärbara datorer som MacBook Pro 16 eller den konkurrerande Lenovo Legion Slim 7 16.
Prestanda
Villkor för testning
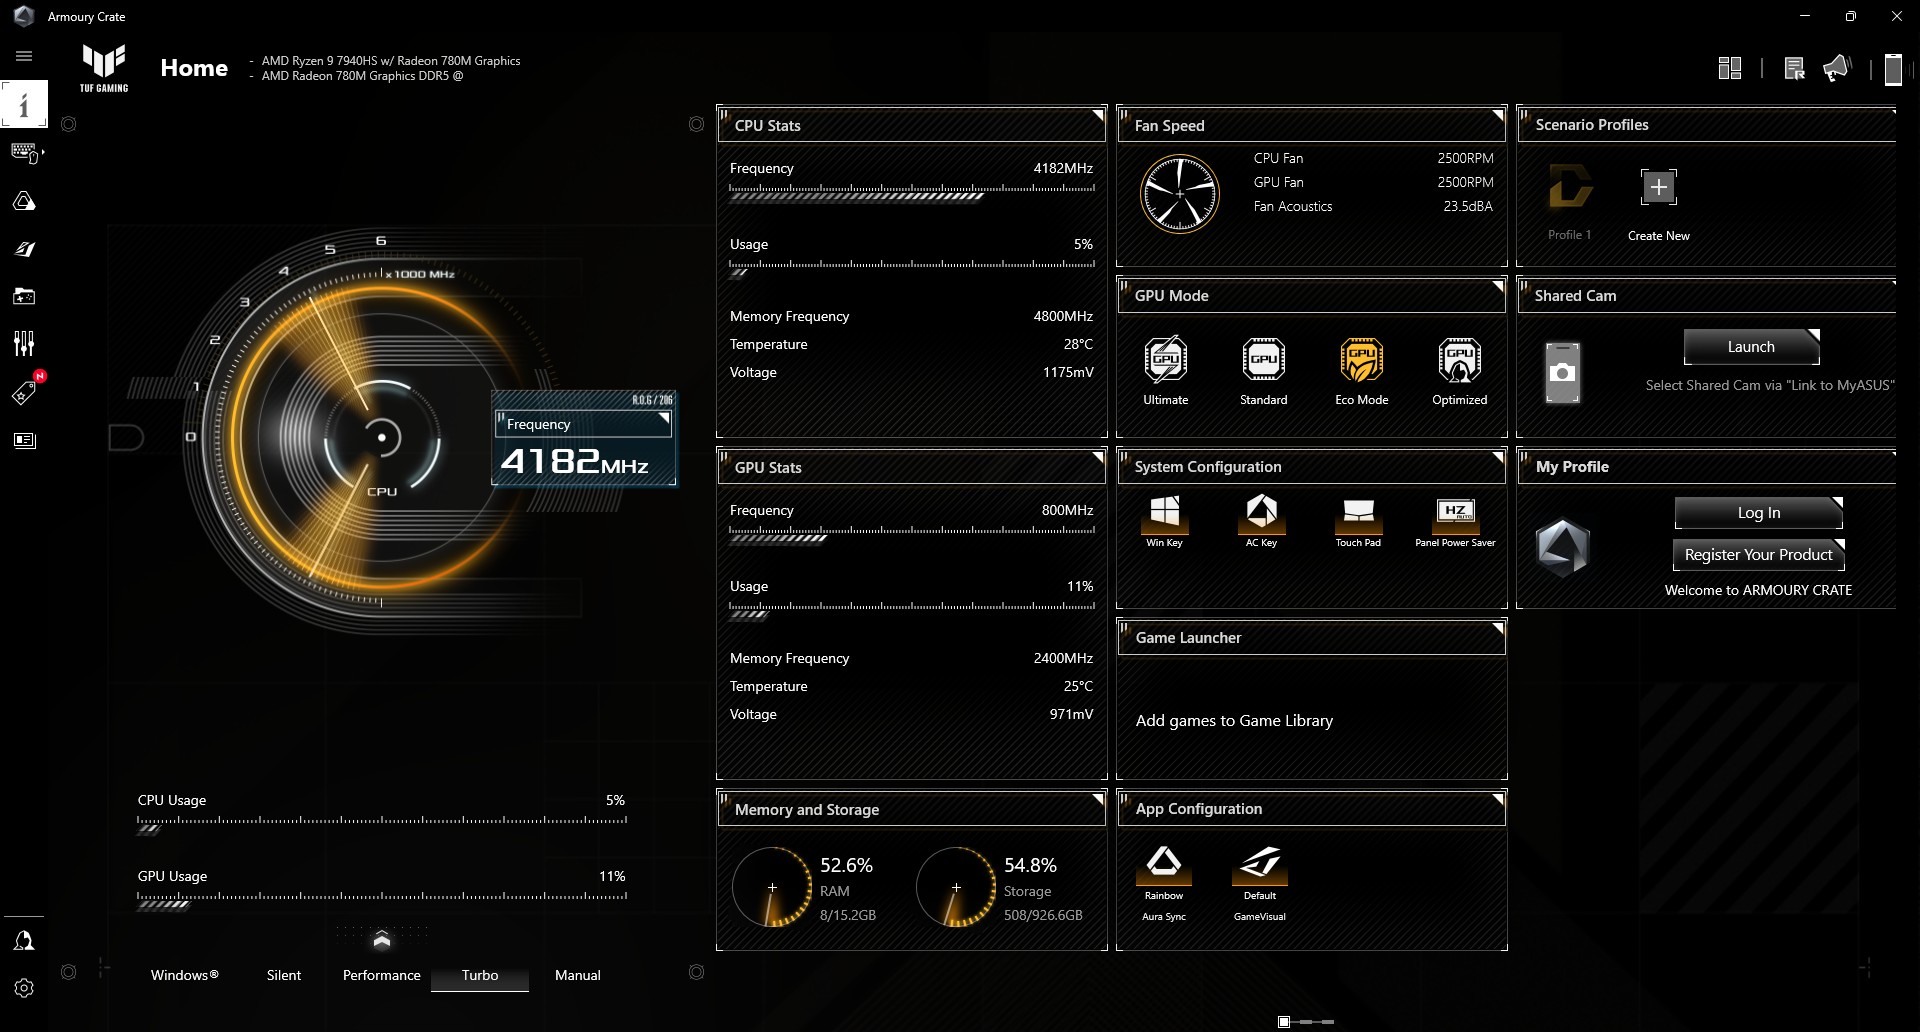
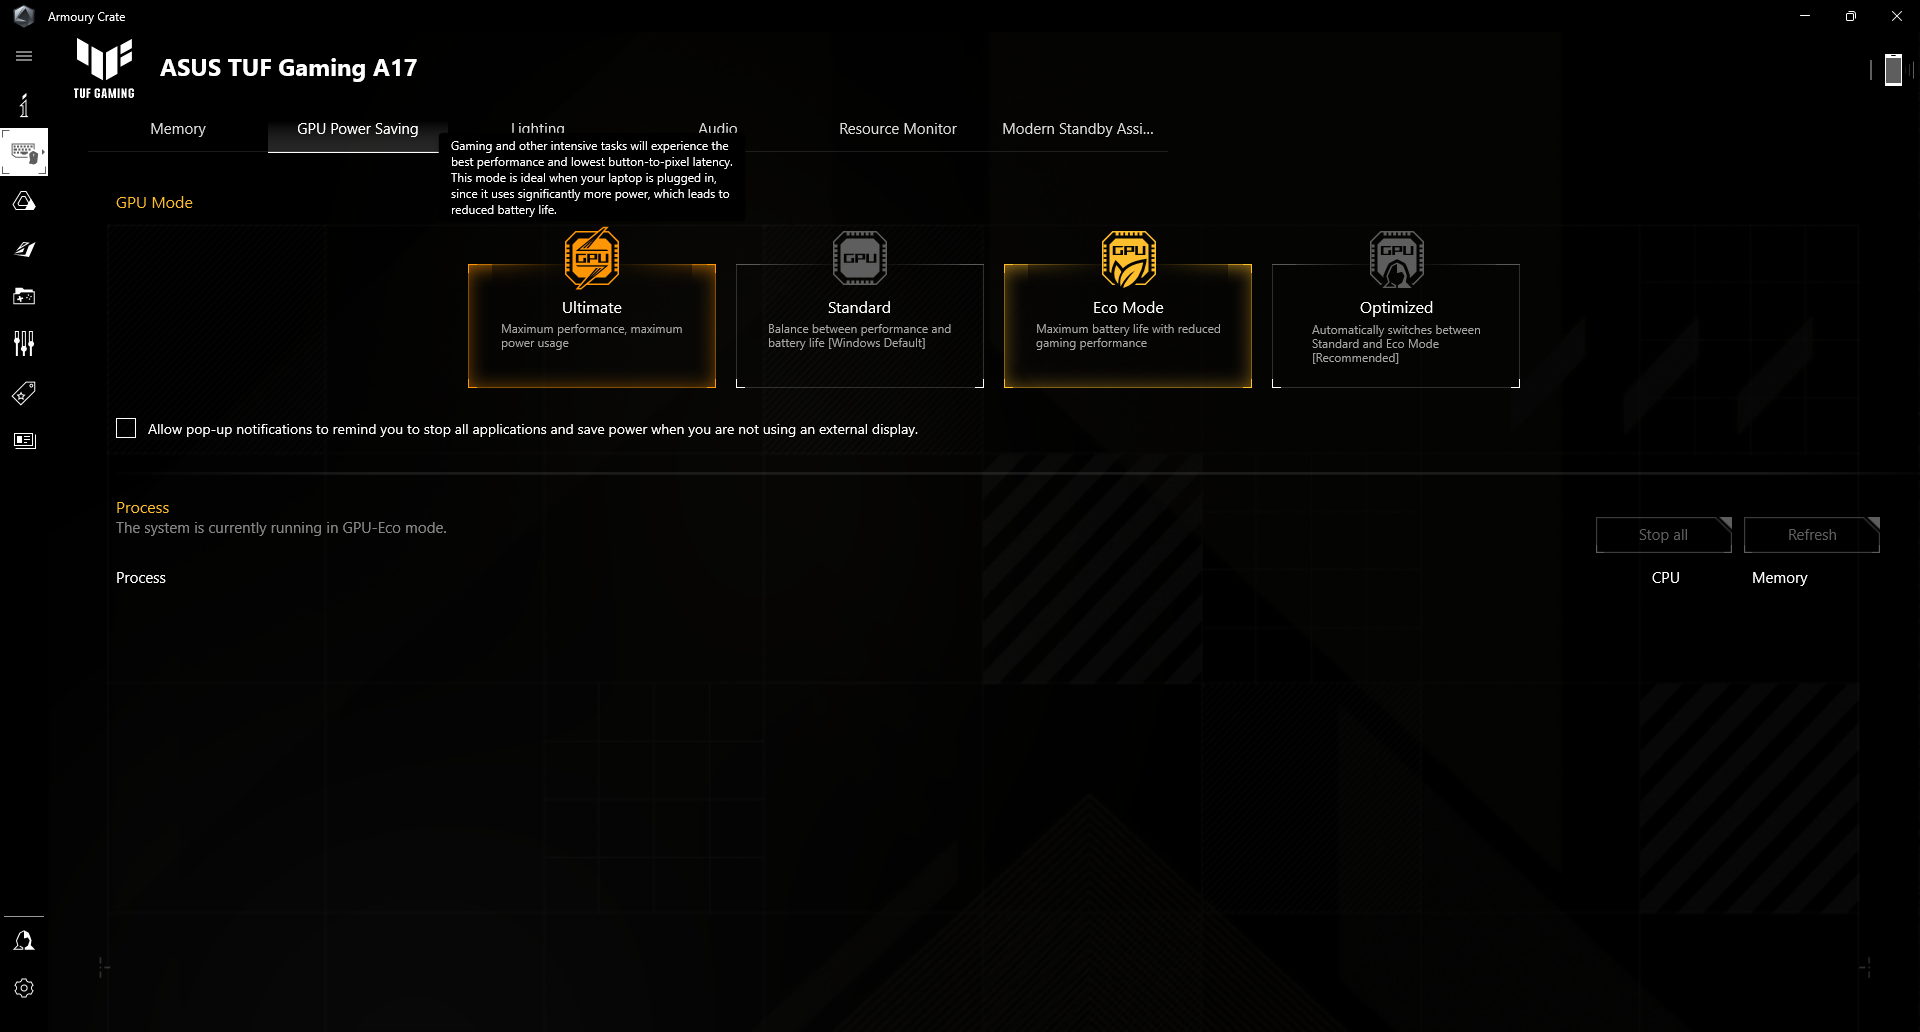
Vi ställde in Asus Armoury Crate på Turbo-läge och Ultimate GPU-läge innan vi körde riktmärkena nedan. Om du ändrar energiprofilerna för Armoury Crate ändras automatiskt även energiprofilerna för Windows. Observera att Performance-läget inte är den snabbaste tillgängliga energiprofilen; den titeln går istället till Turbo-läget.
Under tiden är de fyra GPU-lägena kopplade till MUX och Advanced Optimus enligt följande:
- Ultimat läge: Diskret GPU är aktiv för alla uppgifter. En mjuk omstart krävs. Detta krävs också för att aktivera G-Sync på den interna bildskärmen.
- Standardläge: Även känt som Microsoft MSHybrid. Automatisk växling mellan dGPU för krävande applikationer och iGPU för andra uppgifter.
- Eco-läge: Diskret GPU är inaktiverad och alla program körs på iGPU.
- Optimerat läge: Automatisk växling mellan dGPU för krävande applikationer och iGPU för andra uppgifter när nätström används. Vid batteridrift inaktiveras dGPU automatiskt.
Processor
Ryzen 9 7940HS Ryzen 9 7940HS konkurrerar direkt med den vanliga Core i7-13700H. Rå prestanda ligger inom bara några få procentenheter av sin Intel-motsvarighet i både enkel- och flertrådade belastningar. Vi kan inte observera några större problem med strypning till skillnad från TUF Gaming F17 FX707Z med den äldre 12:e generationens Core i7-12700H.
Nedgradering till Ryzen 7 7735HS från vår Ryzen 9 7940HS kommer att påverka processorprestandan med cirka 15 till 20 procent. Ryzen 7-alternativet är fortfarande tillräckligt snabbt för spel, särskilt på vår mellanklassnivå där GPU:n nästan alltid är flaskhalsen, men spelare som vill få ut varenda bildruta från panelen med hög uppdateringsfrekvens bör överväga Ryzen 9.
Cinebench R15 Multi Loop
Cinebench R23: Multi Core | Single Core
Cinebench R20: CPU (Multi Core) | CPU (Single Core)
Cinebench R15: CPU Multi 64Bit | CPU Single 64Bit
Blender: v2.79 BMW27 CPU
7-Zip 18.03: 7z b 4 | 7z b 4 -mmt1
Geekbench 5.5: Multi-Core | Single-Core
HWBOT x265 Benchmark v2.2: 4k Preset
LibreOffice : 20 Documents To PDF
R Benchmark 2.5: Overall mean
| CPU Performance rating | |
| MSI Raider GE78 HX 13VI | |
| Asus ROG Strix G17 G713PI | |
| Eurocom Raptor X17 | |
| MSI Stealth 17 Studio A13VH-014 | |
| Asus TUF Gaming A17 FA707XI-NS94 | |
| Genomsnitt AMD Ryzen 9 7940HS | |
| MSI Pulse 17 B13VGK | |
| Razer Blade 17 (i7-12800H, RTX 3070 Ti) | |
| MSI Katana 17 B13VFK | |
| Asus TUF Gaming F17 FX707Z-HX011W | |
| Acer Nitro 17 AN17-41-R9LN | |
| Asus ROG Strix G17 G713QE-RB74 -2! | |
| HP Pavilion Gaming 17-cd2146ng | |
| Cinebench R23 / Multi Core | |
| Asus ROG Strix G17 G713PI | |
| MSI Raider GE78 HX 13VI | |
| Eurocom Raptor X17 | |
| MSI Stealth 17 Studio A13VH-014 | |
| MSI Pulse 17 B13VGK | |
| Asus TUF Gaming A17 FA707XI-NS94 | |
| Genomsnitt AMD Ryzen 9 7940HS (15556 - 18131, n=12) | |
| MSI Katana 17 B13VFK | |
| Razer Blade 17 (i7-12800H, RTX 3070 Ti) | |
| Acer Nitro 17 AN17-41-R9LN | |
| Asus TUF Gaming F17 FX707Z-HX011W | |
| Asus ROG Strix G17 G713QE-RB74 | |
| HP Pavilion Gaming 17-cd2146ng | |
| Cinebench R23 / Single Core | |
| MSI Raider GE78 HX 13VI | |
| Eurocom Raptor X17 | |
| Asus ROG Strix G17 G713PI | |
| Asus TUF Gaming A17 FA707XI-NS94 | |
| Razer Blade 17 (i7-12800H, RTX 3070 Ti) | |
| MSI Katana 17 B13VFK | |
| Asus TUF Gaming F17 FX707Z-HX011W | |
| Genomsnitt AMD Ryzen 9 7940HS (1733 - 1832, n=12) | |
| MSI Stealth 17 Studio A13VH-014 | |
| MSI Pulse 17 B13VGK | |
| Acer Nitro 17 AN17-41-R9LN | |
| Asus ROG Strix G17 G713QE-RB74 | |
| HP Pavilion Gaming 17-cd2146ng | |
| Cinebench R20 / CPU (Multi Core) | |
| MSI Raider GE78 HX 13VI | |
| Eurocom Raptor X17 | |
| Asus ROG Strix G17 G713PI | |
| MSI Stealth 17 Studio A13VH-014 | |
| MSI Pulse 17 B13VGK | |
| Asus TUF Gaming A17 FA707XI-NS94 | |
| Genomsnitt AMD Ryzen 9 7940HS (6277 - 7111, n=12) | |
| MSI Katana 17 B13VFK | |
| Acer Nitro 17 AN17-41-R9LN | |
| Razer Blade 17 (i7-12800H, RTX 3070 Ti) | |
| Asus ROG Strix G17 G713QE-RB74 | |
| Asus TUF Gaming F17 FX707Z-HX011W | |
| HP Pavilion Gaming 17-cd2146ng | |
| Cinebench R20 / CPU (Single Core) | |
| MSI Raider GE78 HX 13VI | |
| Eurocom Raptor X17 | |
| Asus TUF Gaming A17 FA707XI-NS94 | |
| Asus ROG Strix G17 G713PI | |
| Razer Blade 17 (i7-12800H, RTX 3070 Ti) | |
| Genomsnitt AMD Ryzen 9 7940HS (679 - 714, n=12) | |
| MSI Katana 17 B13VFK | |
| Asus TUF Gaming F17 FX707Z-HX011W | |
| MSI Pulse 17 B13VGK | |
| MSI Stealth 17 Studio A13VH-014 | |
| Acer Nitro 17 AN17-41-R9LN | |
| Asus ROG Strix G17 G713QE-RB74 | |
| HP Pavilion Gaming 17-cd2146ng | |
| Cinebench R15 / CPU Multi 64Bit | |
| Asus ROG Strix G17 G713PI | |
| MSI Raider GE78 HX 13VI | |
| Eurocom Raptor X17 | |
| MSI Stealth 17 Studio A13VH-014 | |
| MSI Pulse 17 B13VGK | |
| Asus TUF Gaming F17 FX707Z-HX011W | |
| Asus TUF Gaming A17 FA707XI-NS94 | |
| Razer Blade 17 (i7-12800H, RTX 3070 Ti) | |
| Genomsnitt AMD Ryzen 9 7940HS (2470 - 2848, n=12) | |
| MSI Katana 17 B13VFK | |
| Acer Nitro 17 AN17-41-R9LN | |
| Asus ROG Strix G17 G713QE-RB74 | |
| HP Pavilion Gaming 17-cd2146ng | |
| Cinebench R15 / CPU Single 64Bit | |
| MSI Raider GE78 HX 13VI | |
| Asus ROG Strix G17 G713PI | |
| Eurocom Raptor X17 | |
| Asus TUF Gaming A17 FA707XI-NS94 | |
| MSI Stealth 17 Studio A13VH-014 | |
| Genomsnitt AMD Ryzen 9 7940HS (258 - 288, n=12) | |
| Razer Blade 17 (i7-12800H, RTX 3070 Ti) | |
| MSI Katana 17 B13VFK | |
| Asus TUF Gaming F17 FX707Z-HX011W | |
| Acer Nitro 17 AN17-41-R9LN | |
| MSI Pulse 17 B13VGK | |
| Asus ROG Strix G17 G713QE-RB74 | |
| HP Pavilion Gaming 17-cd2146ng | |
| Blender / v2.79 BMW27 CPU | |
| HP Pavilion Gaming 17-cd2146ng | |
| Asus TUF Gaming F17 FX707Z-HX011W | |
| Asus ROG Strix G17 G713QE-RB74 | |
| Acer Nitro 17 AN17-41-R9LN | |
| Razer Blade 17 (i7-12800H, RTX 3070 Ti) | |
| MSI Katana 17 B13VFK | |
| Genomsnitt AMD Ryzen 9 7940HS (182 - 202, n=11) | |
| Asus TUF Gaming A17 FA707XI-NS94 | |
| MSI Pulse 17 B13VGK | |
| MSI Stealth 17 Studio A13VH-014 | |
| Eurocom Raptor X17 | |
| MSI Raider GE78 HX 13VI | |
| Asus ROG Strix G17 G713PI | |
| 7-Zip 18.03 / 7z b 4 -mmt1 | |
| Asus ROG Strix G17 G713PI | |
| MSI Raider GE78 HX 13VI | |
| Asus TUF Gaming A17 FA707XI-NS94 | |
| Genomsnitt AMD Ryzen 9 7940HS (6310 - 6776, n=12) | |
| Eurocom Raptor X17 | |
| MSI Stealth 17 Studio A13VH-014 | |
| Acer Nitro 17 AN17-41-R9LN | |
| Razer Blade 17 (i7-12800H, RTX 3070 Ti) | |
| MSI Katana 17 B13VFK | |
| Asus TUF Gaming F17 FX707Z-HX011W | |
| Asus ROG Strix G17 G713QE-RB74 | |
| MSI Pulse 17 B13VGK | |
| HP Pavilion Gaming 17-cd2146ng | |
| Geekbench 5.5 / Multi-Core | |
| MSI Raider GE78 HX 13VI | |
| Eurocom Raptor X17 | |
| Asus ROG Strix G17 G713PI | |
| MSI Stealth 17 Studio A13VH-014 | |
| MSI Pulse 17 B13VGK | |
| Asus TUF Gaming F17 FX707Z-HX011W | |
| Razer Blade 17 (i7-12800H, RTX 3070 Ti) | |
| Genomsnitt AMD Ryzen 9 7940HS (10089 - 12500, n=13) | |
| Asus TUF Gaming A17 FA707XI-NS94 | |
| MSI Katana 17 B13VFK | |
| Acer Nitro 17 AN17-41-R9LN | |
| HP Pavilion Gaming 17-cd2146ng | |
| Geekbench 5.5 / Single-Core | |
| Asus ROG Strix G17 G713PI | |
| MSI Stealth 17 Studio A13VH-014 | |
| Asus TUF Gaming A17 FA707XI-NS94 | |
| MSI Raider GE78 HX 13VI | |
| Genomsnitt AMD Ryzen 9 7940HS (1823 - 2032, n=13) | |
| Eurocom Raptor X17 | |
| MSI Katana 17 B13VFK | |
| Razer Blade 17 (i7-12800H, RTX 3070 Ti) | |
| Asus TUF Gaming F17 FX707Z-HX011W | |
| MSI Pulse 17 B13VGK | |
| Acer Nitro 17 AN17-41-R9LN | |
| HP Pavilion Gaming 17-cd2146ng | |
| HWBOT x265 Benchmark v2.2 / 4k Preset | |
| Asus ROG Strix G17 G713PI | |
| MSI Raider GE78 HX 13VI | |
| Eurocom Raptor X17 | |
| MSI Stealth 17 Studio A13VH-014 | |
| Asus TUF Gaming A17 FA707XI-NS94 | |
| MSI Pulse 17 B13VGK | |
| Genomsnitt AMD Ryzen 9 7940HS (18.5 - 22.6, n=11) | |
| MSI Katana 17 B13VFK | |
| Acer Nitro 17 AN17-41-R9LN | |
| Razer Blade 17 (i7-12800H, RTX 3070 Ti) | |
| Asus ROG Strix G17 G713QE-RB74 | |
| Asus TUF Gaming F17 FX707Z-HX011W | |
| HP Pavilion Gaming 17-cd2146ng | |
| LibreOffice / 20 Documents To PDF | |
| Asus TUF Gaming F17 FX707Z-HX011W | |
| Acer Nitro 17 AN17-41-R9LN | |
| MSI Pulse 17 B13VGK | |
| HP Pavilion Gaming 17-cd2146ng | |
| MSI Katana 17 B13VFK | |
| Asus ROG Strix G17 G713QE-RB74 | |
| MSI Stealth 17 Studio A13VH-014 | |
| Asus TUF Gaming A17 FA707XI-NS94 | |
| Genomsnitt AMD Ryzen 9 7940HS (36.9 - 54.8, n=12) | |
| Asus ROG Strix G17 G713PI | |
| MSI Raider GE78 HX 13VI | |
| Razer Blade 17 (i7-12800H, RTX 3070 Ti) | |
| Eurocom Raptor X17 | |
| R Benchmark 2.5 / Overall mean | |
| HP Pavilion Gaming 17-cd2146ng | |
| Asus ROG Strix G17 G713QE-RB74 | |
| Acer Nitro 17 AN17-41-R9LN | |
| MSI Pulse 17 B13VGK | |
| Asus TUF Gaming F17 FX707Z-HX011W | |
| Razer Blade 17 (i7-12800H, RTX 3070 Ti) | |
| MSI Katana 17 B13VFK | |
| Genomsnitt AMD Ryzen 9 7940HS (0.4159 - 0.4467, n=12) | |
| MSI Stealth 17 Studio A13VH-014 | |
| Asus TUF Gaming A17 FA707XI-NS94 | |
| Asus ROG Strix G17 G713PI | |
| Eurocom Raptor X17 | |
| MSI Raider GE78 HX 13VI | |
Cinebench R23: Multi Core | Single Core
Cinebench R20: CPU (Multi Core) | CPU (Single Core)
Cinebench R15: CPU Multi 64Bit | CPU Single 64Bit
Blender: v2.79 BMW27 CPU
7-Zip 18.03: 7z b 4 | 7z b 4 -mmt1
Geekbench 5.5: Multi-Core | Single-Core
HWBOT x265 Benchmark v2.2: 4k Preset
LibreOffice : 20 Documents To PDF
R Benchmark 2.5: Overall mean
* ... mindre är bättre
AIDA64: FP32 Ray-Trace | FPU Julia | CPU SHA3 | CPU Queen | FPU SinJulia | FPU Mandel | CPU AES | CPU ZLib | FP64 Ray-Trace | CPU PhotoWorxx
| Performance rating | |
| Asus TUF Gaming A17 FA707XI-NS94 | |
| Genomsnitt AMD Ryzen 9 7940HS | |
| MSI Pulse 17 B13VGK | |
| MSI Katana 17 B13VFK | |
| Razer Blade 17 (i7-12800H, RTX 3070 Ti) | |
| Asus TUF Gaming F17 FX707Z-HX011W | |
| HP Pavilion Gaming 17-cd2146ng | |
| AIDA64 / FP32 Ray-Trace | |
| Asus TUF Gaming A17 FA707XI-NS94 | |
| Genomsnitt AMD Ryzen 9 7940HS (25226 - 29109, n=10) | |
| MSI Pulse 17 B13VGK | |
| MSI Katana 17 B13VFK | |
| Razer Blade 17 (i7-12800H, RTX 3070 Ti) | |
| HP Pavilion Gaming 17-cd2146ng | |
| Asus TUF Gaming F17 FX707Z-HX011W | |
| AIDA64 / FPU Julia | |
| Asus TUF Gaming A17 FA707XI-NS94 | |
| Genomsnitt AMD Ryzen 9 7940HS (106512 - 123214, n=10) | |
| MSI Pulse 17 B13VGK | |
| MSI Katana 17 B13VFK | |
| Razer Blade 17 (i7-12800H, RTX 3070 Ti) | |
| Asus TUF Gaming F17 FX707Z-HX011W | |
| HP Pavilion Gaming 17-cd2146ng | |
| AIDA64 / CPU SHA3 | |
| Asus TUF Gaming A17 FA707XI-NS94 | |
| Genomsnitt AMD Ryzen 9 7940HS (4566 - 5119, n=10) | |
| MSI Pulse 17 B13VGK | |
| MSI Katana 17 B13VFK | |
| Razer Blade 17 (i7-12800H, RTX 3070 Ti) | |
| Asus TUF Gaming F17 FX707Z-HX011W | |
| HP Pavilion Gaming 17-cd2146ng | |
| AIDA64 / CPU Queen | |
| Asus TUF Gaming A17 FA707XI-NS94 | |
| Genomsnitt AMD Ryzen 9 7940HS (118174 - 124783, n=10) | |
| Asus TUF Gaming F17 FX707Z-HX011W | |
| MSI Pulse 17 B13VGK | |
| Razer Blade 17 (i7-12800H, RTX 3070 Ti) | |
| MSI Katana 17 B13VFK | |
| HP Pavilion Gaming 17-cd2146ng | |
| AIDA64 / FPU SinJulia | |
| Asus TUF Gaming A17 FA707XI-NS94 | |
| Genomsnitt AMD Ryzen 9 7940HS (14663 - 15551, n=10) | |
| MSI Pulse 17 B13VGK | |
| Razer Blade 17 (i7-12800H, RTX 3070 Ti) | |
| MSI Katana 17 B13VFK | |
| Asus TUF Gaming F17 FX707Z-HX011W | |
| HP Pavilion Gaming 17-cd2146ng | |
| AIDA64 / FPU Mandel | |
| Asus TUF Gaming A17 FA707XI-NS94 | |
| Genomsnitt AMD Ryzen 9 7940HS (56839 - 66238, n=10) | |
| MSI Pulse 17 B13VGK | |
| MSI Katana 17 B13VFK | |
| Razer Blade 17 (i7-12800H, RTX 3070 Ti) | |
| Asus TUF Gaming F17 FX707Z-HX011W | |
| HP Pavilion Gaming 17-cd2146ng | |
| AIDA64 / CPU AES | |
| Genomsnitt AMD Ryzen 9 7940HS (86309 - 171350, n=10) | |
| Asus TUF Gaming A17 FA707XI-NS94 | |
| MSI Pulse 17 B13VGK | |
| MSI Katana 17 B13VFK | |
| Razer Blade 17 (i7-12800H, RTX 3070 Ti) | |
| Asus TUF Gaming F17 FX707Z-HX011W | |
| HP Pavilion Gaming 17-cd2146ng | |
| AIDA64 / CPU ZLib | |
| MSI Pulse 17 B13VGK | |
| Asus TUF Gaming A17 FA707XI-NS94 | |
| Genomsnitt AMD Ryzen 9 7940HS (866 - 1152, n=10) | |
| Razer Blade 17 (i7-12800H, RTX 3070 Ti) | |
| MSI Katana 17 B13VFK | |
| Asus TUF Gaming F17 FX707Z-HX011W | |
| HP Pavilion Gaming 17-cd2146ng | |
| AIDA64 / FP64 Ray-Trace | |
| Asus TUF Gaming A17 FA707XI-NS94 | |
| Genomsnitt AMD Ryzen 9 7940HS (13175 - 15675, n=10) | |
| MSI Pulse 17 B13VGK | |
| MSI Katana 17 B13VFK | |
| Razer Blade 17 (i7-12800H, RTX 3070 Ti) | |
| Asus TUF Gaming F17 FX707Z-HX011W | |
| HP Pavilion Gaming 17-cd2146ng | |
| AIDA64 / CPU PhotoWorxx | |
| MSI Pulse 17 B13VGK | |
| Genomsnitt AMD Ryzen 9 7940HS (22477 - 41567, n=10) | |
| MSI Katana 17 B13VFK | |
| Asus TUF Gaming A17 FA707XI-NS94 | |
| Asus TUF Gaming F17 FX707Z-HX011W | |
| Razer Blade 17 (i7-12800H, RTX 3070 Ti) | |
| HP Pavilion Gaming 17-cd2146ng | |
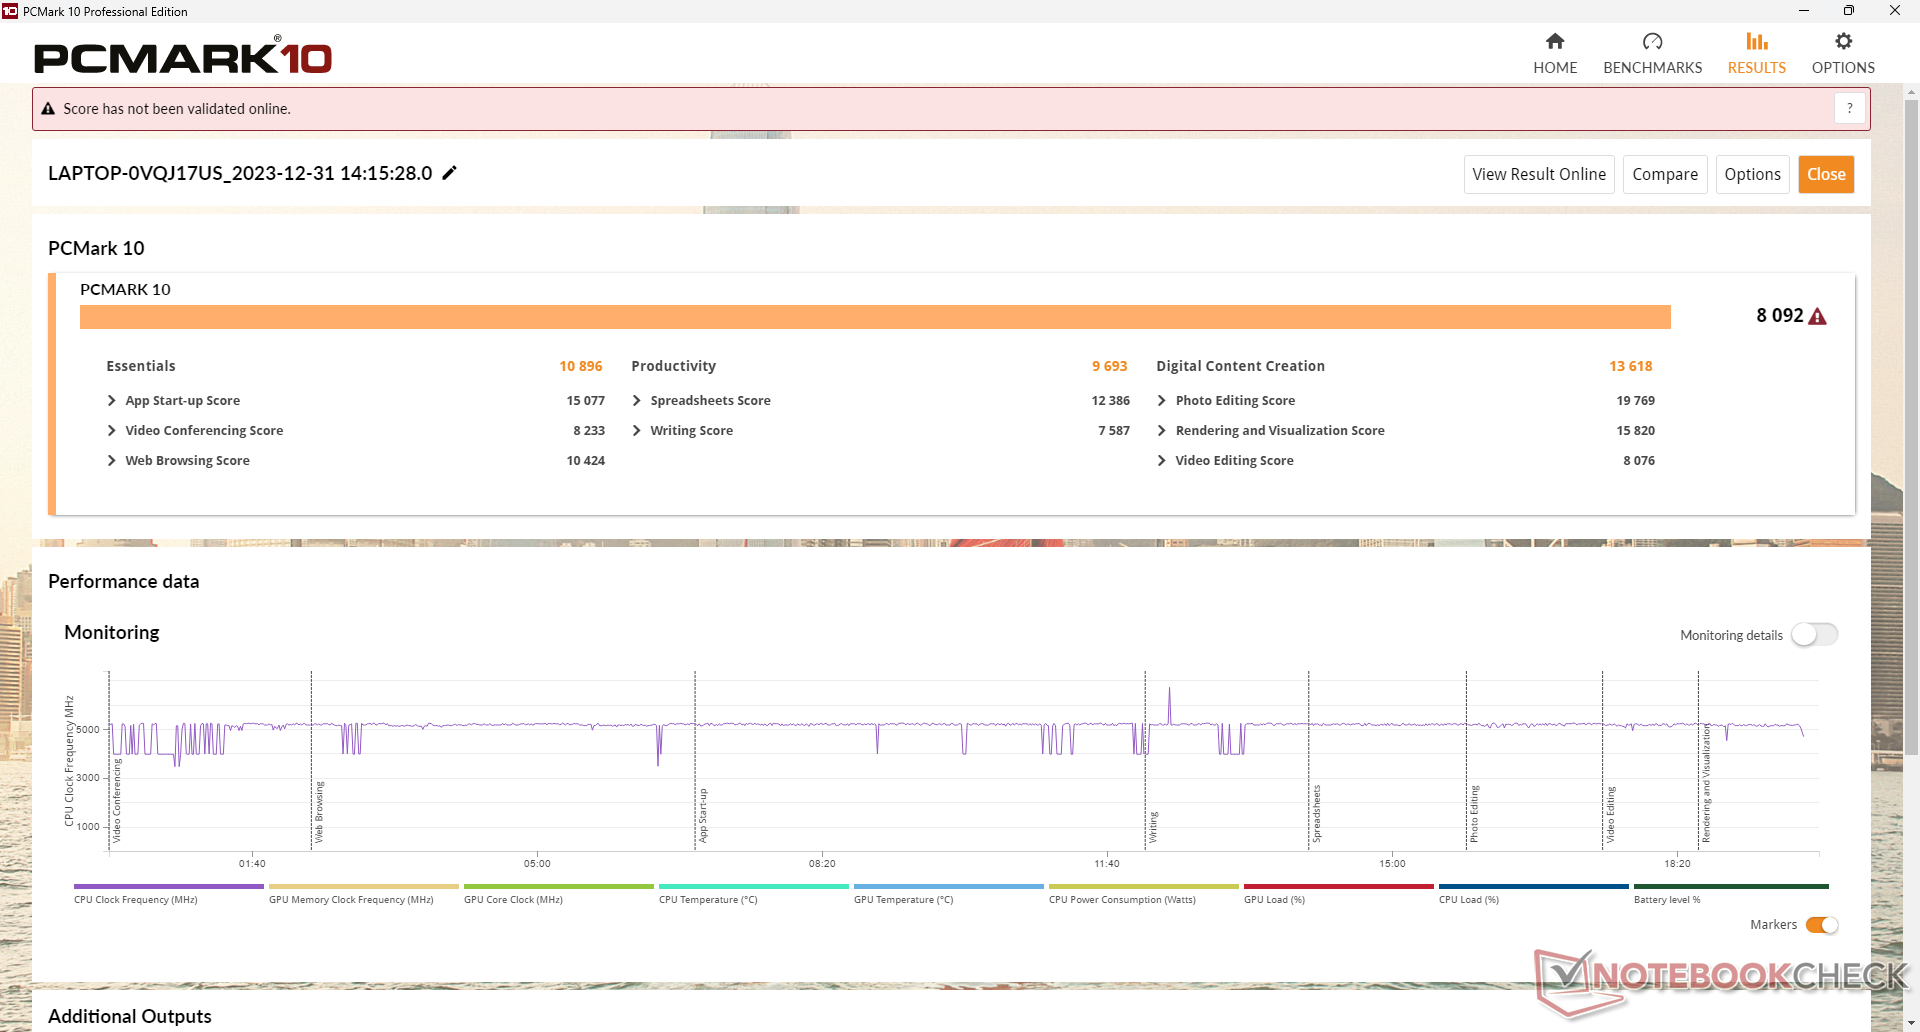
Systemets prestanda
PCMark-poängen är några av de högsta för en 13:e generationens Core i7-driven bärbar speldator tack vare den snabba Zen 4 Ryzen 7-processorn och GeForce RTX 4070 GPU. Vi upplevde inga krascher under testningen, men skärmen hade ibland problem med att vakna från viloläge, möjligen på grund av den automatiska GPU-växlingen.
CrossMark: Overall | Productivity | Creativity | Responsiveness
WebXPRT 3: Overall
WebXPRT 4: Overall
Mozilla Kraken 1.1: Total
| PCMark 10 / Score | |
| Genomsnitt AMD Ryzen 9 7940HS, NVIDIA GeForce RTX 4070 Laptop GPU (8092 - 8205, n=2) | |
| Asus TUF Gaming A17 FA707XI-NS94 | |
| MSI Pulse 17 B13VGK | |
| Razer Blade 17 (i7-12800H, RTX 3070 Ti) | |
| MSI Katana 17 B13VFK | |
| Asus TUF Gaming F17 FX707Z-HX011W | |
| HP Pavilion Gaming 17-cd2146ng | |
| PCMark 10 / Essentials | |
| Genomsnitt AMD Ryzen 9 7940HS, NVIDIA GeForce RTX 4070 Laptop GPU (10896 - 10952, n=2) | |
| Asus TUF Gaming A17 FA707XI-NS94 | |
| MSI Katana 17 B13VFK | |
| MSI Pulse 17 B13VGK | |
| Razer Blade 17 (i7-12800H, RTX 3070 Ti) | |
| Asus TUF Gaming F17 FX707Z-HX011W | |
| HP Pavilion Gaming 17-cd2146ng | |
| PCMark 10 / Productivity | |
| MSI Pulse 17 B13VGK | |
| Genomsnitt AMD Ryzen 9 7940HS, NVIDIA GeForce RTX 4070 Laptop GPU (9693 - 10805, n=2) | |
| Asus TUF Gaming A17 FA707XI-NS94 | |
| MSI Katana 17 B13VFK | |
| Razer Blade 17 (i7-12800H, RTX 3070 Ti) | |
| HP Pavilion Gaming 17-cd2146ng | |
| Asus TUF Gaming F17 FX707Z-HX011W | |
| PCMark 10 / Digital Content Creation | |
| Asus TUF Gaming A17 FA707XI-NS94 | |
| Genomsnitt AMD Ryzen 9 7940HS, NVIDIA GeForce RTX 4070 Laptop GPU (12666 - 13618, n=2) | |
| MSI Pulse 17 B13VGK | |
| Razer Blade 17 (i7-12800H, RTX 3070 Ti) | |
| Asus TUF Gaming F17 FX707Z-HX011W | |
| MSI Katana 17 B13VFK | |
| HP Pavilion Gaming 17-cd2146ng | |
| CrossMark / Overall | |
| MSI Pulse 17 B13VGK | |
| MSI Katana 17 B13VFK | |
| Genomsnitt AMD Ryzen 9 7940HS, NVIDIA GeForce RTX 4070 Laptop GPU (1797 - 1812, n=2) | |
| Asus TUF Gaming A17 FA707XI-NS94 | |
| Razer Blade 17 (i7-12800H, RTX 3070 Ti) | |
| Asus TUF Gaming F17 FX707Z-HX011W | |
| CrossMark / Productivity | |
| MSI Pulse 17 B13VGK | |
| MSI Katana 17 B13VFK | |
| Genomsnitt AMD Ryzen 9 7940HS, NVIDIA GeForce RTX 4070 Laptop GPU (1740 - 1762, n=2) | |
| Asus TUF Gaming A17 FA707XI-NS94 | |
| Razer Blade 17 (i7-12800H, RTX 3070 Ti) | |
| Asus TUF Gaming F17 FX707Z-HX011W | |
| CrossMark / Creativity | |
| MSI Pulse 17 B13VGK | |
| MSI Katana 17 B13VFK | |
| Asus TUF Gaming A17 FA707XI-NS94 | |
| Genomsnitt AMD Ryzen 9 7940HS, NVIDIA GeForce RTX 4070 Laptop GPU (1952 - 1979, n=2) | |
| Asus TUF Gaming F17 FX707Z-HX011W | |
| Razer Blade 17 (i7-12800H, RTX 3070 Ti) | |
| CrossMark / Responsiveness | |
| MSI Pulse 17 B13VGK | |
| MSI Katana 17 B13VFK | |
| Razer Blade 17 (i7-12800H, RTX 3070 Ti) | |
| Genomsnitt AMD Ryzen 9 7940HS, NVIDIA GeForce RTX 4070 Laptop GPU (1478 - 1575, n=2) | |
| Asus TUF Gaming A17 FA707XI-NS94 | |
| Asus TUF Gaming F17 FX707Z-HX011W | |
| WebXPRT 3 / Overall | |
| Asus TUF Gaming A17 FA707XI-NS94 | |
| Genomsnitt AMD Ryzen 9 7940HS, NVIDIA GeForce RTX 4070 Laptop GPU (317 - 319, n=2) | |
| MSI Katana 17 B13VFK | |
| MSI Pulse 17 B13VGK | |
| HP Pavilion Gaming 17-cd2146ng | |
| WebXPRT 4 / Overall | |
| Asus TUF Gaming A17 FA707XI-NS94 | |
| MSI Katana 17 B13VFK | |
| Genomsnitt AMD Ryzen 9 7940HS, NVIDIA GeForce RTX 4070 Laptop GPU (260 - 271, n=2) | |
| MSI Pulse 17 B13VGK | |
| Mozilla Kraken 1.1 / Total | |
| HP Pavilion Gaming 17-cd2146ng | |
| MSI Pulse 17 B13VGK | |
| MSI Katana 17 B13VFK | |
| Genomsnitt AMD Ryzen 9 7940HS, NVIDIA GeForce RTX 4070 Laptop GPU (481 - 499, n=2) | |
| Asus TUF Gaming A17 FA707XI-NS94 | |
* ... mindre är bättre
| PCMark 10 Score | 8092 poäng | |
Hjälp | ||
| AIDA64 / Memory Copy | |
| Genomsnitt AMD Ryzen 9 7940HS (35327 - 78739, n=10) | |
| MSI Pulse 17 B13VGK | |
| Asus TUF Gaming A17 FA707XI-NS94 | |
| MSI Katana 17 B13VFK | |
| Asus TUF Gaming F17 FX707Z-HX011W | |
| Razer Blade 17 (i7-12800H, RTX 3070 Ti) | |
| HP Pavilion Gaming 17-cd2146ng | |
| AIDA64 / Memory Read | |
| MSI Pulse 17 B13VGK | |
| Asus TUF Gaming F17 FX707Z-HX011W | |
| MSI Katana 17 B13VFK | |
| Asus TUF Gaming A17 FA707XI-NS94 | |
| Genomsnitt AMD Ryzen 9 7940HS (30769 - 61836, n=10) | |
| Razer Blade 17 (i7-12800H, RTX 3070 Ti) | |
| HP Pavilion Gaming 17-cd2146ng | |
| AIDA64 / Memory Write | |
| Genomsnitt AMD Ryzen 9 7940HS (42217 - 91567, n=10) | |
| Asus TUF Gaming A17 FA707XI-NS94 | |
| MSI Pulse 17 B13VGK | |
| Asus TUF Gaming F17 FX707Z-HX011W | |
| Razer Blade 17 (i7-12800H, RTX 3070 Ti) | |
| MSI Katana 17 B13VFK | |
| HP Pavilion Gaming 17-cd2146ng | |
| AIDA64 / Memory Latency | |
| MSI Katana 17 B13VFK | |
| MSI Pulse 17 B13VGK | |
| Genomsnitt AMD Ryzen 9 7940HS (87.6 - 111.1, n=10) | |
| Asus TUF Gaming A17 FA707XI-NS94 | |
| HP Pavilion Gaming 17-cd2146ng | |
| Asus TUF Gaming F17 FX707Z-HX011W | |
| Razer Blade 17 (i7-12800H, RTX 3070 Ti) | |
* ... mindre är bättre
DPC-fördröjning
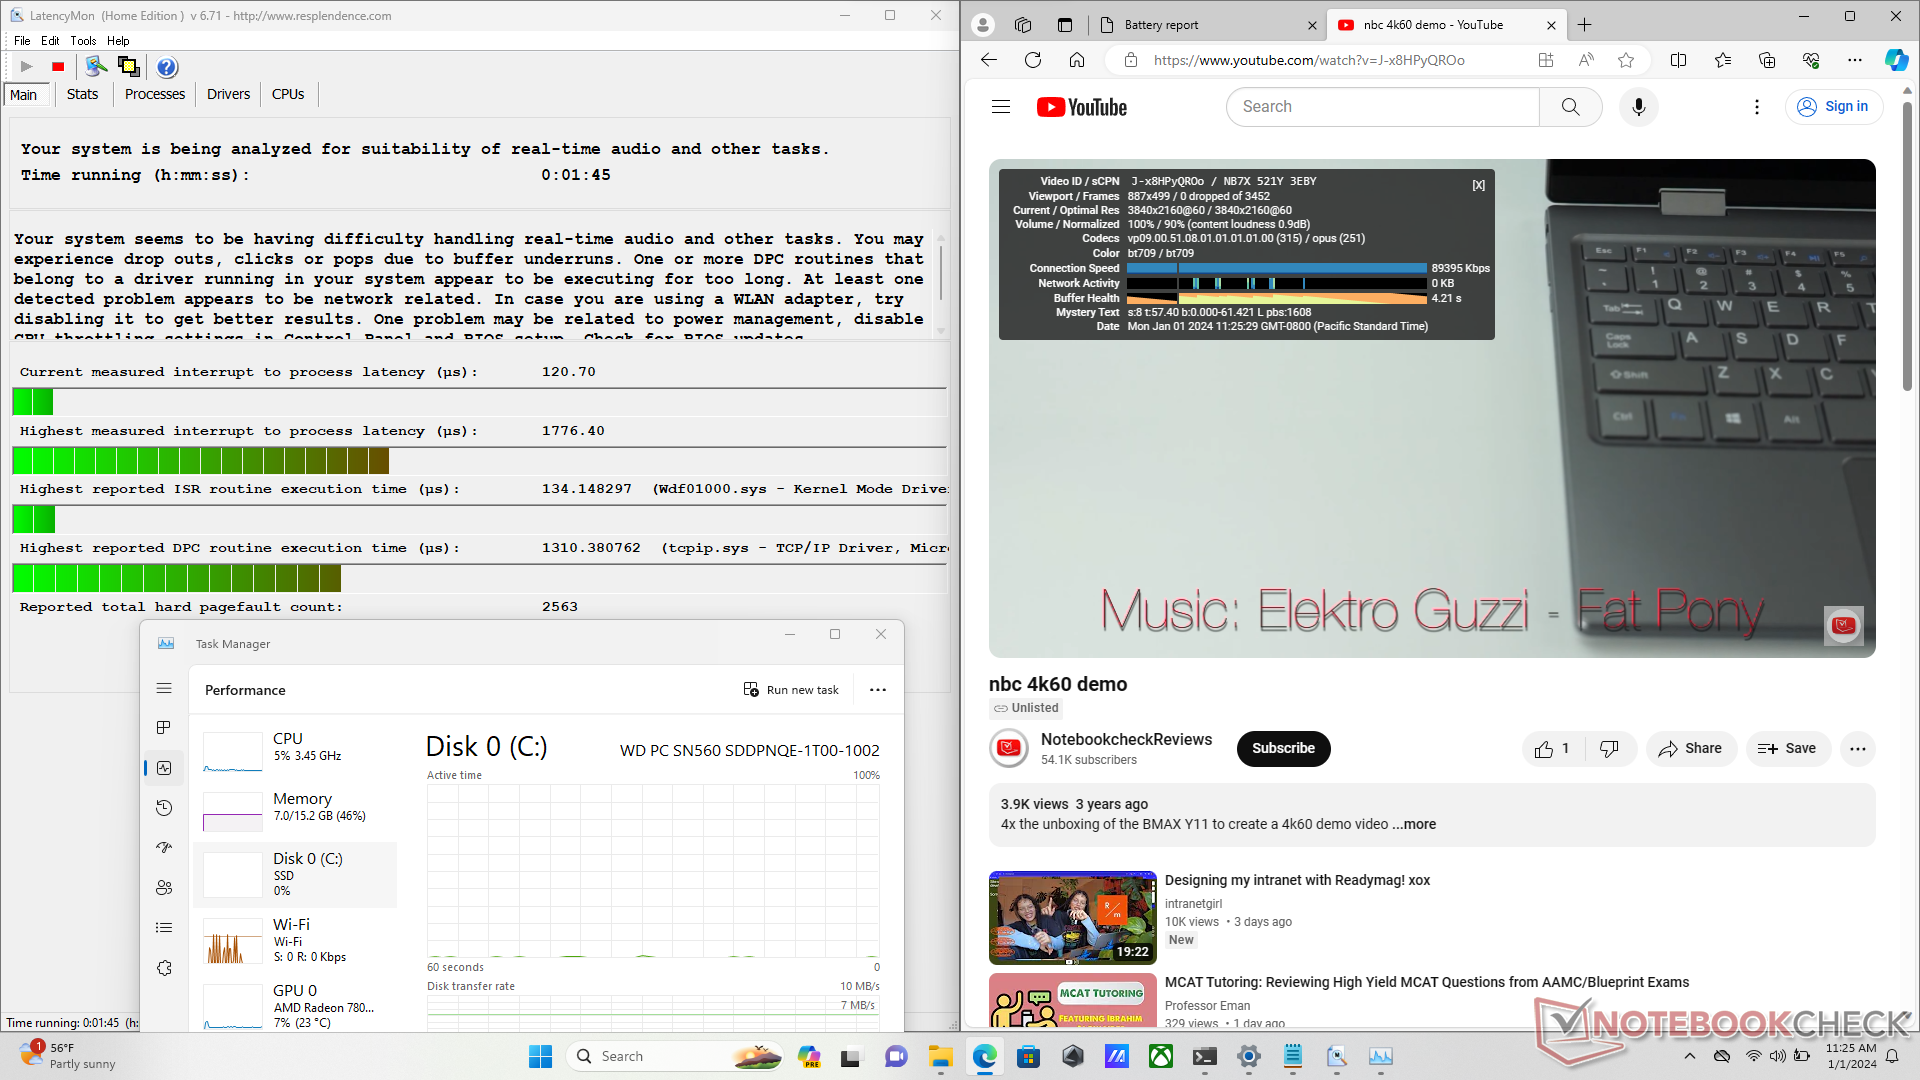
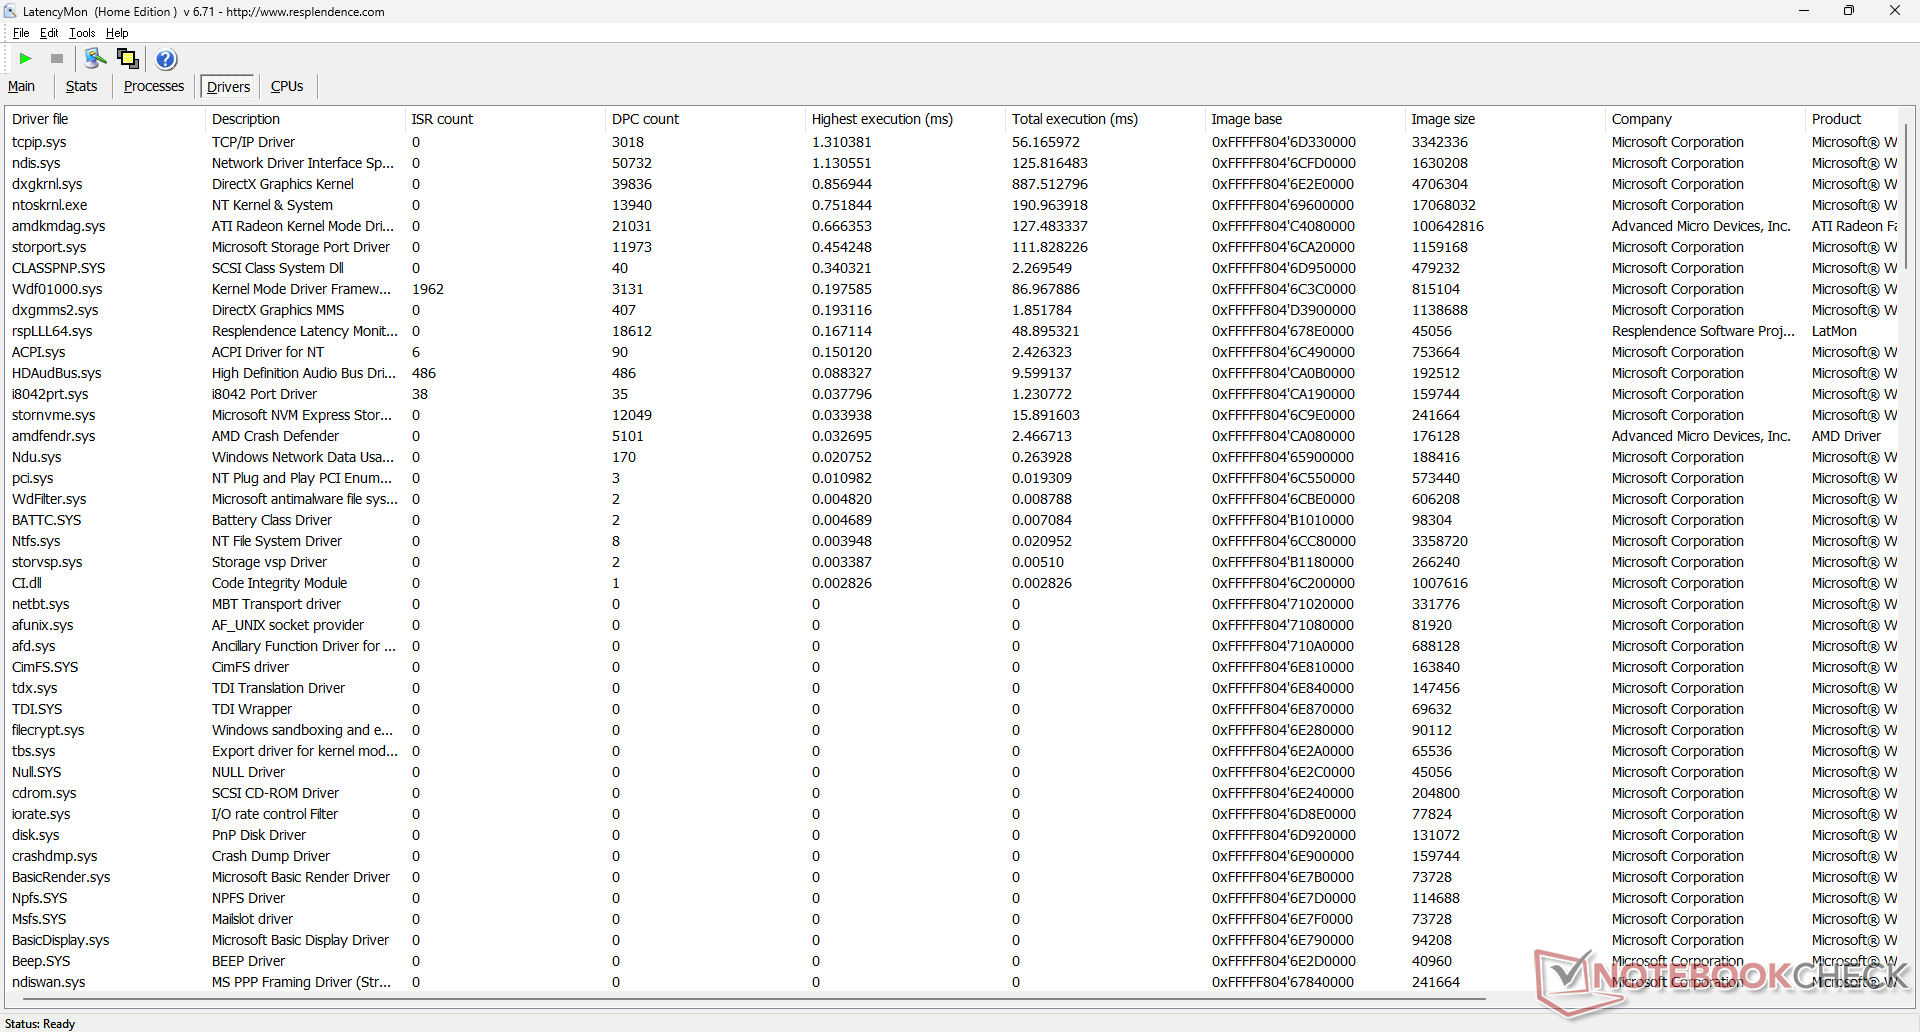
LatencyMon avslöjar DPC-problem när flera webbläsarflikar öppnas på vår hemsida. 4K-videouppspelning vid 60 FPS är annars perfekt utan några tappade bildrutor.
| DPC Latencies / LatencyMon - interrupt to process latency (max), Web, Youtube, Prime95 | |
| MSI Katana 17 B13VFK | |
| Asus TUF Gaming F17 FX707Z-HX011W | |
| Asus TUF Gaming A17 FA707XI-NS94 | |
| HP Pavilion Gaming 17-cd2146ng | |
| MSI Pulse 17 B13VGK | |
| Razer Blade 17 (i7-12800H, RTX 3070 Ti) | |
* ... mindre är bättre
Lagringsenheter
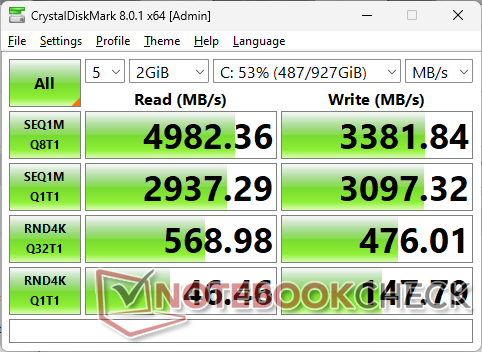
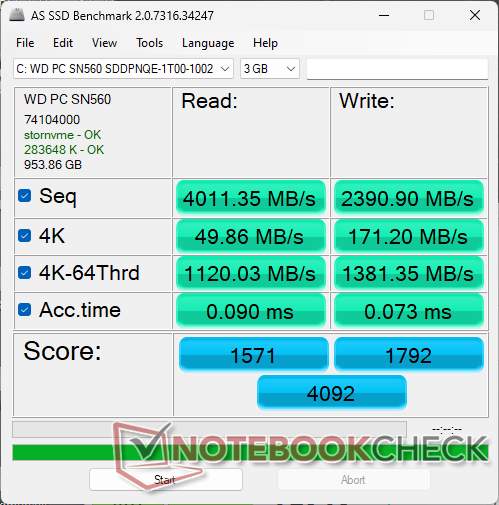
Vår testenhet levereras med WD SN560 som är en PCIe4 x4 NVMe SSD i mellanklassen i motsats till den avancerade WDC SN850X-serien. Överföringshastigheterna toppar på cirka 5000 MB/s istället för 7000+ MB/s på den tidigare nämnda SN850X. För en bärbar dator i mellanklassen är dock WD SN560 mer än tillräcklig. Vi kan inte registrera några problem med prestandastrypning på vår enhet, vilket visas av våra DiskSpd-stresstestresultat nedan.

* ... mindre är bättre
Disk Throttling: DiskSpd Read Loop, Queue Depth 8
GPU-prestanda
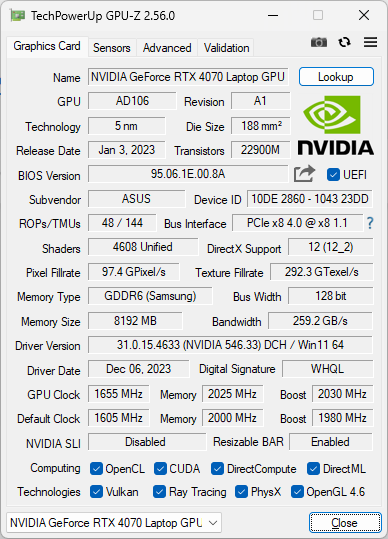
Den övergripande grafikprestandan är ungefär 25 till 30 procent långsammare än desktop-versionen av GeForce RTX 4070. Användare som uppgraderar från en äldre RTX 3060 laptop kommer fortfarande att se märkbara prestandaökningar på upp till 50 procent innan de tar hänsyn till några DLSS-aktiverade funktioner. Det relativt höga TGP-målet på 140 W gör att vår TUF Gaming A17 överträffar den genomsnittliga bärbara datorn i vår databas med samma RTX 4070 GPU med cirka 5 till 15 procent.
Nedgradering till
RTX 4060 eller RTX 4050 konfigurationen kommer att påverka prestandan med cirka 20 procent respektive 35 procent. Prestandadeltat är mer eller mindre en rak linje när man hoppar mellan alternativen RTX 4050, RTX 4060 och RTX 4070. De snabbare RTX 4080 eller 4090 är endast tillgängliga på Asus avancerade ROG-modeller.| Kraftprofil | Grafisk poäng | Poäng för fysik | Kombinerat resultat |
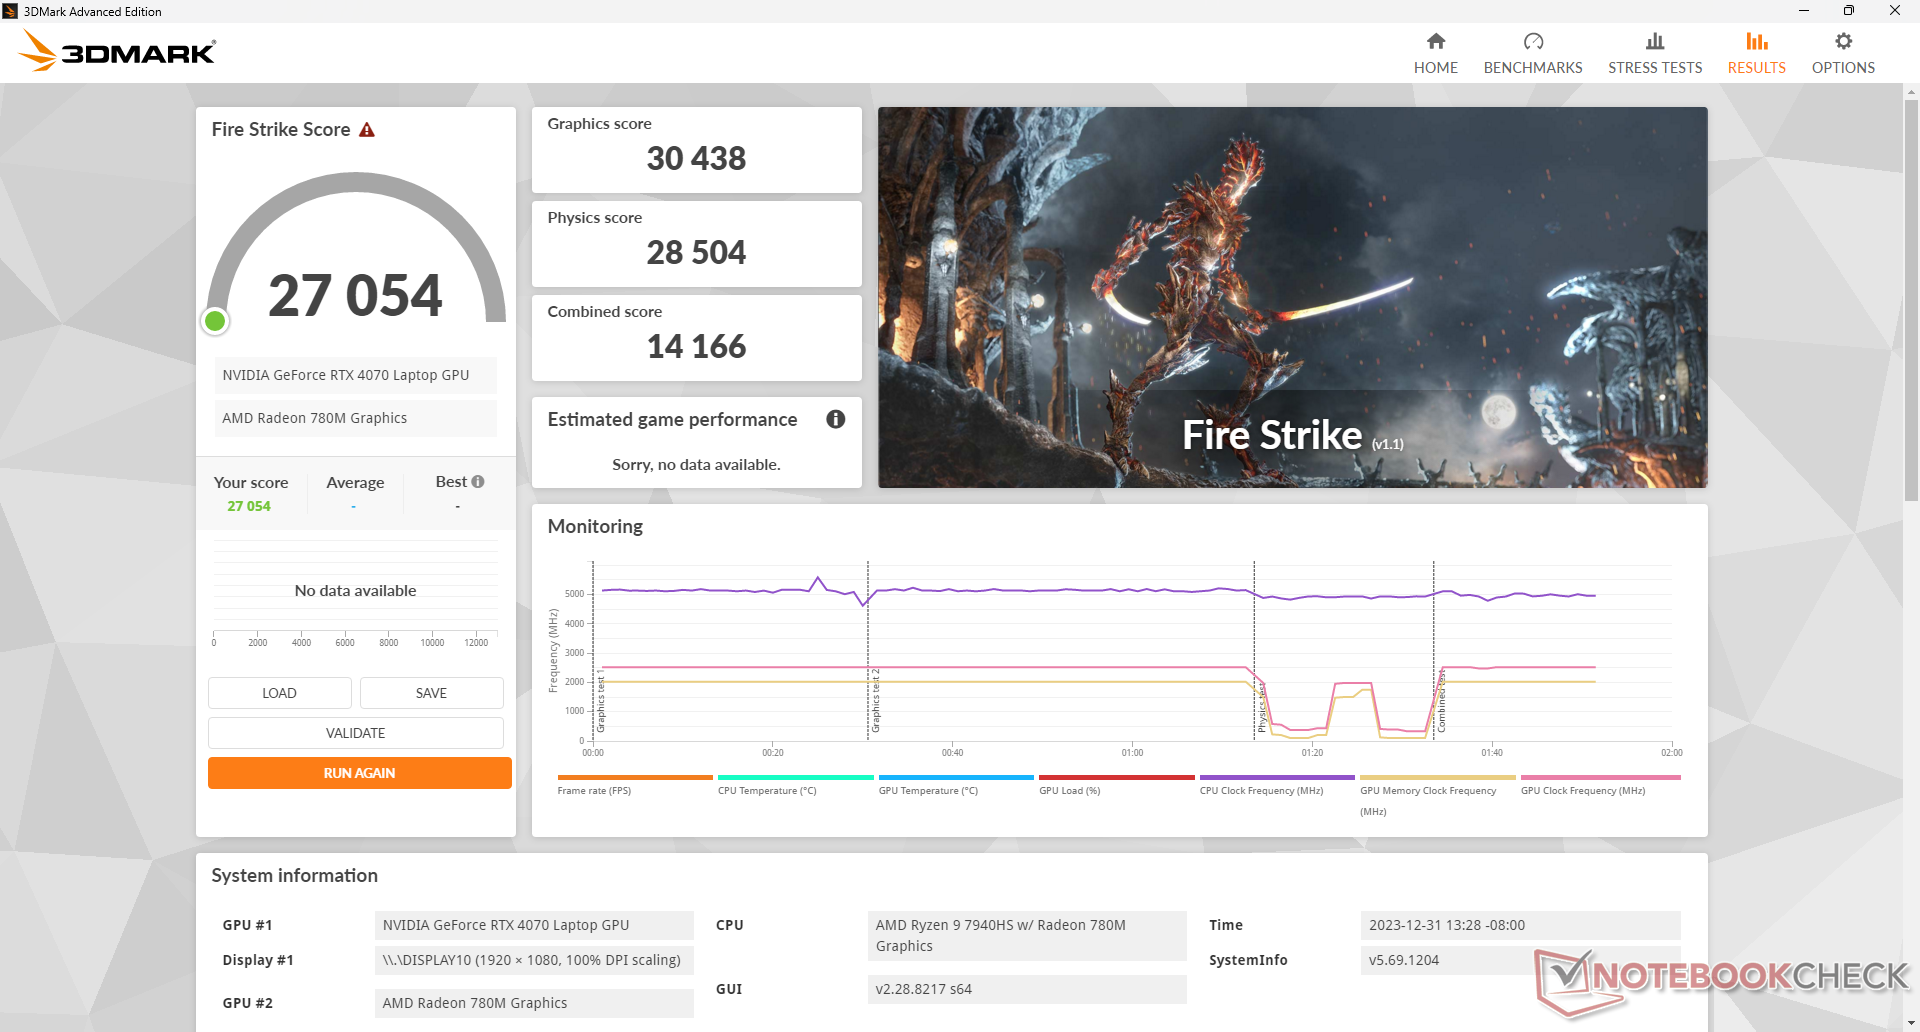
| Turbo-läge | 30438 | 28504 | 14166 |
| Prestanda-läge | 29222 (-4%) | 28345 (-1%) | 13129 (-7%) |
| Balanserat läge | 29472 (-3%) | 27605 (-3%) | 12947 (-9%) |
| Batteridrift | 23884 (-22%) | 26213 (-8%) | 11027 (-22%) |
Körning med de långsammare energiprofilerna Prestanda eller Balanserad påverkar systemprestanda endast marginellt, vilket framgår av vår Fire Strike resultattabell ovan. Den största påverkan kommer från att köra på batteridrift, vilket var väntat.
| 3DMark Performance rating - Percent | |
| MSI Raider GE78 HX 13VI -1! | |
| Alienware m18 R1 AMD -1! | |
| Alienware m16 R1 AMD | |
| KFA2 GeForce RTX 4070 EX Gamer | |
| Asus TUF Gaming A17 FA707XI-NS94 | |
| Lenovo Legion 7 16ARHA7 -1! | |
| Genomsnitt NVIDIA GeForce RTX 4070 Laptop GPU | |
| Razer Blade 17 (i7-12800H, RTX 3070 Ti) -1! | |
| MSI Katana 17 B13VFK -1! | |
| Asus TUF Gaming F17 FX707Z-HX011W -1! | |
| Medion Erazer Scout E20 | |
| Asus ROG Strix G17 G713QE-RB74 -1! | |
| Lenovo ThinkPad Z16 Gen 2 -1! | |
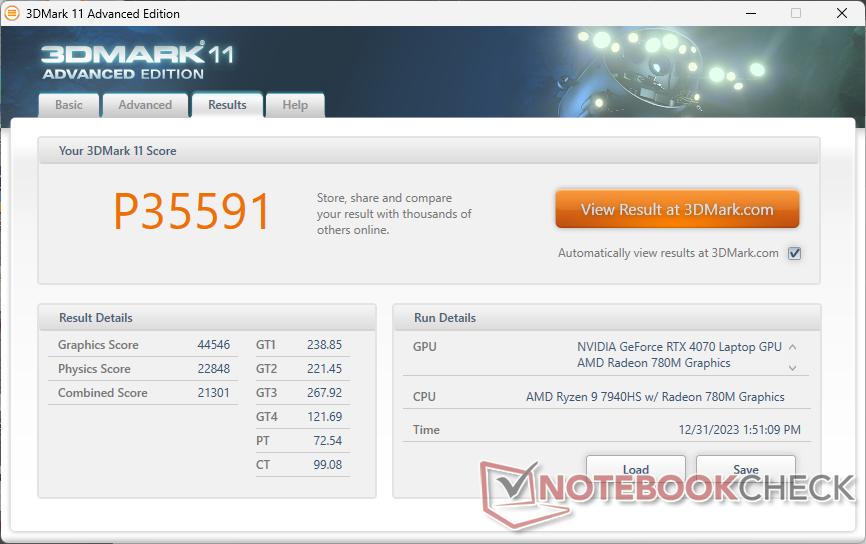
| 3DMark 11 Performance | 35591 poäng | |
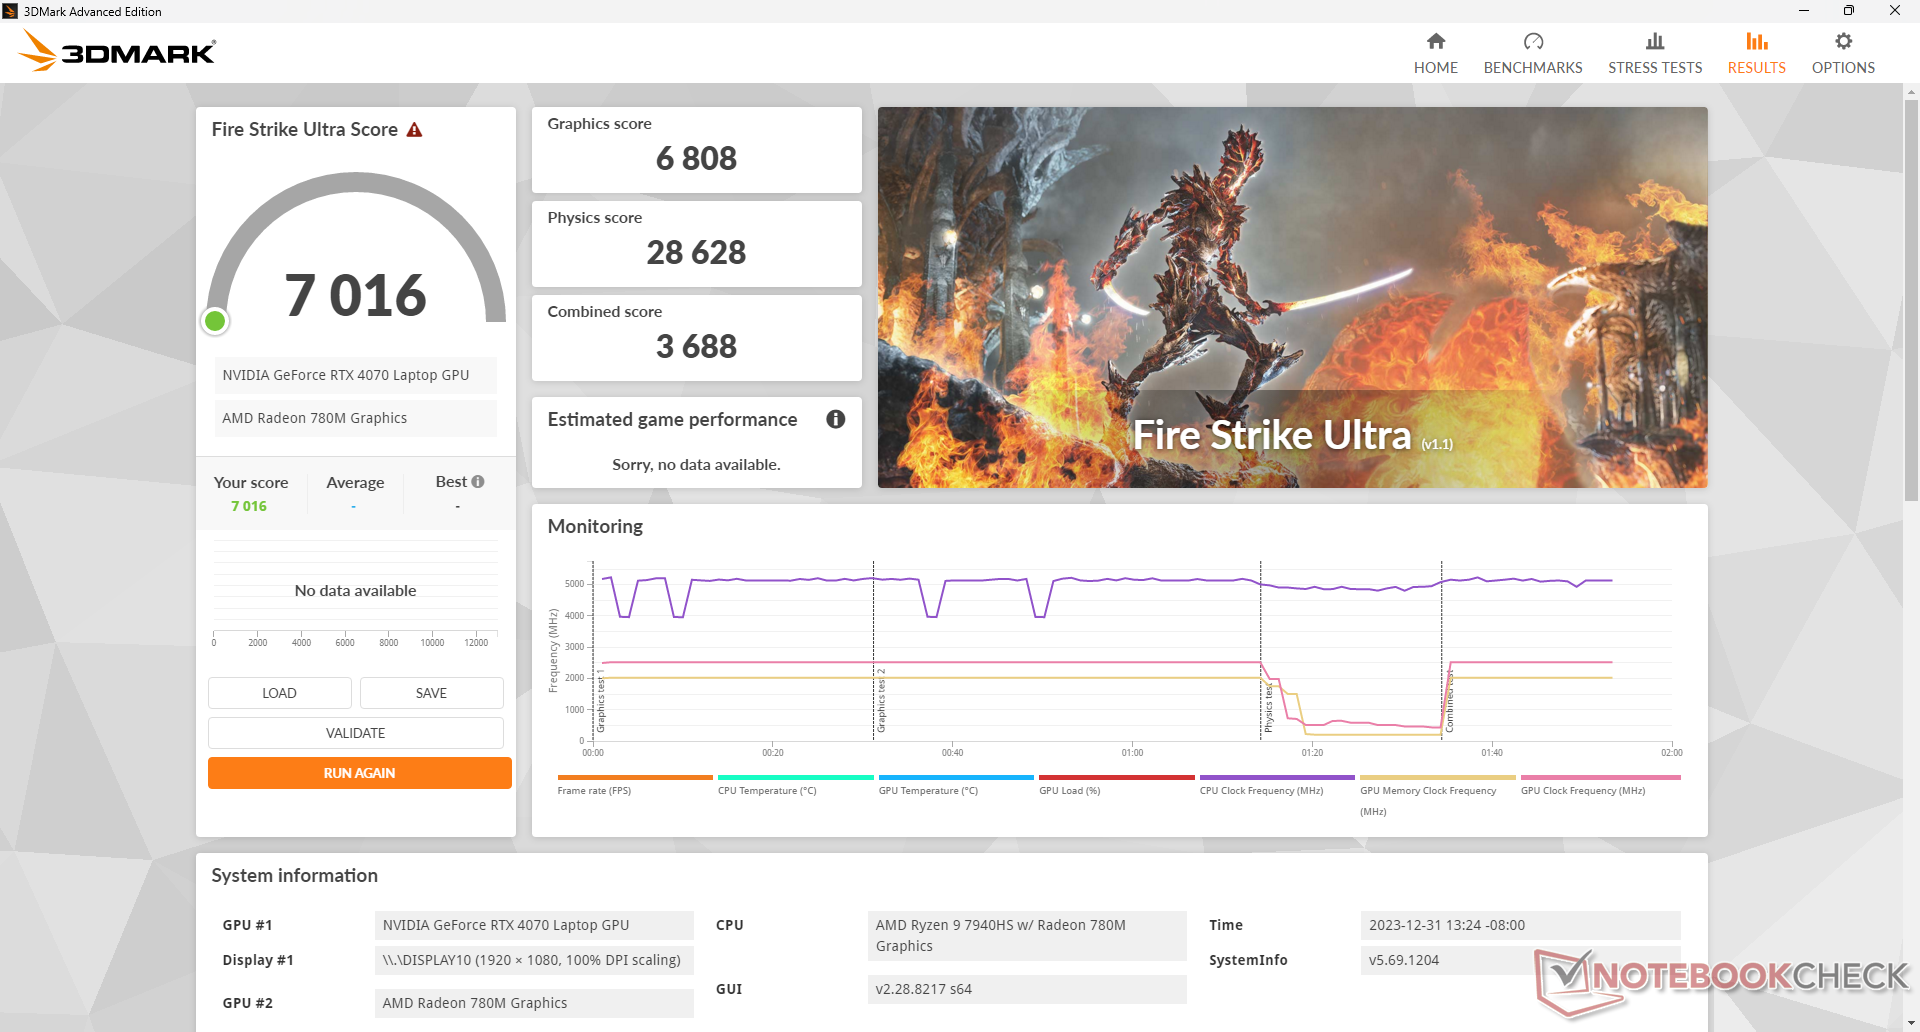
| 3DMark Fire Strike Score | 27054 poäng | |
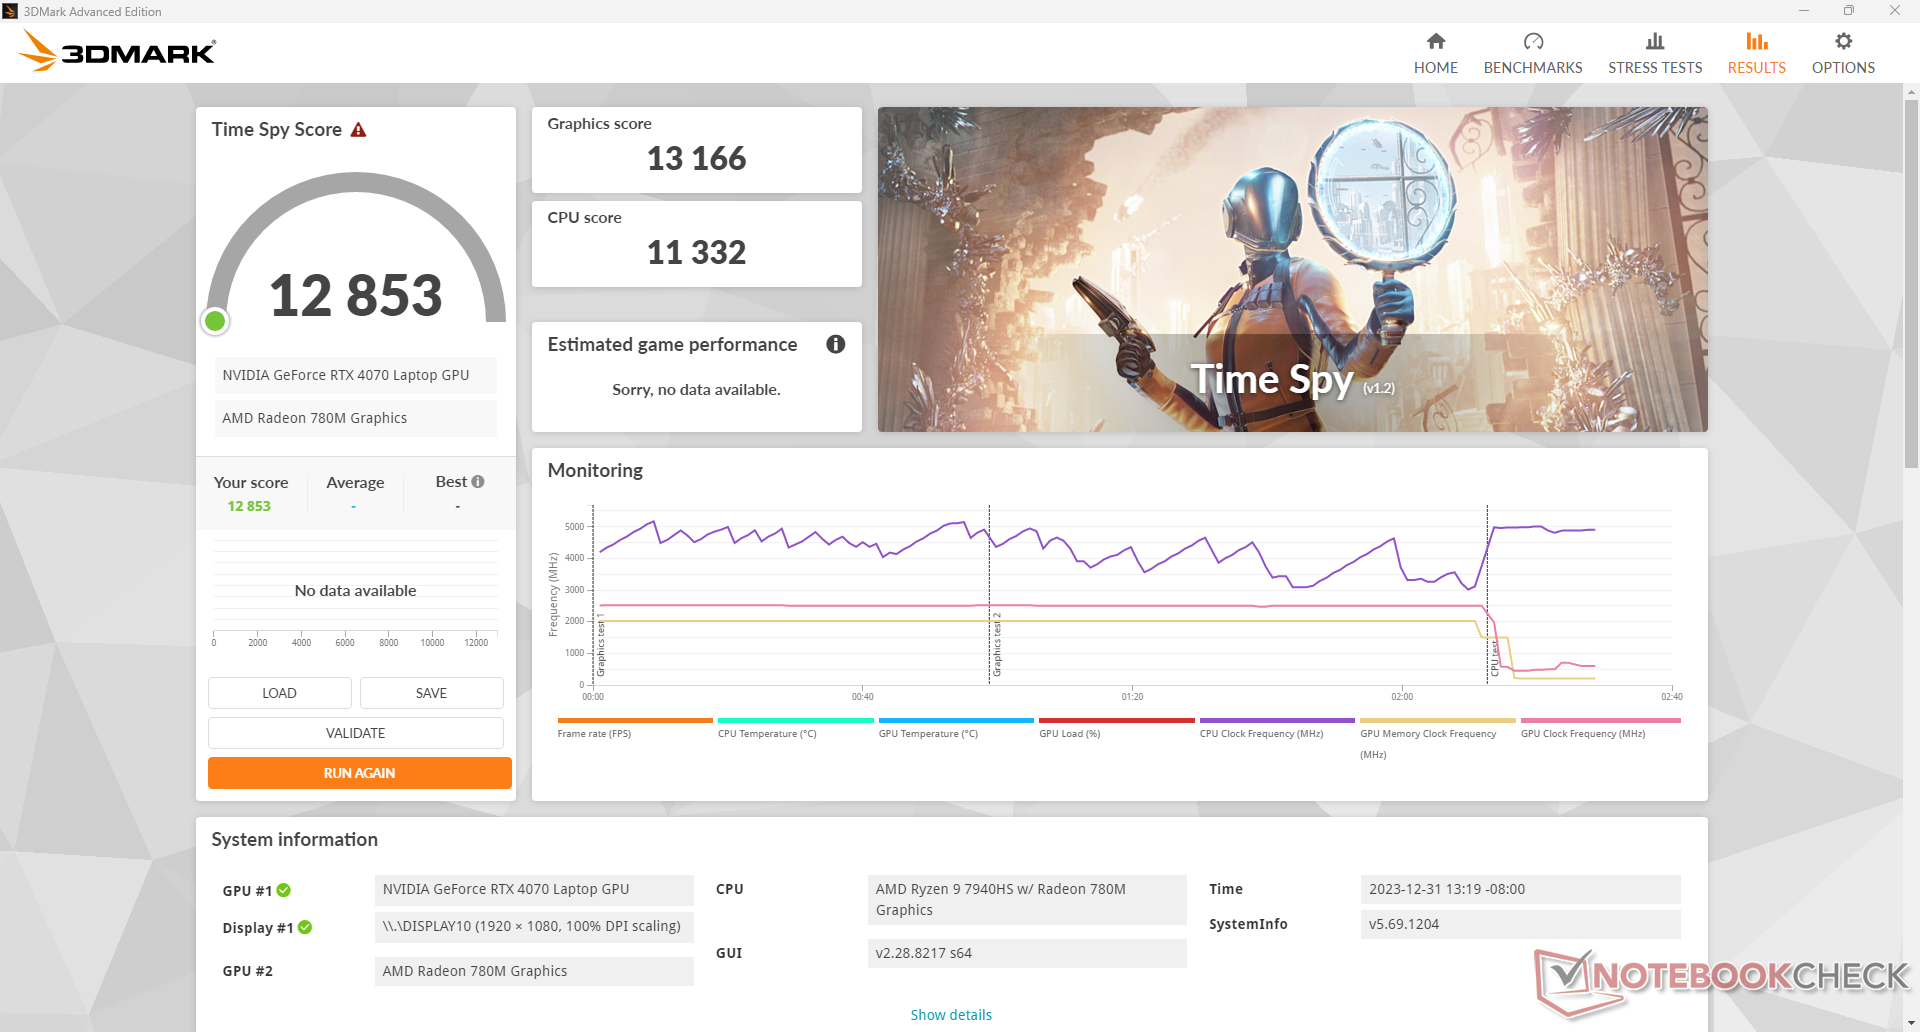
| 3DMark Time Spy Score | 12853 poäng | |
Hjälp | ||
* ... mindre är bättre
| Performance rating - Percent | |
| MSI Raider GE78 HX 13VI | |
| Alienware m16 R1 AMD -1! | |
| Alienware m18 R1 AMD | |
| MSI Katana 17 B13VFK | |
| Razer Blade 17 (i7-12800H, RTX 3070 Ti) | |
| Asus TUF Gaming A17 FA707XI-NS94 -1! | |
| Asus TUF Gaming F17 FX707Z-HX011W | |
| Lenovo Legion 7 16ARHA7 | |
| Asus ROG Strix G17 G713QE-RB74 | |
| Lenovo ThinkPad Z16 Gen 2 -1! | |
| The Witcher 3 - 1920x1080 Ultra Graphics & Postprocessing (HBAO+) | |
| MSI Raider GE78 HX 13VI | |
| Alienware m16 R1 AMD | |
| Alienware m18 R1 AMD | |
| Asus TUF Gaming A17 FA707XI-NS94 | |
| Lenovo Legion 7 16ARHA7 | |
| Razer Blade 17 (i7-12800H, RTX 3070 Ti) | |
| MSI Katana 17 B13VFK | |
| Asus TUF Gaming F17 FX707Z-HX011W | |
| Asus ROG Strix G17 G713QE-RB74 | |
| Lenovo ThinkPad Z16 Gen 2 | |
| GTA V - 1920x1080 Highest AA:4xMSAA + FX AF:16x | |
| MSI Raider GE78 HX 13VI | |
| MSI Katana 17 B13VFK | |
| Alienware m18 R1 AMD | |
| Razer Blade 17 (i7-12800H, RTX 3070 Ti) | |
| Asus TUF Gaming F17 FX707Z-HX011W | |
| Lenovo Legion 7 16ARHA7 | |
| Asus ROG Strix G17 G713QE-RB74 | |
| Final Fantasy XV Benchmark - 1920x1080 High Quality | |
| MSI Raider GE78 HX 13VI | |
| Alienware m16 R1 AMD | |
| Alienware m18 R1 AMD | |
| Asus TUF Gaming A17 FA707XI-NS94 | |
| Lenovo Legion 7 16ARHA7 | |
| Razer Blade 17 (i7-12800H, RTX 3070 Ti) | |
| MSI Katana 17 B13VFK | |
| Asus TUF Gaming F17 FX707Z-HX011W | |
| Asus ROG Strix G17 G713QE-RB74 | |
| Lenovo ThinkPad Z16 Gen 2 | |
| Strange Brigade - 1920x1080 ultra AA:ultra AF:16 | |
| MSI Raider GE78 HX 13VI | |
| Alienware m16 R1 AMD | |
| Alienware m18 R1 AMD | |
| Lenovo Legion 7 16ARHA7 | |
| Asus TUF Gaming A17 FA707XI-NS94 | |
| Razer Blade 17 (i7-12800H, RTX 3070 Ti) | |
| MSI Katana 17 B13VFK | |
| Asus TUF Gaming F17 FX707Z-HX011W | |
| Asus ROG Strix G17 G713QE-RB74 | |
| Lenovo ThinkPad Z16 Gen 2 | |
| Dota 2 Reborn - 1920x1080 ultra (3/3) best looking | |
| MSI Raider GE78 HX 13VI | |
| Alienware m16 R1 AMD | |
| MSI Katana 17 B13VFK | |
| Alienware m18 R1 AMD | |
| Razer Blade 17 (i7-12800H, RTX 3070 Ti) | |
| Asus TUF Gaming F17 FX707Z-HX011W | |
| Asus TUF Gaming A17 FA707XI-NS94 | |
| Asus ROG Strix G17 G713QE-RB74 | |
| Lenovo ThinkPad Z16 Gen 2 | |
| Lenovo Legion 7 16ARHA7 | |
| X-Plane 11.11 - 1920x1080 high (fps_test=3) | |
| MSI Raider GE78 HX 13VI | |
| MSI Katana 17 B13VFK | |
| Alienware m16 R1 AMD | |
| Razer Blade 17 (i7-12800H, RTX 3070 Ti) | |
| Asus TUF Gaming F17 FX707Z-HX011W | |
| Alienware m18 R1 AMD | |
| Asus TUF Gaming A17 FA707XI-NS94 | |
| Asus ROG Strix G17 G713QE-RB74 | |
| Lenovo Legion 7 16ARHA7 | |
| Lenovo ThinkPad Z16 Gen 2 | |
| Tiny Tina's Wonderlands | |
| 1920x1080 Badass Preset (DX12) | |
| Alienware m16 R1 AMD | |
| Alienware m18 R1 AMD | |
| Asus TUF Gaming A17 FA707XI-NS94 | |
| Genomsnitt NVIDIA GeForce RTX 4070 Laptop GPU (58.6 - 115.9, n=18) | |
| MSI Katana 17 B13VFK | |
| Lenovo ThinkPad Z16 Gen 2 | |
| 2560x1440 Badass Preset (DX12) | |
| Alienware m16 R1 AMD | |
| Alienware m18 R1 AMD | |
| Asus TUF Gaming A17 FA707XI-NS94 | |
| Genomsnitt NVIDIA GeForce RTX 4070 Laptop GPU (49.8 - 79.5, n=17) | |
| Lenovo ThinkPad Z16 Gen 2 | |
| 3840x2160 Badass Preset (DX12) | |
| Alienware m16 R1 AMD | |
| Alienware m18 R1 AMD | |
| Asus TUF Gaming A17 FA707XI-NS94 | |
| Genomsnitt NVIDIA GeForce RTX 4070 Laptop GPU (28.3 - 39.7, n=13) | |
| Baldur's Gate 3 | |
| 1920x1080 Ultra Preset AA:T | |
| Alienware m18 R1 AMD | |
| Asus TUF Gaming A17 FA707XI-NS94 | |
| Genomsnitt NVIDIA GeForce RTX 4070 Laptop GPU (66.7 - 128.5, n=30) | |
| Lenovo ThinkPad Z16 Gen 2 | |
| 2560x1440 Ultra Preset AA:T | |
| Alienware m18 R1 AMD | |
| Asus TUF Gaming A17 FA707XI-NS94 | |
| Genomsnitt NVIDIA GeForce RTX 4070 Laptop GPU (54.4 - 89.6, n=25) | |
| Lenovo ThinkPad Z16 Gen 2 | |
| 3840x2160 Ultra Preset AA:T | |
| Alienware m18 R1 AMD | |
| Asus TUF Gaming A17 FA707XI-NS94 | |
| Genomsnitt NVIDIA GeForce RTX 4070 Laptop GPU (33.4 - 45.2, n=12) | |
| Cyberpunk 2077 | |
| 1920x1080 High Preset (FSR off) | |
| Alienware m18 R1 AMD | |
| Asus TUF Gaming A17 FA707XI-NS94 | |
| Genomsnitt NVIDIA GeForce RTX 4070 Laptop GPU (74.7 - 103.6, n=32) | |
| Lenovo ThinkPad Z16 Gen 2 | |
| 1920x1080 Ultra Preset (FSR off) | |
| Alienware m18 R1 AMD | |
| MSI Raider GE78 HX 13VI | |
| Asus TUF Gaming A17 FA707XI-NS94 | |
| Genomsnitt NVIDIA GeForce RTX 4070 Laptop GPU (30.7 - 90.7, n=40) | |
| Lenovo ThinkPad Z16 Gen 2 | |
| 2560x1440 Ultra Preset (FSR off) | |
| MSI Raider GE78 HX 13VI | |
| Alienware m18 R1 AMD | |
| Asus TUF Gaming A17 FA707XI-NS94 | |
| Genomsnitt NVIDIA GeForce RTX 4070 Laptop GPU (24.8 - 57.1, n=37) | |
| Lenovo ThinkPad Z16 Gen 2 | |
| 3840x2160 Ultra Preset (FSR off) | |
| MSI Raider GE78 HX 13VI | |
| Alienware m18 R1 AMD | |
| Asus TUF Gaming A17 FA707XI-NS94 | |
| Genomsnitt NVIDIA GeForce RTX 4070 Laptop GPU (20.2 - 24, n=13) | |
| 1920x1080 Ray Tracing Ultra Preset (DLSS off) | |
| MSI Raider GE78 HX 13VI | |
| Asus TUF Gaming A17 FA707XI-NS94 | |
| Alienware m18 R1 AMD | |
| Genomsnitt NVIDIA GeForce RTX 4070 Laptop GPU (19.1 - 46.8, n=23) | |
| Lenovo ThinkPad Z16 Gen 2 | |
| The Witcher 3 | |
| 1920x1080 Ultra Graphics & Postprocessing (HBAO+) | |
| MSI Raider GE78 HX 13VI | |
| Alienware m16 R1 AMD | |
| Alienware m18 R1 AMD | |
| Asus TUF Gaming A17 FA707XI-NS94 | |
| Lenovo Legion 7 16ARHA7 | |
| Genomsnitt NVIDIA GeForce RTX 4070 Laptop GPU (69.8 - 133.7, n=57) | |
| Razer Blade 17 (i7-12800H, RTX 3070 Ti) | |
| MSI Katana 17 B13VFK | |
| Asus TUF Gaming F17 FX707Z-HX011W | |
| Asus ROG Strix G17 G713QE-RB74 | |
| Lenovo ThinkPad Z16 Gen 2 | |
| 3840x2160 High Graphics & Postprocessing (Nvidia HairWorks Off) | |
| MSI Raider GE78 HX 13VI | |
| Alienware m16 R1 AMD | |
| Alienware m18 R1 AMD | |
| Asus TUF Gaming A17 FA707XI-NS94 | |
| Genomsnitt NVIDIA GeForce RTX 4070 Laptop GPU (26.5 - 83.5, n=16) | |
| MSI Katana 17 B13VFK | |
| Strange Brigade | |
| 1920x1080 ultra AA:ultra AF:16 | |
| MSI Raider GE78 HX 13VI | |
| Alienware m16 R1 AMD | |
| Alienware m18 R1 AMD | |
| Lenovo Legion 7 16ARHA7 | |
| Asus TUF Gaming A17 FA707XI-NS94 | |
| Genomsnitt NVIDIA GeForce RTX 4070 Laptop GPU (76.3 - 234, n=63) | |
| Razer Blade 17 (i7-12800H, RTX 3070 Ti) | |
| MSI Katana 17 B13VFK | |
| Asus TUF Gaming F17 FX707Z-HX011W | |
| Asus ROG Strix G17 G713QE-RB74 | |
| Lenovo ThinkPad Z16 Gen 2 | |
| 2560x1440 ultra AA:ultra AF:16 | |
| MSI Raider GE78 HX 13VI | |
| Alienware m18 R1 AMD | |
| Alienware m16 R1 AMD | |
| Lenovo Legion 7 16ARHA7 | |
| Asus TUF Gaming A17 FA707XI-NS94 | |
| Genomsnitt NVIDIA GeForce RTX 4070 Laptop GPU (52.8 - 150.9, n=55) | |
| MSI Katana 17 B13VFK | |
| 3840x2160 ultra AA:ultra AF:16 | |
| MSI Raider GE78 HX 13VI | |
| Alienware m18 R1 AMD | |
| Alienware m16 R1 AMD | |
| Asus TUF Gaming A17 FA707XI-NS94 | |
| Genomsnitt NVIDIA GeForce RTX 4070 Laptop GPU (42.7 - 77.9, n=18) | |
| MSI Katana 17 B13VFK | |
| X-Plane 11.11 | |
| 1920x1080 high (fps_test=3) | |
| MSI Raider GE78 HX 13VI | |
| MSI Katana 17 B13VFK | |
| Alienware m16 R1 AMD | |
| Genomsnitt NVIDIA GeForce RTX 4070 Laptop GPU (52.1 - 147.9, n=69) | |
| Razer Blade 17 (i7-12800H, RTX 3070 Ti) | |
| Asus TUF Gaming F17 FX707Z-HX011W | |
| Alienware m18 R1 AMD | |
| Asus TUF Gaming A17 FA707XI-NS94 | |
| Asus ROG Strix G17 G713QE-RB74 | |
| Lenovo Legion 7 16ARHA7 | |
| Lenovo ThinkPad Z16 Gen 2 | |
| 3840x2160 high (fps_test=3) | |
| MSI Raider GE78 HX 13VI | |
| MSI Katana 17 B13VFK | |
| Alienware m16 R1 AMD | |
| Genomsnitt NVIDIA GeForce RTX 4070 Laptop GPU (63.4 - 125.8, n=26) | |
| Asus TUF Gaming A17 FA707XI-NS94 | |
| Alienware m18 R1 AMD | |
| Dota 2 Reborn | |
| 1920x1080 ultra (3/3) best looking | |
| MSI Raider GE78 HX 13VI | |
| Alienware m16 R1 AMD | |
| MSI Katana 17 B13VFK | |
| Genomsnitt NVIDIA GeForce RTX 4070 Laptop GPU (89.7 - 191.2, n=67) | |
| Alienware m18 R1 AMD | |
| Razer Blade 17 (i7-12800H, RTX 3070 Ti) | |
| Asus TUF Gaming F17 FX707Z-HX011W | |
| Asus TUF Gaming A17 FA707XI-NS94 | |
| Asus ROG Strix G17 G713QE-RB74 | |
| Lenovo ThinkPad Z16 Gen 2 | |
| Lenovo Legion 7 16ARHA7 | |
| 3840x2160 ultra (3/3) best looking | |
| MSI Raider GE78 HX 13VI | |
| Alienware m16 R1 AMD | |
| Genomsnitt NVIDIA GeForce RTX 4070 Laptop GPU (88.4 - 153.3, n=26) | |
| MSI Katana 17 B13VFK | |
| Alienware m18 R1 AMD | |
| Asus TUF Gaming A17 FA707XI-NS94 | |
Witcher 3 FPS Chart
| låg | med. | hög | ultra | QHD | 4K | |
|---|---|---|---|---|---|---|
| The Witcher 3 (2015) | 120.7 | 75.2 | ||||
| Dota 2 Reborn (2015) | 161.6 | 146.4 | 138.1 | 130 | 112.2 | |
| Final Fantasy XV Benchmark (2018) | 121.9 | 88.9 | 49.4 | |||
| X-Plane 11.11 (2018) | 114.7 | 101.7 | 80.7 | 68.6 | ||
| Far Cry 5 (2018) | 121 | 114 | 62 | |||
| Strange Brigade (2018) | 214 | 139.3 | 72.6 | |||
| Tiny Tina's Wonderlands (2022) | 109.4 | 75.6 | 35.5 | |||
| F1 22 (2022) | 210 | 83.8 | 54.7 | 26.5 | ||
| Baldur's Gate 3 (2023) | 114.7 | 81.1 | 41.1 | |||
| Cyberpunk 2077 (2023) | 135.8 | 118.1 | 99.4 | 86.3 | 51.8 | 22.3 |
Utsläpp
Buller från systemet
Inte bara är fläktljudet generellt högre än vad vi registrerade på Intel-modellen, det är också mycket högre om det är inställt på Turbo-läge. Att köra Witcher 3 i Performance-läget skulle resultera i ett fläktljud på bara 41 dB(A) jämfört med 57 dB(A) i Turbo-läget. Eftersom turboläget bara är något snabbare än prestandaläget kan det vara en bra idé att spela i prestandaläget istället för turboläget, eftersom fläktarna då är mycket tystare. I övrigt rekommenderar vi generellt hörlurar när ljudnivån på bärbara speldatorer når 50 dB(A) eller högre.
Ljudnivå
| Låg belastning |
| 28.5 / 29.8 / 29.8 dB(A) |
| Hög belastning |
| 34.8 / 57.3 dB(A) |
 | ||
30 dB tyst 40 dB(A) hörbar 50 dB(A) högt ljud |
||
min: | ||
| Asus TUF Gaming A17 FA707XI-NS94 GeForce RTX 4070 Laptop GPU, R9 7940HS, WD PC SN560 SDDPNQE-1T00 | Asus TUF Gaming F17 FX707Z-HX011W GeForce RTX 3060 Laptop GPU, i7-12700H, SK Hynix HFM001TD3JX013N | MSI Pulse 17 B13VGK GeForce RTX 4070 Laptop GPU, i7-13700H, Micron 2400 MTFDKBA1T0QFM | MSI Katana 17 B13VFK GeForce RTX 4060 Laptop GPU, i7-13620H, Micron 2400 MTFDKBA1T0QFM | Razer Blade 17 (i7-12800H, RTX 3070 Ti) GeForce RTX 3070 Ti Laptop GPU, i7-12800H, Samsung PM9A1 MZVL21T0HCLR | HP Pavilion Gaming 17-cd2146ng GeForce RTX 3050 Ti Laptop GPU, i5-11300H, SK Hynix BC711 512GB HFM512GD3GX013N | |
|---|---|---|---|---|---|---|
| Noise | 12% | 16% | -4% | 15% | 7% | |
| av / miljö * (dB) | 27.9 | 24 14% | 24 14% | 24.5 12% | 23 18% | 25 10% |
| Idle Minimum * (dB) | 28.5 | 24 16% | 24 16% | 24.5 14% | 23 19% | 27 5% |
| Idle Average * (dB) | 29.8 | 24 19% | 24 19% | 24.5 18% | 23 23% | 28 6% |
| Idle Maximum * (dB) | 29.8 | 24 19% | 24 19% | 40 -34% | 23 23% | 30 -1% |
| Load Average * (dB) | 34.8 | 42.6 -22% | 32.49 7% | 48.3 -39% | 36.92 -6% | 39 -12% |
| Witcher 3 ultra * (dB) | 57.1 | 46.84 18% | 46.51 19% | 56 2% | 50 12% | 44 23% |
| Load Maximum * (dB) | 57.3 | 46.84 18% | 46.51 19% | 59.1 -3% | 50 13% | 46 20% |
* ... mindre är bättre
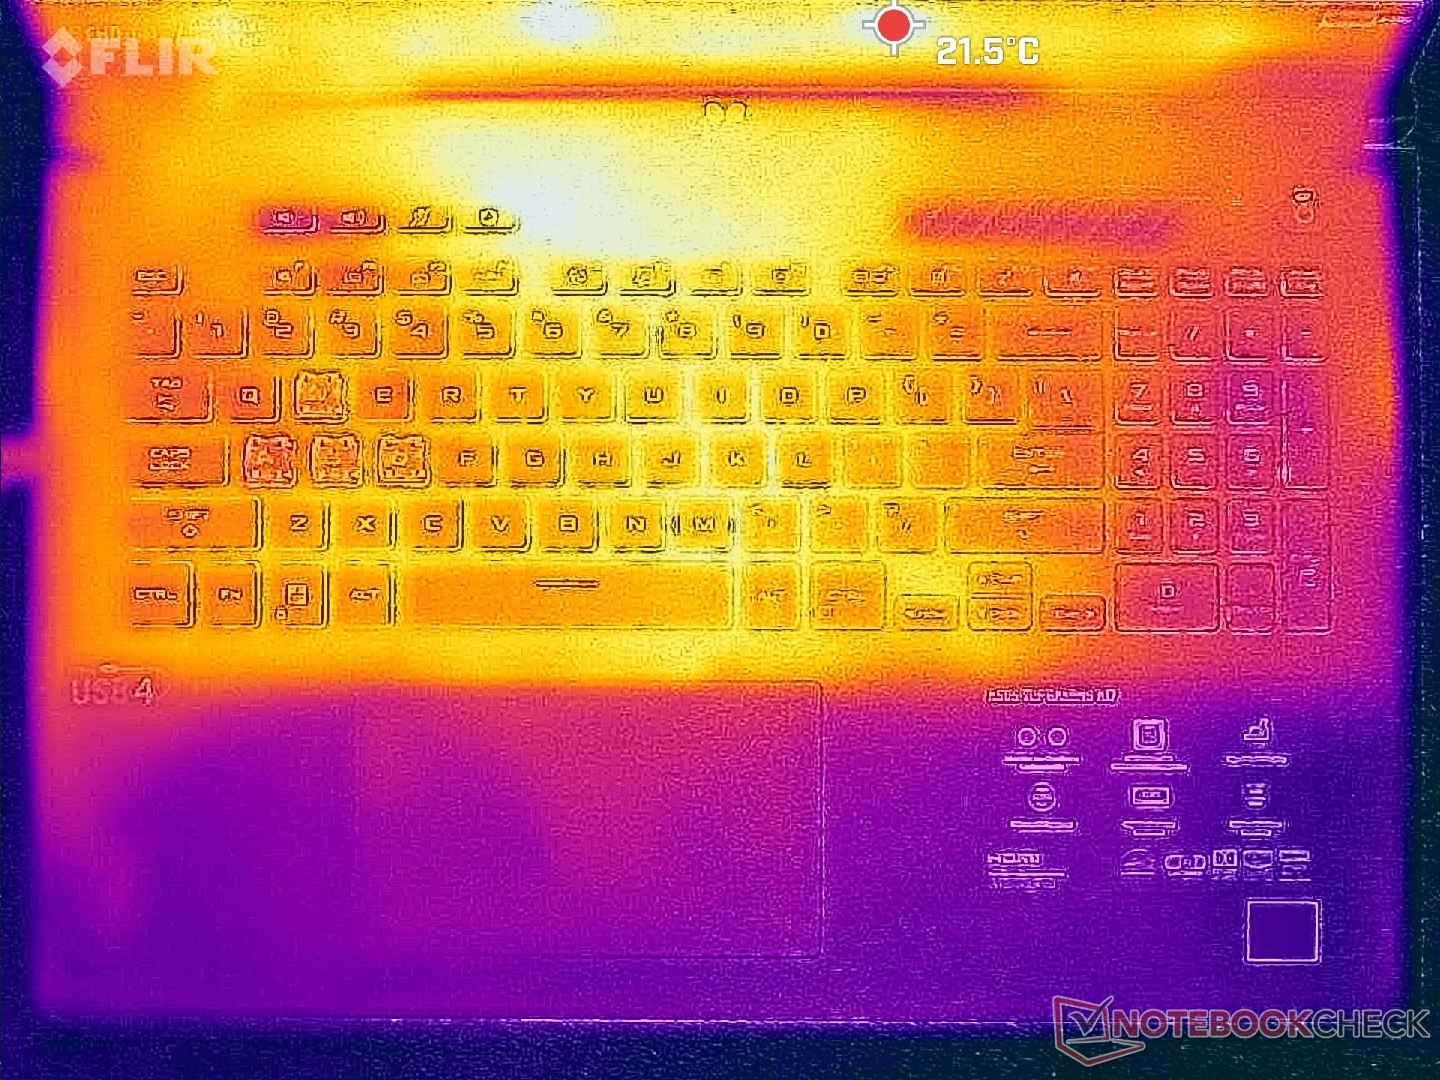
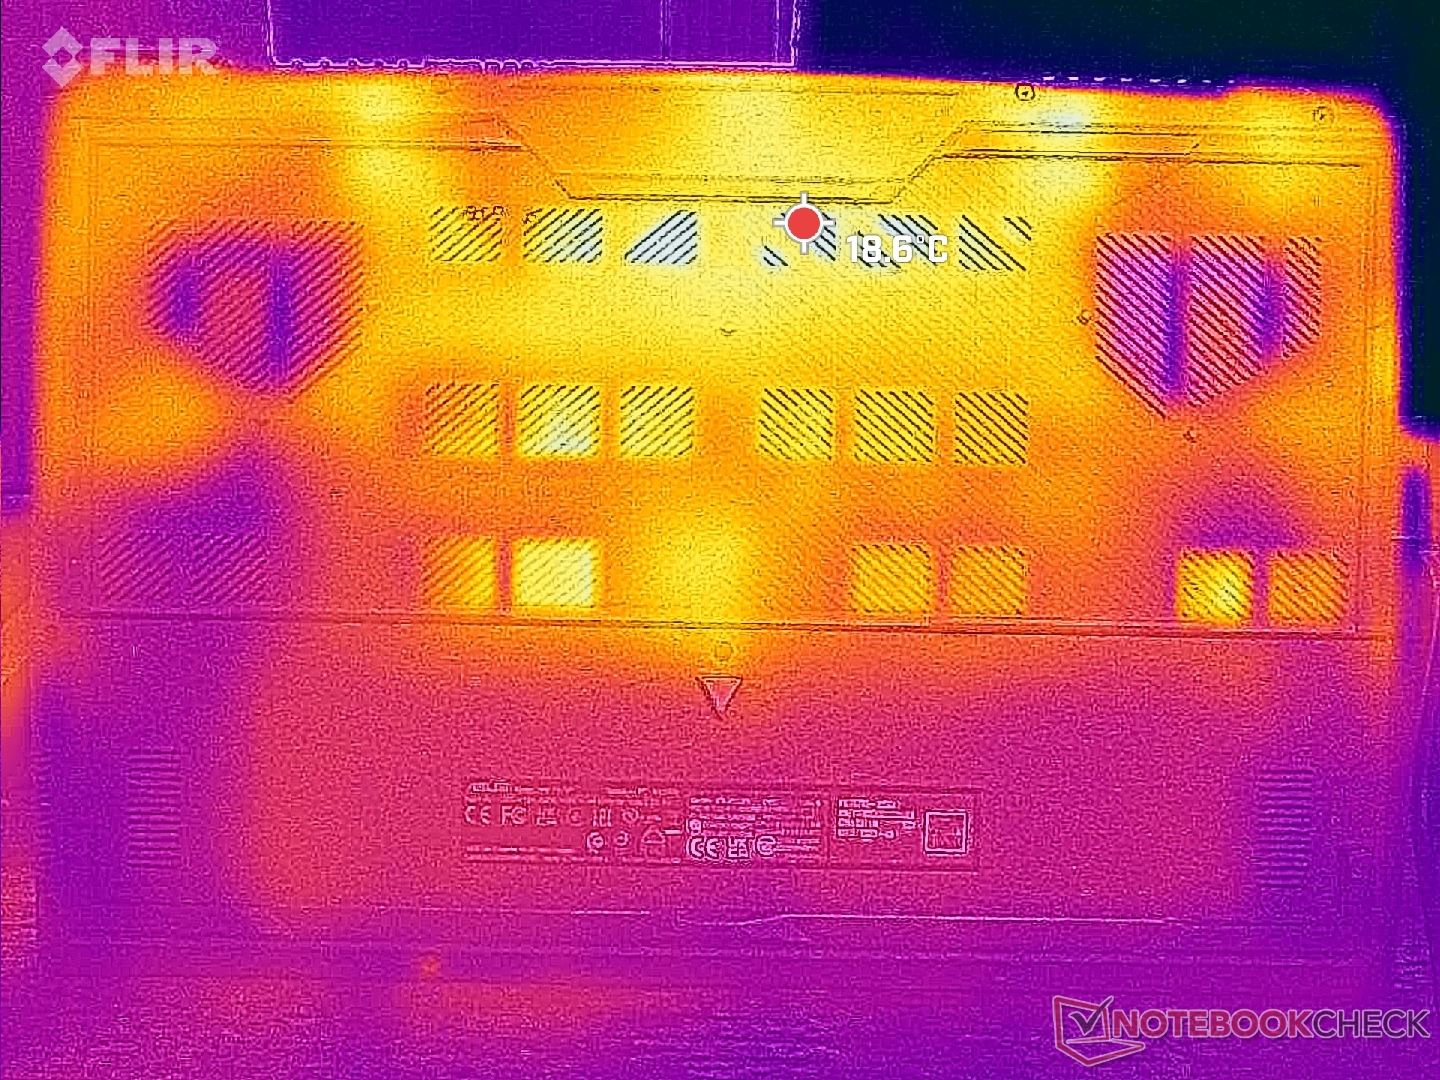
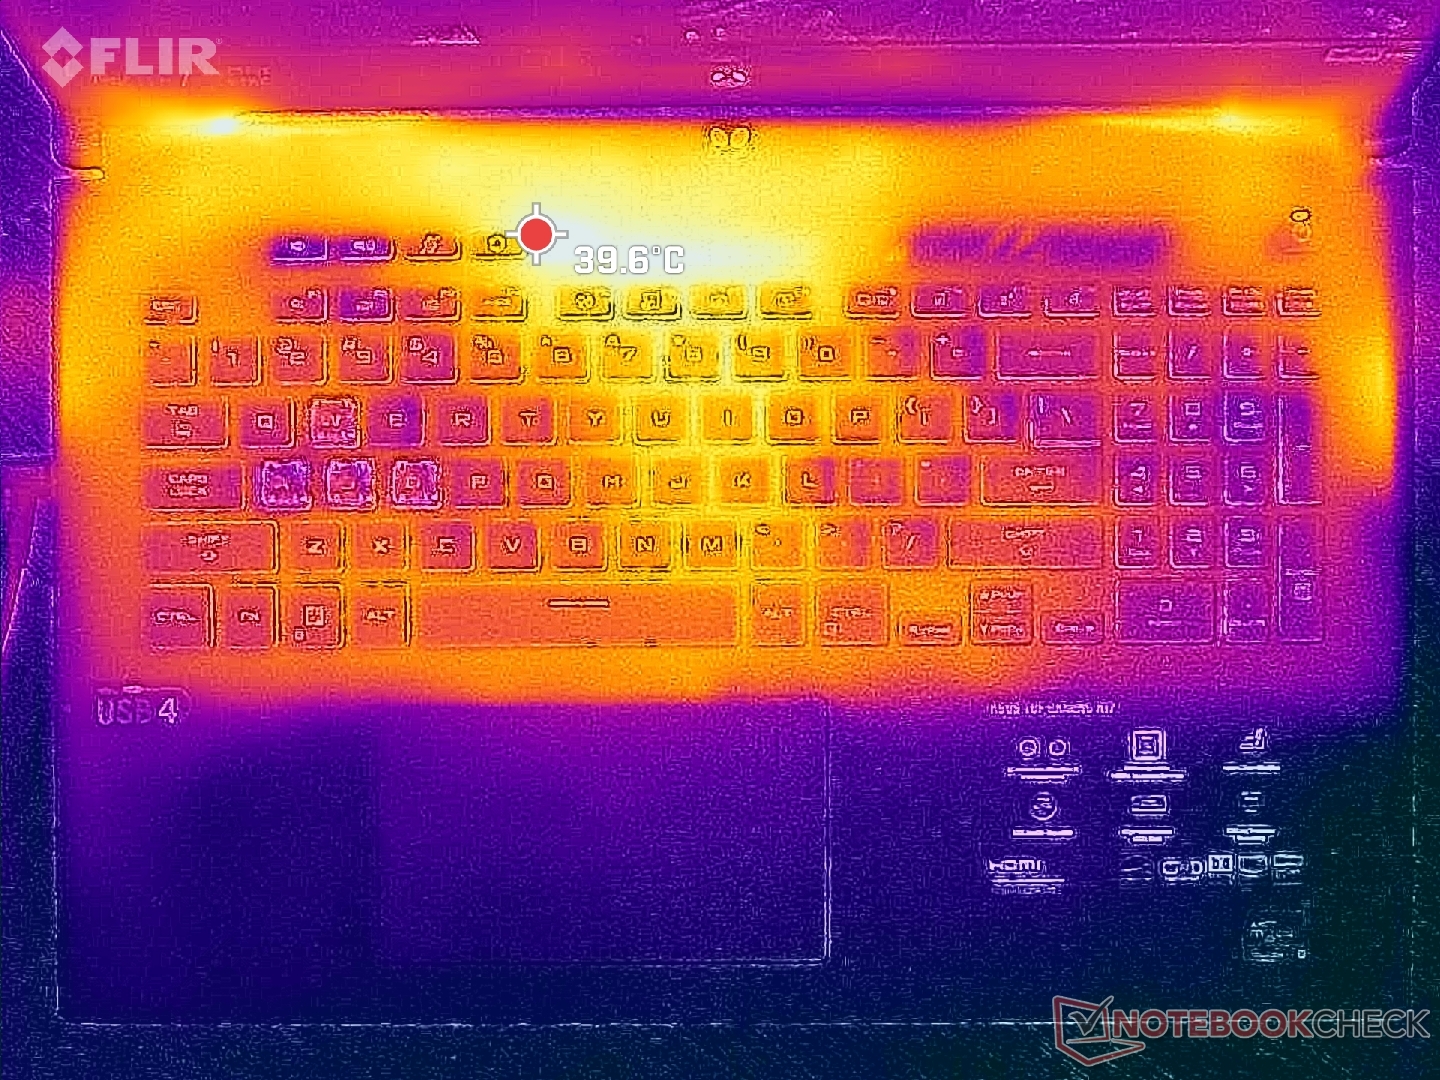
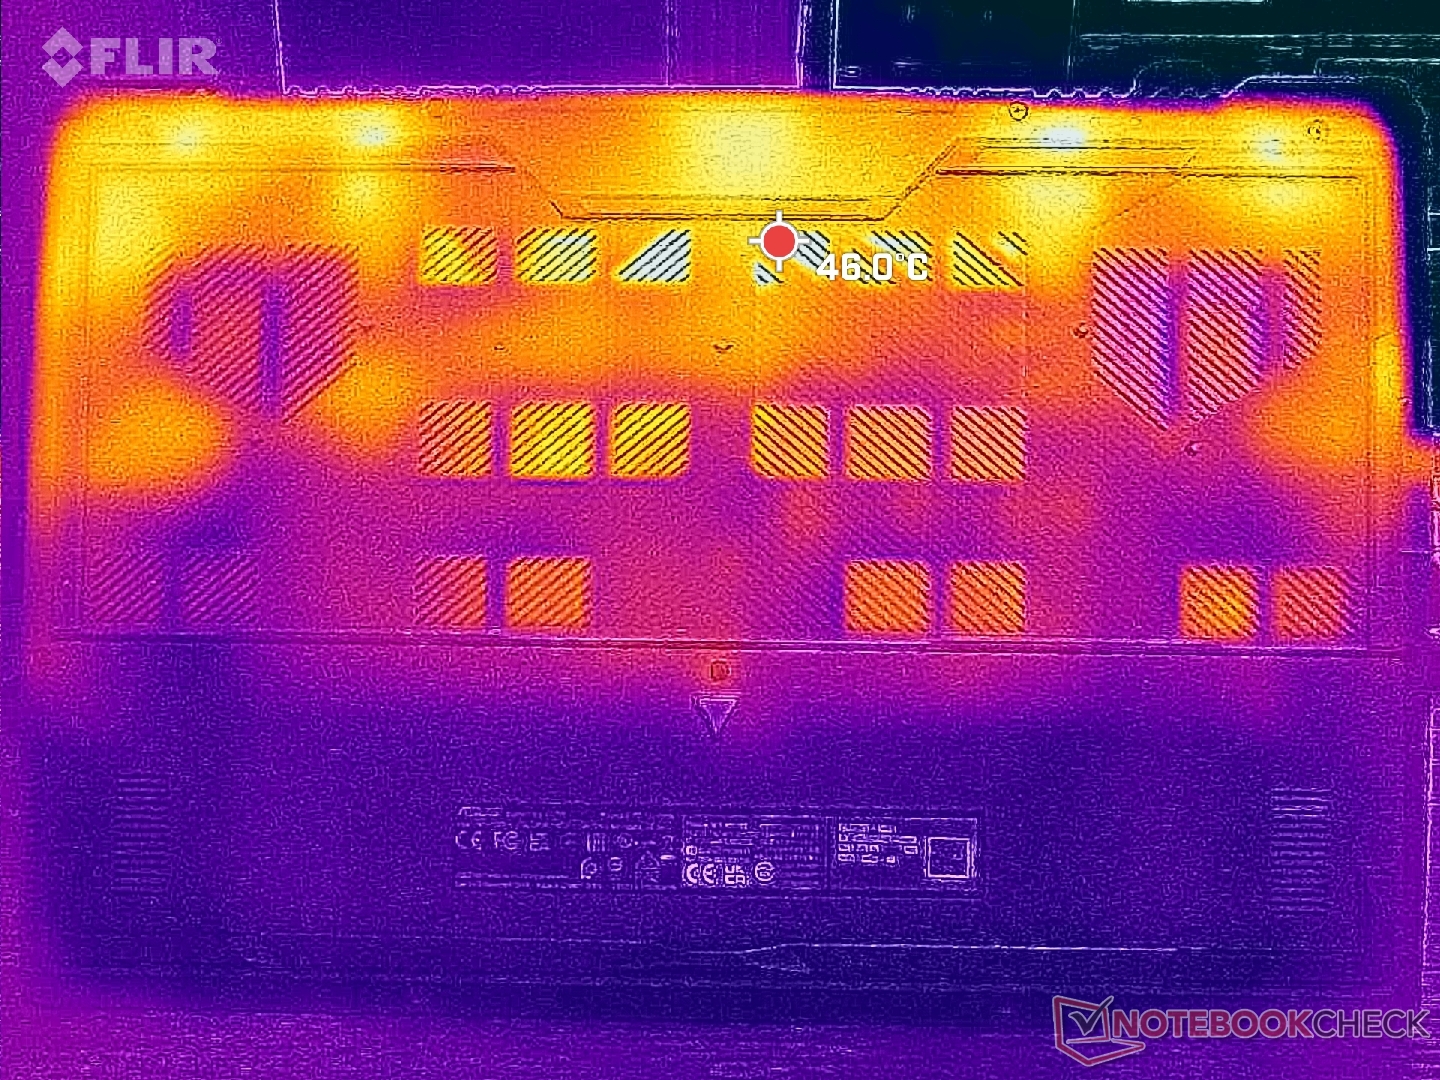
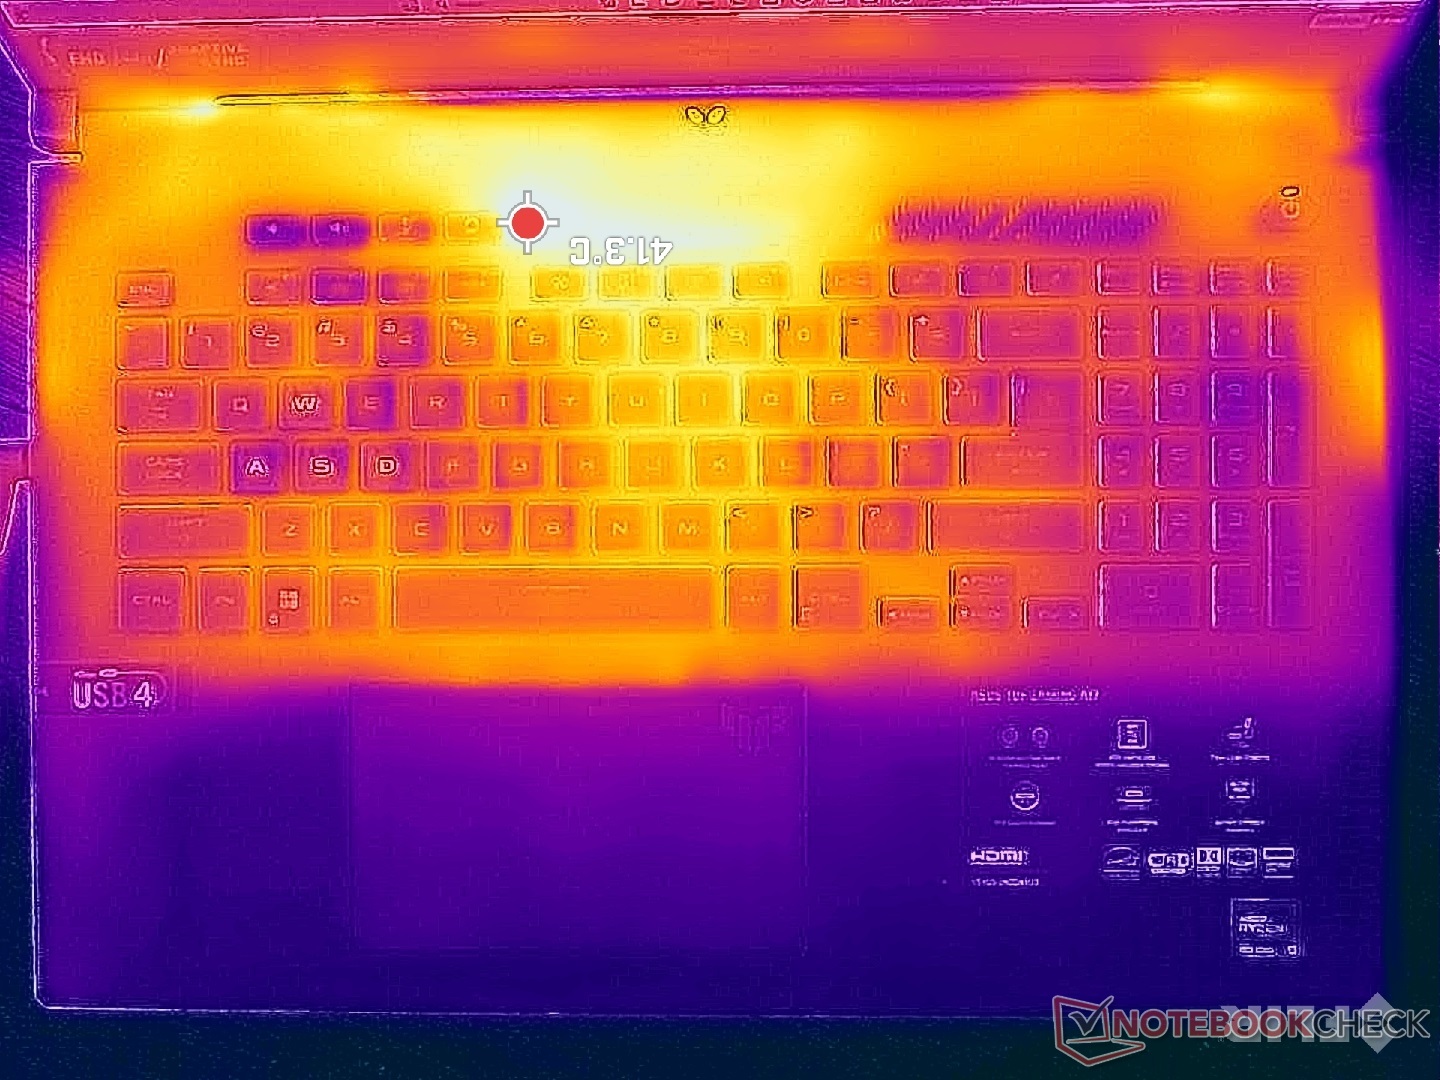
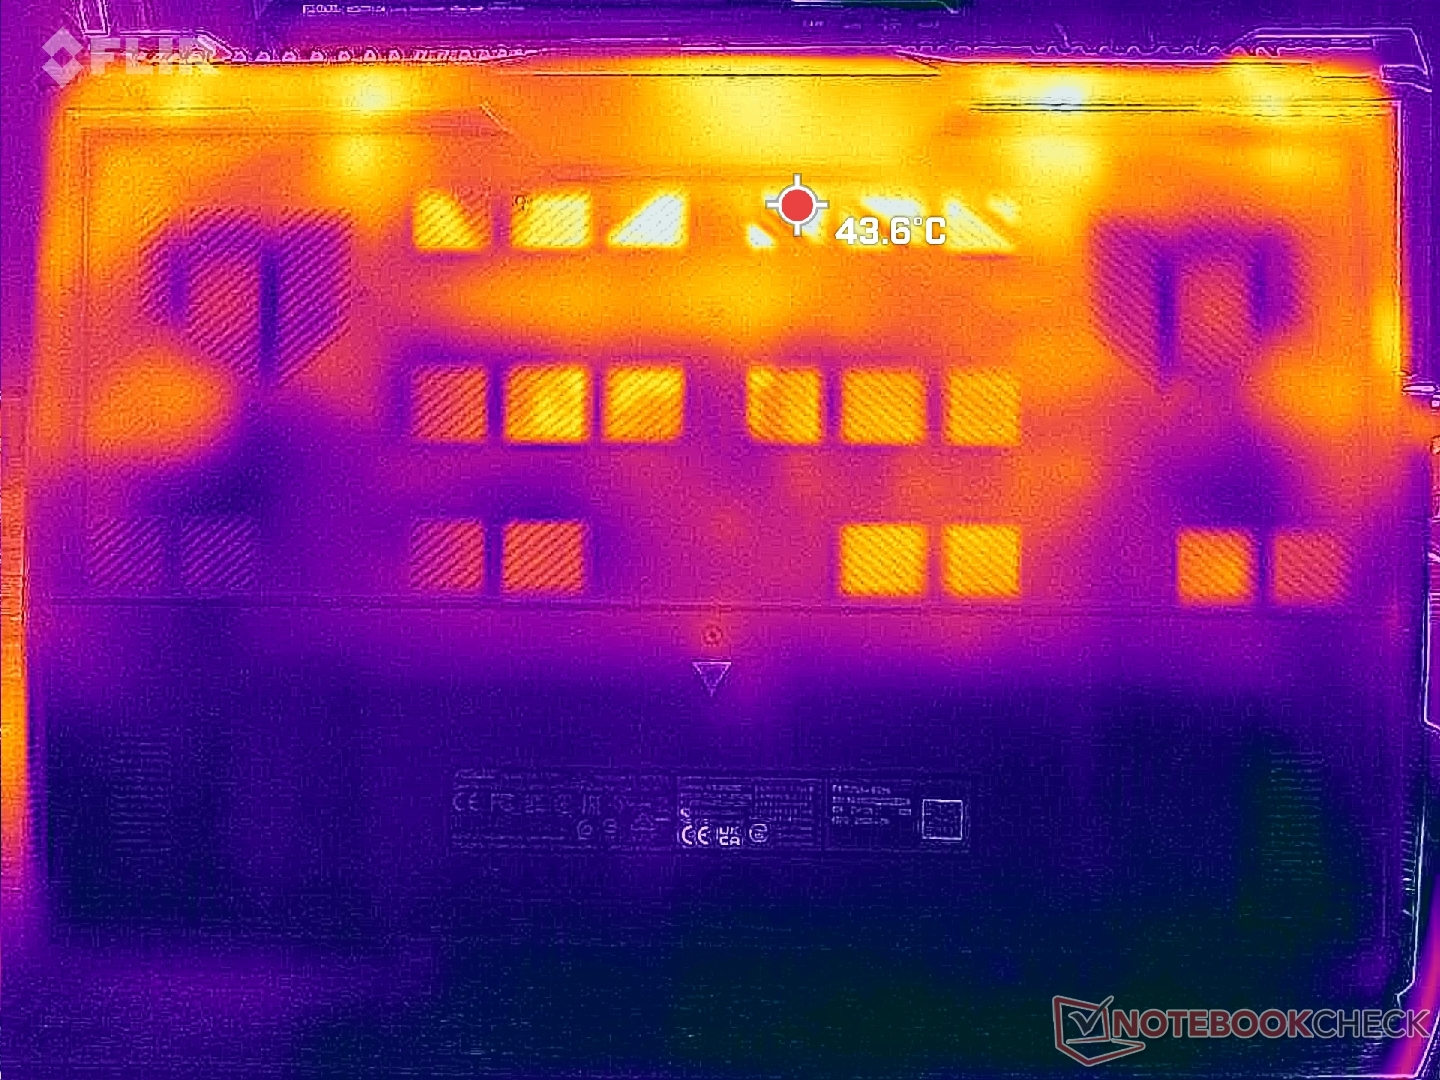
Temperatur
Yttemperaturerna är svalare än på de flesta andra bärbara speldatorer, mycket tack vare basens plastmaterial och de många ventilationsgallren. Till exempel skulle den genomsnittliga yttemperaturen på vår Asus när vi spelade bara nå 29 C jämfört med 39 C på Razer Blade 17 som är jämförelsevis tunnare, har färre ventilationsgaller och mestadels består av metallegering. De heta punkterna på vår Asus sitter också längre bak där det är mindre sannolikt att fingrarna rör vid dem.
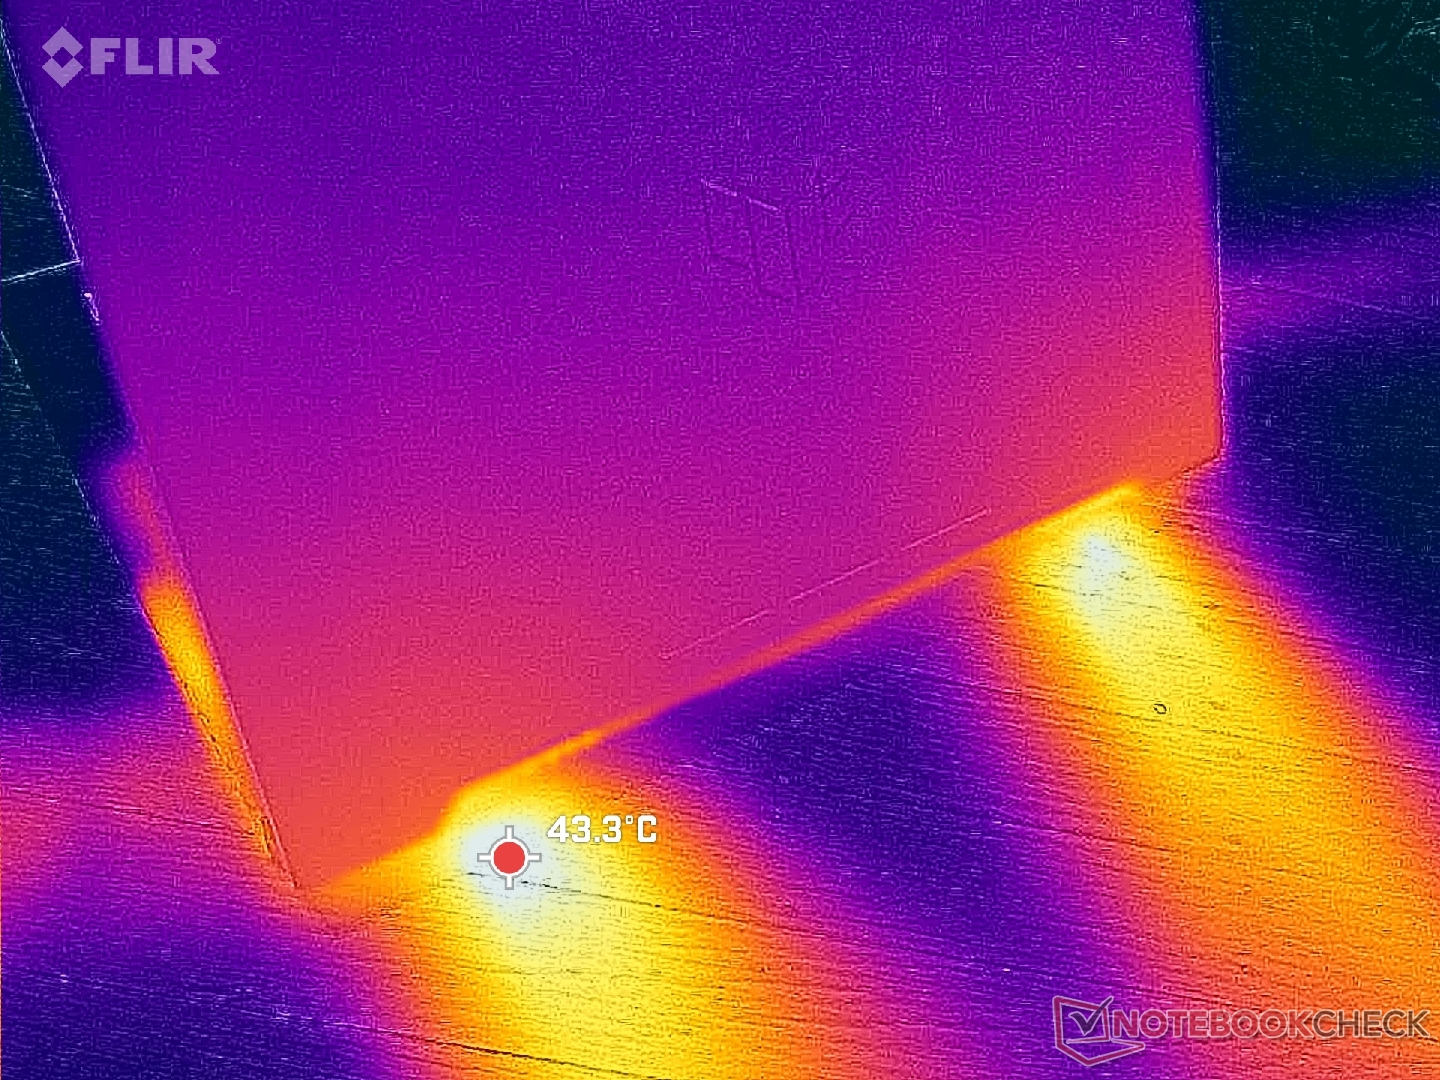
(±) Den maximala temperaturen på ovansidan är 40 °C / 104 F, jämfört med genomsnittet av 40.4 °C / 105 F , allt från 21.2 till 68.8 °C för klassen Gaming.
(+) Botten värms upp till maximalt 33.6 °C / 92 F, jämfört med genomsnittet av 43.2 °C / 110 F
(+) Vid tomgångsbruk är medeltemperaturen för ovansidan 23 °C / 73 F, jämfört med enhetsgenomsnittet på 33.9 °C / ### class_avg_f### F.
(+) När du spelar The Witcher 3 är medeltemperaturen för ovansidan 29.6 °C / 85 F, jämfört med enhetsgenomsnittet på 33.9 °C / ## #class_avg_f### F.
(+) Handledsstöden och pekplattan är kallare än hudtemperaturen med maximalt 22 °C / 71.6 F och är därför svala att ta på.
(+) Medeltemperaturen för handledsstödsområdet på liknande enheter var 28.8 °C / 83.8 F (+6.8 °C / 12.2 F).
| Asus TUF Gaming A17 FA707XI-NS94 AMD Ryzen 9 7940HS, NVIDIA GeForce RTX 4070 Laptop GPU | Asus TUF Gaming F17 FX707Z-HX011W Intel Core i7-12700H, NVIDIA GeForce RTX 3060 Laptop GPU | MSI Pulse 17 B13VGK Intel Core i7-13700H, NVIDIA GeForce RTX 4070 Laptop GPU | MSI Katana 17 B13VFK Intel Core i7-13620H, NVIDIA GeForce RTX 4060 Laptop GPU | Razer Blade 17 (i7-12800H, RTX 3070 Ti) Intel Core i7-12800H, NVIDIA GeForce RTX 3070 Ti Laptop GPU | HP Pavilion Gaming 17-cd2146ng Intel Core i5-11300H, NVIDIA GeForce RTX 3050 Ti Laptop GPU | |
|---|---|---|---|---|---|---|
| Heat | -29% | -29% | -25% | -25% | -17% | |
| Maximum Upper Side * (°C) | 40 | 52 -30% | 48 -20% | 41.6 -4% | 43 -8% | 44 -10% |
| Maximum Bottom * (°C) | 33.6 | 47 -40% | 50 -49% | 43.1 -28% | 44 -31% | 48 -43% |
| Idle Upper Side * (°C) | 26.6 | 31 -17% | 30 -13% | 32 -20% | 32 -20% | 27 -2% |
| Idle Bottom * (°C) | 24.4 | 31 -27% | 33 -35% | 35.8 -47% | 34 -39% | 27 -11% |
* ... mindre är bättre
Stresstest
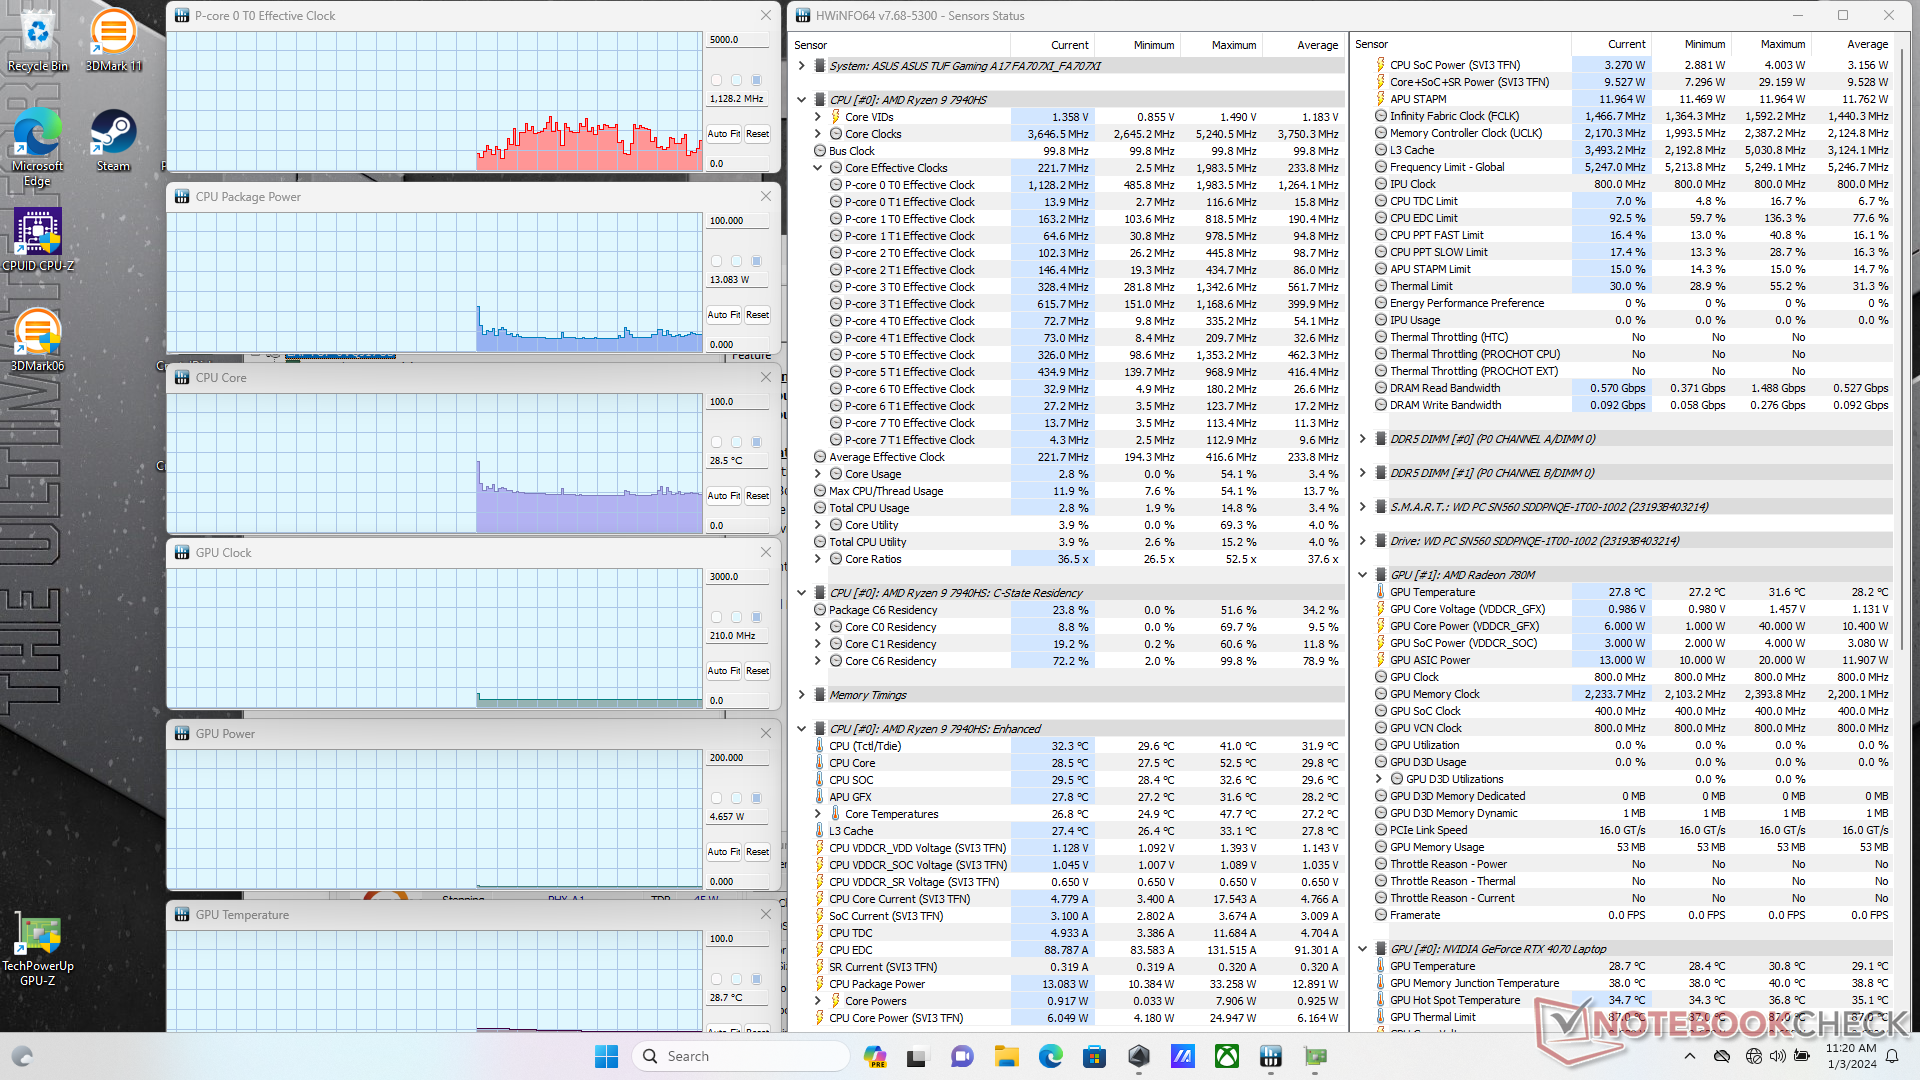
När processorn belastades med Prime95 ökade den till 4,8 GHz innan den sjönk något och stabiliserades på 4,5 GHz, 80 W och 82 C.
GPU:n stabiliseras vid 2505 MHz kärna, 2025 MHz RAM och 106 W när den körs Witcher 3 i Turbo-läget, medan körning i Performance-läget skulle sänka alla dessa värden till 2325 MHz, 2000 MHz respektive 95 W. Performance-läget innebär en liten försämring av grafiken, vilket nämns i avsnittet om GPU-prestanda ovan. Notera att både GPU och CPU blir märkbart varmare i Turbo-läget trots att fläkttaket är högre i Turbo-läget.
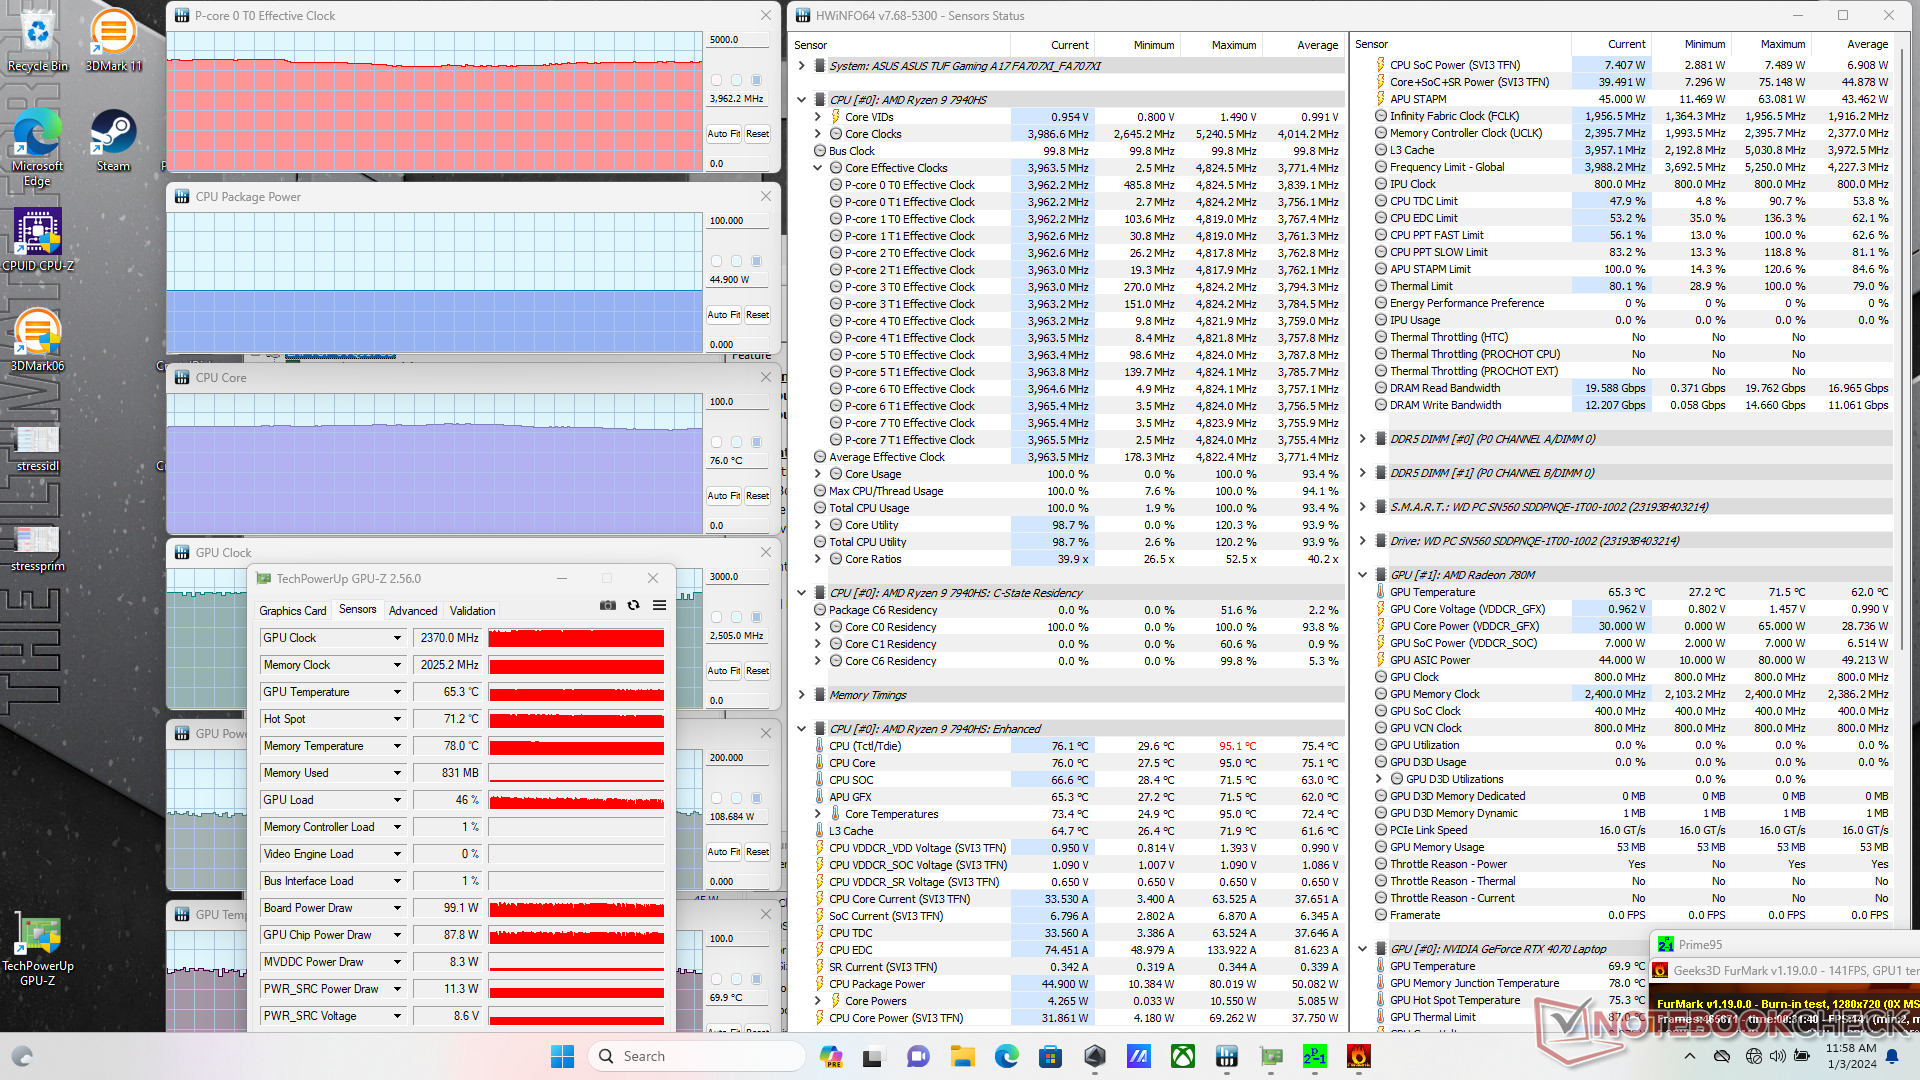
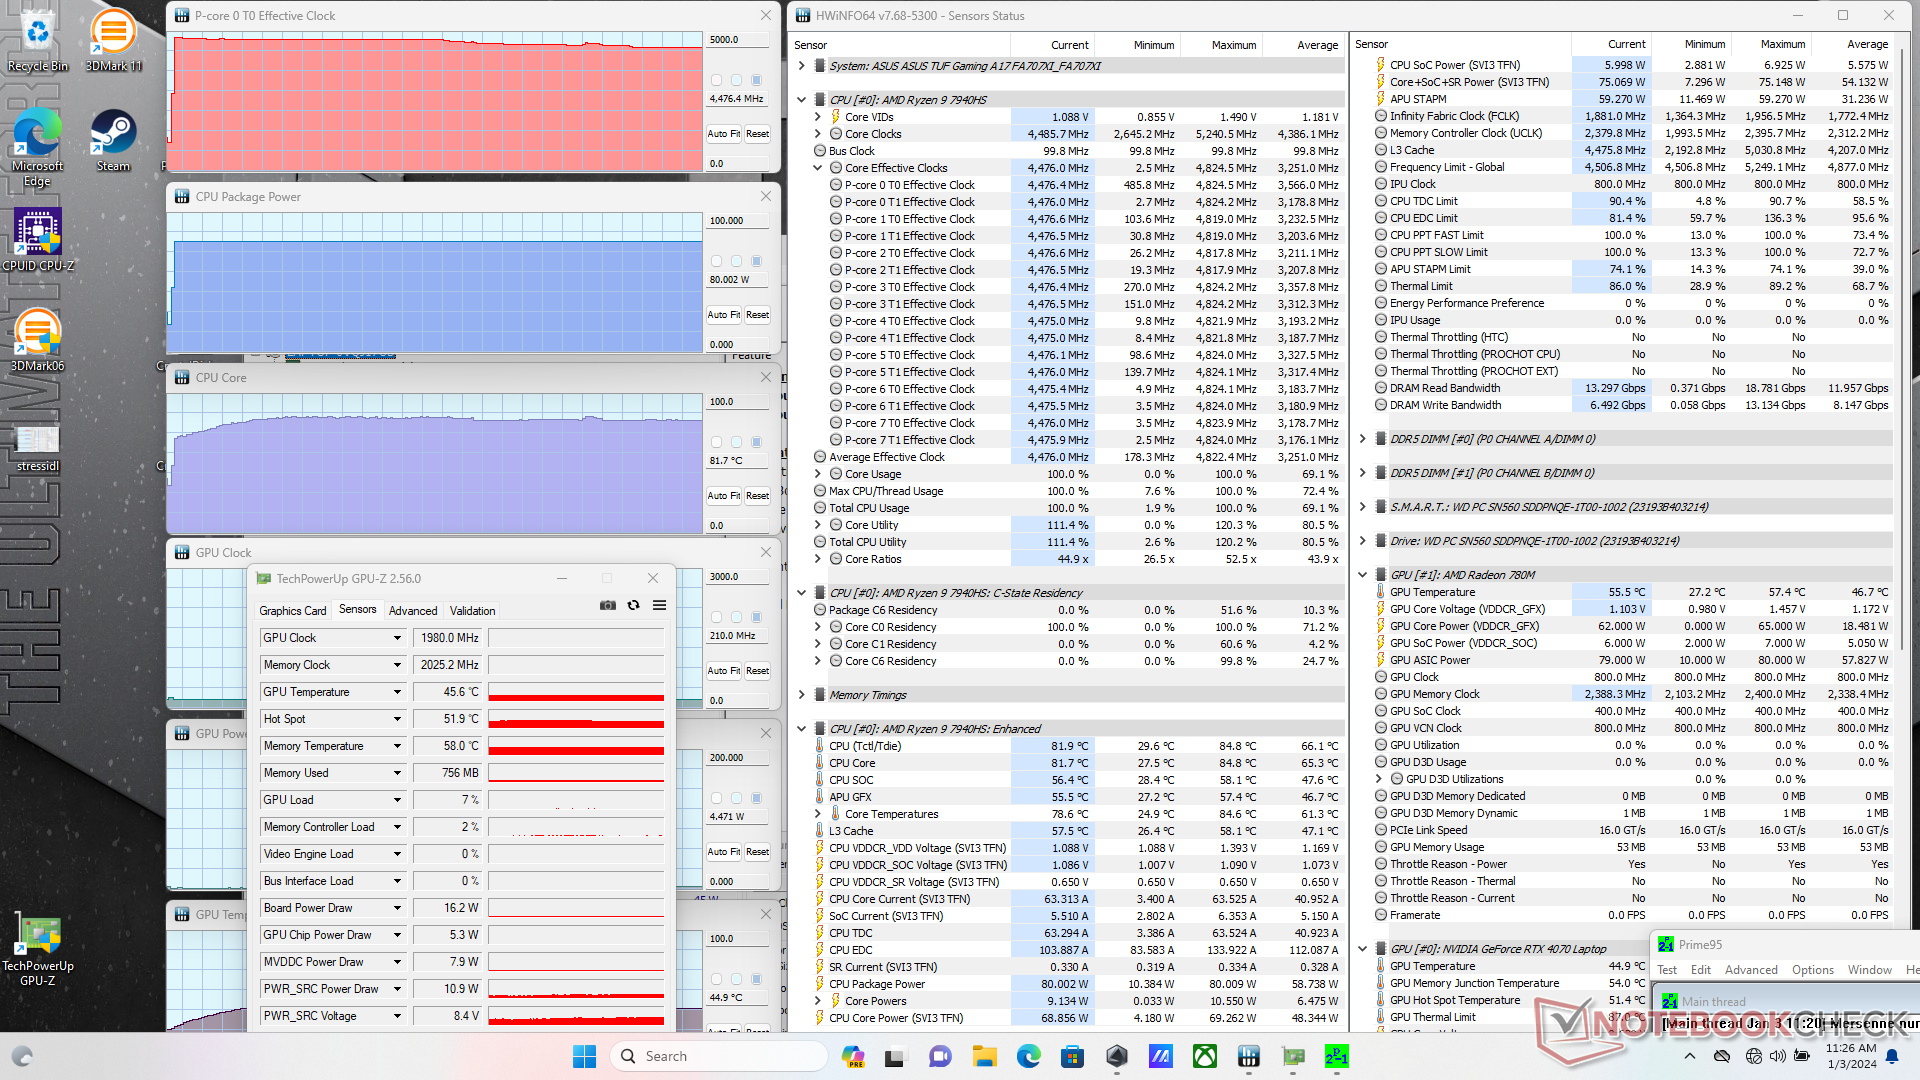
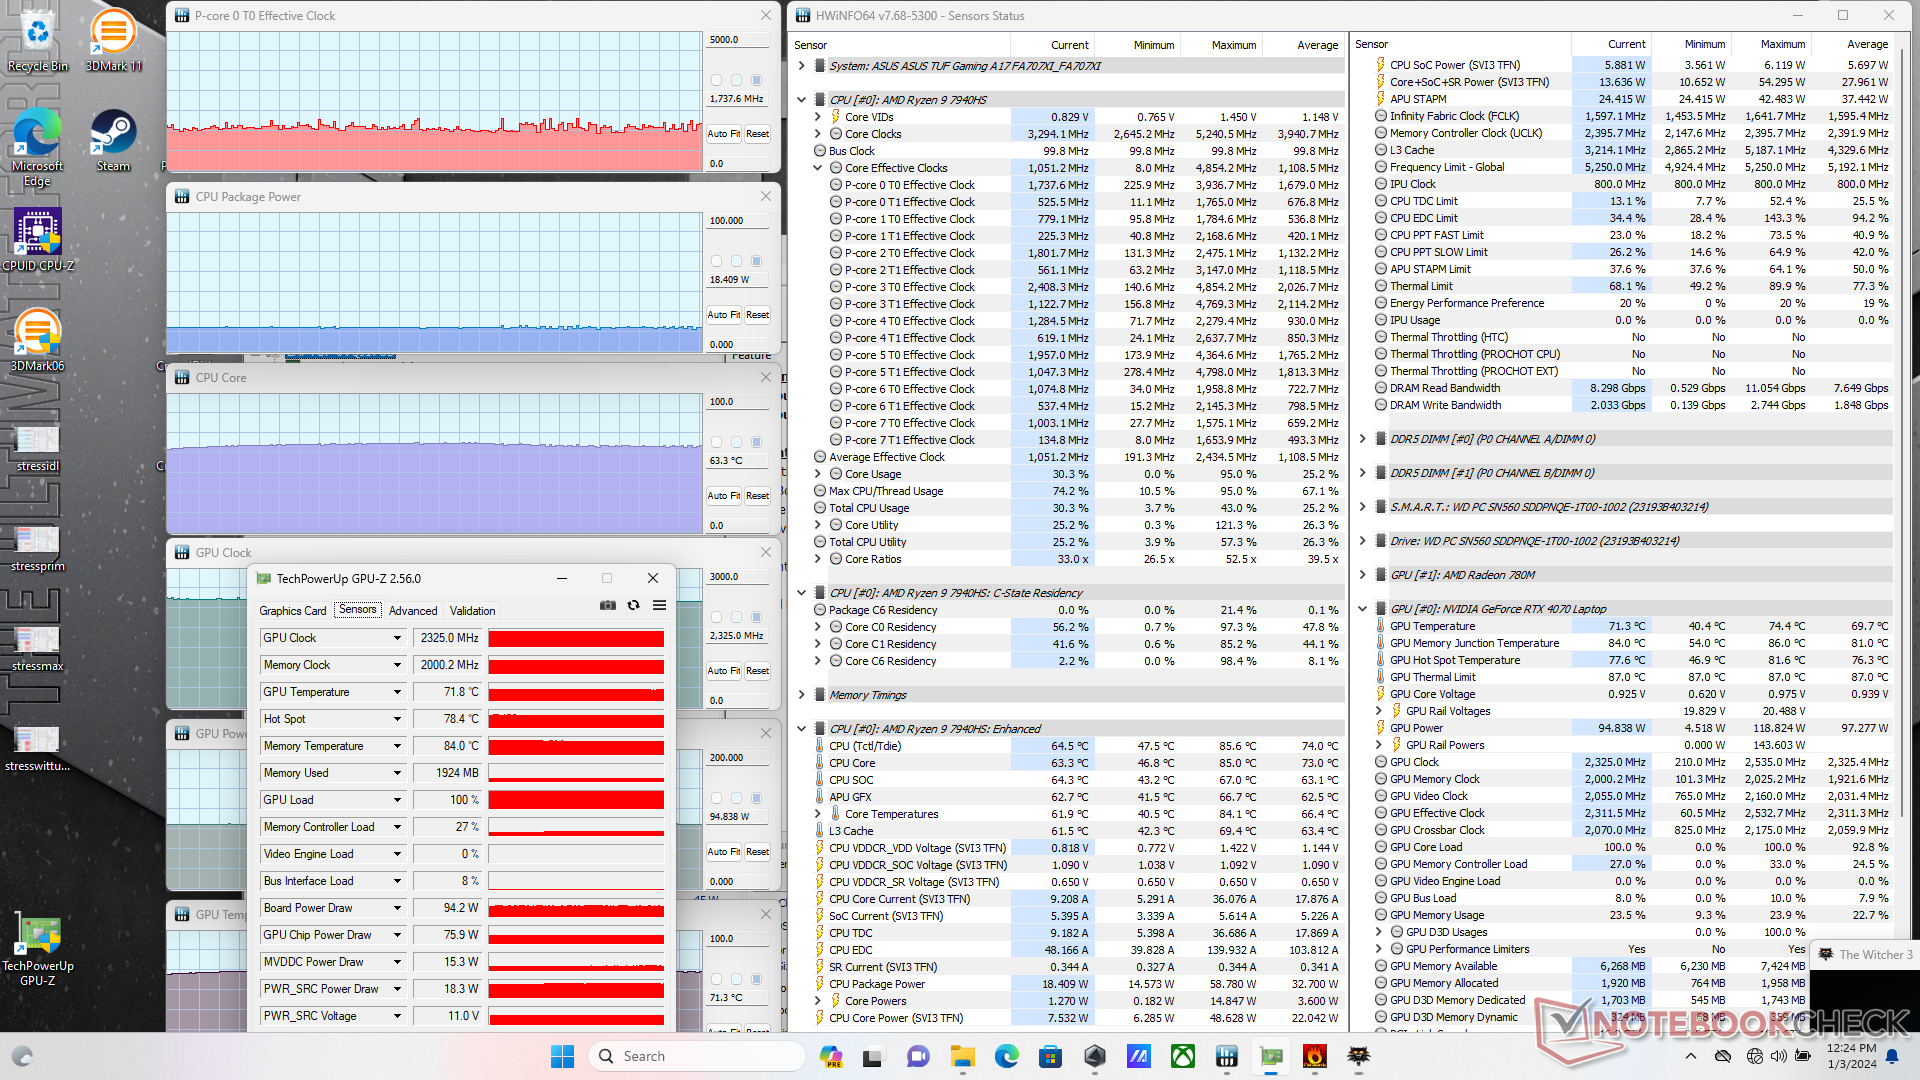
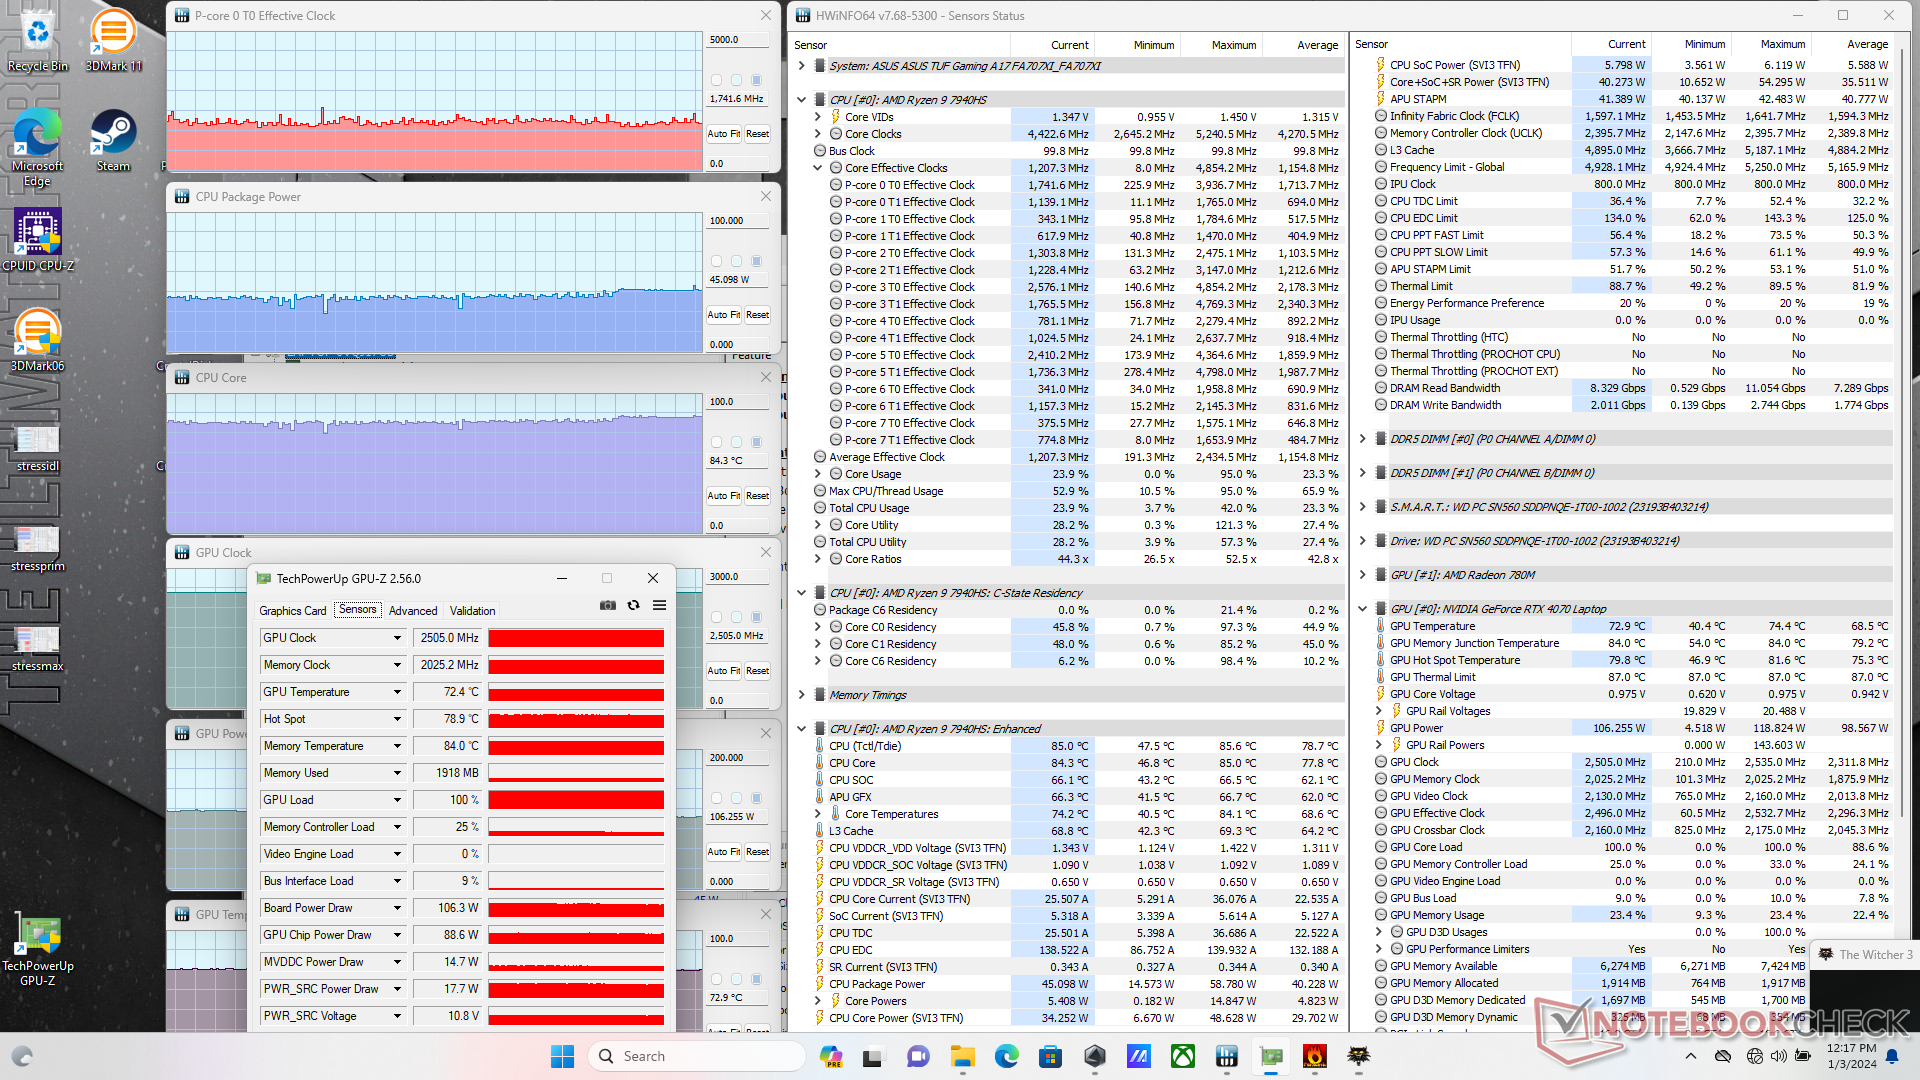
| CPU-klocka (GHz) | GPU-klocka (MHz) | Genomsnittlig CPU-temperatur (°C) | Genomsnittlig GPU-temperatur (°C) | |
| System i viloläge | -- | -- | 29 | 29 |
| Prime95 Stress | 4.5 | -- | 82 | 45 |
| Prime95 + FurMark Stress | 4.0 | 2370 | 76 | 70 |
| Witcher 3 Stress (Performance mode) | ~1.7 | 2325 | 63 | 71 |
| Witcher 3 Stress (Turbo mode) | ~1.7 | 2505 | 84 | 73 |
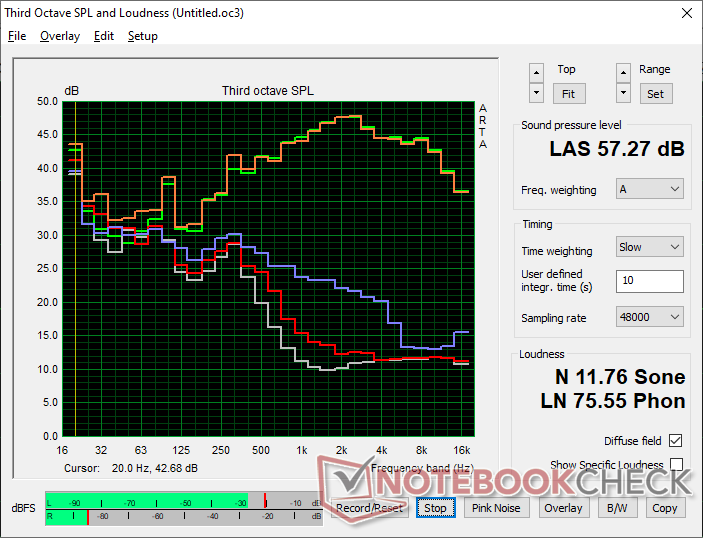
Högtalare
Asus TUF Gaming A17 FA707XI-NS94 ljudanalys
(±) | högtalarljudstyrkan är genomsnittlig men bra (80.7 dB)
Bas 100 - 315 Hz
(-) | nästan ingen bas - i genomsnitt 17.7% lägre än medianen
(±) | linjäriteten för basen är genomsnittlig (8.4% delta till föregående frekvens)
Mellan 400 - 2000 Hz
(+) | balanserad mellan - endast 3.7% från medianen
(+) | mids är linjära (5.1% delta till föregående frekvens)
Högsta 2 - 16 kHz
(+) | balanserade toppar - endast 4.4% från medianen
(+) | toppar är linjära (6.2% delta till föregående frekvens)
Totalt 100 - 16 000 Hz
(±) | linjäriteten för det totala ljudet är genomsnittlig (17.3% skillnad mot median)
Jämfört med samma klass
» 47% av alla testade enheter i den här klassen var bättre, 12% liknande, 41% sämre
» Den bästa hade ett delta på 6%, genomsnittet var 18%, sämst var 132%
Jämfört med alla testade enheter
» 32% av alla testade enheter var bättre, 8% liknande, 59% sämre
» Den bästa hade ett delta på 4%, genomsnittet var 23%, sämst var 134%
Apple MacBook Pro 16 2021 M1 Pro ljudanalys
(+) | högtalare kan spela relativt högt (84.7 dB)
Bas 100 - 315 Hz
(+) | bra bas - bara 3.8% från medianen
(+) | basen är linjär (5.2% delta till föregående frekvens)
Mellan 400 - 2000 Hz
(+) | balanserad mellan - endast 1.3% från medianen
(+) | mids är linjära (2.1% delta till föregående frekvens)
Högsta 2 - 16 kHz
(+) | balanserade toppar - endast 1.9% från medianen
(+) | toppar är linjära (2.7% delta till föregående frekvens)
Totalt 100 - 16 000 Hz
(+) | det totala ljudet är linjärt (4.6% skillnad mot median)
Jämfört med samma klass
» 0% av alla testade enheter i den här klassen var bättre, 0% liknande, 100% sämre
» Den bästa hade ett delta på 5%, genomsnittet var 17%, sämst var 45%
Jämfört med alla testade enheter
» 0% av alla testade enheter var bättre, 0% liknande, 100% sämre
» Den bästa hade ett delta på 4%, genomsnittet var 23%, sämst var 134%
Energiförvaltning
Strömförbrukning
Strömförbrukningen kan vara så låg som 6 W när den körs i energisparläge med dGPU inaktiverad. Vid maximal ljusstyrka och med dGPU:n aktiverad kan förbrukningen vara så hög som 22 W, vilket är två gånger mer krävande än TUF Gaming F17 eller Pulse 17 under liknande förhållanden. Det är därför viktigt att ställa in systemet på iGPU-läge om batteritiden är av yttersta vikt.
Att köra Witcher 3 i turboläge skulle förbruka så mycket som 190 W eller nästan 60 W mer än MSI Pulse 17 med samma GeForce RTX 4070 GPU. Förbrukningen skulle sjunka till 150 W om man istället körde i Performance-läget. Även om den generellt sett är mer krävande än bärbara speldatorer med den äldre RTX 3060, kompenserar prestandavinsterna mer än väl för det.
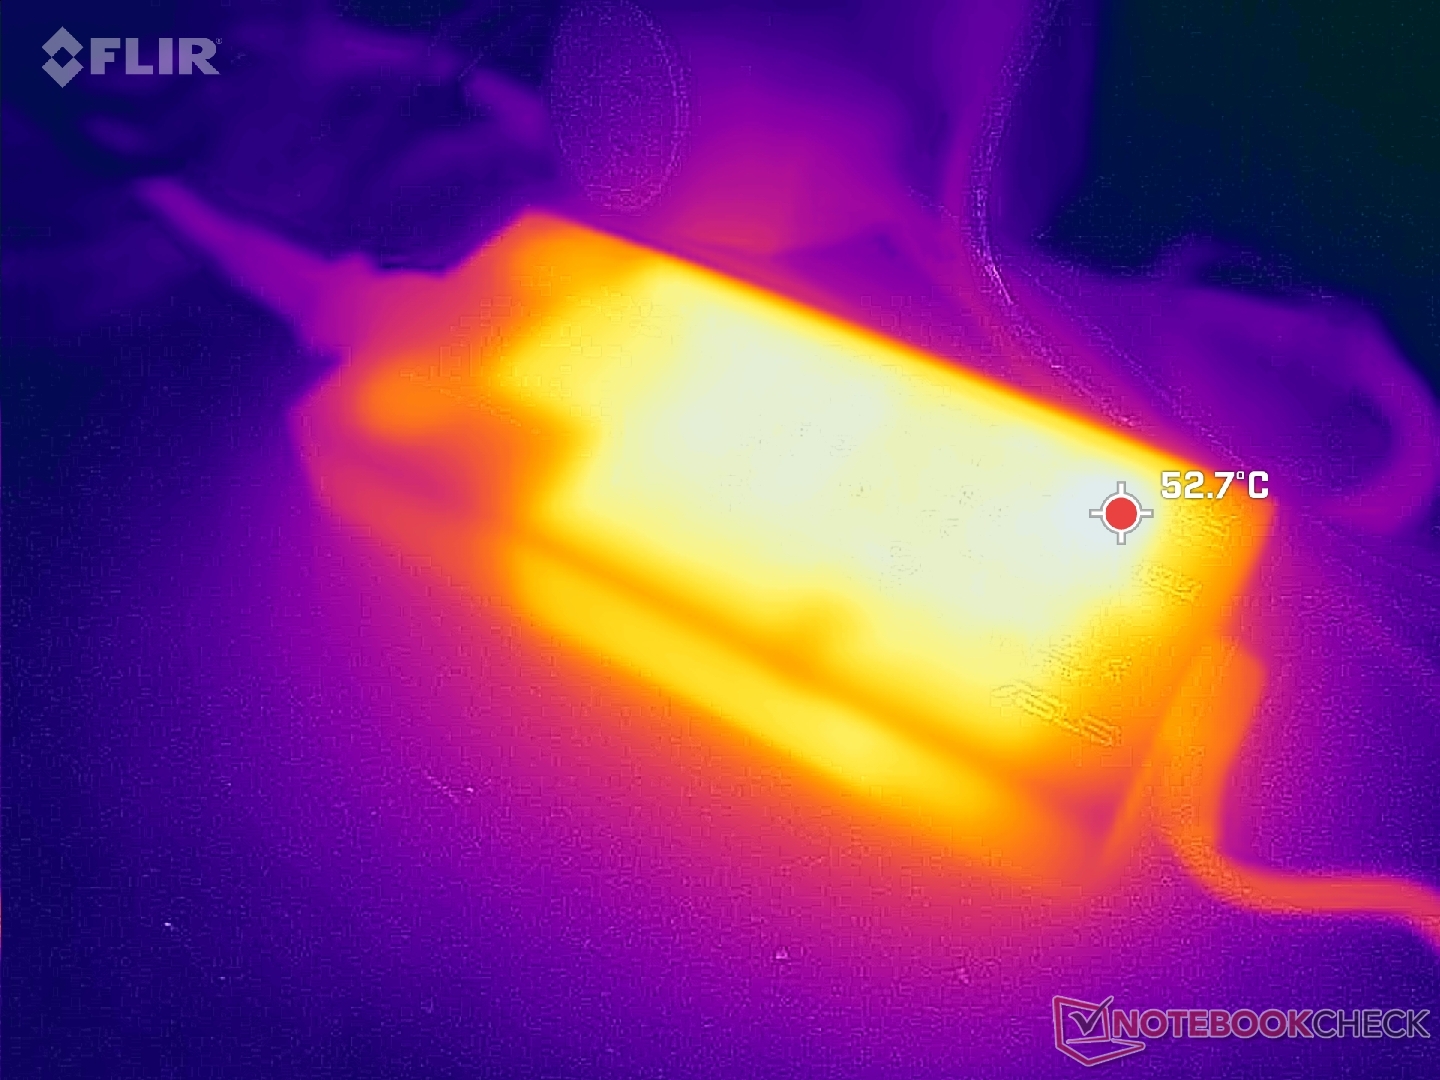
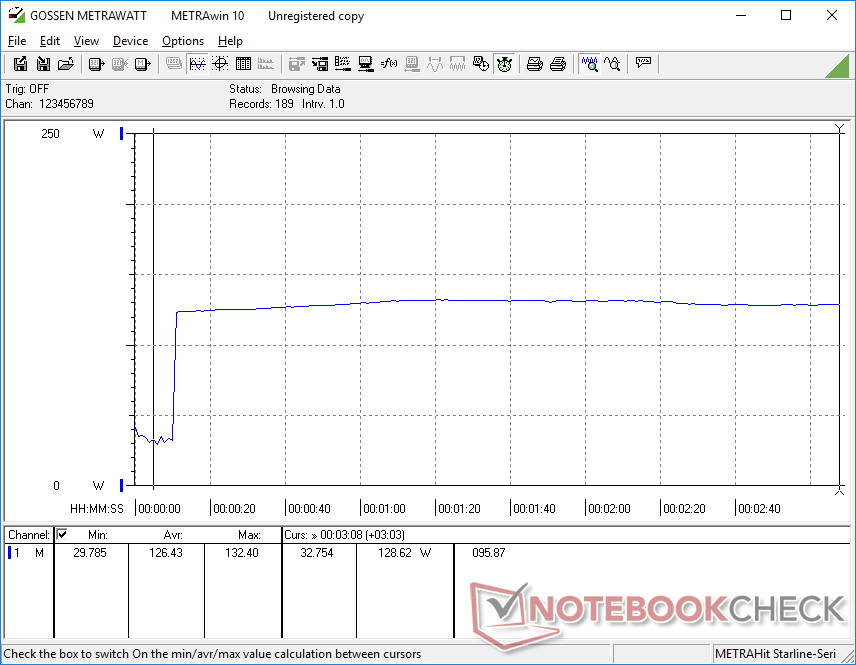
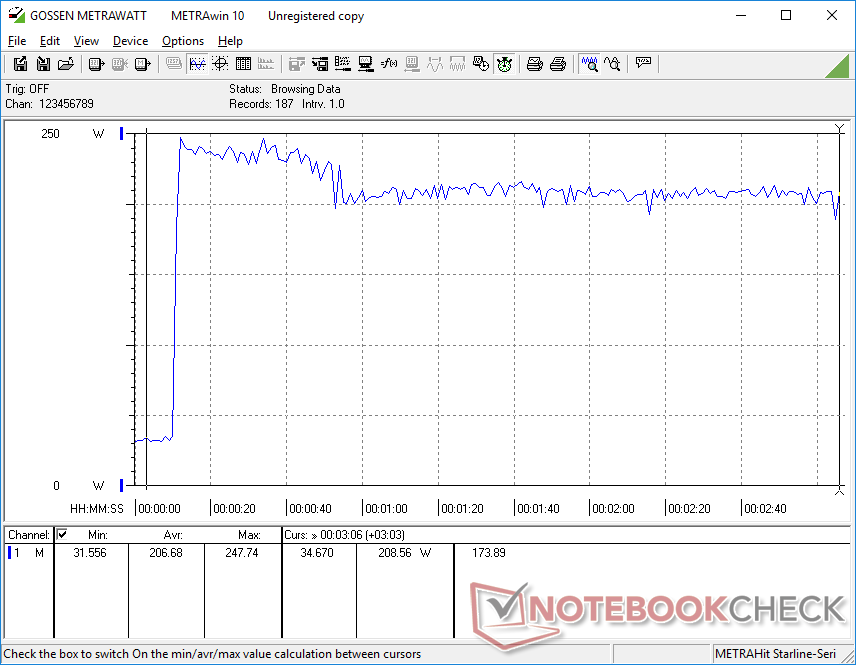
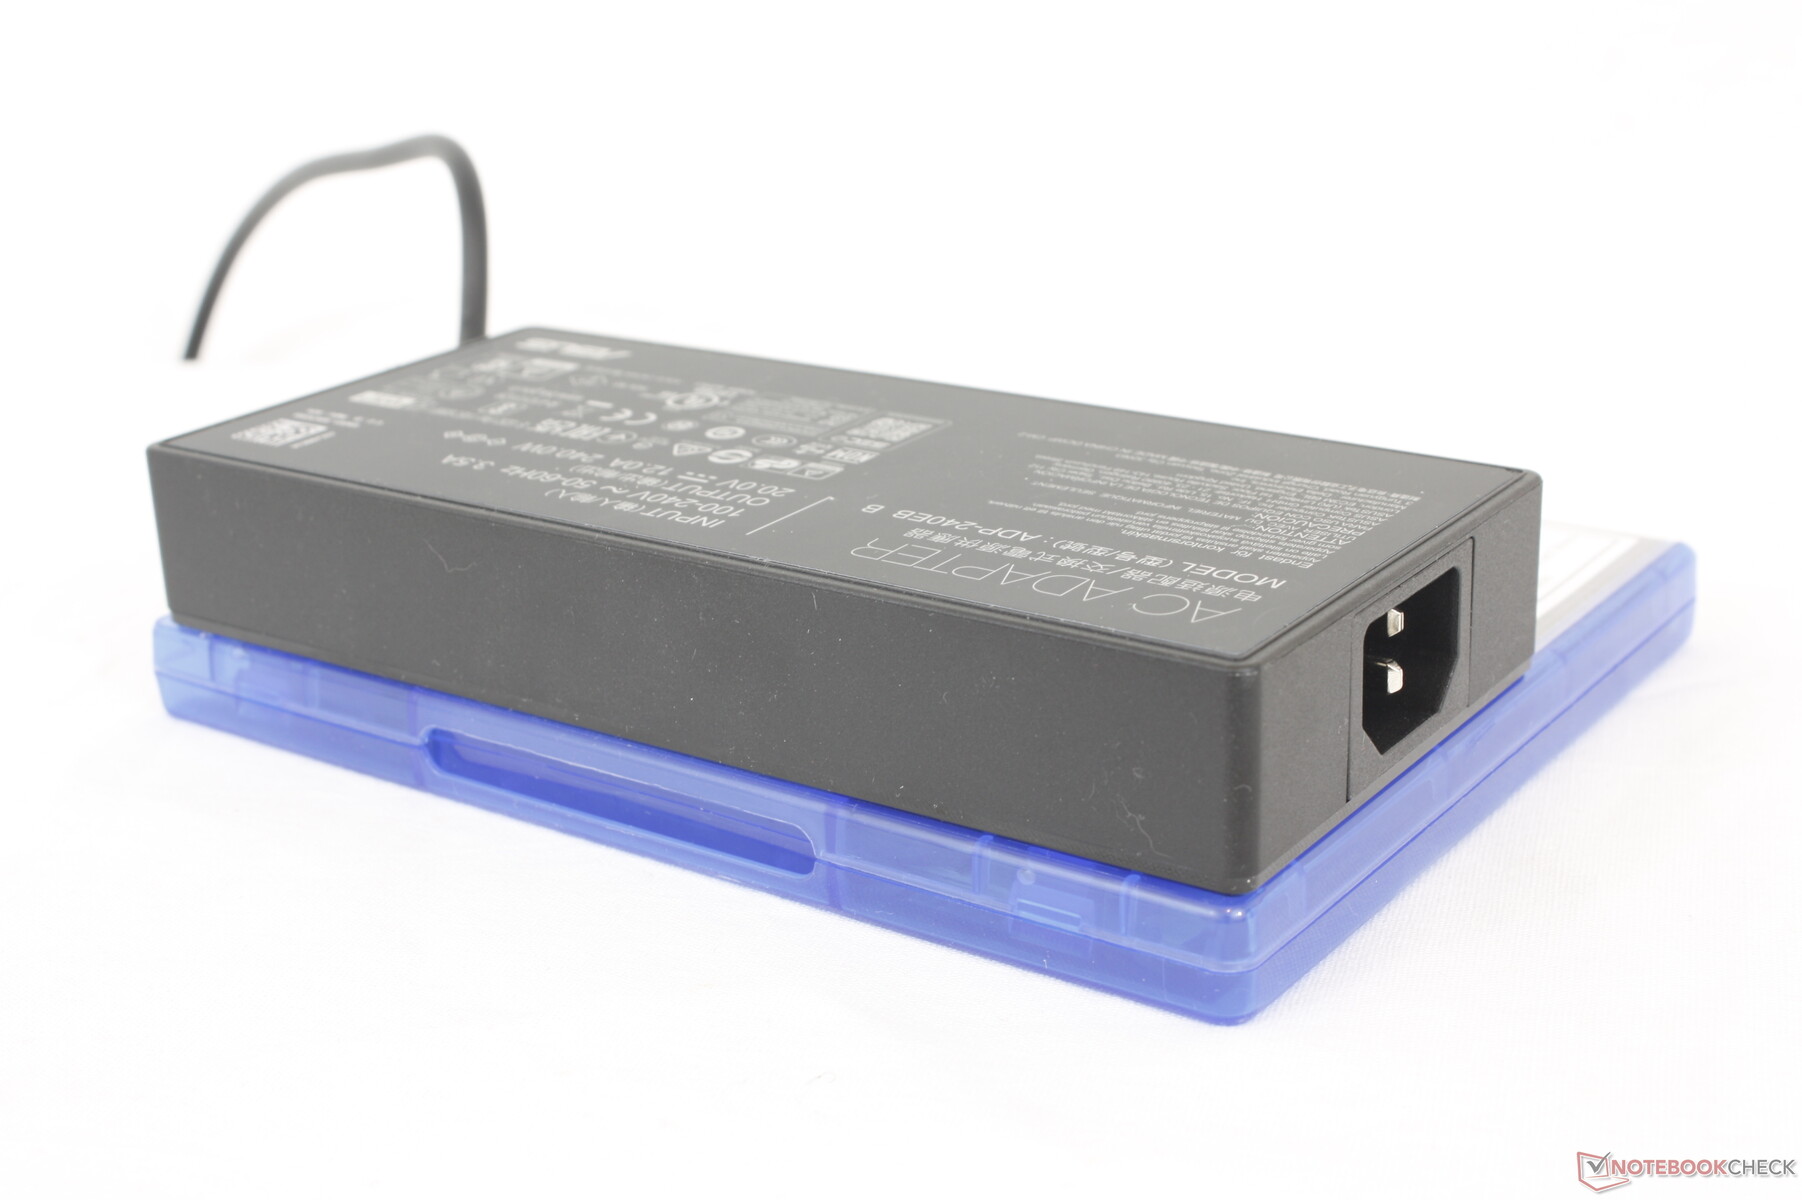
Vi kan mäta en maximal förbrukning på 248 W från den medelstora (~16,5 x 7,6 x 2,5 cm) 240 W AC-adaptern när CPU och GPU vardera utnyttjas till 100 procent. Denna hastighet varar bara i cirka 30 sekunder, vilket visas i skärmdumpen nedan, på grund av termiska begränsningar.
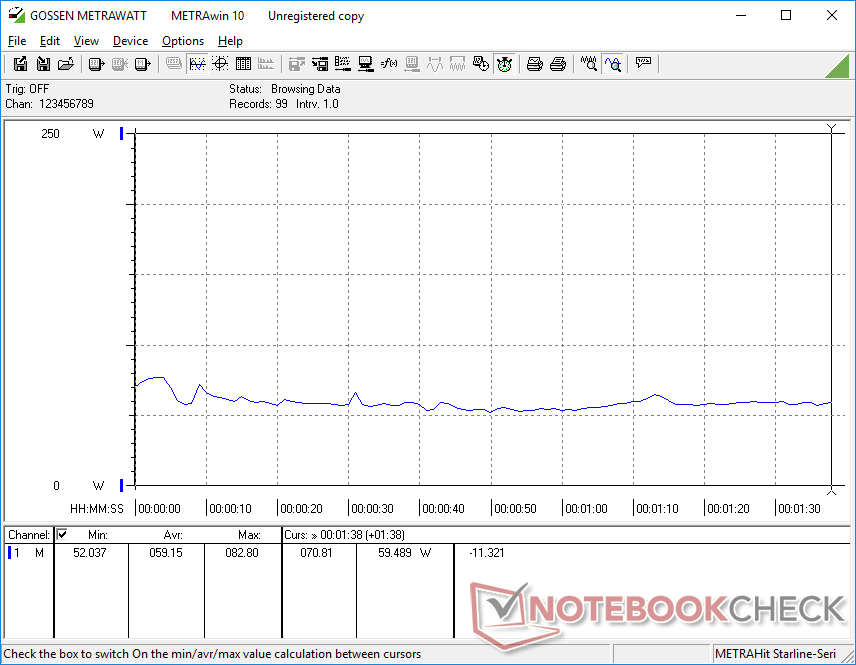
| Av/Standby | |
| Låg belastning | |
| Hög belastning |
|
Förklaring:
min: | |
| Asus TUF Gaming A17 FA707XI-NS94 R9 7940HS, GeForce RTX 4070 Laptop GPU, WD PC SN560 SDDPNQE-1T00, IPS, 1920x1080, 17.3" | Asus TUF Gaming F17 FX707Z-HX011W i7-12700H, GeForce RTX 3060 Laptop GPU, SK Hynix HFM001TD3JX013N, IPS, 1920x1080, 17.3" | MSI Pulse 17 B13VGK i7-13700H, GeForce RTX 4070 Laptop GPU, Micron 2400 MTFDKBA1T0QFM, IPS, 1920x1080, 17.3" | MSI Katana 17 B13VFK i7-13620H, GeForce RTX 4060 Laptop GPU, Micron 2400 MTFDKBA1T0QFM, IPS LED, 1920x1080, 17.3" | Razer Blade 17 (i7-12800H, RTX 3070 Ti) i7-12800H, GeForce RTX 3070 Ti Laptop GPU, Samsung PM9A1 MZVL21T0HCLR, IPS, 2560x1440, 17.3" | HP Pavilion Gaming 17-cd2146ng i5-11300H, GeForce RTX 3050 Ti Laptop GPU, SK Hynix BC711 512GB HFM512GD3GX013N, IPS, 1920x1080, 17.3" | |
|---|---|---|---|---|---|---|
| Power Consumption | 4% | 13% | -8% | -40% | 21% | |
| Idle Minimum * (Watt) | 6.2 | 6.6 -6% | 9 -45% | 12.2 -97% | 14.4 -132% | 3 52% |
| Idle Average * (Watt) | 21.8 | 8.3 62% | 10.2 53% | 14.9 32% | 20 8% | 8 63% |
| Idle Maximum * (Watt) | 22 | 11.8 46% | 10.8 51% | 15.8 28% | 21.5 2% | 28 -27% |
| Load Average * (Watt) | 59.2 | 119 -101% | 72 -22% | 85.22 -44% | 119 -101% | 88 -49% |
| Witcher 3 ultra * (Watt) | 189.7 | 169 11% | 130 31% | 151.1 20% | 218 -15% | 98.2 48% |
| Load Maximum * (Watt) | 247.8 | 222 10% | 221 11% | 212.8 14% | 248 -0% | 152 39% |
* ... mindre är bättre
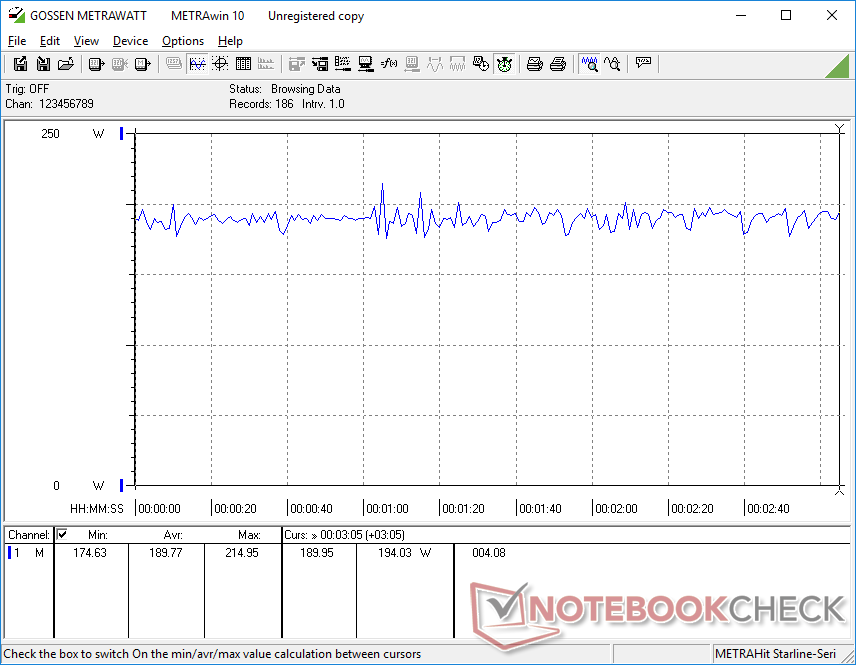
Power Consumption Witcher 3 / Stresstest
Power Consumption external Monitor
Batteritid
Körtiderna är i princip identiska med TUF Gaming F17 trots vår snabbare CPU och GPU. Särskilt WLAN-surfning kan pågå i drygt 9 timmar, vilket är mycket imponerande för en stor 17,3-tums gaming-laptop. Naturligtvis måste användarna komma ihåg att köra på iGPU-läge för att nå så långa drifttider.
Laddning från tom till full kapacitet tar knappt 90 minuter med den medföljande proprietära nätadaptern. Laddning med USB-C-adaptrar från tredje part går långsammare men stöds ändå.
| Asus TUF Gaming A17 FA707XI-NS94 R9 7940HS, GeForce RTX 4070 Laptop GPU, 90 Wh | Asus TUF Gaming F17 FX707Z-HX011W i7-12700H, GeForce RTX 3060 Laptop GPU, 90 Wh | MSI Pulse 17 B13VGK i7-13700H, GeForce RTX 4070 Laptop GPU, 90 Wh | MSI Katana 17 B13VFK i7-13620H, GeForce RTX 4060 Laptop GPU, 53.5 Wh | Razer Blade 17 (i7-12800H, RTX 3070 Ti) i7-12800H, GeForce RTX 3070 Ti Laptop GPU, 82 Wh | HP Pavilion Gaming 17-cd2146ng i5-11300H, GeForce RTX 3050 Ti Laptop GPU, 52.5 Wh | |
|---|---|---|---|---|---|---|
| Batteridrifttid | 16% | 14% | -55% | -15% | -45% | |
| Reader / Idle (h) | 19.7 | |||||
| WiFi v1.3 (h) | 9.1 | 8.7 -4% | 9 -1% | 2.9 -68% | 5.9 -35% | 5 -45% |
| Load (h) | 1.7 | 2.3 35% | 2.2 29% | 1 -41% | 1.8 6% | |
| H.264 (h) | 7.7 | 4.9 |
För
Emot
Slutsats - Bra prestanda med en dålig skärm
TUF Gaming A17 FA707 är en av de billigaste 17,3-tums bärbara speldatorerna med GeForce RTX 4070. Det är särskilt imponerande att systemet levereras med en Zen 4 Ryzen 9-processor, vilket innebär att du inte behöver offra processorprestanda för det låga priset. Den starka kombinationen av CPU och GPU gör den här modellen lätt att rekommendera för spelare som vill maximera prestanda per dollar.
Det är istället resten av datorn som har fått stryka på foten när det gäller processorerna. Mer specifikt är det smala färgomfånget och de genomsnittliga svarstiderna på skärmen bleka i jämförelse med skärmarna på avancerade bärbara speldatorer som de i ROG-serien. Tack och lov erbjuder Asus flera skärmalternativ för TUF Gaming A17 med mycket bättre färger och attribut än vår recensionskonfiguration. Om möjligt rekommenderar vi att du byter ut Ryzen 9-processorn och den dåliga 1080p-panelen i vår recensionskonfiguration mot en enhet med Ryzen 7-processorn och 1440p-panelen. Processorn kan vara lite långsammare, men förbättringarna av skärmkvaliteten kommer att vara mycket mer märkbara och väl värda kompromissen.
Asus TUF Gaming A17 balanserar pris, prestanda och formfaktor mycket bra så länge du kan hitta rätt konfiguration. SKU: er med 1080p-panelen har märkbart sämre färger än 1440p-alternativen.
Andra nackdelar inkluderar Wi-Fi 6-anslutning istället för Wi-Fi 6E, en 720p-webbkamera med låg upplösning och ingen RGB-belysning per tangent. Dessa nackdelar påverkar dock inte spelupplevelsen direkt. Systemet har kvar de flesta kärnfunktionerna som är mer eftertraktade, t.ex. den tunna profilen, den långa batteritiden och de tillgängliga interndelarna för uppgraderingar.
Pris och tillgänglighet
Asus TUF Gaming A17 FA707XI-NS94
- 01/06/2024 v7 (old)
Allen Ngo
Genomskinlighet
Valet av enheter som ska granskas görs av vår redaktion. Testprovet köptes fritt av författaren på hans/hennes egen bekostnad. Långivaren hade inget inflytande på denna recension och inte heller fick tillverkaren en kopia av denna recension innan publiceringen. Det fanns ingen skyldighet att publicera denna recension. Som ett oberoende medieföretag är Notebookcheck inte föremål för auktoritet från tillverkare, återförsäljare eller förlag.
This is how Notebookcheck is testingEvery year, Notebookcheck independently reviews hundreds of laptops and smartphones using standardized procedures to ensure that all results are comparable. We have continuously developed our test methods for around 20 years and set industry standards in the process. In our test labs, high-quality measuring equipment is utilized by experienced technicians and editors. These tests involve a multi-stage validation process. Our complex rating system is based on hundreds of well-founded measurements and benchmarks, which maintains objectivity.
Price comparison

