Recension av Asus ROG Strix Scar 17 SE - Fullt utrustad spellaptop med RTX 3080 Ti
ROG Strix Scar SE är Asus flaggskepp inom spelområdet, och även 2022 är den utrustad med de snabbaste komponenterna som för närvarande finns på marknaden. Vi testar toppmodellen G733CX med Intel Core i9-12950HX, Nvidia GeForce RTX 3080 Ti, två SSD-diskar på 2 TB från Samsung och en snabb QHD-panel med en uppdateringsfrekvens på 240 Hz. Priset är också högklassigt, eftersom den högsta försäljningspriset för vår testenhet ligger på 3 999 euro (~4 129 dollar).
Potentiella konkurrenter i jämförelse
Gradering | Datum | Modell | Vikt | Höjd | Storlek | Upplösning | Pris |
|---|---|---|---|---|---|---|---|
| 86.9 % v7 (old) | 11/2022 | Asus ROG Strix Scar 17 SE G733CX-LL014W i9-12950HX, GeForce RTX 3080 Ti Laptop GPU | 2.9 kg | 28.3 mm | 17.30" | 2560x1440 | |
| 88.9 % v7 (old) | 09/2022 | Lenovo Legion 7 16IAX7-82TD004SGE i9-12900HX, GeForce RTX 3080 Ti Laptop GPU | 2.6 kg | 20 mm | 16.00" | 2560x1600 | |
| 88.3 % v7 (old) | 08/2022 | MSI Titan GT77 12UHS i9-12900HX, GeForce RTX 3080 Ti Laptop GPU | 3.3 kg | 23 mm | 17.30" | 1920x1080 | |
| 87.6 % v7 (old) | 09/2022 | Schenker XMG Neo 17 M22 R9 6900HX, GeForce RTX 3080 Ti Laptop GPU | 2.8 kg | 27 mm | 17.00" | 2560x1600 | |
| 89.2 % v7 (old) | 05/2022 | Alienware x17 R2 P48E i9-12900HK, GeForce RTX 3080 Ti Laptop GPU | 3.1 kg | 20.9 mm | 17.30" | 1920x1080 |
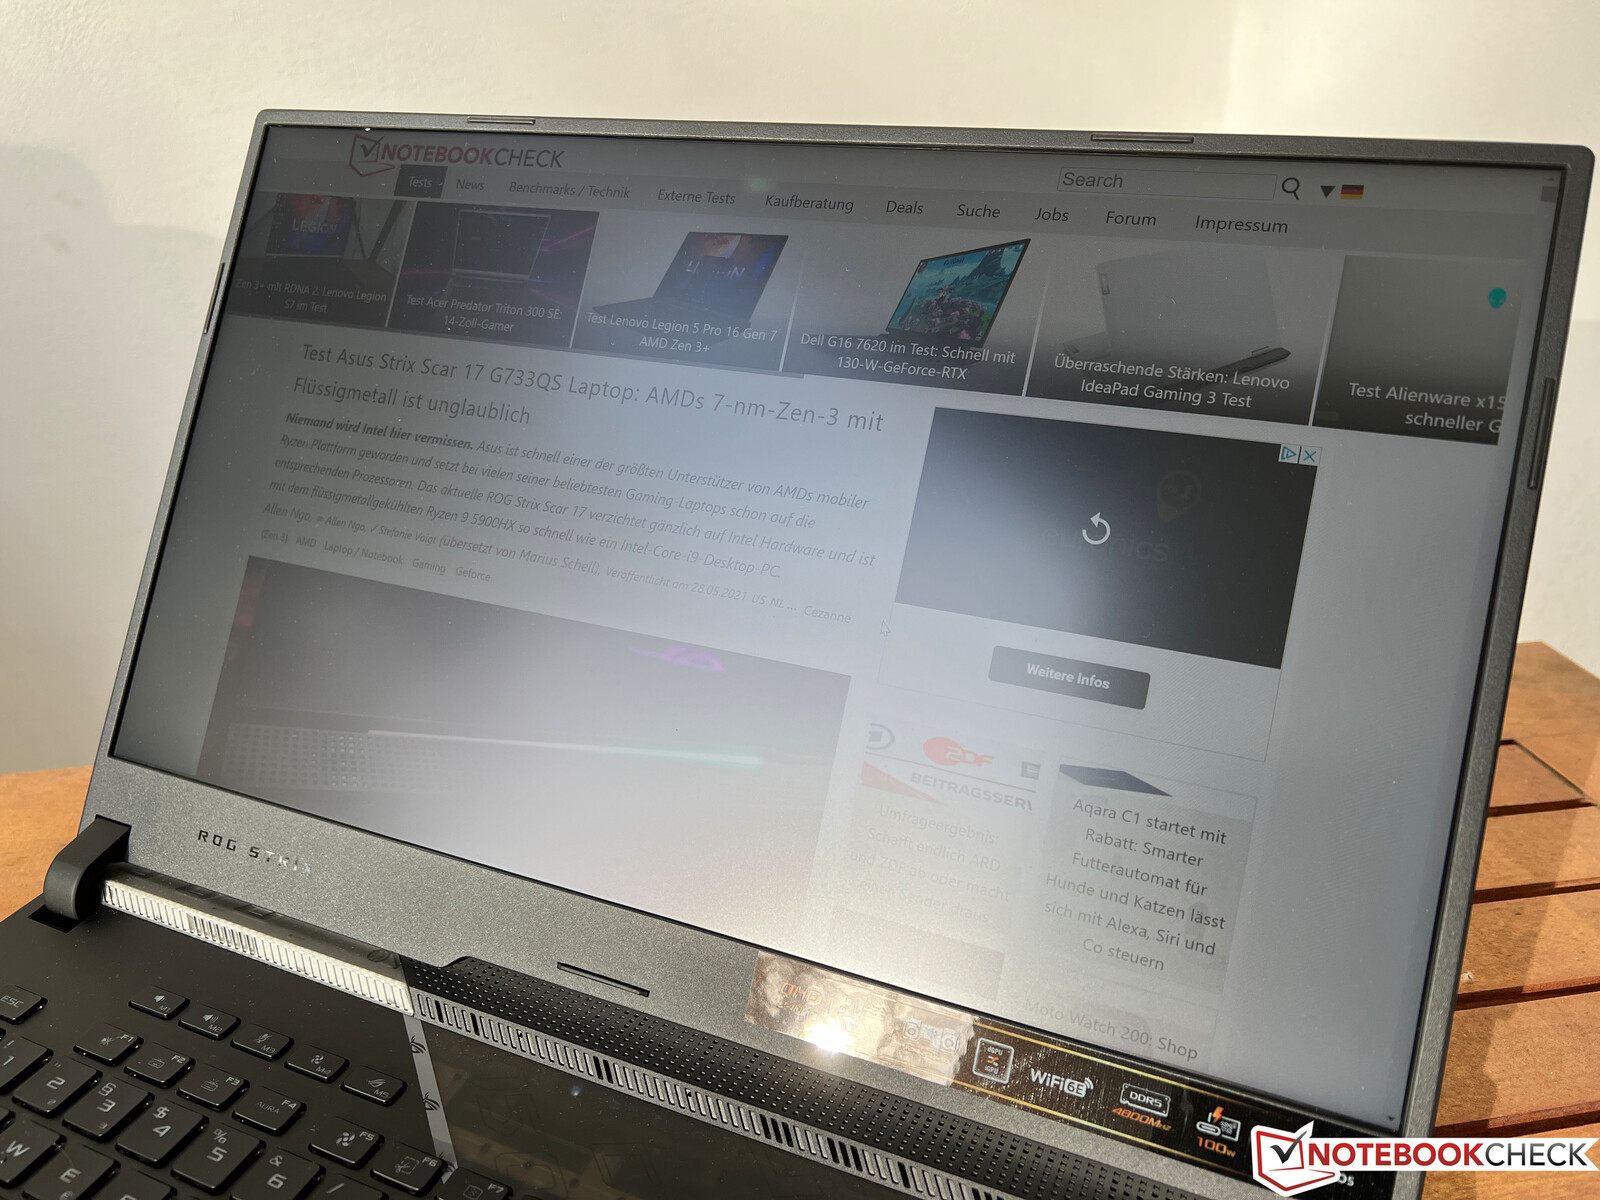
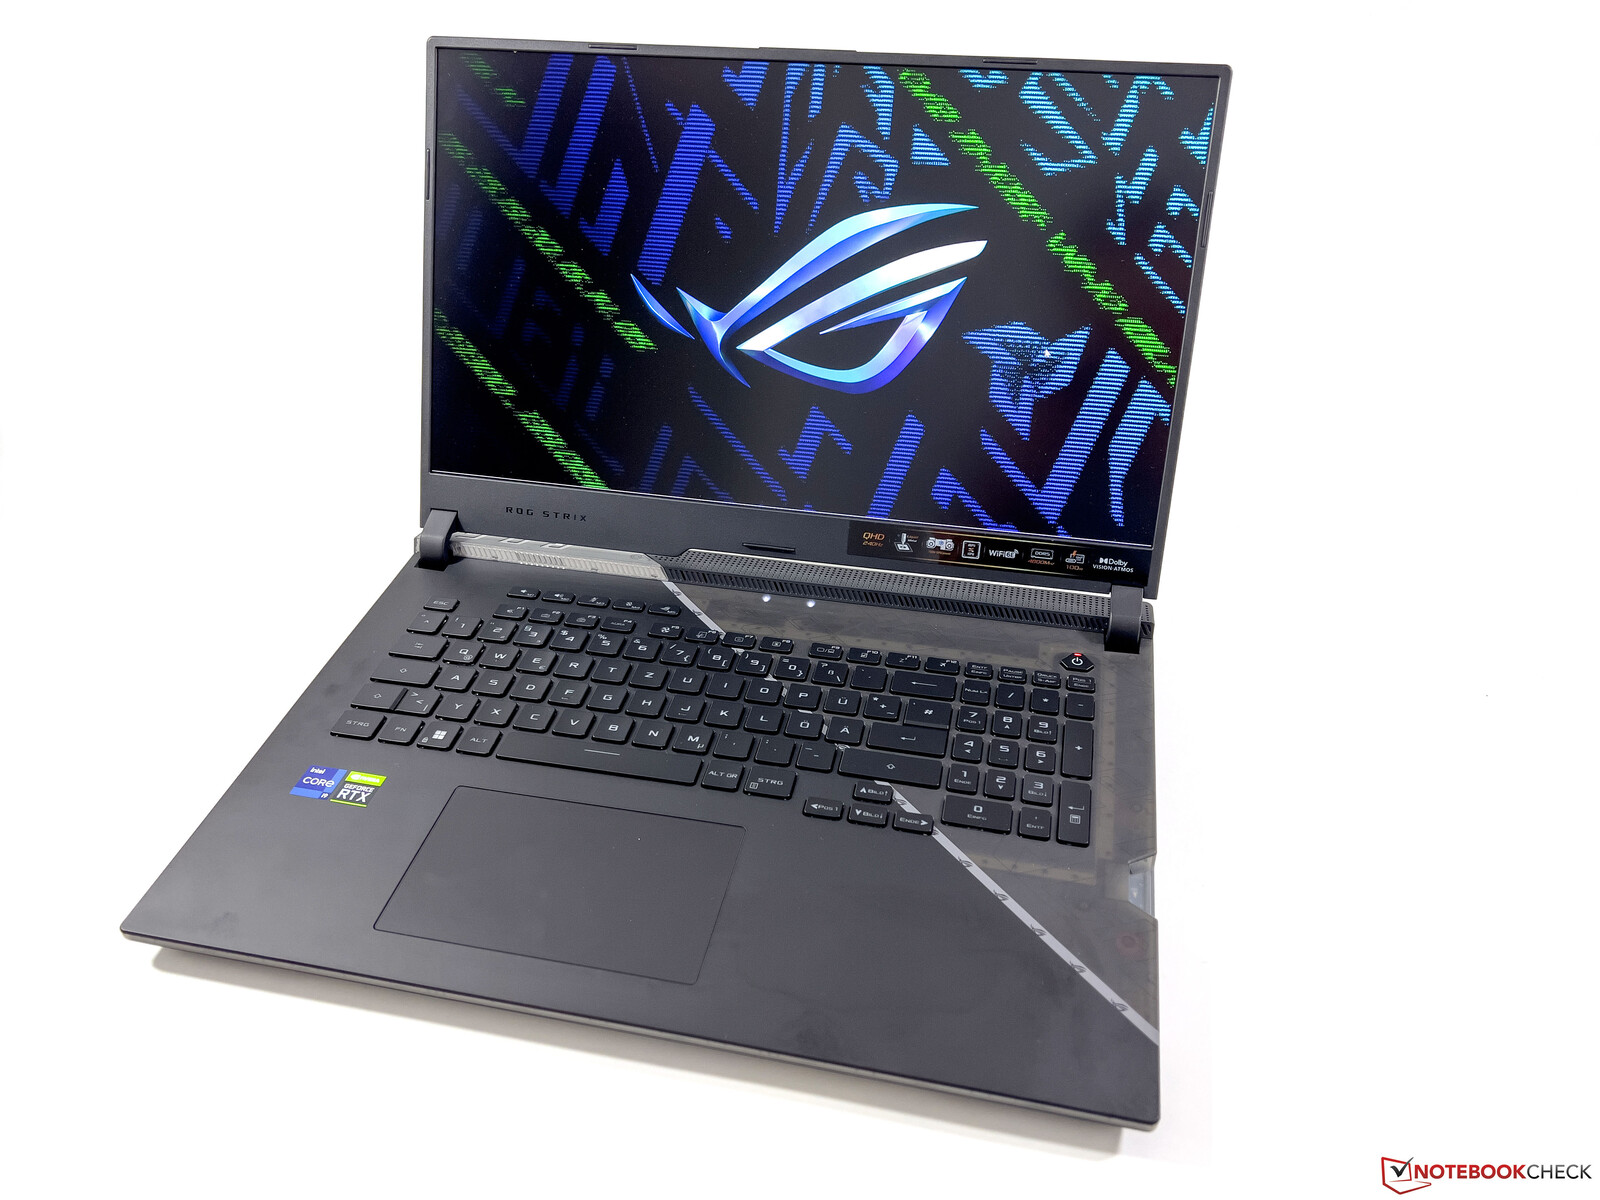
Hölje - Spellaptop med en design som sticker ut och omfattande belysning
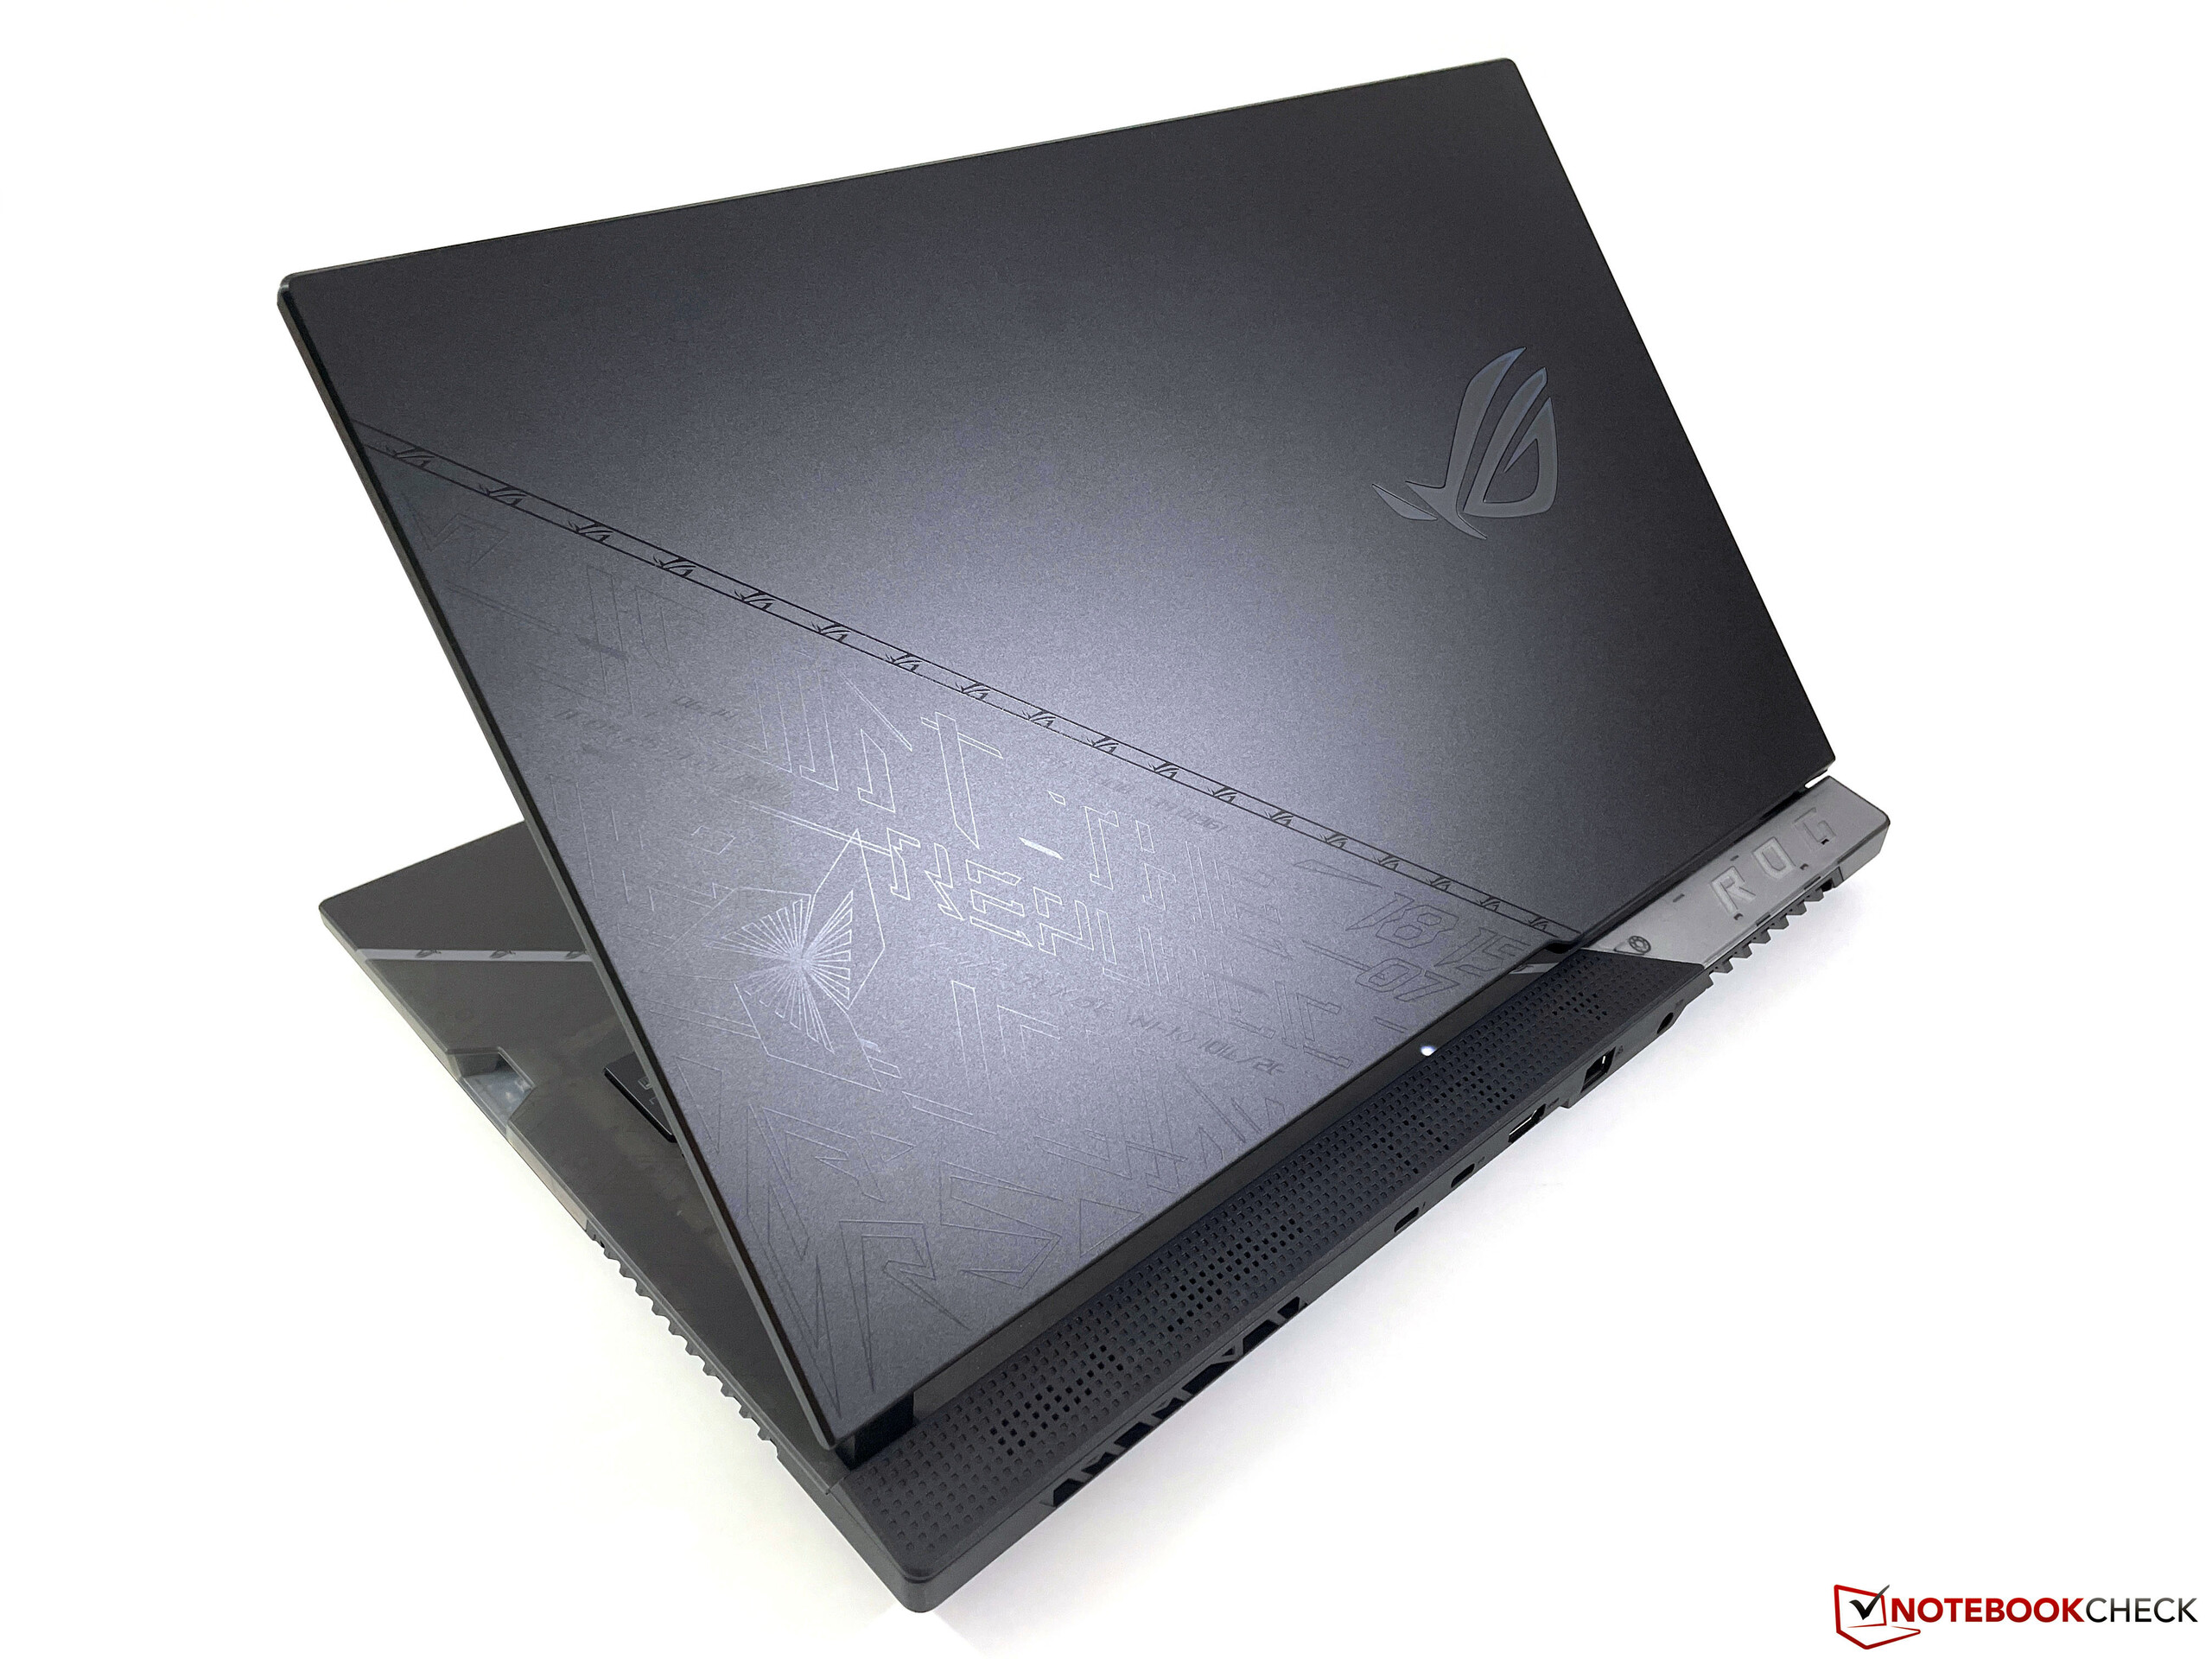
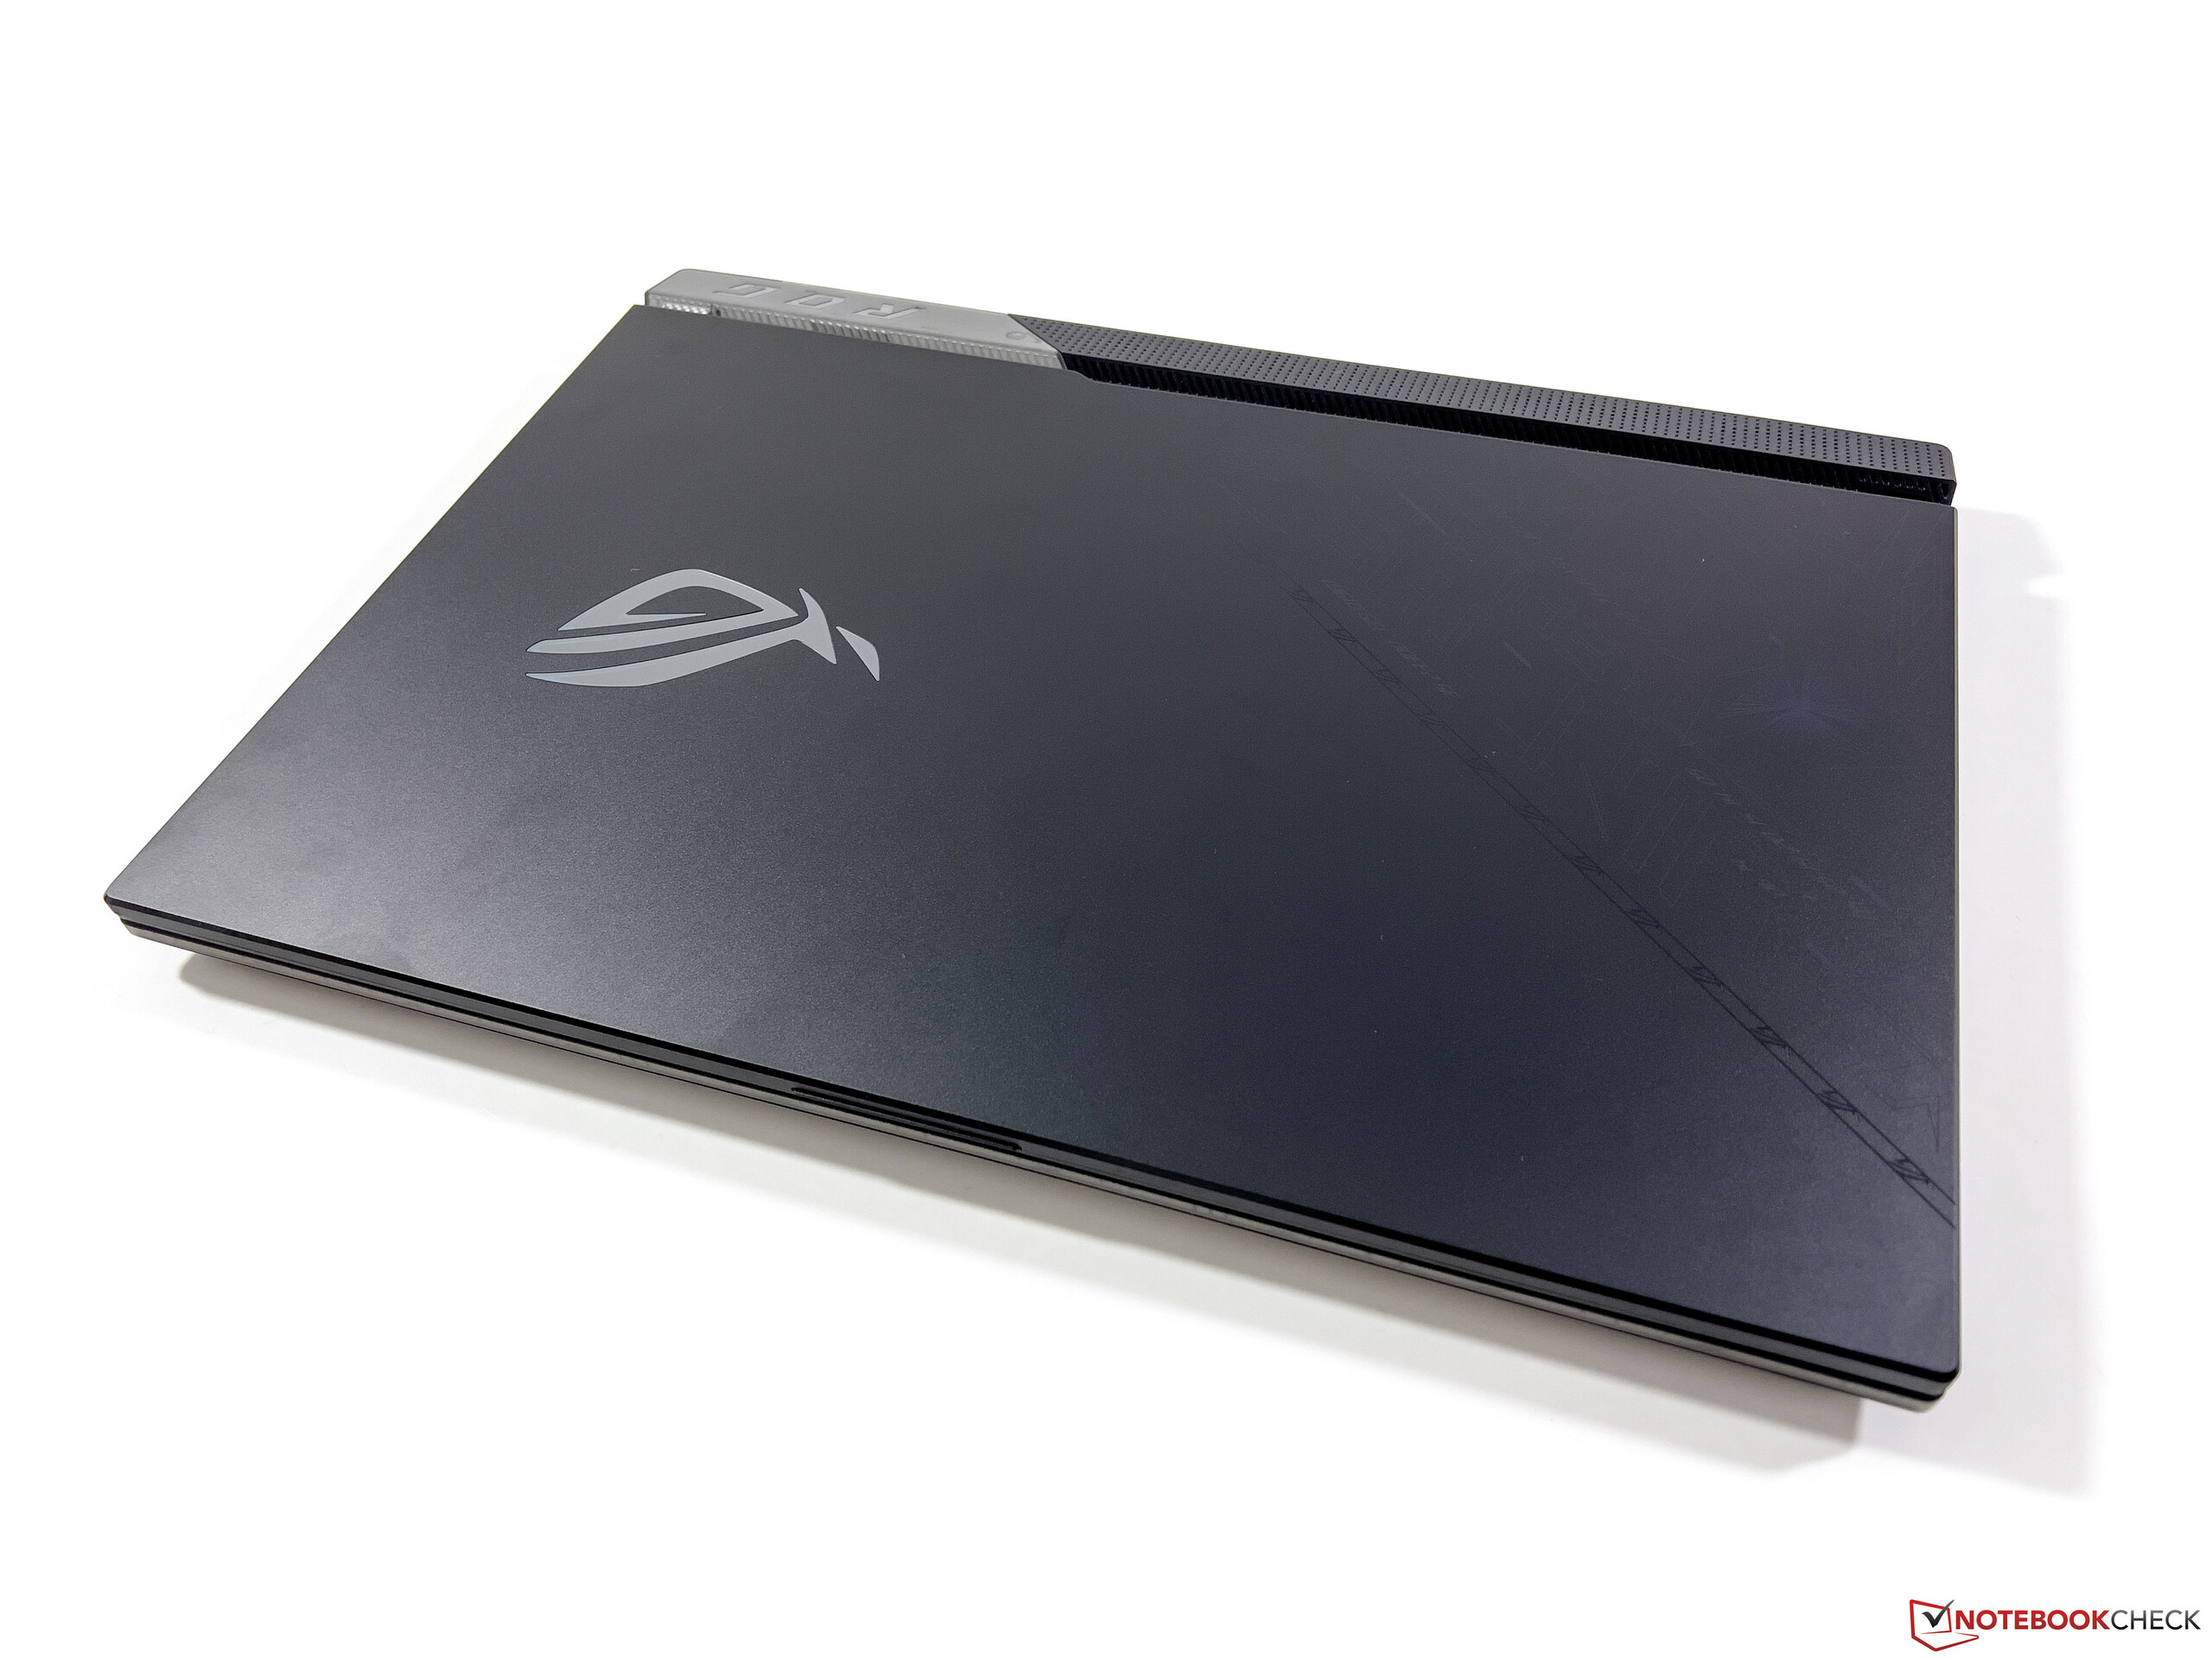
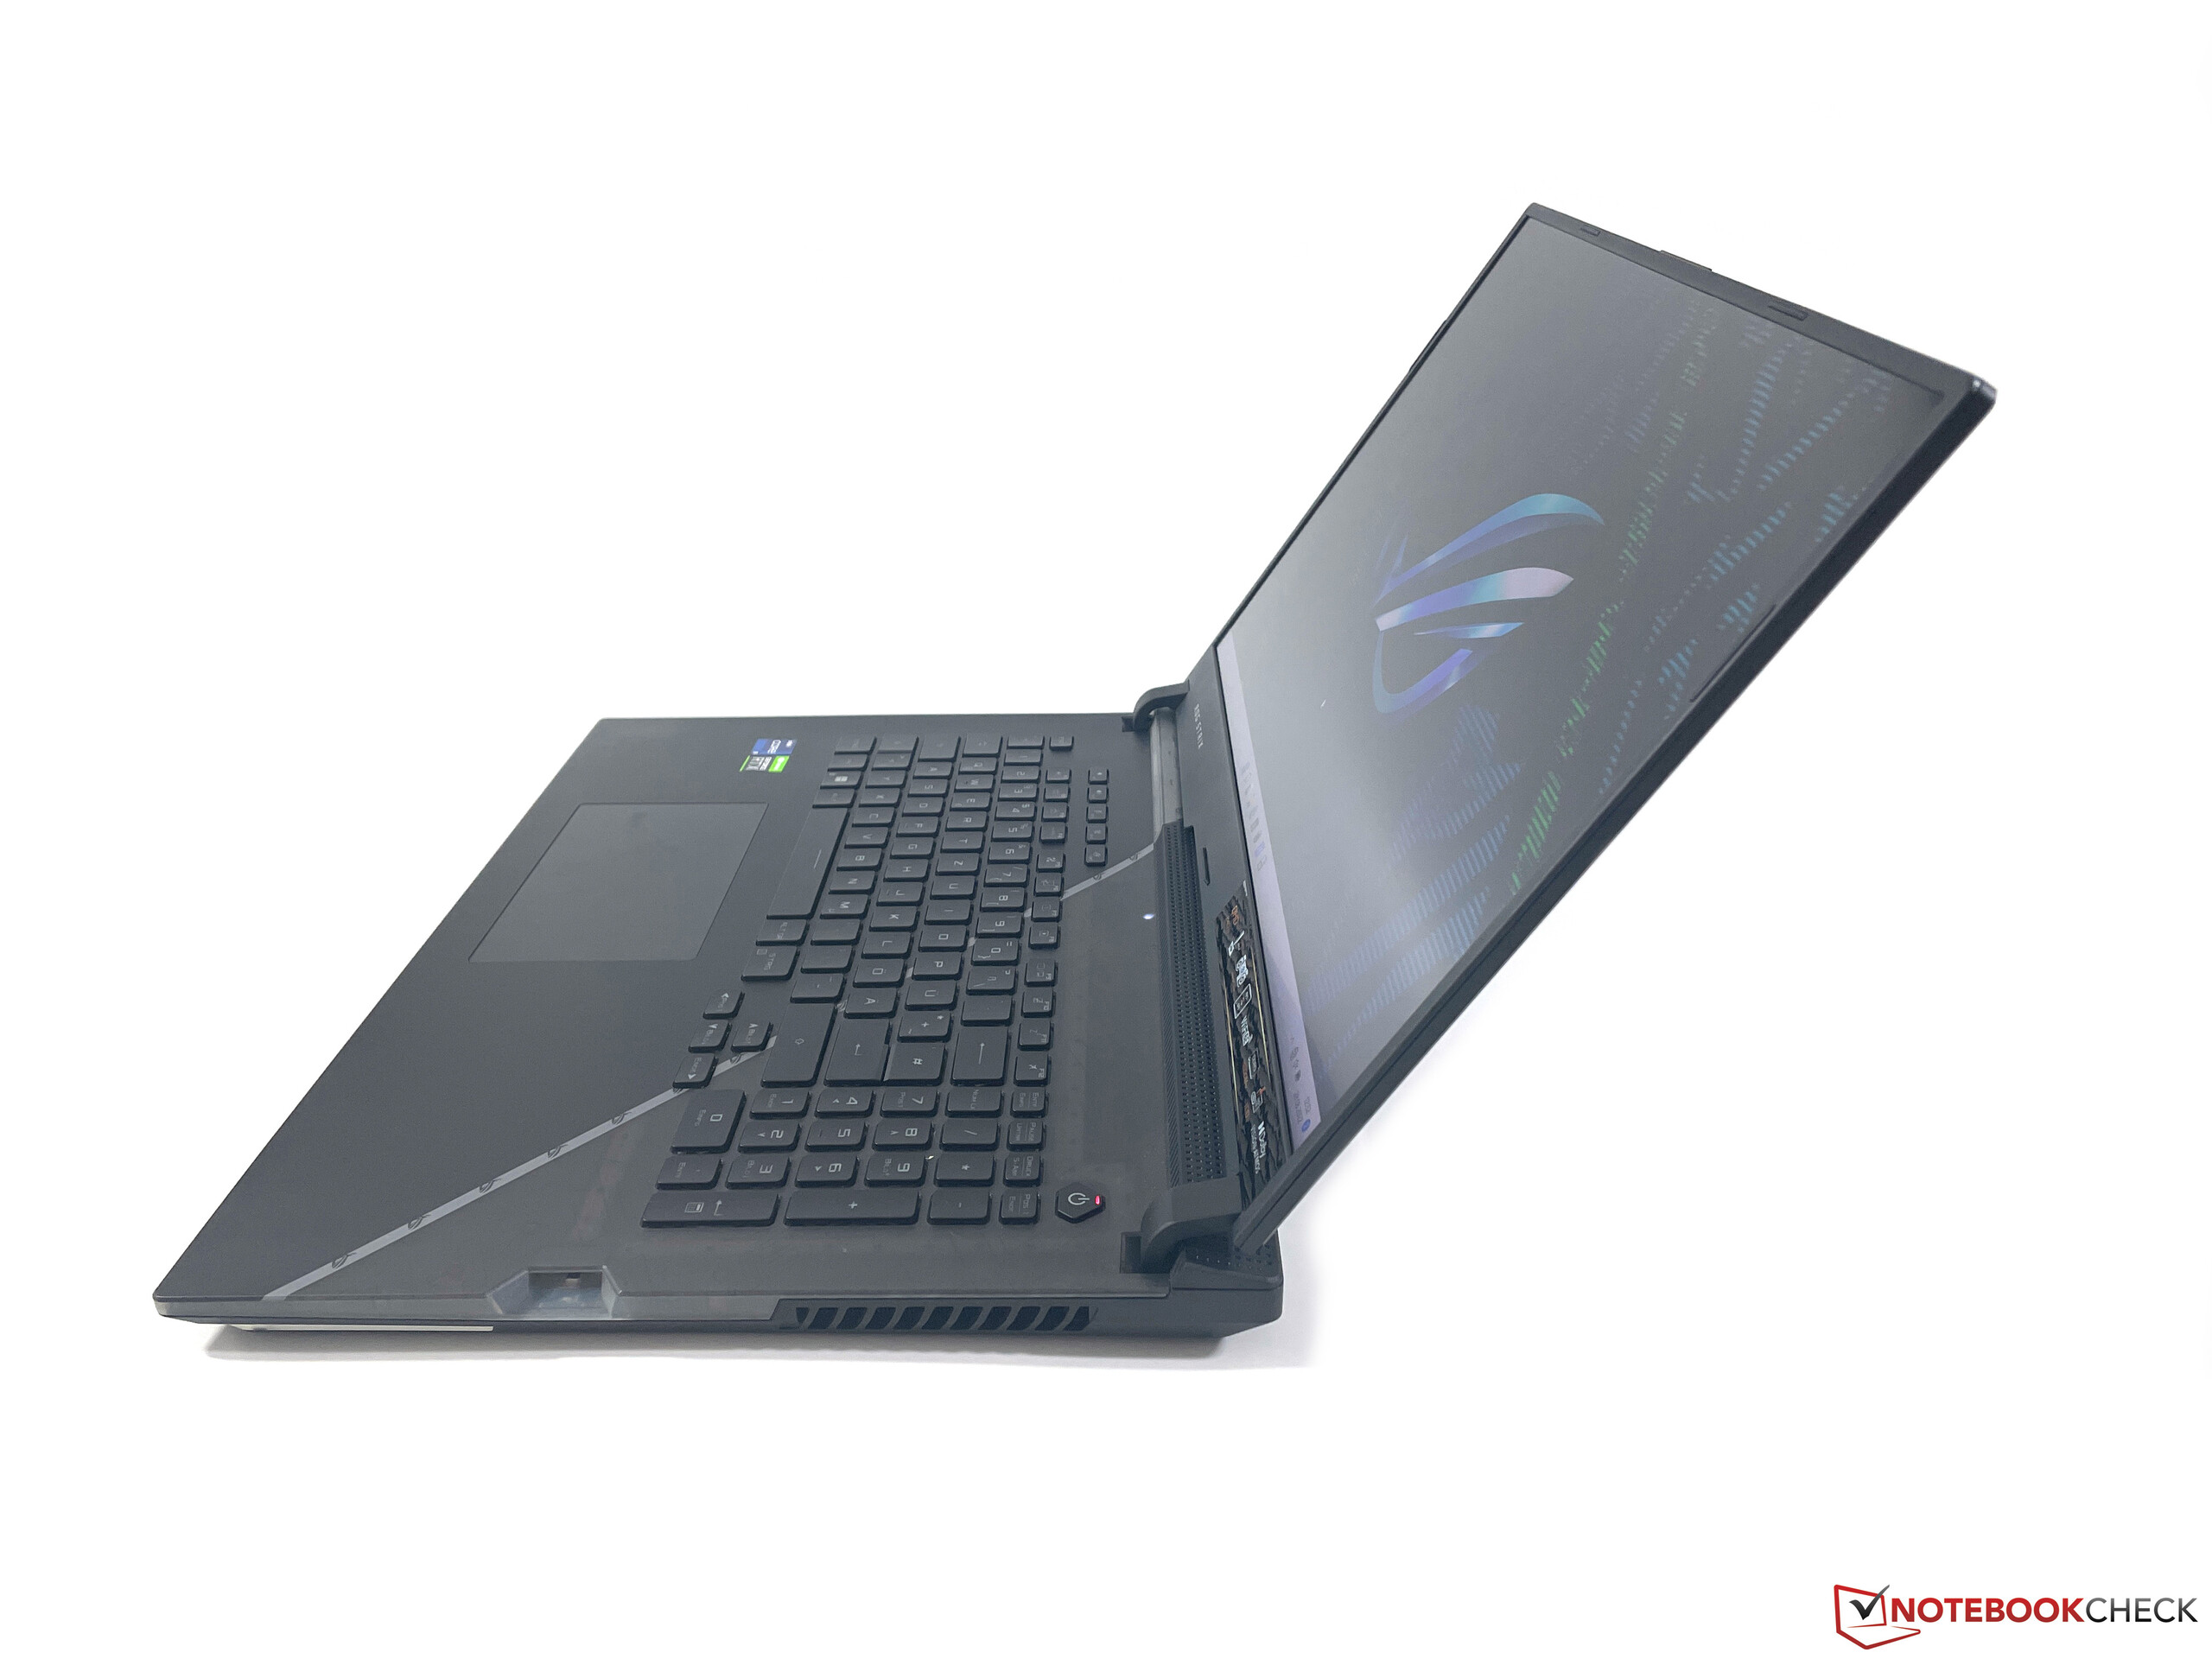
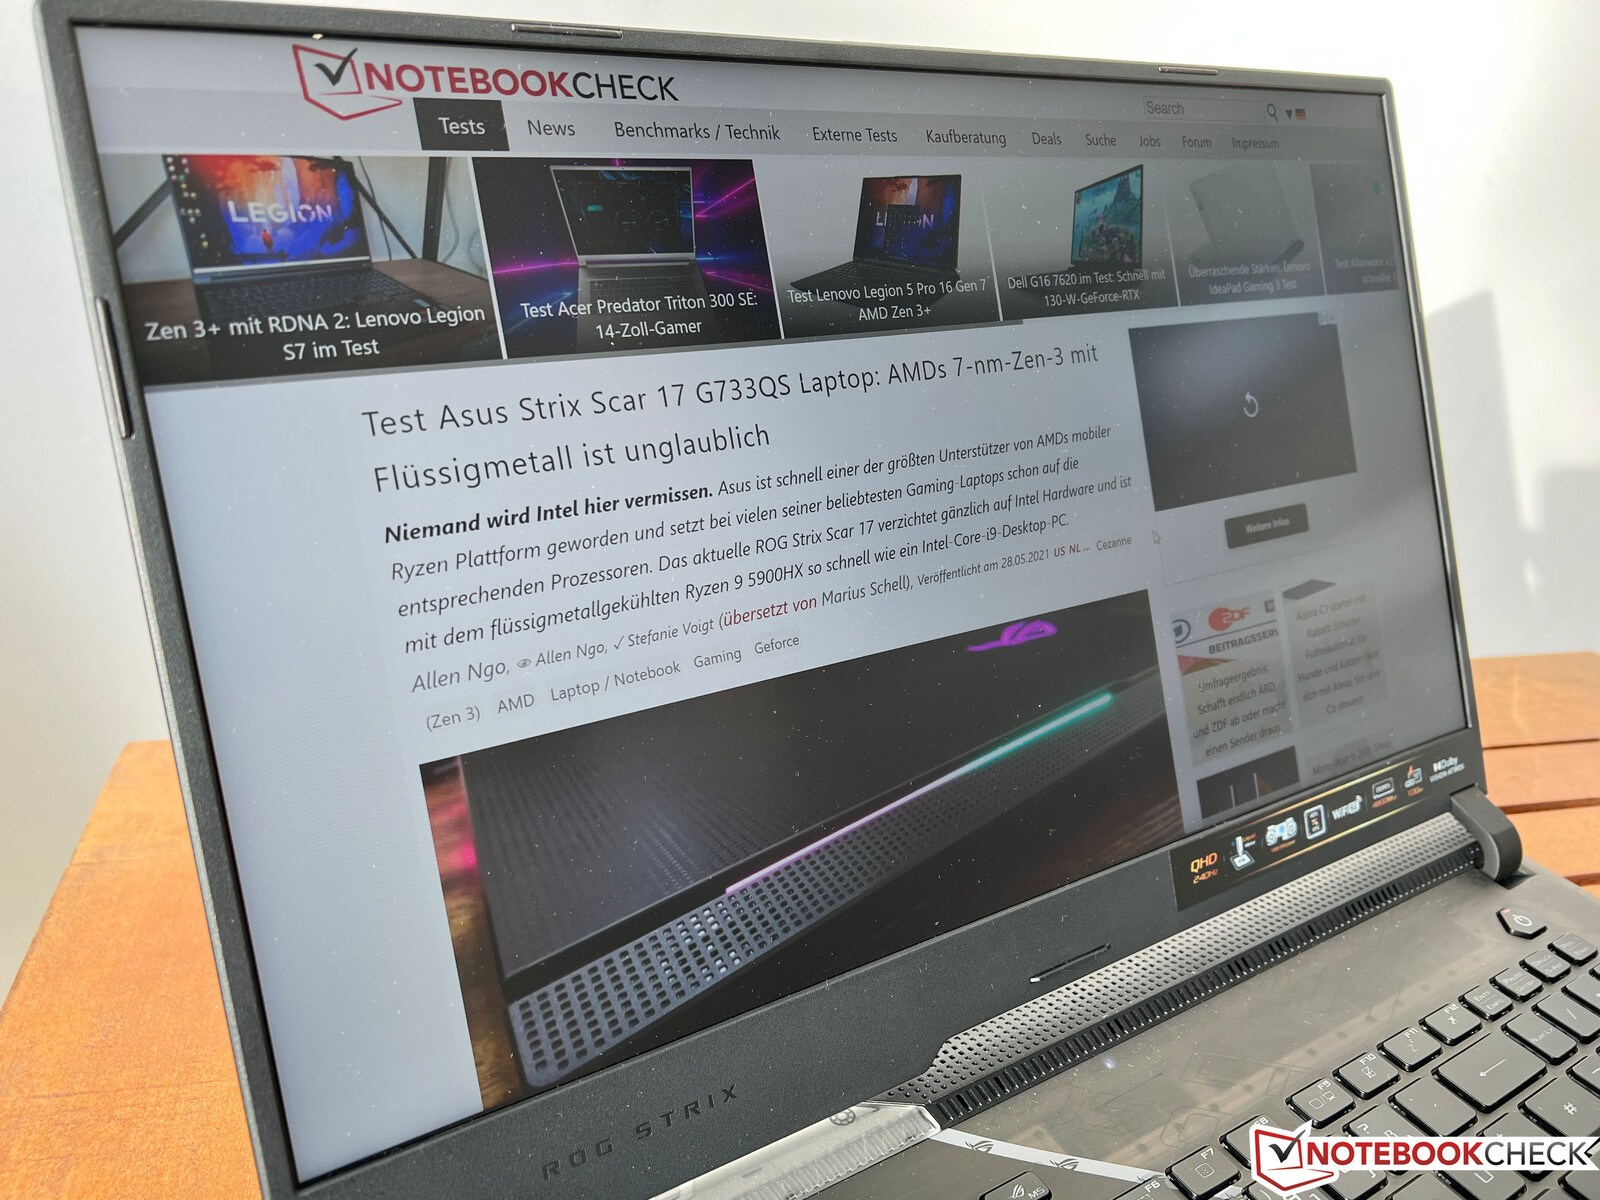
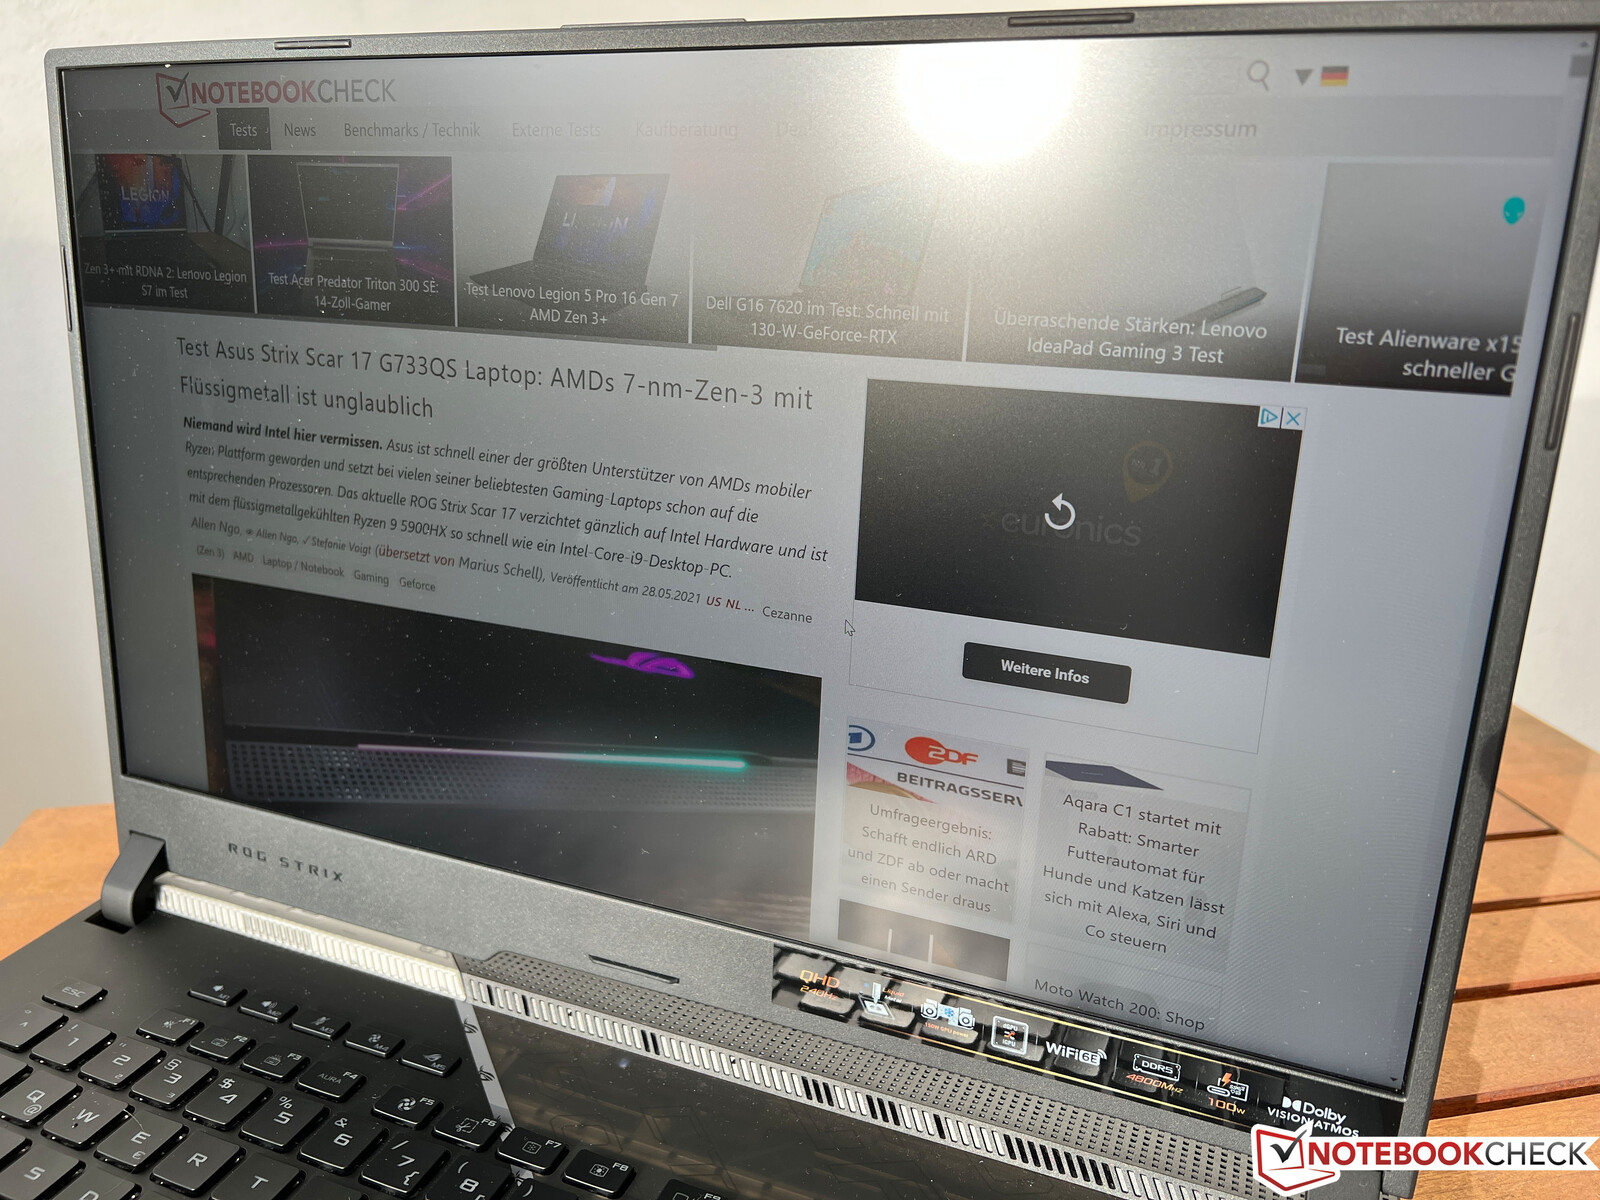
ROG Strix Scar 17 är helt klart en bärbar dator för spel som inte alls döljer sina ambitioner. Höljet är till stor del identiskt med förra årets G733QS, och en del av basenheten är återigen transparent. Dessutom finns det omfattande belysta element och några ytterligare designelement eller gimmicks som den speciella skrivningen på locket som bara blir synlig när du lyser med UV-ljus på den
Kvaliteten på plasthöljet är överlag bra, även om ytorna fortsätter att vara känsliga för fingeravtryck och du kan höra ett och annat litet knarrande ljud när du till exempel öppnar displayen. Stabiliteten hos den tjocka basenheten är hyfsad, men du kan fortfarande trycka ner basenheten minimalt i tangentbordets centrala område. Även om det relativt smala skärmlocket gör ett bra jobb, kan gångjärnet fortfarande inte förhindra en viss lätt vinglighet när den bärbara datorn till exempel flyttas.
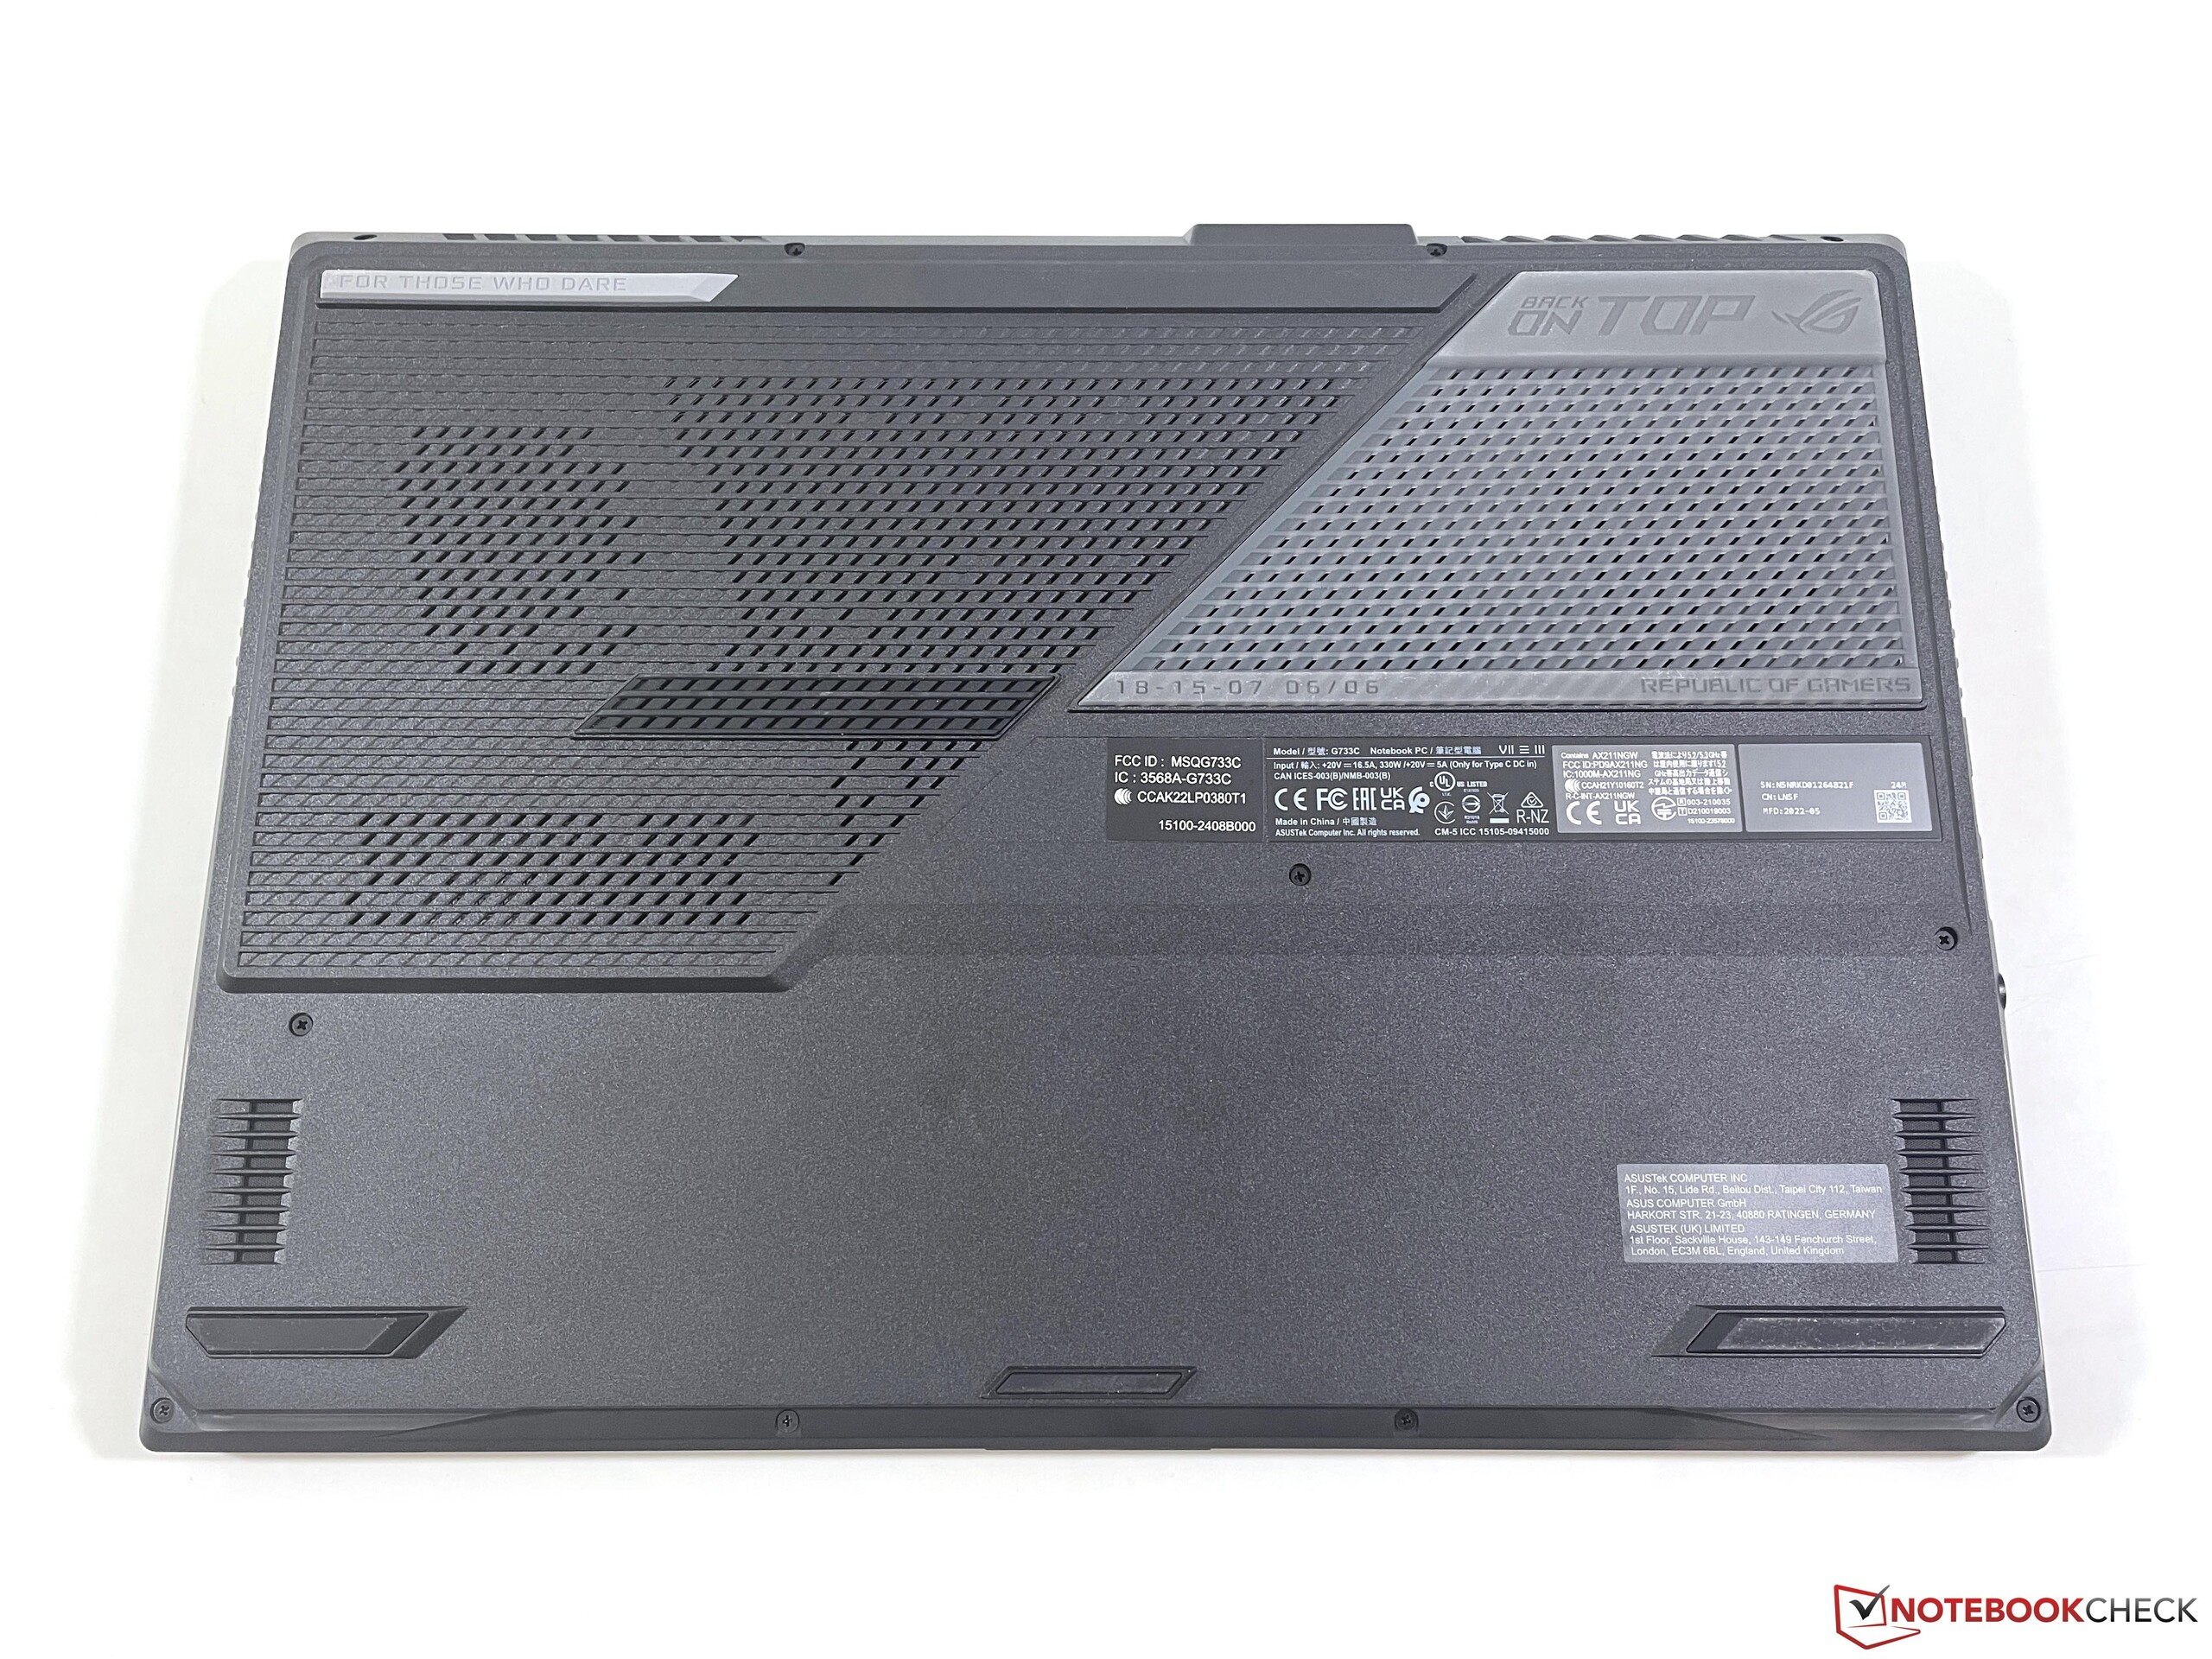
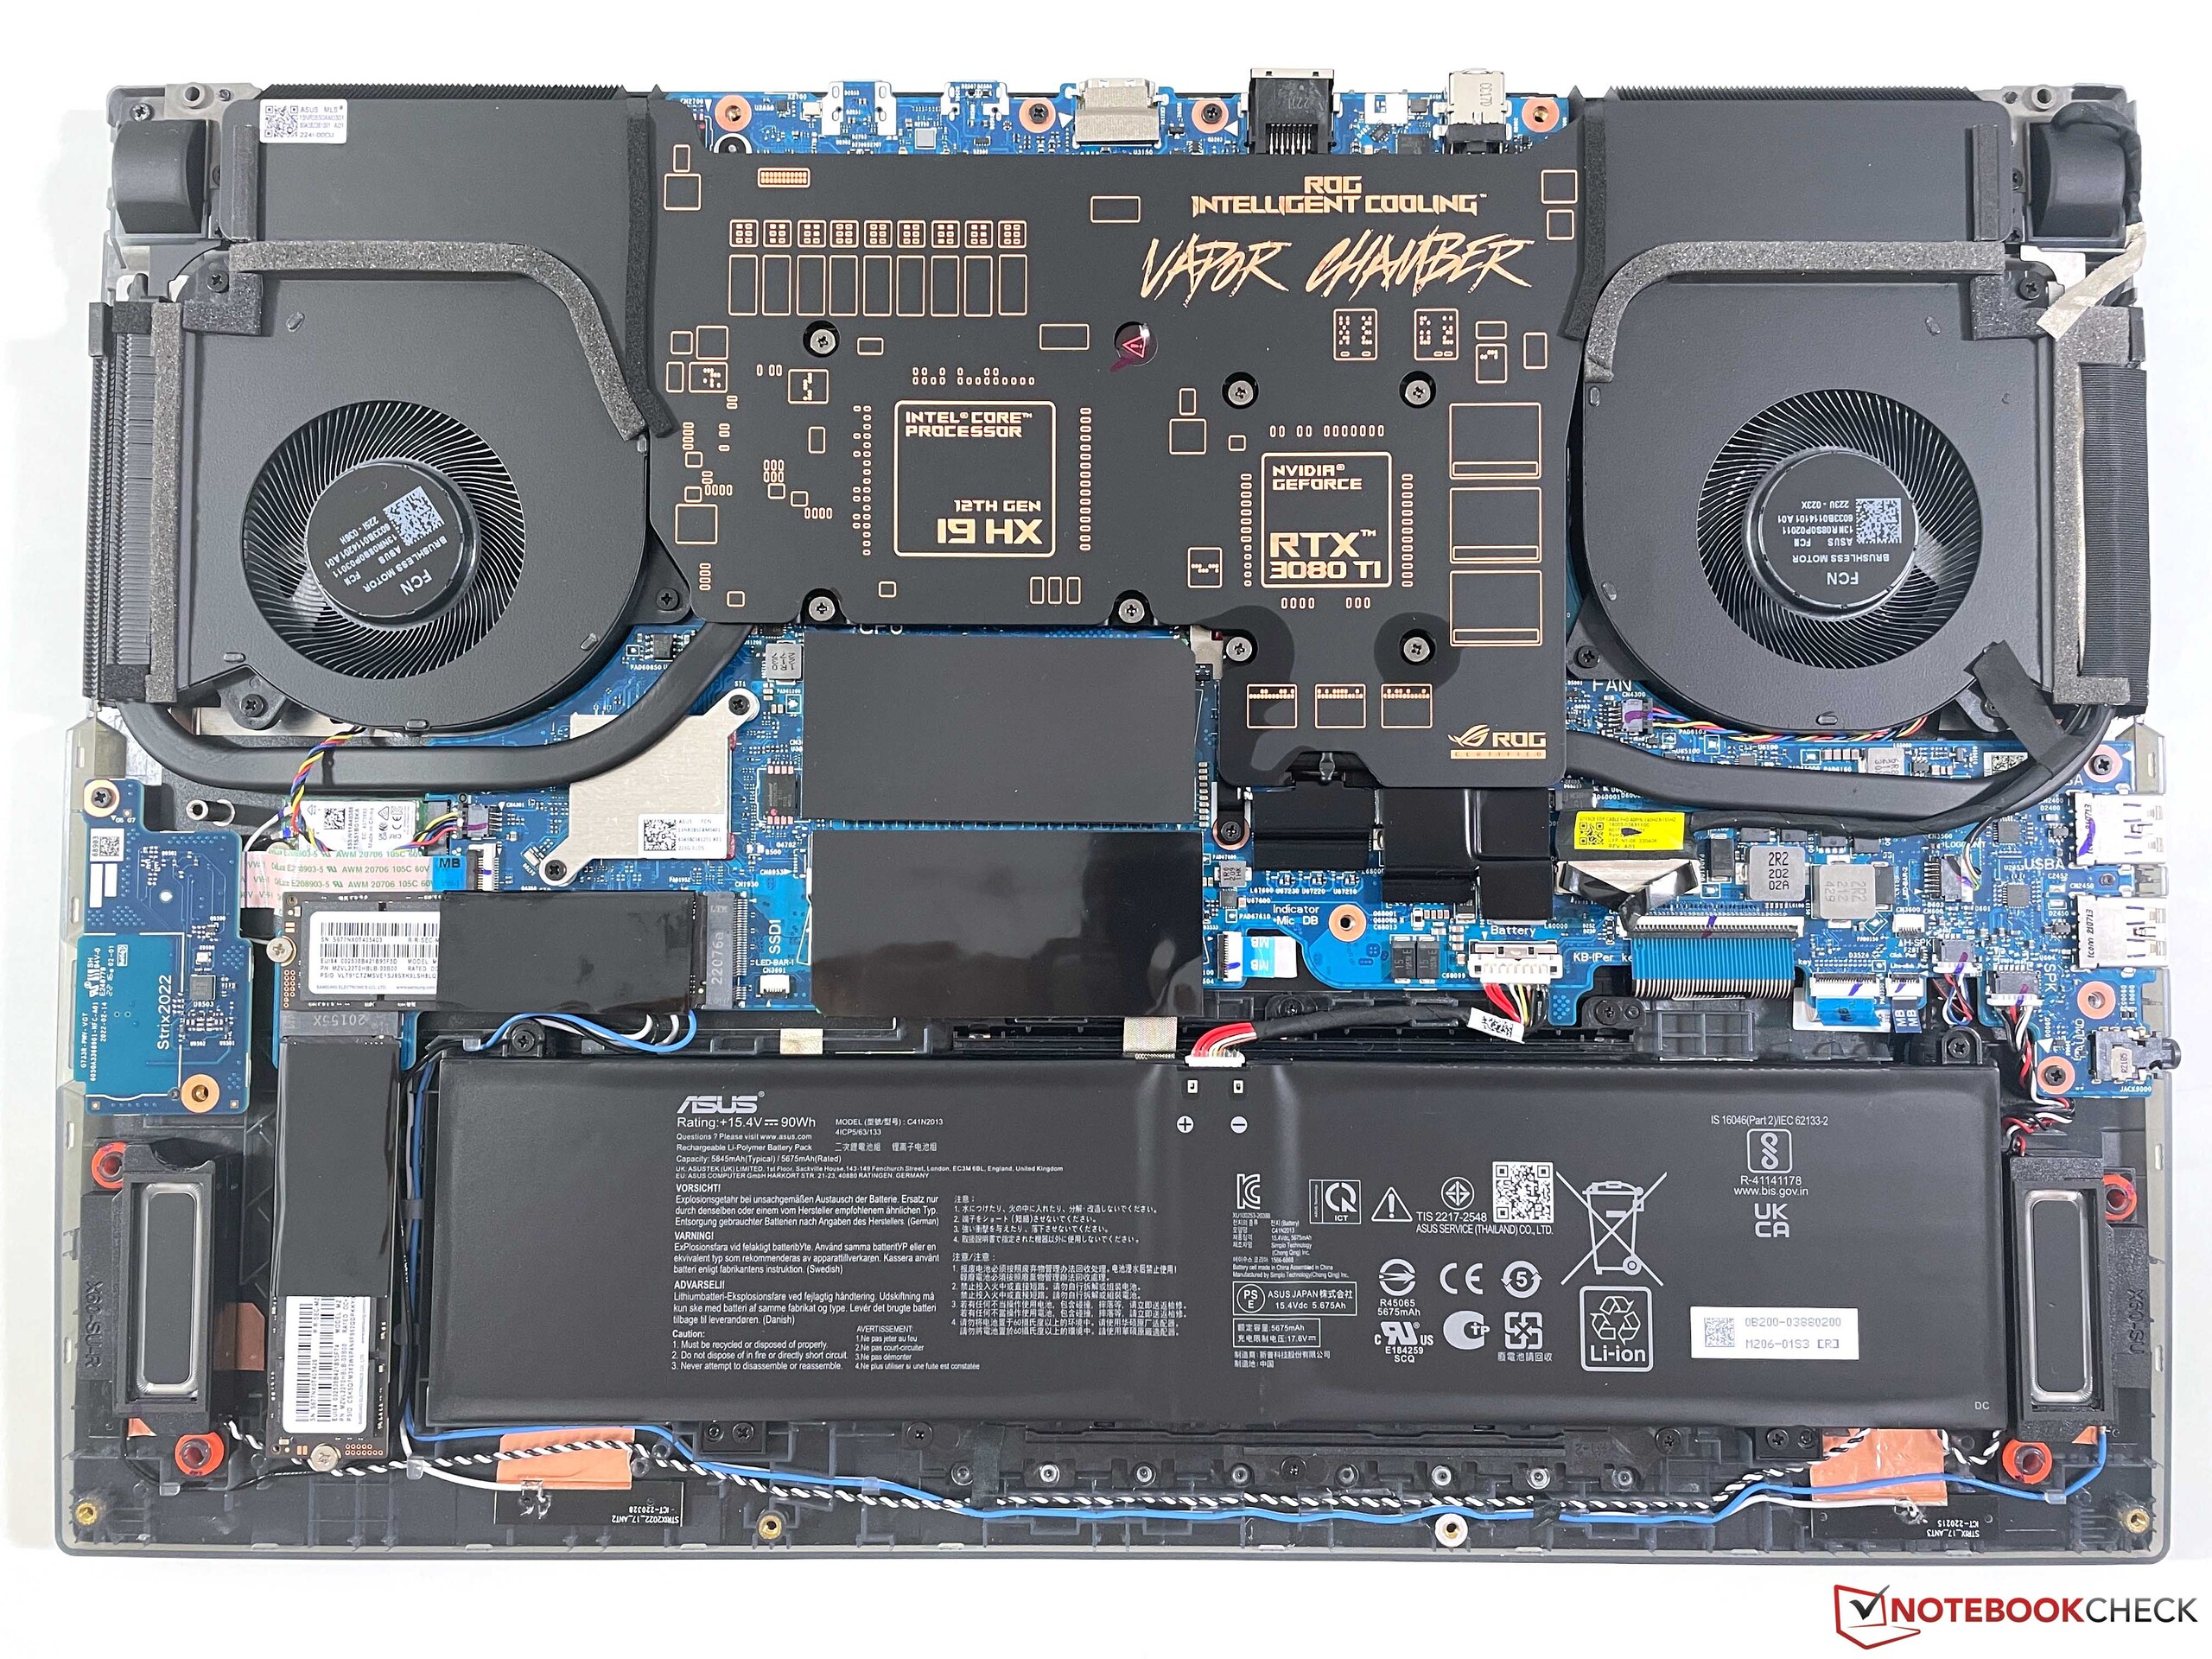
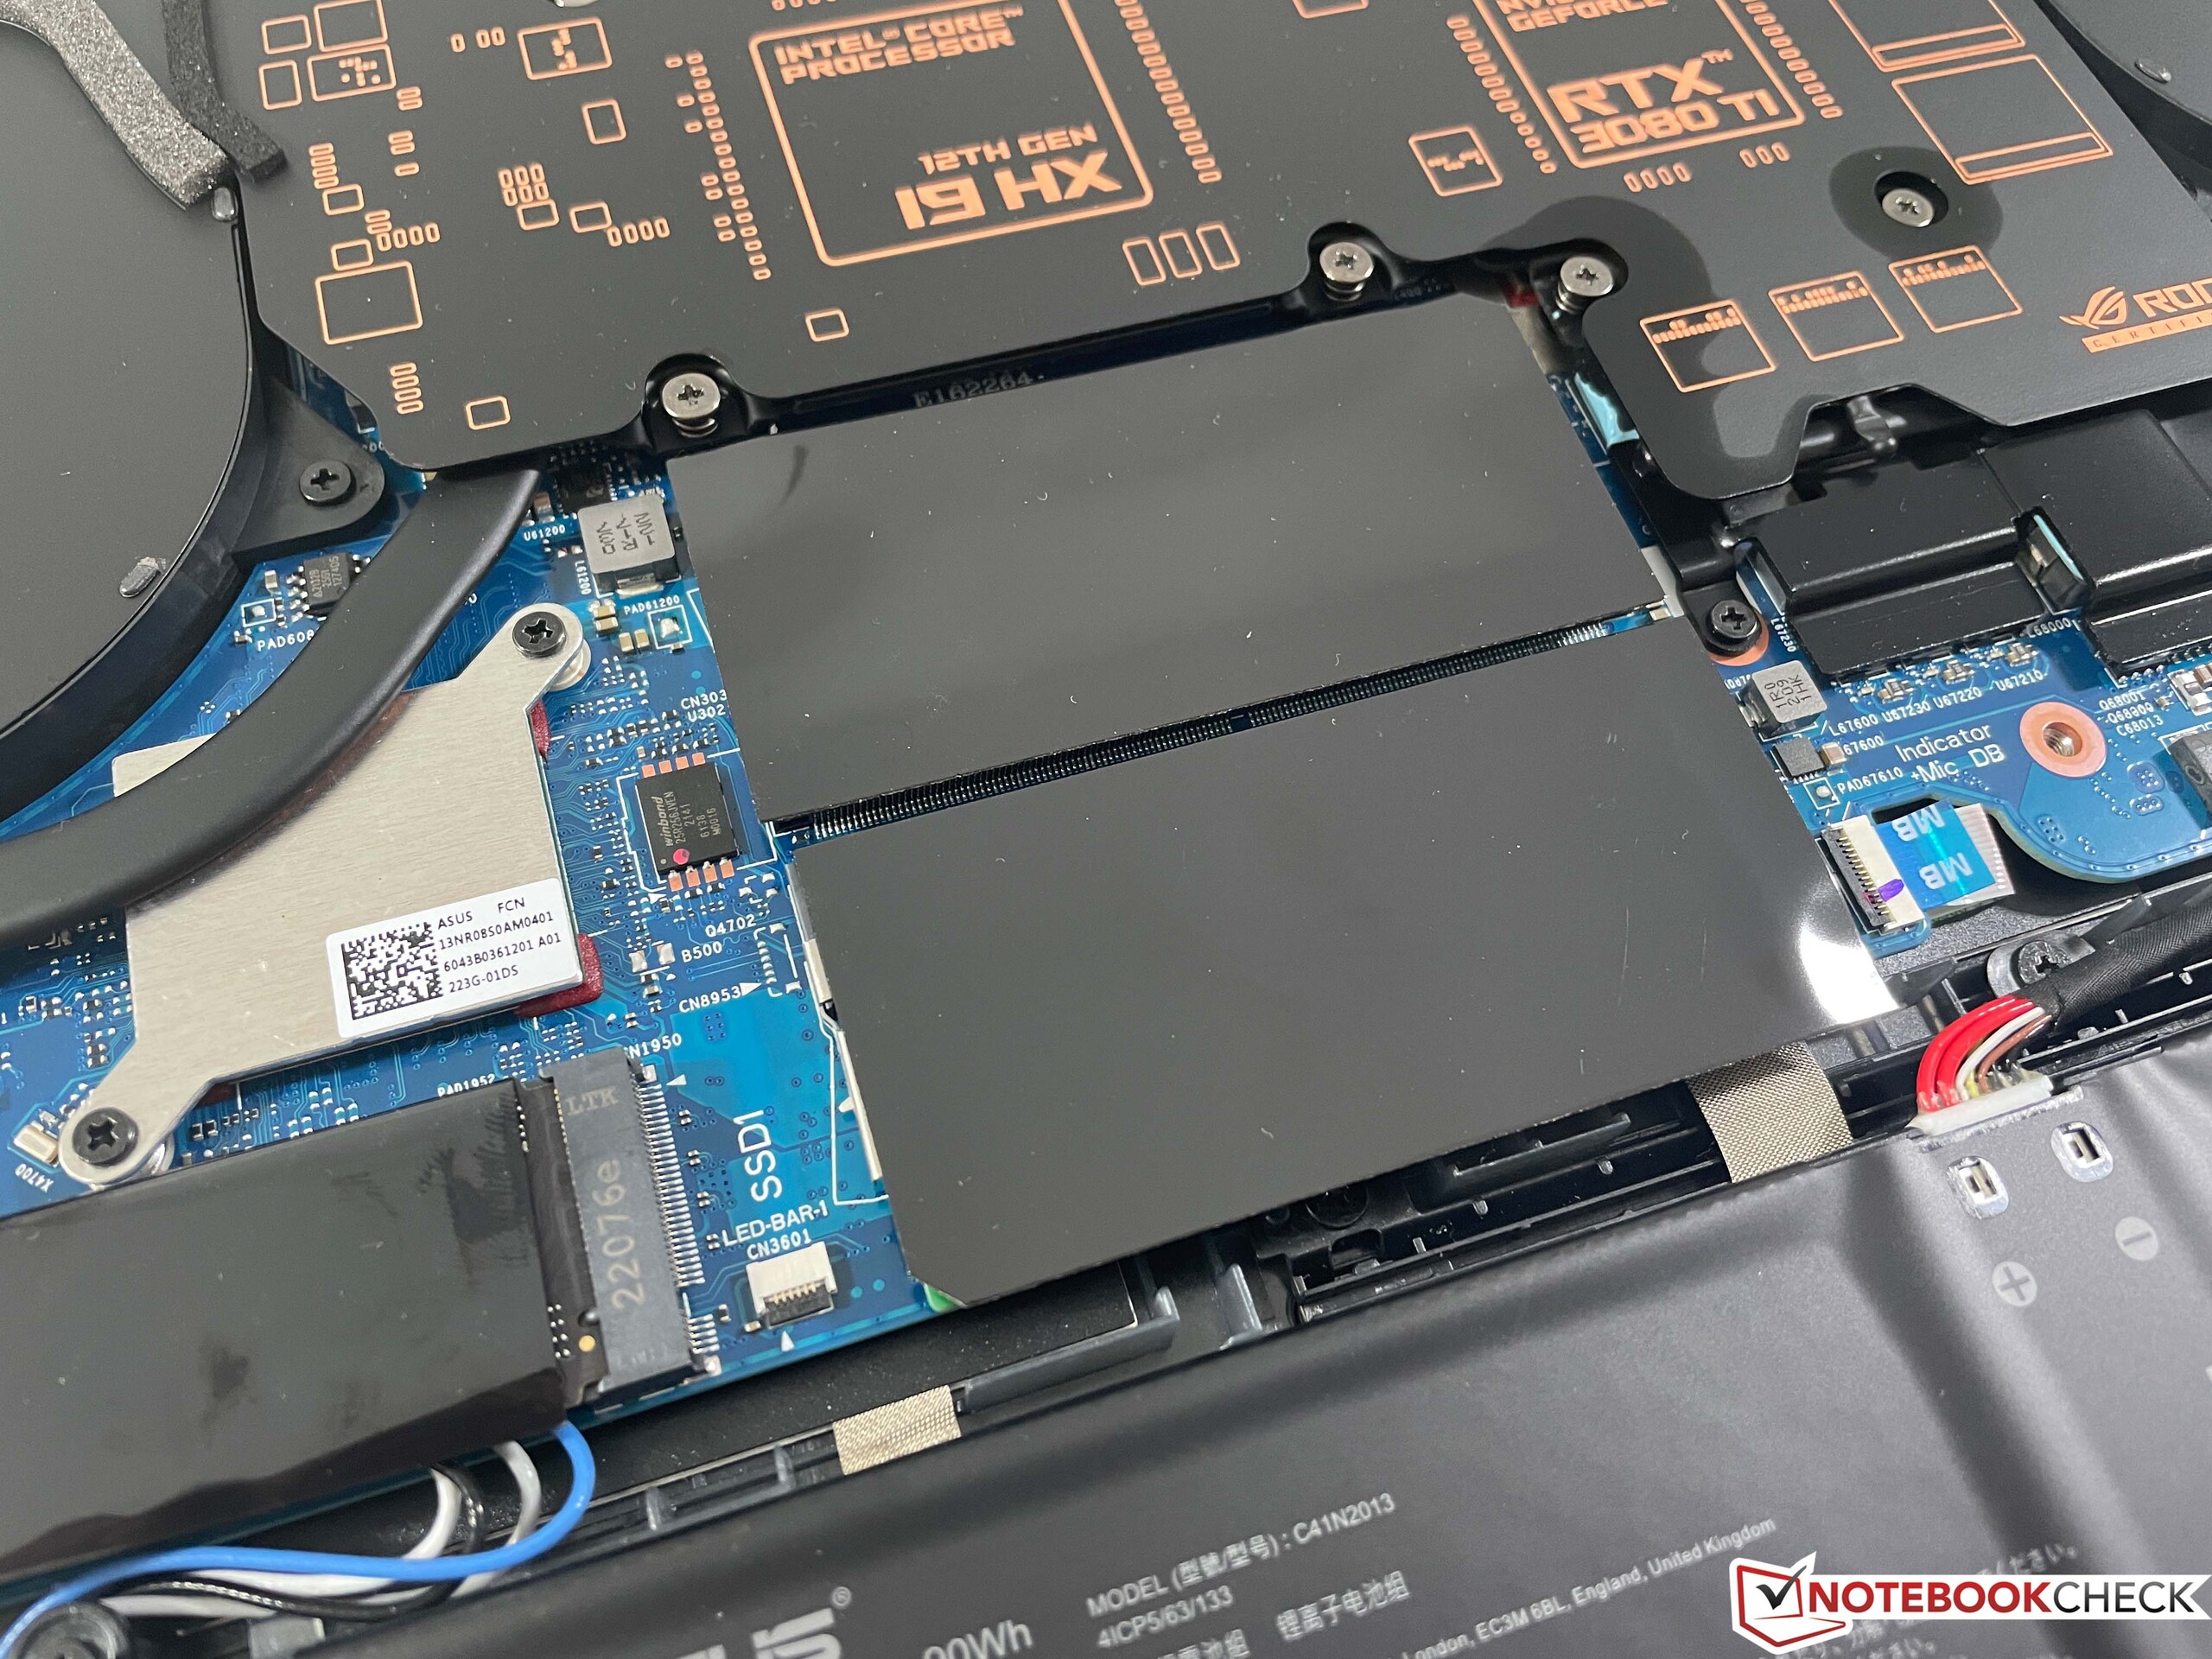
Även om det går att ta bort det nedre locket på fodralet måste man vara försiktig när man gör det. Eftersom belysningen är integrerad i delen måste du först koppla bort två små platta kablar, innan du kan ta bort locket. Med tillgång till fläktarna, de två SSD-enheterna, två RAM-moduler och WLAN-modulen är underhållsalternativen goda.
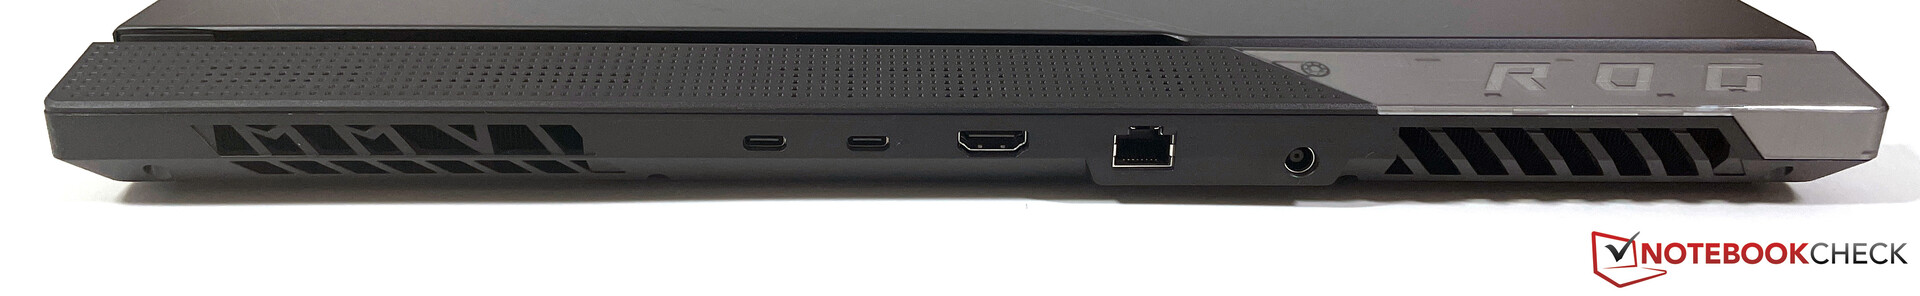
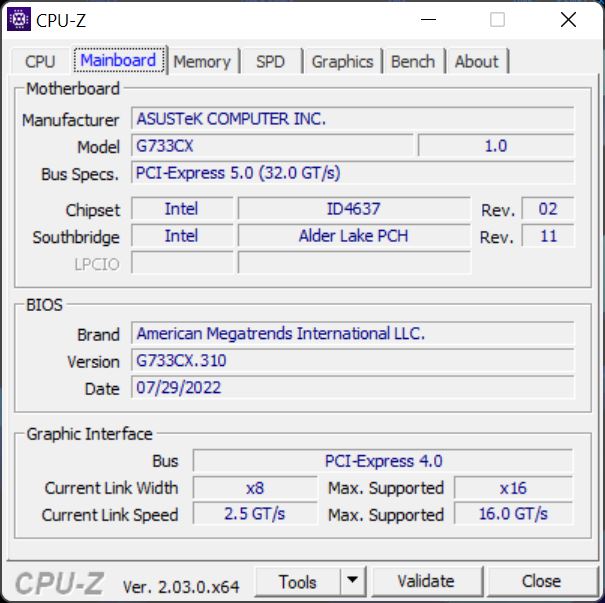
Utrustning - ROG Strix Scar 17 med HDMI 2.1 och Wi-Fi 6E
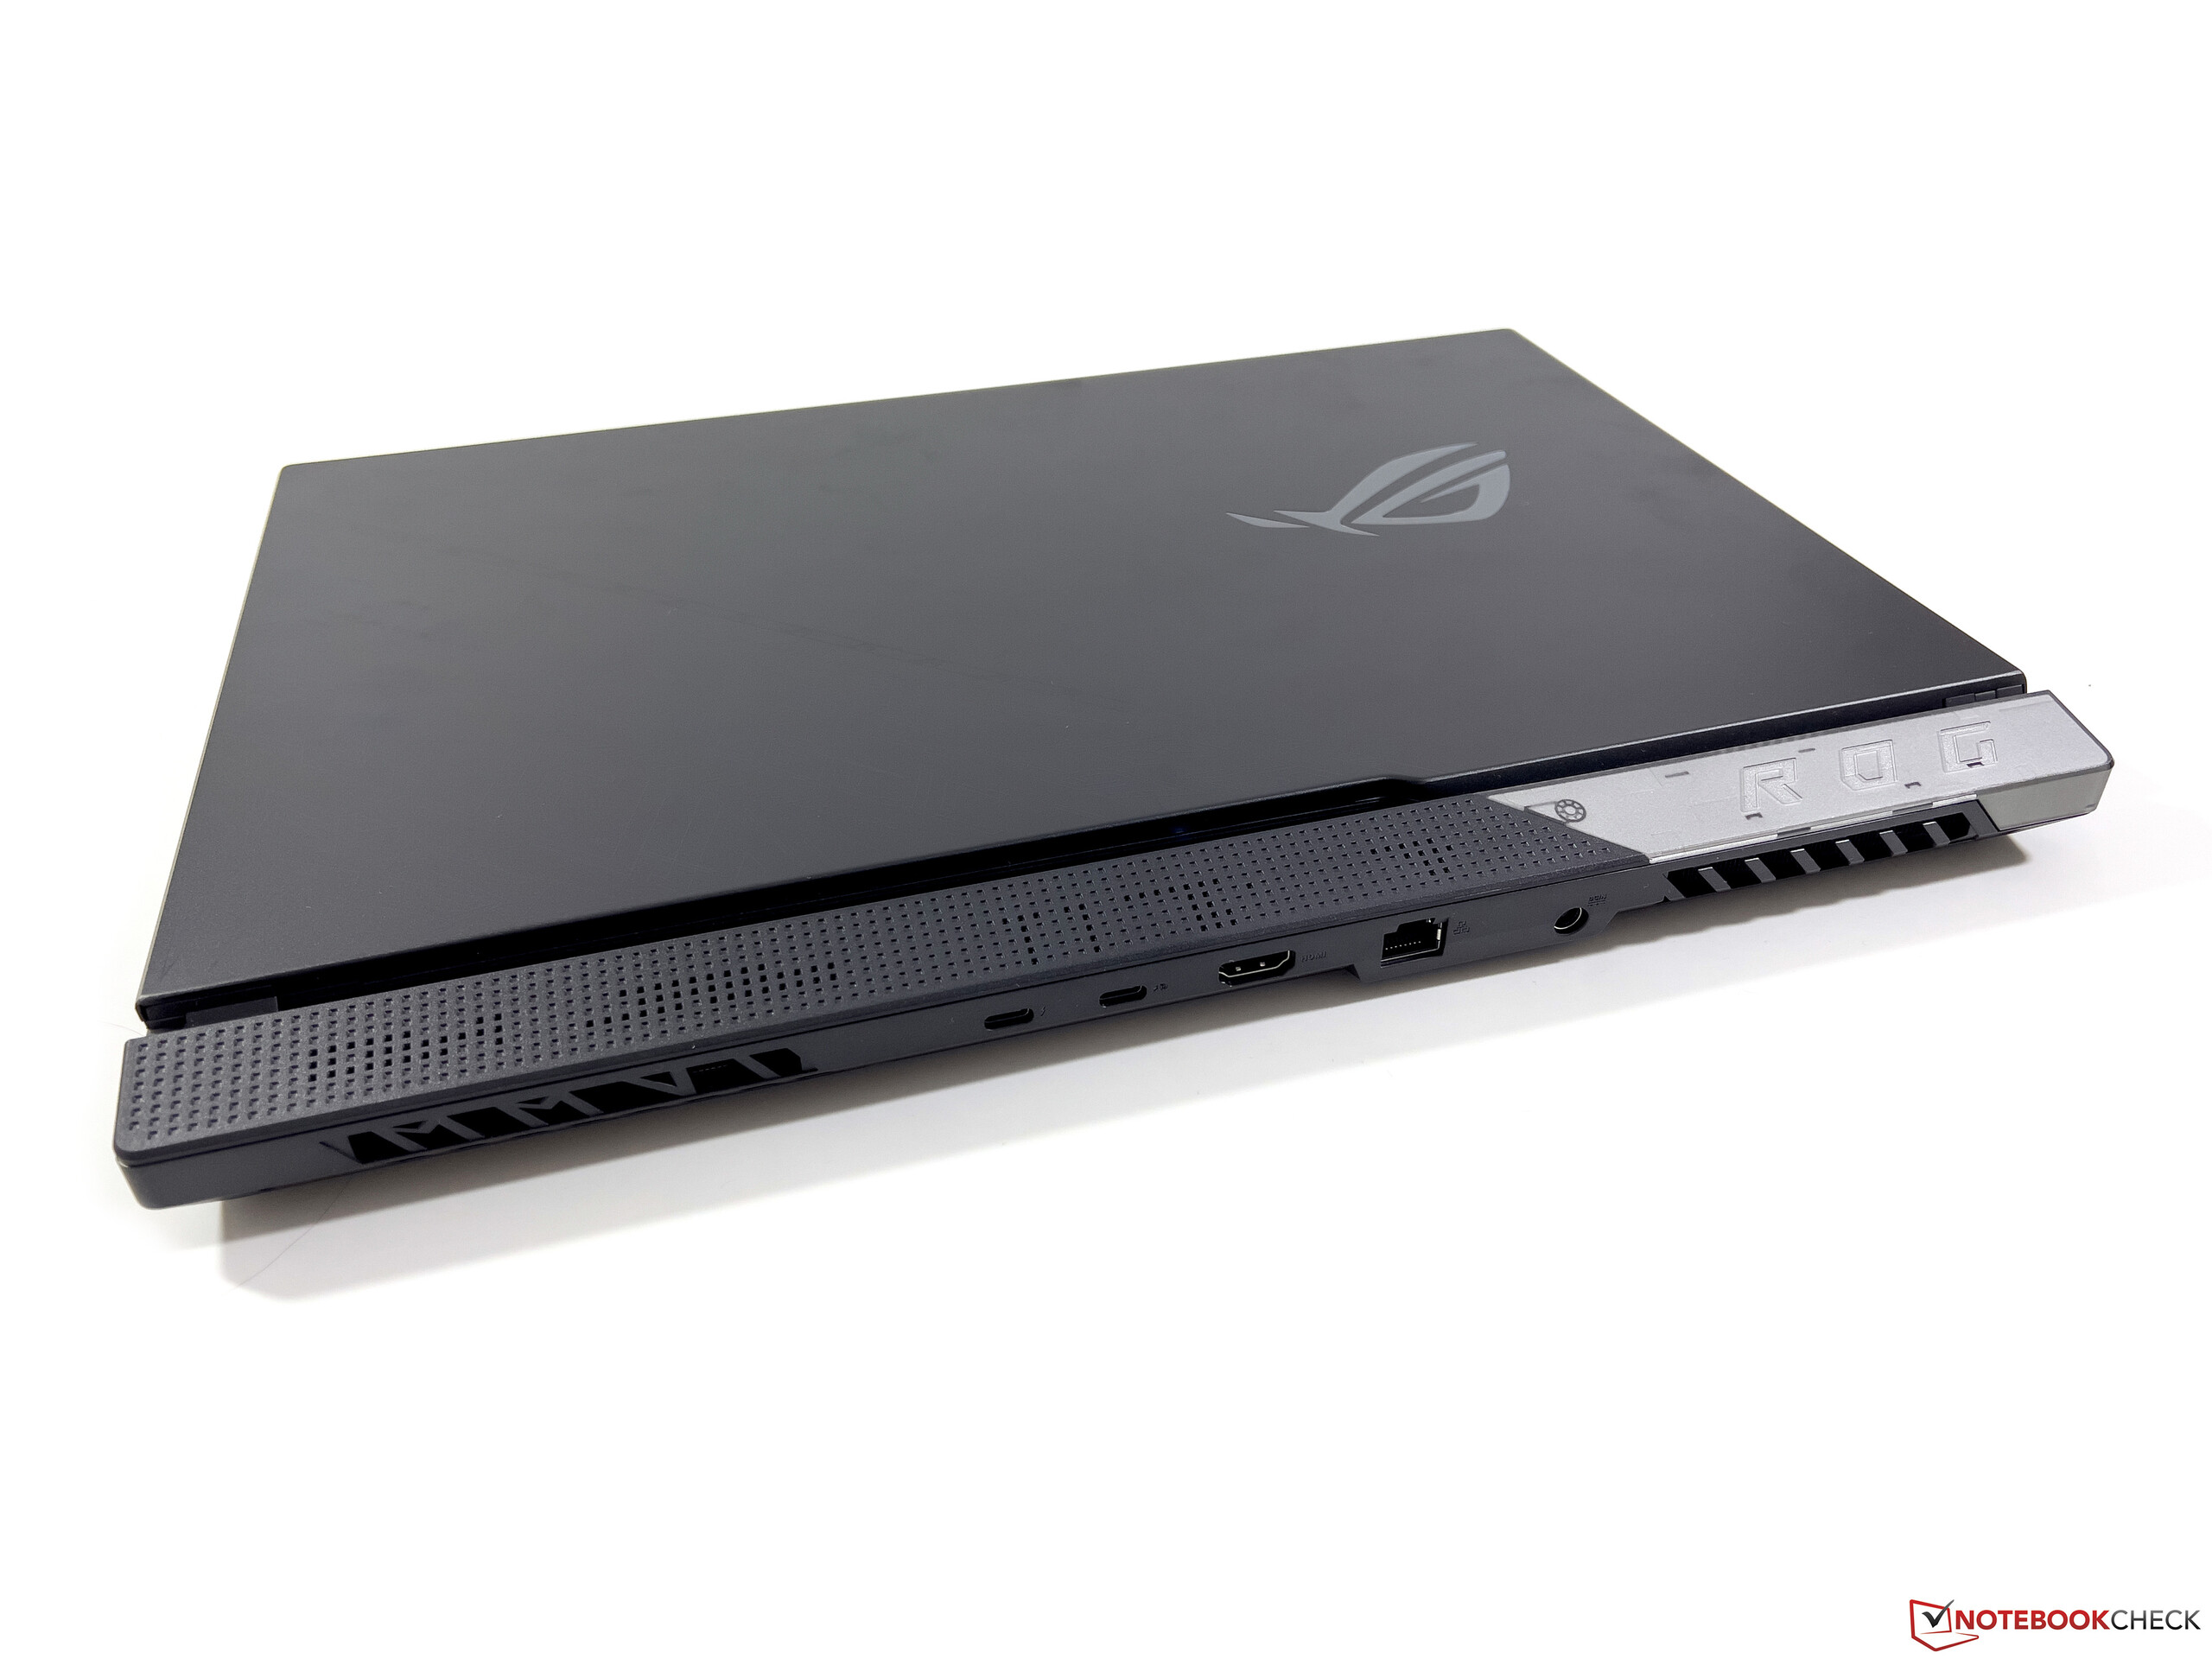
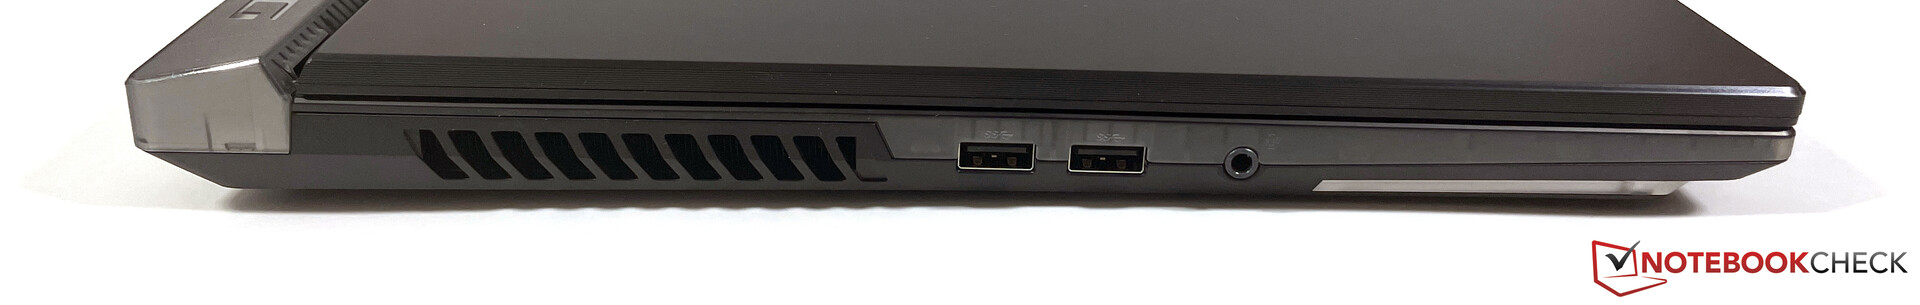
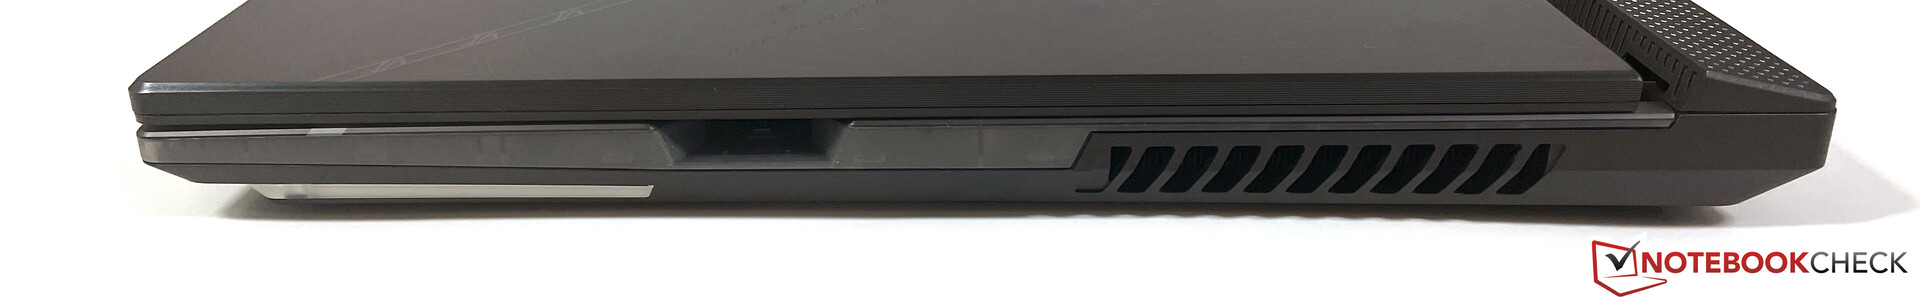
Förutom en Thunderbolt-anslutning har G733CX en HDMI 2.1-port, och USB-porten på baksidan kan också användas för laddning på vägen (max. 100 watt). De flesta anslutningarna finns på baksidan, och du hittar bara två vanliga USB-A-portar och 3,5-mm-ljudporten på vänster sida. På höger sida finns också en plats för Asus Keystone, så att du kan lagra systeminställningar och data.
WLAN-prestandan med Intel AX211 är mycket bra, och vi kunde även ansluta till 6 GHz-nätverket i vår referensrouter från Asus utan problem. Det finns även en Ethernet-anslutning med 2,5 Gbit/s för trådbundna anslutningar. Användare av ROG Strix Scar 17 måste klara sig utan webbkamera, men vid behov erbjuder tillverkaren en motsvarande extern webbkamera (ROG Eye S).
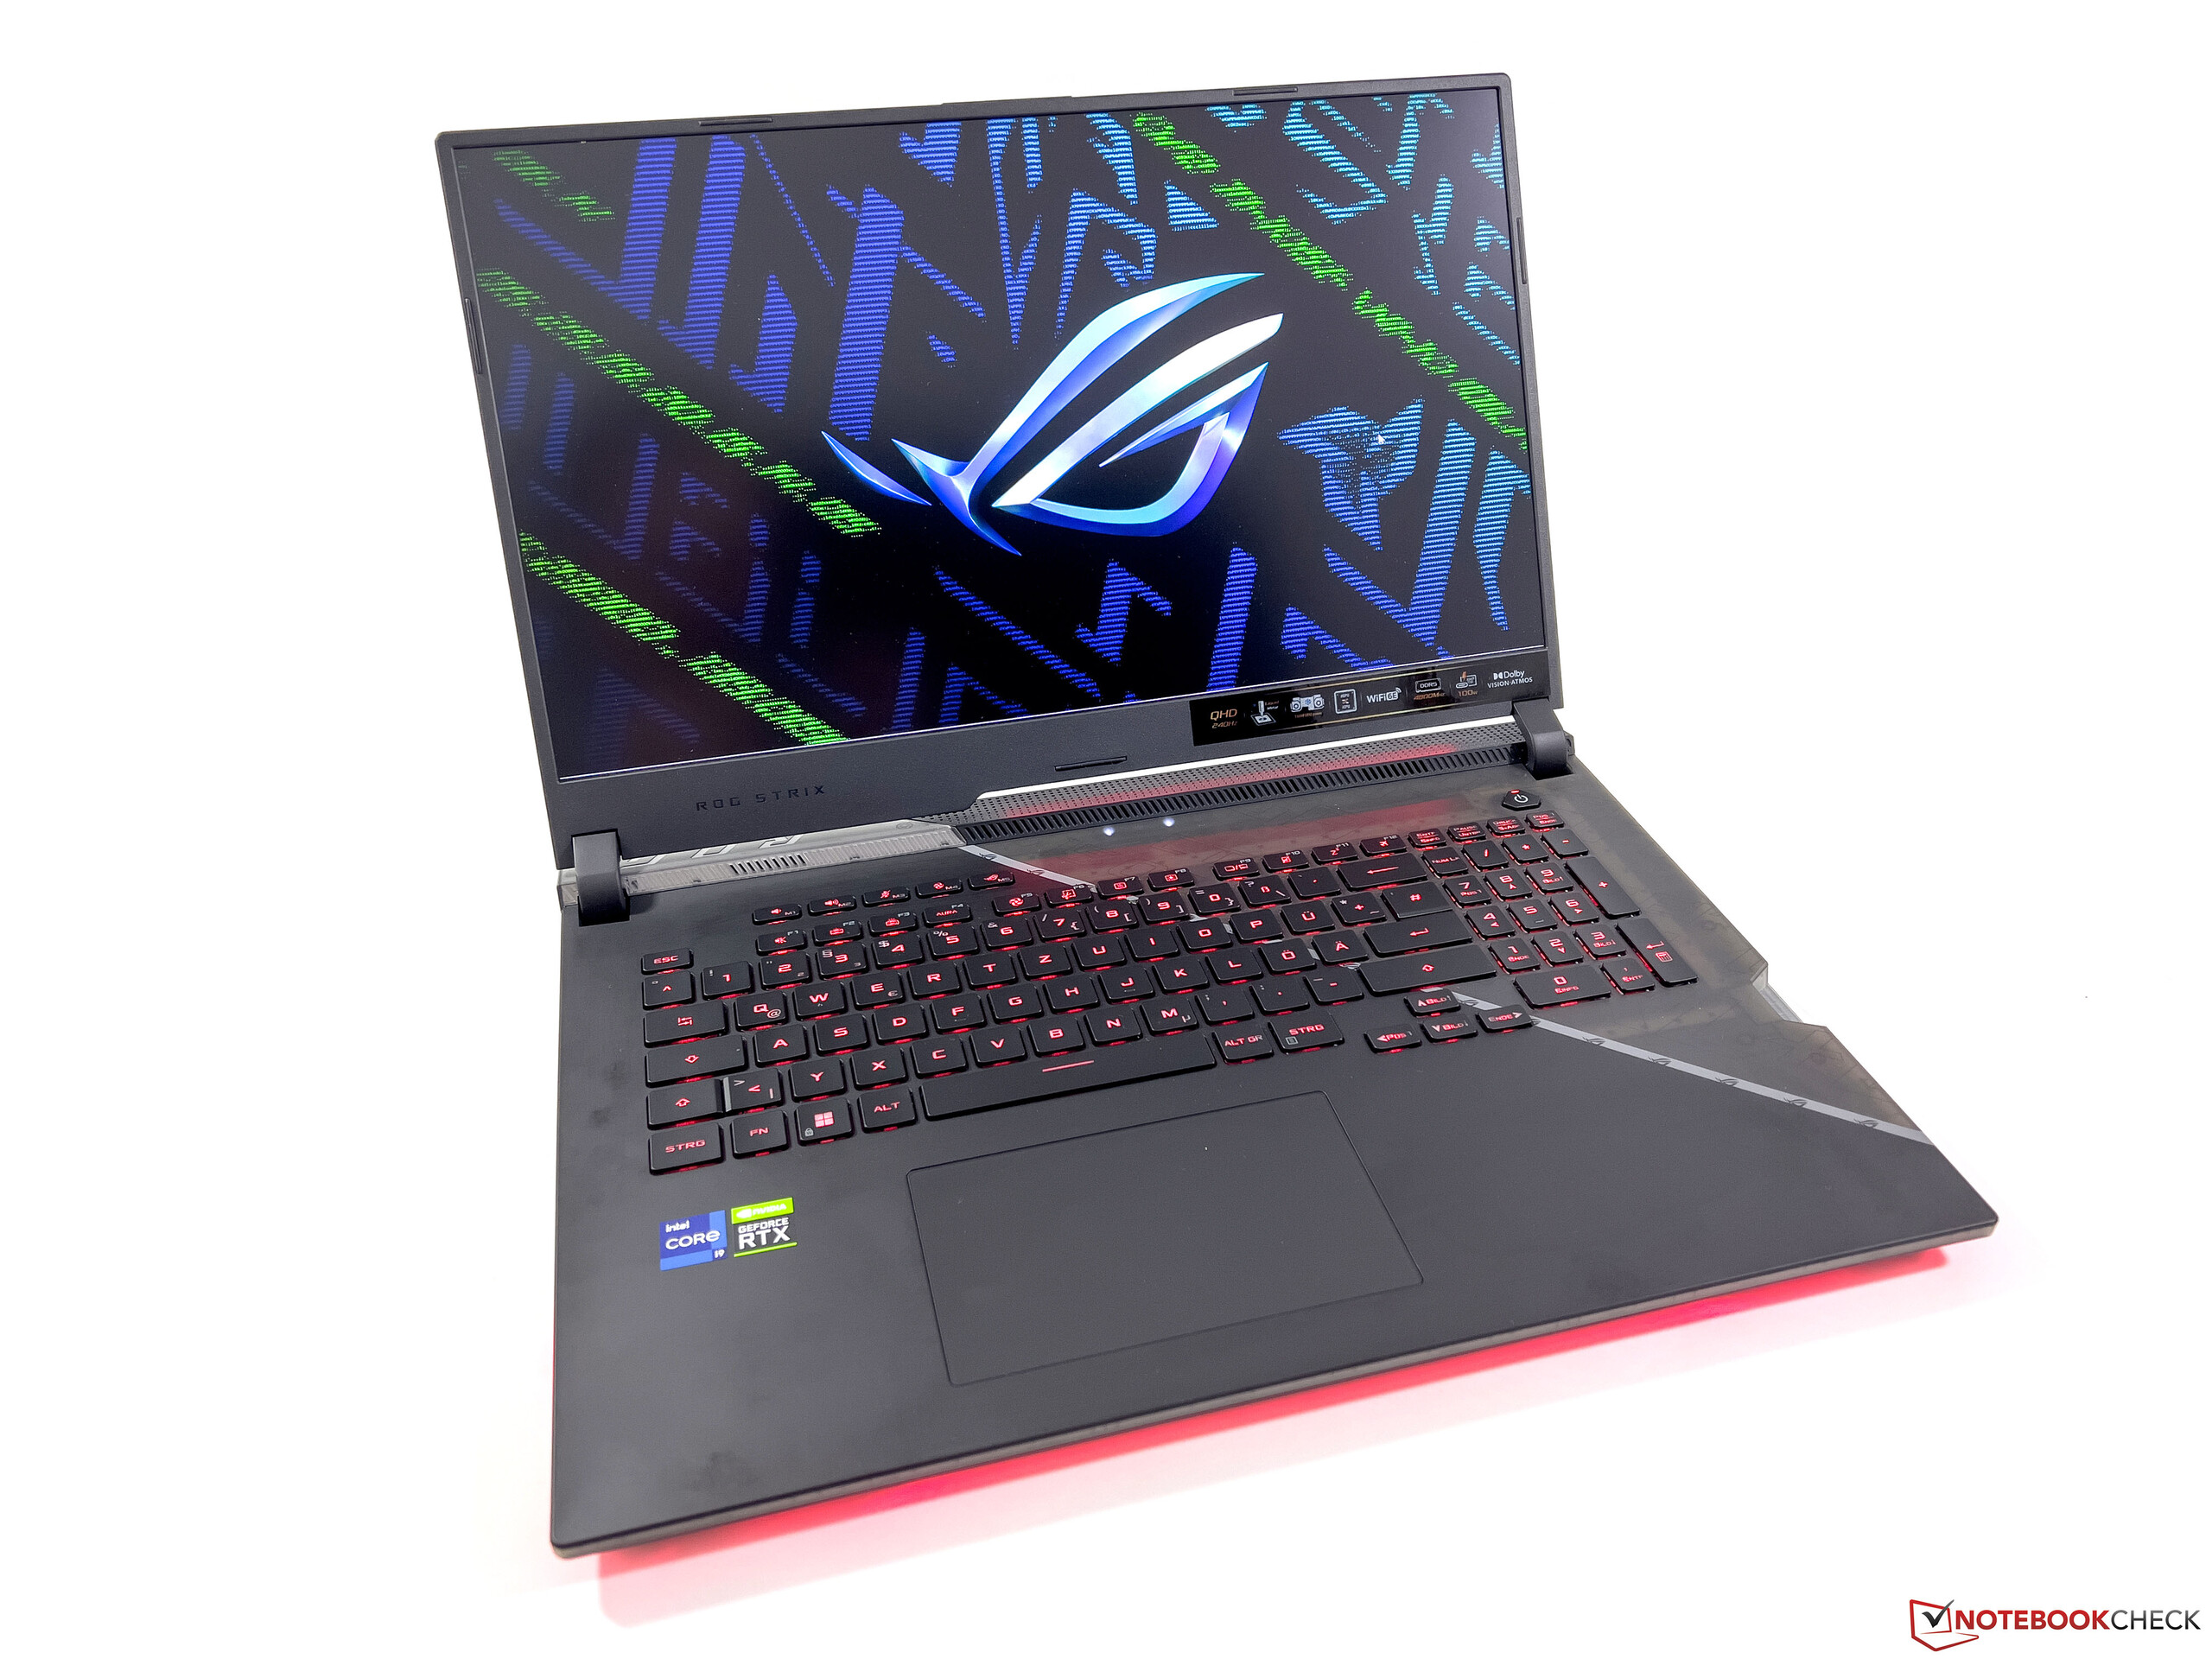
Inmatningsenheter - Asus har ett bra tangentbord
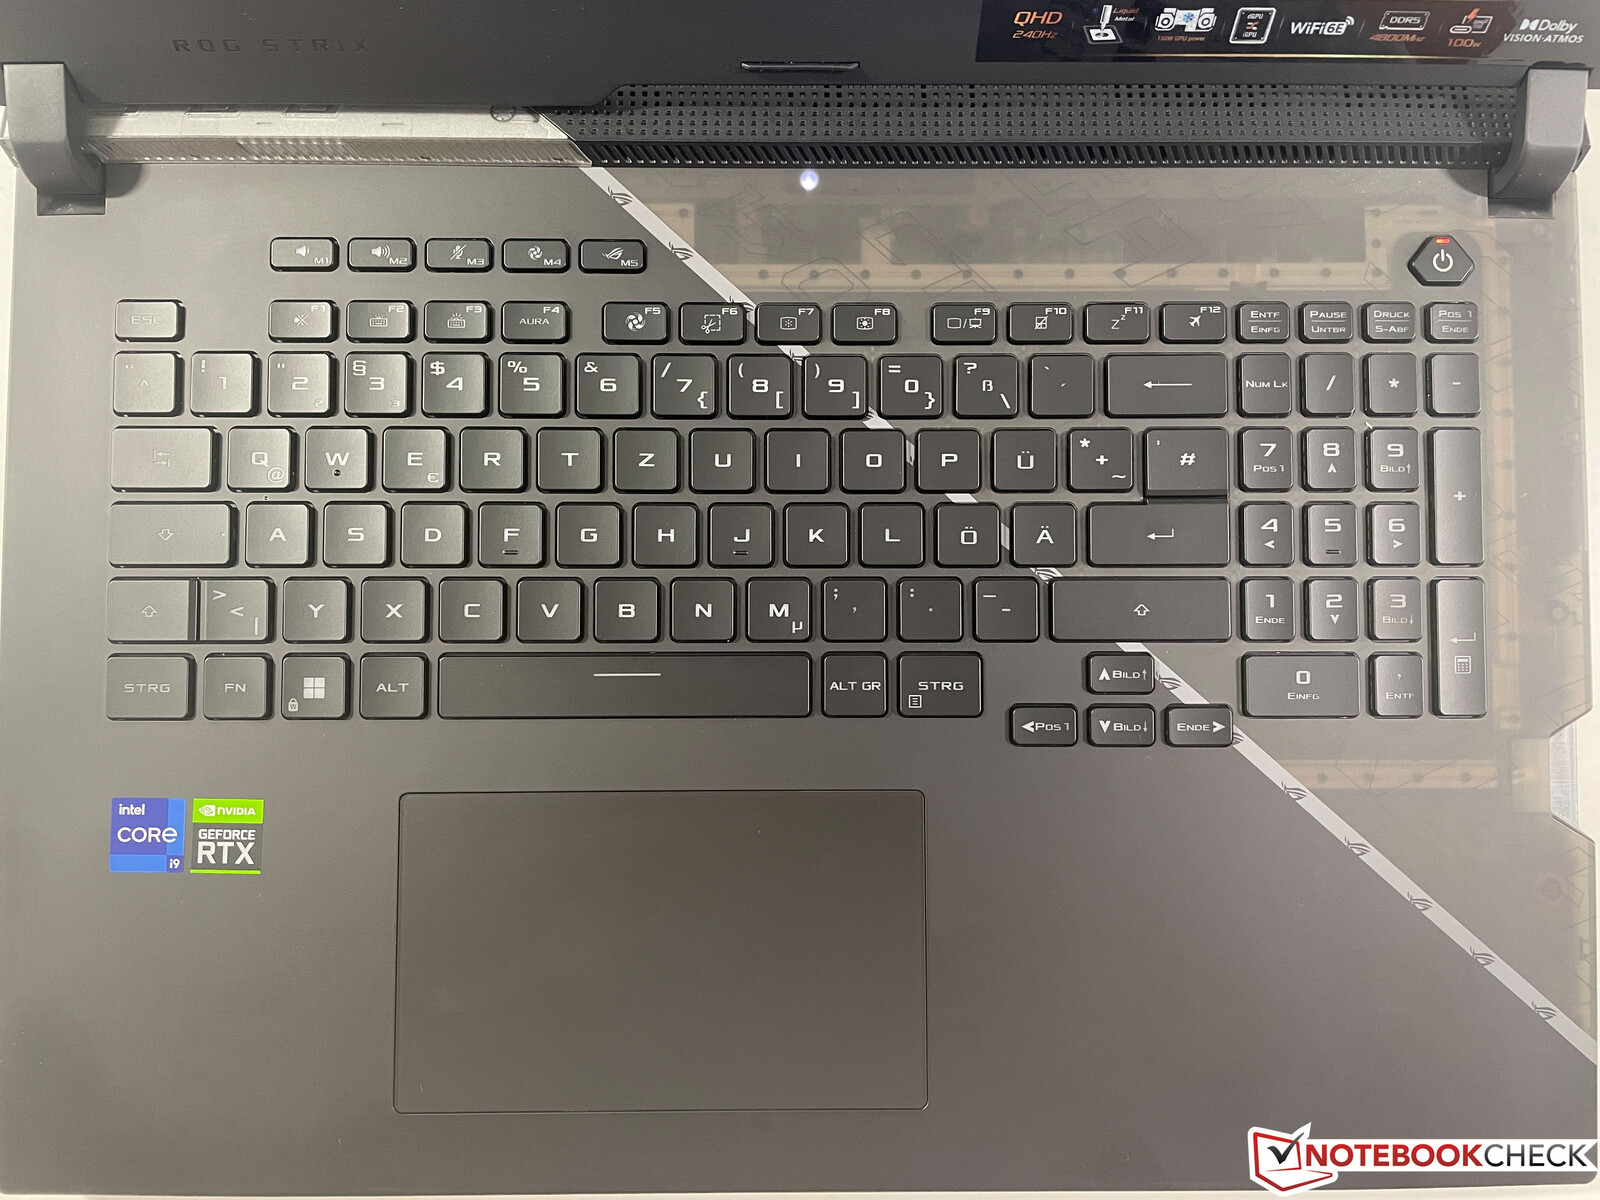
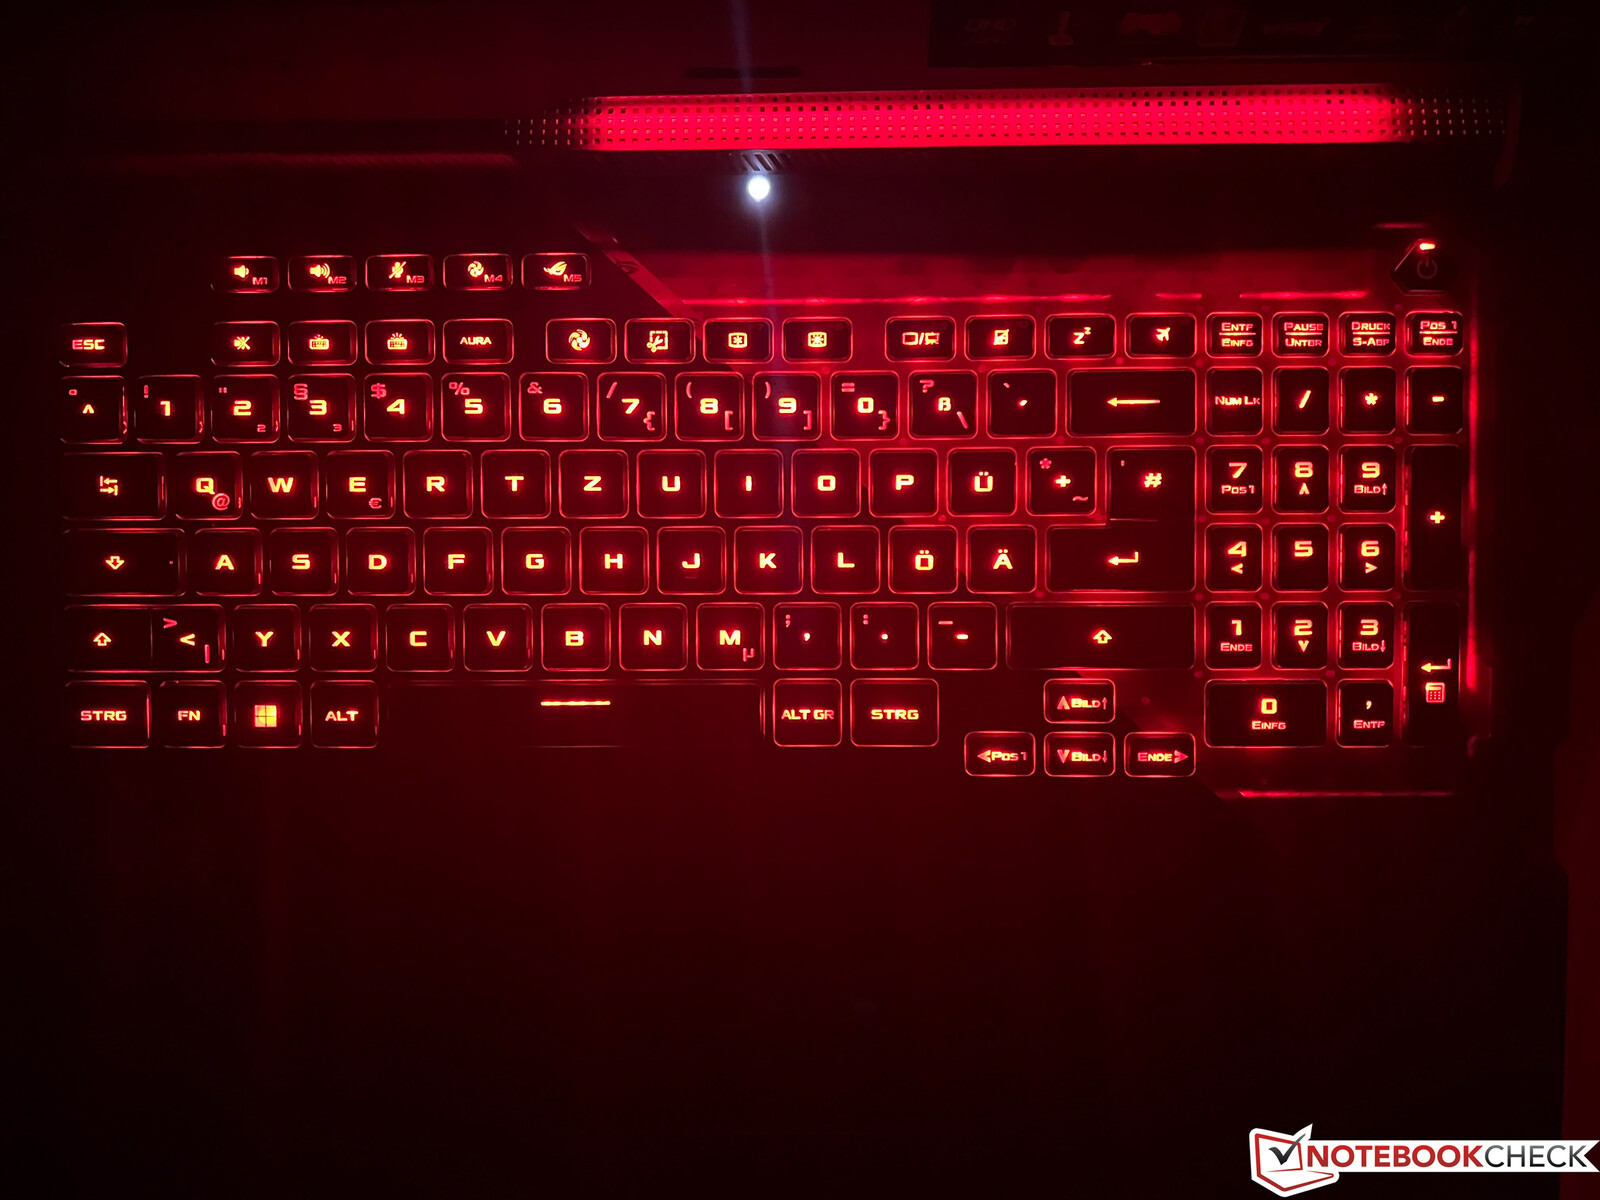
Asus har ändrat tangentbordslayouten igen och använder nu en mer konventionell layout med mindre specialknappar. Det finns också ett "vanligt" nummerblock igen, vilket också innebär att piltangenterna har flyttats något till vänster och nu är mindre. Det är inte alla användare som skulle gilla detta. Kvaliteten på tangentbordet är dock mycket bra med den långa navet på 2 mm, och du kan gå loss på belysningen, som gör att du kan konfigurera varje tangent separat, inklusive spelspecifika lägen via AuraSync-tekniken. Den stora ClickPad erbjuder bra glidegenskaper och fungerar tillförlitligt, men den är också ganska högljudd när du trycker på den.
Skärm - QHD med 240 Hz
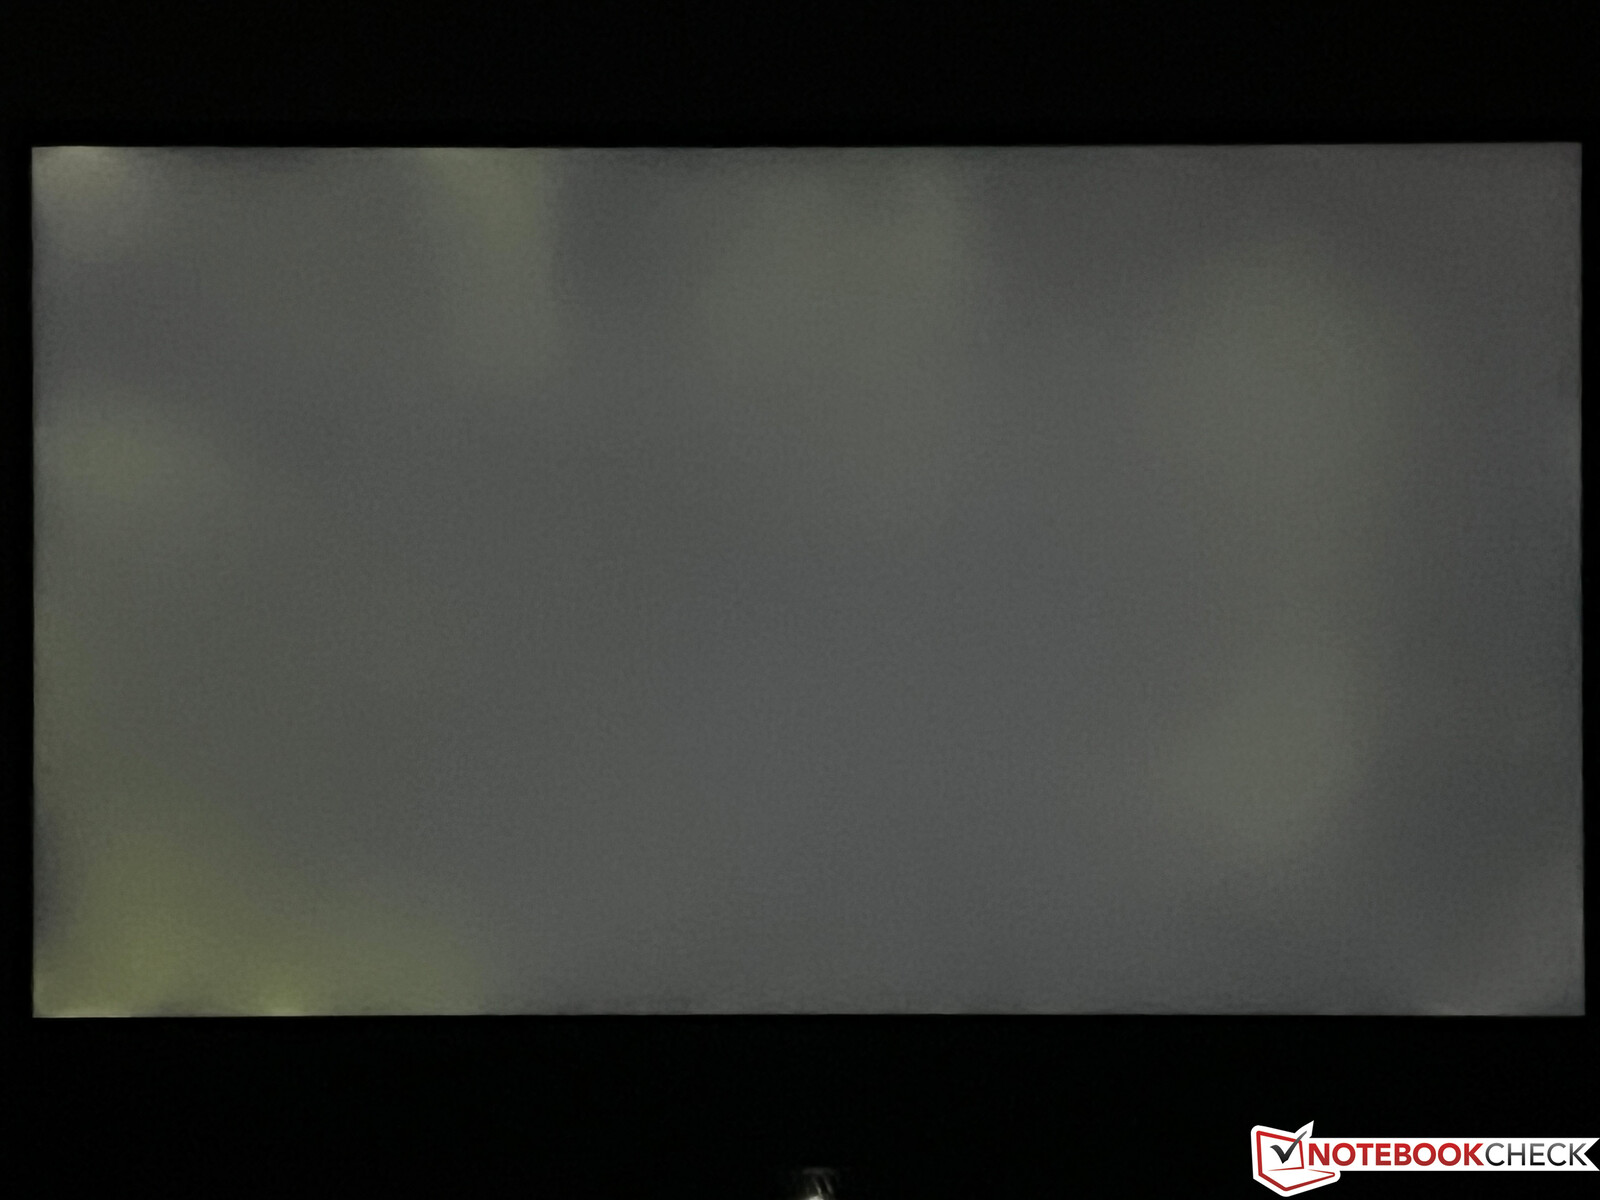
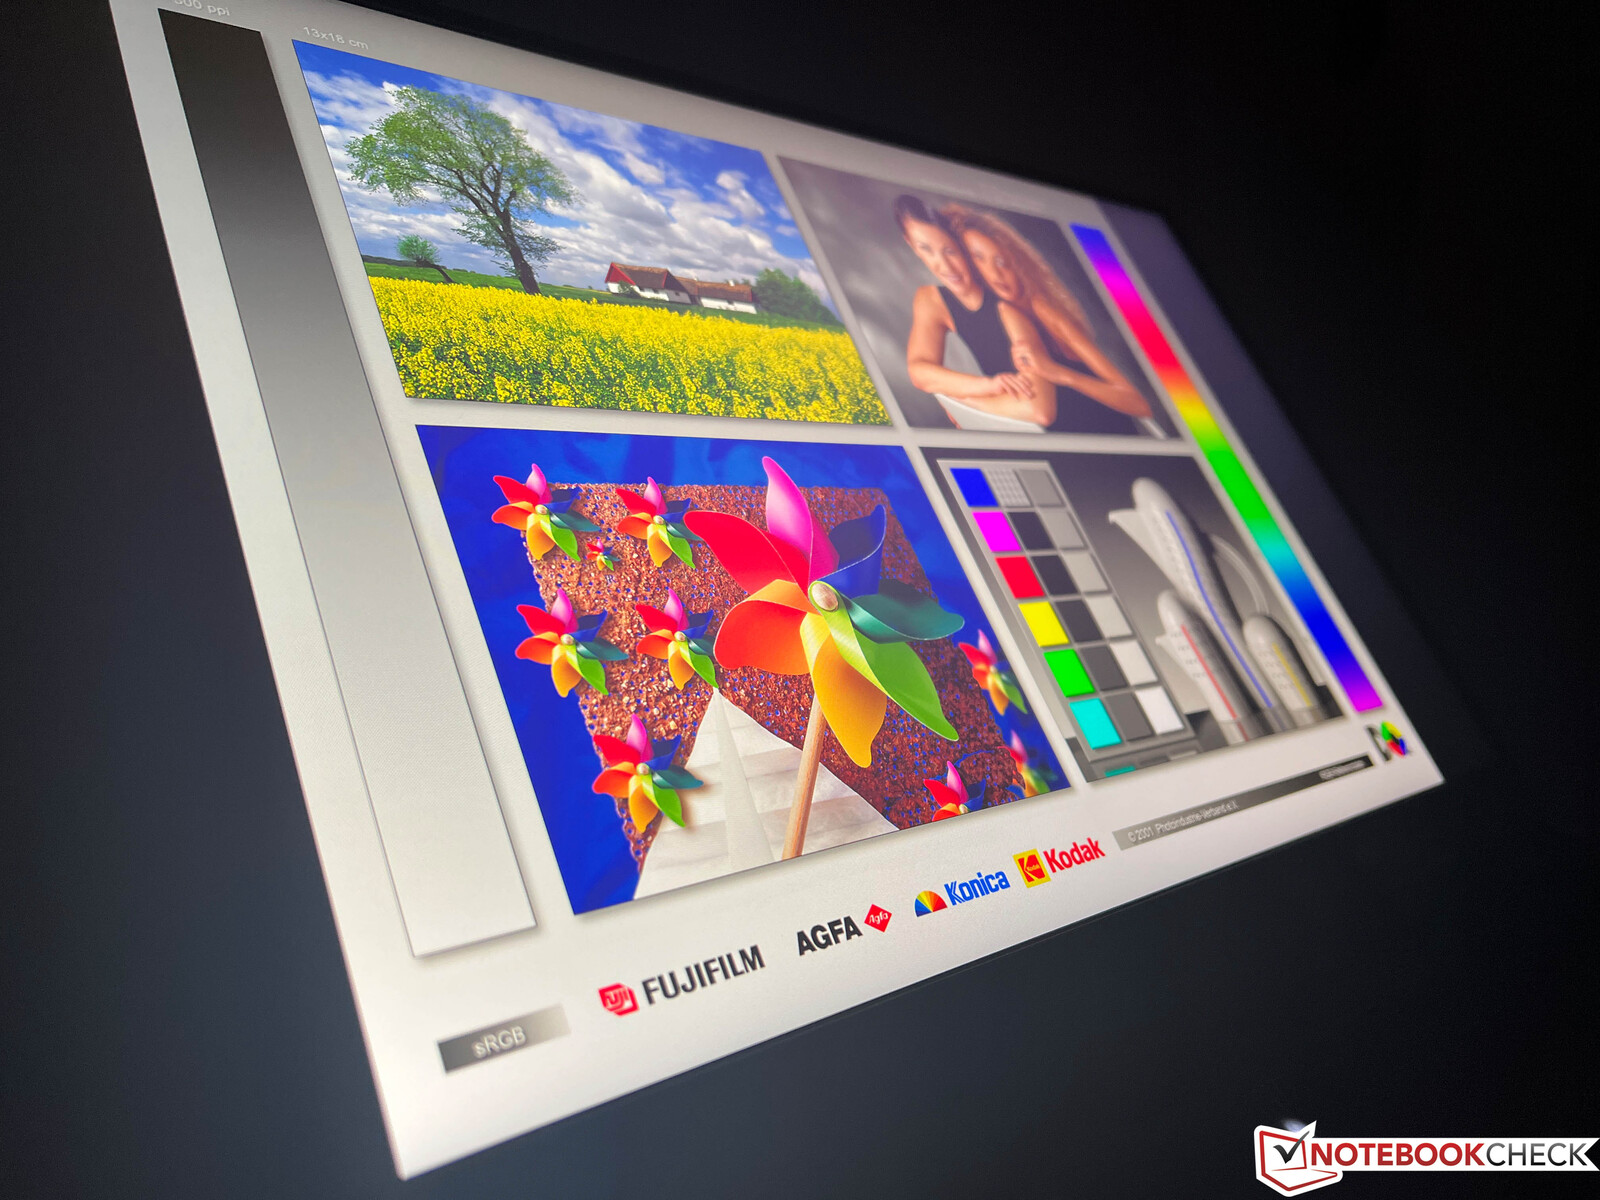
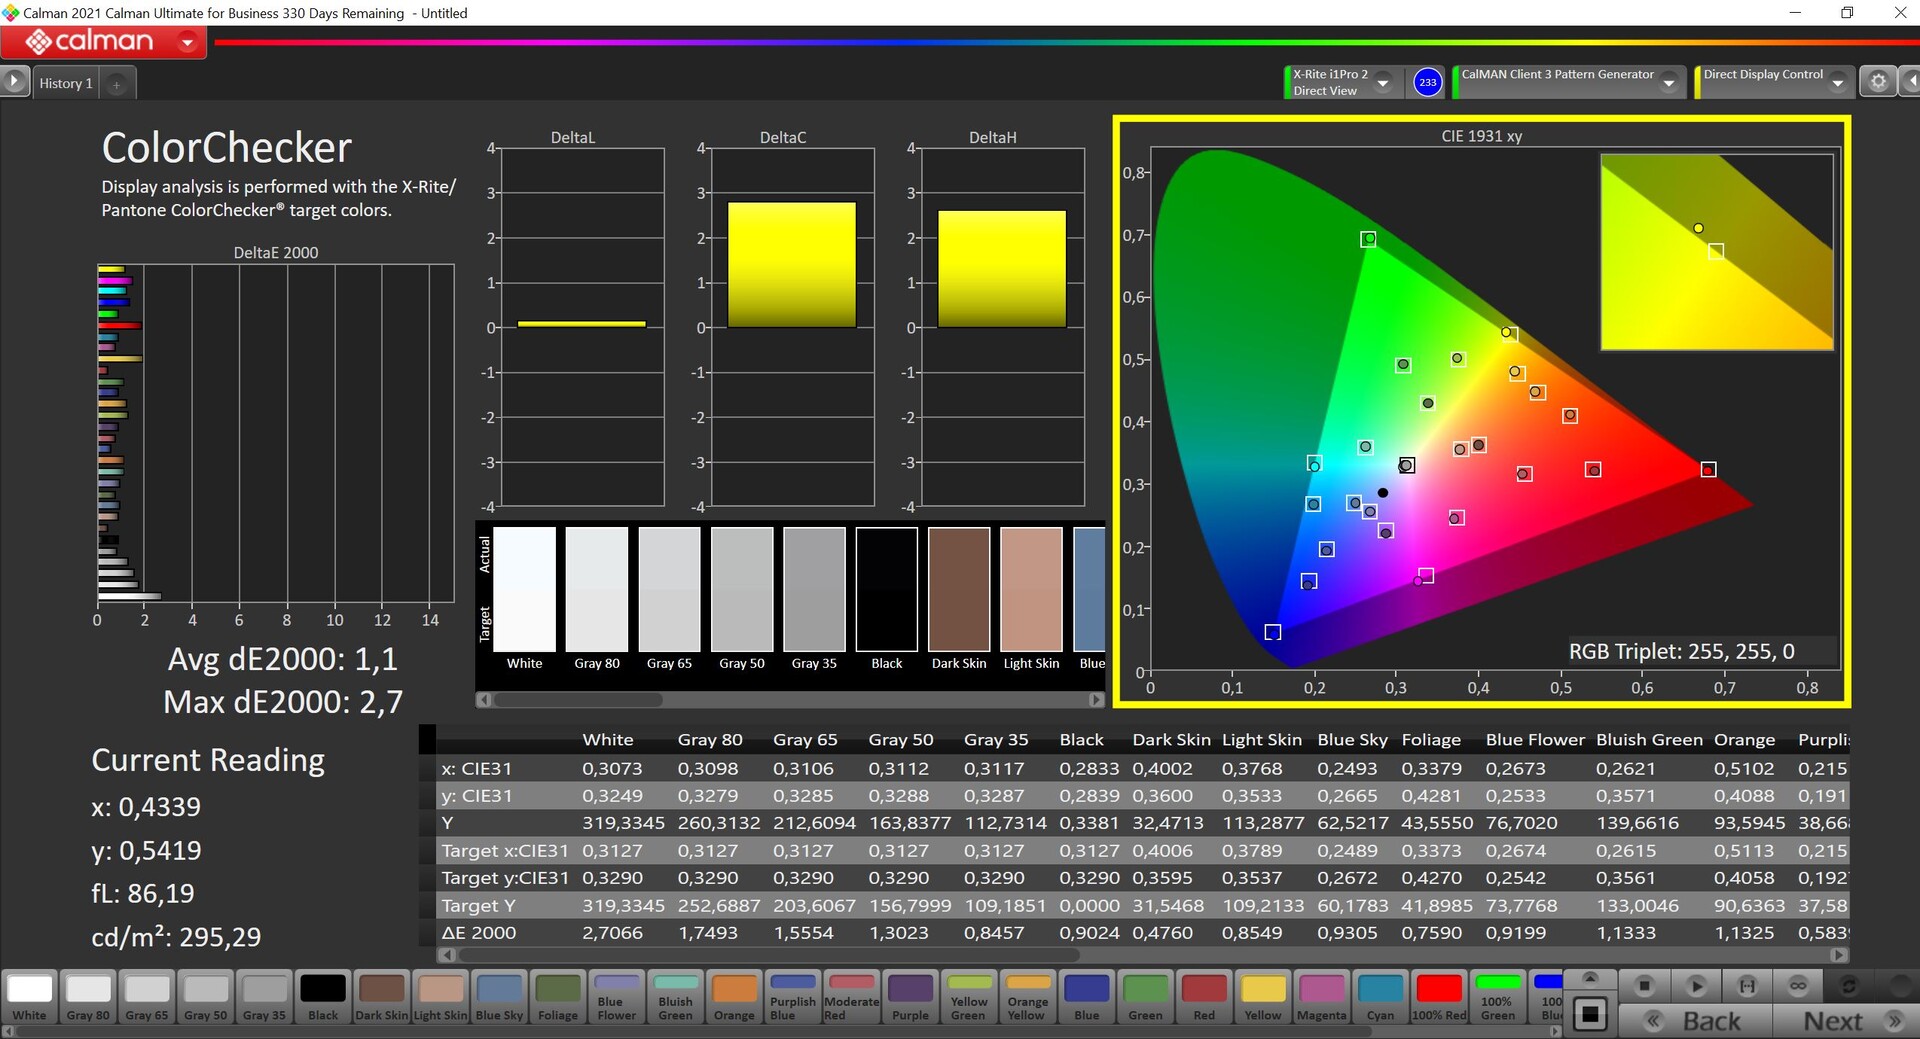
Förutom Full-HD-panelen med 360 Hz som vi testade i förra årets Scar 17 G733QSerbjuder Asus även en QHD-panel med 240 Hz uppdateringsfrekvens, vilket är panelen i vår testenhet. Det subjektiva bildintrycket av den matta IPS-panelen (2560 x 1440 pixlar, 16:9) är mycket bra, och förutom Dolby Vision HDR stöds även Adaptive Sync. Svarstiderna är extremt snabba och PWM används inte. Ljusstyrkan ligger på cirka 300 cd/m² i genomsnitt, vilket också är samma nivå som Full-HD-panelen med 360 Hz. Å andra sidan är svartvärdet lite högt, vilket också resulterar i ett mediokert kontrastförhållande på cirka 1 000:1.
| |||||||||||||||||||||||||
Distribution av ljusstyrkan: 87 %
Mitt på batteriet: 320 cd/m²
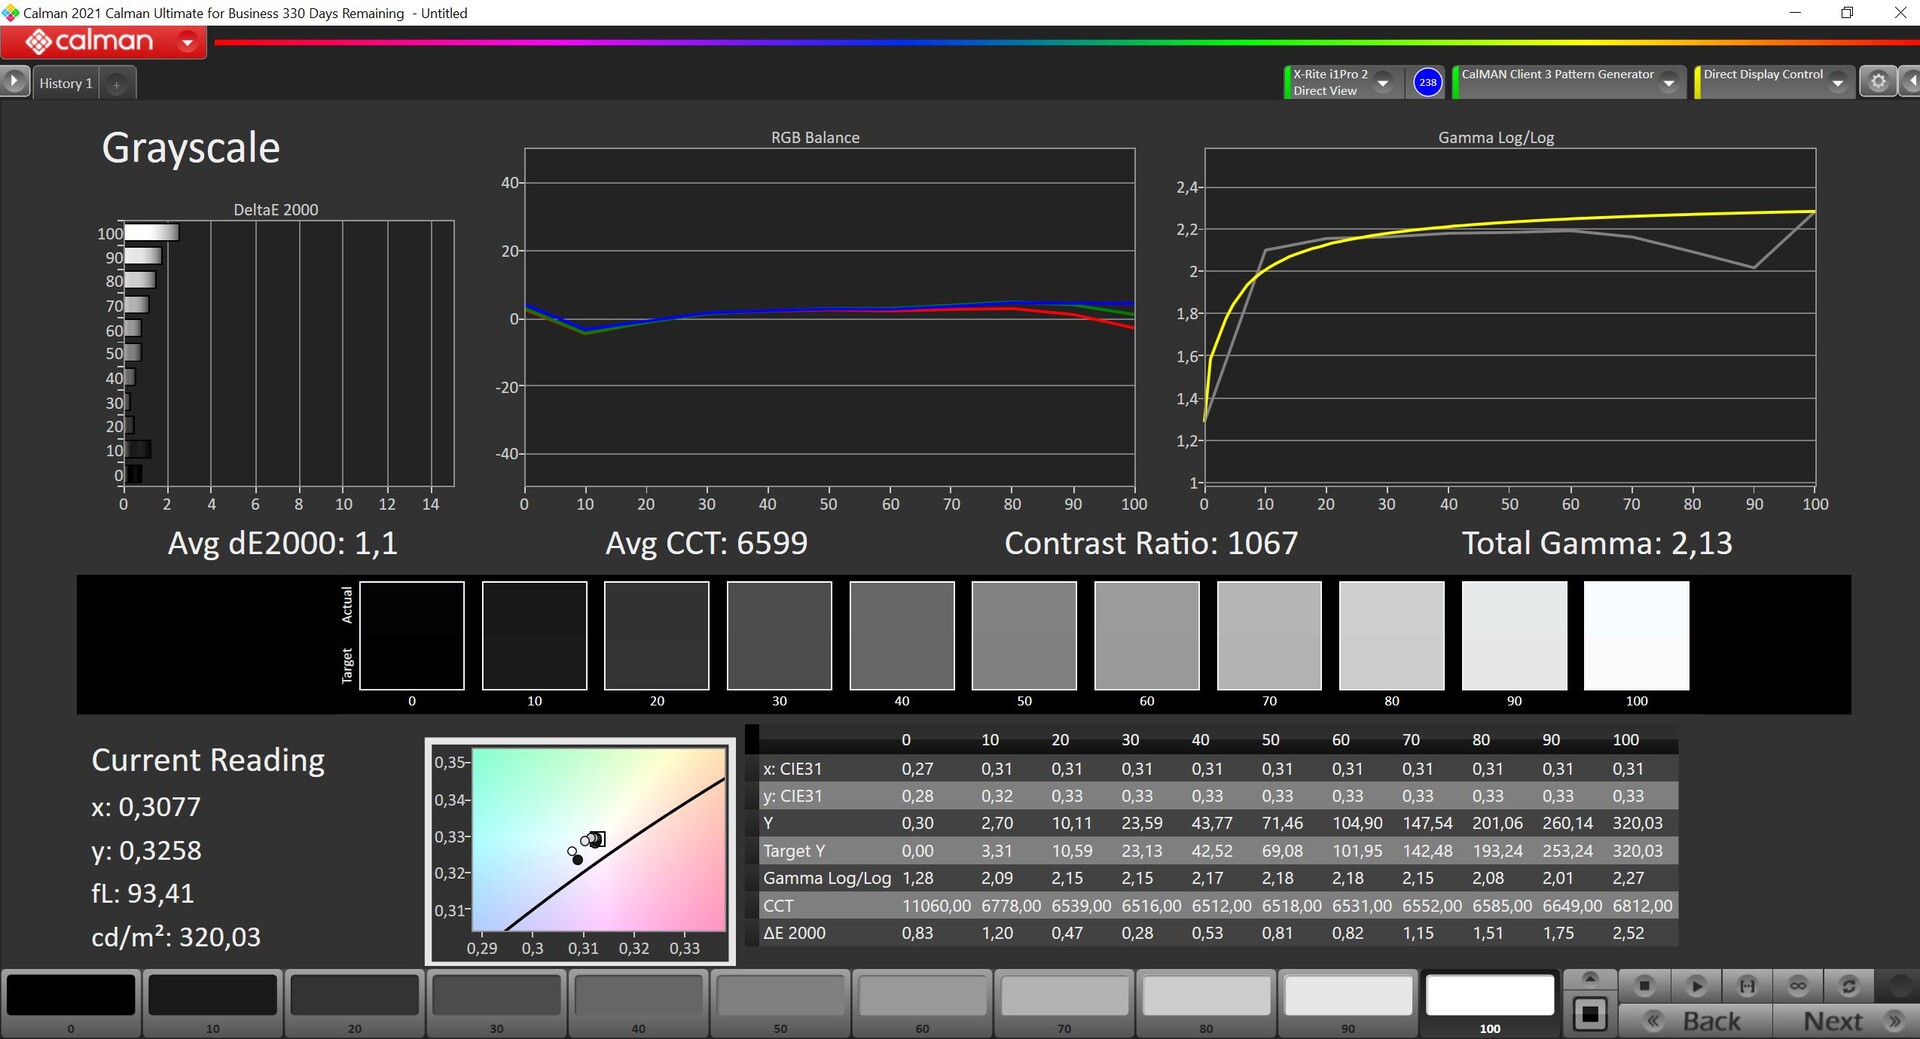
Kontrast: 1067:1 (Svärta: 0.3 cd/m²)
ΔE ColorChecker Calman: 1.1 | ∀{0.5-29.43 Ø4.73}
ΔE Greyscale Calman: 1.1 | ∀{0.09-98 Ø4.97}
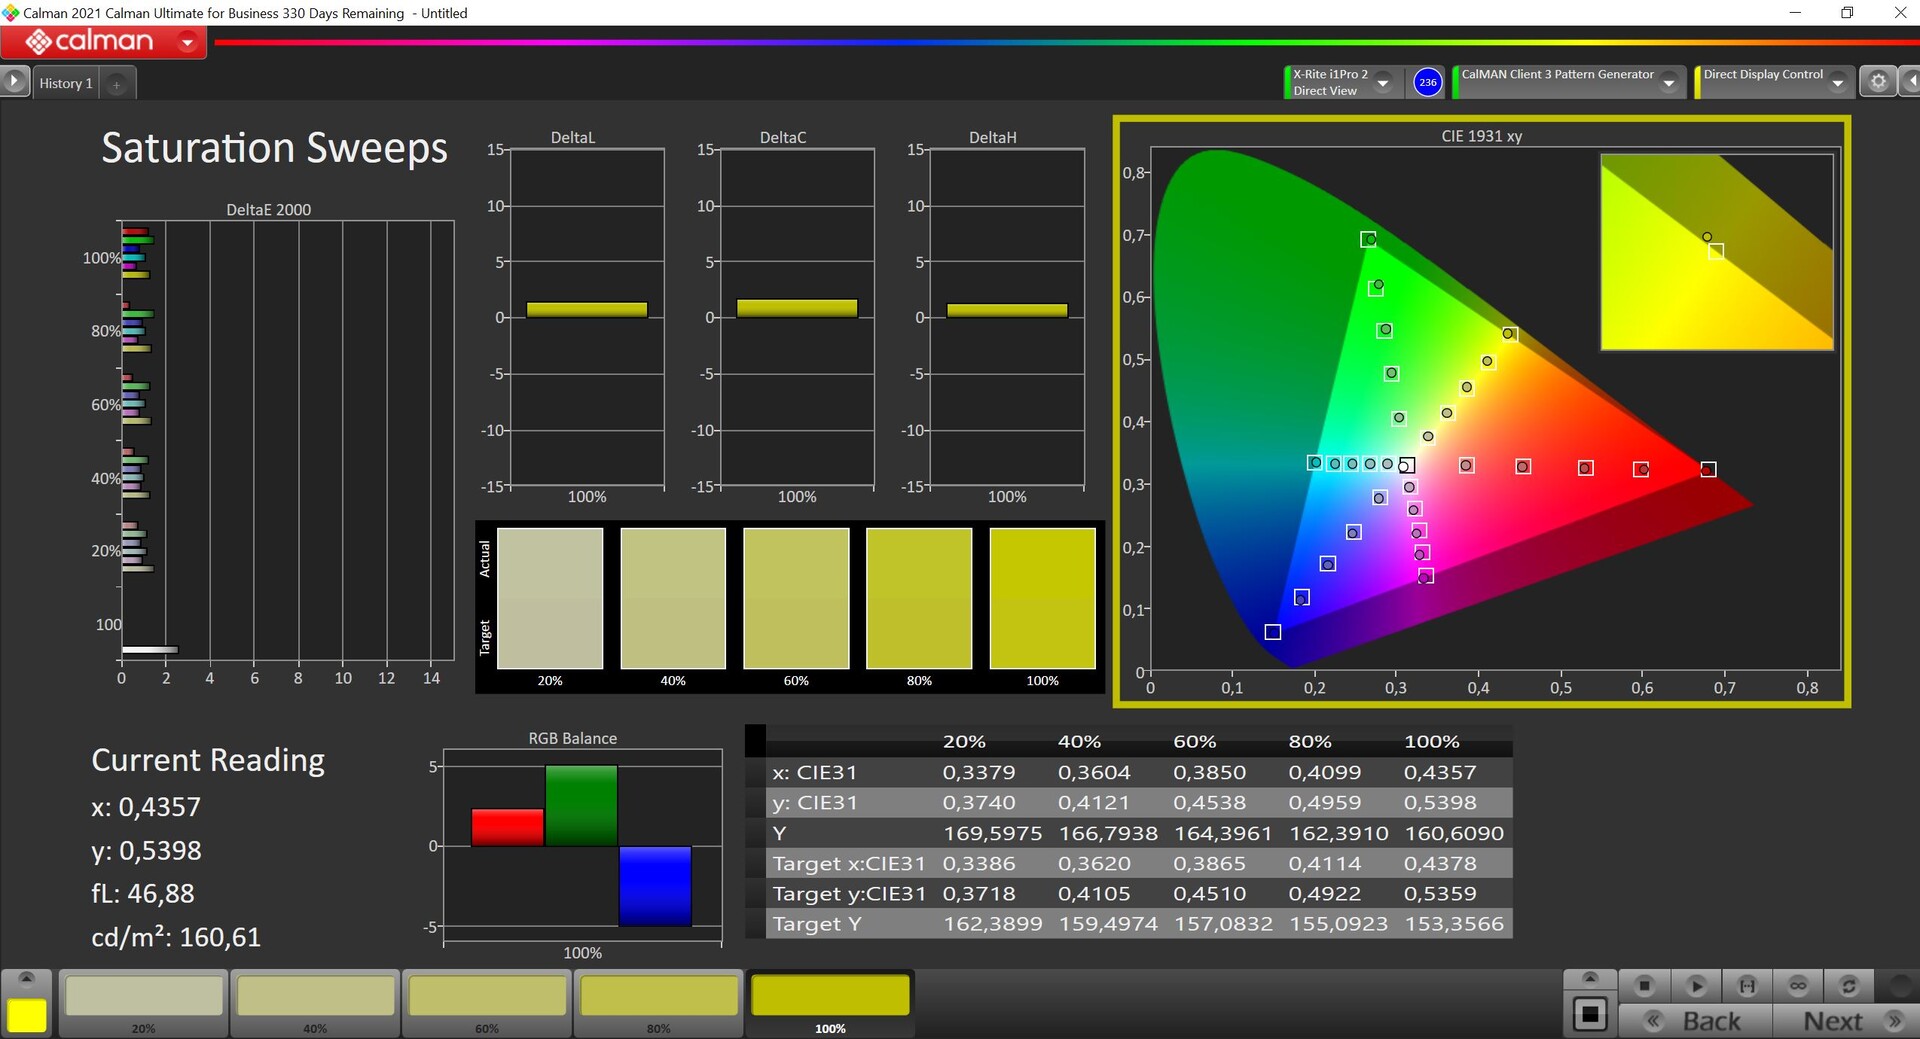
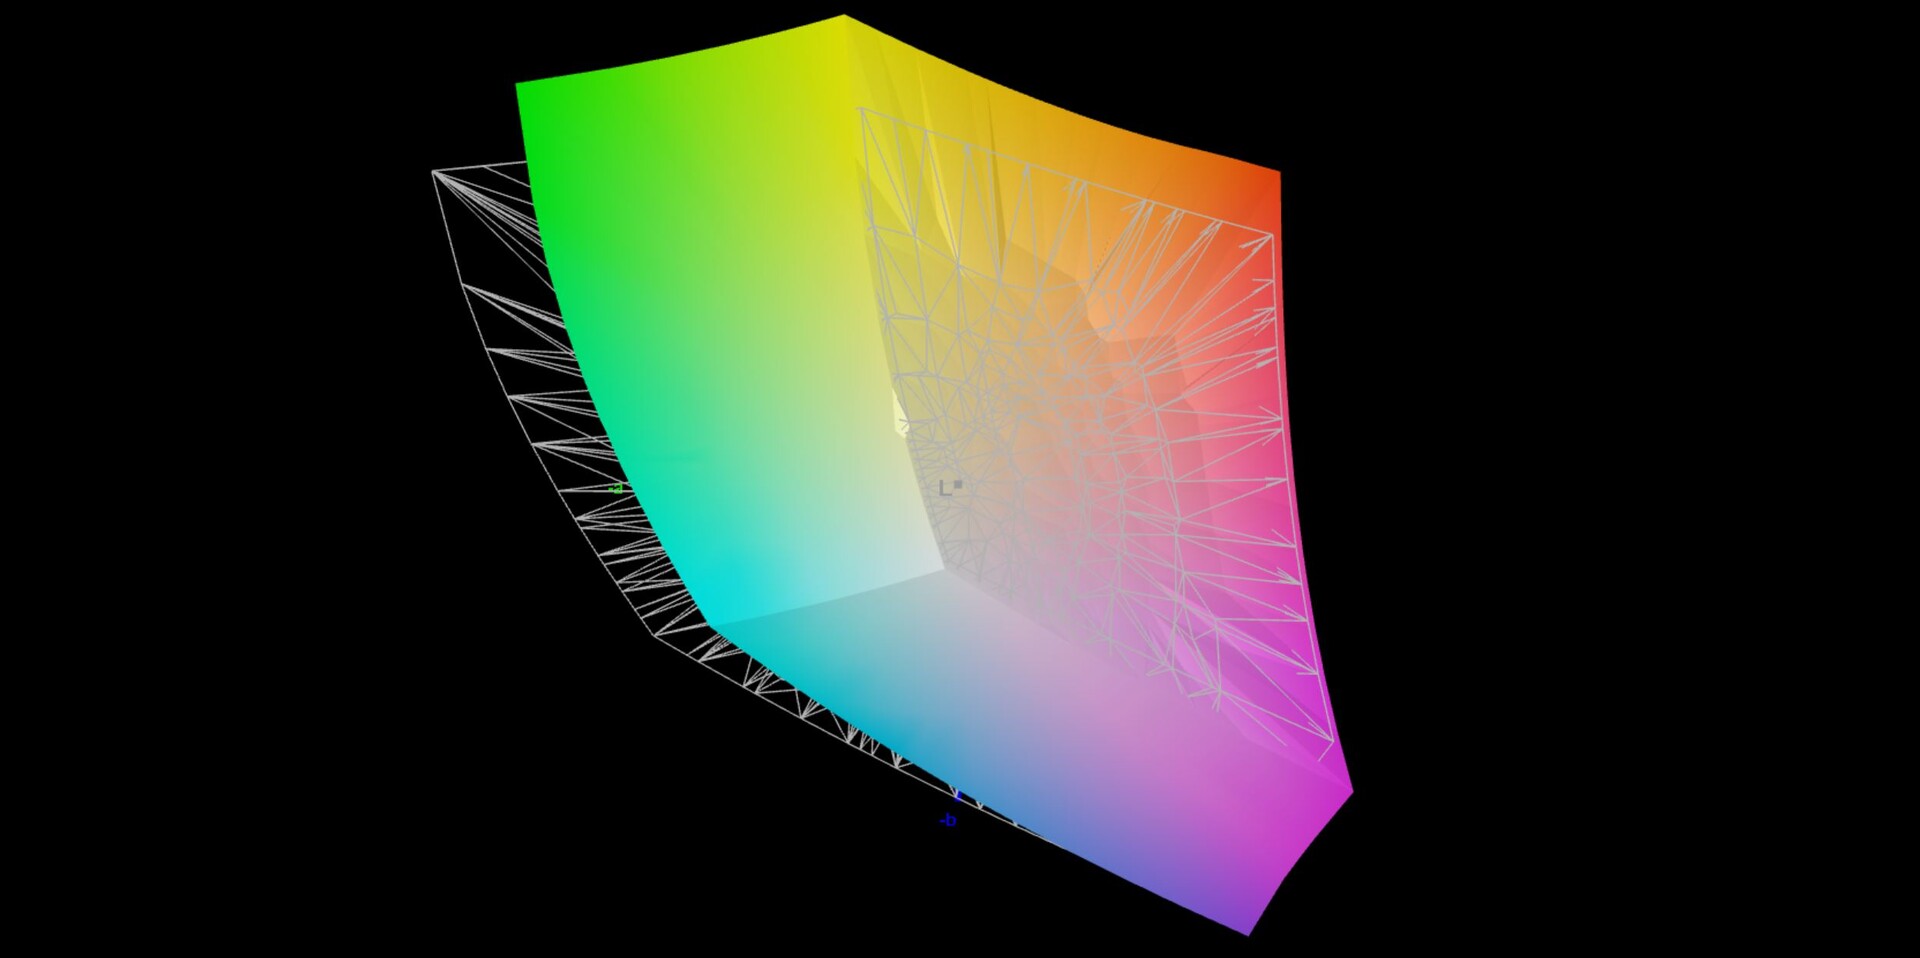
84.8% AdobeRGB 1998 (Argyll 3D)
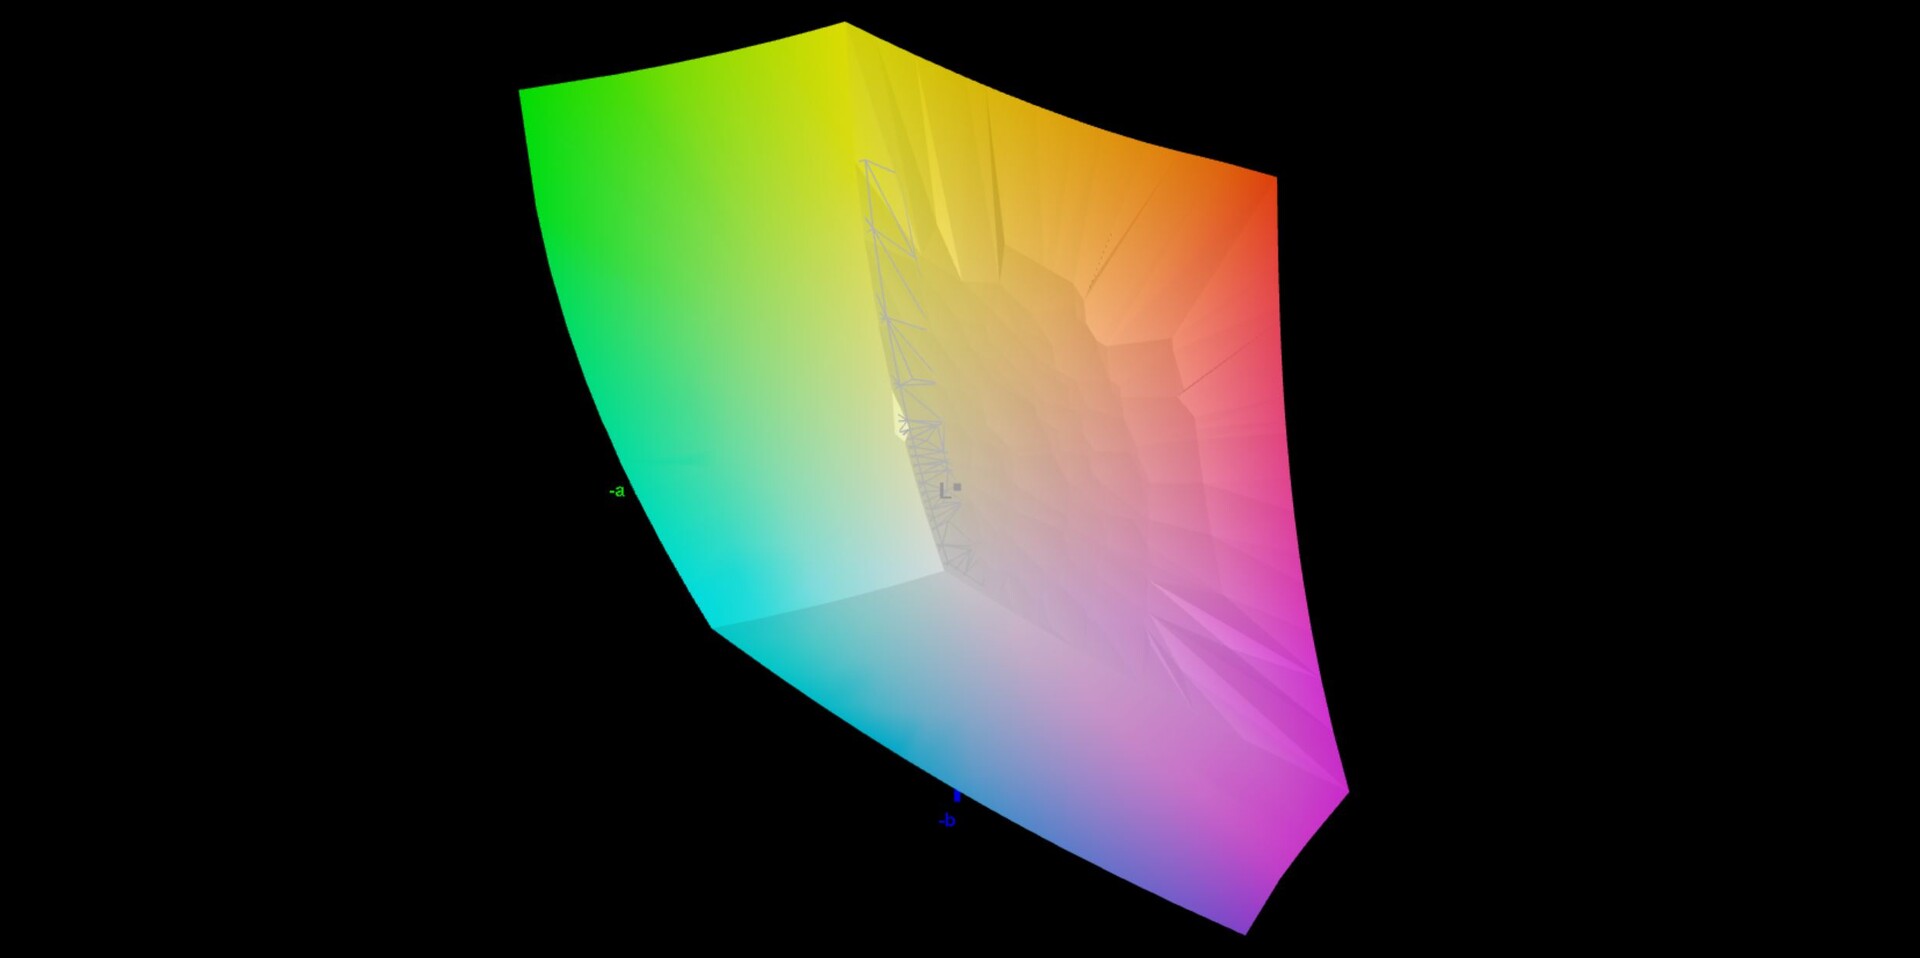
99.9% sRGB (Argyll 3D)
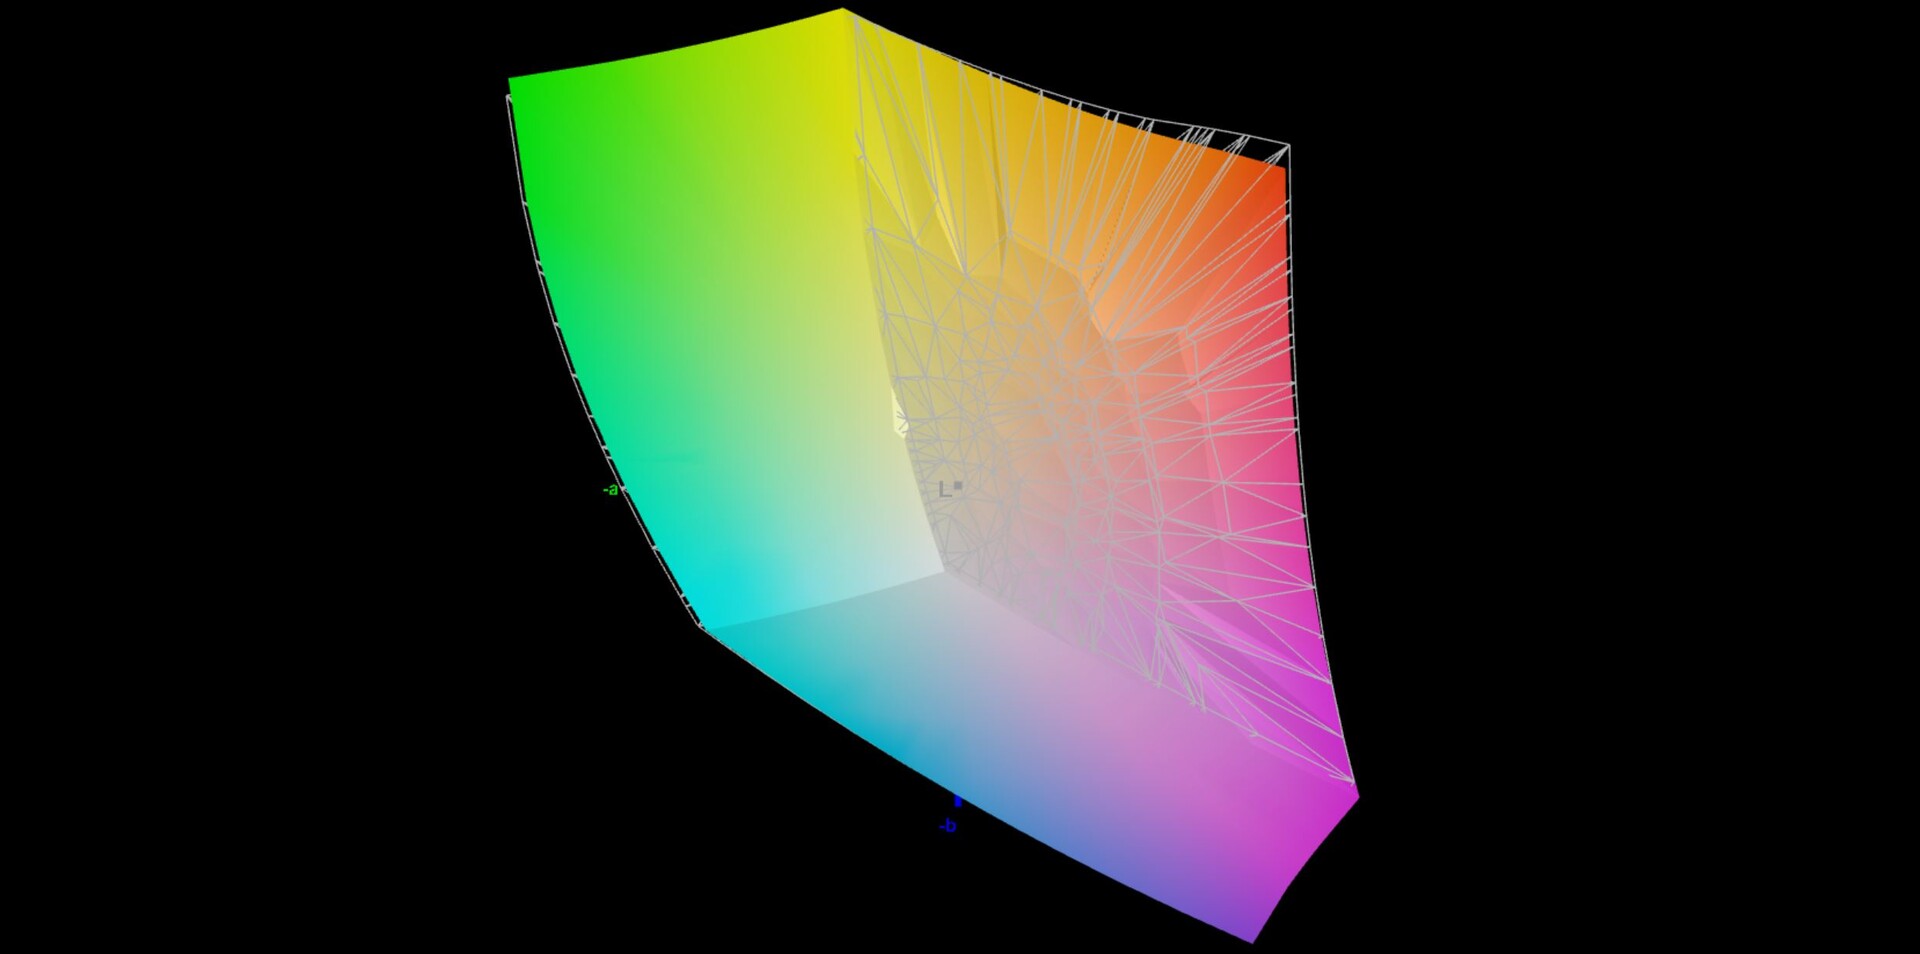
97.1% Display P3 (Argyll 3D)
Gamma: 2.13
CCT: 6599 K
| Asus ROG Strix Scar 17 SE G733CX-LL014W NE173QHM-NZ2, IPS, 2560x1440, 17.3" | Lenovo Legion 7 16IAX7-82TD004SGE NE160QDM-NY1, IPS, 2560x1600, 16" | MSI Titan GT77 12UHS Sharp SHP1544 LQ173M1JW08, IPS-Level, 1920x1080, 17.3" | Schenker XMG Neo 17 M22 BOE0A99, IPS, 2560x1600, 17" | Alienware x17 R2 P48E AU Optronics B173HAN, IPS, 1920x1080, 17.3" | Asus Strix Scar 17 G733QSA-XS99 AU Optronics B173HAN05.4, IPS, 1920x1080, 17.3" | |
|---|---|---|---|---|---|---|
| Display | -16% | -14% | -16% | -8% | -14% | |
| Display P3 Coverage (%) | 97.1 | 69.3 -29% | 70.8 -27% | 69 -29% | 79.2 -18% | 71 -27% |
| sRGB Coverage (%) | 99.9 | 98.2 -2% | 98.9 -1% | 99.8 0% | 99.8 0% | 99.4 -1% |
| AdobeRGB 1998 Coverage (%) | 84.8 | 70.8 -17% | 73 -14% | 69.6 -18% | 79.6 -6% | 72.2 -15% |
| Response Times | -38% | 48% | -25% | -55% | -12% | |
| Response Time Grey 50% / Grey 80% * (ms) | 5.7 ? | 12.6 ? -121% | 3.03 ? 47% | 10.8 ? -89% | 12.4 ? -118% | 6.6 ? -16% |
| Response Time Black / White * (ms) | 10.1 ? | 5.6 ? 45% | 5.28 ? 48% | 6.1 ? 40% | 9.2 ? 9% | 10.8 ? -7% |
| PWM Frequency (Hz) | ||||||
| Screen | -41% | -63% | -9% | -89% | -25% | |
| Brightness middle (cd/m²) | 320 | 547 71% | 280 -12% | 415 30% | 365.4 14% | 303.8 -5% |
| Brightness (cd/m²) | 303 | 523 73% | 275 -9% | 399 32% | 344 14% | 292 -4% |
| Brightness Distribution (%) | 87 | 88 1% | 79 -9% | 90 3% | 85 -2% | 85 -2% |
| Black Level * (cd/m²) | 0.3 | 0.44 -47% | 0.4 -33% | 0.43 -43% | 0.29 3% | 0.23 23% |
| Contrast (:1) | 1067 | 1243 16% | 700 -34% | 965 -10% | 1260 18% | 1321 24% |
| Colorchecker dE 2000 * | 1.1 | 2.1 -91% | 2.1 -91% | 1.44 -31% | 3.17 -188% | 1.87 -70% |
| Colorchecker dE 2000 max. * | 2.7 | 7 -159% | 5.83 -116% | 2.33 14% | 7.69 -185% | 3.26 -21% |
| Greyscale dE 2000 * | 1.1 | 3.2 -191% | 3.3 -200% | 1.8 -64% | 5.3 -382% | 2.7 -145% |
| Gamma | 2.13 103% | 2.23 99% | 2.13 103% | 2.132 103% | 2.18 101% | 2.26 97% |
| CCT | 6599 98% | 6979 93% | 7060 92% | 6327 103% | 5879 111% | 6436 101% |
| Colorchecker dE 2000 calibrated * | 0.9 | 1.58 | 0.89 | 0.51 | 1.45 | |
| Color Space (Percent of AdobeRGB 1998) (%) | 65.6 | |||||
| Color Space (Percent of sRGB) (%) | 99.4 | |||||
| Totalt genomsnitt (program/inställningar) | -32% /
-35% | -10% /
-35% | -17% /
-13% | -51% /
-65% | -17% /
-20% |
* ... mindre är bättre
Skärmen täcker P3-färgrymden, och vår analys med den professionella CalMAN-programvaran visar att skärmen är mycket exakt redan vid leverans. Det finns inte heller någon färgton, och vår egen kalibrering ledde inte till någon ytterligare förbättring, så vi erbjuder ingen profil för dig här. Den här QHD-panelen lämpar sig för bild- och videobearbetning utan några begränsningar.
Visa svarstider
| ↔ Svarstid svart till vitt | ||
|---|---|---|
| 10.1 ms ... stiga ↗ och falla ↘ kombinerat | ↗ 5 ms stiga | 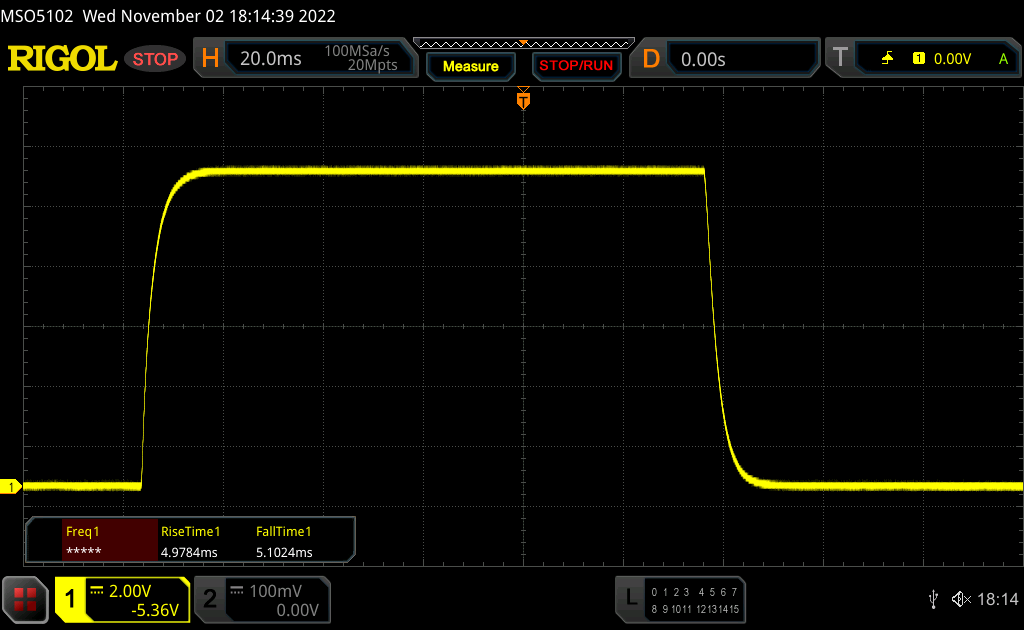 |
| ↘ 5.1 ms hösten | ||
| Skärmen visar bra svarsfrekvens i våra tester, men kan vara för långsam för konkurrenskraftiga spelare. I jämförelse sträcker sig alla testade enheter från 0.1 (minst) till 240 (maximalt) ms. » 28 % av alla enheter är bättre. Det betyder att den uppmätta svarstiden är bättre än genomsnittet av alla testade enheter (19.9 ms). | ||
| ↔ Svarstid 50 % grått till 80 % grått | ||
| 5.7 ms ... stiga ↗ och falla ↘ kombinerat | ↗ 2.7 ms stiga | 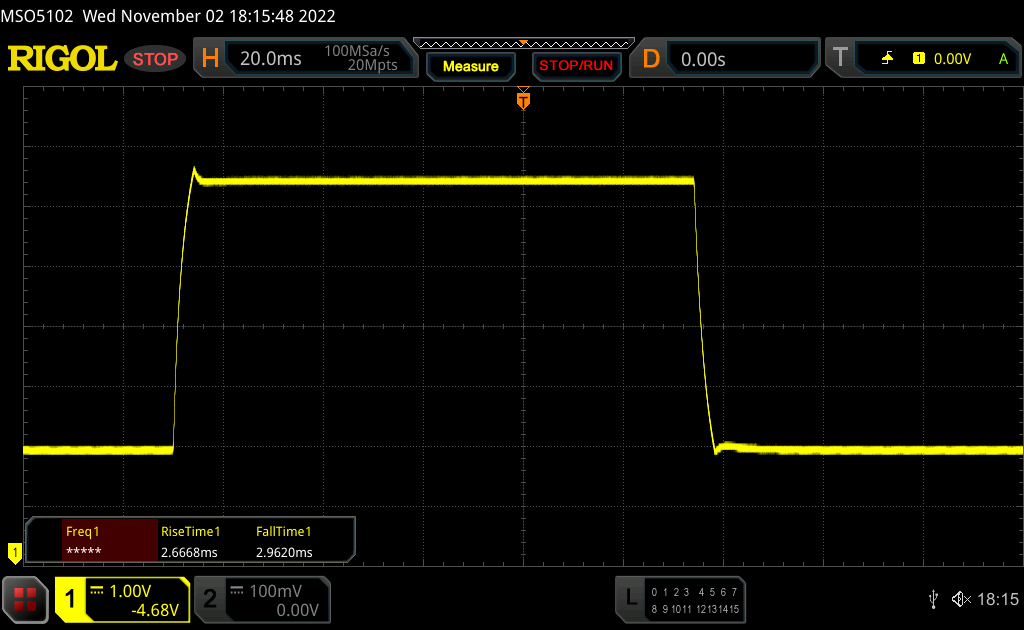 |
| ↘ 3 ms hösten | ||
| Skärmen visar väldigt snabba svarsfrekvenser i våra tester och borde vara mycket väl lämpad för fartfyllt spel. I jämförelse sträcker sig alla testade enheter från 0.165 (minst) till 636 (maximalt) ms. » 18 % av alla enheter är bättre. Det betyder att den uppmätta svarstiden är bättre än genomsnittet av alla testade enheter (31.1 ms). | ||
Skärmflimmer / PWM (Puls-Width Modulation)
| Skärmflimmer / PWM upptäcktes inte | 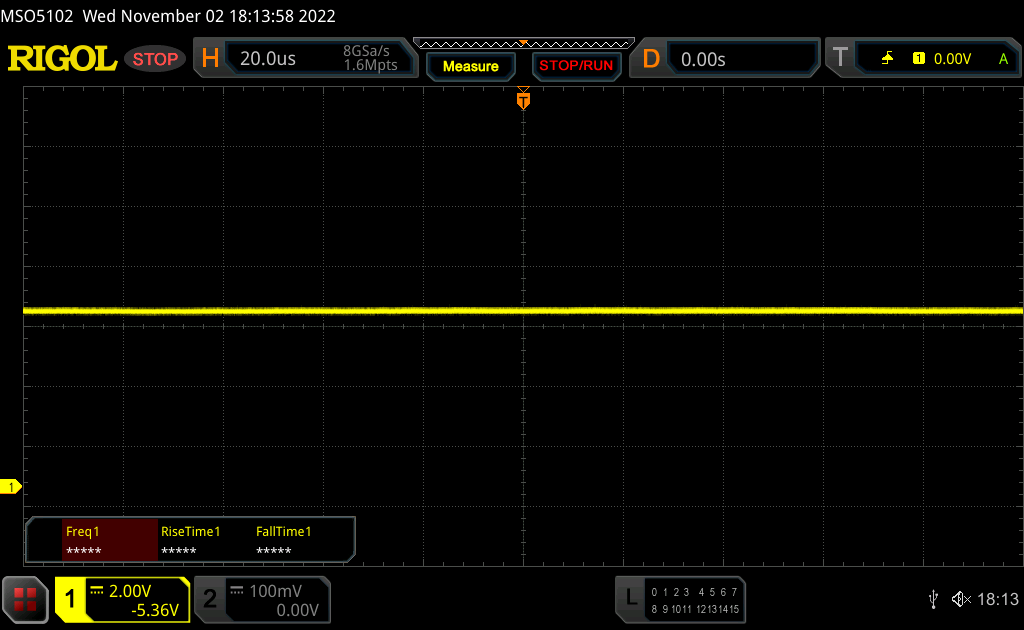 | ||
Som jämförelse: 52 % av alla testade enheter använder inte PWM för att dämpa skärmen. Om PWM upptäcktes mättes ett medelvärde av 7794 (minst: 5 - maximum: 343500) Hz. | |||
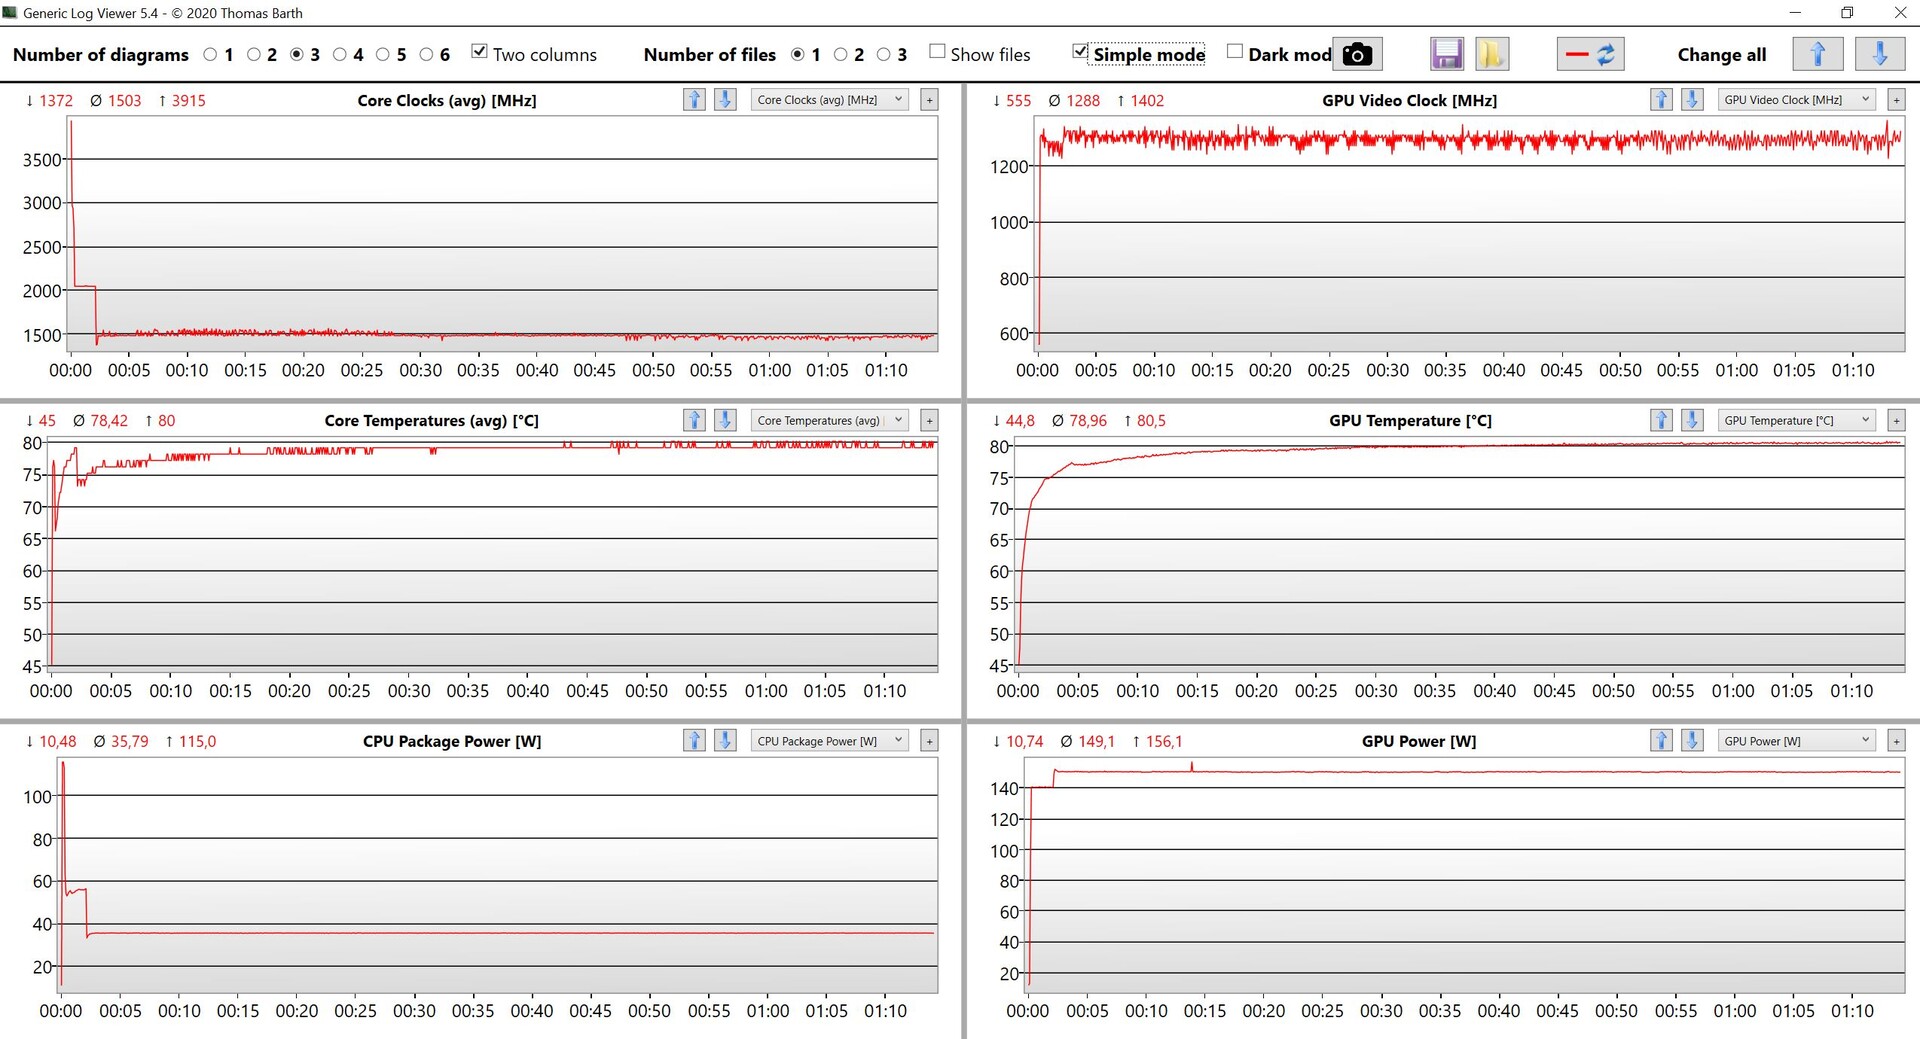
Prestanda - Intel HX med bromsarna i gång
Testförhållanden
ROG-programvaran erbjuder omfattande konfigurationsalternativ och strömprofiler. Du kan till exempel helt avaktivera den integrerade GPU:n (MUX) eller manuellt ställa in effektvärdena för CPU och GPU. För våra benchmarks och mätningar nedan använder vi prestandaprofilen, eftersom denna redan gör den fulla GPU-prestandan tillgänglig. Även om CPU-prestandan till och med är något högre i Turbo-läget rättfärdigar detta inte det betydligt högre fläktljudet enligt vår mening.
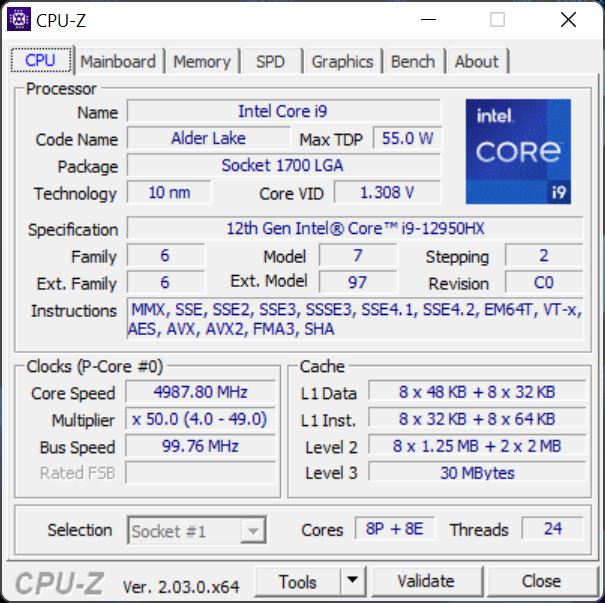
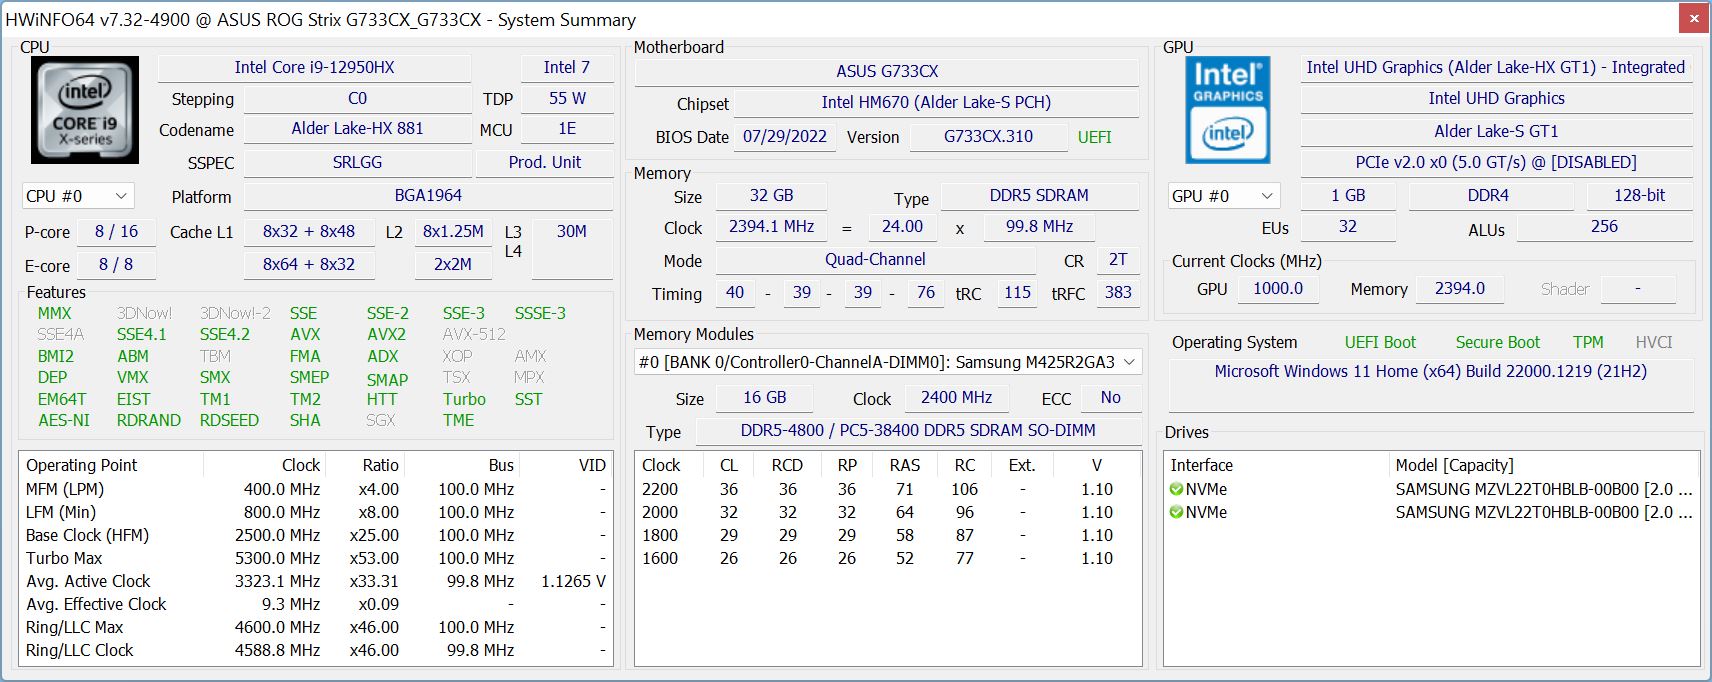
Processor - Core i9-12950HX
Intel Core i9-12950HX är för närvarande den snabbaste mobila processorn från Intel. Även om den kan förbruka upp till 175 watt håller den sig långt ifrån detta värde i vår testenhet. Istället ser vi en maximal förbrukning på 115 watt (även i turboläge), och vid något tillfälle planar värdet ut på 70 watt (105 watt i turboläge). Även om CPU-prestandan inte alls är dålig kan du också få detta med en vanlig Core i9, och den extra premien för HX-chipet är inte värd den extra kostnaden
I batteridrift är strömförbrukningen begränsad till 35 watt, vilket leder till en flerkärnig prestanda som minskar med cirka 40 %. Du kan hitta ytterligare CPU-jämförelser i vårt motsvarande tekniska avsnitt.
Cinebench R15 Multi Constant Load Test
Cinebench R23: Multi Core | Single Core
Cinebench R20: CPU (Multi Core) | CPU (Single Core)
Cinebench R15: CPU Multi 64Bit | CPU Single 64Bit
Blender: v2.79 BMW27 CPU
7-Zip 18.03: 7z b 4 | 7z b 4 -mmt1
Geekbench 5.5: Multi-Core | Single-Core
HWBOT x265 Benchmark v2.2: 4k Preset
LibreOffice : 20 Documents To PDF
R Benchmark 2.5: Overall mean
| CPU Performance rating | |
| Genomsnitt av klass Gaming | |
| Lenovo Legion 7 16IAX7-82TD004SGE | |
| MSI Titan GT77 12UHS | |
| Asus ROG Strix Scar 17 SE G733CX-LL014W | |
| Genomsnitt Intel Core i9-12950HX | |
| Alienware x17 R2 P48E | |
| Schenker XMG Neo 17 M22 | |
| Asus Strix Scar 17 G733QSA-XS99 | |
| Cinebench R23 / Multi Core | |
| Genomsnitt av klass Gaming (10488 - 40970, n=112, senaste 2 åren) | |
| MSI Titan GT77 12UHS | |
| Lenovo Legion 7 16IAX7-82TD004SGE | |
| Asus ROG Strix Scar 17 SE G733CX-LL014W | |
| Genomsnitt Intel Core i9-12950HX (16277 - 23113, n=7) | |
| Alienware x17 R2 P48E | |
| Schenker XMG Neo 17 M22 | |
| Asus Strix Scar 17 G733QSA-XS99 | |
| Cinebench R23 / Single Core | |
| Genomsnitt av klass Gaming (1166 - 2356, n=112, senaste 2 åren) | |
| Lenovo Legion 7 16IAX7-82TD004SGE | |
| MSI Titan GT77 12UHS | |
| Alienware x17 R2 P48E | |
| Asus ROG Strix Scar 17 SE G733CX-LL014W | |
| Genomsnitt Intel Core i9-12950HX (1465 - 1922, n=7) | |
| Schenker XMG Neo 17 M22 | |
| Asus Strix Scar 17 G733QSA-XS99 | |
| Cinebench R20 / CPU (Multi Core) | |
| Genomsnitt av klass Gaming (4029 - 16108, n=111, senaste 2 åren) | |
| MSI Titan GT77 12UHS | |
| Lenovo Legion 7 16IAX7-82TD004SGE | |
| Genomsnitt Intel Core i9-12950HX (6625 - 8777, n=7) | |
| Asus ROG Strix Scar 17 SE G733CX-LL014W | |
| Alienware x17 R2 P48E | |
| Schenker XMG Neo 17 M22 | |
| Asus Strix Scar 17 G733QSA-XS99 | |
| Cinebench R20 / CPU (Single Core) | |
| Genomsnitt av klass Gaming (442 - 895, n=111, senaste 2 åren) | |
| Lenovo Legion 7 16IAX7-82TD004SGE | |
| Asus ROG Strix Scar 17 SE G733CX-LL014W | |
| MSI Titan GT77 12UHS | |
| Alienware x17 R2 P48E | |
| Genomsnitt Intel Core i9-12950HX (703 - 741, n=7) | |
| Schenker XMG Neo 17 M22 | |
| Asus Strix Scar 17 G733QSA-XS99 | |
| Cinebench R15 / CPU Multi 64Bit | |
| Genomsnitt av klass Gaming (1578 - 6271, n=111, senaste 2 åren) | |
| MSI Titan GT77 12UHS | |
| Lenovo Legion 7 16IAX7-82TD004SGE | |
| Asus ROG Strix Scar 17 SE G733CX-LL014W | |
| Genomsnitt Intel Core i9-12950HX (2464 - 3530, n=7) | |
| Alienware x17 R2 P48E | |
| Schenker XMG Neo 17 M22 | |
| Asus Strix Scar 17 G733QSA-XS99 | |
| Cinebench R15 / CPU Single 64Bit | |
| Genomsnitt av klass Gaming (188.8 - 343, n=111, senaste 2 åren) | |
| Lenovo Legion 7 16IAX7-82TD004SGE | |
| MSI Titan GT77 12UHS | |
| Asus ROG Strix Scar 17 SE G733CX-LL014W | |
| Alienware x17 R2 P48E | |
| Genomsnitt Intel Core i9-12950HX (167 - 276, n=7) | |
| Schenker XMG Neo 17 M22 | |
| Asus Strix Scar 17 G733QSA-XS99 | |
| Blender / v2.79 BMW27 CPU | |
| Asus Strix Scar 17 G733QSA-XS99 | |
| Schenker XMG Neo 17 M22 | |
| Asus ROG Strix Scar 17 SE G733CX-LL014W | |
| Alienware x17 R2 P48E | |
| Genomsnitt Intel Core i9-12950HX (138 - 193, n=7) | |
| Genomsnitt av klass Gaming (80 - 330, n=109, senaste 2 åren) | |
| Lenovo Legion 7 16IAX7-82TD004SGE | |
| MSI Titan GT77 12UHS | |
| 7-Zip 18.03 / 7z b 4 | |
| Genomsnitt av klass Gaming (33491 - 148086, n=110, senaste 2 åren) | |
| Lenovo Legion 7 16IAX7-82TD004SGE | |
| MSI Titan GT77 12UHS | |
| Genomsnitt Intel Core i9-12950HX (65637 - 85019, n=7) | |
| Asus ROG Strix Scar 17 SE G733CX-LL014W | |
| Alienware x17 R2 P48E | |
| Schenker XMG Neo 17 M22 | |
| Asus Strix Scar 17 G733QSA-XS99 | |
| 7-Zip 18.03 / 7z b 4 -mmt1 | |
| Genomsnitt av klass Gaming (4199 - 7436, n=110, senaste 2 åren) | |
| Lenovo Legion 7 16IAX7-82TD004SGE | |
| MSI Titan GT77 12UHS | |
| Asus ROG Strix Scar 17 SE G733CX-LL014W | |
| Genomsnitt Intel Core i9-12950HX (6022 - 6318, n=7) | |
| Schenker XMG Neo 17 M22 | |
| Alienware x17 R2 P48E | |
| Asus Strix Scar 17 G733QSA-XS99 | |
| Geekbench 5.5 / Multi-Core | |
| Genomsnitt av klass Gaming (6460 - 27010, n=110, senaste 2 åren) | |
| Lenovo Legion 7 16IAX7-82TD004SGE | |
| MSI Titan GT77 12UHS | |
| Asus ROG Strix Scar 17 SE G733CX-LL014W | |
| Genomsnitt Intel Core i9-12950HX (14028 - 16009, n=7) | |
| Alienware x17 R2 P48E | |
| Schenker XMG Neo 17 M22 | |
| Asus Strix Scar 17 G733QSA-XS99 | |
| Geekbench 5.5 / Single-Core | |
| Genomsnitt av klass Gaming (986 - 2474, n=110, senaste 2 åren) | |
| MSI Titan GT77 12UHS | |
| Genomsnitt Intel Core i9-12950HX (1847 - 1945, n=7) | |
| Alienware x17 R2 P48E | |
| Lenovo Legion 7 16IAX7-82TD004SGE | |
| Asus ROG Strix Scar 17 SE G733CX-LL014W | |
| Schenker XMG Neo 17 M22 | |
| Asus Strix Scar 17 G733QSA-XS99 | |
| HWBOT x265 Benchmark v2.2 / 4k Preset | |
| Genomsnitt av klass Gaming (11.5 - 44.3, n=110, senaste 2 åren) | |
| MSI Titan GT77 12UHS | |
| Lenovo Legion 7 16IAX7-82TD004SGE | |
| Asus ROG Strix Scar 17 SE G733CX-LL014W | |
| Genomsnitt Intel Core i9-12950HX (18.6 - 26.5, n=7) | |
| Alienware x17 R2 P48E | |
| Schenker XMG Neo 17 M22 | |
| Asus Strix Scar 17 G733QSA-XS99 | |
| LibreOffice / 20 Documents To PDF | |
| Schenker XMG Neo 17 M22 | |
| Genomsnitt av klass Gaming (19 - 88.8, n=110, senaste 2 åren) | |
| Asus Strix Scar 17 G733QSA-XS99 | |
| Alienware x17 R2 P48E | |
| Genomsnitt Intel Core i9-12950HX (34.7 - 45.4, n=7) | |
| MSI Titan GT77 12UHS | |
| Asus ROG Strix Scar 17 SE G733CX-LL014W | |
| Lenovo Legion 7 16IAX7-82TD004SGE | |
| R Benchmark 2.5 / Overall mean | |
| Asus Strix Scar 17 G733QSA-XS99 | |
| Schenker XMG Neo 17 M22 | |
| Genomsnitt Intel Core i9-12950HX (0.4251 - 0.4515, n=7) | |
| Alienware x17 R2 P48E | |
| Genomsnitt av klass Gaming (0.3439 - 0.759, n=111, senaste 2 åren) | |
| Asus ROG Strix Scar 17 SE G733CX-LL014W | |
| Lenovo Legion 7 16IAX7-82TD004SGE | |
| MSI Titan GT77 12UHS | |
* ... mindre är bättre
AIDA64: FP32 Ray-Trace | FPU Julia | CPU SHA3 | CPU Queen | FPU SinJulia | FPU Mandel | CPU AES | CPU ZLib | FP64 Ray-Trace | CPU PhotoWorxx
| Performance rating | |
| Genomsnitt av klass Gaming | |
| MSI Titan GT77 12UHS | |
| Asus ROG Strix Scar 17 SE G733CX-LL014W | |
| Genomsnitt Intel Core i9-12950HX | |
| Schenker XMG Neo 17 M22 | |
| Asus Strix Scar 17 G733QSA-XS99 | |
| Lenovo Legion 7 16IAX7-82TD004SGE | |
| Alienware x17 R2 P48E | |
| AIDA64 / FP32 Ray-Trace | |
| Genomsnitt av klass Gaming (10227 - 85542, n=109, senaste 2 åren) | |
| MSI Titan GT77 12UHS | |
| Genomsnitt Intel Core i9-12950HX (15499 - 22868, n=7) | |
| Asus ROG Strix Scar 17 SE G733CX-LL014W | |
| Schenker XMG Neo 17 M22 | |
| Asus Strix Scar 17 G733QSA-XS99 | |
| Lenovo Legion 7 16IAX7-82TD004SGE | |
| Alienware x17 R2 P48E | |
| AIDA64 / FPU Julia | |
| Genomsnitt av klass Gaming (51376 - 238426, n=109, senaste 2 åren) | |
| MSI Titan GT77 12UHS | |
| Asus Strix Scar 17 G733QSA-XS99 | |
| Schenker XMG Neo 17 M22 | |
| Genomsnitt Intel Core i9-12950HX (77846 - 115907, n=7) | |
| Asus ROG Strix Scar 17 SE G733CX-LL014W | |
| Lenovo Legion 7 16IAX7-82TD004SGE | |
| Alienware x17 R2 P48E | |
| AIDA64 / CPU SHA3 | |
| Genomsnitt av klass Gaming (2180 - 9817, n=109, senaste 2 åren) | |
| MSI Titan GT77 12UHS | |
| Lenovo Legion 7 16IAX7-82TD004SGE | |
| Asus ROG Strix Scar 17 SE G733CX-LL014W | |
| Genomsnitt Intel Core i9-12950HX (3426 - 5069, n=7) | |
| Alienware x17 R2 P48E | |
| Asus Strix Scar 17 G733QSA-XS99 | |
| Schenker XMG Neo 17 M22 | |
| AIDA64 / CPU Queen | |
| Genomsnitt av klass Gaming (49785 - 173351, n=100, senaste 2 åren) | |
| Alienware x17 R2 P48E | |
| Asus ROG Strix Scar 17 SE G733CX-LL014W | |
| Genomsnitt Intel Core i9-12950HX (102752 - 104726, n=7) | |
| Asus Strix Scar 17 G733QSA-XS99 | |
| MSI Titan GT77 12UHS | |
| Schenker XMG Neo 17 M22 | |
| Lenovo Legion 7 16IAX7-82TD004SGE | |
| AIDA64 / FPU SinJulia | |
| Genomsnitt av klass Gaming (4424 - 33636, n=109, senaste 2 åren) | |
| Lenovo Legion 7 16IAX7-82TD004SGE | |
| MSI Titan GT77 12UHS | |
| Schenker XMG Neo 17 M22 | |
| Asus Strix Scar 17 G733QSA-XS99 | |
| Genomsnitt Intel Core i9-12950HX (10134 - 12823, n=7) | |
| Asus ROG Strix Scar 17 SE G733CX-LL014W | |
| Alienware x17 R2 P48E | |
| AIDA64 / FPU Mandel | |
| Genomsnitt av klass Gaming (25115 - 128721, n=109, senaste 2 åren) | |
| Asus Strix Scar 17 G733QSA-XS99 | |
| Schenker XMG Neo 17 M22 | |
| MSI Titan GT77 12UHS | |
| Genomsnitt Intel Core i9-12950HX (37146 - 57340, n=7) | |
| Asus ROG Strix Scar 17 SE G733CX-LL014W | |
| Lenovo Legion 7 16IAX7-82TD004SGE | |
| Alienware x17 R2 P48E | |
| AIDA64 / CPU AES | |
| MSI Titan GT77 12UHS | |
| Asus ROG Strix Scar 17 SE G733CX-LL014W | |
| Schenker XMG Neo 17 M22 | |
| Asus Strix Scar 17 G733QSA-XS99 | |
| Lenovo Legion 7 16IAX7-82TD004SGE | |
| Genomsnitt Intel Core i9-12950HX (72599 - 181128, n=7) | |
| Alienware x17 R2 P48E | |
| Genomsnitt av klass Gaming (39258 - 247074, n=109, senaste 2 åren) | |
| AIDA64 / CPU ZLib | |
| Genomsnitt av klass Gaming (574 - 2531, n=109, senaste 2 åren) | |
| Lenovo Legion 7 16IAX7-82TD004SGE | |
| MSI Titan GT77 12UHS | |
| Asus ROG Strix Scar 17 SE G733CX-LL014W | |
| Alienware x17 R2 P48E | |
| Genomsnitt Intel Core i9-12950HX (996 - 1417, n=7) | |
| Asus Strix Scar 17 G733QSA-XS99 | |
| Schenker XMG Neo 17 M22 | |
| AIDA64 / FP64 Ray-Trace | |
| Genomsnitt av klass Gaming (5509 - 45446, n=109, senaste 2 åren) | |
| MSI Titan GT77 12UHS | |
| Genomsnitt Intel Core i9-12950HX (8455 - 12432, n=7) | |
| Asus ROG Strix Scar 17 SE G733CX-LL014W | |
| Asus Strix Scar 17 G733QSA-XS99 | |
| Schenker XMG Neo 17 M22 | |
| Lenovo Legion 7 16IAX7-82TD004SGE | |
| Alienware x17 R2 P48E | |
| AIDA64 / CPU PhotoWorxx | |
| Genomsnitt av klass Gaming (12271 - 89891, n=109, senaste 2 åren) | |
| Asus ROG Strix Scar 17 SE G733CX-LL014W | |
| MSI Titan GT77 12UHS | |
| Genomsnitt Intel Core i9-12950HX (35479 - 42655, n=7) | |
| Lenovo Legion 7 16IAX7-82TD004SGE | |
| Alienware x17 R2 P48E | |
| Schenker XMG Neo 17 M22 | |
| Asus Strix Scar 17 G733QSA-XS99 | |
Systemets prestanda
Det subjektiva intrycket av prestanda är utmärkt, vilket också bekräftas av de goda resultaten i benchmark. Vi märker inga problem alls under testerna.
CrossMark: Overall | Productivity | Creativity | Responsiveness
| PCMark 10 / Score | |
| Lenovo Legion 7 16IAX7-82TD004SGE | |
| Genomsnitt av klass Gaming (5828 - 11574, n=95, senaste 2 åren) | |
| MSI Titan GT77 12UHS | |
| Alienware x17 R2 P48E | |
| Asus ROG Strix Scar 17 SE G733CX-LL014W | |
| Genomsnitt Intel Core i9-12950HX, NVIDIA GeForce RTX 3080 Ti Laptop GPU (n=1) | |
| Asus Strix Scar 17 G733QSA-XS99 | |
| Schenker XMG Neo 17 M22 | |
| PCMark 10 / Essentials | |
| Alienware x17 R2 P48E | |
| Lenovo Legion 7 16IAX7-82TD004SGE | |
| MSI Titan GT77 12UHS | |
| Genomsnitt av klass Gaming (8810 - 12600, n=99, senaste 2 åren) | |
| Asus Strix Scar 17 G733QSA-XS99 | |
| Asus ROG Strix Scar 17 SE G733CX-LL014W | |
| Genomsnitt Intel Core i9-12950HX, NVIDIA GeForce RTX 3080 Ti Laptop GPU (n=1) | |
| Schenker XMG Neo 17 M22 | |
| PCMark 10 / Productivity | |
| Lenovo Legion 7 16IAX7-82TD004SGE | |
| Genomsnitt av klass Gaming (6845 - 18766, n=97, senaste 2 åren) | |
| MSI Titan GT77 12UHS | |
| Alienware x17 R2 P48E | |
| Asus ROG Strix Scar 17 SE G733CX-LL014W | |
| Genomsnitt Intel Core i9-12950HX, NVIDIA GeForce RTX 3080 Ti Laptop GPU (n=1) | |
| Asus Strix Scar 17 G733QSA-XS99 | |
| Schenker XMG Neo 17 M22 | |
| PCMark 10 / Digital Content Creation | |
| Lenovo Legion 7 16IAX7-82TD004SGE | |
| Genomsnitt av klass Gaming (7602 - 19657, n=97, senaste 2 åren) | |
| MSI Titan GT77 12UHS | |
| Alienware x17 R2 P48E | |
| Asus ROG Strix Scar 17 SE G733CX-LL014W | |
| Genomsnitt Intel Core i9-12950HX, NVIDIA GeForce RTX 3080 Ti Laptop GPU (n=1) | |
| Asus Strix Scar 17 G733QSA-XS99 | |
| Schenker XMG Neo 17 M22 | |
| CrossMark / Overall | |
| Lenovo Legion 7 16IAX7-82TD004SGE | |
| Asus ROG Strix Scar 17 SE G733CX-LL014W | |
| Genomsnitt Intel Core i9-12950HX, NVIDIA GeForce RTX 3080 Ti Laptop GPU (n=1) | |
| MSI Titan GT77 12UHS | |
| Genomsnitt av klass Gaming (1366 - 2409, n=97, senaste 2 åren) | |
| Alienware x17 R2 P48E | |
| Schenker XMG Neo 17 M22 | |
| CrossMark / Productivity | |
| Lenovo Legion 7 16IAX7-82TD004SGE | |
| MSI Titan GT77 12UHS | |
| Asus ROG Strix Scar 17 SE G733CX-LL014W | |
| Genomsnitt Intel Core i9-12950HX, NVIDIA GeForce RTX 3080 Ti Laptop GPU (n=1) | |
| Genomsnitt av klass Gaming (1386 - 2254, n=97, senaste 2 åren) | |
| Alienware x17 R2 P48E | |
| Schenker XMG Neo 17 M22 | |
| CrossMark / Creativity | |
| Asus ROG Strix Scar 17 SE G733CX-LL014W | |
| Genomsnitt Intel Core i9-12950HX, NVIDIA GeForce RTX 3080 Ti Laptop GPU (n=1) | |
| Lenovo Legion 7 16IAX7-82TD004SGE | |
| MSI Titan GT77 12UHS | |
| Genomsnitt av klass Gaming (1343 - 2729, n=97, senaste 2 åren) | |
| Alienware x17 R2 P48E | |
| Schenker XMG Neo 17 M22 | |
| CrossMark / Responsiveness | |
| Lenovo Legion 7 16IAX7-82TD004SGE | |
| MSI Titan GT77 12UHS | |
| Asus ROG Strix Scar 17 SE G733CX-LL014W | |
| Genomsnitt Intel Core i9-12950HX, NVIDIA GeForce RTX 3080 Ti Laptop GPU (n=1) | |
| Genomsnitt av klass Gaming (1226 - 2334, n=97, senaste 2 åren) | |
| Alienware x17 R2 P48E | |
| Schenker XMG Neo 17 M22 | |
| PCMark 10 Score | 7208 poäng | |
Hjälp | ||
| AIDA64 / Memory Copy | |
| Genomsnitt av klass Gaming (21750 - 129946, n=109, senaste 2 åren) | |
| MSI Titan GT77 12UHS | |
| Lenovo Legion 7 16IAX7-82TD004SGE | |
| Asus ROG Strix Scar 17 SE G733CX-LL014W | |
| Genomsnitt Intel Core i9-12950HX (59731 - 64732, n=7) | |
| Alienware x17 R2 P48E | |
| Schenker XMG Neo 17 M22 | |
| Asus Strix Scar 17 G733QSA-XS99 | |
| AIDA64 / Memory Read | |
| Genomsnitt av klass Gaming (22956 - 118858, n=109, senaste 2 åren) | |
| Lenovo Legion 7 16IAX7-82TD004SGE | |
| Asus ROG Strix Scar 17 SE G733CX-LL014W | |
| Genomsnitt Intel Core i9-12950HX (59744 - 70359, n=7) | |
| MSI Titan GT77 12UHS | |
| Alienware x17 R2 P48E | |
| Schenker XMG Neo 17 M22 | |
| Asus Strix Scar 17 G733QSA-XS99 | |
| AIDA64 / Memory Write | |
| Genomsnitt av klass Gaming (22297 - 135096, n=109, senaste 2 åren) | |
| Asus ROG Strix Scar 17 SE G733CX-LL014W | |
| Lenovo Legion 7 16IAX7-82TD004SGE | |
| Genomsnitt Intel Core i9-12950HX (57750 - 67899, n=7) | |
| MSI Titan GT77 12UHS | |
| Schenker XMG Neo 17 M22 | |
| Alienware x17 R2 P48E | |
| Asus Strix Scar 17 G733QSA-XS99 | |
| AIDA64 / Memory Latency | |
| Genomsnitt av klass Gaming (75.3 - 259, n=109, senaste 2 åren) | |
| Alienware x17 R2 P48E | |
| Schenker XMG Neo 17 M22 | |
| MSI Titan GT77 12UHS | |
| Genomsnitt Intel Core i9-12950HX (84.5 - 92.2, n=7) | |
| Lenovo Legion 7 16IAX7-82TD004SGE | |
| Asus ROG Strix Scar 17 SE G733CX-LL014W | |
| Asus Strix Scar 17 G733QSA-XS99 | |
* ... mindre är bättre
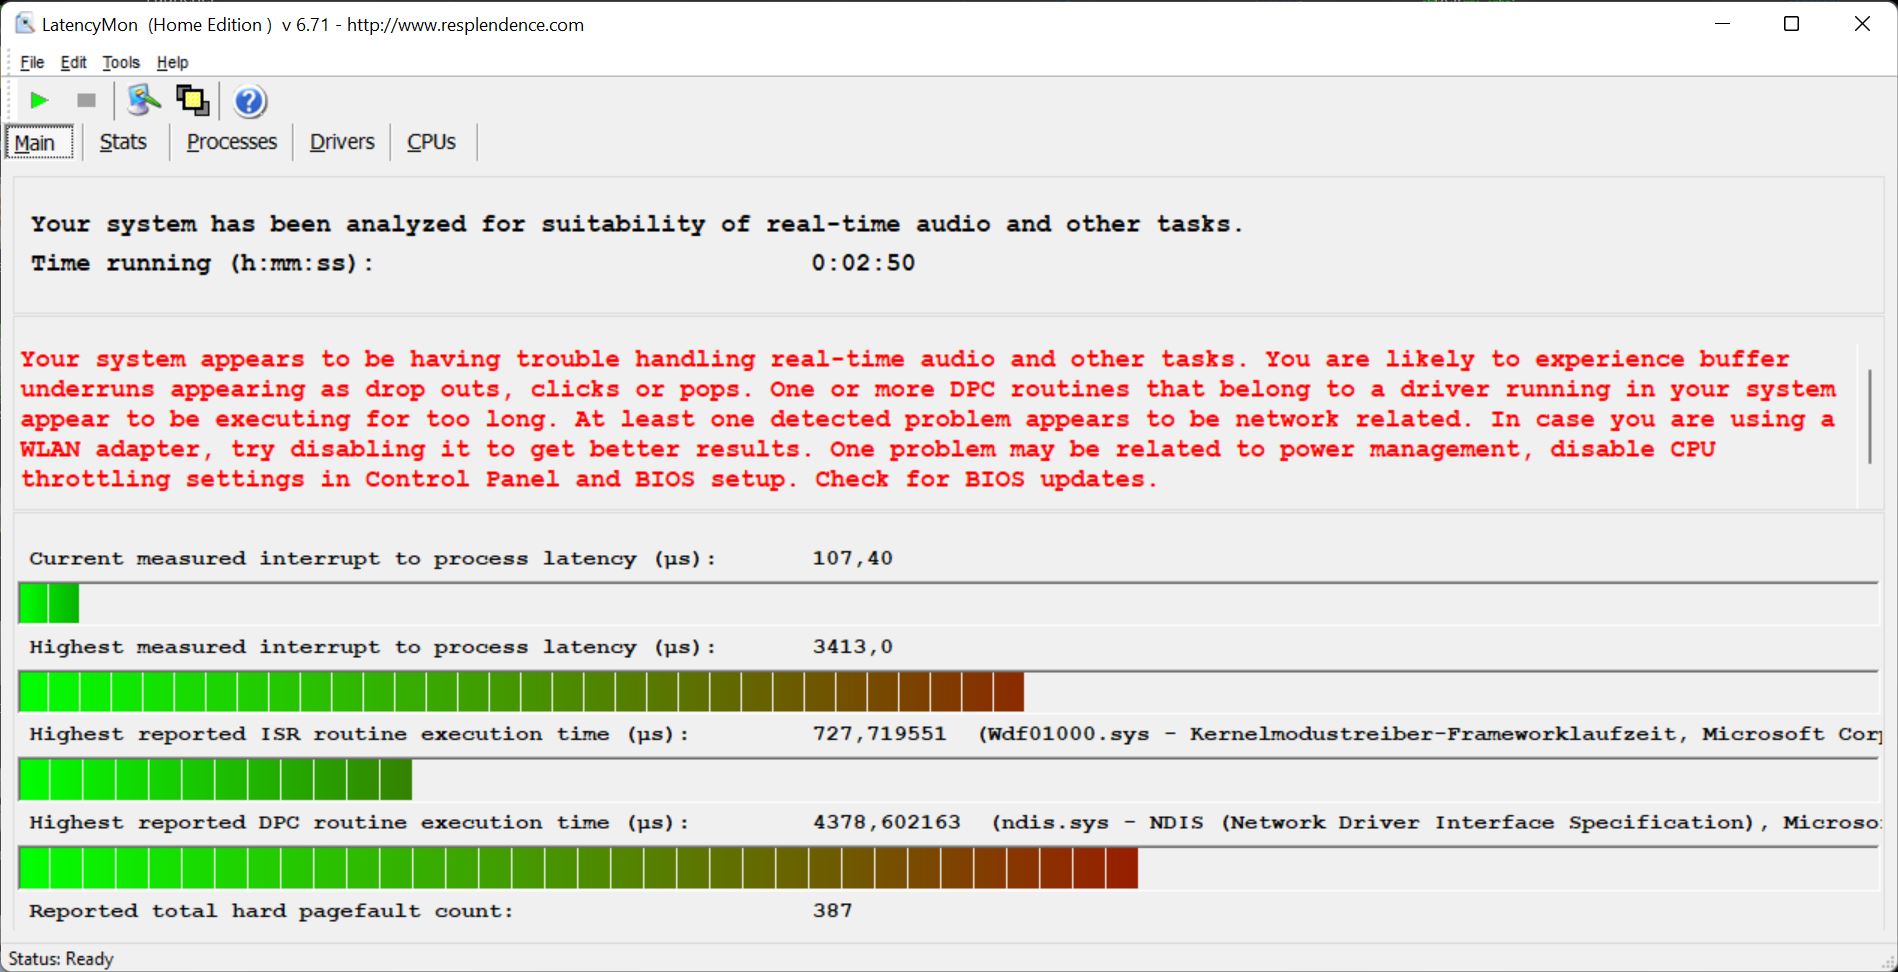
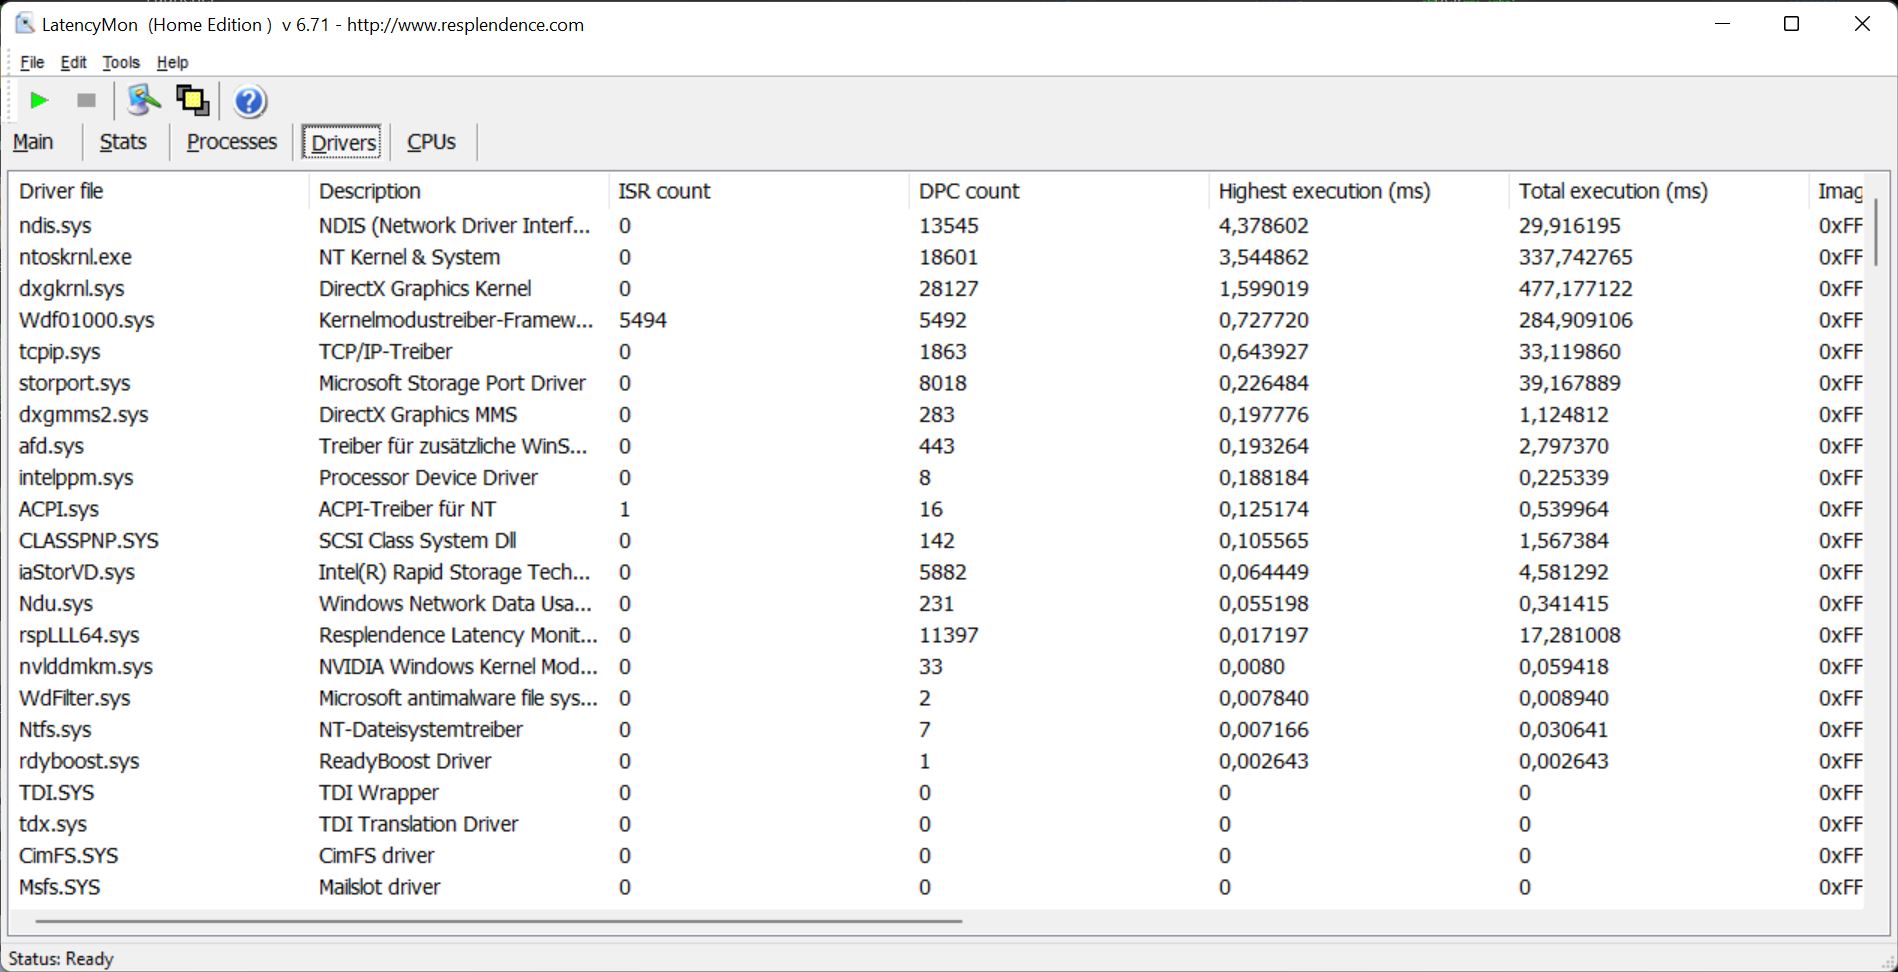
DPC-latenstider
I vårt standardiserade latenstest (surfning på Internet, 4K YouTube-video, CPU-belastning) har vår testenhet med dess BIOS-version vissa problem, så den är inte lämpad för video och ljudbehandling i realtid.
| DPC Latencies / LatencyMon - interrupt to process latency (max), Web, Youtube, Prime95 | |
| Schenker XMG Neo 17 M22 | |
| Asus ROG Strix Scar 17 SE G733CX-LL014W | |
| MSI Titan GT77 12UHS | |
| MSI Titan GT77 12UHS | |
| Lenovo Legion 7 16IAX7-82TD004SGE | |
| Alienware x17 R2 P48E | |
| Asus Strix Scar 17 G733QSA-XS99 | |
* ... mindre är bättre
Lagringslösning
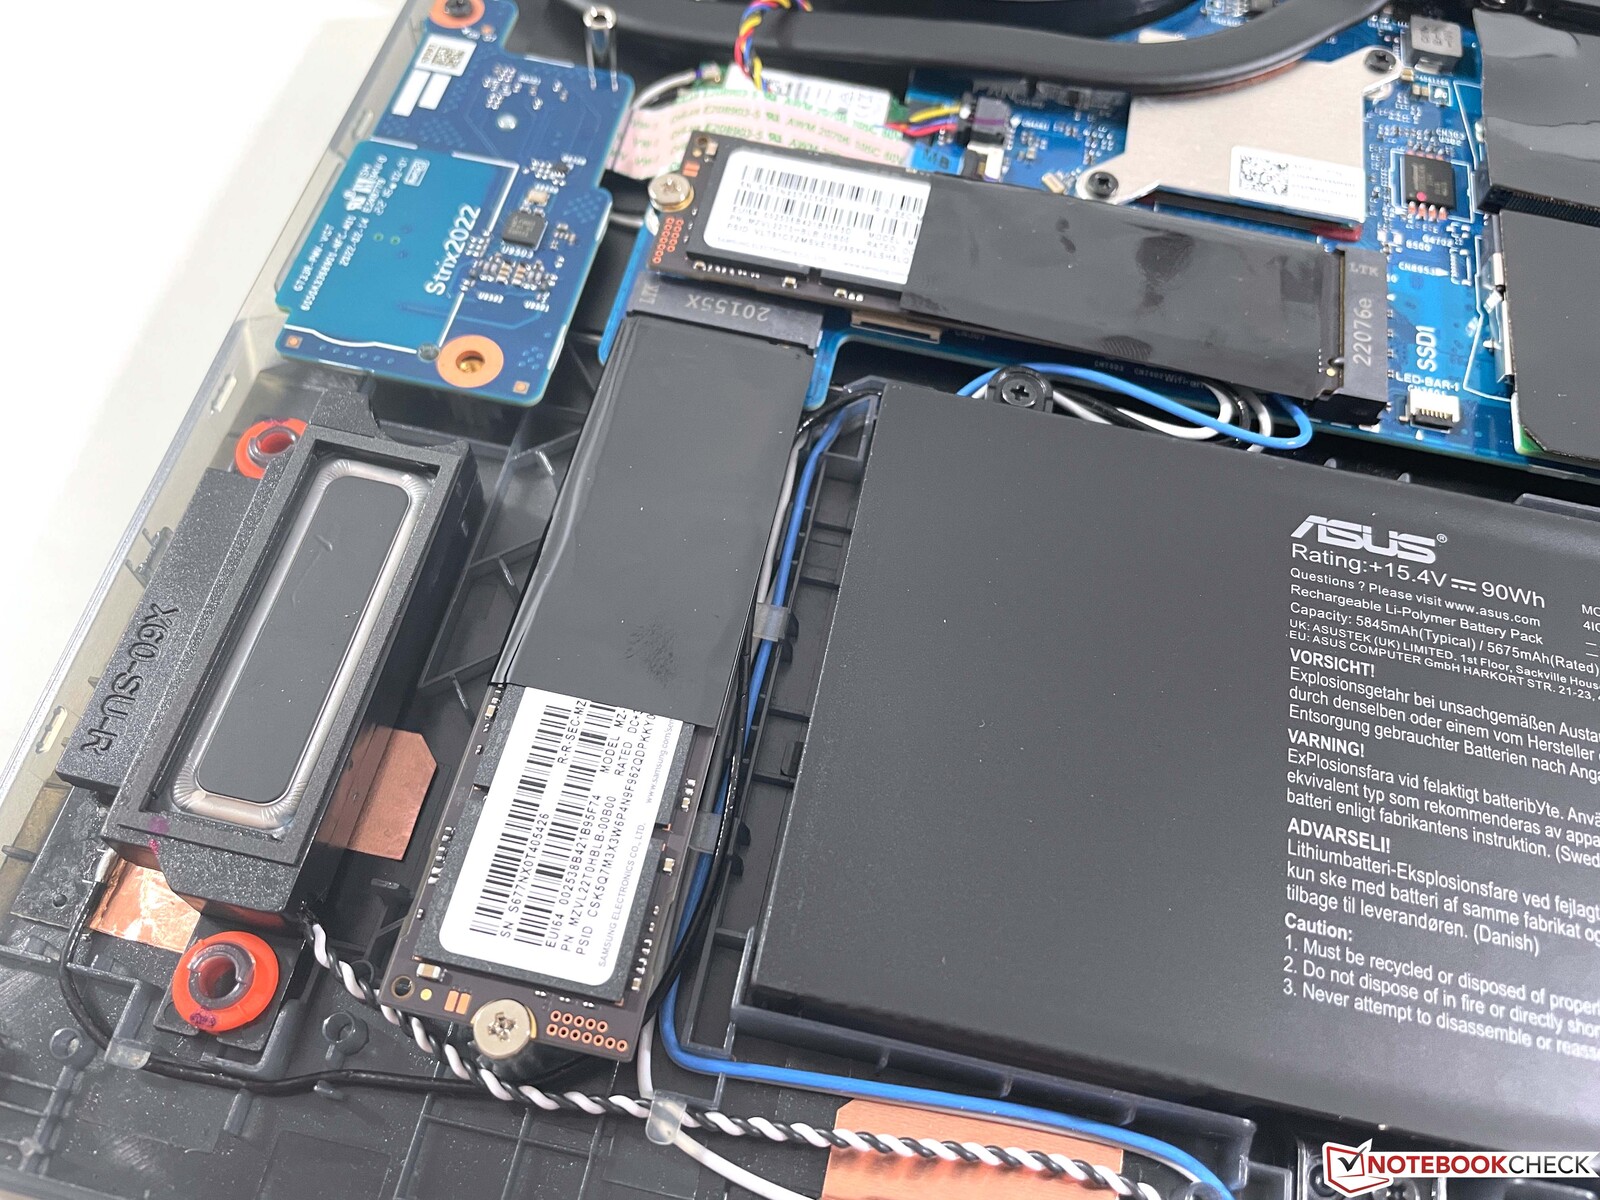
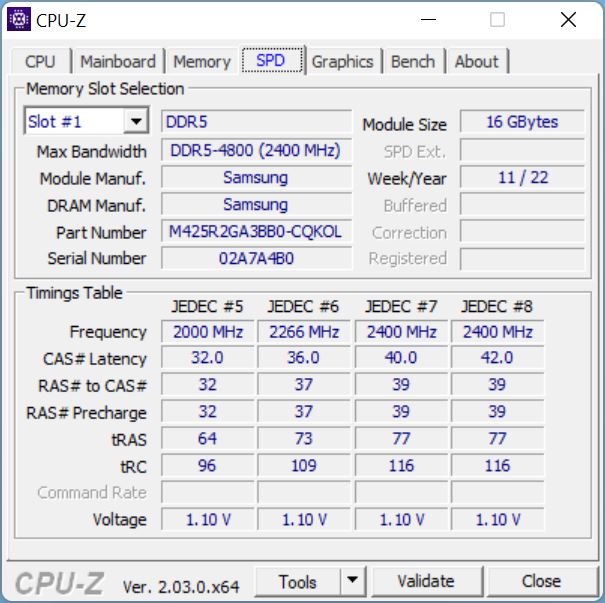
Asus använder två snabba SSD-diskar på 2 TB från Samsung (PM91A) i en RAID 0-konfiguration här. Detta möjliggör extremt höga överföringshastigheter på mer än 10 GB/s. Prestandan förblir dock inte stabil vid konstant belastning, utan sjunker istället massivt. Men det bör inte orsaka några begränsningar under vardagliga spel. Du kan hitta ytterligare SSD-jämförelser här.

* ... mindre är bättre
Disk Throttling: DiskSpd Read Loop, Queue Depth 8
Grafikkort
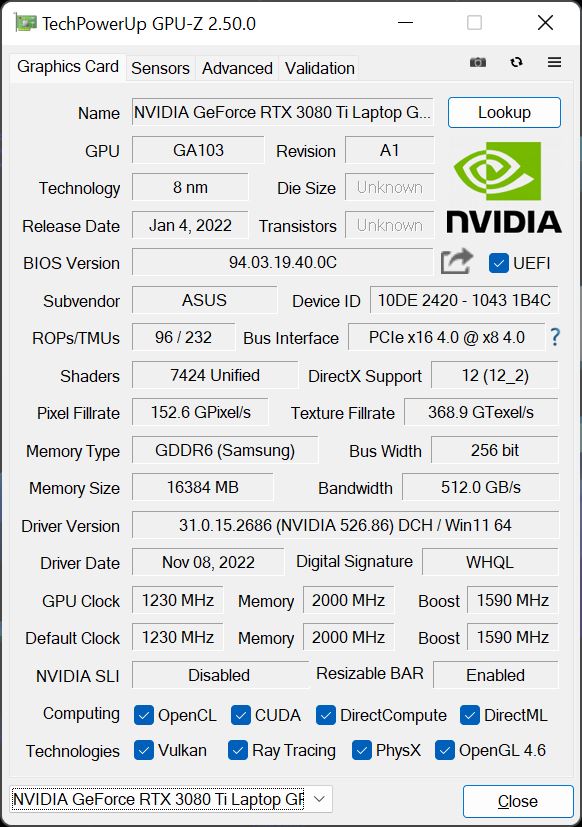
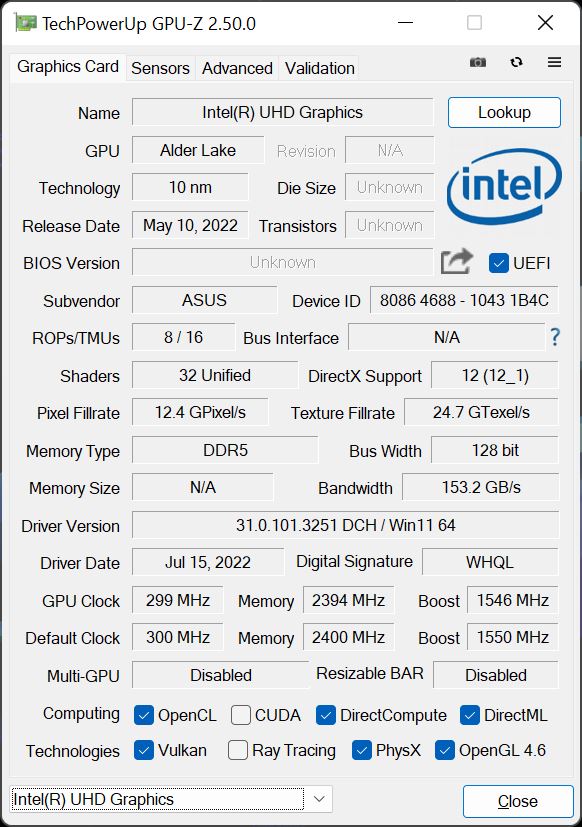
Asus använder denGeForce RTX 3080 Ti versionen med en TGP på 150 watt, och GPU:n kan också använda ytterligare 25 watt Dynamic Boost från processorn. Den uppnår också detta värde (175 watt) i prestandaläget, så det är inte nödvändigt att använda turboläget. Det finns också en MUX som gör det möjligt att helt avaktivera den integrerade GPU:n (kräver en omstart), vilket förbättrar latenserna vid spelande men inte har någon större effekt på själva grafikprestandan
Grafikprestandan hamnar i gruppen av topprestationer och är också högre än genomsnittsvärdena för RTX 3080 Ti i vår databas. Dessutom förblir grafikprestandan helt stabil. Stresstestet 3DMark Time Spy klaras utan problem, och det finns inte heller någon prestandaförlust i vårt The Witcher 3 konstant belastningstest. Spelprestandan är lätt tillräcklig för maximala detaljer i den ursprungliga QHD-upplösningen, även i krävande spel.
Vid batteridrift får GPU:n förbruka maximalt 44 watt, vilket motsvarar en prestandaförlust på cirka 70 %. Du kan hitta ytterligare GPU-jämförelser här.
| 3DMark 11 Performance | 35997 poäng | |
| 3DMark Fire Strike Score | 28793 poäng | |
| 3DMark Time Spy Score | 12904 poäng | |
Hjälp | ||
| Blender / v3.3 Classroom OPTIX/RTX | |
| Genomsnitt NVIDIA GeForce RTX 3080 Ti Laptop GPU (20 - 28, n=13) | |
| Lenovo Legion 7 16IAX7-82TD004SGE | |
| Asus ROG Strix Scar 17 SE G733CX-LL014W | |
| MSI Titan GT77 12UHS | |
| Genomsnitt av klass Gaming (9 - 32, n=111, senaste 2 åren) | |
| Blender / v3.3 Classroom CUDA | |
| Lenovo Legion 7 16IAX7-82TD004SGE | |
| Genomsnitt NVIDIA GeForce RTX 3080 Ti Laptop GPU (32 - 41, n=13) | |
| Asus ROG Strix Scar 17 SE G733CX-LL014W | |
| Genomsnitt av klass Gaming (15 - 228, n=111, senaste 2 åren) | |
| MSI Titan GT77 12UHS | |
| Blender / v3.3 Classroom CPU | |
| Asus ROG Strix Scar 17 SE G733CX-LL014W | |
| Genomsnitt NVIDIA GeForce RTX 3080 Ti Laptop GPU (261 - 429, n=13) | |
| Lenovo Legion 7 16IAX7-82TD004SGE | |
| MSI Titan GT77 12UHS | |
| Genomsnitt av klass Gaming (122 - 565, n=107, senaste 2 åren) | |
* ... mindre är bättre
| The Witcher 3 - 1920x1080 Ultra Graphics & Postprocessing (HBAO+) | |
| Genomsnitt av klass Gaming (95 - 240, n=8, senaste 2 åren) | |
| MSI Titan GT77 12UHS | |
| Alienware x17 R2 P48E | |
| Schenker XMG Neo 17 M22 | |
| Asus ROG Strix Scar 17 SE G733CX-LL014W | |
| Lenovo Legion 7 16IAX7-82TD004SGE | |
| Genomsnitt NVIDIA GeForce RTX 3080 Ti Laptop GPU (30 - 130.6, n=43) | |
| Asus Strix Scar 17 G733QSA-XS99 | |
| F1 22 | |
| 1920x1080 Ultra High Preset AA:T AF:16x | |
| Schenker XMG Neo 17 M22 | |
| Genomsnitt NVIDIA GeForce RTX 3080 Ti Laptop GPU (78.9 - 91, n=4) | |
| MSI Titan GT77 12UHS | |
| Asus ROG Strix Scar 17 SE G733CX-LL014W | |
| Genomsnitt av klass Gaming (40.1 - 121.2, n=5, senaste 2 åren) | |
| 2560x1440 Ultra High Preset AA:T AF:16x | |
| Schenker XMG Neo 17 M22 | |
| Genomsnitt NVIDIA GeForce RTX 3080 Ti Laptop GPU (52.9 - 62, n=2) | |
| Genomsnitt av klass Gaming (42 - 77.8, n=3, senaste 2 åren) | |
| Asus ROG Strix Scar 17 SE G733CX-LL014W | |
The Witcher 3 FPS Chart
| låg | med. | hög | ultra | QHD | |
|---|---|---|---|---|---|
| GTA V (2015) | 186.8 | 180.7 | 126.7 | 114.1 | |
| The Witcher 3 (2015) | 118.8 | ||||
| Dota 2 Reborn (2015) | 211 | 191 | 180.8 | 169.8 | |
| Final Fantasy XV Benchmark (2018) | 173.3 | 156.2 | 118.5 | 92.8 | |
| X-Plane 11.11 (2018) | 165.3 | 143.5 | 116.2 | ||
| Strange Brigade (2018) | 236 | 211 | 157.7 | ||
| F1 2021 (2021) | 236 | 211 | 132.8 | 106.2 | |
| Cyberpunk 2077 1.6 (2022) | 103 | 101 | 98 | 87 | 56 |
| F1 22 (2022) | 235 | 235 | 199.7 | 78.9 | 52.9 |
| Call of Duty Modern Warfare 2 2022 (2022) | 135 | 109 | 107 | 78 |
Utsläpp och energihantering
Bullernivåer
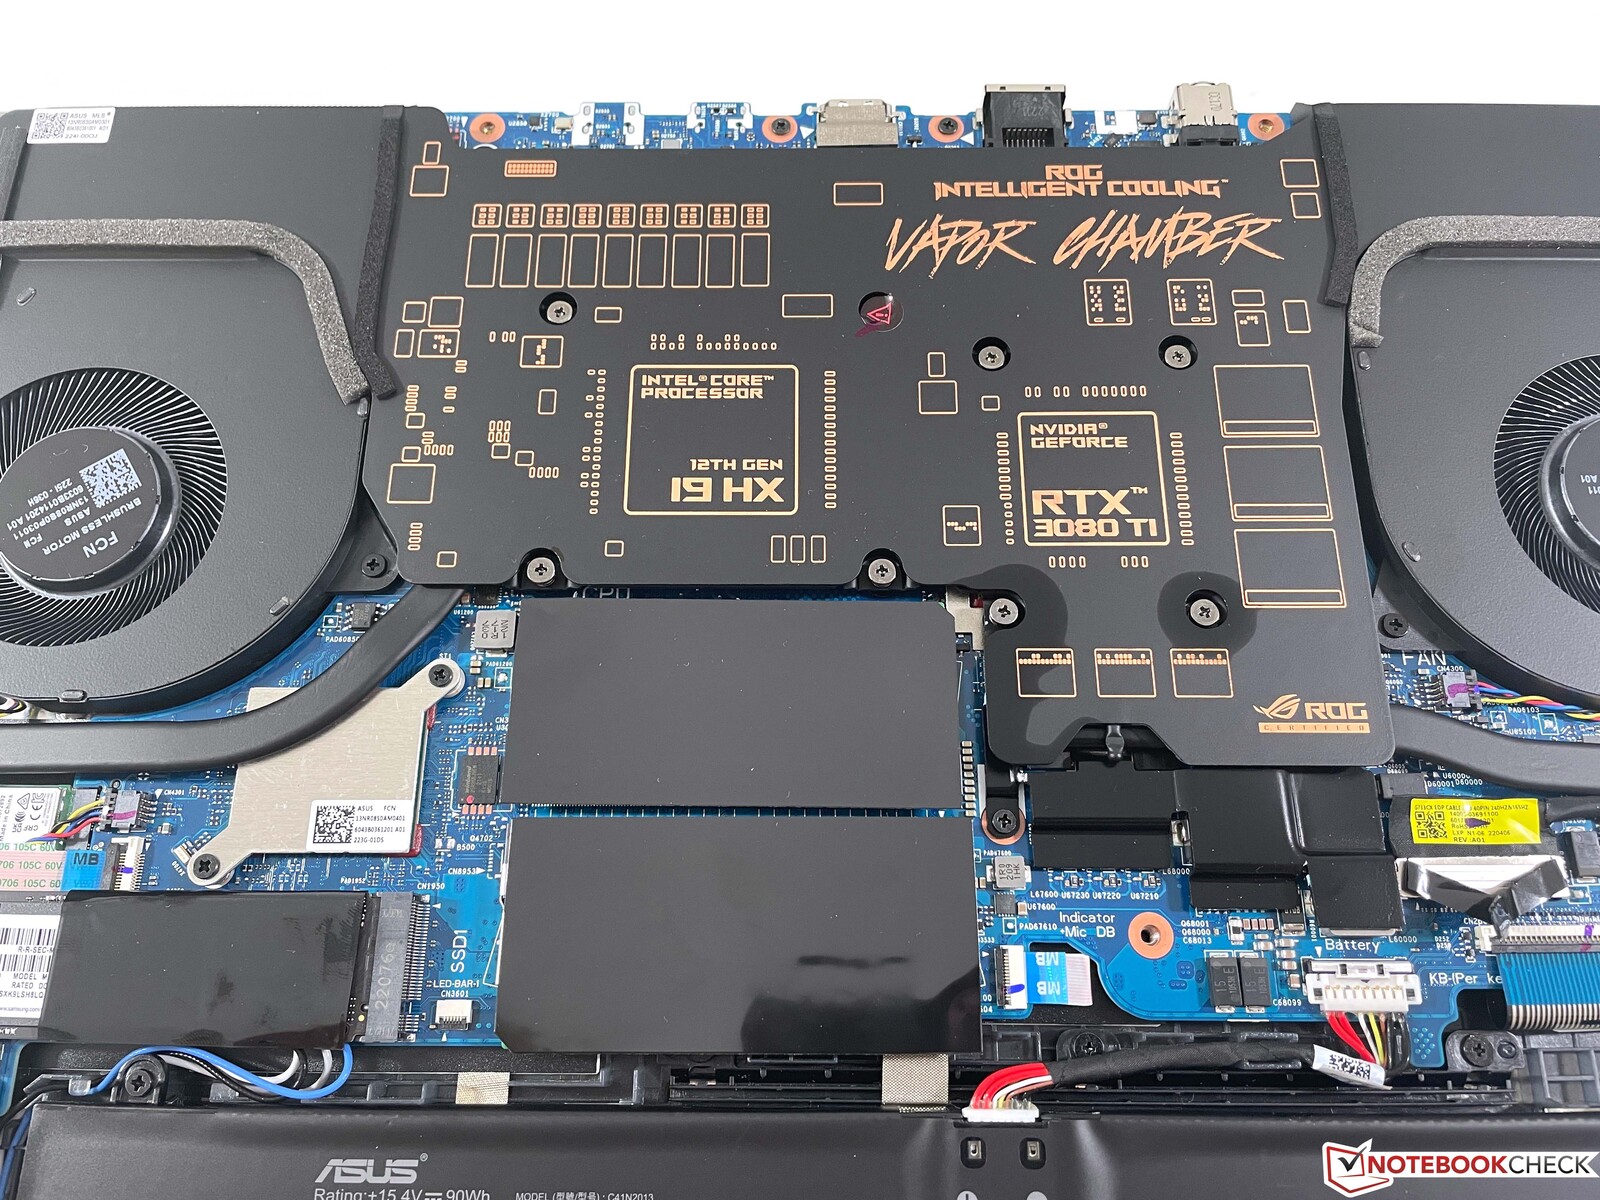
Asus använder sig av ett kylsystem med ångkammare här. I strömläget Performance förblir enheten också relativt tyst, och vi kan mäta högst 46 dB(A) under stresstestet och under spelandet. Detta är naturligtvis fortfarande märkbart, men vår testenhet är ändå betydligt tystare med detta än konkurrenterna. I turboläget är spelprestandan endast obetydligt högre, men de två löpande fläktarna ger upphov till högljudda 54 dB(A). Under tomgångsdrift förblir fläktarna ofta avstängda, men vi märker nästan alltid av några tysta elektroniska ljud. Under belastning finns det också något hörbart spolviftande som kommer från GPU:n, gissar vi.
Ljudnivå
| Låg belastning |
| 23.9 / 23.9 / 23.9 dB(A) |
| Hög belastning |
| 34.3 / 45.9 dB(A) |
 | ||
30 dB tyst 40 dB(A) hörbar 50 dB(A) högt ljud |
||
min: | ||
| Asus ROG Strix Scar 17 SE G733CX-LL014W GeForce RTX 3080 Ti Laptop GPU, i9-12950HX, Samsung PM9A1 MZVL22T0HBLB | Lenovo Legion 7 16IAX7-82TD004SGE GeForce RTX 3080 Ti Laptop GPU, i9-12900HX, Micron 3400 1TB MTFDKBA1T0TFH | MSI Titan GT77 12UHS GeForce RTX 3080 Ti Laptop GPU, i9-12900HX, Samsung PM9A1 MZVL21T0HCLR | Schenker XMG Neo 17 M22 GeForce RTX 3080 Ti Laptop GPU, R9 6900HX, Samsung SSD 980 Pro 1TB MZ-V8P1T0BW | Alienware x17 R2 P48E GeForce RTX 3080 Ti Laptop GPU, i9-12900HK, 2x Samsung PM9A1 1TB (RAID 0) | Asus Strix Scar 17 G733QSA-XS99 GeForce RTX 3080 Laptop GPU, R9 5900HX, 2x Samsung PM981a MZVLB1T0HBLR (RAID 0) | |
|---|---|---|---|---|---|---|
| Noise | -19% | -9% | -27% | 1% | -4% | |
| av / miljö * (dB) | 23.9 | 24.5 -3% | 21.9 8% | 26 -9% | 22.7 5% | 25 -5% |
| Idle Minimum * (dB) | 23.9 | 24.5 -3% | 24.53 -3% | 26 -9% | 23.1 3% | 25.2 -5% |
| Idle Average * (dB) | 23.9 | 30 -26% | 24.53 -3% | 29 -21% | 23.1 3% | 25.2 -5% |
| Idle Maximum * (dB) | 23.9 | 32.5 -36% | 24.53 -3% | 40 -67% | 23.1 3% | 25.2 -5% |
| Load Average * (dB) | 34.3 | 43.9 -28% | 46.25 -35% | 47 -37% | 31.9 7% | 30.7 10% |
| Load Maximum * (dB) | 45.9 | 54.2 -18% | 54.25 -18% | 54 -18% | 52.5 -14% | 51.3 -12% |
| Witcher 3 ultra * (dB) | 48.8 | 56.86 | 52 | 52.5 | 51.3 |
* ... mindre är bättre
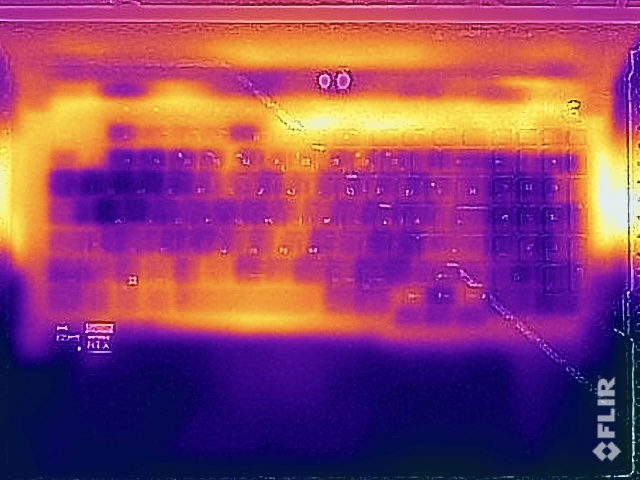
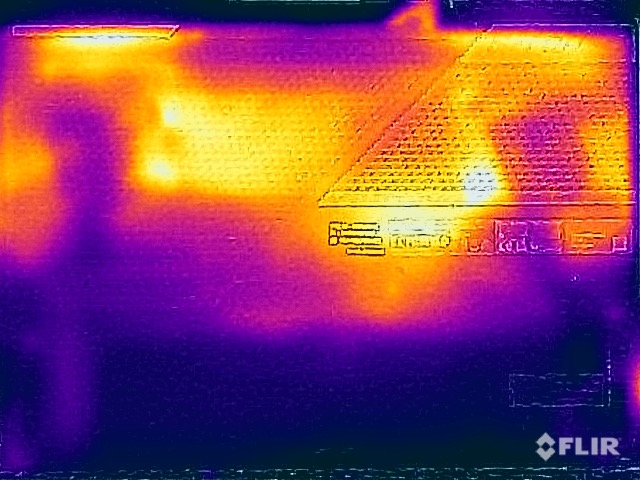
Temperatur
Trots de relativt tysta fläktarna ger yttemperaturerna ingen anledning till oro. Även om vi mäter mer än 50 °C (122 °F) på några isolerade ställen under belastning, förblir tangentbordet mycket svalt och det finns inga begränsningar alls under spelandet
Under stresstestet får GPU:n förmånsbehandling och körs stabilt på 150 watt så snart processorn har planat ut på cirka 36 watt. Det finns ingen prestandaförlust direkt efter stresstestet.
(-) Den maximala temperaturen på ovansidan är 48.8 °C / 120 F, jämfört med genomsnittet av 40.4 °C / 105 F , allt från 21.2 till 68.8 °C för klassen Gaming.
(-) Botten värms upp till maximalt 52.4 °C / 126 F, jämfört med genomsnittet av 43.2 °C / 110 F
(+) Vid tomgångsbruk är medeltemperaturen för ovansidan 28.6 °C / 83 F, jämfört med enhetsgenomsnittet på 33.9 °C / ### class_avg_f### F.
(±) När du spelar The Witcher 3 är medeltemperaturen för ovansidan 35.1 °C / 95 F, jämfört med enhetsgenomsnittet på 33.9 °C / ## #class_avg_f### F.
(+) Handledsstöden och pekplattan är kallare än hudtemperaturen med maximalt 26 °C / 78.8 F och är därför svala att ta på.
(+) Medeltemperaturen för handledsstödsområdet på liknande enheter var 28.8 °C / 83.8 F (+2.8 °C / 5 F).
| Asus ROG Strix Scar 17 SE G733CX-LL014W Intel Core i9-12950HX, NVIDIA GeForce RTX 3080 Ti Laptop GPU | Lenovo Legion 7 16IAX7-82TD004SGE Intel Core i9-12900HX, NVIDIA GeForce RTX 3080 Ti Laptop GPU | MSI Titan GT77 12UHS Intel Core i9-12900HX, NVIDIA GeForce RTX 3080 Ti Laptop GPU | Schenker XMG Neo 17 M22 AMD Ryzen 9 6900HX, NVIDIA GeForce RTX 3080 Ti Laptop GPU | Alienware x17 R2 P48E Intel Core i9-12900HK, NVIDIA GeForce RTX 3080 Ti Laptop GPU | Asus Strix Scar 17 G733QSA-XS99 AMD Ryzen 9 5900HX, NVIDIA GeForce RTX 3080 Laptop GPU | |
|---|---|---|---|---|---|---|
| Heat | -8% | -3% | 1% | 7% | 4% | |
| Maximum Upper Side * (°C) | 48.8 | 44.4 9% | 40.8 16% | 49 -0% | 49.6 -2% | 40 18% |
| Maximum Bottom * (°C) | 52.4 | 60.8 -16% | 52.4 -0% | 52 1% | 42.4 19% | 39.8 24% |
| Idle Upper Side * (°C) | 30.4 | 33.8 -11% | 34.6 -14% | 30 1% | 29.2 4% | 34.6 -14% |
| Idle Bottom * (°C) | 34.1 | 38.8 -14% | 38.4 -13% | 33 3% | 32 6% | 38.4 -13% |
* ... mindre är bättre
Högtalare
Ljudanläggningen består av totalt fyra moduler som ger ett kraftfullt och rymligt ljud. Även om högtalarna inte är de mest högljudda på marknaden är kvaliteten överlag mycket bra. På grund av det höga fläktljudet under spelande rekommenderar vi dock fortfarande ett headset.
Asus ROG Strix Scar 17 SE G733CX-LL014W ljudanalys
(±) | högtalarljudstyrkan är genomsnittlig men bra (73.3 dB)
Bas 100 - 315 Hz
(±) | reducerad bas - i genomsnitt 6.2% lägre än medianen
(±) | linjäriteten för basen är genomsnittlig (7.5% delta till föregående frekvens)
Mellan 400 - 2000 Hz
(+) | balanserad mellan - endast 2% från medianen
(+) | mids är linjära (3.9% delta till föregående frekvens)
Högsta 2 - 16 kHz
(+) | balanserade toppar - endast 3.5% från medianen
(±) | linjäriteten för toppar är genomsnittlig (9.3% delta till föregående frekvens)
Totalt 100 - 16 000 Hz
(+) | det totala ljudet är linjärt (13.6% skillnad mot median)
Jämfört med samma klass
» 20% av alla testade enheter i den här klassen var bättre, 7% liknande, 73% sämre
» Den bästa hade ett delta på 6%, genomsnittet var 18%, sämst var 132%
Jämfört med alla testade enheter
» 15% av alla testade enheter var bättre, 4% liknande, 82% sämre
» Den bästa hade ett delta på 4%, genomsnittet var 24%, sämst var 134%
MSI Titan GT77 12UHS ljudanalys
(+) | högtalare kan spela relativt högt (83.4 dB)
Bas 100 - 315 Hz
(-) | nästan ingen bas - i genomsnitt 71.8% lägre än medianen
(+) | basen är linjär (0% delta till föregående frekvens)
Mellan 400 - 2000 Hz
(-) | nästan inga mids - i genomsnitt 71.8% lägre än medianen
(+) | mids är linjära (0% delta till föregående frekvens)
Högsta 2 - 16 kHz
(-) | nästan inga toppar - i genomsnitt 71.8% lägre än medianen
(+) | toppar är linjära (0% delta till föregående frekvens)
Totalt 100 - 16 000 Hz
(-) | det totala ljudet är inte linjärt (107.7% skillnad mot median)
Jämfört med samma klass
» 100% av alla testade enheter i den här klassen var bättre, 0% liknande, 0% sämre
» Den bästa hade ett delta på 6%, genomsnittet var 18%, sämst var 132%
Jämfört med alla testade enheter
» 96% av alla testade enheter var bättre, 0% liknande, 4% sämre
» Den bästa hade ett delta på 4%, genomsnittet var 24%, sämst var 134%
Effektförbrukning
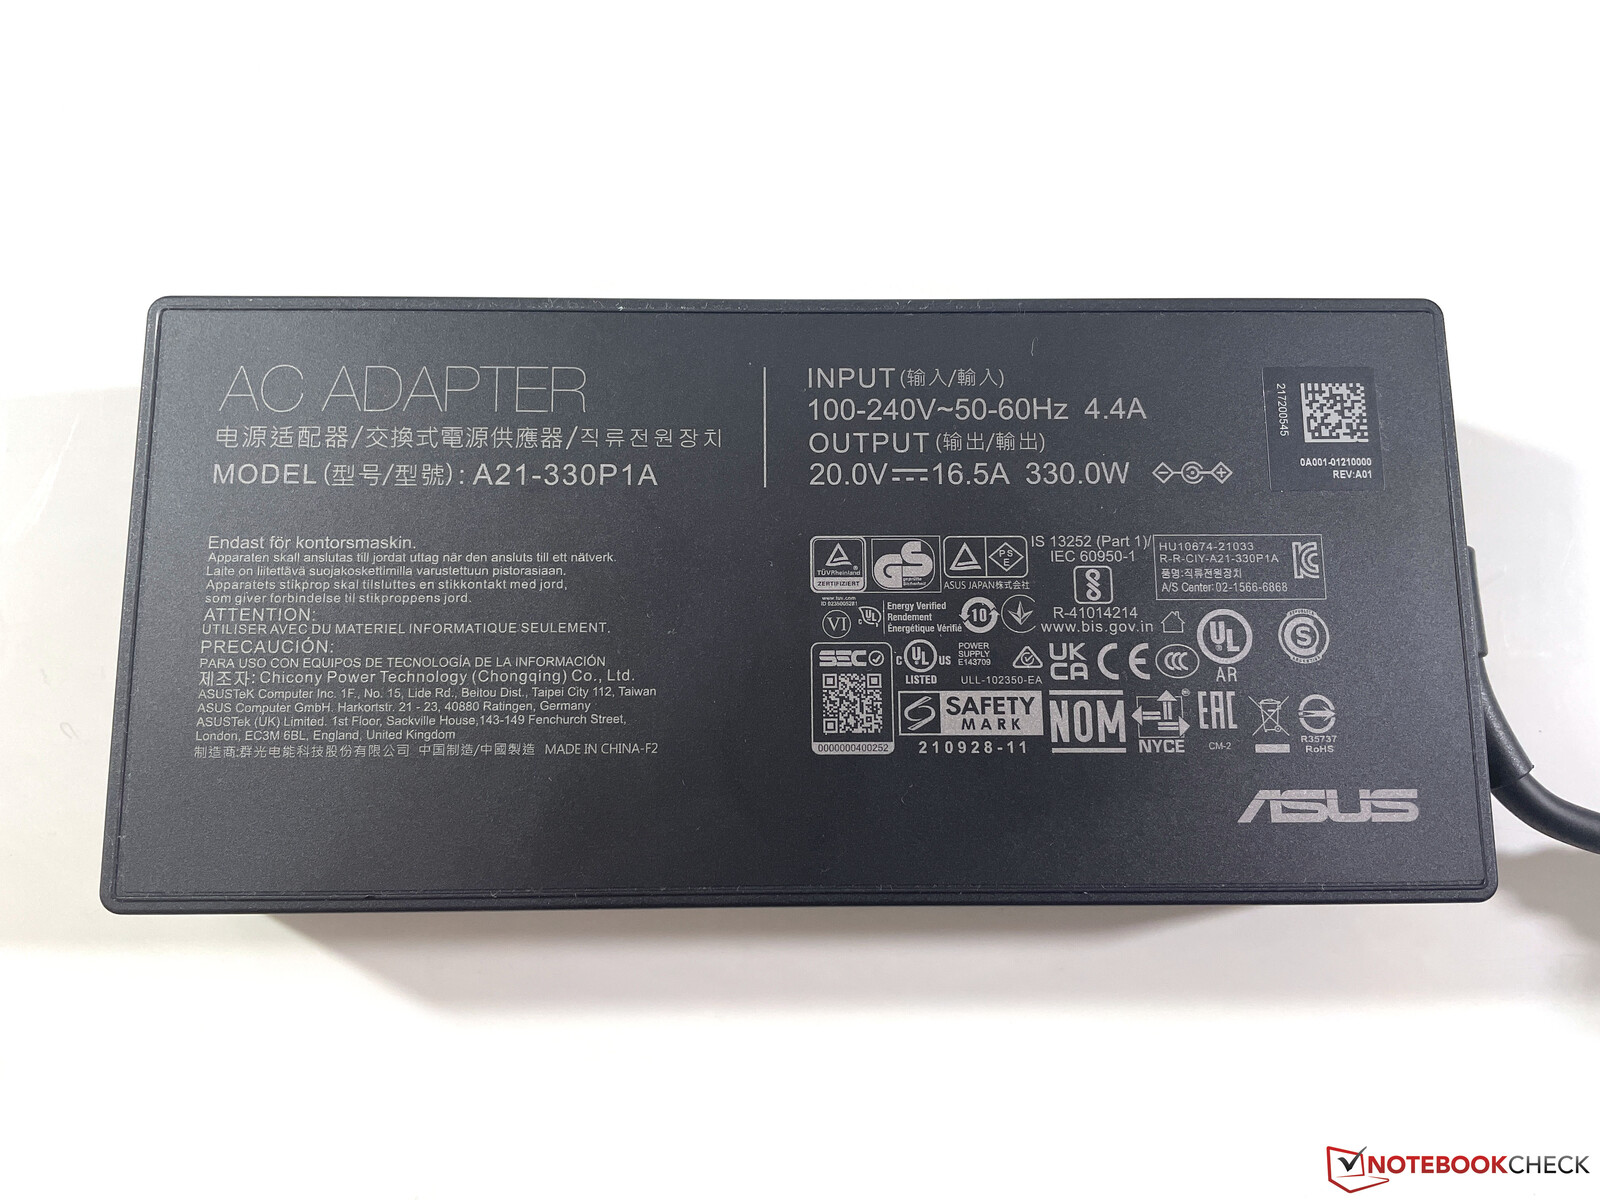
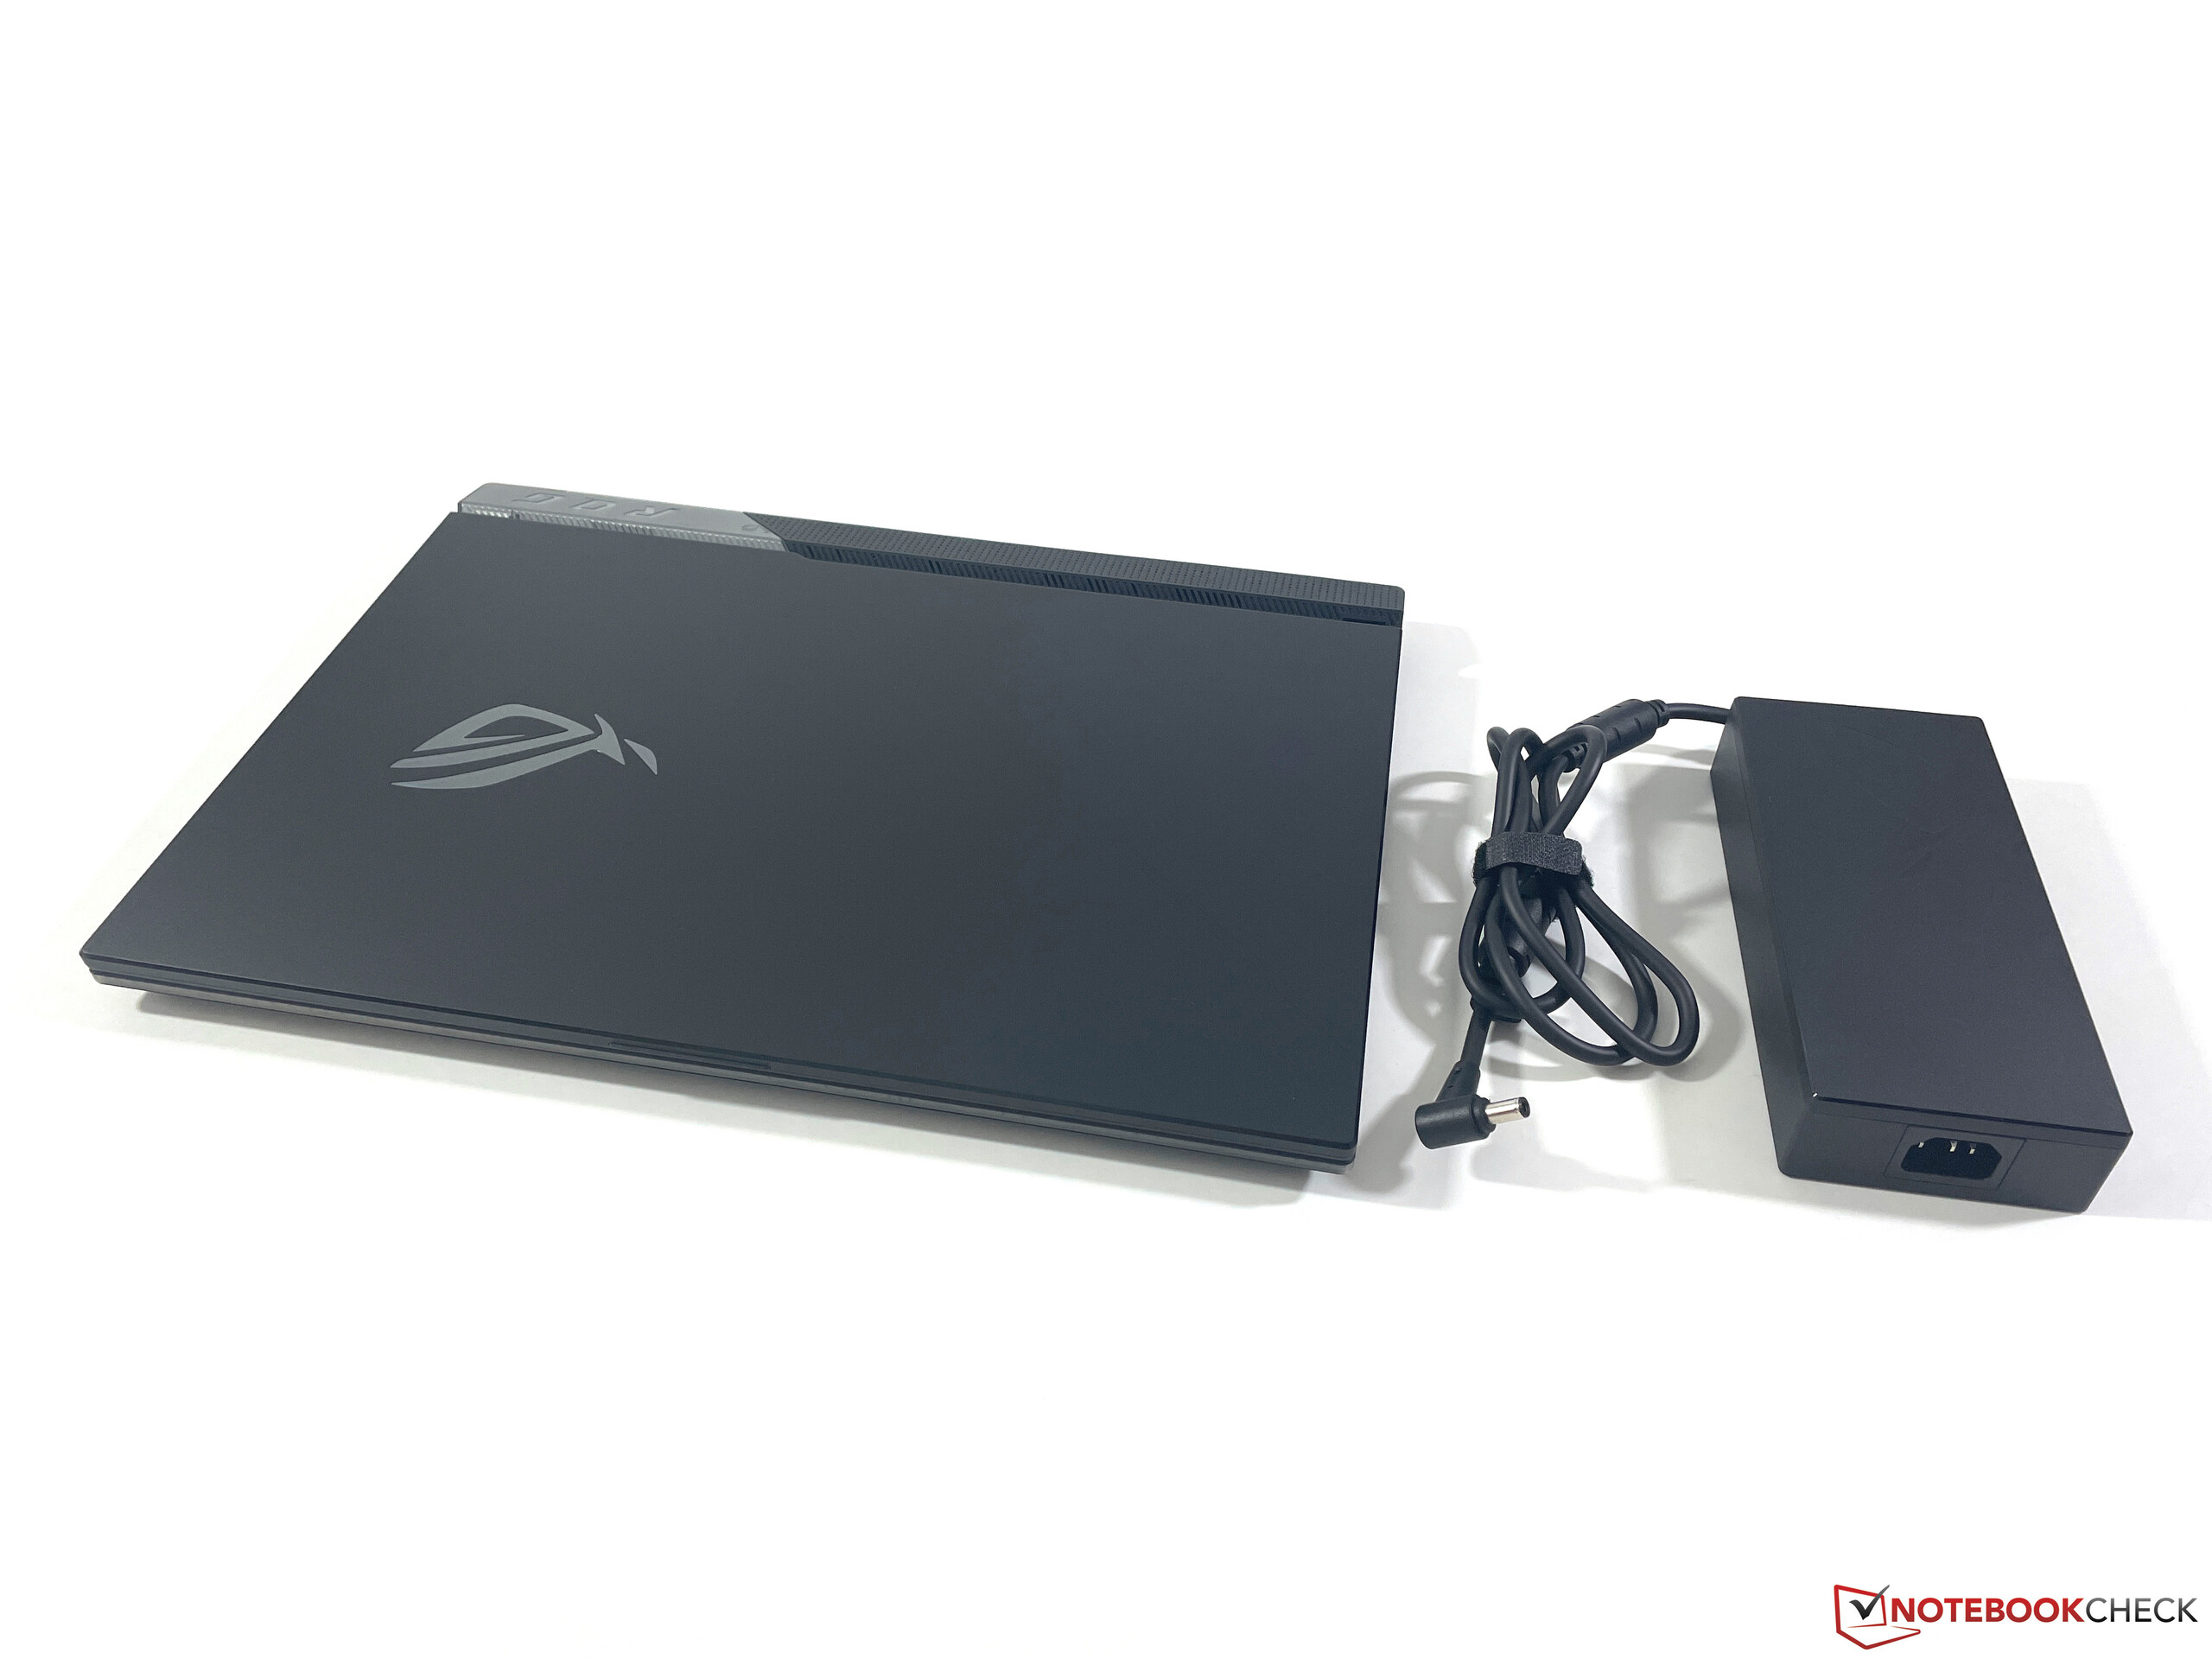
ROG Strix Scar 17 SE är inte en särskilt effektiv bärbar dator, vilket inte är särskilt förvånande med tanke på den kraftfulla hårdvaran. Vi mäter redan upp till 27 watt vid tomgångsdrift, och när du spelar ökar värdet till cirka 230 watt. Strömförsörjningen på 330 watt är därför tillräckligt stor. Standbyförbrukningen är också ganska hög på 2,6 watt, men det beror på de ljuseffekter som är aktiverade som standard.
| Av/Standby | |
| Låg belastning | |
| Hög belastning |
|
Förklaring:
min: | |
Power Consumption The Witcher 3 / Stress Test
Power Consumption With External Monitor
Batteritid
I vårt WLAN-test med 150 cd/m², vilket motsvarar 48 % av den maximala ljusstyrkan, klarar sig vår testenhet bara i cirka 4 timmar. Med tanke på de höga förbrukningsvärdena är detta inte särskilt förvånande. Några av konkurrenterna håller betydligt längre här, om du behöver överbrygga tiderna borta från eluttaget. Spelande är möjligt i ungefär en timme, men endast med en betydande prestandaförlust. Det tar cirka 100 minuter att ladda upp 90-Wh-batteriet helt och hållet, med 80 % av kapaciteten tillgänglig redan efter cirka 53 minuter.
För
Emot
Slutsats - En fullt utrustad och snabb spellaptop
Den aktuella Asus ROG Strix Scar 17 SE levererar verkligen allt en spelares hjärta önskar. En snabb QHD-panel med 240 Hz tillsammans med GeForce RTX 3080 Ti, som också erbjuder tillräckligt med kraft för den ursprungliga upplösningen i maximala detaljer. Även om CPU-prestandan också är bra för en bärbar dator för spel, kan potentialen hos HX-processorn inte utnyttjas fullt ut. Du bör därför spara dig den extra premien för den kraftfullare processorn och bara välja en vanlig Core i9
Andra fördelar är de mycket exakta färgerna, om du till exempel måste arbeta direkt med videobearbetning, de måttliga yttemperaturerna och de relativt tysta fläktarna under spelandet. Även om det finns ett turboläge som också blir betydligt högre, har detta inte någon större inverkan på spelprestandan, så det är inte värt det enligt vår åsikt
Nya Asus ROG Strix Scar 17 SE erbjuder gott om prestanda och spelfunktioner, men du bör spara in på den extra kostnaden för Intel HX-processorn.
Konkurrenterna på spelmarknaden erbjuder liknande prestandaspecifikationer men också ljusare skärmar i delar och mindre flashiga höljen. Dessutom kan elektroniska ljud bli irriterande i längden.
Pris och tillgänglighet
Vår testkonfiguration av ROG Strix Scar 17 SE finns på Amazon för 3899 kr, och en mindre konfiguration med den vanliga Core i9-12900H finns också tillgänglig där för $2278.
Asus ROG Strix Scar 17 SE G733CX-LL014W
- 11/18/2022 v7 (old)
Andreas Osthoff
Price comparison

