MSI Titan GT77 HX 13V Review - Ultimativ bärbar dator för spel med RTX 4090 och Core i9-13950HX
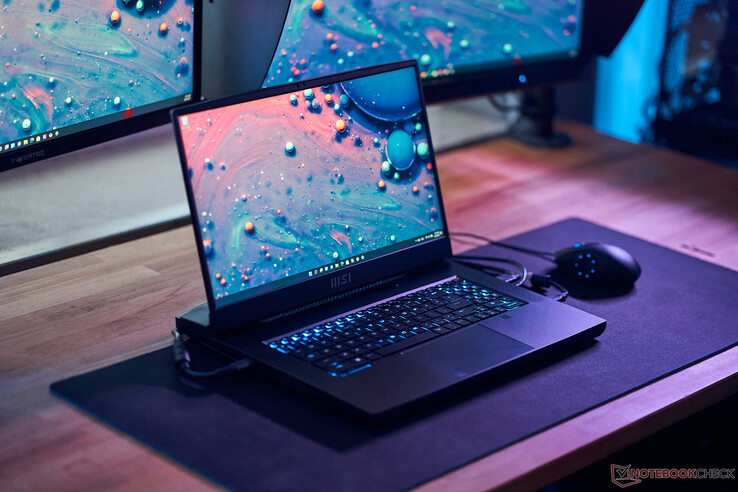
MSI:s Titan GT77-serie erbjuder bärbara toppmodeller för spel som är utformade för maximal prestanda. Den nya 2023-modellen GT77 HX 13VI fortsätter detta koncept och använder några av de bästa mobila komponenterna som finns tillgängliga. Förutom de senaste Raptor Lake-HX CPU:erna från Intel kan du också njuta av de helt nya bärbara GPU:erna för bärbara datorer från Nvidia: GeForce.RTX 4080eller GeForce RTX 4090. MSI utrustar också den nya GT77 med en 4K Mini-LED-skärm med en uppdateringsfrekvens på 144 Hz.
Vår recensionsenhet är en förproduktionsenhet medCore i9-13950HX, GeForce RTX 4090, 64 GB RAM, 4 TB SSD-lagring och 4K Mini-LED-skärm. Konfigurationer för detaljhandeln (GT77 HX 13VI) med samma specifikationer kommer att levereras medCore i9-13980HX(något högre klockfrekvens, men inget vPro-stöd i gengäld) för ett prisbasbelopp på 6599 euro i Tyskland (5299 kr); SKU:n med RTX 4080 och 2 TB SSD-lagring säljs för 5499 euro (GT77 HX 13VH, 4299 kr).
Potentiella konkurrenter i jämförelse
Gradering | Datum | Modell | Vikt | Höjd | Storlek | Upplösning | Pris |
|---|---|---|---|---|---|---|---|
| 89 % v7 (old) | 02/2023 | MSI Titan GT77 HX 13VI i9-13950HX, GeForce RTX 4090 Laptop GPU | 3.5 kg | 23 mm | 17.30" | 3840x2160 | |
| 91.2 % v7 (old) | 02/2023 | Razer Blade 16 Early 2023 i9-13950HX, GeForce RTX 4080 Laptop GPU | 2.4 kg | 21.99 mm | 16.00" | 2560x1600 | |
| 86.9 % v7 (old) | 11/2022 | Asus ROG Strix Scar 17 SE G733CX-LL014W i9-12950HX, GeForce RTX 3080 Ti Laptop GPU | 2.9 kg | 28.3 mm | 17.30" | 2560x1440 | |
| 88.3 % v7 (old) | 08/2022 | MSI Titan GT77 12UHS i9-12900HX, GeForce RTX 3080 Ti Laptop GPU | 3.3 kg | 23 mm | 17.30" | 1920x1080 | |
| 89.2 % v7 (old) | 05/2022 | Alienware x17 R2 P48E i9-12900HK, GeForce RTX 3080 Ti Laptop GPU | 3.1 kg | 20.9 mm | 17.30" | 1920x1080 | |
| 87.6 % v7 (old) | 09/2022 | Schenker XMG Neo 17 M22 R9 6900HX, GeForce RTX 3080 Ti Laptop GPU | 2.8 kg | 27 mm | 17.00" | 2560x1600 |
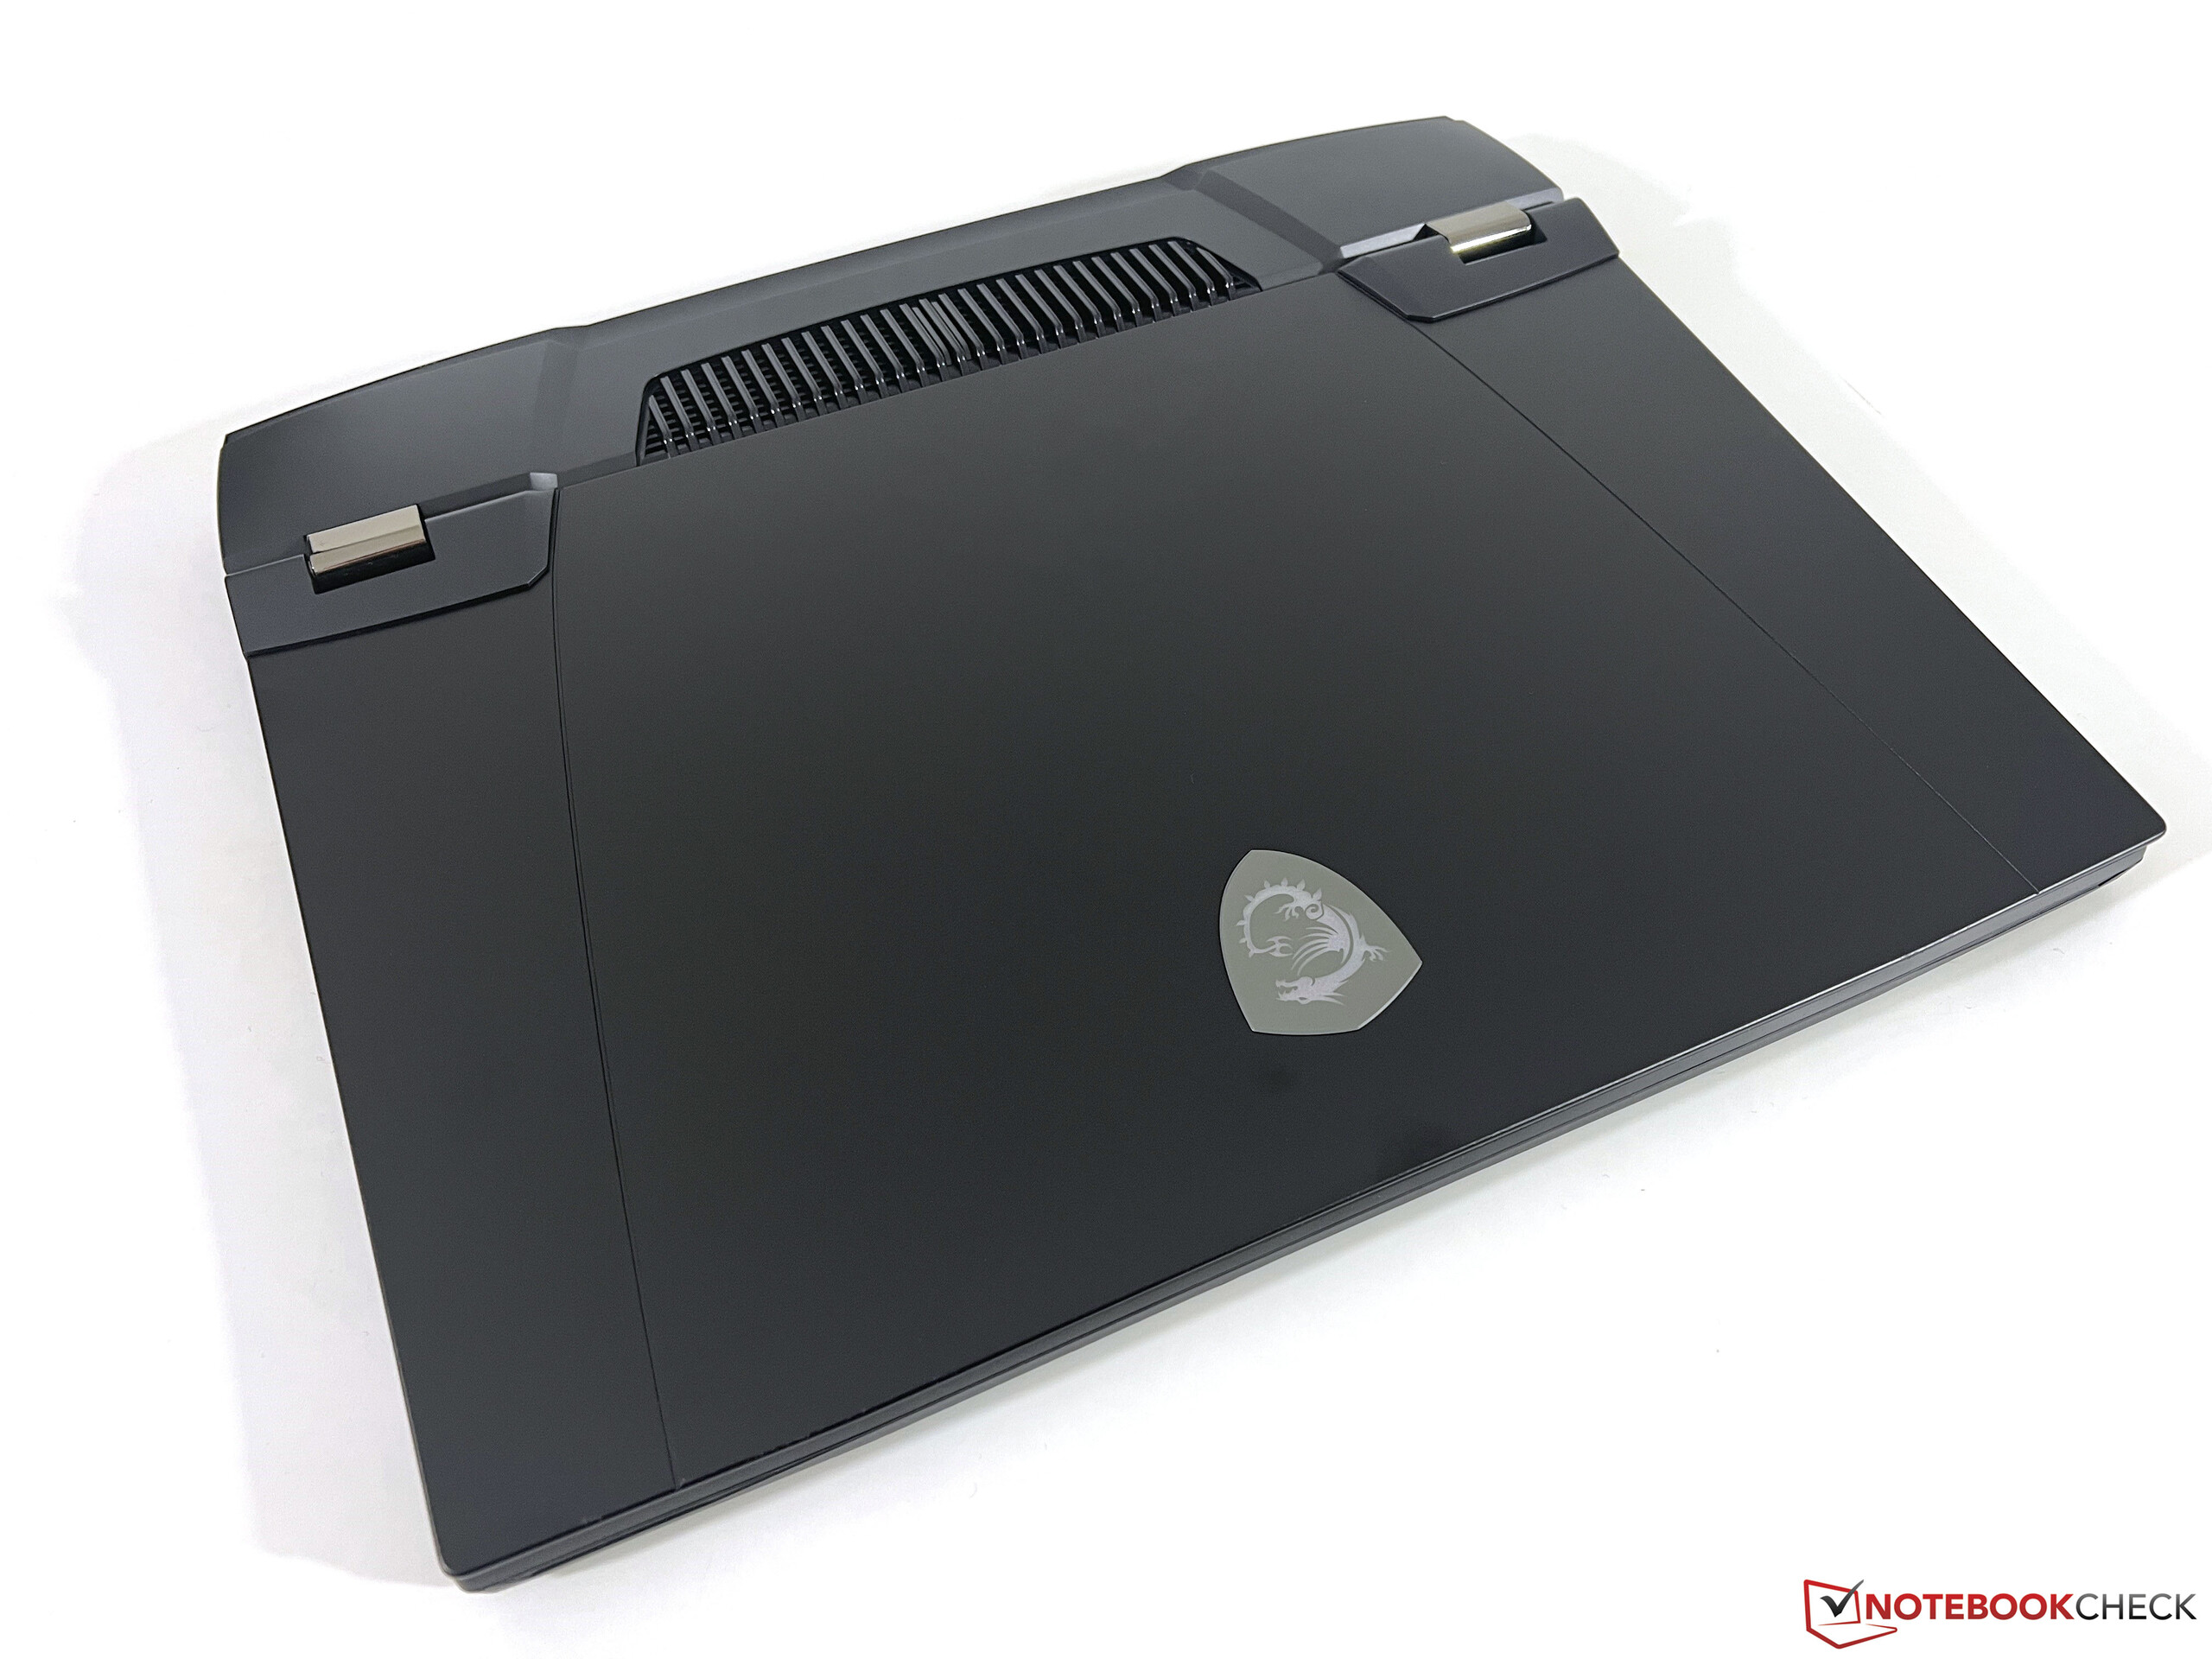
Fall - Titan med begränsad belysning
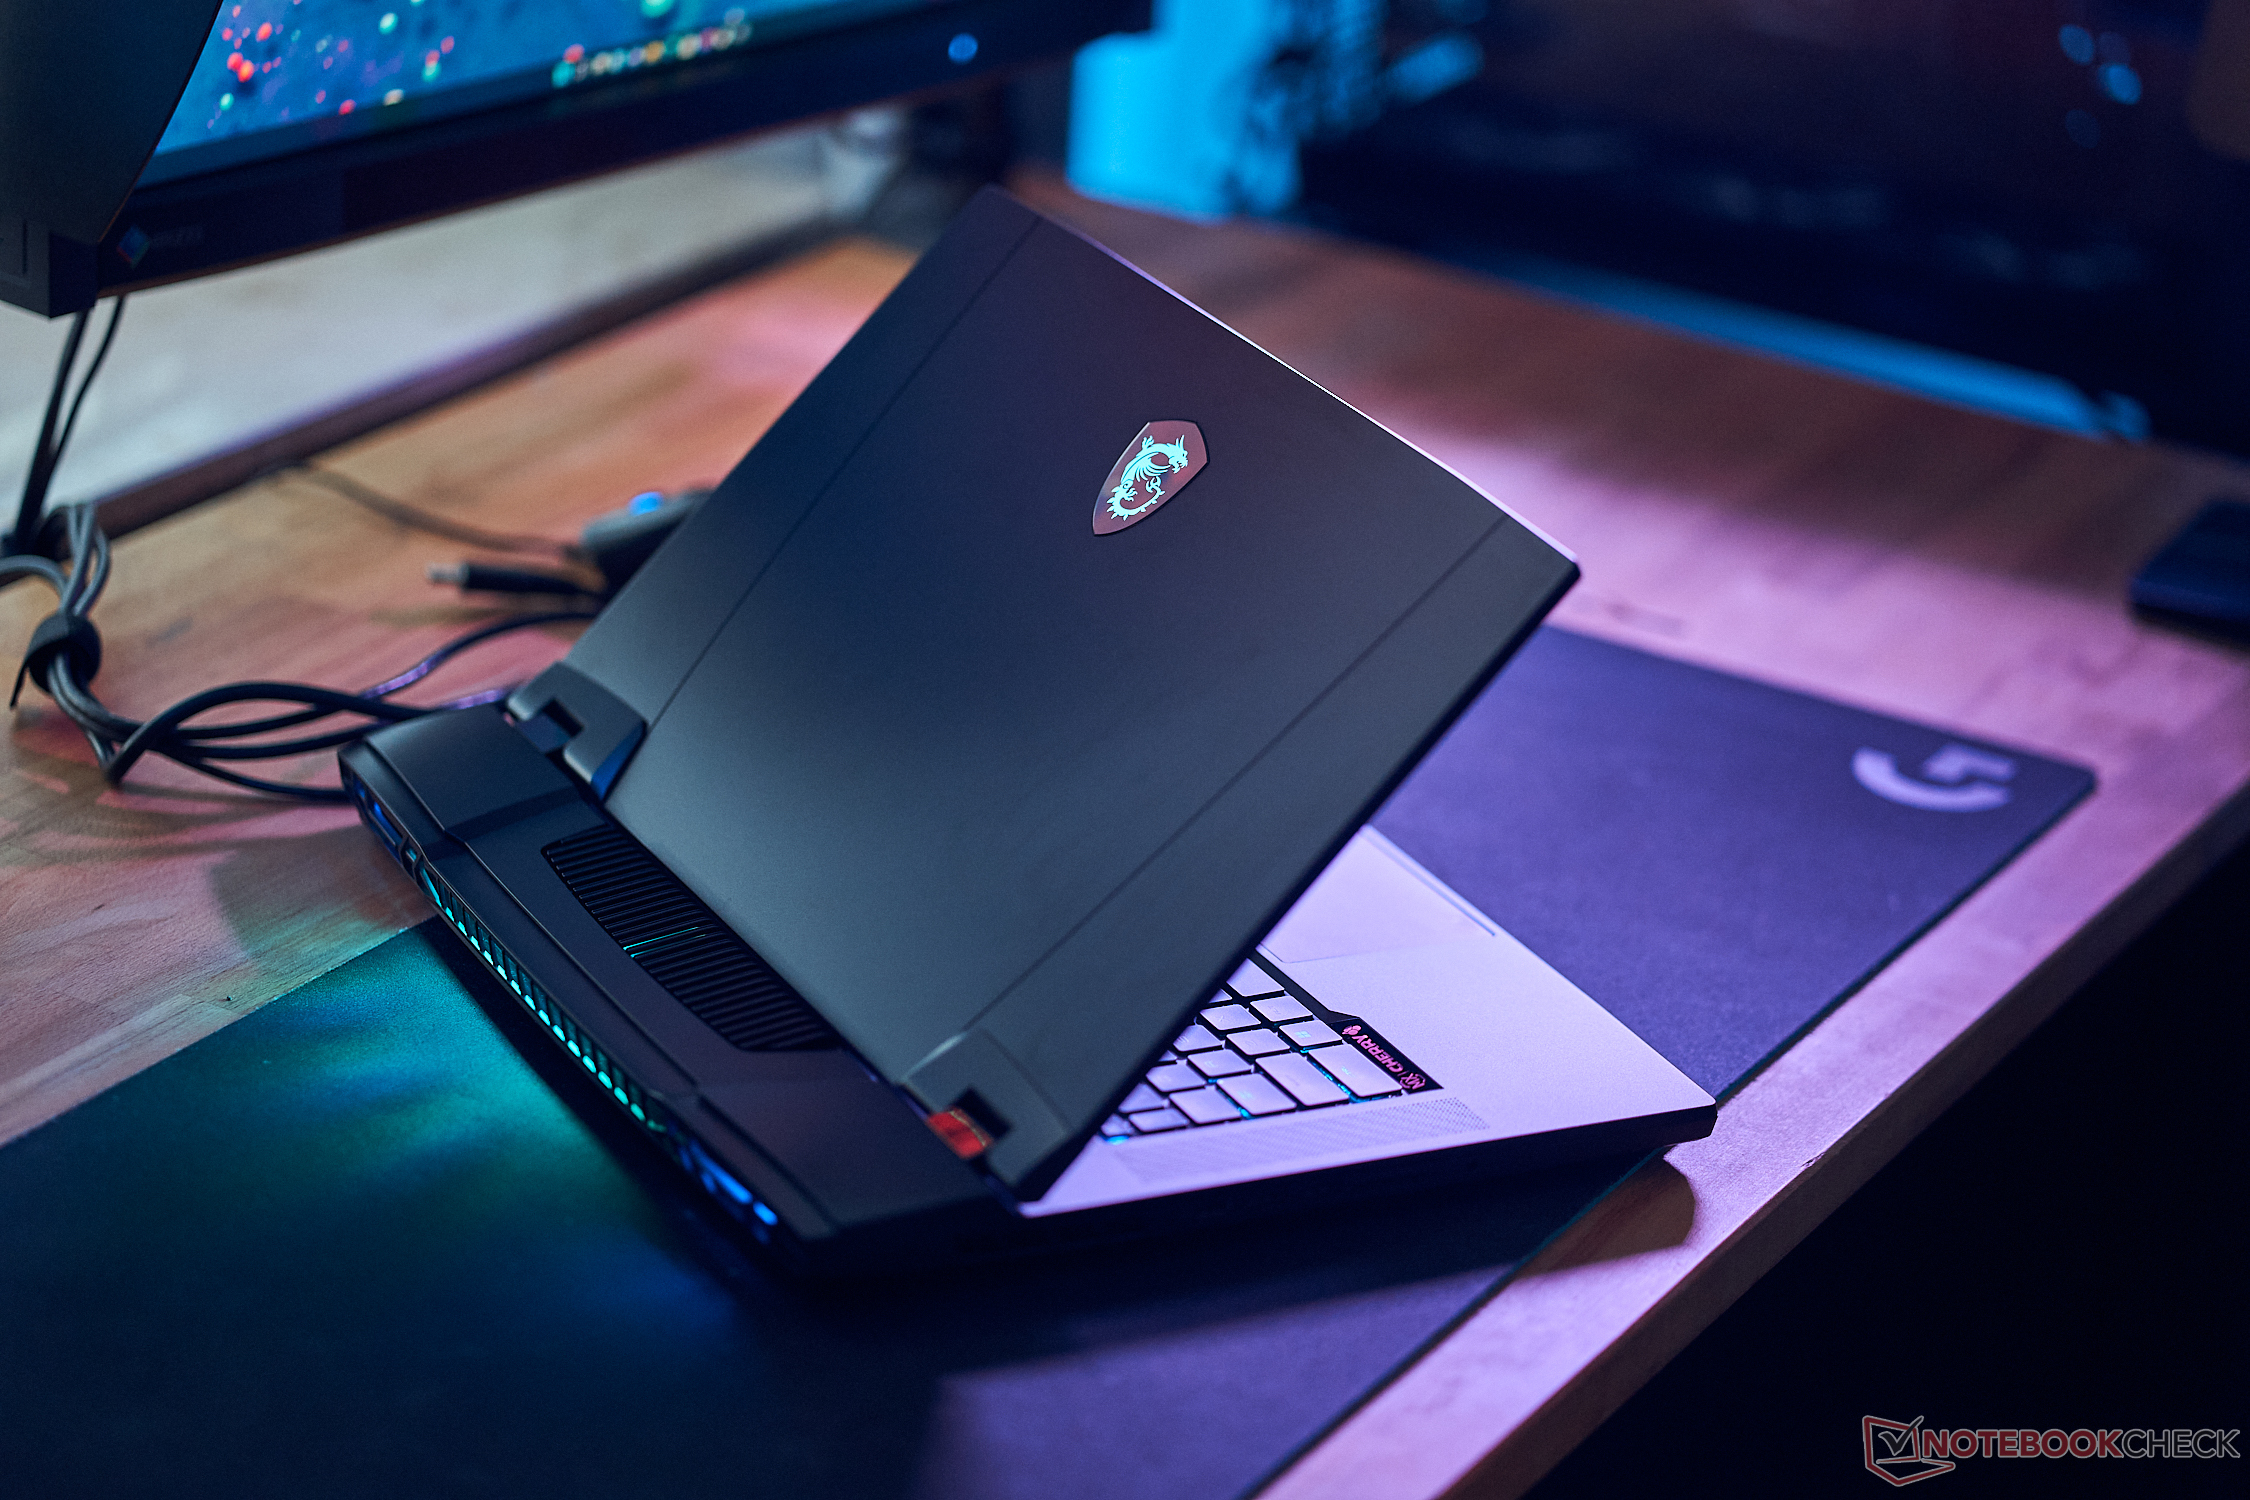
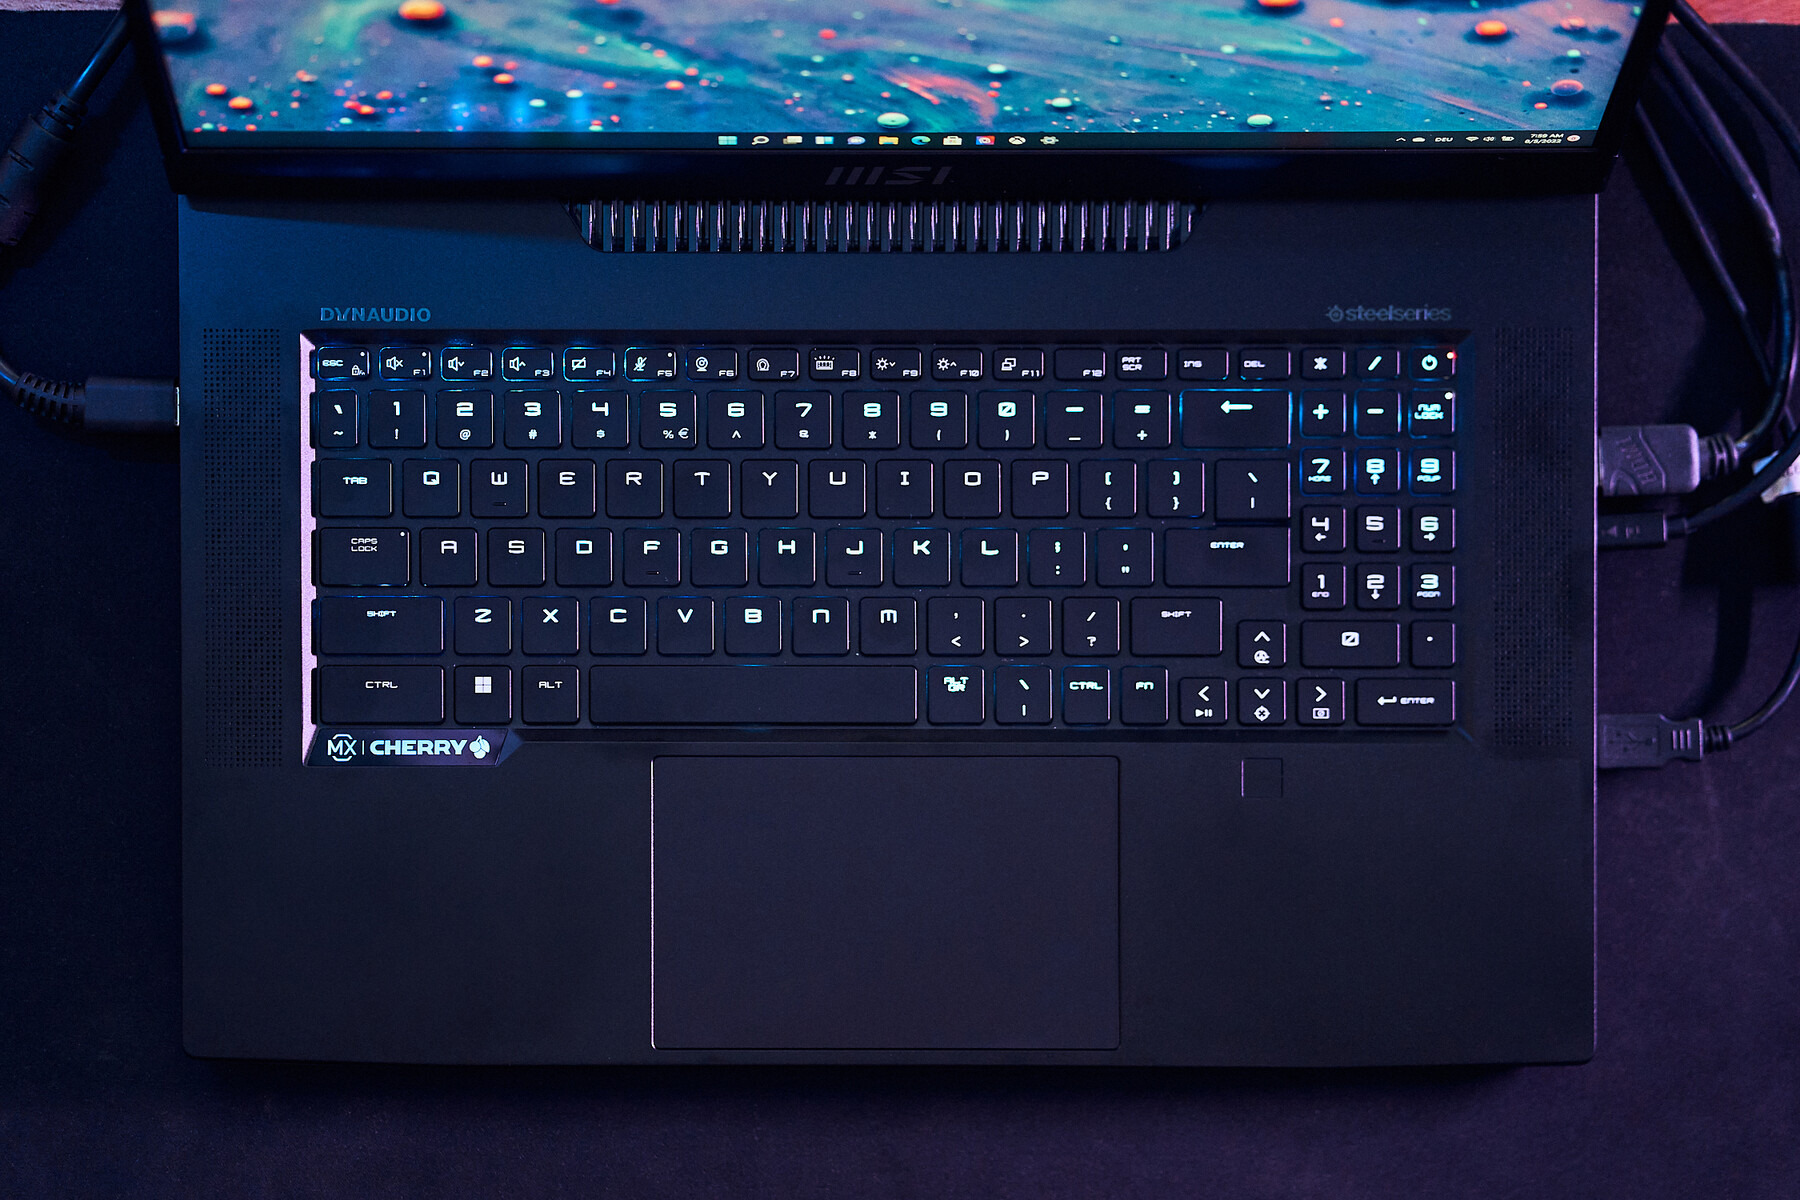
MSI introducerade en ny chassidesign för förra åretsTitan GT77så det finns inga visuella förändringar för den nya modellen. Det svarta chassit är mycket återhållsamt för en high-end gamer och RGB-belysningen är också begränsad till logotypen på locket samt fläktuttagen på baksidan. Det handlar om personliga preferenser, men du kan åtminstone använda den bärbara datorn även i professionella miljöer när du stänger av belysningen. Du kommer snabbt att se fingeravtryck på de släta ytorna, som kräver regelbunden rengöring. MSI använder fortfarande en skärm med ett bildförhållande på 16:9 för 2023-modellen.
Kvaliteten på chassit är hyfsad, även om det nästan helt och hållet är tillverkat av plast. Speciellt det grova materialet i botten uppfyller inte riktigt förväntningarna på det höga priset och skulle också kunna användas på en bärbar dator för 500 euro. Den övergripande byggkvaliteten är dock hyfsad; basenheten är mycket robust och det förekommer endast mindre knarrande ljud. Locket å andra sidan är mer flexibelt, men vi kunde inte provocera fram bildförvrängningar. Vi hade föredragit något styvare skärmgångjärn och locket vinglar lite när du justerar öppningsvinkeln (upp till ~135 grader).
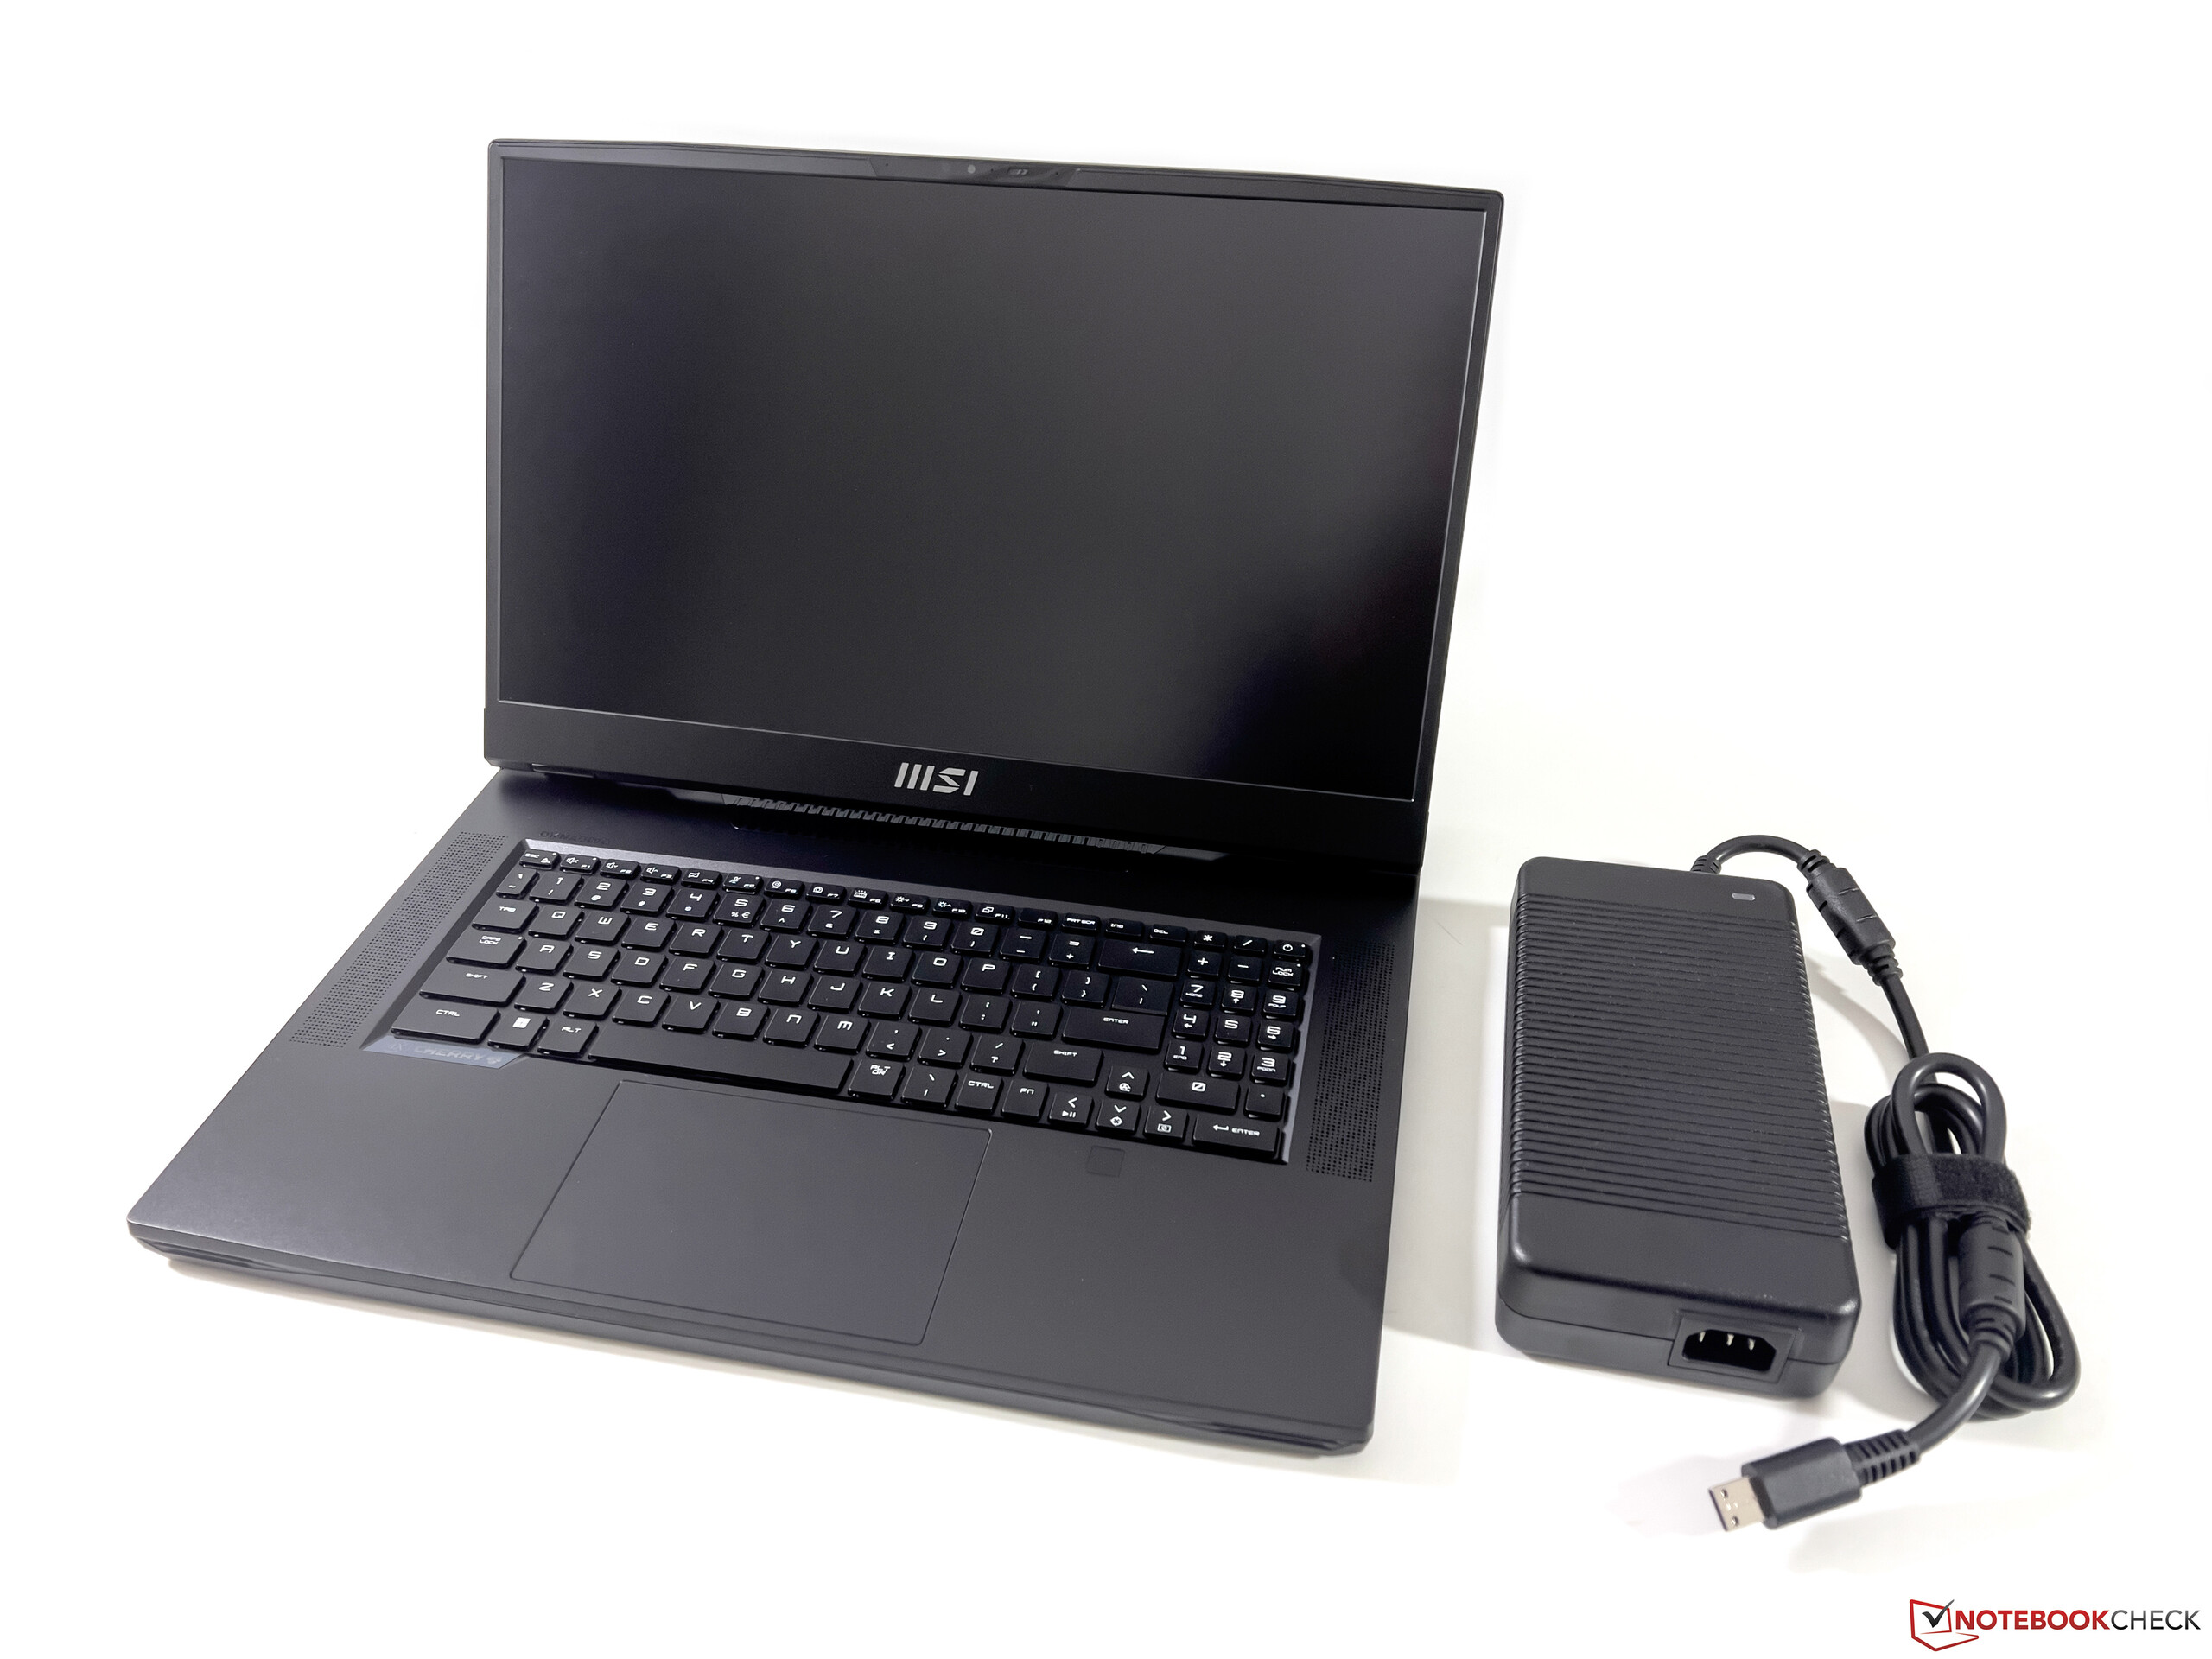
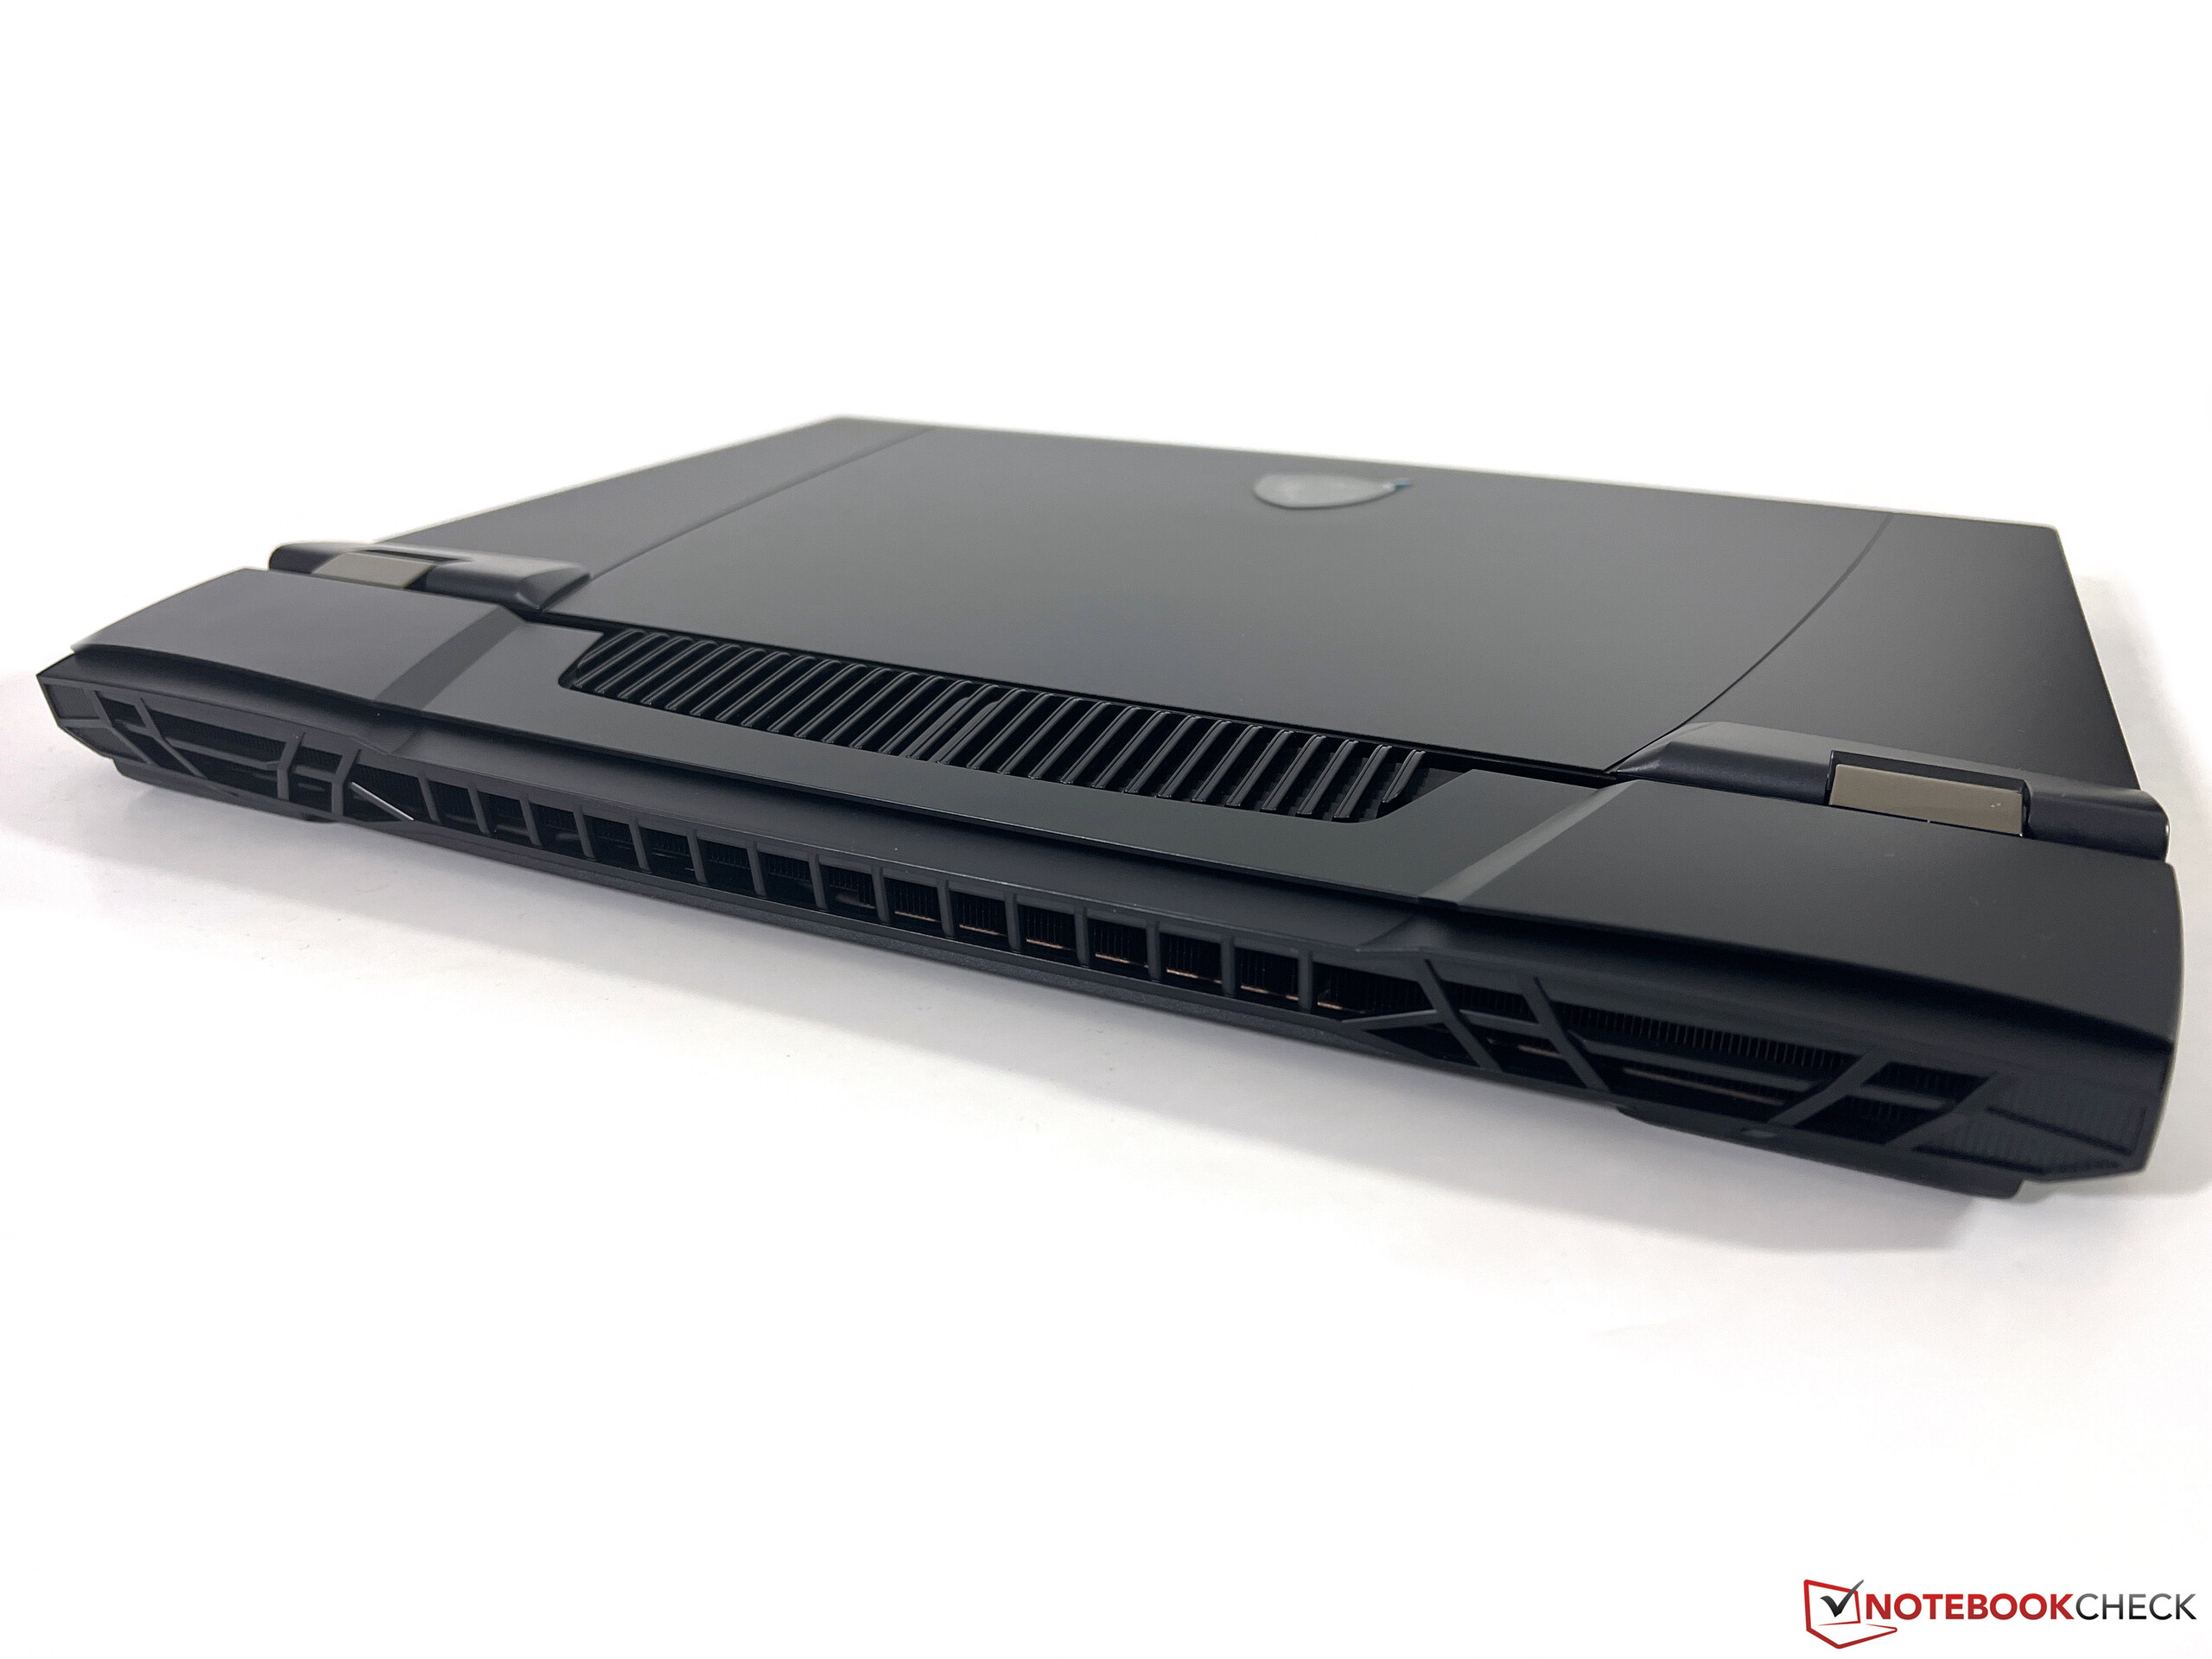
GT77 är fortfarande en relativt smal maskin på 2,3 cm, särskilt med tanke på den kraftfulla hårdvaran. På grund av den stora kylarenheten på baksidan är dock den bärbara datorn mycket djup och har ett mycket större fotavtryck än sina rivaler. Den är också mycket tung med nästan 3,5 kg och du måste lägga till ytterligare 1,4 kg för den skrymmande 330 W strömadaptern.
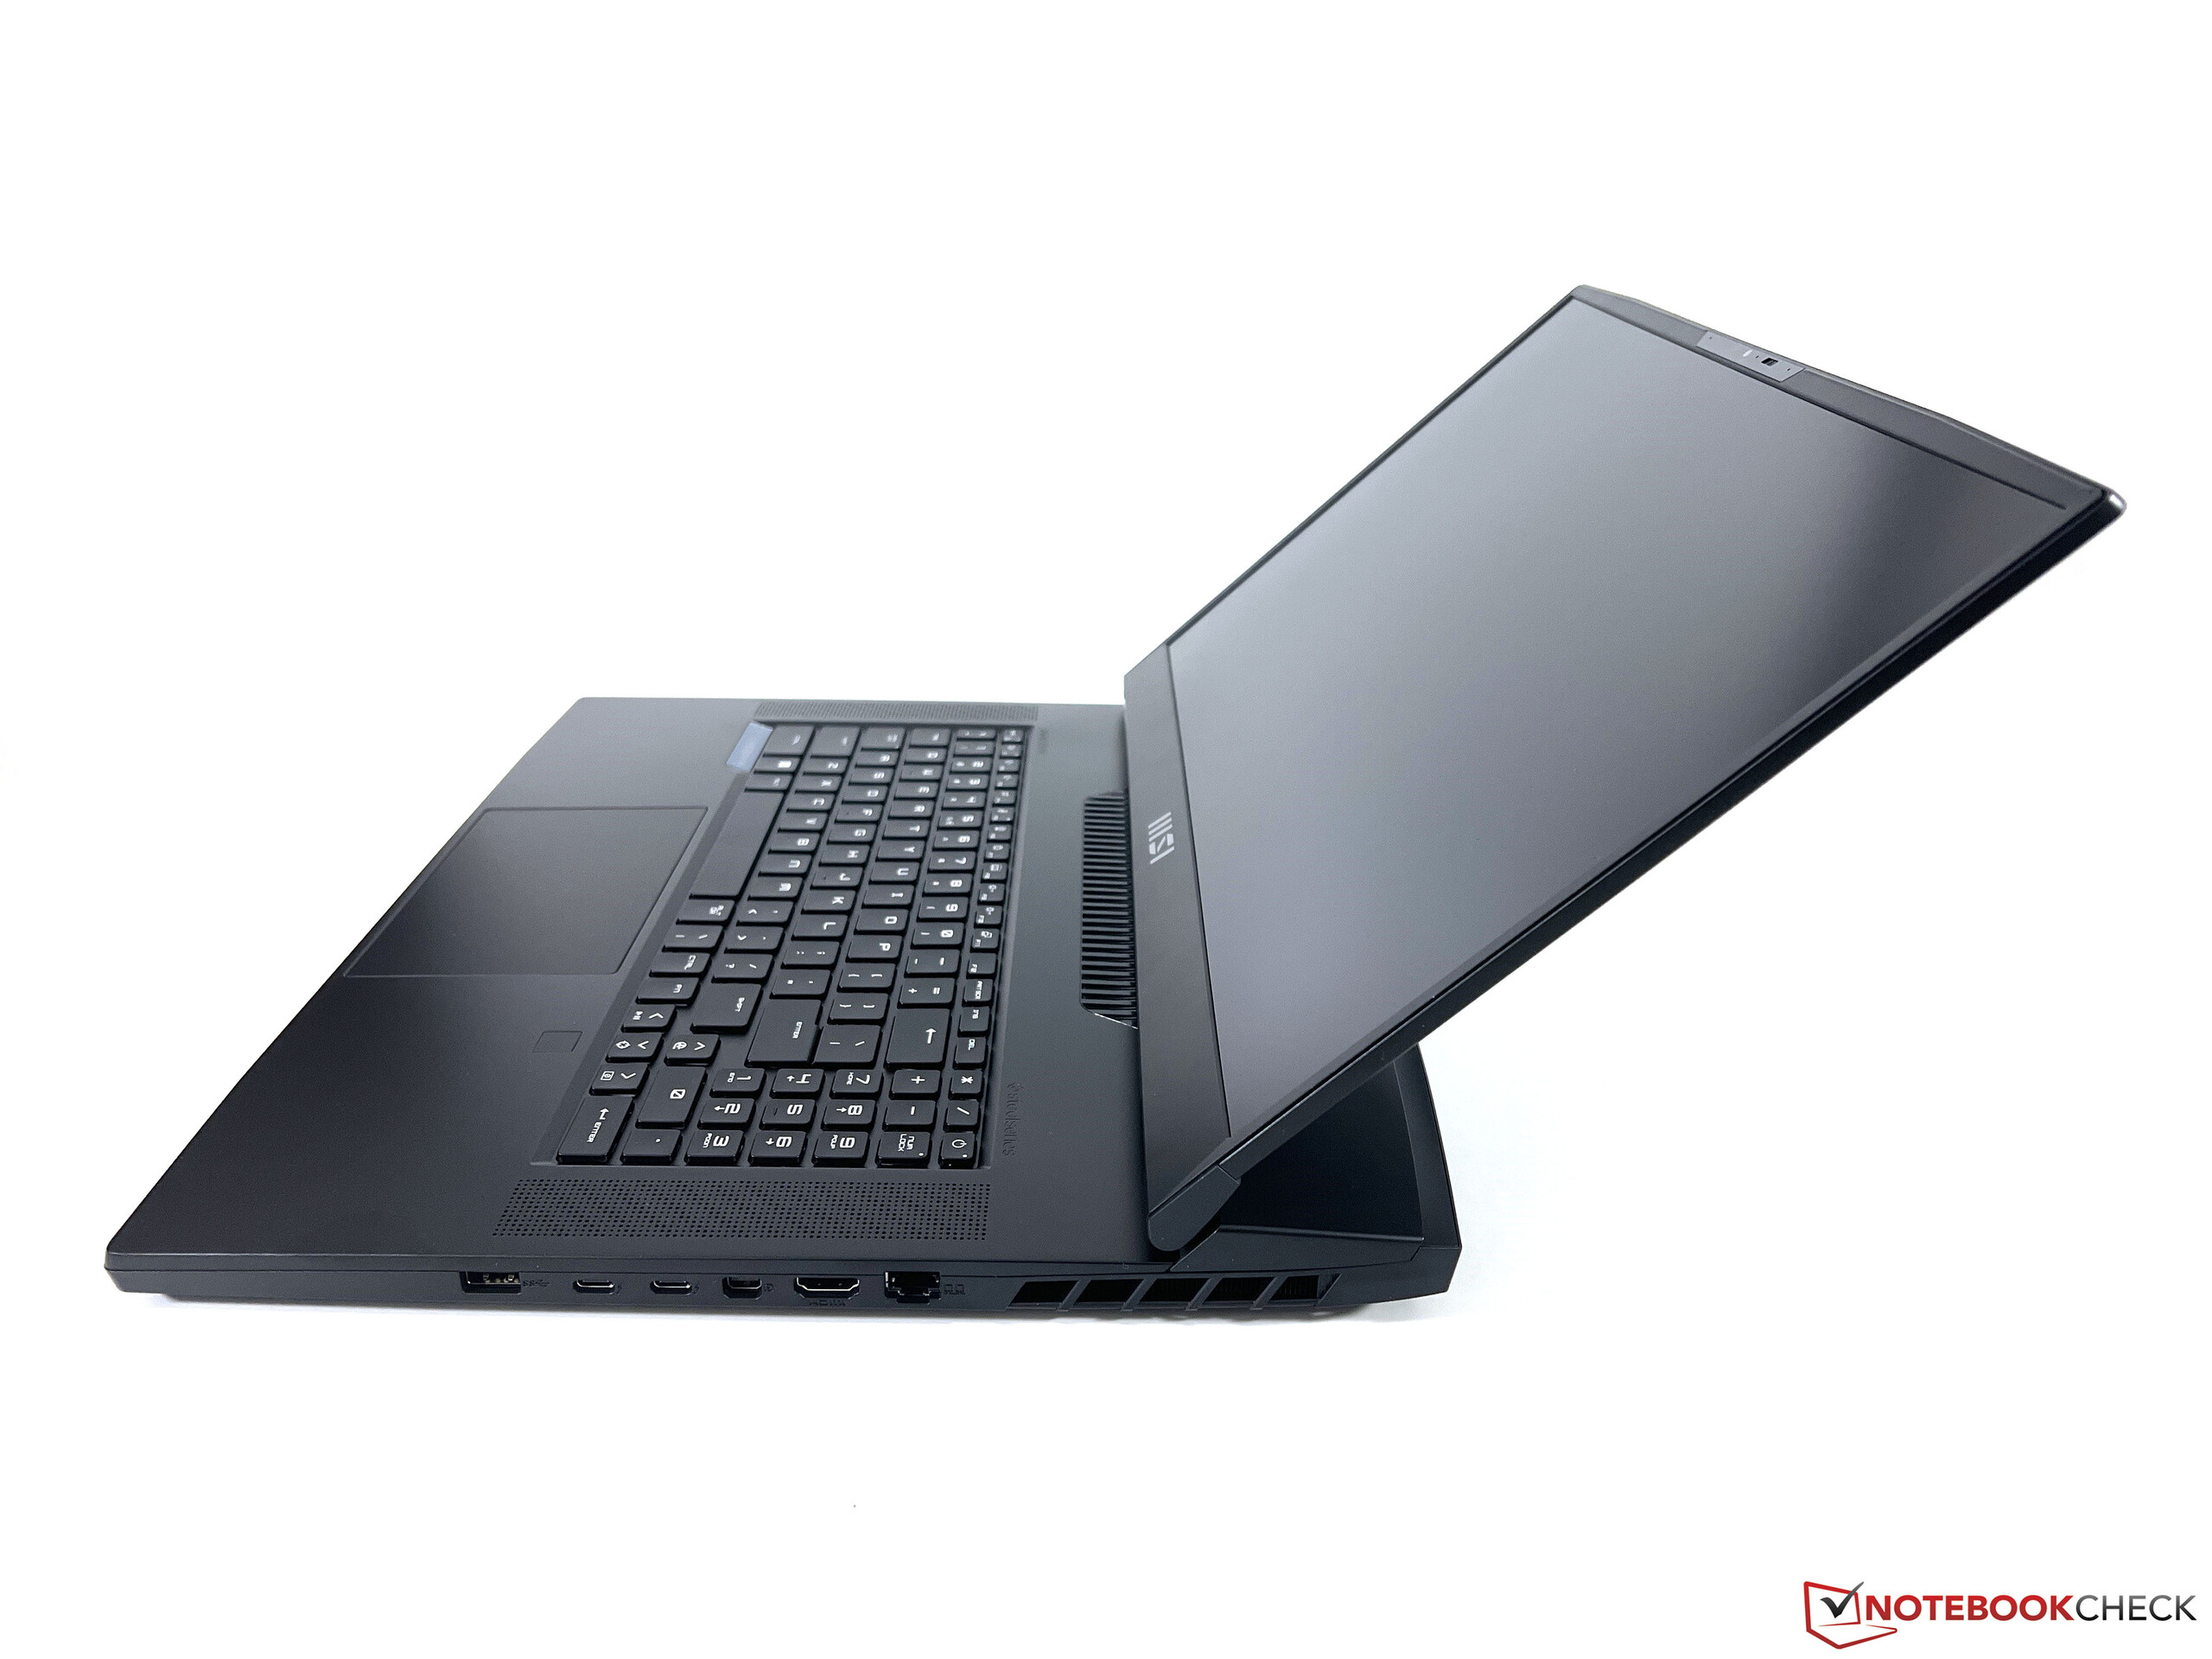
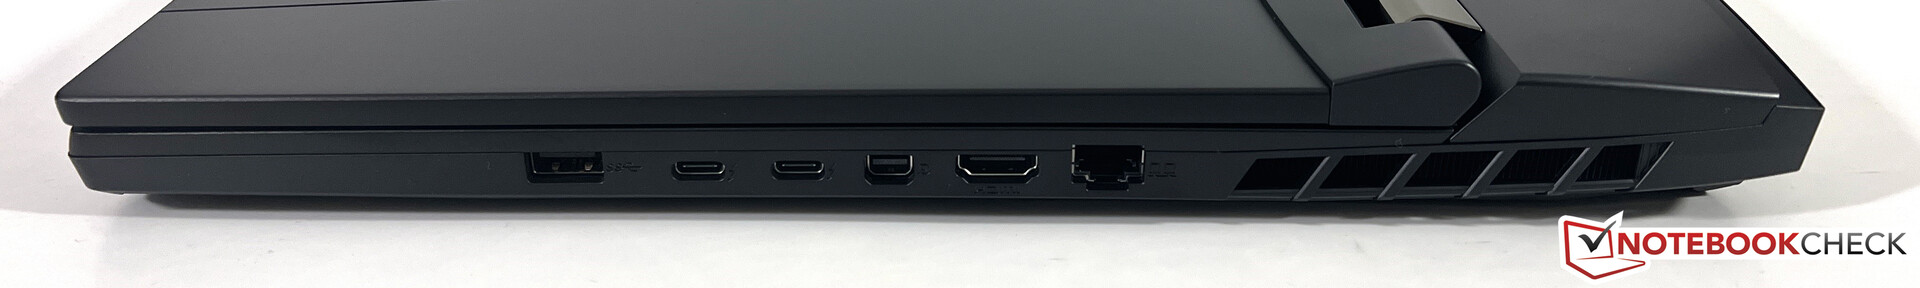
Anslutning - Thunderbolt och kortläsare
Ingenting har ändrats när det gäller portar och du får fortfarande alla viktiga standarder. Alla portar är placerade på de två sidorna eftersom det bakre området uteslutande används för kylning. Du kan också ladda batteriet vid den bakre USB-C-porten, men det kräver en 100 W-adapter (65 W-moduler fungerade inte).
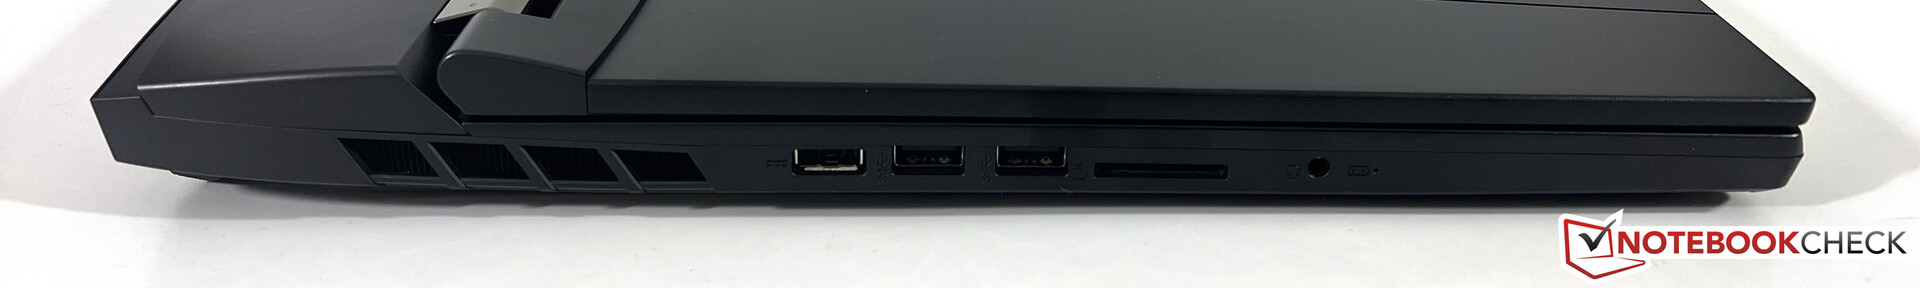
SD-kortläsare
SD-kortläsaren kan ta emot fullstora minneskort och klarar genomsnittliga överföringshastigheter på mer än 80 MB/s med vårt referenskort (AV Pro V60).
| SD Card Reader | |
| average JPG Copy Test (av. of 3 runs) | |
| Alienware x17 R2 P48E (AV Pro V60) | |
| Genomsnitt av klass Gaming (20.9 - 210, n=54, senaste 2 åren) | |
| Razer Blade 16 Early 2023 (AV PRO microSD 128 GB V60) | |
| MSI Titan GT77 HX 13VI (Angelibird AV Pro V60) | |
| MSI Titan GT77 12UHS (AV PRO microSD 128 GB V60) | |
| Schenker XMG Neo 17 M22 (AV PRO microSD 128 GB V60) | |
| maximum AS SSD Seq Read Test (1GB) | |
| Alienware x17 R2 P48E (AV Pro V60) | |
| Razer Blade 16 Early 2023 (AV PRO microSD 128 GB V60) | |
| Genomsnitt av klass Gaming (25.5 - 261, n=51, senaste 2 åren) | |
| MSI Titan GT77 12UHS (AV PRO microSD 128 GB V60) | |
| MSI Titan GT77 HX 13VI (Angelibird AV Pro V60) | |
Kommunikation
MSI utrustar den nya Titan GT77 med Wi-Fi-modulen Killer AX1690i, som stöder den aktuella Wi-Fi-standarden 6E och Bluetooth 5.3. Vårt amerikanska exemplar anslöt inte till 6 GHz i vår referensrouter från Asus, men signalkvaliteten var också mycket bra när vi använde 5 GHz-nätverket (Wi-Fi 6). Du kan också använda Ethernet-porten med 2,5 Gbps.
Webbkamera
Webbkameran är utrustad med en mekanisk slutare, men det är i stort sett alla positiva aspekter. MSI använder fortfarande den dåliga 720p-kameran, som inte tar bra bilder ens i bra ljusförhållanden. Du kan förvänta dig mer år 2023, särskilt med tanke på priset.


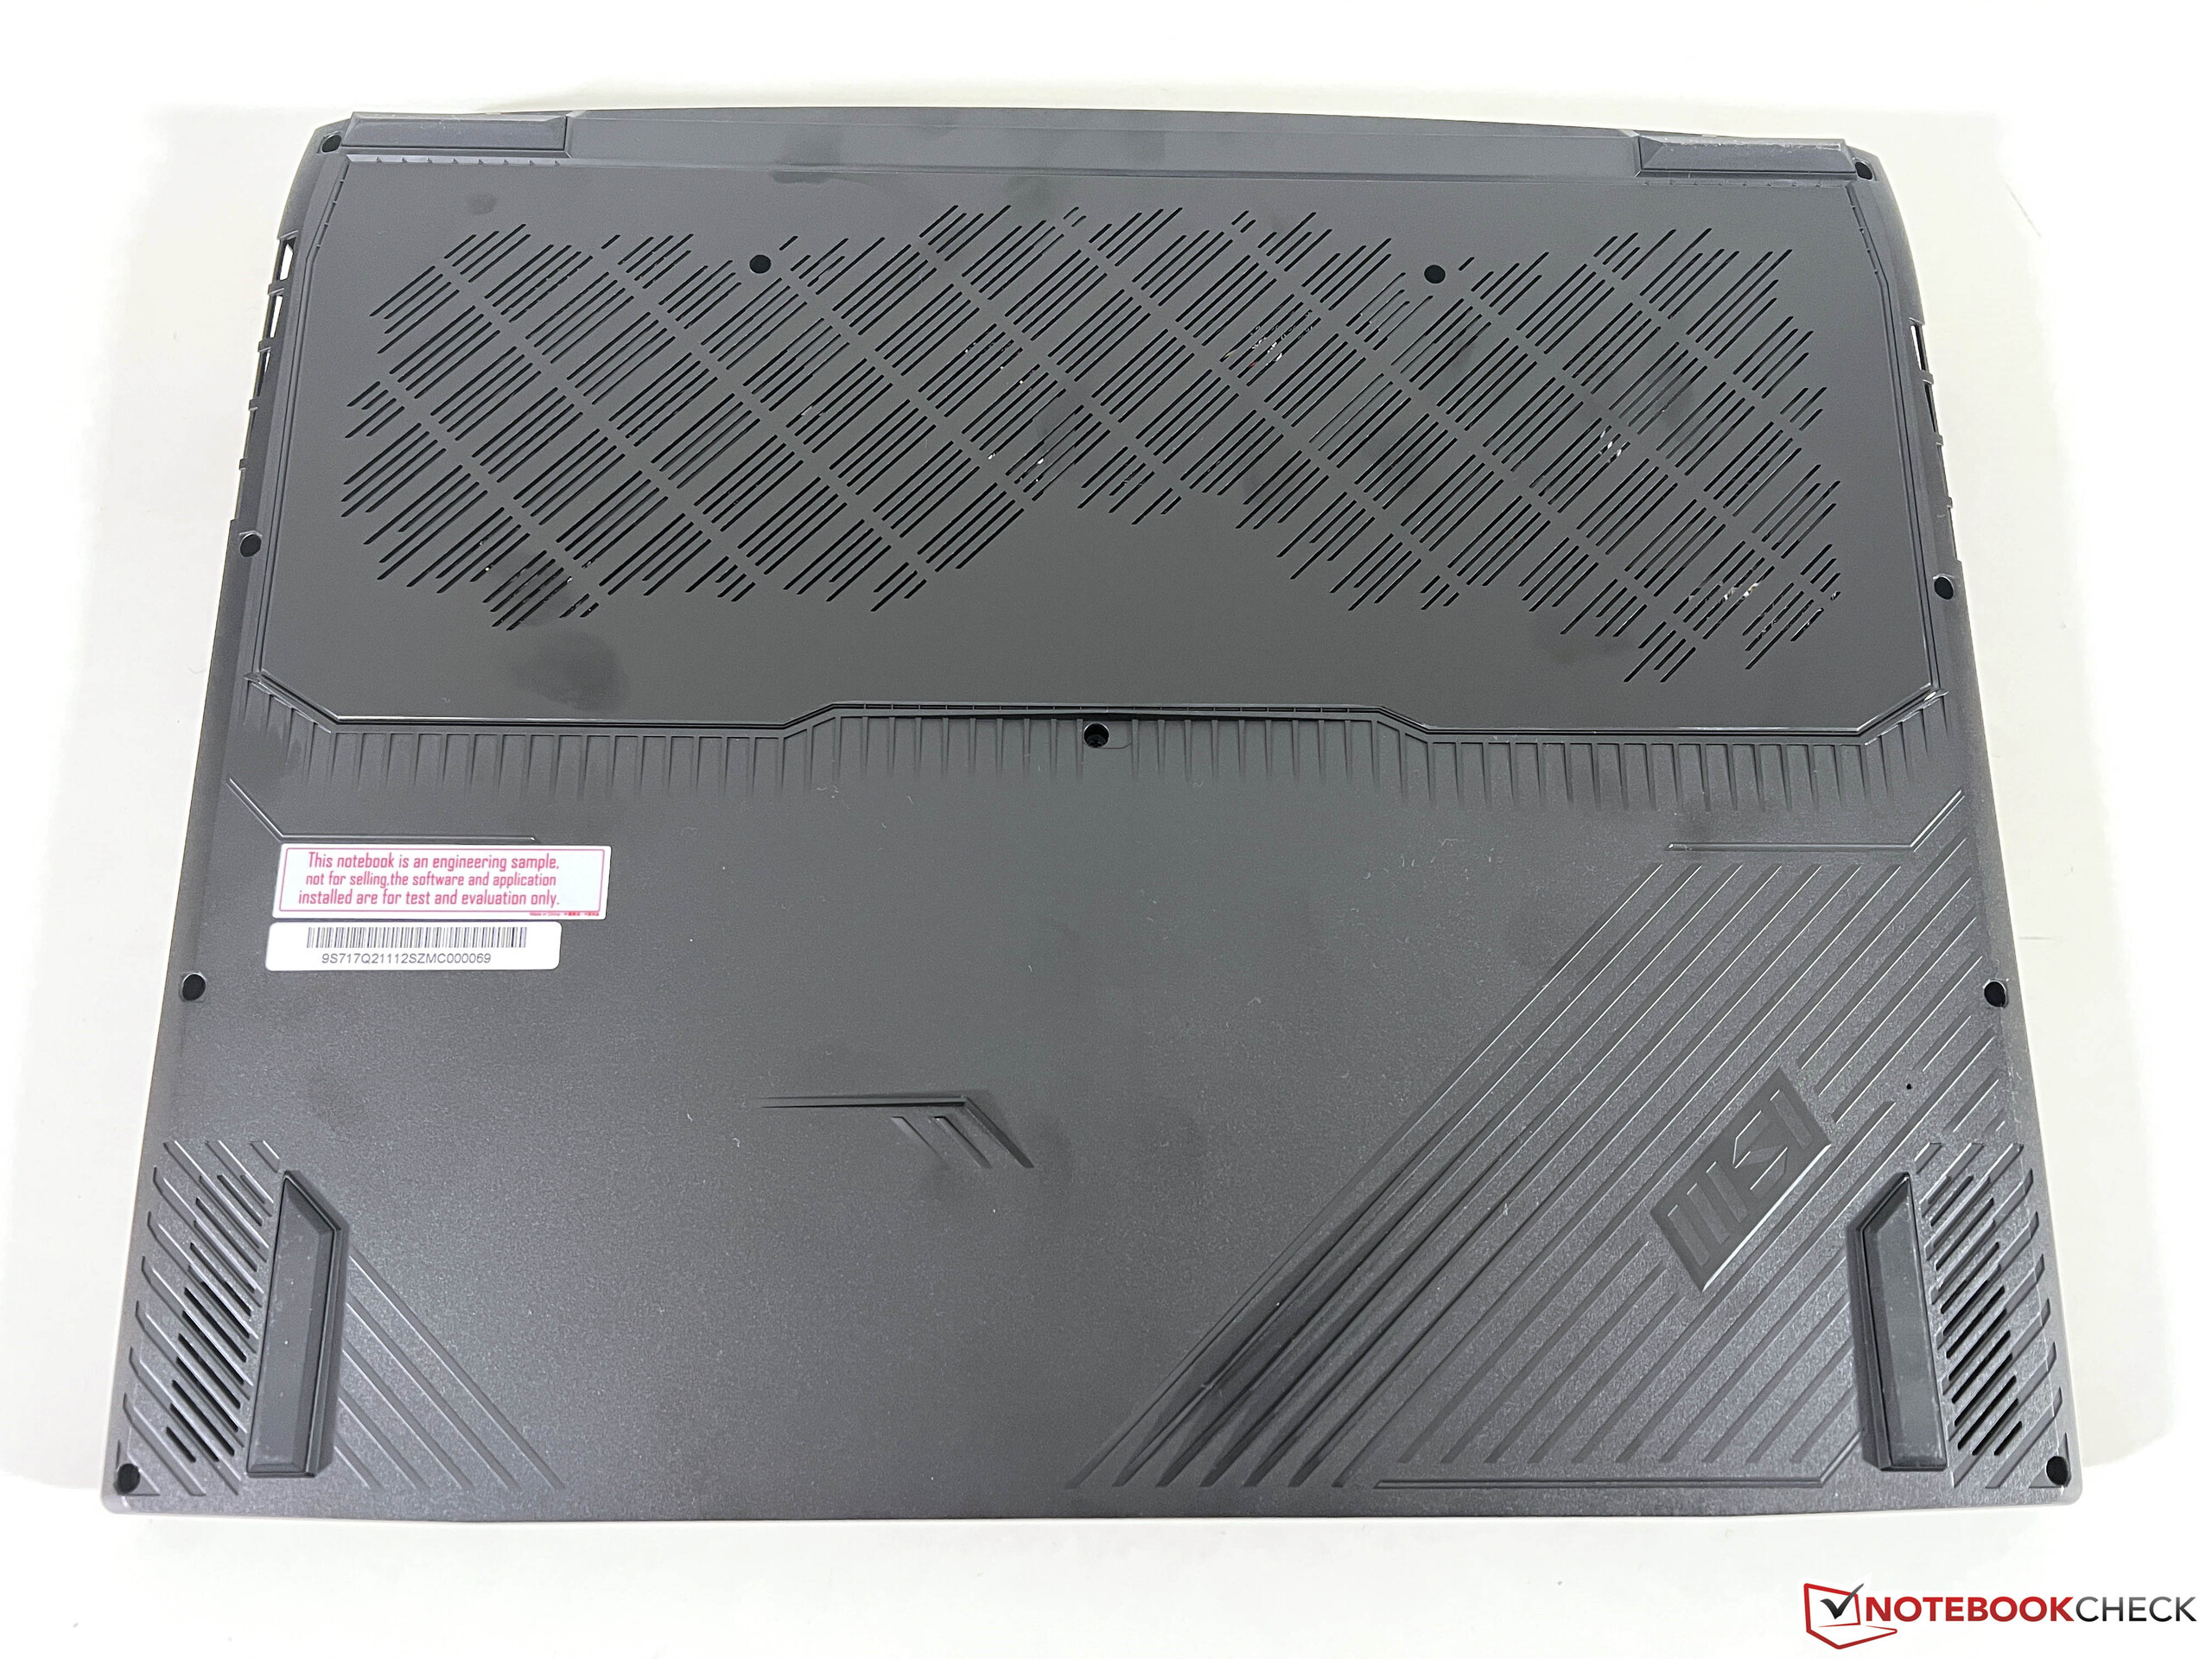
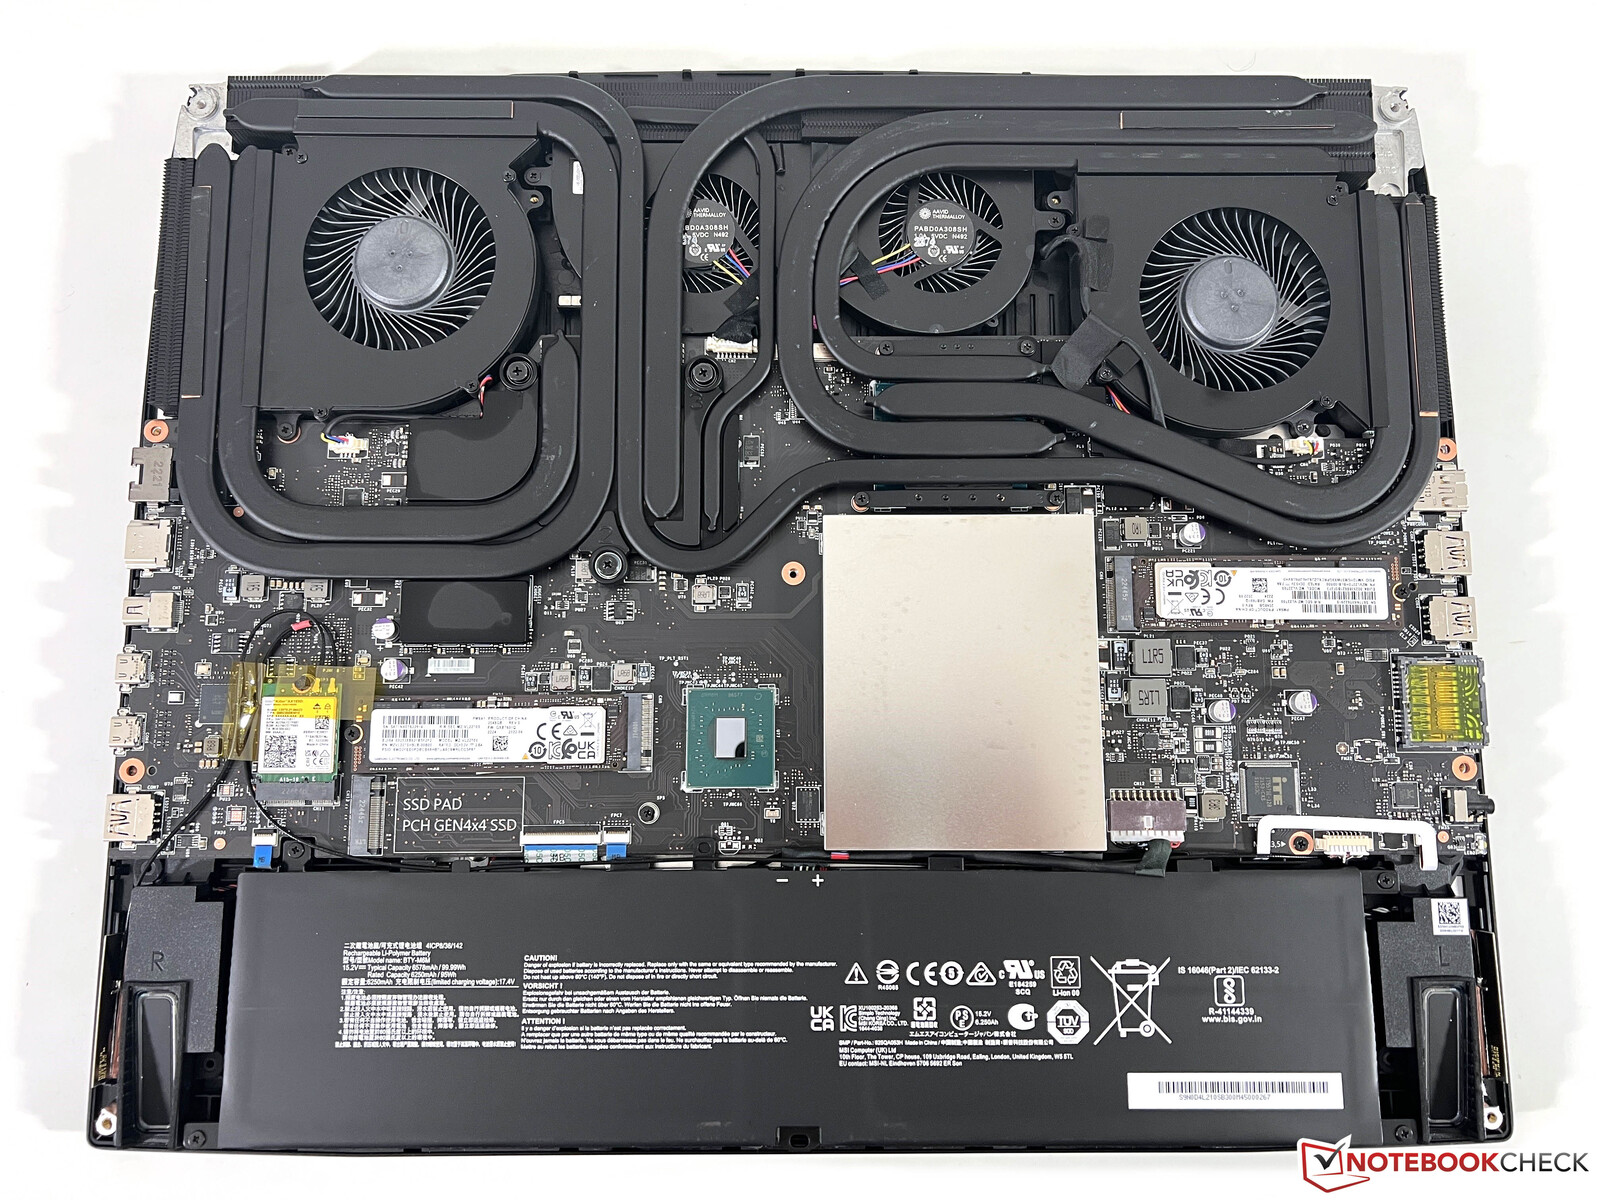
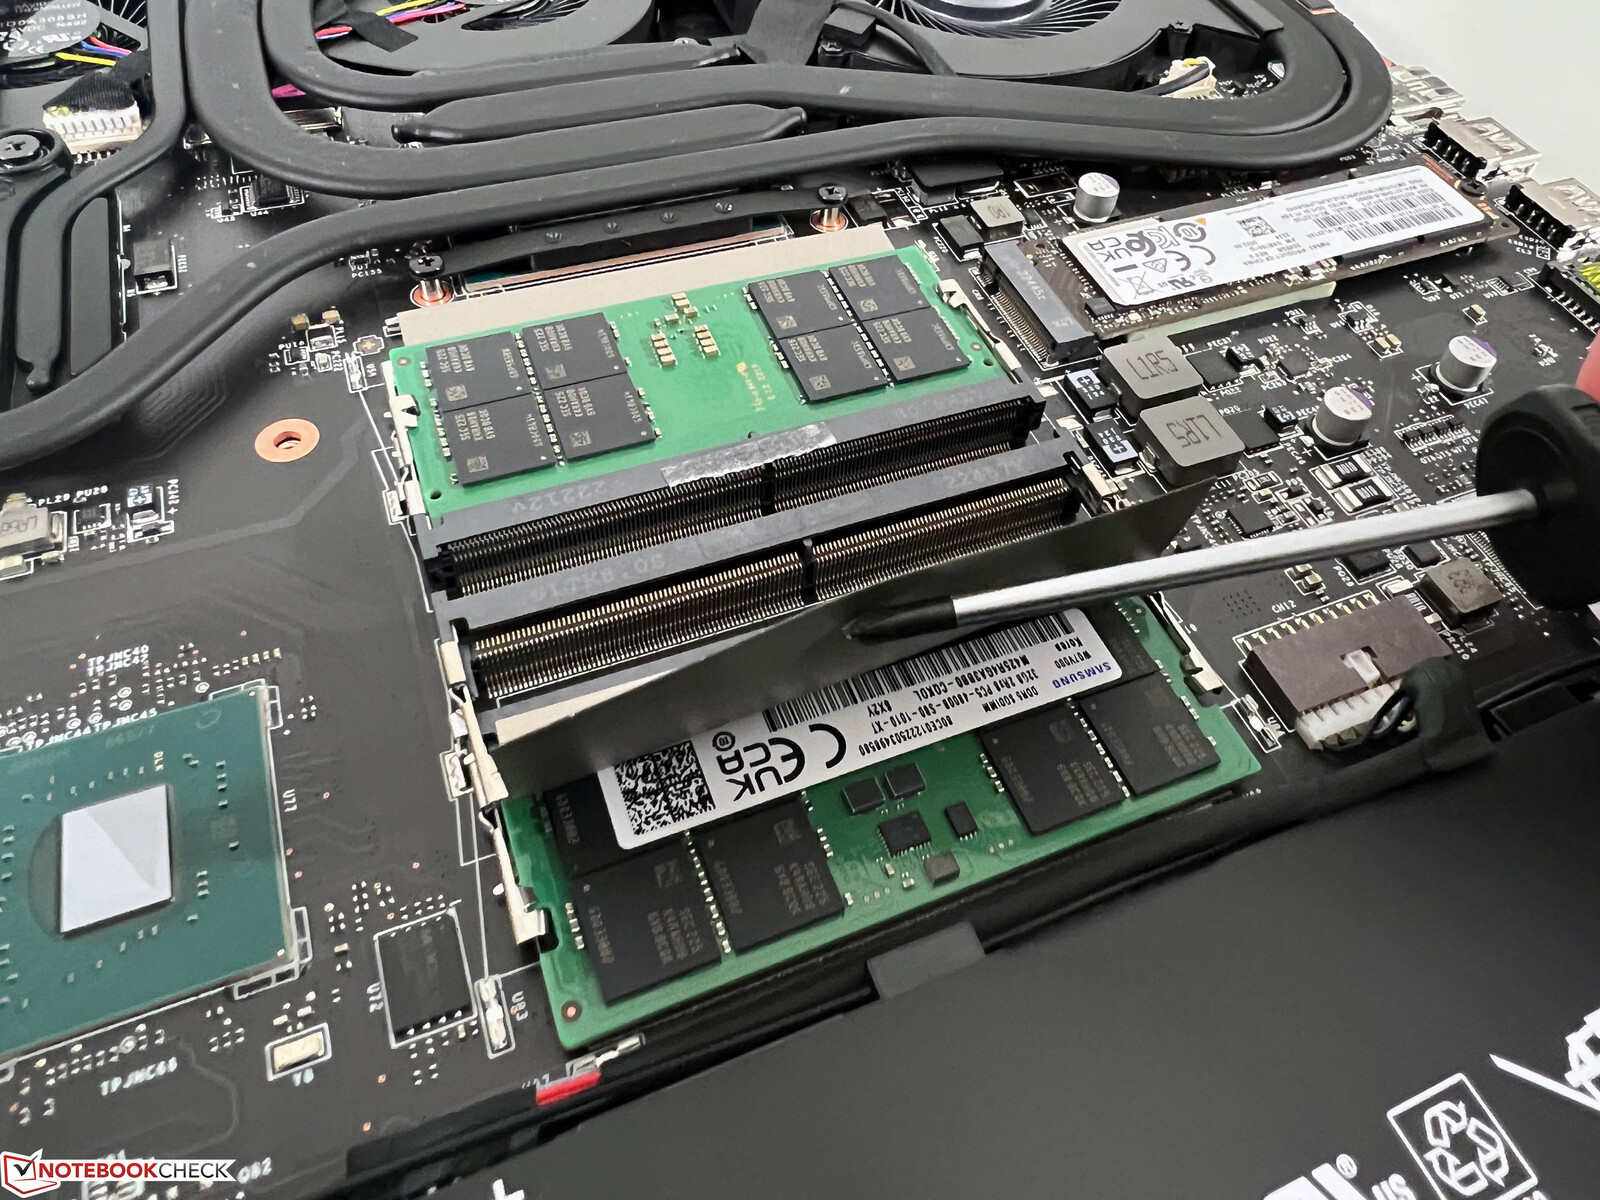
Underhåll
Hela det nedre locket sitter fast med vanliga Philips-skruvar och kan tas bort, men locket sitter väldigt hårt fast och det är inte lätt. Förutom fyra SO-DIMM-platser kan du även använda tre M.2-platser för uppgraderingar. Det är också möjligt att byta ut Wi-Fi-modulen och rengöra fläktarna. MSI har ändrat kylningslayouten och använder fler heatpipes jämfört med den tidigare modell, vilket innebär att den fjärde M.2-platsen måste tas bort.
Inmatningsenheter - MSI med bra mekaniskt tangentbord
Vi gillade redan det mekaniska tangentbordet i tidigare modell och det har inte ändrats. Skrivljudet är lite högre jämfört med konventionella gummikupoltangentbord, men Cherry-enheten är märkbart tystare än det mekaniska tangentbord du kan få för denXMG Neo 17, till exempel. Piltangenterna och den dedikerade numpad (som är lite smalare) använder konventionella brytare. Det går att justera belysningen för varje tangent individuellt, men du kan också välja en oansenlig färg för alla tangenter. Fingeravtrycksläsaren är implementerad i handflatsstödet precis under piltangenterna.
Den stora klickplattan fungerade bra under vår granskning och vanliga marköroperationer är inga problem, men klickljudet är lite högljutt. De flesta spelare kommer dock att använda en extern mus eller gamepad ändå.
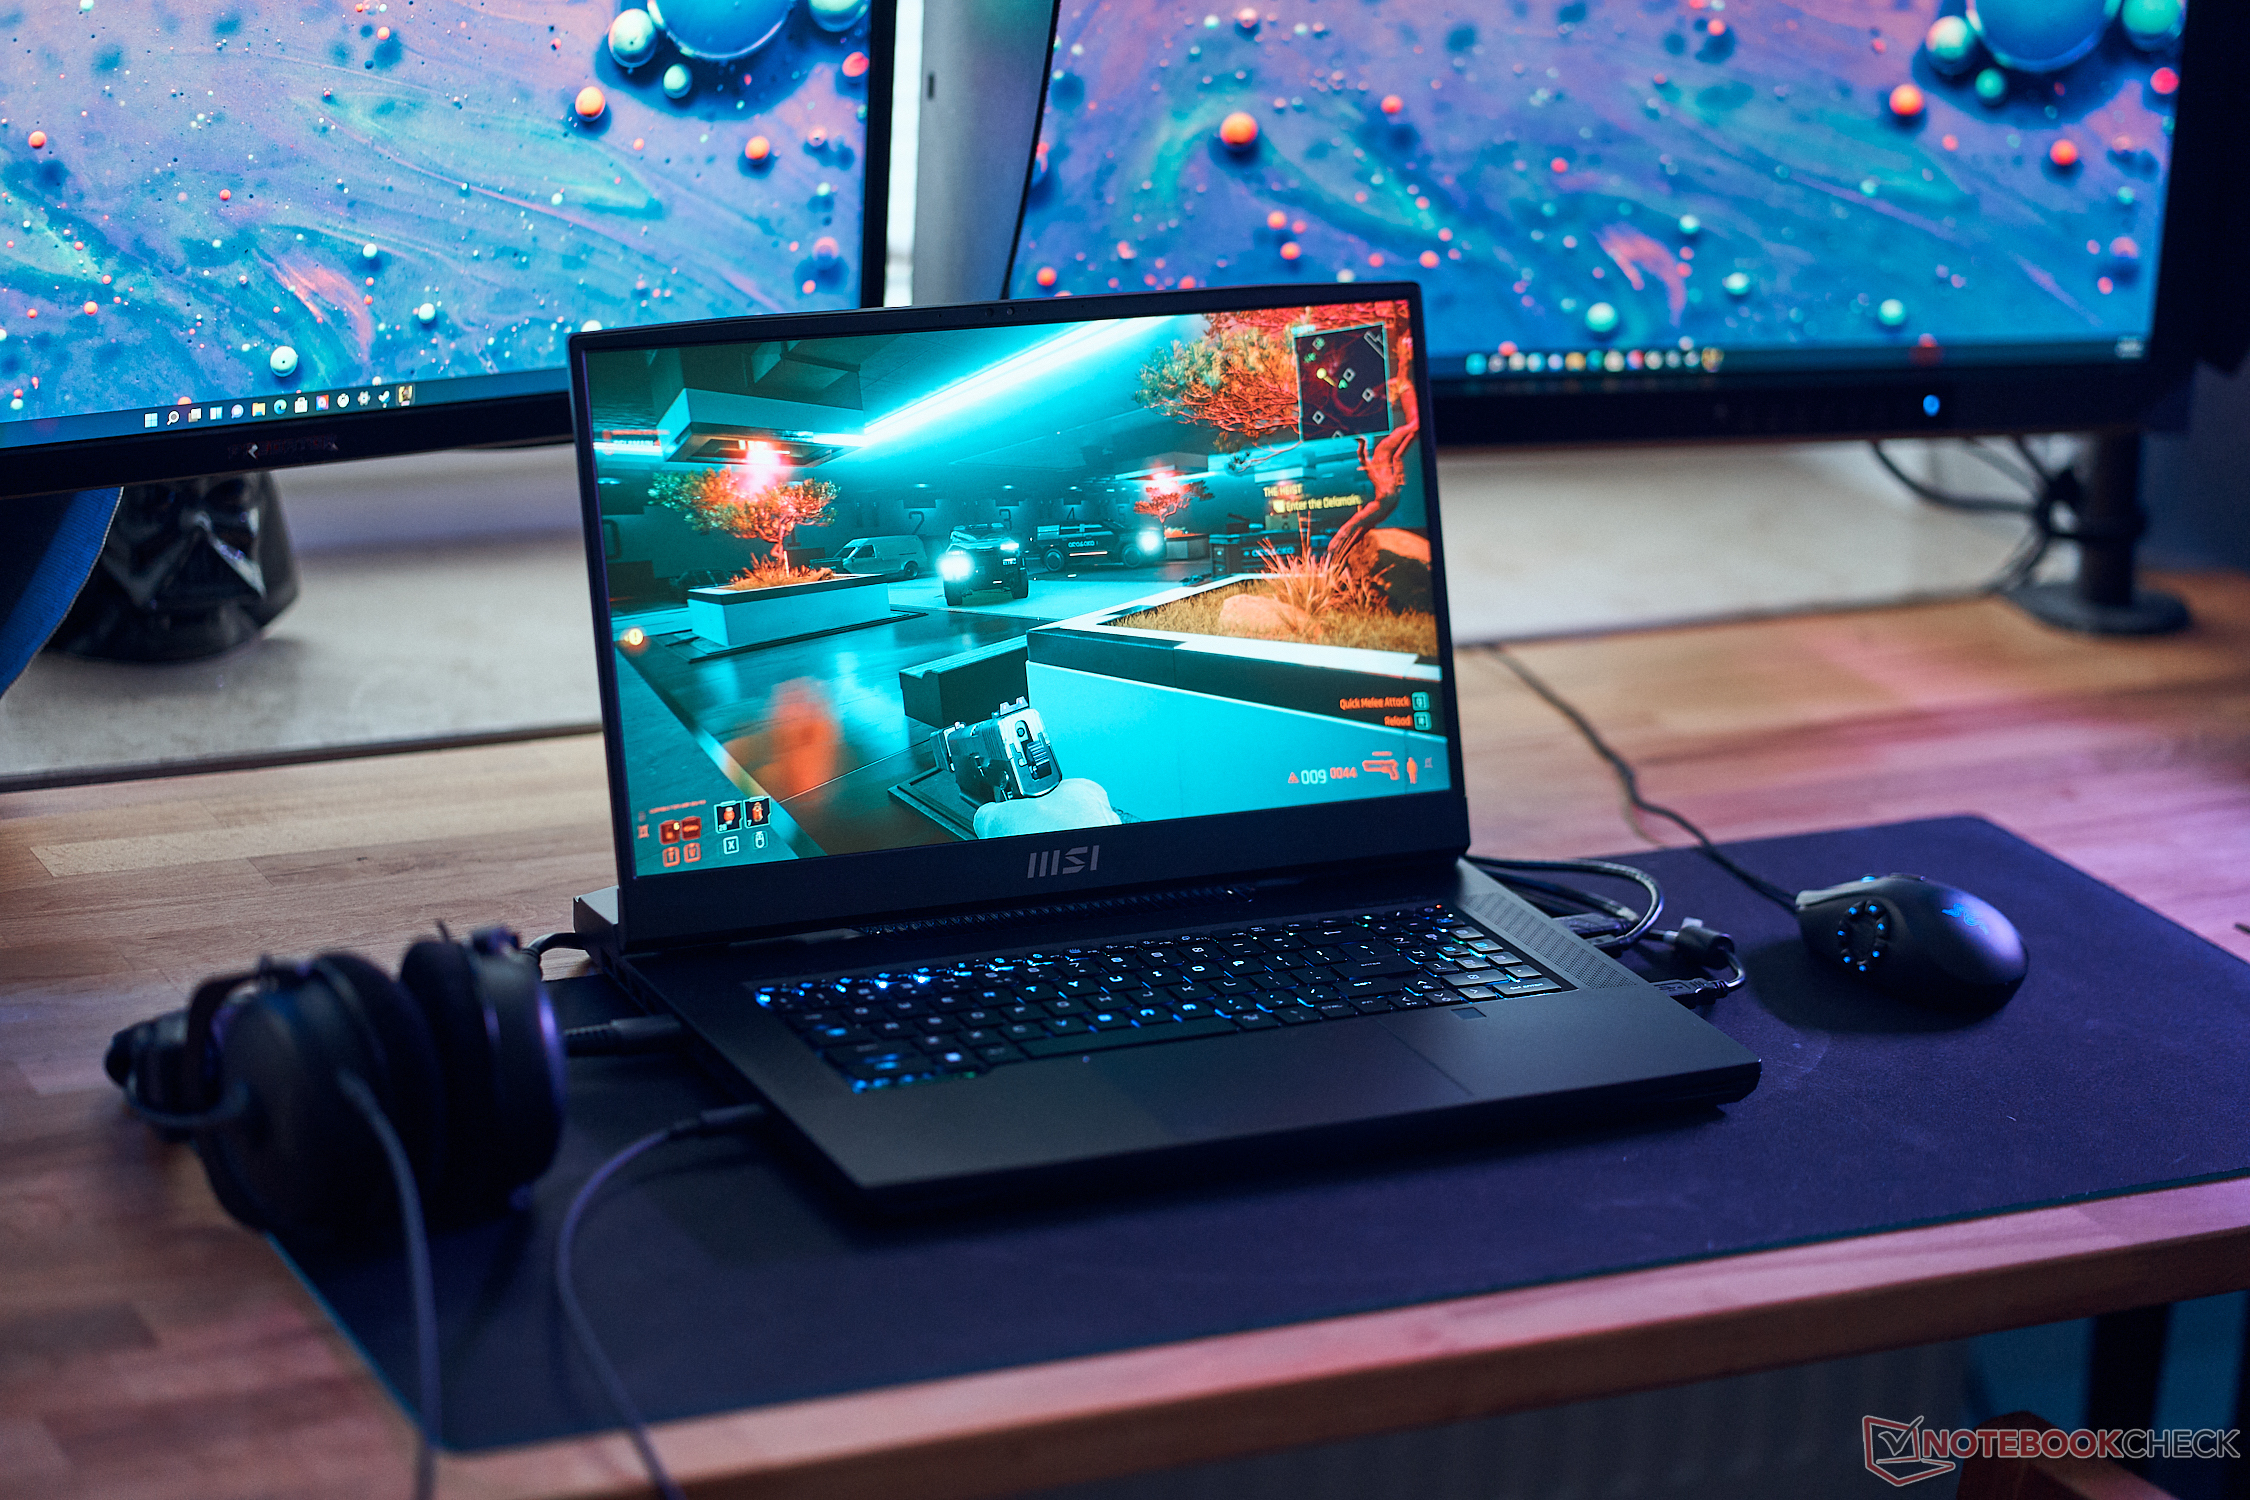
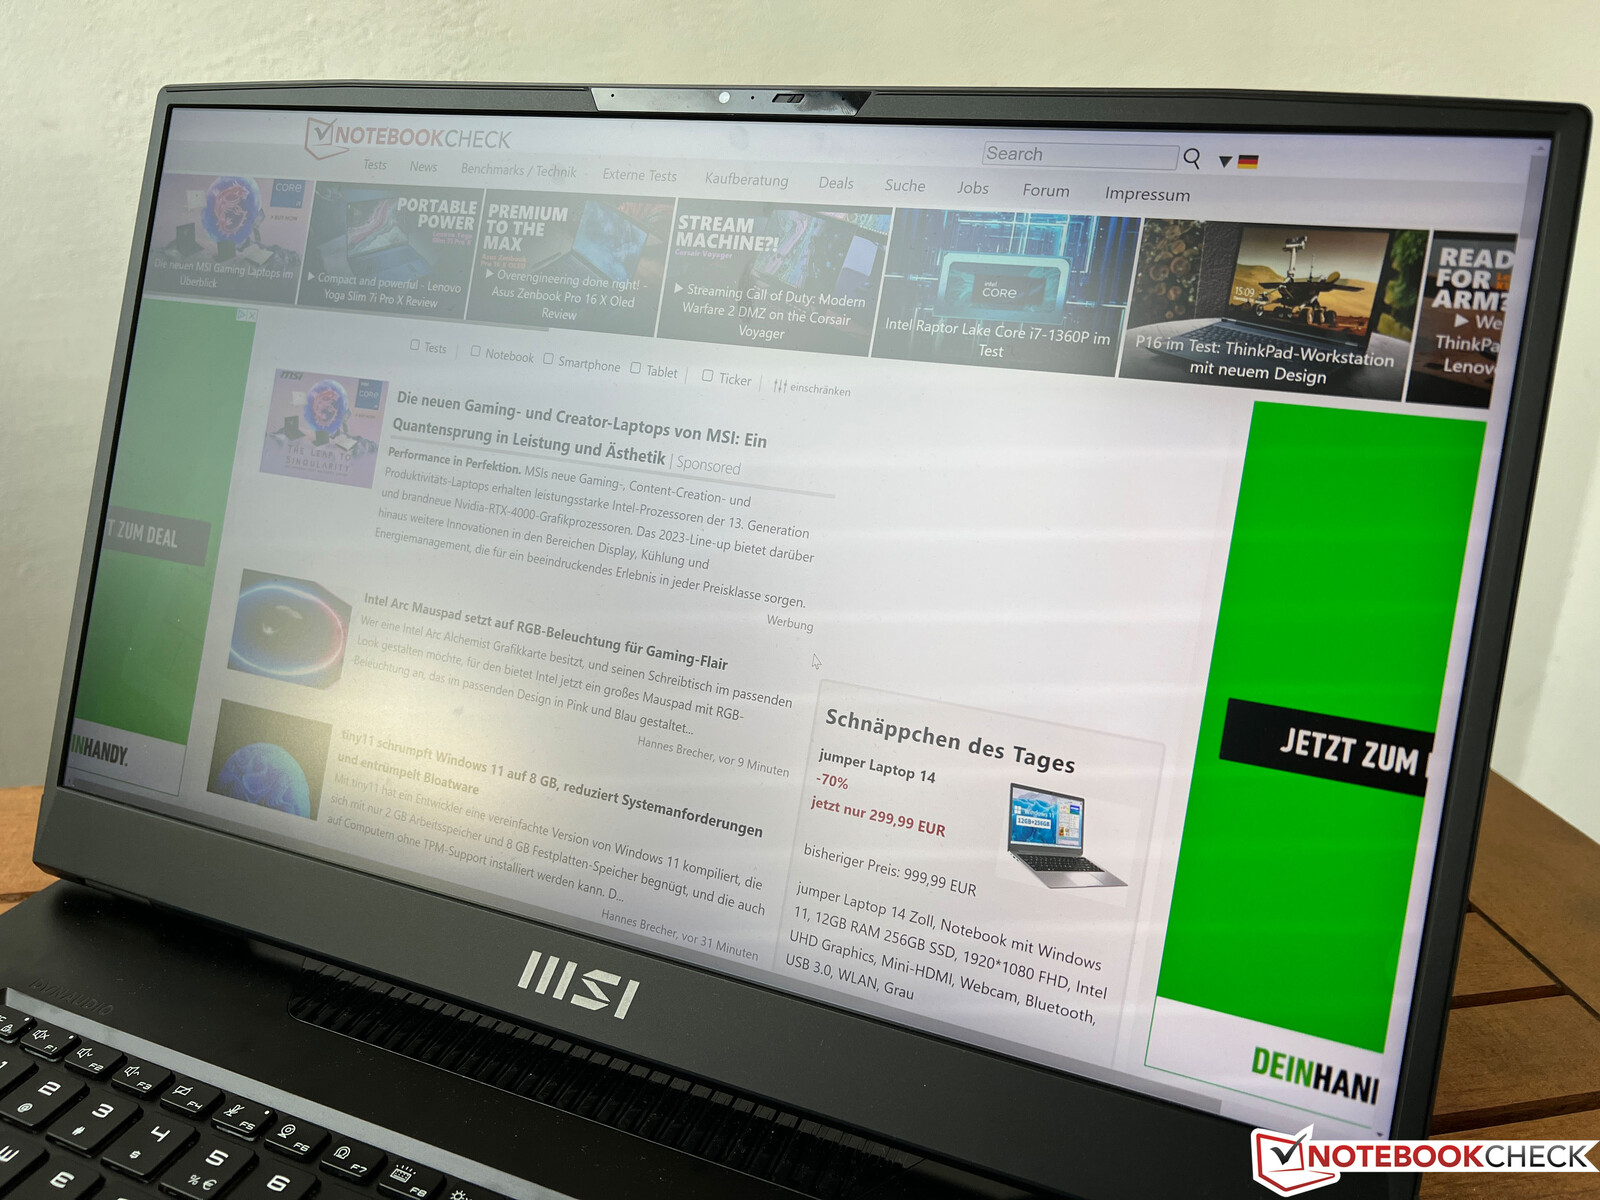
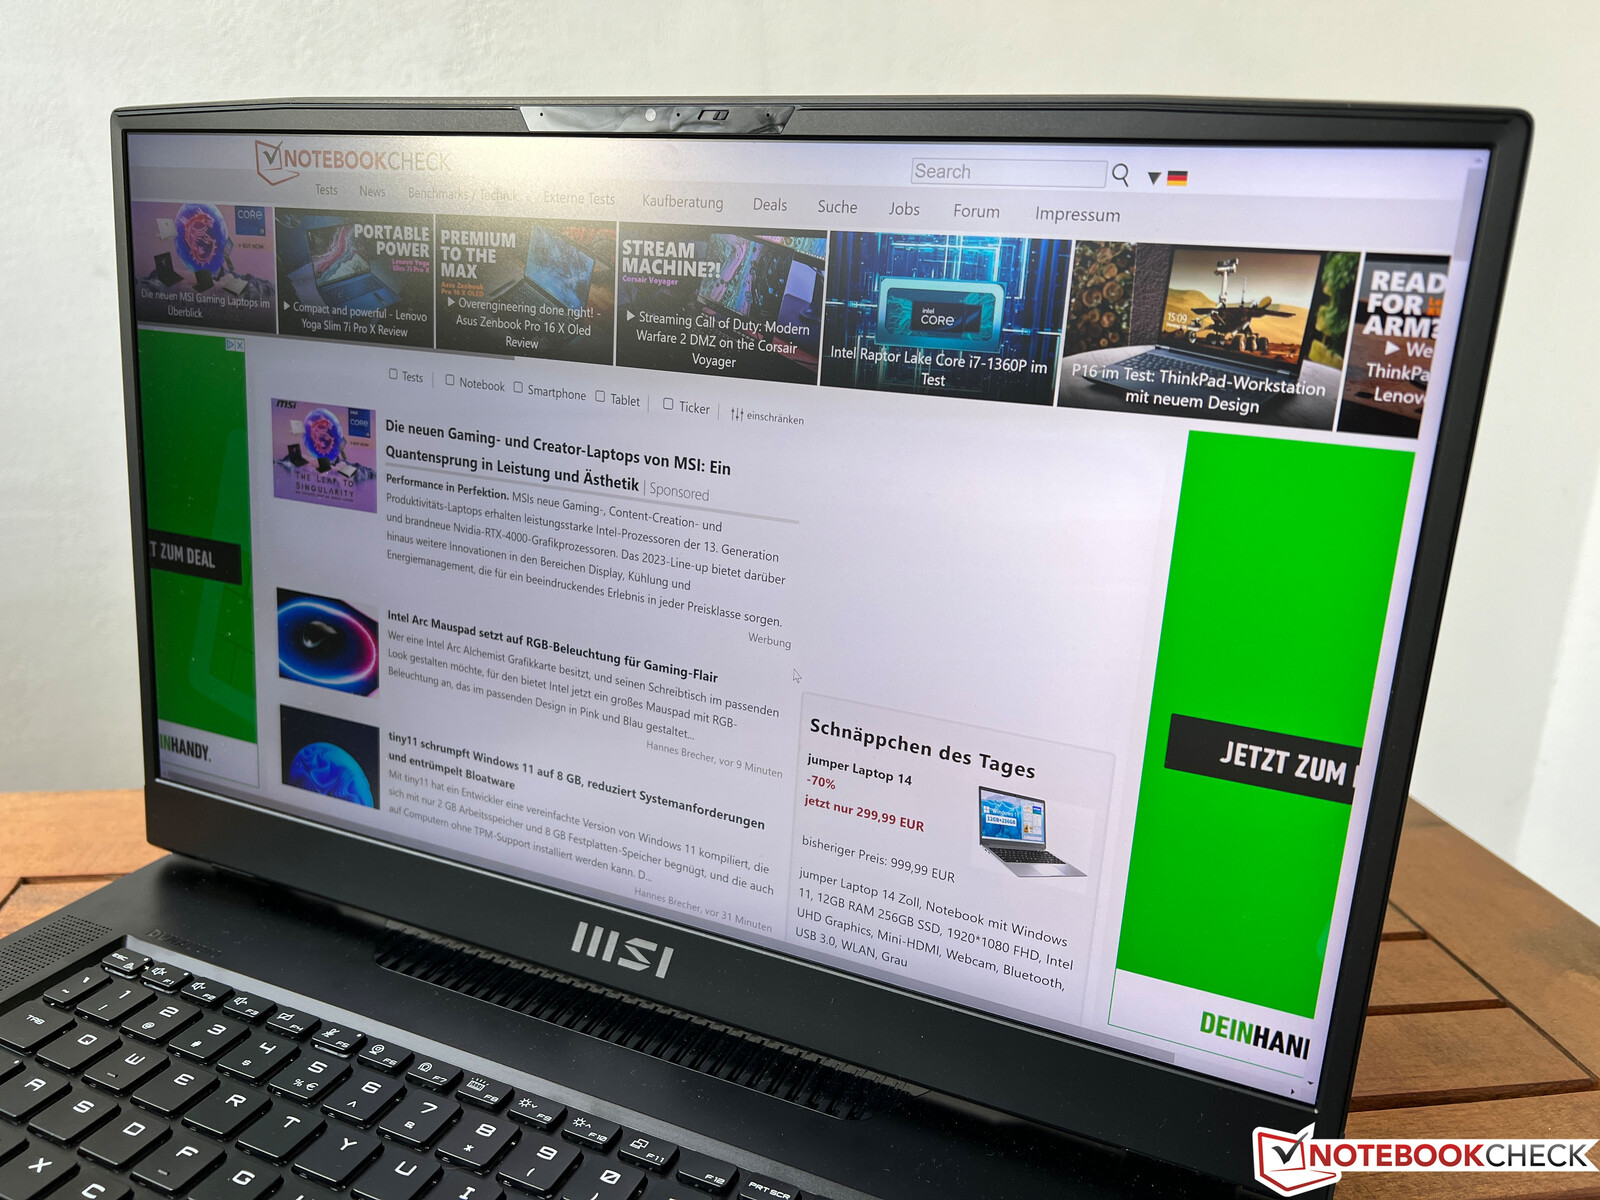
Skärm - 4K Mini-LED med 144 Hz

MSI använder inte bara de senaste CPU- och GPU-modellerna, utan erbjuder även en helt ny Mini-LED-panel med 4K-upplösning (16:9, 3840 x 2160 pixlar) och en uppdateringsfrekvens på 144 Hz. Det är även möjligt att få en QHD IPS-skärm med 240 Hz. Den subjektiva bildkvaliteten hos den matta Mini-LED-panelen från AU Optronics (B173ZAN06.C) är imponerande med knivskarpt innehåll och fylliga färger. Svarta bilder är faktiskt svarta och det finns ingen bakgrundsbelysningsblödning på Mini-LED-skärmar. MSI annonserar mer än 1000 dimningszoner, men du kan ändå märka av blomning. Ljusa objekt på mörka bakgrunder skapar ljusa moln eftersom hela dimningszonen är upplyst. Du märker det dock egentligen bara när logotyper dyker upp, men vi märkte det inte under spel eller dagliga saker. Vi mäter en genomsnittlig ljusstyrka på 600 nits och ett mycket högt kontrastförhållande tack vare det låga svartvärdet.
Panelen stöder HDR 1000 och vi kan bekräfta en maximal ljusstyrka på mer än 1000 nits på en helt vit bild, men panelen når inte upp till högre värden medan Mini-LED-panelen iApple MacBook Pro 16kan nå upp till 1600 nits för små delar av skärmen. HDR-implementeringen i Windows är fortfarande en katastrof jämfört med macOS. HDR måste aktiveras manuellt, du kan inte använda några färgprofiler längre och du kan inte använda HDR på batteri. Vi skulle inte bli förvånade om många användare inte använder HDR alls med tanke på dessa problem, vilket är synd. Kvaliteten på HDR-videor är jämförbar med MacBook Pro 16 trots den matta ytan, och vi testade dem sida vid sida.
| |||||||||||||||||||||||||
Distribution av ljusstyrkan: 93 %
Mitt på batteriet: 402 cd/m²
Kontrast: 6060000:1 (Svärta: 0.0001 cd/m²)
ΔE ColorChecker Calman: 4.8 | ∀{0.5-29.43 Ø4.71}
calibrated: 1.8
ΔE Greyscale Calman: 6.5 | ∀{0.09-98 Ø4.96}
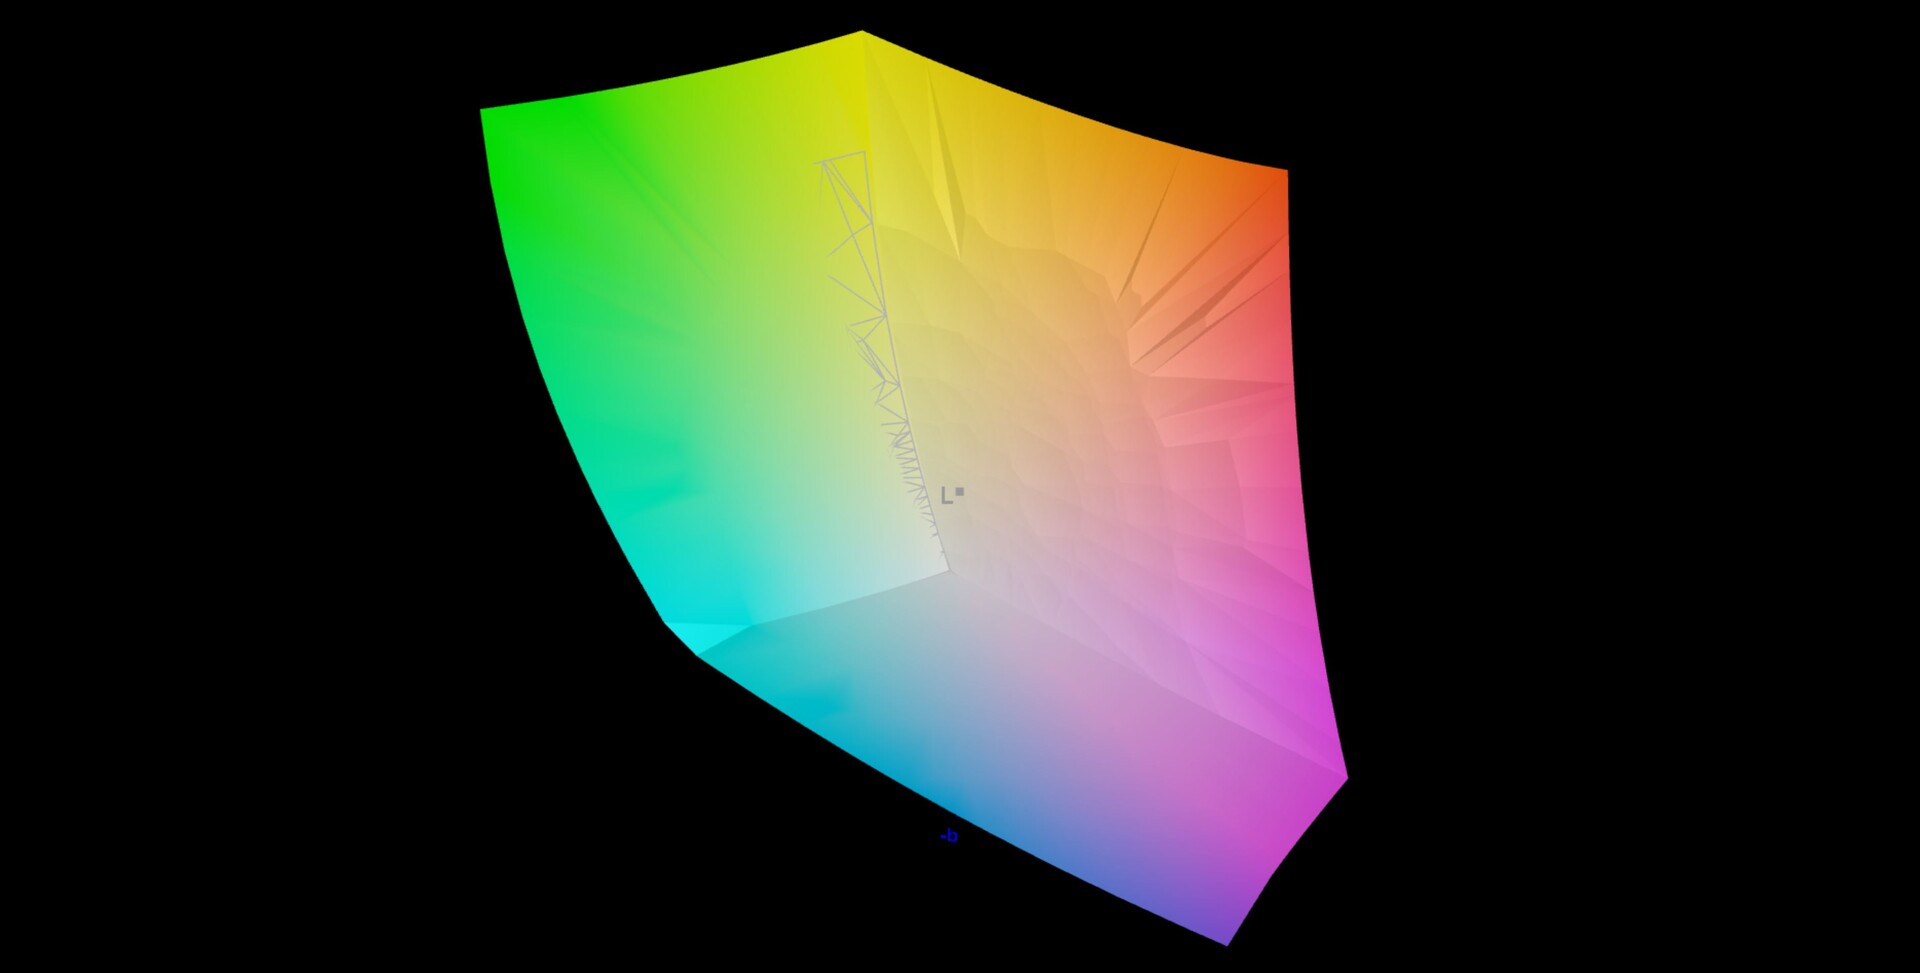
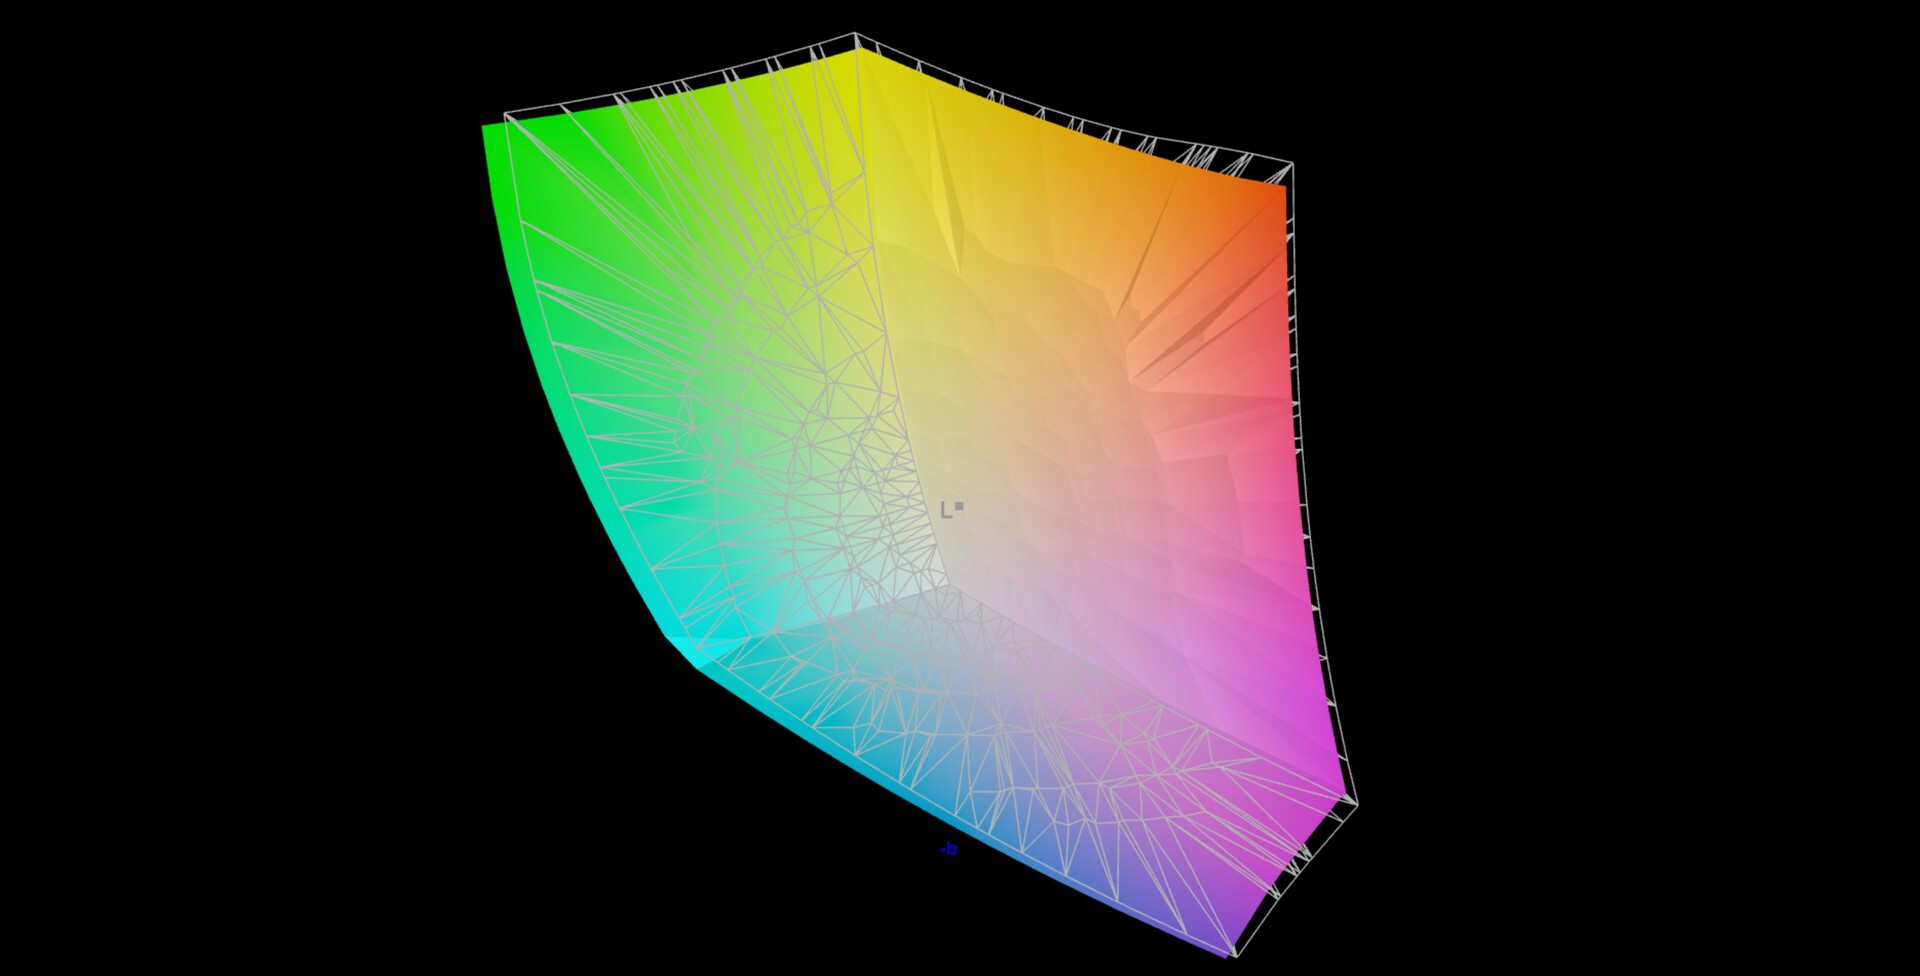
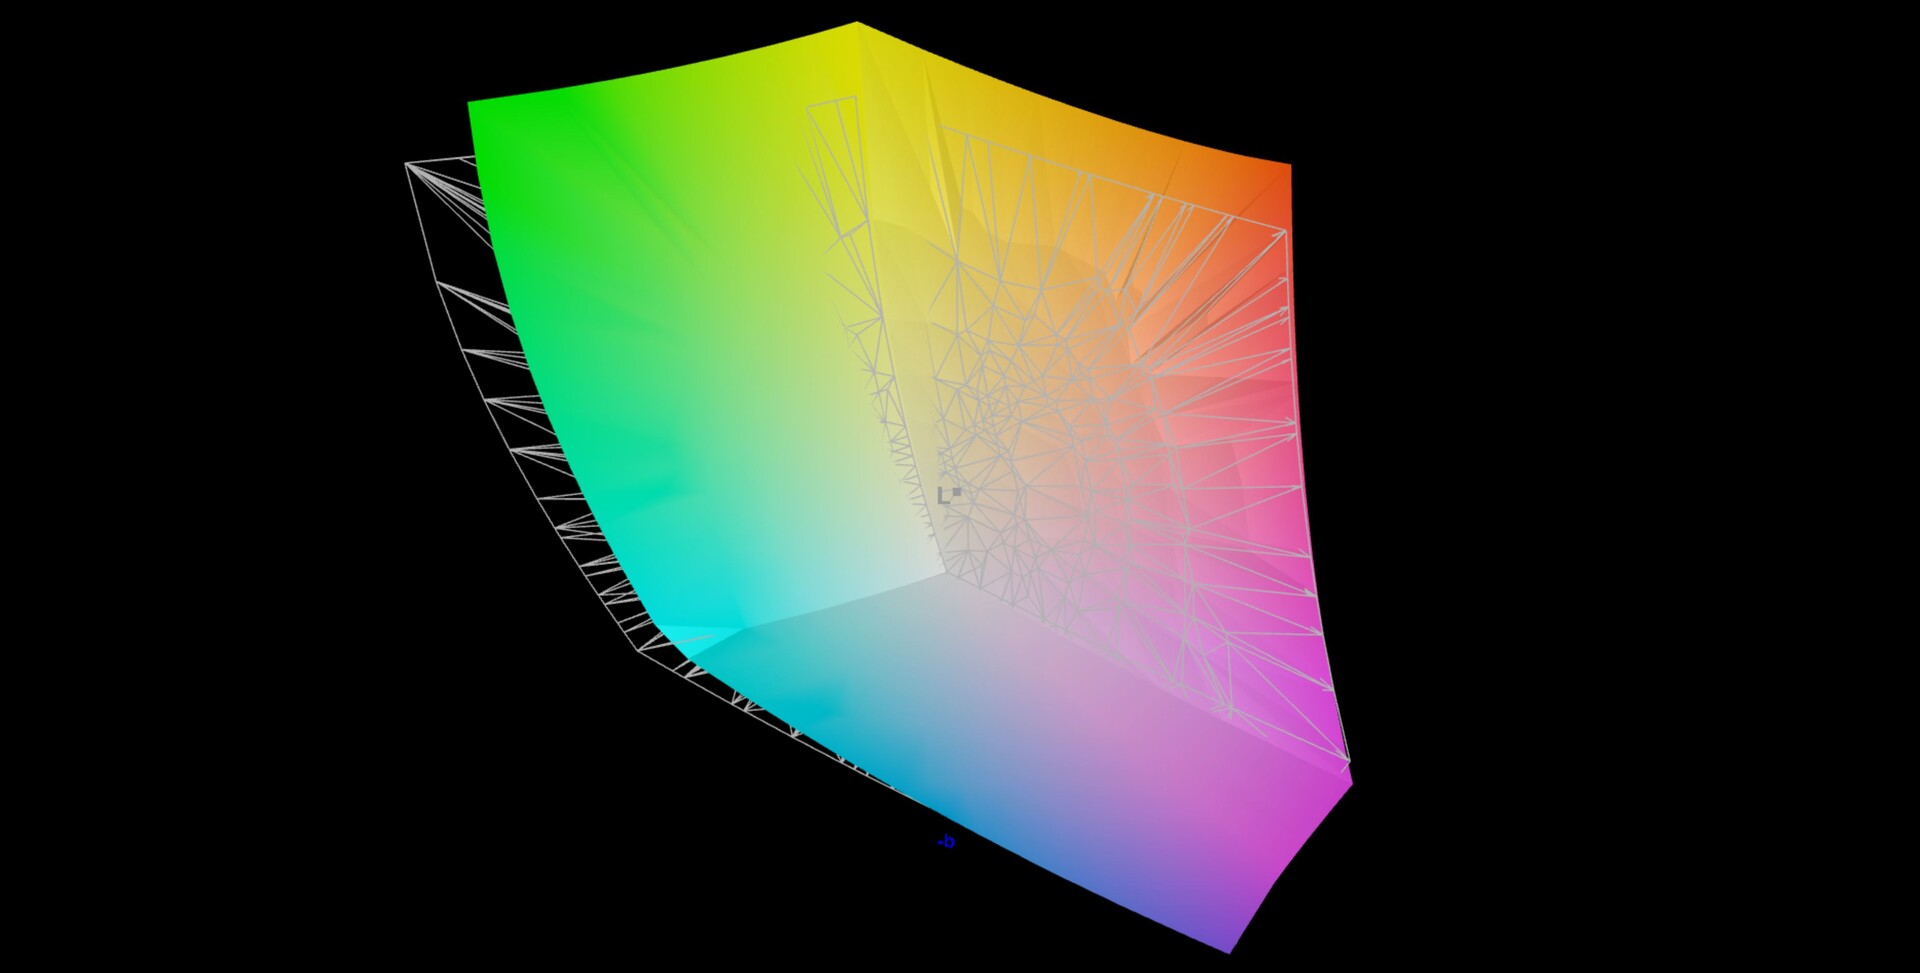
92.4% AdobeRGB 1998 (Argyll 3D)
99.9% sRGB (Argyll 3D)
94.9% Display P3 (Argyll 3D)
Gamma: 2.63
CCT: 6596 K
| MSI Titan GT77 HX 13VI B173ZAN06.C, Mini-LED, 3840x2160, 17.3" | Razer Blade 16 Early 2023 CSOT T3 MNG007DA4-1, IPS, 2560x1600, 16" | Asus ROG Strix Scar 17 SE G733CX-LL014W NE173QHM-NZ2, IPS, 2560x1440, 17.3" | MSI Titan GT77 12UHS Sharp SHP1544 LQ173M1JW08, IPS-Level, 1920x1080, 17.3" | Alienware x17 R2 P48E AU Optronics B173HAN, IPS, 1920x1080, 17.3" | Schenker XMG Neo 17 M22 BOE0A99, IPS, 2560x1600, 17" | |
|---|---|---|---|---|---|---|
| Display | 0% | -2% | -16% | -10% | -17% | |
| Display P3 Coverage (%) | 94.9 | 98.5 4% | 97.1 2% | 70.8 -25% | 79.2 -17% | 69 -27% |
| sRGB Coverage (%) | 99.9 | 100 0% | 99.9 0% | 98.9 -1% | 99.8 0% | 99.8 0% |
| AdobeRGB 1998 Coverage (%) | 92.4 | 89.7 -3% | 84.8 -8% | 73 -21% | 79.6 -14% | 69.6 -25% |
| Response Times | 69% | 74% | 86% | 67% | 75% | |
| Response Time Grey 50% / Grey 80% * (ms) | 38.4 ? | 6.6 ? 83% | 5.7 ? 85% | 3.03 ? 92% | 12.4 ? 68% | 10.8 ? 72% |
| Response Time Black / White * (ms) | 26.6 ? | 12 ? 55% | 10.1 ? 62% | 5.28 ? 80% | 9.2 ? 65% | 6.1 ? 77% |
| PWM Frequency (Hz) | 2380 ? | |||||
| Screen | -38877% | -37485% | -44442% | -32218% | -47756% | |
| Brightness middle (cd/m²) | 606 | 456.8 -25% | 320 -47% | 280 -54% | 365.4 -40% | 415 -32% |
| Brightness (cd/m²) | 602 | 437 -27% | 303 -50% | 275 -54% | 344 -43% | 399 -34% |
| Brightness Distribution (%) | 93 | 83 -11% | 87 -6% | 79 -15% | 85 -9% | 90 -3% |
| Black Level * (cd/m²) | 0.0001 | 0.35 -349900% | 0.3 -299900% | 0.4 -399900% | 0.29 -289900% | 0.43 -429900% |
| Contrast (:1) | 6060000 | 1305 -100% | 1067 -100% | 700 -100% | 1260 -100% | 965 -100% |
| Colorchecker dE 2000 * | 4.8 | 3.7 23% | 1.1 77% | 2.1 56% | 3.17 34% | 1.44 70% |
| Colorchecker dE 2000 max. * | 8.2 | 6.42 22% | 2.7 67% | 5.83 29% | 7.69 6% | 2.33 72% |
| Colorchecker dE 2000 calibrated * | 1.8 | 0.66 63% | 1.58 12% | 0.51 72% | 0.89 51% | |
| Greyscale dE 2000 * | 6.5 | 2.6 60% | 1.1 83% | 3.3 49% | 5.3 18% | 1.8 72% |
| Gamma | 2.63 84% | 2.3 96% | 2.13 103% | 2.13 103% | 2.18 101% | 2.132 103% |
| CCT | 6596 99% | 6108 106% | 6599 98% | 7060 92% | 5879 111% | 6327 103% |
| Totalt genomsnitt (program/inställningar) | -12936% /
-24983% | -12471% /
-23057% | -14791% /
-28561% | -10720% /
-20704% | -15899% /
-30693% |
* ... mindre är bättre
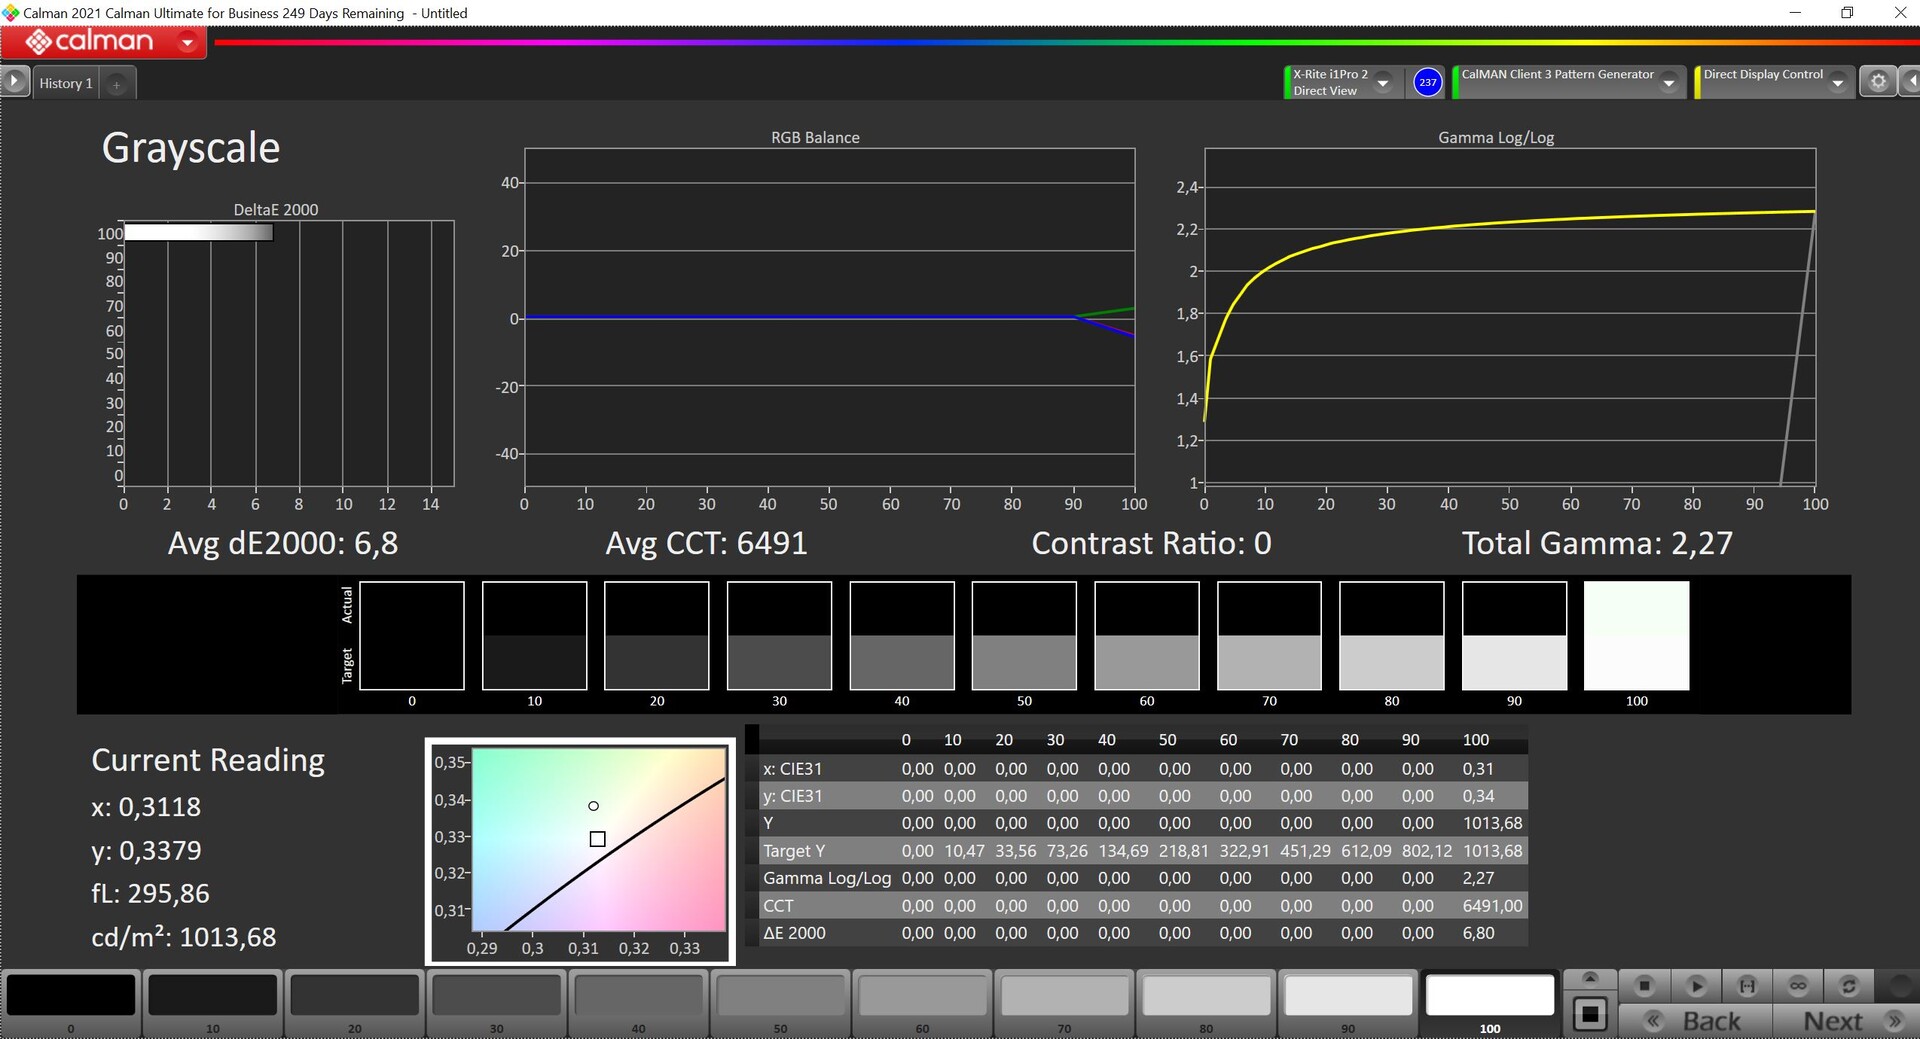
MSI levererar Titan GT77 med True Color-programvaran, som erbjuder olika förinställningar för färgrymder och scenarier (som Gamer, Office, Movie) och du kan även använda programvaran för att kalibrera skärmen. Vi använde den professionella CalMAN-mjukvaran i kombination med X-Rite i1 Pro 2-spektrofotometern och profilen Display P3 eftersom panelen ska täcka hela P3-skalan.
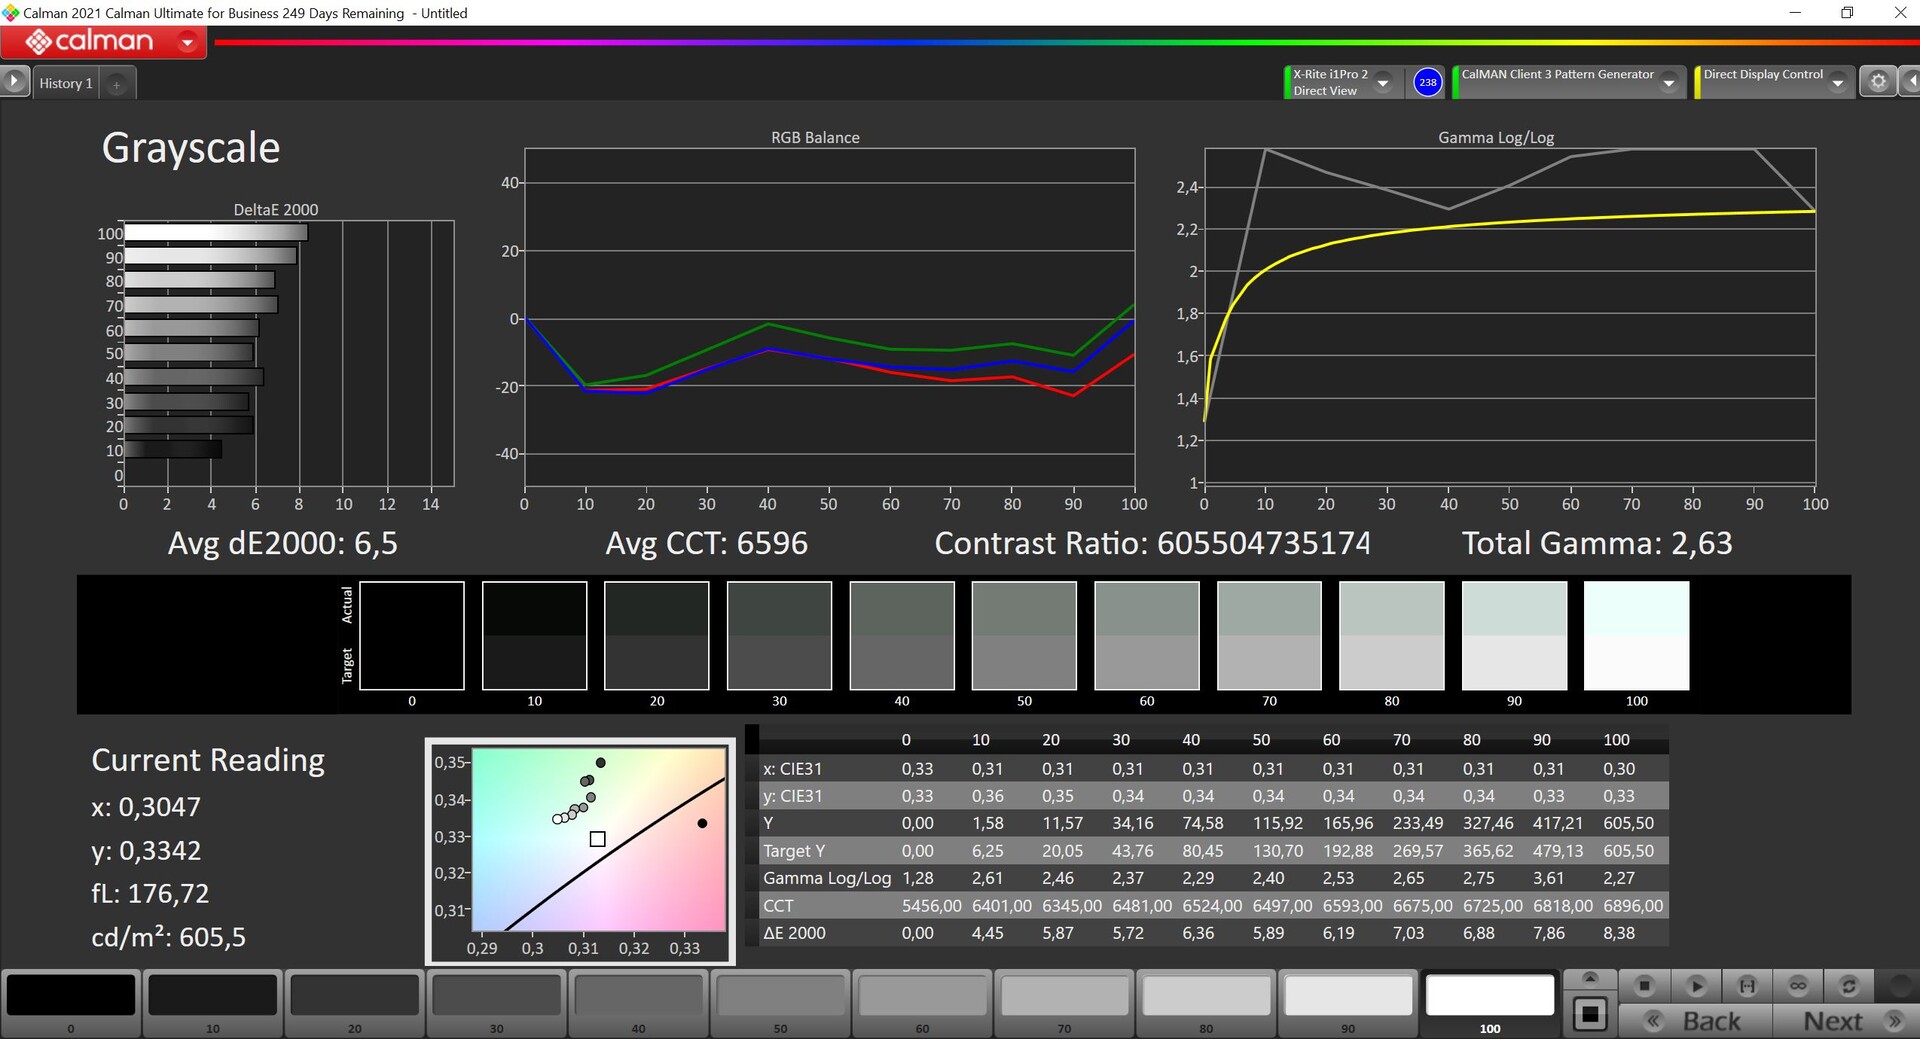
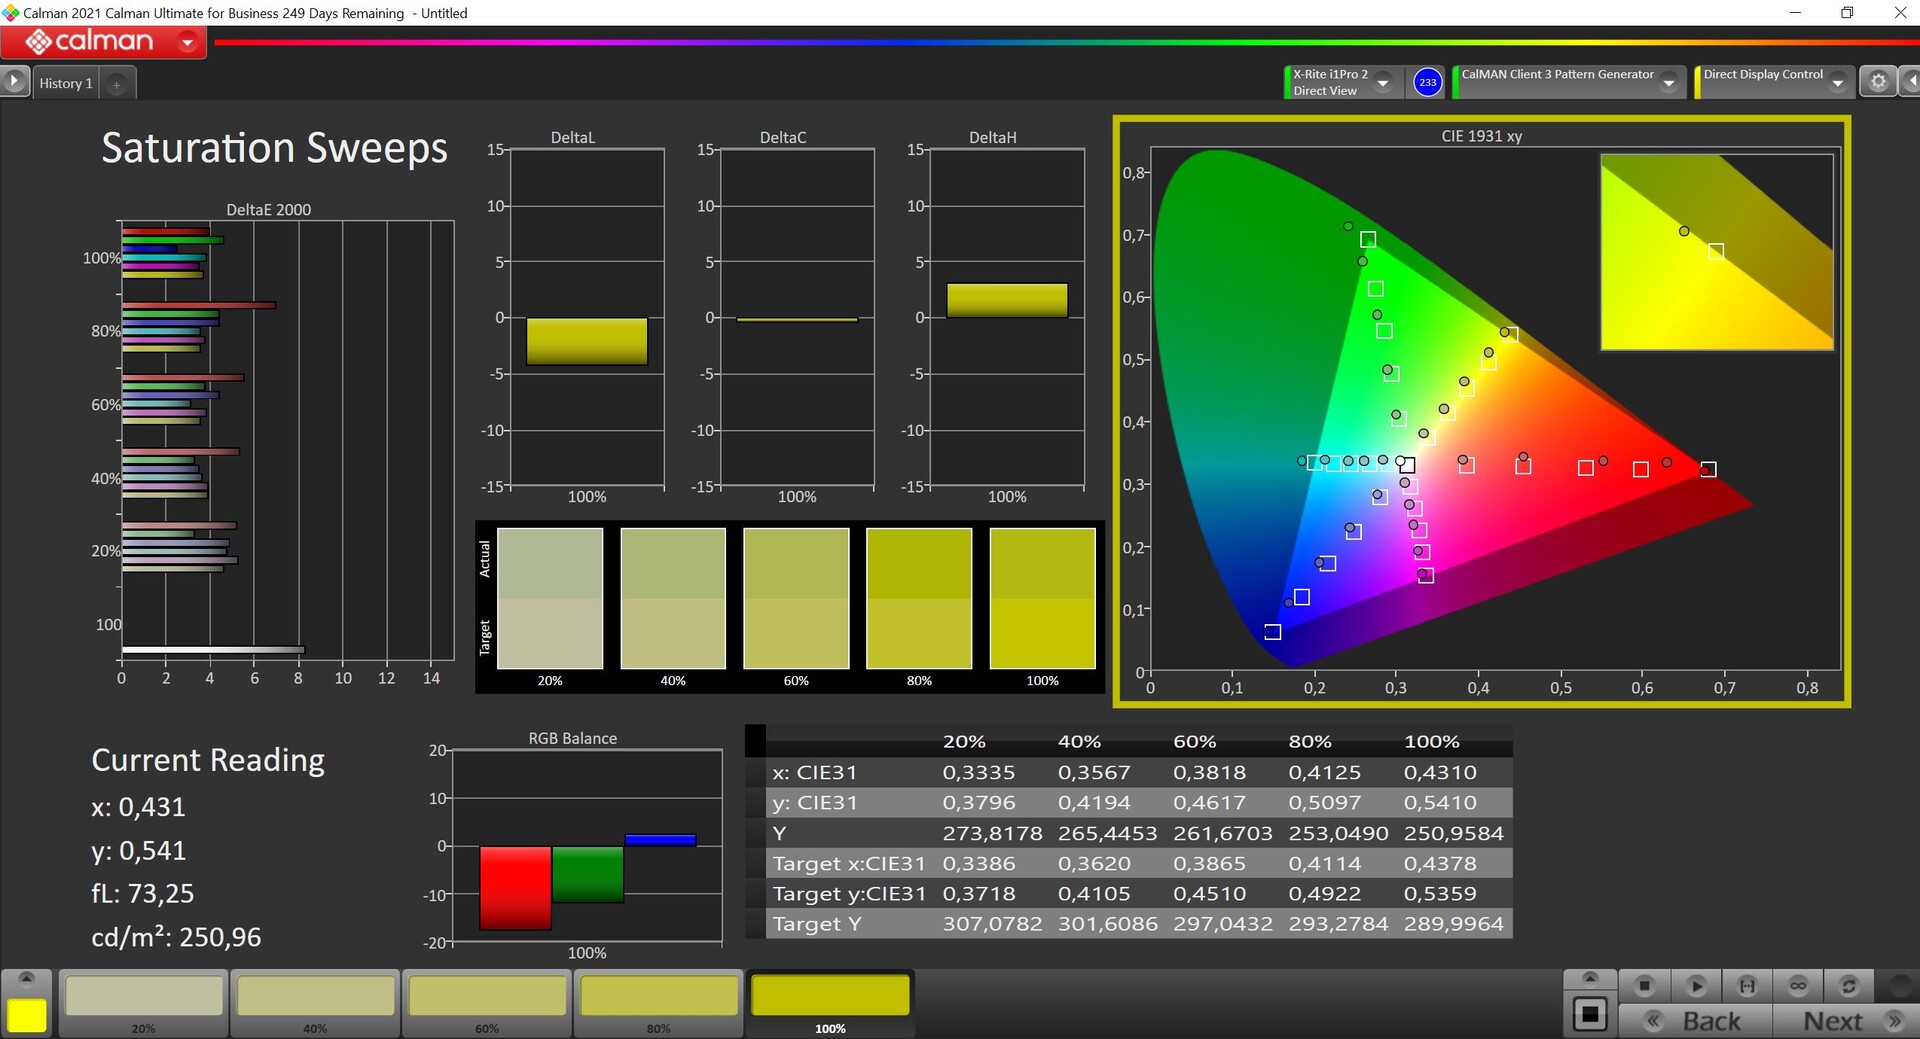
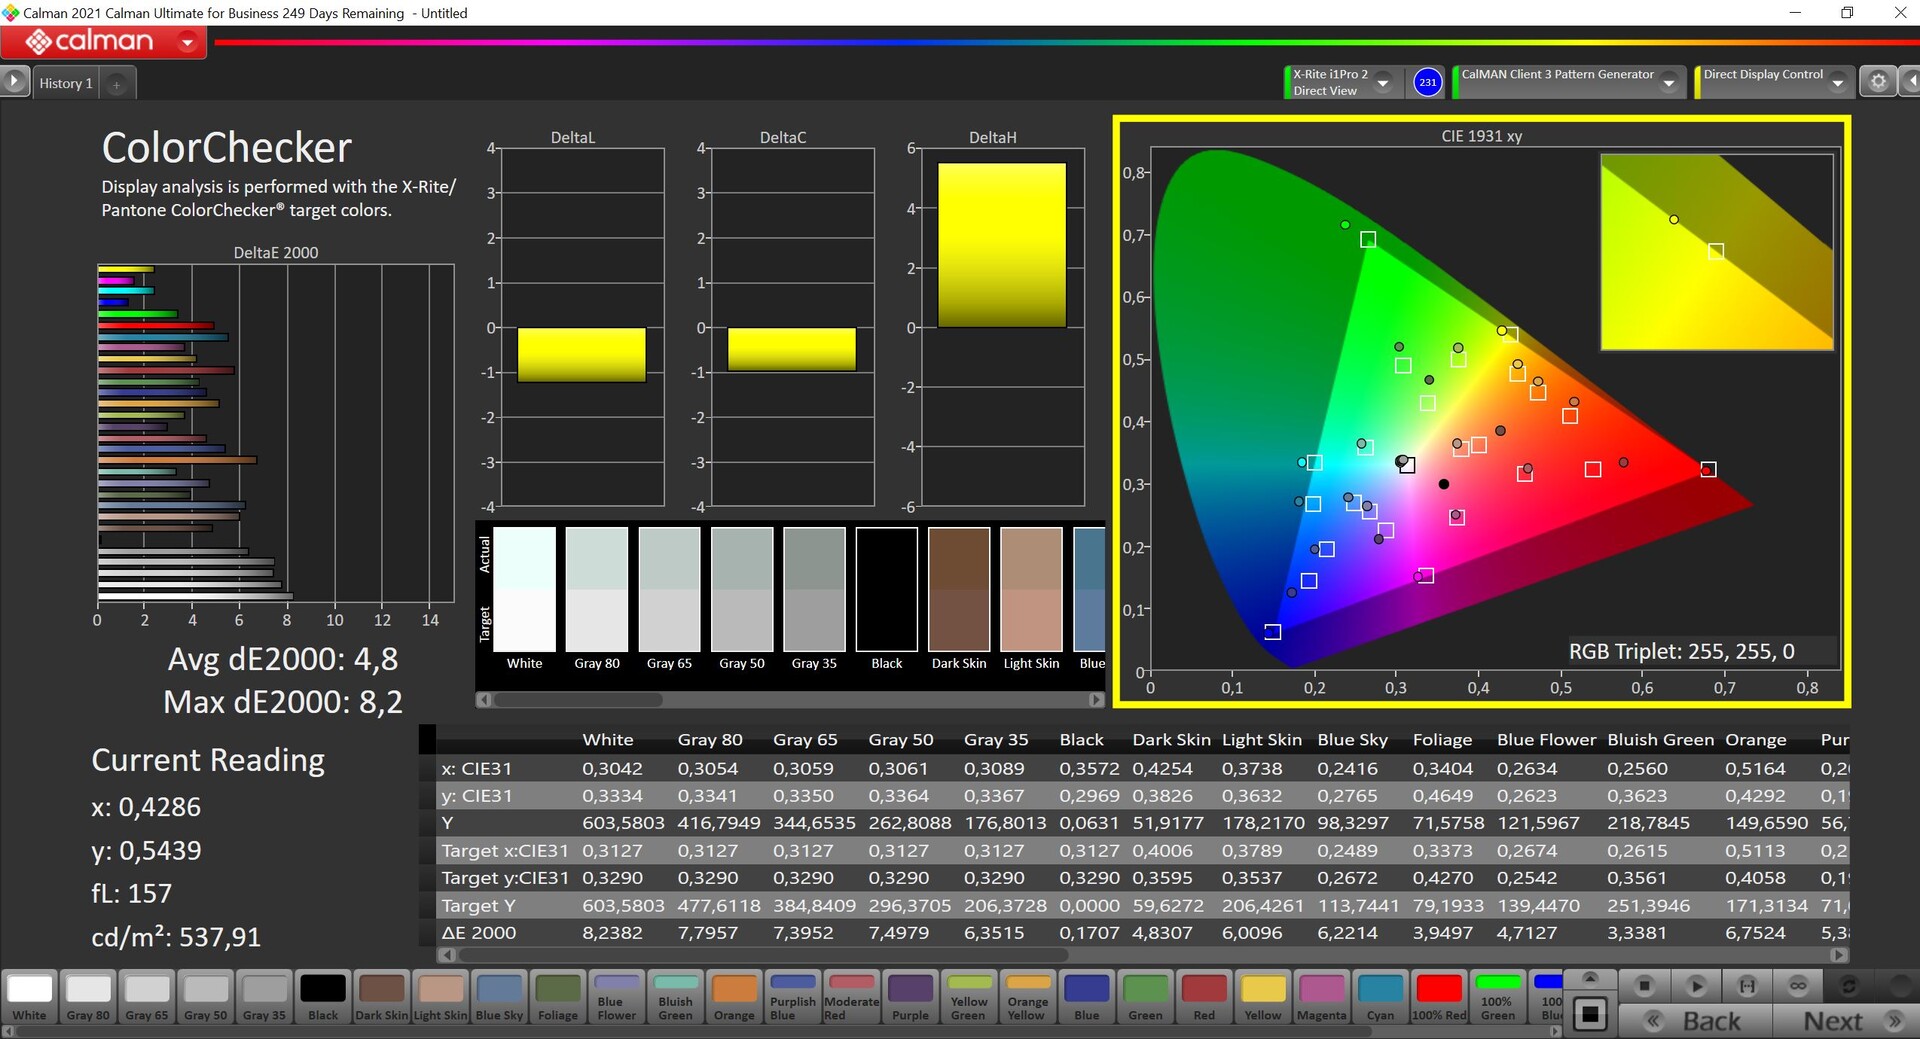
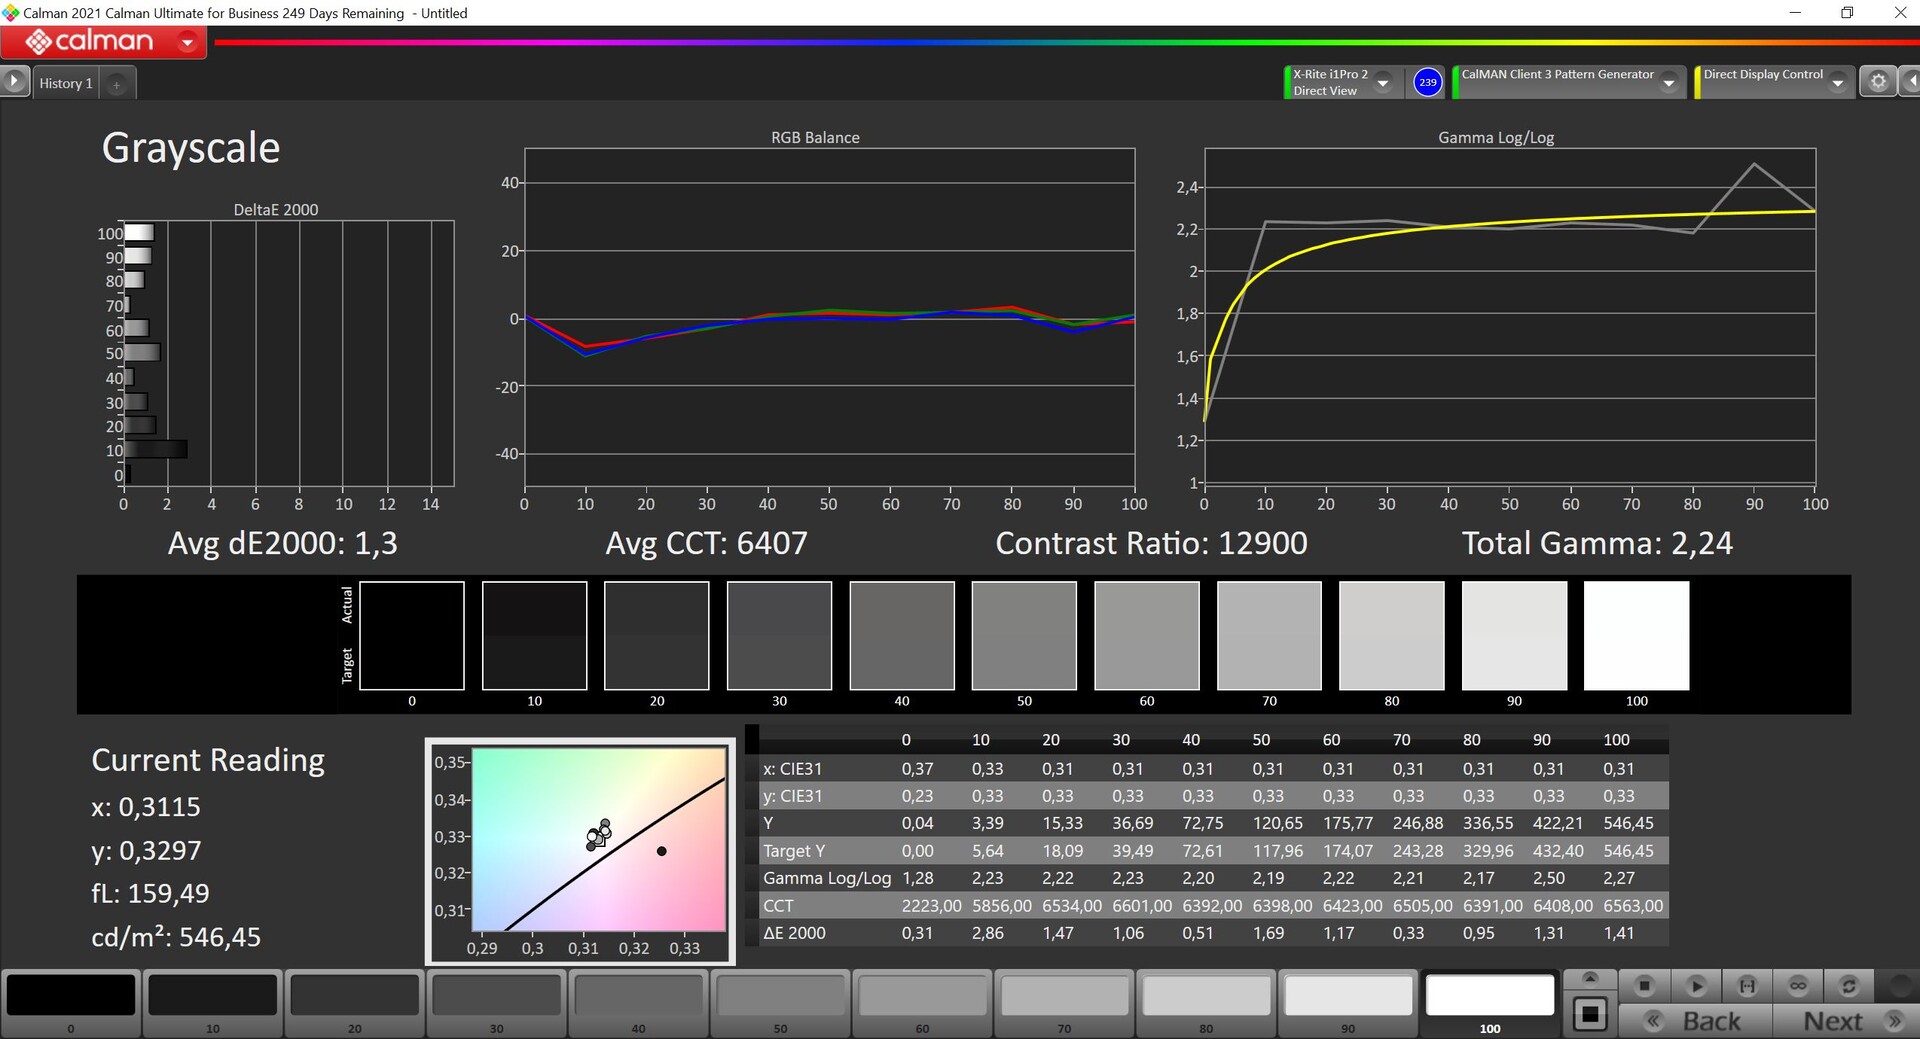
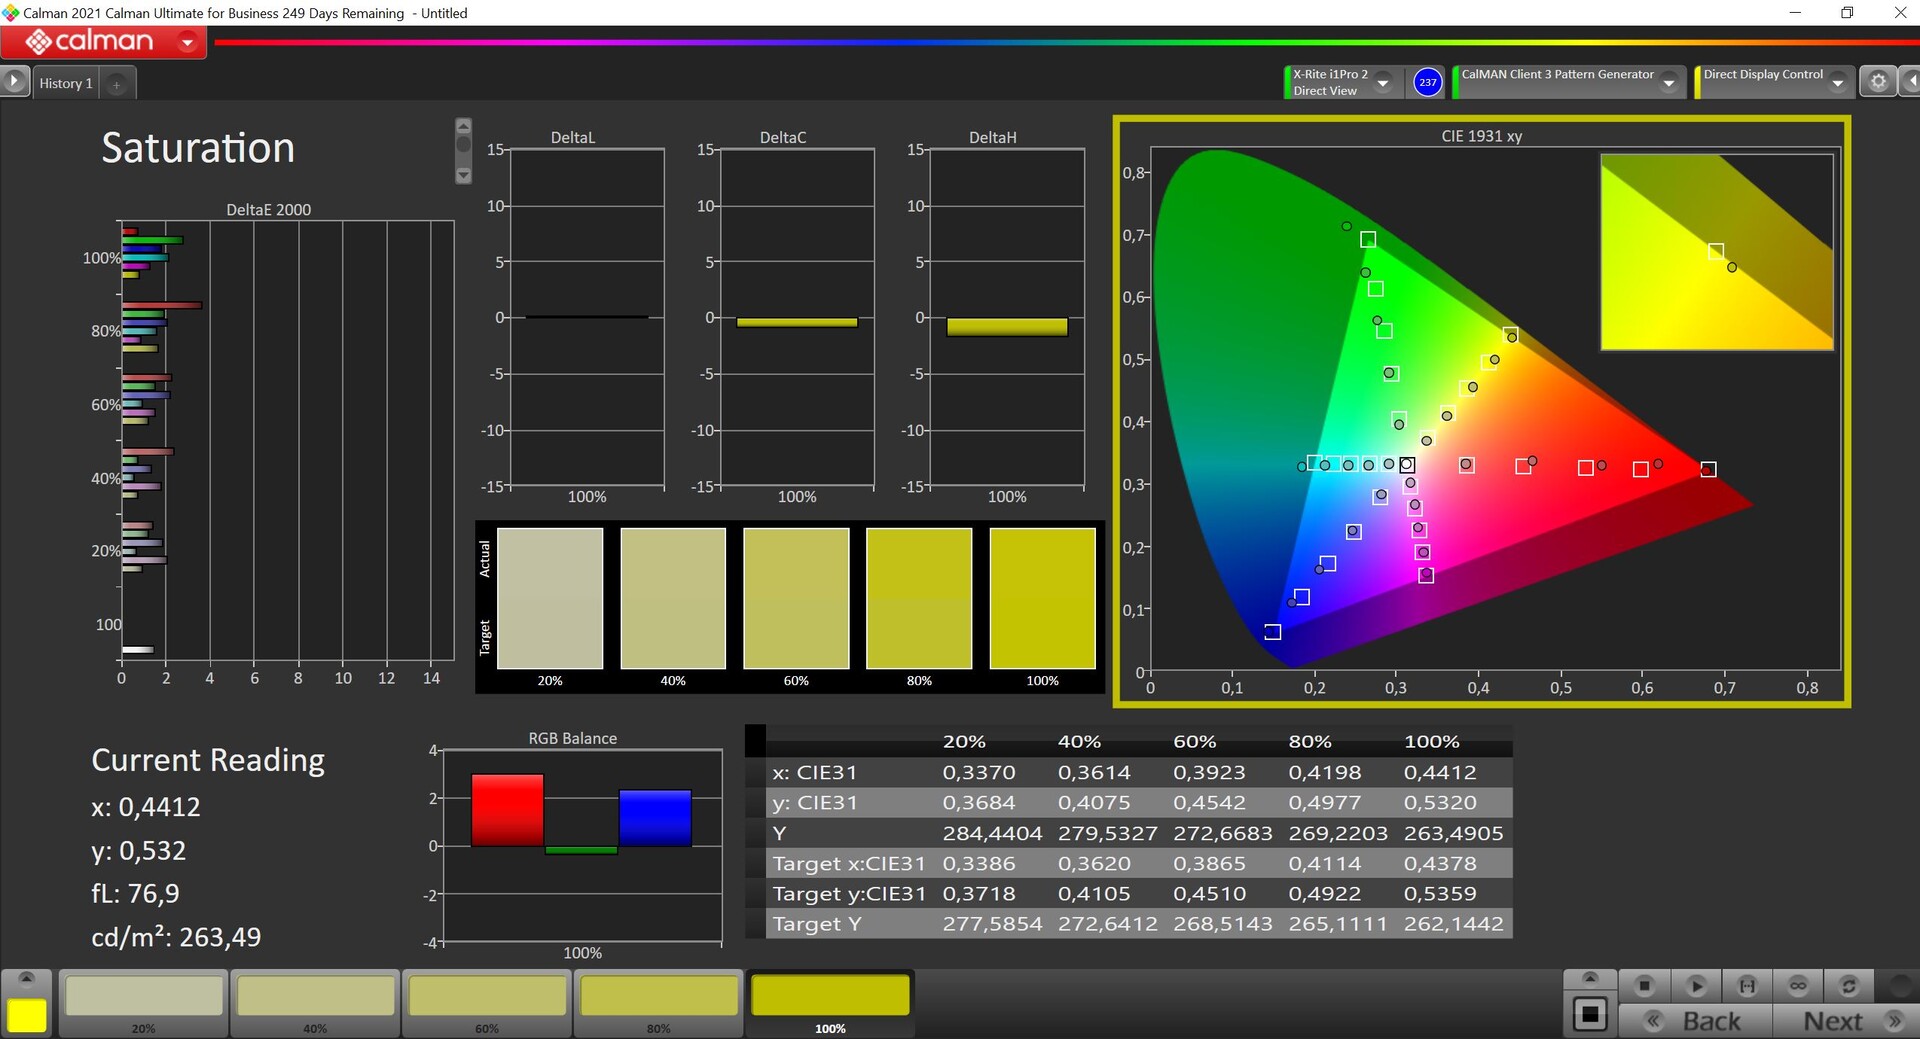
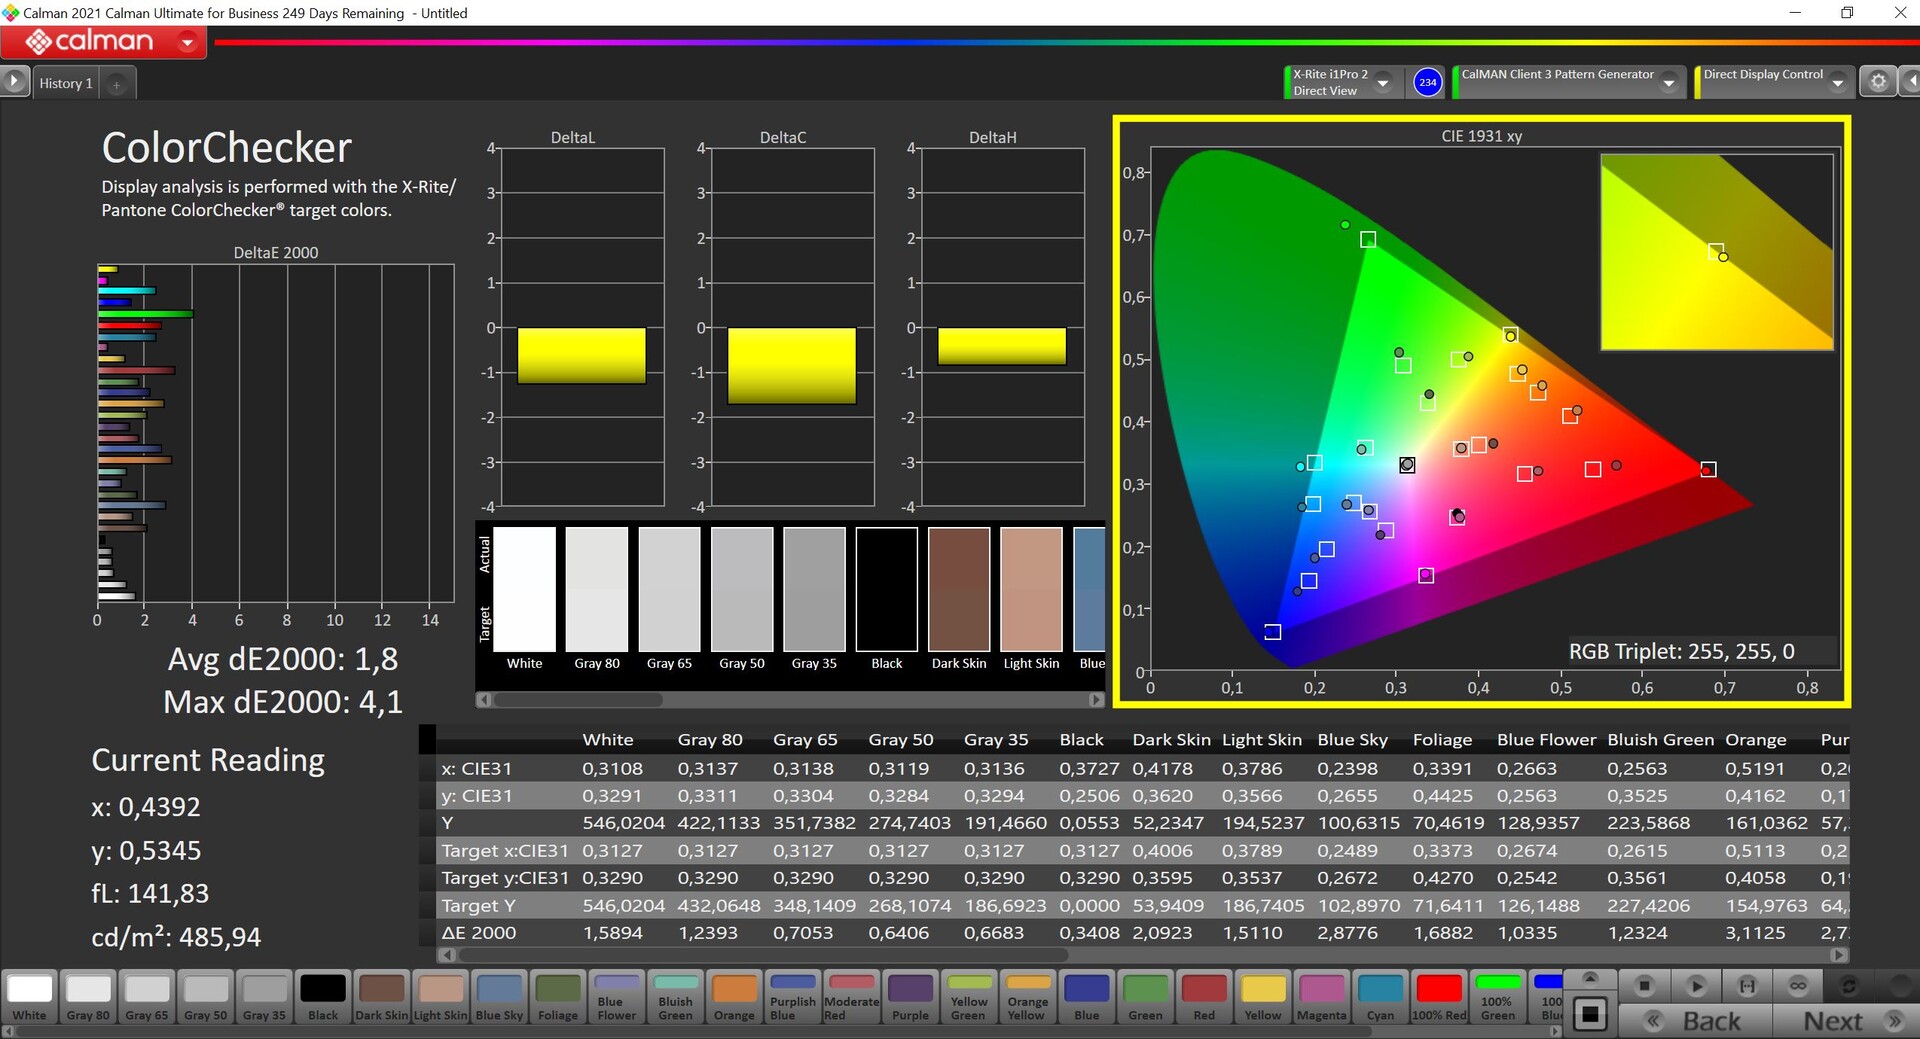
Avvikelserna jämfört med P3-referensområdet är mycket stora, både när det gäller gråskala och färger. Vår egen kalibrering (motsvarande profil finns gratis tillgänglig i bildskärmsrutan ovan) förbättrar färgprestandan märkbart, men sänker också den maximala ljusstyrkan med cirka 50 nits. Vi rekommenderar ändå den kalibrerade profilen och det är möjligt att redigera bilder/videor, även om våra mätningar visar att P3-färgrymden endast täcks till 95 %.
Visa svarstider
| ↔ Svarstid svart till vitt | ||
|---|---|---|
| 26.6 ms ... stiga ↗ och falla ↘ kombinerat | ↗ 9.2 ms stiga | 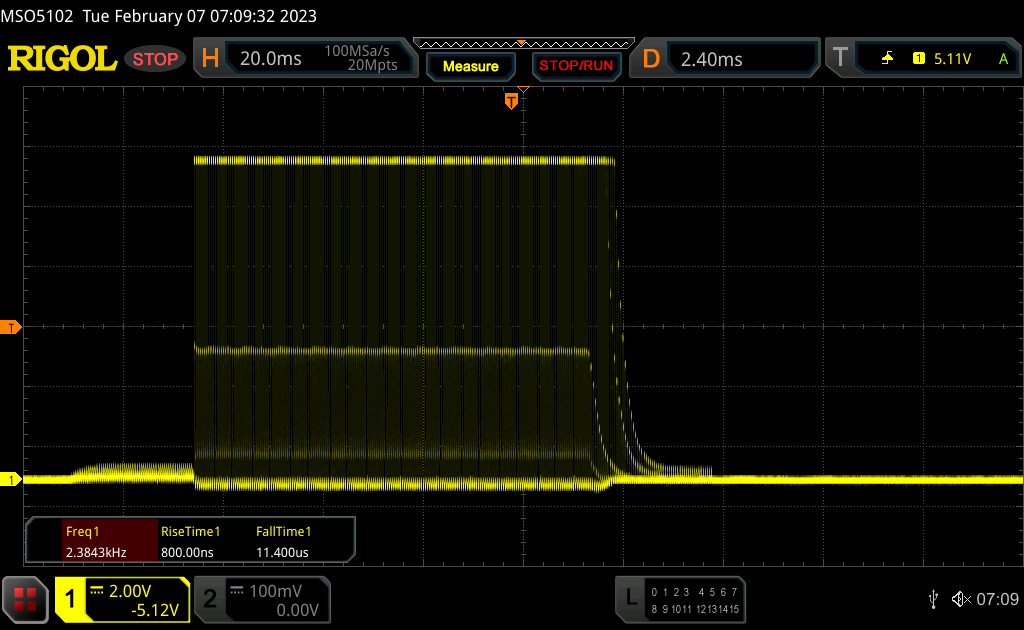 |
| ↘ 17.4 ms hösten | ||
| Skärmen visar relativt långsamma svarsfrekvenser i våra tester och kan vara för långsam för spelare. I jämförelse sträcker sig alla testade enheter från 0.1 (minst) till 240 (maximalt) ms. » 67 % av alla enheter är bättre. Detta innebär att den uppmätta svarstiden är sämre än genomsnittet av alla testade enheter (19.8 ms). | ||
| ↔ Svarstid 50 % grått till 80 % grått | ||
| 38.4 ms ... stiga ↗ och falla ↘ kombinerat | ↗ 13.6 ms stiga | 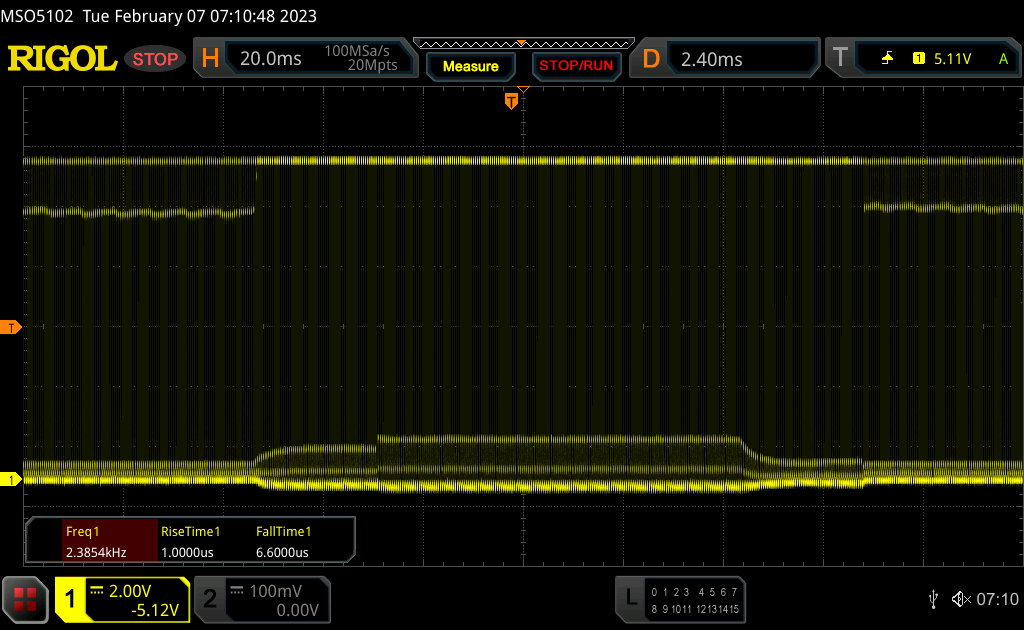 |
| ↘ 24.8 ms hösten | ||
| Skärmen visar långsamma svarsfrekvenser i våra tester och kommer att vara otillfredsställande för spelare. I jämförelse sträcker sig alla testade enheter från 0.165 (minst) till 636 (maximalt) ms. » 58 % av alla enheter är bättre. Detta innebär att den uppmätta svarstiden är sämre än genomsnittet av alla testade enheter (31 ms). | ||
Skärmflimmer / PWM (Puls-Width Modulation)
| Skärmflimmer / PWM upptäckt | 2380 Hz | ≤ 100 % ljusstyrka inställning | 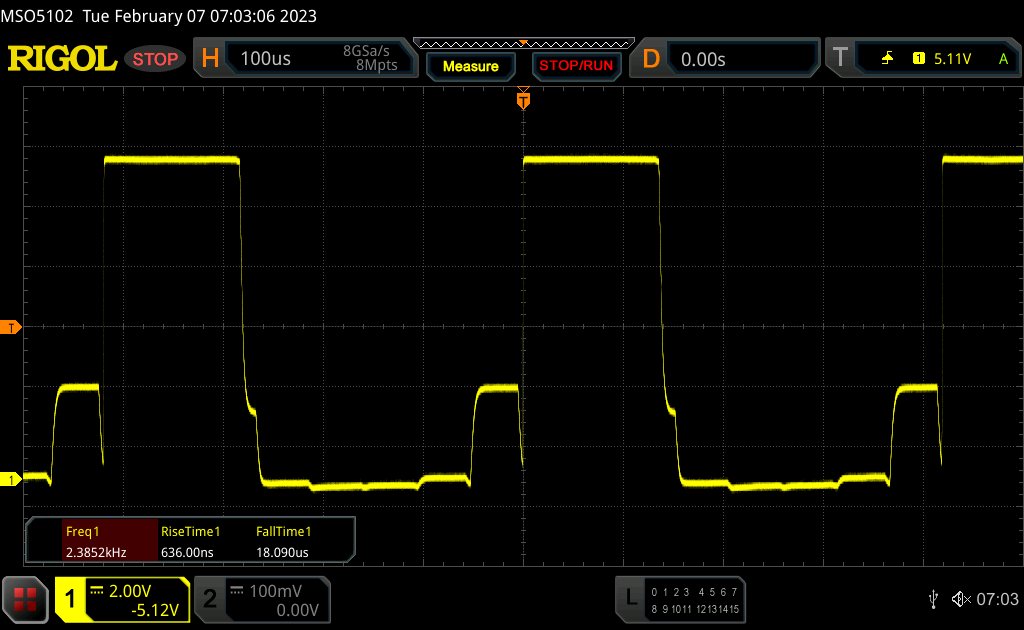 |
Displayens bakgrundsbelysning flimrar vid 2380 Hz (i värsta fall, t.ex. med PWM) Flimrande upptäckt vid en ljusstyrkeinställning på 100 % och lägre. Det ska inte finnas något flimmer eller PWM över denna ljusstyrkeinställning. Frekvensen för 2380 Hz är ganska hög, så de flesta användare som är känsliga för PWM bör inte märka något flimmer. Som jämförelse: 52 % av alla testade enheter använder inte PWM för att dämpa skärmen. Om PWM upptäcktes mättes ett medelvärde av 7754 (minst: 5 - maximum: 343500) Hz. | |||


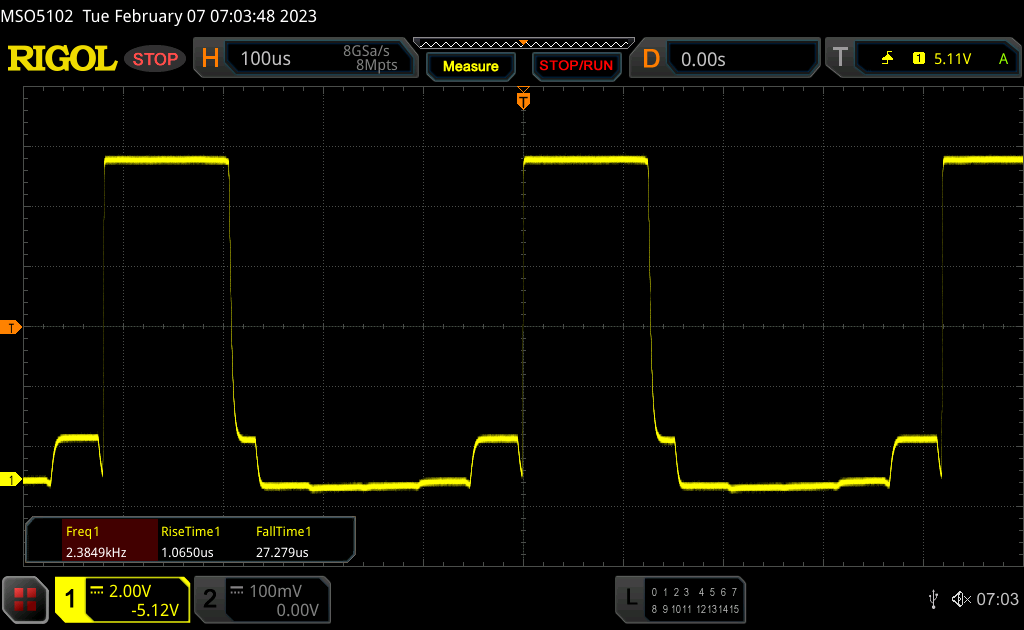
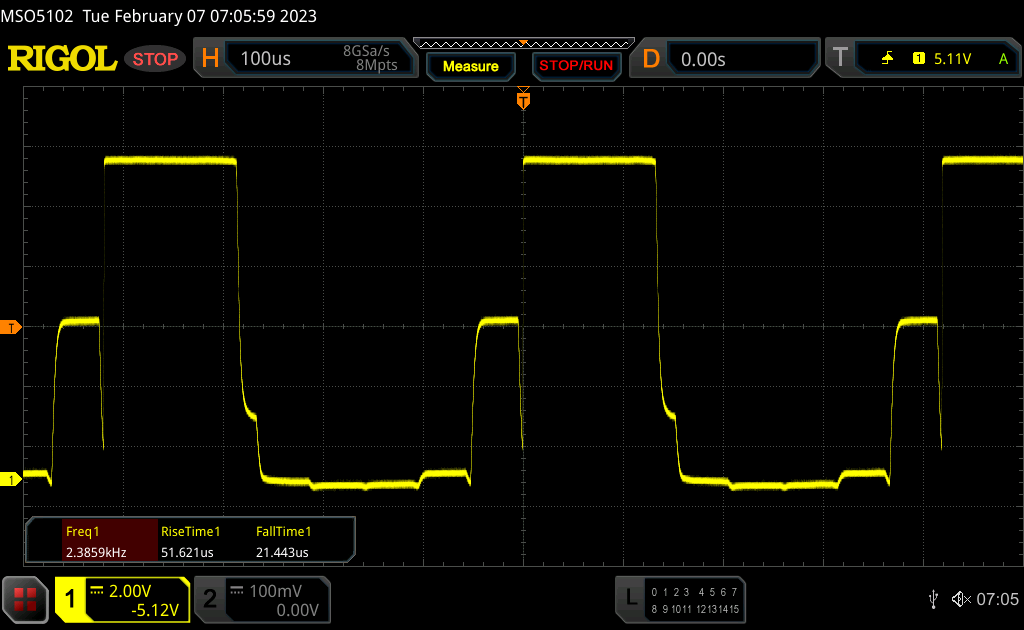
Vi upptäcker PWM vid alla ljusstyrkor (även maximal HDR-styrka) med en frekvens på 2,38 kHz, vilket gör det svårt att fastställa svarstiderna. Vi kommer att lägga till motsvarande resultat senare.
Den matta panelen och den höga ljusstyrkan borde vara bra utomhus, men MSI begränsar GT77:s möjligheter att användas utomhus. HDR är inte möjligt på batteri och den maximala SDR-hällbarheten sänks också från ~600 till ~400 nits så fort du kopplar bort nätadaptern. Det finns inga begränsningar när det gäller betraktningsvinkelstabilitet.

Prestanda - Core i9 HX och RTX 4090
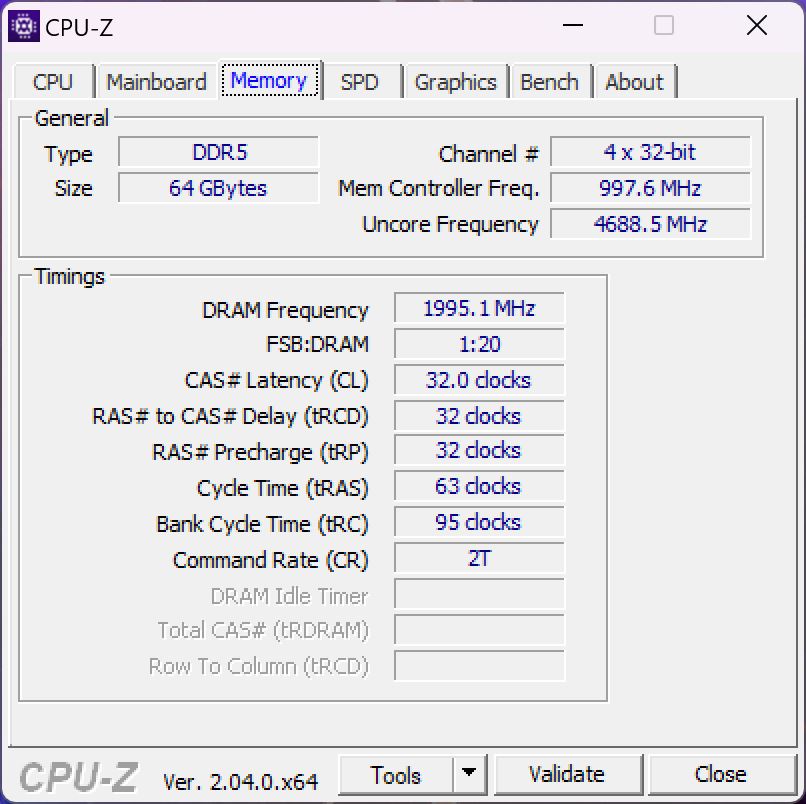
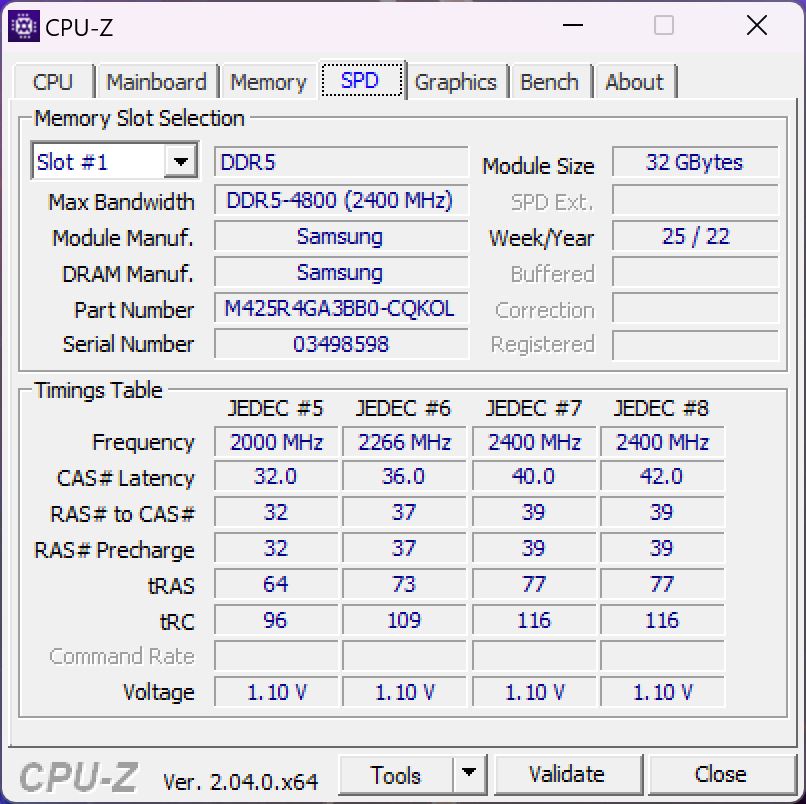
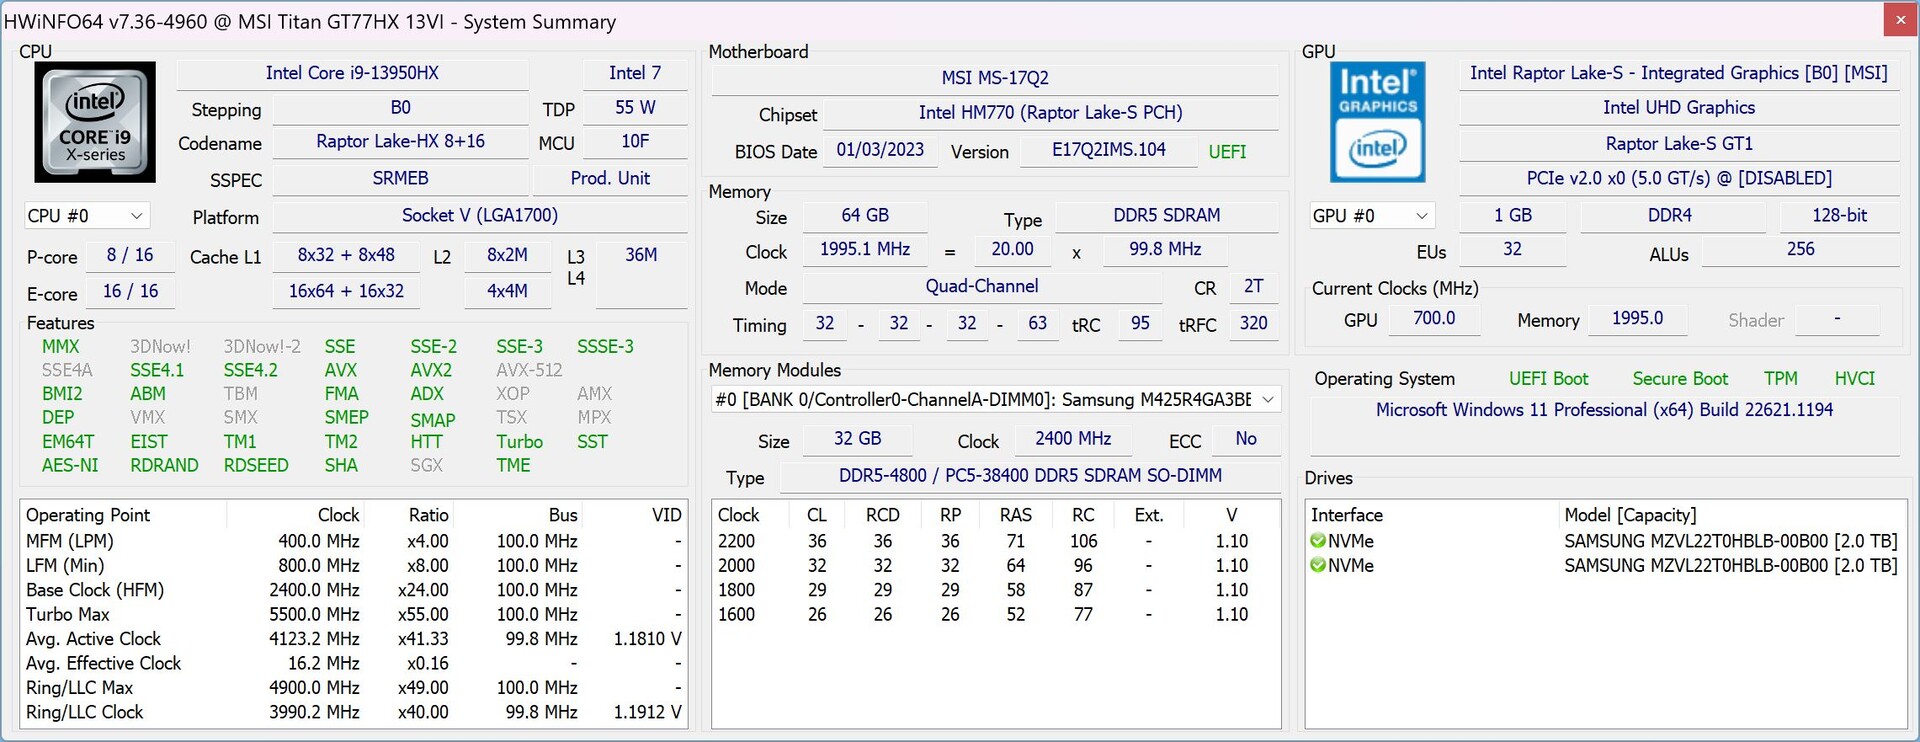
Vår granskningsenhet är utrustad medCore i9-13950HXen av de snabbaste mobila processorerna från Intel. Detaljhandelsversionen kommer att vara utrustad medCore i9-13980HX, men den erbjuder endast en 100 MHz högre maximal klockfrekvens för P-kärnorna till förmån för vPro-stödet. Det sistnämnda är inte viktigt när du spelar spel, men kan vara intressant när du planerar att använda Titan som en mobil arbetsstation. MSI använder fortfarande DDR5-4800 istället för den snabbare DDR5-5600 och du kan antingen välja den nyaGeForce RTX 4080ellerRTX 4090för bärbara datorer.
Översikt av inställningar
Den förinstallerade MSI Center-programvaran erbjuder olika prestandainställningar med ett AI-läge och fyra ytterligare förinställningar (Extreme Performance, Balanced, Silent, Super Battery). Du kan också välja grafikläge (hybrid, endast dGPU, endast iGPU) tack vare en MUX, men det finns inget stöd för Advanced Optimus, vilket innebär att ändringar kräver en omstart.
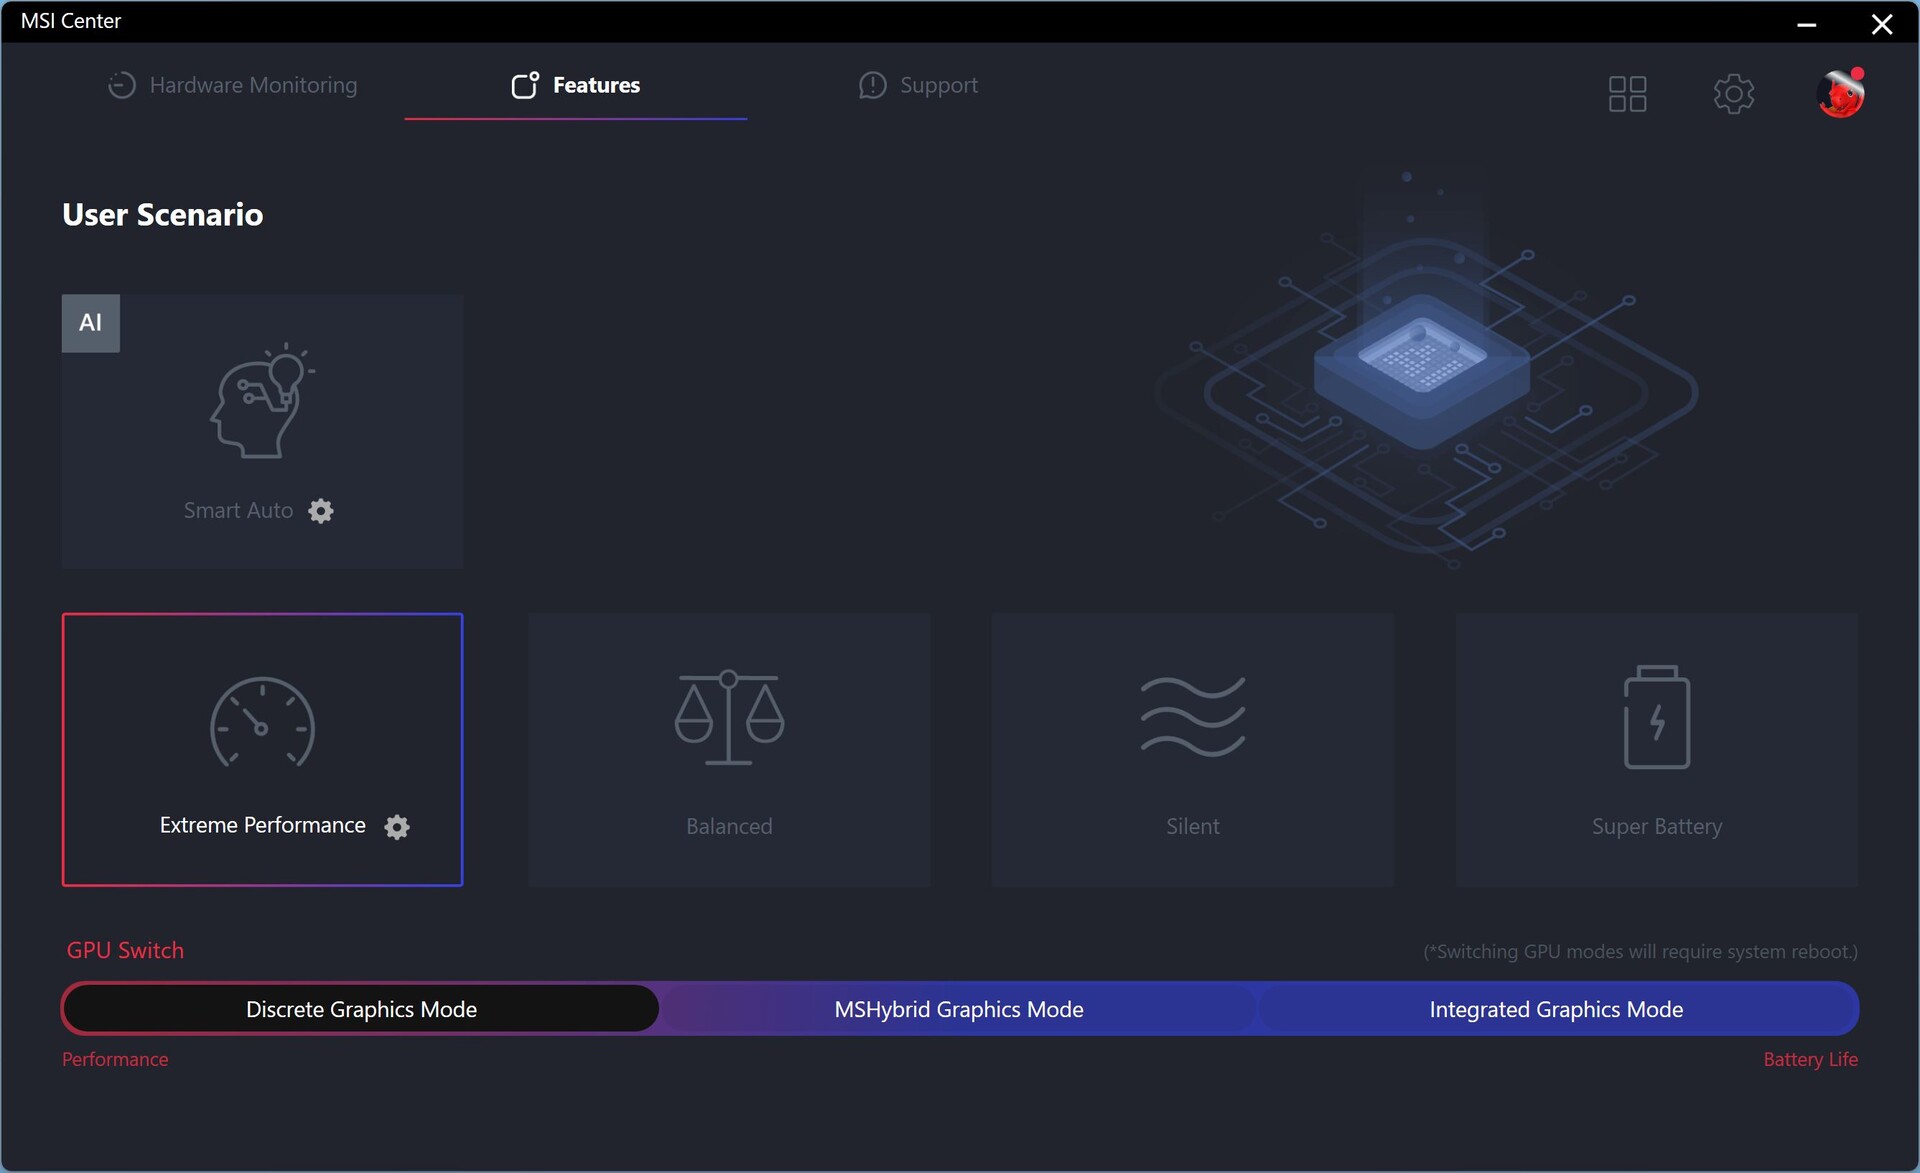
Vi använde förinställningen Extreme Performance med det diskreta GPU-läget (iGPU avaktiverad) för våra benchmarks, men vi använde iGPU för batteritesterna. Vi upplevde inga allvarliga problem med MSI-programvaran, men det fanns ett fel med det diskreta grafikläget där vi inte kunde sänka skärmens ljusstyrka. Vi förväntar oss att detta problem kommer att åtgärdas på detaljhandelsenheter.
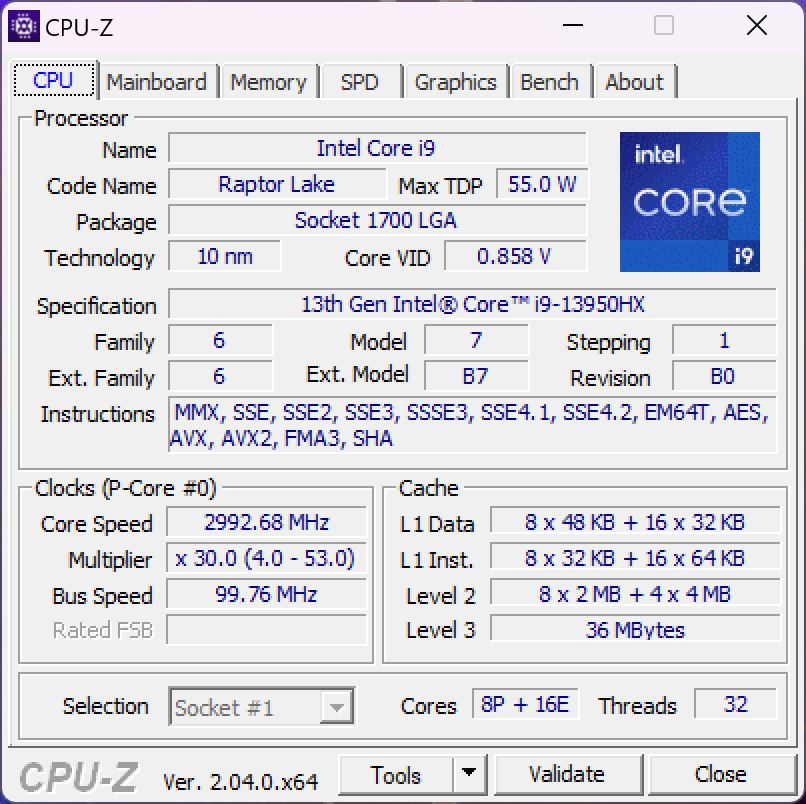
Processor - Core i9-13950HX
I motsats till vad som sägs i långsammare Raptor Lake-mobilprocessorerhar Intel ändrat kärnkonfigurationen för de avancerade chipen i HX-serien jämfört med de gamla Alder Lake-processorerna. Klockorna är högre, men det finns nu också dubbelt så många effektivitetskärnor (från 8 till 16), vilket innebär att CPU:n kan exekvera upp till 32 trådar samtidigt (16 E-kärnor + 8 P-kärnor med hypertrådning).
Prestandan hos den nyaCore i9-13950HXi MSI Titan GT77 är utmärkt tack vare generösa effektgränser. Prestandan fluktuerar lite, men vi kan observera en förbrukning på mer än 200 W i början av benchmarks innan chipet lägger sig på cirka 150 W. Prestandasprånget jämfört med den gamlaTitan GT77medCore i9-12900HXär 22 % i alla CPU-benchmarks och Core i9-13950HX i den nyaRazer Blade 16är också slagen med 14 %.
Som väntat ser vi de största förbättringarna i flerkärniga tester, där man bara märker det högre antalet kärnor. Till exempel: Den nya GT77 är 45 % snabbare än den gamla GT77 med Core i9-12900HX i Cinebench R23 Multi. Fördelen jämfört med andra Raptor Lake HX-processorer visar också att detta är en mycket snabb implementering. Den nya modellen är också snabbare i enkärniga tester, men fördelen är mycket lägre, 6-10 %.
CPU-prestandan är låst vid 25 W på batteri, även i det snabbaste prestandaläget, vilket resulterar i ett prestandaförlust på mer än 70 % i flerkärniga scenarier. Ytterligare CPU-jämförelser finns i vår tekniska sektion.
Cinebench R15 Multi Dauertest
Cinebench R23: Multi Core | Single Core
Cinebench R20: CPU (Multi Core) | CPU (Single Core)
Cinebench R15: CPU Multi 64Bit | CPU Single 64Bit
Blender: v2.79 BMW27 CPU
7-Zip 18.03: 7z b 4 | 7z b 4 -mmt1
Geekbench 5.5: Multi-Core | Single-Core
HWBOT x265 Benchmark v2.2: 4k Preset
LibreOffice : 20 Documents To PDF
R Benchmark 2.5: Overall mean
| CPU Performance rating | |
| MSI Titan GT77 HX 13VI | |
| Schenker XMG Neo 16 Raptor Lake | |
| Genomsnitt Intel Core i9-13950HX | |
| Razer Blade 16 Early 2023 | |
| Genomsnitt av klass Gaming | |
| MSI Titan GT77 12UHS | |
| Asus ROG Strix Scar 17 SE G733CX-LL014W | |
| Alienware x17 R2 P48E | |
| Schenker XMG Neo 17 M22 | |
| Cinebench R23 / Multi Core | |
| MSI Titan GT77 HX 13VI | |
| Genomsnitt Intel Core i9-13950HX (24560 - 33277, n=7) | |
| Schenker XMG Neo 16 Raptor Lake | |
| Schenker XMG Neo 16 Raptor Lake | |
| Schenker XMG Neo 16 Raptor Lake | |
| Razer Blade 16 Early 2023 | |
| Genomsnitt av klass Gaming (10488 - 42661, n=107, senaste 2 åren) | |
| MSI Titan GT77 12UHS | |
| Asus ROG Strix Scar 17 SE G733CX-LL014W | |
| Alienware x17 R2 P48E | |
| Schenker XMG Neo 17 M22 | |
| Cinebench R23 / Single Core | |
| MSI Titan GT77 HX 13VI | |
| Genomsnitt Intel Core i9-13950HX (1952 - 2113, n=7) | |
| Schenker XMG Neo 16 Raptor Lake | |
| Razer Blade 16 Early 2023 | |
| Genomsnitt av klass Gaming (1166 - 2415, n=107, senaste 2 åren) | |
| MSI Titan GT77 12UHS | |
| Alienware x17 R2 P48E | |
| Asus ROG Strix Scar 17 SE G733CX-LL014W | |
| Schenker XMG Neo 17 M22 | |
| Cinebench R20 / CPU (Multi Core) | |
| MSI Titan GT77 HX 13VI | |
| Schenker XMG Neo 16 Raptor Lake | |
| Genomsnitt Intel Core i9-13950HX (8697 - 12648, n=7) | |
| Genomsnitt av klass Gaming (4029 - 16433, n=106, senaste 2 åren) | |
| Razer Blade 16 Early 2023 | |
| MSI Titan GT77 12UHS | |
| Asus ROG Strix Scar 17 SE G733CX-LL014W | |
| Alienware x17 R2 P48E | |
| Schenker XMG Neo 17 M22 | |
| Cinebench R20 / CPU (Single Core) | |
| MSI Titan GT77 HX 13VI | |
| Genomsnitt Intel Core i9-13950HX (742 - 816, n=7) | |
| Genomsnitt av klass Gaming (442 - 913, n=106, senaste 2 åren) | |
| Schenker XMG Neo 16 Raptor Lake | |
| Razer Blade 16 Early 2023 | |
| Asus ROG Strix Scar 17 SE G733CX-LL014W | |
| MSI Titan GT77 12UHS | |
| Alienware x17 R2 P48E | |
| Schenker XMG Neo 17 M22 | |
| Cinebench R15 / CPU Multi 64Bit | |
| MSI Titan GT77 HX 13VI | |
| Schenker XMG Neo 16 Raptor Lake | |
| Schenker XMG Neo 16 Raptor Lake | |
| Genomsnitt Intel Core i9-13950HX (3625 - 5227, n=7) | |
| Razer Blade 16 Early 2023 | |
| Genomsnitt av klass Gaming (1578 - 6330, n=105, senaste 2 åren) | |
| MSI Titan GT77 12UHS | |
| Asus ROG Strix Scar 17 SE G733CX-LL014W | |
| Alienware x17 R2 P48E | |
| Schenker XMG Neo 17 M22 | |
| Cinebench R15 / CPU Single 64Bit | |
| MSI Titan GT77 HX 13VI | |
| Genomsnitt av klass Gaming (188.8 - 350, n=106, senaste 2 åren) | |
| Schenker XMG Neo 16 Raptor Lake | |
| Schenker XMG Neo 16 Raptor Lake | |
| Genomsnitt Intel Core i9-13950HX (274 - 303, n=7) | |
| MSI Titan GT77 12UHS | |
| Asus ROG Strix Scar 17 SE G733CX-LL014W | |
| Razer Blade 16 Early 2023 | |
| Alienware x17 R2 P48E | |
| Schenker XMG Neo 17 M22 | |
| Blender / v2.79 BMW27 CPU | |
| Schenker XMG Neo 17 M22 | |
| Asus ROG Strix Scar 17 SE G733CX-LL014W | |
| Alienware x17 R2 P48E | |
| Genomsnitt av klass Gaming (79 - 330, n=104, senaste 2 åren) | |
| MSI Titan GT77 12UHS | |
| Razer Blade 16 Early 2023 | |
| Genomsnitt Intel Core i9-13950HX (100 - 137, n=7) | |
| Schenker XMG Neo 16 Raptor Lake | |
| MSI Titan GT77 HX 13VI | |
| 7-Zip 18.03 / 7z b 4 | |
| MSI Titan GT77 HX 13VI | |
| Schenker XMG Neo 16 Raptor Lake | |
| Genomsnitt Intel Core i9-13950HX (99351 - 127295, n=7) | |
| Razer Blade 16 Early 2023 | |
| Genomsnitt av klass Gaming (33491 - 148086, n=105, senaste 2 åren) | |
| MSI Titan GT77 12UHS | |
| Asus ROG Strix Scar 17 SE G733CX-LL014W | |
| Alienware x17 R2 P48E | |
| Schenker XMG Neo 17 M22 | |
| 7-Zip 18.03 / 7z b 4 -mmt1 | |
| MSI Titan GT77 HX 13VI | |
| Schenker XMG Neo 16 Raptor Lake | |
| Genomsnitt Intel Core i9-13950HX (6445 - 7064, n=7) | |
| Razer Blade 16 Early 2023 | |
| Genomsnitt av klass Gaming (4199 - 7436, n=105, senaste 2 åren) | |
| MSI Titan GT77 12UHS | |
| Asus ROG Strix Scar 17 SE G733CX-LL014W | |
| Schenker XMG Neo 17 M22 | |
| Alienware x17 R2 P48E | |
| Geekbench 5.5 / Multi-Core | |
| Schenker XMG Neo 16 Raptor Lake | |
| MSI Titan GT77 HX 13VI | |
| Genomsnitt Intel Core i9-13950HX (16776 - 21853, n=7) | |
| Razer Blade 16 Early 2023 | |
| Genomsnitt av klass Gaming (6460 - 28263, n=105, senaste 2 åren) | |
| MSI Titan GT77 12UHS | |
| Asus ROG Strix Scar 17 SE G733CX-LL014W | |
| Alienware x17 R2 P48E | |
| Schenker XMG Neo 17 M22 | |
| Geekbench 5.5 / Single-Core | |
| Genomsnitt av klass Gaming (986 - 2474, n=105, senaste 2 åren) | |
| MSI Titan GT77 HX 13VI | |
| Schenker XMG Neo 16 Raptor Lake | |
| Genomsnitt Intel Core i9-13950HX (1805 - 2097, n=7) | |
| MSI Titan GT77 12UHS | |
| Alienware x17 R2 P48E | |
| Asus ROG Strix Scar 17 SE G733CX-LL014W | |
| Razer Blade 16 Early 2023 | |
| Schenker XMG Neo 17 M22 | |
| HWBOT x265 Benchmark v2.2 / 4k Preset | |
| MSI Titan GT77 HX 13VI | |
| Schenker XMG Neo 16 Raptor Lake | |
| Genomsnitt Intel Core i9-13950HX (26 - 34.5, n=7) | |
| Genomsnitt av klass Gaming (11.5 - 44.4, n=105, senaste 2 åren) | |
| Razer Blade 16 Early 2023 | |
| MSI Titan GT77 12UHS | |
| Asus ROG Strix Scar 17 SE G733CX-LL014W | |
| Alienware x17 R2 P48E | |
| Schenker XMG Neo 17 M22 | |
| LibreOffice / 20 Documents To PDF | |
| Schenker XMG Neo 17 M22 | |
| Genomsnitt av klass Gaming (33.2 - 88.8, n=105, senaste 2 åren) | |
| Razer Blade 16 Early 2023 | |
| MSI Titan GT77 HX 13VI | |
| Schenker XMG Neo 16 Raptor Lake | |
| Genomsnitt Intel Core i9-13950HX (32.8 - 52.1, n=7) | |
| Alienware x17 R2 P48E | |
| MSI Titan GT77 12UHS | |
| Asus ROG Strix Scar 17 SE G733CX-LL014W | |
| R Benchmark 2.5 / Overall mean | |
| Schenker XMG Neo 17 M22 | |
| Alienware x17 R2 P48E | |
| Genomsnitt av klass Gaming (0.3439 - 0.759, n=106, senaste 2 åren) | |
| Asus ROG Strix Scar 17 SE G733CX-LL014W | |
| MSI Titan GT77 12UHS | |
| Razer Blade 16 Early 2023 | |
| MSI Titan GT77 HX 13VI | |
| Genomsnitt Intel Core i9-13950HX (0.3823 - 0.4121, n=7) | |
| Schenker XMG Neo 16 Raptor Lake | |
* ... mindre är bättre
AIDA64: FP32 Ray-Trace | FPU Julia | CPU SHA3 | CPU Queen | FPU SinJulia | FPU Mandel | CPU AES | CPU ZLib | FP64 Ray-Trace | CPU PhotoWorxx
| Performance rating | |
| MSI Titan GT77 HX 13VI | |
| Schenker XMG Neo 16 Raptor Lake | |
| Genomsnitt av klass Gaming | |
| Genomsnitt Intel Core i9-13950HX | |
| Razer Blade 16 Early 2023 | |
| MSI Titan GT77 12UHS | |
| Asus ROG Strix Scar 17 SE G733CX-LL014W | |
| Schenker XMG Neo 17 M22 | |
| Alienware x17 R2 P48E | |
| AIDA64 / FP32 Ray-Trace | |
| Genomsnitt av klass Gaming (10227 - 85542, n=105, senaste 2 åren) | |
| MSI Titan GT77 HX 13VI | |
| Schenker XMG Neo 16 Raptor Lake | |
| Razer Blade 16 Early 2023 | |
| Razer Blade 16 Early 2023 | |
| Razer Blade 16 Early 2023 | |
| Genomsnitt Intel Core i9-13950HX (17993 - 28957, n=9) | |
| MSI Titan GT77 12UHS | |
| Asus ROG Strix Scar 17 SE G733CX-LL014W | |
| Schenker XMG Neo 17 M22 | |
| Alienware x17 R2 P48E | |
| AIDA64 / FPU Julia | |
| MSI Titan GT77 HX 13VI | |
| Genomsnitt av klass Gaming (51376 - 238426, n=105, senaste 2 åren) | |
| Schenker XMG Neo 16 Raptor Lake | |
| Razer Blade 16 Early 2023 | |
| Razer Blade 16 Early 2023 | |
| Razer Blade 16 Early 2023 | |
| Genomsnitt Intel Core i9-13950HX (89362 - 144303, n=9) | |
| MSI Titan GT77 12UHS | |
| Schenker XMG Neo 17 M22 | |
| Asus ROG Strix Scar 17 SE G733CX-LL014W | |
| Alienware x17 R2 P48E | |
| AIDA64 / CPU SHA3 | |
| MSI Titan GT77 HX 13VI | |
| Schenker XMG Neo 16 Raptor Lake | |
| Genomsnitt av klass Gaming (2180 - 10115, n=105, senaste 2 åren) | |
| Razer Blade 16 Early 2023 | |
| Razer Blade 16 Early 2023 | |
| Razer Blade 16 Early 2023 | |
| Genomsnitt Intel Core i9-13950HX (4518 - 7093, n=9) | |
| MSI Titan GT77 12UHS | |
| Asus ROG Strix Scar 17 SE G733CX-LL014W | |
| Alienware x17 R2 P48E | |
| Schenker XMG Neo 17 M22 | |
| AIDA64 / CPU Queen | |
| MSI Titan GT77 HX 13VI | |
| Schenker XMG Neo 16 Raptor Lake | |
| Genomsnitt Intel Core i9-13950HX (131931 - 140103, n=8) | |
| Razer Blade 16 Early 2023 | |
| Razer Blade 16 Early 2023 | |
| Genomsnitt av klass Gaming (49785 - 173351, n=90, senaste 2 åren) | |
| Alienware x17 R2 P48E | |
| Asus ROG Strix Scar 17 SE G733CX-LL014W | |
| MSI Titan GT77 12UHS | |
| Schenker XMG Neo 17 M22 | |
| AIDA64 / FPU SinJulia | |
| MSI Titan GT77 HX 13VI | |
| Schenker XMG Neo 16 Raptor Lake | |
| Razer Blade 16 Early 2023 | |
| Razer Blade 16 Early 2023 | |
| Razer Blade 16 Early 2023 | |
| Genomsnitt Intel Core i9-13950HX (12318 - 17057, n=9) | |
| Genomsnitt av klass Gaming (4424 - 33636, n=105, senaste 2 åren) | |
| MSI Titan GT77 12UHS | |
| Schenker XMG Neo 17 M22 | |
| Asus ROG Strix Scar 17 SE G733CX-LL014W | |
| Alienware x17 R2 P48E | |
| AIDA64 / FPU Mandel | |
| Genomsnitt av klass Gaming (25115 - 128721, n=105, senaste 2 åren) | |
| MSI Titan GT77 HX 13VI | |
| Schenker XMG Neo 16 Raptor Lake | |
| Razer Blade 16 Early 2023 | |
| Razer Blade 16 Early 2023 | |
| Razer Blade 16 Early 2023 | |
| Genomsnitt Intel Core i9-13950HX (44372 - 71038, n=9) | |
| Schenker XMG Neo 17 M22 | |
| MSI Titan GT77 12UHS | |
| Asus ROG Strix Scar 17 SE G733CX-LL014W | |
| Alienware x17 R2 P48E | |
| AIDA64 / CPU AES | |
| MSI Titan GT77 12UHS | |
| Asus ROG Strix Scar 17 SE G733CX-LL014W | |
| Razer Blade 16 Early 2023 | |
| Razer Blade 16 Early 2023 | |
| Razer Blade 16 Early 2023 | |
| Genomsnitt Intel Core i9-13950HX (99981 - 204491, n=9) | |
| MSI Titan GT77 HX 13VI | |
| Schenker XMG Neo 17 M22 | |
| Schenker XMG Neo 16 Raptor Lake | |
| Genomsnitt av klass Gaming (39258 - 247074, n=105, senaste 2 åren) | |
| Alienware x17 R2 P48E | |
| AIDA64 / CPU ZLib | |
| MSI Titan GT77 HX 13VI | |
| Schenker XMG Neo 16 Raptor Lake | |
| Razer Blade 16 Early 2023 | |
| Razer Blade 16 Early 2023 | |
| Razer Blade 16 Early 2023 | |
| Genomsnitt Intel Core i9-13950HX (1263 - 2069, n=9) | |
| Genomsnitt av klass Gaming (574 - 2531, n=105, senaste 2 åren) | |
| MSI Titan GT77 12UHS | |
| Asus ROG Strix Scar 17 SE G733CX-LL014W | |
| Alienware x17 R2 P48E | |
| Schenker XMG Neo 17 M22 | |
| AIDA64 / FP64 Ray-Trace | |
| Genomsnitt av klass Gaming (5509 - 45446, n=105, senaste 2 åren) | |
| MSI Titan GT77 HX 13VI | |
| Schenker XMG Neo 16 Raptor Lake | |
| Razer Blade 16 Early 2023 | |
| Razer Blade 16 Early 2023 | |
| Razer Blade 16 Early 2023 | |
| Genomsnitt Intel Core i9-13950HX (9649 - 15573, n=9) | |
| MSI Titan GT77 12UHS | |
| Asus ROG Strix Scar 17 SE G733CX-LL014W | |
| Schenker XMG Neo 17 M22 | |
| Alienware x17 R2 P48E | |
| AIDA64 / CPU PhotoWorxx | |
| Razer Blade 16 Early 2023 | |
| Razer Blade 16 Early 2023 | |
| Razer Blade 16 Early 2023 | |
| Genomsnitt Intel Core i9-13950HX (40233 - 50864, n=9) | |
| Genomsnitt av klass Gaming (12271 - 89891, n=105, senaste 2 åren) | |
| Schenker XMG Neo 16 Raptor Lake | |
| Asus ROG Strix Scar 17 SE G733CX-LL014W | |
| MSI Titan GT77 12UHS | |
| MSI Titan GT77 HX 13VI | |
| Alienware x17 R2 P48E | |
| Schenker XMG Neo 17 M22 | |
Systemets prestanda
Den subjektiva prestandan hos GT77 är utmärkt och de syntetiska benchmarkresultaten är också mycket bra, men det är knappast förvånande med tanke på den kraftfulla hårdvaran. Rivalerna är också mycket snabba och du kommer att märka en stor skillnad mellan systemen.
CrossMark: Overall | Productivity | Creativity | Responsiveness
| PCMark 10 / Score | |
| MSI Titan GT77 HX 13VI | |
| Genomsnitt av klass Gaming (5828 - 12414, n=93, senaste 2 åren) | |
| Genomsnitt Intel Core i9-13950HX, NVIDIA GeForce RTX 4090 Laptop GPU (7597 - 8884, n=2) | |
| MSI Titan GT77 12UHS | |
| Alienware x17 R2 P48E | |
| Razer Blade 16 Early 2023 | |
| Asus ROG Strix Scar 17 SE G733CX-LL014W | |
| Schenker XMG Neo 17 M22 | |
| PCMark 10 / Essentials | |
| MSI Titan GT77 HX 13VI | |
| Genomsnitt Intel Core i9-13950HX, NVIDIA GeForce RTX 4090 Laptop GPU (10903 - 11761, n=2) | |
| Alienware x17 R2 P48E | |
| MSI Titan GT77 12UHS | |
| Razer Blade 16 Early 2023 | |
| Genomsnitt av klass Gaming (8810 - 11935, n=97, senaste 2 åren) | |
| Asus ROG Strix Scar 17 SE G733CX-LL014W | |
| Schenker XMG Neo 17 M22 | |
| PCMark 10 / Productivity | |
| Genomsnitt av klass Gaming (6845 - 25323, n=95, senaste 2 åren) | |
| MSI Titan GT77 12UHS | |
| Alienware x17 R2 P48E | |
| Asus ROG Strix Scar 17 SE G733CX-LL014W | |
| MSI Titan GT77 HX 13VI | |
| Schenker XMG Neo 17 M22 | |
| Genomsnitt Intel Core i9-13950HX, NVIDIA GeForce RTX 4090 Laptop GPU (8330 - 9851, n=2) | |
| Razer Blade 16 Early 2023 | |
| PCMark 10 / Digital Content Creation | |
| MSI Titan GT77 HX 13VI | |
| Genomsnitt Intel Core i9-13950HX, NVIDIA GeForce RTX 4090 Laptop GPU (13099 - 16424, n=2) | |
| Razer Blade 16 Early 2023 | |
| Genomsnitt av klass Gaming (7602 - 19954, n=95, senaste 2 åren) | |
| MSI Titan GT77 12UHS | |
| Alienware x17 R2 P48E | |
| Asus ROG Strix Scar 17 SE G733CX-LL014W | |
| Schenker XMG Neo 17 M22 | |
| CrossMark / Overall | |
| MSI Titan GT77 HX 13VI | |
| Asus ROG Strix Scar 17 SE G733CX-LL014W | |
| MSI Titan GT77 12UHS | |
| Genomsnitt Intel Core i9-13950HX, NVIDIA GeForce RTX 4090 Laptop GPU (2019 - 2139, n=2) | |
| Schenker XMG Neo 16 Raptor Lake | |
| Genomsnitt av klass Gaming (1366 - 2409, n=94, senaste 2 åren) | |
| Alienware x17 R2 P48E | |
| Schenker XMG Neo 17 M22 | |
| Razer Blade 16 Early 2023 | |
| CrossMark / Productivity | |
| MSI Titan GT77 12UHS | |
| MSI Titan GT77 HX 13VI | |
| Asus ROG Strix Scar 17 SE G733CX-LL014W | |
| Genomsnitt Intel Core i9-13950HX, NVIDIA GeForce RTX 4090 Laptop GPU (1909 - 1977, n=2) | |
| Genomsnitt av klass Gaming (1386 - 2254, n=94, senaste 2 åren) | |
| Schenker XMG Neo 16 Raptor Lake | |
| Alienware x17 R2 P48E | |
| Schenker XMG Neo 17 M22 | |
| Razer Blade 16 Early 2023 | |
| CrossMark / Creativity | |
| MSI Titan GT77 HX 13VI | |
| Schenker XMG Neo 16 Raptor Lake | |
| Asus ROG Strix Scar 17 SE G733CX-LL014W | |
| Genomsnitt Intel Core i9-13950HX, NVIDIA GeForce RTX 4090 Laptop GPU (2222 - 2423, n=2) | |
| MSI Titan GT77 12UHS | |
| Genomsnitt av klass Gaming (1343 - 2786, n=94, senaste 2 åren) | |
| Alienware x17 R2 P48E | |
| Schenker XMG Neo 17 M22 | |
| Razer Blade 16 Early 2023 | |
| CrossMark / Responsiveness | |
| MSI Titan GT77 12UHS | |
| Asus ROG Strix Scar 17 SE G733CX-LL014W | |
| MSI Titan GT77 HX 13VI | |
| Genomsnitt Intel Core i9-13950HX, NVIDIA GeForce RTX 4090 Laptop GPU (1792 - 1861, n=2) | |
| Genomsnitt av klass Gaming (1226 - 2334, n=94, senaste 2 åren) | |
| Alienware x17 R2 P48E | |
| Schenker XMG Neo 16 Raptor Lake | |
| Schenker XMG Neo 17 M22 | |
| Razer Blade 16 Early 2023 | |
| PCMark 10 Score | 8884 poäng | |
Hjälp | ||
| AIDA64 / Memory Copy | |
| Razer Blade 16 Early 2023 | |
| Razer Blade 16 Early 2023 | |
| Razer Blade 16 Early 2023 | |
| Genomsnitt Intel Core i9-13950HX (61938 - 78813, n=9) | |
| Genomsnitt av klass Gaming (21750 - 129946, n=105, senaste 2 åren) | |
| Schenker XMG Neo 16 Raptor Lake | |
| MSI Titan GT77 12UHS | |
| MSI Titan GT77 HX 13VI | |
| Asus ROG Strix Scar 17 SE G733CX-LL014W | |
| Alienware x17 R2 P48E | |
| Schenker XMG Neo 17 M22 | |
| AIDA64 / Memory Read | |
| Razer Blade 16 Early 2023 | |
| Razer Blade 16 Early 2023 | |
| Razer Blade 16 Early 2023 | |
| Genomsnitt Intel Core i9-13950HX (62368 - 86831, n=9) | |
| Schenker XMG Neo 16 Raptor Lake | |
| Genomsnitt av klass Gaming (22956 - 118858, n=105, senaste 2 åren) | |
| Asus ROG Strix Scar 17 SE G733CX-LL014W | |
| MSI Titan GT77 HX 13VI | |
| MSI Titan GT77 12UHS | |
| Alienware x17 R2 P48E | |
| Schenker XMG Neo 17 M22 | |
| AIDA64 / Memory Write | |
| Razer Blade 16 Early 2023 | |
| Razer Blade 16 Early 2023 | |
| Razer Blade 16 Early 2023 | |
| Genomsnitt av klass Gaming (22297 - 135096, n=105, senaste 2 åren) | |
| Genomsnitt Intel Core i9-13950HX (59501 - 80441, n=9) | |
| Schenker XMG Neo 16 Raptor Lake | |
| Asus ROG Strix Scar 17 SE G733CX-LL014W | |
| MSI Titan GT77 HX 13VI | |
| MSI Titan GT77 12UHS | |
| Schenker XMG Neo 17 M22 | |
| Alienware x17 R2 P48E | |
| AIDA64 / Memory Latency | |
| Genomsnitt av klass Gaming (75.3 - 259, n=105, senaste 2 åren) | |
| Razer Blade 16 Early 2023 | |
| Razer Blade 16 Early 2023 | |
| Razer Blade 16 Early 2023 | |
| Alienware x17 R2 P48E | |
| MSI Titan GT77 HX 13VI | |
| Schenker XMG Neo 17 M22 | |
| Schenker XMG Neo 16 Raptor Lake | |
| Genomsnitt Intel Core i9-13950HX (84.4 - 99.5, n=9) | |
| MSI Titan GT77 12UHS | |
| Asus ROG Strix Scar 17 SE G733CX-LL014W | |
* ... mindre är bättre
DPC-latenstid
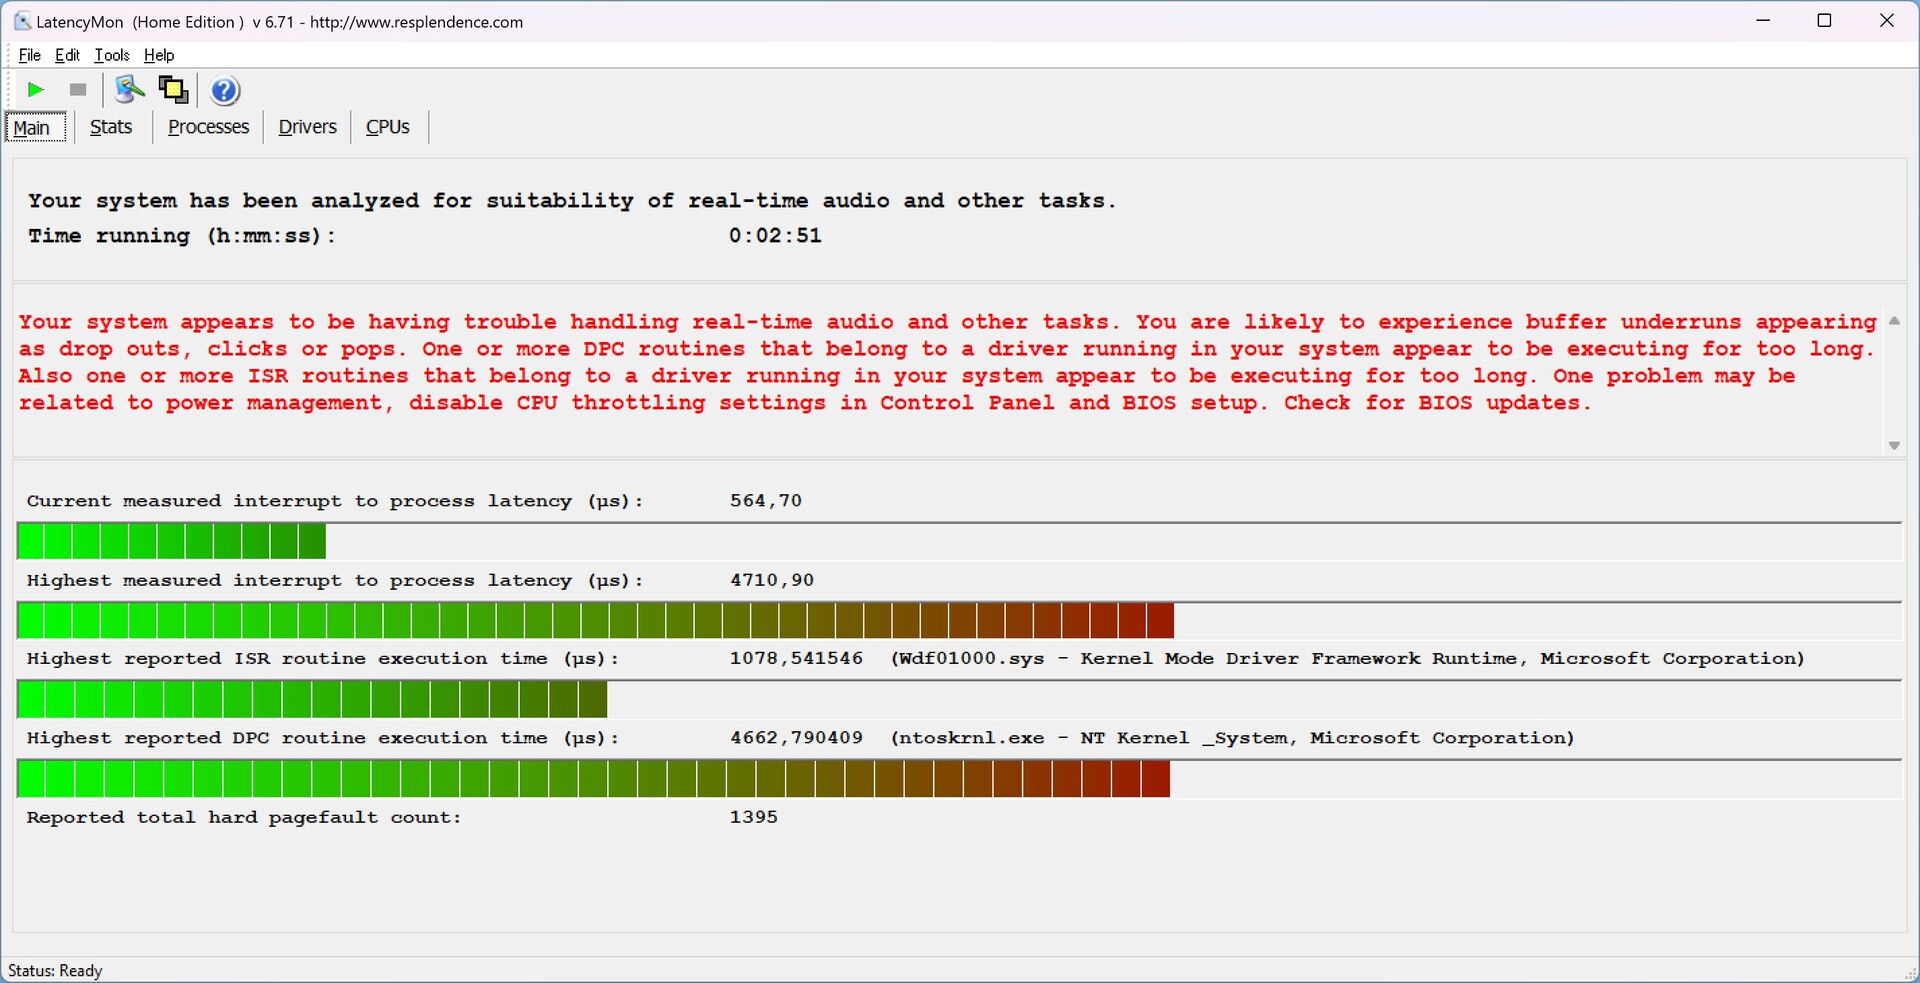
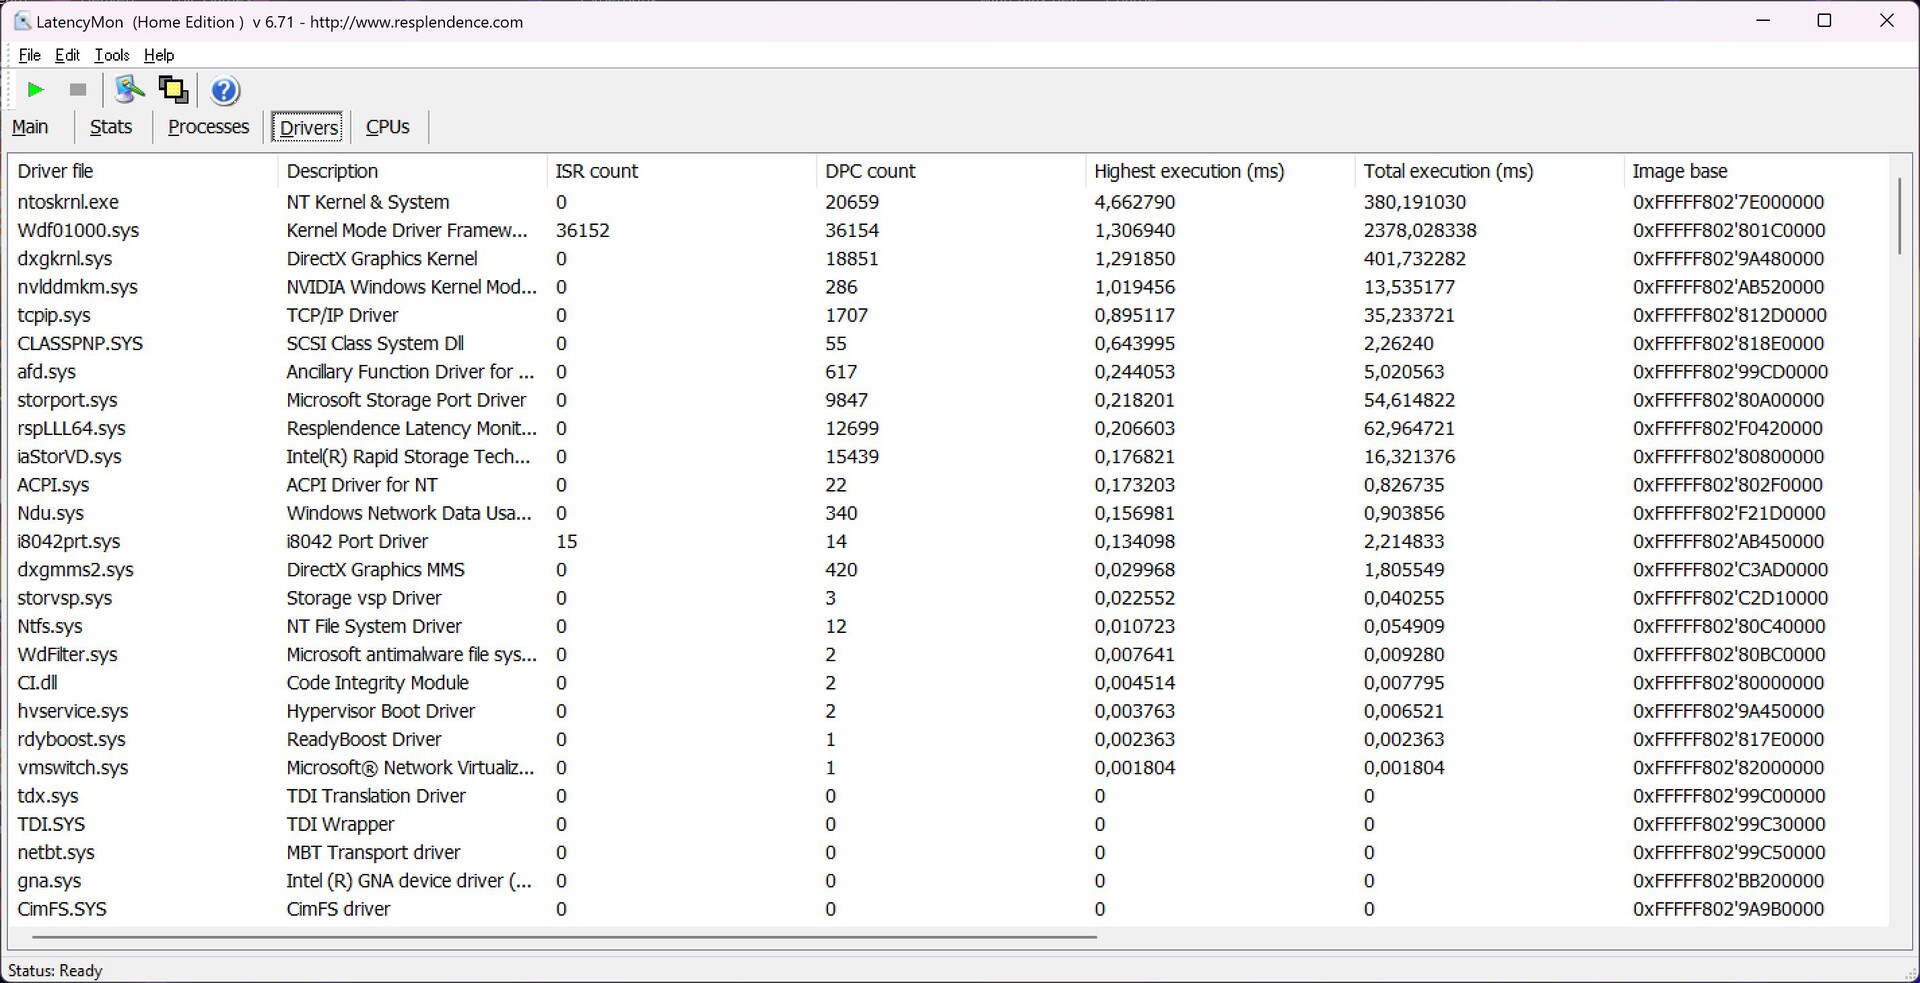
Vårt standardiserade latenstest (webbsökning, 4K YouTube-uppspelning, CPU-belastning) visar på stora begränsningar för ljudprogram i realtid med den aktuella BIOS-versionen (1.04).
| DPC Latencies / LatencyMon - interrupt to process latency (max), Web, Youtube, Prime95 | |
| MSI Titan GT77 HX 13VI | |
| Schenker XMG Neo 17 M22 | |
| Asus ROG Strix Scar 17 SE G733CX-LL014W | |
| Razer Blade 16 Early 2023 | |
| MSI Titan GT77 12UHS | |
| MSI Titan GT77 12UHS | |
| Alienware x17 R2 P48E | |
* ... mindre är bättre
Lagringsenheter
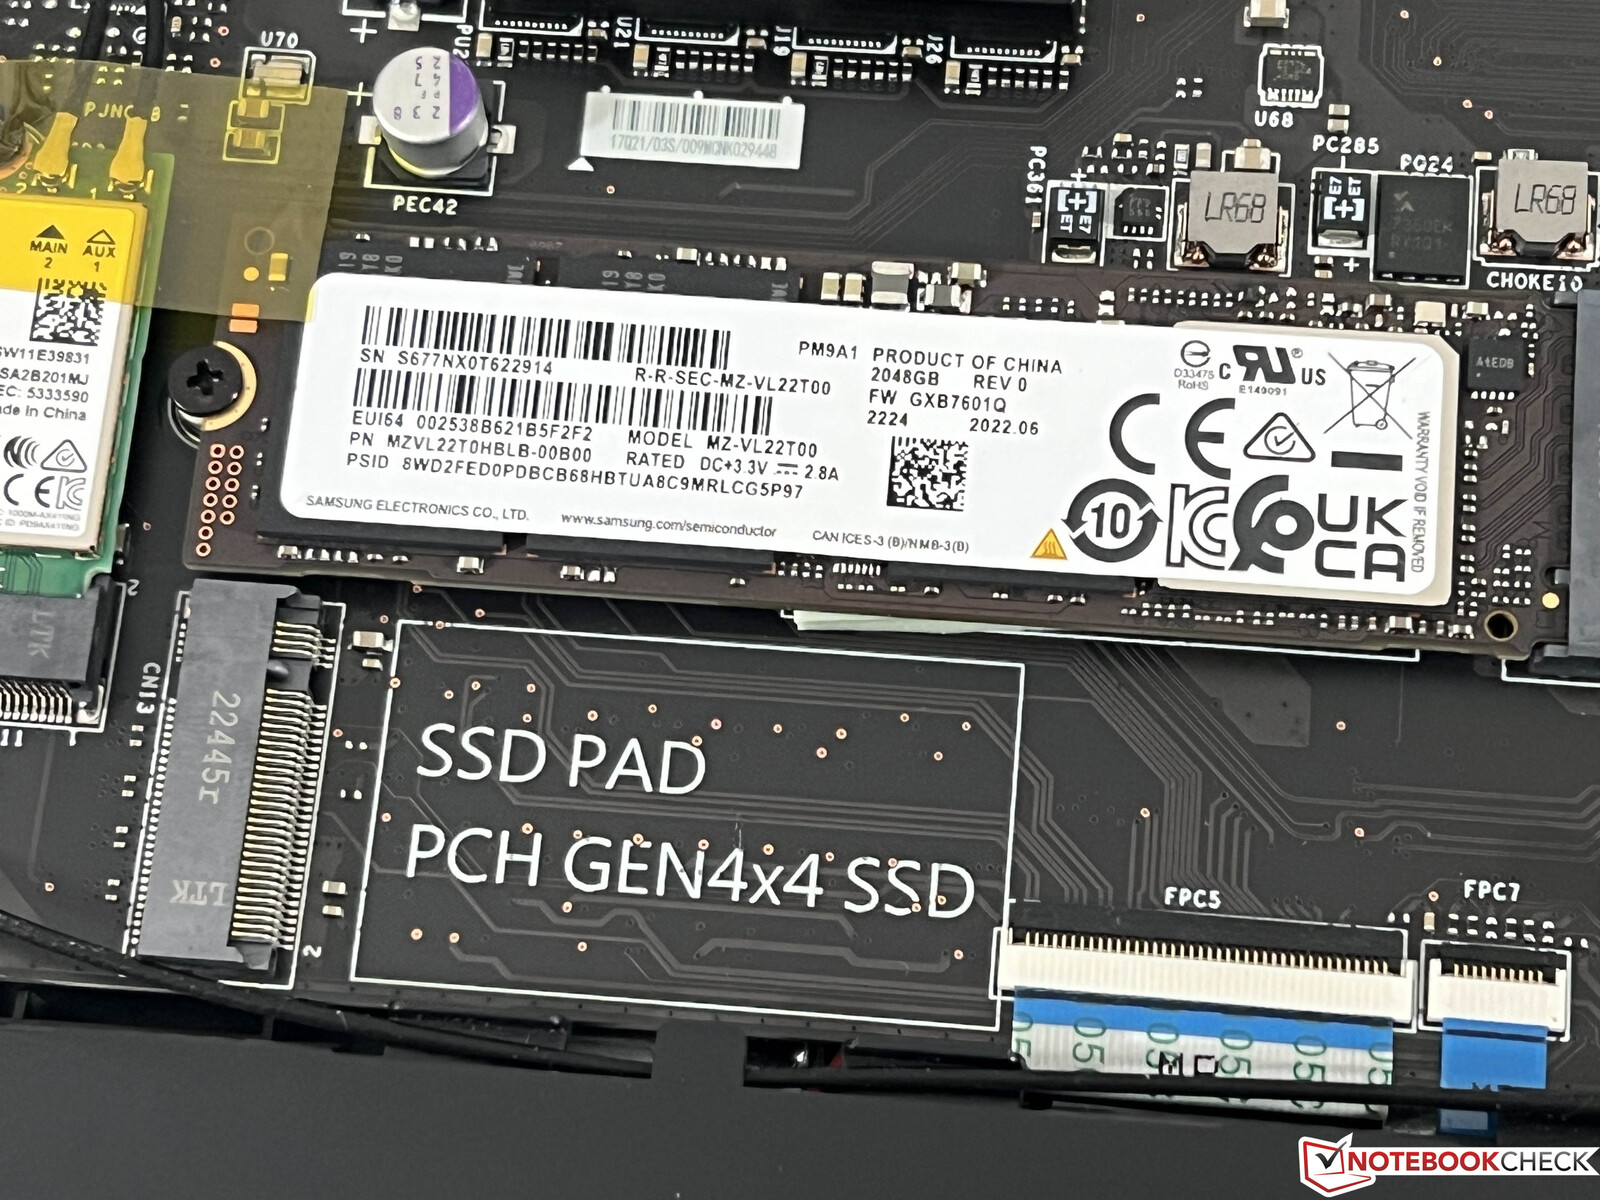
2023 Titan är en av de första bärbara datorerna med ett snabbt PCIe 5.0-gränssnitt, men det finns knappt några lämpliga SSD-enheter på marknaden ännu. De andra två platserna har stöd för PCIe 4.0 och vår recensionsenhet är utrustad med två 2 TB SSD-diskar från Samsung (PM9A1, OEM-versionen av 980 Pro) i en RAID 0-konfiguration. Förutom den rena kapaciteten på 4 TB (3,97 gratis för användaren) kan vi också registrera överföringshastigheter norr om 11 GB/s. Den här prestandan kan dock inte upprätthållas särskilt länge och sjunker avsevärt efter några minuter, så SSD-kylare hade kanske varit en bra idé. Fler SSD-jämförelser finns tillgängliga här.

* ... mindre är bättre
Disk Throttling: DiskSpd Read Loop, Queue Depth 8
GPU-prestanda - RTX 4090 bärbar dator
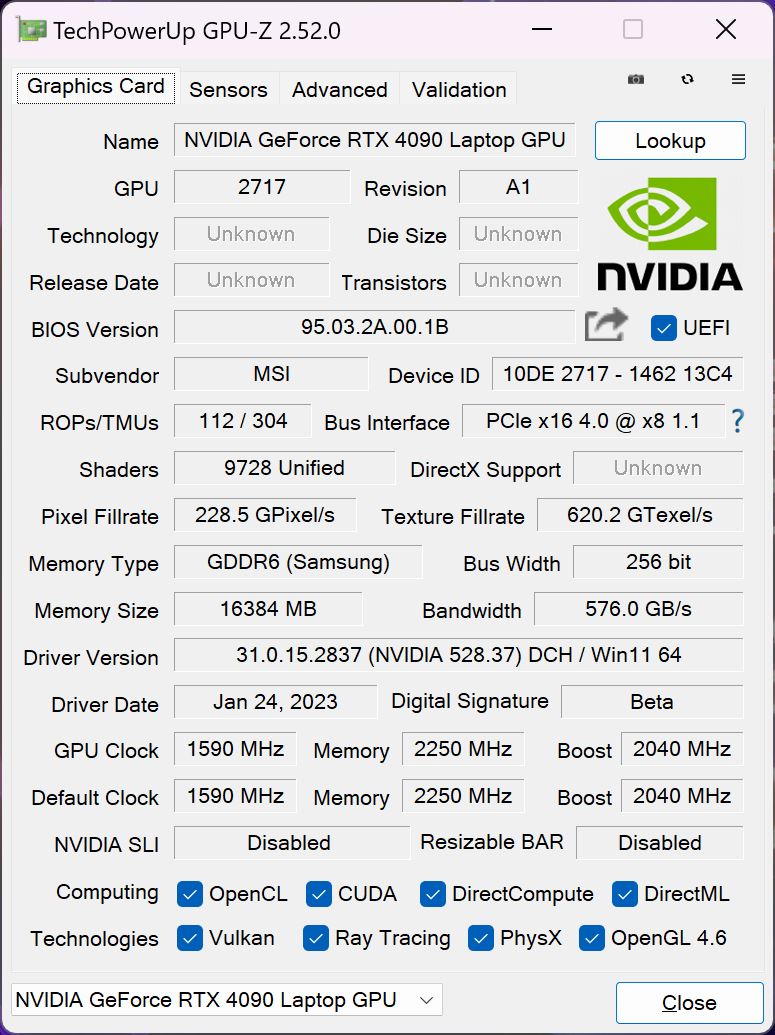
TheGeForce RTX 4090är Nvidias nya avancerade mobila GPU och GT77 använder den snabbaste versionen med en maximal förbrukning på 175 W (150 W TGP + 25 W Dynamic Boost från CPU), 16 GB VRAM och en maximal kärnklocka på 2340 MHz.
Grafikprestandan är utmärkt och den nya RTX 4090 sitter mellan de stationära modellerna.RTX 3090/RTX 3090 Tioch de stationära modellernaRTX 4070 TiochRTX 4080i syntetiska riktmärken. Fördelen jämfört med de gamla mobilaRTX 3080 Tii det tidigareGT77är 40-60 % (beroende på benchmark) trots samma TGP. Themobila RTX 4080iRazer Blade 16är ungefär 17-19 % långsammare beroende på riktmärke.
Den nya Titan kan bibehålla grafikprestandan och stresstestet 3dMark Time Spy klaras lätt med 99 %. Strömförbrukningen är dock begränsad till 27 W på batteriet, vilket resulterar i ett prestandaförlust på nästan 80 %.
Geekbench 5.5: OpenCL Score
GFXBench: 3840x2160 4K Aztec Ruins High Tier Offscreen | 2560x1440 Aztec Ruins High Tier Offscreen
| 3DMark / Wild Life Extreme Unlimited | |
| NVIDIA GeForce RTX 3090 Ti | |
| NVIDIA GeForce RTX 4090 Laptop GPU | |
| Genomsnitt NVIDIA GeForce RTX 4090 Laptop GPU (34246 - 44948, n=7) | |
| Genomsnitt av klass Gaming (22281 - 47946, n=17, senaste 2 åren) | |
| NVIDIA GeForce RTX 3080 Ti Laptop GPU | |
| NVIDIA GeForce RTX 3080 Ti Laptop GPU | |
| NVIDIA GeForce RTX 3080 Ti Laptop GPU | |
| Apple M2 Max 38-Core GPU | |
| NVIDIA GeForce RTX 3080 Ti Laptop GPU | |
| 3DMark / Speed Way Score | |
| NVIDIA GeForce RTX 4080 | |
| NVIDIA GeForce RTX 4090 Laptop GPU | |
| NVIDIA GeForce RTX 4090 Laptop GPU | |
| Genomsnitt NVIDIA GeForce RTX 4090 Laptop GPU (4401 - 5940, n=27) | |
| NVIDIA GeForce RTX 4070 Ti | |
| NVIDIA GeForce RTX 3080 Ti | |
| NVIDIA GeForce RTX 3090 | |
| Genomsnitt av klass Gaming (1577 - 6643, n=44, senaste 2 åren) | |
| NVIDIA GeForce RTX 4080 Laptop GPU | |
| NVIDIA GeForce RTX 3080 Ti Laptop GPU | |
| GFXBench / 4K Aztec Ruins High Tier Offscreen | |
| Genomsnitt NVIDIA GeForce RTX 4090 Laptop GPU (239 - 246, n=3) | |
| NVIDIA GeForce RTX 4090 Laptop GPU | |
| NVIDIA GeForce RTX 4080 Laptop GPU | |
| Apple M2 Max 38-Core GPU | |
| Genomsnitt av klass Gaming (100.4 - 243, n=6, senaste 2 åren) | |
| GFXBench / Aztec Ruins High Tier Offscreen | |
| Genomsnitt NVIDIA GeForce RTX 4090 Laptop GPU (518 - 550, n=3) | |
| NVIDIA GeForce RTX 4090 Laptop GPU | |
| NVIDIA GeForce RTX 4080 Laptop GPU | |
| Apple M2 Max 38-Core GPU | |
| Genomsnitt av klass Gaming (232 - 507, n=6, senaste 2 åren) | |
| 3DMark 06 Standard Score | 67927 poäng | |
| 3DMark Vantage P Result | 113387 poäng | |
| 3DMark 11 Performance | 49253 poäng | |
| 3DMark Fire Strike Score | 37594 poäng | |
| 3DMark Fire Strike Extreme Score | 25475 poäng | |
| 3DMark Time Spy Score | 20862 poäng | |
Hjälp | ||
Photoshop PugetBench: Filter Score | General Score | GPU Score | Overall Score
Premiere Pro PugetBench: GPU 0.9 | Live Playback 0.9 | Export 0.9 | Overall Score 0.9
| Blender / v3.3 Classroom OPTIX/RTX | |
| Alienware x15 R2 P111F | |
| Asus ROG Strix Scar 17 SE G733CX-LL014W | |
| MSI Titan GT77 12UHS | |
| Genomsnitt av klass Gaming (9 - 32, n=106, senaste 2 åren) | |
| Razer Blade 16 Early 2023 | |
| ASUS TUF Gaming GeForce RTX 3080 Ti OC | |
| Intel Core i5-13400F | |
| Genomsnitt NVIDIA GeForce RTX 4090 Laptop GPU (9 - 19, n=39) | |
| KFA2 GeForce RTX 4070 Ti SG | |
| MSI Titan GT77 HX 13VI | |
| Schenker XMG Neo 16 Raptor Lake | |
| KFA2 GeForce RTX 4080 SG | |
| Blender / v3.3 Classroom CUDA | |
| Alienware x15 R2 P111F | |
| Asus ROG Strix Scar 17 SE G733CX-LL014W | |
| Genomsnitt av klass Gaming (15 - 228, n=106, senaste 2 åren) | |
| MSI Titan GT77 12UHS | |
| Razer Blade 16 Early 2023 | |
| ASUS TUF Gaming GeForce RTX 3080 Ti OC | |
| Intel Core i5-13400F | |
| Genomsnitt NVIDIA GeForce RTX 4090 Laptop GPU (16 - 24, n=39) | |
| Schenker XMG Neo 16 Raptor Lake | |
| MSI Titan GT77 HX 13VI | |
| Blender / v3.3 Classroom CPU | |
| Alienware x15 R2 P111F | |
| Intel Core i5-13400F | |
| Apple MacBook Pro 16 2023 M2 Max | |
| Asus ROG Strix Scar 17 SE G733CX-LL014W | |
| MSI Titan GT77 12UHS | |
| Genomsnitt av klass Gaming (122 - 565, n=102, senaste 2 åren) | |
| Razer Blade 16 Early 2023 | |
| Schenker XMG Neo 16 Raptor Lake | |
| Genomsnitt NVIDIA GeForce RTX 4090 Laptop GPU (144 - 305, n=39) | |
| MSI Titan GT77 HX 13VI | |
| ASUS TUF Gaming GeForce RTX 3080 Ti OC | |
| Blender / v3.3 Classroom METAL | |
| Apple MacBook Pro 16 2023 M2 Max | |
| Photoshop PugetBench / Filter Score | |
| KFA2 GeForce RTX 4080 SG | |
| ASUS TUF Gaming GeForce RTX 3080 Ti OC | |
| KFA2 GeForce RTX 4070 Ti SG | |
| Intel Core i5-13400F | |
| Apple MacBook Pro 16 2023 M2 Max | |
| MSI Titan GT77 HX 13VI | |
| Genomsnitt NVIDIA GeForce RTX 4090 Laptop GPU (91.9 - 104.6, n=5) | |
| Photoshop PugetBench / General Score | |
| MSI Titan GT77 HX 13VI | |
| Genomsnitt NVIDIA GeForce RTX 4090 Laptop GPU (151.8 - 168.2, n=5) | |
| Apple MacBook Pro 16 2023 M2 Max | |
| KFA2 GeForce RTX 4080 SG | |
| ASUS TUF Gaming GeForce RTX 3080 Ti OC | |
| KFA2 GeForce RTX 4070 Ti SG | |
| Intel Core i5-13400F | |
| Photoshop PugetBench / GPU Score | |
| KFA2 GeForce RTX 4080 SG | |
| ASUS TUF Gaming GeForce RTX 3080 Ti OC | |
| KFA2 GeForce RTX 4070 Ti SG | |
| Apple MacBook Pro 16 2023 M2 Max | |
| Genomsnitt NVIDIA GeForce RTX 4090 Laptop GPU (109.1 - 119.4, n=5) | |
| MSI Titan GT77 HX 13VI | |
| Intel Core i5-13400F | |
| Photoshop PugetBench / Overall Score | |
| KFA2 GeForce RTX 4080 SG | |
| ASUS TUF Gaming GeForce RTX 3080 Ti OC | |
| KFA2 GeForce RTX 4070 Ti SG | |
| MSI Titan GT77 HX 13VI | |
| Genomsnitt NVIDIA GeForce RTX 4090 Laptop GPU (1225 - 1356, n=5) | |
| Apple MacBook Pro 16 2023 M2 Max | |
| Intel Core i5-13400F | |
| Premiere Pro PugetBench / GPU 0.9 | |
| MSI Titan GT77 HX 13VI | |
| Genomsnitt NVIDIA GeForce RTX 4090 Laptop GPU (75.8 - 109.2, n=3) | |
| KFA2 GeForce RTX 4080 SG | |
| Intel Core i5-13400F | |
| ASUS TUF Gaming GeForce RTX 3080 Ti OC | |
| KFA2 GeForce RTX 4070 Ti SG | |
| Apple MacBook Pro 16 2023 M2 Max | |
| Premiere Pro PugetBench / Live Playback 0.9 | |
| MSI Titan GT77 HX 13VI | |
| Genomsnitt NVIDIA GeForce RTX 4090 Laptop GPU (91.7 - 118, n=3) | |
| KFA2 GeForce RTX 4080 SG | |
| KFA2 GeForce RTX 4070 Ti SG | |
| ASUS TUF Gaming GeForce RTX 3080 Ti OC | |
| Intel Core i5-13400F | |
| Apple MacBook Pro 16 2023 M2 Max | |
| Premiere Pro PugetBench / Export 0.9 | |
| MSI Titan GT77 HX 13VI | |
| KFA2 GeForce RTX 4070 Ti SG | |
| KFA2 GeForce RTX 4080 SG | |
| ASUS TUF Gaming GeForce RTX 3080 Ti OC | |
| Genomsnitt NVIDIA GeForce RTX 4090 Laptop GPU (78.4 - 113.4, n=3) | |
| Apple MacBook Pro 16 2023 M2 Max | |
| Intel Core i5-13400F | |
| Premiere Pro PugetBench / Overall Score 0.9 | |
| Apple MacBook Pro 16 2023 M2 Max | |
| MSI Titan GT77 HX 13VI | |
| Genomsnitt NVIDIA GeForce RTX 4090 Laptop GPU (821 - 1105, n=3) | |
| KFA2 GeForce RTX 4070 Ti SG | |
| KFA2 GeForce RTX 4080 SG | |
| ASUS TUF Gaming GeForce RTX 3080 Ti OC | |
| Intel Core i5-13400F | |
Photoshop PugetBench: Filter Score | General Score | GPU Score | Overall Score
Premiere Pro PugetBench: GPU 0.9 | Live Playback 0.9 | Export 0.9 | Overall Score 0.9
* ... mindre är bättre
RTX 4090 har inga speciella drivrutiner som arbetsstationens GPU:er, men prestandan är fortfarande imponerande och den nya GeForce GPU:n kan till och med slå den professionellaRTX A5500i vissa av SPECviewperf-testerna (som Maya, SiemensNX). Konsument-GPU:n ligger dock ibland också i botten, så det beror på din arbetsbelastning, men professionella GPU:er är inte alltid nödvändiga.
Spelprestanda
Spelprestandan är helt fantastisk och kombinationen av Core i9-13950HX och RTX 4090 klarar alla testade spel smidigt, även i 4K med maximala inställningar. Enda undantaget är extrema fall som Cyberpunk 2077 med RT Ultra-förinställningen i 4K, där du kan hjälpa till med uppskalning (mer om det senare). Våra standardspel som vi testar med varje bärbar dator visar en genomsnittlig fördel på 26 % jämfört med den gamla.RTX 3080 Ti, men fördelen är större i nyare titlar och högre upplösningar.
| The Witcher 3 - 1920x1080 Ultra Graphics & Postprocessing (HBAO+) | |
| Schenker XMG Neo 16 Raptor Lake | |
| MSI Titan GT77 HX 13VI | |
| Genomsnitt av klass Gaming (104.7 - 240, n=7, senaste 2 åren) | |
| Razer Blade 16 Early 2023 | |
| MSI Titan GT77 12UHS | |
| Alienware x17 R2 P48E | |
| Schenker XMG Neo 17 M22 | |
| Asus ROG Strix Scar 17 SE G733CX-LL014W | |
Raytracing-prestandan är också mycket bra och det nya RTX 4090 är ungefär i nivå medstationära RTX 4070 Ti.
| The Witcher 3 v4 - 1920x1080 RT Ultra Preset / On AA:FX | |
| KFA2 GeForce RTX 4070 Ti SG | |
| MSI Titan GT77 HX 13VI | |
| Schenker XMG Neo 16 Raptor Lake | |
| Genomsnitt NVIDIA GeForce RTX 4090 Laptop GPU (53.1 - 68, n=5) | |
| The Callisto Protocol - 1920x1080 Ultra Preset (without FSR Upscaling) + Full Ray-Tracing | |
| KFA2 GeForce RTX 4080 SG | |
| KFA2 GeForce RTX 4070 Ti SG | |
| ASUS TUF Gaming GeForce RTX 3080 Ti OC | |
| MSI Titan GT77 HX 13VI | |
| Genomsnitt NVIDIA GeForce RTX 4090 Laptop GPU (32 - 79.6, n=5) | |
| Schenker XMG Neo 16 Raptor Lake | |
| Spider-Man Miles Morales - 1920x0180 Very High Preset + Ray-Tracing AA:T | |
| KFA2 GeForce RTX 4080 SG | |
| KFA2 GeForce RTX 4070 Ti SG | |
| Schenker XMG Neo 16 Raptor Lake | |
| ASUS TUF Gaming GeForce RTX 3080 Ti OC | |
| MSI Titan GT77 HX 13VI | |
| Genomsnitt NVIDIA GeForce RTX 4090 Laptop GPU (79.6 - 96.2, n=4) | |
| Watch Dogs Legion - 1920x1080 Ultra Preset + Ultra Ray Tracing (DX12) | |
| Schenker XMG Neo 16 Raptor Lake | |
| Zotac Gaming GeForce RTX 3090 Ti AMP Extreme Holo | |
| Genomsnitt NVIDIA GeForce RTX 4090 Laptop GPU (84 - 90, n=2) | |
| MSI Titan GT77 HX 13VI | |
| Razer Blade 16 Early 2023 | |
| MSI Titan GT77 12UHS | |
| Alienware x15 R2 P111F | |
| Spel | Inställning | DLSS off | DLSS on (Balanced) | Skillnad |
|---|---|---|---|---|
| Spider-Man Miles Morales | 4K Ultra | 83 FPS | 132 FPS | +59 % |
| Witcher 3 4.00 | 4K RT Ultra | 27 FPS | 50 FPS | +85 % |
| Cyberpunk 2077 1.5 | RT 4K | 22 FPS | 95 FPS | +331 % |
| God of War | 4K Ultra | 80 FPS | 111 FPS | +38 % |
Vi utför vanligtvis våra benchmarks för spel utan uppgraderingstekniker som Nvidia DLSS eller AMD FSR. Prestandan kan dock gynnas mycket när titeln stöder det och vi märkte några stora förbättringar med aktiverad DLSS 3.0 utan några visuella brister. Med tanke på dessa resultat kan de kommande mindre varianternaRTX 4060ochRTX 4070bör kunna hantera 4K-spel när DLSS är aktiv.
Spelprestandan är helt stabil, vilket även vår Witcher 3 -slinga visar. Prestandan minskar dock återigen massivt på batteriet.
Witcher 3 FPS-Diagramm
Vi kontrollerade också den nya GPU:ns effektivitet med vårt Witcher 3 -test. Processorns inflytande är inte särskilt stort och vi använder värdena kopplade till en extern skärm, så vi kan eliminera de olika typerna av skärmar och även jämföra resultaten med stationära GPU:er. Resultatet för den nya RTX 4090 är imponerande, eftersom GPU:n är cirka 40 % effektivare än RTX 3080 Ti Mobile (140 W) iAlienware x15ochstationära RTX 4080. Den nya GT77 är också 53 % effektivare än den tidigare modell med denRTX 3080 Tivid samma TGP.
| låg | med. | hög | ultra | QHD | 4K DLSS | 4K | |
|---|---|---|---|---|---|---|---|
| GTA V (2015) | 184.1 | 182.6 | 140.9 | 138.5 | 175.7 | ||
| The Witcher 3 (2015) | 619 | 546 | 422 | 198.9 | 160 | ||
| Dota 2 Reborn (2015) | 225 | 206 | 194.1 | 185.9 | 178.9 | ||
| Final Fantasy XV Benchmark (2018) | 230 | 221 | 187.4 | 162.9 | 94.7 | ||
| X-Plane 11.11 (2018) | 203 | 177.5 | 134.1 | 114.3 | |||
| Far Cry 5 (2018) | 186 | 173 | 160 | 159 | 113 | ||
| Strange Brigade (2018) | 490 | 396 | 391 | 373 | 309 | 159.3 | |
| Shadow of the Tomb Raider (2018) | 245 | 227 | 219 | 214 | 187 | 103 | |
| Metro Exodus (2019) | 204 | 183 | 153 | 132 | 116 | 81 | |
| Control (2019) | 240 | 232 | 187 | 122 | 63 | ||
| Borderlands 3 (2019) | 201 | 176 | 162 | 151 | 130 | 76 | |
| Horizon Zero Dawn (2020) | 209 | 189 | 174 | 163 | 154 | 131 | 95 |
| Mafia Definitive Edition (2020) | 219 | 189 | 179 | 161 | 93 | ||
| Watch Dogs Legion (2020) | 152 | 144 | 131 | 120 | 109 | 69 | |
| F1 2021 (2021) | 501 | 449 | 417 | 209 | 192.4 | 114.4 | |
| Far Cry 6 (2021) | 167 | 147 | 144 | 135 | 89 | ||
| Forza Horizon 5 (2021) | 220 | 181 | 174 | 124 | 113 | 95 | |
| God of War (2022) | 201 | 200 | 180 | 133 | 115 | 80 | |
| Rainbow Six Extraction (2022) | 378 | 347 | 346 | 314 | 219 | 112 | |
| Dying Light 2 (2022) | 240 | 206 | 174 | 121 | 62 | ||
| GRID Legends (2022) | 254 | 230 | 210 | 199 | 190 | 132 | |
| Cyberpunk 2077 1.6 (2022) | 156 | 144 | 138 | 135 | 98 | 56 | |
| Ghostwire Tokyo (2022) | 237 | 236 | 234 | 231 | 206 | 100 | |
| Tiny Tina's Wonderlands (2022) | 339 | 289 | 224 | 182 | 131 | 70 | |
| F1 22 (2022) | 316 | 294 | 283 | 138.2 | 90.1 | 44.9 | |
| Call of Duty Modern Warfare 2 2022 (2022) | 230 | 215 | 183 | 176 | 135 | 126 | 85 |
| Spider-Man Miles Morales (2022) | 134 | 131 | 118 | 116 | 113 | 83 | |
| The Callisto Protocol (2022) | 195 | 181 | 145 | 144 | 114 | 68 | |
| The Witcher 3 v4 (2023) | 240 | 189 | 173 | 150 | 104 | 50 | |
| Dead Space Remake (2023) | 147 | 141 | 130 | 129 | 100 | 53 |
Utsläpp - GT77 med fler värmerör
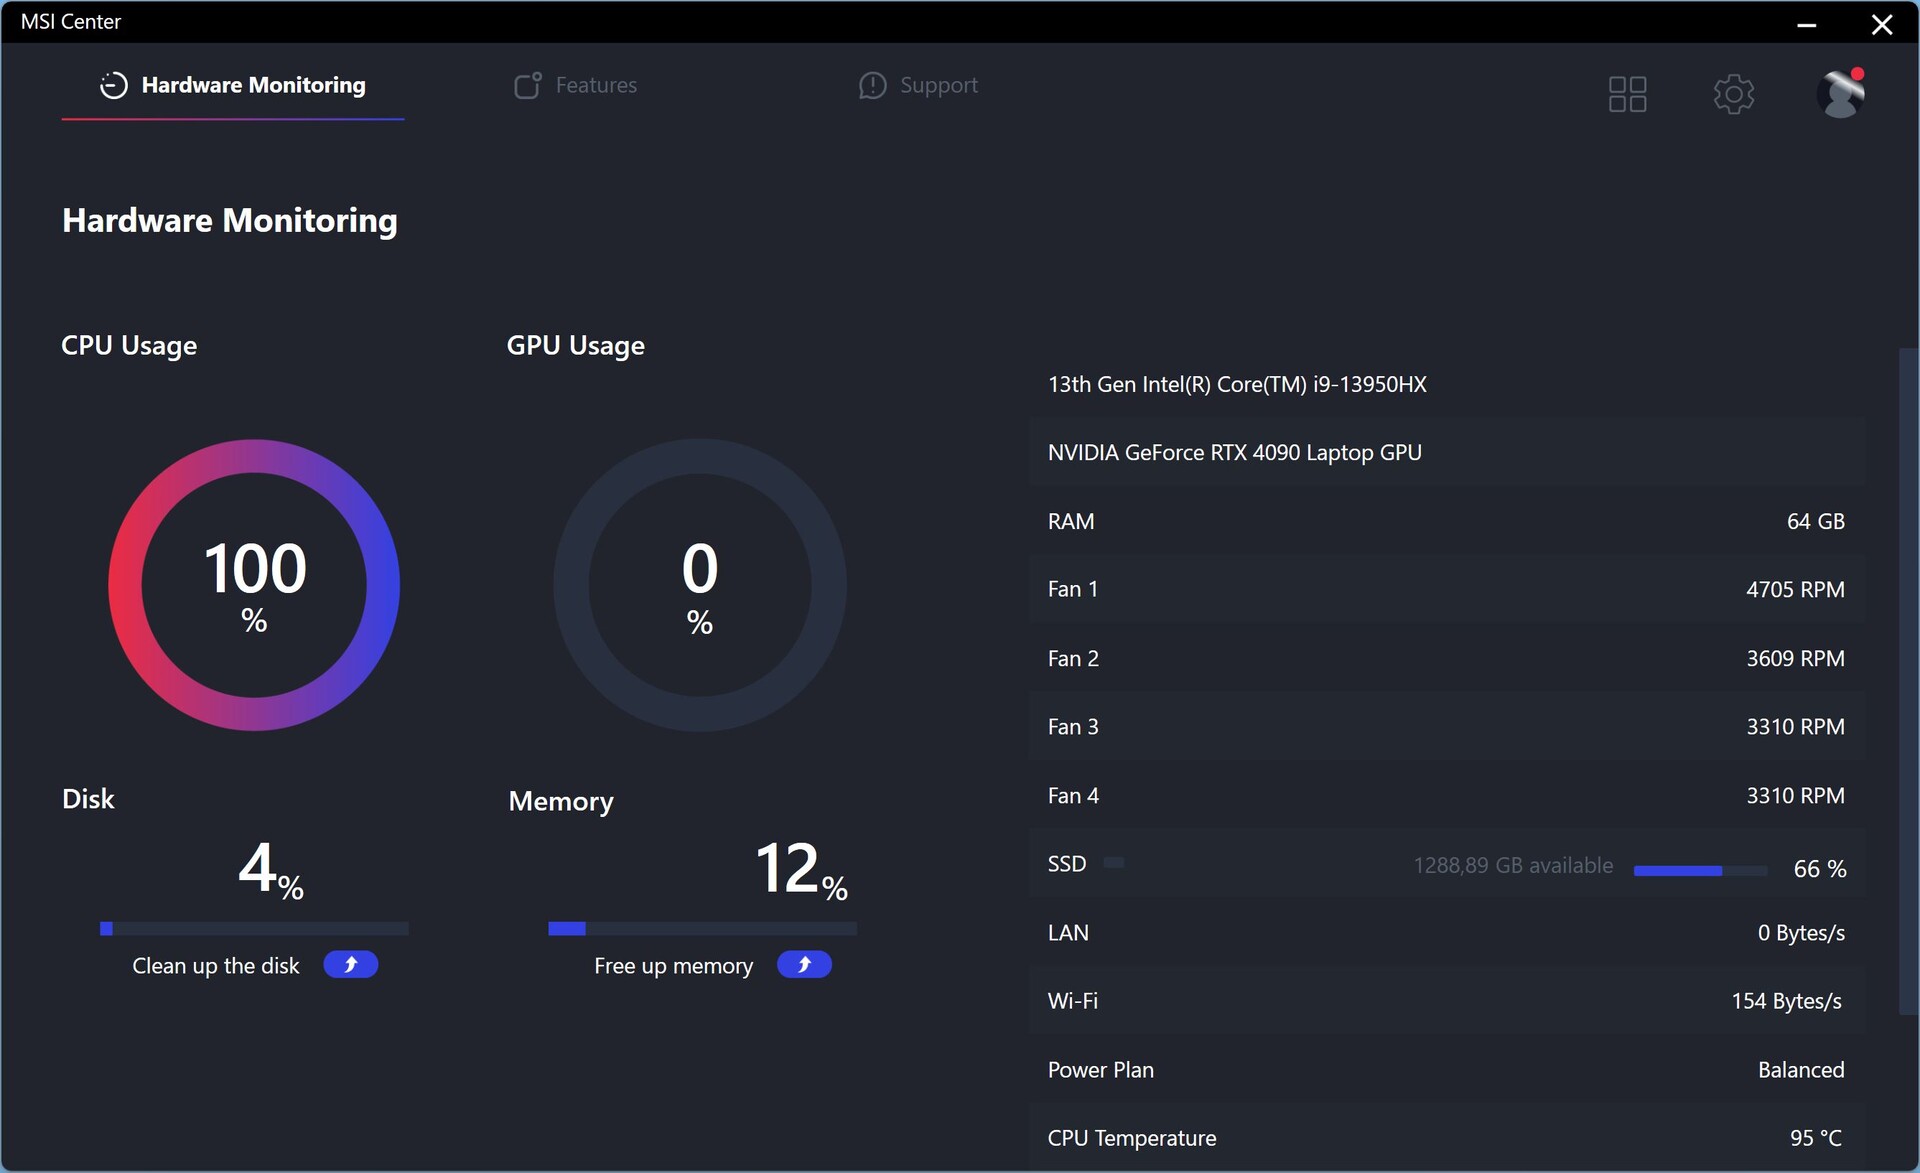
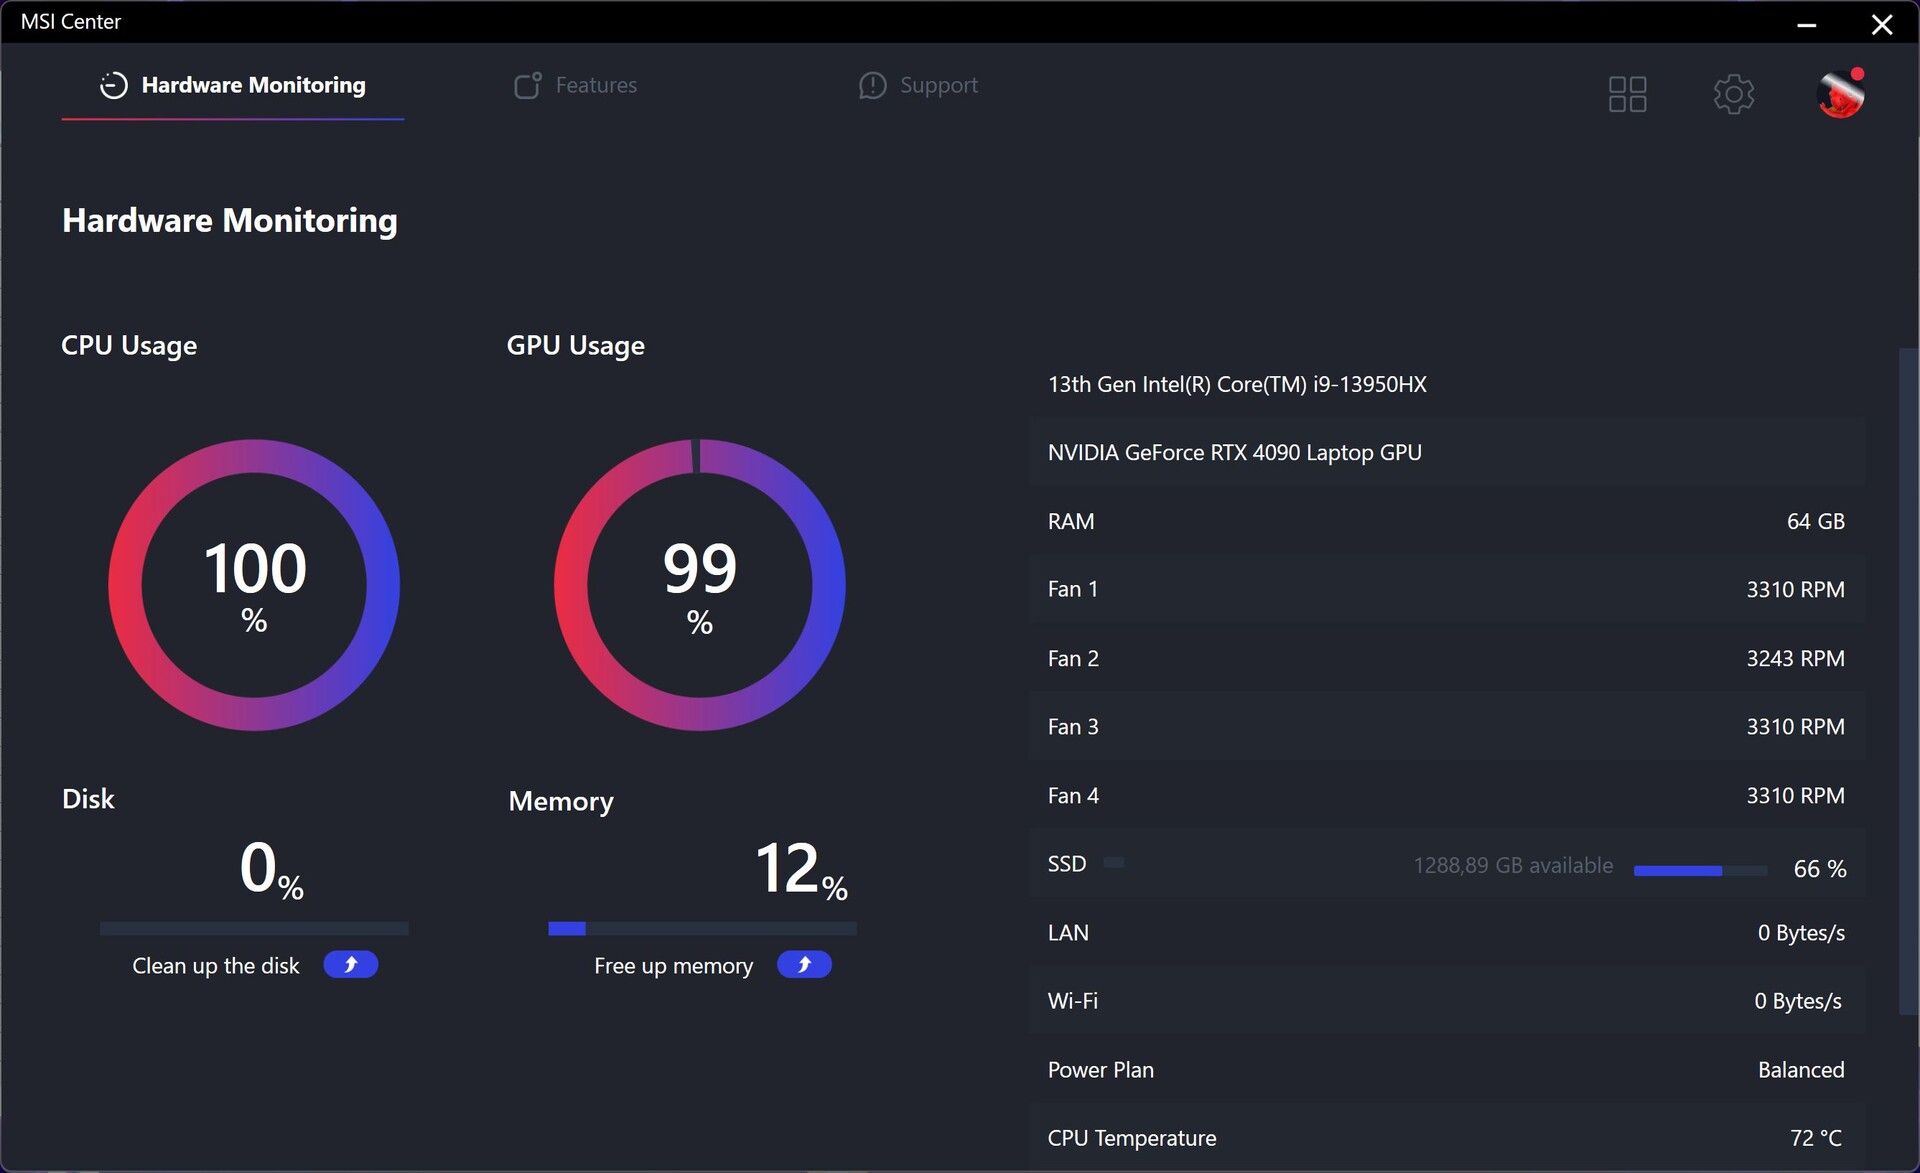
Systembrus
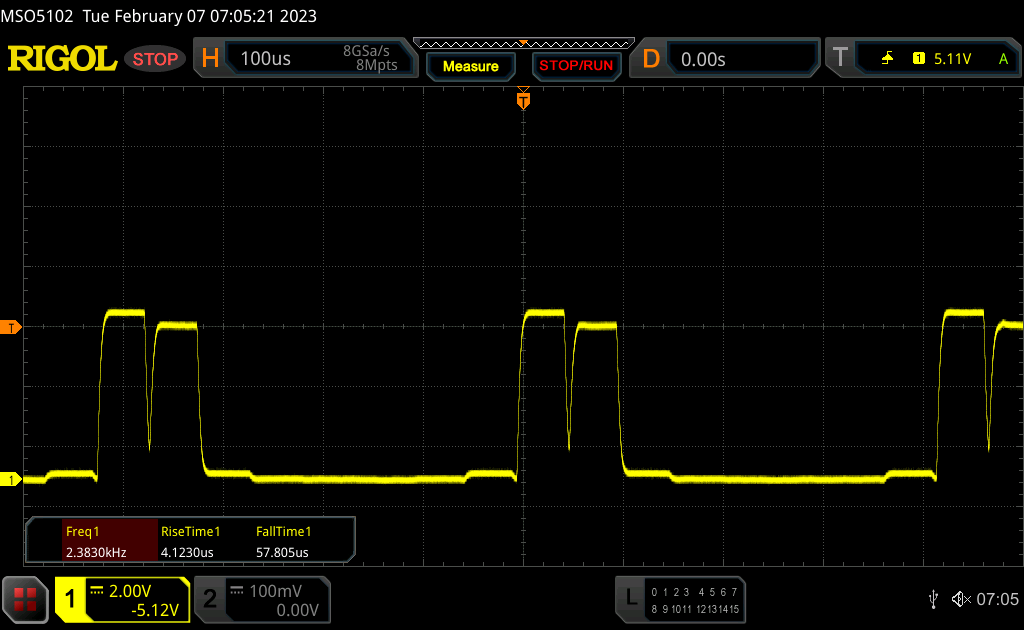
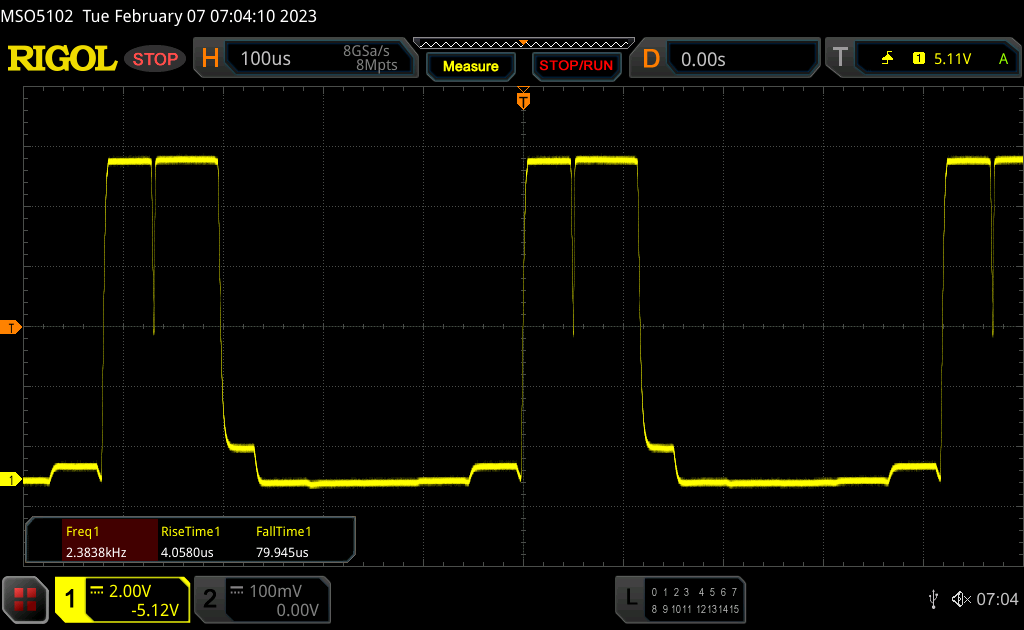
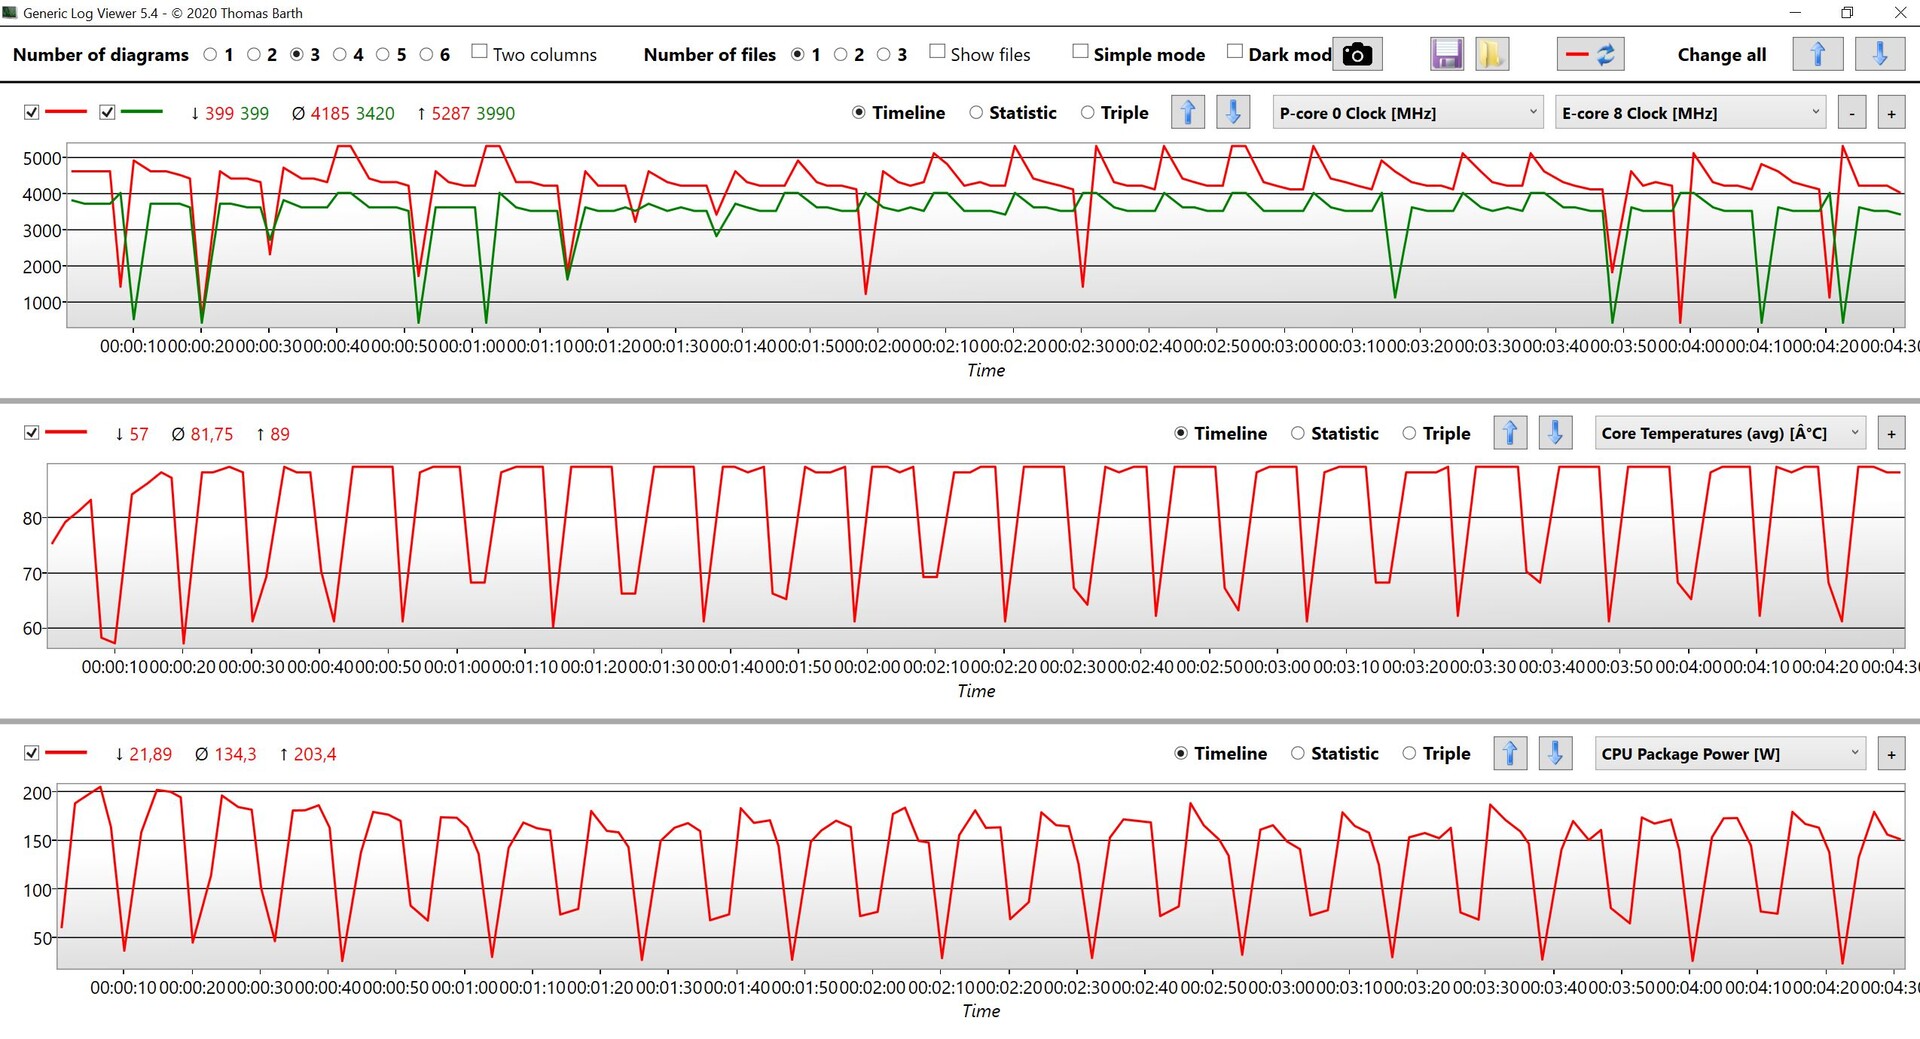
Titan GT77 använder fyra fläktar och många heatpipes för att avleda all värme. En av fläktarna (Fan 1 enligt MSI Control) snurrar alltid på ~1500 rpm oberoende av effektinställningarna, vilket resulterar i ett muller på 29,2 dB(A). Det är därför aldrig ett tyst system och ibland kan man höra elektroniska ljud på 29 dB(A) också. Den konstanta fläktaktiviteten innebär att fläktarna inte snurrar upp under lätt arbetsbelastning som webbsurfning. Om du börjar stressa CPU:n eller GPU:n blir det däremot väldigt snabbt väldigt bullrigt. Det är ganska intressant att vi fick de mest högljudda fläktarna under CPU-belastning med 61 dB(A), medan stresstestet "bara" resulterade i 53,3 dB(A). Orsaken är fläktbeteendet, vilket också kan ses på bilderna nedan.
Vi uppmätte mellan 53 och 56 dB(A) beroende på titeln, vilket naturligtvis är mycket högt. Det finns två olika tillvägagångssätt här, du kan antingen använda ett headset (gärna med brusreducering) eller så använder du Silent-läget, som begränsar fläktljudet till 39,6 dB(A). Prestandan kommer också att ta stryk, men de flesta spel kommer ändå att köras smidigt tack vare de enorma prestandareserverna. Du kan aktivera Cooler Boost-funktionen manuellt, vilket kommer att resultera i 62,8 dB(A), men vi nådde aldrig upp till den nivån under testningen.
| Extrema prestanda | Balanserad | Tyst | |
|---|---|---|---|
| Witcher 3 4.00 Ultra 4K | 55,7 dB(A) | 55,7 dB(A) | 39,6 dB(A) |
| Witcher 3 Ultra | 53,3 dB(A) | 53,3 dB(A) | 39,6 dB(A) |
| Dead Space Remake Ultra 4K | 55,7 dB(A) | 53,3 dB(A) | 39,6 dB(A) |
| CB R23 Multi | 61 dB(A) | 55,7 dB(A) | 36,8 dB(A) |
| Furmark | 56,1 dB(A) | 53,3 dB(A) | 39,6 dB(A) |
Ljudnivå
| Låg belastning |
| 29.2 / 29.2 / 29.2 dB(A) |
| Hög belastning |
| 50.7 / 61 dB(A) |
 | ||
30 dB tyst 40 dB(A) hörbar 50 dB(A) högt ljud |
||
min: | ||
| MSI Titan GT77 HX 13VI GeForce RTX 4090 Laptop GPU, i9-13950HX, Samsung PM9A1 MZVL22T0HBLB | Razer Blade 16 Early 2023 GeForce RTX 4080 Laptop GPU, i9-13950HX, SSSTC CA6-8D1024 | Asus ROG Strix Scar 17 SE G733CX-LL014W GeForce RTX 3080 Ti Laptop GPU, i9-12950HX, Samsung PM9A1 MZVL22T0HBLB | MSI Titan GT77 12UHS GeForce RTX 3080 Ti Laptop GPU, i9-12900HX, Samsung PM9A1 MZVL21T0HCLR | Alienware x17 R2 P48E GeForce RTX 3080 Ti Laptop GPU, i9-12900HK, 2x Samsung PM9A1 1TB (RAID 0) | Schenker XMG Neo 17 M22 GeForce RTX 3080 Ti Laptop GPU, R9 6900HX, Samsung SSD 980 Pro 1TB MZ-V8P1T0BW | |
|---|---|---|---|---|---|---|
| Noise | 16% | 19% | 10% | 18% | -2% | |
| av / miljö * (dB) | 24.6 | 23 7% | 23.9 3% | 21.9 11% | 22.7 8% | 26 -6% |
| Idle Minimum * (dB) | 29.2 | 23 21% | 23.9 18% | 24.53 16% | 23.1 21% | 26 11% |
| Idle Average * (dB) | 29.2 | 23 21% | 23.9 18% | 24.53 16% | 23.1 21% | 29 1% |
| Idle Maximum * (dB) | 29.2 | 23.6 19% | 23.9 18% | 24.53 16% | 23.1 21% | 40 -37% |
| Load Average * (dB) | 50.7 | 39 23% | 34.3 32% | 46.25 9% | 31.9 37% | 47 7% |
| Witcher 3 ultra * (dB) | 53.3 | 51.6 3% | 56.86 -7% | 52.5 2% | 52 2% | |
| Load Maximum * (dB) | 61 | 51.3 16% | 45.9 25% | 54.25 11% | 52.5 14% | 54 11% |
* ... mindre är bättre
Temperatur
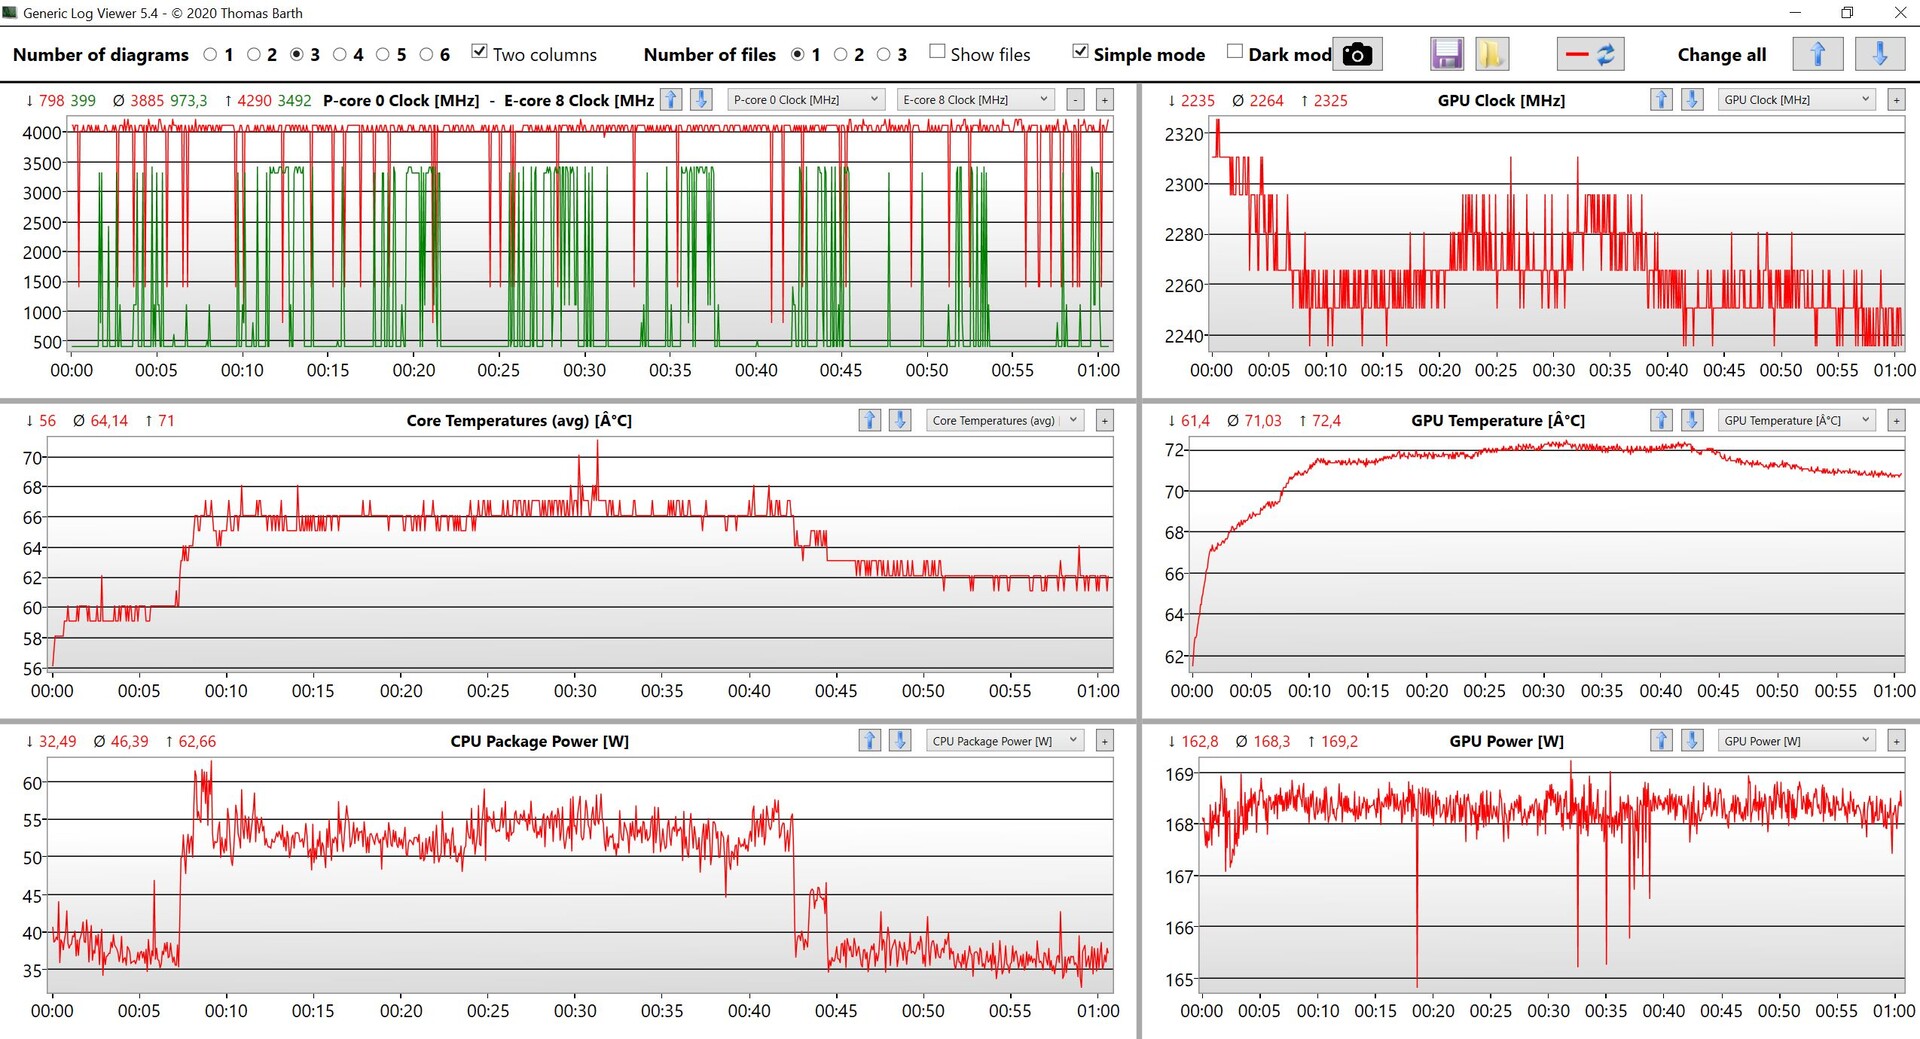
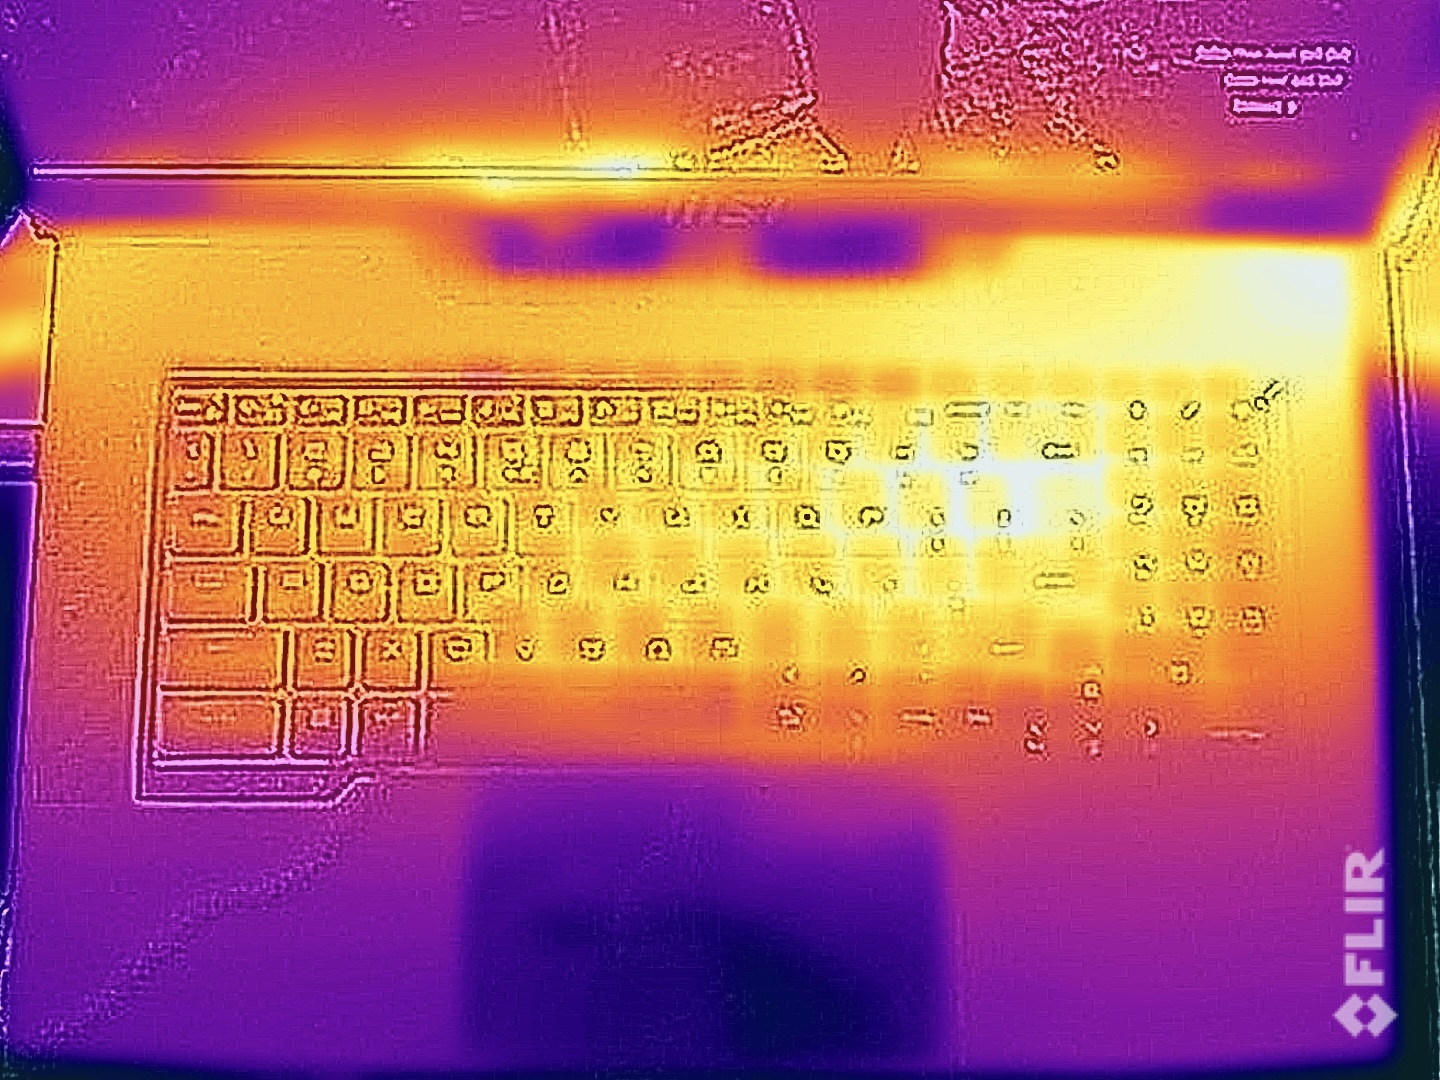
De högljudda fläktarna har en stor fördel, eftersom yttemperaturen är förvånansvärt låg och du kan fortfarande använda tangentbordet utan begränsningar under längre spelsessioner. Vi kontrollerade resultaten flera gånger, men siffrorna var desamma. Vi kan knappt mäta mer än 40 °C under belastning, vilket är ett bra resultat med tanke på prestandan.
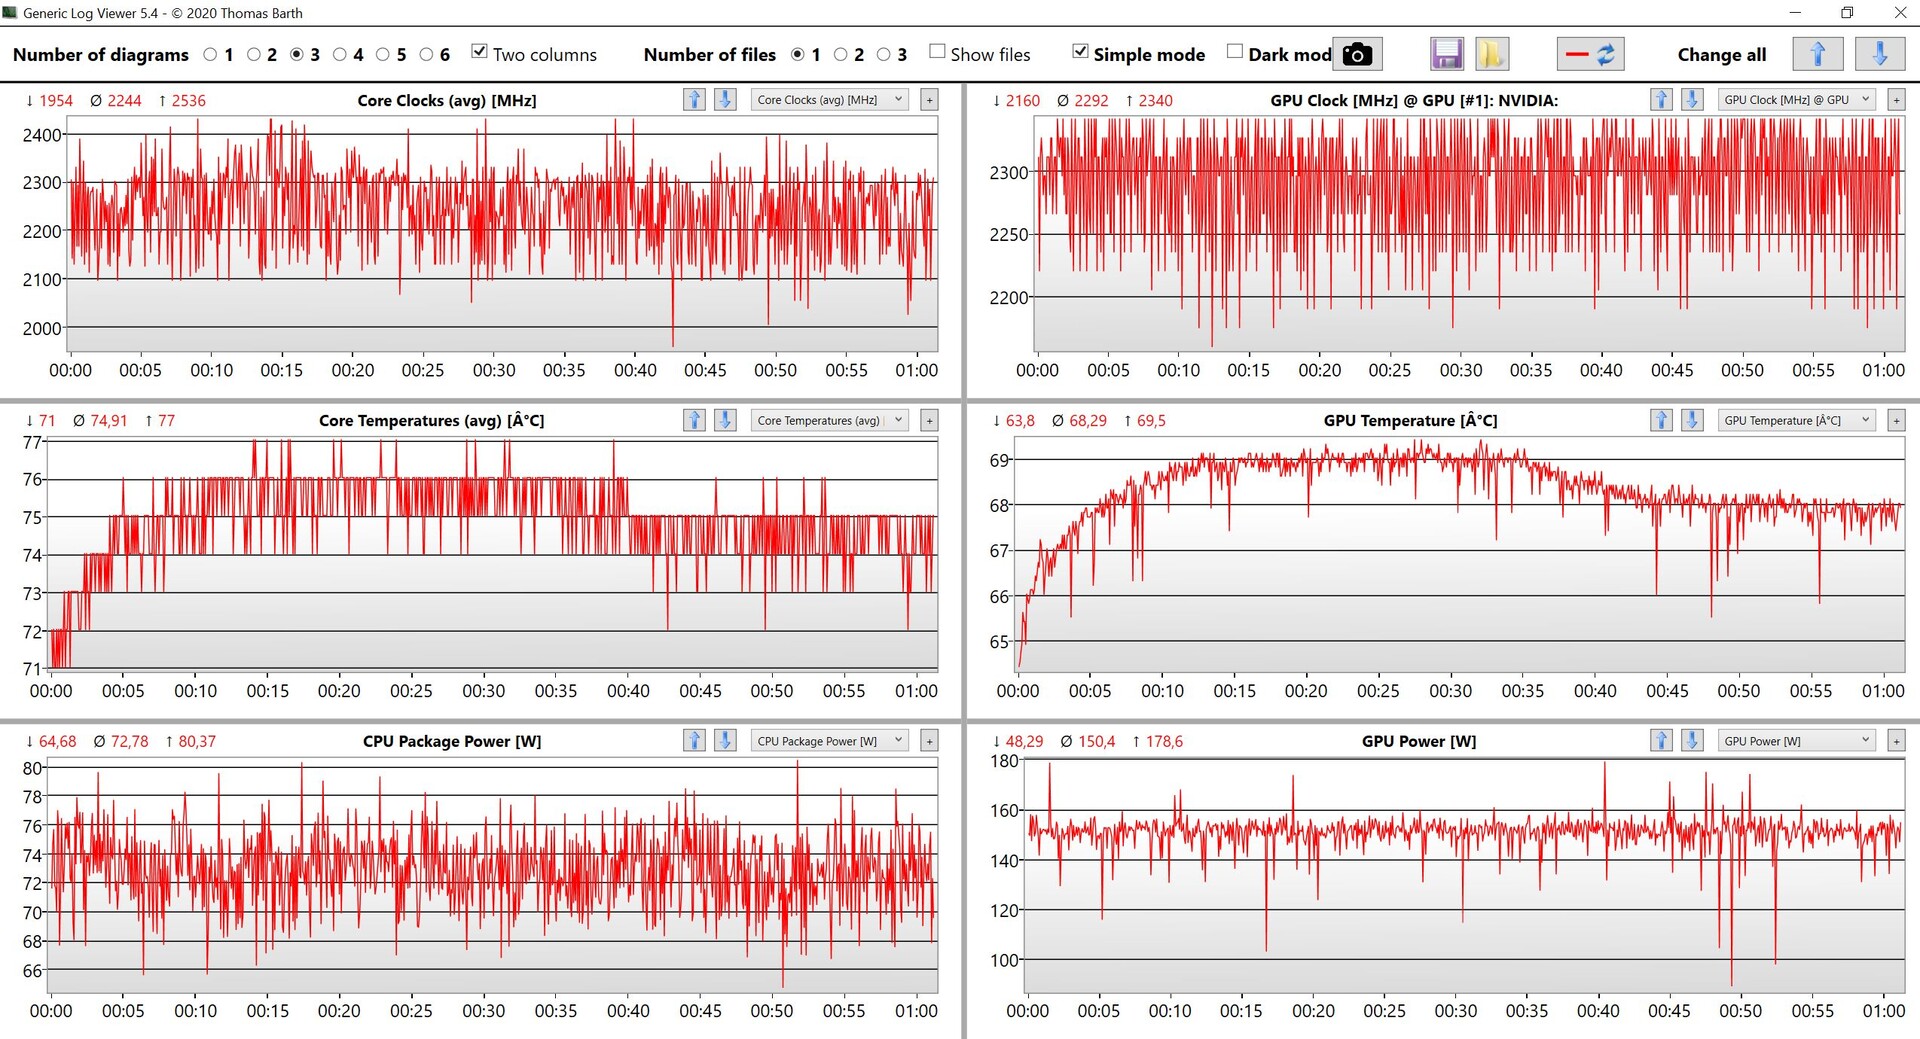
CPU och GPU planar snabbt ut vid 75 W respektive 150 W under stresstestet och prestandan är stabil. Systemet kyler totalt 225W, men MSI annonserar även upp till 250W för system medCore i9-13980HX, så temperaturerna kan vara lite högre (vi förväntar oss egentligen inte ännu högre fläktar).
(±) Den maximala temperaturen på ovansidan är 40.6 °C / 105 F, jämfört med genomsnittet av 40.4 °C / 105 F , allt från 21.2 till 68.8 °C för klassen Gaming.
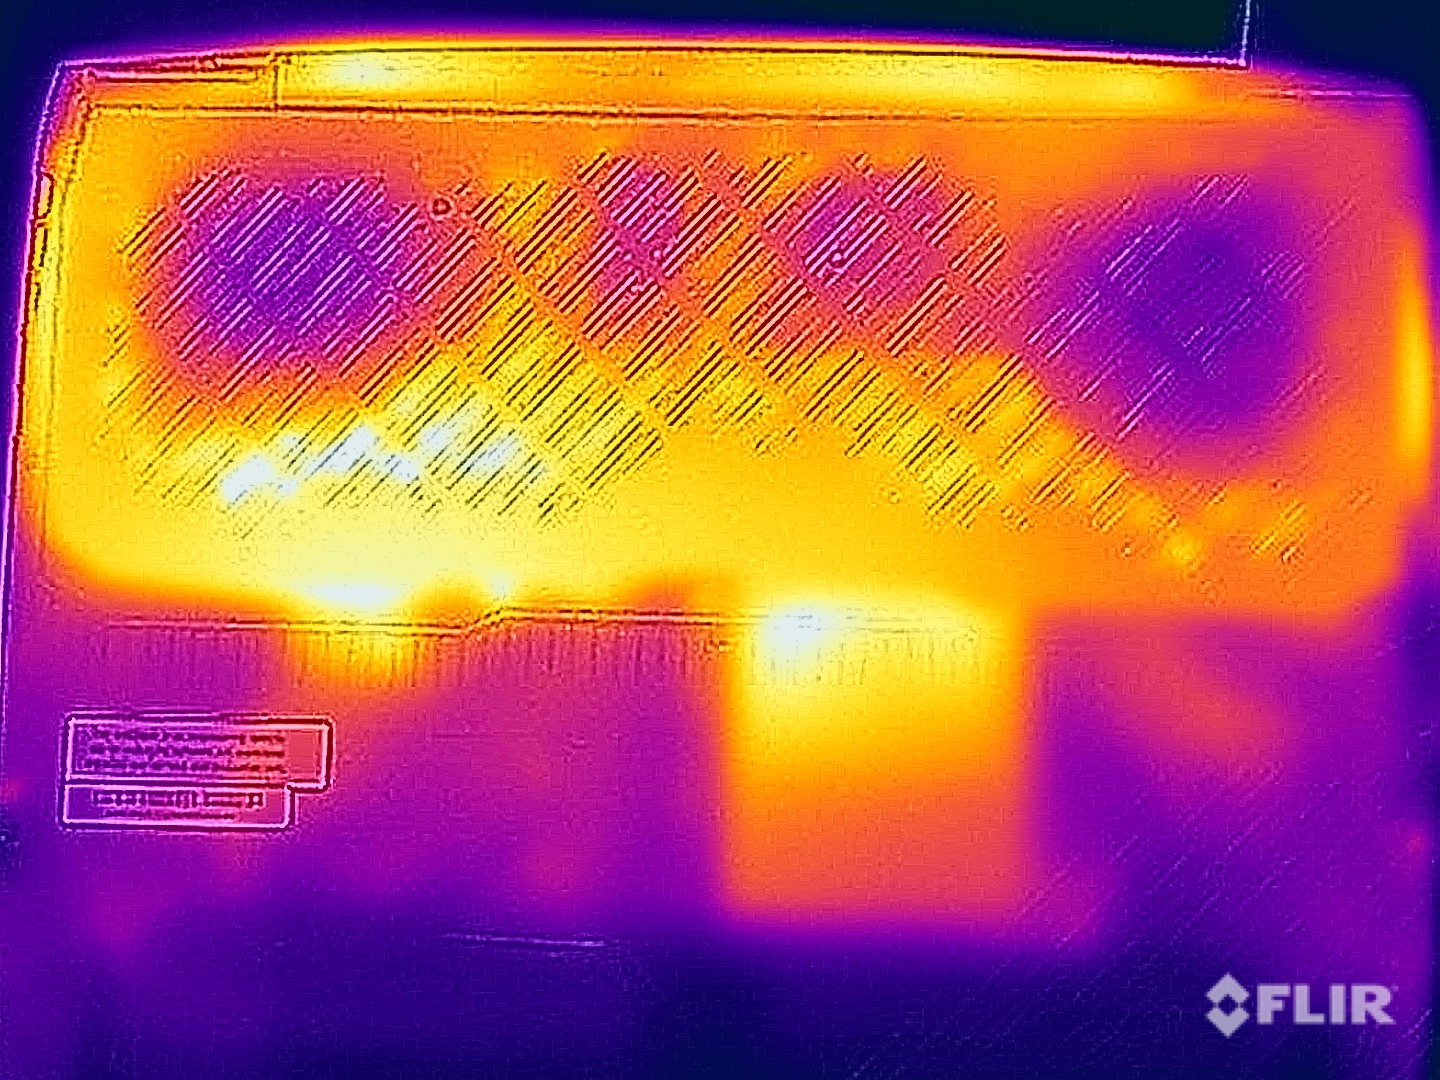
(±) Botten värms upp till maximalt 41.1 °C / 106 F, jämfört med genomsnittet av 43.2 °C / 110 F
(+) Vid tomgångsbruk är medeltemperaturen för ovansidan 25.2 °C / 77 F, jämfört med enhetsgenomsnittet på 33.9 °C / ### class_avg_f### F.
(±) När du spelar The Witcher 3 är medeltemperaturen för ovansidan 36.2 °C / 97 F, jämfört med enhetsgenomsnittet på 33.9 °C / ## #class_avg_f### F.
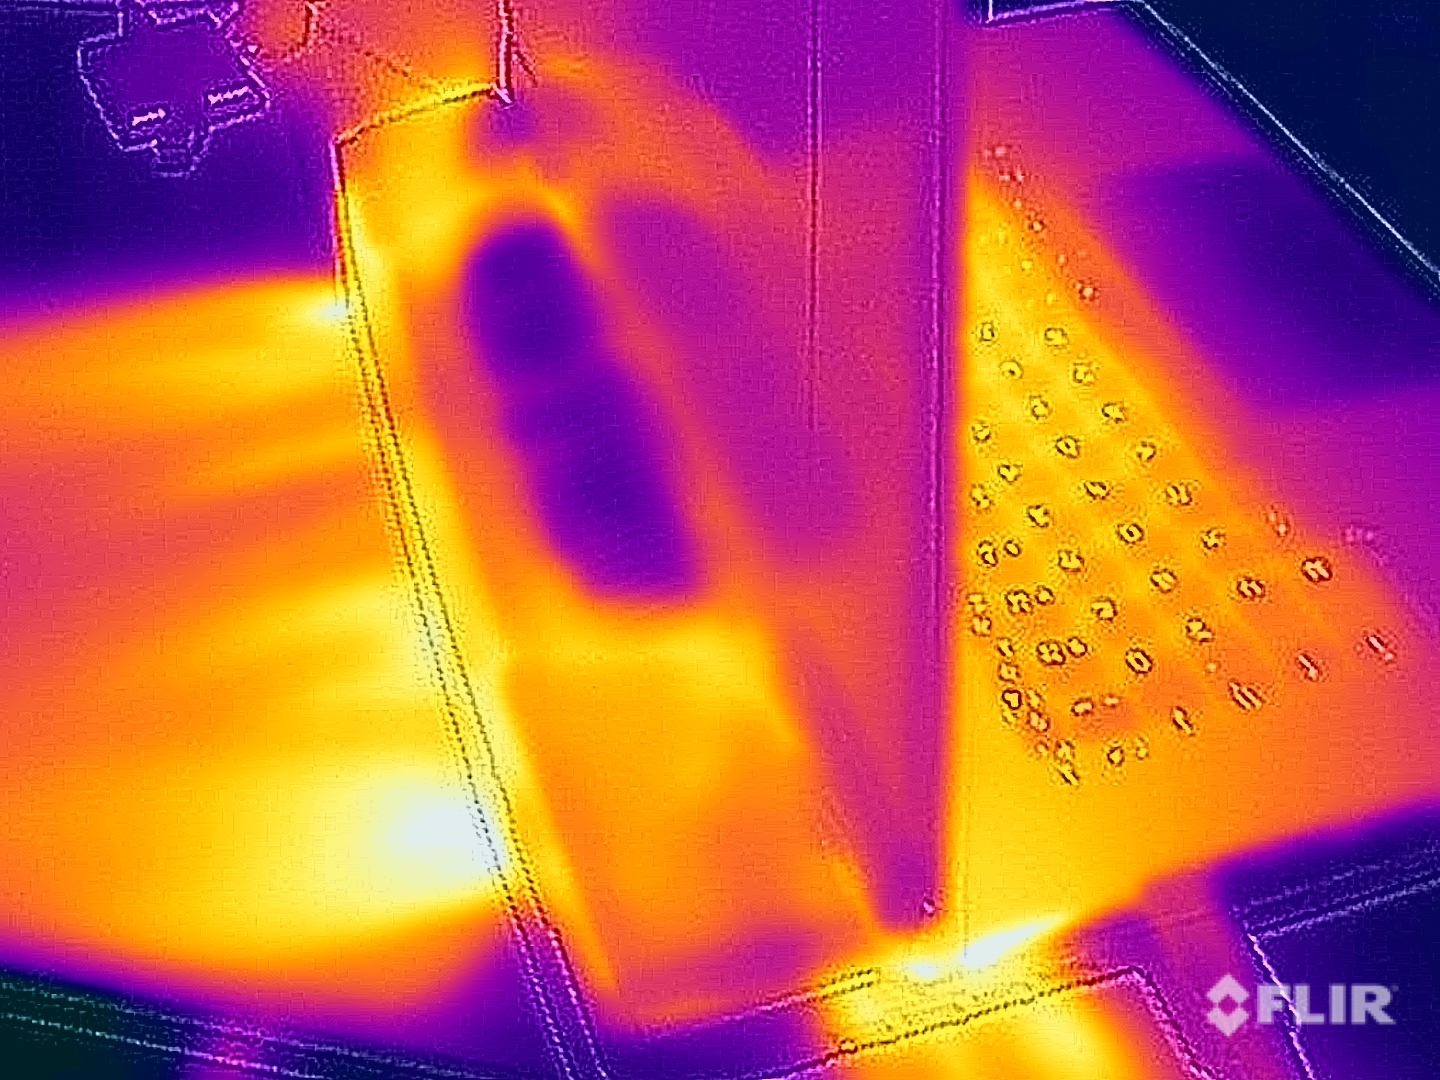
(+) Handledsstöden och pekplattan är kallare än hudtemperaturen med maximalt 29.6 °C / 85.3 F och är därför svala att ta på.
(±) Medeltemperaturen för handledsstödsområdet på liknande enheter var 28.8 °C / 83.8 F (-0.8 °C / -1.5 F).
| MSI Titan GT77 HX 13VI Intel Core i9-13950HX, NVIDIA GeForce RTX 4090 Laptop GPU | Razer Blade 16 Early 2023 Intel Core i9-13950HX, NVIDIA GeForce RTX 4080 Laptop GPU | Asus ROG Strix Scar 17 SE G733CX-LL014W Intel Core i9-12950HX, NVIDIA GeForce RTX 3080 Ti Laptop GPU | MSI Titan GT77 12UHS Intel Core i9-12900HX, NVIDIA GeForce RTX 3080 Ti Laptop GPU | Alienware x17 R2 P48E Intel Core i9-12900HK, NVIDIA GeForce RTX 3080 Ti Laptop GPU | Schenker XMG Neo 17 M22 AMD Ryzen 9 6900HX, NVIDIA GeForce RTX 3080 Ti Laptop GPU | |
|---|---|---|---|---|---|---|
| Heat | -5% | -19% | -22% | -11% | -18% | |
| Maximum Upper Side * (°C) | 40.6 | 40 1% | 48.8 -20% | 40.8 -0% | 49.6 -22% | 49 -21% |
| Maximum Bottom * (°C) | 41.1 | 37.6 9% | 52.4 -27% | 52.4 -27% | 42.4 -3% | 52 -27% |
| Idle Upper Side * (°C) | 26.2 | 32.4 -24% | 30.4 -16% | 34.6 -32% | 29.2 -11% | 30 -15% |
| Idle Bottom * (°C) | 30.3 | 31.4 -4% | 34.1 -13% | 38.4 -27% | 32 -6% | 33 -9% |
* ... mindre är bättre
Högtalare
GT77 har fortfarande två bra stereohögtalare i kombination med två bashögtalare som ger ett bra ljud. Du kan dock inte riktigt njuta under spelande eftersom fläktarna är alldeles för högljudda, men ljudsystemet är definitivt tillräckligt för tillfällig musik- och videouppspelning.
MSI Titan GT77 HX 13VI ljudanalys
(+) | högtalare kan spela relativt högt (90.1 dB)
Bas 100 - 315 Hz
(±) | reducerad bas - i genomsnitt 14.3% lägre än medianen
(±) | linjäriteten för basen är genomsnittlig (7.5% delta till föregående frekvens)
Mellan 400 - 2000 Hz
(+) | balanserad mellan - endast 3.5% från medianen
(+) | mids är linjära (3.2% delta till föregående frekvens)
Högsta 2 - 16 kHz
(+) | balanserade toppar - endast 1.9% från medianen
(+) | toppar är linjära (3.8% delta till föregående frekvens)
Totalt 100 - 16 000 Hz
(+) | det totala ljudet är linjärt (11.1% skillnad mot median)
Jämfört med samma klass
» 8% av alla testade enheter i den här klassen var bättre, 3% liknande, 89% sämre
» Den bästa hade ett delta på 6%, genomsnittet var 18%, sämst var 132%
Jämfört med alla testade enheter
» 7% av alla testade enheter var bättre, 2% liknande, 91% sämre
» Den bästa hade ett delta på 4%, genomsnittet var 23%, sämst var 134%
Alienware x17 R2 P48E ljudanalys
(+) | högtalare kan spela relativt högt (84.3 dB)
Bas 100 - 315 Hz
(±) | reducerad bas - i genomsnitt 9.7% lägre än medianen
(+) | basen är linjär (5.5% delta till föregående frekvens)
Mellan 400 - 2000 Hz
(+) | balanserad mellan - endast 1.6% från medianen
(+) | mids är linjära (3% delta till föregående frekvens)
Högsta 2 - 16 kHz
(±) | högre toppar - i genomsnitt 5% högre än medianen
(±) | linjäriteten för toppar är genomsnittlig (7.6% delta till föregående frekvens)
Totalt 100 - 16 000 Hz
(+) | det totala ljudet är linjärt (9.3% skillnad mot median)
Jämfört med samma klass
» 3% av alla testade enheter i den här klassen var bättre, 2% liknande, 95% sämre
» Den bästa hade ett delta på 6%, genomsnittet var 18%, sämst var 132%
Jämfört med alla testade enheter
» 3% av alla testade enheter var bättre, 1% liknande, 96% sämre
» Den bästa hade ett delta på 4%, genomsnittet var 23%, sämst var 134%
Energihantering - Titan med 99,9 Wh-batteri
Effektförbrukning
Strömförbrukningen för det nya GT77 när det går på tomgång med iGPU:n är inte alltför dålig och det finns inga större skillnader mot tidigare modeller under belastning heller, vilket är imponerande med tanke på prestandaförbättringen. Vi kan observera en maximal förbrukning på upp till 420 W när vi startar stresstestet, men den sjunker snabbt till ~290 W när komponenterna har satt sig. Detta innebär att nätadaptern på 330 W är tillräcklig.
| Av/Standby | |
| Låg belastning | |
| Hög belastning |
|
Förklaring:
min: | |
| MSI Titan GT77 HX 13VI i9-13950HX, GeForce RTX 4090 Laptop GPU, Samsung PM9A1 MZVL22T0HBLB, Mini-LED, 3840x2160, 17.3" | Razer Blade 16 Early 2023 i9-13950HX, GeForce RTX 4080 Laptop GPU, SSSTC CA6-8D1024, IPS, 2560x1600, 16" | Asus ROG Strix Scar 17 SE G733CX-LL014W i9-12950HX, GeForce RTX 3080 Ti Laptop GPU, Samsung PM9A1 MZVL22T0HBLB, IPS, 2560x1440, 17.3" | MSI Titan GT77 12UHS i9-12900HX, GeForce RTX 3080 Ti Laptop GPU, Samsung PM9A1 MZVL21T0HCLR, IPS-Level, 1920x1080, 17.3" | Alienware x17 R2 P48E i9-12900HK, GeForce RTX 3080 Ti Laptop GPU, 2x Samsung PM9A1 1TB (RAID 0), IPS, 1920x1080, 17.3" | Schenker XMG Neo 17 M22 R9 6900HX, GeForce RTX 3080 Ti Laptop GPU, Samsung SSD 980 Pro 1TB MZ-V8P1T0BW, IPS, 2560x1600, 17" | Genomsnitt NVIDIA GeForce RTX 4090 Laptop GPU | Genomsnitt av klass Gaming | |
|---|---|---|---|---|---|---|---|---|
| Power Consumption | -12% | -7% | -30% | -37% | 33% | -9% | 14% | |
| Idle Minimum * (Watt) | 14 | 15.2 -9% | 19.3 -38% | 30.21 -116% | 24.1 -72% | 7 50% | 16.2 ? -16% | 13 ? 7% |
| Idle Average * (Watt) | 21.6 | 22.8 -6% | 26.5 -23% | 32.42 -50% | 28.5 -32% | 11 49% | 23.1 ? -7% | 19 ? 12% |
| Idle Maximum * (Watt) | 24.8 | 49.8 -101% | 27.1 -9% | 33.7 -36% | 60 -142% | 17 31% | 34.2 ? -38% | 24.6 ? 1% |
| Load Average * (Watt) | 122.5 | 121.2 1% | 141 -15% | 125.09 -2% | 128.7 -5% | 92 25% | 130.5 ? -7% | 110.7 ? 10% |
| Witcher 3 ultra * (Watt) | 265 | 242 9% | 225 15% | 256 3% | 254 4% | 221 17% | ||
| Load Maximum * (Watt) | 418 | 273.7 35% | 307.9 26% | 321.88 23% | 323 23% | 306 27% | 324 ? 22% | 259 ? 38% |
* ... mindre är bättre
Power consumption Witcher 3 / Stress test
Power consumption external screen
Batteritider
MSI har redan implementerat det största möjliga batteriet med 99,9 Wh, men batteritiderna är fortfarande begränsade på grund av den höga förbrukningen. Vi har redan nämnt att skärmens ljusstyrka minskas på batteriet och du kan inte heller använda HDR, men du kan ändå räkna med cirka 5-6 timmar vid en ljusstyrka på 150 nits (69 % av den maximala ljusstyrkan på vår recensionsenhet) i praktiska scenarier. Den minsta drifttiden är 1,5 timmar, men vi har redan nämnt att prestandan är kraftigt reducerad. En full laddning tar 158 minuter när enheten är påslagen. 80 % av kapaciteten är tillgänglig efter lite mer än 1,5 timmar.
| MSI Titan GT77 HX 13VI i9-13950HX, GeForce RTX 4090 Laptop GPU, 99.9 Wh | Razer Blade 16 Early 2023 i9-13950HX, GeForce RTX 4080 Laptop GPU, 95.2 Wh | Asus ROG Strix Scar 17 SE G733CX-LL014W i9-12950HX, GeForce RTX 3080 Ti Laptop GPU, 90 Wh | MSI Titan GT77 12UHS i9-12900HX, GeForce RTX 3080 Ti Laptop GPU, 99.9 Wh | Alienware x17 R2 P48E i9-12900HK, GeForce RTX 3080 Ti Laptop GPU, 87 Wh | Schenker XMG Neo 17 M22 R9 6900HX, GeForce RTX 3080 Ti Laptop GPU, 99 Wh | Genomsnitt av klass Gaming | |
|---|---|---|---|---|---|---|---|
| Batteridrifttid | 8% | -21% | 17% | -53% | 36% | 27% | |
| H.264 (h) | 6 | 7.2 20% | 6.6 10% | 8.32 ? 39% | |||
| WiFi v1.3 (h) | 5.3 | 6.1 15% | 4.2 -21% | 6.9 30% | 2 -62% | 9 70% | 7.11 ? 34% |
| Load (h) | 1.4 | 1.4 0% | 1.4 0% | 0.8 -43% | 1.8 29% | 1.502 ? 7% | |
| Witcher 3 ultra (h) | 1.5 |
För
Emot
Slutsats - GT77 med extrem spelprestanda och fantastisk skärm
Det nya MSI Titan GT77 kommer troligen bara att nå en mycket liten grupp användare på grund av det höga priset, men det är ändå ett imponerande exempel på vad som är möjligt. Den avancerade spelaren kombinerar de bästa komponenterna du för närvarande kan få i nästan alla avseenden och det är ett mycket bra helhetspaket, som inte behöver gömma sig bakom fullfjädrade stationära system.
Vi känner redan till chassit från föregångaren och det lämnar ett hyggligt intryck, men belysningsalternativen är ganska begränsade (vilket kan vara bra eller dåligt beroende på dina preferenser) och de släta ytorna är mycket benägna att ta fingeravtryck. Det mekaniska tangentbordet är fortfarande utmärkt och det finns tillräckligt med portar. Den nya HX-processor från Intels nuvarande Raptor Lake-generation är i genomsnitt cirka 22 % snabbare än sin föregångare, men den nyaGeForce RTX 4090är ännu mer imponerande. Trots en liknande TGP på 175 W är den cirka 40-60 % snabbare än den gamla.RTX 3080 Tioch kan konkurrera med skrivbordsversionerna av RTX 3090/RTX 3090 Ti. Jämfört med de nuvarande RTX-40xx desktop GPU:erna sitter den nya RTX 4090 Laptop precis mellan RTX 4070 Ti och RTX 4080.
Ingen bärbar dator för spel erbjuder mer prestanda just nu: MSI GT77 med Core i9-13950HX och GeForce RTX 4090 använder den snabbaste hårdvaran du kan få för en bärbar dator. Spel ser också otroligt bra ut på den nya 4K Mini-LED-panelen.
Hårdvarukombinationen har inga problem med den nya Mini-LED-skärmens ursprungliga 4K-upplösning (144 Hz). Den subjektiva bildkvaliteten är utmärkt och spel ser bara riktigt bra ut. Du kan också använda panelen för bildredigering efter en kalibrering, vilket är möjligt med den förinstallerade True Color-programvaran. Skärmen har också stöd för HDR med en ljusstyrka på mer än 1000 nits, men HDR-implementeringen i Windows är fortfarande fruktansvärd jämfört med macOS, där den bara fungerar sömlöst.
Med tanke på den kraftfulla hårdvaran, den diskreta chassidesignen, den bra skärmen och det utmärkta tangentbordet fungerar Titan GT77 också riktigt bra som mobil arbetsstation och till och med RTX A5500 hamnar på efterkälken i vissa professionella applikationer.
Kylningen fungerar riktigt bra med fyra fläktar och gott om heatpipes och vi kan knappt mäta yttemperaturer på över 40 °C även under belastning, men fläktarna är i gengäld extremt högljudda. Du ska räkna med mellan 54-57 dB(A) under spel och till och med över 60 dB(A) när du bara belastar processorn. Fläktljudet är mycket jämnt, men vi rekommenderar ändå hörlurar (helst med aktiv brusreducering). Det är också möjligt att använda det tysta läget och minska fläktljudet till 40 dB(A). Prestandan kommer att ta en smäll, men den kommer fortfarande att vara mer än tillräcklig i de flesta titlar.
MSI Titan GT77 har också en del nackdelar, särskilt med tanke på det höga priset. Det gäller bland annat användningen av billig plast (särskilt det nedre locket), långsam DDR5-4800 ram och den dåliga 720p-kameran. Prestandan för de två 2 TB SSD-enheterna i en RAID 0-konfiguration är mycket hög, men inte stabil. GT77 är den första bärbara 17-tums gamingdatorn med den nya hårdvaran i vår recension och vi är redan ivriga att testa konkurrenterna under de kommande veckorna.
Pris och tillgänglighet
Den nya MSI Titan GT77 HX 13 VI finns tillgänglig på MSI:s butik för 5299 dollar.
MSI Titan GT77 HX 13VI
- 02/07/2023 v7 (old)
Andreas Osthoff
Genomskinlighet
Valet av enheter som ska granskas görs av vår redaktion. Testprovet gavs till författaren som ett lån av tillverkaren eller återförsäljaren för denna recension. Långivaren hade inget inflytande på denna recension och inte heller fick tillverkaren en kopia av denna recension innan publiceringen. Det fanns ingen skyldighet att publicera denna recension. Som ett oberoende medieföretag är Notebookcheck inte föremål för auktoritet från tillverkare, återförsäljare eller förlag.
This is how Notebookcheck is testingEvery year, Notebookcheck independently reviews hundreds of laptops and smartphones using standardized procedures to ensure that all results are comparable. We have continuously developed our test methods for around 20 years and set industry standards in the process. In our test labs, high-quality measuring equipment is utilized by experienced technicians and editors. These tests involve a multi-stage validation process. Our complex rating system is based on hundreds of well-founded measurements and benchmarks, which maintains objectivity.
Price comparison

