MSI Cyborg 15 A12VF granskning: Bärbar dator för spel med låg effekt RTX 4060
MSI:s bärbara dator för mobilt spelande vill inte - och kan inte heller - sätta några nya prestandarekord. TheCore i7-12650Hoch GeForce RTX 4060körs med konservativa effektgränser och en låg TGP (45 Watt), vilket resulterar i en ganska låg strömförbrukning. Ett 120-watts nätaggregat är allt som behövs för den bärbara datorn. Bland konkurrenterna finns bärbara datorer som t.ex Asus TUF Gaming A16 FA617, denAorus 15 XE5, denMSI Katana 15 B12VEK, denHP Victus 15och Schenker XMG Fusion 15.
Potentiella konkurrenter i jämförelse
Gradering | Datum | Modell | Vikt | Höjd | Storlek | Upplösning | Pris |
|---|---|---|---|---|---|---|---|
| 82.4 % v7 (old) | 04/2023 | MSI Cyborg 15 A12VF i7-12650H, GeForce RTX 4060 Laptop GPU | 2 kg | 22.9 mm | 15.60" | 1920x1080 | |
| 86.2 % v7 (old) | 02/2023 | Asus TUF Gaming A16 FA617 R7 7735HS, Radeon RX 7600S | 2.2 kg | 27 mm | 16.00" | 1920x1200 | |
| 85.5 % v7 (old) | 12/2022 | Aorus 15 XE5 i7-12700H, GeForce RTX 3070 Ti Laptop GPU | 2.3 kg | 24 mm | 15.60" | 2560x1440 | |
| 87.4 % v7 (old) | 08/2022 | Schenker XMG Fusion 15 (Mid 22) i7-11800H, GeForce RTX 3070 Laptop GPU | 1.9 kg | 21.65 mm | 15.60" | 2560x1440 | |
| 82.9 % v7 (old) | 03/2023 | MSI Katana 15 B12VEK i7-12650H, GeForce RTX 4050 Laptop GPU | 2.3 kg | 24.9 mm | 15.60" | 1920x1080 | |
| 81 % v7 (old) | 01/2023 | HP Victus 15 fa0020nr i7-12700H, GeForce RTX 3050 Ti Laptop GPU | 2.3 kg | 23.6 mm | 15.60" | 1920x1080 |
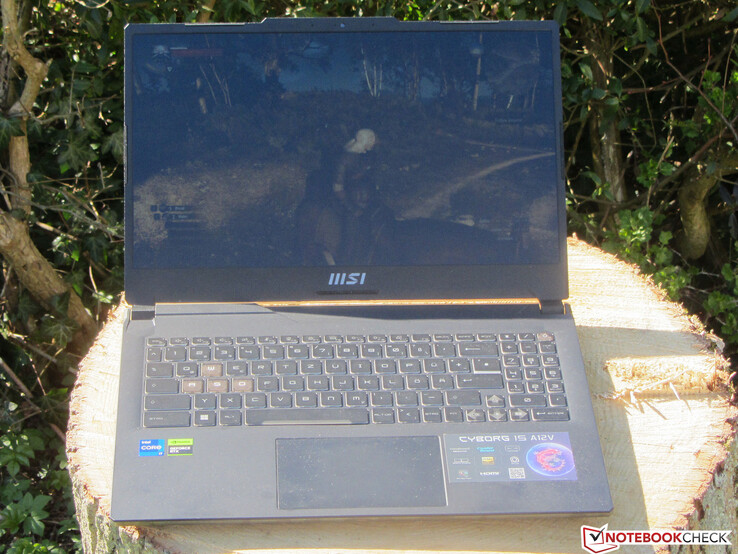
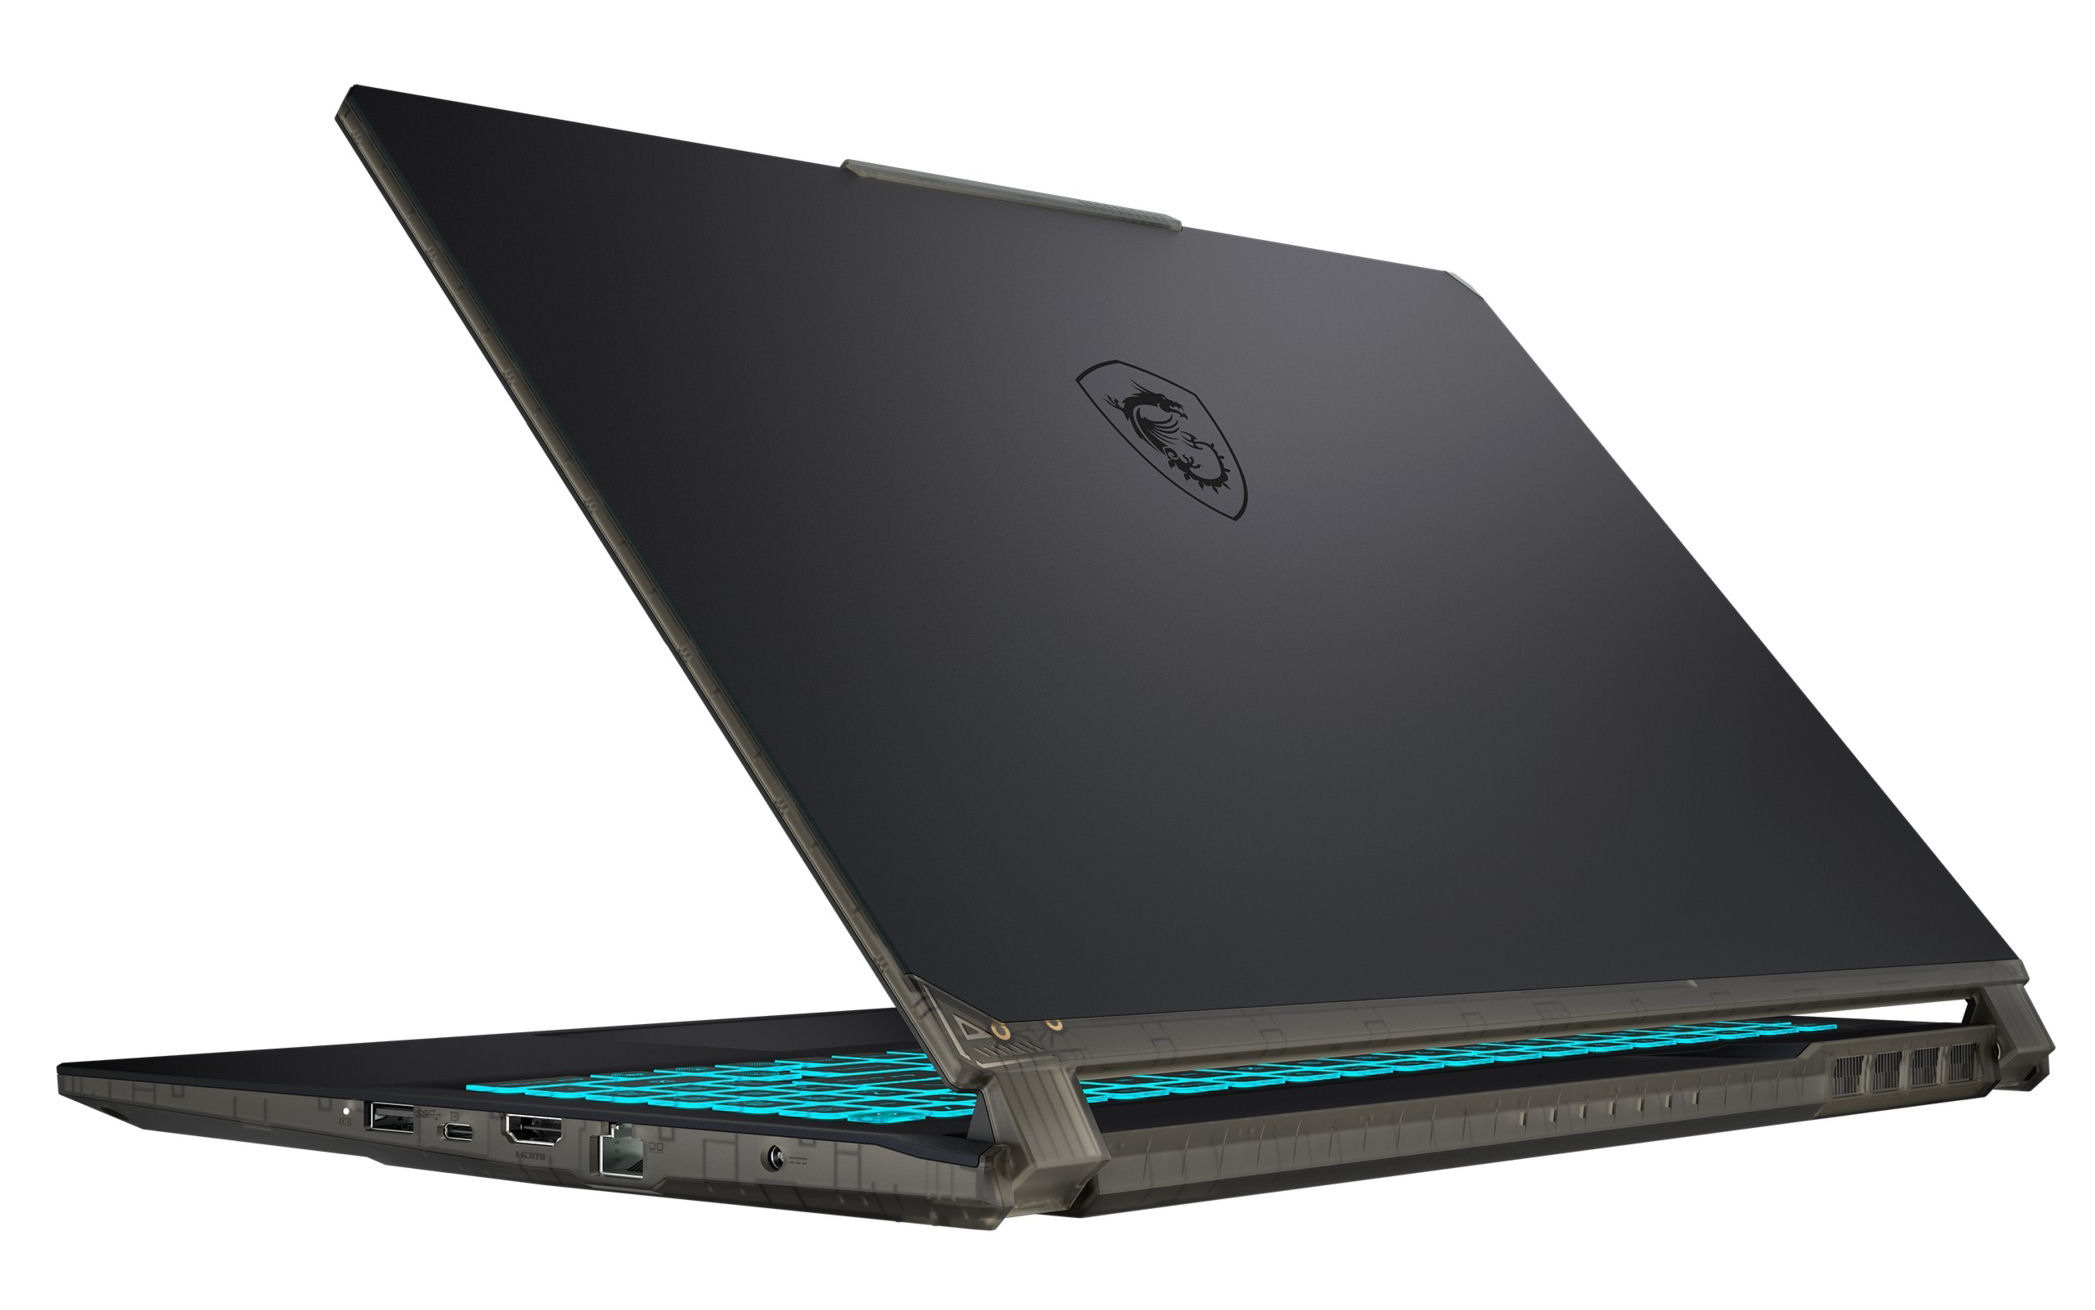
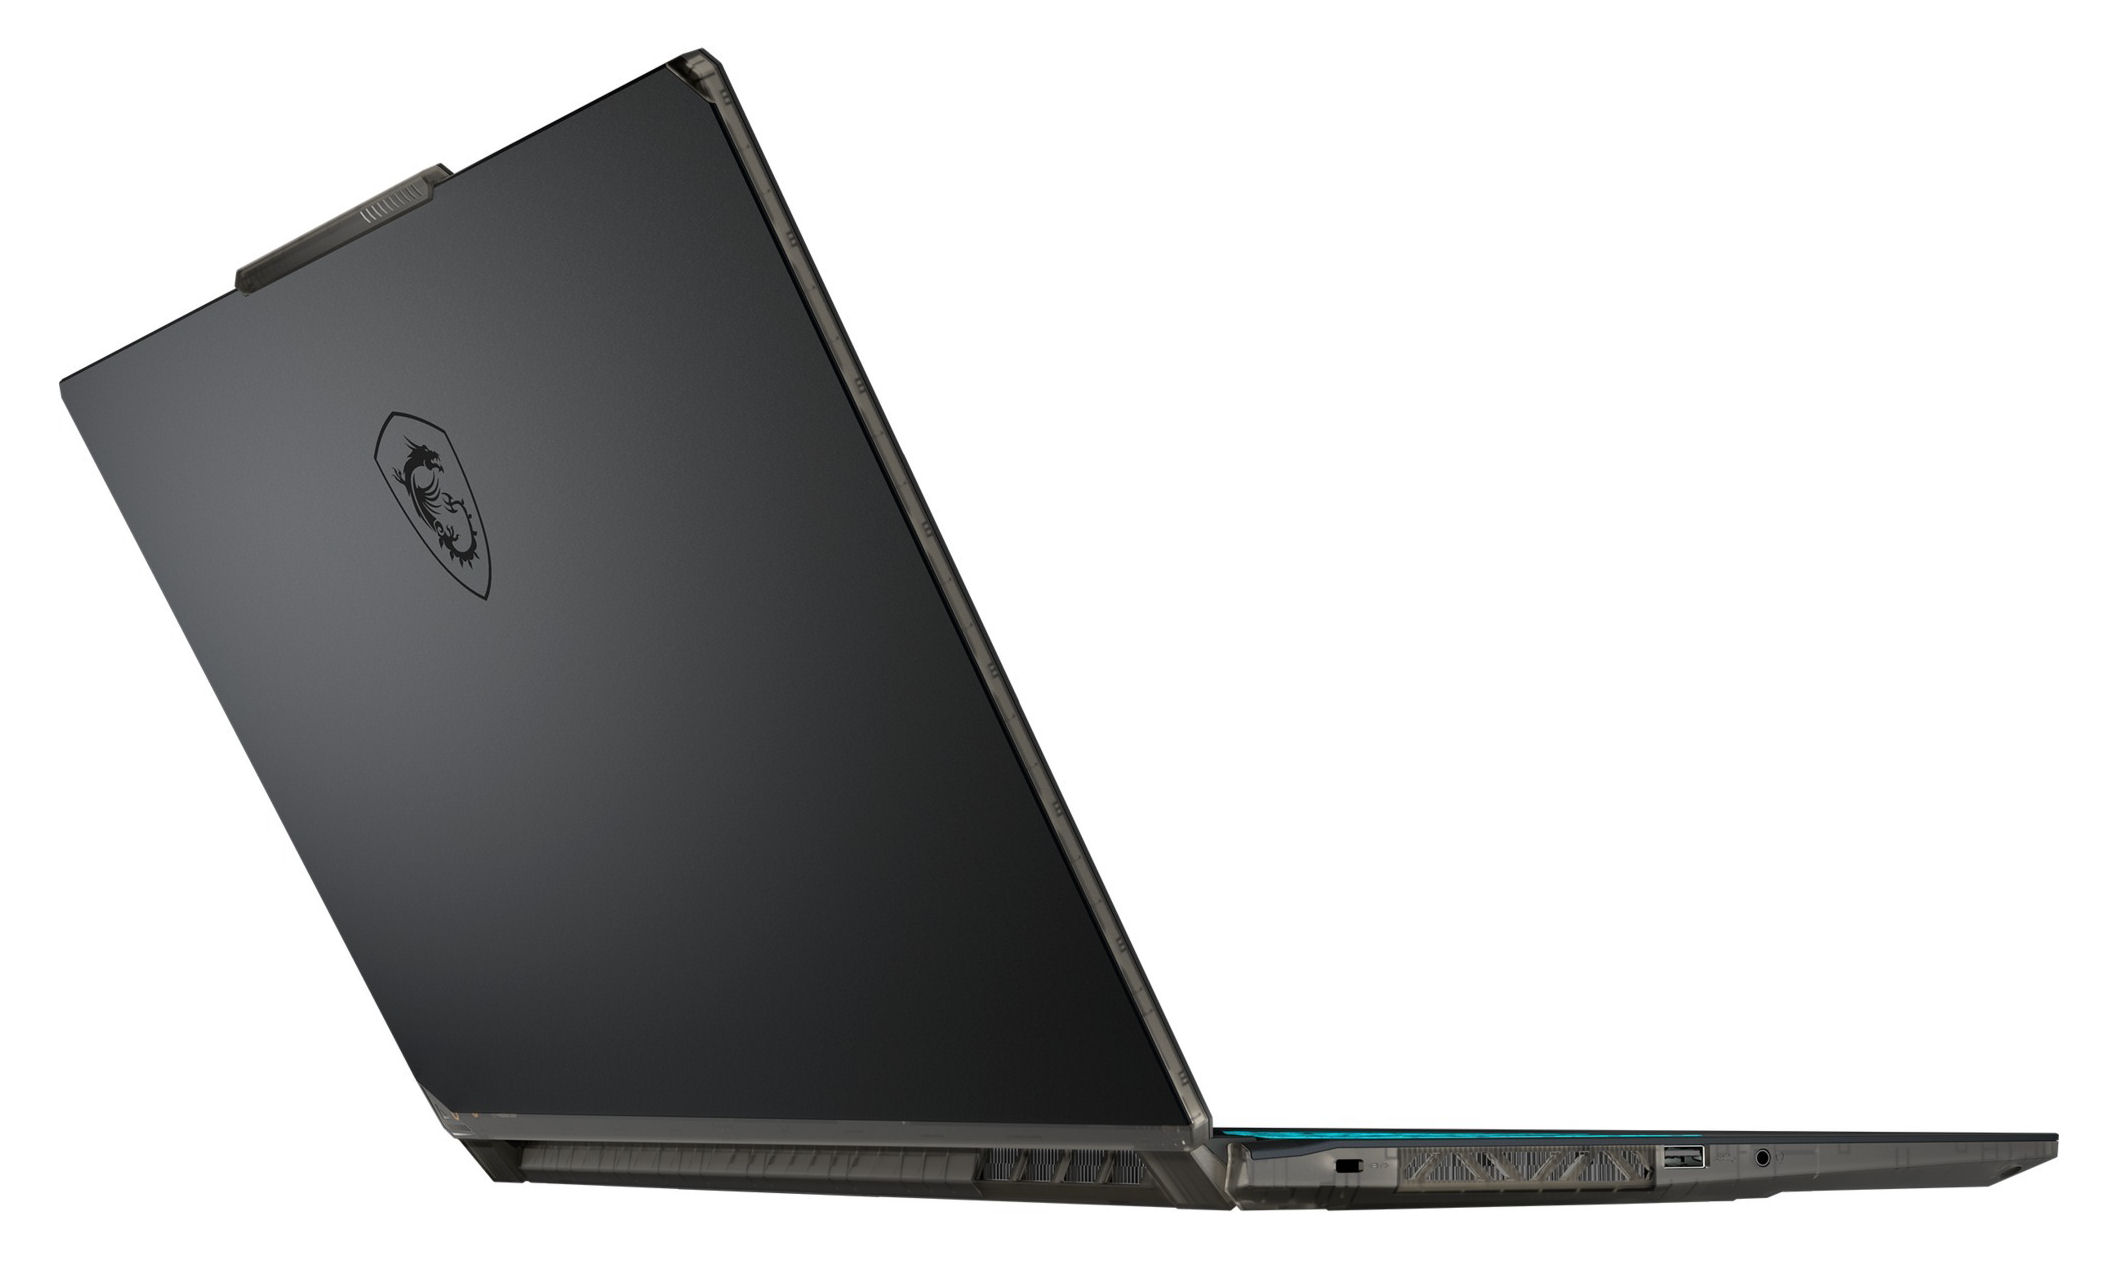
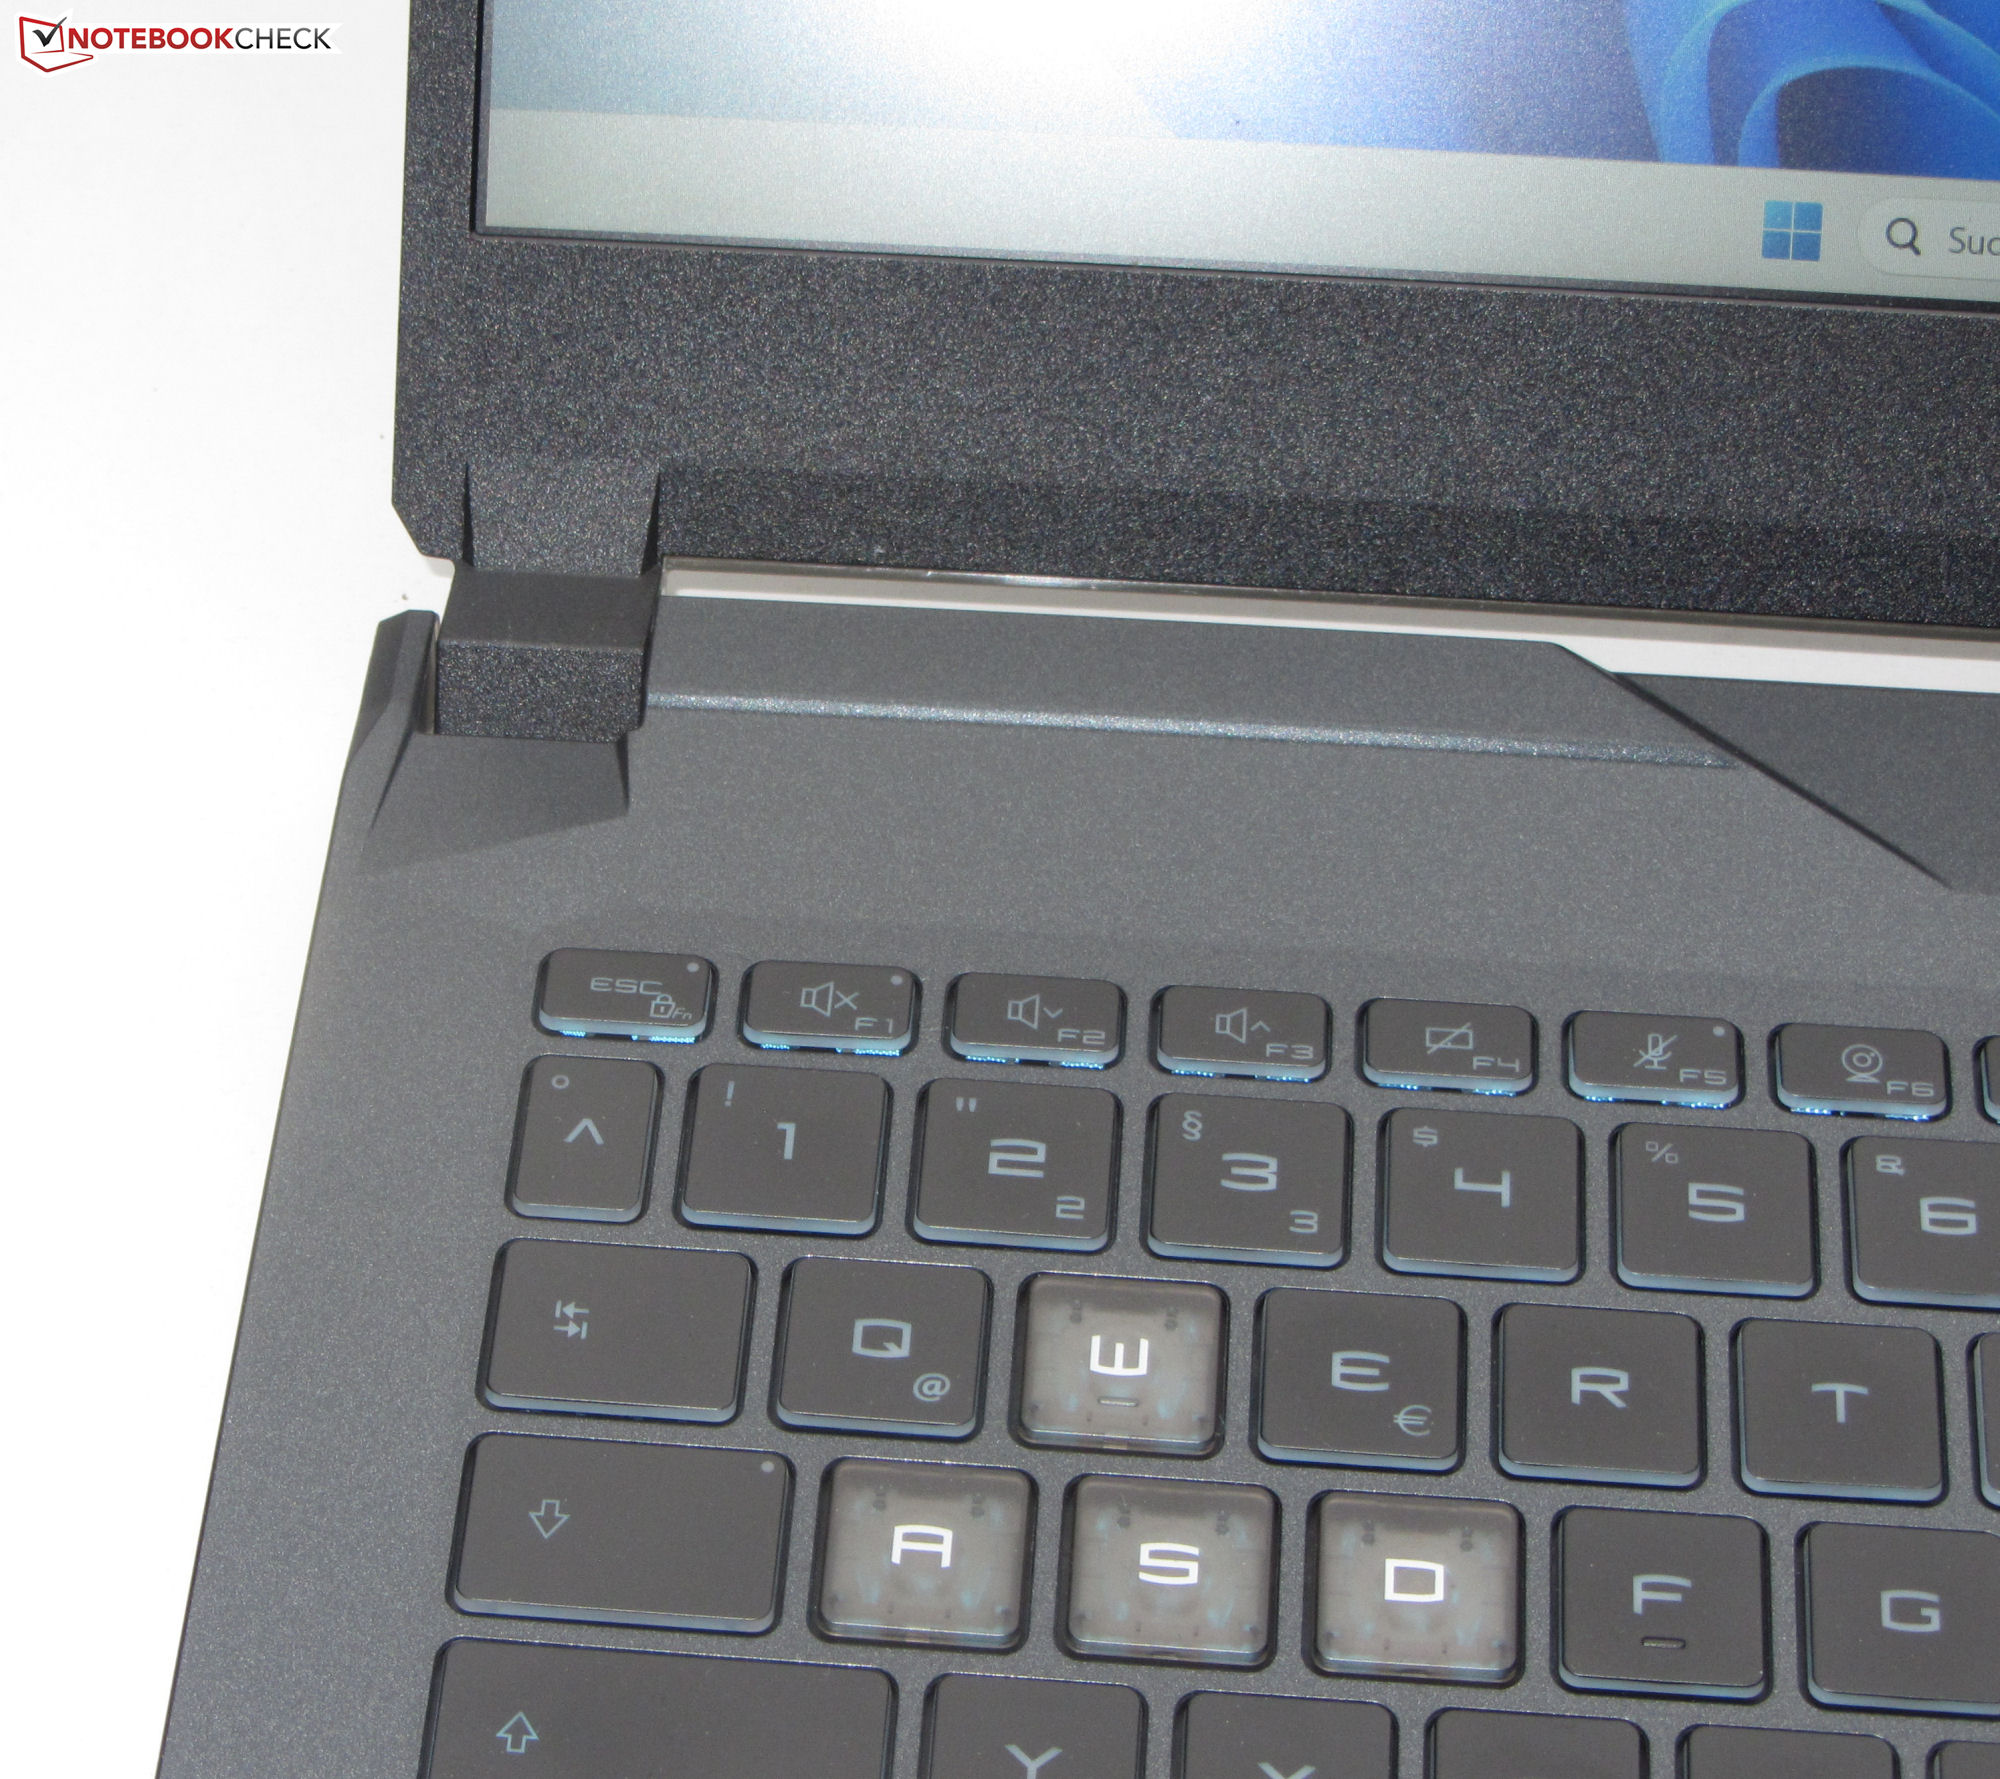
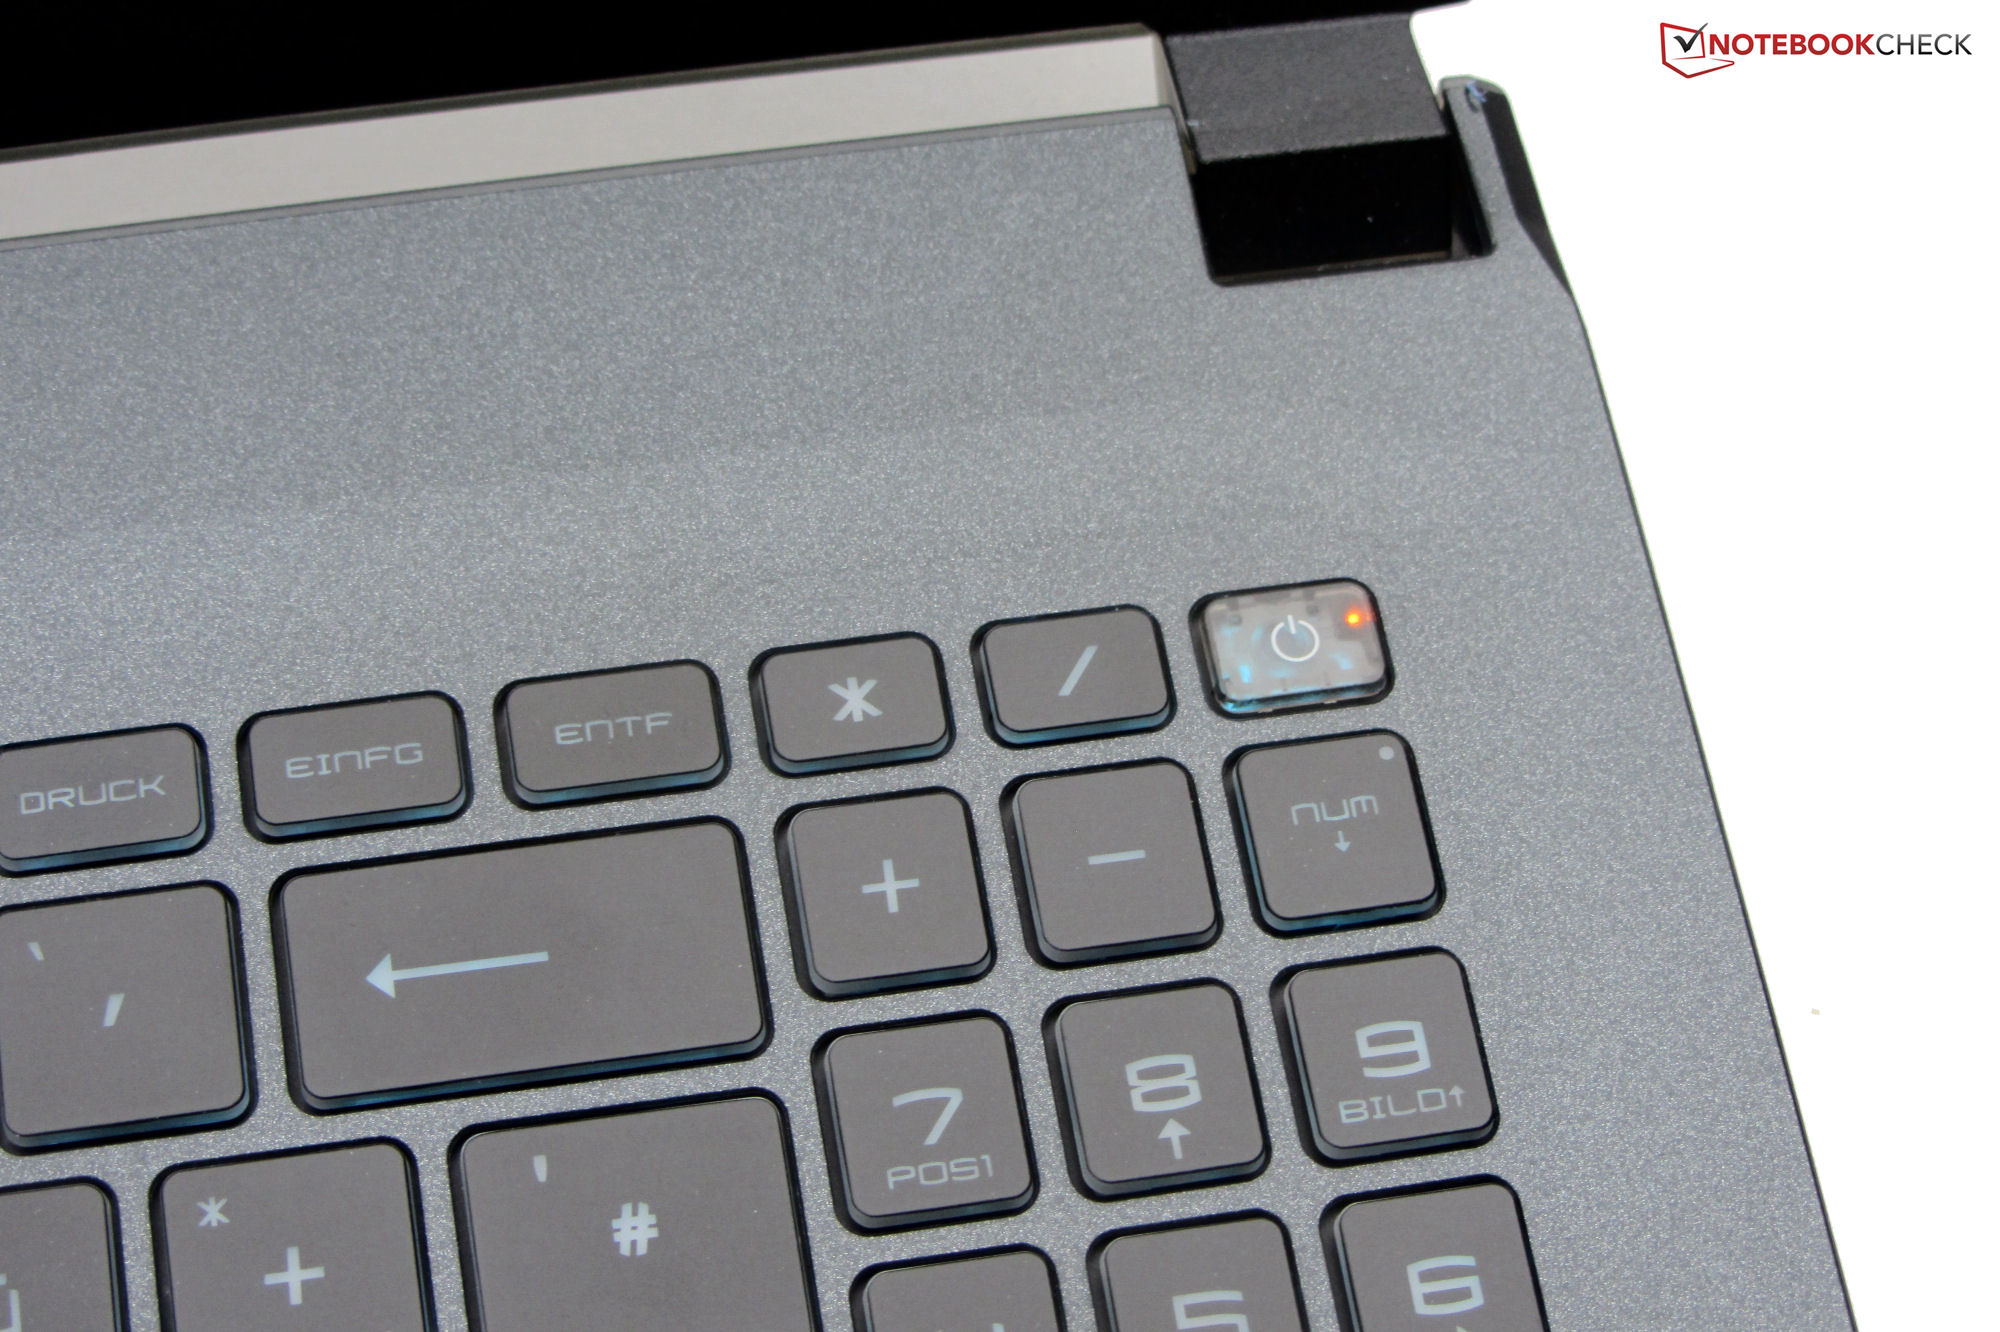
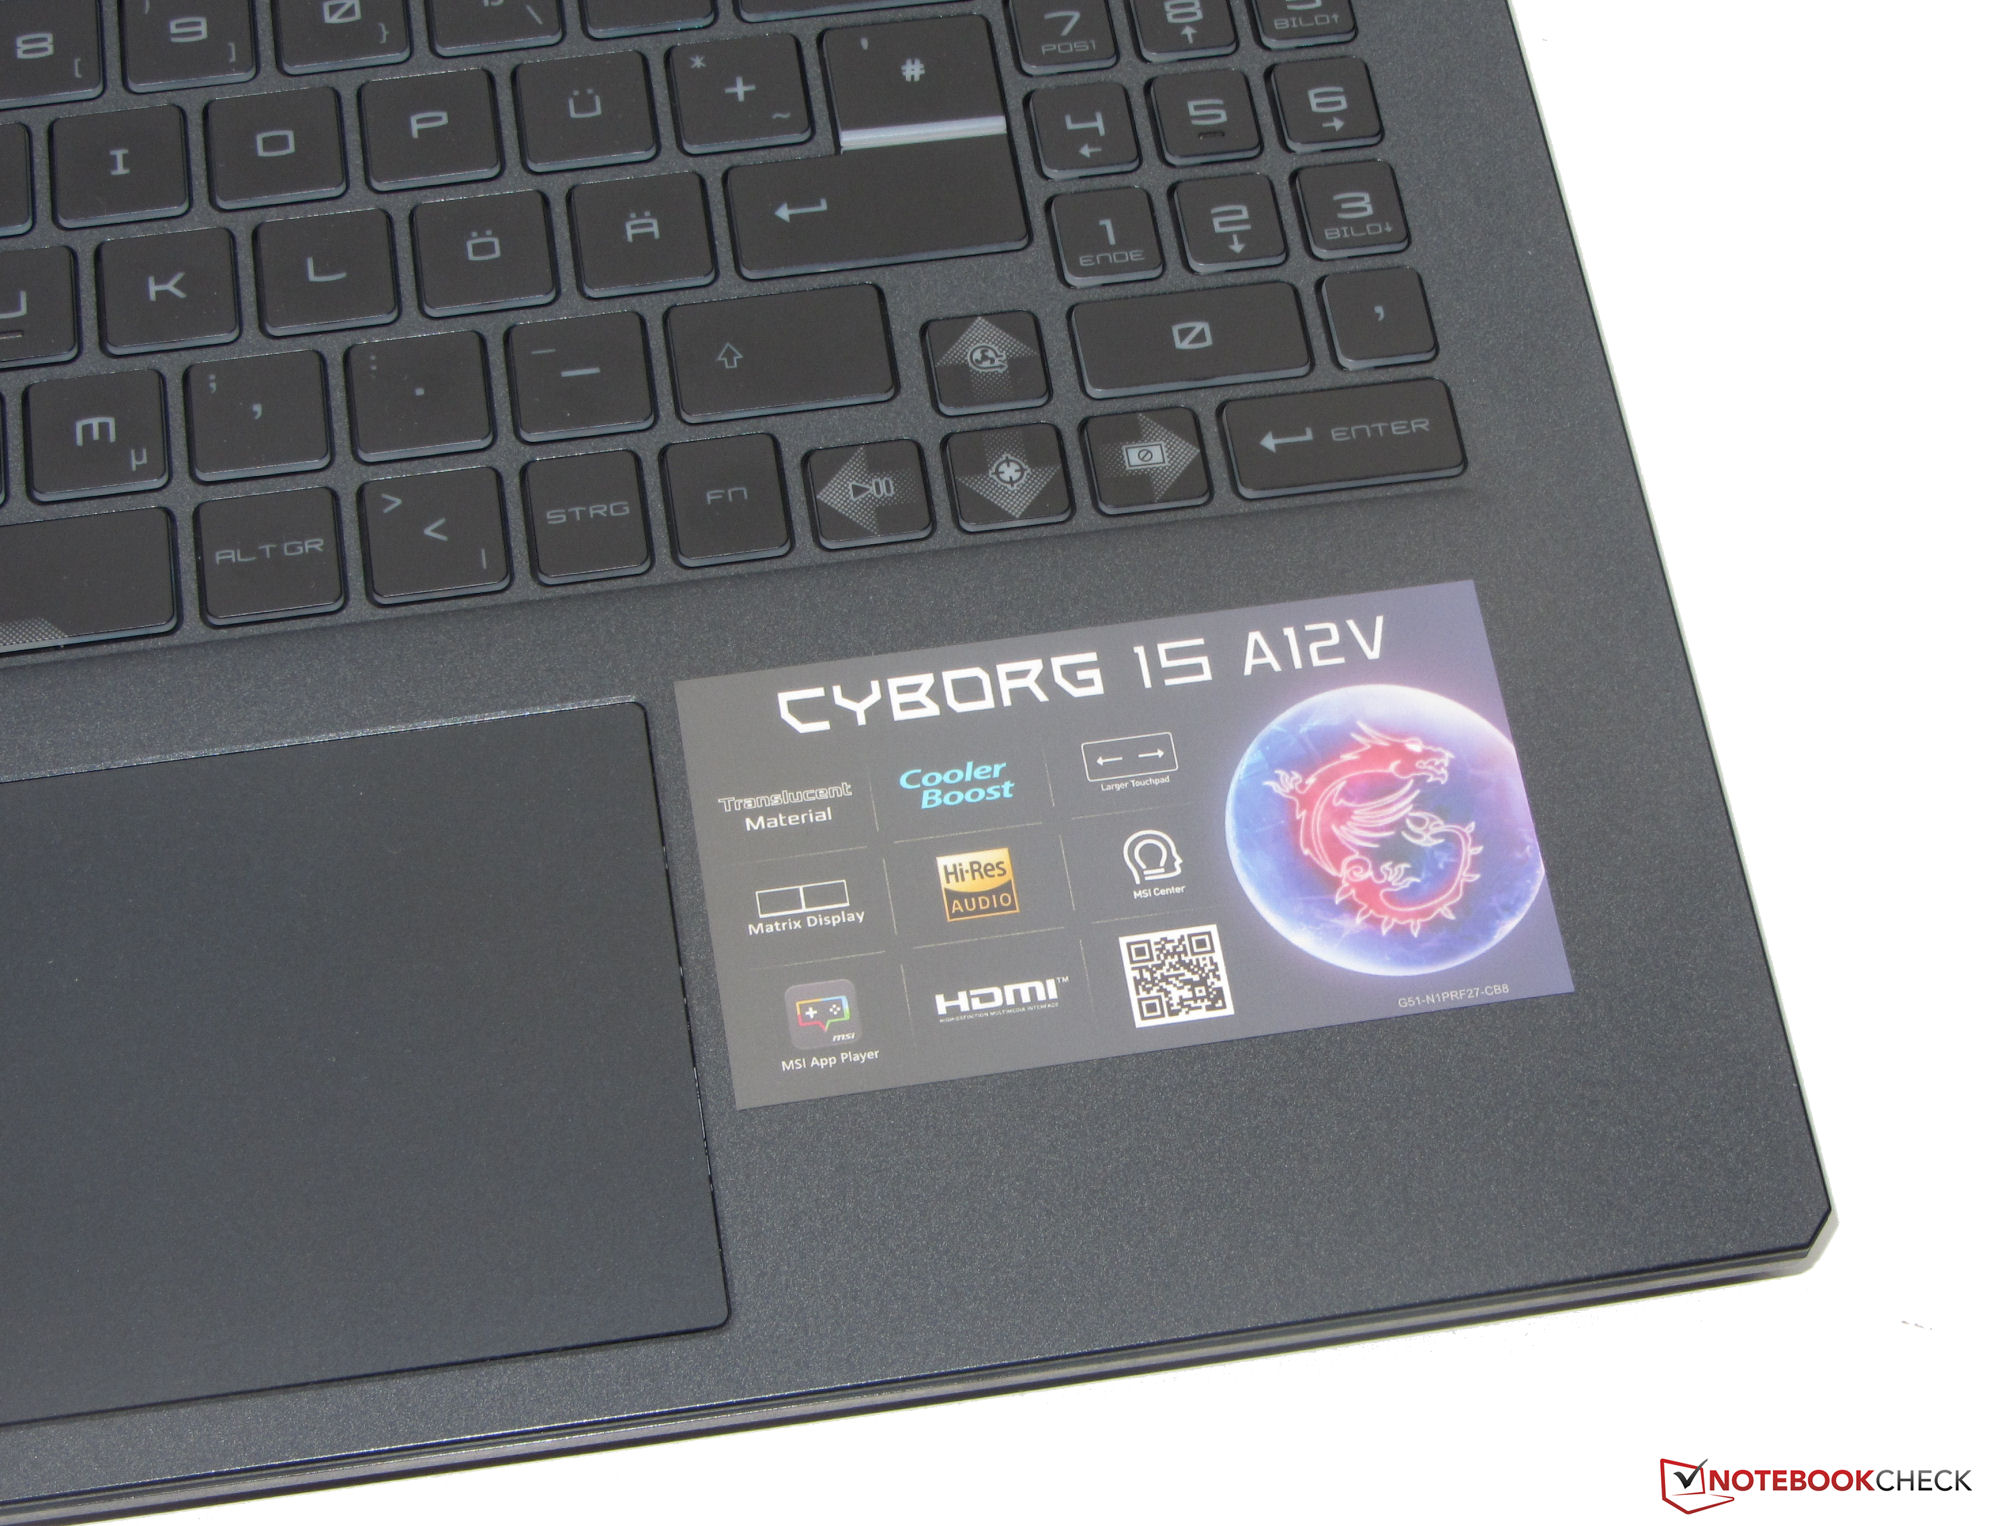
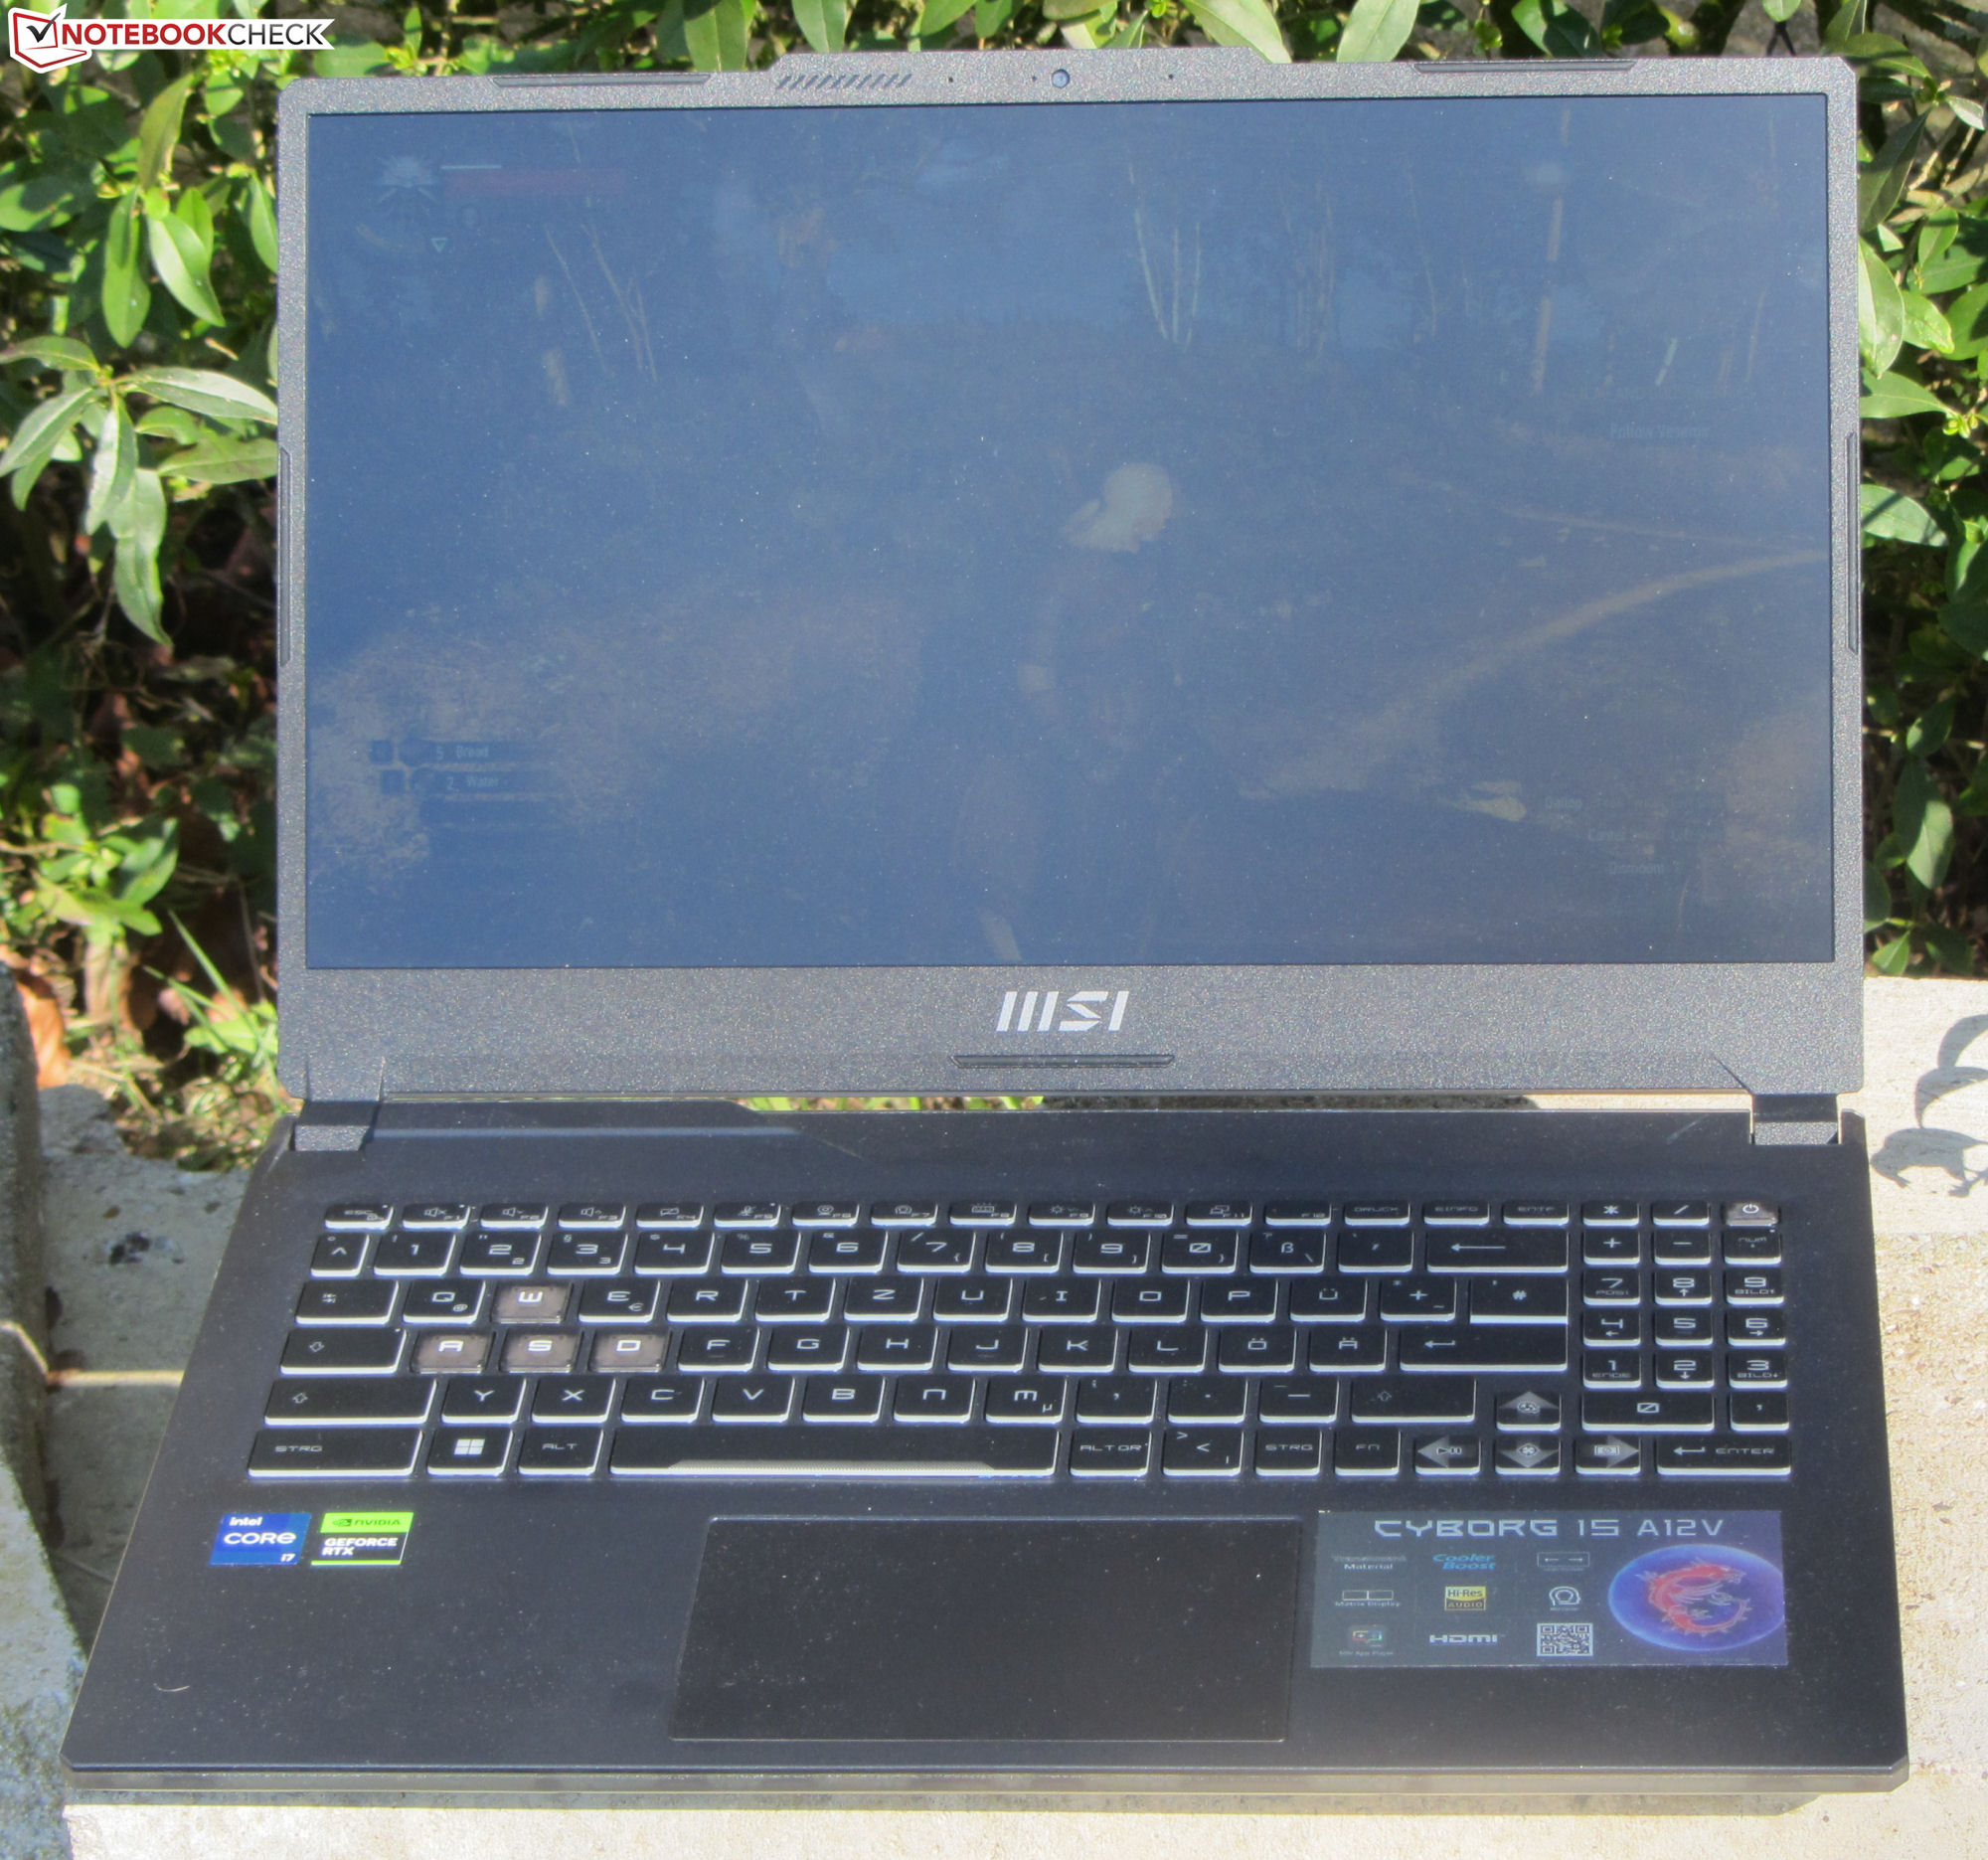
Fodral - A12VF med 180 graders öppningsvinkel
De flesta delar av kompaktfodralet är tillverkade av plast, och metall används endast på baksidan av locket. MSI använder sig av en huvudsakligen diskret design och den bärbara datorn skulle inte se fel ut i professionella kontorsmiljöer. Den svarta grundfärgen luckras upp av några genomskinliga delar av höljet, som t.ex. höljetbotten, och tangentbordsbelysningen i turkosblått ger också lite färg.
Den bärbara datorn avslöjar inga fel i tillverkningen. Spalterna är jämna och vi märker inga materialutsprång. Även om basenheten och locket kan vara skeva håller sig detta inom ramarna. Gångjärnen håller locket stadigt på plats, med en maximal öppningsvinkel på 180 grader. Den bärbara datorn kan öppnas med en enda hand.
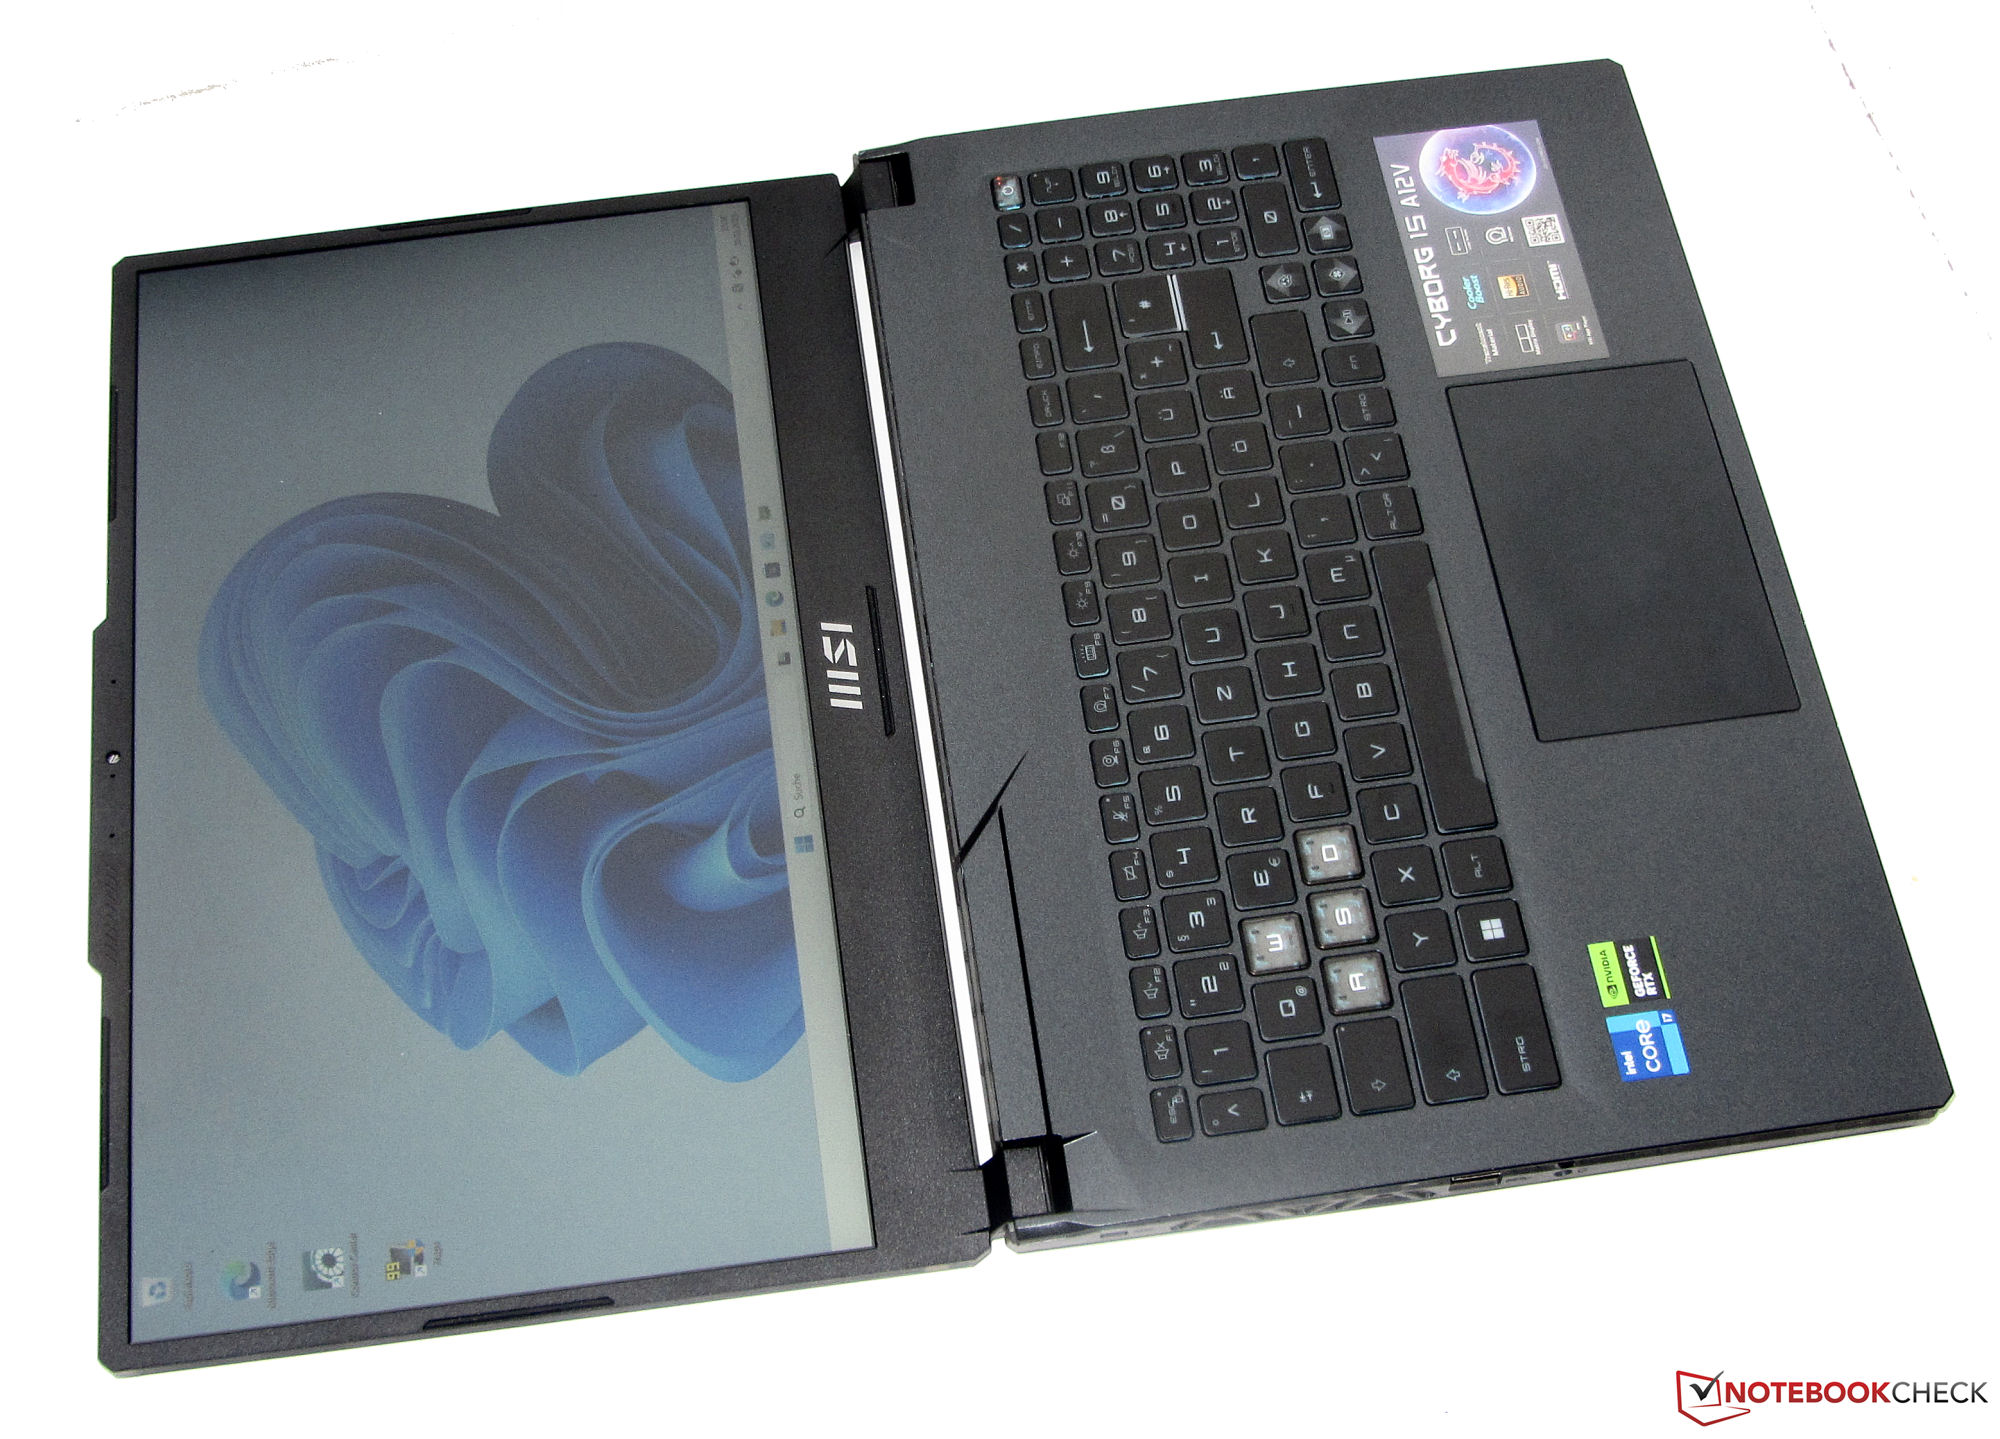
MSI:s bärbara dator har samma mått som konkurrenterna, men är en av de lättare bärbara speldatorerna i 15,6-tumsformatet.
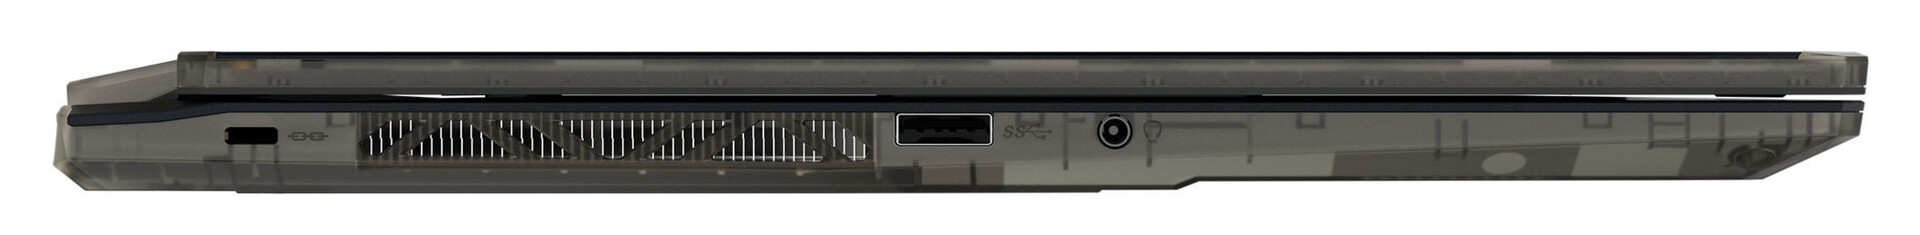
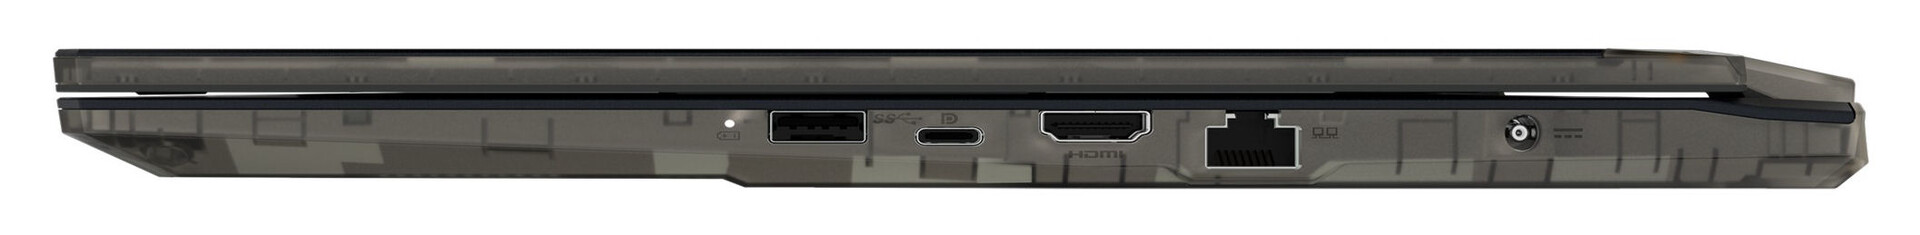
Utrustning - MSI:s bärbara dator har ingen Thunderbolt-anslutning
Anslutningsutrustningen är begränsad, med två tillgängliga USB-A-portar (USB 3.2 Gen 1) och en enda USB-C-port (USB 3.2 Gen 1). Den sistnämnda har även stöd för DisplayPort. Tillsammans finns det två videoutgångsalternativ (1x DP, 1x HDMI). Dessutom finns det en kombinerad ljudport, en Gigabit Ethernet-port och en öppning för ett kabellås. En läsare för lagringskort finns inte tillgänglig.
Kommunikation
Överföringshastigheterna för WLAN som bestämts under optimala förhållanden (utan ytterligare WLAN-enheter i närheten och med ett kort avstånd mellan den bärbara datorn och serverdatorn) är utmärkta och motsvarar kapaciteten hos WLAN-chippet (Intel AX201). Trådbundna nätverksanslutningar hanteras av ett Gigabit Ethernet-chip (RTL8168/8111; 1 Gbit/s) från Realtek.
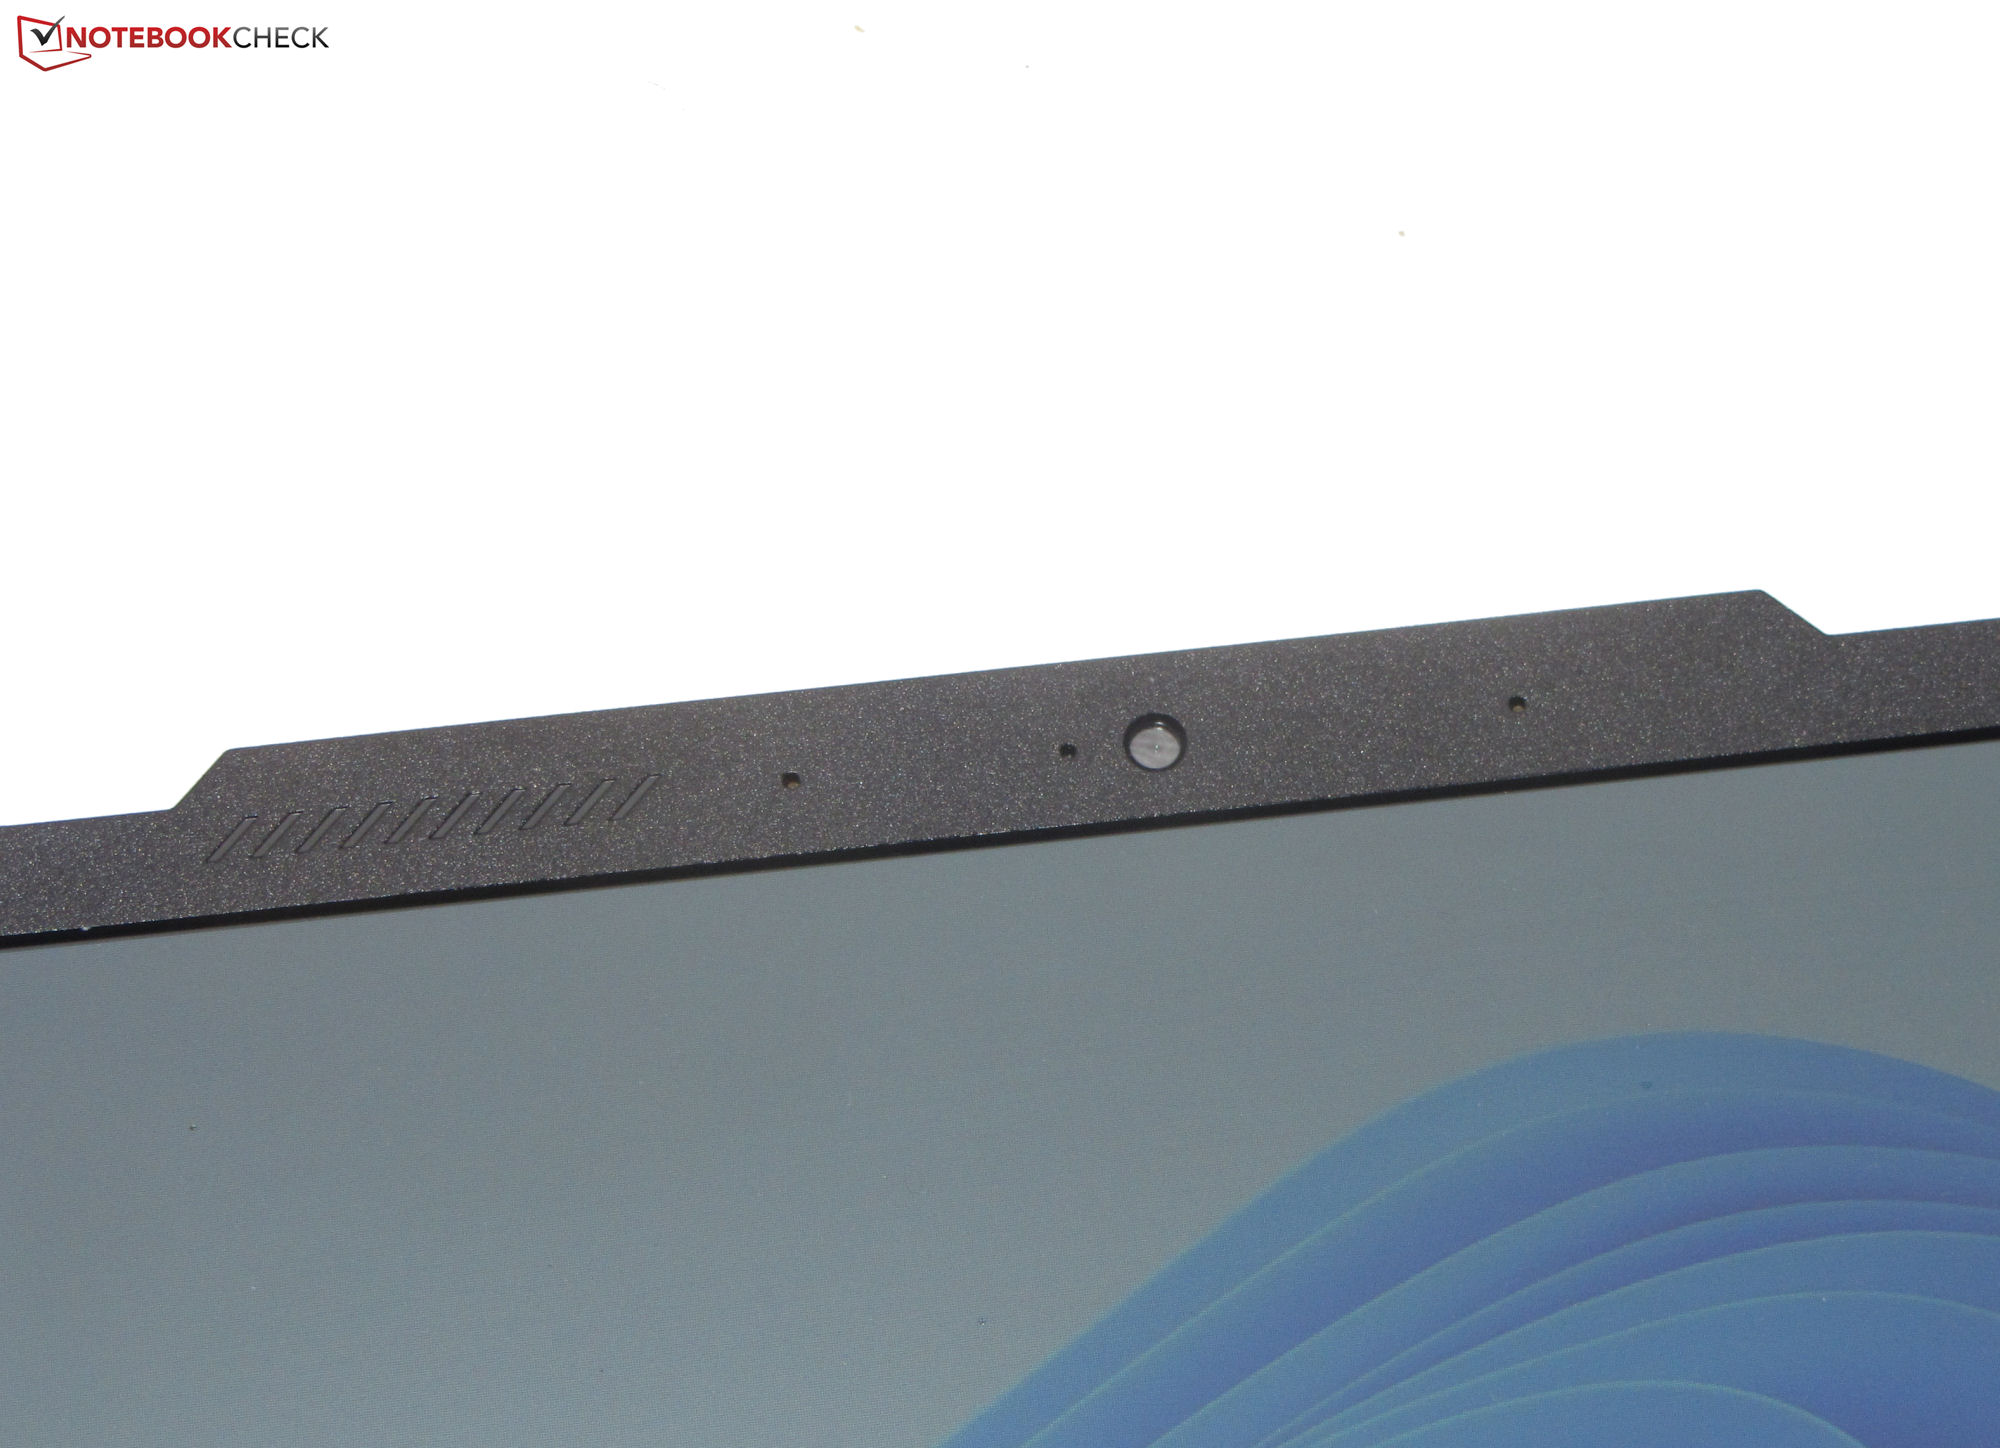
Webbkamera
Webbkameran (0,9 MP, max. 1 280 x 720 pixlar) har inget mekaniskt skydd. Den kvalitet som den levererar är standard. Färgnoggrannheten är bristfällig, och med en färgavvikelse på cirka 16 missas målet DeltaE < 3.


Tillbehör
Den bärbara datorn innehåller inga ytterligare tillbehör förutom den vanliga dokumentationen (snabbstartsinstruktioner och garantiinformation).
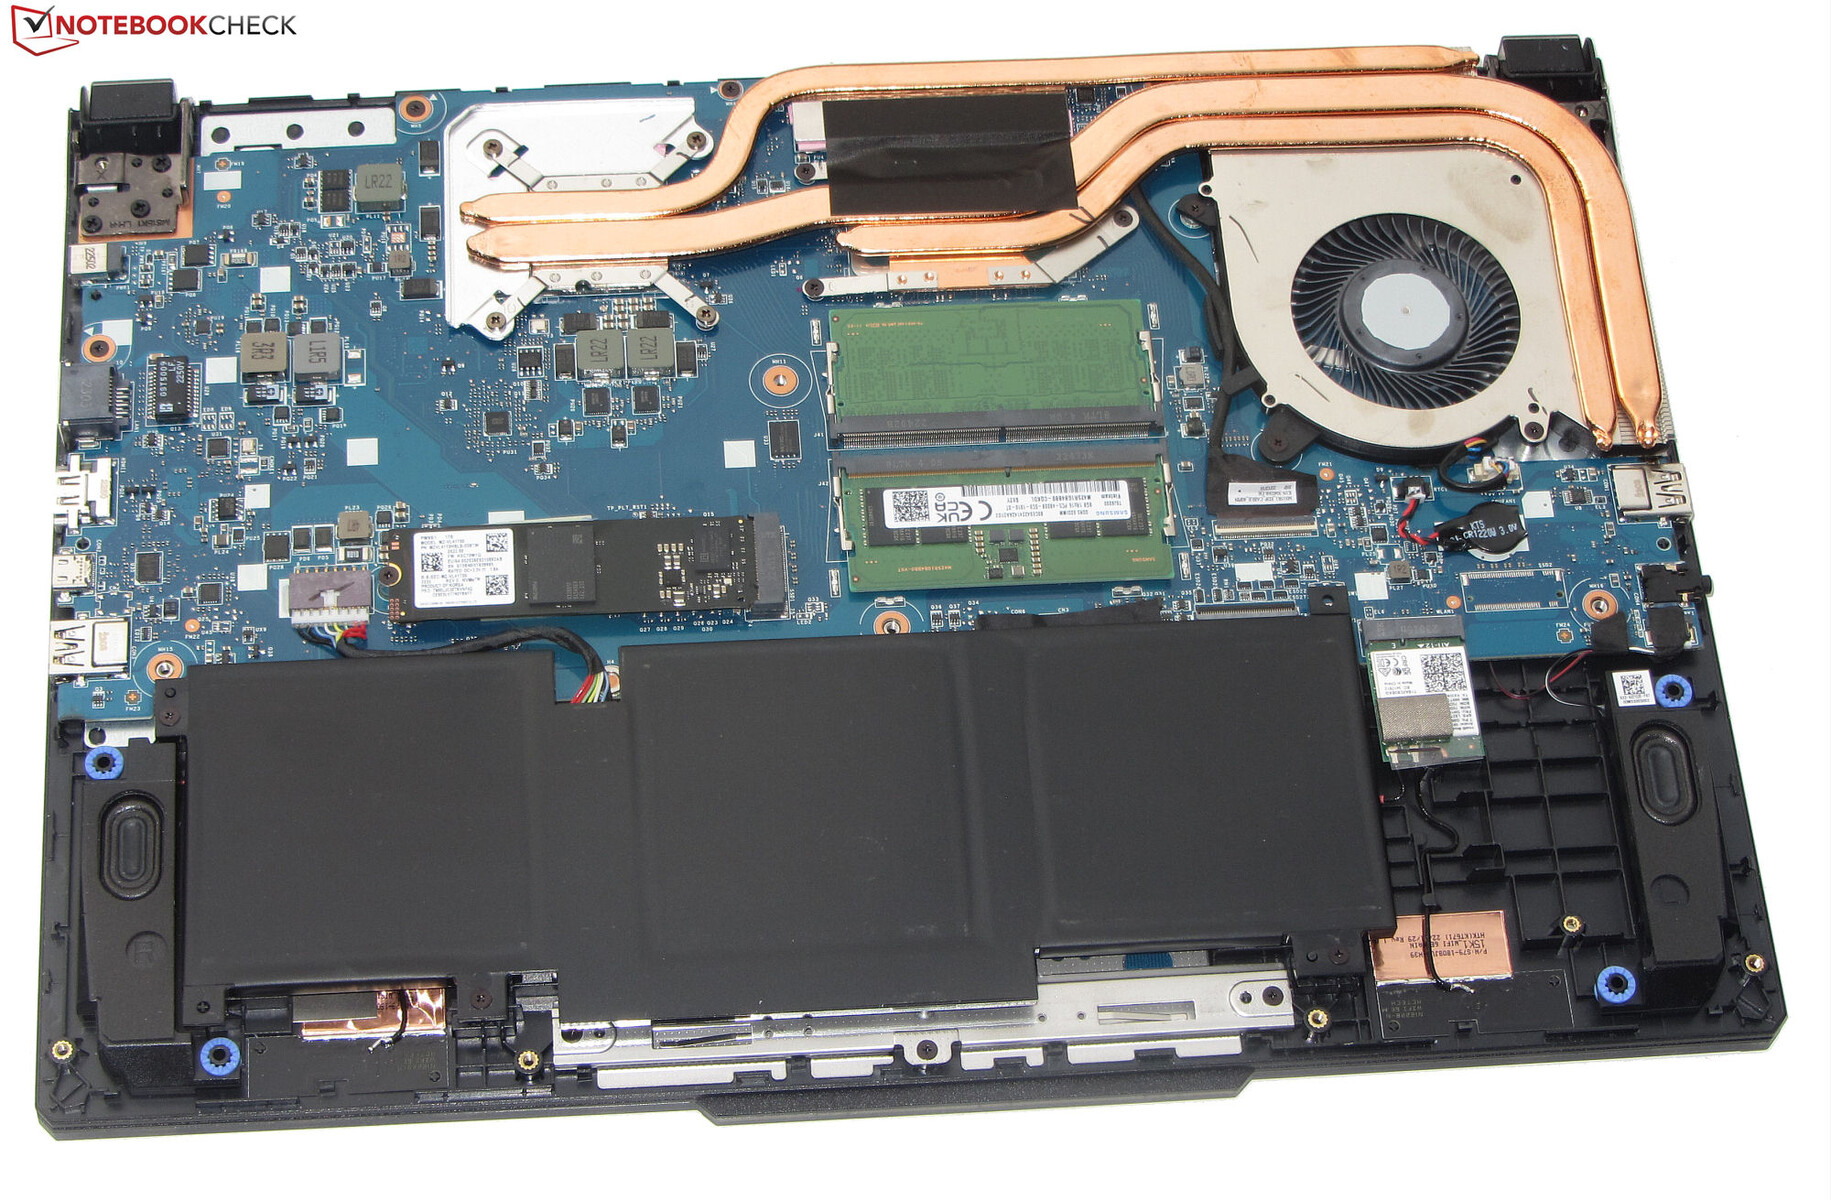
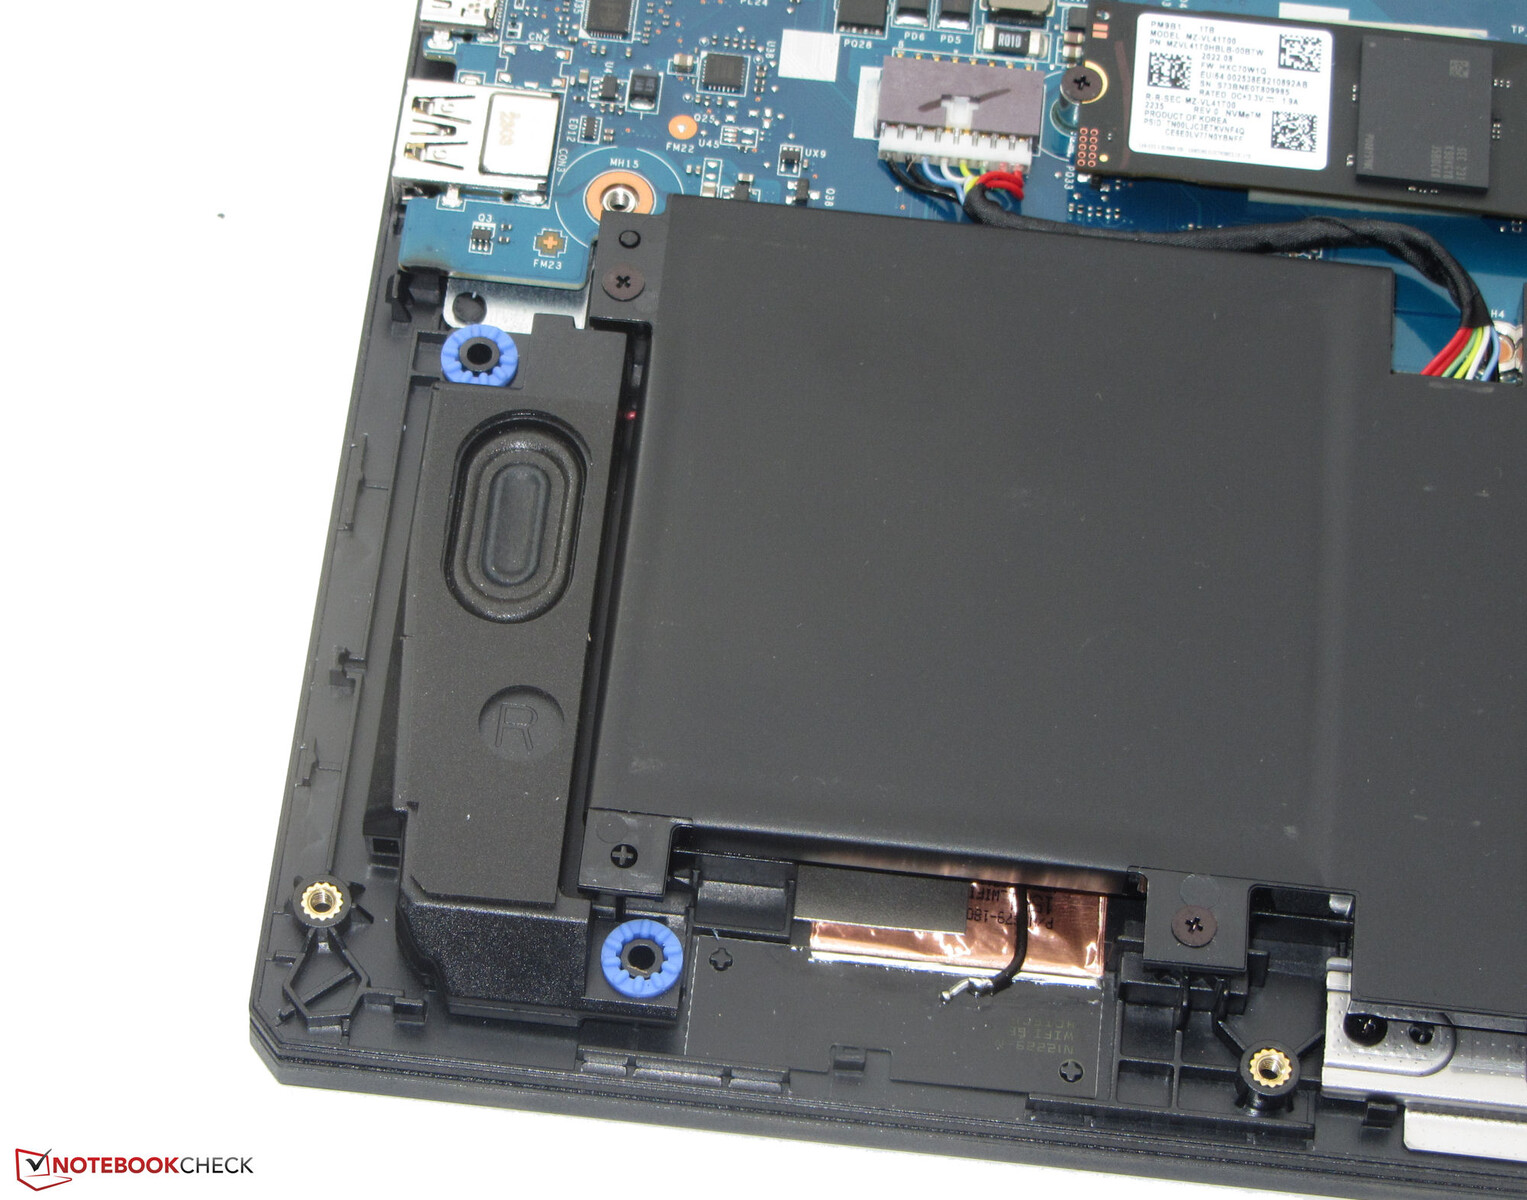
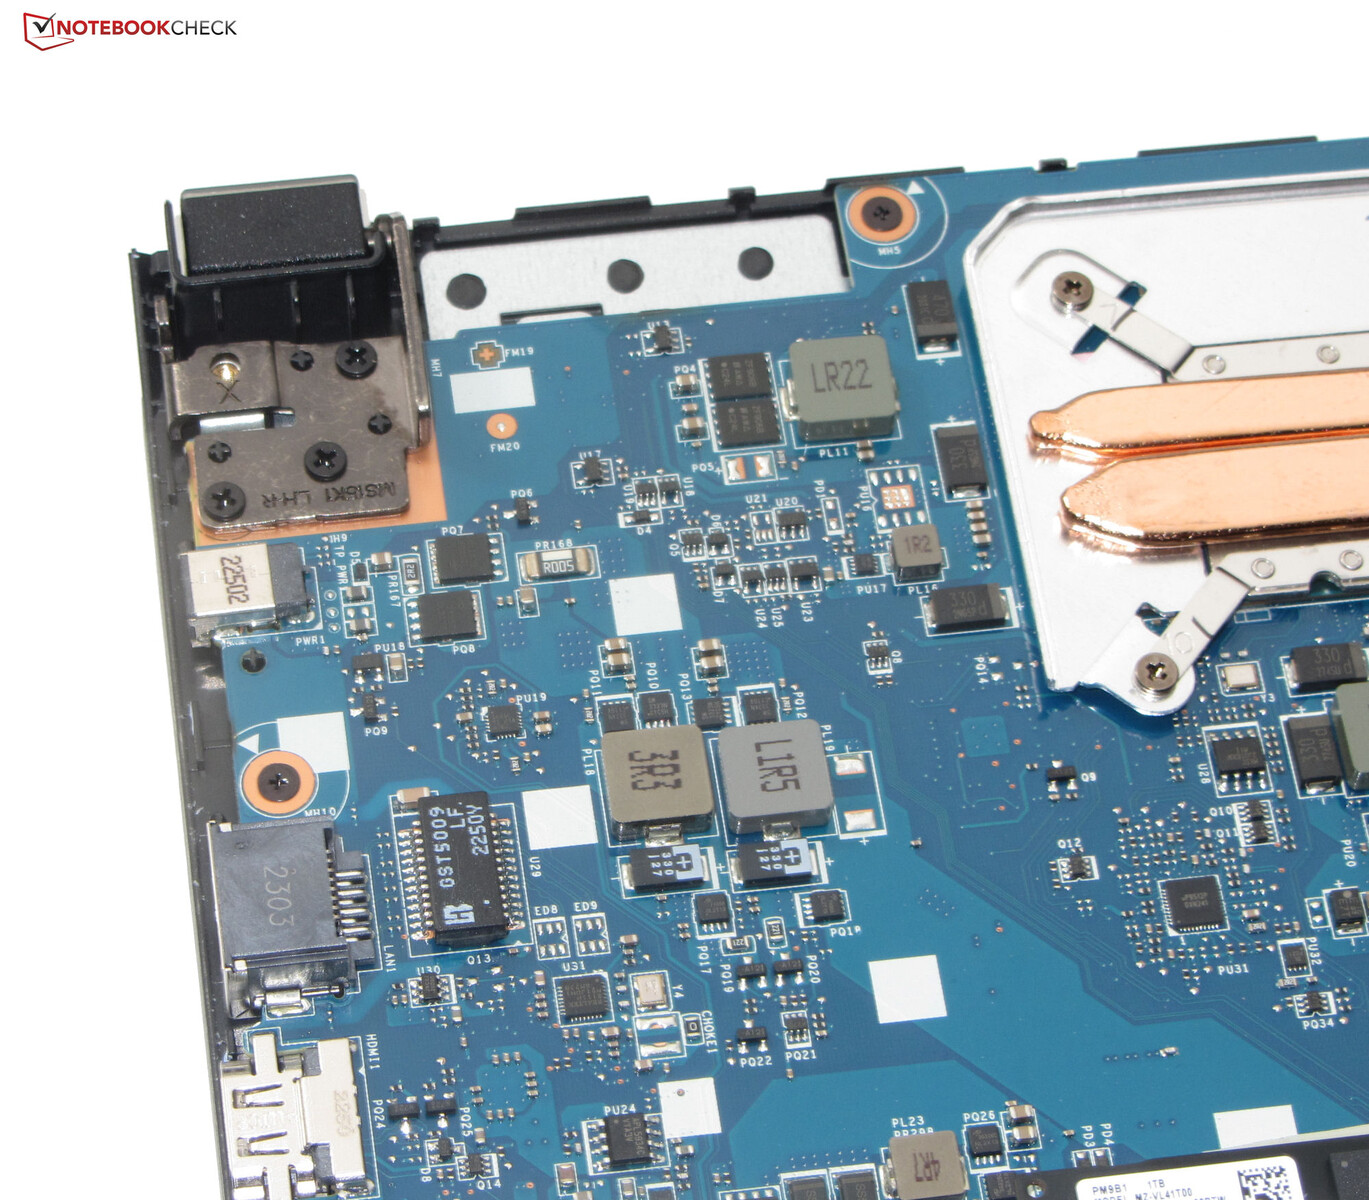
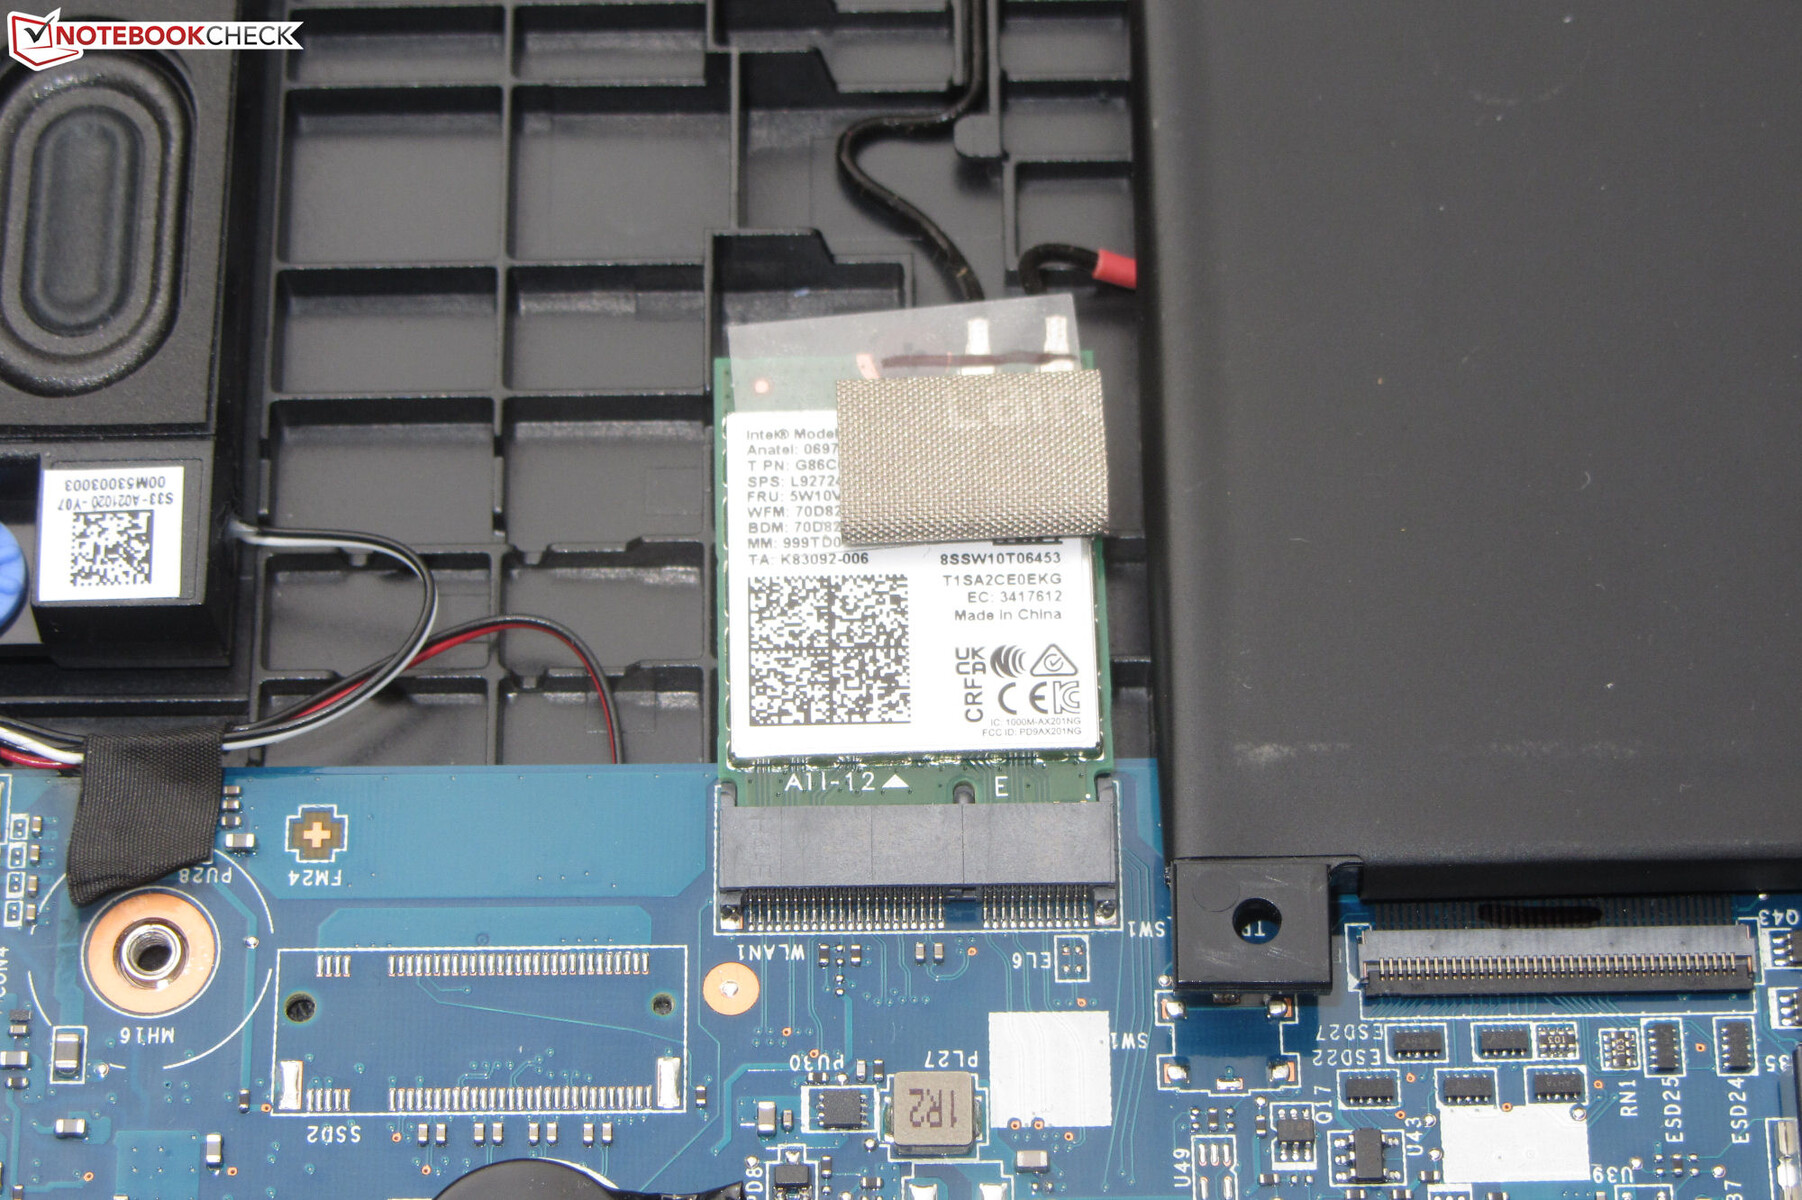
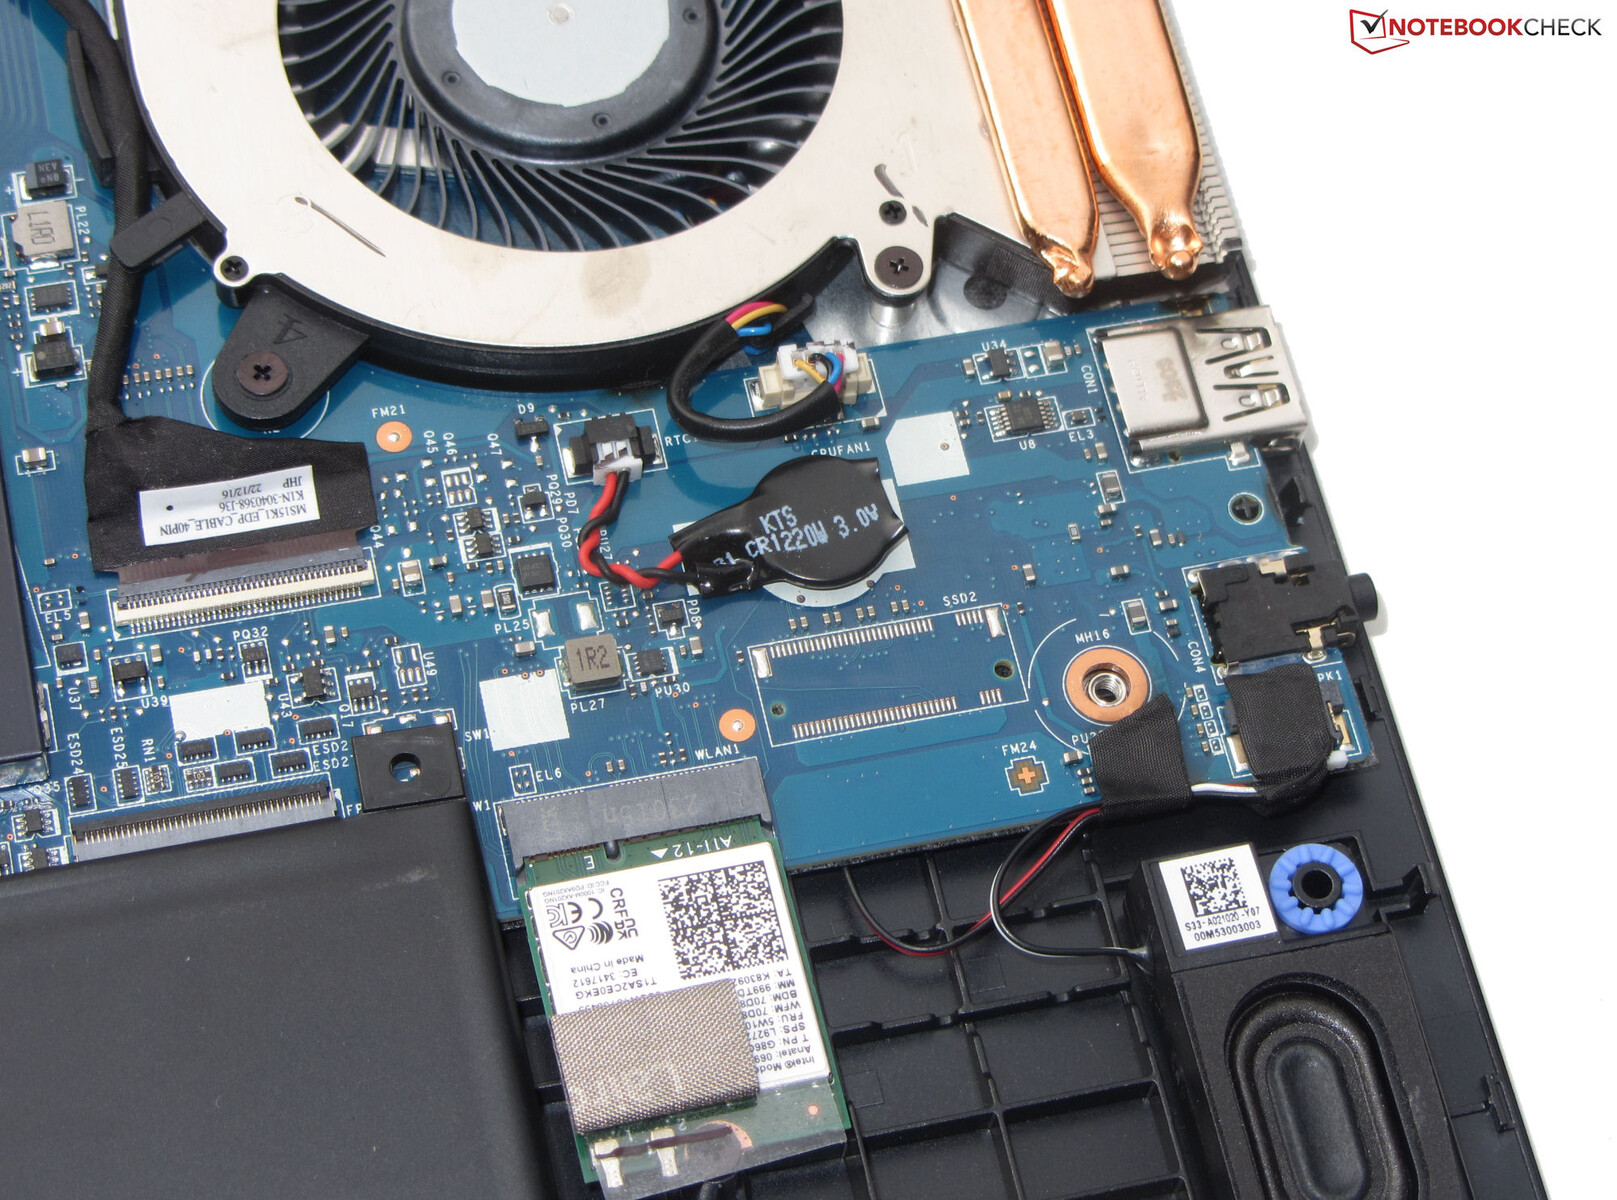
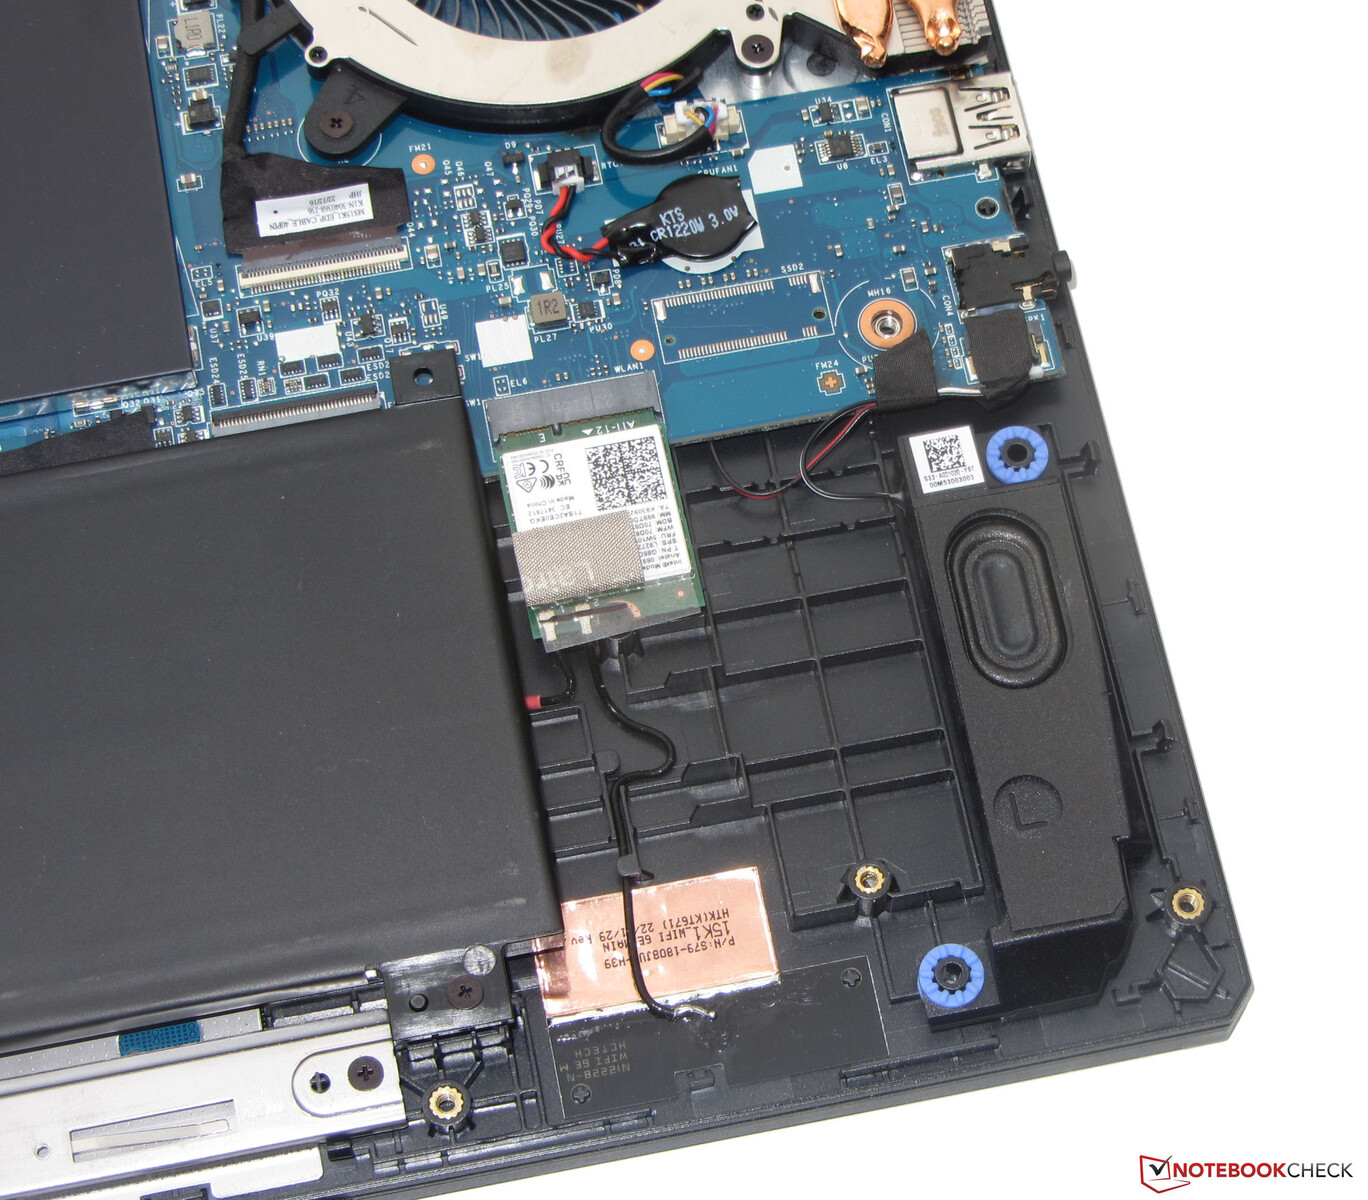
Underhåll
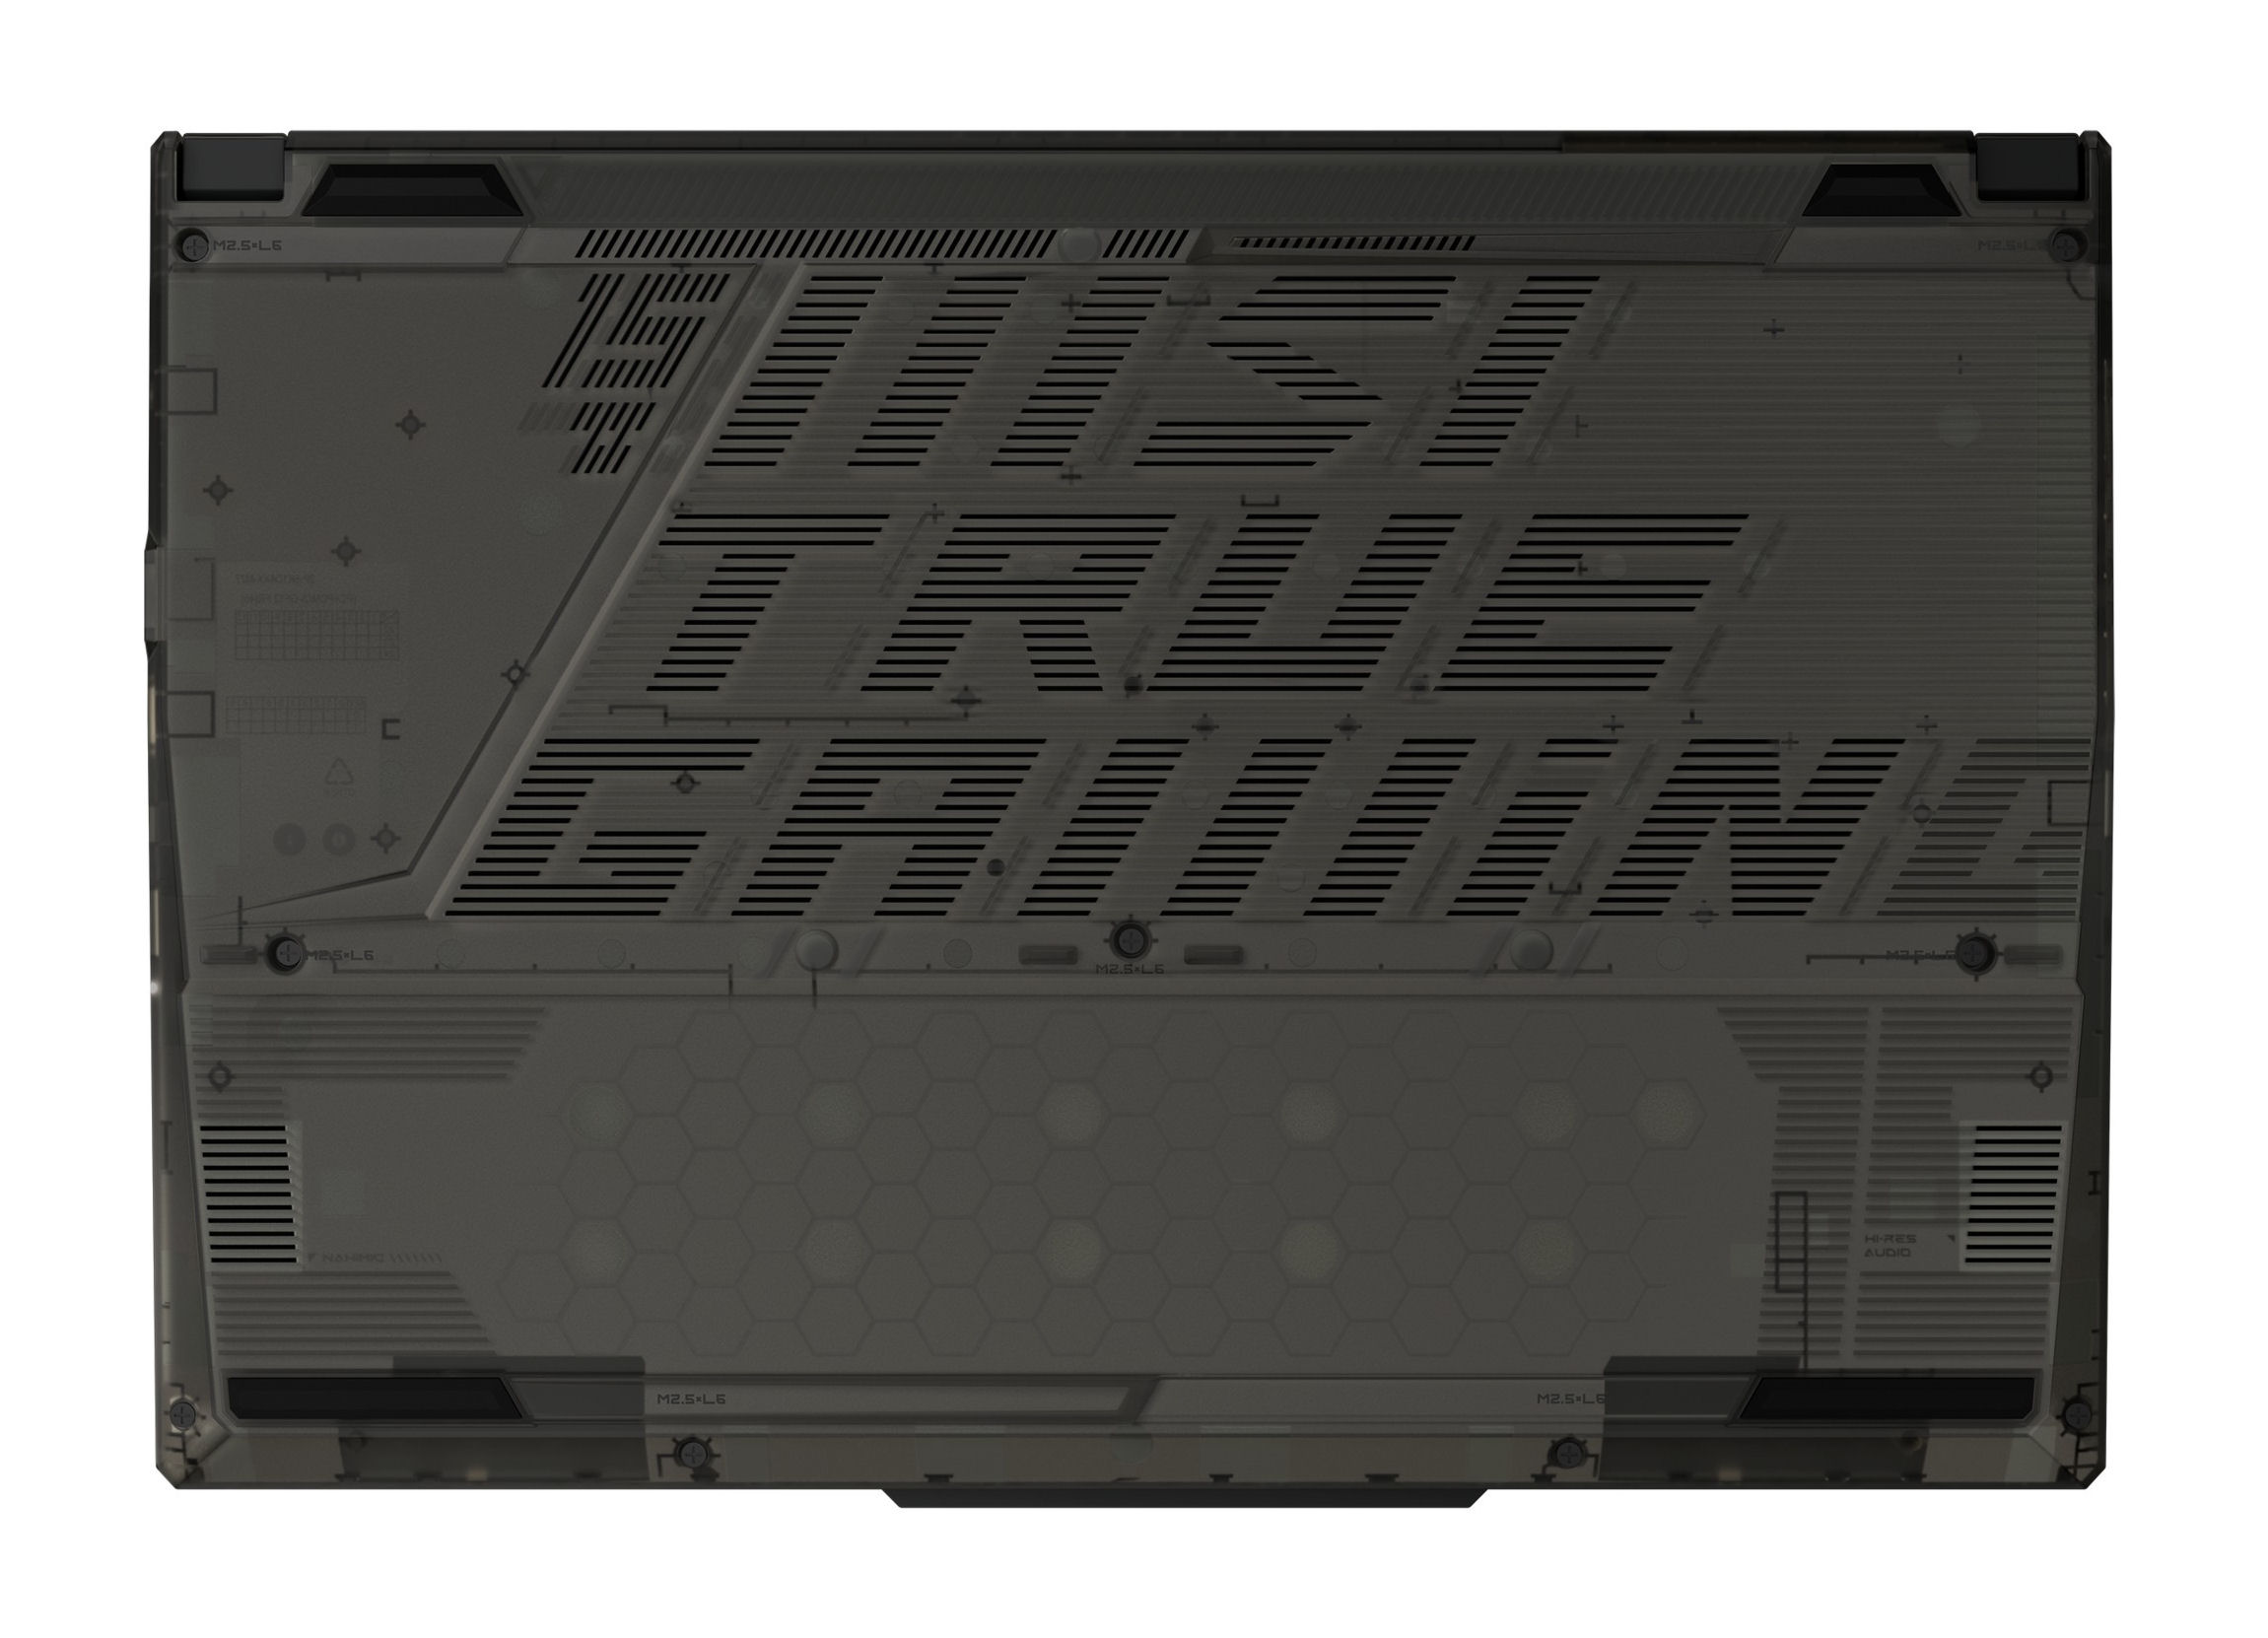
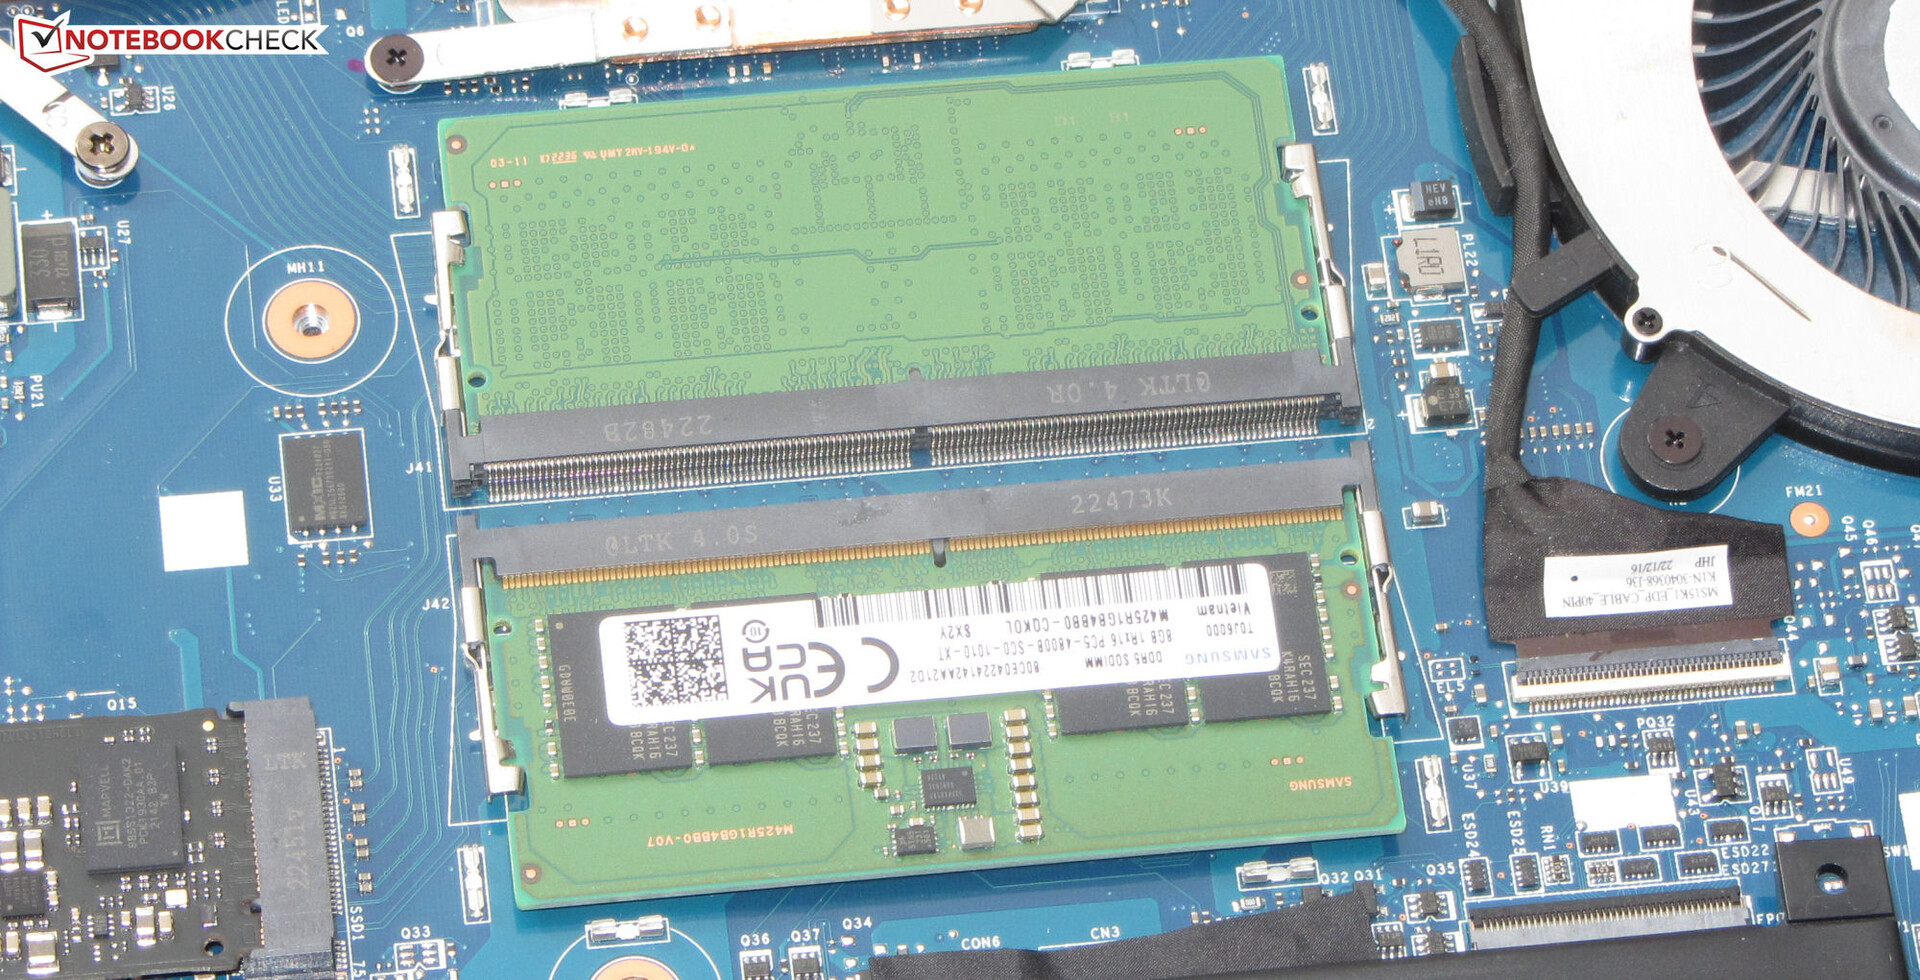
När du har tagit bort alla skruvar på botten kan du ta bort botten av höljet med hjälp av ett litet verktyg eller en spatel. Men du måste vara försiktig, eftersom den hålls av ganska fasta plastklämmor. Efter att ha tagit bort botten får du tillgång till arbetsminnesbankerna (båda upptagna), SSD (PCIe 4), BIOS-batteri, WLAN-modul, fläkt, högtalare och batteri.
Garanti
MSI erbjuder en tvåårig garantiperiod för den bärbara 15,6-tumsdatorn i Tyskland. Du kan också köpa en garantiförlängning med ett eller två år för cirka 120 och 250 euro (~133 och 276 dollar).
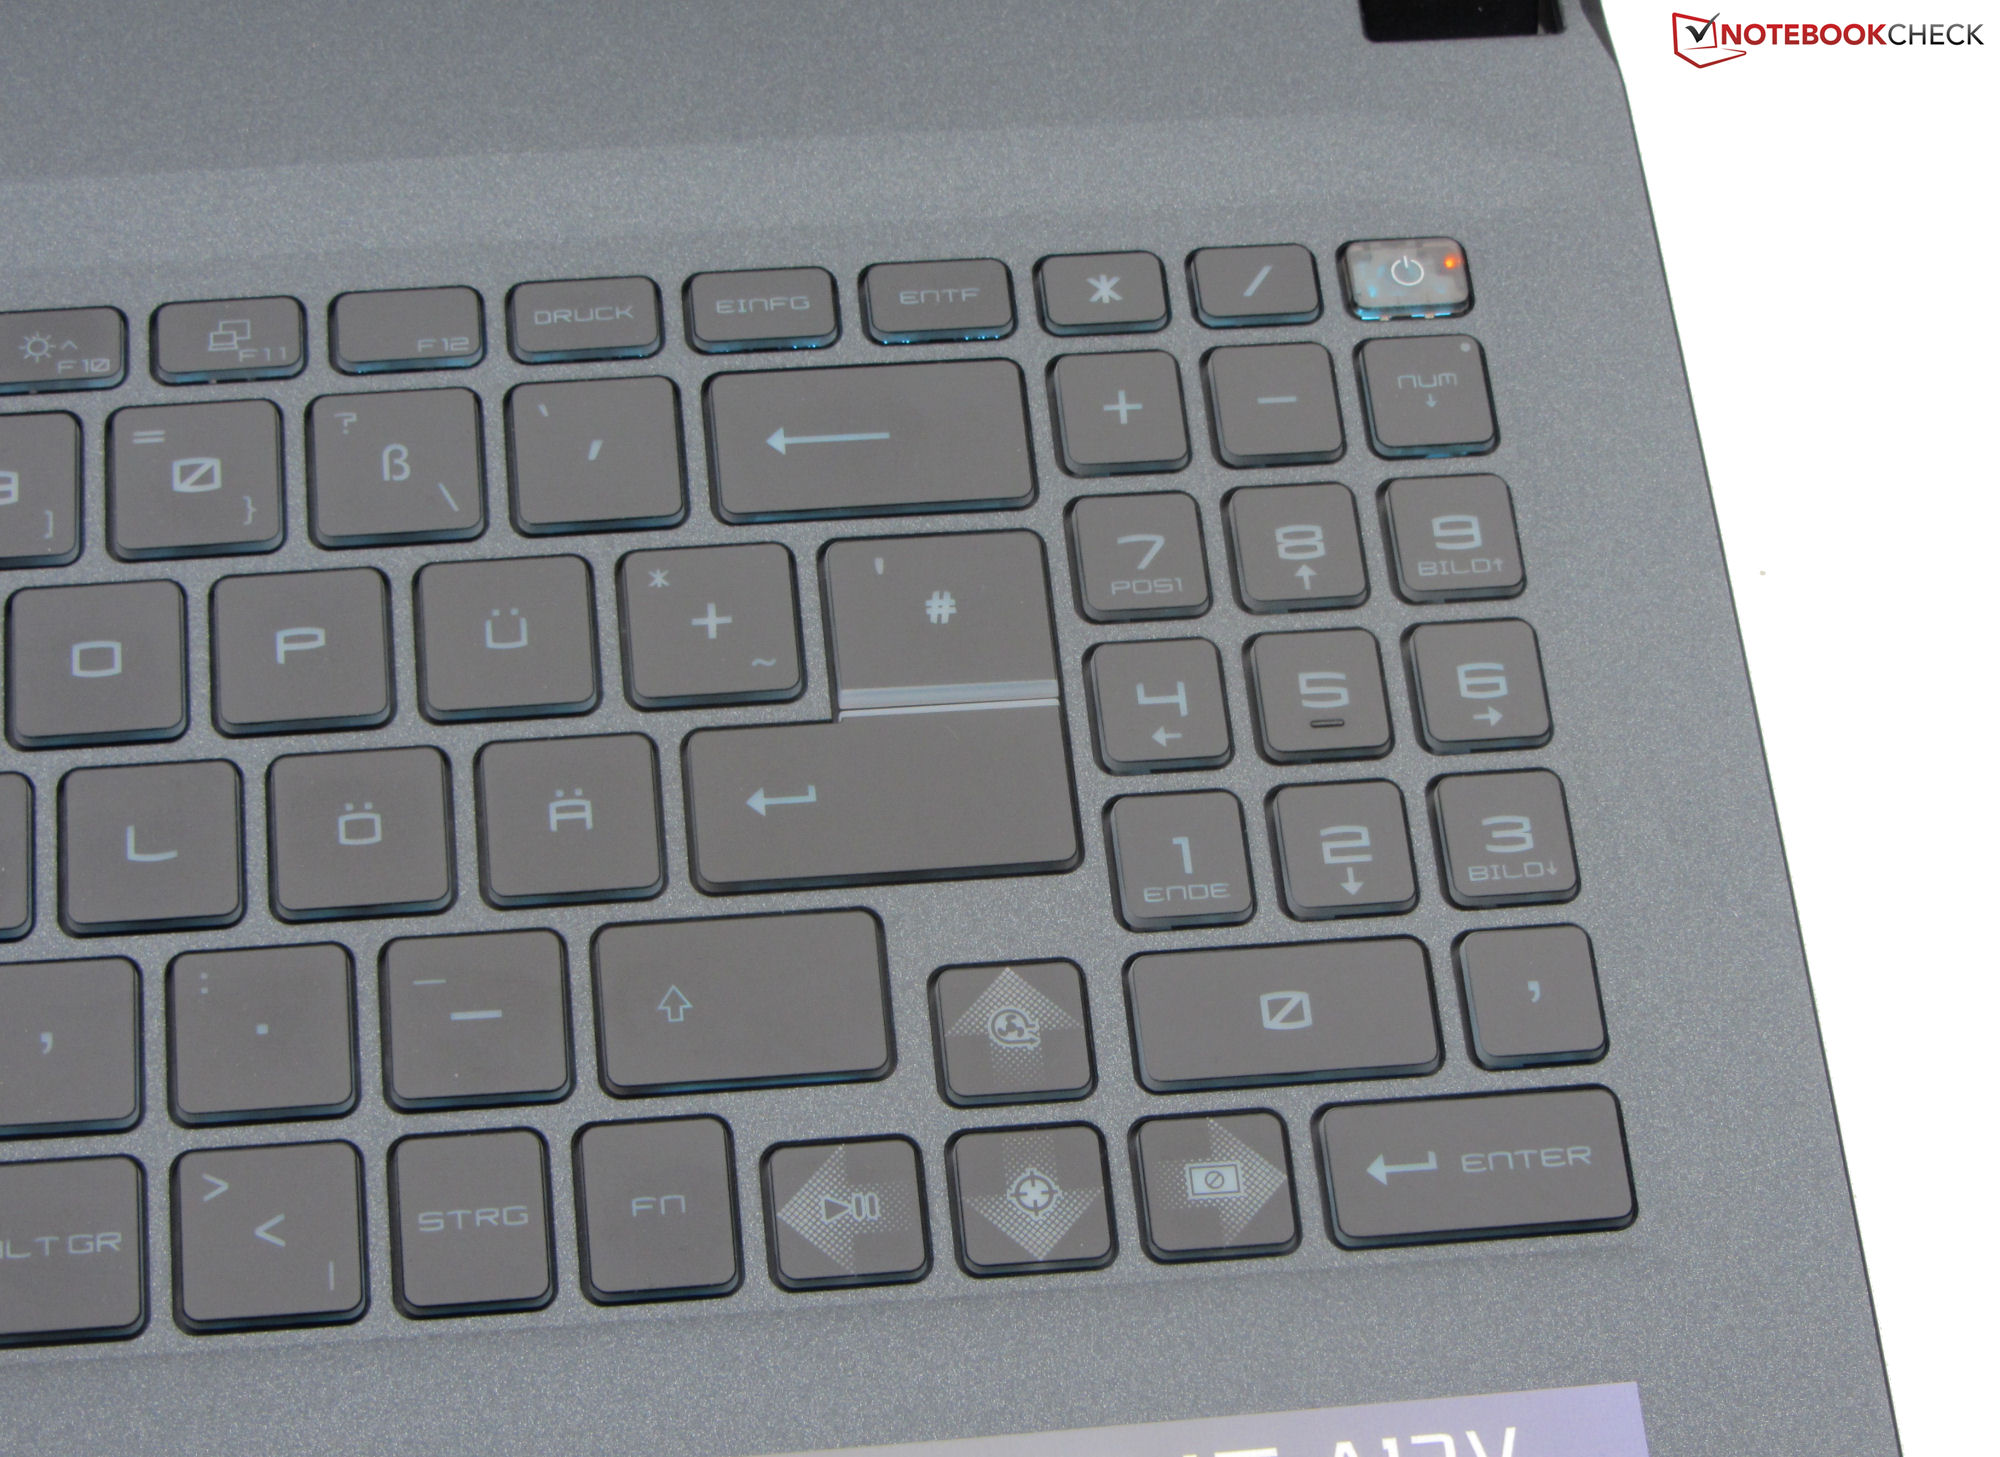
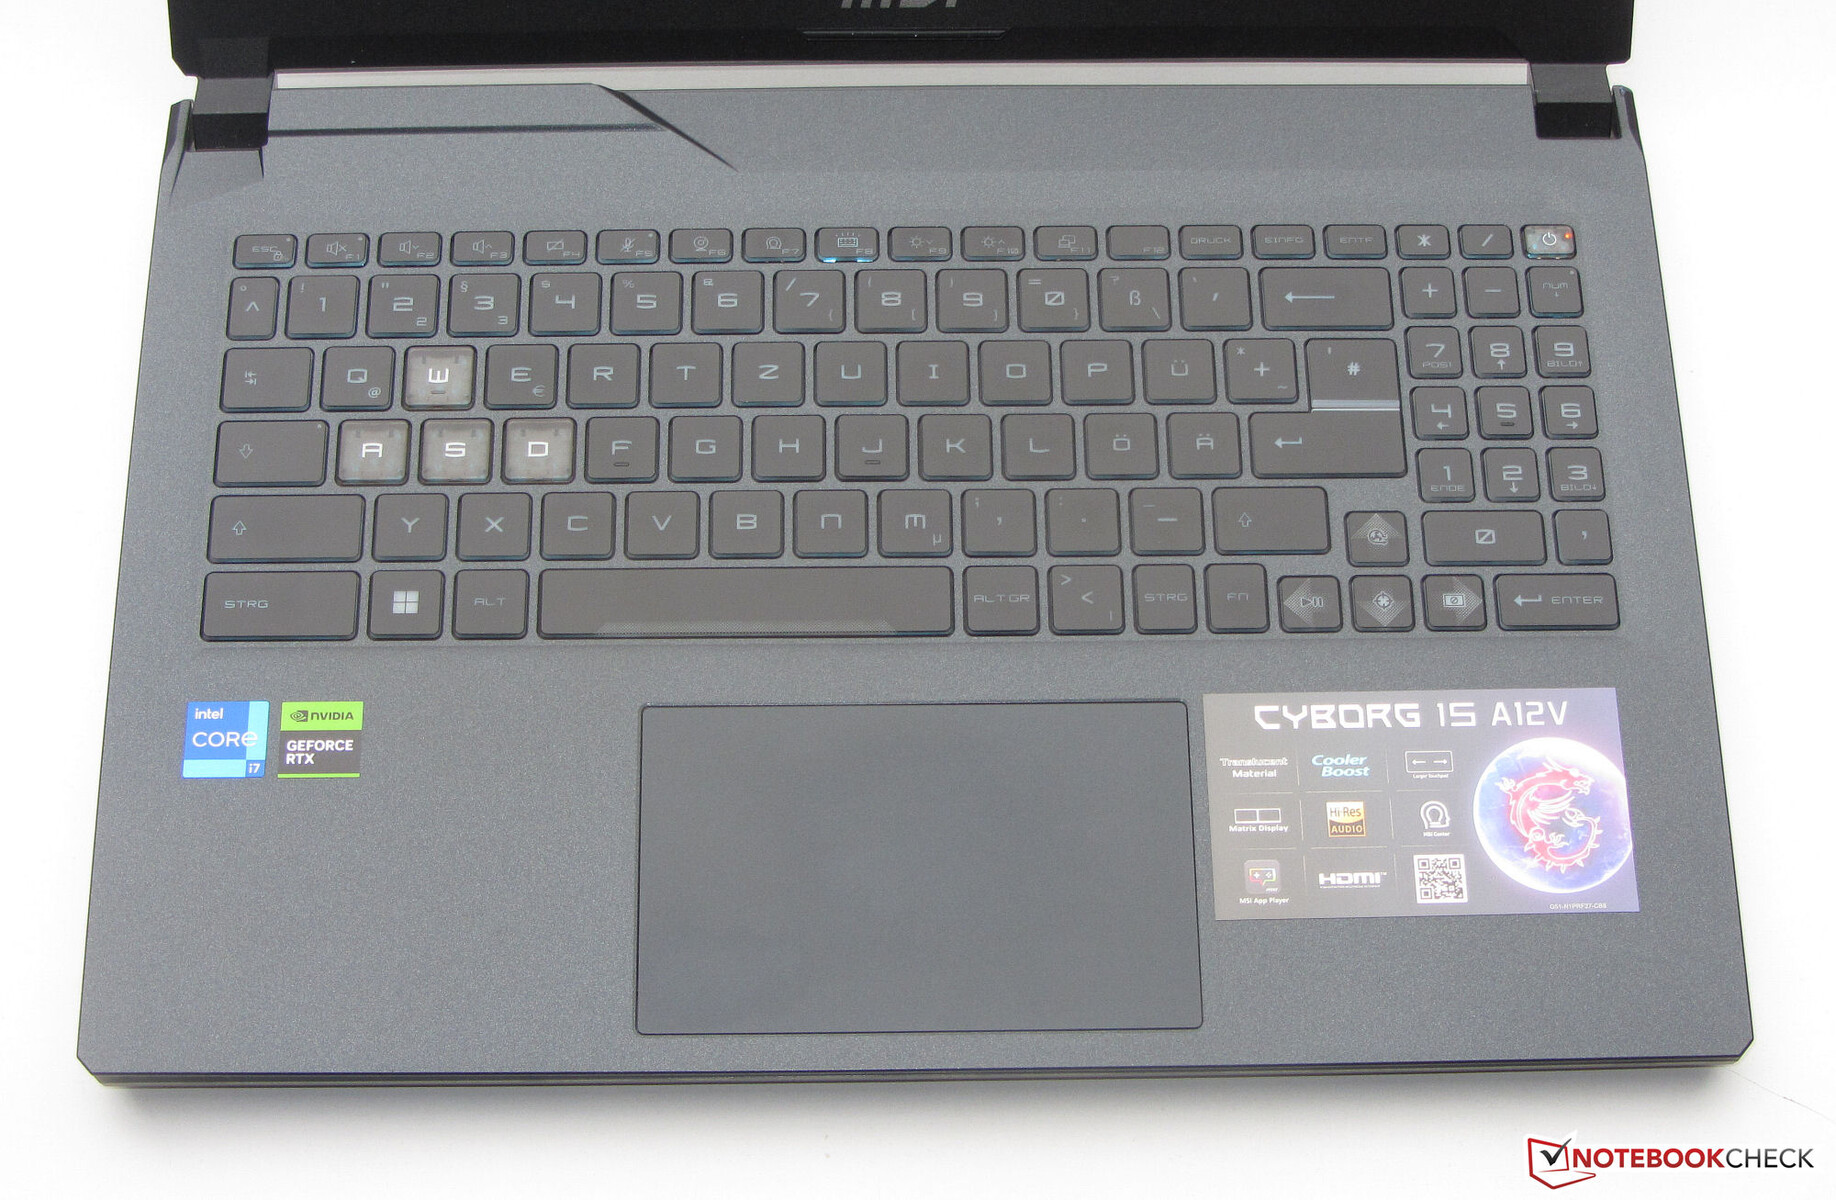
Inmatningsenheter - Cyborg skiljer på WASD-tangenterna för spel
Tangentbord
De platta och mjuka tangenterna på det upplysta chiclet-tangentbordet har en kort slaglängd och en tydlig tryckpunkt. Tangentmotståndet är hyfsat. Tangentbordet har en viss liten eftergivenhet när du skriver, men det visar sig inte vara irriterande. Som typiskt för MSI-enheter är "Fn"-tangenten inte placerad på samma position som vanligt på andra tangentbord för bärbara datorer. Den enfärgade tangentbordsbelysningen erbjuder tre steg av ljusstyrka och styrs via en funktionstangent. På det hela taget levererar MSI ett tangentbord som lämpar sig för vardaglig användning.
Pekplatta
Den släta ytan på den multitouchbara klickplattan (~12 x 7,5 cm, ~4,7 x 2,8 tum) underlättar för fingrarna att glida. Den reagerar på inmatningar i hörnen och har dessutom en kort slaglängd och en tydlig tryckpunkt.
Skärm - FHD-panel med låg färgrymdstäckning
144 Hz-panelen i 16:9-format ger endast medelmåttiga svarstider. Å andra sidan är det positivt att den inte visar PWM-flimmer vid alla ljusstyrkor. Ljusstyrkan och kontrasten på den matta 15,6-tums FHD-skärmen missar motsvarande mål på >1 000:1 respektive 300 cd/m², även om kontrasten kommer nära.
Konkurrenterna gör ett bättre jobb här, och resten av enheterna i vårt jämförelsefält har ljusare skärmar.
| |||||||||||||||||||||||||
Distribution av ljusstyrkan: 89 %
Mitt på batteriet: 250 cd/m²
Kontrast: 988:1 (Svärta: 0.25 cd/m²)
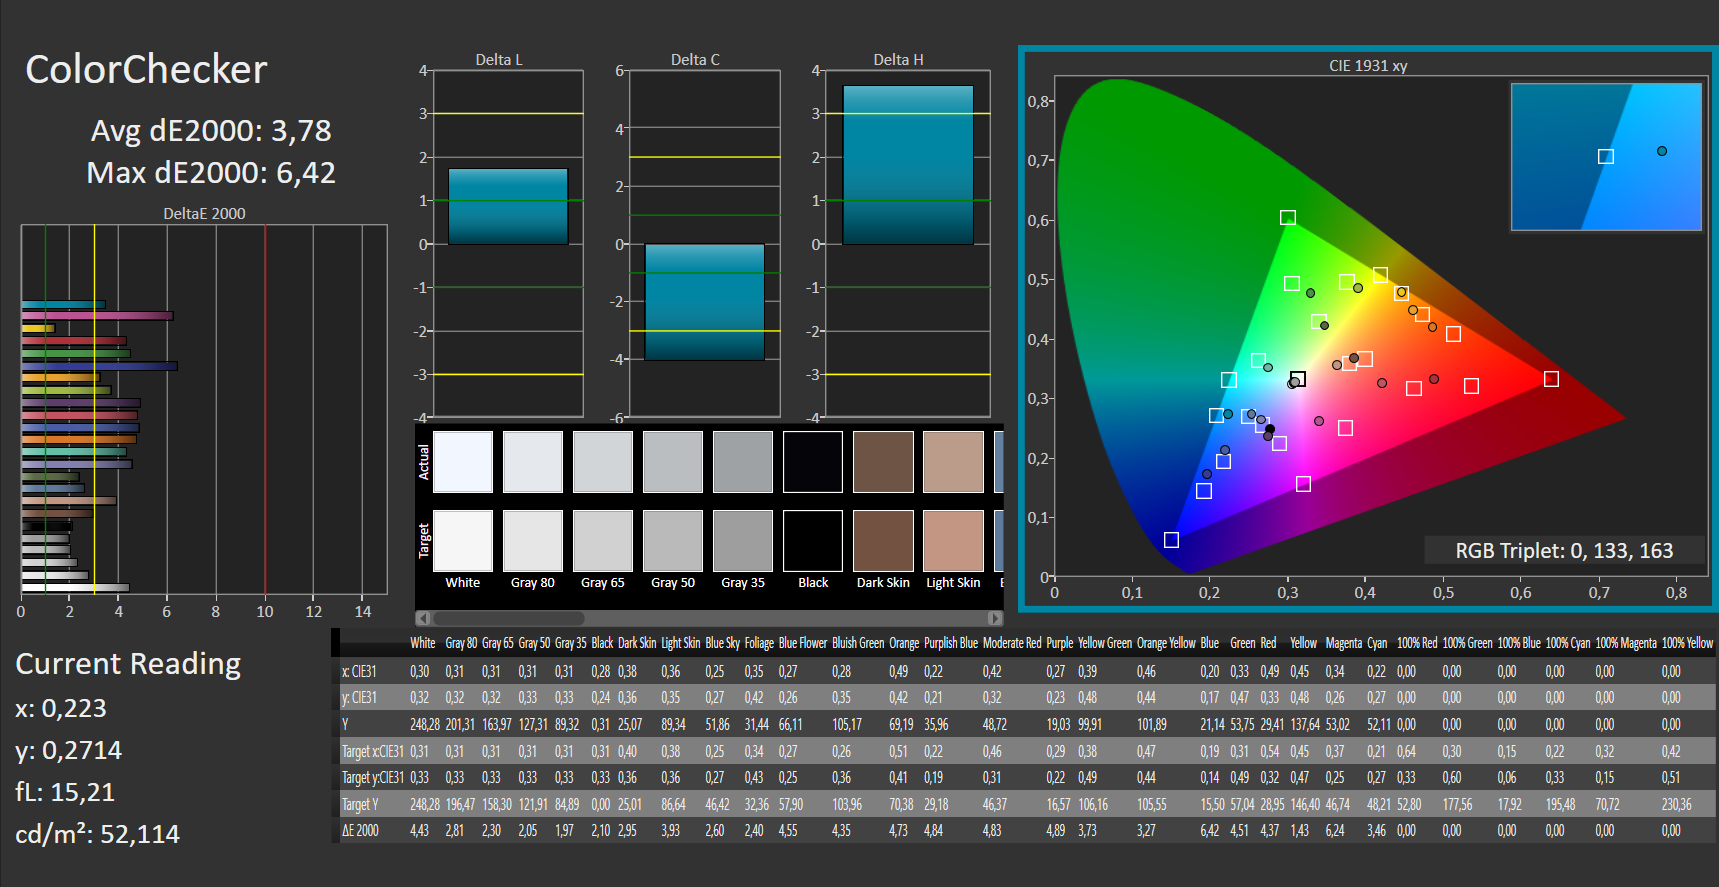
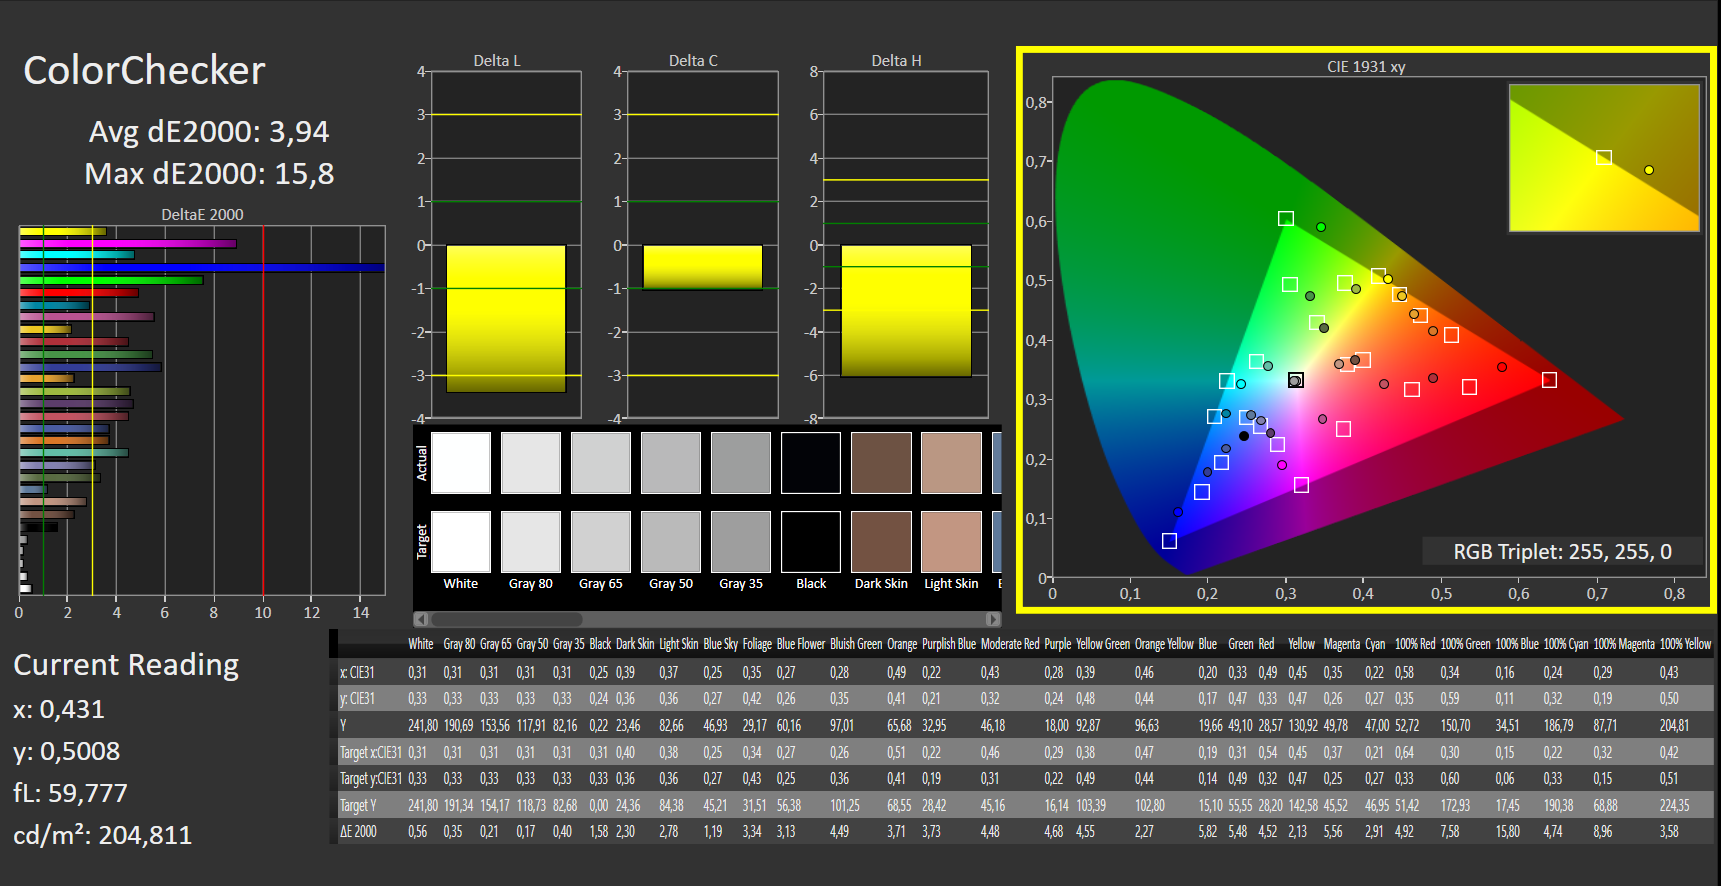
ΔE ColorChecker Calman: 3.78 | ∀{0.5-29.43 Ø4.73}
calibrated: 3.94
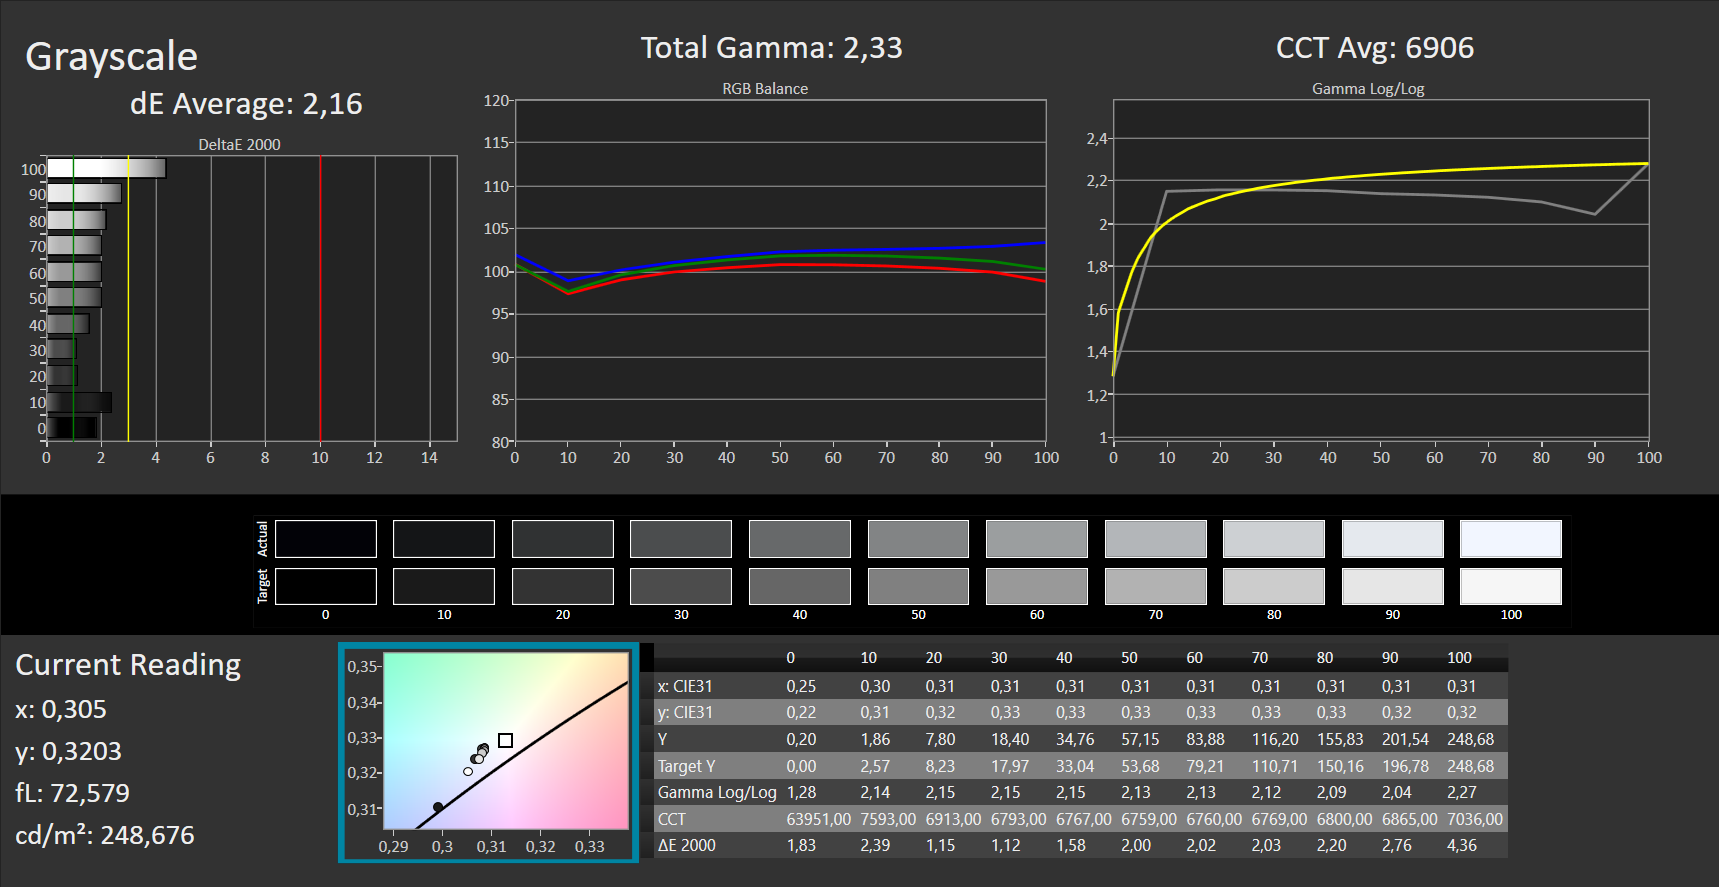
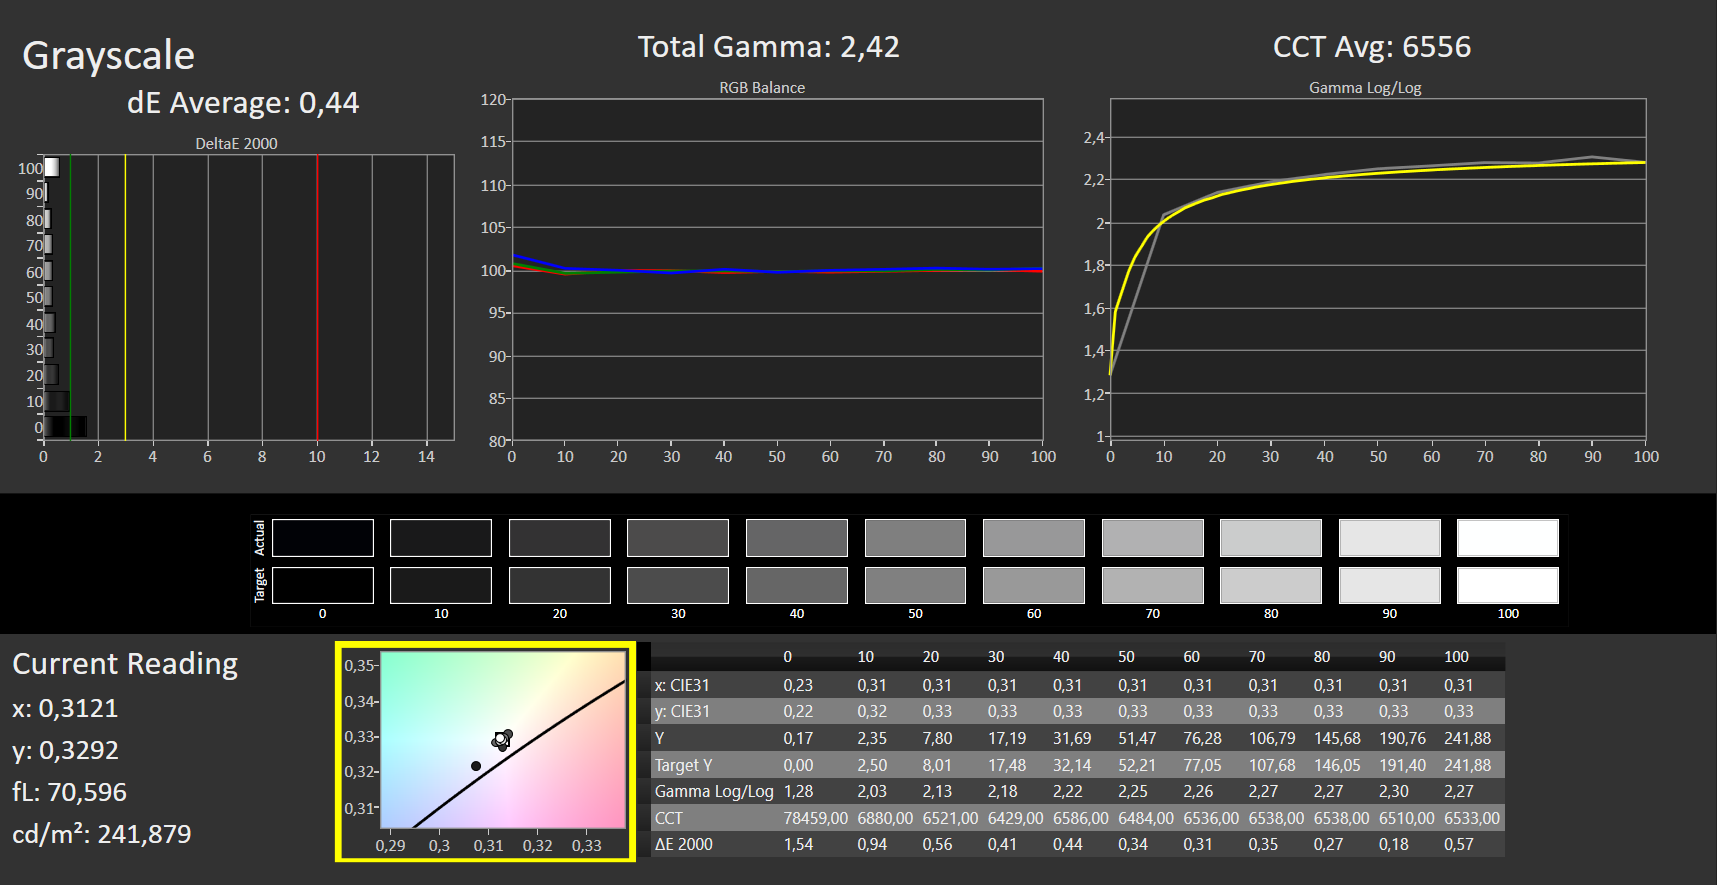
ΔE Greyscale Calman: 2.16 | ∀{0.09-98 Ø4.97}
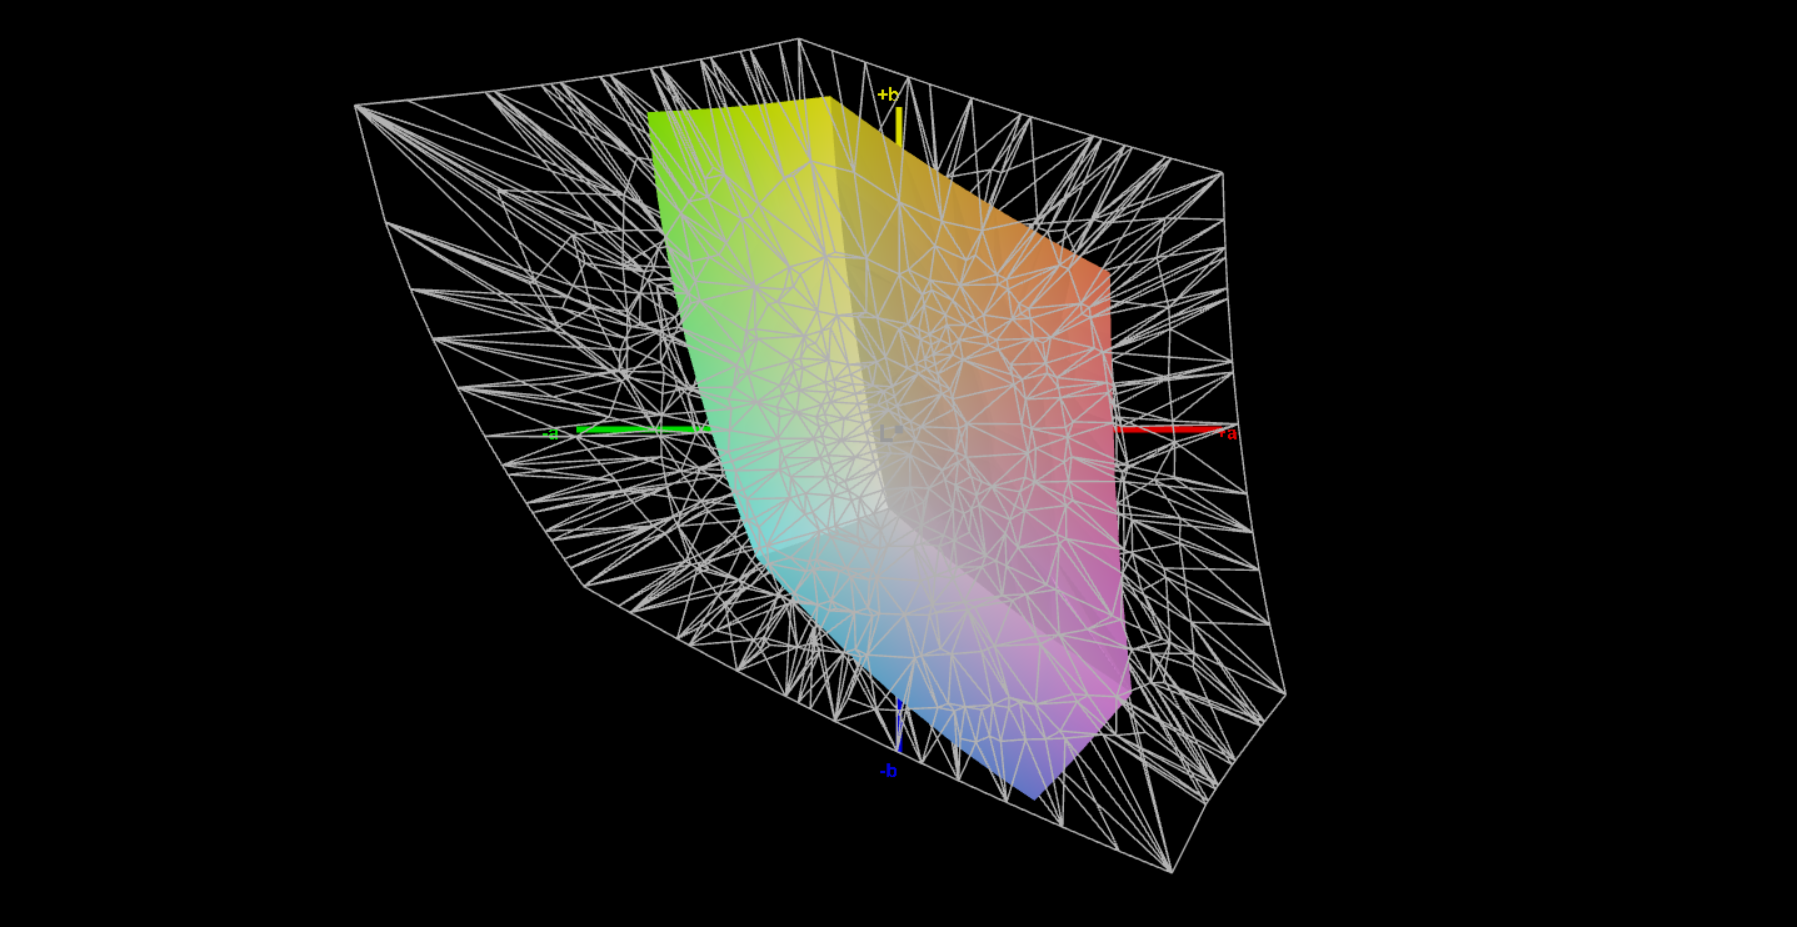
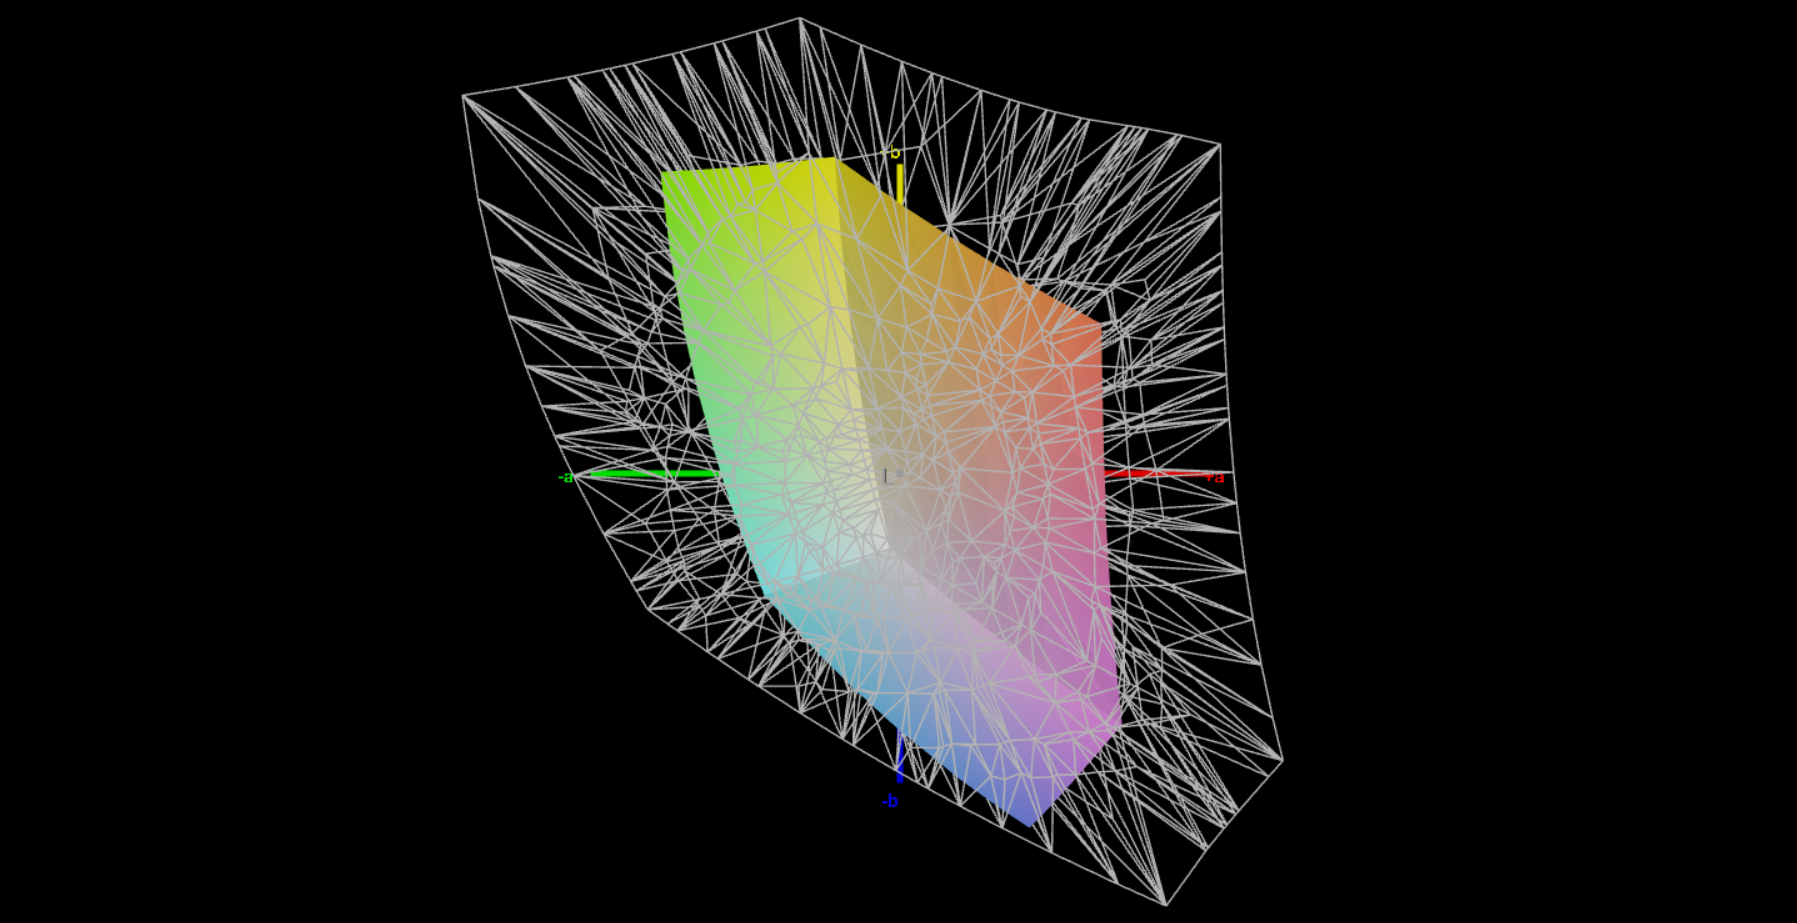
43.7% AdobeRGB 1998 (Argyll 3D)
62.6% sRGB (Argyll 3D)
42.3% Display P3 (Argyll 3D)
Gamma: 2.33
CCT: 6906 K
| MSI Cyborg 15 A12VF AU Optronics B156HAN15.1, IPS, 1920x1080, 15.6" | Asus TUF Gaming A16 FA617 NE160WUM-NX2 (BOE0B33), IPS-Level, 1920x1200, 16" | Aorus 15 XE5 Chi Mei N156KME-GNA, IPS, 2560x1440, 15.6" | Schenker XMG Fusion 15 (Mid 22) BOE CQ NE156QHM-NY2, IPS, 2560x1440, 15.6" | MSI Katana 15 B12VEK AUOAF90 (B156HAN08.4), IPS, 1920x1080, 15.6" | HP Victus 15 fa0020nr CMN1521, IPS, 1920x1080, 15.6" | |
|---|---|---|---|---|---|---|
| Display | 61% | 93% | 56% | -10% | -1% | |
| Display P3 Coverage (%) | 42.3 | 69.4 64% | 95.2 125% | 67.3 59% | 38.1 -10% | 42 -1% |
| sRGB Coverage (%) | 62.6 | 97.8 56% | 99.9 60% | 96.7 54% | 56.8 -9% | 62.7 0% |
| AdobeRGB 1998 Coverage (%) | 43.7 | 70.9 62% | 84.5 93% | 68.2 56% | 39.3 -10% | 43.4 -1% |
| Response Times | 26% | 37% | 49% | -84% | -77% | |
| Response Time Grey 50% / Grey 80% * (ms) | 22 ? | 17 ? 23% | 14.4 ? 35% | 11.6 ? 47% | 38.8 ? -76% | 35.2 ? -60% |
| Response Time Black / White * (ms) | 14 ? | 10.1 ? 28% | 8.6 ? 39% | 7 ? 50% | 26.8 ? -91% | 27.2 ? -94% |
| PWM Frequency (Hz) | ||||||
| Screen | 31% | 1% | -8% | -28% | -13% | |
| Brightness middle (cd/m²) | 247 | 308 25% | 336 36% | 326 32% | 261 6% | 284.3 15% |
| Brightness (cd/m²) | 234 | 293 25% | 316 35% | 303 29% | 258 10% | 262 12% |
| Brightness Distribution (%) | 89 | 90 1% | 89 0% | 89 0% | 92 3% | 87 -2% |
| Black Level * (cd/m²) | 0.25 | 0.23 8% | 0.34 -36% | 0.33 -32% | 0.19 24% | 0.17 32% |
| Contrast (:1) | 988 | 1339 36% | 988 0% | 988 0% | 1374 39% | 1672 69% |
| Colorchecker dE 2000 * | 3.78 | 1.47 61% | 3.36 11% | 2.73 28% | 5.57 -47% | 4.52 -20% |
| Colorchecker dE 2000 max. * | 6.42 | 2.98 54% | 6.67 -4% | 9.54 -49% | 20.6 -221% | 18.67 -191% |
| Colorchecker dE 2000 calibrated * | 3.94 | 1.02 74% | 0.74 81% | 1.36 65% | 4.63 -18% | 1.55 61% |
| Greyscale dE 2000 * | 2.16 | 2.2 -2% | 4.7 -118% | 5.2 -141% | 3.19 -48% | 4.1 -90% |
| Gamma | 2.33 94% | 2.228 99% | 2.244 98% | 2.074 106% | 2.45 90% | 2.3 96% |
| CCT | 6906 94% | 6228 104% | 6897 94% | 6911 94% | 6146 106% | 6529 100% |
| Totalt genomsnitt (program/inställningar) | 39% /
37% | 44% /
26% | 32% /
14% | -41% /
-32% | -30% /
-19% |
* ... mindre är bättre
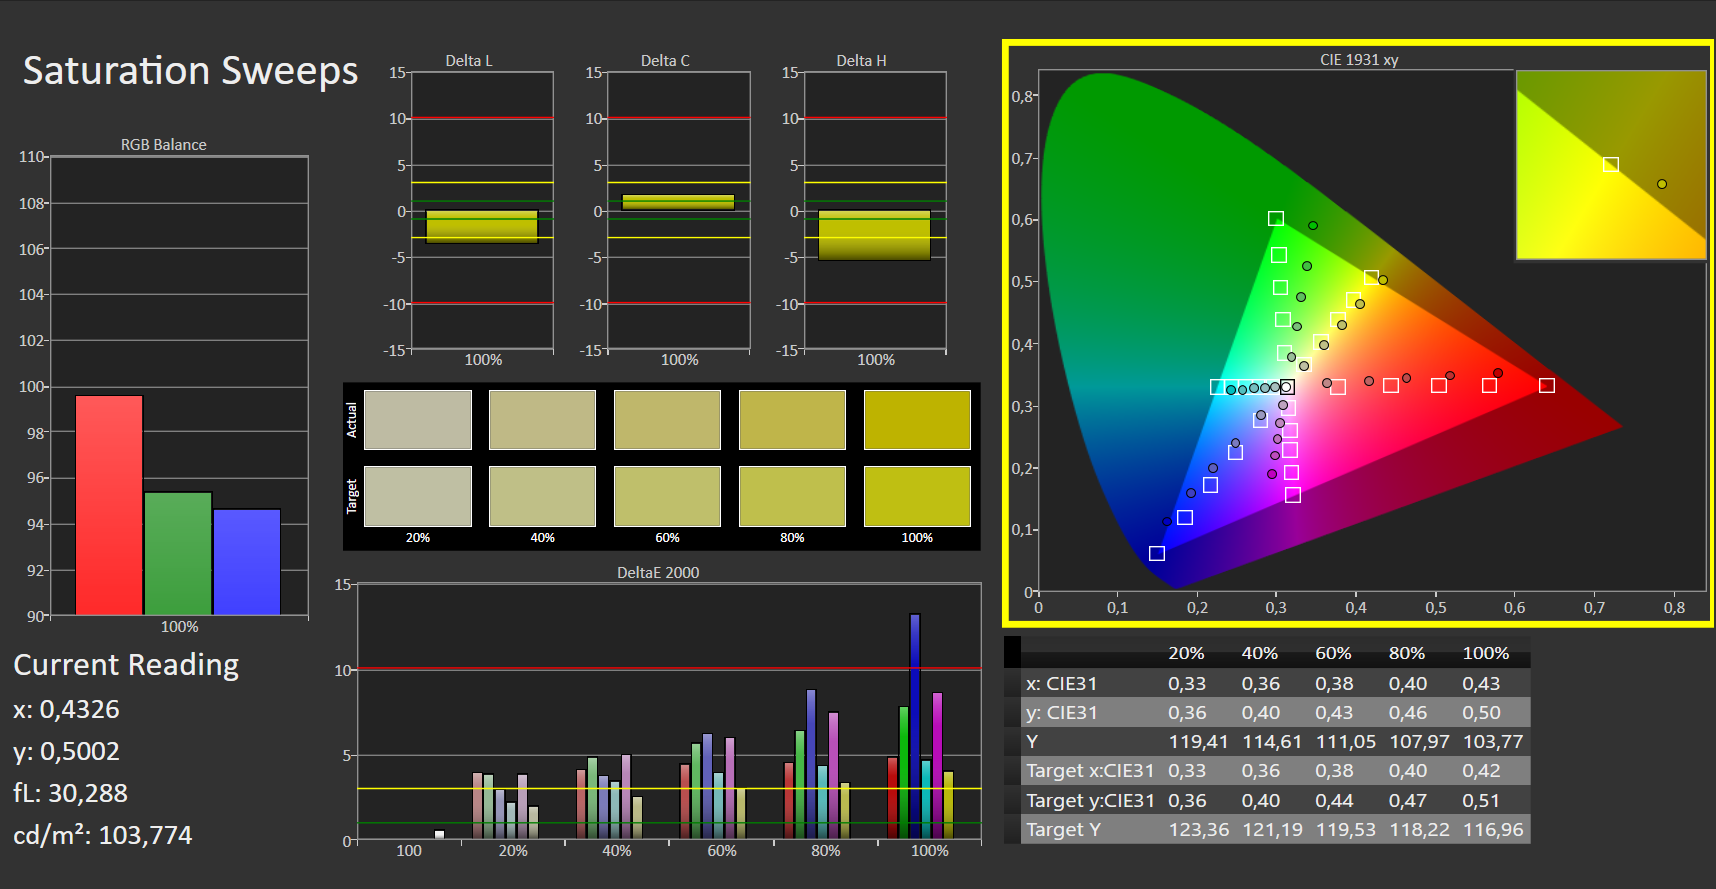
Vid leverans är skärmens färgåtergivning mycket hygglig, med en avvikelse på 3,8 som knappt missar målet DeltaE < 3. En kalibrering ökar visserligen färgavvikelsen, men den ger också en mer balanserad gråskala.
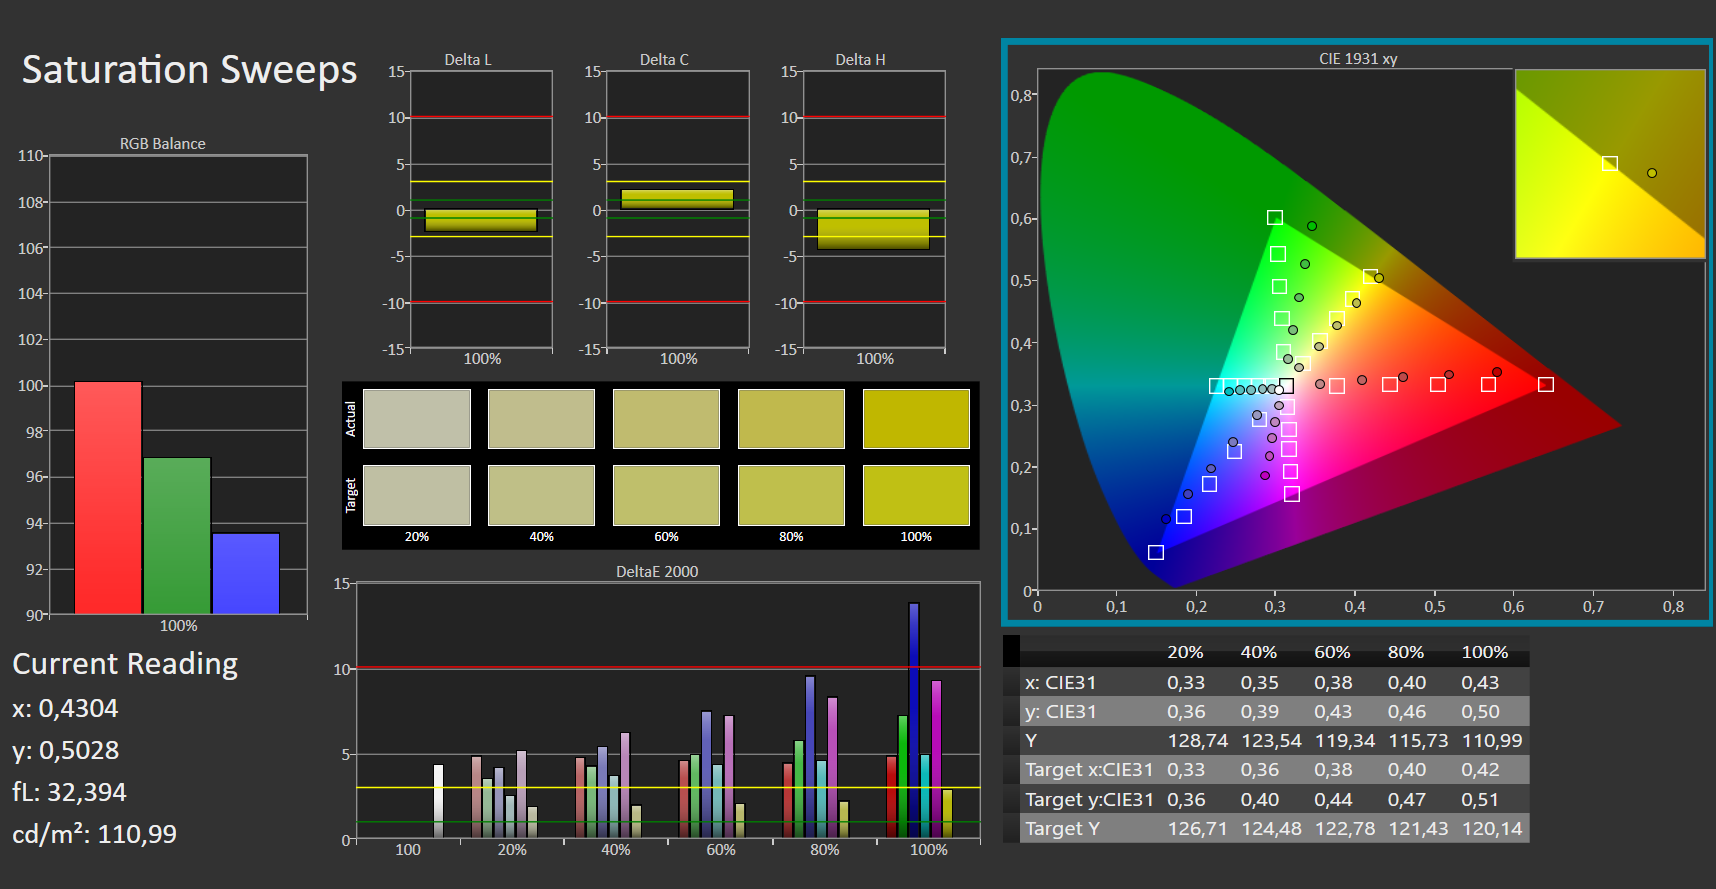
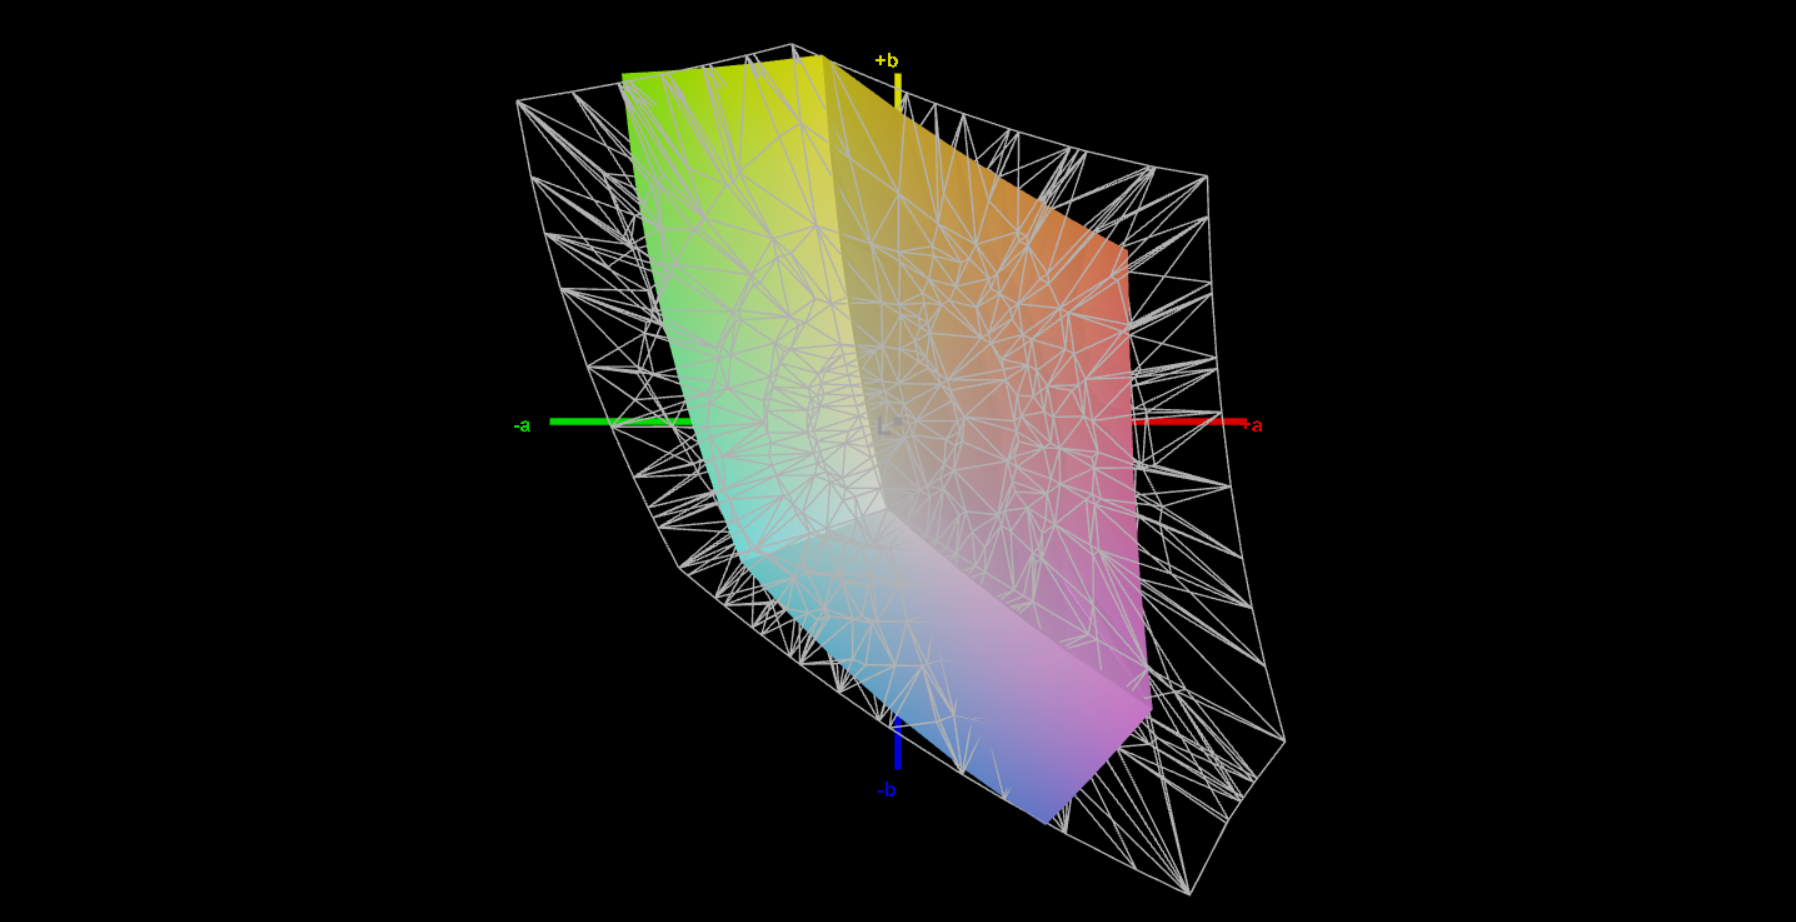
Panelen kan inte täcka färgrymderna AdobeRGB (44 %), sRGB (63 %) och DCI-P3 (42 %). Den lämpar sig därför inte för tillämpningsscenarier som är beroende av färgprecision. Konkurrenter som t.ex Asus TUF Gaming A16 FA617och XMG Fusion 15är mer lämpliga här, och deras skärmar kan täcka sRGB-färgrymden.
Visa svarstider
| ↔ Svarstid svart till vitt | ||
|---|---|---|
| 14 ms ... stiga ↗ och falla ↘ kombinerat | ↗ 7 ms stiga |  |
| ↘ 7 ms hösten | ||
| Skärmen visar bra svarsfrekvens i våra tester, men kan vara för långsam för konkurrenskraftiga spelare. I jämförelse sträcker sig alla testade enheter från 0.1 (minst) till 240 (maximalt) ms. » 34 % av alla enheter är bättre. Det betyder att den uppmätta svarstiden är bättre än genomsnittet av alla testade enheter (19.9 ms). | ||
| ↔ Svarstid 50 % grått till 80 % grått | ||
| 22 ms ... stiga ↗ och falla ↘ kombinerat | ↗ 9 ms stiga |  |
| ↘ 13 ms hösten | ||
| Skärmen visar bra svarsfrekvens i våra tester, men kan vara för långsam för konkurrenskraftiga spelare. I jämförelse sträcker sig alla testade enheter från 0.165 (minst) till 636 (maximalt) ms. » 33 % av alla enheter är bättre. Det betyder att den uppmätta svarstiden är bättre än genomsnittet av alla testade enheter (31.1 ms). | ||
Skärmflimmer / PWM (Puls-Width Modulation)
| Skärmflimmer / PWM upptäcktes inte |  | ||
Som jämförelse: 52 % av alla testade enheter använder inte PWM för att dämpa skärmen. Om PWM upptäcktes mättes ett medelvärde av 7798 (minst: 5 - maximum: 343500) Hz. | |||
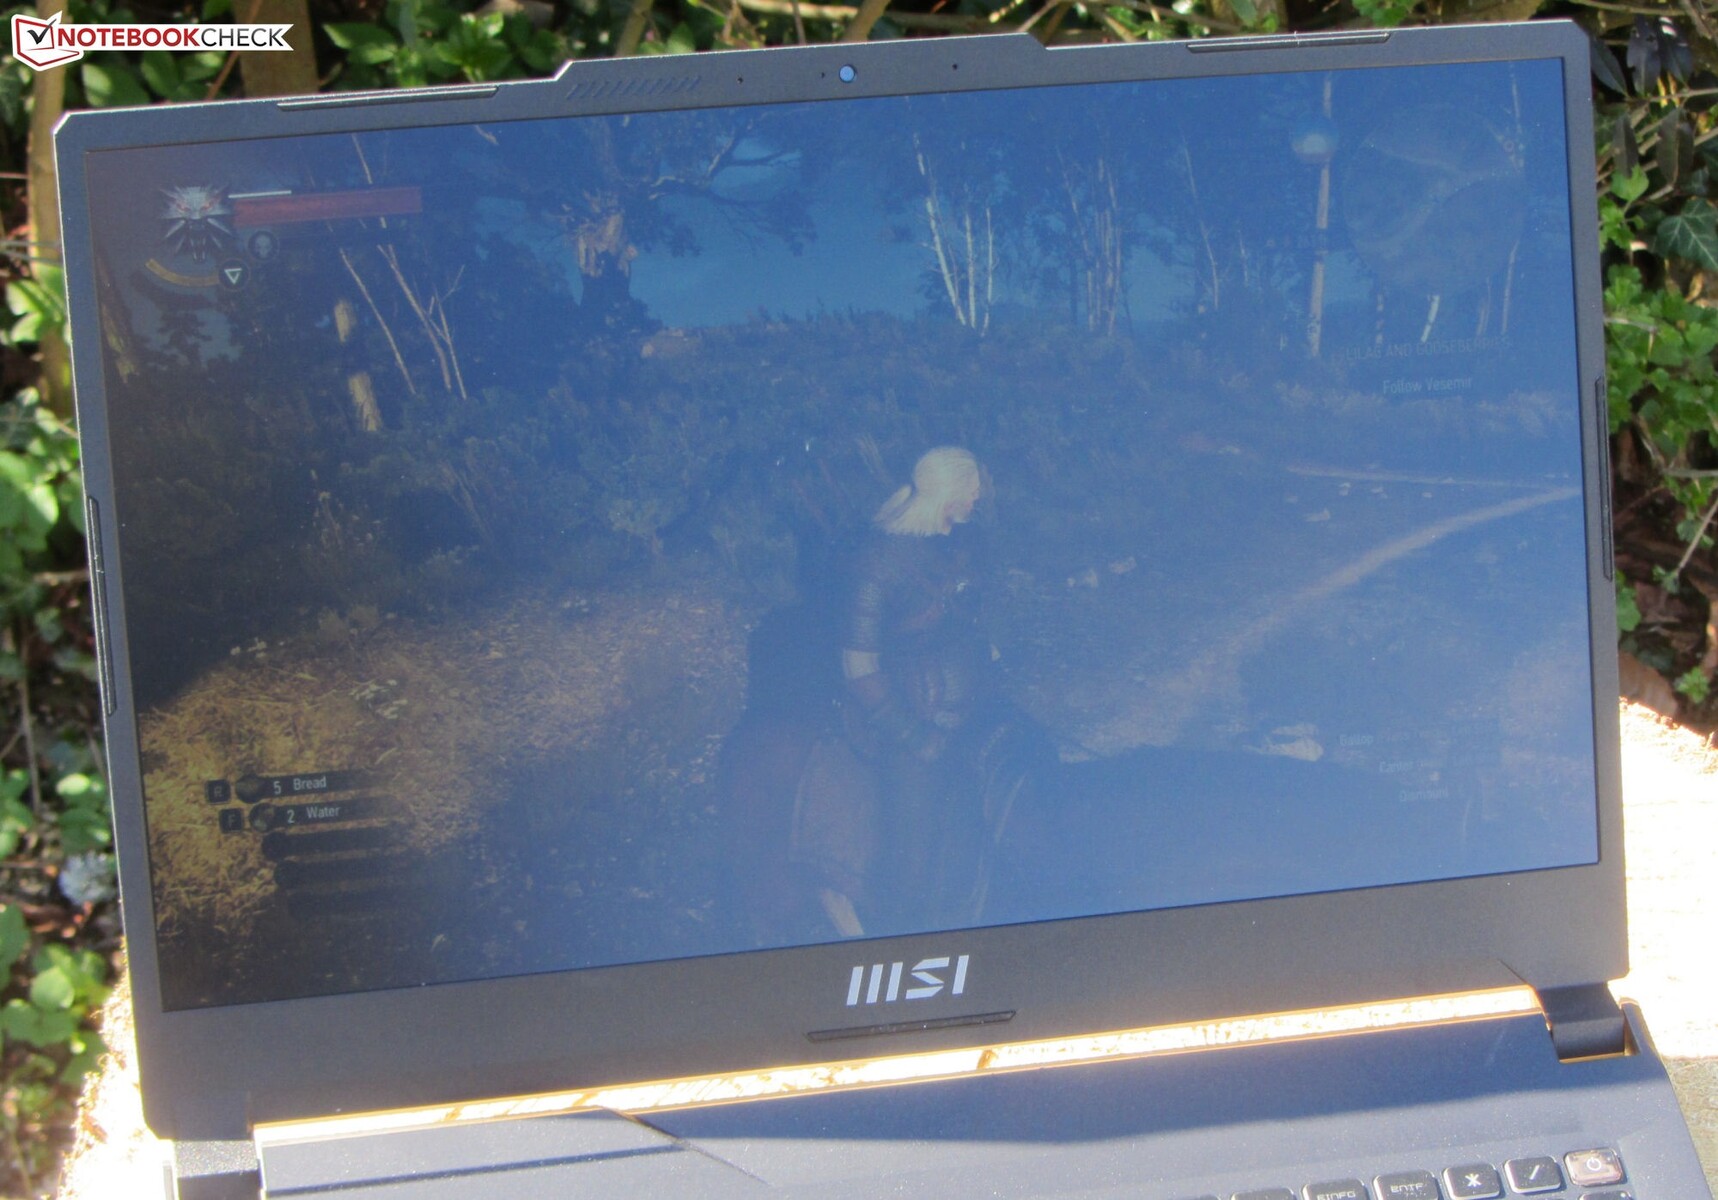
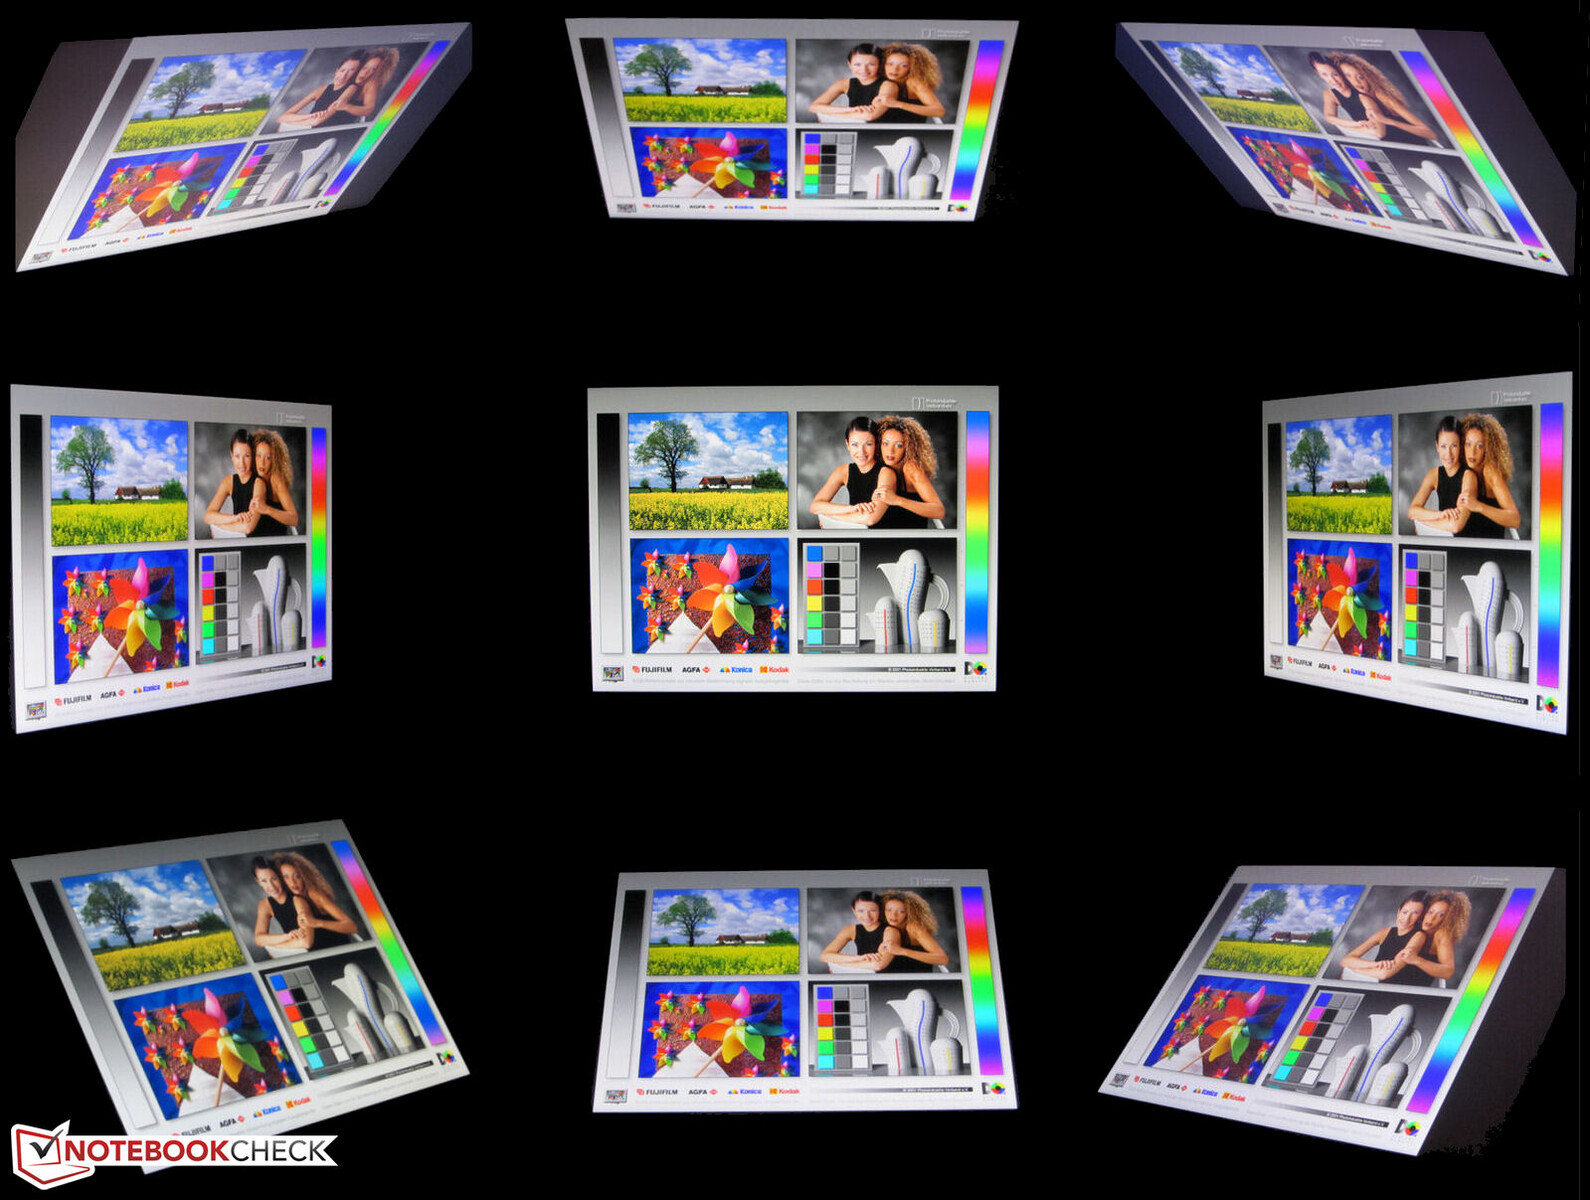
IPS-panelens betraktningsvinklar är stabila och den kan läsas enkelt från alla vinklar. Utomhus kan innehållet på skärmen läsas när solen inte är för stark.
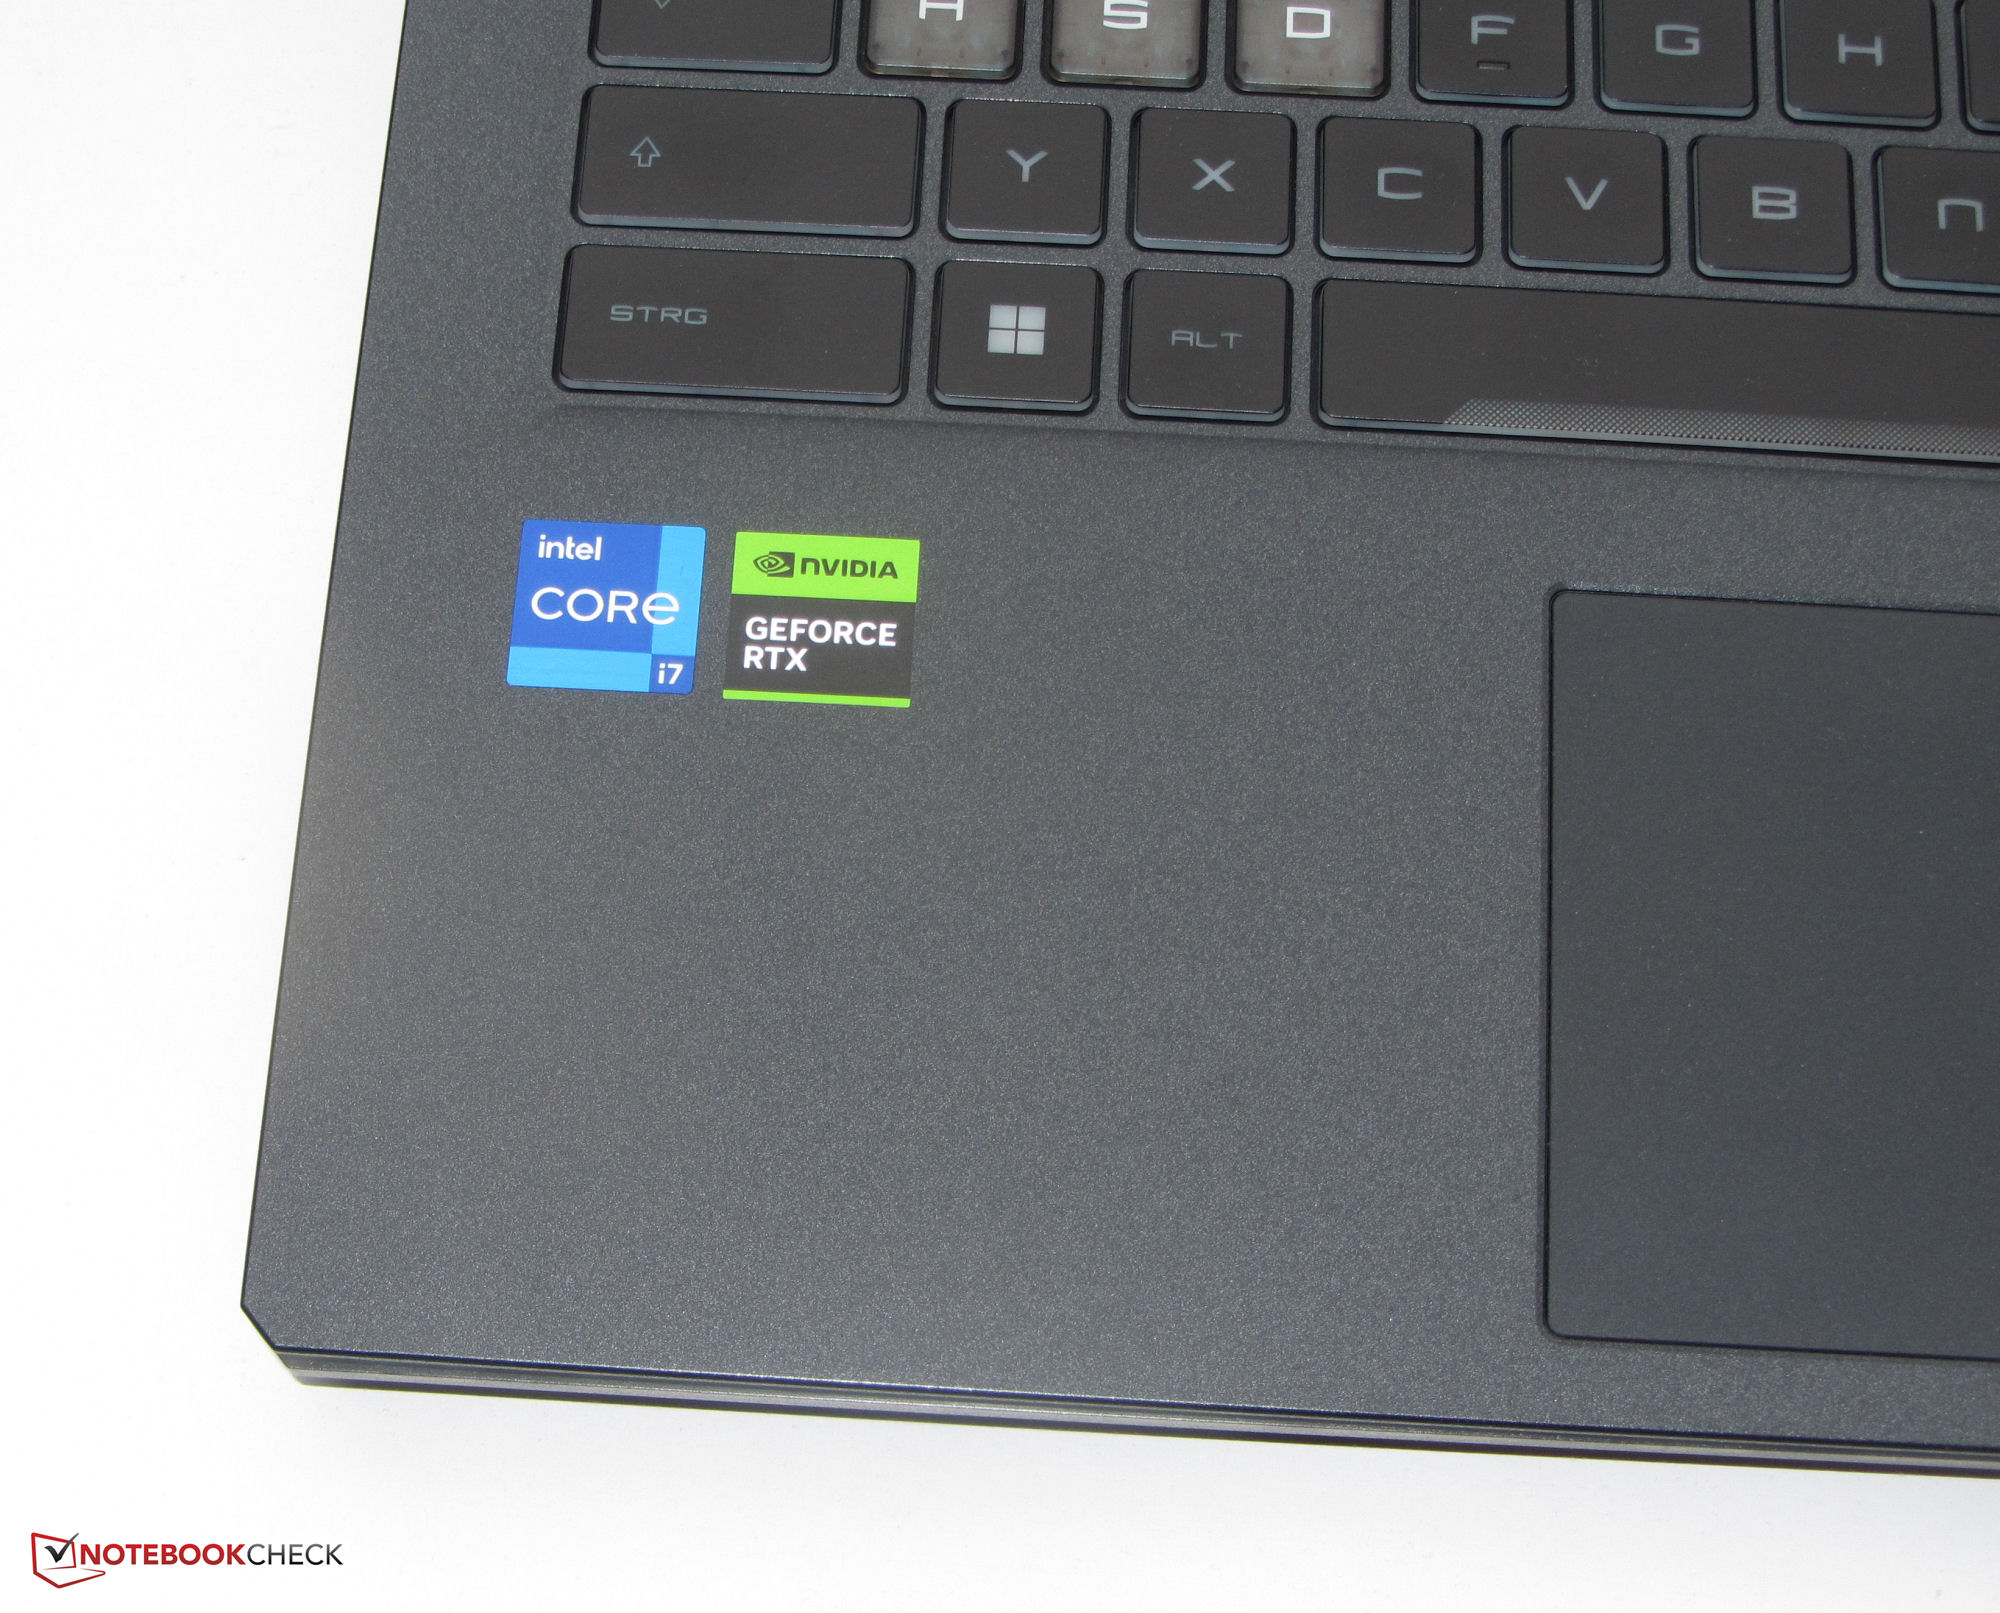
Föreställning - Alder Lake och Ada Lovelace i ett hårt koppel
Med Cyborg 15 A12VF-serien erbjuder MSI bärbara bärbara datorer för mobilt spelande som använder den GeForce Bärbar dator med RTX 4060grafikkärna i en lägre strömkonfiguration med en TGP på 45 watt. Detta åtföljs av Alder Lake-processorer från Intel. Prispunkterna för de A12VF-modeller som finns tillgängliga vid tidpunkten för detta test ligger mellan cirka 1 250 och 1 800 euro (~1 382-1 989 dollar). Priset på vår testenhet ligger i den övre delen av denna skala.
Testförhållanden
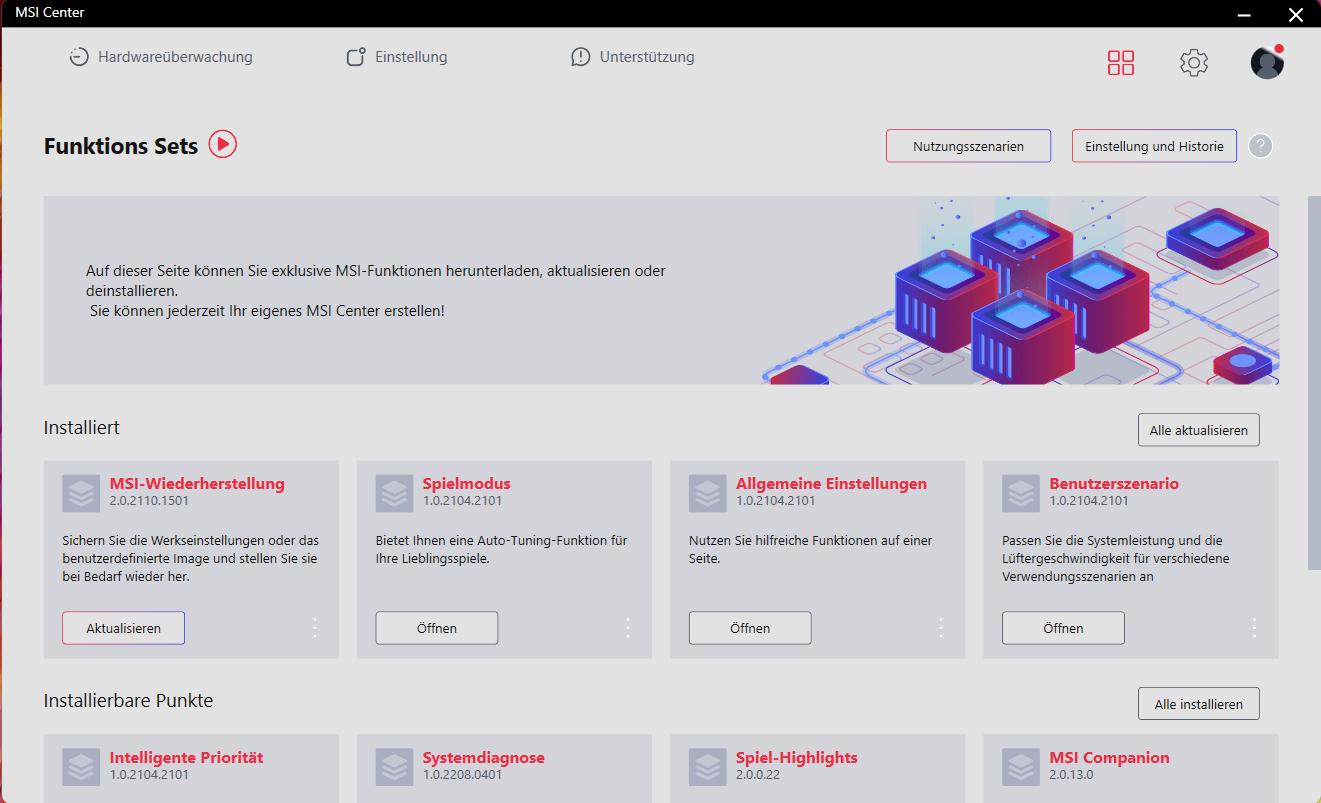
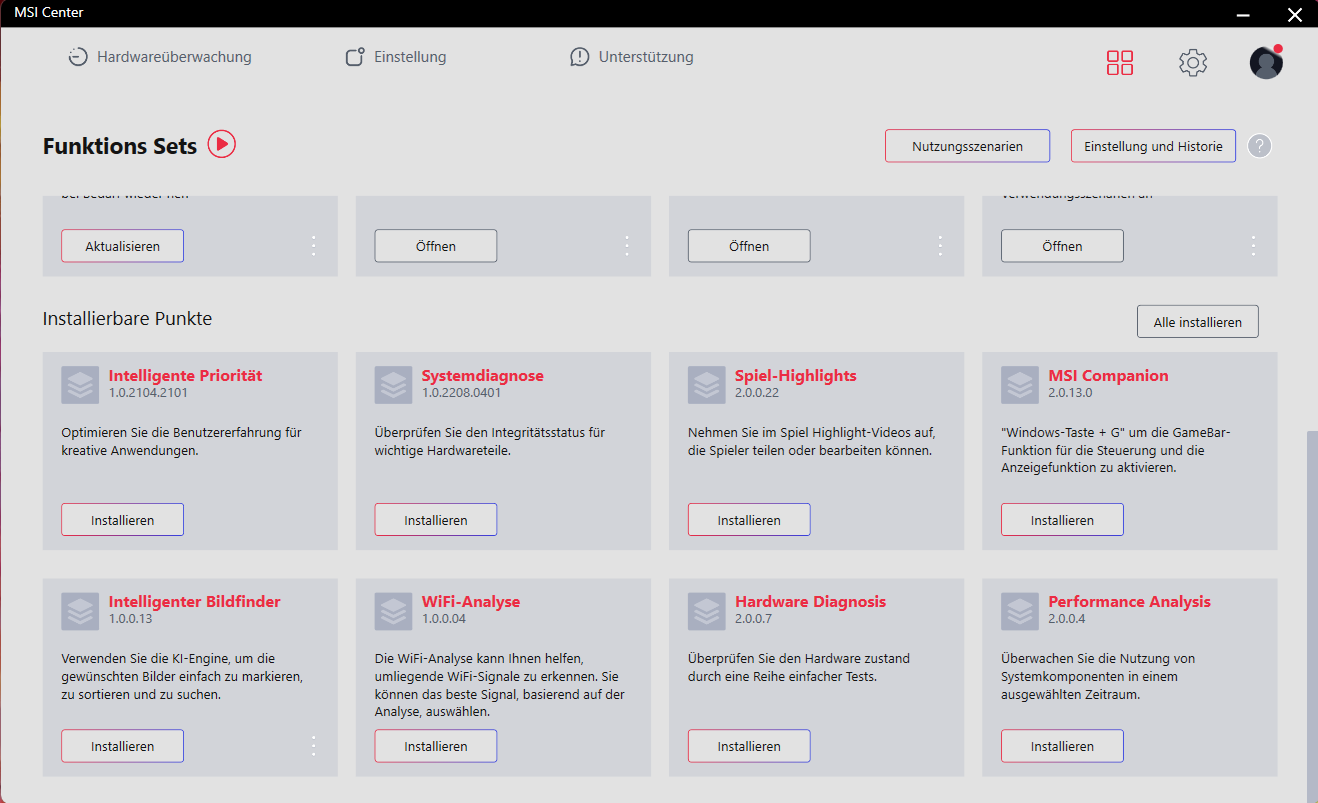
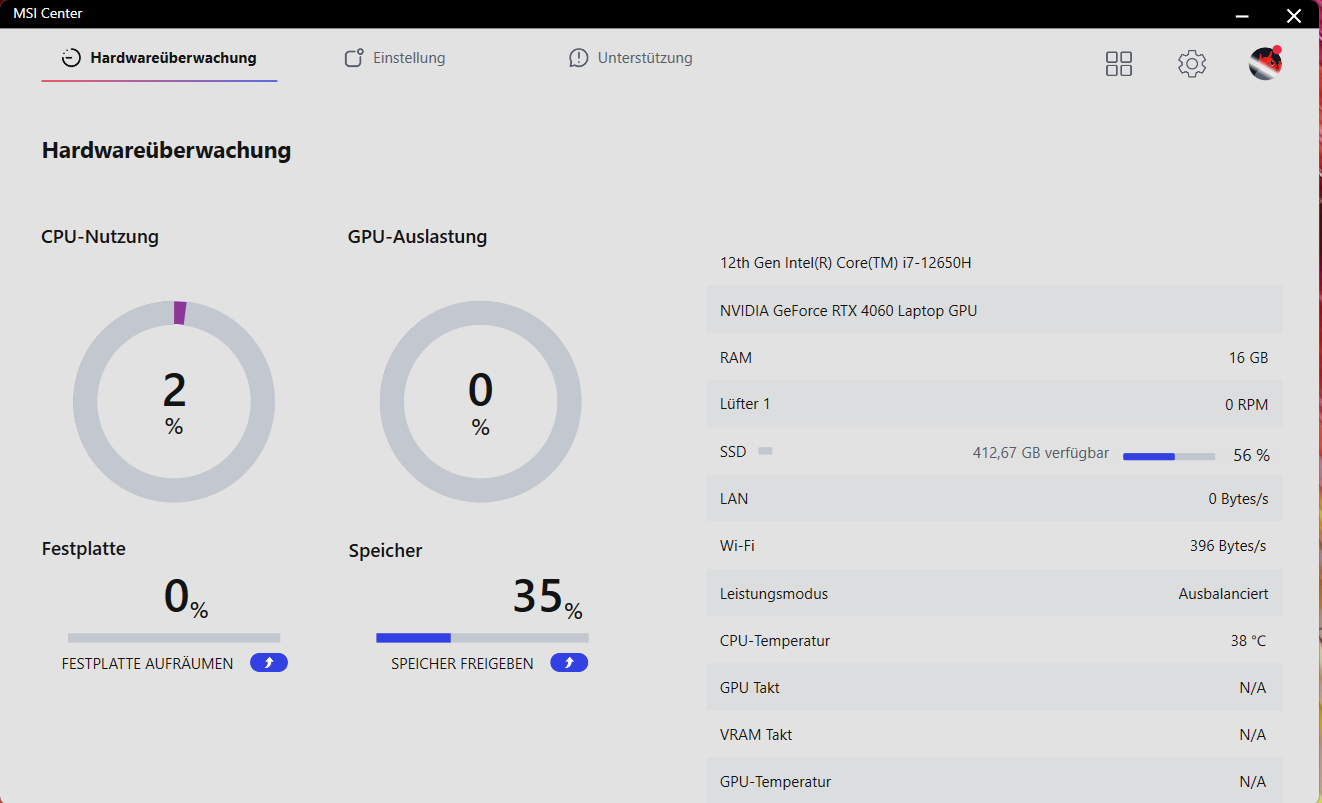
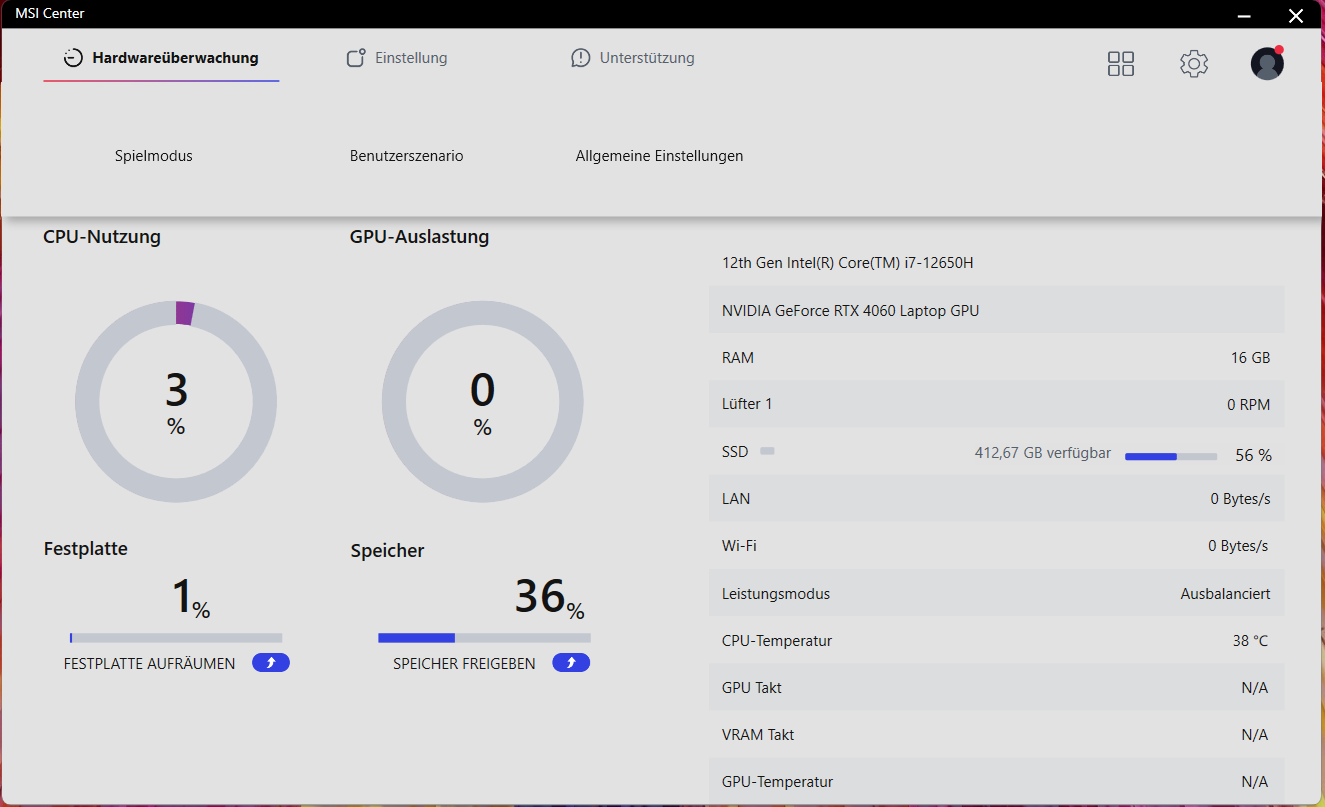
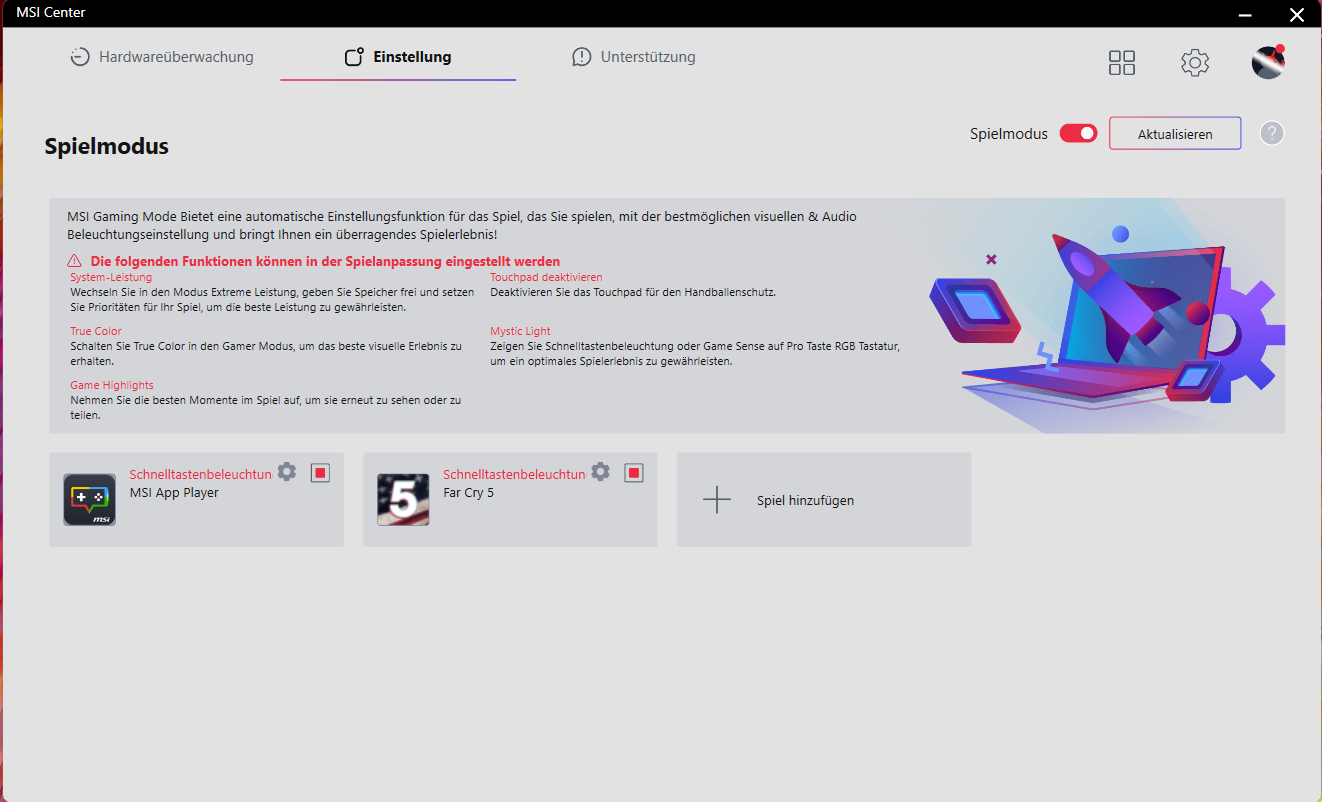
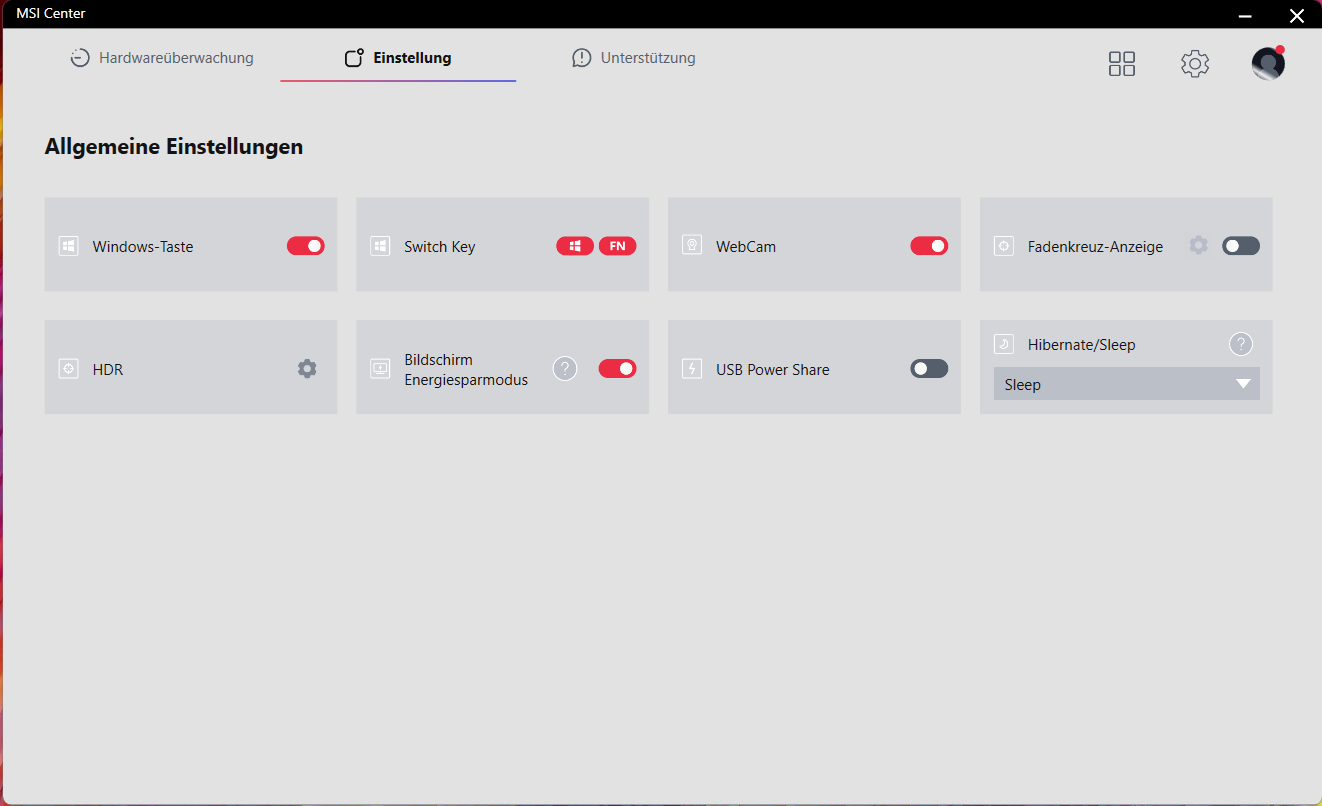
Med den förinstallerade programvaran MSI Center (se bilder) eller med tangentkombinationen "Fn" + "F7" kan du växla mellan de fyra prestandaprofilerna (se tabellen nedan). Vi använde profilen "Extreme Performance" för benchmarks och "Super Battery" för batteritesterna. Alternativt finns också en AI-baserad "Smart Auto"-funktion som automatiskt väljer den profil som passar bäst för det aktuella användningsscenariot.
| Extrem prestanda | Balanserad | Silent Mode | Super Battery | |
|---|---|---|---|---|
| Effektgräns 1 | 55 Watt | 45 Watt | 20 Watt | 15 Watt |
| Effektgräns 2 | 78 Watt | 70 Watt | 20 Watt | 15 Watt |

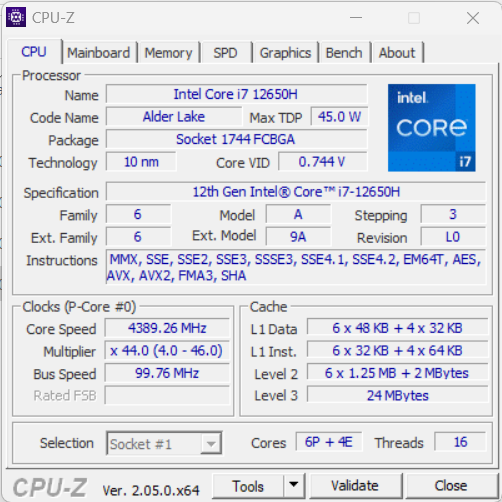
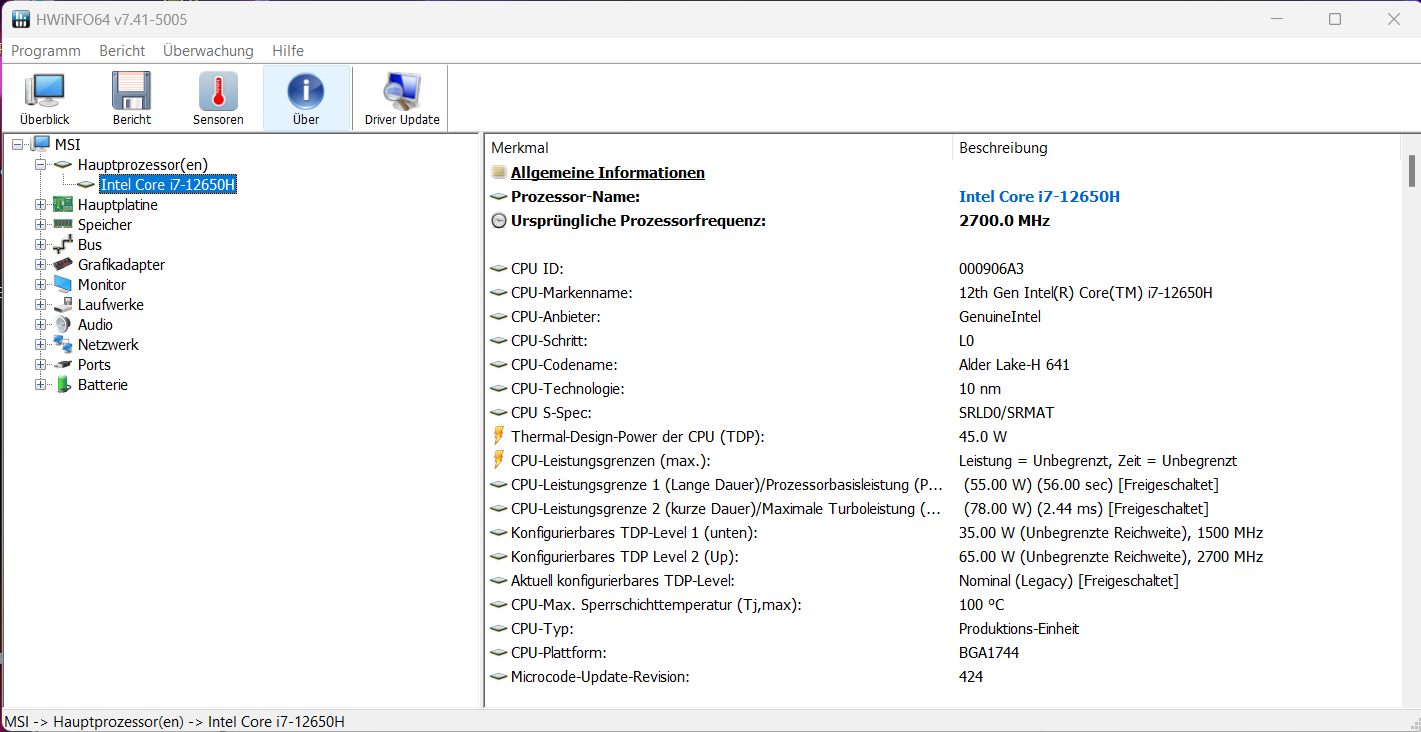
Processor
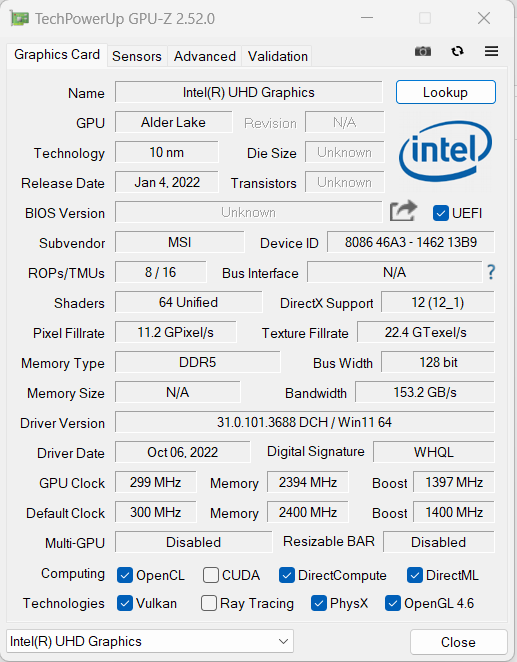
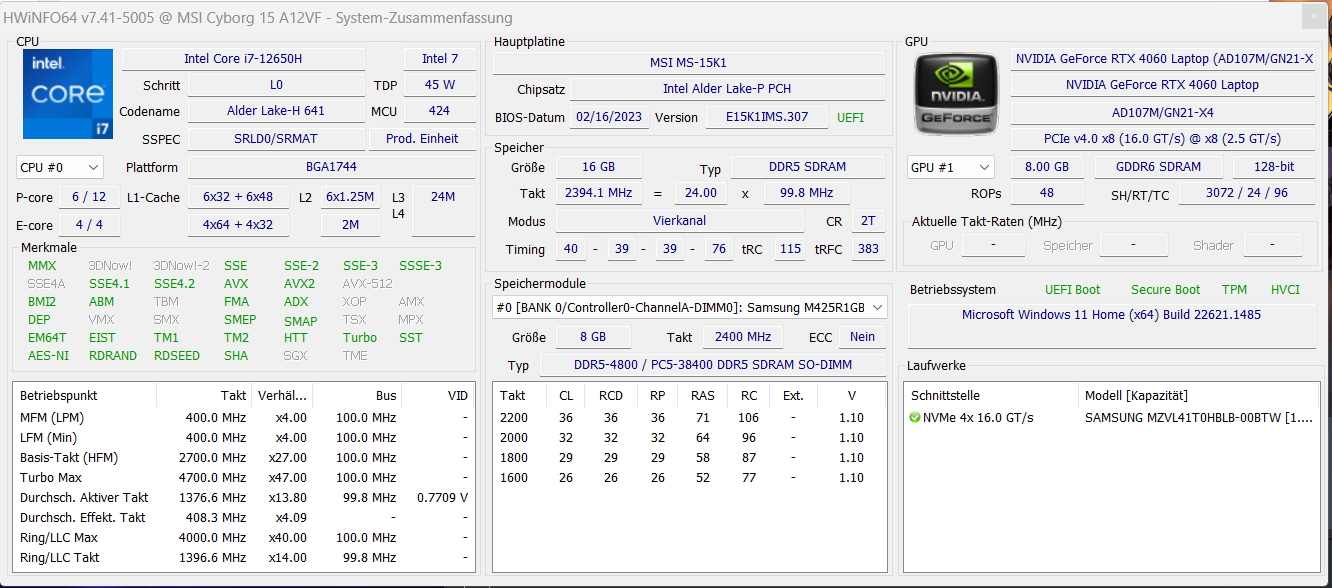
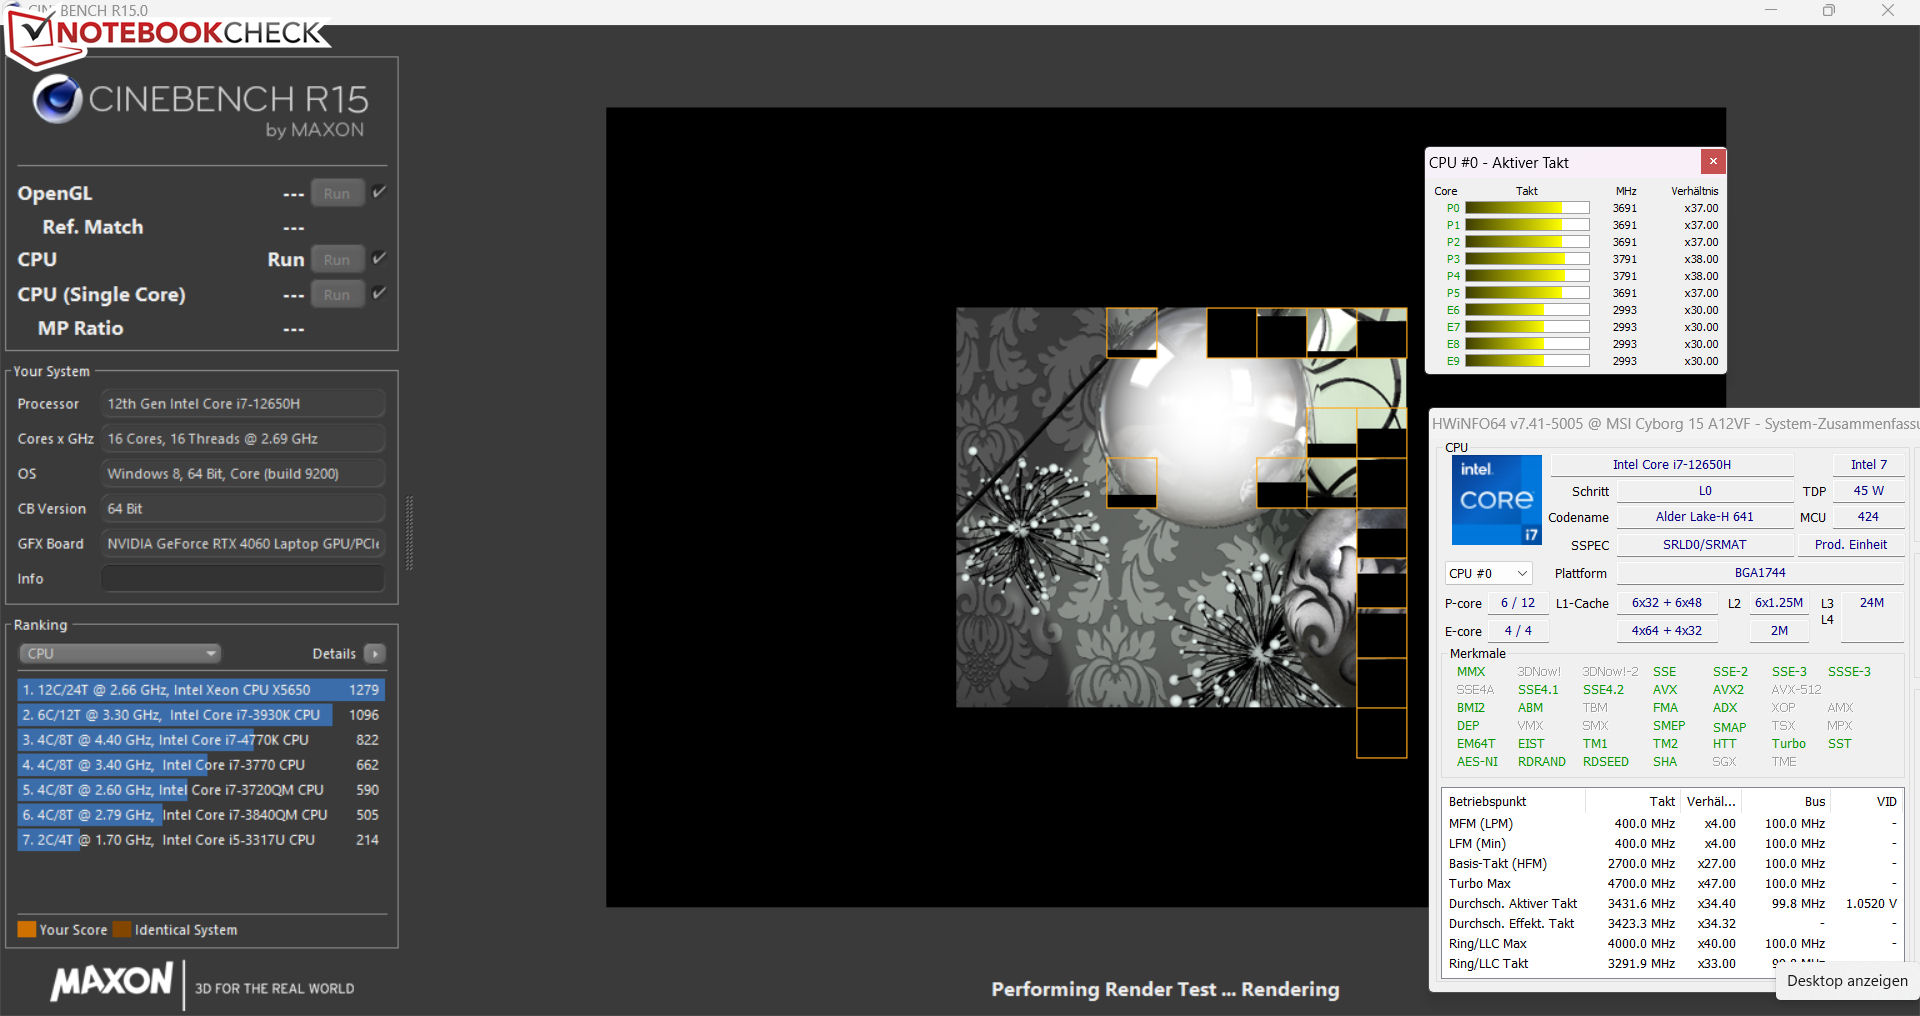
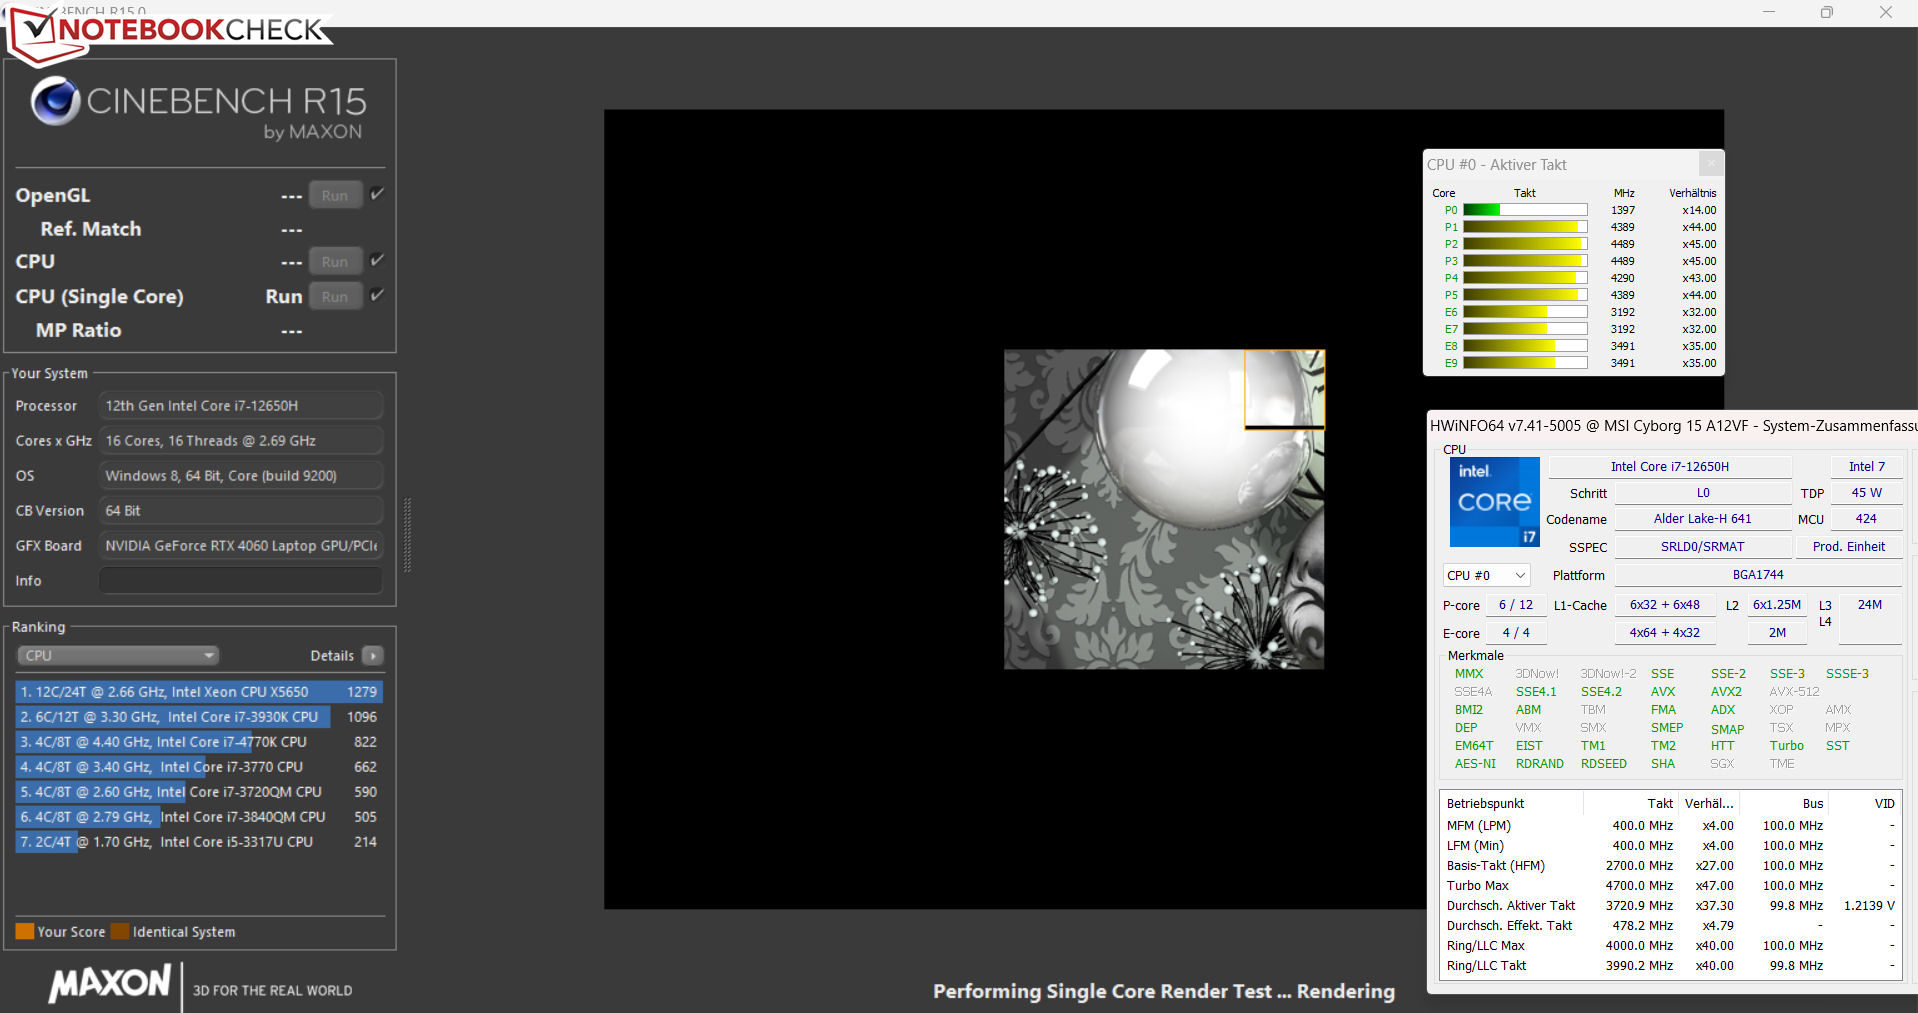
TheCore i7-12650Halder Lake-processorn består av sex Performance-kärnor (hyperthreading, 2,3-4,7 GHz) och fyra Efficiency-kärnor (ingen hyperthreading, 1,7-3,5 GHz), vilket ger totalt sexton logiska CPU-kärnor.
Vid nätdrift kör CPU:n CPU-testerna i Cinebench R15-benchmark vid medelhöga till höga (multitråd) och höga till maximala (enkeltråd) klockfrekvenser. Vid batteridrift sjunker prestandan för en tråd något (205 poäng) och prestandan för flera trådar sjunker mer markant (994 poäng). Sammantaget ligger benchmarkresultaten något över genomsnittet för CPU:n som vi hittills fastställt.
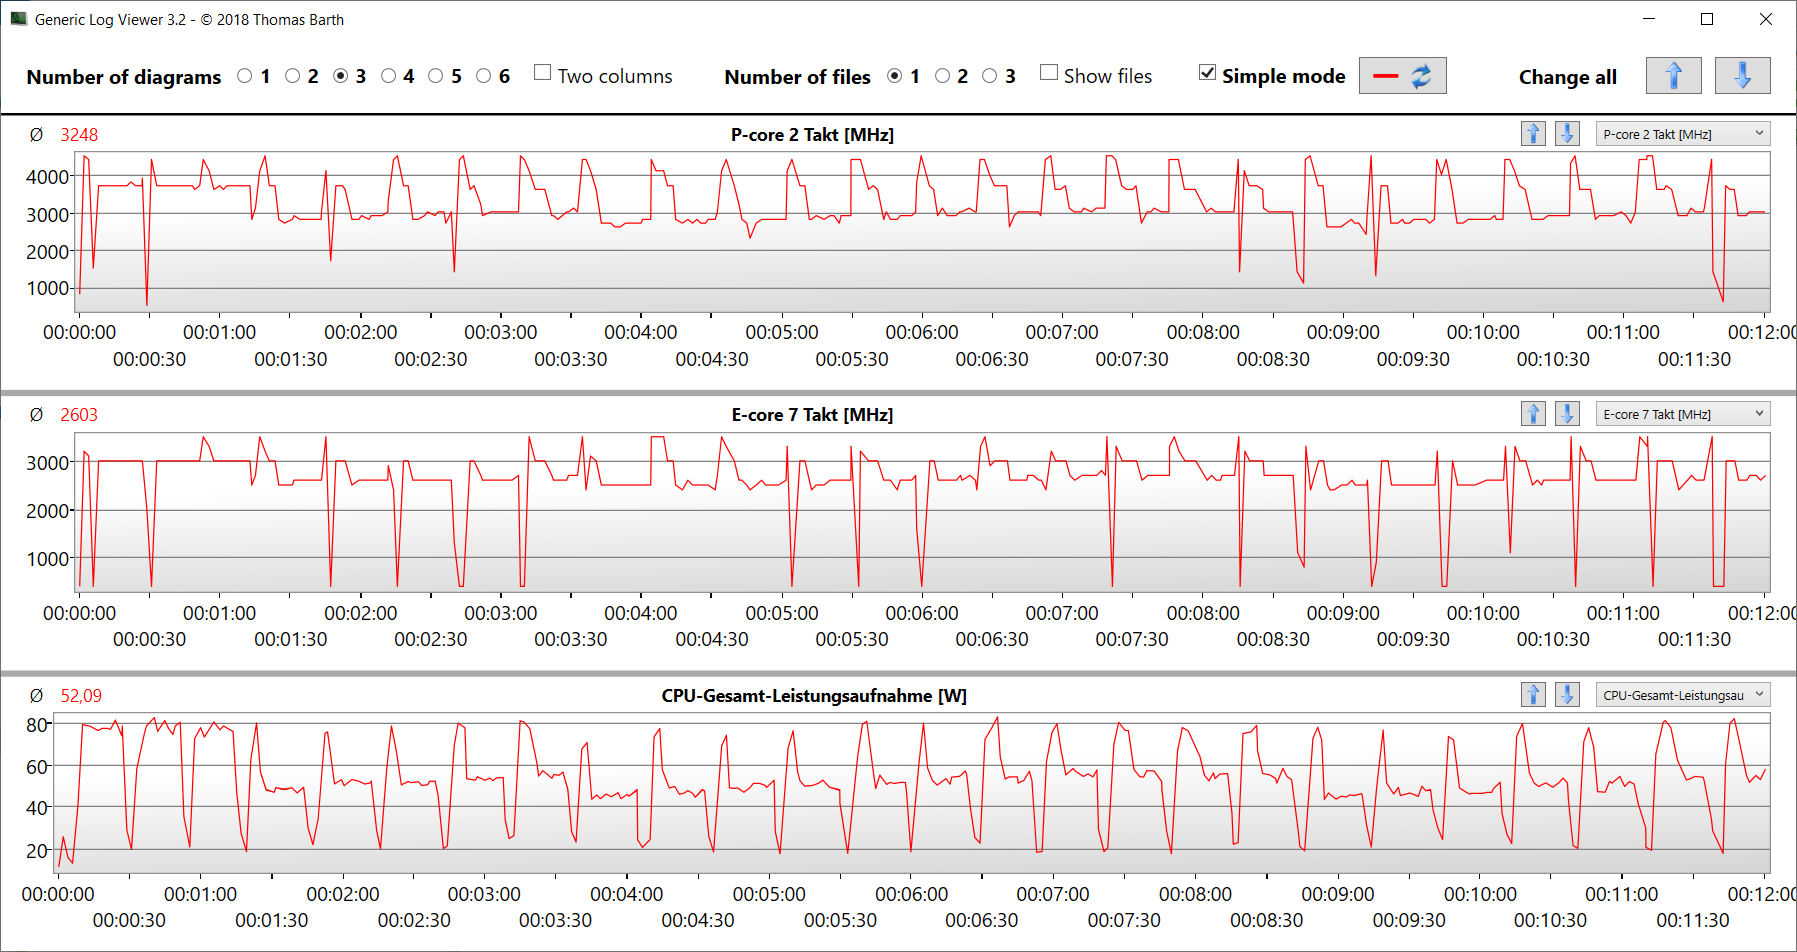
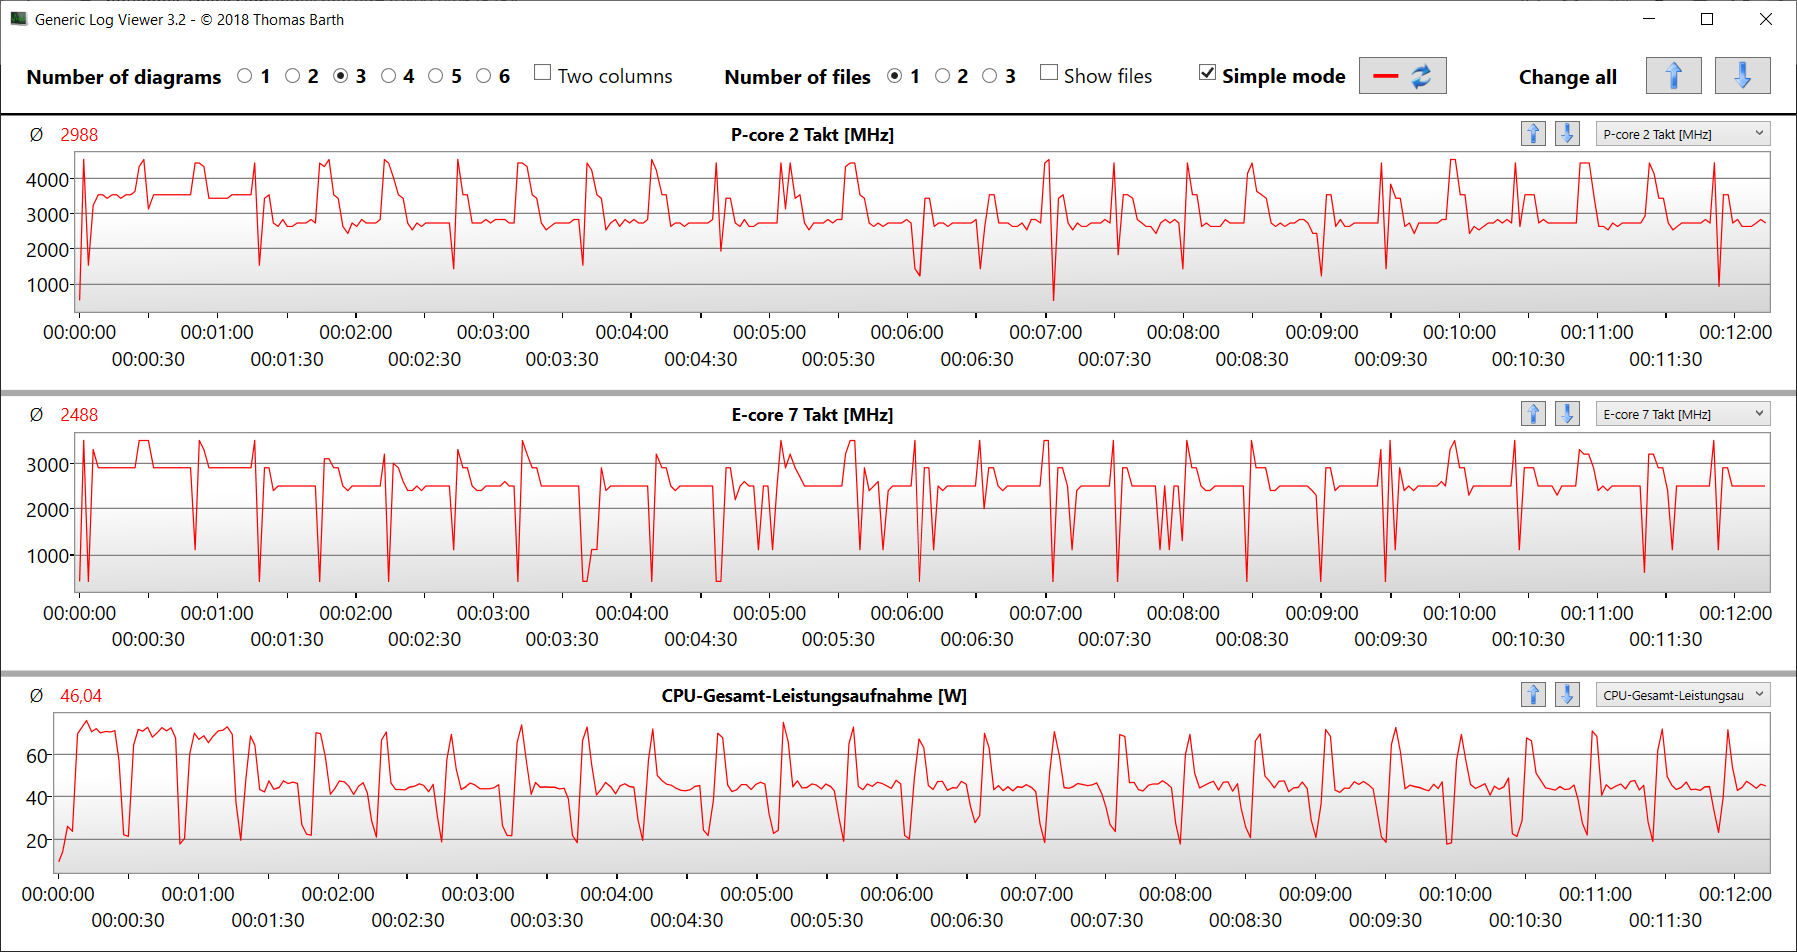
CB15-slingtestet visar att konstant belastning av flera trådar gör att Turbohastigheten sjunker något efter den andra körningen och att processorn inte kan hålla en konstant nivå.
Cinebench R15 Multi Constant Load Test
* ... mindre är bättre
AIDA64: FP32 Ray-Trace | FPU Julia | CPU SHA3 | CPU Queen | FPU SinJulia | FPU Mandel | CPU AES | CPU ZLib | FP64 Ray-Trace | CPU PhotoWorxx
| Performance rating | |
| Genomsnitt av klass Gaming | |
| Asus TUF Gaming A16 FA617 | |
| Aorus 15 XE5 | |
| Schenker XMG Fusion 15 (Mid 22) | |
| MSI Katana 15 B12VEK | |
| MSI Cyborg 15 A12VF | |
| HP Victus 15 fa0020nr | |
| Genomsnitt Intel Core i7-12650H | |
| AIDA64 / FP32 Ray-Trace | |
| Genomsnitt av klass Gaming (10227 - 85542, n=110, senaste 2 åren) | |
| Asus TUF Gaming A16 FA617 | |
| MSI Katana 15 B12VEK | |
| Aorus 15 XE5 | |
| HP Victus 15 fa0020nr | |
| Schenker XMG Fusion 15 (Mid 22) | |
| MSI Cyborg 15 A12VF | |
| Genomsnitt Intel Core i7-12650H (5422 - 15620, n=14) | |
| AIDA64 / FPU Julia | |
| Genomsnitt av klass Gaming (51376 - 238426, n=110, senaste 2 åren) | |
| Asus TUF Gaming A16 FA617 | |
| MSI Katana 15 B12VEK | |
| MSI Cyborg 15 A12VF | |
| Aorus 15 XE5 | |
| HP Victus 15 fa0020nr | |
| Schenker XMG Fusion 15 (Mid 22) | |
| Genomsnitt Intel Core i7-12650H (26386 - 76434, n=14) | |
| AIDA64 / CPU SHA3 | |
| Genomsnitt av klass Gaming (2180 - 9817, n=110, senaste 2 åren) | |
| Schenker XMG Fusion 15 (Mid 22) | |
| Asus TUF Gaming A16 FA617 | |
| MSI Katana 15 B12VEK | |
| Aorus 15 XE5 | |
| MSI Cyborg 15 A12VF | |
| HP Victus 15 fa0020nr | |
| Genomsnitt Intel Core i7-12650H (1479 - 3244, n=14) | |
| AIDA64 / CPU Queen | |
| Genomsnitt av klass Gaming (49785 - 173351, n=101, senaste 2 åren) | |
| Asus TUF Gaming A16 FA617 | |
| Aorus 15 XE5 | |
| HP Victus 15 fa0020nr | |
| MSI Katana 15 B12VEK | |
| Schenker XMG Fusion 15 (Mid 22) | |
| MSI Cyborg 15 A12VF | |
| Genomsnitt Intel Core i7-12650H (59278 - 89537, n=14) | |
| AIDA64 / FPU SinJulia | |
| Genomsnitt av klass Gaming (4424 - 33636, n=110, senaste 2 åren) | |
| Asus TUF Gaming A16 FA617 | |
| Schenker XMG Fusion 15 (Mid 22) | |
| MSI Katana 15 B12VEK | |
| Aorus 15 XE5 | |
| MSI Cyborg 15 A12VF | |
| HP Victus 15 fa0020nr | |
| Genomsnitt Intel Core i7-12650H (4690 - 8726, n=14) | |
| AIDA64 / FPU Mandel | |
| Genomsnitt av klass Gaming (25115 - 128721, n=110, senaste 2 åren) | |
| Asus TUF Gaming A16 FA617 | |
| MSI Katana 15 B12VEK | |
| Schenker XMG Fusion 15 (Mid 22) | |
| HP Victus 15 fa0020nr | |
| MSI Cyborg 15 A12VF | |
| Aorus 15 XE5 | |
| Genomsnitt Intel Core i7-12650H (15001 - 37738, n=14) | |
| AIDA64 / CPU AES | |
| Schenker XMG Fusion 15 (Mid 22) | |
| Aorus 15 XE5 | |
| Genomsnitt av klass Gaming (39258 - 247074, n=110, senaste 2 åren) | |
| MSI Katana 15 B12VEK | |
| MSI Cyborg 15 A12VF | |
| Asus TUF Gaming A16 FA617 | |
| HP Victus 15 fa0020nr | |
| Genomsnitt Intel Core i7-12650H (32702 - 92530, n=14) | |
| AIDA64 / CPU ZLib | |
| Genomsnitt av klass Gaming (574 - 2531, n=110, senaste 2 åren) | |
| MSI Cyborg 15 A12VF | |
| Asus TUF Gaming A16 FA617 | |
| MSI Katana 15 B12VEK | |
| Aorus 15 XE5 | |
| HP Victus 15 fa0020nr | |
| Genomsnitt Intel Core i7-12650H (443 - 891, n=14) | |
| Schenker XMG Fusion 15 (Mid 22) | |
| AIDA64 / FP64 Ray-Trace | |
| Genomsnitt av klass Gaming (5509 - 45446, n=110, senaste 2 åren) | |
| Asus TUF Gaming A16 FA617 | |
| MSI Katana 15 B12VEK | |
| Schenker XMG Fusion 15 (Mid 22) | |
| Aorus 15 XE5 | |
| HP Victus 15 fa0020nr | |
| MSI Cyborg 15 A12VF | |
| Genomsnitt Intel Core i7-12650H (3096 - 8448, n=14) | |
| AIDA64 / CPU PhotoWorxx | |
| Genomsnitt av klass Gaming (12271 - 89891, n=110, senaste 2 åren) | |
| MSI Katana 15 B12VEK | |
| MSI Cyborg 15 A12VF | |
| Aorus 15 XE5 | |
| Genomsnitt Intel Core i7-12650H (22046 - 44164, n=14) | |
| Asus TUF Gaming A16 FA617 | |
| Schenker XMG Fusion 15 (Mid 22) | |
| HP Victus 15 fa0020nr | |
Systemets prestanda
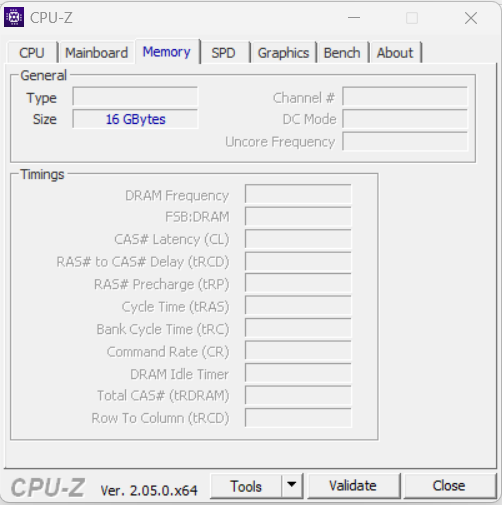
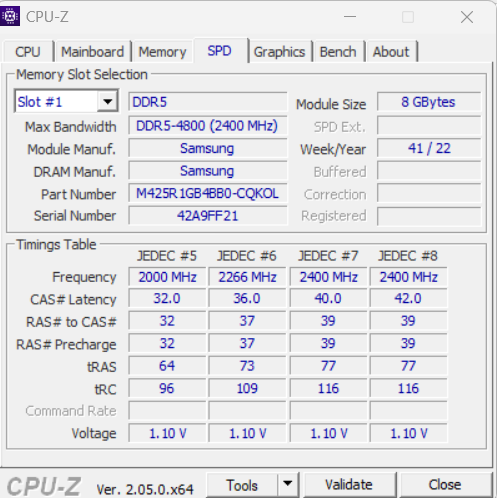
Du kan inte förvänta dig en extrem prestanda från det smidigt fungerande systemet, eftersom det fokuserar mer på andra aspekter som kompakt storlek, mobilitet och låg energiförbrukning. Den hårdvara som används kan dock hantera krävande tillämpningsområden som rendering, videobearbetning och spel. Överföringshastigheterna för arbetsminnet ligger på en normal nivå för DDR5-4800 RAM-minne. De åtföljs av goda PC-Mark-resultat.
CrossMark: Overall | Productivity | Creativity | Responsiveness
| PCMark 10 / Score | |
| Genomsnitt av klass Gaming (5828 - 11574, n=96, senaste 2 åren) | |
| Aorus 15 XE5 | |
| Asus TUF Gaming A16 FA617 | |
| MSI Cyborg 15 A12VF | |
| Genomsnitt Intel Core i7-12650H, NVIDIA GeForce RTX 4060 Laptop GPU (n=1) | |
| HP Victus 15 fa0020nr | |
| MSI Katana 15 B12VEK | |
| Schenker XMG Fusion 15 (Mid 22) | |
| PCMark 10 / Essentials | |
| Aorus 15 XE5 | |
| MSI Cyborg 15 A12VF | |
| Genomsnitt Intel Core i7-12650H, NVIDIA GeForce RTX 4060 Laptop GPU (n=1) | |
| Genomsnitt av klass Gaming (8810 - 12600, n=100, senaste 2 åren) | |
| Asus TUF Gaming A16 FA617 | |
| HP Victus 15 fa0020nr | |
| MSI Katana 15 B12VEK | |
| Schenker XMG Fusion 15 (Mid 22) | |
| PCMark 10 / Productivity | |
| Genomsnitt av klass Gaming (6845 - 18766, n=98, senaste 2 åren) | |
| Aorus 15 XE5 | |
| MSI Cyborg 15 A12VF | |
| Genomsnitt Intel Core i7-12650H, NVIDIA GeForce RTX 4060 Laptop GPU (n=1) | |
| MSI Katana 15 B12VEK | |
| Asus TUF Gaming A16 FA617 | |
| HP Victus 15 fa0020nr | |
| Schenker XMG Fusion 15 (Mid 22) | |
| PCMark 10 / Digital Content Creation | |
| Genomsnitt av klass Gaming (7602 - 19657, n=98, senaste 2 åren) | |
| Aorus 15 XE5 | |
| Asus TUF Gaming A16 FA617 | |
| HP Victus 15 fa0020nr | |
| MSI Cyborg 15 A12VF | |
| Genomsnitt Intel Core i7-12650H, NVIDIA GeForce RTX 4060 Laptop GPU (n=1) | |
| MSI Katana 15 B12VEK | |
| Schenker XMG Fusion 15 (Mid 22) | |
| CrossMark / Overall | |
| Genomsnitt av klass Gaming (1366 - 2409, n=98, senaste 2 åren) | |
| Aorus 15 XE5 | |
| MSI Cyborg 15 A12VF | |
| Genomsnitt Intel Core i7-12650H, NVIDIA GeForce RTX 4060 Laptop GPU (n=1) | |
| MSI Katana 15 B12VEK | |
| Schenker XMG Fusion 15 (Mid 22) | |
| HP Victus 15 fa0020nr | |
| CrossMark / Productivity | |
| Aorus 15 XE5 | |
| Genomsnitt av klass Gaming (1386 - 2254, n=98, senaste 2 åren) | |
| MSI Cyborg 15 A12VF | |
| Genomsnitt Intel Core i7-12650H, NVIDIA GeForce RTX 4060 Laptop GPU (n=1) | |
| MSI Katana 15 B12VEK | |
| Schenker XMG Fusion 15 (Mid 22) | |
| HP Victus 15 fa0020nr | |
| CrossMark / Creativity | |
| Genomsnitt av klass Gaming (1343 - 2729, n=98, senaste 2 åren) | |
| Aorus 15 XE5 | |
| MSI Cyborg 15 A12VF | |
| Genomsnitt Intel Core i7-12650H, NVIDIA GeForce RTX 4060 Laptop GPU (n=1) | |
| MSI Katana 15 B12VEK | |
| HP Victus 15 fa0020nr | |
| Schenker XMG Fusion 15 (Mid 22) | |
| CrossMark / Responsiveness | |
| Aorus 15 XE5 | |
| Genomsnitt av klass Gaming (1226 - 2334, n=98, senaste 2 åren) | |
| MSI Cyborg 15 A12VF | |
| Genomsnitt Intel Core i7-12650H, NVIDIA GeForce RTX 4060 Laptop GPU (n=1) | |
| Schenker XMG Fusion 15 (Mid 22) | |
| MSI Katana 15 B12VEK | |
| HP Victus 15 fa0020nr | |
| PCMark 8 Home Score Accelerated v2 | 5364 poäng | |
| PCMark 8 Work Score Accelerated v2 | 6432 poäng | |
| PCMark 10 Score | 7098 poäng | |
Hjälp | ||
| AIDA64 / Memory Copy | |
| Genomsnitt av klass Gaming (21750 - 129946, n=110, senaste 2 åren) | |
| MSI Cyborg 15 A12VF | |
| MSI Katana 15 B12VEK | |
| Genomsnitt Intel Core i7-12650H (43261 - 69735, n=14) | |
| Aorus 15 XE5 | |
| Asus TUF Gaming A16 FA617 | |
| Schenker XMG Fusion 15 (Mid 22) | |
| HP Victus 15 fa0020nr | |
| AIDA64 / Memory Read | |
| Genomsnitt av klass Gaming (22956 - 118858, n=110, senaste 2 åren) | |
| MSI Katana 15 B12VEK | |
| MSI Cyborg 15 A12VF | |
| Aorus 15 XE5 | |
| Genomsnitt Intel Core i7-12650H (47313 - 67412, n=14) | |
| Asus TUF Gaming A16 FA617 | |
| Schenker XMG Fusion 15 (Mid 22) | |
| HP Victus 15 fa0020nr | |
| AIDA64 / Memory Write | |
| Genomsnitt av klass Gaming (22297 - 135096, n=110, senaste 2 åren) | |
| Aorus 15 XE5 | |
| MSI Katana 15 B12VEK | |
| MSI Cyborg 15 A12VF | |
| Asus TUF Gaming A16 FA617 | |
| Genomsnitt Intel Core i7-12650H (45617 - 59361, n=14) | |
| Schenker XMG Fusion 15 (Mid 22) | |
| HP Victus 15 fa0020nr | |
| AIDA64 / Memory Latency | |
| Genomsnitt av klass Gaming (75.3 - 259, n=110, senaste 2 åren) | |
| Aorus 15 XE5 | |
| MSI Katana 15 B12VEK | |
| Schenker XMG Fusion 15 (Mid 22) | |
| MSI Cyborg 15 A12VF | |
| Asus TUF Gaming A16 FA617 | |
| Genomsnitt Intel Core i7-12650H (71.6 - 103.9, n=14) | |
| HP Victus 15 fa0020nr | |
* ... mindre är bättre
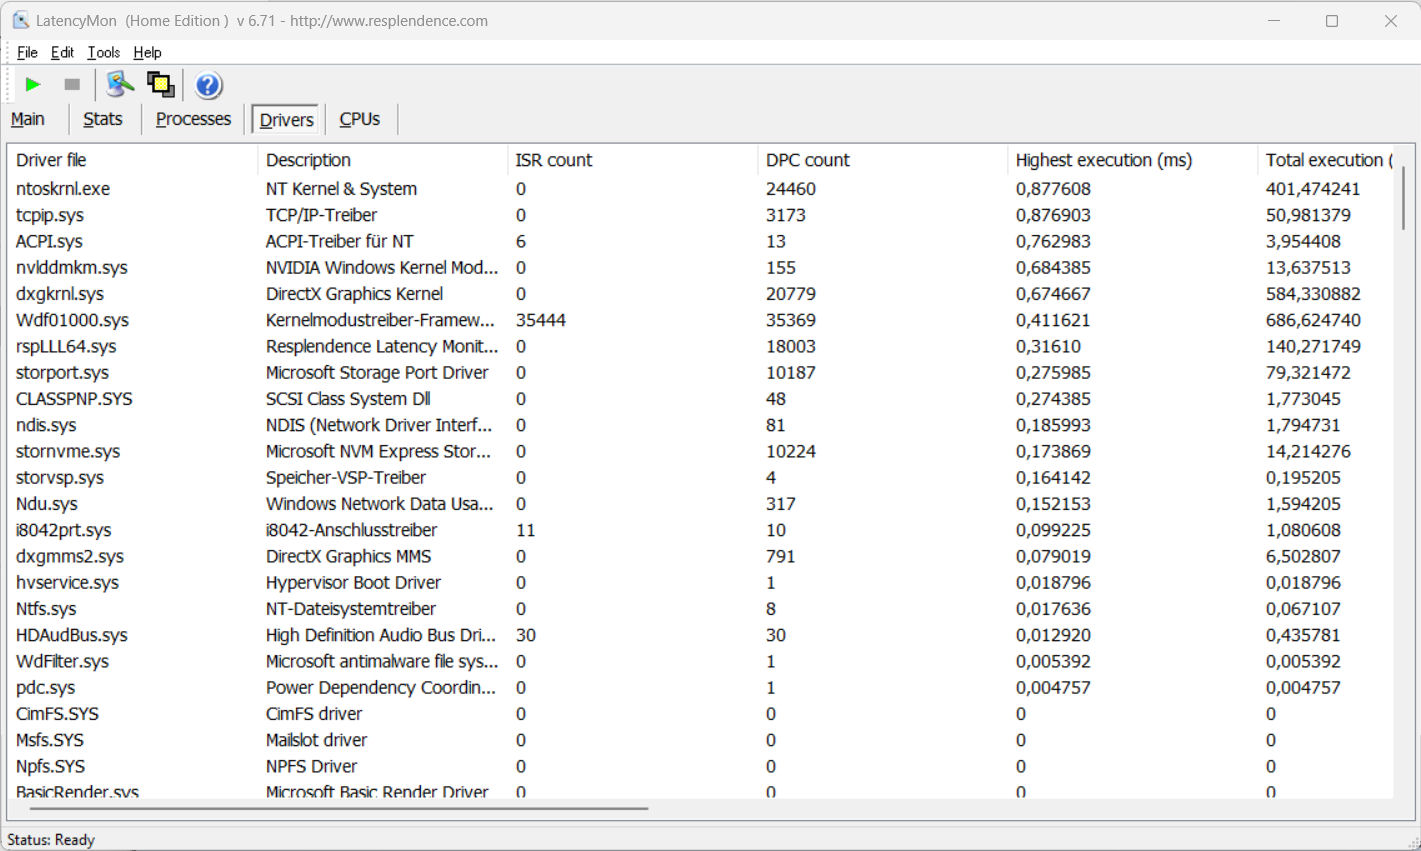
DPC-latenstider
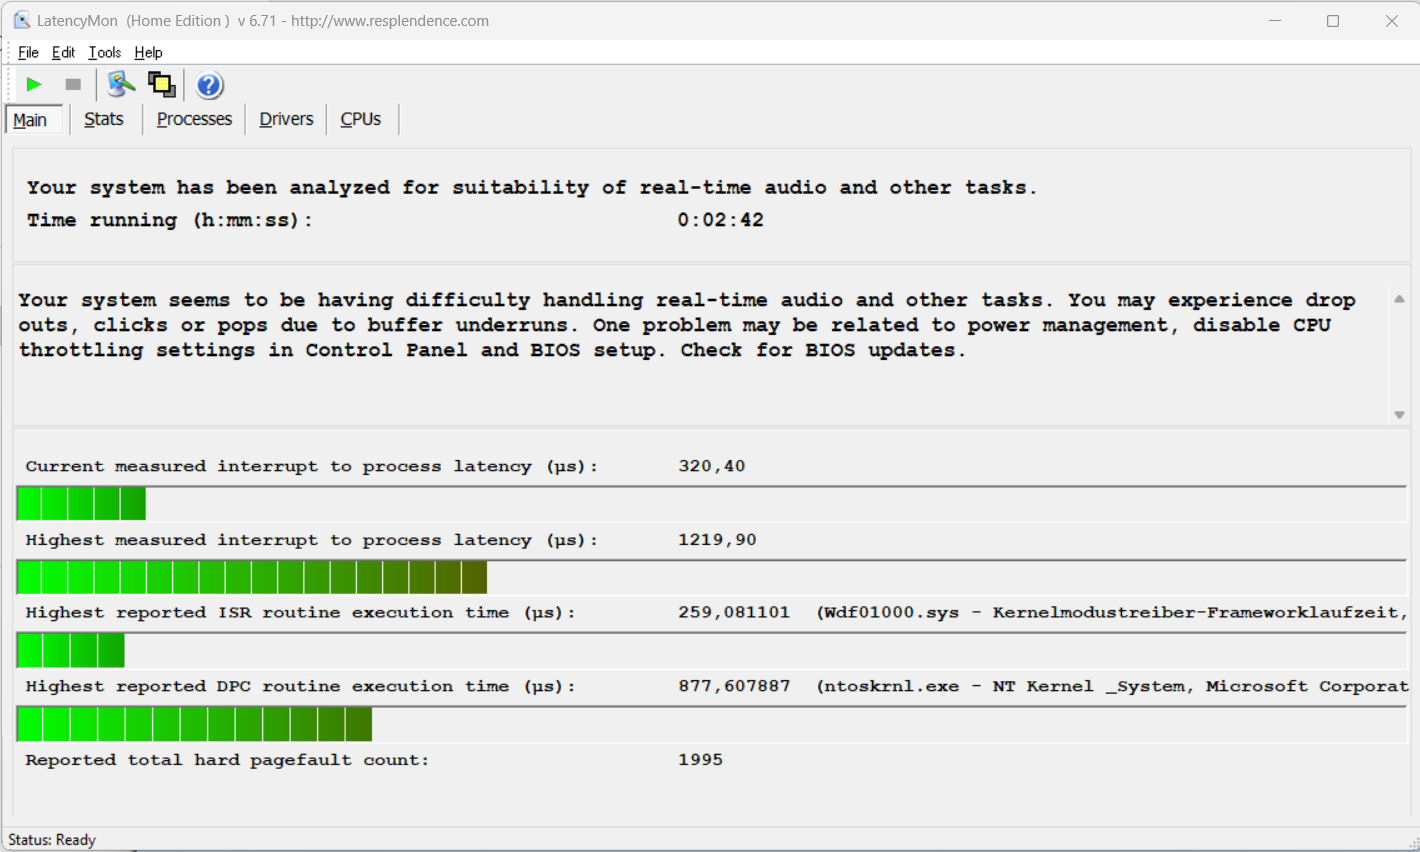
Det standardiserade Latency Monitor-testet (webbsurfning, 4k-videoåtergivning, Prime95 hög belastning) avslöjar några tydliga fördröjningar, och systemet verkar inte lämpat för video- och ljudbearbetning i realtid. Framtida mjukvaruuppdateringar kan leda till vissa förbättringar eller till och med göra saker och ting värre.
| DPC Latencies / LatencyMon - interrupt to process latency (max), Web, Youtube, Prime95 | |
| MSI Katana 15 B12VEK | |
| Schenker XMG Fusion 15 (Mid 22) | |
| HP Victus 15 fa0020nr | |
| MSI Cyborg 15 A12VF | |
| Aorus 15 XE5 | |
| Asus TUF Gaming A16 FA617 | |
* ... mindre är bättre
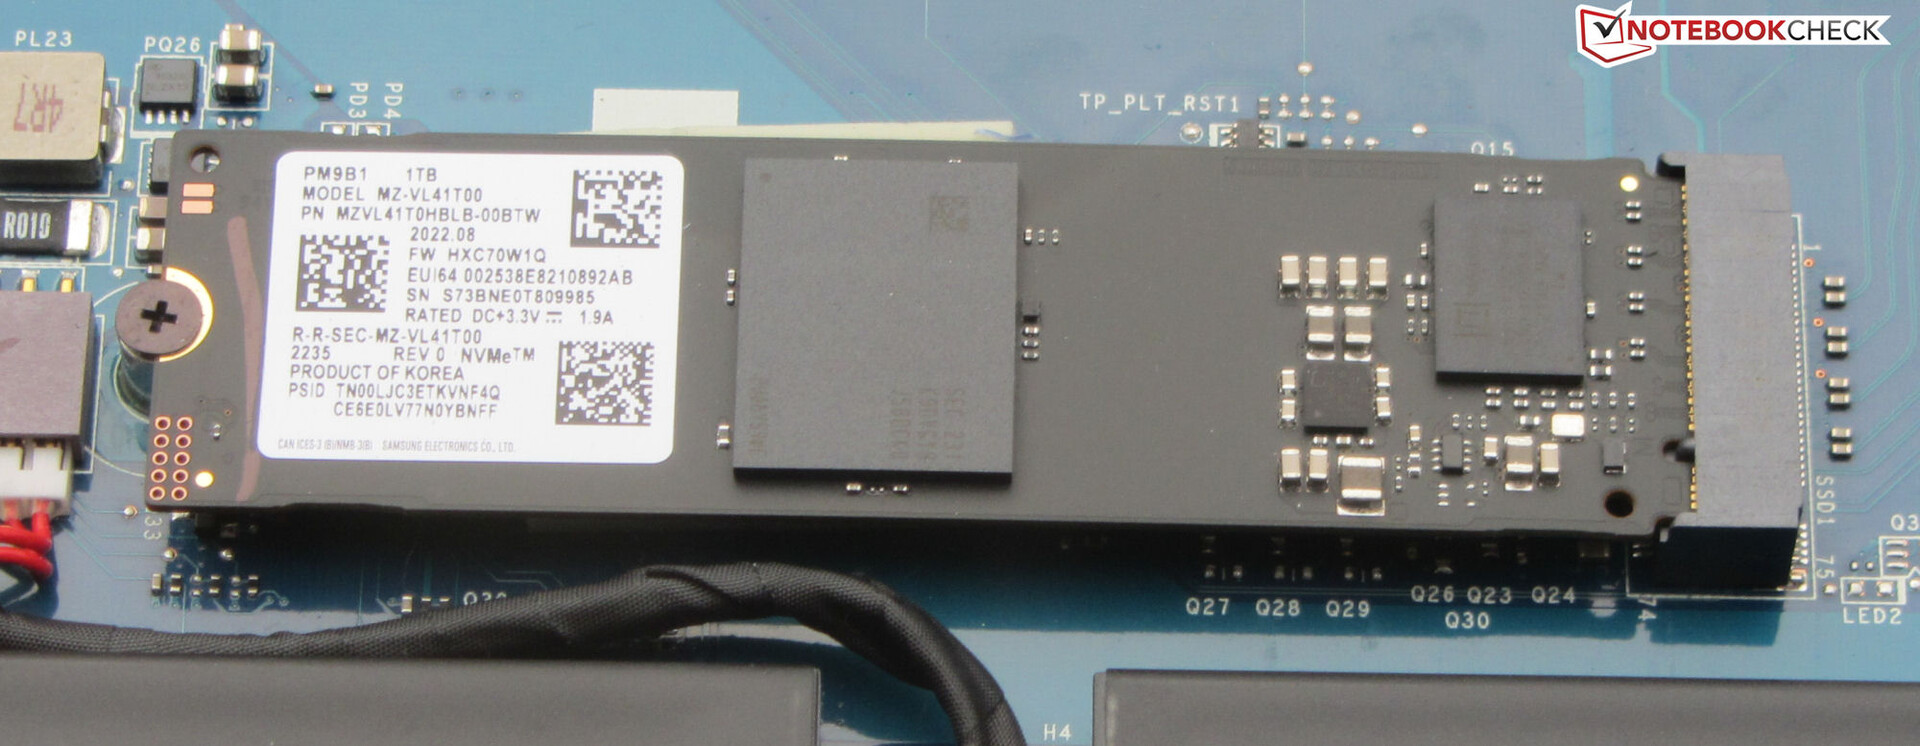
Lagringslösning
MSI har utrustat Cyborg med en PCIe 4 SSD (M.2-2280) från Samsung med en lagringskapacitet på 1 TB. Även om den levererar bra överföringshastigheter är den inte en av toppmodellerna bland SSD:er.
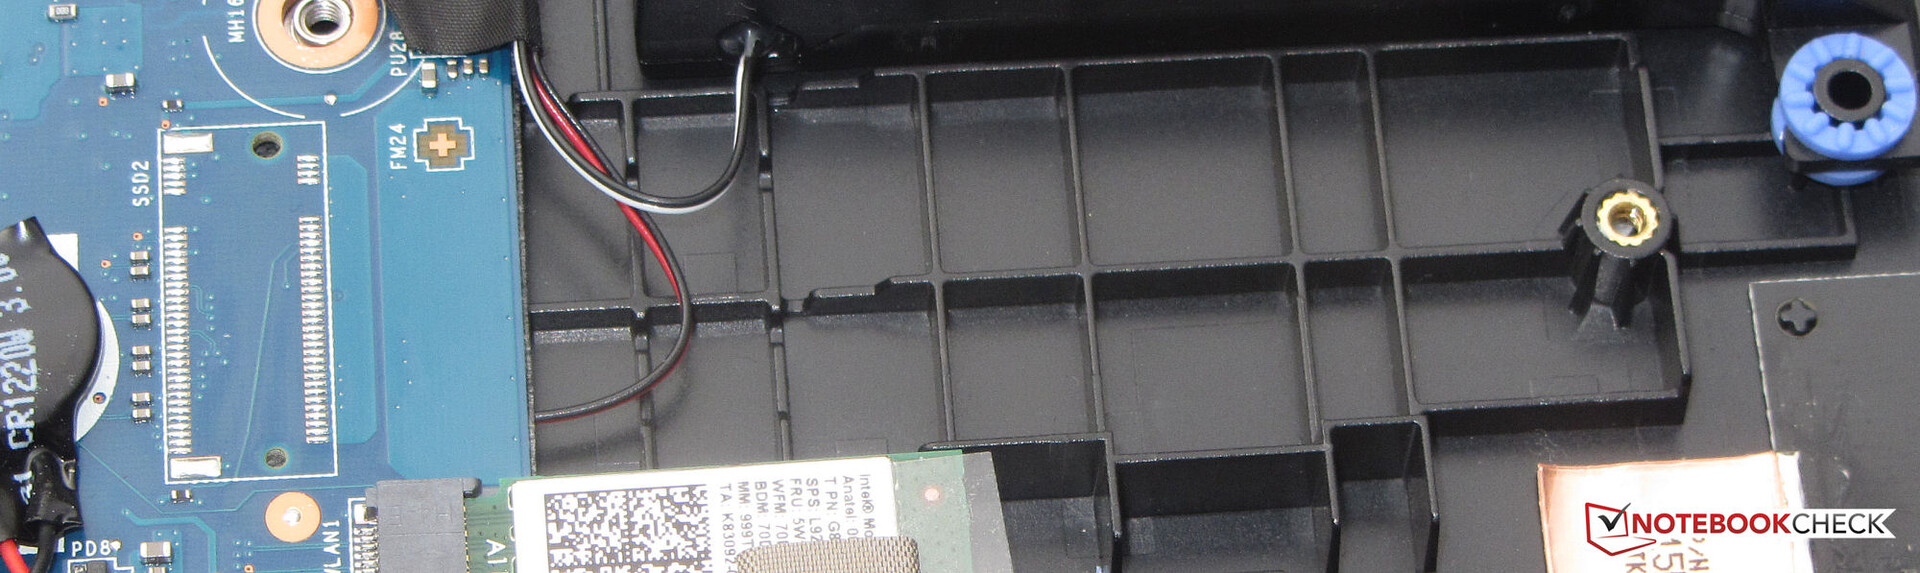
Även om det finns plats för en andra SSD i den bärbara datorn sparar MSI på den nödvändiga slitsen för att ansluta den. Detta beslut är svårt att motivera i en bärbar dator i den här prisklassen. Möjligheten att lägga till en andra lagringsmodul har blivit standard vid det här laget, särskilt för en bärbar dator för spel.

* ... mindre är bättre
Disk Throttling: DiskSpd Read Loop, Queue Depth 8
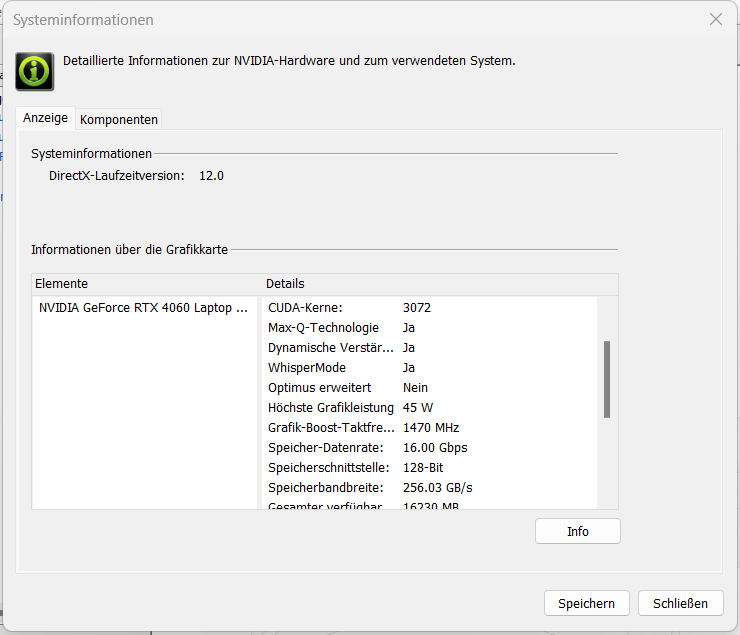
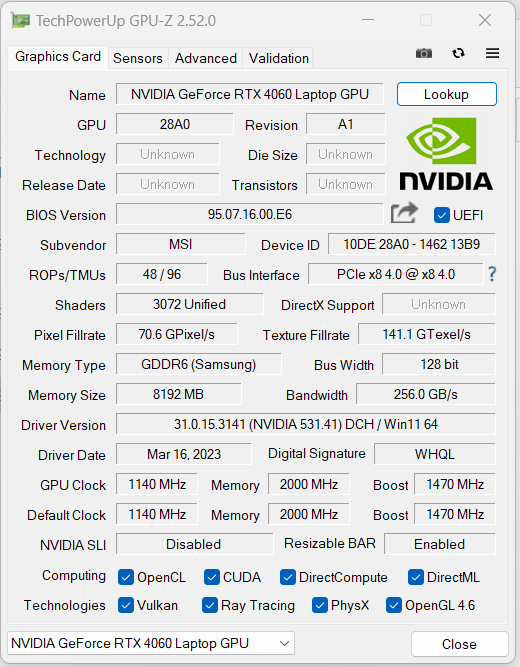
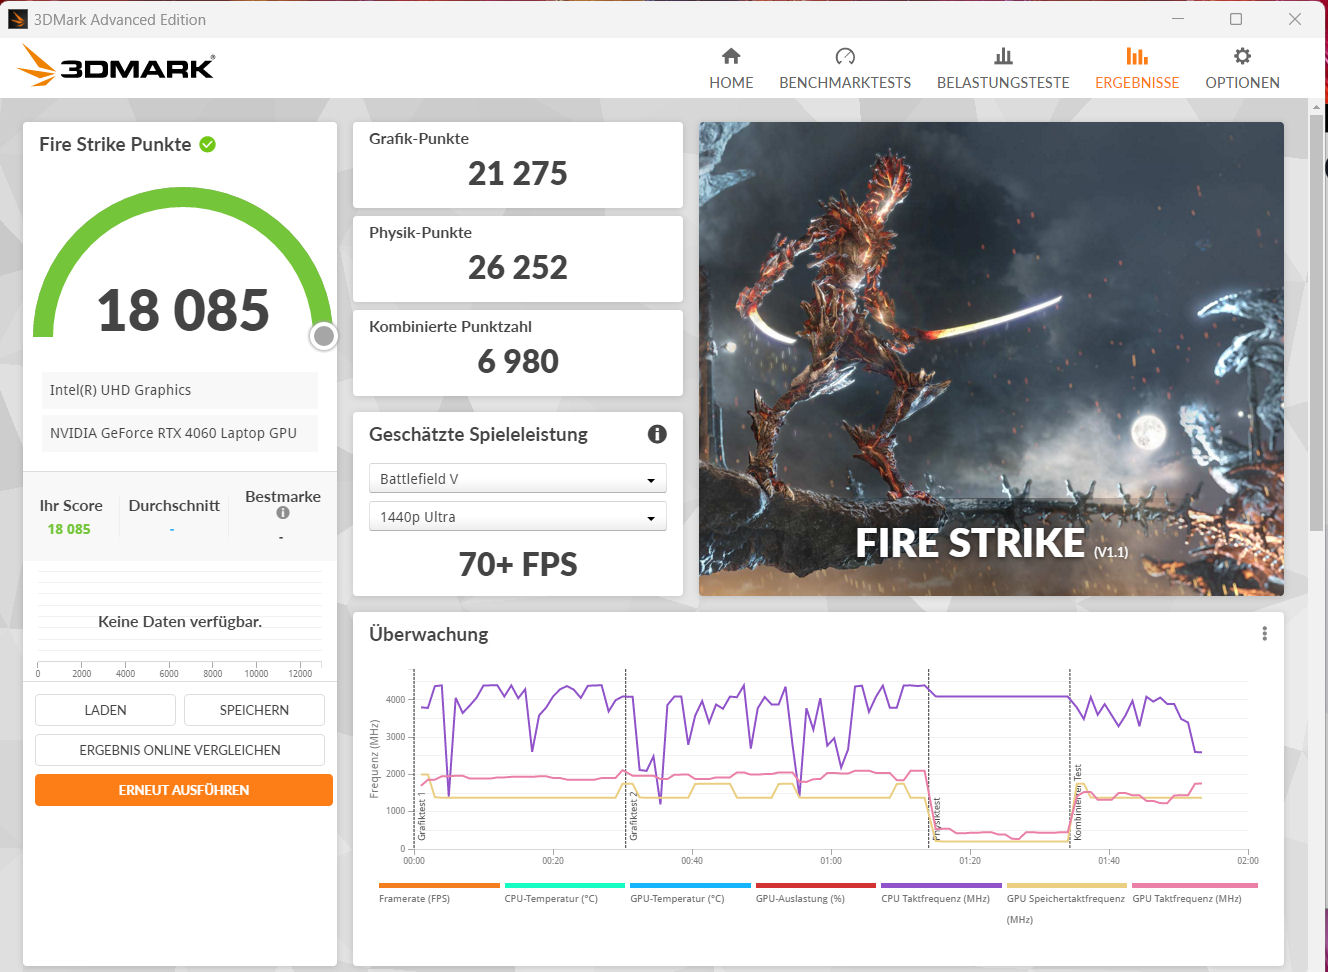
Grafikkort
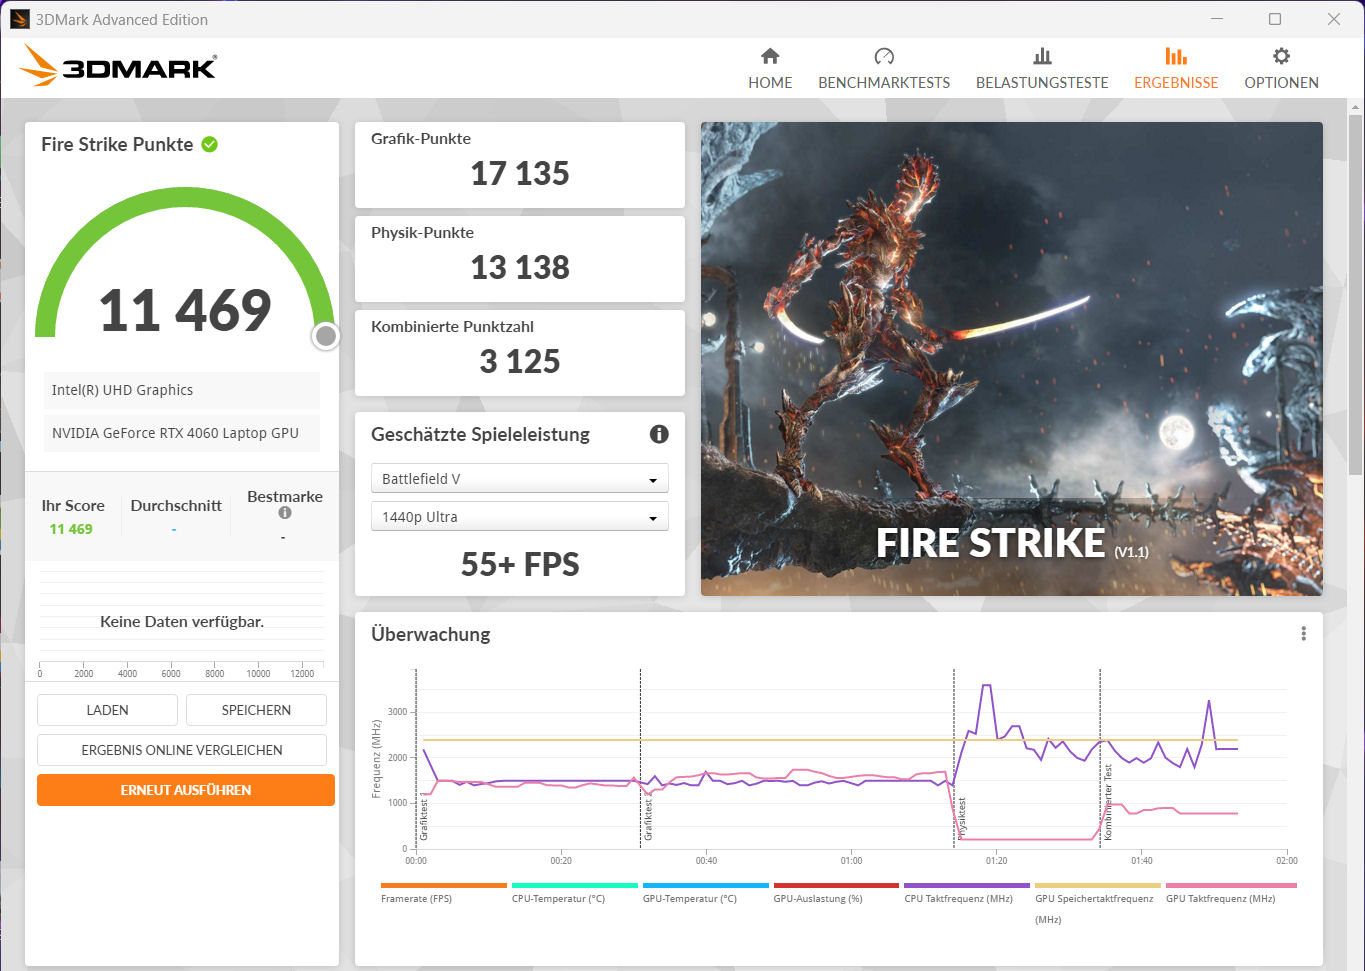
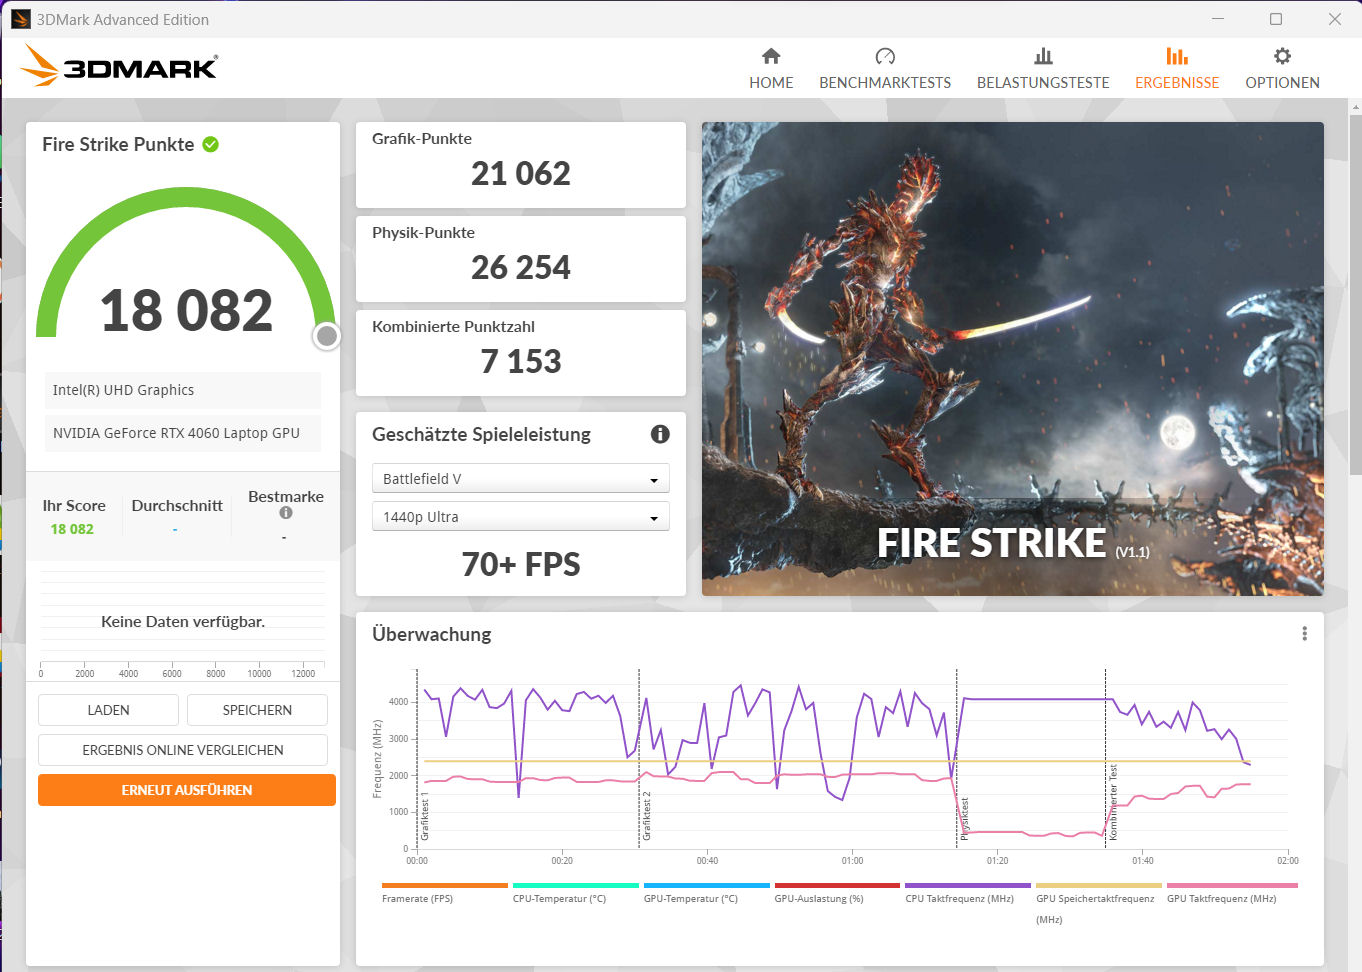
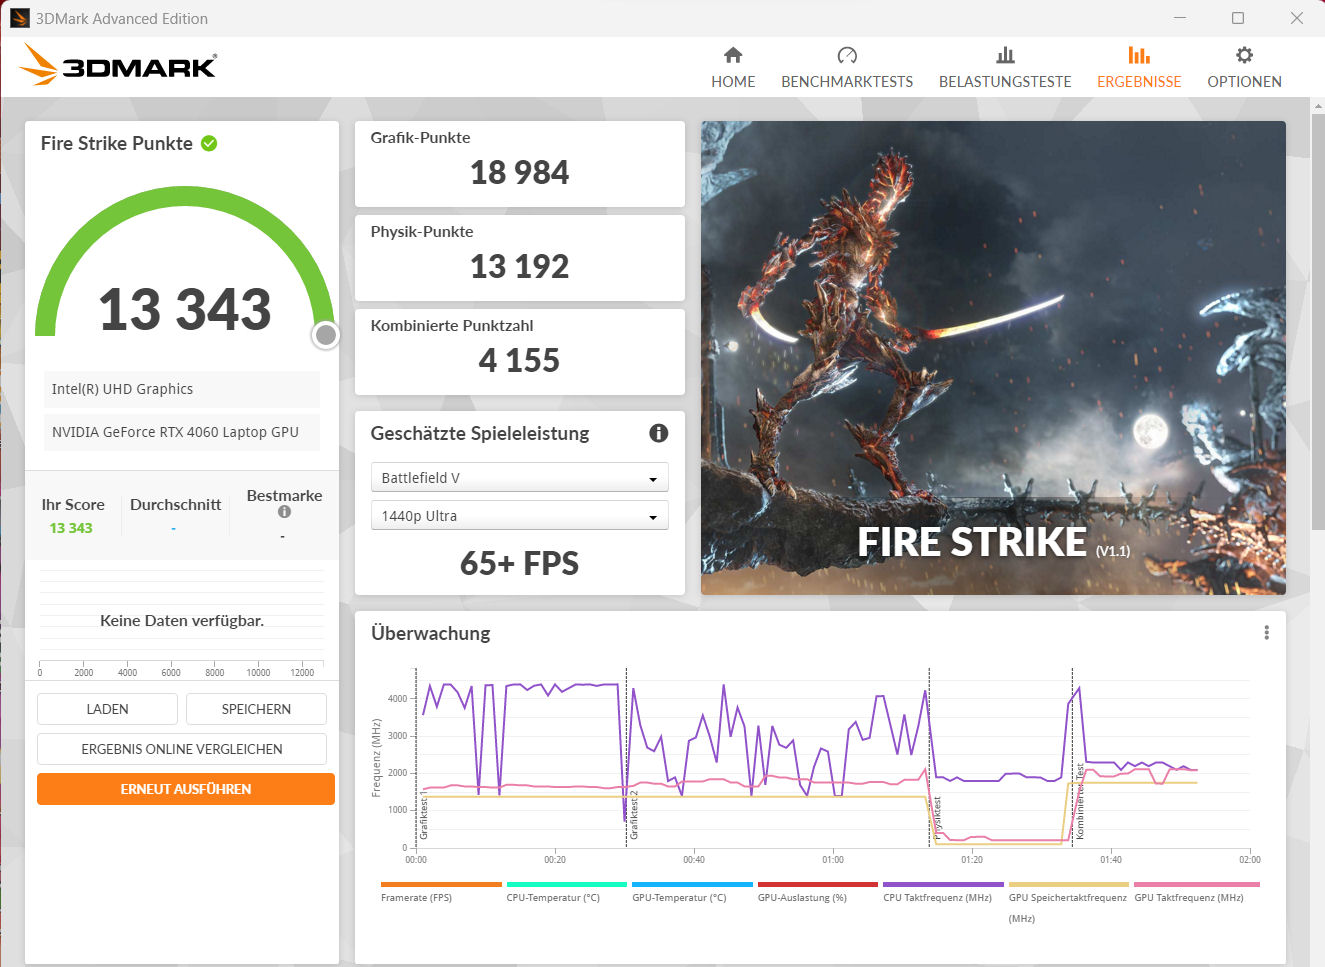
TheGeForce RTX 4060 bärbar datorgPU har 3 072 shaders, en 128-bitars buss och 8 192 MB snabbt GDDR6-minne. MSI konfigurerar en TGP på 45 watt (35 watt + 10 watt dynamisk), vilket är ett värde i den nedre delen av dess kapacitet. Men TGP:n används åtminstone fullt ut, enligt vårt The Witcher 3 -test. Den bärbara datorn erbjuder inget dGPU-läge.
Det är inte förvånande att benchmarkresultaten ligger under det nuvarande genomsnittet för RTX 4060 GPU:er, men vi måste överväga dem i samband med strömförbrukningen. Med en TGP som är mer än dubbelt så hög är RTX 4060 GPU:n (TGP: 105 Watt) i denMSI Katana 17resultat som "bara" är 30-40 procent högre i genomsnitt. Detta innebär att RTX 4060 med 45 watt körs mycket effektivt här.
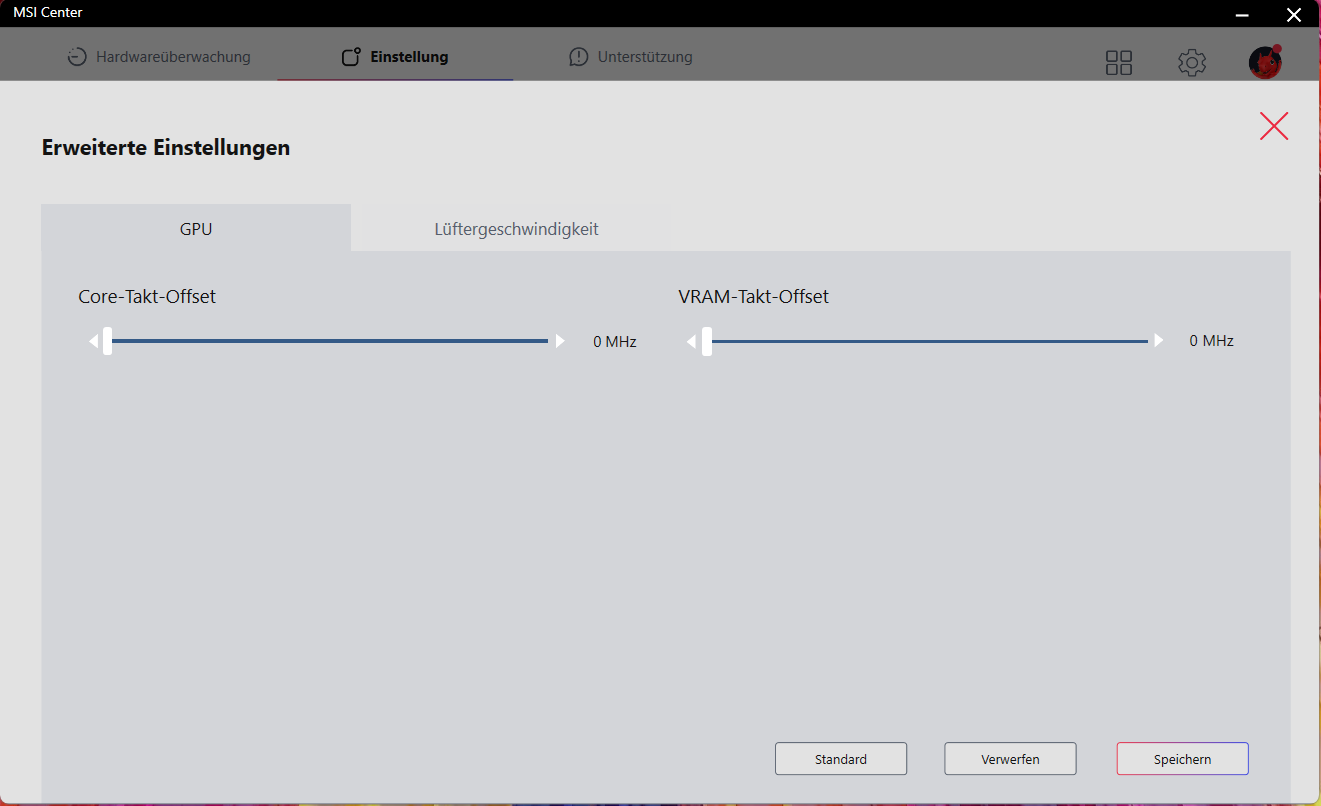
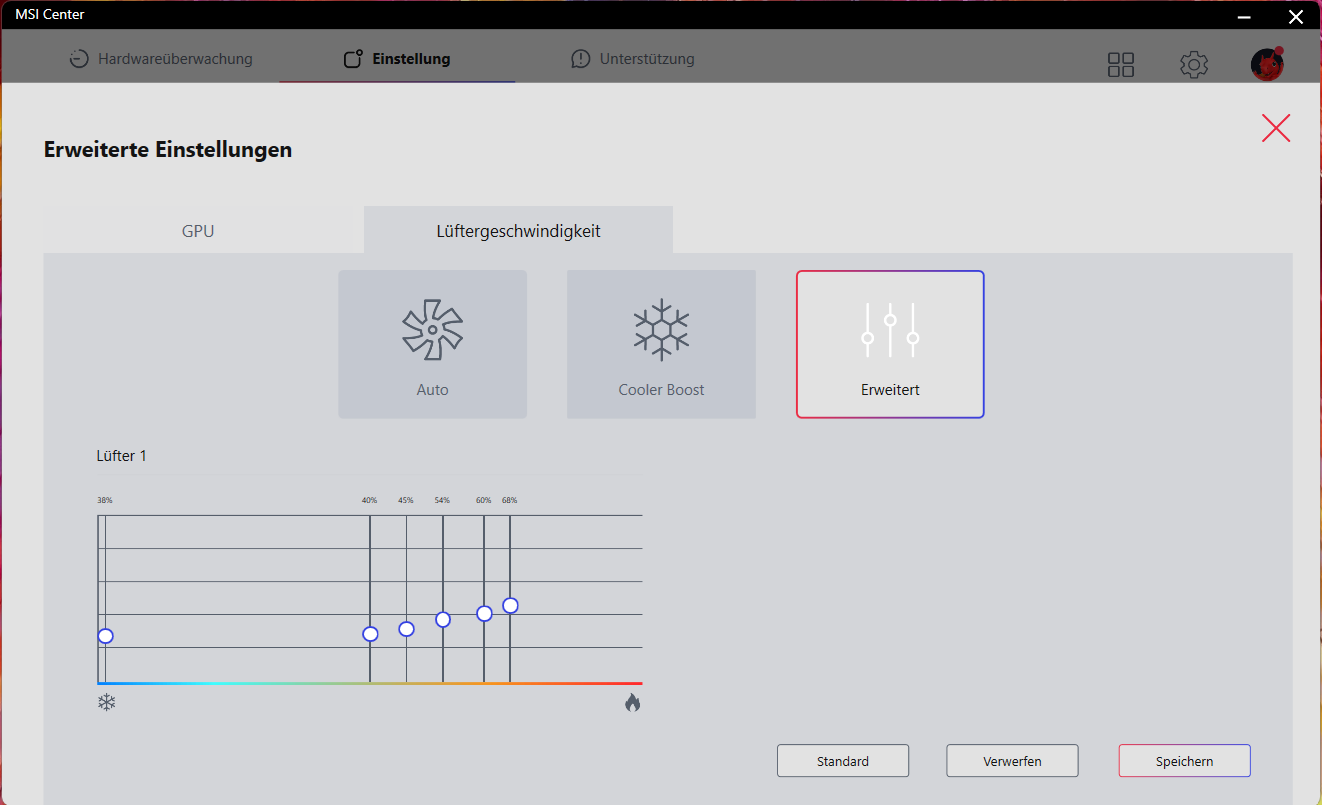
MSI Center erbjuder överklockningsalternativ för GPU och grafiklagring, men endast när profilen "Extreme Performance" är aktiverad (du måste klicka på kugghjulssymbolen). Du använder alltid det här alternativet på egen risk, och om det uppstår problem eller instabilitet måste du ta bort överklockningen.

| 3DMark 06 Standard Score | 48240 poäng | |
| 3DMark 11 Performance | 26146 poäng | |
| 3DMark Cloud Gate Standard Score | 57304 poäng | |
| 3DMark Fire Strike Score | 18086 poäng | |
| 3DMark Time Spy Score | 7918 poäng | |
Hjälp | ||
* ... mindre är bättre
Spelprestanda
Den bärbara datorn är utformad för FHD-spel med höga till maximala inställningar. Du kan använda högre upplösningar om du ansluter motsvarande bildskärm - men endast med delvis reducerade inställningar. Bildfrekvensen i de spel vi testade ligger under det genomsnitt som vi fastställt för RTX 4060 GPU:er.
| The Witcher 3 - 1920x1080 Ultra Graphics & Postprocessing (HBAO+) | |
| Genomsnitt av klass Gaming (95 - 240, n=8, senaste 2 åren) | |
| MSI Katana 17 B13VFK | |
| Genomsnitt NVIDIA GeForce RTX 4060 Laptop GPU (77 - 159.7, n=42) | |
| Aorus 15 XE5 | |
| Schenker XMG Fusion 15 (Mid 22) | |
| Asus TUF Gaming A16 FA617 | |
| MSI Katana 15 B12VEK | |
| MSI Cyborg 15 A12VF | |
| HP Victus 15 fa0020nr | |
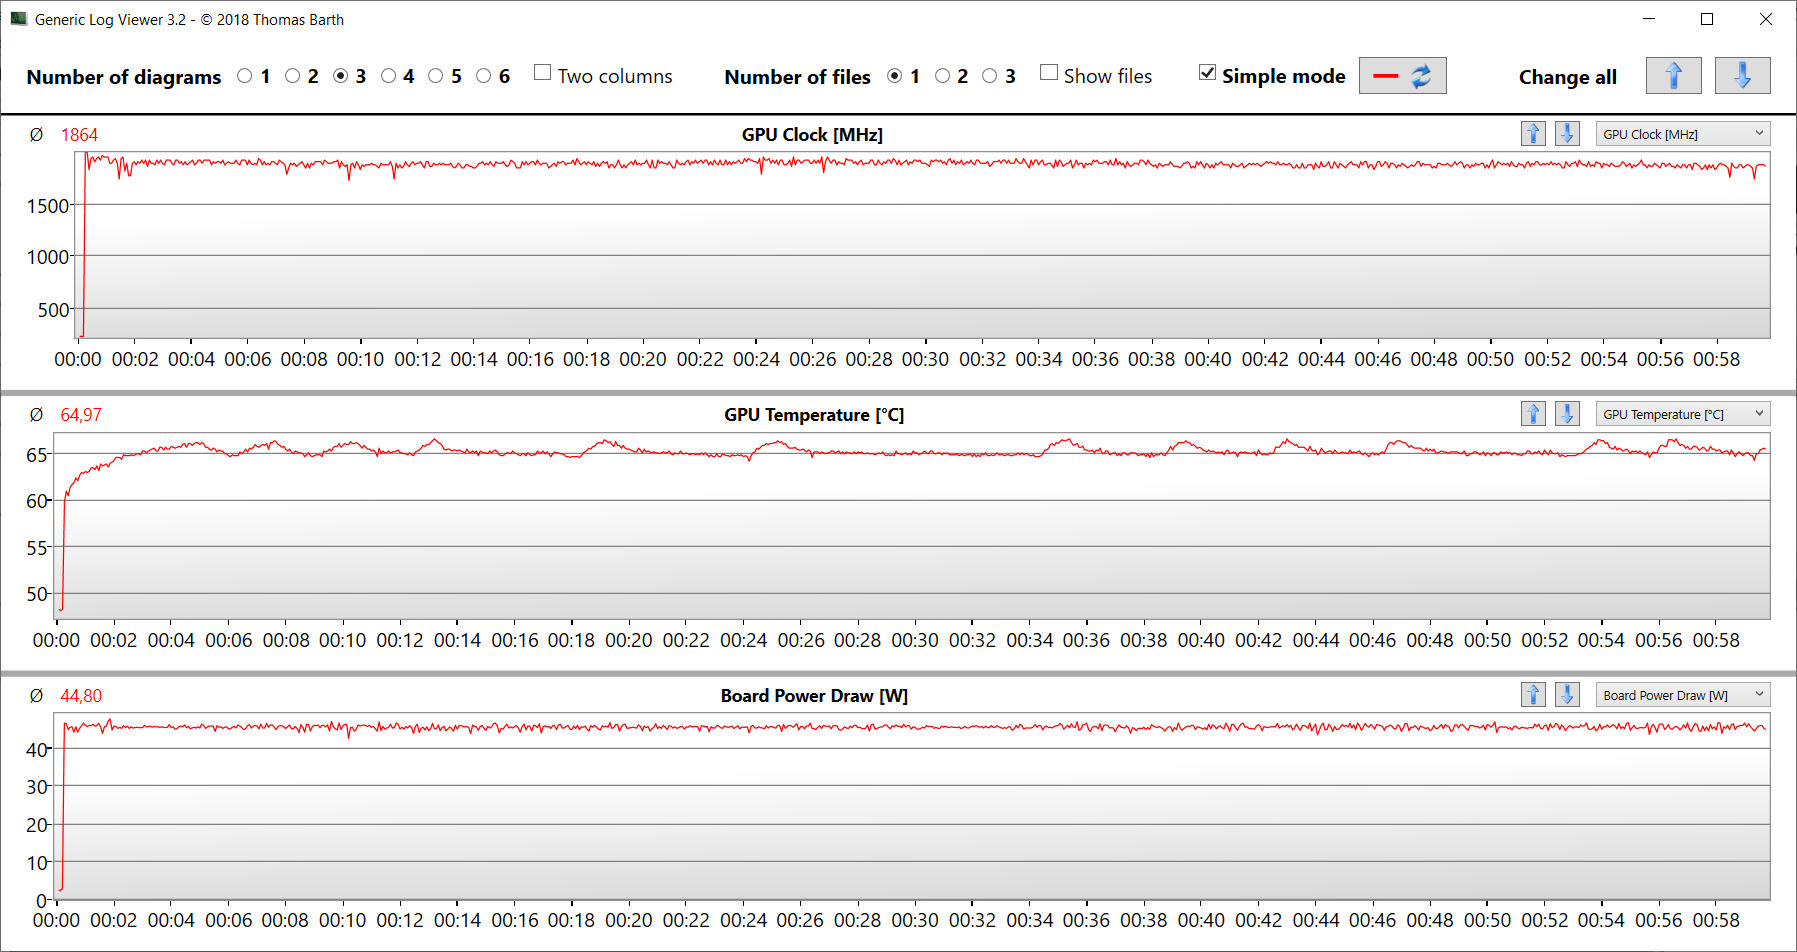
För att utvärdera om bildfrekvensen förblir i stort sett konstant under en längre tidsperiod kör vi spelet "The Witcher 3" i cirka 60 minuter i Full-HD-upplösning och med maximala kvalitetsinställningar. Spelkaraktären flyttas inte. Vi märker inte någon minskning av bildfrekvensen.
The Witcher 3 FPS Chart
| låg | med. | hög | ultra | |
|---|---|---|---|---|
| GTA V (2015) | 185.8 | 181.5 | 164.9 | 89.3 |
| The Witcher 3 (2015) | 321.6 | 235.7 | 140.7 | 77.4 |
| Dota 2 Reborn (2015) | 161.7 | 152.6 | 140 | 135.4 |
| Final Fantasy XV Benchmark (2018) | 172.8 | 105.6 | 76.9 | |
| X-Plane 11.11 (2018) | 141.3 | 120.8 | 96.8 | |
| Far Cry 5 (2018) | 168 | 116 | 109 | 102 |
| Strange Brigade (2018) | 395 | 206 | 160.5 | 137.3 |
| God of War (2022) | 57.5 | 52 | 41.8 | |
| Rainbow Six Extraction (2022) | 186 | 145 | 141 | 108 |
| Cyberpunk 2077 1.6 (2022) | 88.5 | 72.3 | 63.5 | 57.9 |
| Ghostwire Tokyo (2022) | 114.4 | 113.7 | 112.7 | 108.4 |
| F1 22 (2022) | 169.8 | 162.3 | 124.7 | 48.7 |
| The Quarry (2022) | 116.9 | 88.1 | 72.7 | 57.2 |
| Uncharted Legacy of Thieves Collection (2022) | 71.1 | 70.3 | 67.7 | 65.6 |
| Call of Duty Modern Warfare 2 2022 (2022) | 103 | 93 | 70 | 68 |
| Spider-Man Miles Morales (2022) | 89.2 | 82 | 72.5 | 66.4 |
| The Callisto Protocol (2022) | 112.8 | 82.4 | 77.8 | 54.4 |
| Need for Speed Unbound (2022) | 104.9 | 92.6 | 74.9 | 65 |
| High On Life (2023) | 163.2 | 123 | 92.1 | 71.2 |
| The Witcher 3 v4 (2023) | 148.6 | 117.9 | 59.2 | 50.3 |
| Dead Space Remake (2023) | 62.8 | 61 | 53.7 | 53.3 |
| Hogwarts Legacy (2023) | 108 | 87.7 | 74.2 | 62.5 |
| Returnal (2023) | 84 | 80 | 72 | 62 |
| Atomic Heart (2023) | 133.9 | 103.3 | 62.8 | 49.6 |
| Company of Heroes 3 (2023) | 152.3 | 136.9 | 101.6 | 100 |
| Sons of the Forest (2023) | 78.2 | 61.5 | 59.5 | 58.5 |
| Resident Evil 4 Remake (2023) | 106.9 | 75.9 | 69.4 | 50.9 |
| The Last of Us (2023) | 74.6 | 62.5 | 55.4 | 45.2 |
Utsläpp - Den bärbara datorn från MSI värms upp måttligt
Bullernivåer
Cyborgs maskinvara är konfigurerad för låg energiförbrukning och därmed också för låg värmeutveckling. Även om vi bör förvänta oss ett tystgående kylsystem här, finner vi ett visst utrymme för förbättringar i detta avseende.
I genomsnitt ligger ljudutvecklingen under speldrift på en måttlig nivå. Den bärbara datorn kan dock bli mycket högljudd vid toppbelastning. I läget "Extreme Performance" kan den maximala ljudnivån öka upp till 56,3 dB(A). När det gäller ljudutvecklingen kan profilen "Balanced" rekommenderas.
Vad som är mer irriterande visar sig vara beteendet under tomgångsdrift och i vardaglig drift (kontor, Internet): Fläkten går ständigt i ett tydligt hörbart område och vi mäter ljudnivåer på upp till 38 dB(A). Detta gäller för alla prestandaprofiler med undantag för profilen "Super Battery", som ofta låter fläkten vara avstängd.
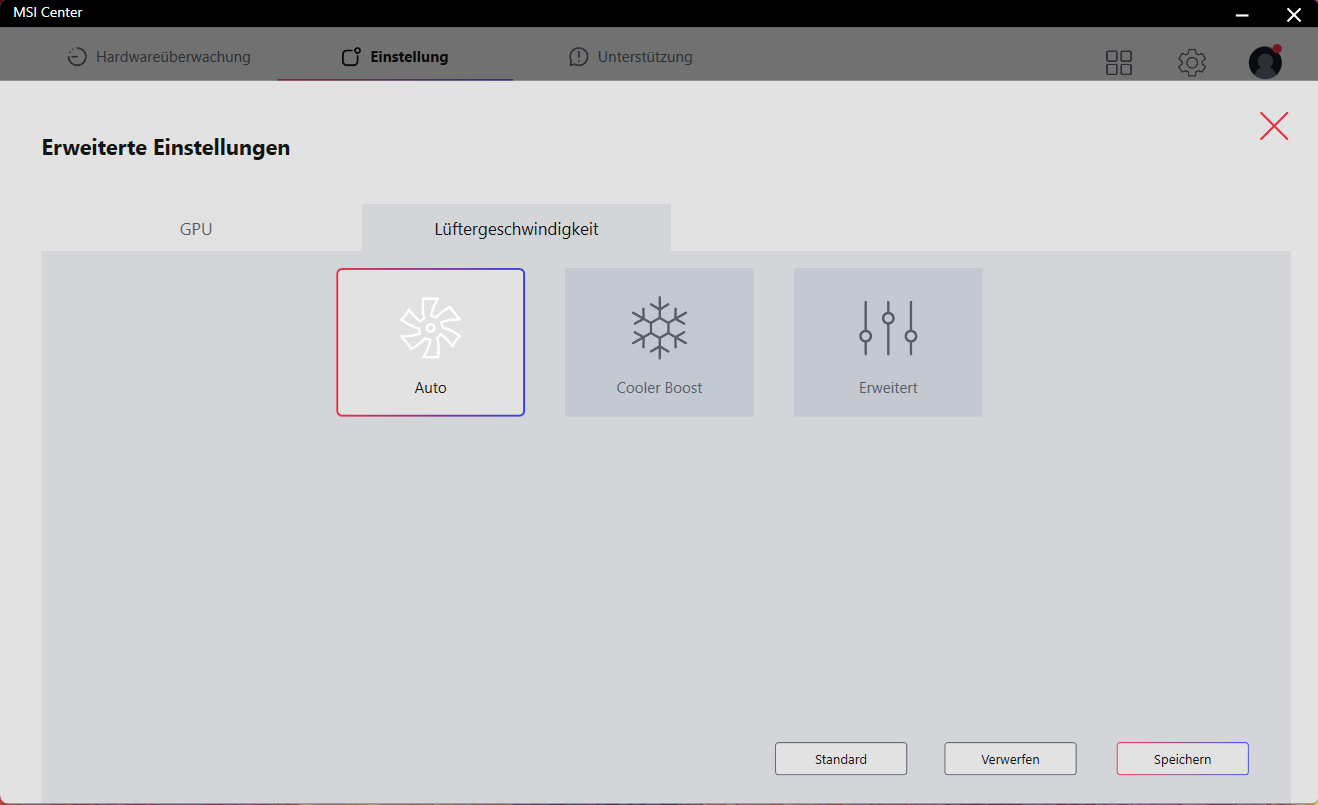
MSI Center ger viss begränsad tillgång till fläktkontrollen, men endast med profilen "Extreme Performance" aktiverad (du måste klicka på kugghjulssymbolen). Profilerna "Auto" och "Cooler Boost" (med fläkten konstant på full hastighet) är tillgängliga. Dessutom kan du också justera fläktkurvan.
Ljudnivå
| Låg belastning |
| 27 / 37.5 / 38 dB(A) |
| Hög belastning |
| 56.3 / 56.3 dB(A) |
 | ||
30 dB tyst 40 dB(A) hörbar 50 dB(A) högt ljud |
||
min: | ||
| MSI Cyborg 15 A12VF GeForce RTX 4060 Laptop GPU, i7-12650H, Samsung PM9B1 1024GB MZVL41T0HBLB | Asus TUF Gaming A16 FA617 Radeon RX 7600S, R7 7735HS, Micron 2400 MTFDKBA1T0QFM | Aorus 15 XE5 GeForce RTX 3070 Ti Laptop GPU, i7-12700H, Gigabyte AG470S1TB-SI B10 | Schenker XMG Fusion 15 (Mid 22) GeForce RTX 3070 Laptop GPU, i7-11800H, Samsung SSD 980 Pro 1TB MZ-V8P1T0BW | MSI Katana 15 B12VEK GeForce RTX 4050 Laptop GPU, i7-12650H, Micron 2400 MTFDKBA1T0QFM | HP Victus 15 fa0020nr GeForce RTX 3050 Ti Laptop GPU, i7-12700H, Samsung PM9A1 MZVL2512HCJQ | |
|---|---|---|---|---|---|---|
| Noise | 20% | 14% | 14% | 22% | 20% | |
| av / miljö * (dB) | 27 | 24 11% | 24 11% | 26 4% | 24 11% | 24.8 8% |
| Idle Minimum * (dB) | 27 | 24 11% | 26 4% | 26 4% | 24 11% | 26.2 3% |
| Idle Average * (dB) | 37.5 | 25 33% | 28 25% | 28 25% | 24 36% | 29.2 22% |
| Idle Maximum * (dB) | 38 | 28 26% | 30 21% | 31 18% | 24 37% | 29.4 23% |
| Load Average * (dB) | 56.3 | 42 25% | 48 15% | 45 20% | 37.71 33% | 29.9 47% |
| Load Maximum * (dB) | 56.3 | 50 11% | 52 8% | 48 15% | 54.55 3% | 45.5 19% |
| Witcher 3 ultra * (dB) | 50 | 52 | 46 | 45.75 | 41.1 |
* ... mindre är bättre
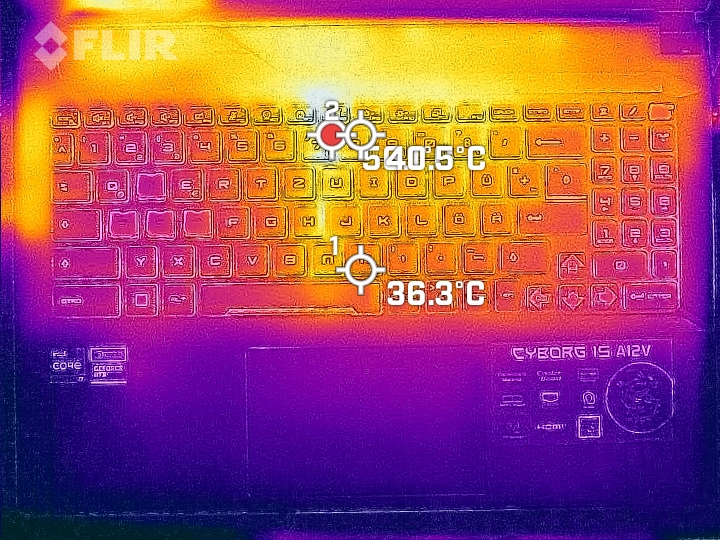
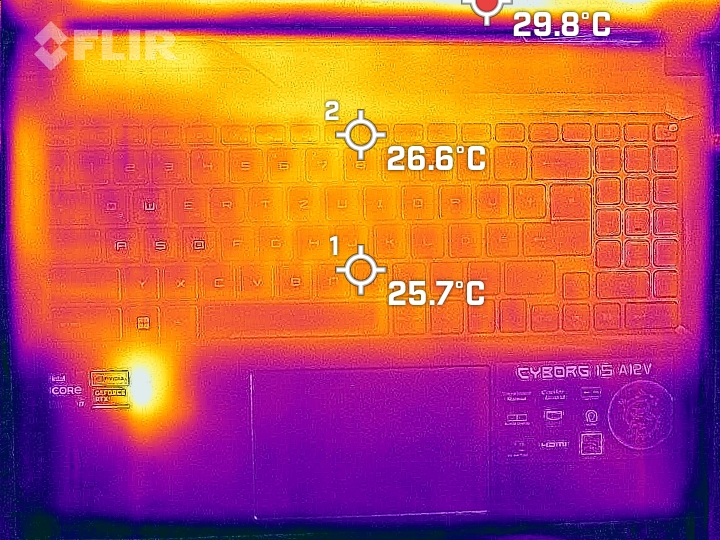
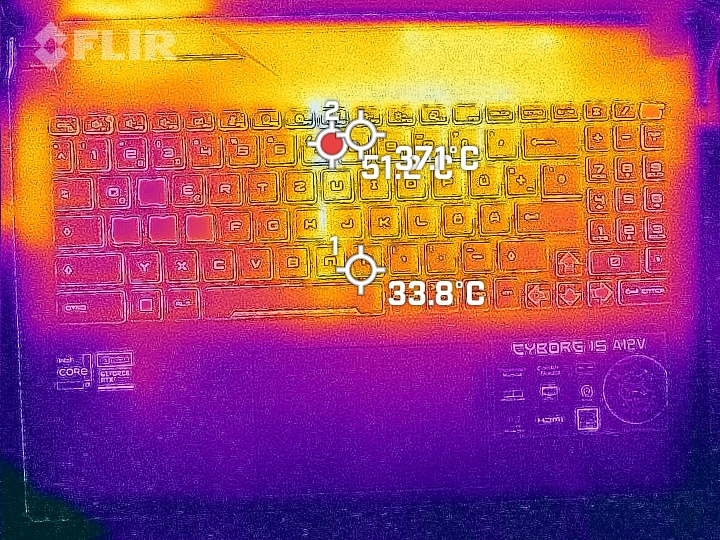
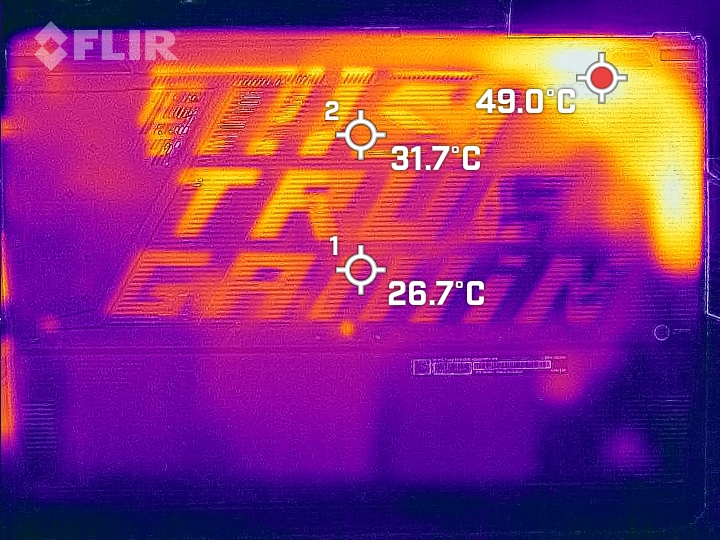
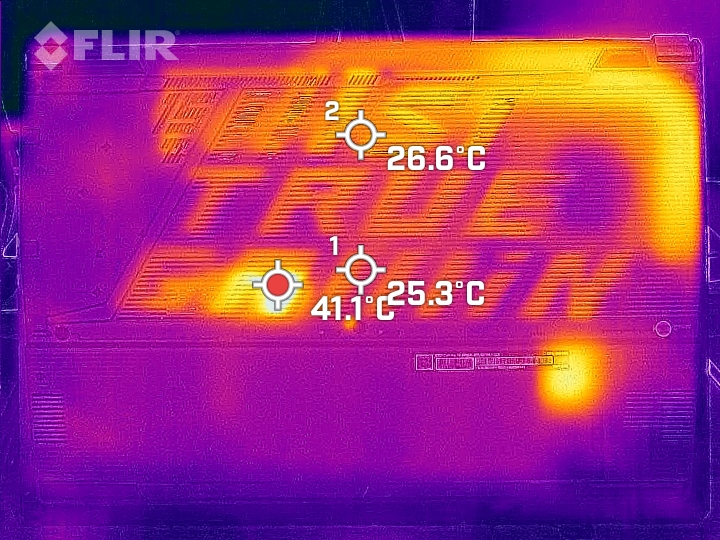
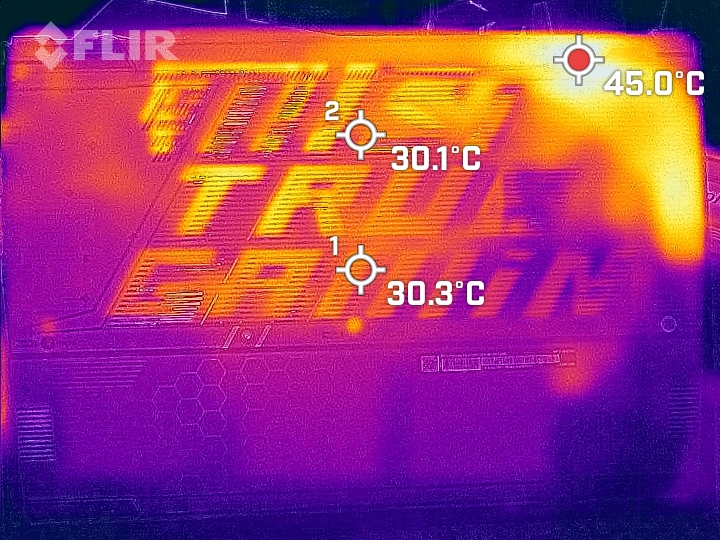
Temperaturer
Den bärbara datorn värms upp måttligt i bästa fall. De högsta temperaturerna (40 till 47,5 °C, 104 till 117,5 °F) uppnås vid tre mätpunkter under stresstestet. Vid daglig drift håller sig temperaturerna inom det gröna området.
(-) Den maximala temperaturen på ovansidan är 47.5 °C / 118 F, jämfört med genomsnittet av 40.4 °C / 105 F , allt från 21.2 till 68.8 °C för klassen Gaming.
(+) Botten värms upp till maximalt 35.5 °C / 96 F, jämfört med genomsnittet av 43.2 °C / 110 F
(+) Vid tomgångsbruk är medeltemperaturen för ovansidan 25.9 °C / 79 F, jämfört med enhetsgenomsnittet på 33.9 °C / ### class_avg_f### F.
(±) När du spelar The Witcher 3 är medeltemperaturen för ovansidan 35.6 °C / 96 F, jämfört med enhetsgenomsnittet på 33.9 °C / ## #class_avg_f### F.
(+) Handledsstöden och pekplattan är kallare än hudtemperaturen med maximalt 27.8 °C / 82 F och är därför svala att ta på.
(±) Medeltemperaturen för handledsstödsområdet på liknande enheter var 28.8 °C / 83.8 F (+1 °C / 1.8 F).
| MSI Cyborg 15 A12VF Intel Core i7-12650H, NVIDIA GeForce RTX 4060 Laptop GPU | Asus TUF Gaming A16 FA617 AMD Ryzen 7 7735HS, AMD Radeon RX 7600S | Aorus 15 XE5 Intel Core i7-12700H, NVIDIA GeForce RTX 3070 Ti Laptop GPU | Schenker XMG Fusion 15 (Mid 22) Intel Core i7-11800H, NVIDIA GeForce RTX 3070 Laptop GPU | MSI Katana 15 B12VEK Intel Core i7-12650H, NVIDIA GeForce RTX 4050 Laptop GPU | HP Victus 15 fa0020nr Intel Core i7-12700H, NVIDIA GeForce RTX 3050 Ti Laptop GPU | |
|---|---|---|---|---|---|---|
| Heat | -32% | -34% | -37% | -22% | 16% | |
| Maximum Upper Side * (°C) | 47.5 | 54 -14% | 46 3% | 52 -9% | 47 1% | 37.2 22% |
| Maximum Bottom * (°C) | 35.5 | 47 -32% | 57 -61% | 63 -77% | 48 -35% | 35.4 -0% |
| Idle Upper Side * (°C) | 27.7 | 40 -44% | 38 -37% | 37 -34% | 35 -26% | 22.4 19% |
| Idle Bottom * (°C) | 29.5 | 40 -36% | 42 -42% | 38 -29% | 38 -29% | 22.6 23% |
* ... mindre är bättre
Stresstest
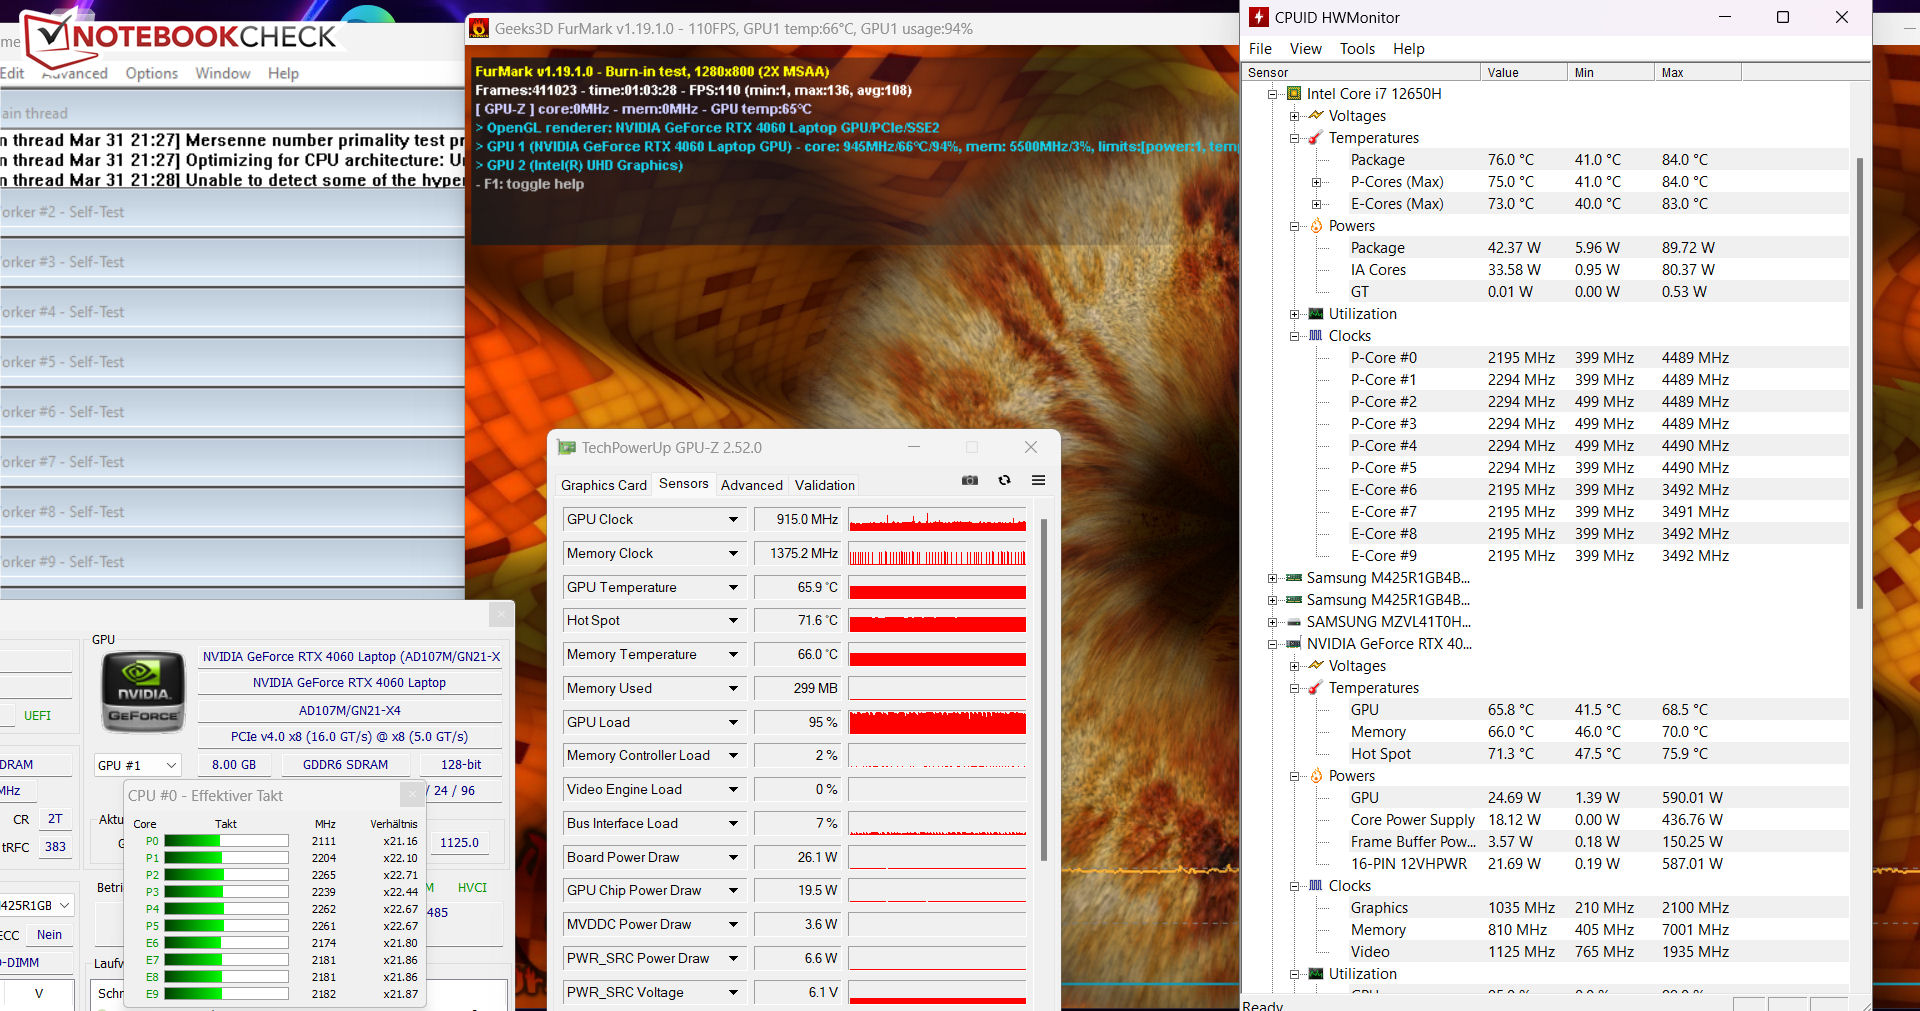
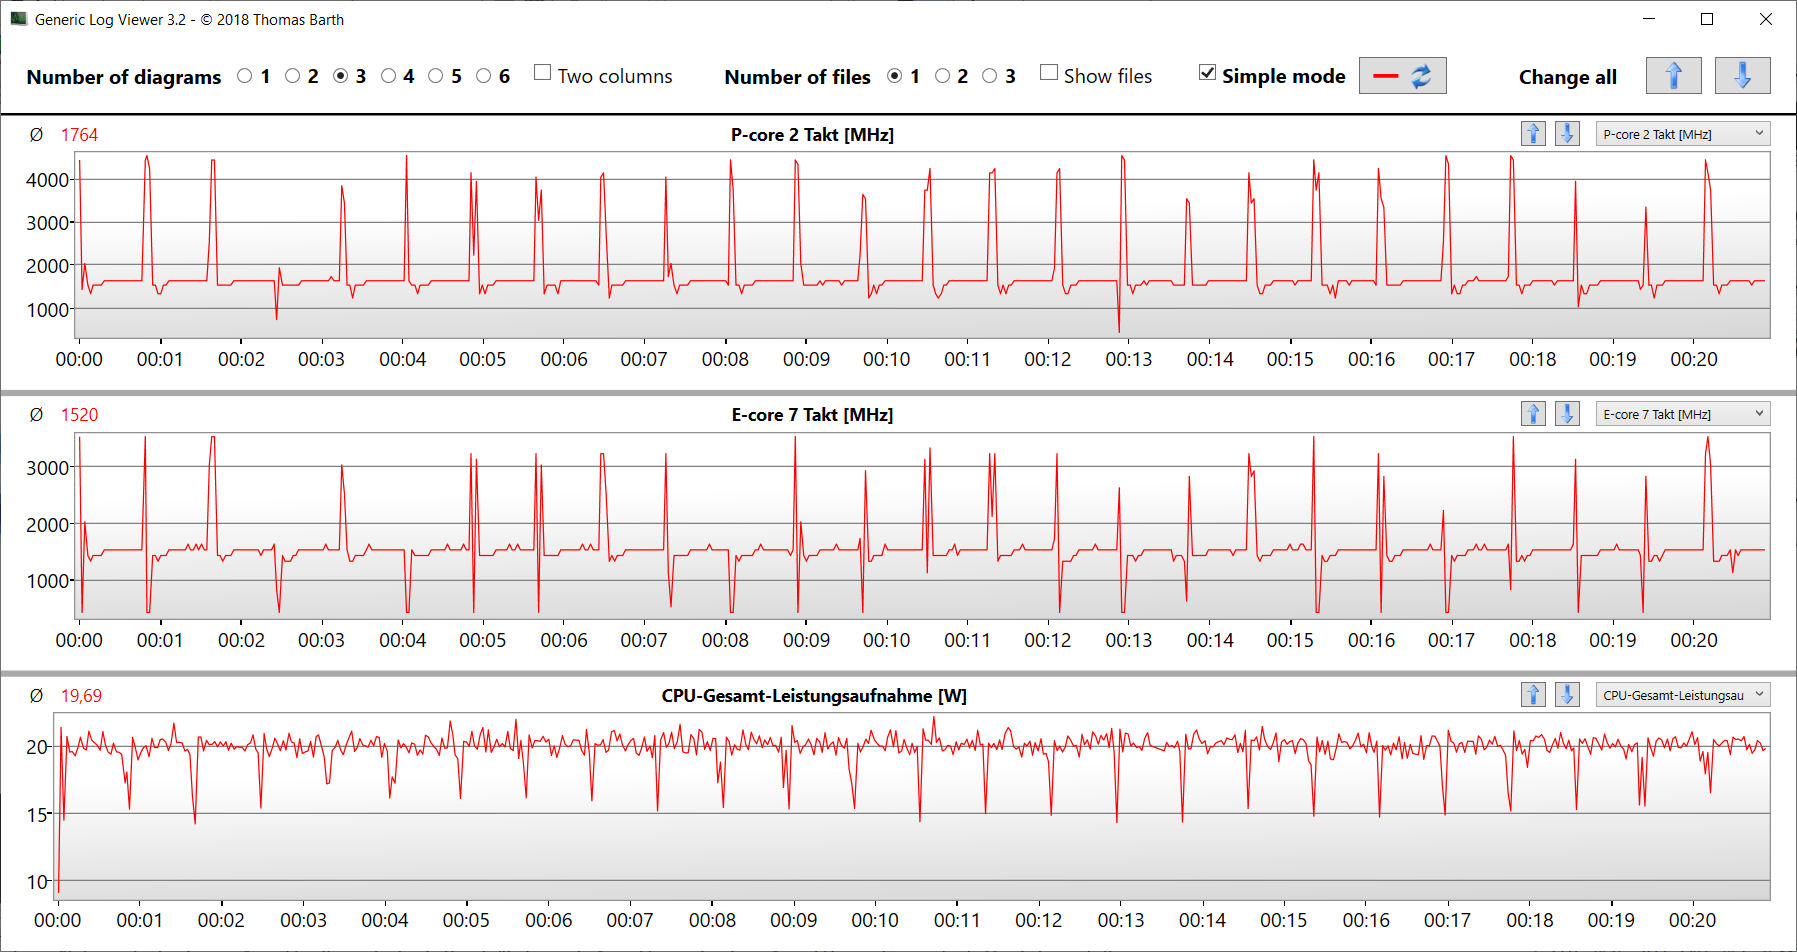
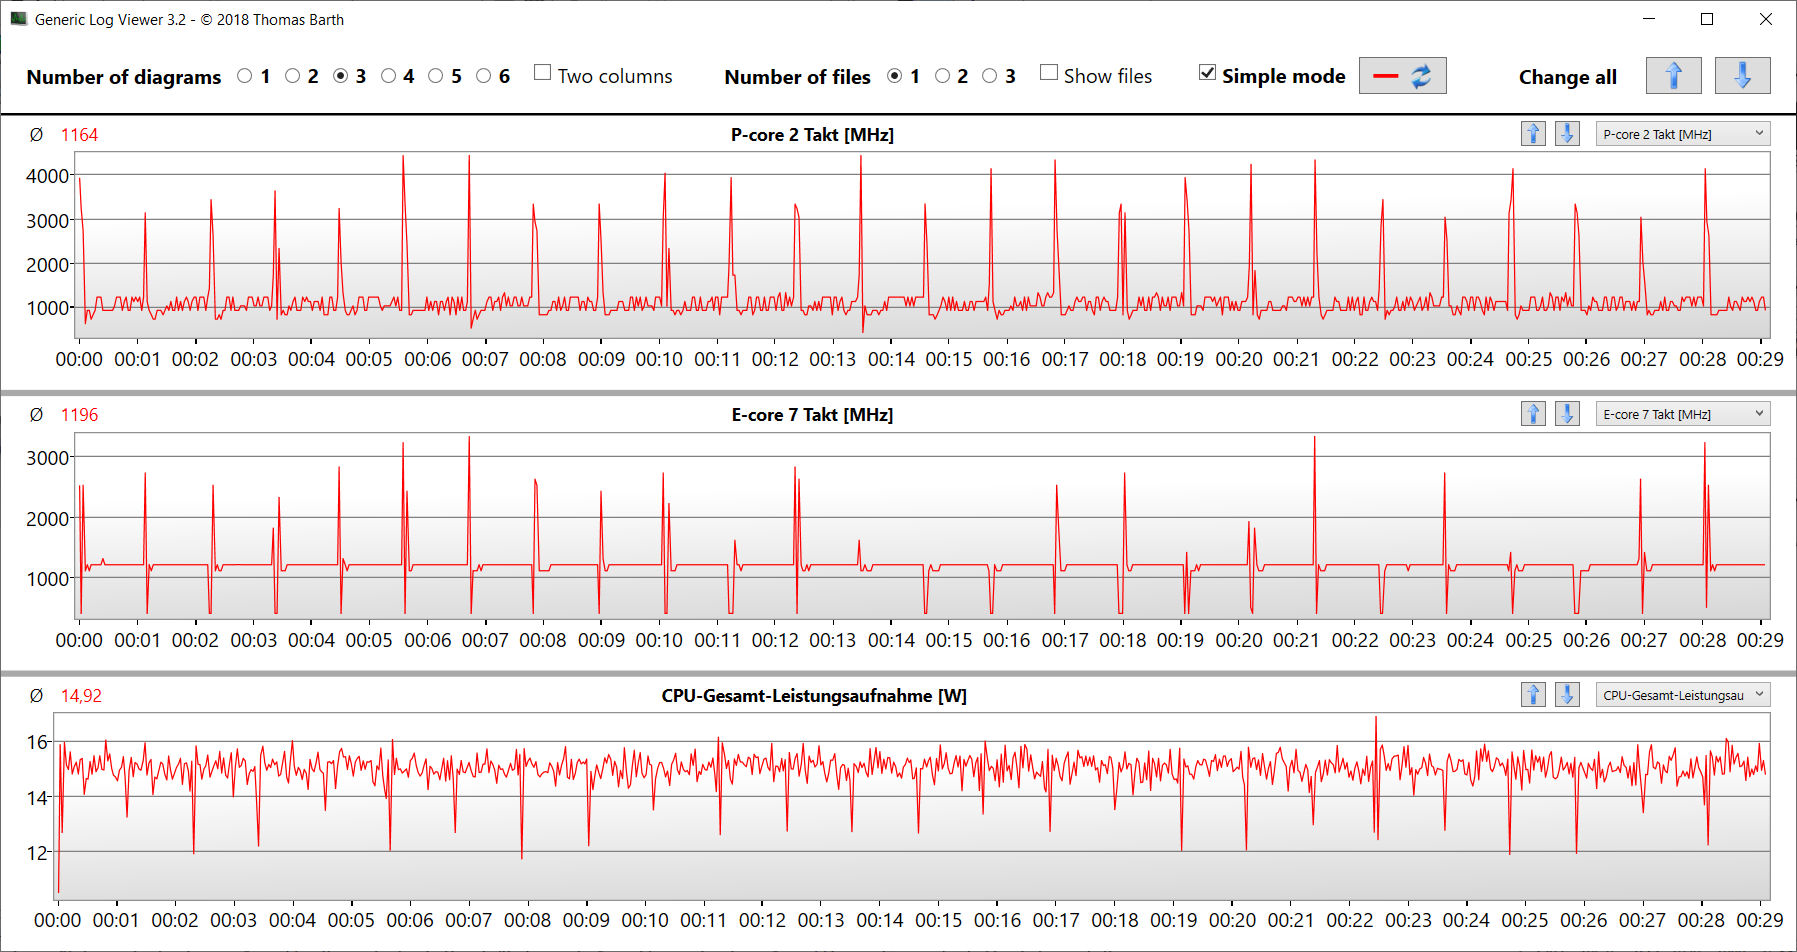
Stresstestet (med Prime95 och Furmark igång konstant) är ett extremt scenario för att utvärdera systemets stabilitet under full belastning. Processorn (P: 3,3-3,5 GHz, E: 2,8 GHz) och grafikprocessorn (1 000-1 500 MHz) börjar testet med medelhöga klockfrekvenser, och värdena sjunker under testets gång.
Högtalare
Stereohögtalarna ger ett hyfsat ljud, men det innehåller knappt någon bas. För en bättre ljudupplevelse rekommenderas hörlurar eller externa högtalare.
MSI Cyborg 15 A12VF ljudanalys
(±) | högtalarljudstyrkan är genomsnittlig men bra (77.79 dB)
Bas 100 - 315 Hz
(-) | nästan ingen bas - i genomsnitt 19.8% lägre än medianen
(±) | linjäriteten för basen är genomsnittlig (12.2% delta till föregående frekvens)
Mellan 400 - 2000 Hz
(+) | balanserad mellan - endast 1.8% från medianen
(+) | mids är linjära (5% delta till föregående frekvens)
Högsta 2 - 16 kHz
(+) | balanserade toppar - endast 4.2% från medianen
(+) | toppar är linjära (3.9% delta till föregående frekvens)
Totalt 100 - 16 000 Hz
(+) | det totala ljudet är linjärt (14.2% skillnad mot median)
Jämfört med samma klass
» 25% av alla testade enheter i den här klassen var bättre, 7% liknande, 68% sämre
» Den bästa hade ett delta på 6%, genomsnittet var 18%, sämst var 132%
Jämfört med alla testade enheter
» 17% av alla testade enheter var bättre, 4% liknande, 79% sämre
» Den bästa hade ett delta på 4%, genomsnittet var 24%, sämst var 134%
Asus TUF Gaming A16 FA617 ljudanalys
(+) | högtalare kan spela relativt högt (82 dB)
Bas 100 - 315 Hz
(±) | reducerad bas - i genomsnitt 14.4% lägre än medianen
(±) | linjäriteten för basen är genomsnittlig (8.3% delta till föregående frekvens)
Mellan 400 - 2000 Hz
(±) | högre mellan - i genomsnitt 6.5% högre än median
(+) | mids är linjära (3.8% delta till föregående frekvens)
Högsta 2 - 16 kHz
(±) | reducerade toppar - i genomsnitt 6% lägre än medianen
(±) | linjäriteten för toppar är genomsnittlig (10.4% delta till föregående frekvens)
Totalt 100 - 16 000 Hz
(±) | linjäriteten för det totala ljudet är genomsnittlig (18.8% skillnad mot median)
Jämfört med samma klass
» 62% av alla testade enheter i den här klassen var bättre, 8% liknande, 30% sämre
» Den bästa hade ett delta på 6%, genomsnittet var 18%, sämst var 132%
Jämfört med alla testade enheter
» 43% av alla testade enheter var bättre, 8% liknande, 49% sämre
» Den bästa hade ett delta på 4%, genomsnittet var 24%, sämst var 134%
Energihantering - Bärbar dator för spel med bra batteritid
Effektförbrukning
På det hela taget är MSI:s bärbara dator mycket effektiv när det gäller energiförbrukning. Över hela belastningsområdet är förbrukningen lägre än hos konkurrenterna. Den går igenom våra The Witcher 3 - och stresstester med en relativt konstant strömförbrukning. Strömförsörjningen är tillräckligt stor med 120 watt.
| Av/Standby | |
| Låg belastning | |
| Hög belastning |
|
Förklaring:
min: | |
| MSI Cyborg 15 A12VF i7-12650H, GeForce RTX 4060 Laptop GPU, Samsung PM9B1 1024GB MZVL41T0HBLB, IPS, 1920x1080, 15.6" | Asus TUF Gaming A16 FA617 R7 7735HS, Radeon RX 7600S, Micron 2400 MTFDKBA1T0QFM, IPS-Level, 1920x1200, 16" | Aorus 15 XE5 i7-12700H, GeForce RTX 3070 Ti Laptop GPU, Gigabyte AG470S1TB-SI B10, IPS, 2560x1440, 15.6" | Schenker XMG Fusion 15 (Mid 22) i7-11800H, GeForce RTX 3070 Laptop GPU, Samsung SSD 980 Pro 1TB MZ-V8P1T0BW, IPS, 2560x1440, 15.6" | MSI Katana 15 B12VEK i7-12650H, GeForce RTX 4050 Laptop GPU, Micron 2400 MTFDKBA1T0QFM, IPS, 1920x1080, 15.6" | HP Victus 15 fa0020nr i7-12700H, GeForce RTX 3050 Ti Laptop GPU, Samsung PM9A1 MZVL2512HCJQ, IPS, 1920x1080, 15.6" | Genomsnitt NVIDIA GeForce RTX 4060 Laptop GPU | Genomsnitt av klass Gaming | |
|---|---|---|---|---|---|---|---|---|
| Power Consumption | -42% | -222% | -84% | -30% | -40% | -72% | -104% | |
| Idle Minimum * (Watt) | 6 | 8 -33% | 31 -417% | 12 -100% | 8.5 -42% | 5.1 15% | 11.5 ? -92% | 13.3 ? -122% |
| Idle Average * (Watt) | 8.8 | 11 -25% | 35 -298% | 17 -93% | 10.2 -16% | 15.1 -72% | 16 ? -82% | 19 ? -116% |
| Idle Maximum * (Watt) | 11.9 | 16 -34% | 46 -287% | 24 -102% | 11.3 5% | 18.9 -59% | 20.3 ? -71% | 24.5 ? -106% |
| Load Average * (Watt) | 89 | 97 -9% | 120 -35% | 106 -19% | 84 6% | 114.5 -29% | 92.9 ? -4% | 108.1 ? -21% |
| Witcher 3 ultra * (Watt) | 90.3 | 161.5 -79% | 202 -124% | 159.9 -77% | 128 -42% | 113.9 -26% | ||
| Load Maximum * (Watt) | 99 | 168 -70% | 268 -171% | 208 -110% | 189 -91% | 165.8 -67% | 210 ? -112% | 254 ? -157% |
* ... mindre är bättre
Power Consumption The Witcher 3 / Stress Test
Power Consumption With External Monitor
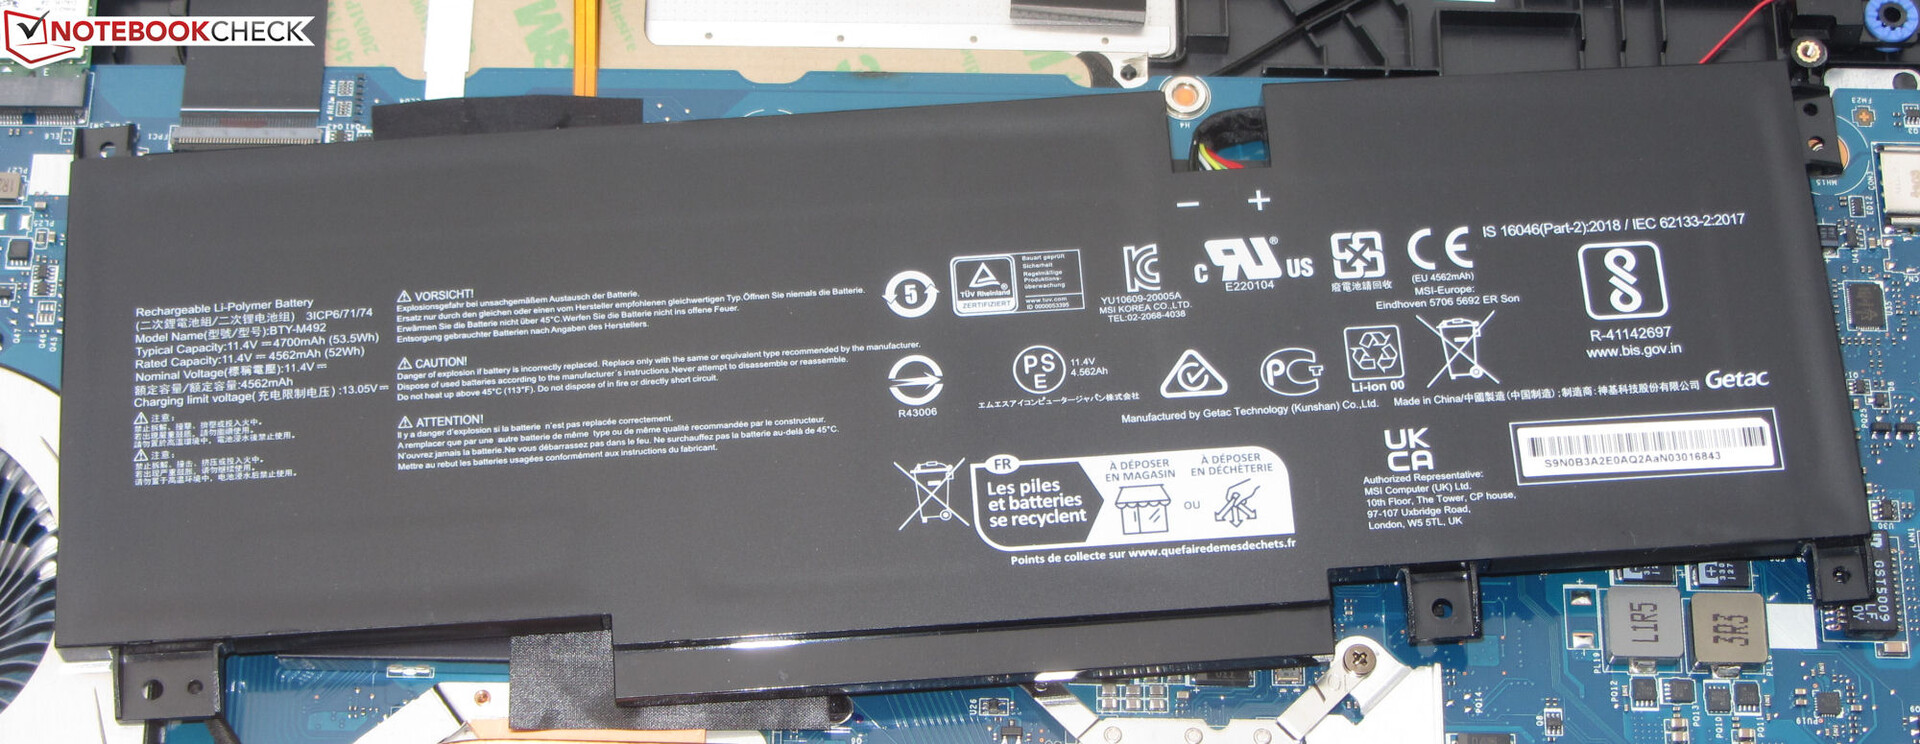
Batteritid
I WLAN-testet där webbplatser laddas via skript och videotestet med kortfilmen Big Buck Bunny (H.264-kodning, FHD) som körs i en slinga uppnår den bärbara 15,6-tumsdatorn körtider på 7:32 timmar respektive 8:00 timmar. Under båda testerna är den bärbara datorns energisparfunktioner inaktiverade och skärmens ljusstyrka minskas till cirka 150 cd/m². För att köra videotestet avaktiveras även de trådlösa kommunikationsmodulerna.
Den bärbara datorn från MSI erbjuder en bra batteritid överlag, trots den relativt lilla batterikapaciteten på 53,5 Wh. Det faktum att det inte kan hålla jämna steg med den TUF Gaming A16beror på kombinationen av ett stort 90-Wh-batteri och den energieffektiva AMD APU som den bärbara datorn erbjuder. Om vi beräknar körtiden per Watthour ligger Cyborg före.
| MSI Cyborg 15 A12VF i7-12650H, GeForce RTX 4060 Laptop GPU, 53.5 Wh | Asus TUF Gaming A16 FA617 R7 7735HS, Radeon RX 7600S, 90 Wh | Aorus 15 XE5 i7-12700H, GeForce RTX 3070 Ti Laptop GPU, 99 Wh | Schenker XMG Fusion 15 (Mid 22) i7-11800H, GeForce RTX 3070 Laptop GPU, 93.48 Wh | MSI Katana 15 B12VEK i7-12650H, GeForce RTX 4050 Laptop GPU, 53.5 Wh | HP Victus 15 fa0020nr i7-12700H, GeForce RTX 3050 Ti Laptop GPU, 70 Wh | Genomsnitt av klass Gaming | |
|---|---|---|---|---|---|---|---|
| Batteridrifttid | 25% | -19% | -4% | -41% | -68% | -19% | |
| Reader / Idle (h) | 13.6 | 20.2 49% | 10 -26% | 15.5 14% | 2.6 -81% | 8.71 ? -36% | |
| H.264 (h) | 8 | 6.2 -22% | 7.5 -6% | 4.4 -45% | 8.26 ? 3% | ||
| WiFi v1.3 (h) | 7.5 | 12.1 61% | 6.8 -9% | 7.4 -1% | 4.3 -43% | 2.1 -72% | 7.01 ? -7% |
| Load (h) | 2.3 | 1.5 -35% | 1.9 -17% | 1.8 -22% | 1.5 -35% | 1.1 -52% | 1.47 ? -36% |
För
Emot
Slutsats - Bärbar dator för spel med låg energiförbrukning

MSI Cyborg 15 fokuserar på en kompromiss mellan prestanda, mobilitet och strömförbrukning. På grund av de reducerade prestandainställningarna är Core i7-12650Hoch GeForce RTX 4060presterar under sin kapacitet. Trots detta är deras beräkningskraft fortfarande tillräcklig för FHD-spel vid höga till maximala inställningar även då.
Även om vi gillar konceptet med Cyborg 15, lämnar genomförandet fortfarande utrymme för förbättringar. En aktuell högklassig GPU erbjuder fortfarande tillräcklig prestanda för FHD-spel även vid en låg TGP på 45 watt.
Strömförbrukningen, som är låg för en bärbar dator för spel, kan översättas till en bra batteritid. Realistiska värden på 7-8 timmar är fortfarande möjliga, trots den relativt lilla batterikapaciteten på 53,5 Wh. Tyvärr erbjuder USB-C-porten inget stöd för Power Delivery, vilket skulle vara en vettig funktion i fallet Cyborg.
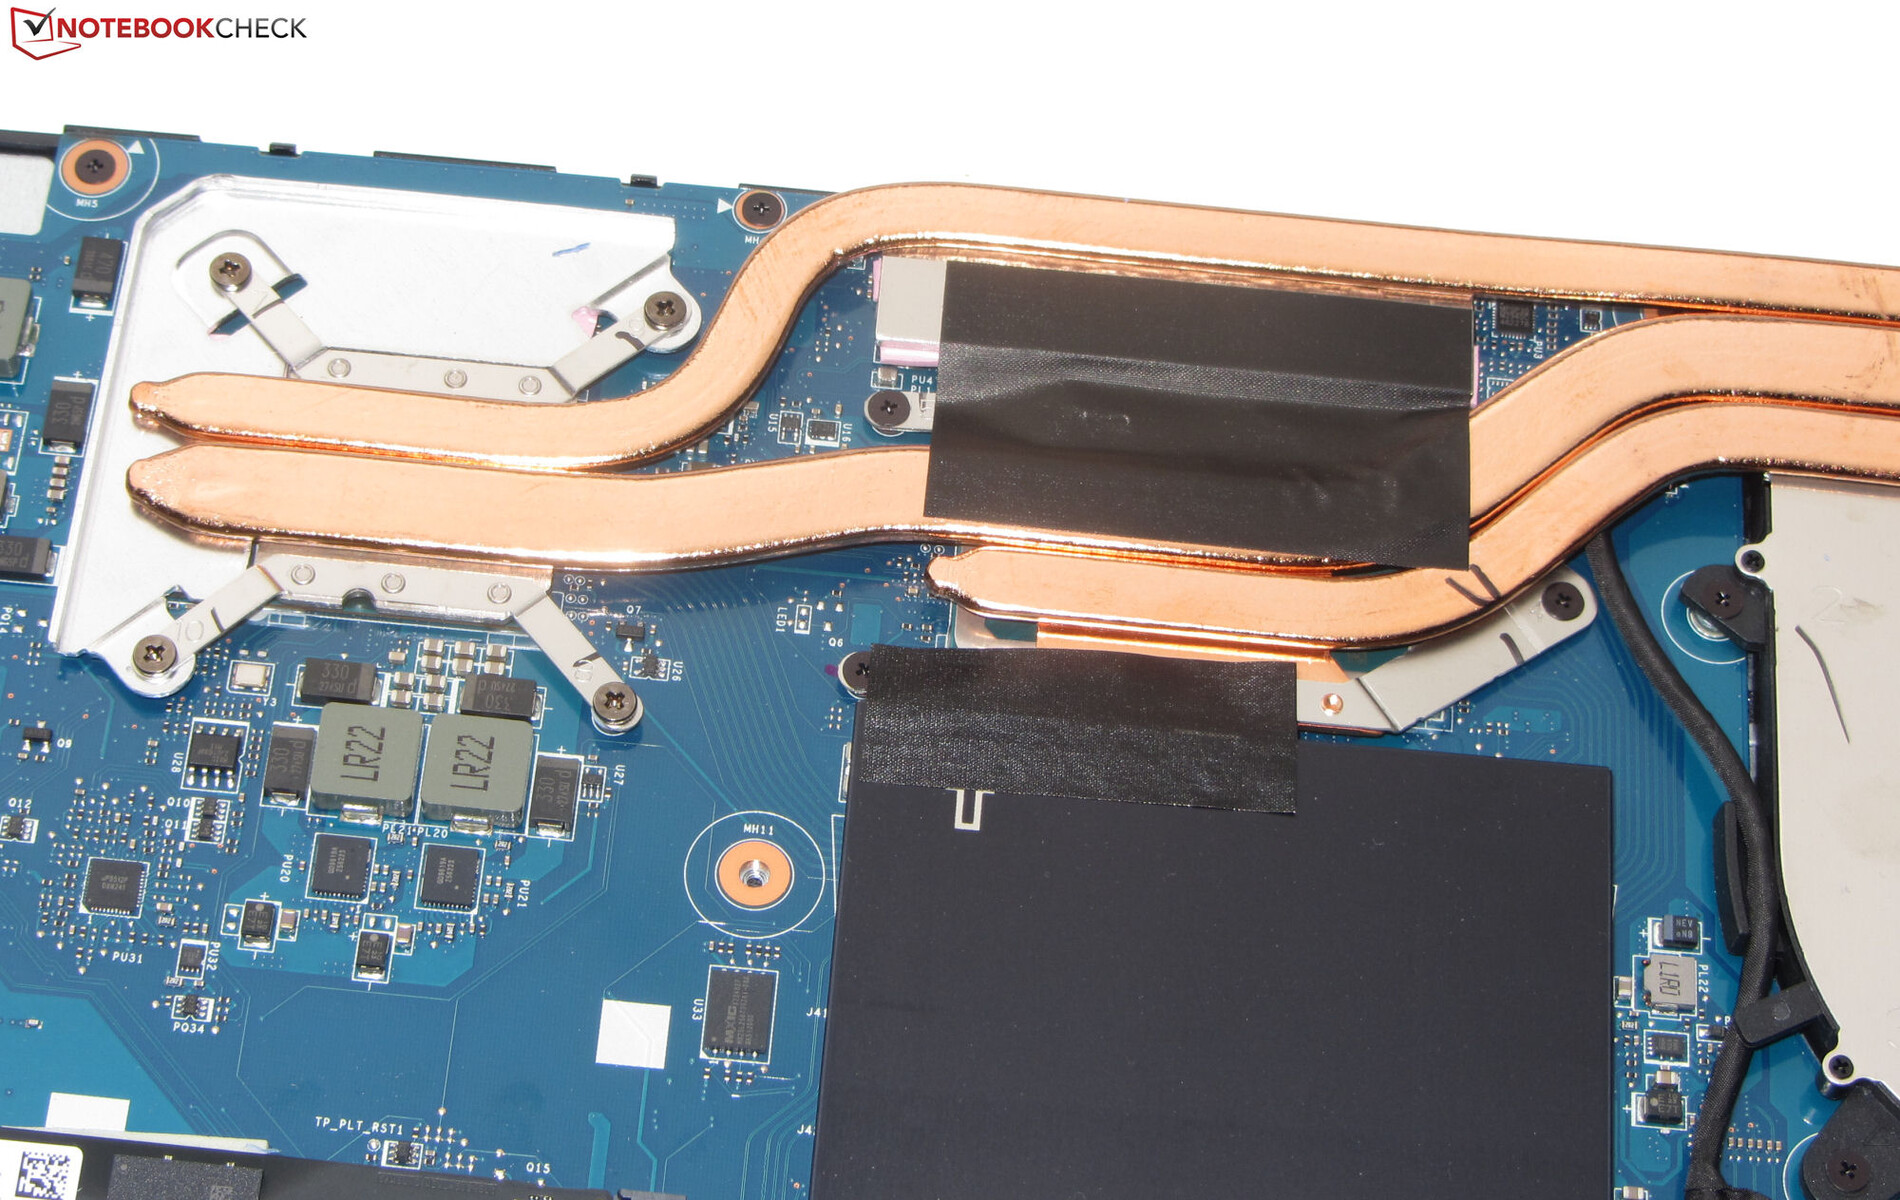
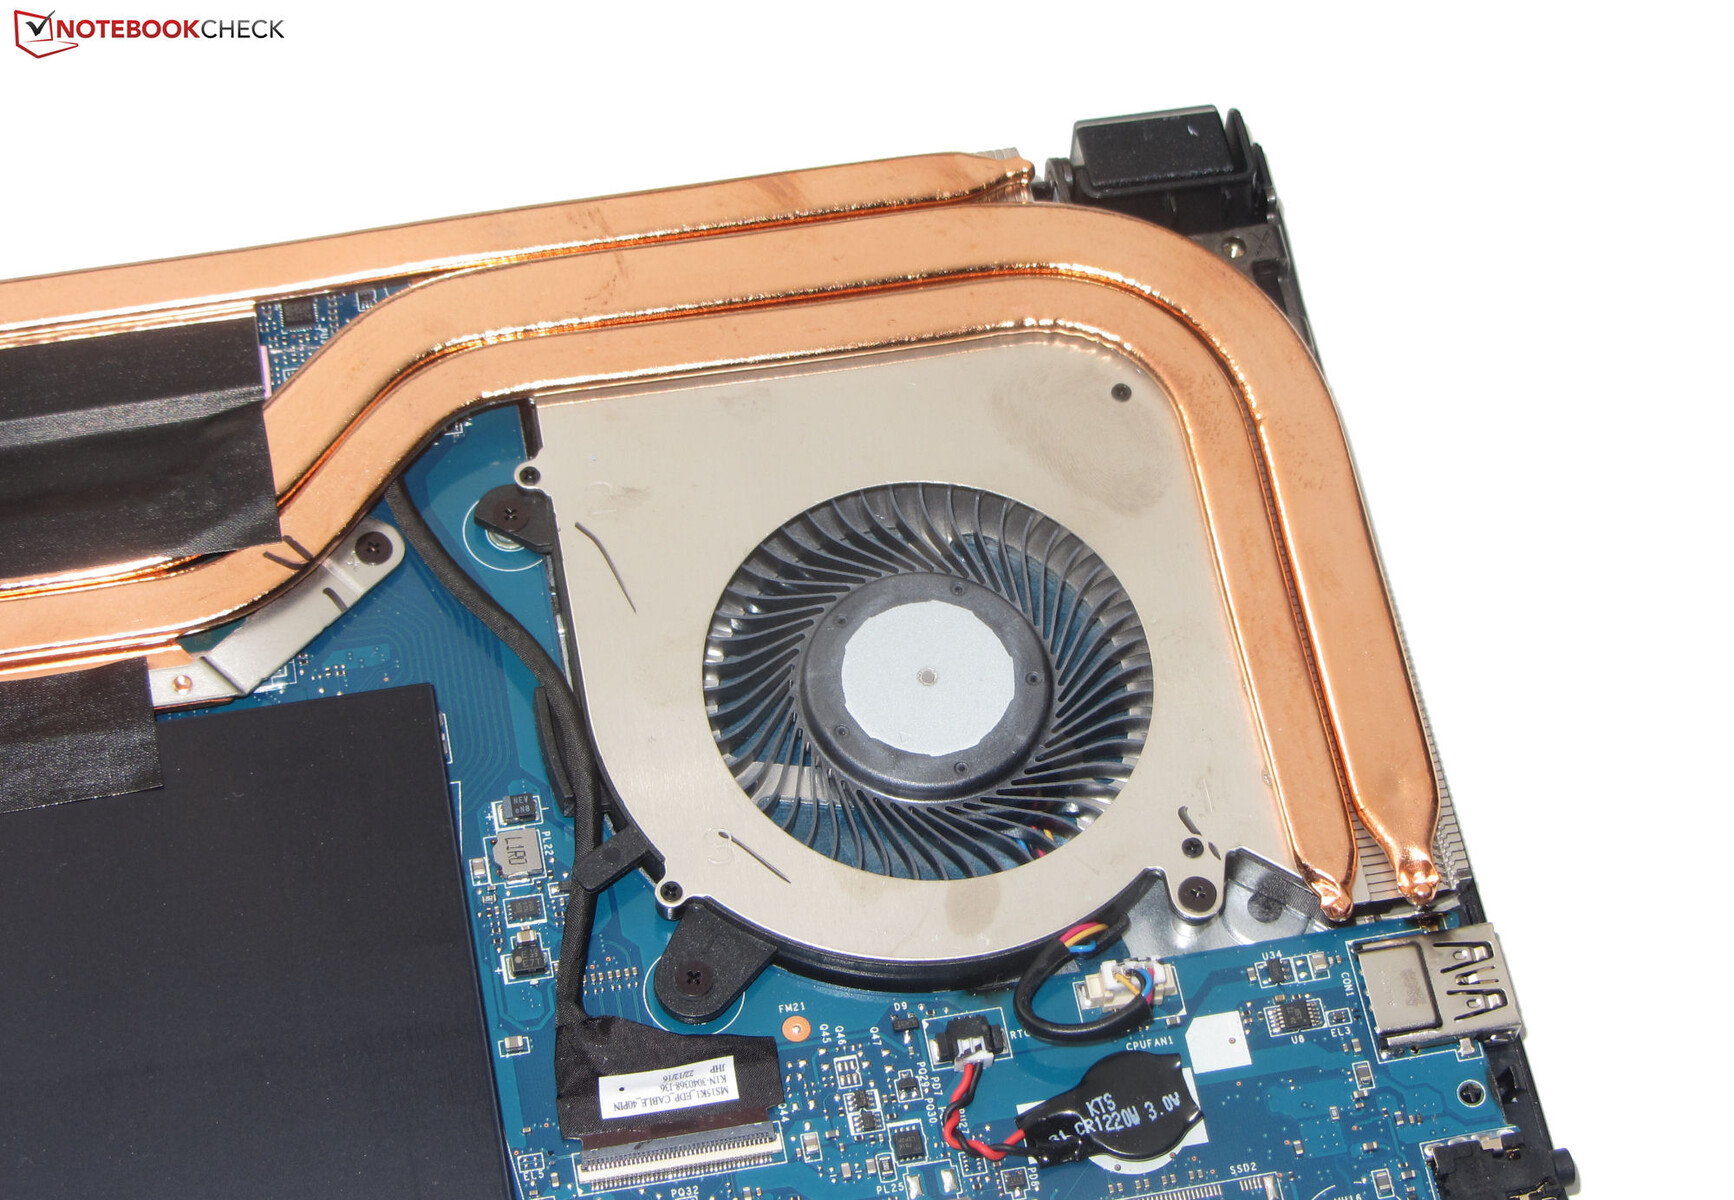
Även om den bärbara datorn inte blir särskilt varm är dess maximala ljudnivå på den vanliga höga nivån för klassen bärbara datorer. Dessutom förblir fläkten ständigt hörbar vid tomgångsdrift. Vi hade förväntat oss mer här. Detta kan vara priset för att avstå från en andra fläkt tillsammans med motsvarande heatpipe. Förutom kylsystemet utgör skärmen (FHD, 144 Hz, IPS) en annan svaghet hos den bärbara datorn, där ljusstyrkan och färgomfångstäckningen visar sig vara för låg.
Ett alternativ kan vara Asus TUF Gaming A16 FA617. Den erbjuder en jämförbar datorprestanda, men får en betydligt längre batteritid, bättre skärm och en lägre maximal ljudutveckling. Å andra sidan förbrukar den bärbara datorn betydligt mer ström under belastning än Cyborg 15.
Pris och tillgänglighet
MSI Cyborg 15 A12VF
- 04/09/2023 v7 (old)
Sascha Mölck
Genomskinlighet
Valet av enheter som ska granskas görs av vår redaktion. Testprovet gavs till författaren som ett lån av tillverkaren eller återförsäljaren för denna recension. Långivaren hade inget inflytande på denna recension och inte heller fick tillverkaren en kopia av denna recension innan publiceringen. Det fanns ingen skyldighet att publicera denna recension. Som ett oberoende medieföretag är Notebookcheck inte föremål för auktoritet från tillverkare, återförsäljare eller förlag.
This is how Notebookcheck is testingEvery year, Notebookcheck independently reviews hundreds of laptops and smartphones using standardized procedures to ensure that all results are comparable. We have continuously developed our test methods for around 20 years and set industry standards in the process. In our test labs, high-quality measuring equipment is utilized by experienced technicians and editors. These tests involve a multi-stage validation process. Our complex rating system is based on hundreds of well-founded measurements and benchmarks, which maintains objectivity.
Price comparison

