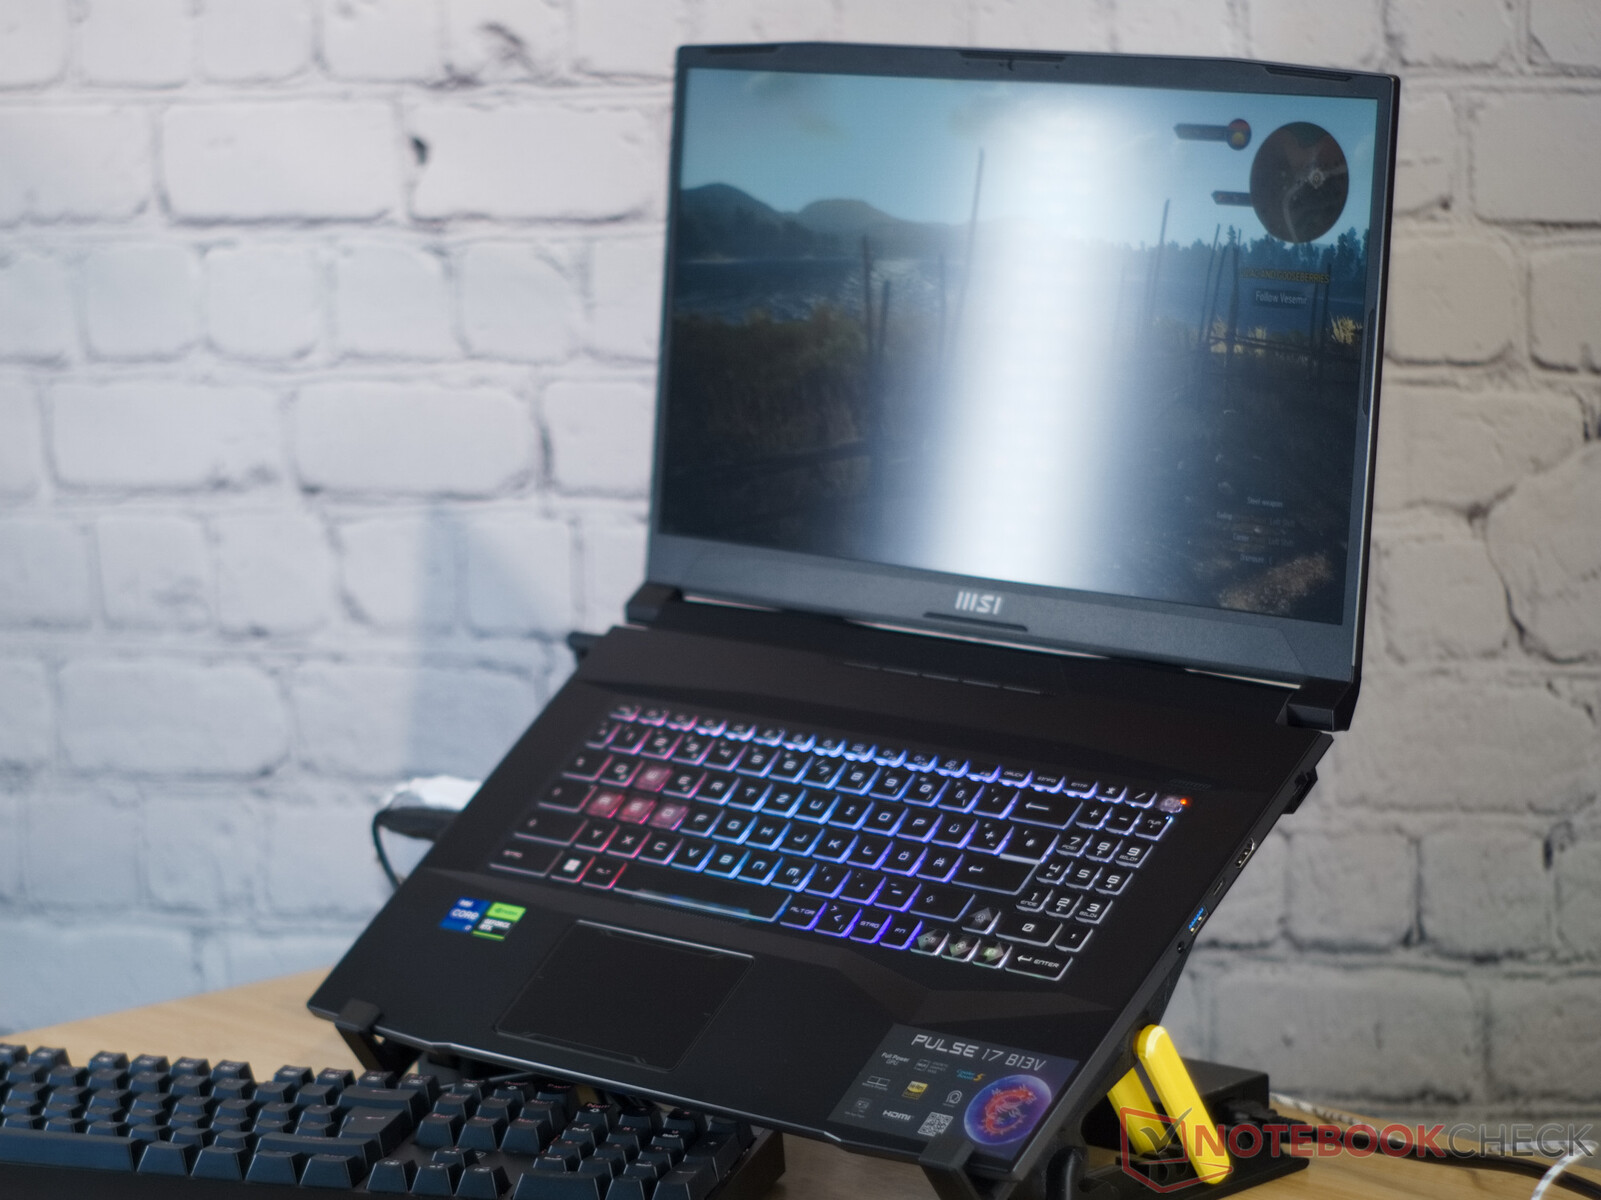
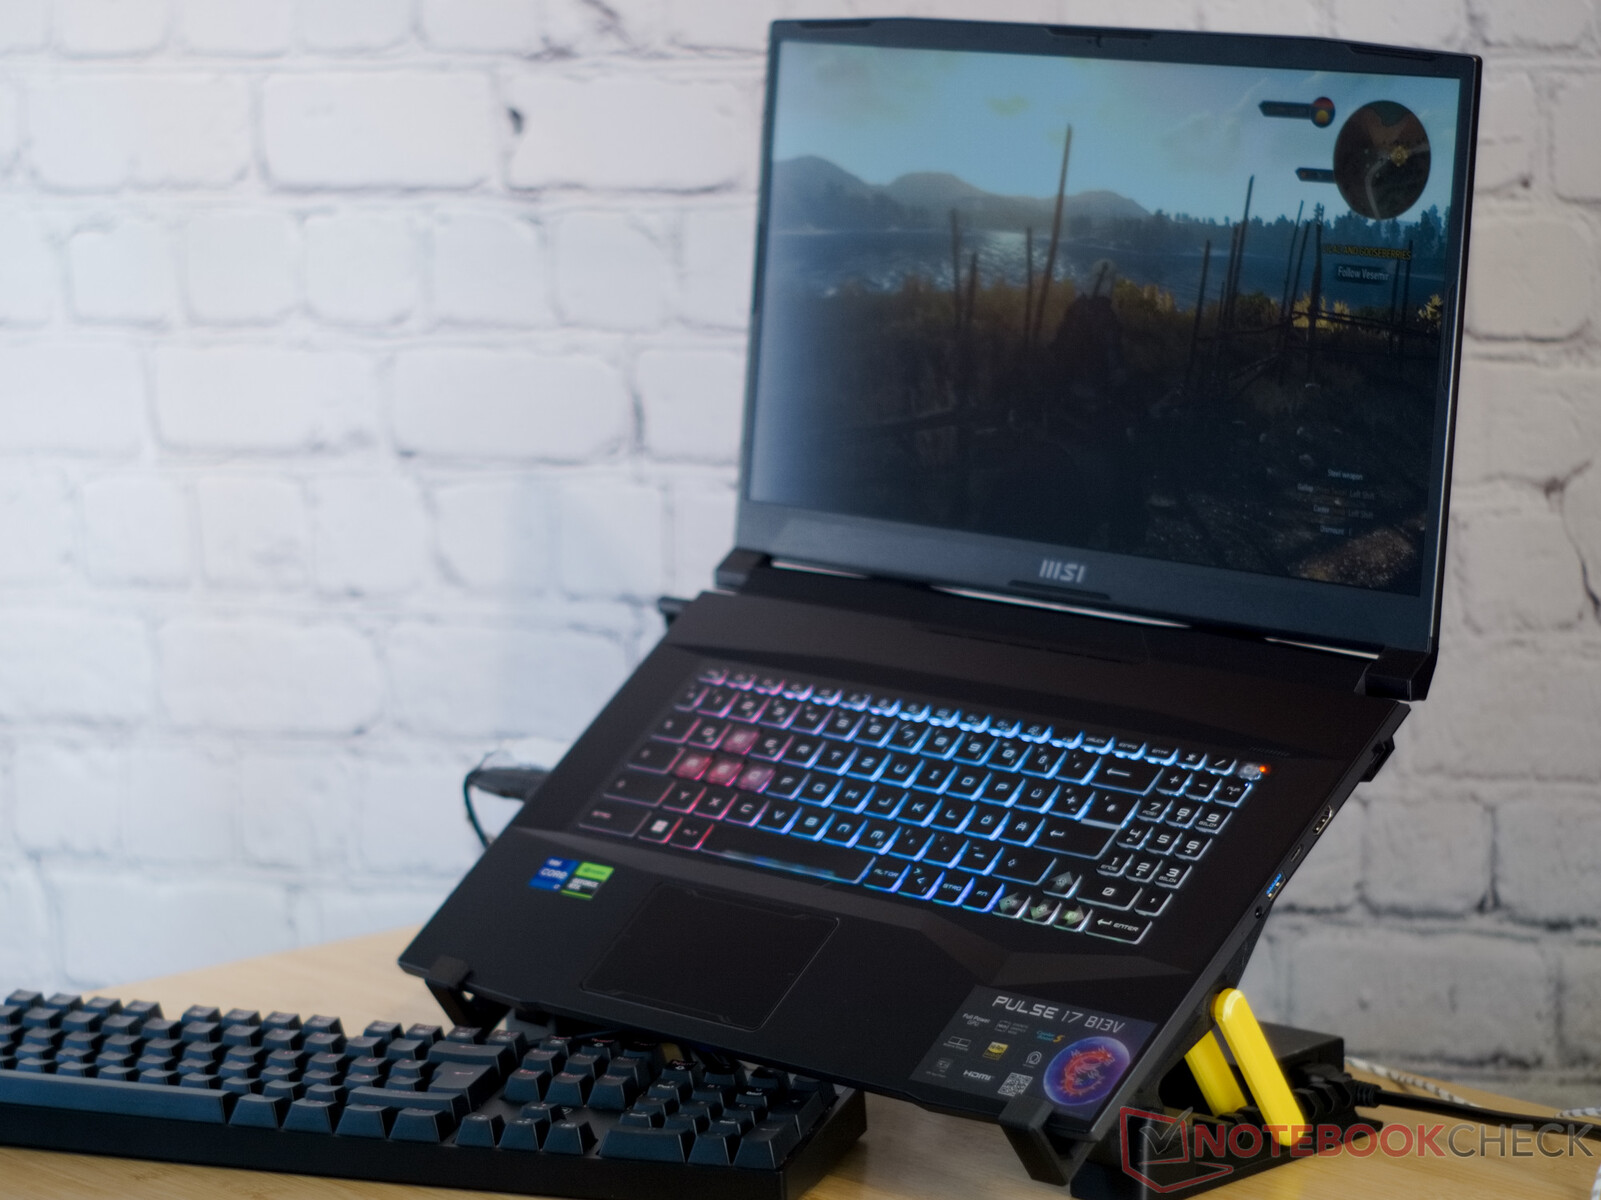
MSI Pulse 17 B13V - recension av bärbar dator för spel: Med tysta vingar
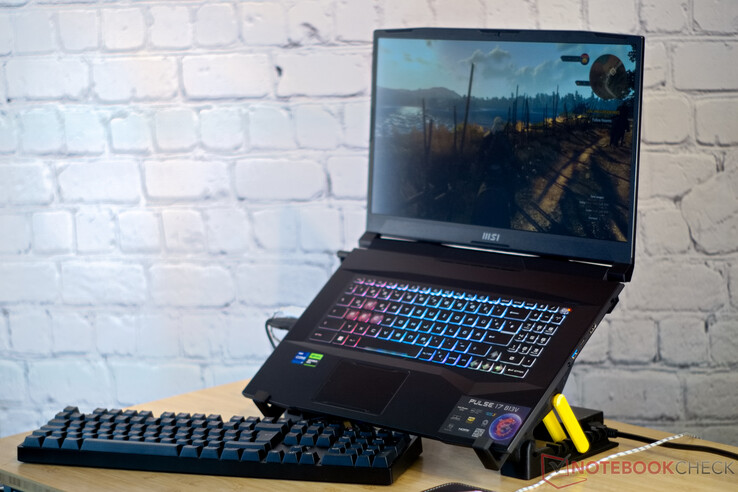
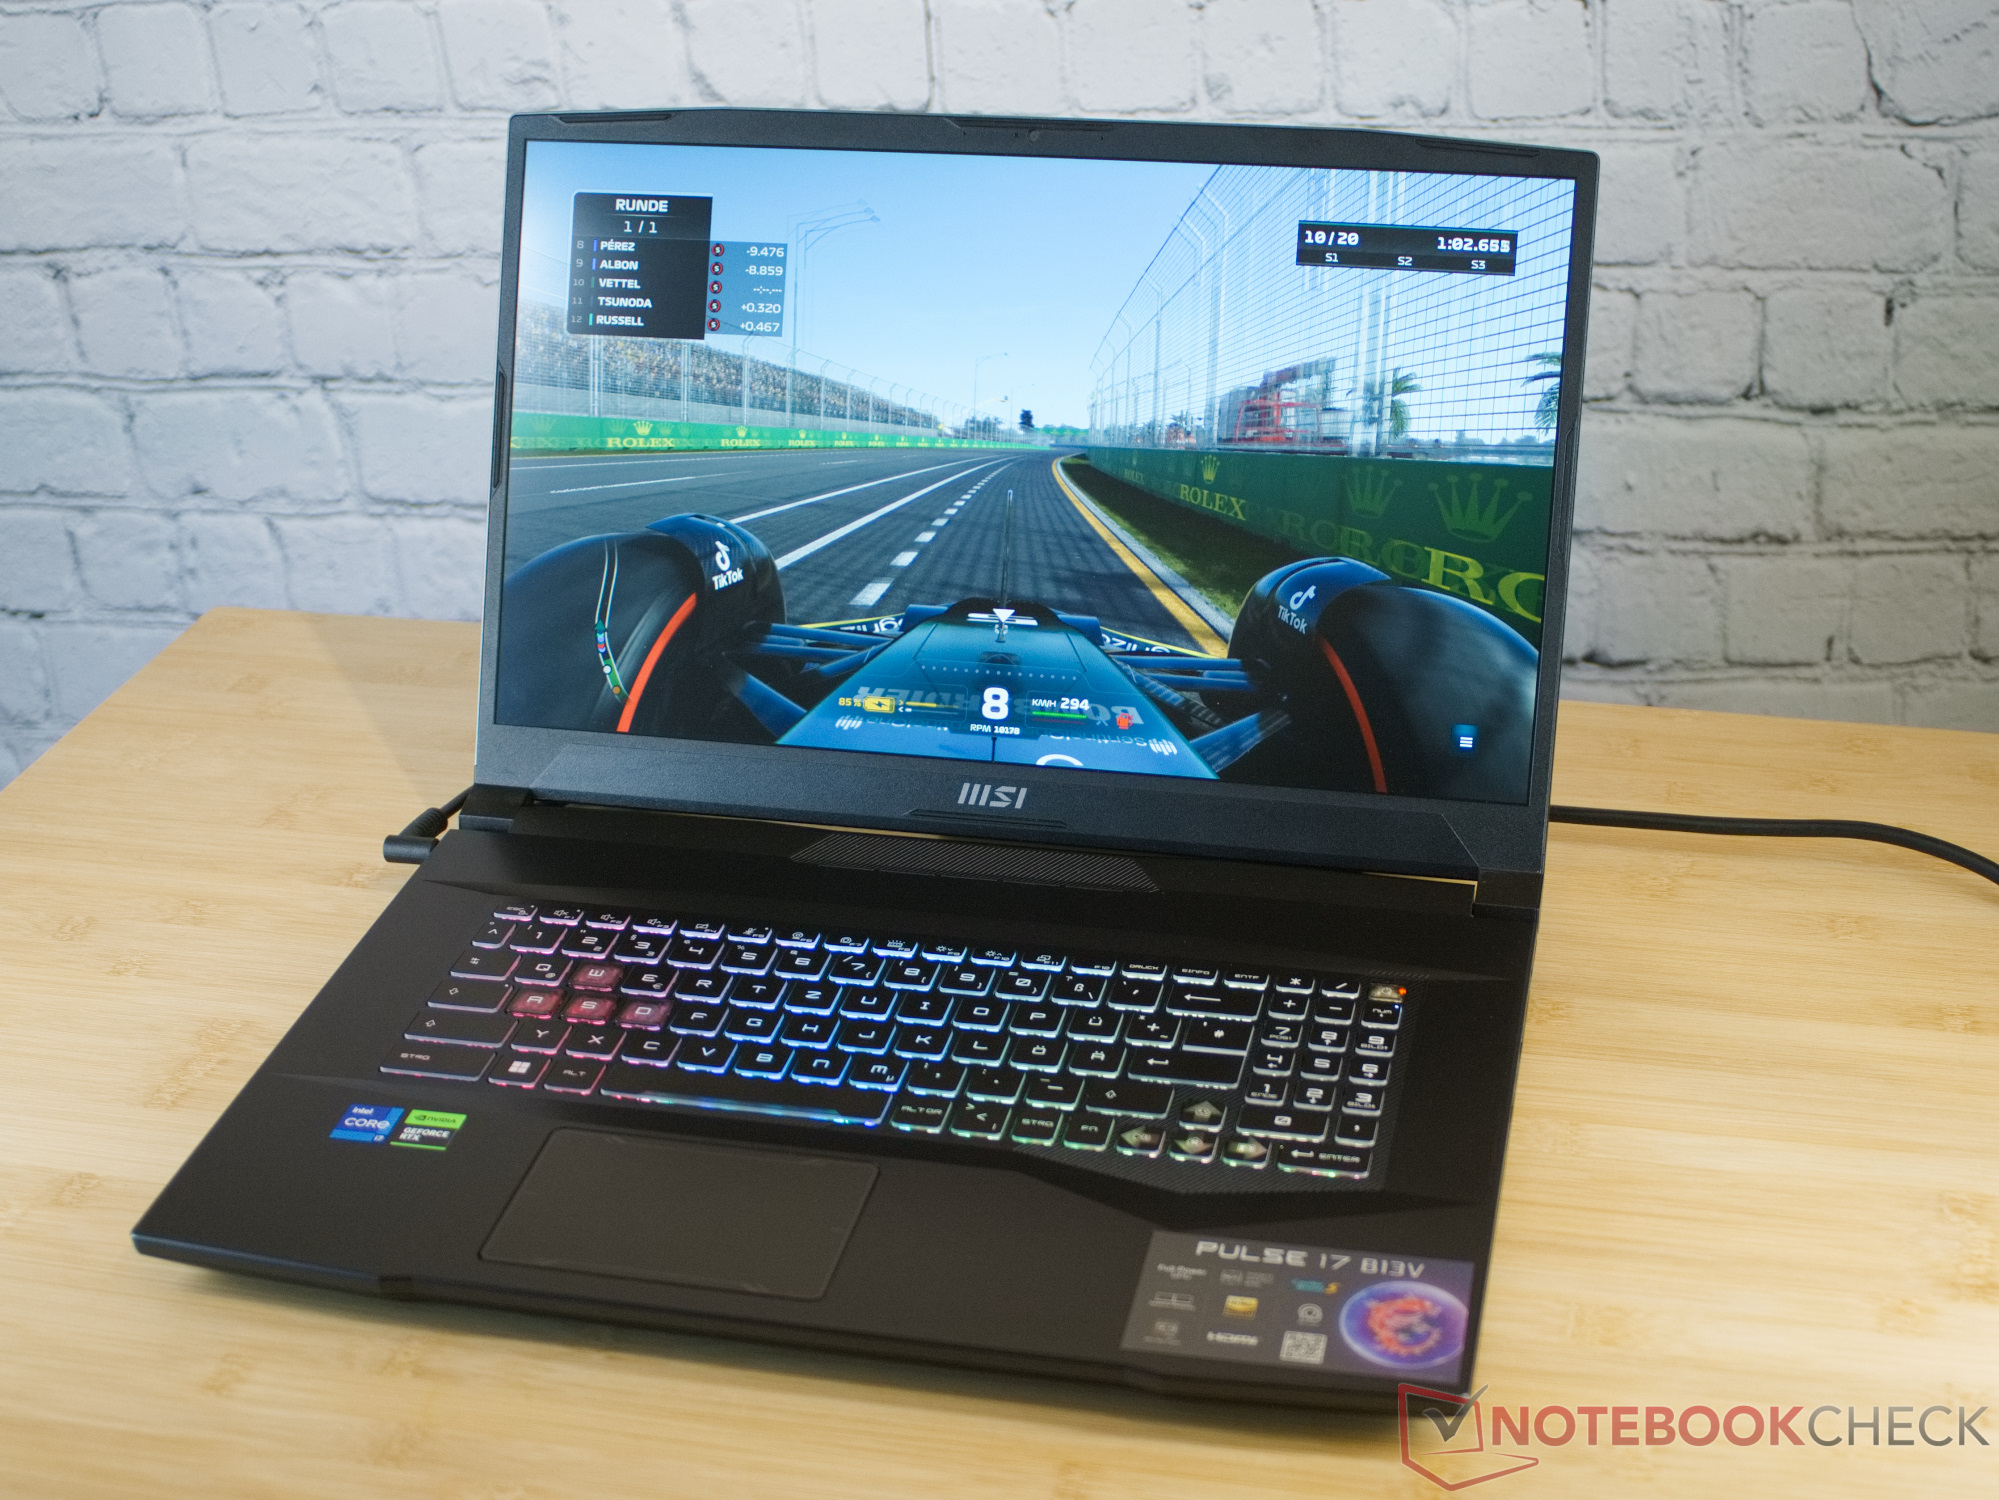
Med MSI Pulse 17 kommer Red Dragon med en bärbar speldator vars yttre påminner lite om science fiction. Detta intryck beror på displaylocket av anodiserat aluminium, många kanter och hörn och till och med bikaknätet på botten av den 17-tums bärbara datorn. Men inuti den bärbara datorn körs nuvarande komponenter, och vår testenhet är utrustad med en Intel Core i7-13700Hoch Nvidia GeForce RTX 4070. När vi testade föregångaren i början av åretvar prestandan hos den bärbara datorn övertygande. Men vi märkte också att Pulse GL76 saknade G-Sync, MUX, Advanced Optimus och Thunderbolt-stöd. Ljudnivån från fläktarna i den bärbara speldatorn gav också anledning till klagomål.
MSI har nu omarbetat den bärbara datorn avsevärt och introducerat många förbättringar överallt, förutom den nya designen, chipgenerationerna och det kryptiska namnet. Med detta stiger den kraftfulla enheten avsevärt i våra betyg. Vi jämför den bärbara datorn med Asus ROG Strix G17 G713PI, denMSI Katana 17 B13VFK, och Schenker XMG Focus 17 (E23).
Potentiella konkurrenter i jämförelse
Gradering | Datum | Modell | Vikt | Höjd | Storlek | Upplösning | Pris |
|---|---|---|---|---|---|---|---|
| 86.3 % v7 (old) | 07/2023 | MSI Pulse 17 B13VGK i7-13700H, GeForce RTX 4070 Laptop GPU | 2.7 kg | 27.2 mm | 17.30" | 1920x1080 | |
| 83.2 % v7 (old) | 01/2023 | MSI Pulse GL76 12UGK i7-12700H, GeForce RTX 3070 Laptop GPU | 2.6 kg | 24.2 mm | 17.30" | 1920x1080 | |
| 82.1 % v7 (old) | 02/2023 | MSI Katana 17 B13VFK i7-13620H, GeForce RTX 4060 Laptop GPU | 2.8 kg | 25.2 mm | 17.30" | 1920x1080 | |
| 87.2 % v7 (old) | 07/2023 | Acer Nitro 17 AN17-51-71ER i7-13700H, GeForce RTX 4060 Laptop GPU | 3 kg | 30.3 mm | 17.30" | 2560x1440 | |
| 85.9 % v7 (old) | 06/2023 | Schenker XMG Focus 17 (E23) i9-13900HX, GeForce RTX 4070 Laptop GPU | 2.9 kg | 29.3 mm | 17.30" | 2560x1440 | |
| 88.4 % v7 (old) | 04/2023 | Asus ROG Strix G17 G713PI R9 7945HX, GeForce RTX 4070 Laptop GPU | 2.8 kg | 30.7 mm | 17.30" | 2560x1440 |
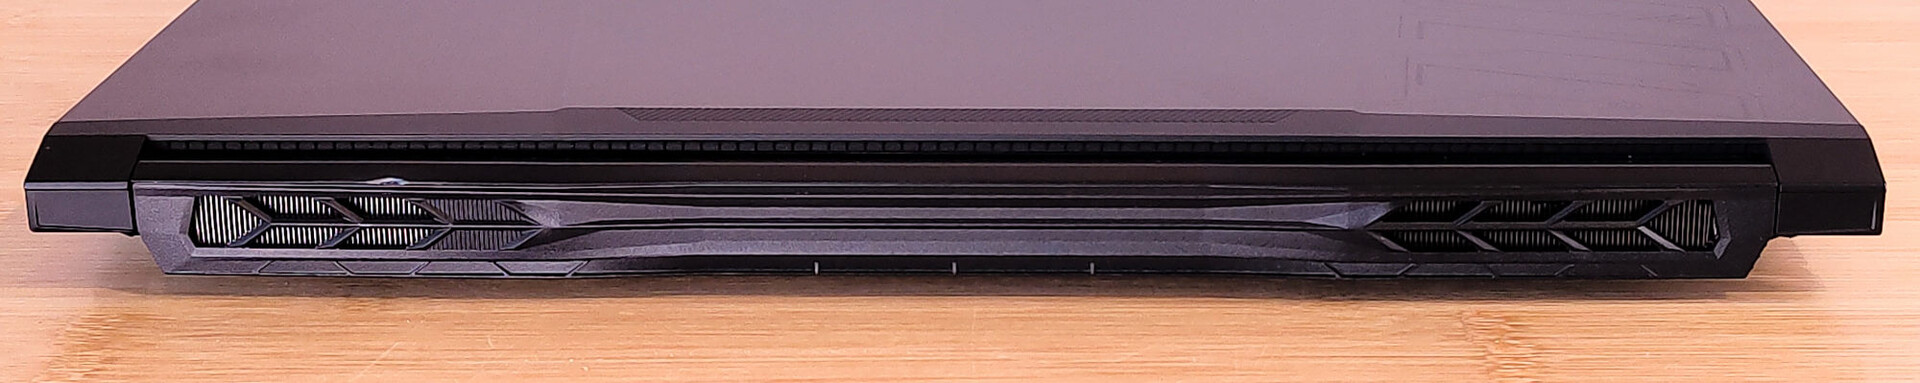
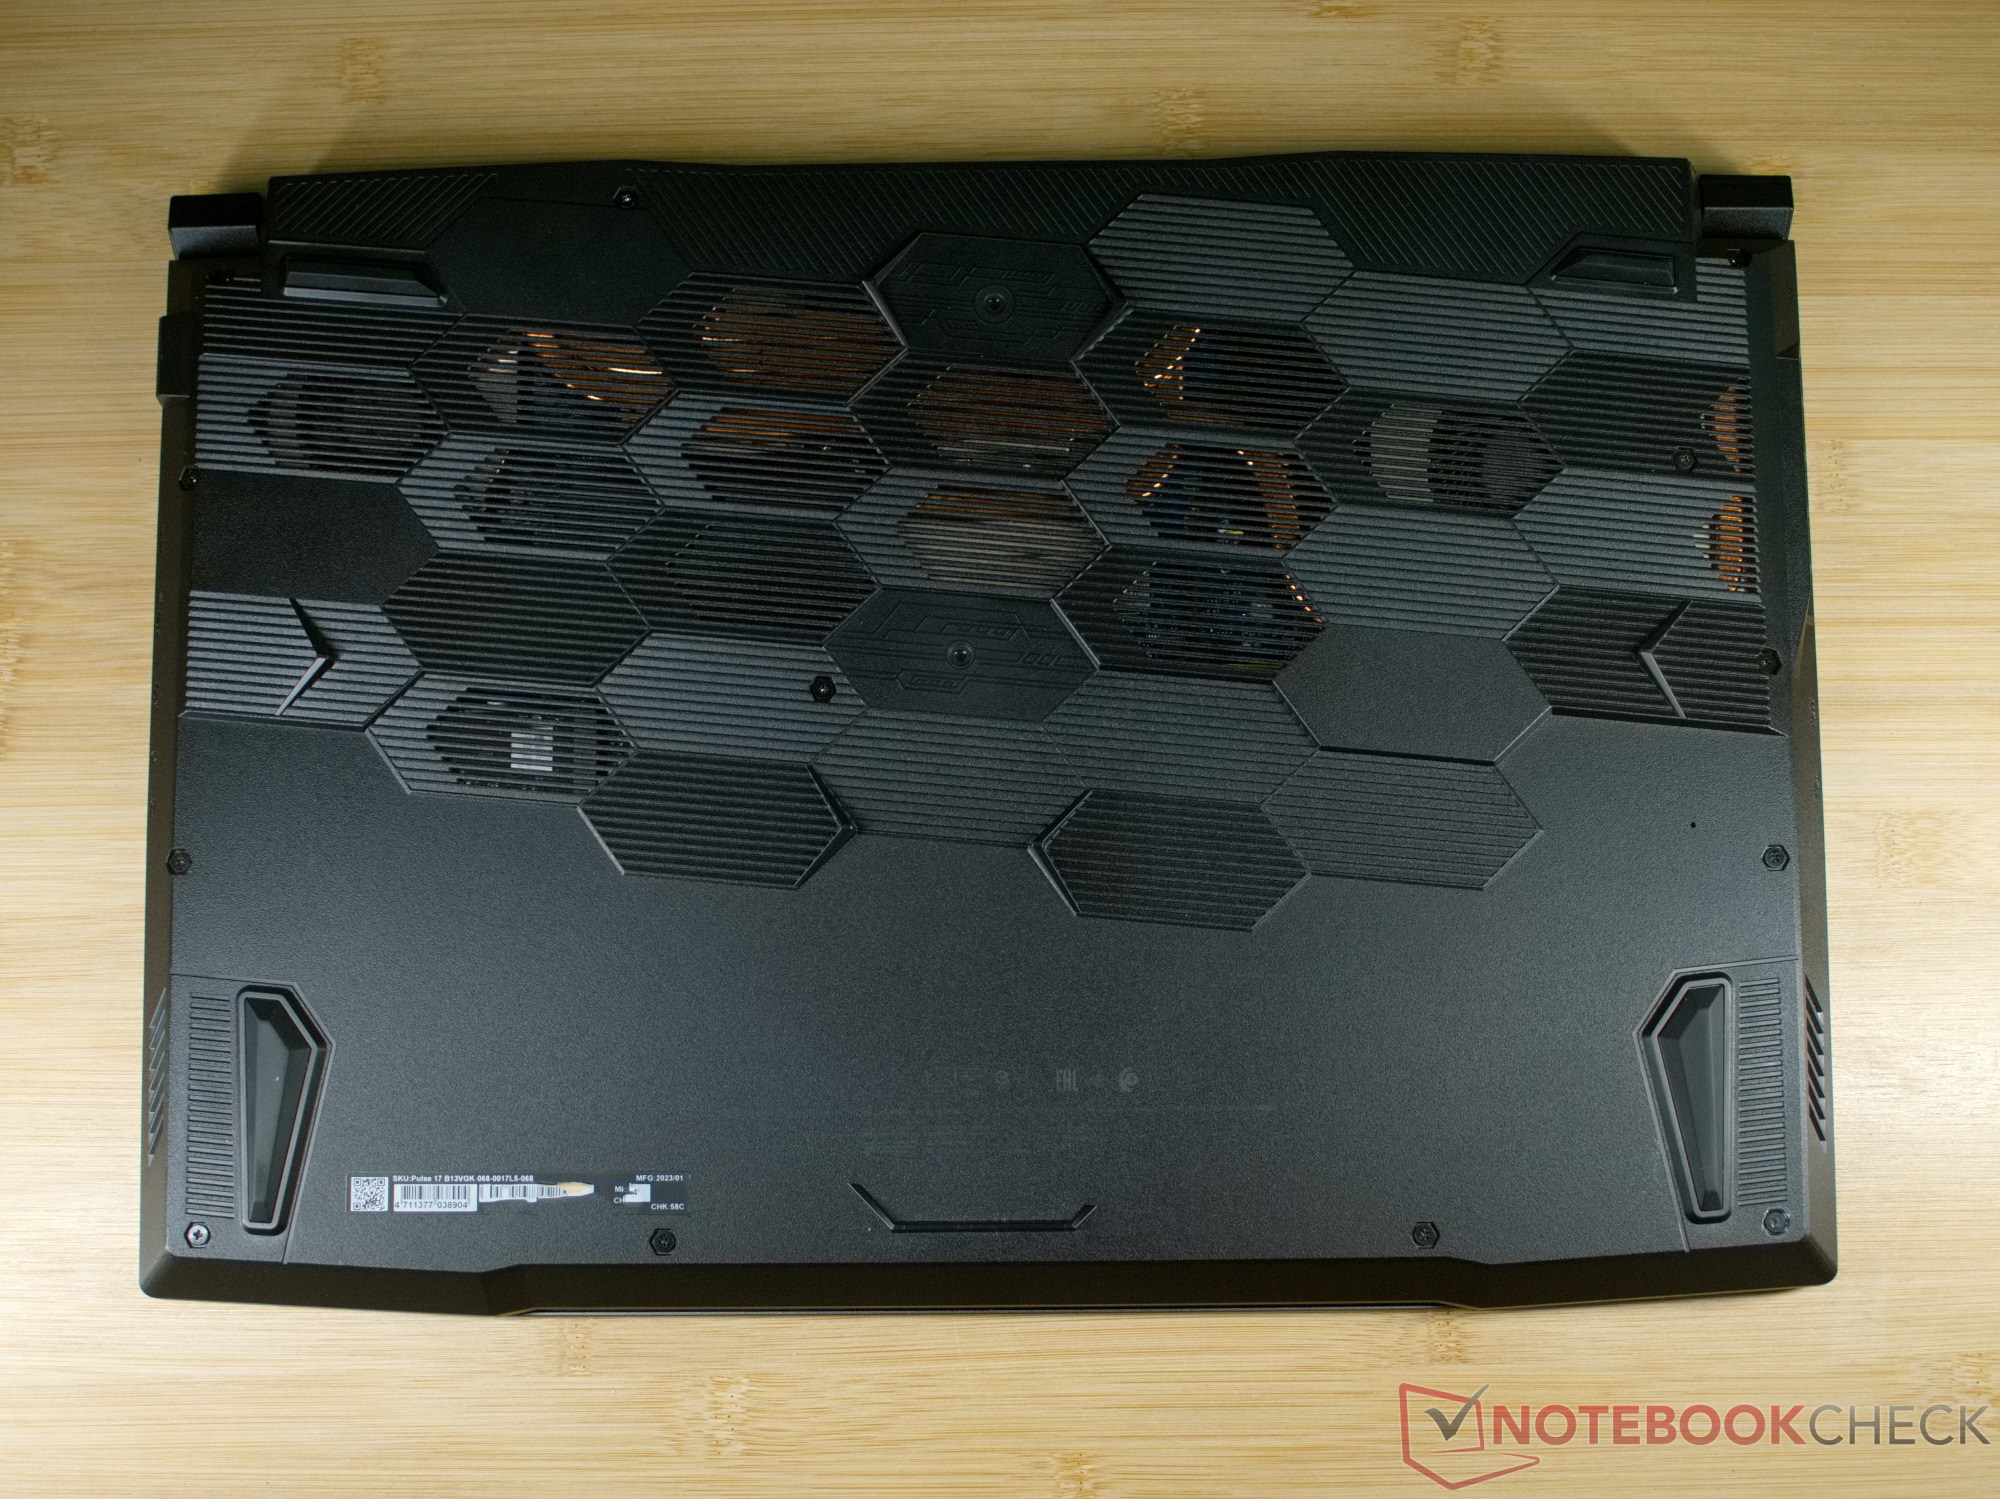
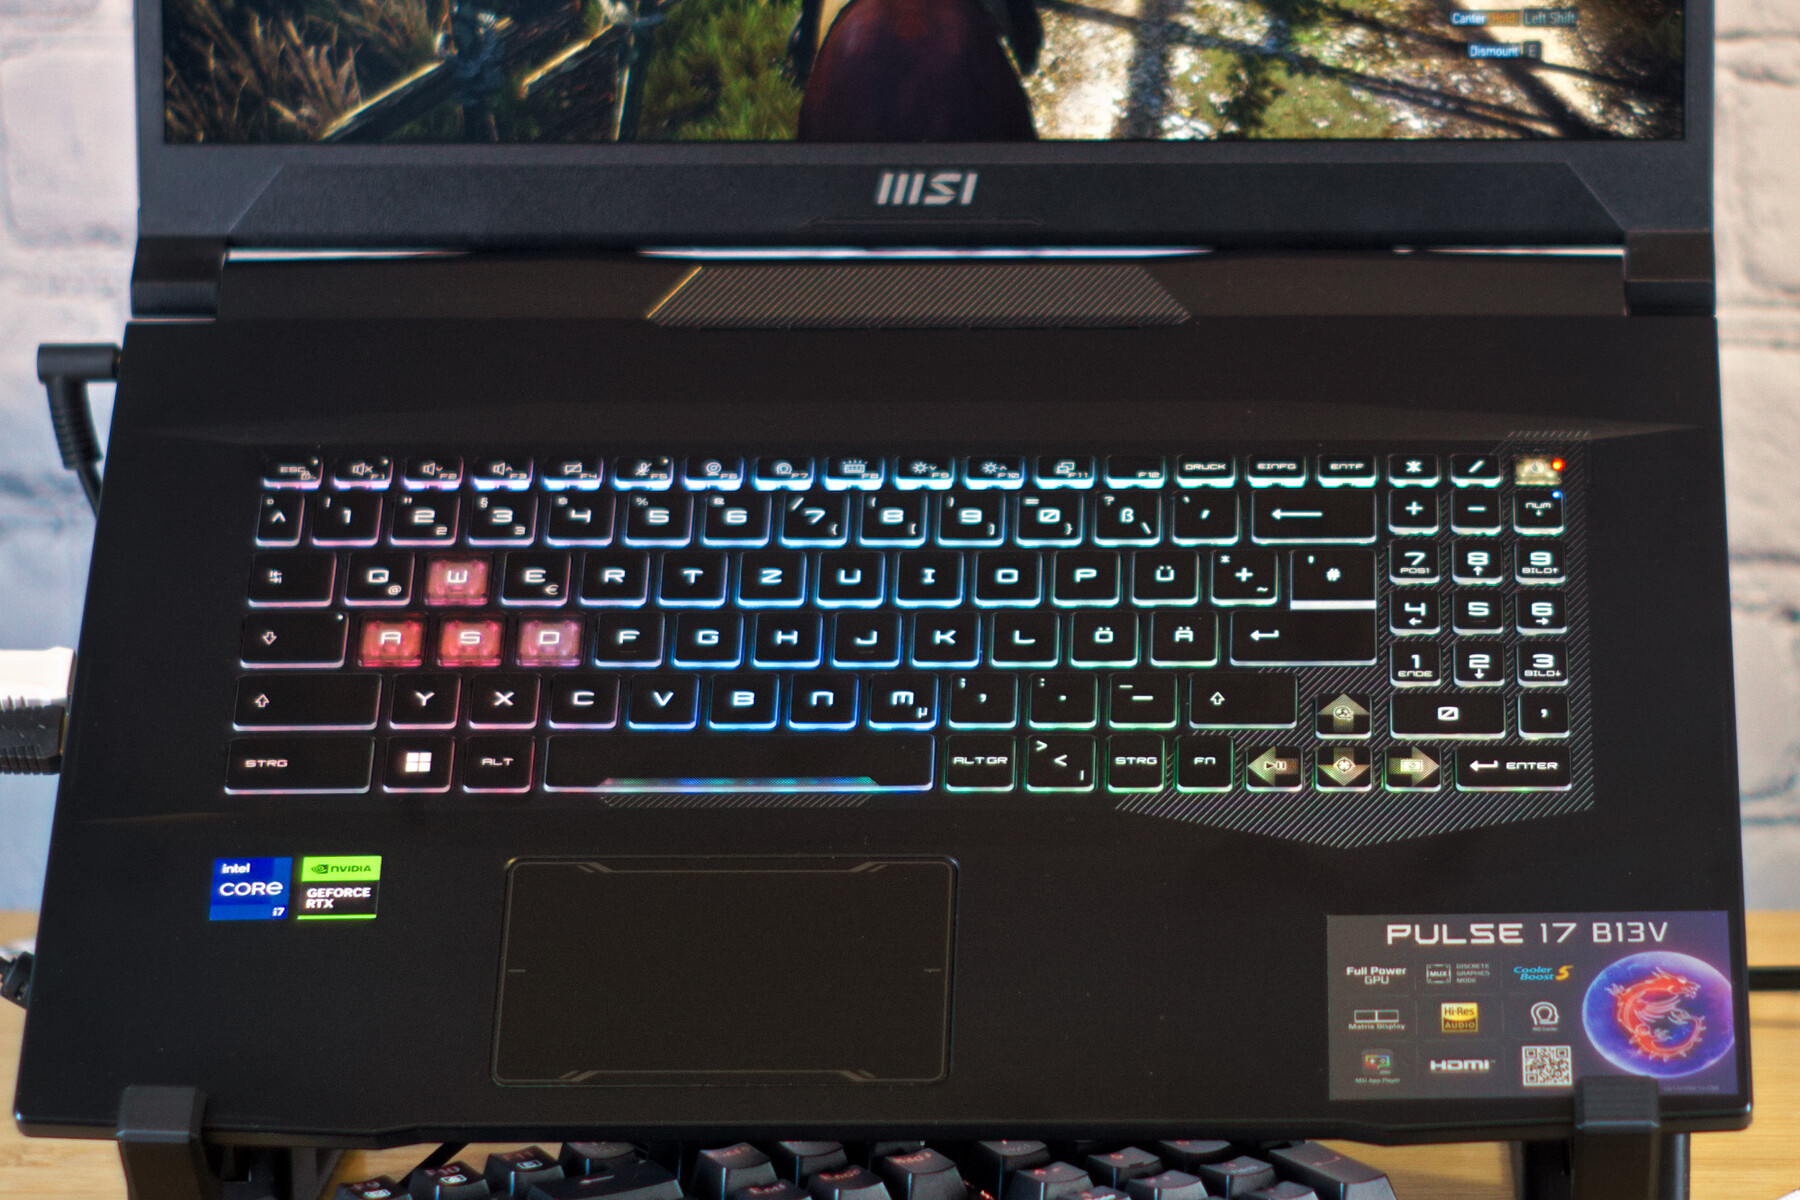
Fodral - Displaylock i aluminium med sci-fi-utseende
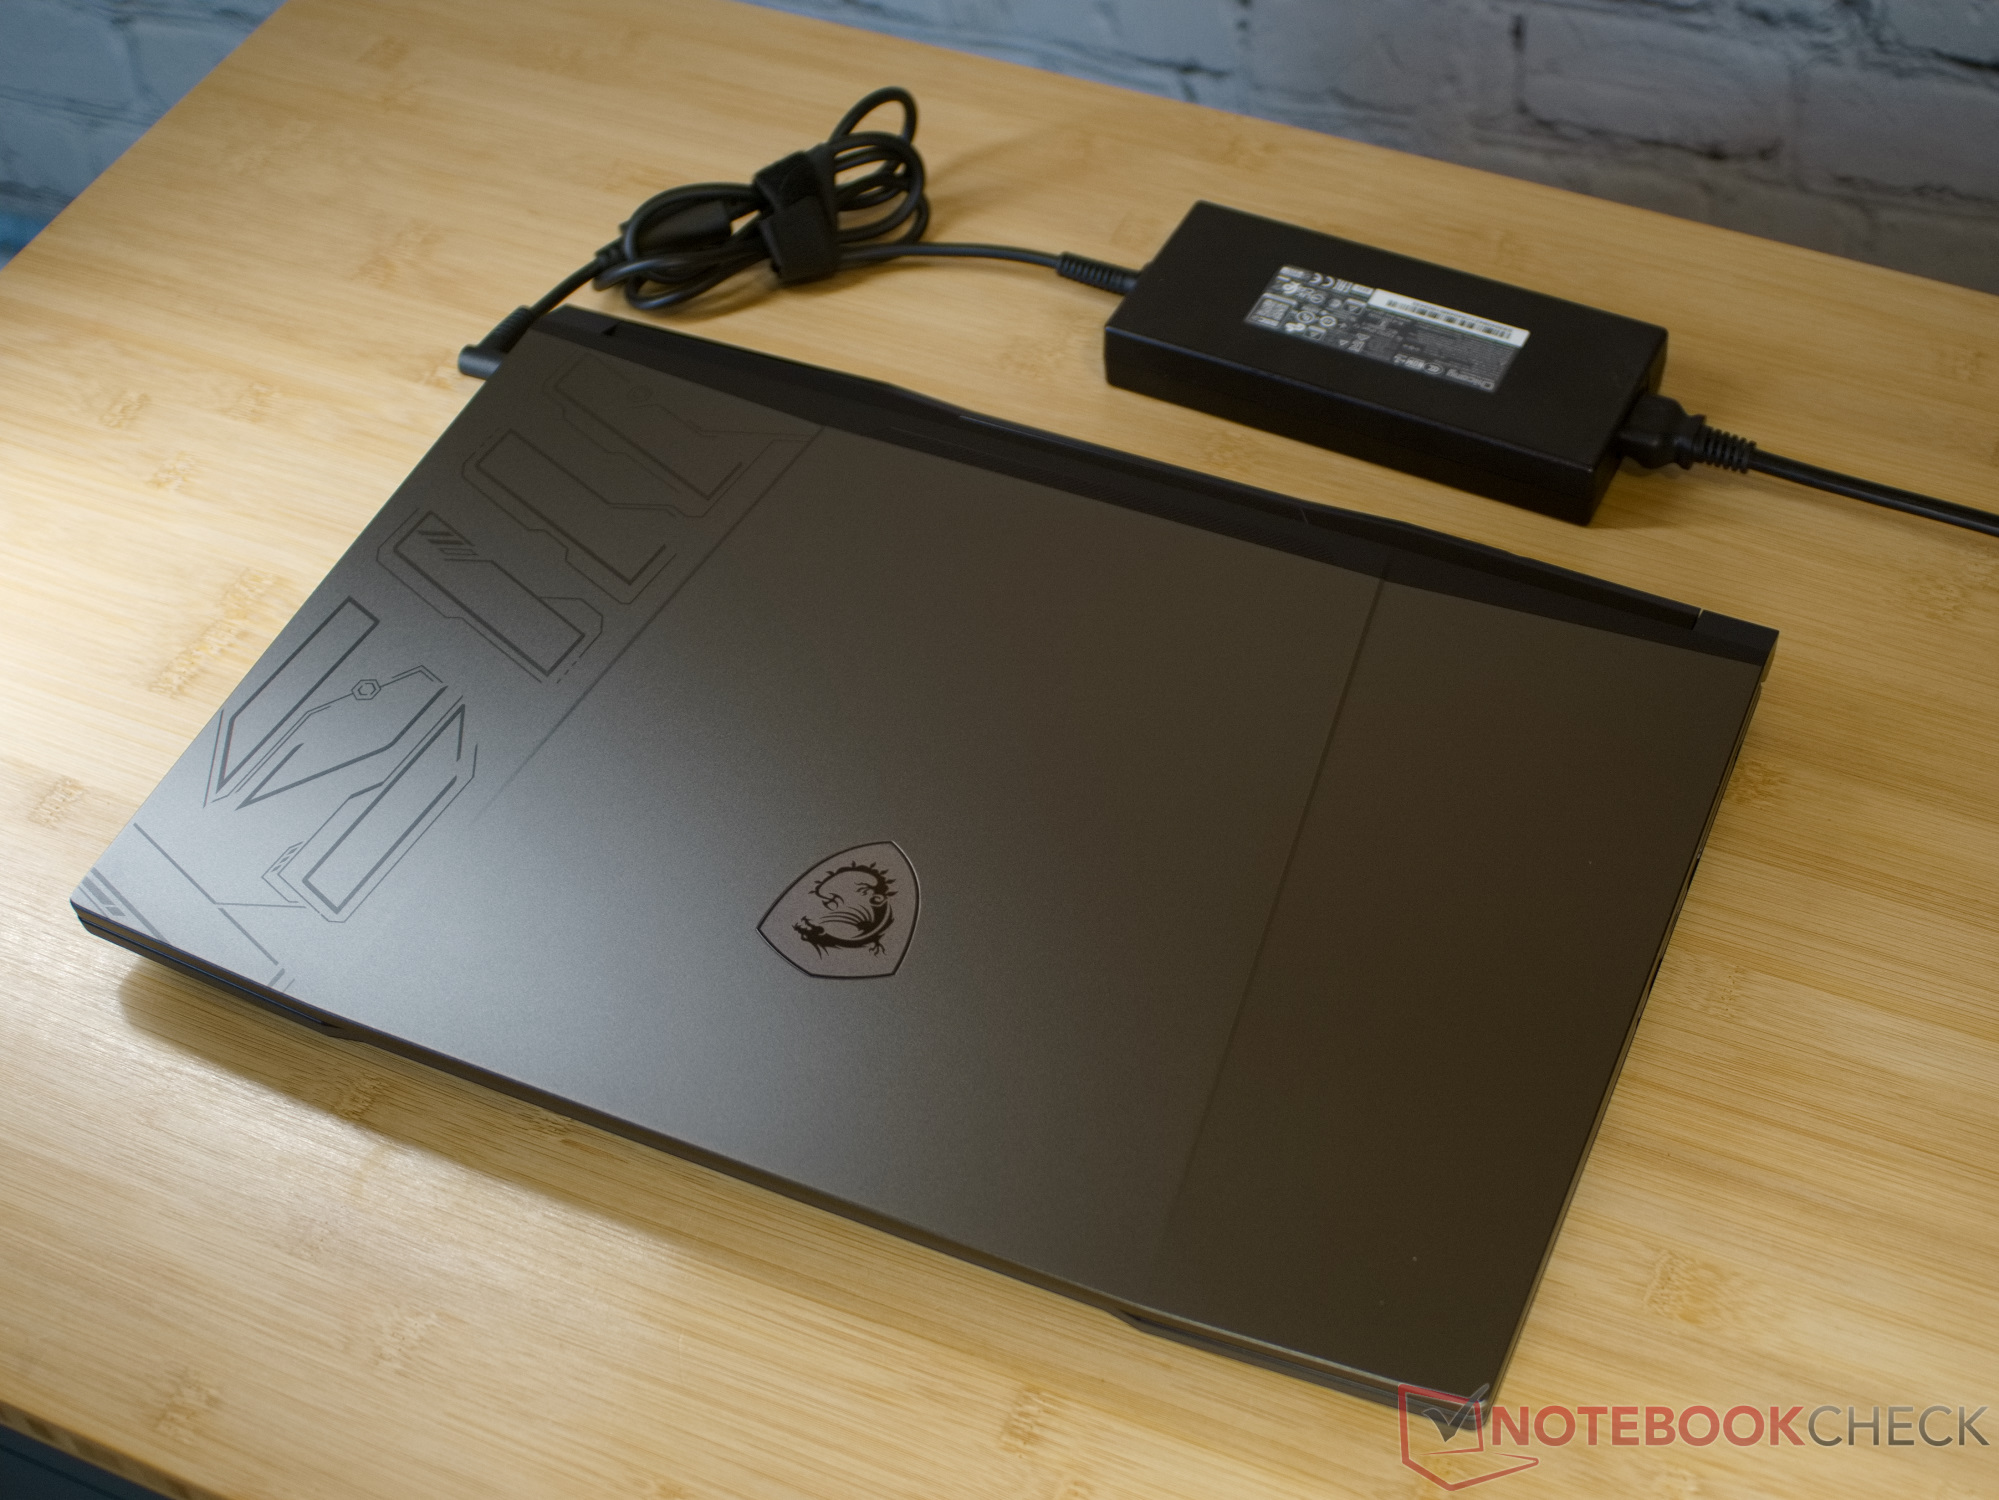
Nästan alla nuvarande bärbara speldatorer från MSI är designade med ett liknande koncept. Om och om igen använder MSI de aggressiva linjerna på displaylocket samt de kantiga gångjärnen och bikakemönstret på höljets botten. I Pulse 17 är aluminiumdisplaylocket ornamenterat av några kanter som ger en extra sci-fi-känsla till den bärbara datorn. Under locket fortsätter det futuristiska temat med MSI som också lägger till många designelement här.
Samtidigt är fodralet till MSI Pulse 17 ganska robust, men den stora storleken på den bärbara datorn innebär också att det fortfarande är möjligt att vrida eller trycka in plastelementen något. Pulse 17 presenterar sig dock som en solid enhet totalt sett. Den stora skärmen kan öppnas 180 ° och kan hålla sin position i viss utsträckning. Gångjärnen är nästan för lätta att flytta, och några lätta vibrationer eller knackning på displayen kommer redan att flytta den lite.
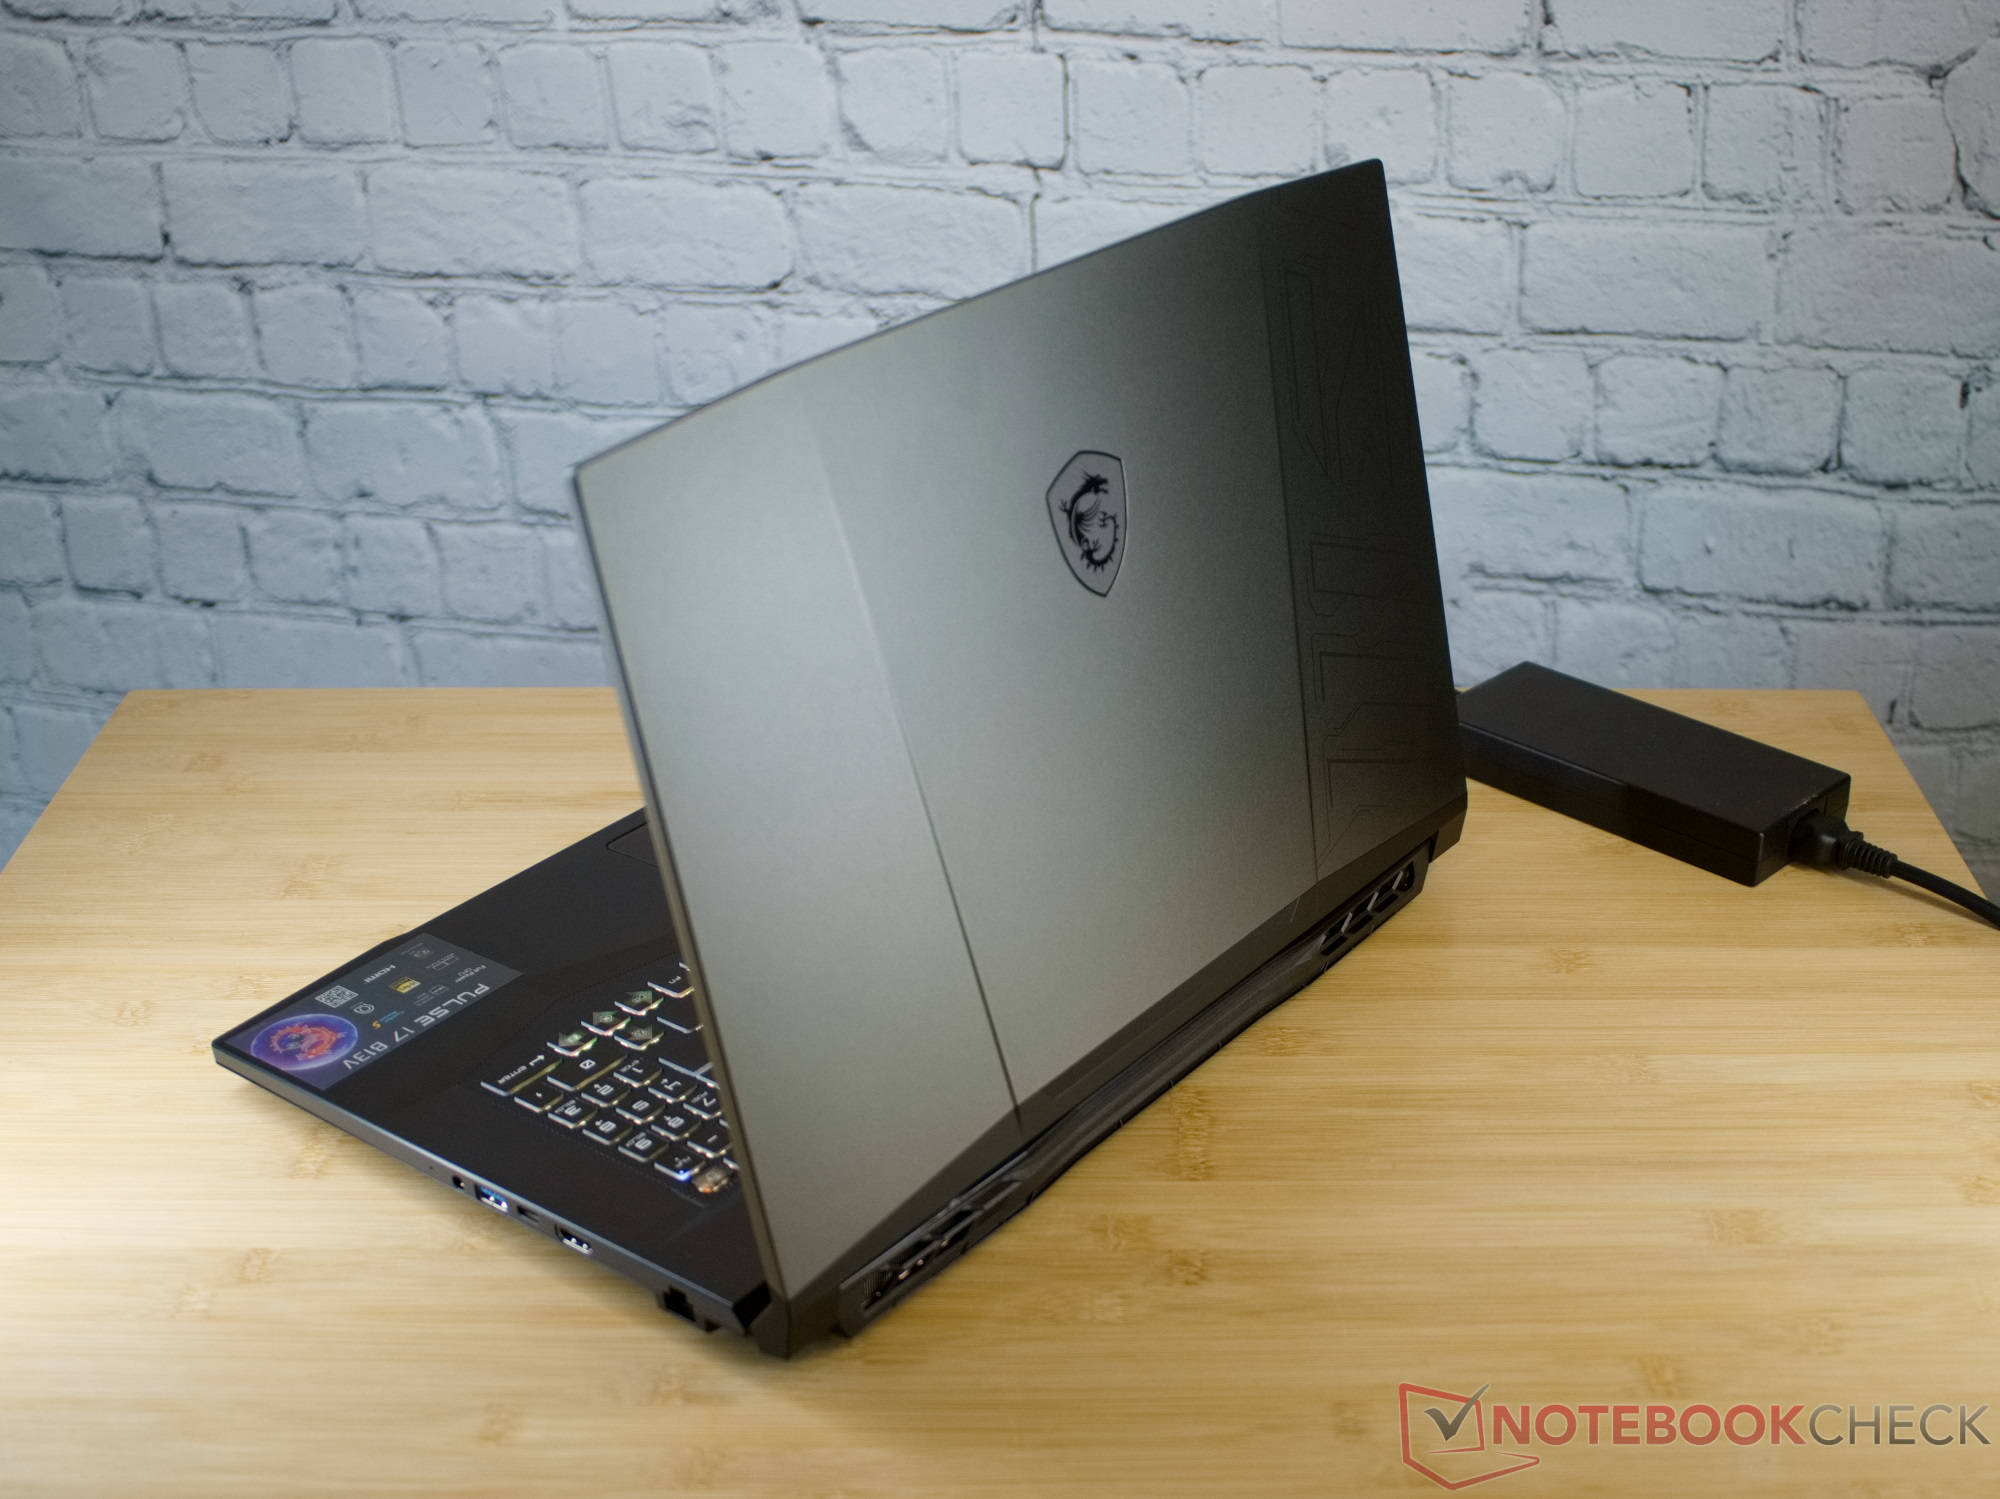
Med en vikt på 2,7 kg (~6 lb) är MSI Pulse 17 lättviktaren bland sina konkurrenter i samma storlek. Endast föregångarmodellen väger mindre. Bortsett från det skiljer sig de nuvarande bärbara speldatorerna i vår jämförelse ganska lite när det gäller hur de fyller upp väskan.
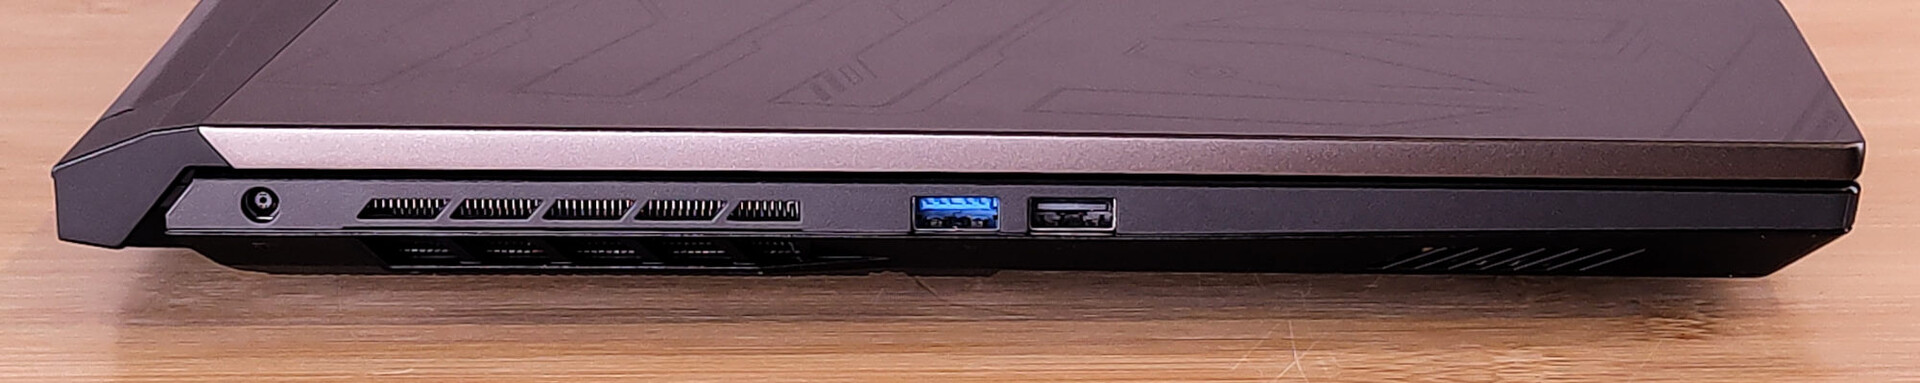
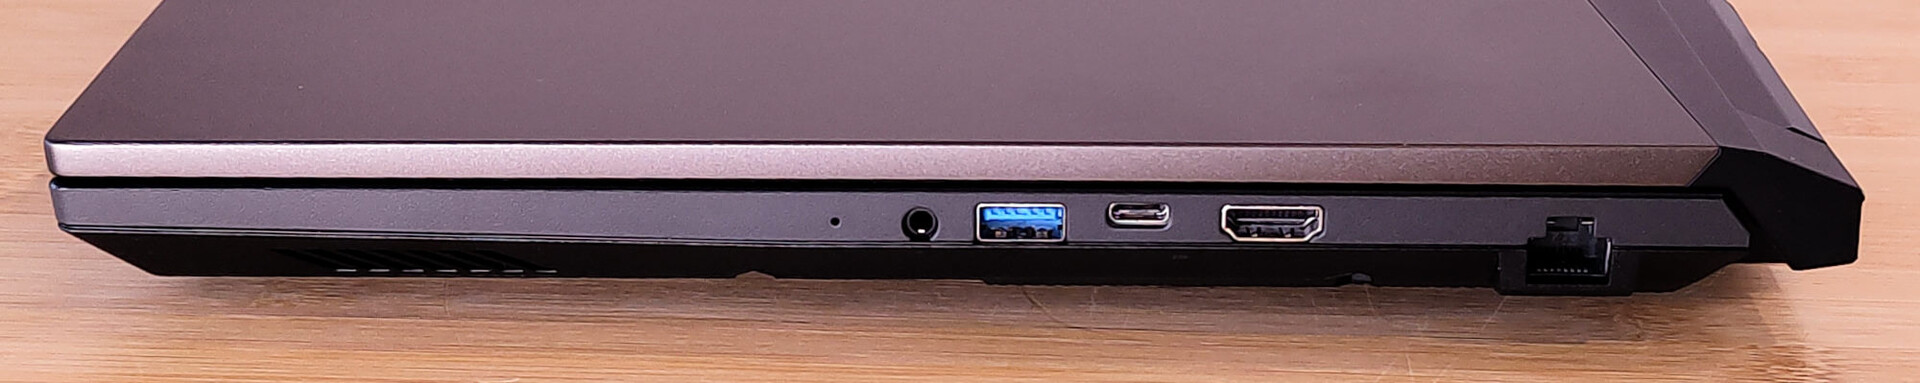
Utrustning - Ingen Thunderbolt och endast USB 3.2 Gen 1
Det faktum att Pulse har två USB-anslutningar på varje sida är en smart design som gör att både vänster- och högerhänta användare kan hålla sina kablar ur vägen. En av USB-portarna på höger sida är en USB-C-anslutning, men tyvärr har den bara stöd för dataöverföring och DisplayPort.
Kommunikation
Med Gigabit LAN och WiFi 6 från Intel AX201-modulen är Pulse 17 inte riktigt uppdaterad när det gäller nätverksteknik. Å andra sidan visar vår testenhet att höga och stabila överföringshastigheter också är möjliga i 5-GHz-nätverket.
Webbkamera
Webbkameran på MSI Pulse 17 är också allt annat än modern. Den erbjuder HD-upplösning och ger ganska suddiga bilder med starka kromatiska avvikelser vid kontrasterande kanter.


Tillbehör
Förutom det vanliga pappersarbetet, ett klistermärke med den röda draken och laddaren för den bärbara datorn, hittar vi inga ytterligare tillbehör i förpackningen.
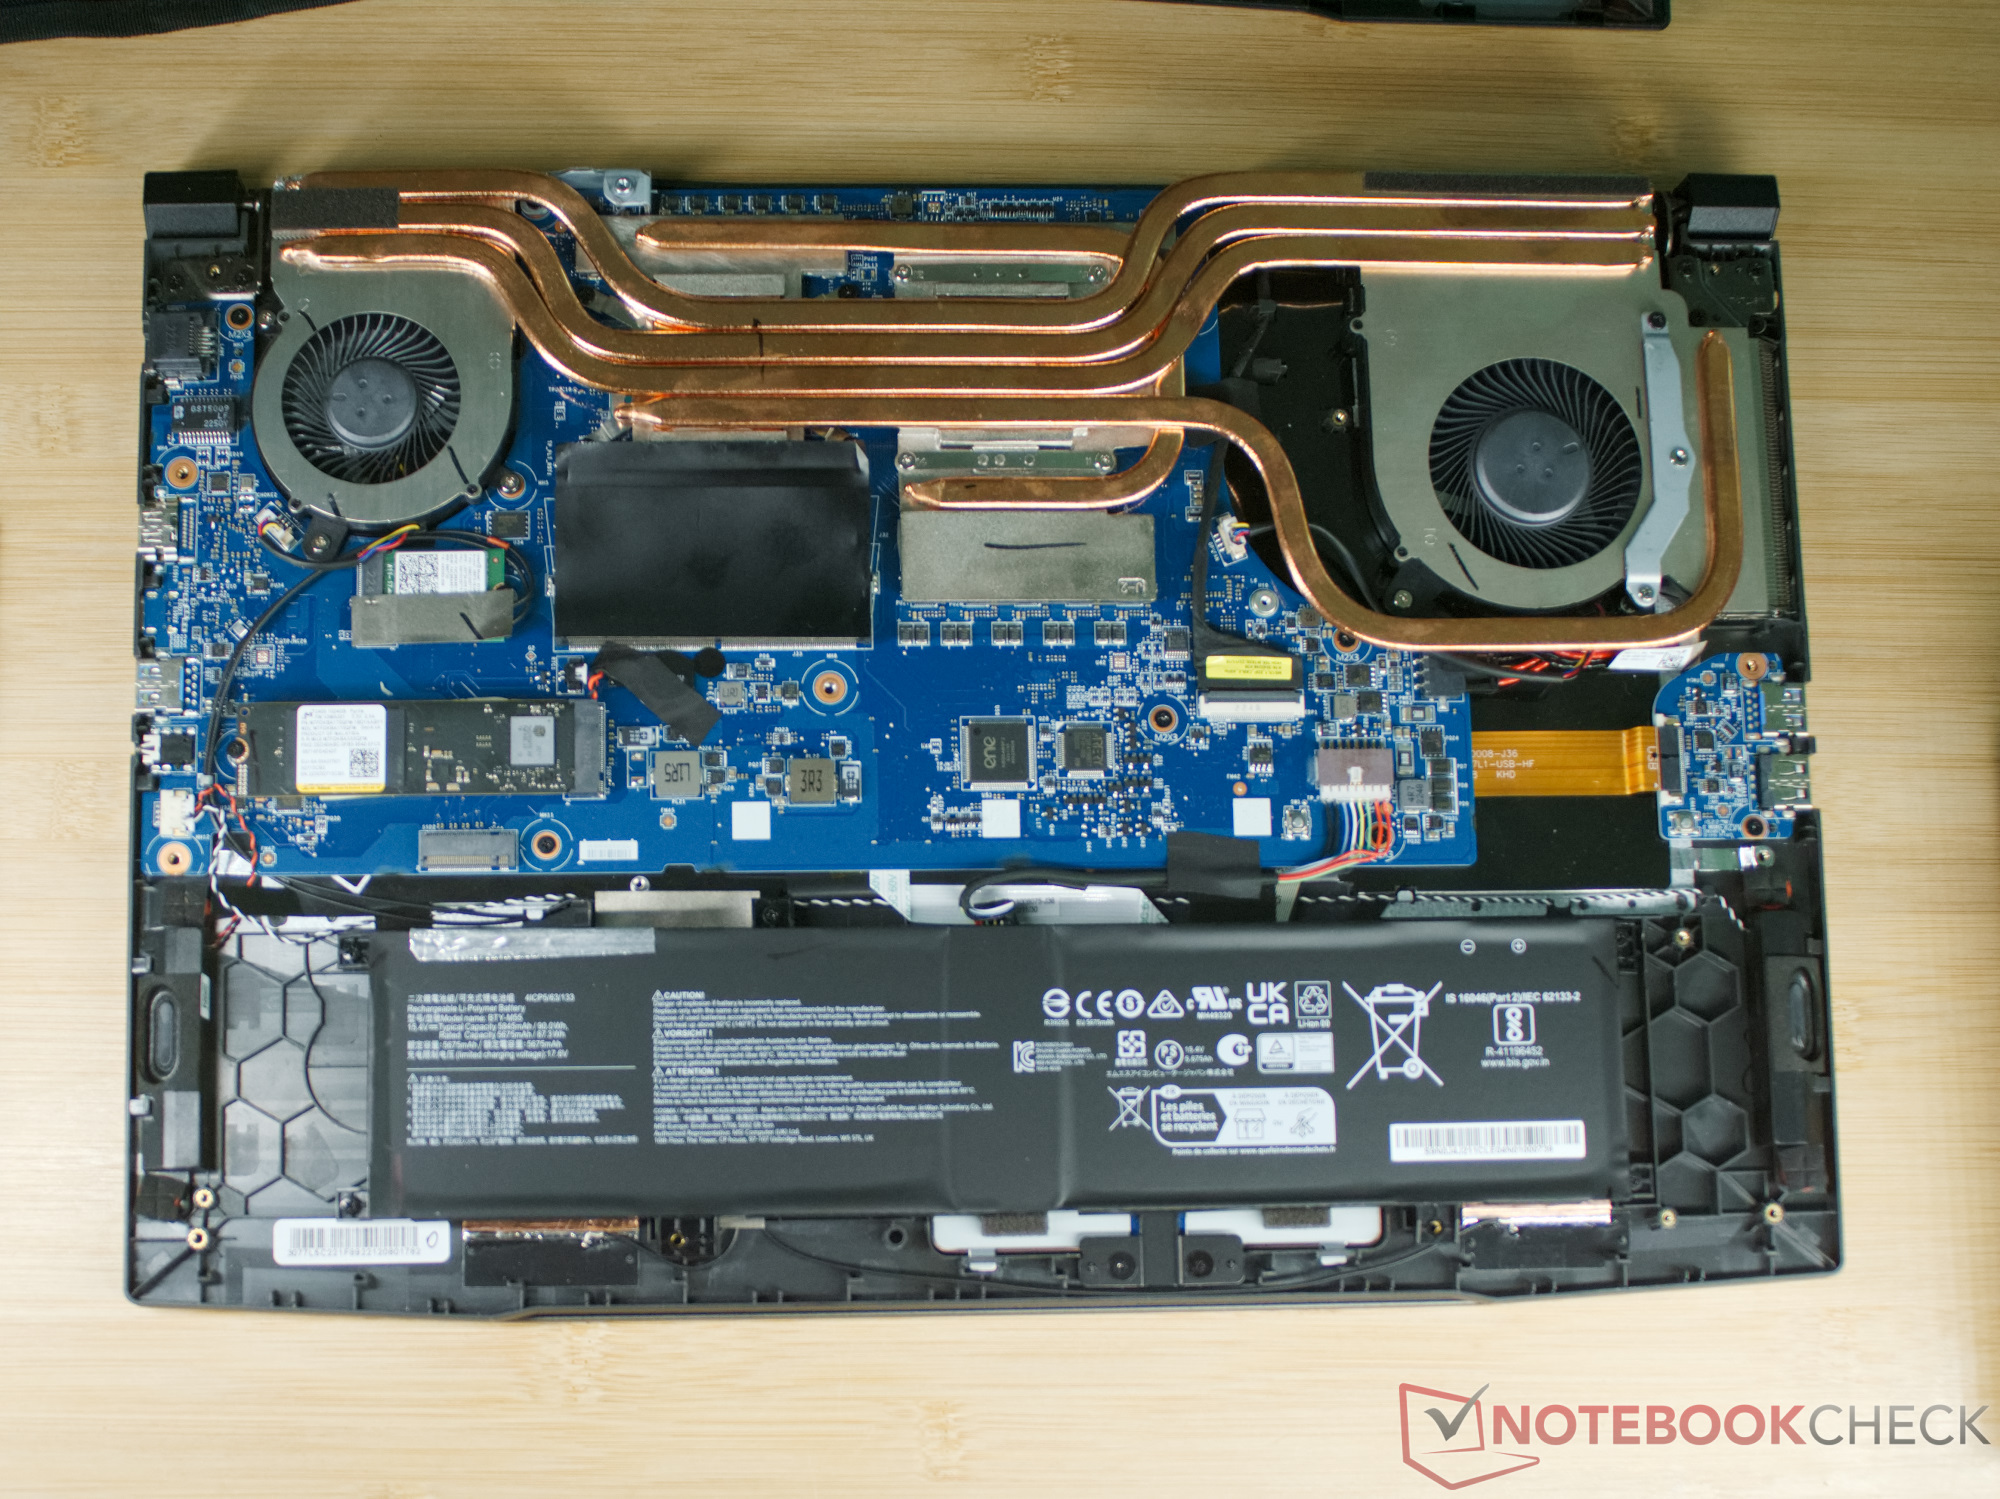
Underhåll
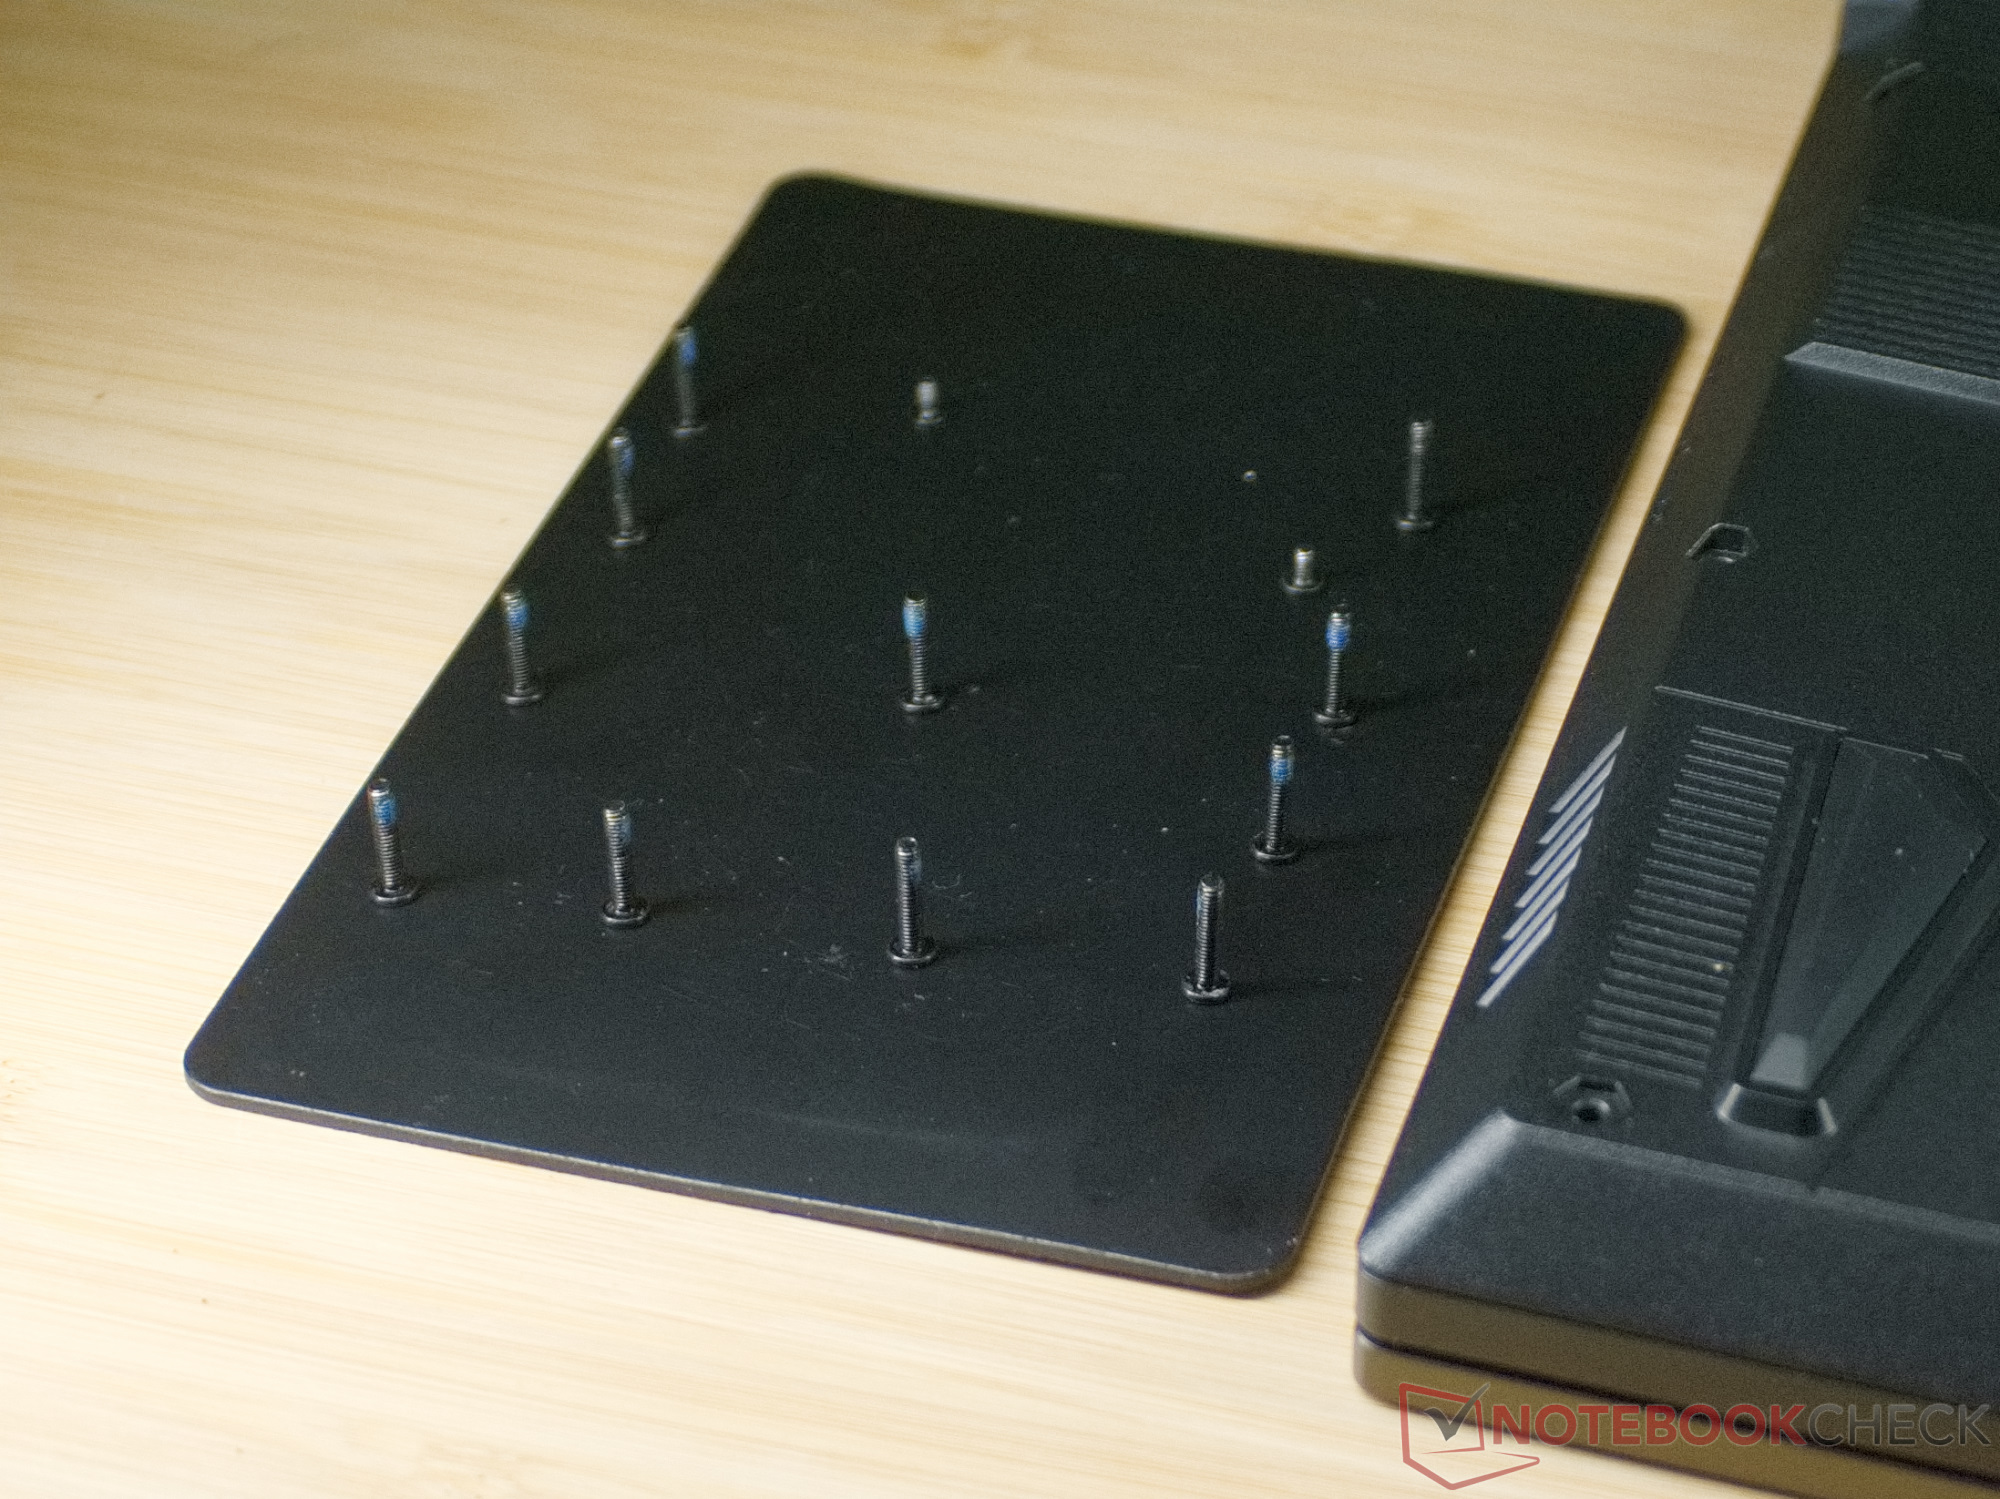
En av de 13 Phillips PH0-skruvarna som håller fast chassits botten är skyddad av en klisterförsegling i vår testenhet. Även om MSI upprepade gånger betonar att detta inte är relevant för garantin, kan vissa leverantörer protestera om förseglingen bryts i ett garantifall.
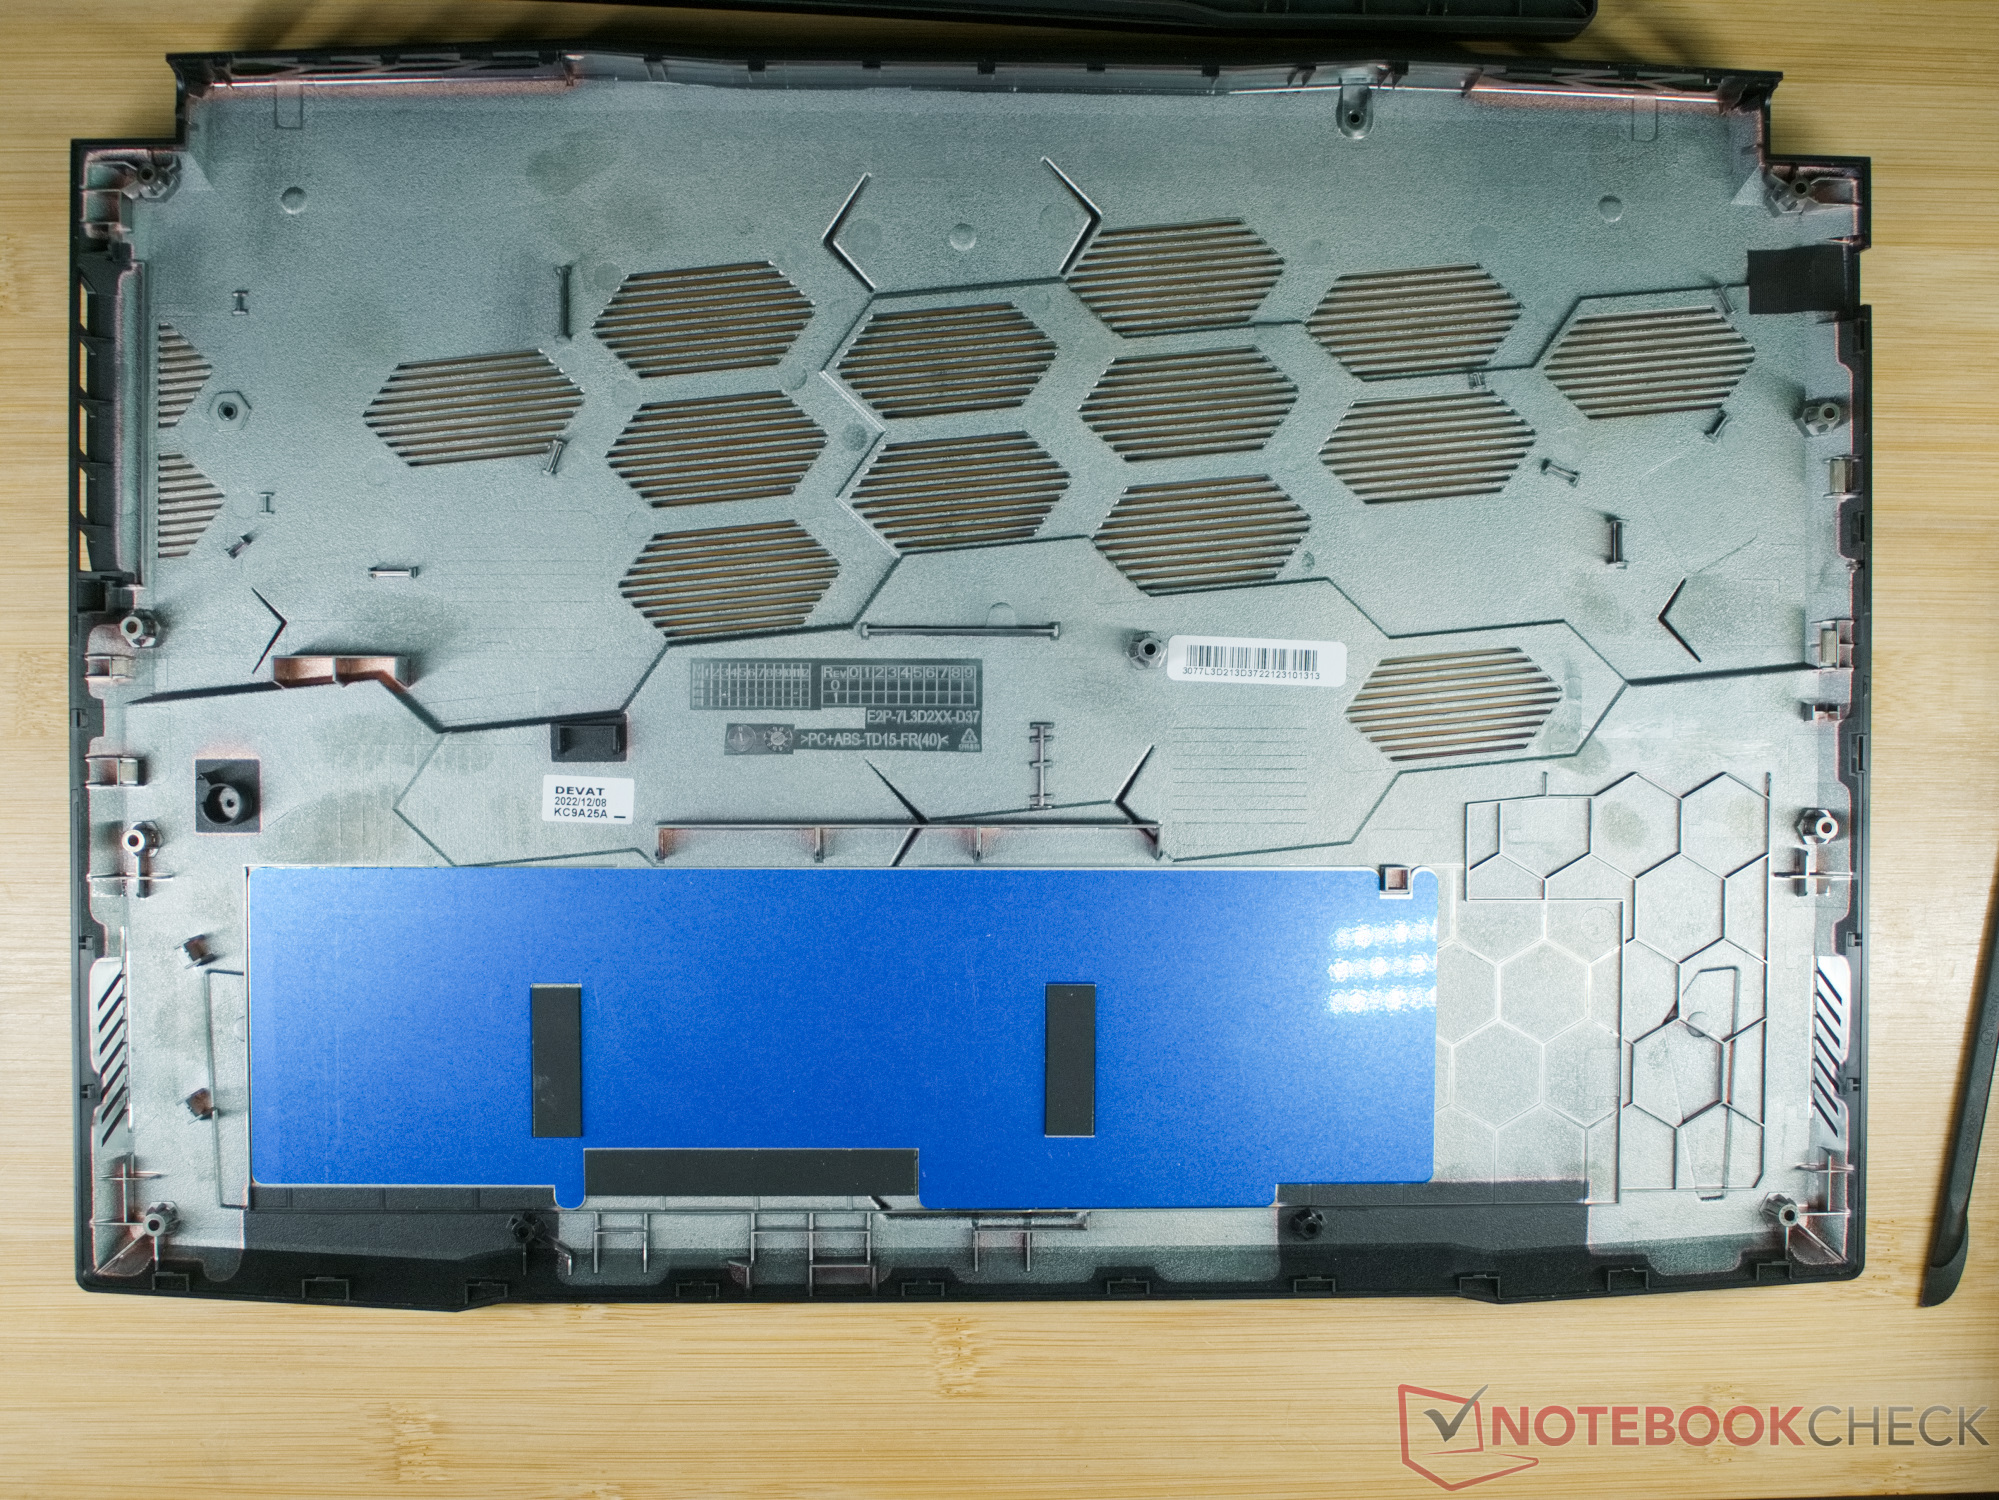
När du tar bort de 13 skruvarna bör du också markera deras position, eftersom två av skruvarna är betydligt kortare. Bottenkåpan är också säkrad med flera klämmor, men de kan enkelt öppnas med ett plastverktyg, så att du kan lyfta av bottenkåpan efteråt.
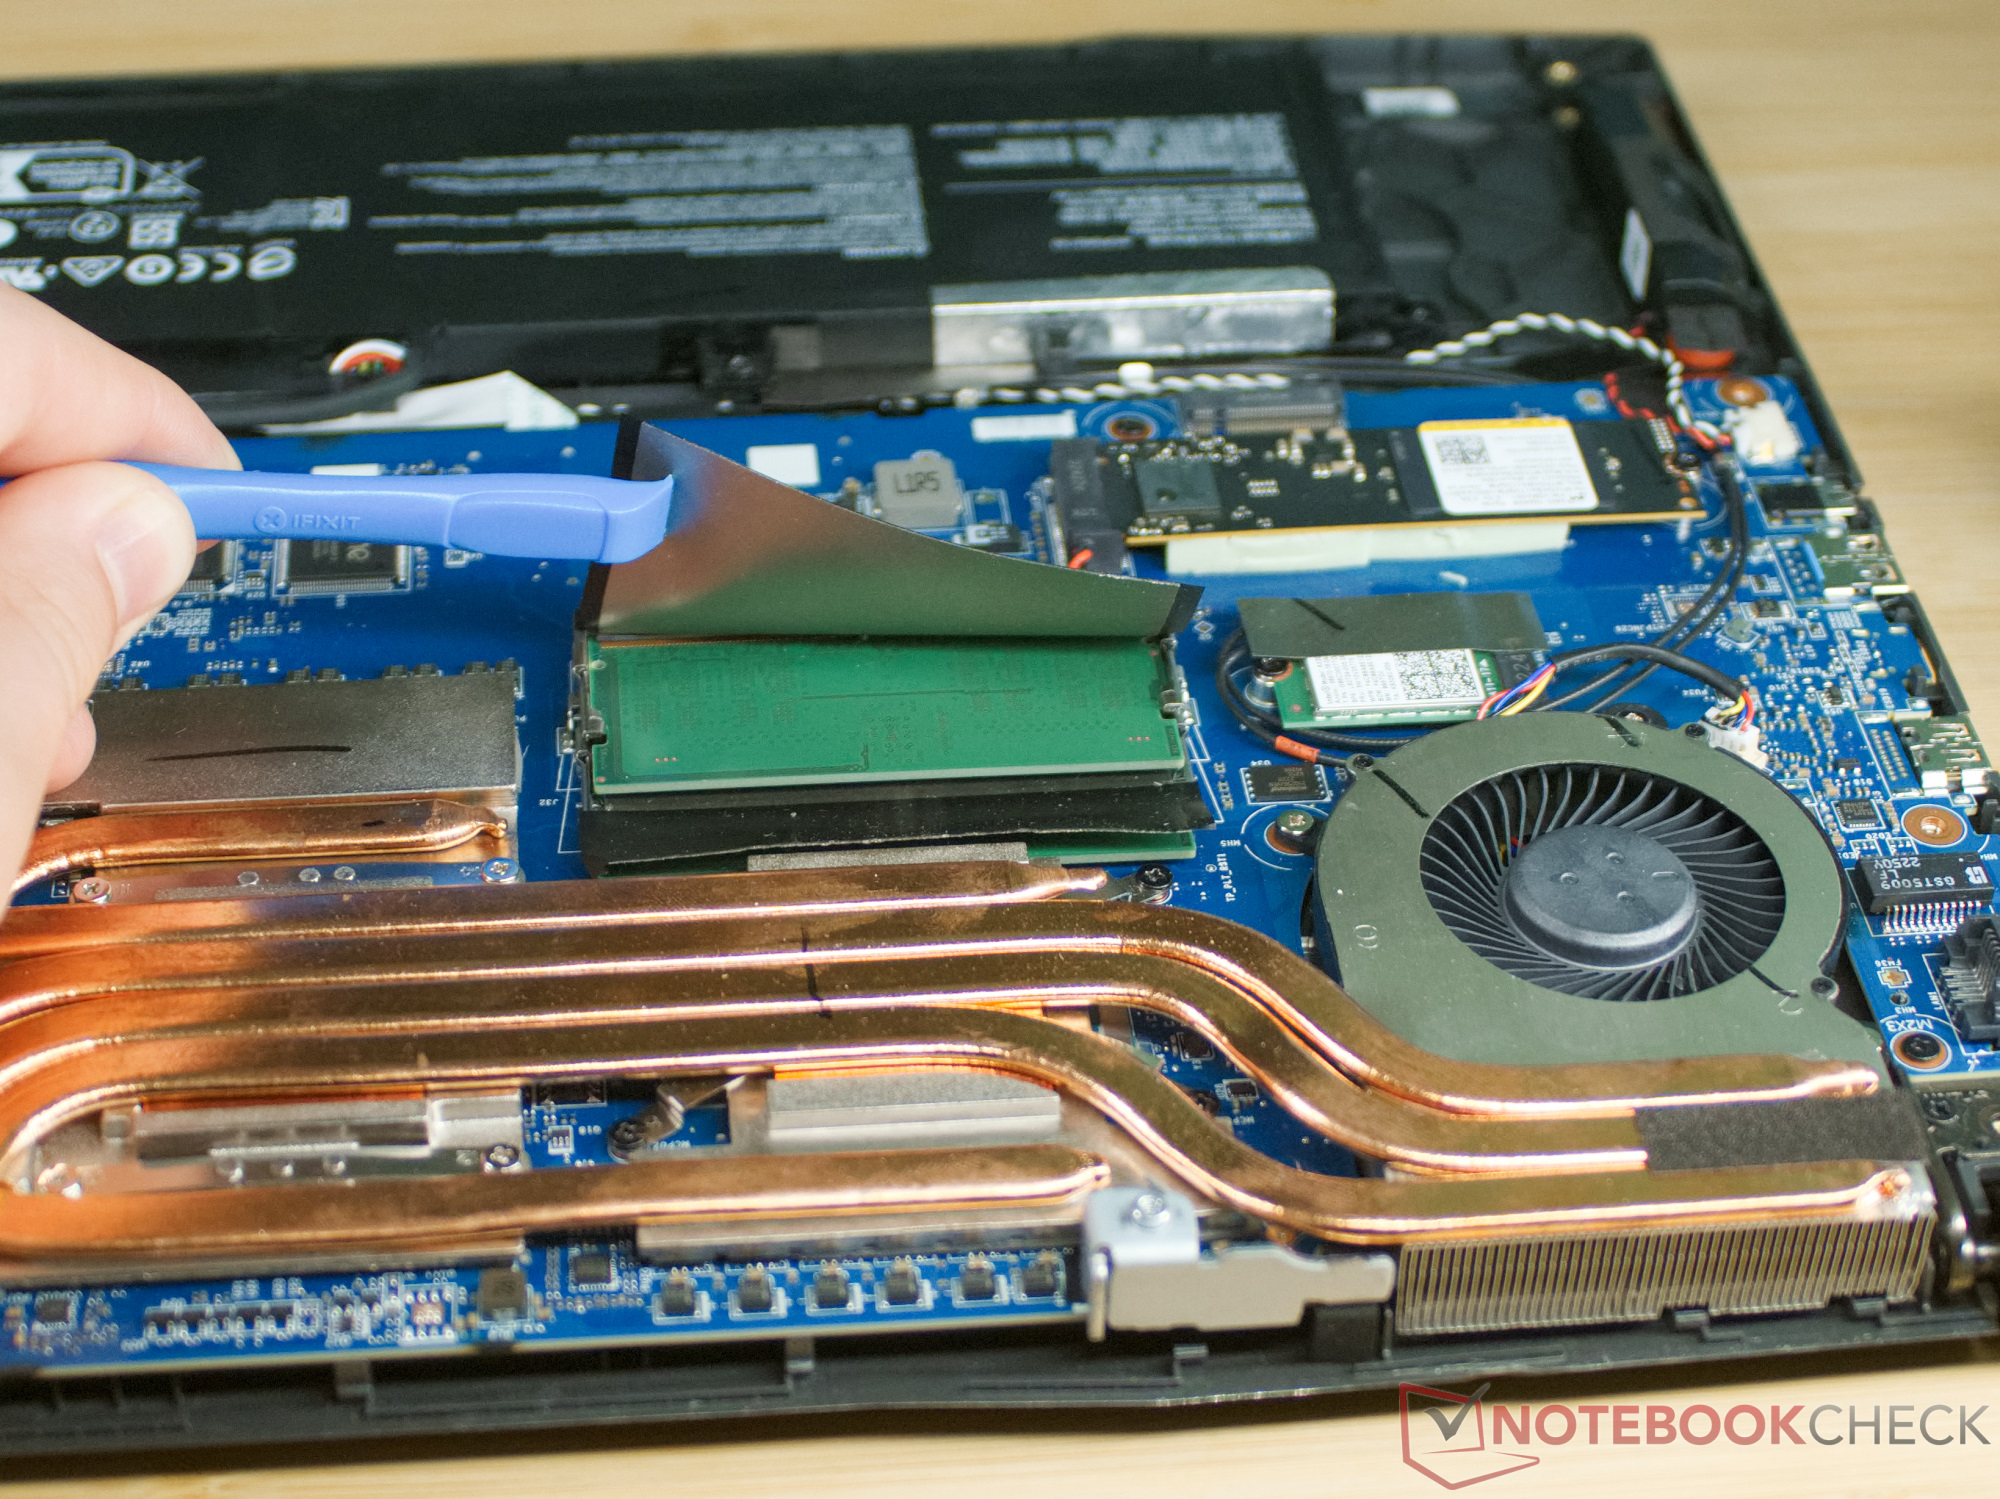
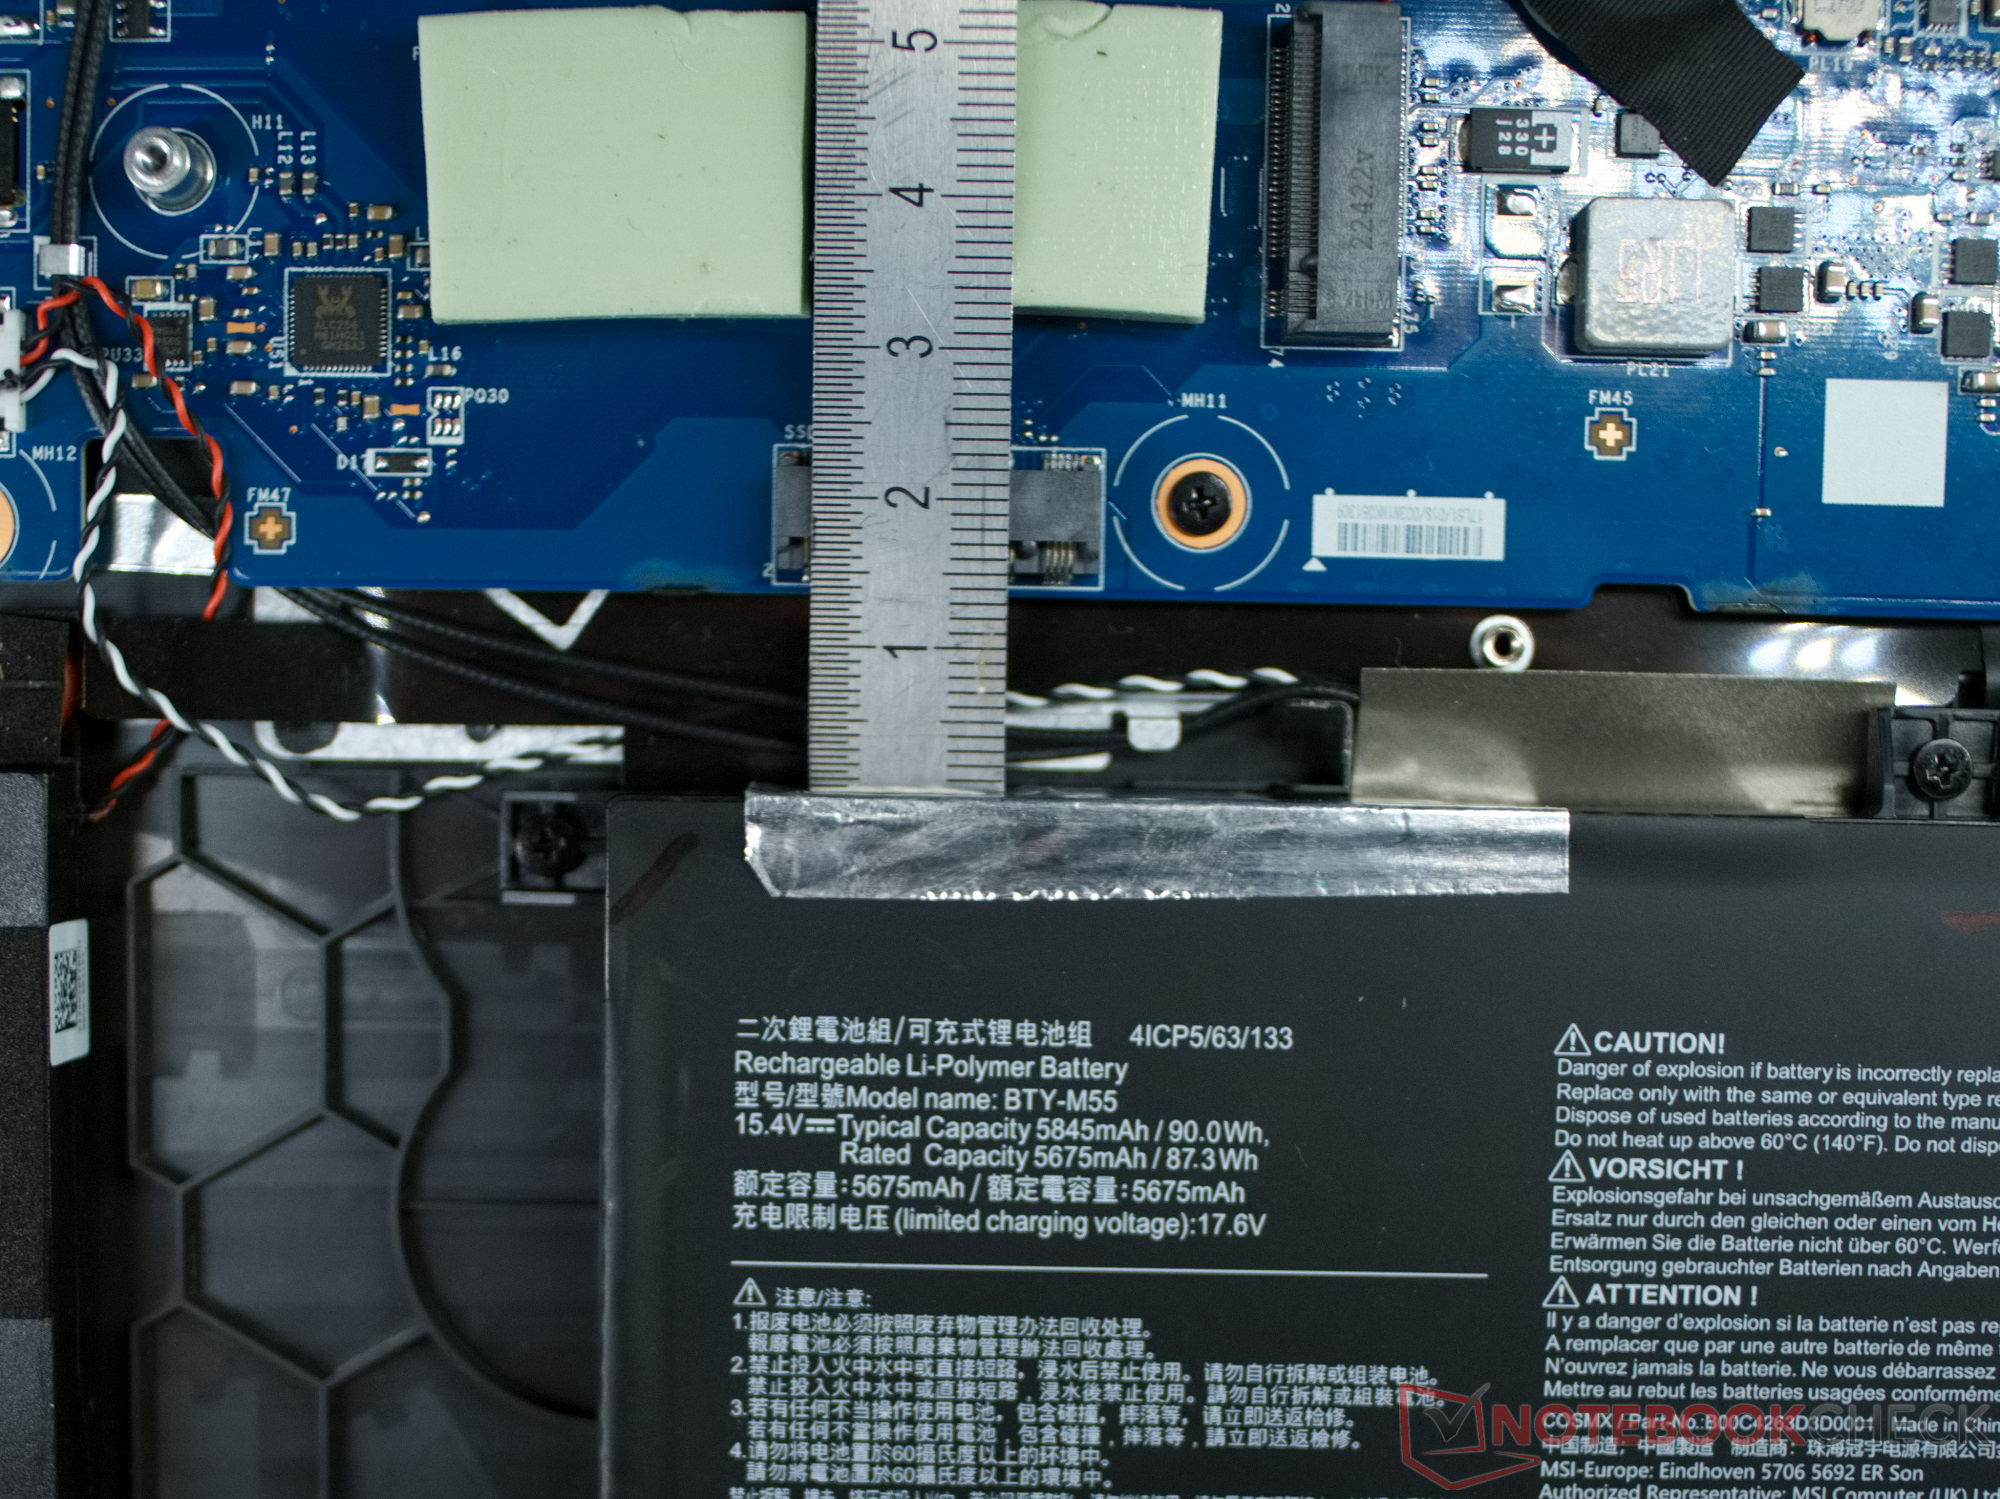
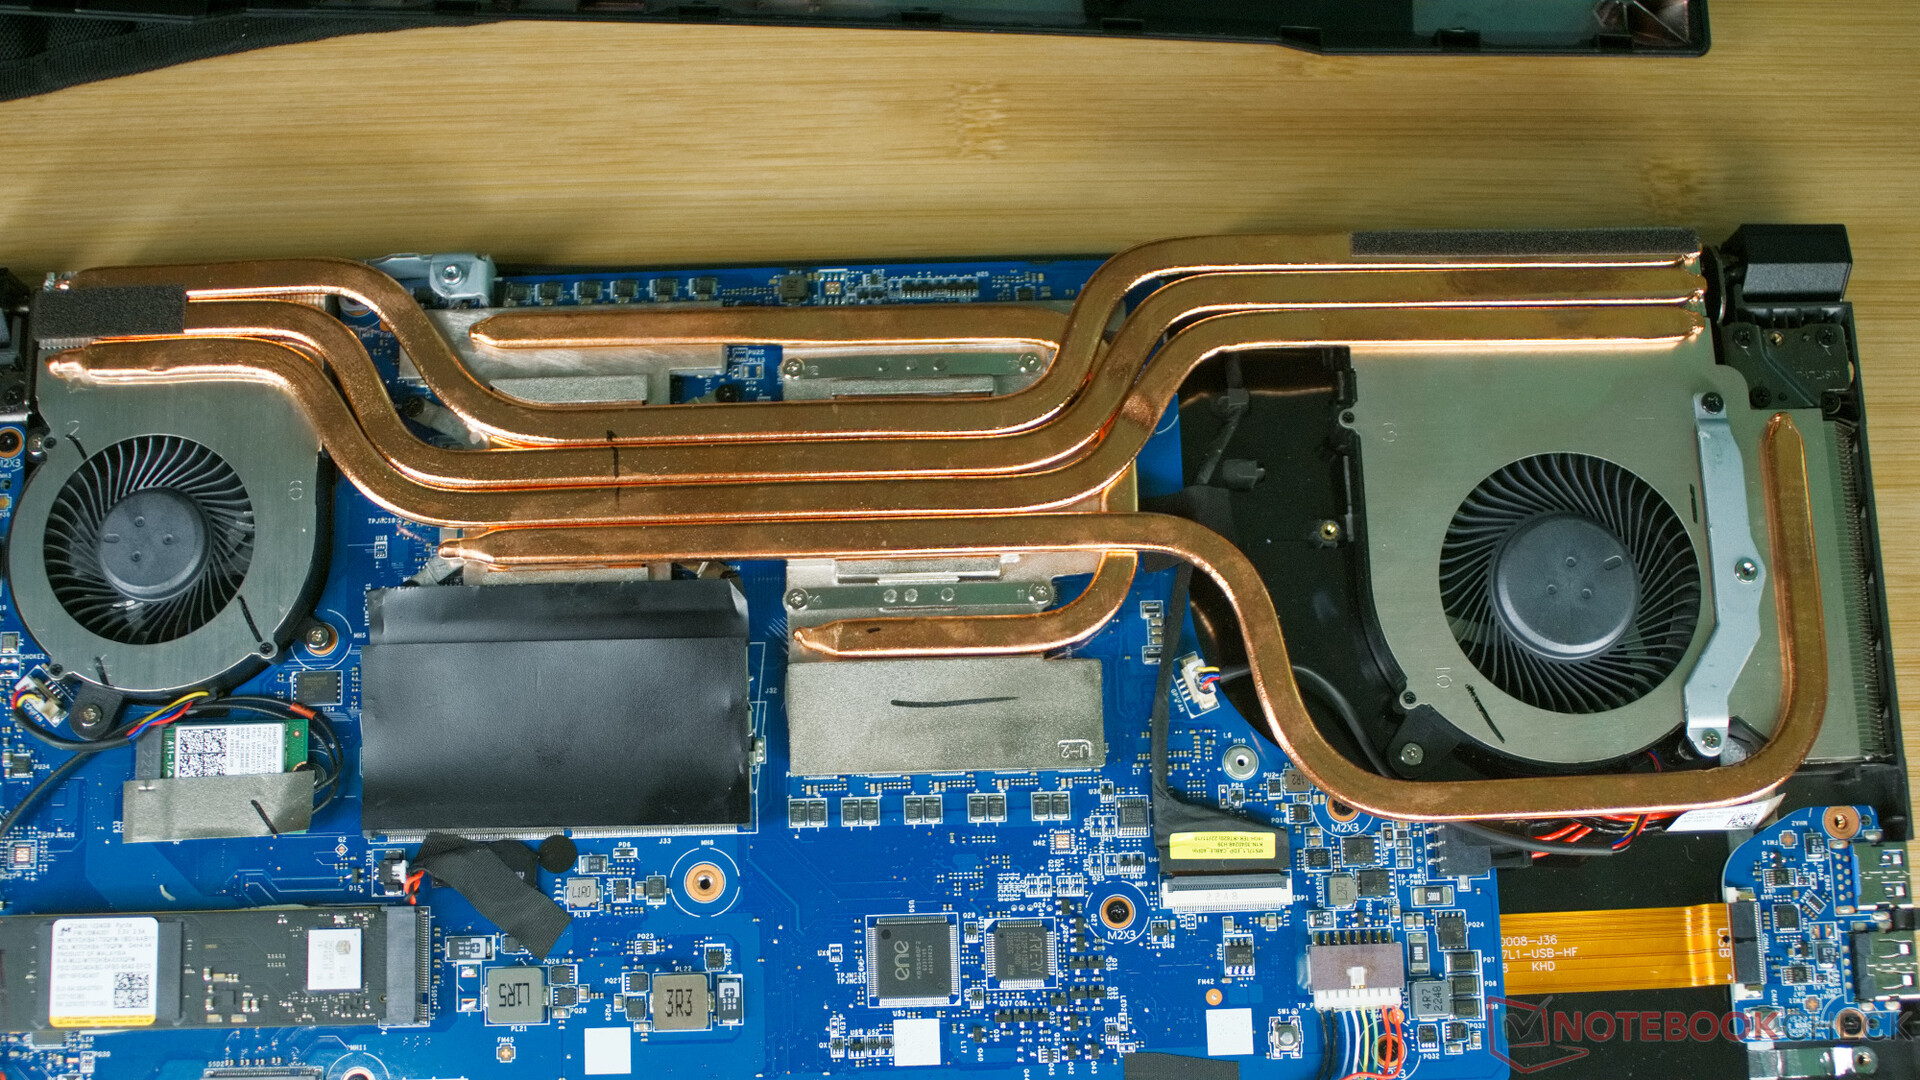
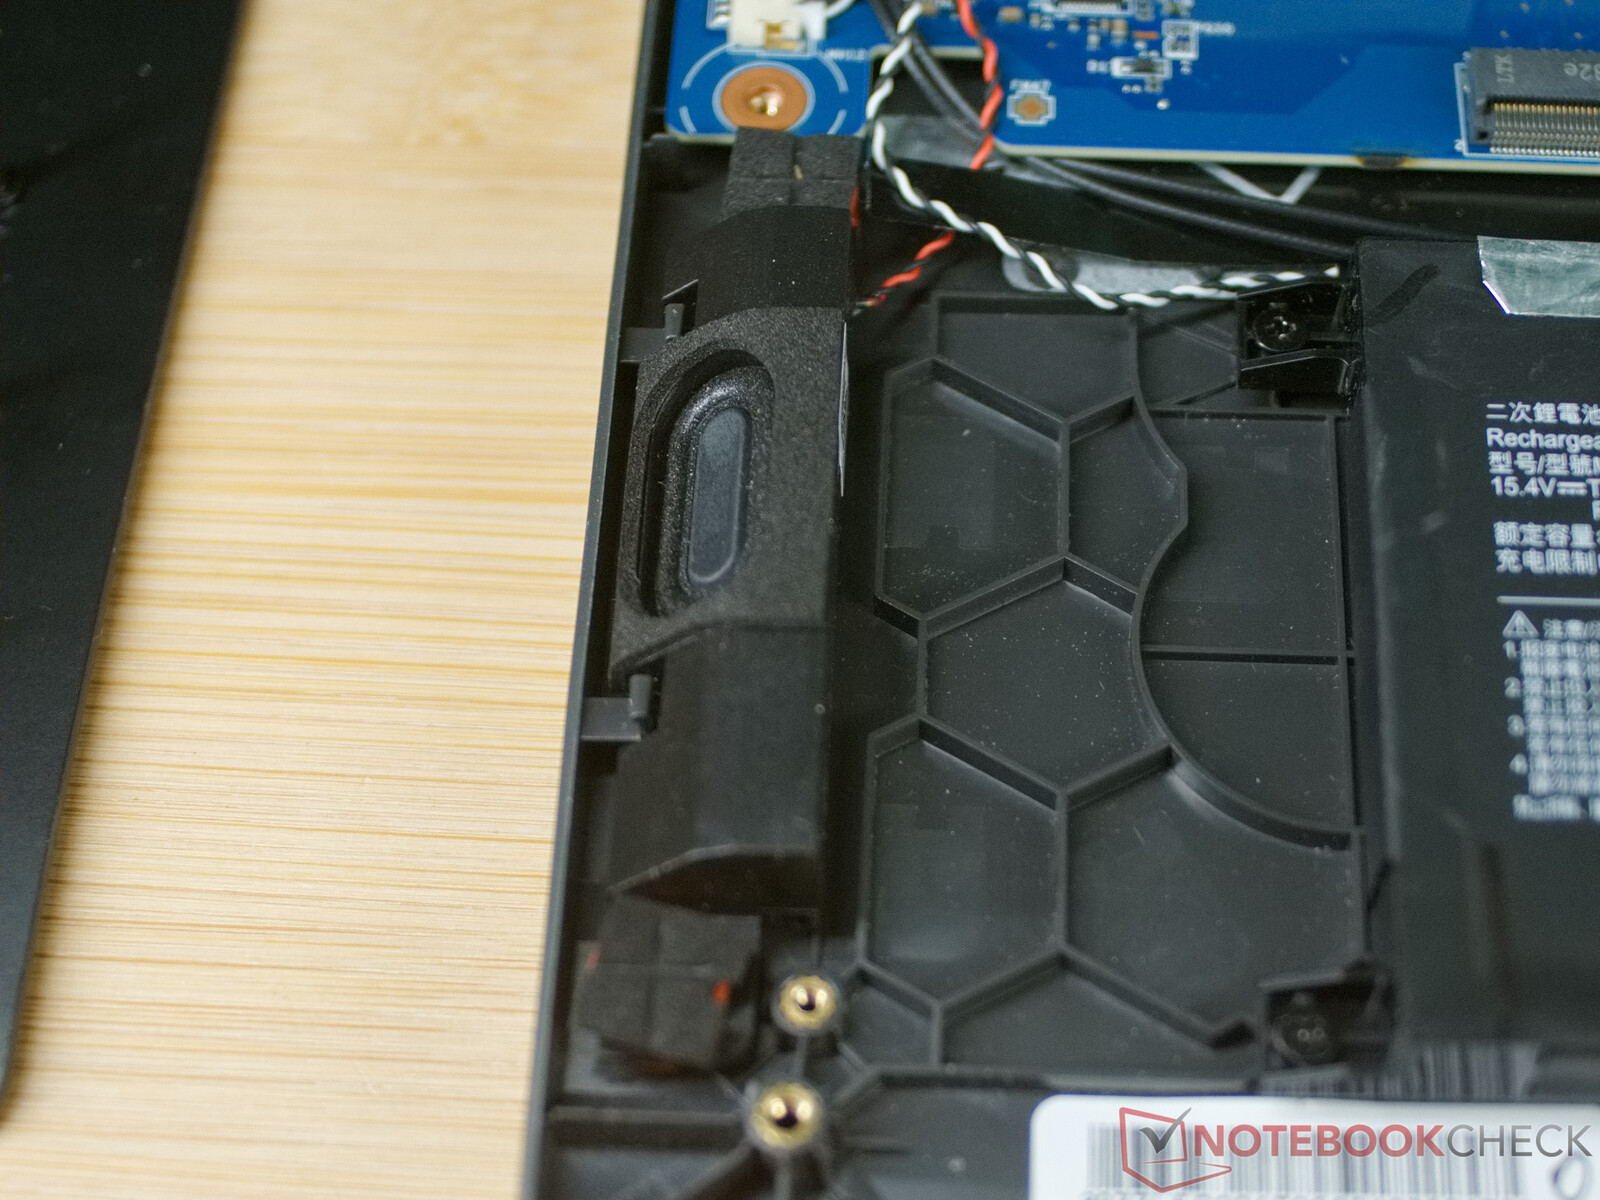
Inuti den bärbara datorn hittar vi en ganska modulär konstruktion, så att RAM-minnet, NVMe SSD och WLAN/Modul kan bytas ut snabbt. Batteriet, högtalarna och kortet med de två USB-anslutningarna kan också enkelt bytas ut. De som regelbundet vill ta bort dammet mellan fläktarna och kylflänsarna måste dock ta bort hela kylsystemet för att kunna göra detta.
Den bärbara datorn erbjuder också en andra M.2 PCIe-kortplats, men tyvärr blockeras den av batteriet. Så du kan förmodligen bara installera en andra SSD med en lösning med adaptrar och kablar.
Garanti
MSI erbjuder 24 månaders garanti till köpare i Europa.
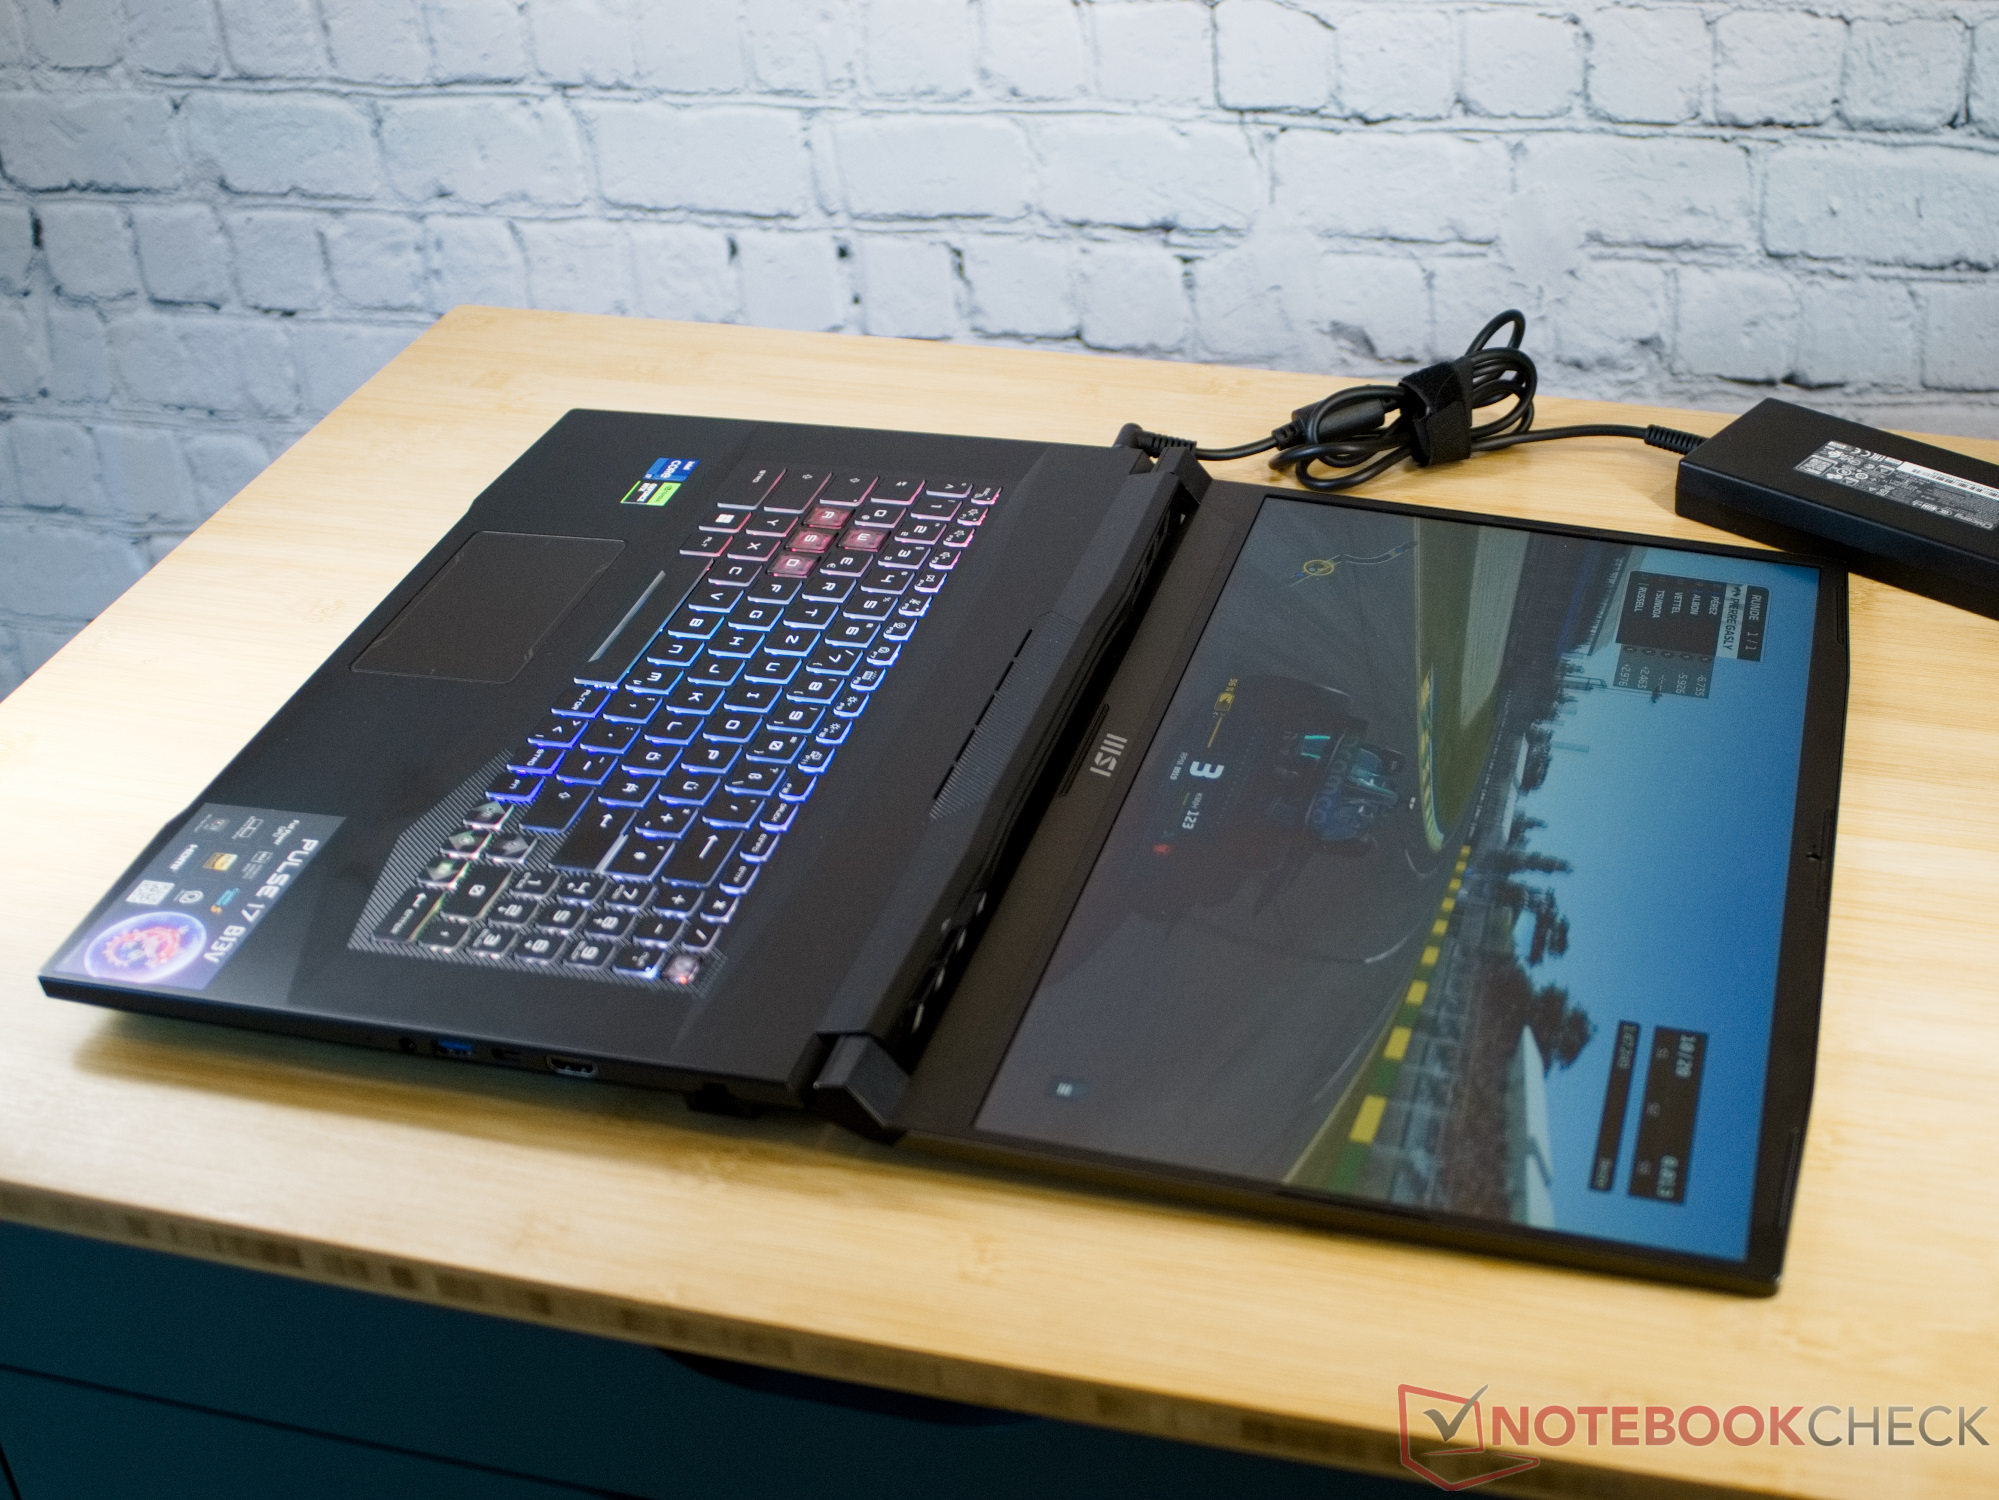
Input Devices - Four RGB zones and a small touchpad in the MSI Pulse
Tangentbord
Med MSI Control Center kan du styra RGB-bakgrundsbelysningen på MSI Pluse 17-tangentbordet. Tillverkaren tillåter också att använda programvara från tredje part för att ändra färger och effekter i tangentbordets fyra belysningszoner. De transparenta W-, A-, S- och D-tangenterna betonas särskilt här. Tangentbordet erbjuder en bra haptisk feedback och tangenttryckning på cirka 1,2 mm (~ 0,05 in).
Pekplatta
Pekplattan på Pulse 17 är relativt liten, men det innebär också att den inte är i vägen för handflatorna när man spelar. Med sin släta yta, skarpa tangenter och höga precision fungerar den generellt sett bra.
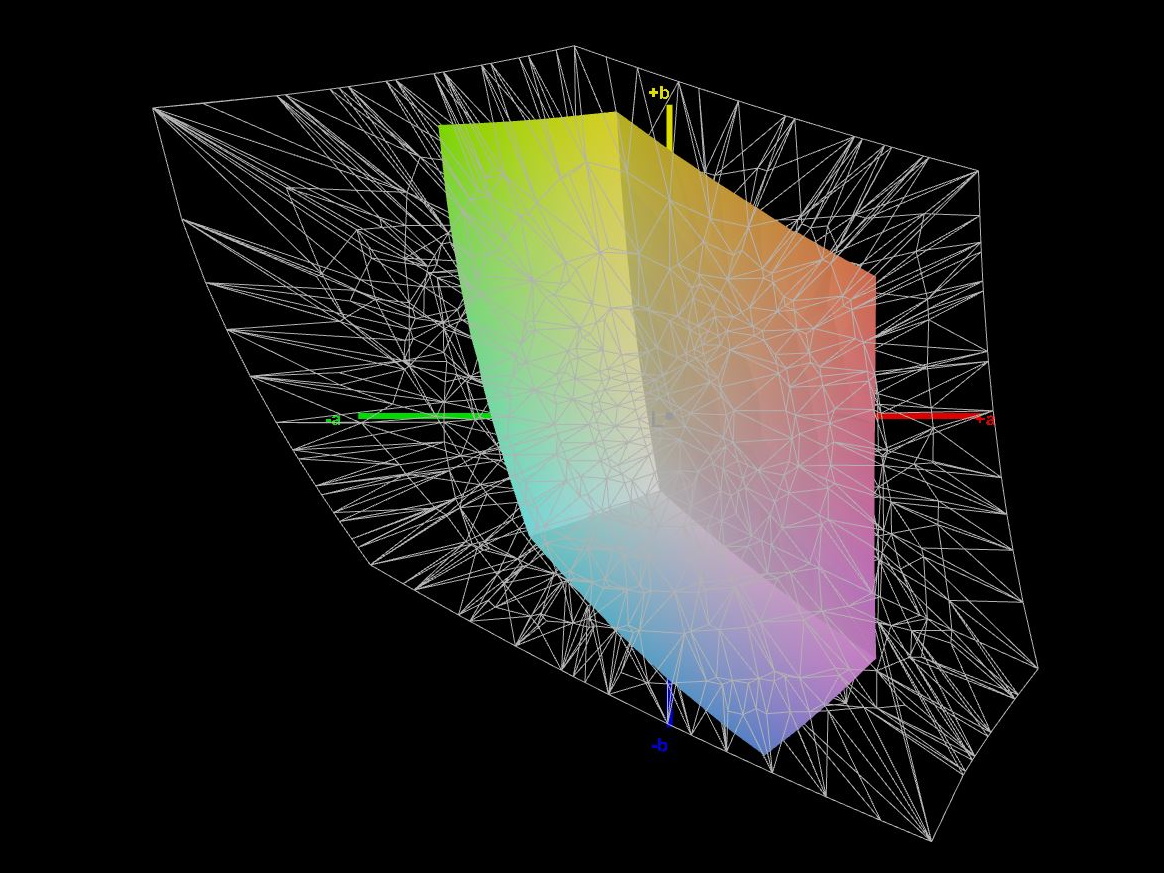
Display - Mindre än 60% sRGB-täckning
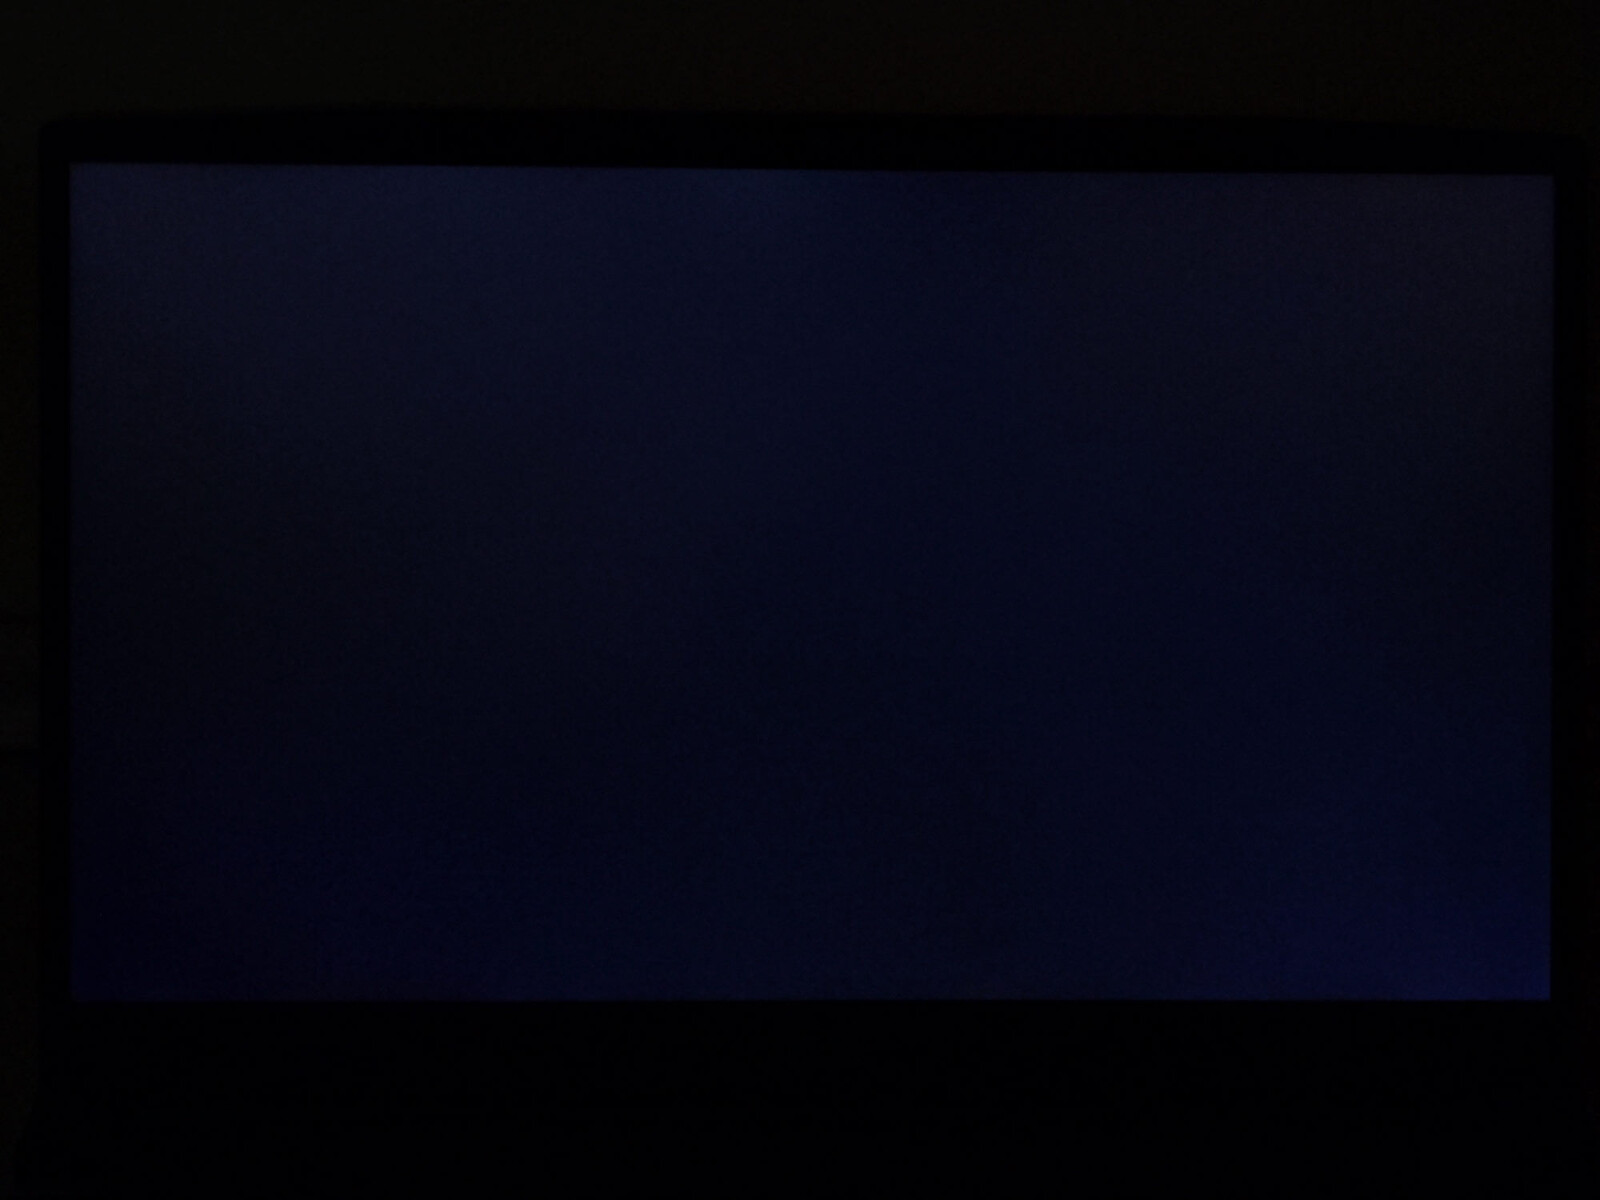
I en bärbar dator för spel bör skärmen vara mycket lyhörd, helt täcka sRGB-färgrymden och erbjuda en hög kontrast. Av dessa är det bara ett högt kontrastförhållande som talar för skärmen på MSI Pulse. Även om den matta skärmen inte är särskilt ljus med en genomsnittlig ljusstyrka på 250 cd / m², säkerställer det låga svarta värdet det höga kontrastförhållandet. Ljusfördelningen är inte särskilt jämn, men åtminstone märker vi inga synliga ljushalos.
Detta innebär att skärmen på Pulse 17 är betydligt sämre jämfört med den på Puls GL76. Svarstiderna har nästan fördubblats i jämförelse och blivit nästan 6 gånger långsammare ibland, och antalet visningsbara färger har minskat till nästan hälften. Så MSI har utfört en betydande nedgradering av skärmen.
| |||||||||||||||||||||||||
Distribution av ljusstyrkan: 91 %
Mitt på batteriet: 253 cd/m²
Kontrast: 1814:1 (Svärta: 0.14 cd/m²)
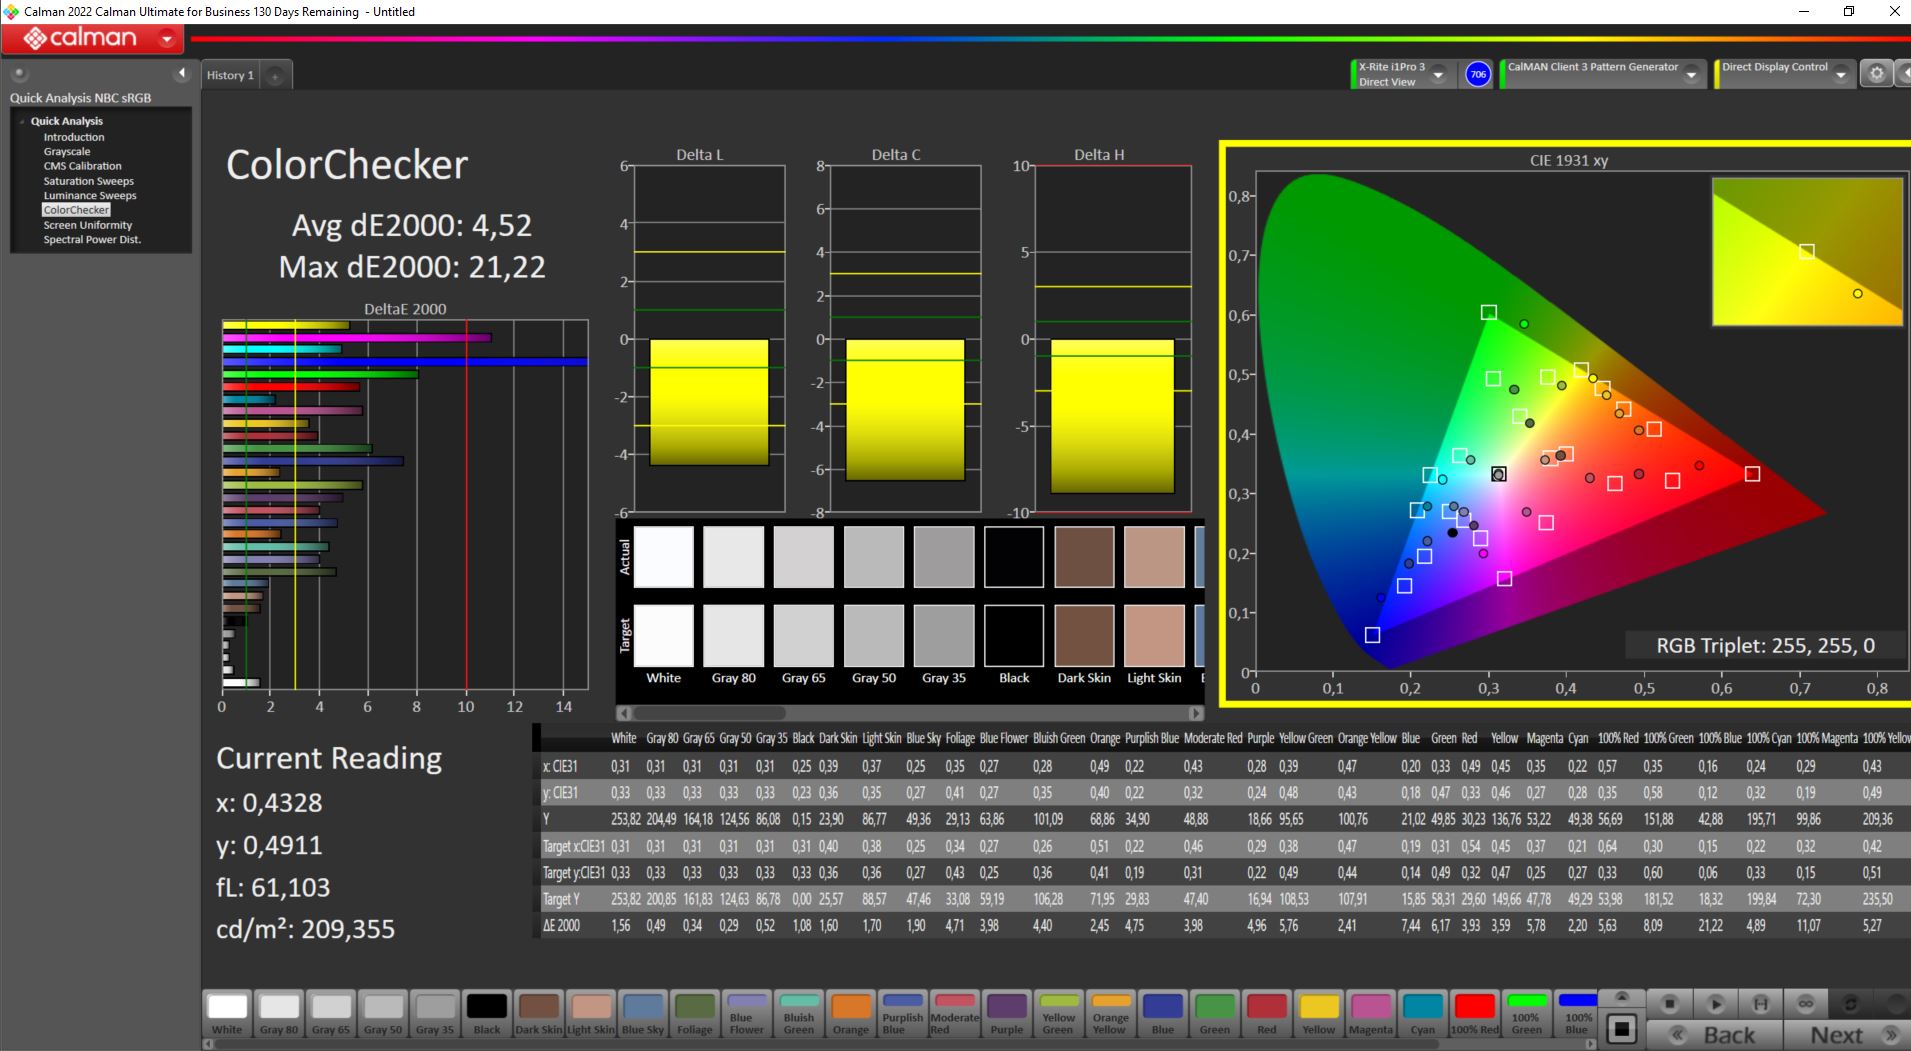
ΔE ColorChecker Calman: 4.52 | ∀{0.5-29.43 Ø4.71}
calibrated: 4.52
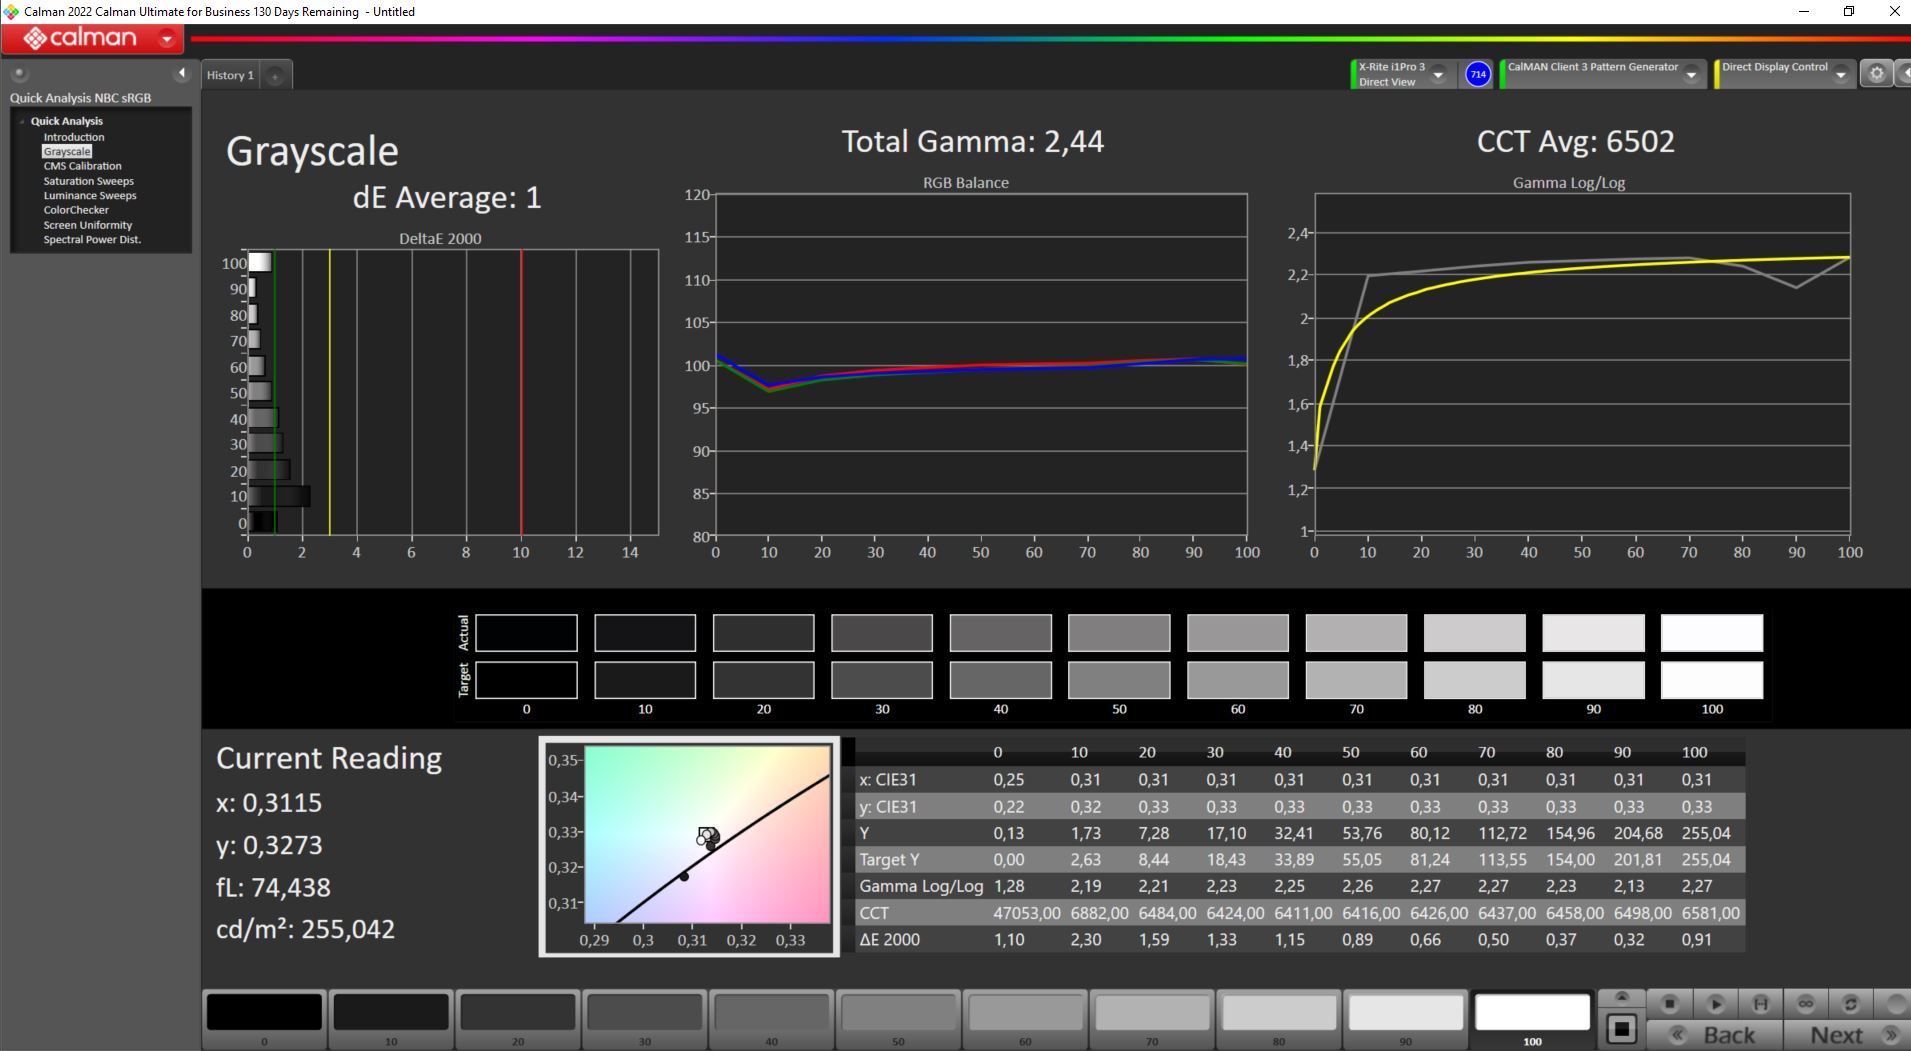
ΔE Greyscale Calman: 1 | ∀{0.09-98 Ø4.96}
39.7% AdobeRGB 1998 (Argyll 3D)
57.5% sRGB (Argyll 3D)
38.4% Display P3 (Argyll 3D)
Gamma: 2.44
CCT: 6502 K
| MSI Pulse 17 B13VGK AU Optronics B173HAN04.9, IPS, 1920x1080, 17.3" | MSI Pulse GL76 12UGK Sharp LQ173M1JW08, IPS, 1920x1080, 17.3" | MSI Katana 17 B13VFK B173HAN04.9, IPS LED, 1920x1080, 17.3" | Acer Nitro 17 AN17-51-71ER BOE0B7C NE173QHM-NY6, , 2560x1440, 17.3" | Schenker XMG Focus 17 (E23) BOE09F9 NE173QHM-NZ1, IPS, 2560x1440, 17.3" | Asus ROG Strix G17 G713PI BOE0B69, IPS, 2560x1440, 17.3" | |
|---|---|---|---|---|---|---|
| Display | 82% | 6% | 115% | 113% | 115% | |
| Display P3 Coverage (%) | 38.4 | 71.9 87% | 40.8 6% | 98.3 156% | 96.6 152% | 98.3 156% |
| sRGB Coverage (%) | 57.5 | 99.9 74% | 61 6% | 100 74% | 99.9 74% | 100 74% |
| AdobeRGB 1998 Coverage (%) | 39.7 | 73.7 86% | 42.2 6% | 85.7 116% | 84.5 113% | 85.9 116% |
| Response Times | 69% | -8% | 60% | 51% | 74% | |
| Response Time Grey 50% / Grey 80% * (ms) | 31.2 ? | 4.6 ? 85% | 33 ? -6% | 14.8 ? 53% | 16.4 ? 47% | 5.3 ? 83% |
| Response Time Black / White * (ms) | 23.6 ? | 11.2 ? 53% | 26 ? -10% | 8 ? 66% | 10.8 ? 54% | 8.6 ? 64% |
| PWM Frequency (Hz) | ||||||
| Screen | -55% | -13% | -50% | -10% | 2% | |
| Brightness middle (cd/m²) | 254 | 337.7 33% | 267 5% | 361 42% | 349 37% | 327 29% |
| Brightness (cd/m²) | 250 | 331 32% | 256 2% | 326 30% | 318 27% | 320 28% |
| Brightness Distribution (%) | 91 | 82 -10% | 93 2% | 87 -4% | 82 -10% | 89 -2% |
| Black Level * (cd/m²) | 0.14 | 0.31 -121% | 0.21 -50% | 0.6 -329% | 0.56 -300% | 0.38 -171% |
| Contrast (:1) | 1814 | 1089 -40% | 1271 -30% | 602 -67% | 623 -66% | 861 -53% |
| Colorchecker dE 2000 * | 4.52 | 4.12 9% | 4.7 -4% | 3.83 15% | 1.08 76% | 1.01 78% |
| Colorchecker dE 2000 max. * | 21.22 | 8.89 58% | 20.4 4% | 5.71 73% | 3.05 86% | 4.01 81% |
| Colorchecker dE 2000 calibrated * | 4.52 | 0.98 78% | 4.5 -0% | 3.48 23% | 1.08 76% | 0.41 91% |
| Greyscale dE 2000 * | 1 | 6.3 -530% | 1.5 -50% | 3.29 -229% | 1.14 -14% | 1.6 -60% |
| Gamma | 2.44 90% | 2.48 89% | 2.12 104% | 2.29 96% | 2.41 91% | 2.168 101% |
| CCT | 6502 100% | 6542 99% | 6552 99% | 6679 97% | 6687 97% | 6659 98% |
| Totalt genomsnitt (program/inställningar) | 32% /
-8% | -5% /
-9% | 42% /
1% | 51% /
25% | 64% /
37% |
* ... mindre är bättre
Färgrymderna AdobeRGB och DisplayP3 täcks bara till mindre än 40%, och inte ens sRGB täcks till 60% av Pulse 17.
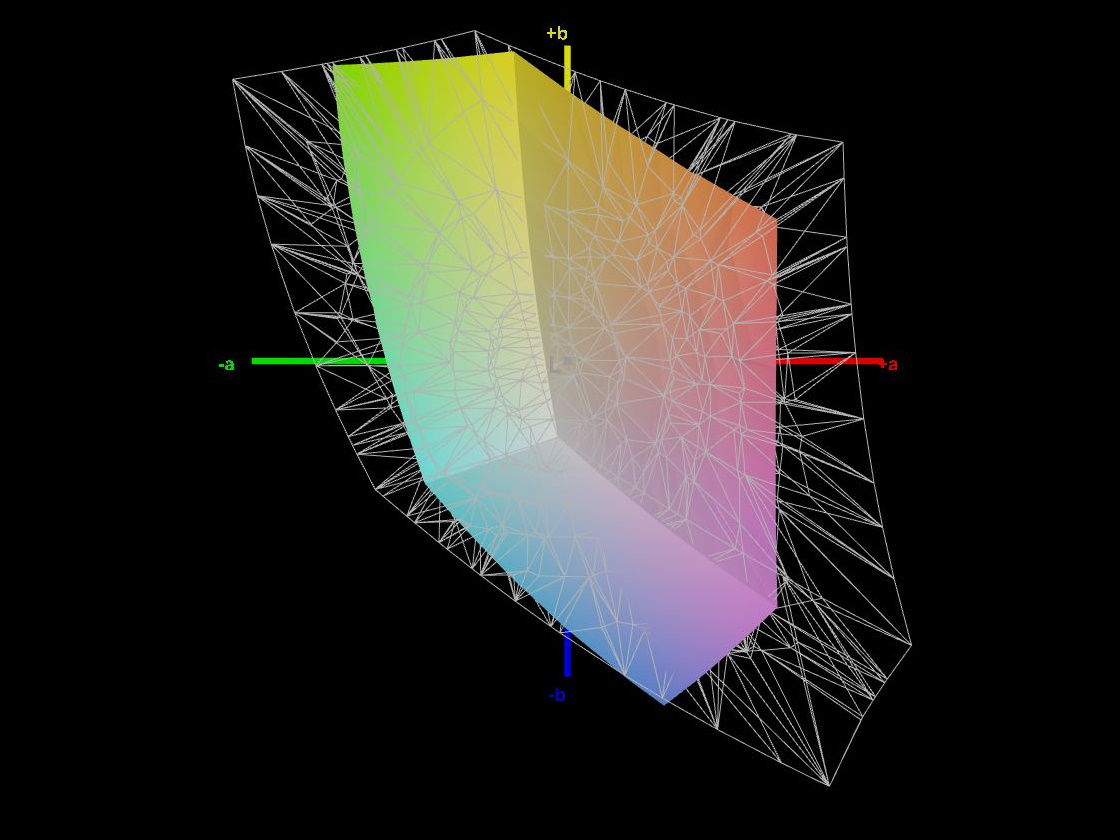
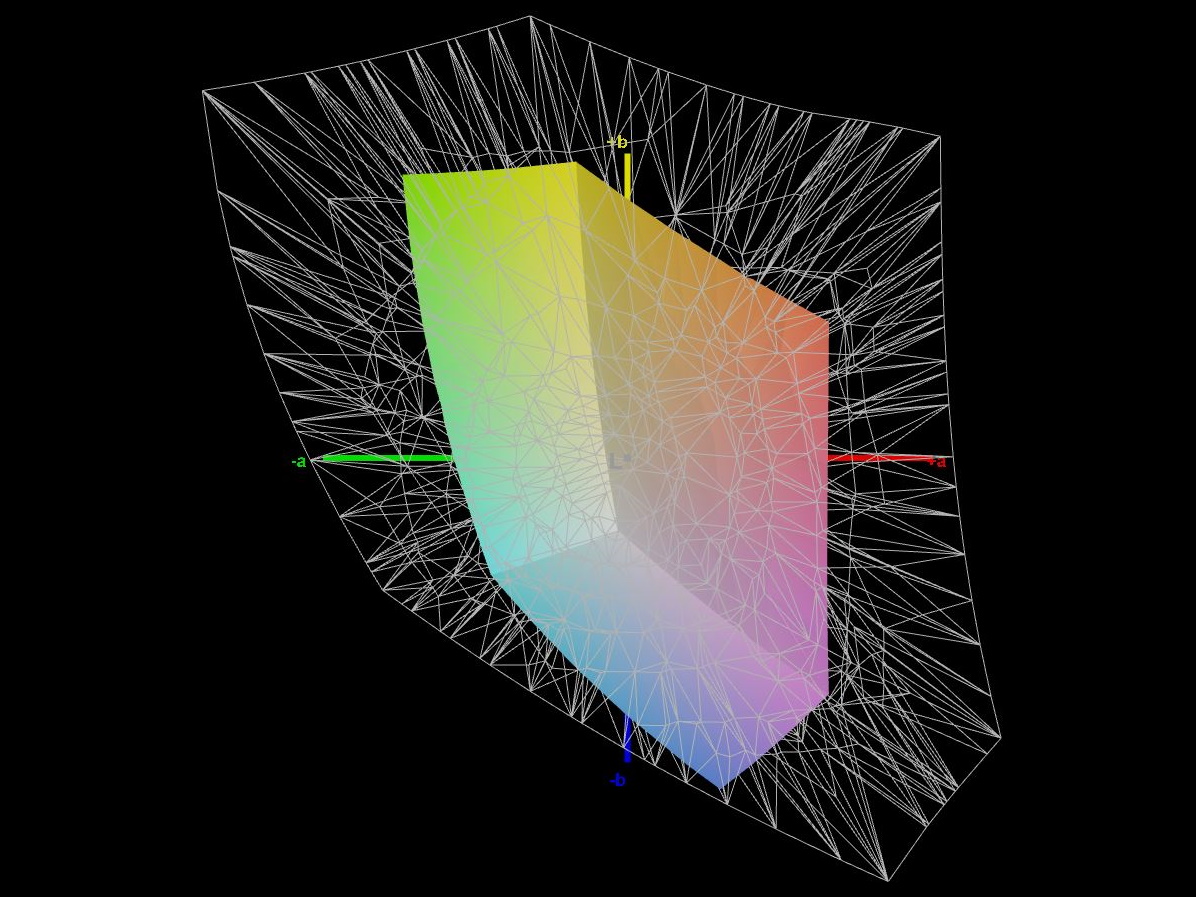
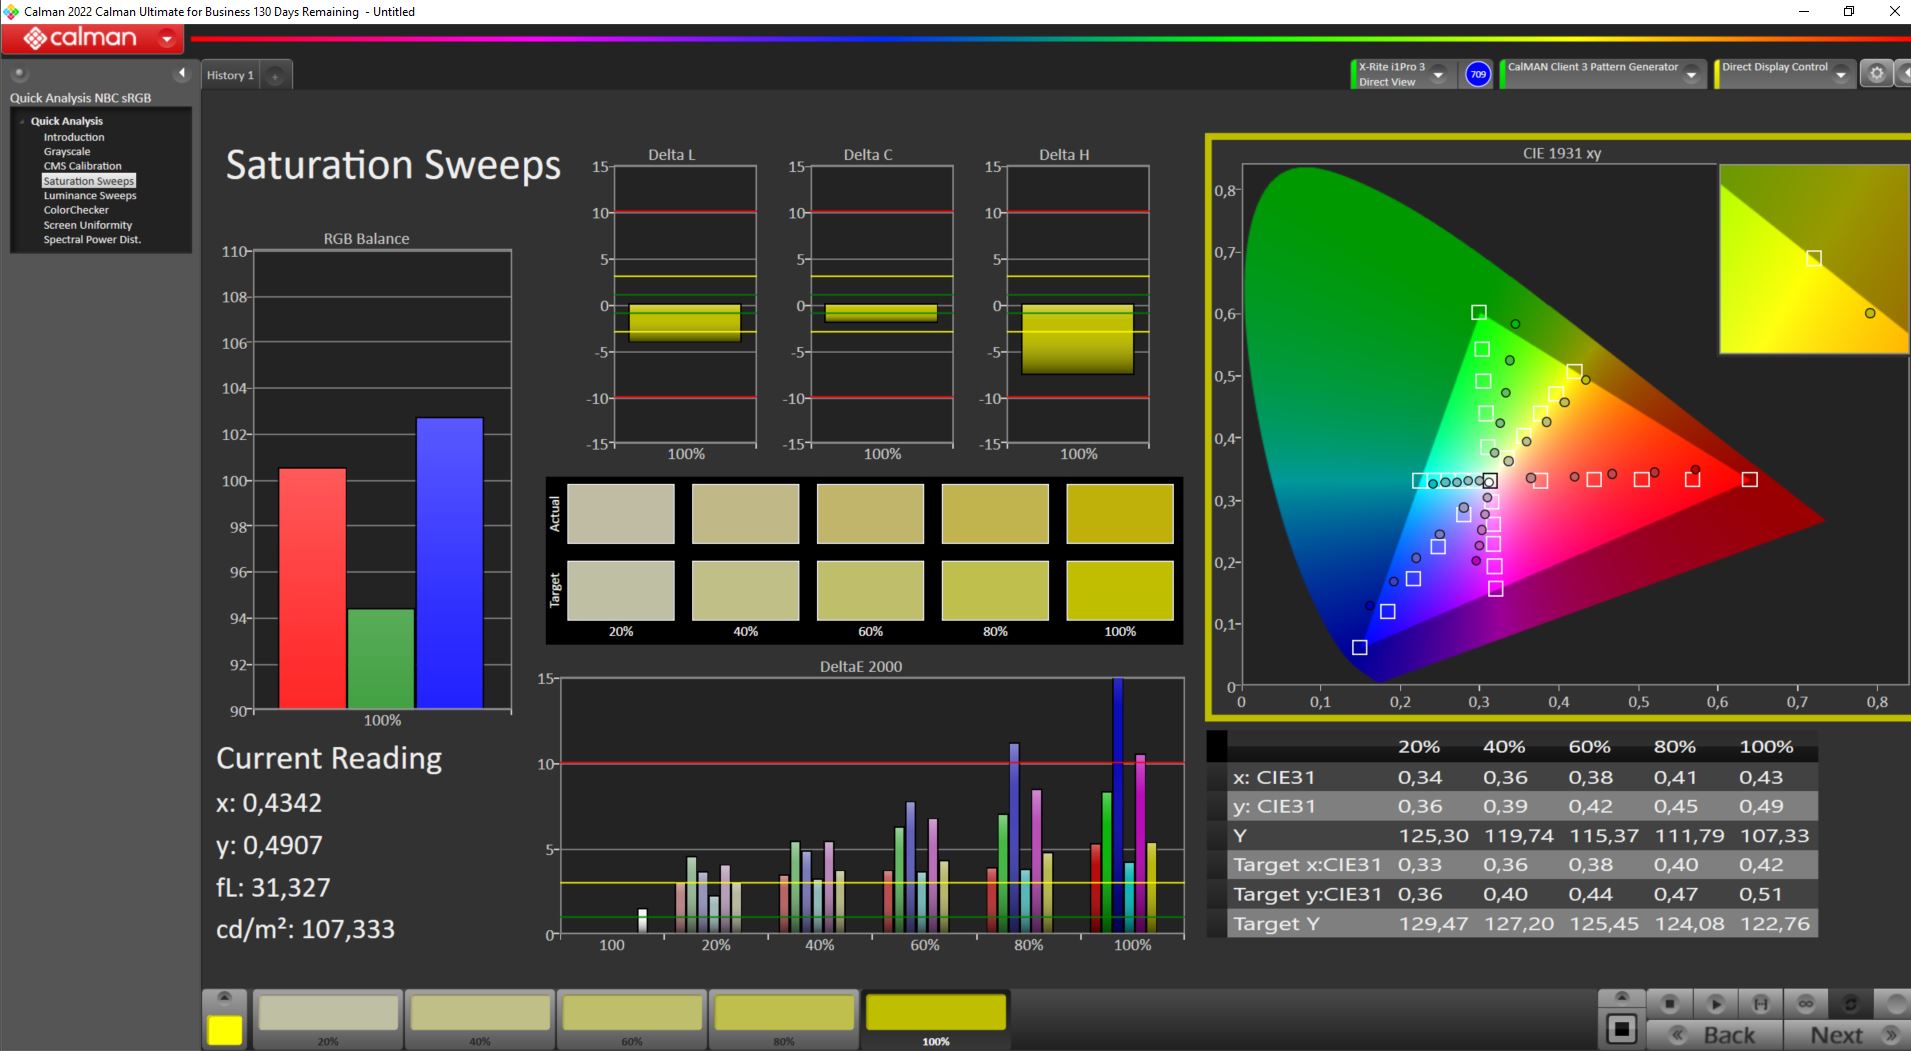
Calman-testet visar åtminstone ett bra resultat vid visning av gråskala. Utvärderingen av färgåtergivningens noggrannhet med Calman ColorChecker avslöjar dock tydligt skärmens gränser. Med endast 60 % av sRGB-färgrymden saknar skärmen tydligt stora delar av färgerna och hamnar på motsvarande sätt långt från färgskalan i röda, gröna och blå färger. Detta resulterar i en maximal färgavvikelse på ΔΕ 21,22. Detta är en mycket hög maximal avvikelse som inte uppnås av någon av våra andra jämförelselaptops. Men skärmen klarar sig något bättre i de genomsnittliga färgavvikelserna. En ytterligare kalibrering ändrar dock inte resultatet, så att även MSI Katanafår lägre färgavvikelser med vår ICC-profil.
Visa svarstider
| ↔ Svarstid svart till vitt | ||
|---|---|---|
| 23.6 ms ... stiga ↗ och falla ↘ kombinerat | ↗ 12.2 ms stiga | 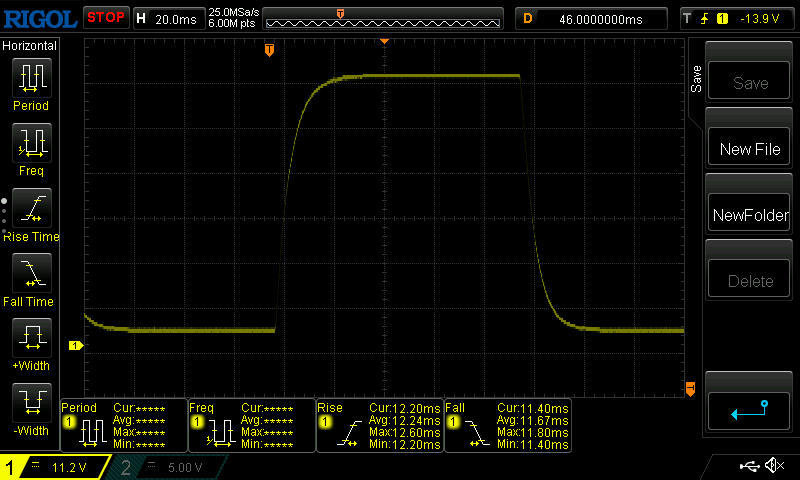 |
| ↘ 11.4 ms hösten | ||
| Skärmen visar bra svarsfrekvens i våra tester, men kan vara för långsam för konkurrenskraftiga spelare. I jämförelse sträcker sig alla testade enheter från 0.1 (minst) till 240 (maximalt) ms. » 54 % av alla enheter är bättre. Detta innebär att den uppmätta svarstiden är sämre än genomsnittet av alla testade enheter (19.8 ms). | ||
| ↔ Svarstid 50 % grått till 80 % grått | ||
| 31.2 ms ... stiga ↗ och falla ↘ kombinerat | ↗ 14.2 ms stiga | 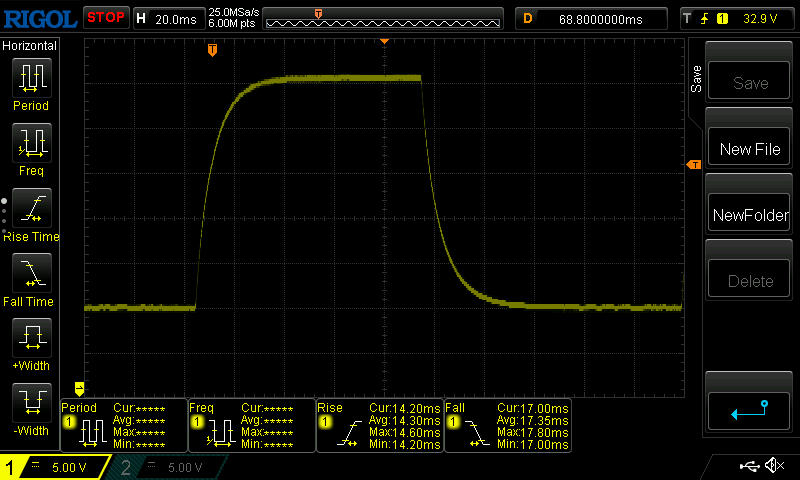 |
| ↘ 17 ms hösten | ||
| Skärmen visar långsamma svarsfrekvenser i våra tester och kommer att vara otillfredsställande för spelare. I jämförelse sträcker sig alla testade enheter från 0.165 (minst) till 636 (maximalt) ms. » 42 % av alla enheter är bättre. Det betyder att den uppmätta svarstiden liknar genomsnittet av alla testade enheter (31 ms). | ||
Skärmflimmer / PWM (Puls-Width Modulation)
| Skärmflimmer / PWM upptäcktes inte | 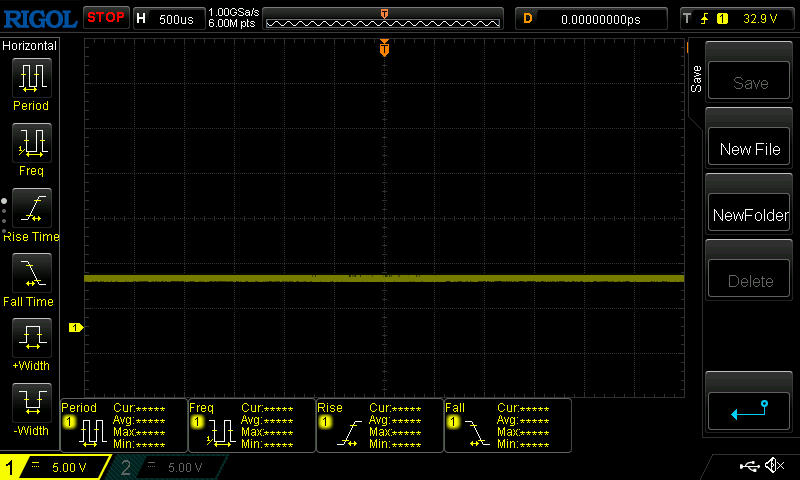 | ||
Som jämförelse: 52 % av alla testade enheter använder inte PWM för att dämpa skärmen. Om PWM upptäcktes mättes ett medelvärde av 7754 (minst: 5 - maximum: 343500) Hz. | |||
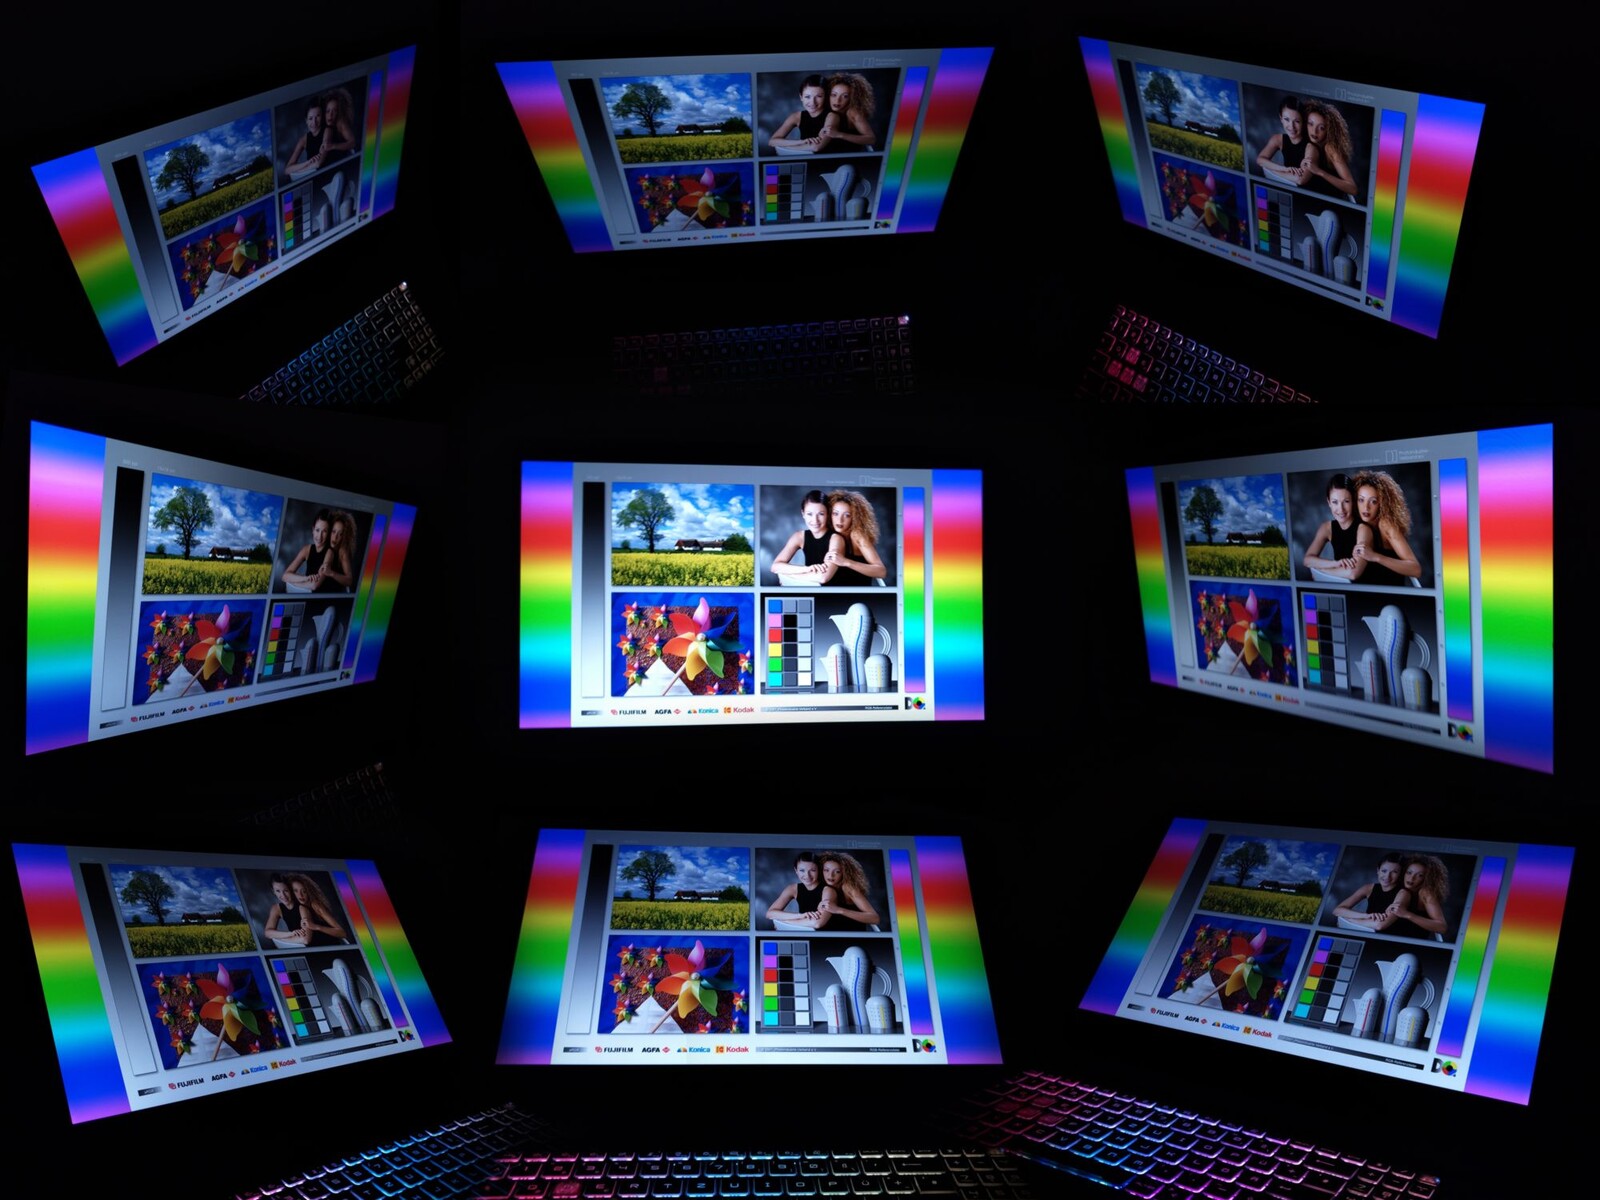
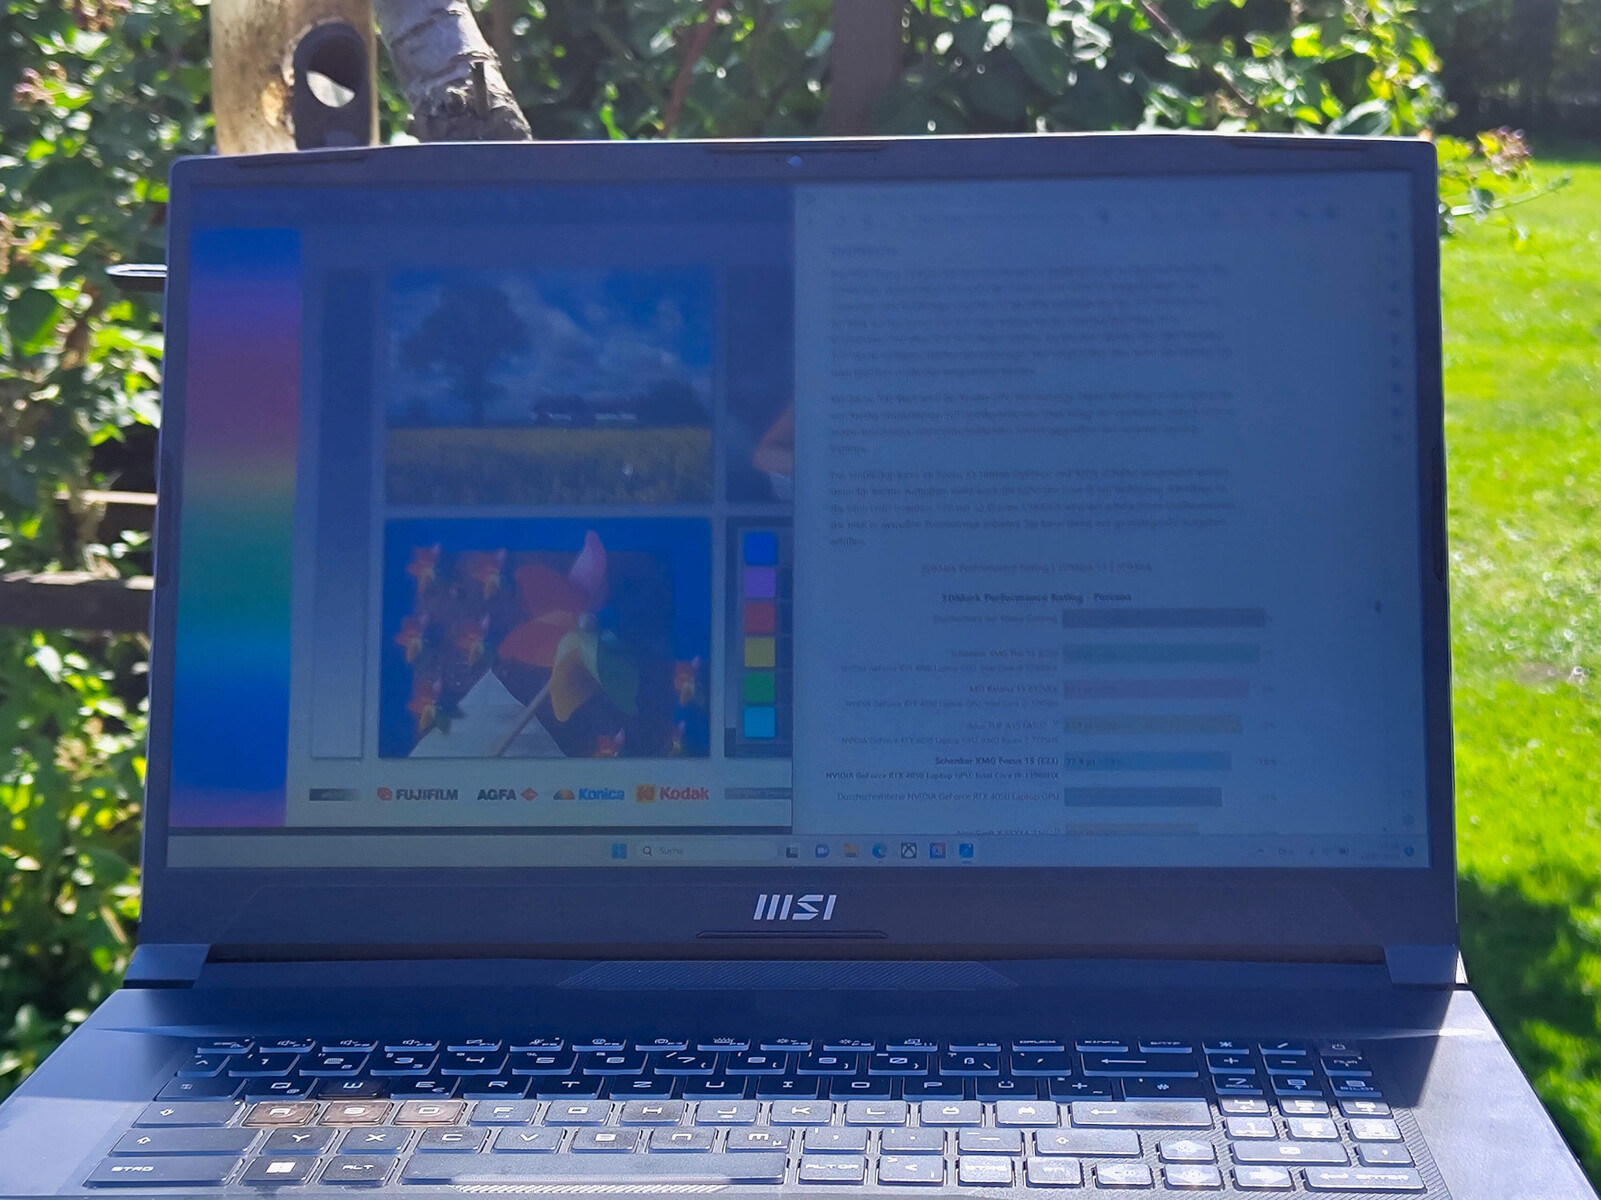
Betraktningsvinklarna på Pulse 17 IPS-panelen är ganska stabila när det gäller färgåtergivning, men förlorar betydligt i ljusstyrka med ökande vinkel. När den bärbara datorn används utomhus är den bara övertygande i begränsad utsträckning, eftersom skärmen inte är tillräckligt ljus för att synas i starkt solljus. Även i vår studiobelysning blir det snabbt tydligt att skärmen är ganska mörk, med den matta ytan som fortfarande visar en relativt stor mängd reflektioner.
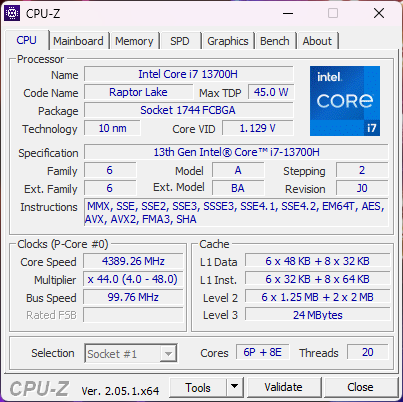
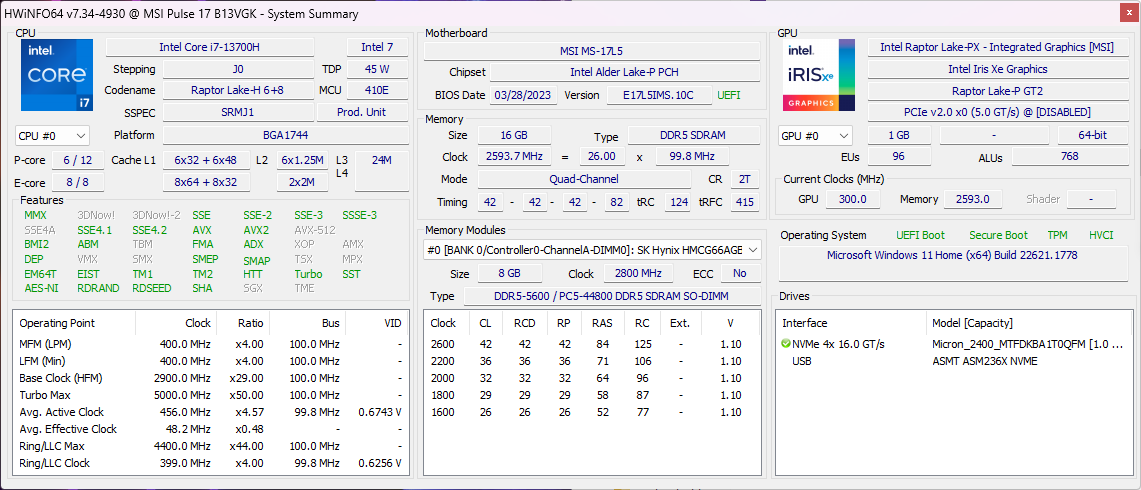
Prestanda - Mycket kraftfull Intel Core i7-13700H
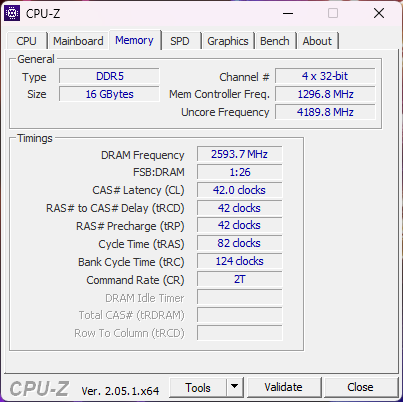
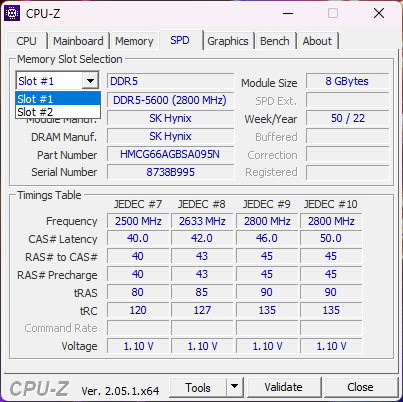
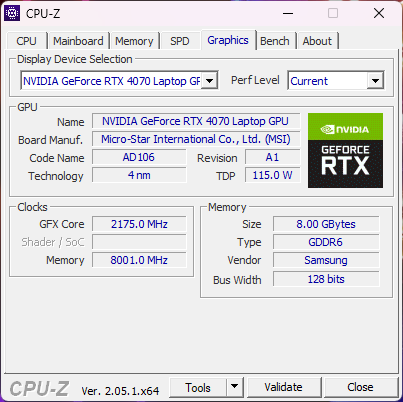
MSI Pulse 17 B13V finns i två utrustningskonfigurationer som bara skiljer sig åt när det gäller deras GPU. Medan vår testenhet använder enNvidia GeForce RTX 4070kommer den andra konfigurationen med en RTX 4060. Som processor används Intel Core i7-13700Hanvänds. Den åtföljs av 16 GB DDR5-5200 RAM och en SSD med en kapacitet på 1 TB. Med en så kraftfull hårdvarukonfiguration är vår testenhet lämplig för spel med upplösningar över Full HD.
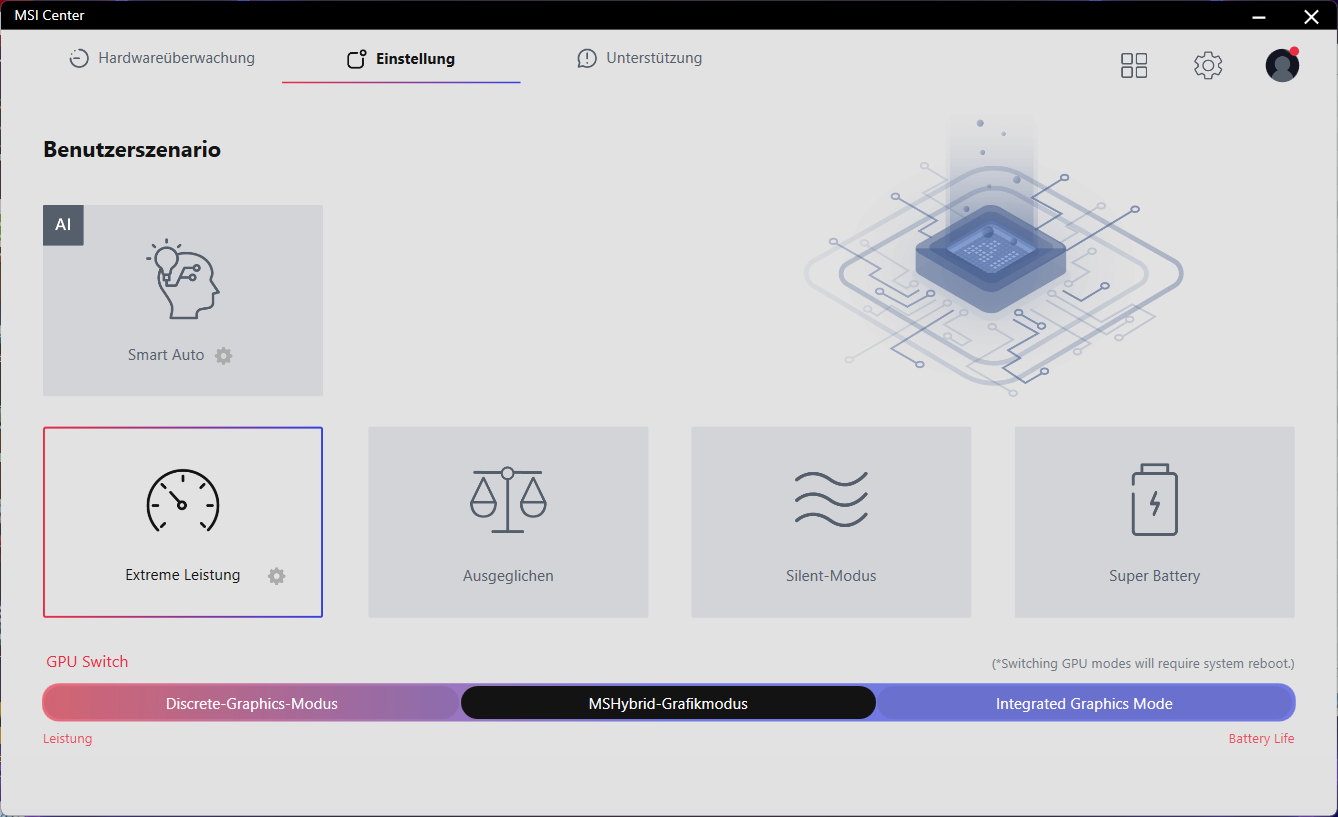
Effektstyrning och testförhållanden
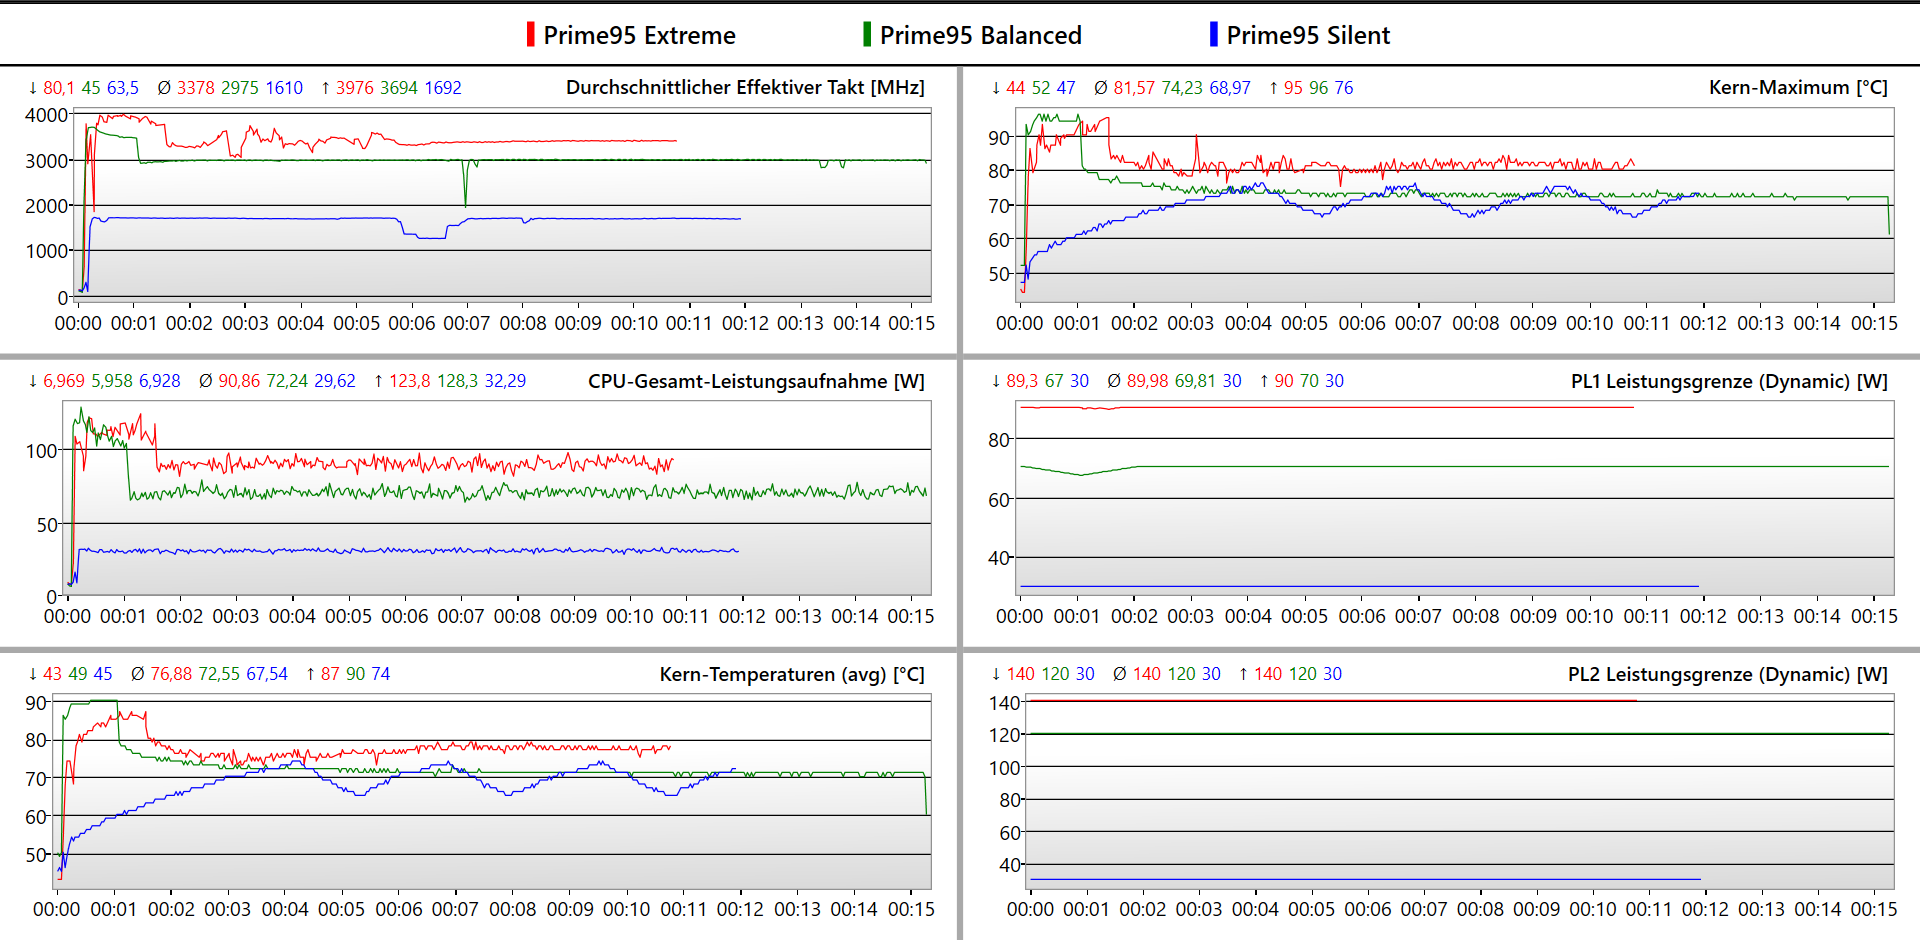
MSI erbjuder tre prestandaprofiler och ett batterisparläge i Pulse 17. Dessutom kan du också använda MSI:s AI-läge. När processorn körs ensam kan den använda en PL1 på 90 watt i Extreme Performance-läget, med en kraftfull prestandaökning (PL2) på 140 watt. I läget Balanced ligger PL1 och PL2 på 70 respektive 120 watt. Quiet Operation-läget där fläktarna inte hörs körs på 30 watt utan boost.
Men det som är mer intressant för en gaming-laptop är prestandan under spel. I alla tre prestandalägena skiljer sig detta knappast under de första 10 minuterna under vårt test. Endast temperaturerna når olika värden. Lägena Prestanda och Balanserad säkerställer konstanta CPU- och GPU-temperaturer. I läget Tyst drift stiger temperaturerna så högt att prestandan stryps och sjunker avsevärt efter cirka 10 minuter.
Vi beslutade därför att köra alla generiska riktmärken i Performance-läge och spelriktmärkena i Balanced-läge. I alla våra testade spel körde vi också ett ytterligare riktmärke med de högsta kvalitetsinställningarna i Performance-läget. De uppnådda bildfrekvenserna skilde sig genomgående med mindre än en procentenhet. Det innebär att Performance-läget knappast ger någon FPS-fördel när du spelar.
Processor
Med sex P- och åtta E-kärnor är Intel Core i7-13700H i Pulse 17 hantera 20 trådar. Processorn är försedd med en relativt hög mängd kraft och kan på detta sätt placera sig knappt före de andra jämförelseenheterna med Core i7. Dock harXMG Focus 17med enCore i9och Asus ROG Strix G17med enRyzen 9 överträffar i7-processorerna avsevärt.
Cinebench R15 Multi Constant Load Test
Cinebench R23: Multi Core | Single Core
Cinebench R20: CPU (Multi Core) | CPU (Single Core)
Cinebench R15: CPU Multi 64Bit | CPU Single 64Bit
Blender: v2.79 BMW27 CPU
7-Zip 18.03: 7z b 4 | 7z b 4 -mmt1
Geekbench 5.5: Multi-Core | Single-Core
HWBOT x265 Benchmark v2.2: 4k Preset
LibreOffice : 20 Documents To PDF
R Benchmark 2.5: Overall mean
| CPU Performance rating | |
| Asus ROG Strix G17 G713PI | |
| Schenker XMG Focus 17 (E23) | |
| Genomsnitt av klass Gaming | |
| MSI Pulse 17 B13VGK | |
| MSI Pulse GL76 12UGK | |
| Genomsnitt Intel Core i7-13700H | |
| MSI Katana 17 B13VFK | |
| Acer Nitro 17 AN17-51-71ER | |
| Cinebench R23 / Multi Core | |
| Asus ROG Strix G17 G713PI | |
| Schenker XMG Focus 17 (E23) | |
| Genomsnitt av klass Gaming (10488 - 42661, n=107, senaste 2 åren) | |
| Acer Nitro 17 AN17-51-71ER | |
| MSI Pulse 17 B13VGK | |
| MSI Pulse GL76 12UGK | |
| MSI Katana 17 B13VFK | |
| Genomsnitt Intel Core i7-13700H (5890 - 20034, n=29) | |
| Cinebench R23 / Single Core | |
| Genomsnitt av klass Gaming (1166 - 2415, n=107, senaste 2 åren) | |
| Schenker XMG Focus 17 (E23) | |
| Asus ROG Strix G17 G713PI | |
| MSI Katana 17 B13VFK | |
| Genomsnitt Intel Core i7-13700H (1323 - 1914, n=29) | |
| MSI Pulse GL76 12UGK | |
| MSI Pulse 17 B13VGK | |
| Acer Nitro 17 AN17-51-71ER | |
| Cinebench R20 / CPU (Multi Core) | |
| Genomsnitt av klass Gaming (4029 - 16433, n=106, senaste 2 åren) | |
| Schenker XMG Focus 17 (E23) | |
| Asus ROG Strix G17 G713PI | |
| MSI Pulse 17 B13VGK | |
| Acer Nitro 17 AN17-51-71ER | |
| MSI Pulse GL76 12UGK | |
| MSI Katana 17 B13VFK | |
| Genomsnitt Intel Core i7-13700H (2322 - 7674, n=29) | |
| Cinebench R20 / CPU (Single Core) | |
| Genomsnitt av klass Gaming (442 - 913, n=106, senaste 2 åren) | |
| Schenker XMG Focus 17 (E23) | |
| Asus ROG Strix G17 G713PI | |
| Genomsnitt Intel Core i7-13700H (508 - 741, n=29) | |
| MSI Katana 17 B13VFK | |
| MSI Pulse GL76 12UGK | |
| MSI Pulse 17 B13VGK | |
| Acer Nitro 17 AN17-51-71ER | |
| Cinebench R15 / CPU Multi 64Bit | |
| Asus ROG Strix G17 G713PI | |
| Schenker XMG Focus 17 (E23) | |
| Genomsnitt av klass Gaming (1578 - 6330, n=105, senaste 2 åren) | |
| Acer Nitro 17 AN17-51-71ER | |
| MSI Pulse 17 B13VGK | |
| MSI Pulse GL76 12UGK | |
| Genomsnitt Intel Core i7-13700H (905 - 2982, n=29) | |
| MSI Katana 17 B13VFK | |
| Cinebench R15 / CPU Single 64Bit | |
| Genomsnitt av klass Gaming (188.8 - 350, n=106, senaste 2 åren) | |
| Asus ROG Strix G17 G713PI | |
| Schenker XMG Focus 17 (E23) | |
| Genomsnitt Intel Core i7-13700H (213 - 278, n=29) | |
| MSI Katana 17 B13VFK | |
| MSI Pulse GL76 12UGK | |
| MSI Pulse 17 B13VGK | |
| Acer Nitro 17 AN17-51-71ER | |
| Blender / v2.79 BMW27 CPU | |
| Genomsnitt Intel Core i7-13700H (169 - 555, n=29) | |
| MSI Katana 17 B13VFK | |
| MSI Pulse GL76 12UGK | |
| Acer Nitro 17 AN17-51-71ER | |
| MSI Pulse 17 B13VGK | |
| Genomsnitt av klass Gaming (79 - 330, n=104, senaste 2 åren) | |
| Schenker XMG Focus 17 (E23) | |
| Asus ROG Strix G17 G713PI | |
| 7-Zip 18.03 / 7z b 4 | |
| Asus ROG Strix G17 G713PI | |
| Schenker XMG Focus 17 (E23) | |
| Genomsnitt av klass Gaming (33491 - 148086, n=105, senaste 2 åren) | |
| MSI Pulse 17 B13VGK | |
| Acer Nitro 17 AN17-51-71ER | |
| MSI Pulse GL76 12UGK | |
| MSI Katana 17 B13VFK | |
| Genomsnitt Intel Core i7-13700H (27322 - 76344, n=29) | |
| 7-Zip 18.03 / 7z b 4 -mmt1 | |
| Asus ROG Strix G17 G713PI | |
| Schenker XMG Focus 17 (E23) | |
| Genomsnitt av klass Gaming (4199 - 7436, n=105, senaste 2 åren) | |
| Genomsnitt Intel Core i7-13700H (4825 - 6238, n=29) | |
| MSI Katana 17 B13VFK | |
| MSI Pulse GL76 12UGK | |
| MSI Pulse 17 B13VGK | |
| Acer Nitro 17 AN17-51-71ER | |
| Geekbench 5.5 / Multi-Core | |
| Asus ROG Strix G17 G713PI | |
| Schenker XMG Focus 17 (E23) | |
| Genomsnitt av klass Gaming (6460 - 28263, n=105, senaste 2 åren) | |
| MSI Pulse 17 B13VGK | |
| Acer Nitro 17 AN17-51-71ER | |
| MSI Pulse GL76 12UGK | |
| Genomsnitt Intel Core i7-13700H (6165 - 14215, n=29) | |
| MSI Katana 17 B13VFK | |
| Geekbench 5.5 / Single-Core | |
| Genomsnitt av klass Gaming (986 - 2474, n=105, senaste 2 åren) | |
| Asus ROG Strix G17 G713PI | |
| Schenker XMG Focus 17 (E23) | |
| Genomsnitt Intel Core i7-13700H (1362 - 1919, n=29) | |
| MSI Katana 17 B13VFK | |
| MSI Pulse 17 B13VGK | |
| MSI Pulse GL76 12UGK | |
| Acer Nitro 17 AN17-51-71ER | |
| HWBOT x265 Benchmark v2.2 / 4k Preset | |
| Asus ROG Strix G17 G713PI | |
| Genomsnitt av klass Gaming (11.5 - 44.4, n=105, senaste 2 åren) | |
| Schenker XMG Focus 17 (E23) | |
| MSI Pulse 17 B13VGK | |
| Acer Nitro 17 AN17-51-71ER | |
| MSI Pulse GL76 12UGK | |
| MSI Katana 17 B13VFK | |
| Genomsnitt Intel Core i7-13700H (6.72 - 21.2, n=29) | |
| LibreOffice / 20 Documents To PDF | |
| MSI Pulse 17 B13VGK | |
| MSI Katana 17 B13VFK | |
| Acer Nitro 17 AN17-51-71ER | |
| Schenker XMG Focus 17 (E23) | |
| Genomsnitt av klass Gaming (33.2 - 88.8, n=105, senaste 2 åren) | |
| Genomsnitt Intel Core i7-13700H (31.3 - 62.4, n=29) | |
| MSI Pulse GL76 12UGK | |
| Asus ROG Strix G17 G713PI | |
| R Benchmark 2.5 / Overall mean | |
| Acer Nitro 17 AN17-51-71ER | |
| MSI Pulse 17 B13VGK | |
| MSI Pulse GL76 12UGK | |
| Genomsnitt Intel Core i7-13700H (0.4308 - 0.607, n=29) | |
| MSI Katana 17 B13VFK | |
| Genomsnitt av klass Gaming (0.3439 - 0.759, n=106, senaste 2 åren) | |
| Schenker XMG Focus 17 (E23) | |
| Asus ROG Strix G17 G713PI | |
* ... mindre är bättre
AIDA64: FP32 Ray-Trace | FPU Julia | CPU SHA3 | CPU Queen | FPU SinJulia | FPU Mandel | CPU AES | CPU ZLib | FP64 Ray-Trace | CPU PhotoWorxx
| Performance rating | |
| Asus ROG Strix G17 G713PI | |
| Genomsnitt av klass Gaming | |
| Schenker XMG Focus 17 (E23) | |
| Acer Nitro 17 AN17-51-71ER | |
| MSI Pulse 17 B13VGK | |
| MSI Pulse GL76 12UGK | |
| Genomsnitt Intel Core i7-13700H | |
| MSI Katana 17 B13VFK | |
| AIDA64 / FP32 Ray-Trace | |
| Asus ROG Strix G17 G713PI | |
| Genomsnitt av klass Gaming (10227 - 85542, n=105, senaste 2 åren) | |
| Schenker XMG Focus 17 (E23) | |
| MSI Pulse 17 B13VGK | |
| Acer Nitro 17 AN17-51-71ER | |
| MSI Pulse GL76 12UGK | |
| Genomsnitt Intel Core i7-13700H (4986 - 18908, n=29) | |
| MSI Katana 17 B13VFK | |
| AIDA64 / FPU Julia | |
| Asus ROG Strix G17 G713PI | |
| Genomsnitt av klass Gaming (51376 - 238426, n=105, senaste 2 åren) | |
| Schenker XMG Focus 17 (E23) | |
| MSI Pulse 17 B13VGK | |
| Acer Nitro 17 AN17-51-71ER | |
| MSI Pulse GL76 12UGK | |
| Genomsnitt Intel Core i7-13700H (25360 - 92359, n=29) | |
| MSI Katana 17 B13VFK | |
| AIDA64 / CPU SHA3 | |
| Asus ROG Strix G17 G713PI | |
| Genomsnitt av klass Gaming (2180 - 10115, n=105, senaste 2 åren) | |
| Schenker XMG Focus 17 (E23) | |
| Acer Nitro 17 AN17-51-71ER | |
| MSI Pulse 17 B13VGK | |
| MSI Pulse GL76 12UGK | |
| Genomsnitt Intel Core i7-13700H (1339 - 4224, n=29) | |
| MSI Katana 17 B13VFK | |
| AIDA64 / CPU Queen | |
| Asus ROG Strix G17 G713PI | |
| Schenker XMG Focus 17 (E23) | |
| Genomsnitt av klass Gaming (49785 - 173351, n=90, senaste 2 åren) | |
| MSI Pulse GL76 12UGK | |
| Acer Nitro 17 AN17-51-71ER | |
| MSI Pulse 17 B13VGK | |
| Genomsnitt Intel Core i7-13700H (59324 - 107159, n=29) | |
| MSI Katana 17 B13VFK | |
| AIDA64 / FPU SinJulia | |
| Asus ROG Strix G17 G713PI | |
| Genomsnitt av klass Gaming (4424 - 33636, n=105, senaste 2 åren) | |
| Schenker XMG Focus 17 (E23) | |
| MSI Pulse 17 B13VGK | |
| Acer Nitro 17 AN17-51-71ER | |
| MSI Pulse GL76 12UGK | |
| Genomsnitt Intel Core i7-13700H (4800 - 11050, n=29) | |
| MSI Katana 17 B13VFK | |
| AIDA64 / FPU Mandel | |
| Asus ROG Strix G17 G713PI | |
| Genomsnitt av klass Gaming (25115 - 128721, n=105, senaste 2 åren) | |
| Schenker XMG Focus 17 (E23) | |
| MSI Pulse 17 B13VGK | |
| Acer Nitro 17 AN17-51-71ER | |
| MSI Pulse GL76 12UGK | |
| Genomsnitt Intel Core i7-13700H (12321 - 45118, n=29) | |
| MSI Katana 17 B13VFK | |
| AIDA64 / CPU AES | |
| Asus ROG Strix G17 G713PI | |
| Acer Nitro 17 AN17-51-71ER | |
| MSI Pulse GL76 12UGK | |
| Genomsnitt av klass Gaming (39258 - 247074, n=105, senaste 2 åren) | |
| Schenker XMG Focus 17 (E23) | |
| MSI Pulse 17 B13VGK | |
| Genomsnitt Intel Core i7-13700H (28769 - 151254, n=29) | |
| MSI Katana 17 B13VFK | |
| AIDA64 / CPU ZLib | |
| Asus ROG Strix G17 G713PI | |
| Schenker XMG Focus 17 (E23) | |
| Genomsnitt av klass Gaming (574 - 2531, n=105, senaste 2 åren) | |
| Acer Nitro 17 AN17-51-71ER | |
| MSI Pulse 17 B13VGK | |
| MSI Pulse GL76 12UGK | |
| Genomsnitt Intel Core i7-13700H (389 - 1215, n=29) | |
| MSI Katana 17 B13VFK | |
| AIDA64 / FP64 Ray-Trace | |
| Asus ROG Strix G17 G713PI | |
| Genomsnitt av klass Gaming (5509 - 45446, n=105, senaste 2 åren) | |
| Schenker XMG Focus 17 (E23) | |
| MSI Pulse 17 B13VGK | |
| Acer Nitro 17 AN17-51-71ER | |
| MSI Pulse GL76 12UGK | |
| Genomsnitt Intel Core i7-13700H (2540 - 10135, n=29) | |
| MSI Katana 17 B13VFK | |
| AIDA64 / CPU PhotoWorxx | |
| Schenker XMG Focus 17 (E23) | |
| Genomsnitt av klass Gaming (12271 - 89891, n=105, senaste 2 åren) | |
| Genomsnitt Intel Core i7-13700H (12872 - 52727, n=29) | |
| MSI Pulse 17 B13VGK | |
| Acer Nitro 17 AN17-51-71ER | |
| MSI Katana 17 B13VFK | |
| Asus ROG Strix G17 G713PI | |
| MSI Pulse GL76 12UGK | |
Systemets prestanda
Vi körde PCMark 10-riktmärket för systemprestanda två gånger, eftersom MSI Pulse i den första körningen förblev långt efter de kraftfulla resultaten som processorn kunde visa i sina riktmärken tidigare. Med bara 6844 poäng skulle den bara ha nått sista plats bland våra jämförelseenheter. Men flera uppdateringar senare med Windows Update förändras bilden drastiskt.
Den bärbara speldatorn placerar sig nu bara knappt före jämförelseenheterna. Den enda tydliga avvikelsen finns i avsnittet Essentials i jämförelsetestet. Vi misstänker att felet ligger hos den relativt långsamma SSD-enheten i vår testenhet, eftersom Essentials-avsnittet lägger särskild vikt vid åtkomsttiderna för data och program.
Den CPU-tunga CrossMark målar en liknande bild med jämförelseenheterna med Core i9och Ryzen 9kan placera sig betydligt längre fram.
CrossMark: Overall | Productivity | Creativity | Responsiveness
| PCMark 10 / Score | |
| Genomsnitt av klass Gaming (5828 - 12414, n=93, senaste 2 åren) | |
| MSI Pulse 17 B13VGK | |
| MSI Pulse GL76 12UGK | |
| Asus ROG Strix G17 G713PI | |
| Genomsnitt Intel Core i7-13700H, NVIDIA GeForce RTX 4070 Laptop GPU (7158 - 7956, n=8) | |
| MSI Katana 17 B13VFK | |
| Acer Nitro 17 AN17-51-71ER | |
| Schenker XMG Focus 17 (E23) | |
| PCMark 10 / Essentials | |
| Asus ROG Strix G17 G713PI | |
| MSI Pulse GL76 12UGK | |
| MSI Katana 17 B13VFK | |
| Genomsnitt Intel Core i7-13700H, NVIDIA GeForce RTX 4070 Laptop GPU (10252 - 11449, n=8) | |
| Genomsnitt av klass Gaming (8810 - 11935, n=97, senaste 2 åren) | |
| MSI Pulse 17 B13VGK | |
| Acer Nitro 17 AN17-51-71ER | |
| Schenker XMG Focus 17 (E23) | |
| PCMark 10 / Productivity | |
| Genomsnitt av klass Gaming (6845 - 25323, n=95, senaste 2 åren) | |
| Asus ROG Strix G17 G713PI | |
| MSI Pulse 17 B13VGK | |
| MSI Pulse GL76 12UGK | |
| Schenker XMG Focus 17 (E23) | |
| Genomsnitt Intel Core i7-13700H, NVIDIA GeForce RTX 4070 Laptop GPU (8501 - 10769, n=8) | |
| MSI Katana 17 B13VFK | |
| Acer Nitro 17 AN17-51-71ER | |
| PCMark 10 / Digital Content Creation | |
| Genomsnitt av klass Gaming (7602 - 19954, n=95, senaste 2 åren) | |
| Acer Nitro 17 AN17-51-71ER | |
| MSI Pulse 17 B13VGK | |
| MSI Pulse GL76 12UGK | |
| Genomsnitt Intel Core i7-13700H, NVIDIA GeForce RTX 4070 Laptop GPU (10358 - 12908, n=8) | |
| MSI Katana 17 B13VFK | |
| Schenker XMG Focus 17 (E23) | |
| Asus ROG Strix G17 G713PI | |
| CrossMark / Overall | |
| Asus ROG Strix G17 G713PI | |
| Schenker XMG Focus 17 (E23) | |
| Genomsnitt av klass Gaming (1366 - 2409, n=94, senaste 2 åren) | |
| MSI Pulse 17 B13VGK | |
| Genomsnitt Intel Core i7-13700H, NVIDIA GeForce RTX 4070 Laptop GPU (1768 - 2073, n=6) | |
| MSI Katana 17 B13VFK | |
| MSI Pulse GL76 12UGK | |
| Acer Nitro 17 AN17-51-71ER | |
| CrossMark / Productivity | |
| Asus ROG Strix G17 G713PI | |
| Schenker XMG Focus 17 (E23) | |
| Genomsnitt av klass Gaming (1386 - 2254, n=94, senaste 2 åren) | |
| MSI Pulse 17 B13VGK | |
| Genomsnitt Intel Core i7-13700H, NVIDIA GeForce RTX 4070 Laptop GPU (1645 - 2006, n=6) | |
| MSI Pulse GL76 12UGK | |
| MSI Katana 17 B13VFK | |
| Acer Nitro 17 AN17-51-71ER | |
| CrossMark / Creativity | |
| Asus ROG Strix G17 G713PI | |
| Schenker XMG Focus 17 (E23) | |
| Genomsnitt av klass Gaming (1343 - 2786, n=94, senaste 2 åren) | |
| MSI Pulse 17 B13VGK | |
| Genomsnitt Intel Core i7-13700H, NVIDIA GeForce RTX 4070 Laptop GPU (1936 - 2137, n=6) | |
| MSI Katana 17 B13VFK | |
| MSI Pulse GL76 12UGK | |
| Acer Nitro 17 AN17-51-71ER | |
| CrossMark / Responsiveness | |
| MSI Pulse GL76 12UGK | |
| MSI Pulse 17 B13VGK | |
| Schenker XMG Focus 17 (E23) | |
| Genomsnitt Intel Core i7-13700H, NVIDIA GeForce RTX 4070 Laptop GPU (1451 - 2202, n=6) | |
| MSI Katana 17 B13VFK | |
| Genomsnitt av klass Gaming (1226 - 2334, n=94, senaste 2 åren) | |
| Asus ROG Strix G17 G713PI | |
| Acer Nitro 17 AN17-51-71ER | |
| PCMark 10 Score | 7796 poäng | |
Hjälp | ||
| AIDA64 / Memory Copy | |
| Schenker XMG Focus 17 (E23) | |
| Genomsnitt av klass Gaming (21750 - 129946, n=105, senaste 2 åren) | |
| Genomsnitt Intel Core i7-13700H (24334 - 78081, n=29) | |
| MSI Pulse 17 B13VGK | |
| Acer Nitro 17 AN17-51-71ER | |
| MSI Katana 17 B13VFK | |
| Asus ROG Strix G17 G713PI | |
| MSI Pulse GL76 12UGK | |
| AIDA64 / Memory Read | |
| Schenker XMG Focus 17 (E23) | |
| Genomsnitt av klass Gaming (22956 - 118858, n=105, senaste 2 åren) | |
| MSI Pulse 17 B13VGK | |
| Acer Nitro 17 AN17-51-71ER | |
| Genomsnitt Intel Core i7-13700H (23681 - 79656, n=29) | |
| MSI Katana 17 B13VFK | |
| Asus ROG Strix G17 G713PI | |
| MSI Pulse GL76 12UGK | |
| AIDA64 / Memory Write | |
| Genomsnitt av klass Gaming (22297 - 135096, n=105, senaste 2 åren) | |
| Schenker XMG Focus 17 (E23) | |
| Genomsnitt Intel Core i7-13700H (22986 - 99898, n=29) | |
| Acer Nitro 17 AN17-51-71ER | |
| MSI Pulse 17 B13VGK | |
| Asus ROG Strix G17 G713PI | |
| MSI Katana 17 B13VFK | |
| MSI Pulse GL76 12UGK | |
| AIDA64 / Memory Latency | |
| Acer Nitro 17 AN17-51-71ER | |
| Genomsnitt av klass Gaming (75.3 - 259, n=105, senaste 2 åren) | |
| MSI Katana 17 B13VFK | |
| MSI Pulse 17 B13VGK | |
| Genomsnitt Intel Core i7-13700H (82.4 - 136.8, n=29) | |
| MSI Pulse GL76 12UGK | |
| Schenker XMG Focus 17 (E23) | |
| Asus ROG Strix G17 G713PI | |
* ... mindre är bättre
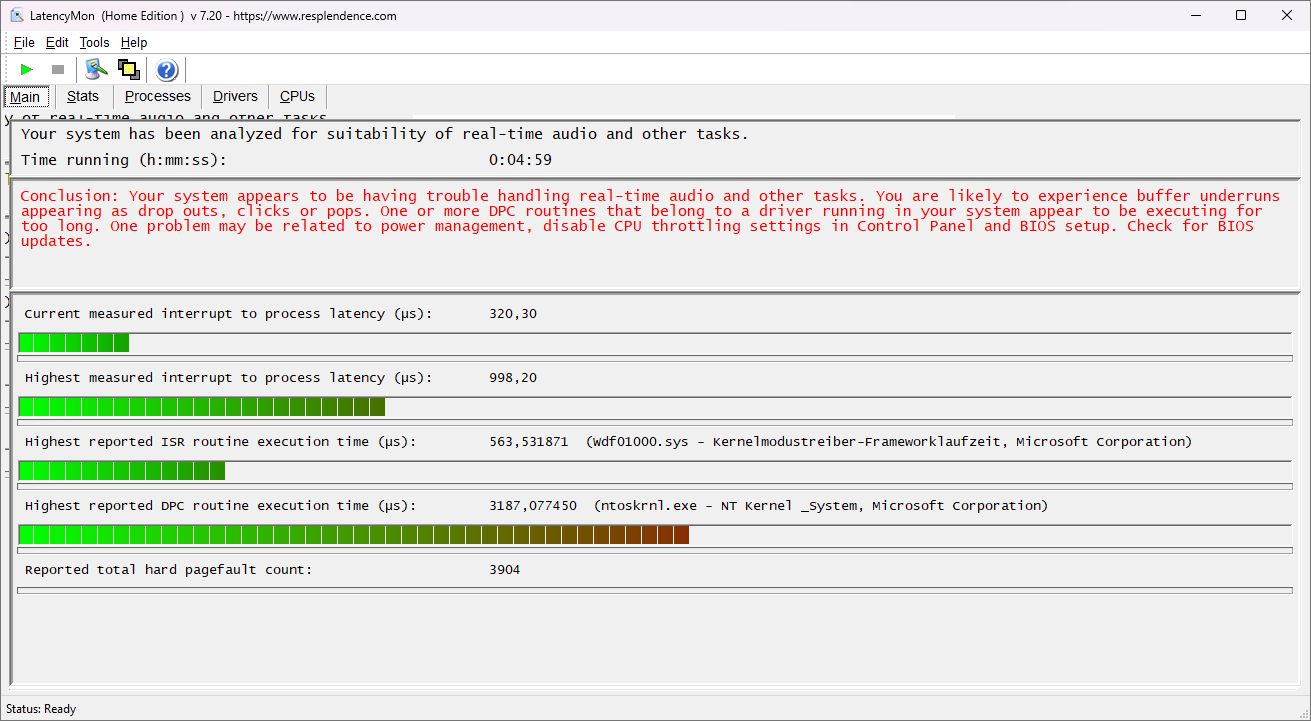
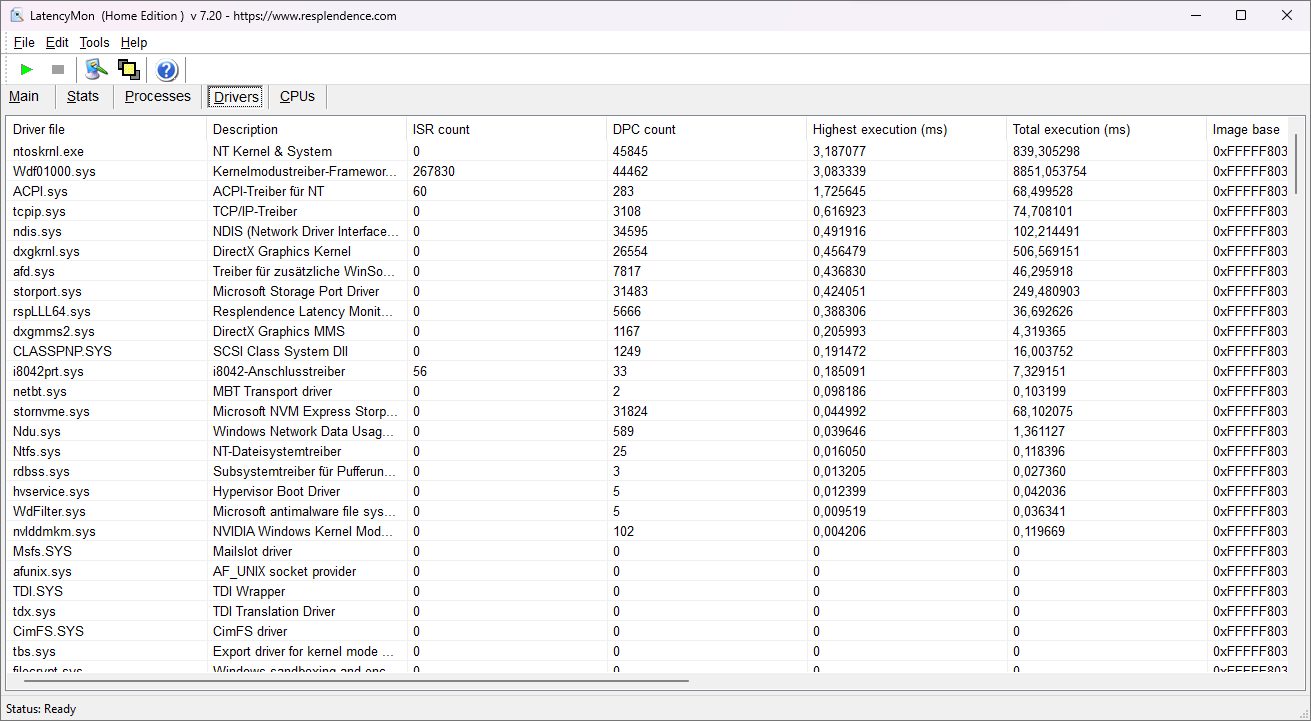
DPC-fördröjningar
I DPC-latenserna bestämmer LatencyMon att den bärbara datorn med de tillgängliga uppdateringarna vid tidpunkten för testet inte är lämplig för realtidsbehandling av ljud. Problemet ligger uppenbarligen i Windows Kernel här.

| DPC Latencies / LatencyMon - interrupt to process latency (max), Web, Youtube, Prime95 | |
| MSI Katana 17 B13VFK | |
| Asus ROG Strix G17 G713PI | |
| Acer Nitro 17 AN17-51-71ER | |
| MSI Pulse 17 B13VGK | |
| Schenker XMG Focus 17 (E23) | |
| MSI Pulse GL76 12UGK | |
* ... mindre är bättre
Lagringslösning
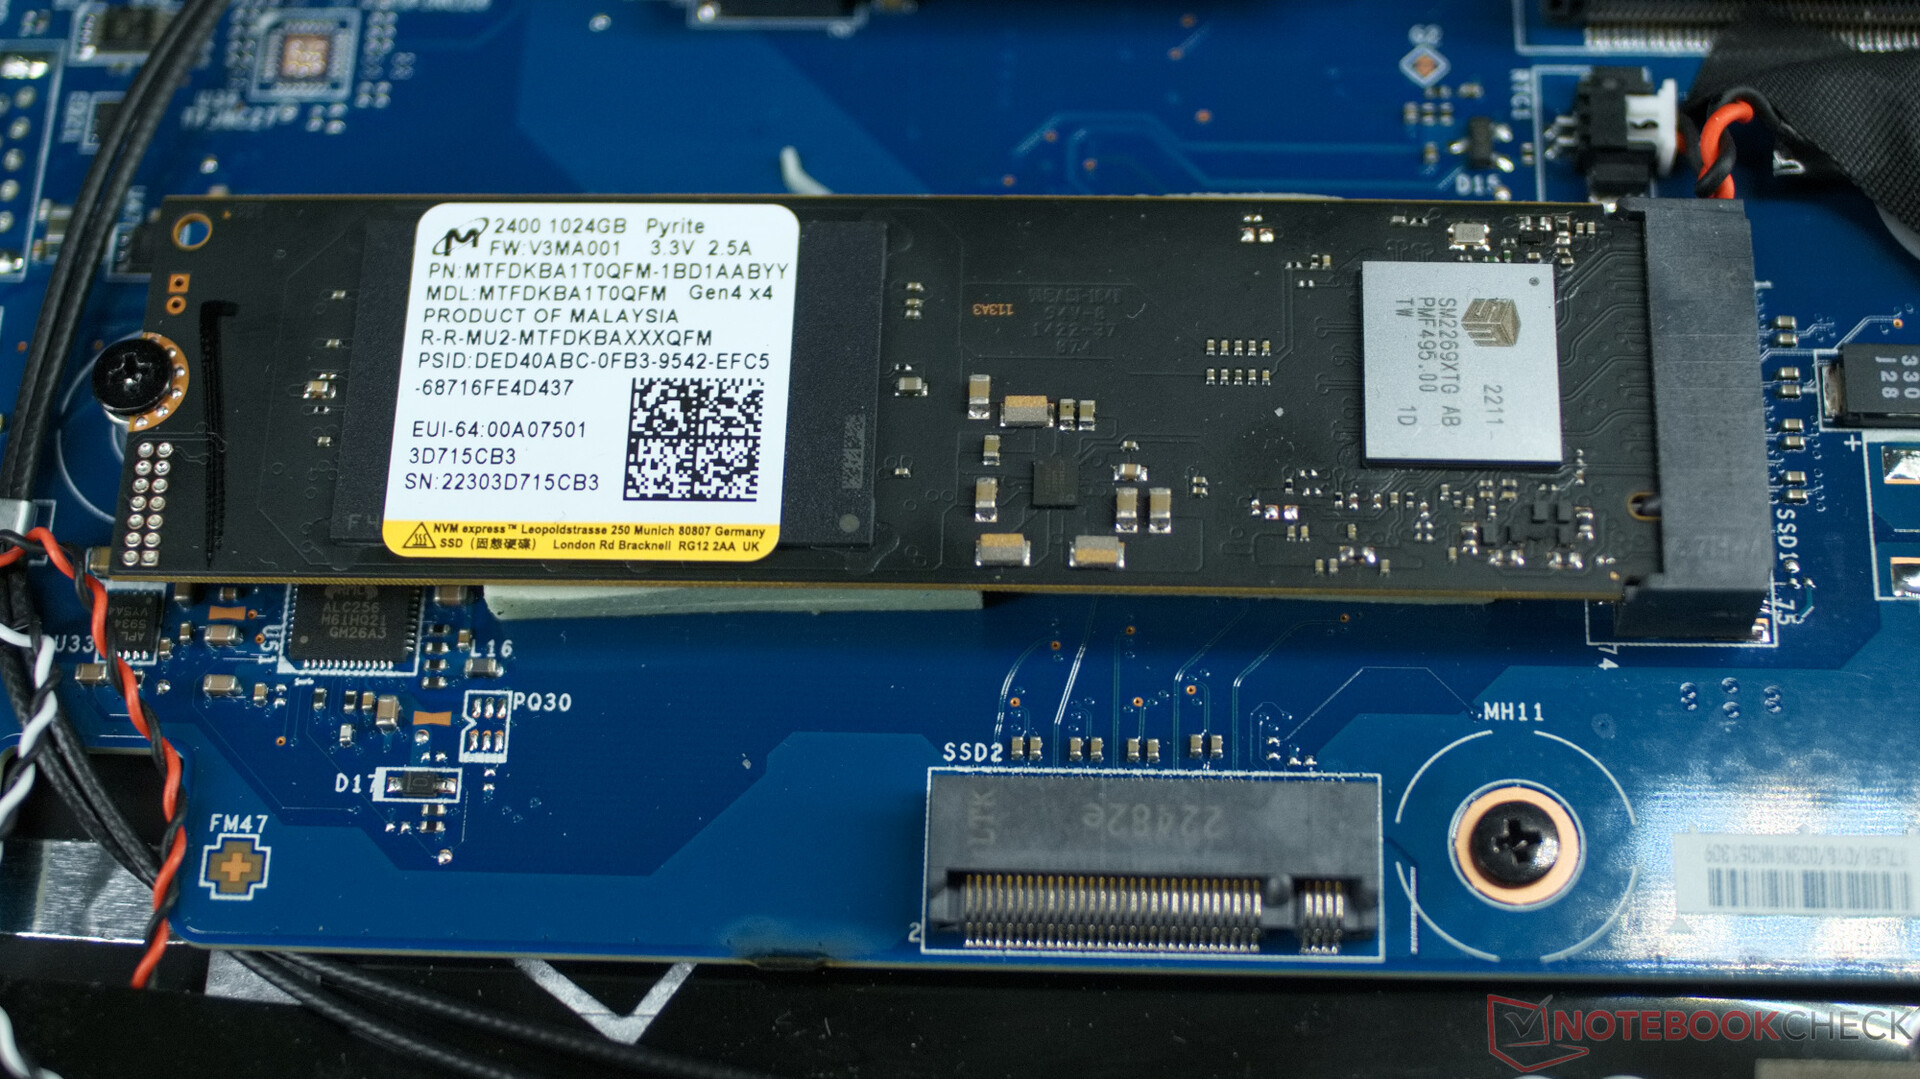
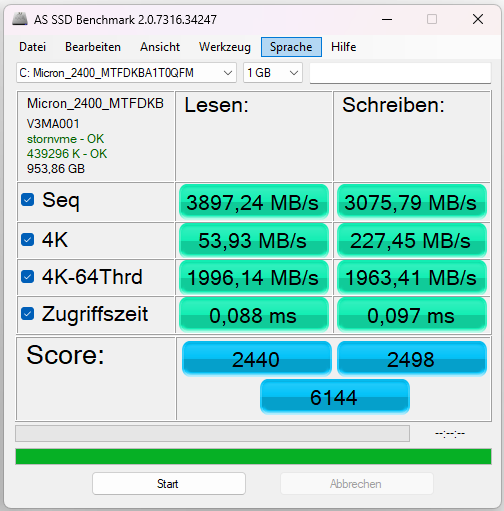
Den härMicron 2400 NVMe SSD i vår testenhet erbjuder en kapacitet på 1 Terabyte. Dess hastighet är genomsnittlig bland bärbara datorer för spel och kan också bibehållas konstant i MSI Pulse 17 under längre tidsperioder utan problem.

* ... mindre är bättre
Constant Read Performance: DiskSpd Read Loop, Queue Depth 8
Grafikkort
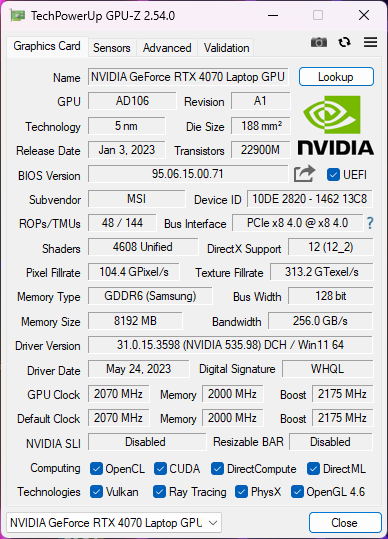
NvidiaNvidia RTX 4070kan köras konstant med en kraftfull 100 till 140 watt i MSI Pulse 17 utan att temperaturerna i chipet blir för heta här. Med detta levererar grafikchipet en relativt hög prestanda i 3DMark-riktmärkena. Detta innebär att Full HD-spel och lite raytracing inte bör utgöra några problem för grafikkortet, och chipet hanterar också snabbt praktiska applikationer som rendering av 3D-grafik i program som Blender.
| 3DMark 11 Performance | 34584 poäng | |
| 3DMark Cloud Gate Standard Score | 70329 poäng | |
| 3DMark Fire Strike Score | 27138 poäng | |
| 3DMark Time Spy Score | 12235 poäng | |
Hjälp | ||
| Geekbench 6.7 - GPU OpenCL | |
| Genomsnitt av klass Gaming (67235 - 253130, n=103, senaste 2 åren) | |
| MSI Pulse 17 B13VGK | |
| Genomsnitt NVIDIA GeForce RTX 4070 Laptop GPU (85488 - 129836, n=45) | |
* ... mindre är bättre
Spelprestanda
SchenkerSchenker XMG Focus 17och Asus ROG Strix G17har en liten fördel jämfört med MSI Pulse 17 här. Båda bärbara datorerna erbjuder helt enkelt en snabbare processor, vilket tydligt återspeglas i bildfrekvenserna för de CPU-tunga spelen som Dota 2 Reborn. Pulse 17 visar dock också att Full HD-spel och mer med höga kvalitetsinställningar och till och med raytracing är möjligt utan att gå lägre än 60 bilder per sekund. Samtidigt är den bärbara datorn betydligt tystare än de andra konkurrenterna, och du kan spela spel här utan någon prestandaförlust i balanserat läge med en ljudnivå på bara 42 dB(A) (uppmätt från ett avstånd på 15 cm, ~6 in).
| Performance rating - Percent | |
| Genomsnitt av klass Gaming | |
| Asus ROG Strix G17 G713PI | |
| Schenker XMG Focus 17 (E23) | |
| MSI Katana 17 B13VFK | |
| MSI Pulse 17 B13VGK | |
| Acer Nitro 17 AN17-51-71ER | |
| MSI Pulse GL76 12UGK | |
| The Witcher 3 - 1920x1080 Ultra Graphics & Postprocessing (HBAO+) | |
| Genomsnitt av klass Gaming (104.7 - 240, n=7, senaste 2 åren) | |
| Asus ROG Strix G17 G713PI | |
| Schenker XMG Focus 17 (E23) | |
| MSI Pulse 17 B13VGK | |
| Acer Nitro 17 AN17-51-71ER | |
| MSI Katana 17 B13VFK | |
| MSI Pulse GL76 12UGK | |
| GTA V - 1920x1080 Highest AA:4xMSAA + FX AF:16x | |
| Genomsnitt av klass Gaming (48.3 - 186.9, n=94, senaste 2 åren) | |
| Schenker XMG Focus 17 (E23) | |
| MSI Pulse 17 B13VGK | |
| Acer Nitro 17 AN17-51-71ER | |
| Asus ROG Strix G17 G713PI | |
| MSI Katana 17 B13VFK | |
| MSI Pulse GL76 12UGK | |
| Final Fantasy XV Benchmark - 1920x1080 High Quality | |
| Genomsnitt av klass Gaming (41 - 215, n=95, senaste 2 åren) | |
| Schenker XMG Focus 17 (E23) | |
| Asus ROG Strix G17 G713PI | |
| MSI Pulse 17 B13VGK | |
| Acer Nitro 17 AN17-51-71ER | |
| MSI Katana 17 B13VFK | |
| MSI Pulse GL76 12UGK | |
| Strange Brigade - 1920x1080 ultra AA:ultra AF:16 | |
| Genomsnitt av klass Gaming (76.3 - 458, n=87, senaste 2 åren) | |
| Schenker XMG Focus 17 (E23) | |
| Asus ROG Strix G17 G713PI | |
| MSI Pulse 17 B13VGK | |
| Acer Nitro 17 AN17-51-71ER | |
| MSI Katana 17 B13VFK | |
| MSI Pulse GL76 12UGK | |
| Dota 2 Reborn - 1920x1080 ultra (3/3) best looking | |
| Schenker XMG Focus 17 (E23) | |
| Asus ROG Strix G17 G713PI | |
| MSI Katana 17 B13VFK | |
| Genomsnitt av klass Gaming (84.8 - 248, n=107, senaste 2 åren) | |
| MSI Pulse 17 B13VGK | |
| Acer Nitro 17 AN17-51-71ER | |
| MSI Pulse GL76 12UGK | |
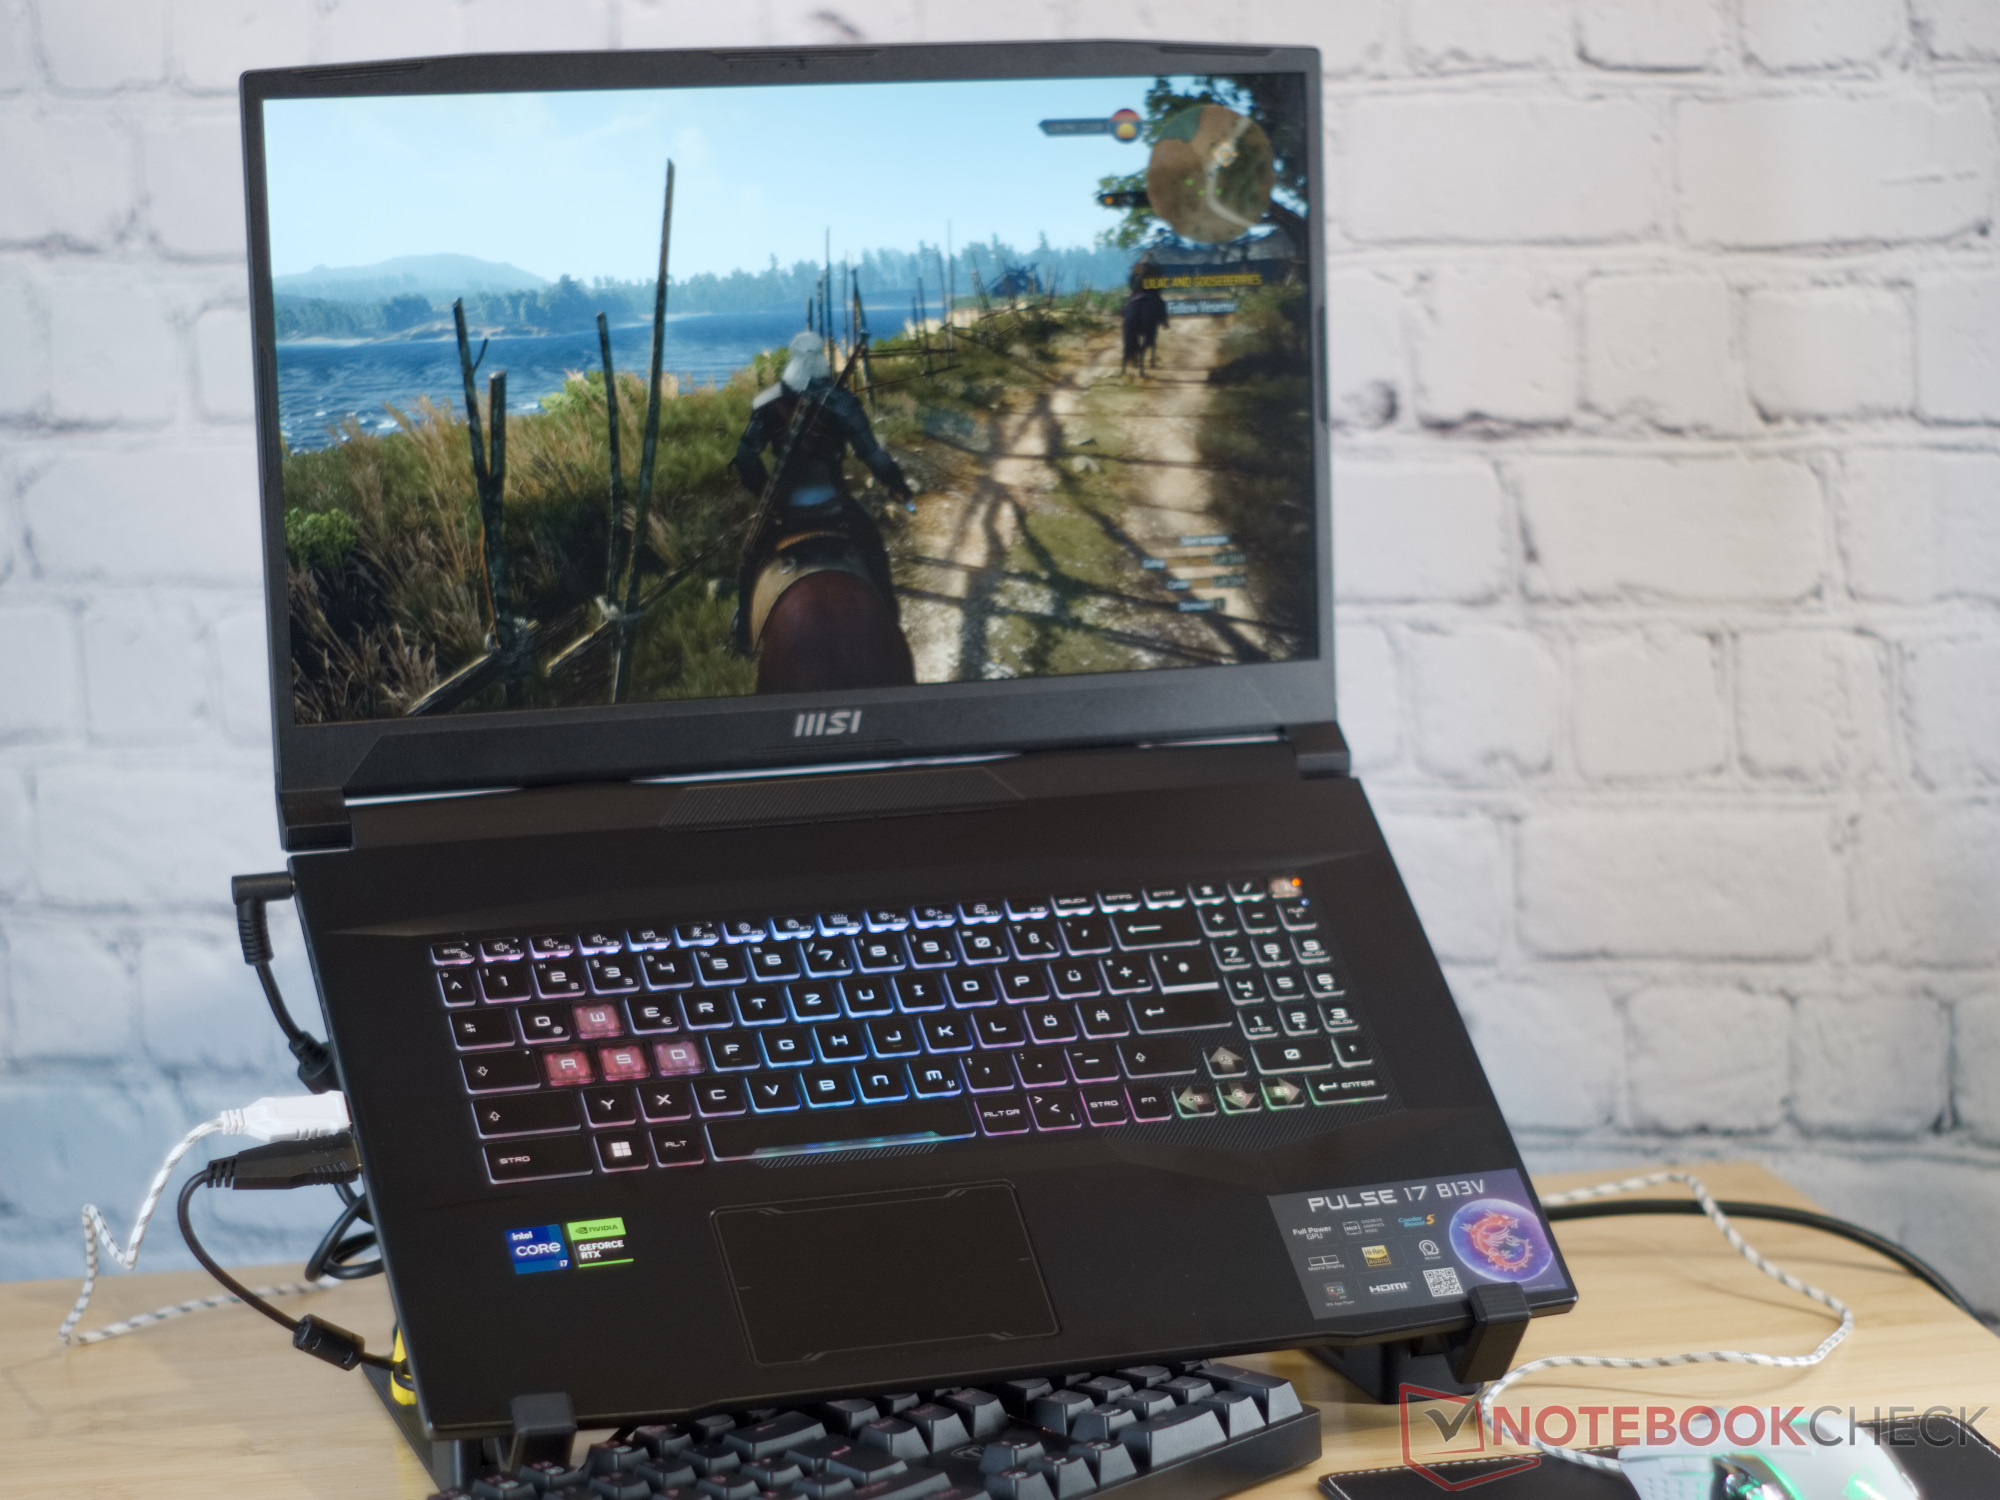
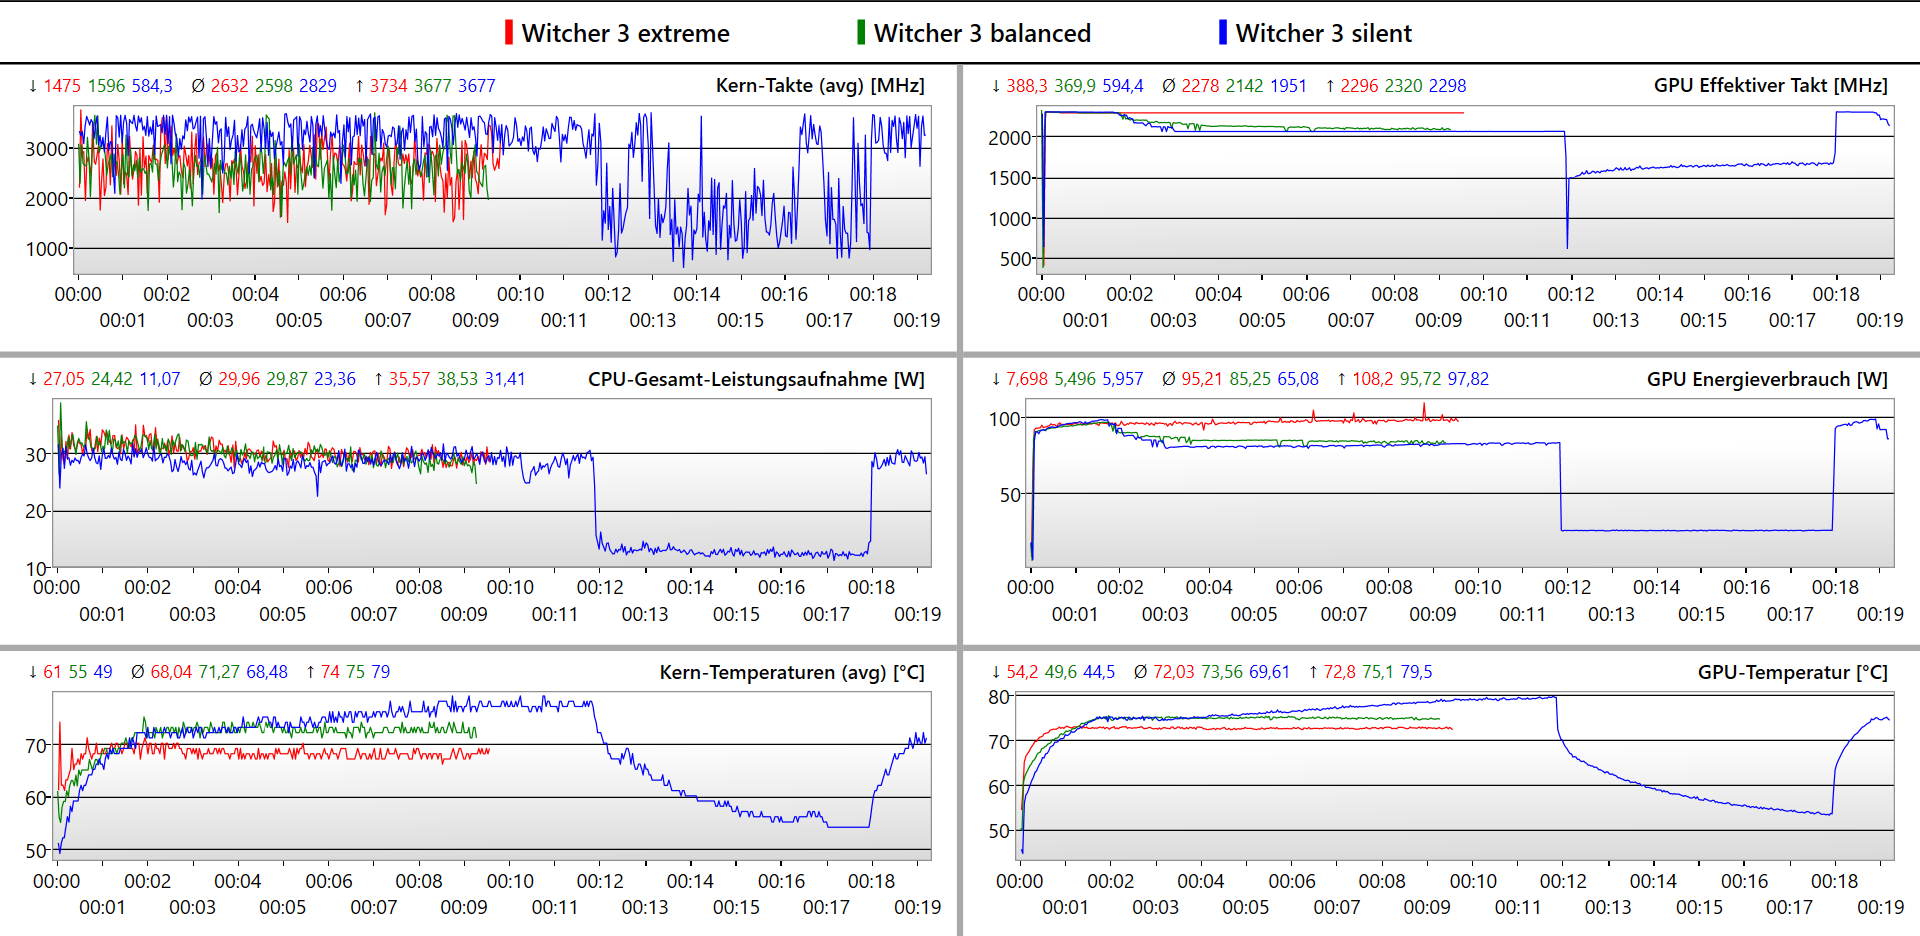
I det timslånga testet med The Witcher 3 visas det typiska FPS-intervallet i spelets dag- och nattrytm. Vi ser inga signifikanta avvikande värden här.
The Witcher 3 FPS Chart
| låg | med. | hög | ultra | QHD | 4K | |
|---|---|---|---|---|---|---|
| GTA V (2015) | 184.8 | 182.2 | 176.9 | 116.4 | ||
| The Witcher 3 (2015) | 106.9 | |||||
| Dota 2 Reborn (2015) | 174 | 158 | 146.3 | 138.5 | 132.4 | |
| Final Fantasy XV Benchmark (2018) | 150.5 | 111.9 | 86.2 | 47.5 | ||
| X-Plane 11.11 (2018) | 147.6 | 130.8 | 102 | 102.2 | ||
| Far Cry 5 (2018) | 163 | 154 | 145 | |||
| Strange Brigade (2018) | 468 | 295 | 233 | 202 | ||
| F1 22 (2022) | 239 | 228 | 186.7 | 71 | ||
| F1 23 (2023) | 248 | 251 | 199.2 | 100 |
Utsläpp - tysta fläktar
Utsläpp av buller
MSI Pulse 17 är extremt tyst för att vara en bärbar speldator. Vi mäter en maximal ljudnivå på endast 46,5 dB(A) under belastning i Performance-läget, och i Balanced-läget är den till och med upp till 4 dB(A) lägre. Fläktarna hörs också med en viss fördröjning under belastning. Till exempel blir de bara aktiva strax före slutet av riktmärket i vår mätning under genomsnittlig belastning med PCMark 06.
Ljudnivå
| Låg belastning |
| 24 / 24 / 24 dB(A) |
| Hög belastning |
| 32.49 / 46.51 dB(A) |
 | ||
30 dB tyst 40 dB(A) hörbar 50 dB(A) högt ljud |
||
min: | ||
| MSI Pulse 17 B13VGK GeForce RTX 4070 Laptop GPU, i7-13700H, Micron 2400 MTFDKBA1T0QFM | MSI Pulse GL76 12UGK GeForce RTX 3070 Laptop GPU, i7-12700H, Micron 3400 1TB MTFDKBA1T0TFH | MSI Katana 17 B13VFK GeForce RTX 4060 Laptop GPU, i7-13620H, Micron 2400 MTFDKBA1T0QFM | Acer Nitro 17 AN17-51-71ER GeForce RTX 4060 Laptop GPU, i7-13700H, Samsung PM9A1 MZVL21T0HCLR | Schenker XMG Focus 17 (E23) GeForce RTX 4070 Laptop GPU, i9-13900HX, Crucial P5 Plus 1TB CT1000P5PSSD8 | Asus ROG Strix G17 G713PI GeForce RTX 4070 Laptop GPU, R9 7945HX, WD PC SN560 SDDPNQE-1T00 | |
|---|---|---|---|---|---|---|
| Noise | -13% | -24% | -11% | -19% | -14% | |
| av / miljö * (dB) | 24 | 24.1 -0% | 24.5 -2% | 24 -0% | 24 -0% | 25 -4% |
| Idle Minimum * (dB) | 24 | 26.9 -12% | 24.5 -2% | 24 -0% | 24 -0% | 26 -8% |
| Idle Average * (dB) | 24 | 26.9 -12% | 24.5 -2% | 24 -0% | 24 -0% | 29 -21% |
| Idle Maximum * (dB) | 24 | 27 -13% | 40 -67% | 32.32 -35% | 26.47 -10% | 30 -25% |
| Load Average * (dB) | 32.49 | 43.8 -35% | 48.3 -49% | 35.18 -8% | 55.72 -71% | 46 -42% |
| Witcher 3 ultra * (dB) | 46.51 | 44.7 4% | 56 -20% | 54.78 -18% | 57.94 -25% | 46 1% |
| Load Maximum * (dB) | 46.51 | 58.3 -25% | 59.1 -27% | 54.78 -18% | 57.94 -25% | 47 -1% |
* ... mindre är bättre
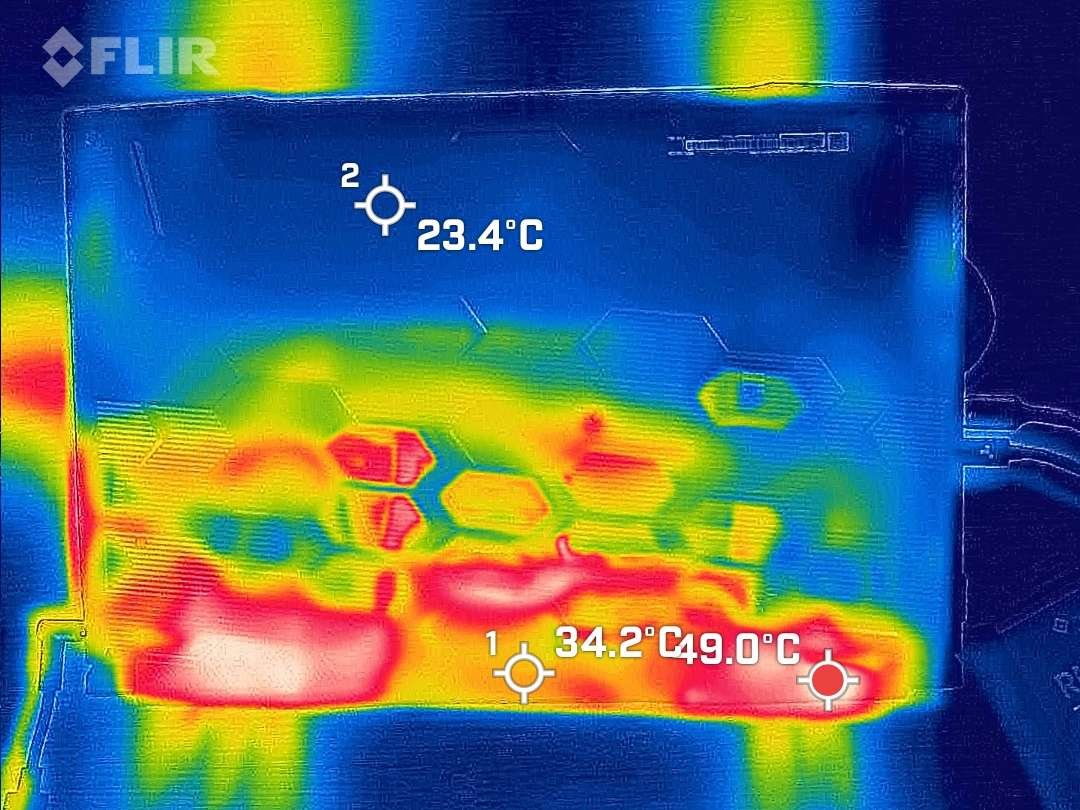
Temperaturer
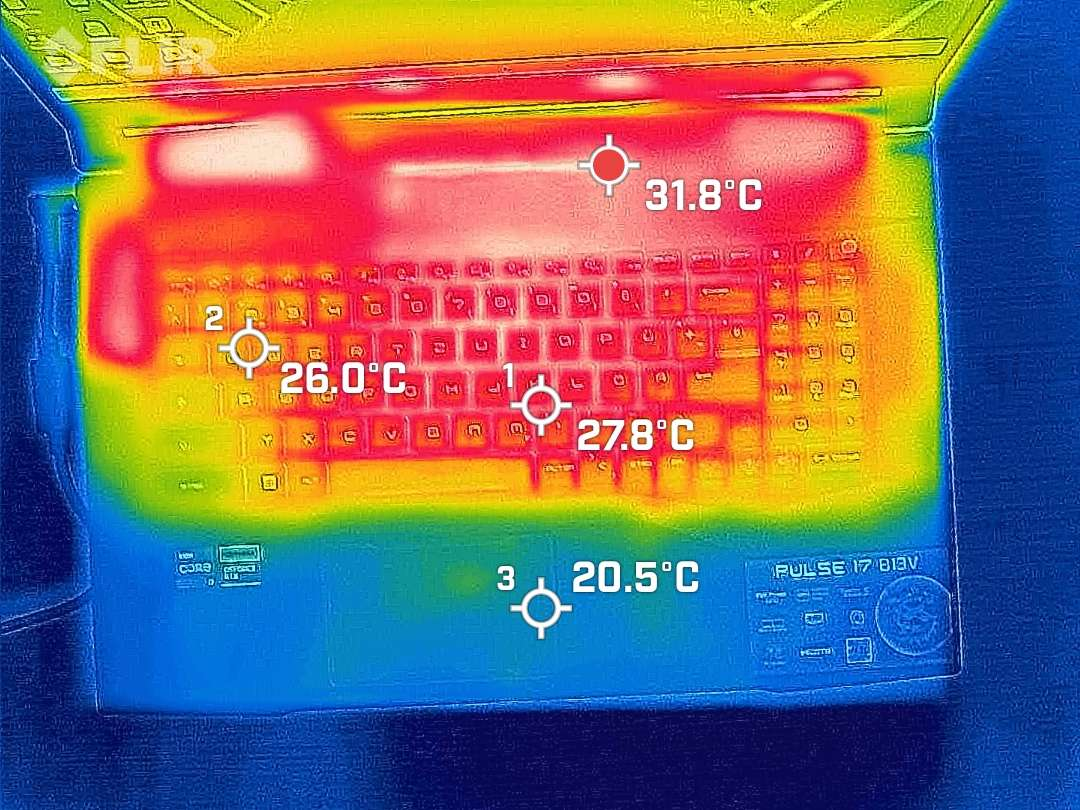
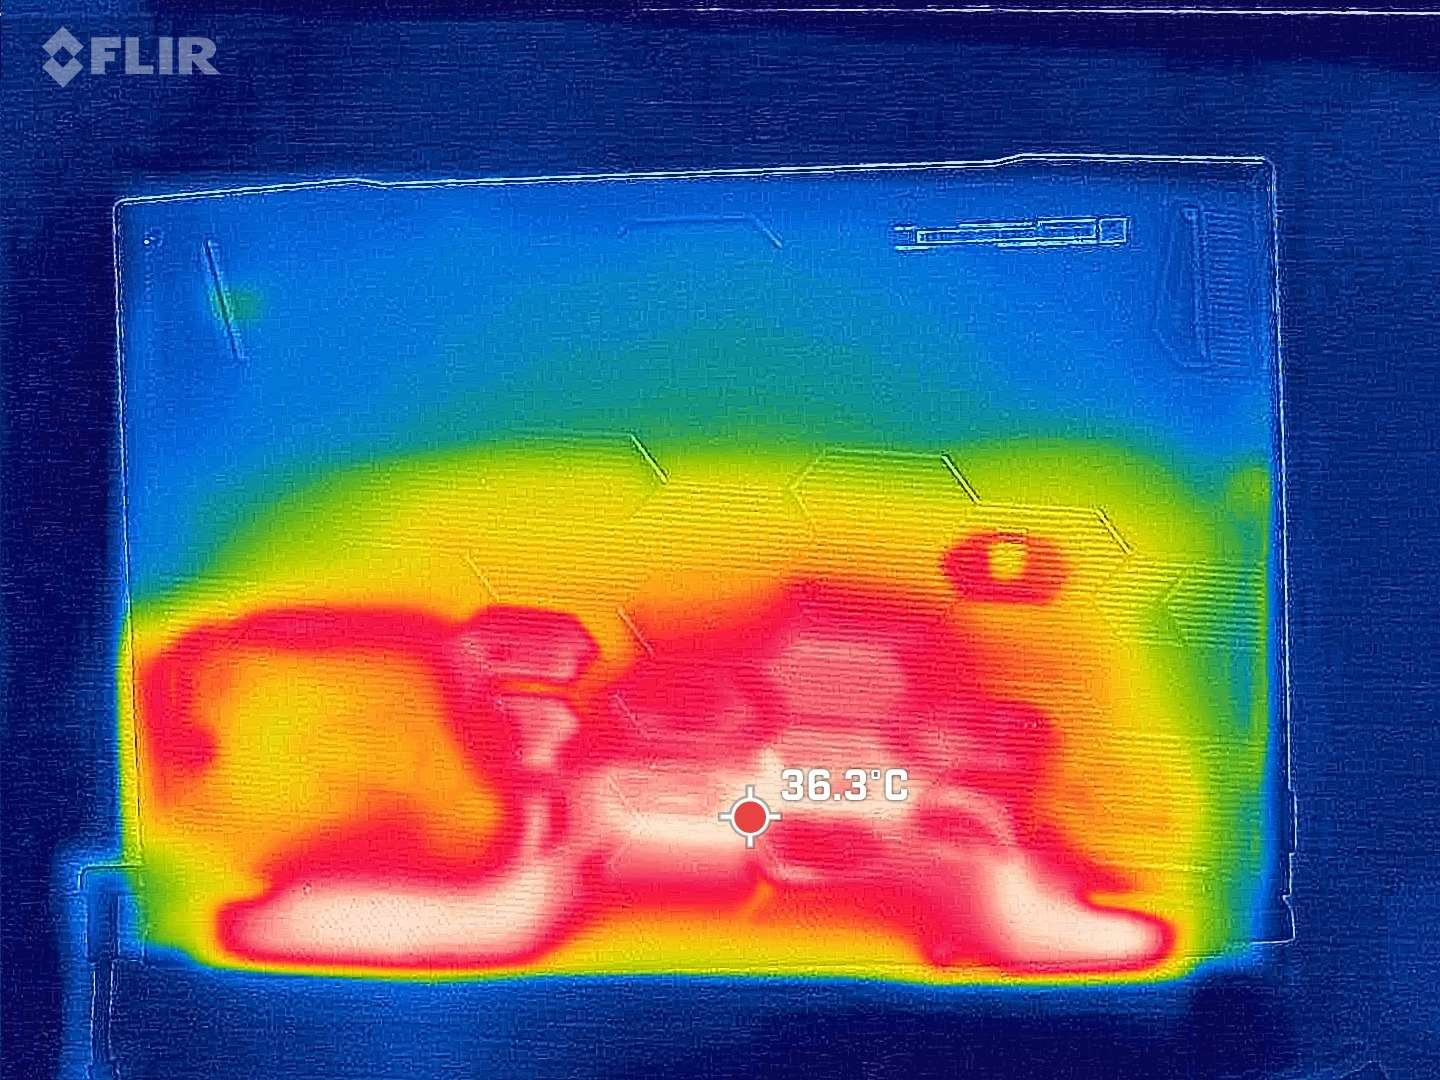
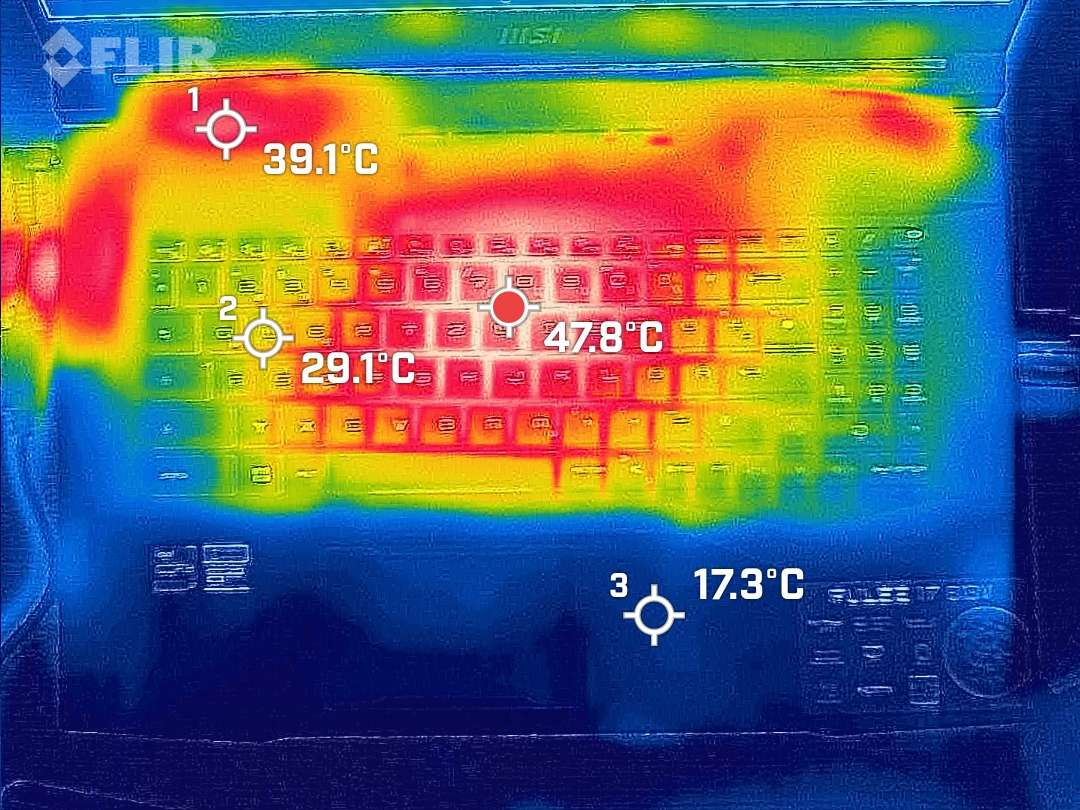
I vår testenhet är yttemperaturerna på handflatorna genomgående svala och bara knappt högre än rumstemperatur. Enhetens maximala temperatur är 48 °C (118 °F) och den är spridd över stora områden på bakkanten ovanför och under kylsystemet, samt i mitten av tangentbordet. Temperaturerna ligger dock inom tolerabla intervall i de områden som är viktiga för spel samt längst ner på den högpresterande bärbara speldatorn.
(-) Den maximala temperaturen på ovansidan är 48 °C / 118 F, jämfört med genomsnittet av 40.4 °C / 105 F , allt från 21.2 till 68.8 °C för klassen Gaming.
(-) Botten värms upp till maximalt 50 °C / 122 F, jämfört med genomsnittet av 43.2 °C / 110 F
(+) Vid tomgångsbruk är medeltemperaturen för ovansidan 27.8 °C / 82 F, jämfört med enhetsgenomsnittet på 33.9 °C / ### class_avg_f### F.
(±) När du spelar The Witcher 3 är medeltemperaturen för ovansidan 37 °C / 99 F, jämfört med enhetsgenomsnittet på 33.9 °C / ## #class_avg_f### F.
(+) Handledsstöden och pekplattan är kallare än hudtemperaturen med maximalt 24 °C / 75.2 F och är därför svala att ta på.
(+) Medeltemperaturen för handledsstödsområdet på liknande enheter var 28.8 °C / 83.8 F (+4.8 °C / 8.6 F).
| MSI Pulse 17 B13VGK Intel Core i7-13700H, NVIDIA GeForce RTX 4070 Laptop GPU | |
|---|---|
| Heat | |
| Maximum Upper Side * (°C) | 48 |
| Maximum Bottom * (°C) | 50 |
| Idle Upper Side * (°C) | 30 |
| Idle Bottom * (°C) | 33 |
* ... mindre är bättre
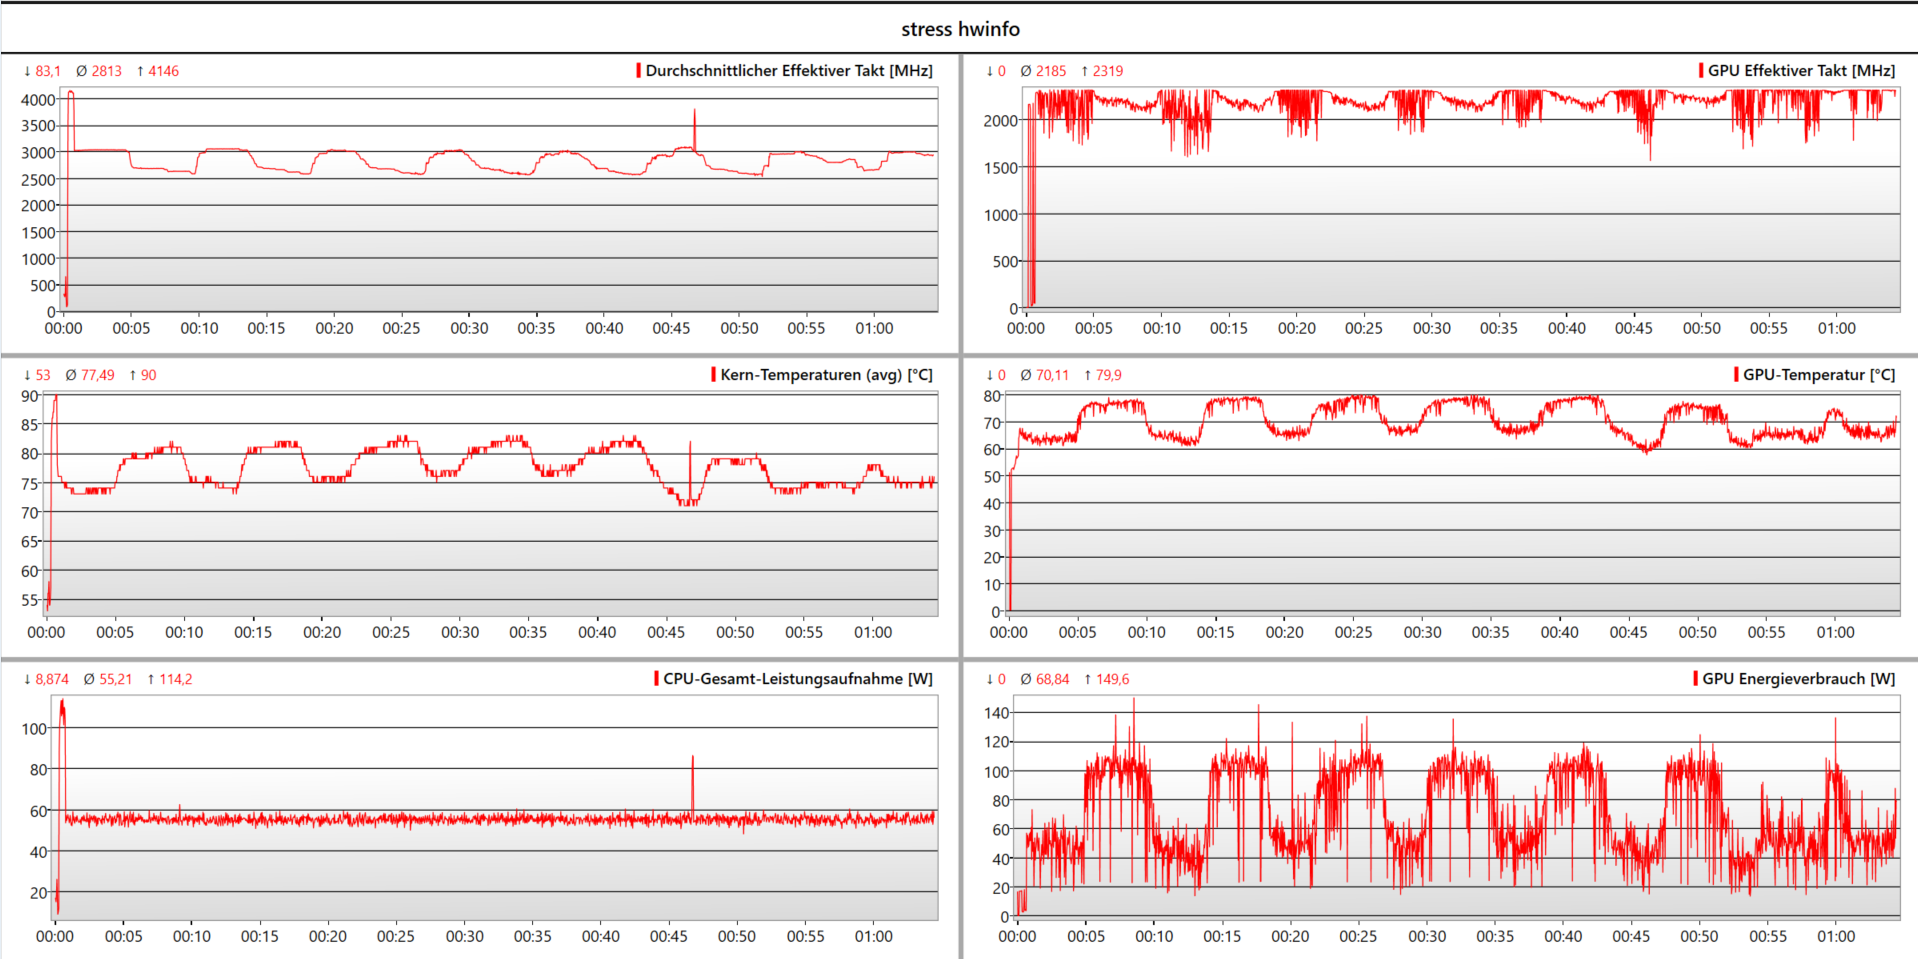
Stresstest
Vi kör stresstestet på den nästan nya MSI Pulse 17. Tydligen är måltemperaturen för GPU: n cirka 80 °C (176 °F). Så snart detta värde uppnås stryps prestandan tills GPU: n har svalnat lite. Detta orsakar några vågor i vår logg av stresstestet med Prime95 och Furmark. Efter sin korta boostfas kör Core i7 konstant på cirka 55 watt. RTX 4070 måste upprepade gånger strypa från till 110 watt ner till 50 watt. I de senare delarna av vårt test av MSI Pulse 17 har den bärbara datorns effektkontroll stabiliserats avsevärt, så att vi kan anta en viss inlärningseffekt här.
Högtalare
Det överbetonade mellanregistret gör att MSI Pulse 17 låter lite burkigt. Men med upp till 85 dB(A) är de små högtalarna relativt högljudda och kan lätt överrösta de tysta fläktarna i den här bärbara speldatorn. De som inte gillar högtalarna kan ansluta externa enheter via Bluetooth eller 3,5 mm-ljudporten.
MSI Pulse 17 B13VGK ljudanalys
(+) | högtalare kan spela relativt högt (85.01 dB)
Bas 100 - 315 Hz
(±) | reducerad bas - i genomsnitt 13.2% lägre än medianen
(±) | linjäriteten för basen är genomsnittlig (12.3% delta till föregående frekvens)
Mellan 400 - 2000 Hz
(±) | högre mellan - i genomsnitt 9.4% högre än median
(+) | mids är linjära (5.7% delta till föregående frekvens)
Högsta 2 - 16 kHz
(+) | balanserade toppar - endast 2.9% från medianen
(+) | toppar är linjära (6.7% delta till föregående frekvens)
Totalt 100 - 16 000 Hz
(±) | linjäriteten för det totala ljudet är genomsnittlig (15.8% skillnad mot median)
Jämfört med samma klass
» 37% av alla testade enheter i den här klassen var bättre, 7% liknande, 56% sämre
» Den bästa hade ett delta på 6%, genomsnittet var 18%, sämst var 132%
Jämfört med alla testade enheter
» 24% av alla testade enheter var bättre, 5% liknande, 70% sämre
» Den bästa hade ett delta på 4%, genomsnittet var 23%, sämst var 134%
Apple MacBook Pro 16 2021 M1 Pro ljudanalys
(+) | högtalare kan spela relativt högt (84.7 dB)
Bas 100 - 315 Hz
(+) | bra bas - bara 3.8% från medianen
(+) | basen är linjär (5.2% delta till föregående frekvens)
Mellan 400 - 2000 Hz
(+) | balanserad mellan - endast 1.3% från medianen
(+) | mids är linjära (2.1% delta till föregående frekvens)
Högsta 2 - 16 kHz
(+) | balanserade toppar - endast 1.9% från medianen
(+) | toppar är linjära (2.7% delta till föregående frekvens)
Totalt 100 - 16 000 Hz
(+) | det totala ljudet är linjärt (4.6% skillnad mot median)
Jämfört med samma klass
» 0% av alla testade enheter i den här klassen var bättre, 0% liknande, 100% sämre
» Den bästa hade ett delta på 5%, genomsnittet var 17%, sämst var 45%
Jämfört med alla testade enheter
» 0% av alla testade enheter var bättre, 0% liknande, 100% sämre
» Den bästa hade ett delta på 4%, genomsnittet var 23%, sämst var 134%
Energihantering - 90 Wh-batteri ger lång batteritid
Strömförbrukning
Medan den maximala strömförbrukningen för Pulse 17 under belastning är ganska typisk för laptop-klassen, är vår testenhet ovanligt effektiv för en gaming-laptop under viloläge och även under måttlig belastning.
| Av/Standby | |
| Låg belastning | |
| Hög belastning |
|
Förklaring:
min: | |
| MSI Pulse 17 B13VGK i7-13700H, GeForce RTX 4070 Laptop GPU, Micron 2400 MTFDKBA1T0QFM, IPS, 1920x1080, 17.3" | MSI Pulse GL76 12UGK i7-12700H, GeForce RTX 3070 Laptop GPU, Micron 3400 1TB MTFDKBA1T0TFH, IPS, 1920x1080, 17.3" | MSI Katana 17 B13VFK i7-13620H, GeForce RTX 4060 Laptop GPU, Micron 2400 MTFDKBA1T0QFM, IPS LED, 1920x1080, 17.3" | Acer Nitro 17 AN17-51-71ER i7-13700H, GeForce RTX 4060 Laptop GPU, Samsung PM9A1 MZVL21T0HCLR, , 2560x1440, 17.3" | Schenker XMG Focus 17 (E23) i9-13900HX, GeForce RTX 4070 Laptop GPU, Crucial P5 Plus 1TB CT1000P5PSSD8, IPS, 2560x1440, 17.3" | Asus ROG Strix G17 G713PI R9 7945HX, GeForce RTX 4070 Laptop GPU, WD PC SN560 SDDPNQE-1T00, IPS, 2560x1440, 17.3" | Genomsnitt NVIDIA GeForce RTX 4070 Laptop GPU | Genomsnitt av klass Gaming | |
|---|---|---|---|---|---|---|---|---|
| Power Consumption | -45% | -26% | -18% | -97% | -75% | -58% | -66% | |
| Idle Minimum * (Watt) | 9 | 12.4 -38% | 12.2 -36% | 8.3 8% | 17 -89% | 15 -67% | 13.2 ? -47% | 13 ? -44% |
| Idle Average * (Watt) | 10.2 | 13.1 -28% | 14.9 -46% | 13.5 -32% | 18 -76% | 20 -96% | 18.2 ? -78% | 19 ? -86% |
| Idle Maximum * (Watt) | 10.8 | 25.3 -134% | 15.8 -46% | 14.8 -37% | 25.8 -139% | 29 -169% | 24.6 ? -128% | 24.6 ? -128% |
| Load Average * (Watt) | 72 | 105.4 -46% | 85.22 -18% | 77 -7% | 178 -147% | 121 -68% | 97 ? -35% | 110.7 ? -54% |
| Witcher 3 ultra * (Watt) | 130 | 150 -15% | 151.1 -16% | 154 -18% | 265 -104% | 179.8 -38% | ||
| Load Maximum * (Watt) | 221 | 240.5 -9% | 212.8 4% | 263 -19% | 275 -24% | 246 -11% | 221 ? -0% | 259 ? -17% |
* ... mindre är bättre
Power Consumption The Witcher 3 / Stress Test
Power Consumption With External Monitor
Batteritid
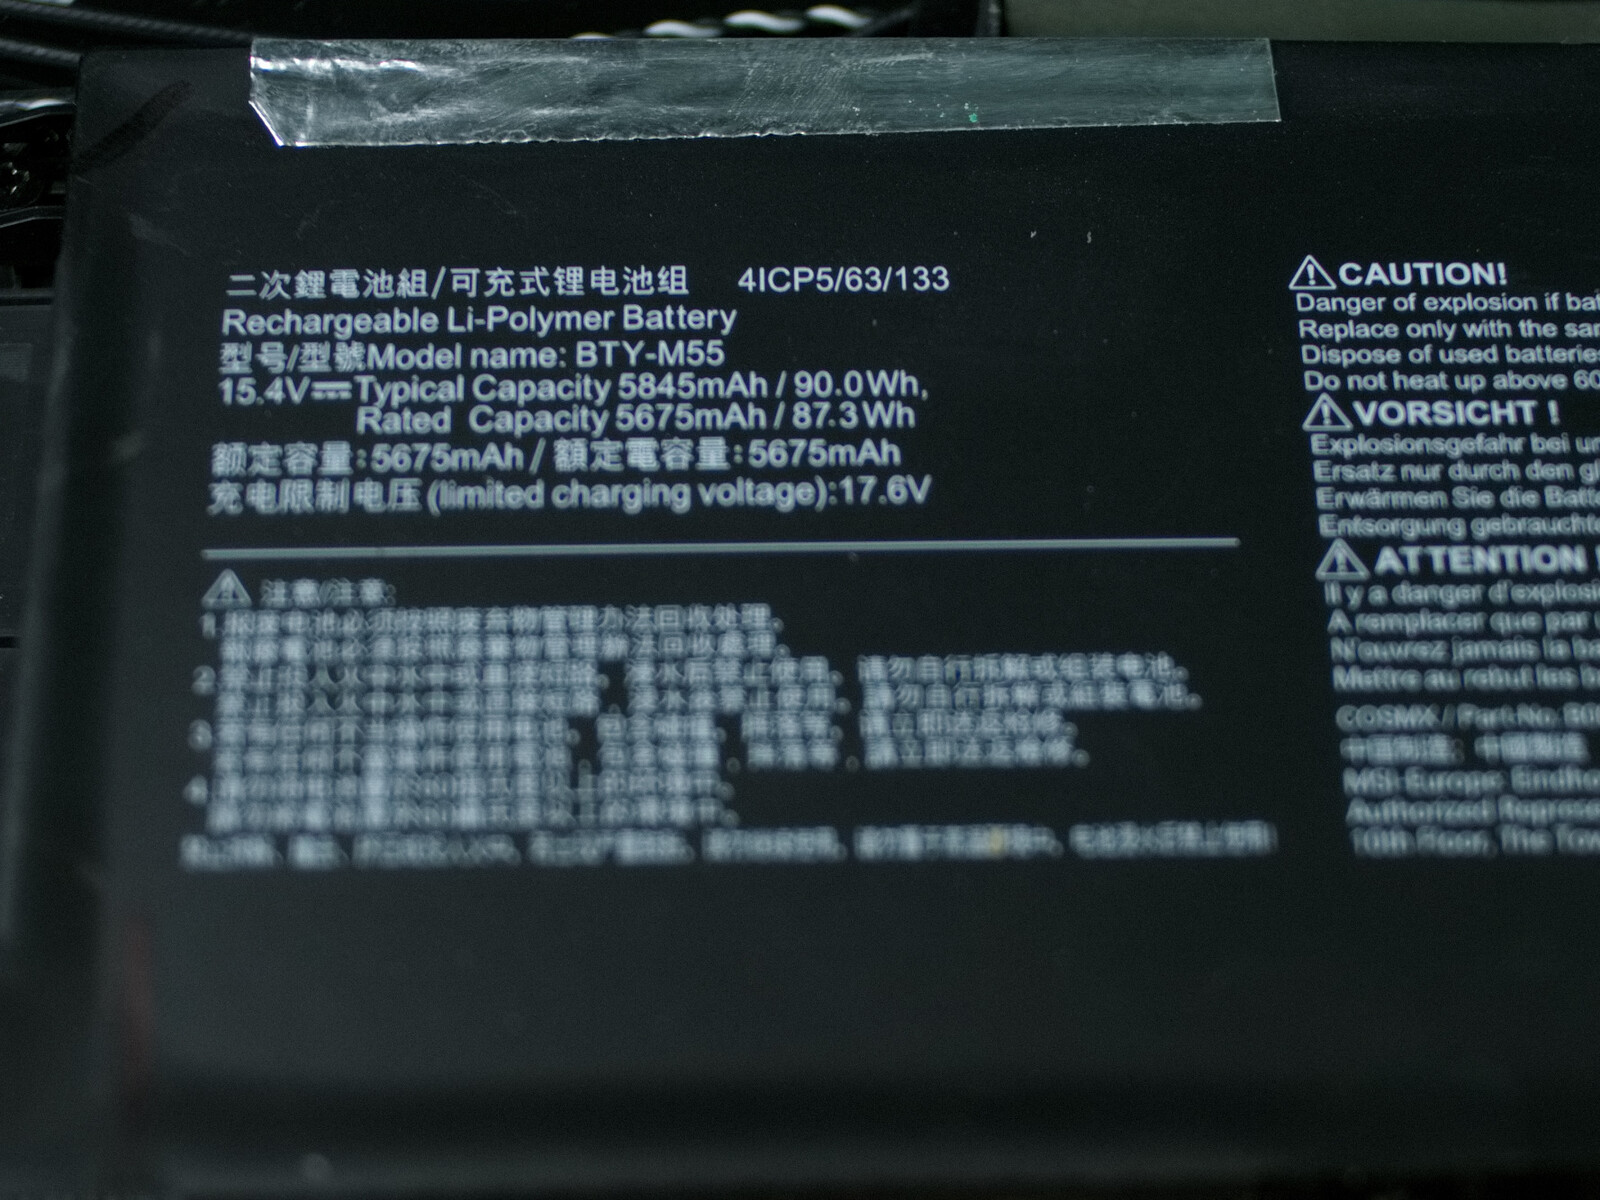
I enlighet med våra mätningar av strömförbrukningen är det inte heller förvånande att den bärbara speldatorn håller länge med sitt 90-Wh-batteri i vårt WiFi-webbsurfningstest och når nästan 9 timmar här. Även under belastning räcker batteriet i drygt 2 timmar.
| MSI Pulse 17 B13VGK i7-13700H, GeForce RTX 4070 Laptop GPU, 90 Wh | MSI Pulse GL76 12UGK i7-12700H, GeForce RTX 3070 Laptop GPU, 90 Wh | MSI Katana 17 B13VFK i7-13620H, GeForce RTX 4060 Laptop GPU, 53.5 Wh | Acer Nitro 17 AN17-51-71ER i7-13700H, GeForce RTX 4060 Laptop GPU, 90 Wh | Schenker XMG Focus 17 (E23) i9-13900HX, GeForce RTX 4070 Laptop GPU, 73 Wh | Asus ROG Strix G17 G713PI R9 7945HX, GeForce RTX 4070 Laptop GPU, 90 Wh | Genomsnitt av klass Gaming | |
|---|---|---|---|---|---|---|---|
| Batteridrifttid | -20% | -62% | -9% | -57% | -54% | -27% | |
| WiFi v1.3 (h) | 9 | 5.9 -34% | 2.9 -68% | 8.2 -9% | 3.9 -57% | 4.3 -52% | 7.11 ? -21% |
| Load (h) | 2.2 | 2.1 -5% | 1 -55% | 1 -55% | 1.502 ? -32% | ||
| Reader / Idle (h) | 7.3 | 8.27 ? | |||||
| H.264 (h) | 6.9 | 3.1 | 2.8 | 8.32 ? | |||
| Witcher 3 ultra (h) | 2.5 | 1 | 1.1 |
För
Emot
Omdöme - Mer steam punk än sci-fi
På den positiva sidan av MSI Pulse 17 finns det flera starka punkter som talar för den bärbara datorn, med en optimal prestanda för Core i7och Nvidia GeForce RTX 4070 i första hand. För att uppnå detta behöver Pulse inte ens pulserande fläktar, och den bärbara datorn är särskilt tyst för sin prestandaklass. Andra positiva punkter för den bärbara speldatorn inkluderar ett anständigt tangentbord och bra positionering av de externa anslutningarna. Batteritiden är också utmärkt för en gaming-laptop.
Pulse 17 är en bärbar speldator som kan erbjuda en kraftfull prestanda till en låg ljudnivå. Å andra sidan har enheten inte riktigt anlänt till år 2023 i många andra aspekter.
Tyvärr kommer den bärbara datorn också med några rejäla nackdelar. Bortsett från MSI Katana 17 har ingen annan bärbar dator i vår jämförelse en så dålig skärm. Anslutningsutrustningen med långsamma USB 2.0- och USB 3.2 Gen 1-portar och 1 GBit/s LAN samt avsaknaden av 6 GHz Wi-Fi presenterar inte heller den bärbara speldatorn som en avancerad enhet. Men det som verkligen är irriterande är den blockerade M.2 NVMe-porten, eftersom tillverkaren kunde ha undvikit detta på två sätt. För det första skulle moderkortet och höljet ha lämnat tillräckligt med utrymme för att flytta modulen något åt vänster för att ge lite utrymme för batteriet. Och för det andra kunde de onödigt bortkastade PCIe-banorna också ha investerats i en Thunderbolt-port.
Även om den nuvarande modellen, jämfört med föregångaren, nu erbjuder stöd för G-Sync, MUX och Advanced Optimus, saknar den fortfarande Thunderbolt. Dessutom var skärmen på föregångaren betydligt bättre enligt våra mätningar.
Till gatupriser från 2 150 euro (~ 2 415 dollar) vid tidpunkten för vårt test finns det många (i delar också betydligt billigare) bärbara datorer som alternativ till vår testenhet. Priset du betalar tillverkaren för Asus ROG Stix G17 är på samma nivå som för MSI-enheten från många leverantörer. Även om du måste göra några tunga kompromisser i batteritiden med den bärbara datorn från Asus, annars är Pulse 17 och ROG Strix G17 ganska lika inom alla prestandaområden. Å andra sidan är ROG Strix skärm- och anslutningsutrustning betydligt bättre.
Pris och tillgänglighet
MSI Pulse 17 B13VGK är endast tillgänglig från ett fåtal leverantörer i USA såsom Newegg för ~$1963, med fler leverantörer som erbjuder det i Storbritannien, Australieneller Kanadatill exempel.
MSI Pulse 17 B13VGK
- 07/16/2023 v7 (old)
Marc Herter
Genomskinlighet
Valet av enheter som ska granskas görs av vår redaktion. Testprovet gavs till författaren som ett lån av tillverkaren eller återförsäljaren för denna recension. Långivaren hade inget inflytande på denna recension och inte heller fick tillverkaren en kopia av denna recension innan publiceringen. Det fanns ingen skyldighet att publicera denna recension. Som ett oberoende medieföretag är Notebookcheck inte föremål för auktoritet från tillverkare, återförsäljare eller förlag.
This is how Notebookcheck is testingEvery year, Notebookcheck independently reviews hundreds of laptops and smartphones using standardized procedures to ensure that all results are comparable. We have continuously developed our test methods for around 20 years and set industry standards in the process. In our test labs, high-quality measuring equipment is utilized by experienced technicians and editors. These tests involve a multi-stage validation process. Our complex rating system is based on hundreds of well-founded measurements and benchmarks, which maintains objectivity.
Price comparison

