Recension av den bärbara datorn Asus ROG Strix Scar 17 G733PY: Intel är inte längre kung

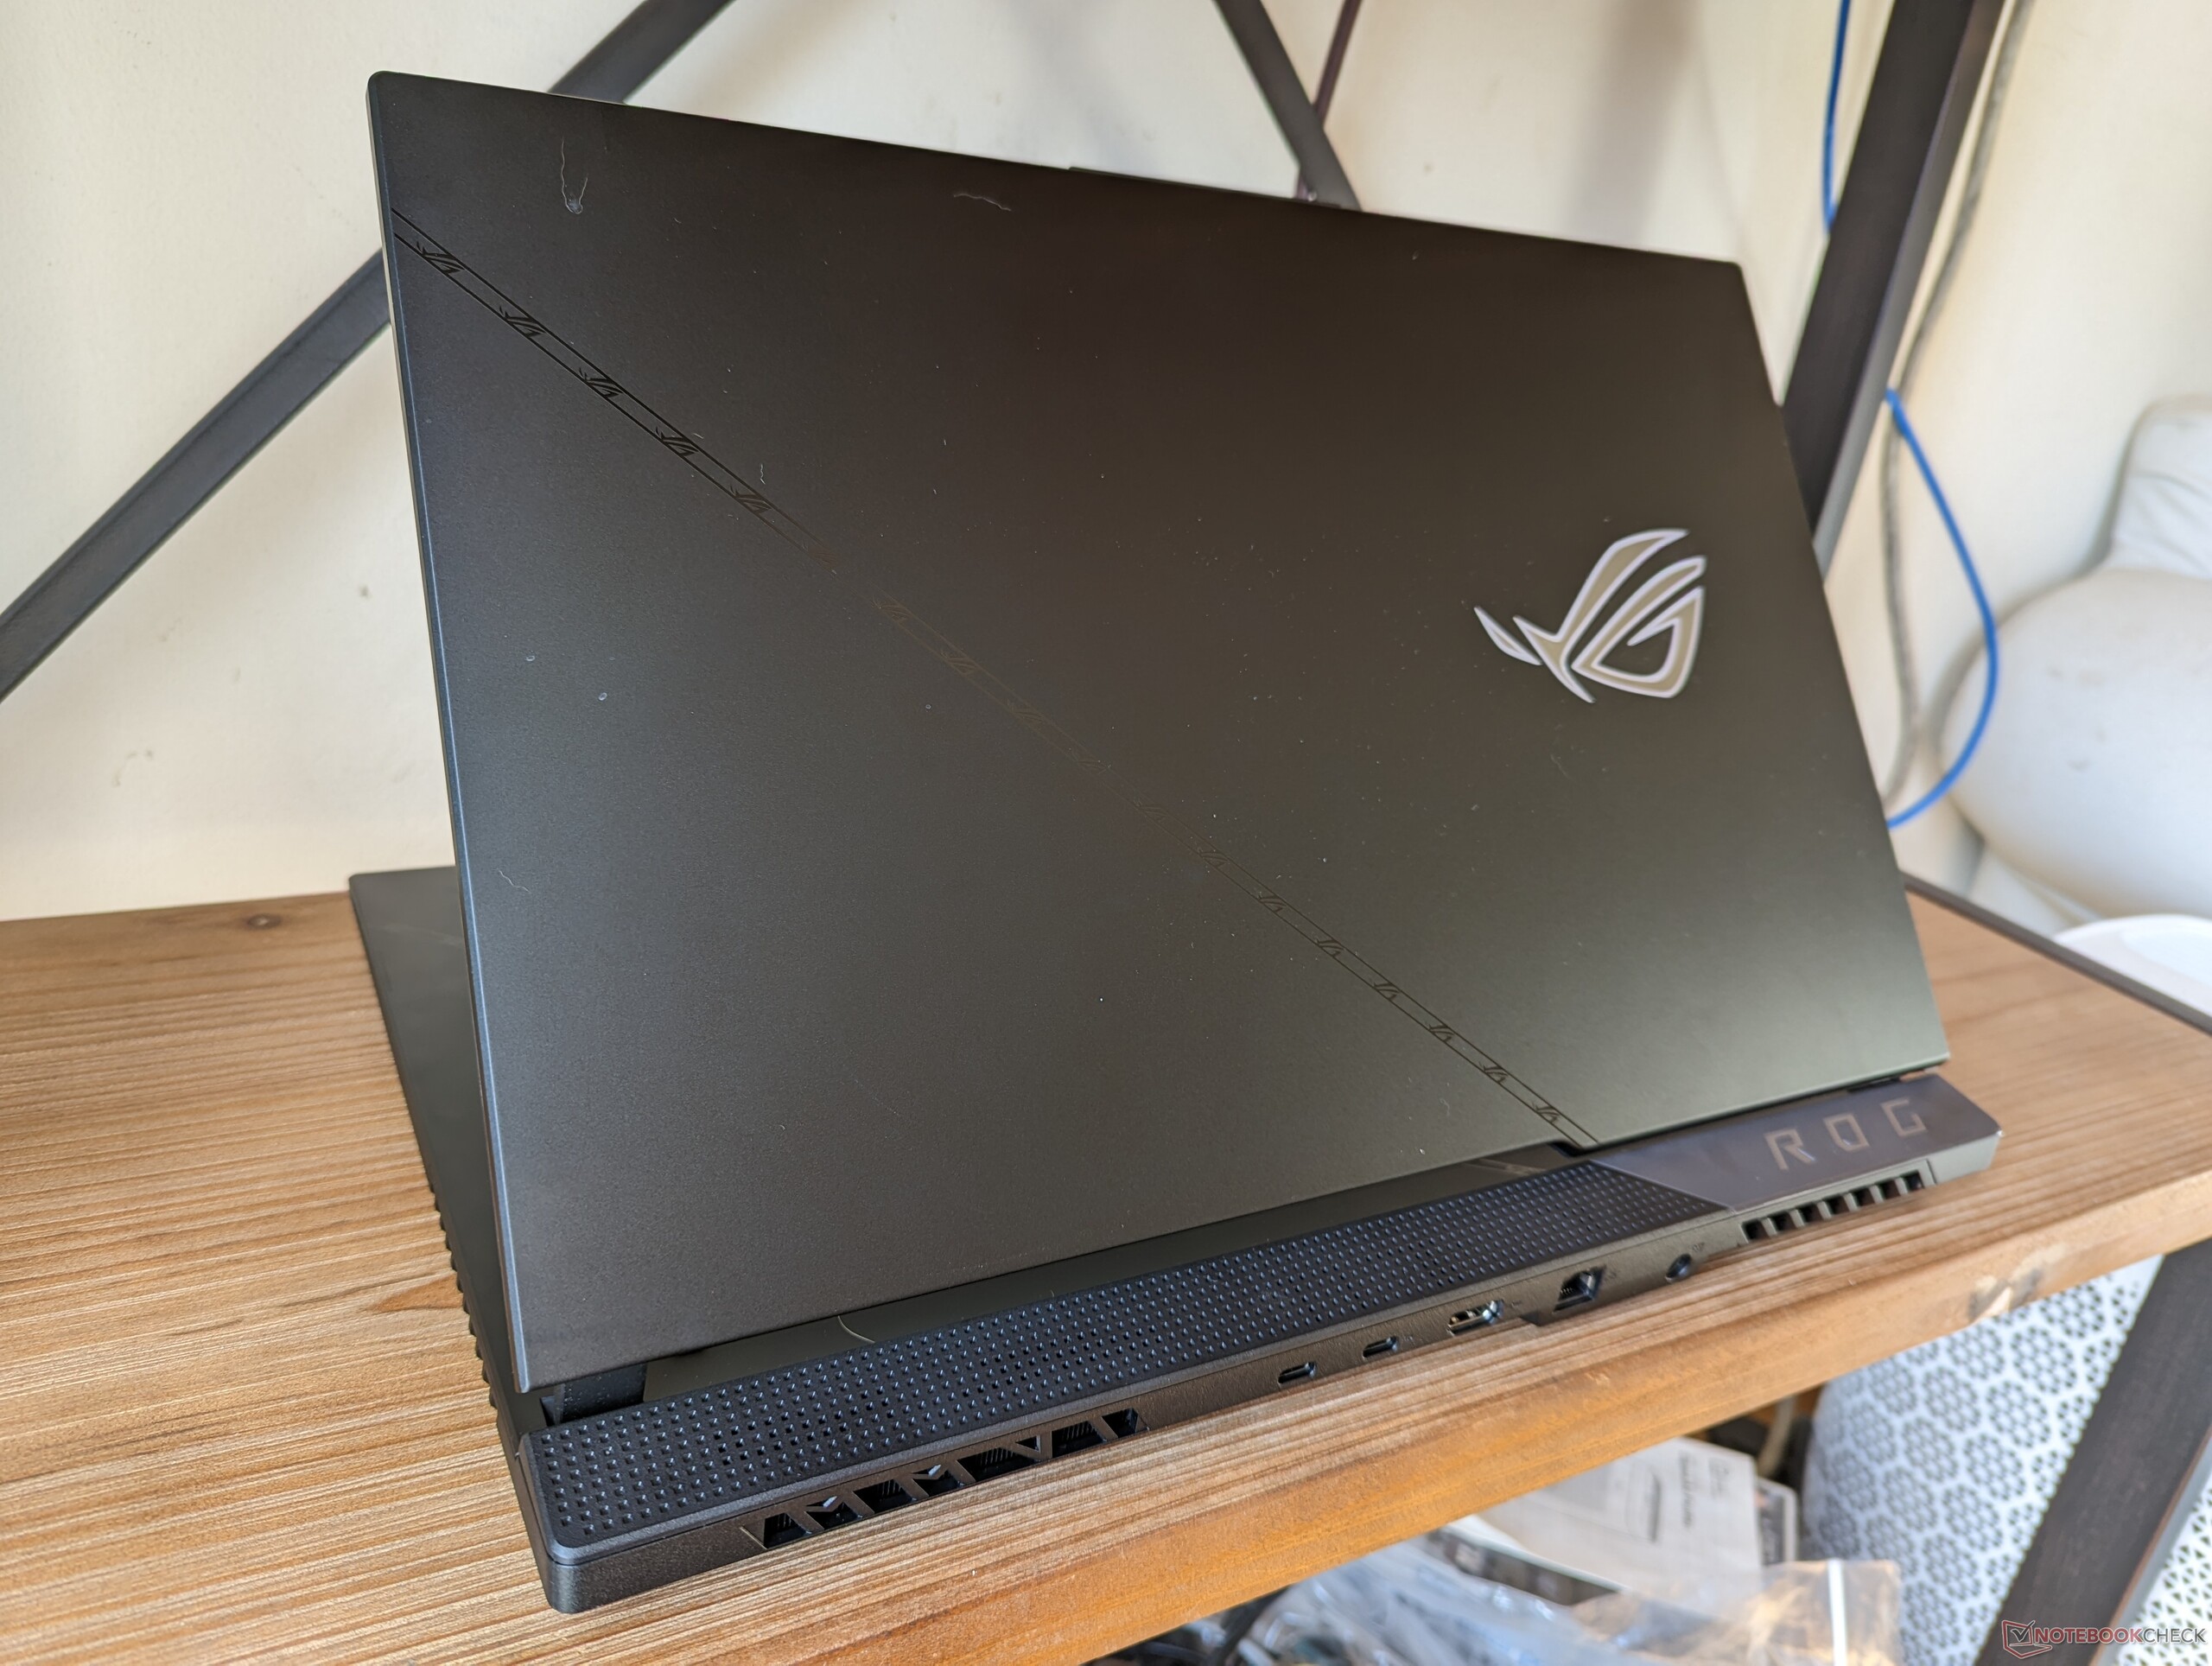
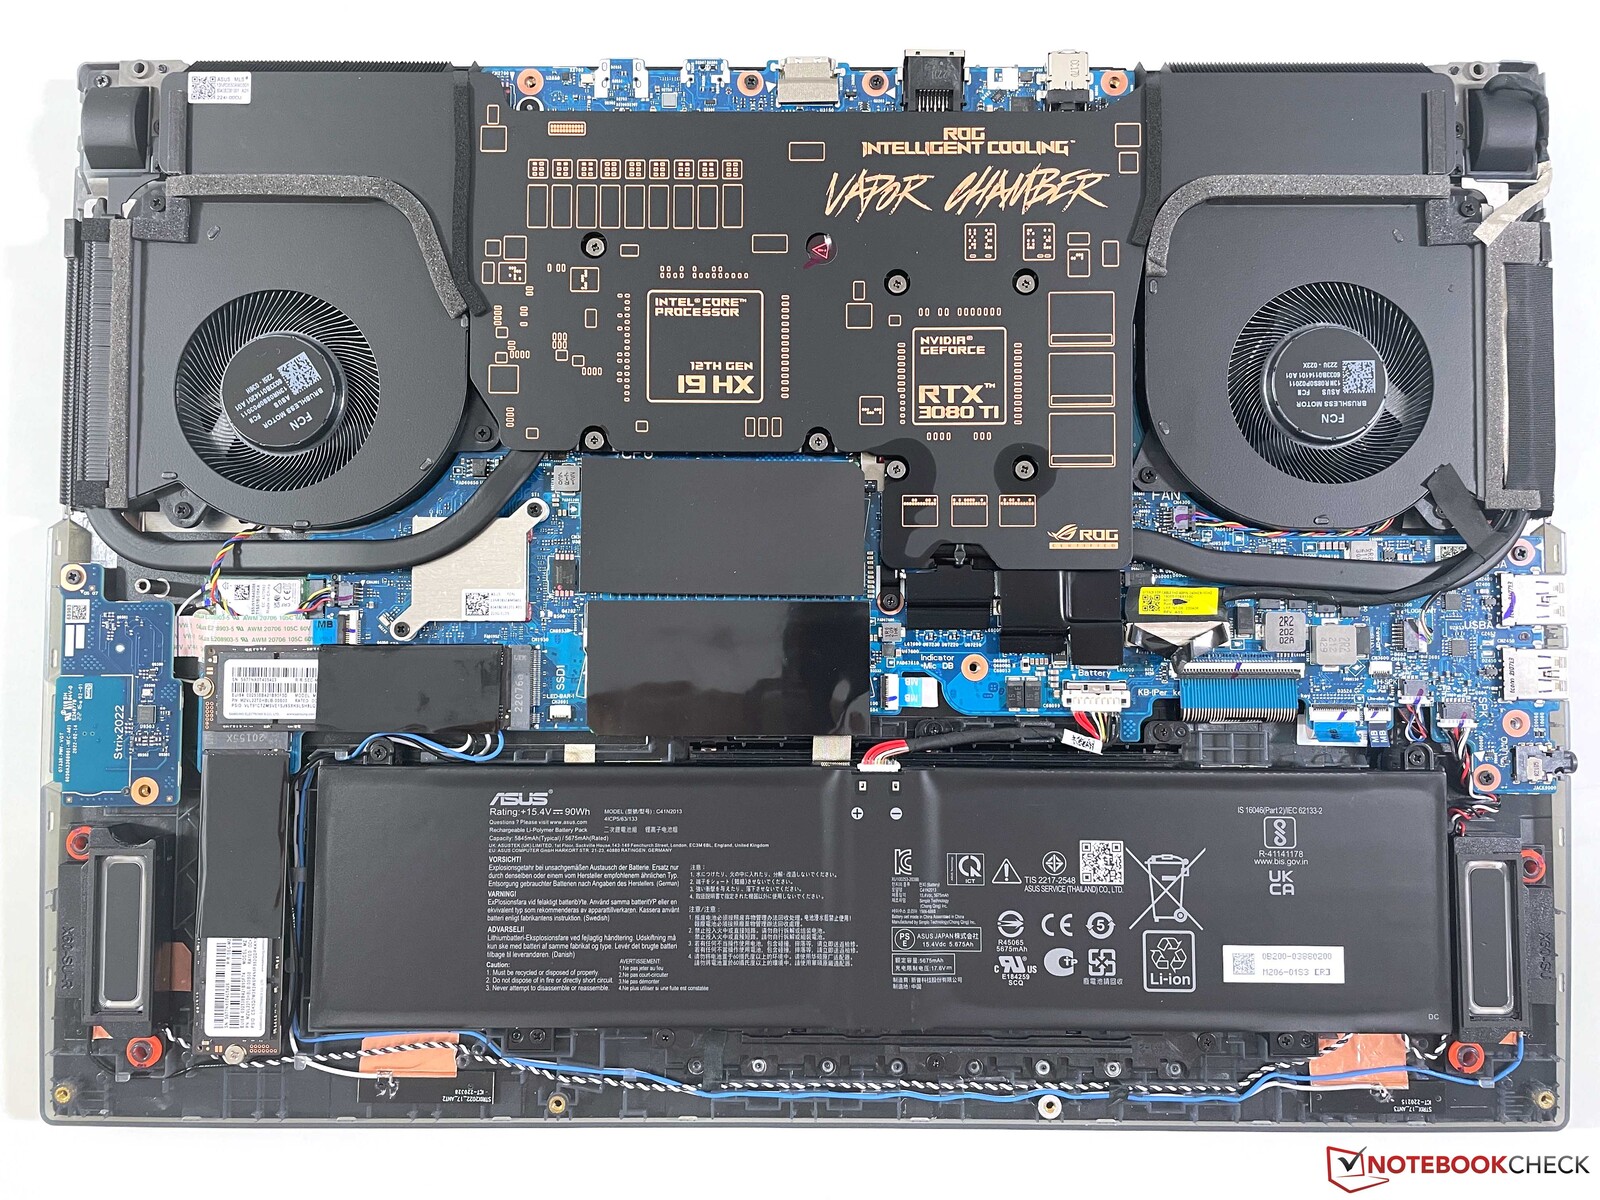
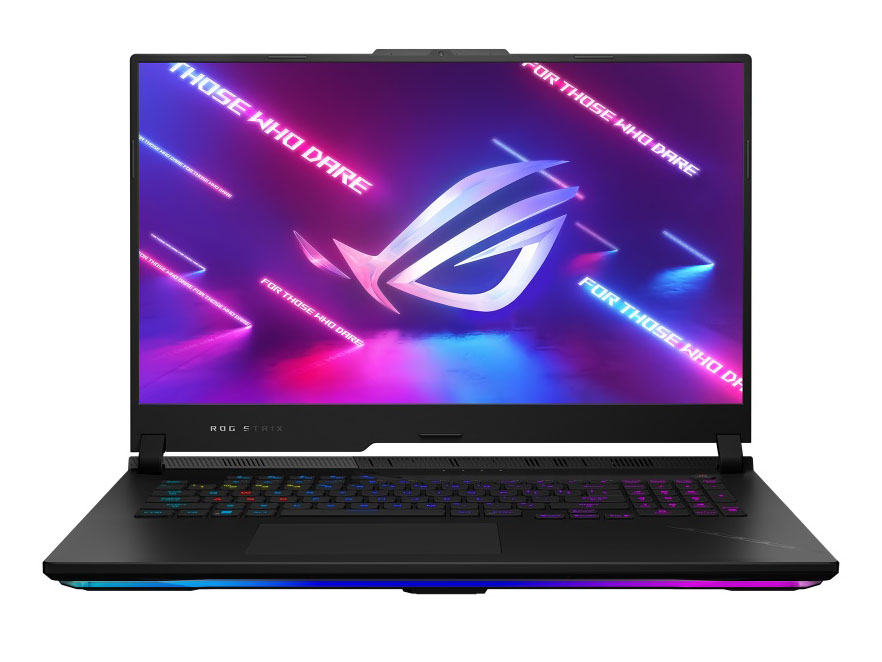
Asus presenterades på CES 2023 och har uppdaterat sin 17,3-tums ROG Strix Scar 17-serie med de senaste 13:e generationens Intel CPU:er, Zen 4 CPU:er från AMD och Nvidia Ada Lovelace GPU:er för att ersätta förra årets sortiment. Förutom dessa interna uppgraderingar förblir dock den externa chassidesignen nästan identisk från år till år. Vi rekommenderar att du kollar in våra befintliga recensioner av 2022 års ROG Strix Scar 17 för att lära dig mer om de fysiska egenskaperna hos 2023 års modell. Eventuella skillnader mellan dem kommer att noteras nedan.
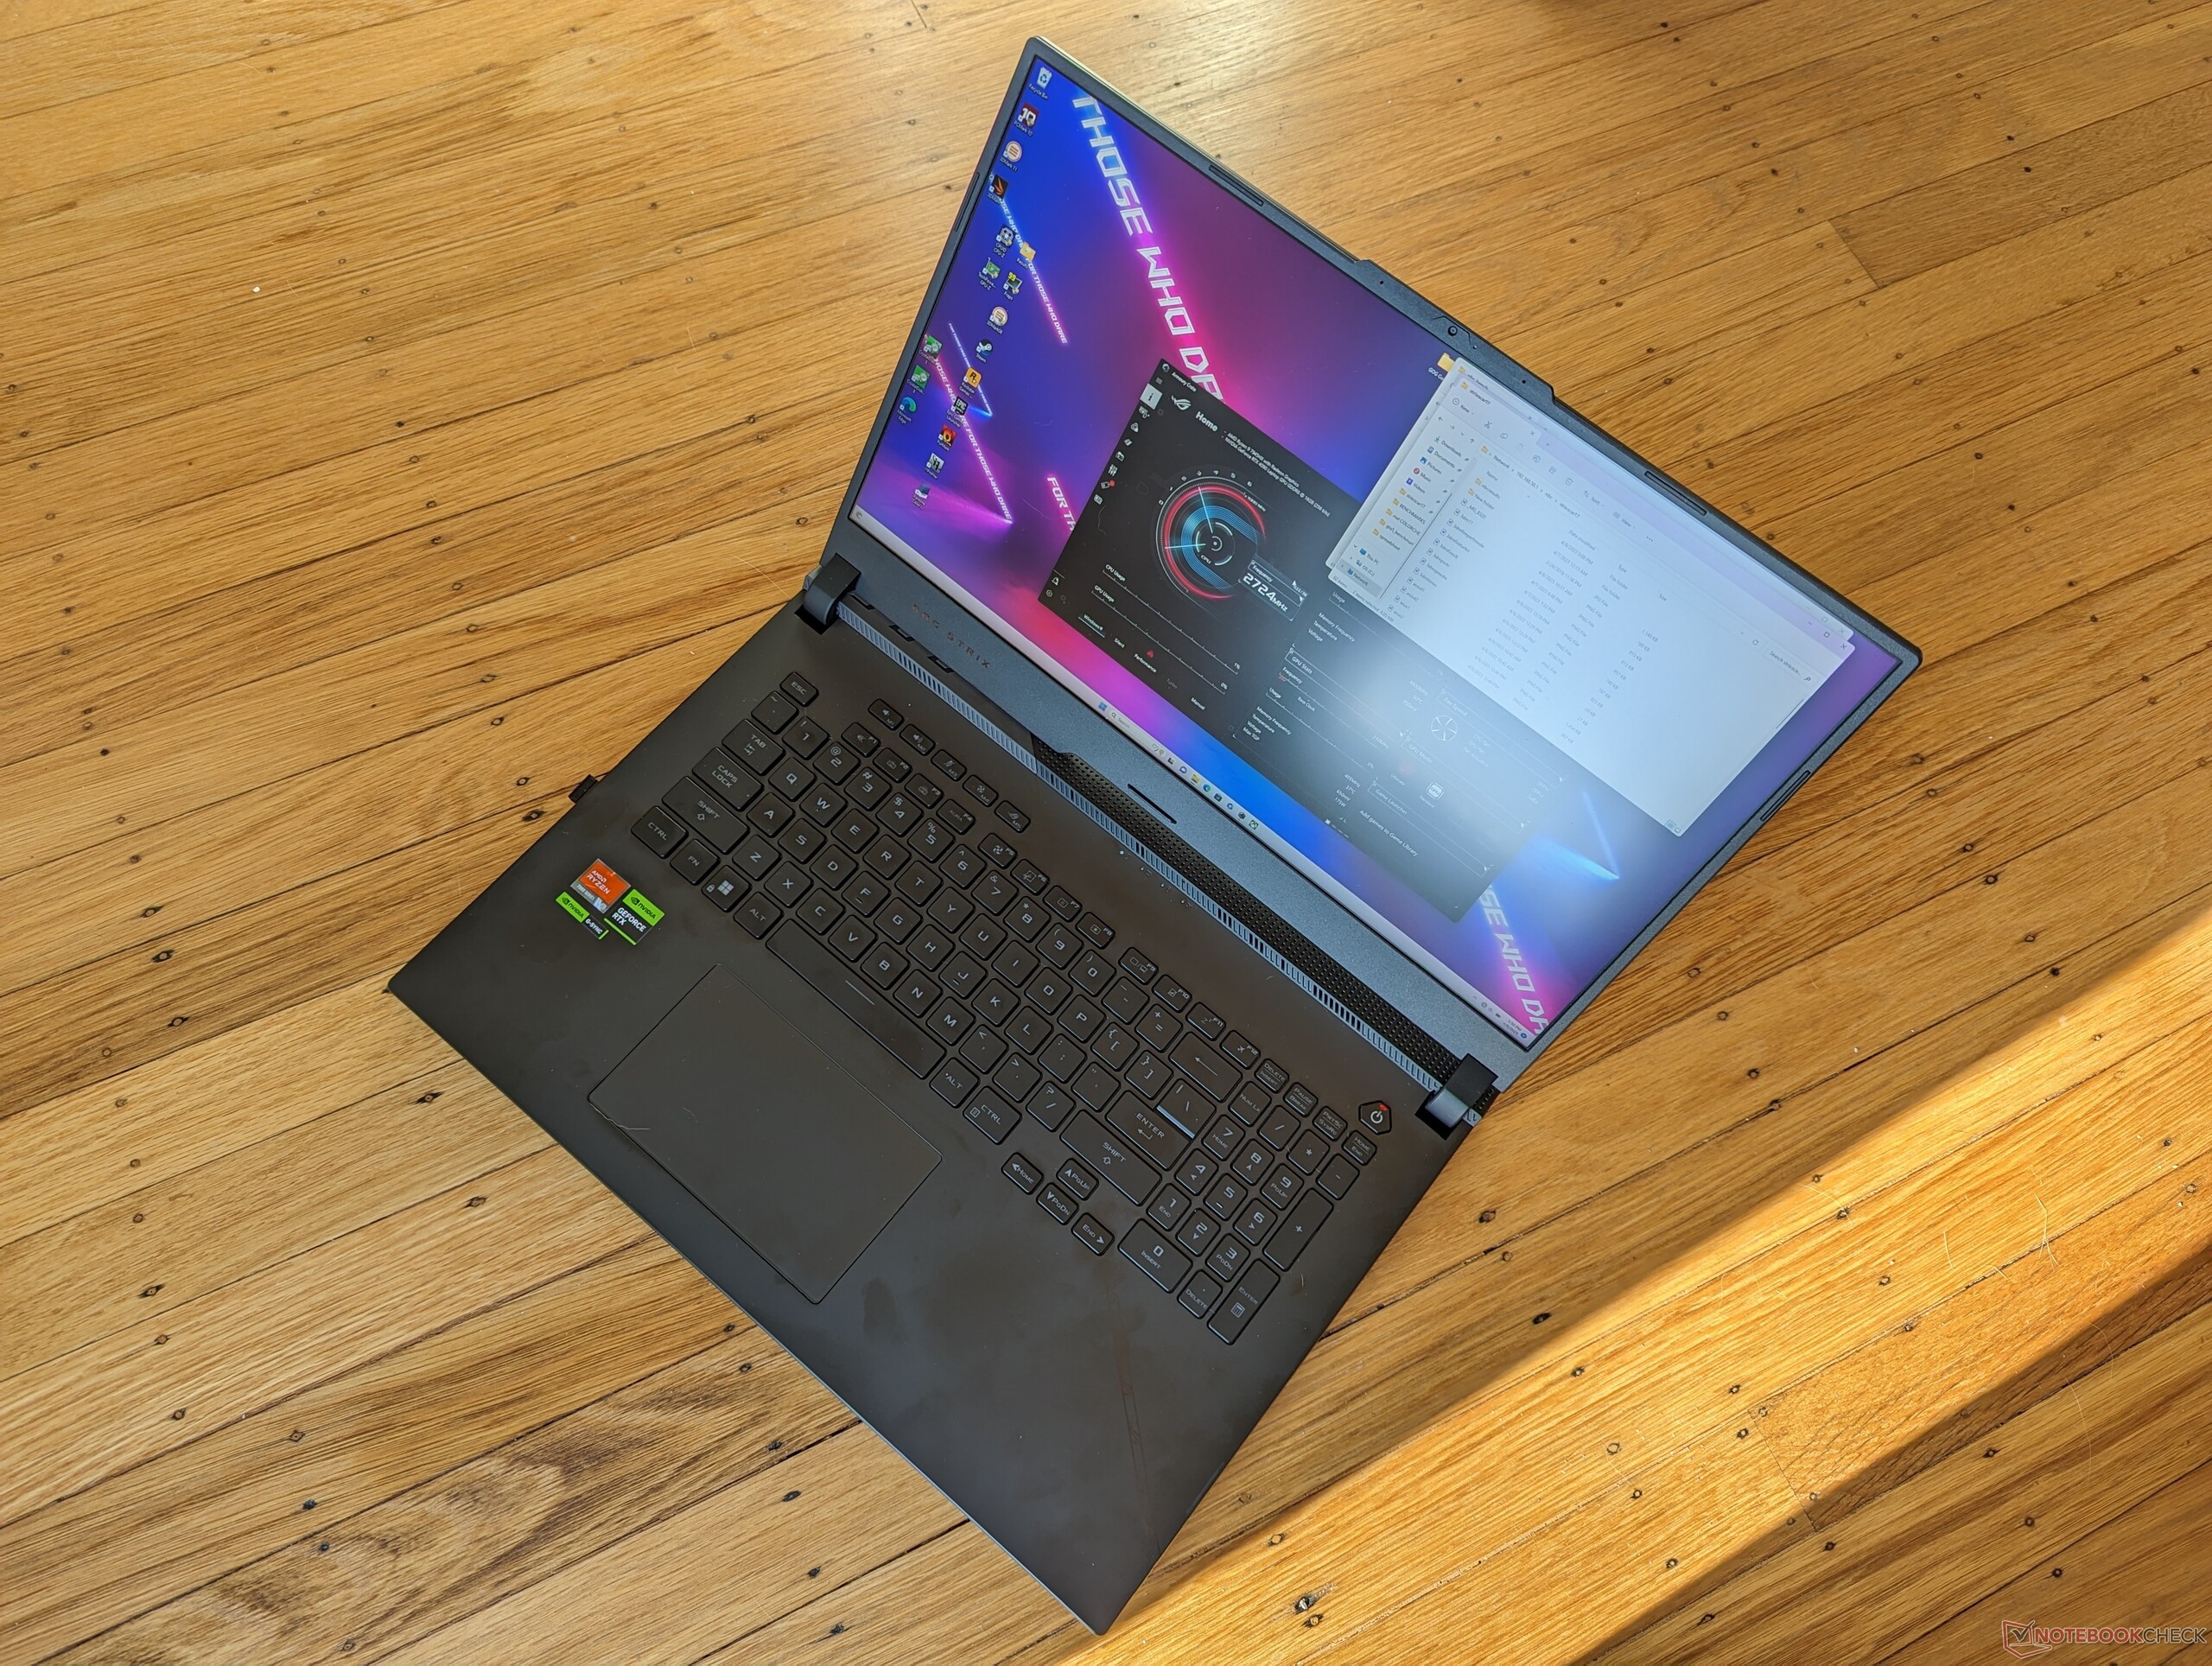
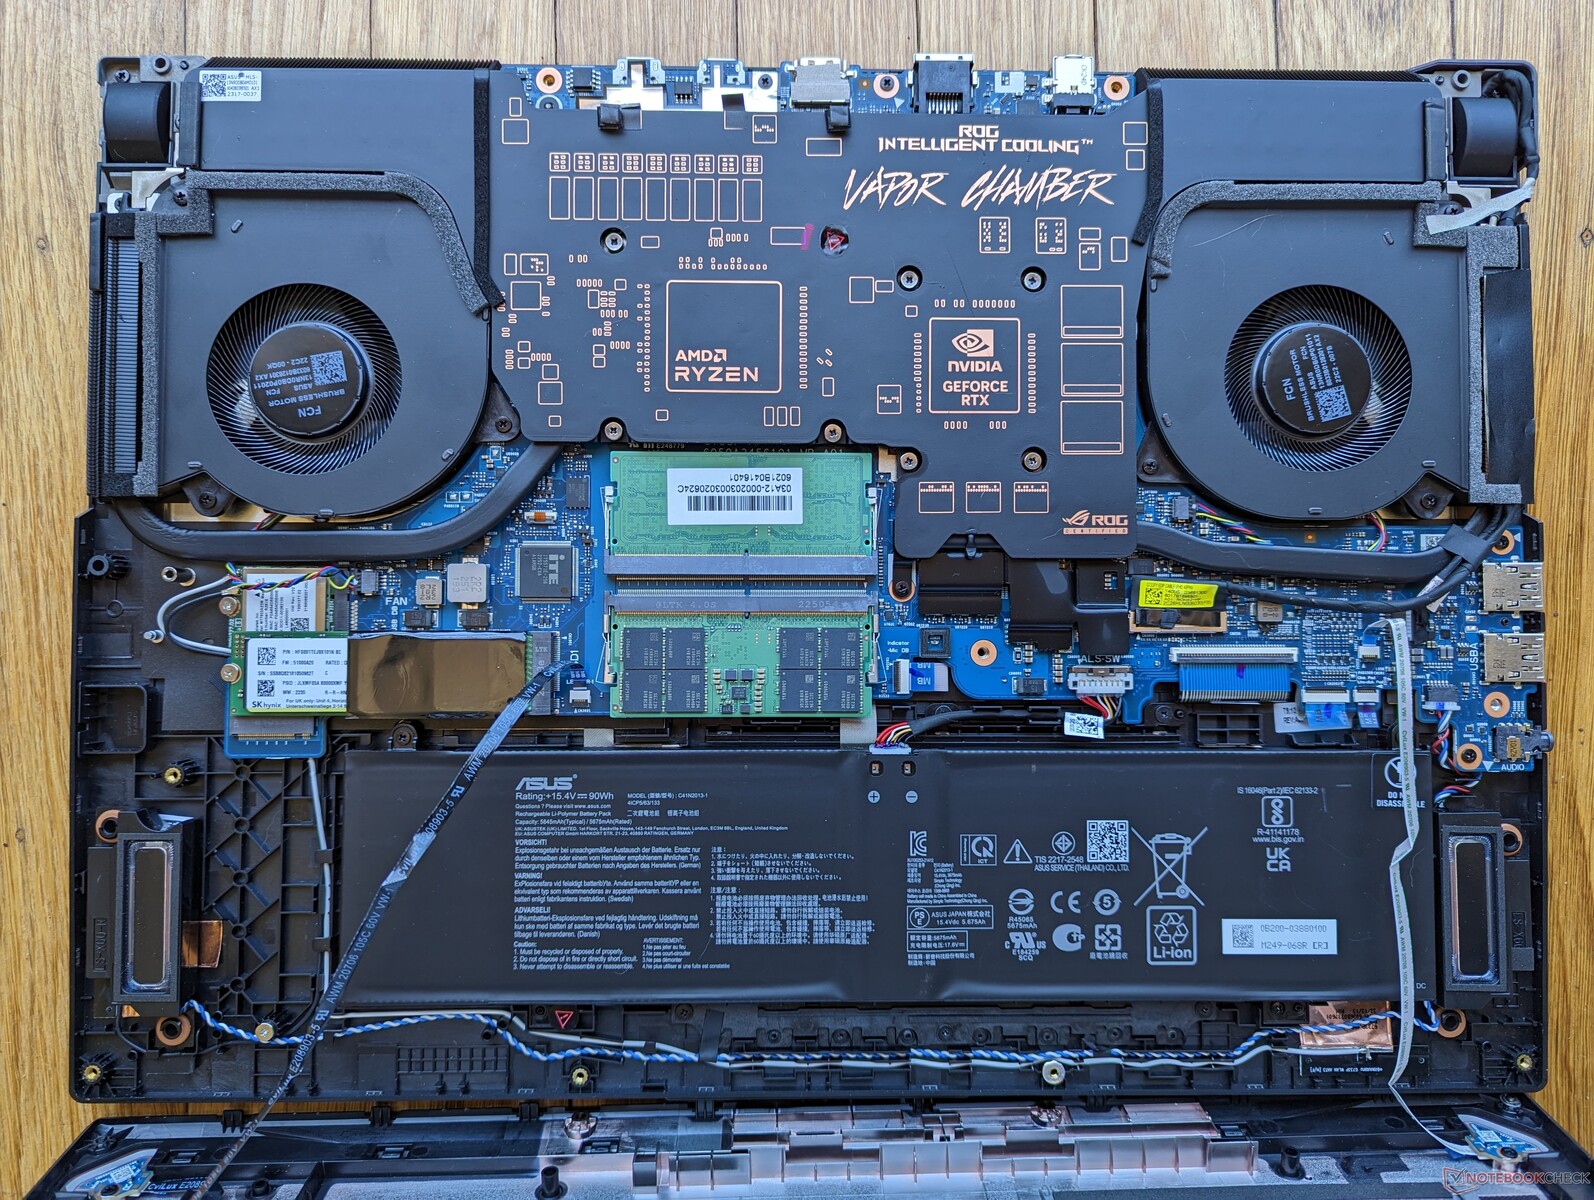
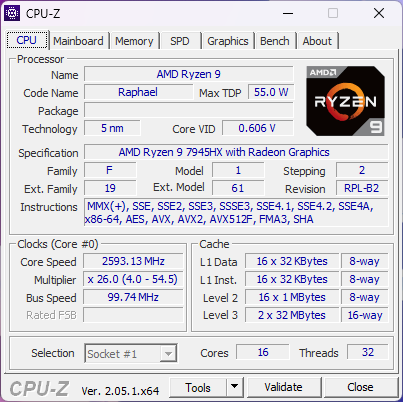
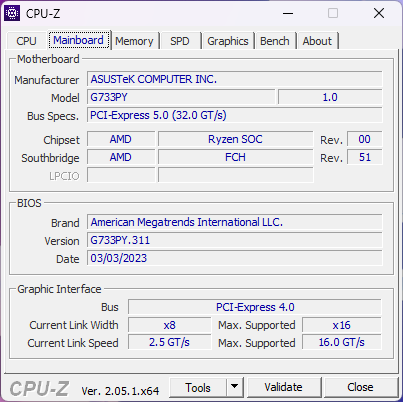
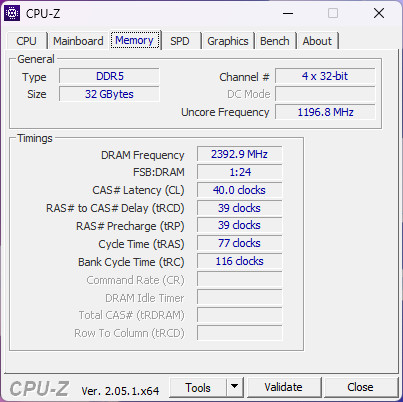
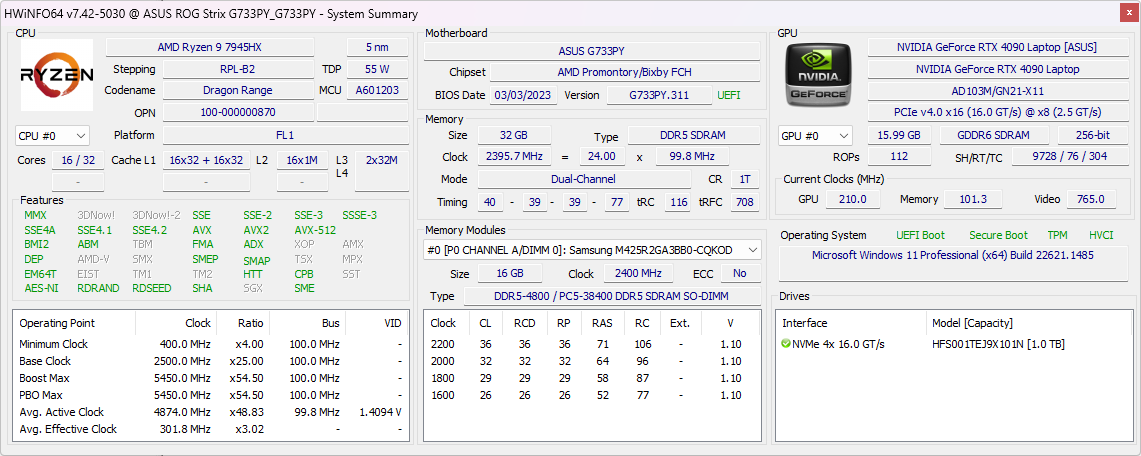
Vår konfiguration i recensionen är den mest avancerade SKU:n utrustad med Ryzen 9 7945HX CPU och 175 W GeForce RTX 4090 GPU. Andra SKU:er finns tillgängliga ner till RTX 4060, men alla har samma 240 Hz 1440p IPS-panel i skrivande stund.
Konkurrenterna till Strix Scar 17 inkluderar andra högklassiga bärbara 17-tums gamingdatorer som t.ex Razer Blade 17, Alienware m17, MSI GE77eller Aorus 17.
Fler recensioner av Asus:
Potentiella konkurrenter i jämförelse
Gradering | Datum | Modell | Vikt | Höjd | Storlek | Upplösning | Pris |
|---|---|---|---|---|---|---|---|
| 88.3 % v7 (old) | 04/2023 | Asus ROG Strix Scar 17 G733PY-XS96 R9 7945HX, GeForce RTX 4090 Laptop GPU | 2.9 kg | 28.3 mm | 17.30" | 2560x1440 | |
| 88.3 % v7 (old) | 03/2023 | MSI GE78HX 13VH-070US i9-13950HX, GeForce RTX 4080 Laptop GPU | 3 kg | 23 mm | 17.00" | 2560x1600 | |
| 89.9 % v7 (old) | 03/2023 | Eluktronics Mech-17 GP2 i9-13900HX, GeForce RTX 4090 Laptop GPU | 2.9 kg | 27 mm | 17.00" | 2560x1600 | |
| 88.4 % v7 (old) | 04/2023 | Asus ROG Strix G17 G713PI R9 7945HX, GeForce RTX 4070 Laptop GPU | 2.8 kg | 30.7 mm | 17.30" | 2560x1440 | |
| 83.7 % v7 (old) | 08/2022 | Aorus 17X XES i9-12900HX, GeForce RTX 3070 Ti Laptop GPU | 2.7 kg | 30 mm | 17.30" | 1920x1080 | |
| 86.1 % v7 (old) | 01/2023 | Alienware m17 R5 (R9 6900HX, RX 6850M XT) R9 6900HX, Radeon RX 6850M XT | 3.4 kg | 26.7 mm | 17.00" | 3840x2160 |
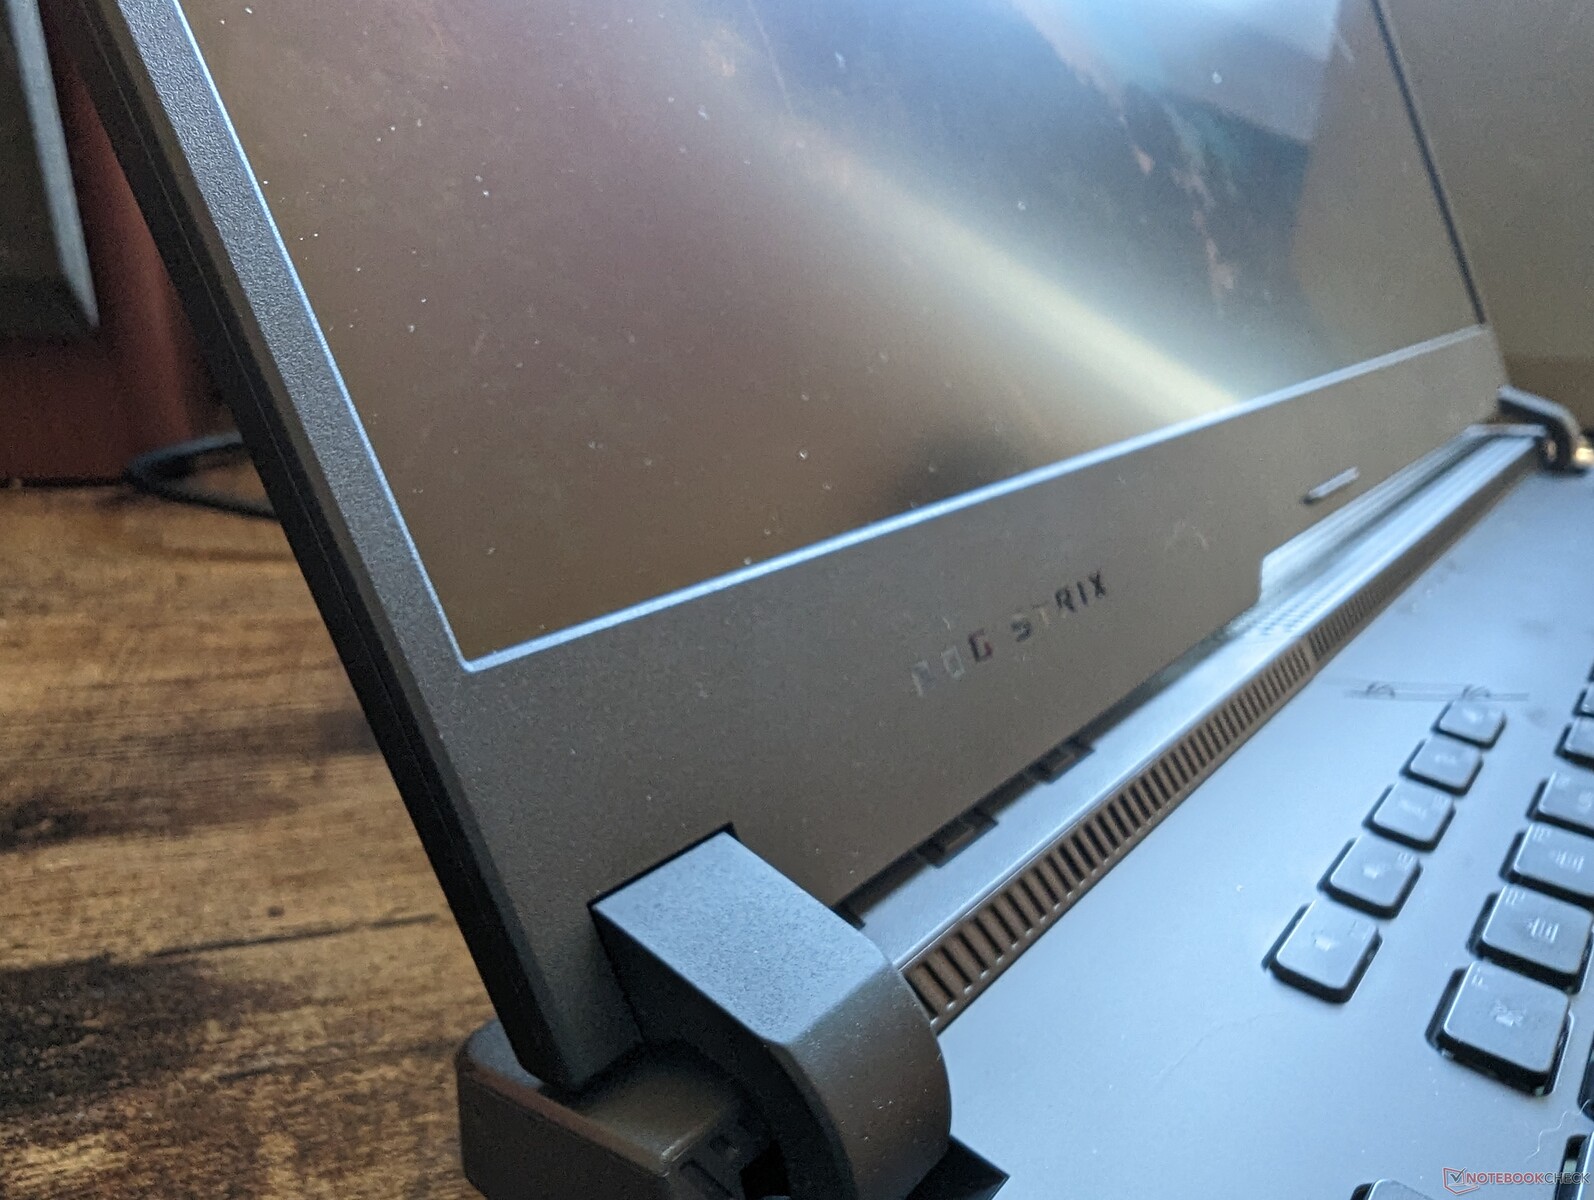
Case - Inga ändringar... Nästan
Det finns tre viktiga skillnader mellan 2023- och 2022-modellerna:
- Asus Keystone stöds inte längre. Tillverkaren insåg sannolikt att väldigt få ägare använde funktionen från början.
- Ny webbkamera. Det finns nu en integrerad webbkamera medan förra årets modell helt saknade en sådan.
- Nya ytliga markeringar på handflatorna och det yttre locket.
Det övergripande chassit är i övrigt identiskt med året innan.
Kommunikation
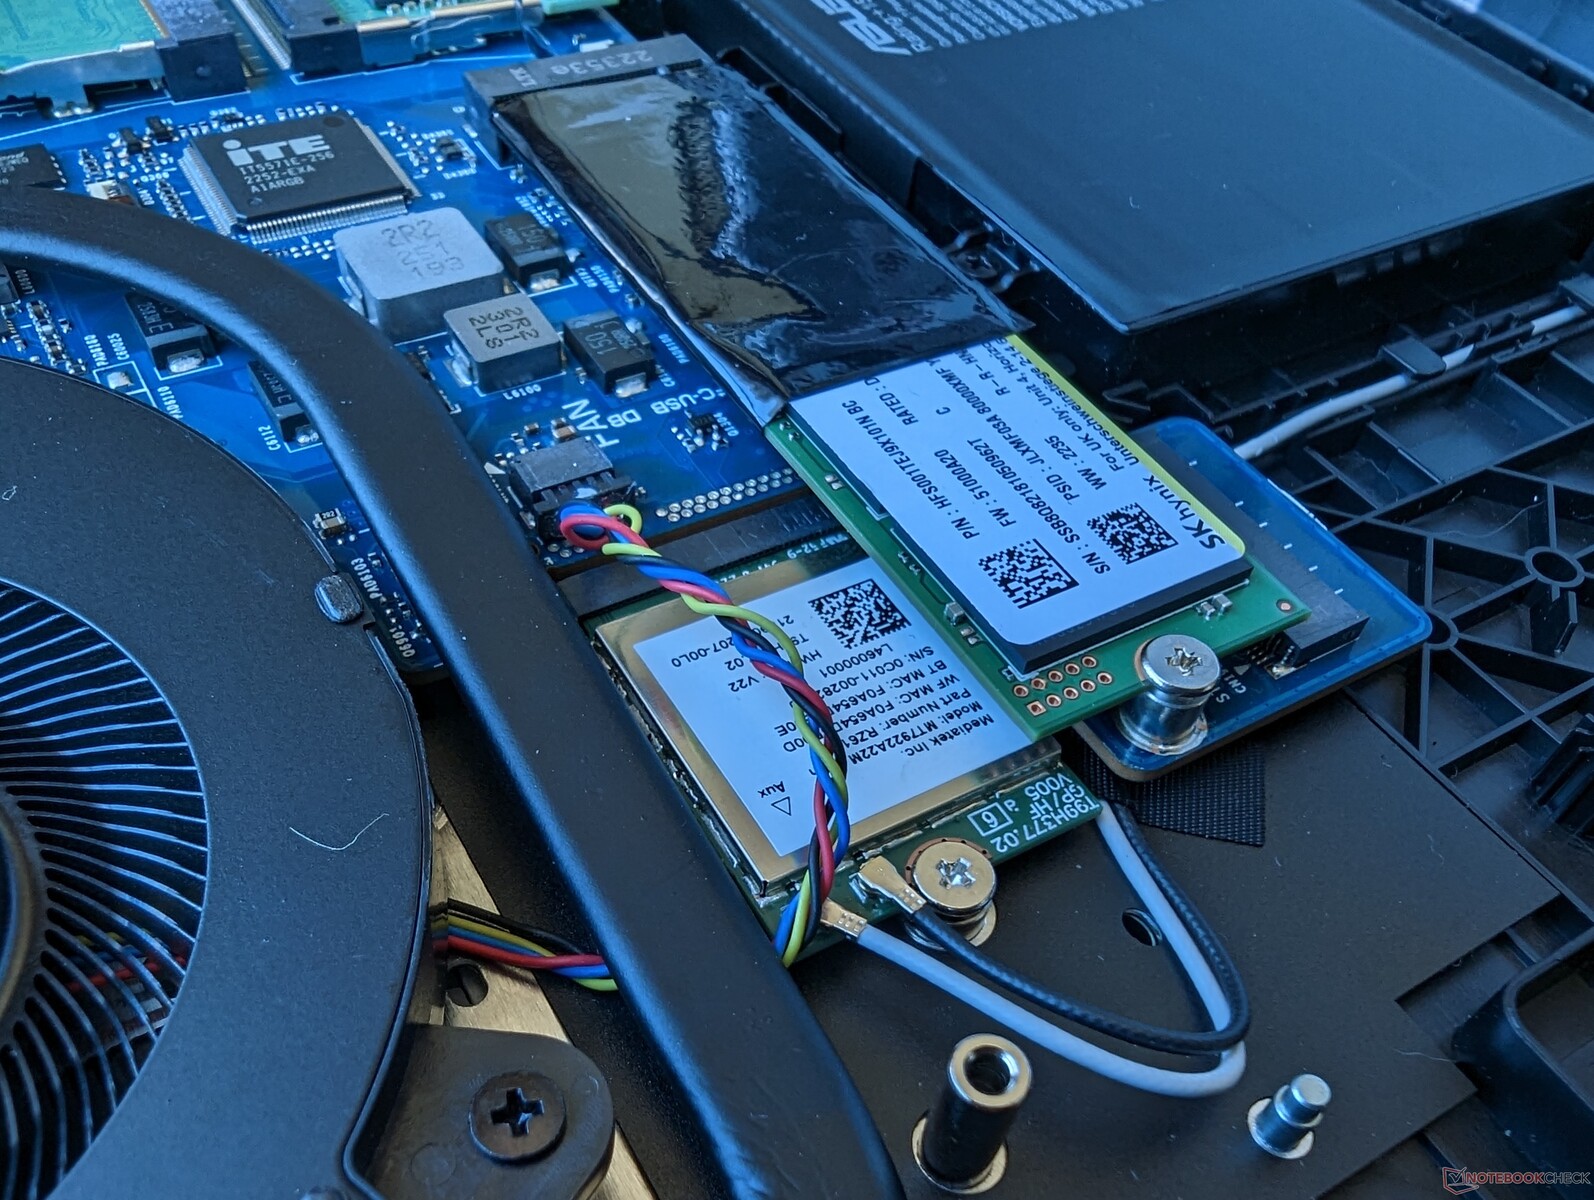
Wi-Fi 6E tillhandahålls av MediaTek MT7922 i stället för den vanligare Intel AX211, vilket troligen beror på att detta är en AMD-Nvidia-fokuserad konstruktion. Överföringshastigheter och prestanda är ändå stabila och pålitliga när de paras ihop med vår testrouter Asus AXE11000.
| Networking | |
| iperf3 transmit AXE11000 | |
| Asus ROG Strix G17 G713PI | |
| Eluktronics Mech-17 GP2 | |
| MSI GE78HX 13VH-070US | |
| Alienware m17 R5 (R9 6900HX, RX 6850M XT) | |
| Asus ROG Strix Scar 17 G733PY-XS96 | |
| iperf3 receive AXE11000 | |
| Asus ROG Strix G17 G713PI | |
| Eluktronics Mech-17 GP2 | |
| Asus ROG Strix Scar 17 G733PY-XS96 | |
| MSI GE78HX 13VH-070US | |
| Alienware m17 R5 (R9 6900HX, RX 6850M XT) | |
| iperf3 transmit AXE11000 6GHz | |
| Aorus 17X XES | |
| Asus ROG Strix Scar 17 G733PY-XS96 | |
| MSI GE78HX 13VH-070US | |
| iperf3 receive AXE11000 6GHz | |
| Aorus 17X XES | |
| MSI GE78HX 13VH-070US | |
| Asus ROG Strix Scar 17 G733PY-XS96 | |
Webbkamera
Även om en webbkamera är bättre än ingen webbkamera alls, valde Asus den minsta gemensamma nämnaren genom att installera en 1 MP-sensor istället för en 2 MP- eller 5 MP-sensor. Andra bärbara datorer för spel, som t.ex Alienware m17 R1 eller Razer Blade har webbkameror med högre upplösning i jämförelse. IR stöds inte av Asus.


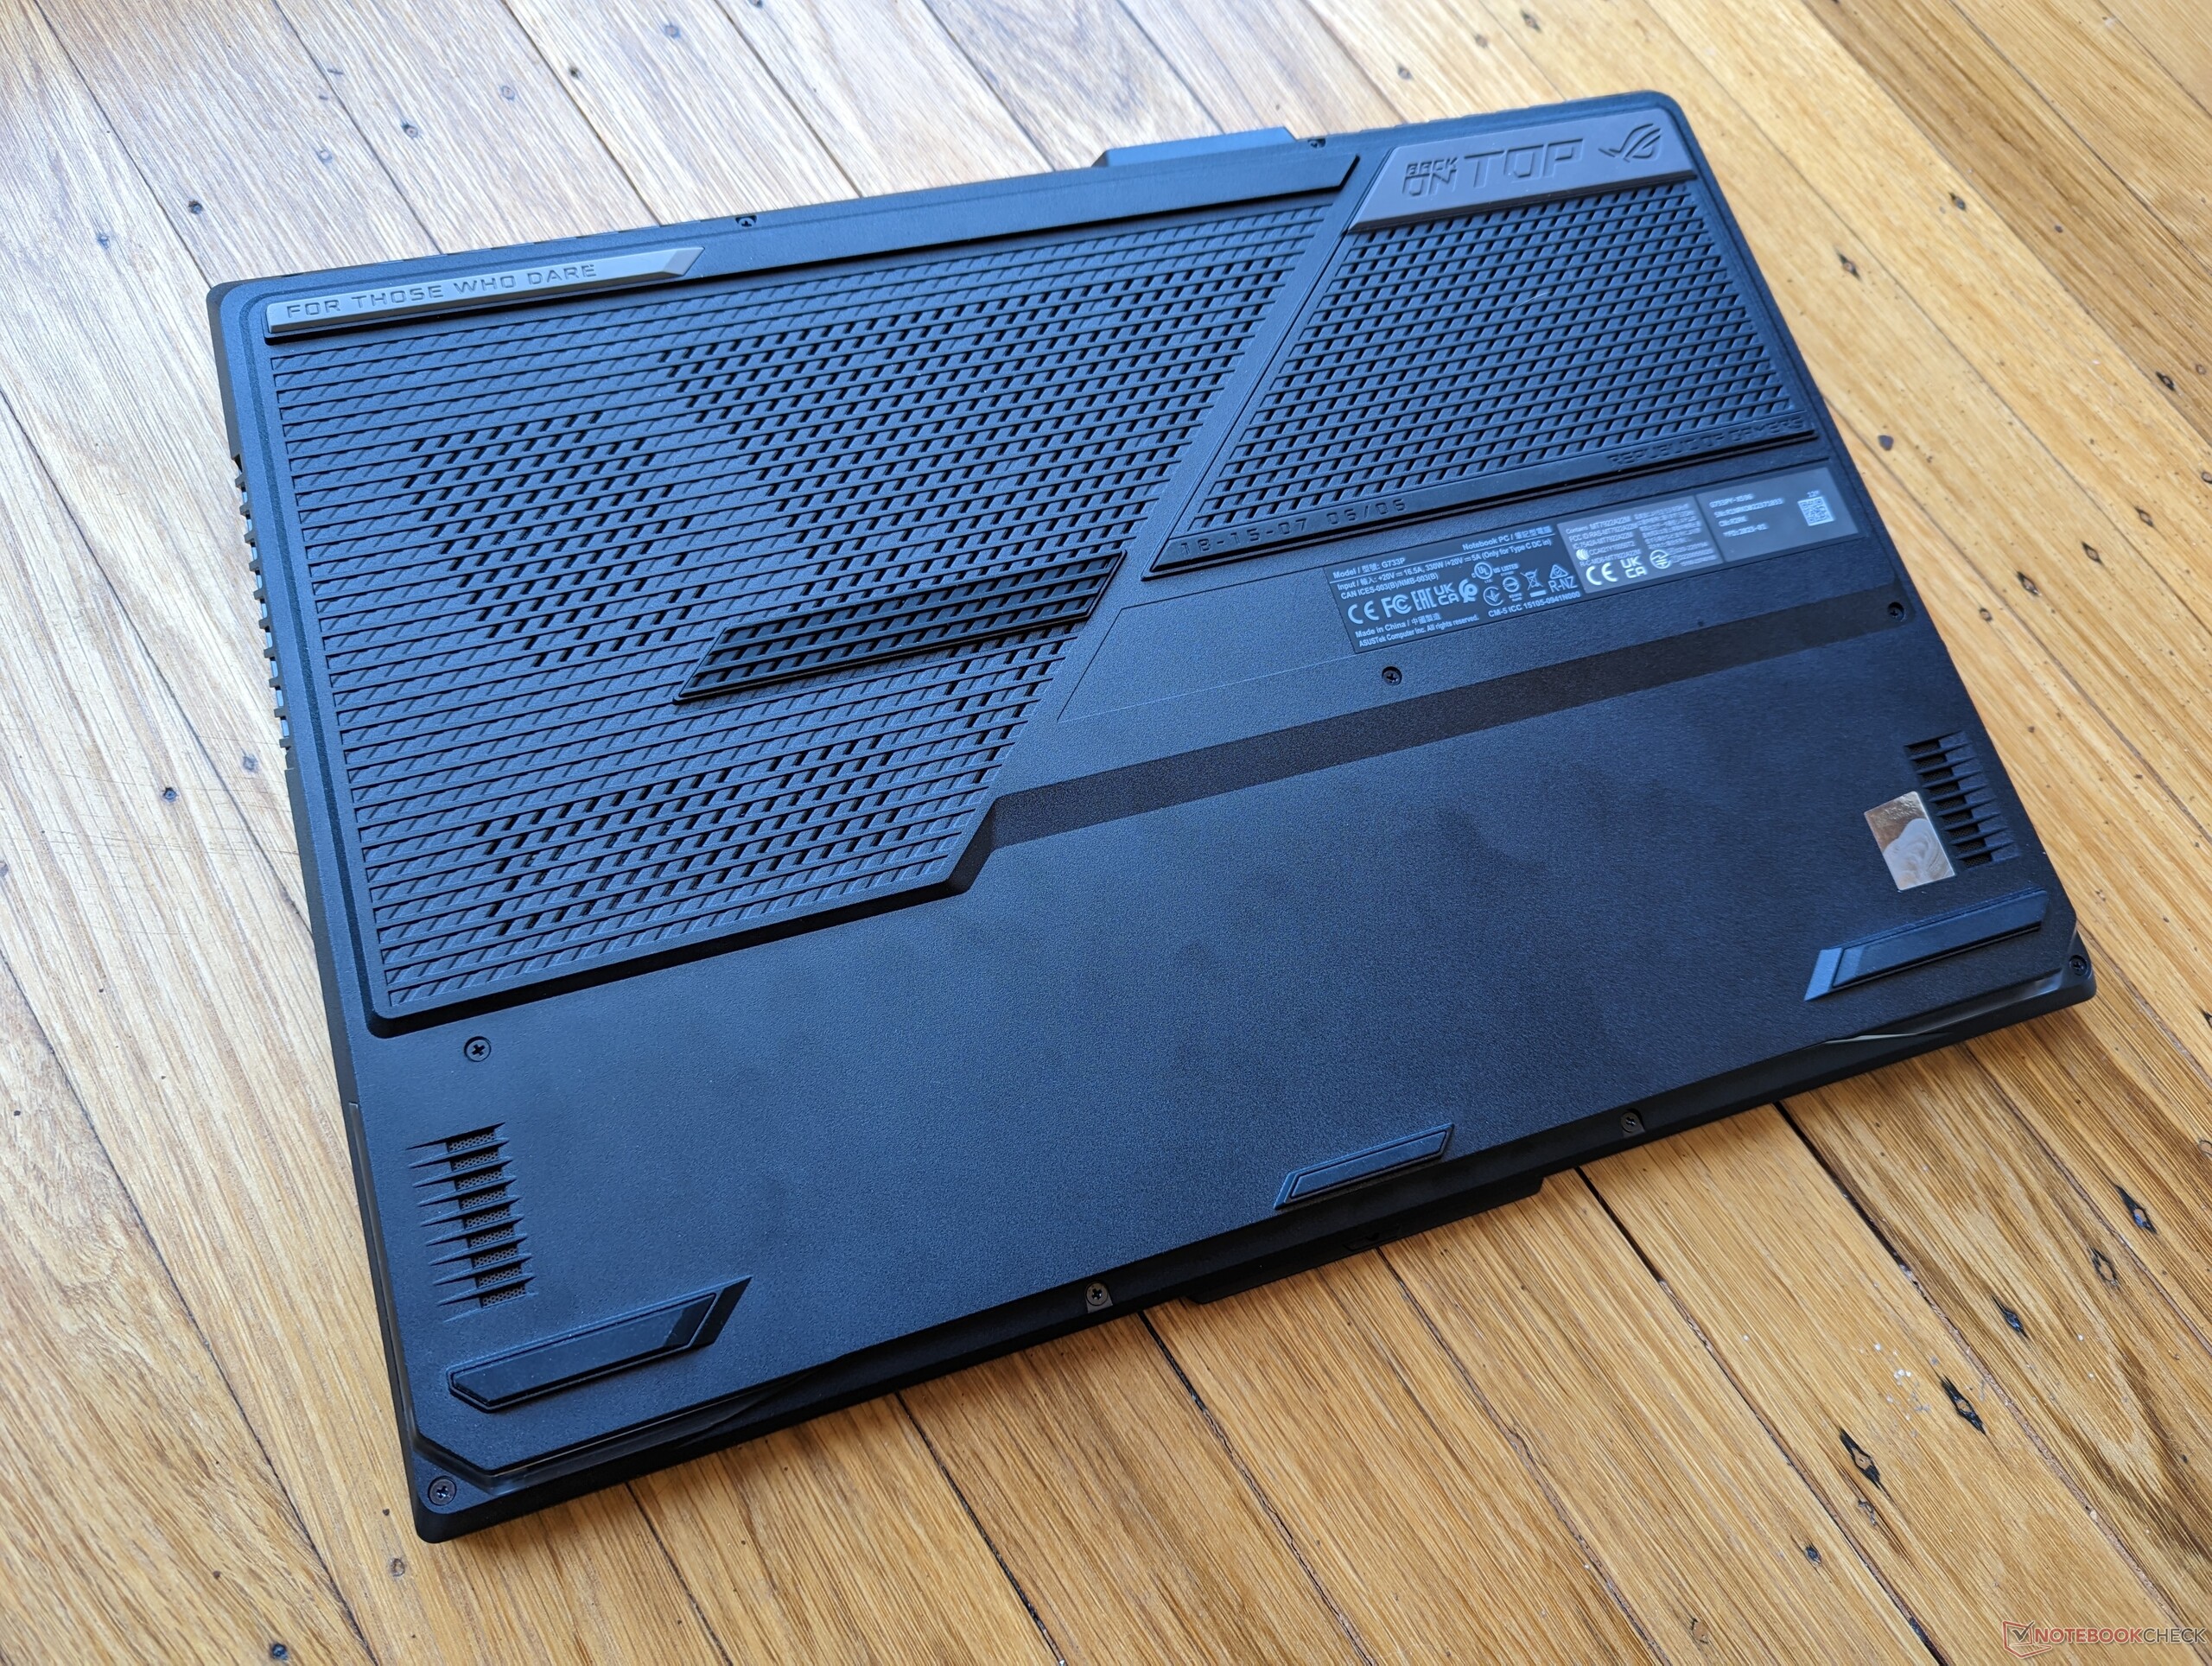
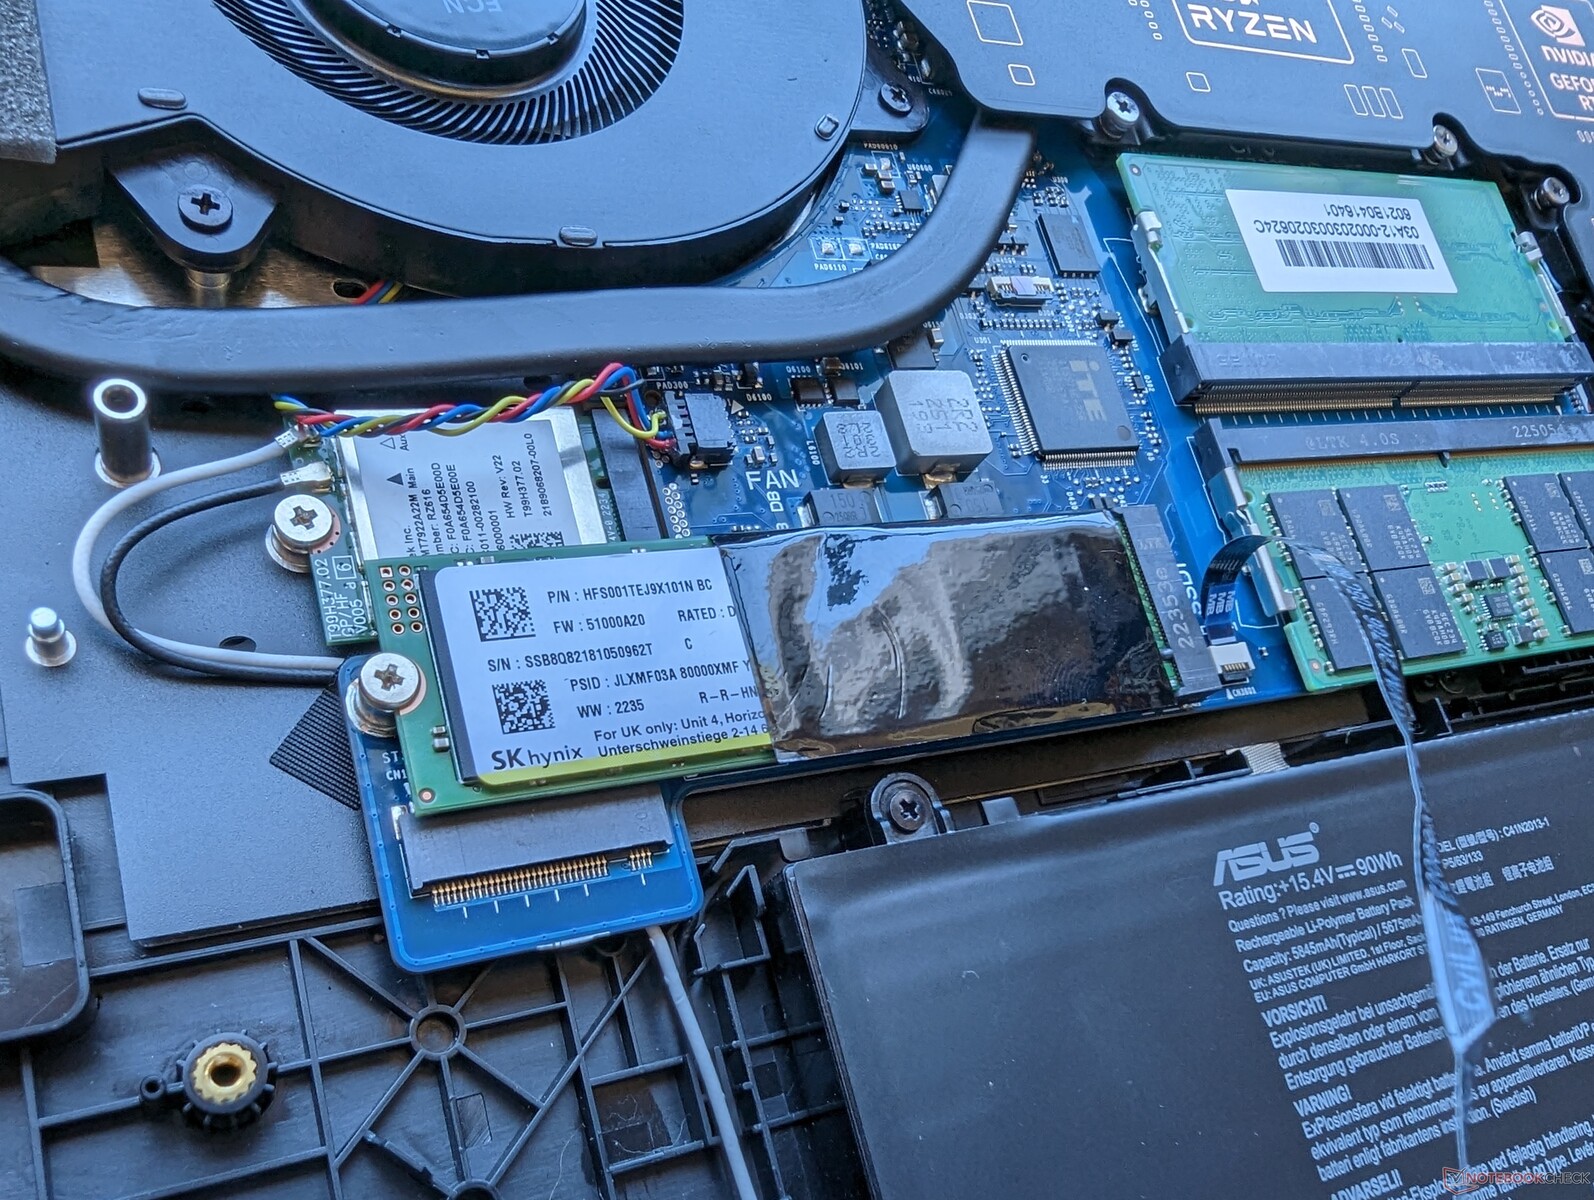
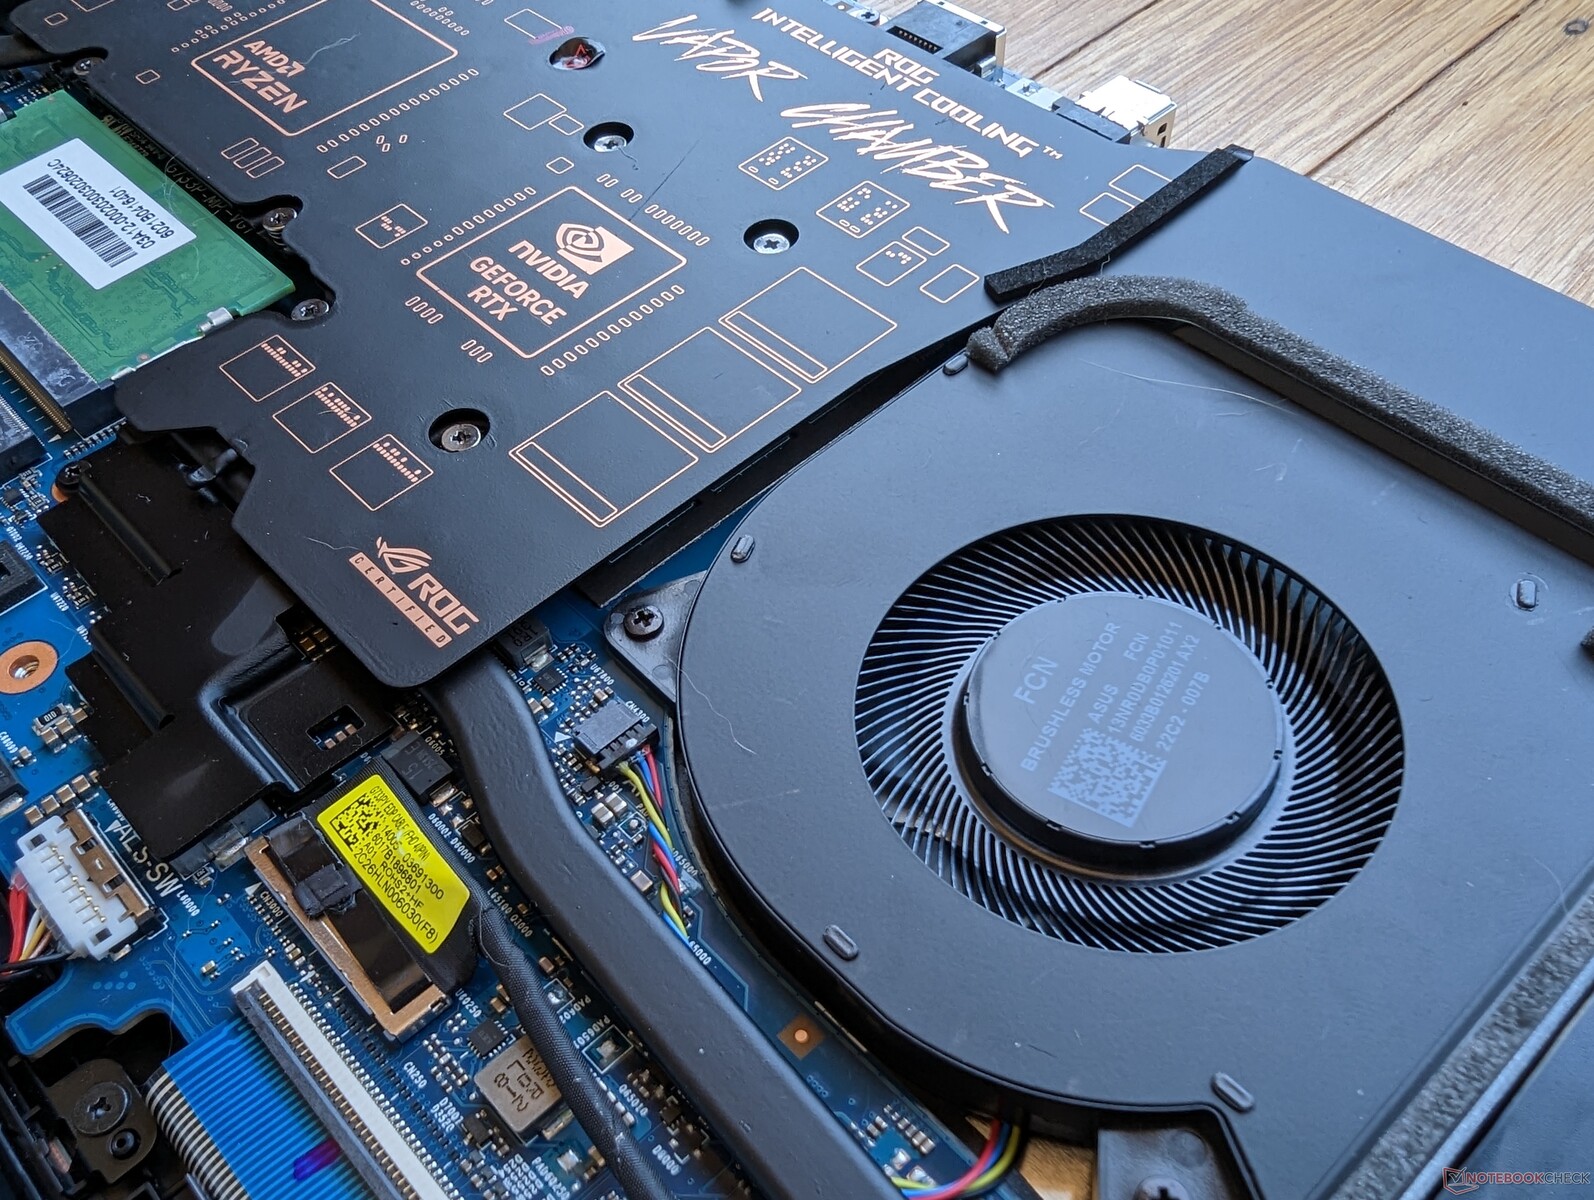
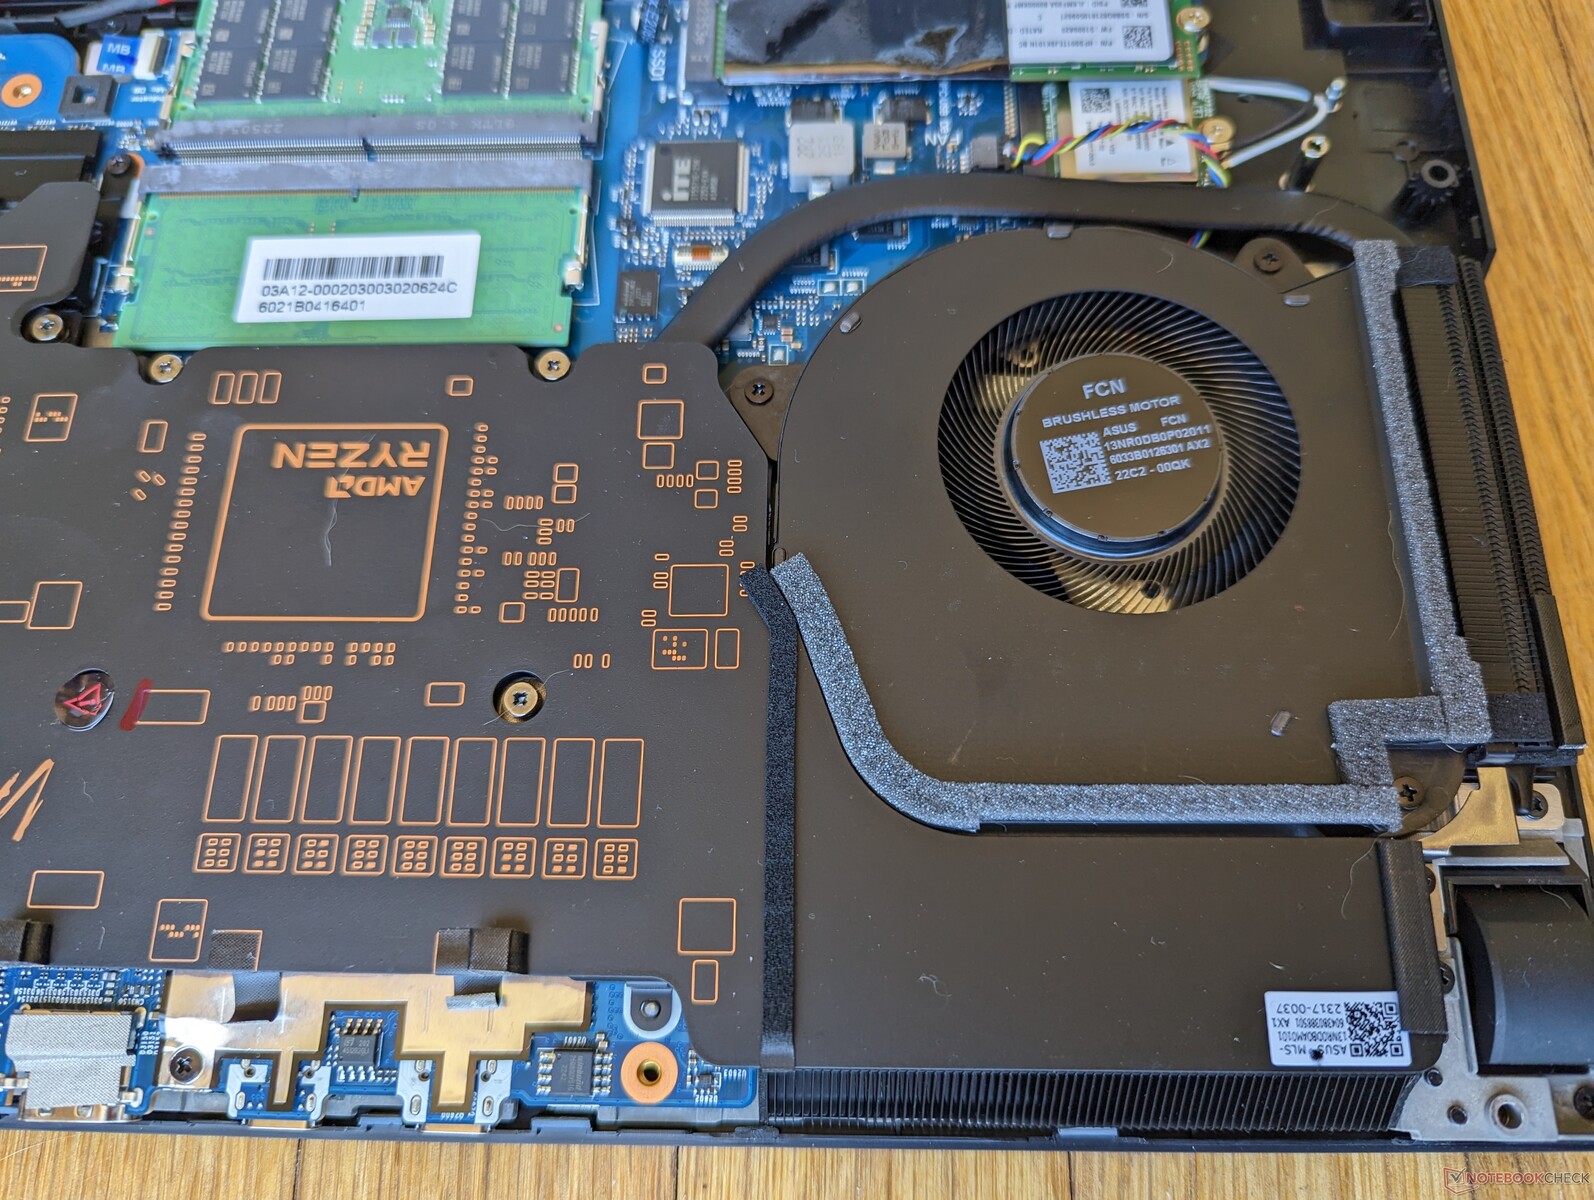
Underhåll
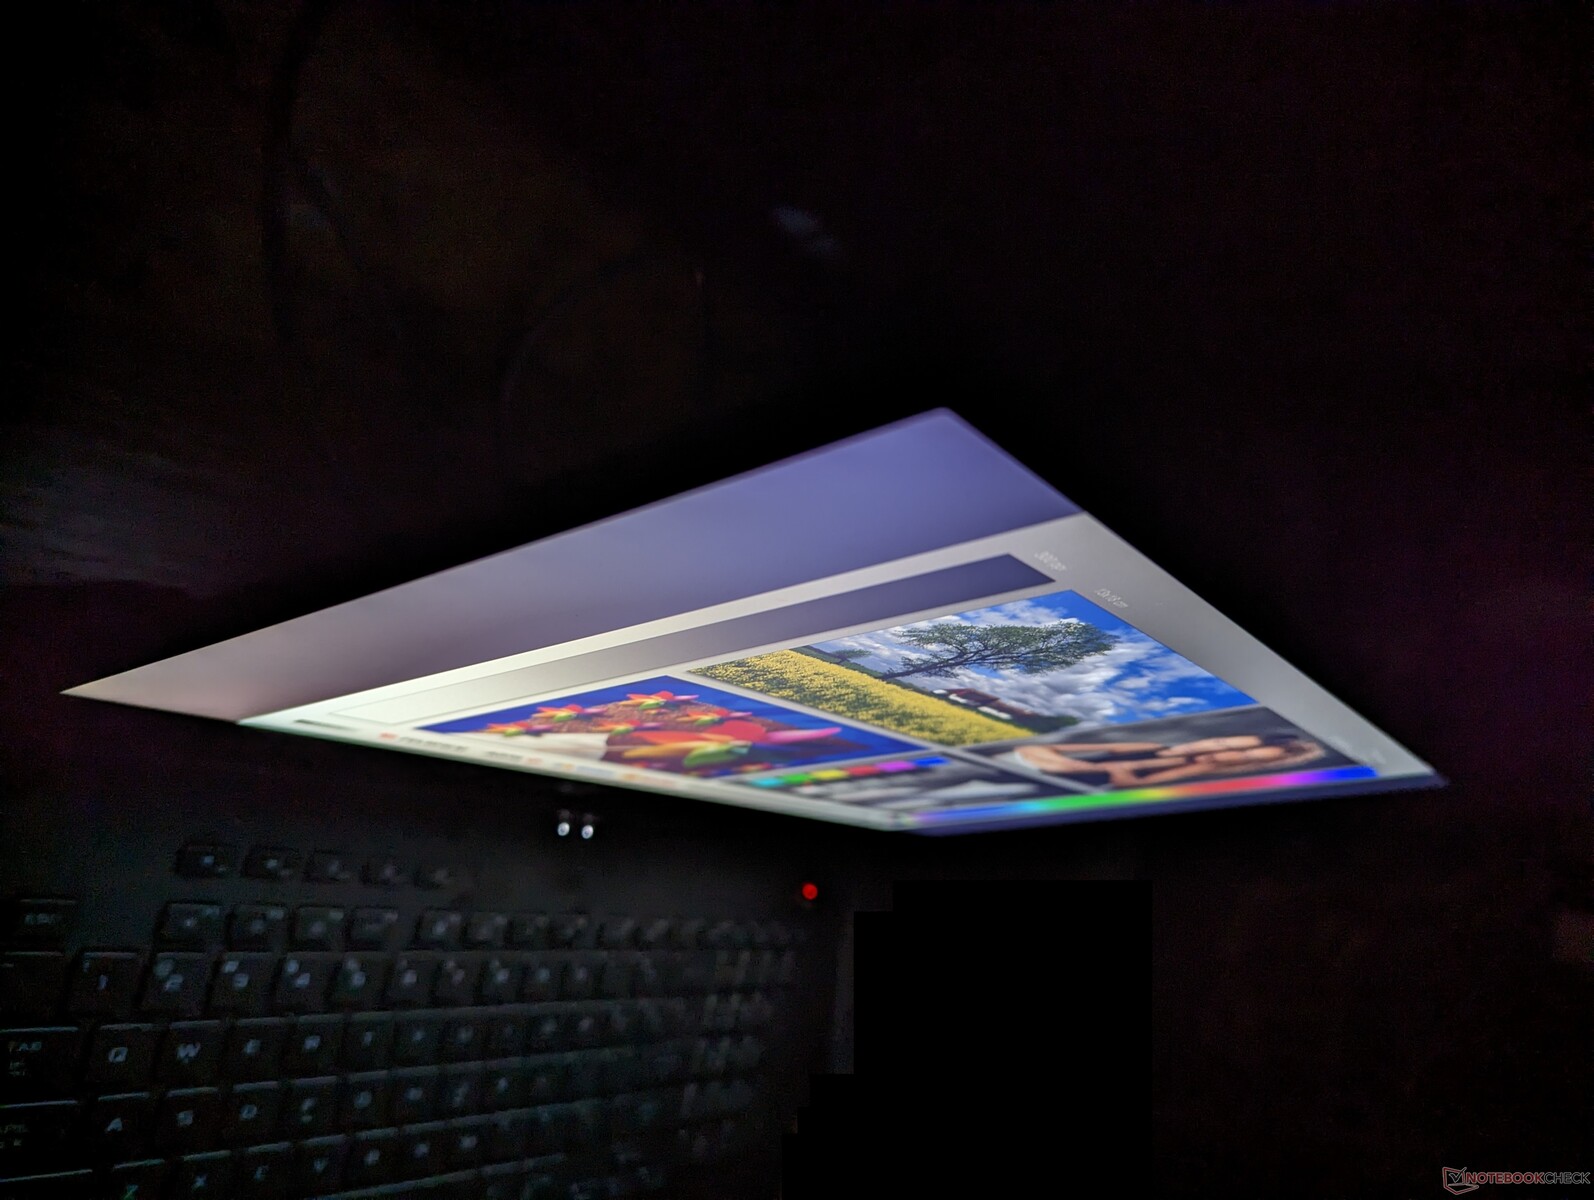
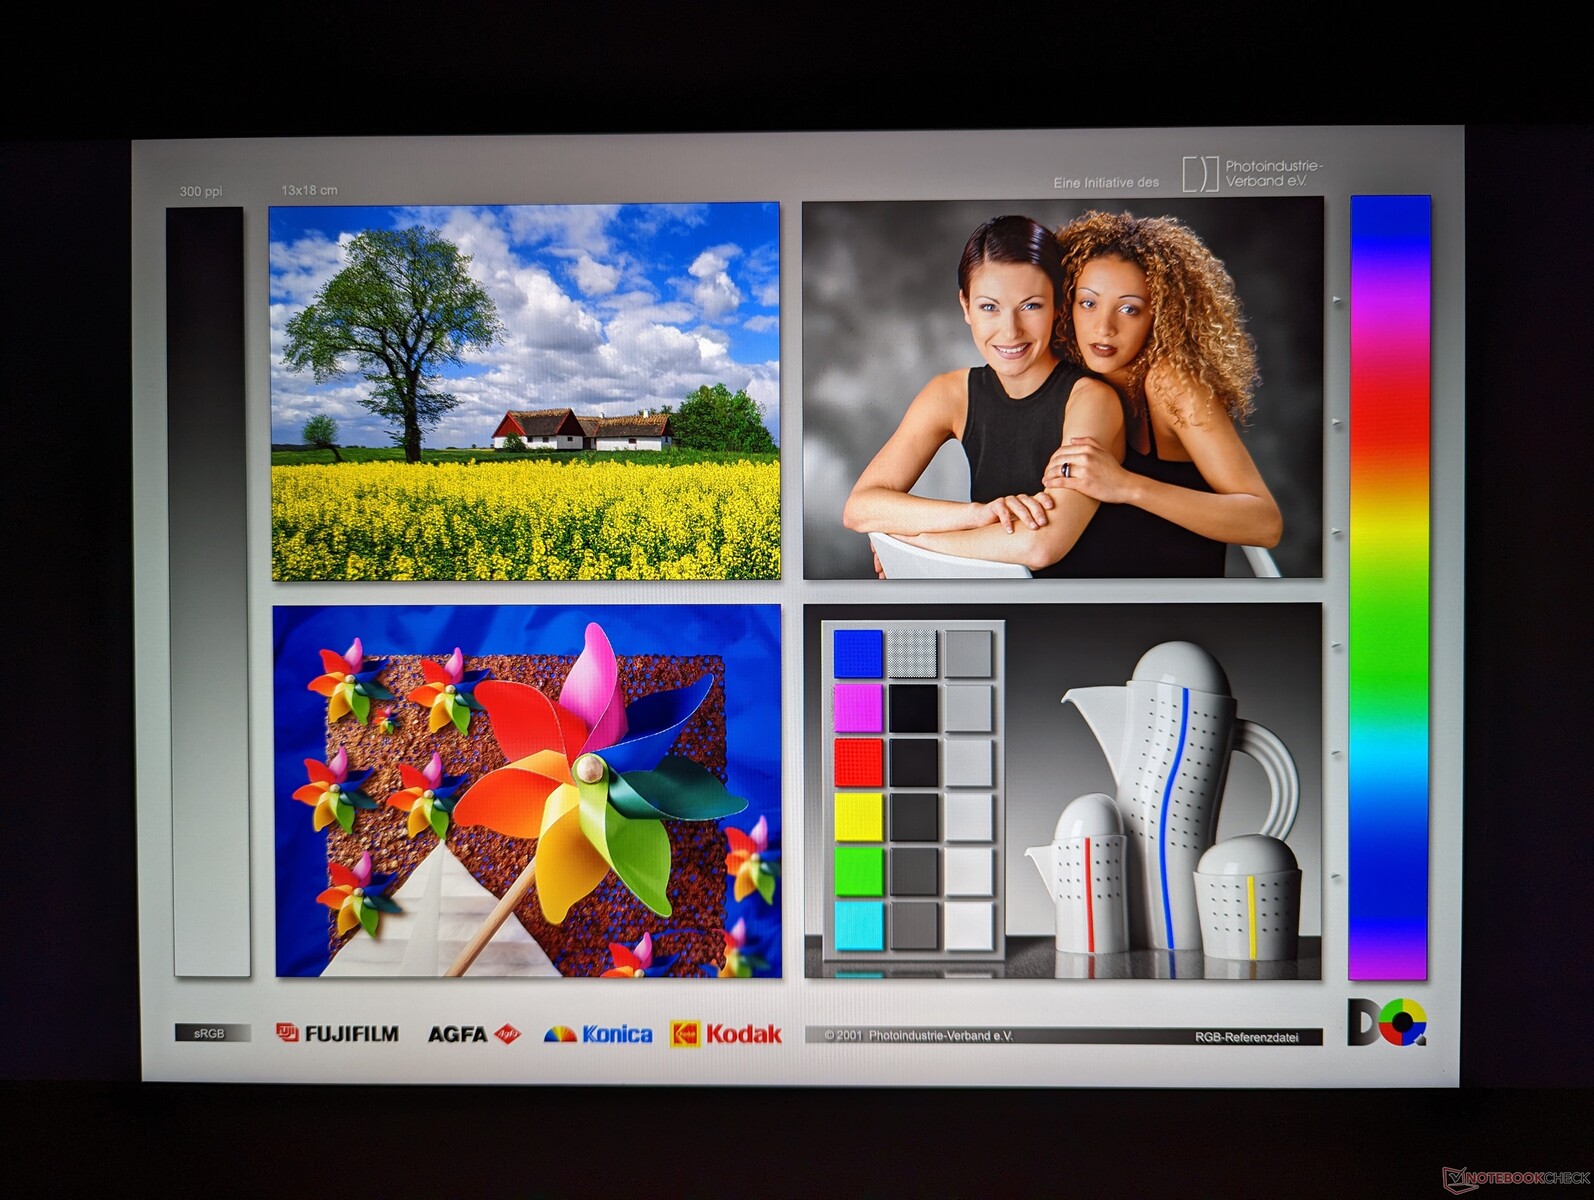
Skärm - 1440p Sweet Spot
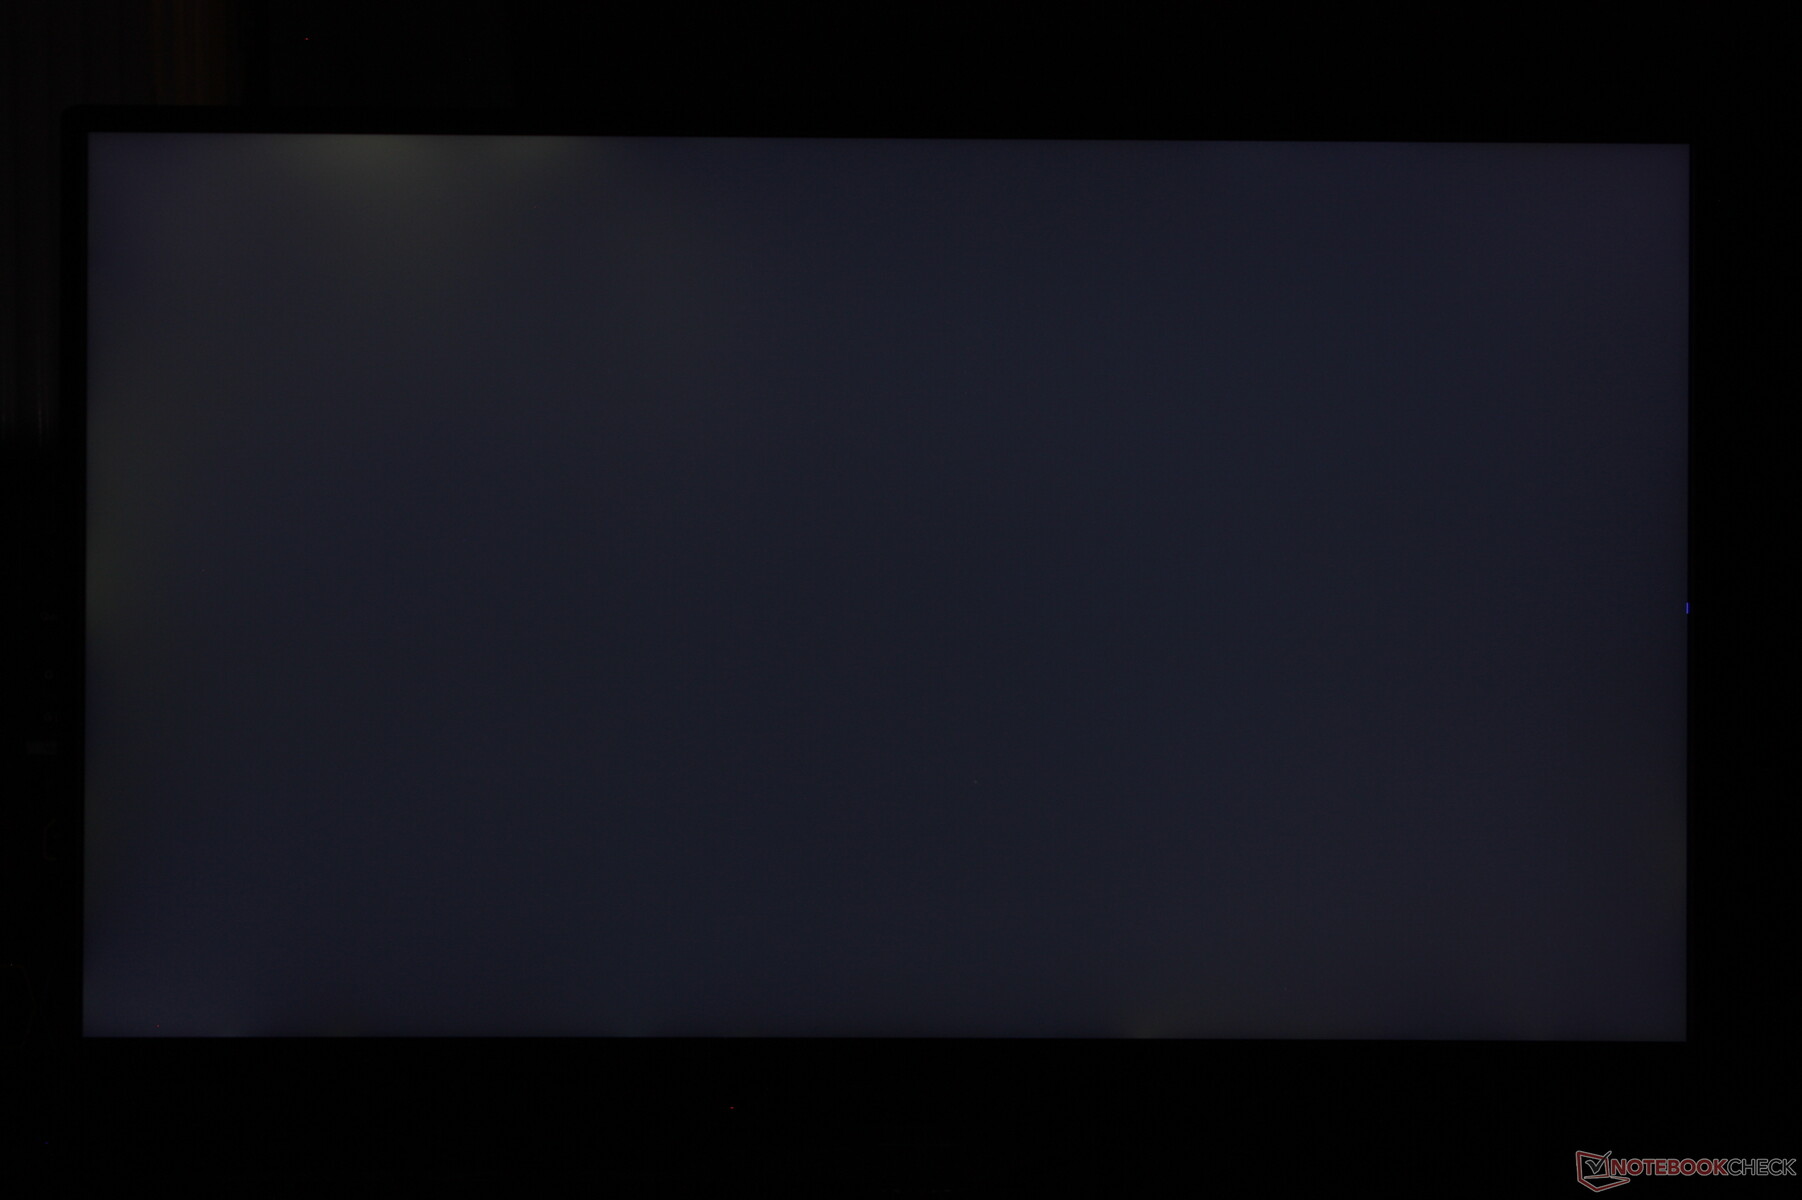
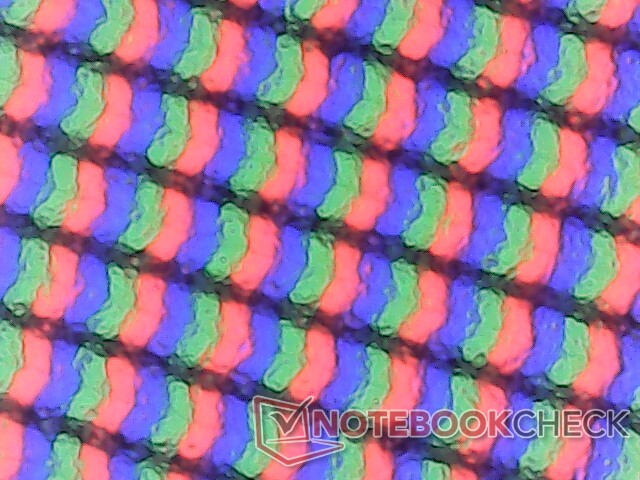
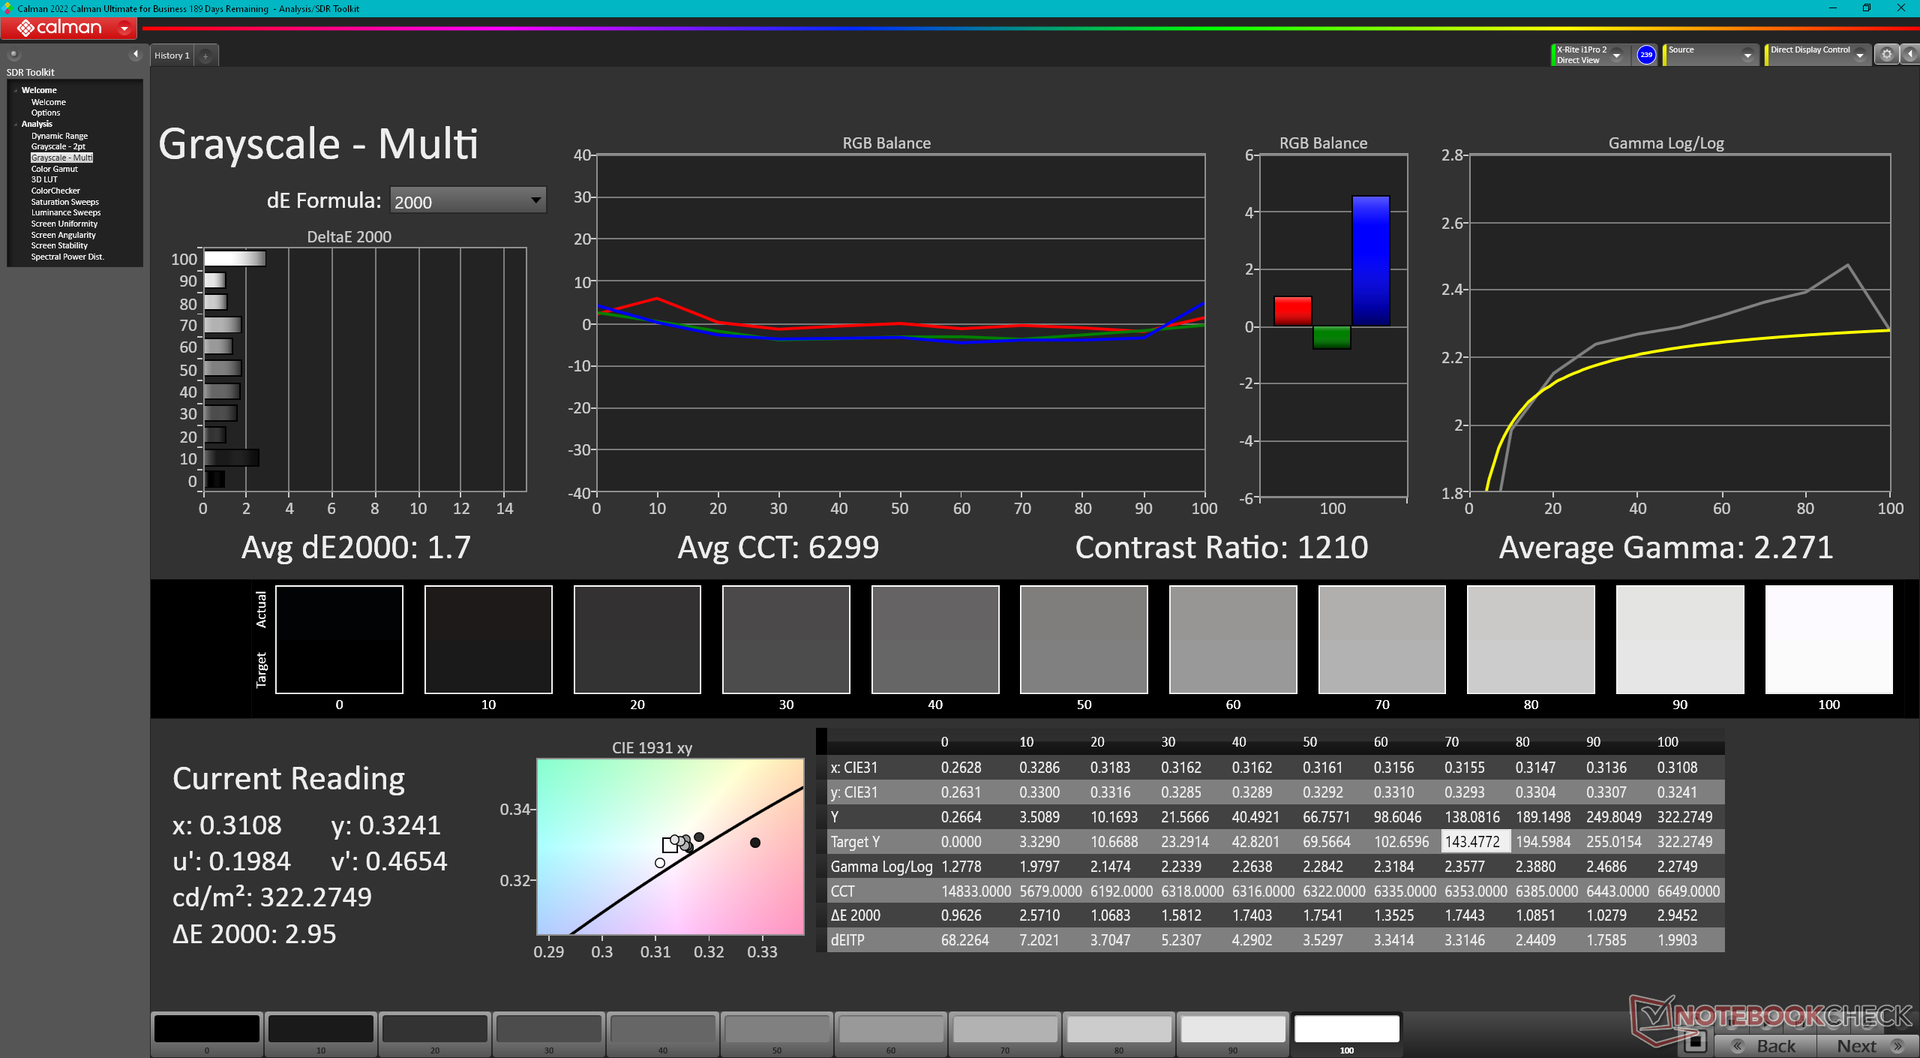
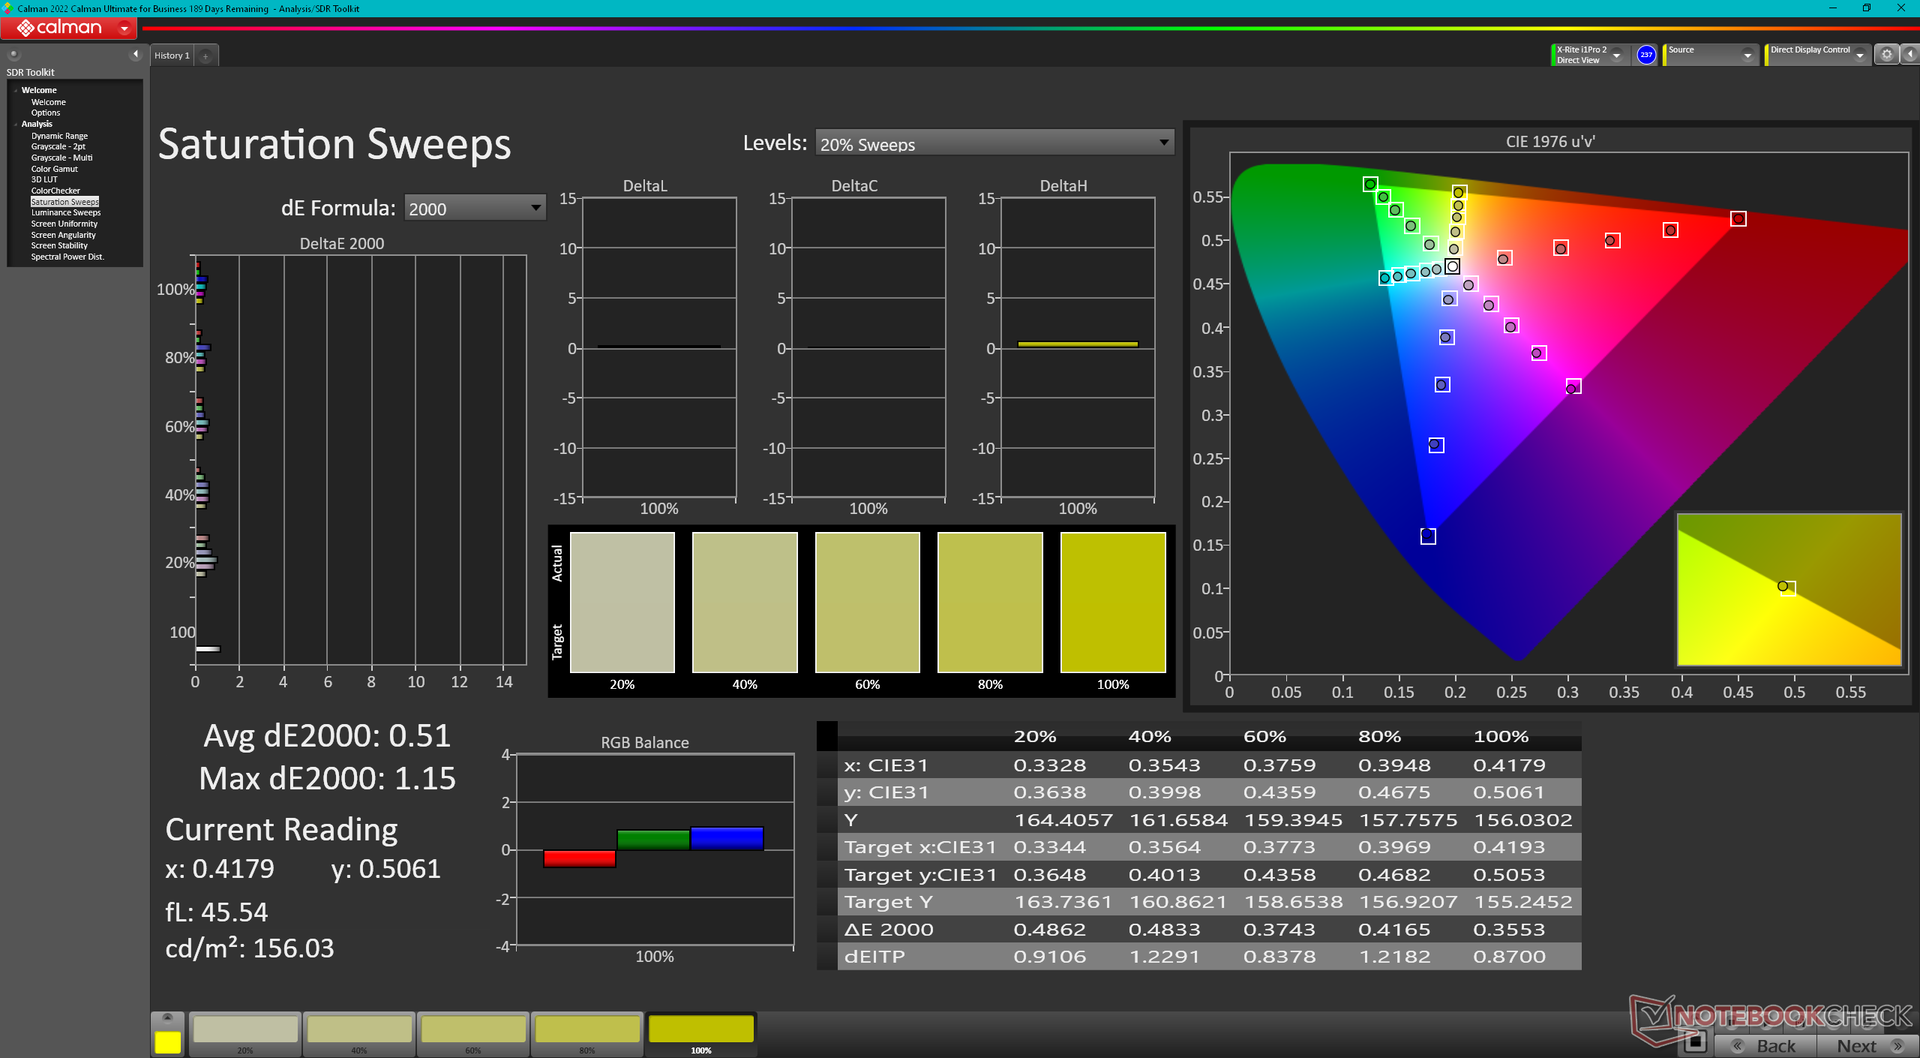
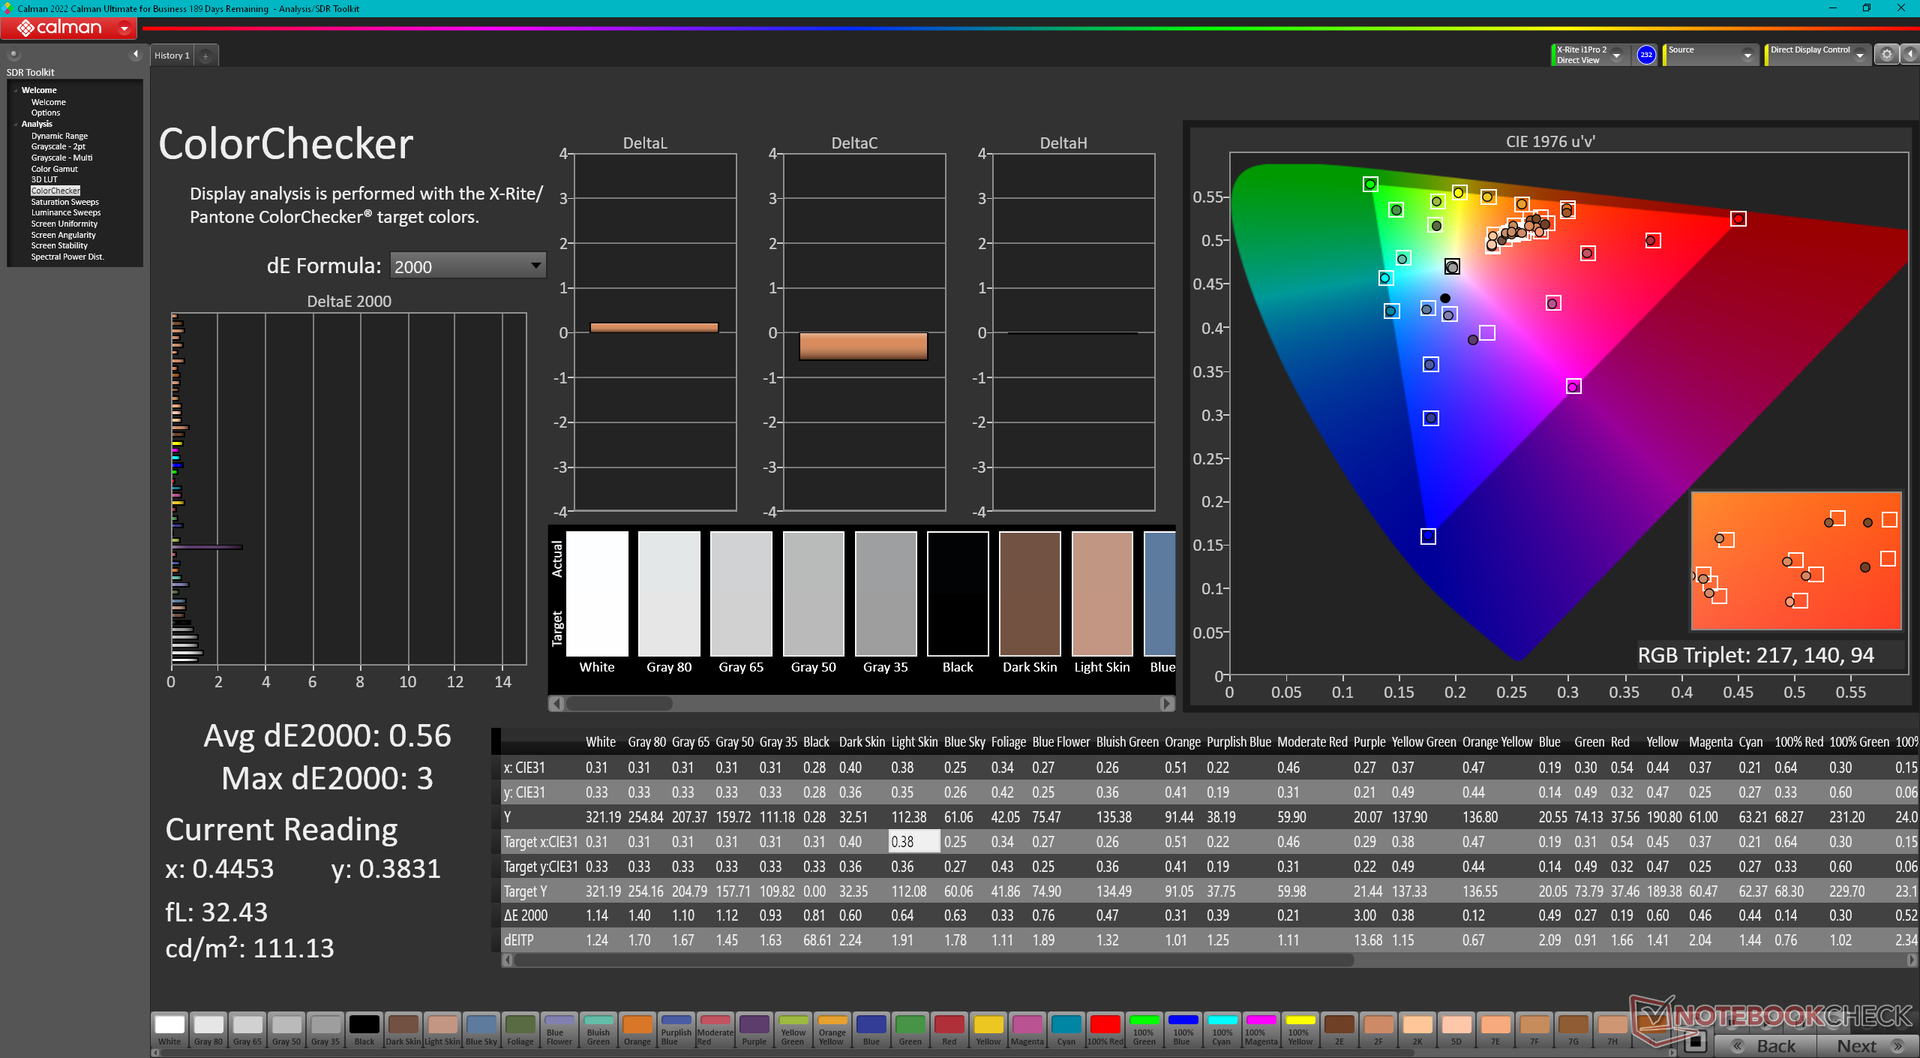
2023-modellen använder samma 240 Hz BOE NE173QHM-NZ2 IPS-panel som 2022-modellen. Våra mätningar nedan är därför nästan identiska från år till år. Detta är inte nödvändigtvis en dålig sak eftersom panelen erbjuder mycket snabba svarstider, fullständiga DCI-P3-färger och ett hyfsat kontrastförhållande för att passa för både grafikredigering och spel. Användare som letar efter 4K- eller OLED-alternativ har dock ingen tur för tillfället.
| |||||||||||||||||||||||||
Distribution av ljusstyrkan: 86 %
Mitt på batteriet: 322.5 cd/m²
Kontrast: 1112:1 (Svärta: 0.29 cd/m²)
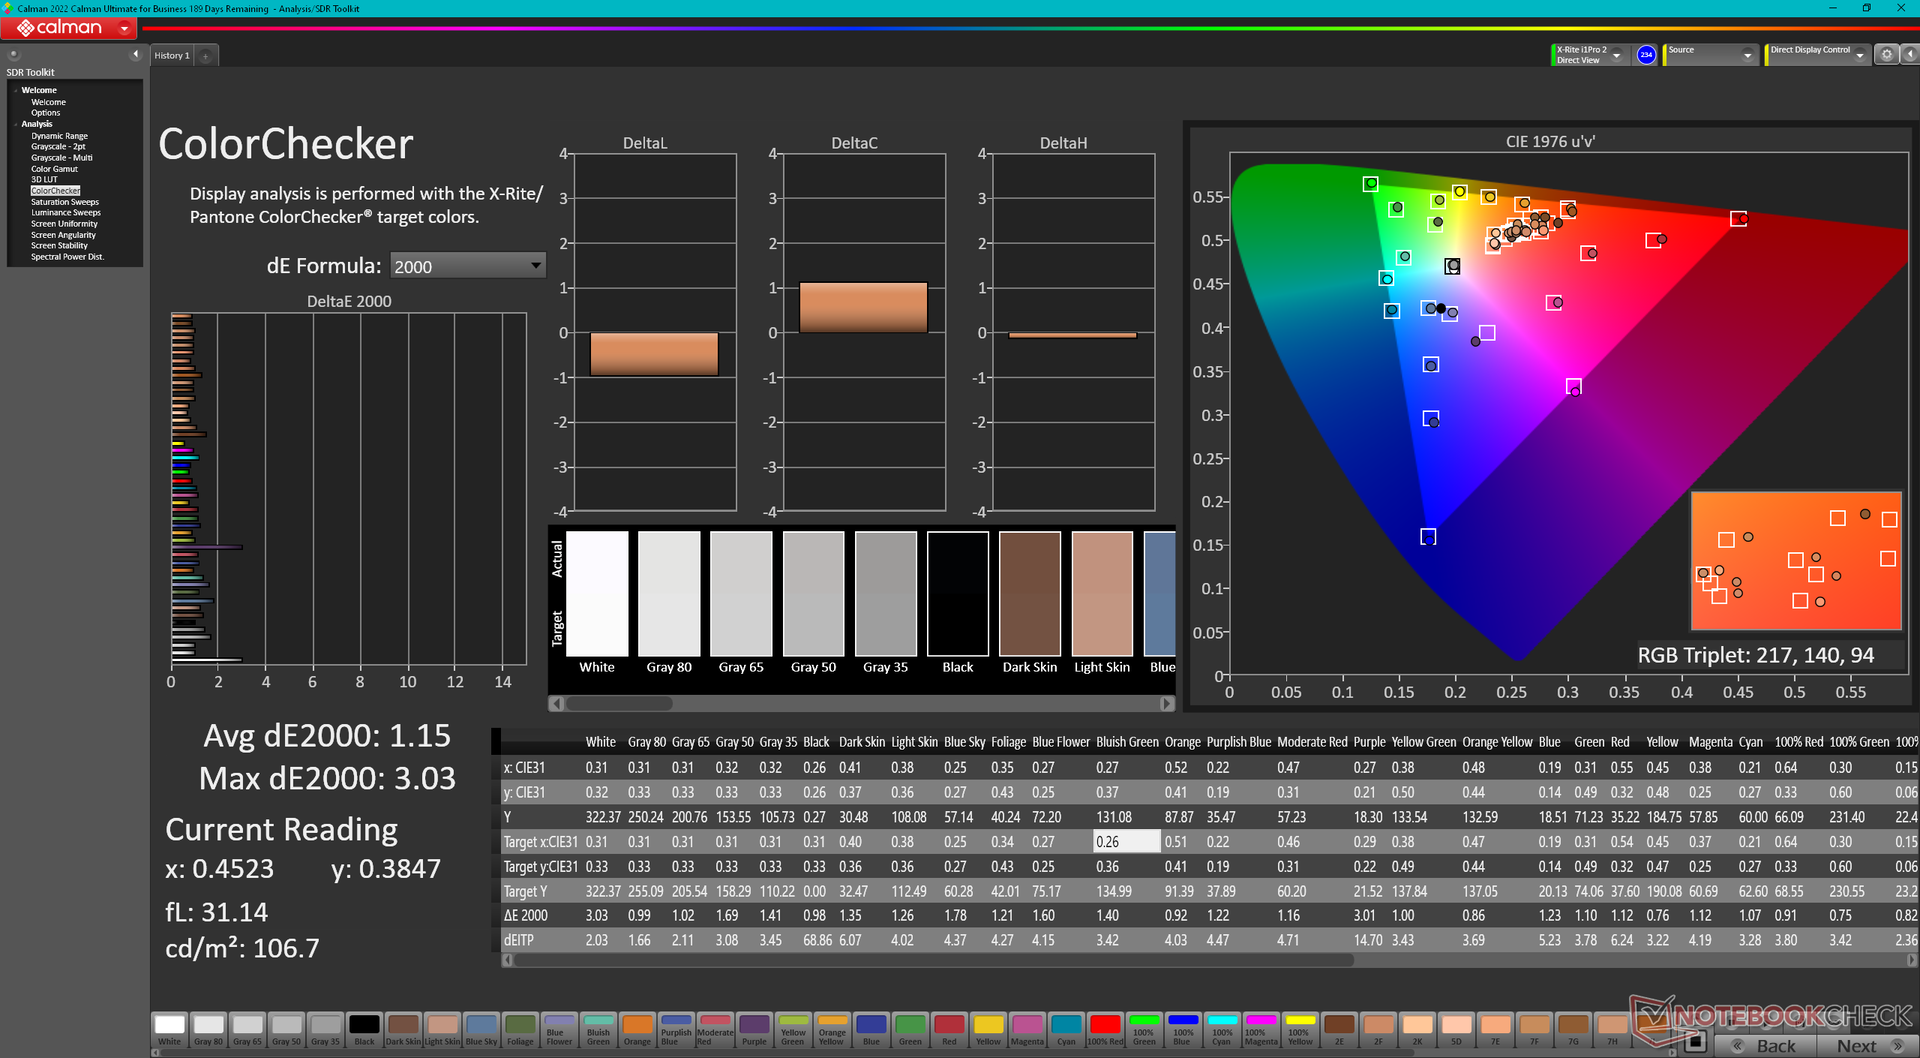
ΔE ColorChecker Calman: 1.15 | ∀{0.5-29.43 Ø4.71}
calibrated: 0.56
ΔE Greyscale Calman: 1.7 | ∀{0.09-98 Ø4.96}
85.6% AdobeRGB 1998 (Argyll 3D)
100% sRGB (Argyll 3D)
98% Display P3 (Argyll 3D)
Gamma: 2.27
CCT: 6299 K
| Asus ROG Strix Scar 17 G733PY-XS96 NE173QHM-NZ2, IPS, 2560x1440, 17.3" | Asus ROG Strix Scar 17 SE G733CX-LL014W NE173QHM-NZ2, IPS, 2560x1440, 17.3" | MSI GE78HX 13VH-070US AU Optronics B170QAN01.2, IPS, 2560x1600, 17" | Eluktronics Mech-17 GP2 BOE NE170QDM-NZ1, IPS, 2560x1600, 17" | Aorus 17X XES Sharp SHP1563, IPS, 1920x1080, 17.3" | Alienware m17 R5 (R9 6900HX, RX 6850M XT) AU Optronics AUODBA3, IPS, 3840x2160, 17" | |
|---|---|---|---|---|---|---|
| Display | -1% | 0% | -16% | -15% | 1% | |
| Display P3 Coverage (%) | 98 | 97.1 -1% | 97.6 0% | 69.1 -29% | 70.1 -28% | 97.2 -1% |
| sRGB Coverage (%) | 100 | 99.9 0% | 99.9 0% | 99.7 0% | 99.9 0% | 99.6 0% |
| AdobeRGB 1998 Coverage (%) | 85.6 | 84.8 -1% | 86.5 1% | 69.8 -18% | 71.9 -16% | 88.4 3% |
| Response Times | 10% | 38% | -38% | 47% | -84% | |
| Response Time Grey 50% / Grey 80% * (ms) | 6.2 ? | 5.7 ? 8% | 4.2 ? 32% | 12 ? -94% | 3.4 ? 45% | 16.4 ? -165% |
| Response Time Black / White * (ms) | 11.4 ? | 10.1 ? 11% | 6.4 ? 44% | 9.4 ? 18% | 5.8 ? 49% | 11.6 ? -2% |
| PWM Frequency (Hz) | ||||||
| Screen | 5% | -93% | -20% | -102% | -161% | |
| Brightness middle (cd/m²) | 322.5 | 320 -1% | 398.6 24% | 417.3 29% | 278 -14% | 484 50% |
| Brightness (cd/m²) | 317 | 303 -4% | 384 21% | 387 22% | 273 -14% | 449 42% |
| Brightness Distribution (%) | 86 | 87 1% | 89 3% | 87 1% | 79 -8% | 87 1% |
| Black Level * (cd/m²) | 0.29 | 0.3 -3% | 0.46 -59% | 0.42 -45% | 0.26 10% | 0.55 -90% |
| Contrast (:1) | 1112 | 1067 -4% | 867 -22% | 994 -11% | 1069 -4% | 880 -21% |
| Colorchecker dE 2000 * | 1.15 | 1.1 4% | 4.05 -252% | 2.14 -86% | 3.96 -244% | 4.8 -317% |
| Colorchecker dE 2000 max. * | 3.03 | 2.7 11% | 8.68 -186% | 4.09 -35% | 10.78 -256% | 7.48 -147% |
| Colorchecker dE 2000 calibrated * | 0.56 | 1.02 -82% | 0.42 25% | 1.07 -91% | 4.74 -746% | |
| Greyscale dE 2000 * | 1.7 | 1.1 35% | 6.5 -282% | 3.1 -82% | 6.8 -300% | 5.5 -224% |
| Gamma | 2.27 97% | 2.13 103% | 2.11 104% | 2.19 100% | 2.224 99% | 2.42 91% |
| CCT | 6299 103% | 6599 98% | 7518 86% | 6040 108% | 7651 85% | 6148 106% |
| Totalt genomsnitt (program/inställningar) | 5% /
4% | -18% /
-54% | -25% /
-22% | -23% /
-62% | -81% /
-116% |
* ... mindre är bättre
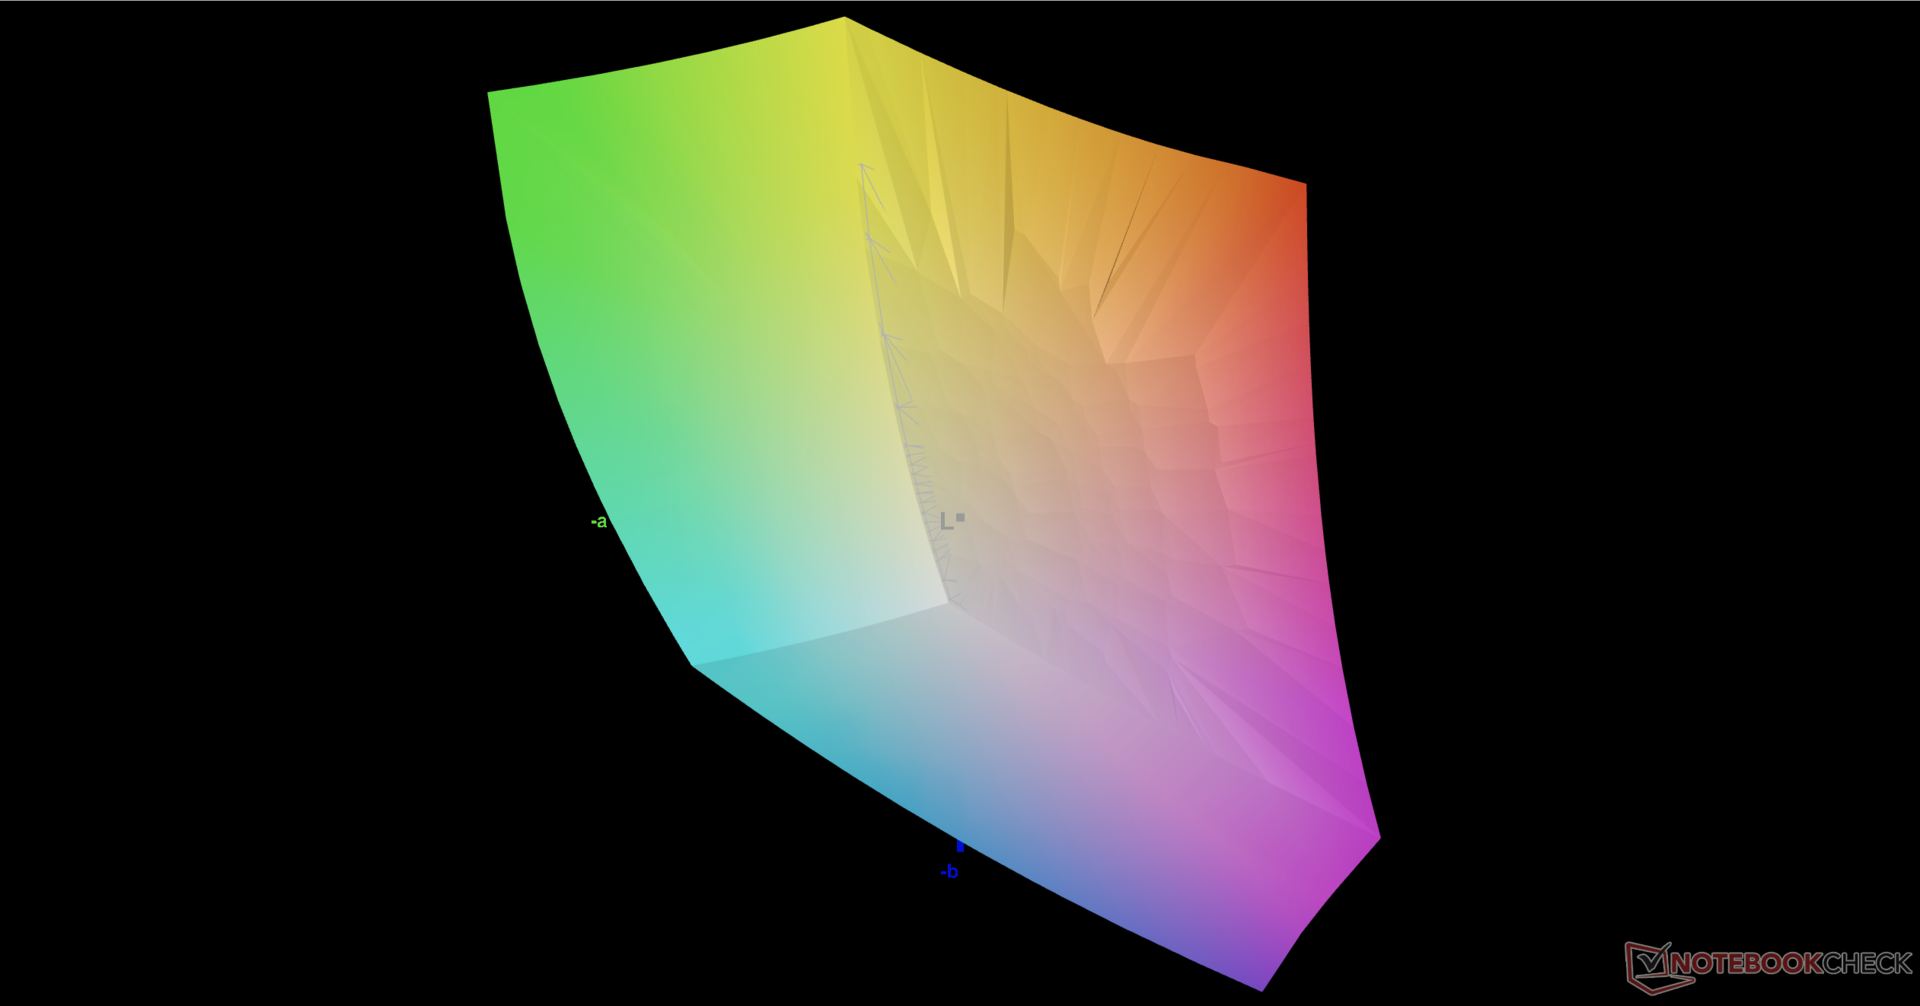
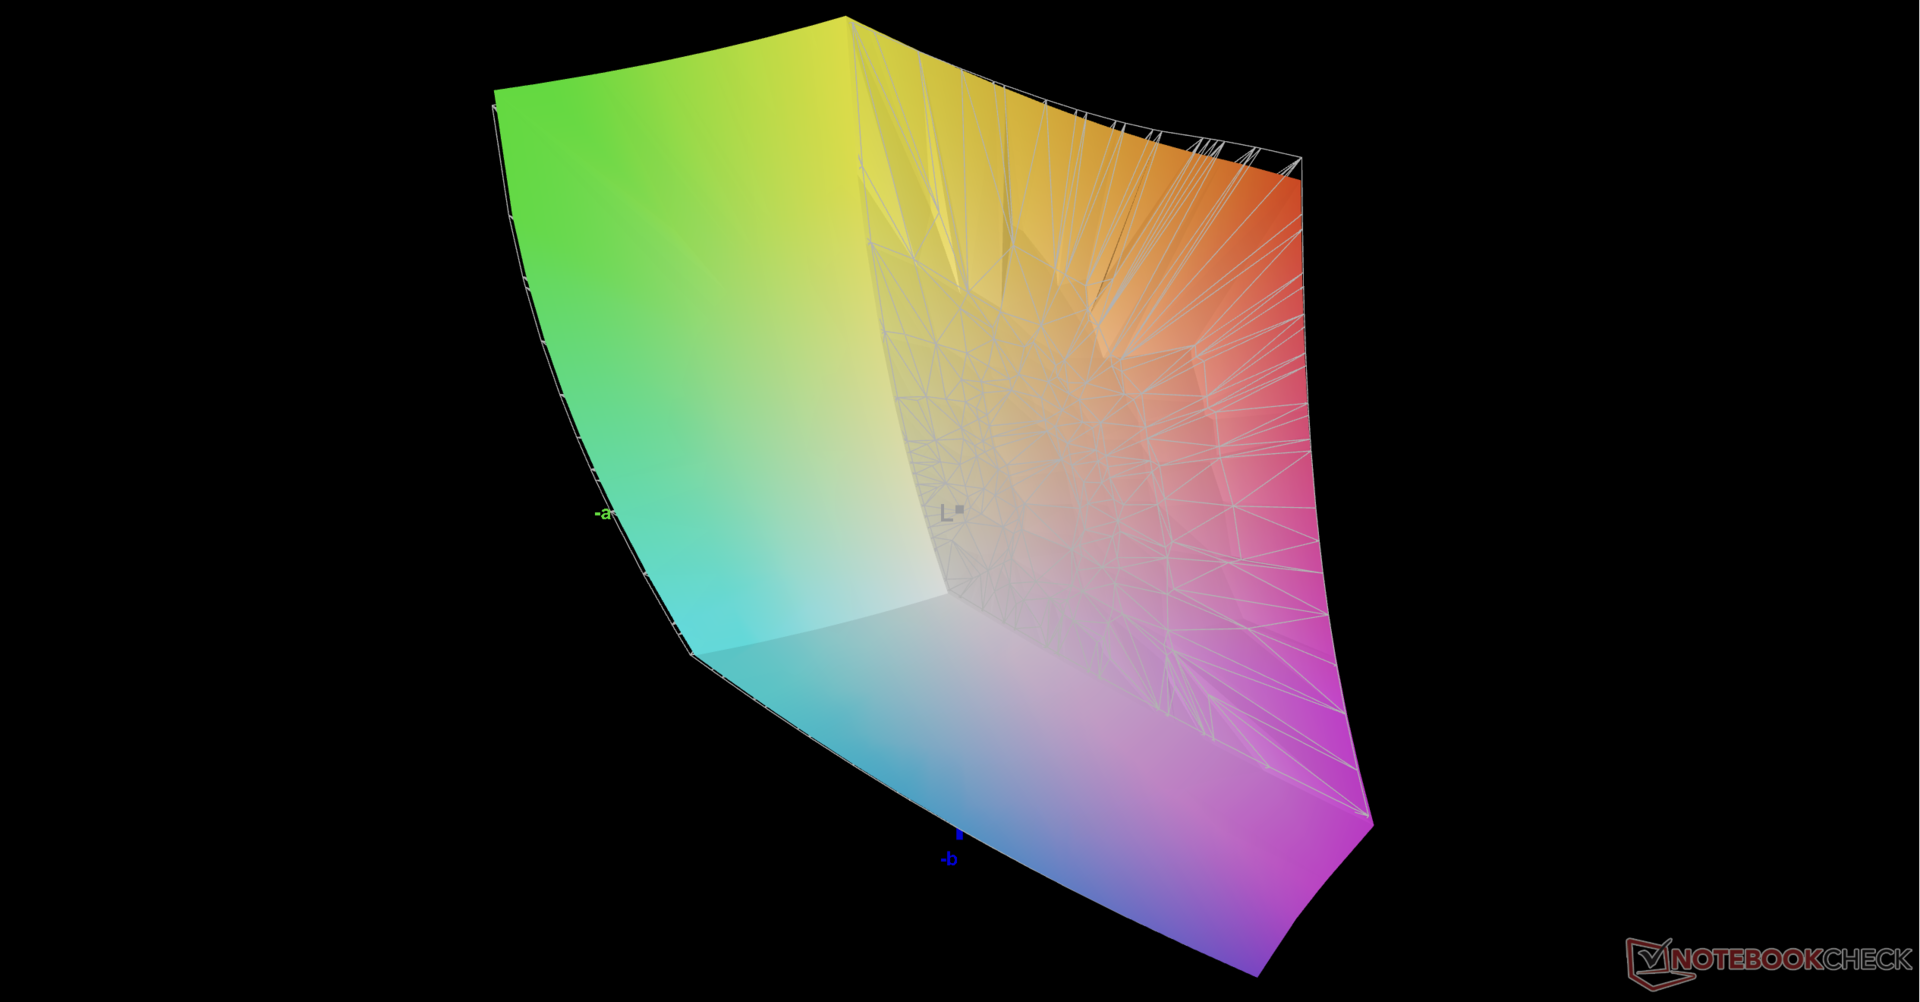
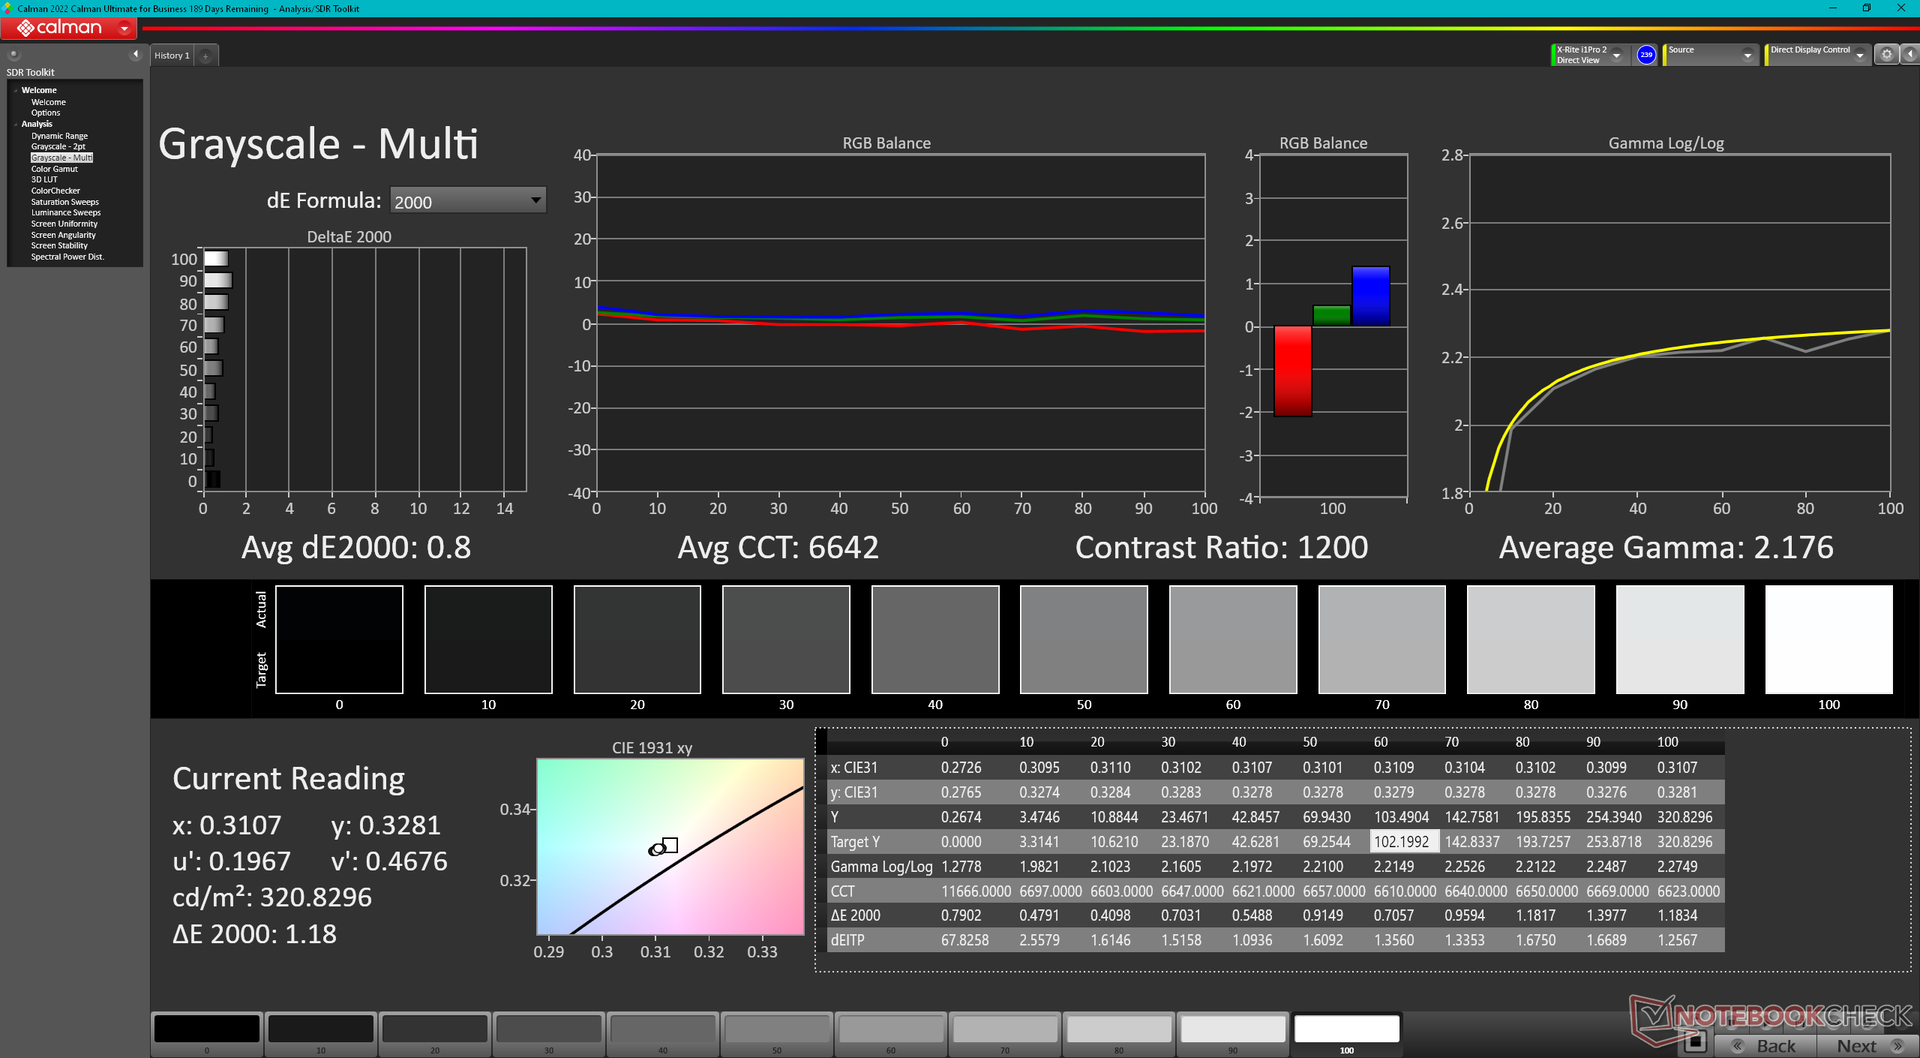
Skärmen levereras förkalibrerad med mycket låga medelvärden för gråskala och färgdeltaE på endast 1,7 respektive 1,15. En kalibrering av slutanvändaren behövs därför inte.

Visa svarstider
| ↔ Svarstid svart till vitt | ||
|---|---|---|
| 11.4 ms ... stiga ↗ och falla ↘ kombinerat | ↗ 5.9 ms stiga | 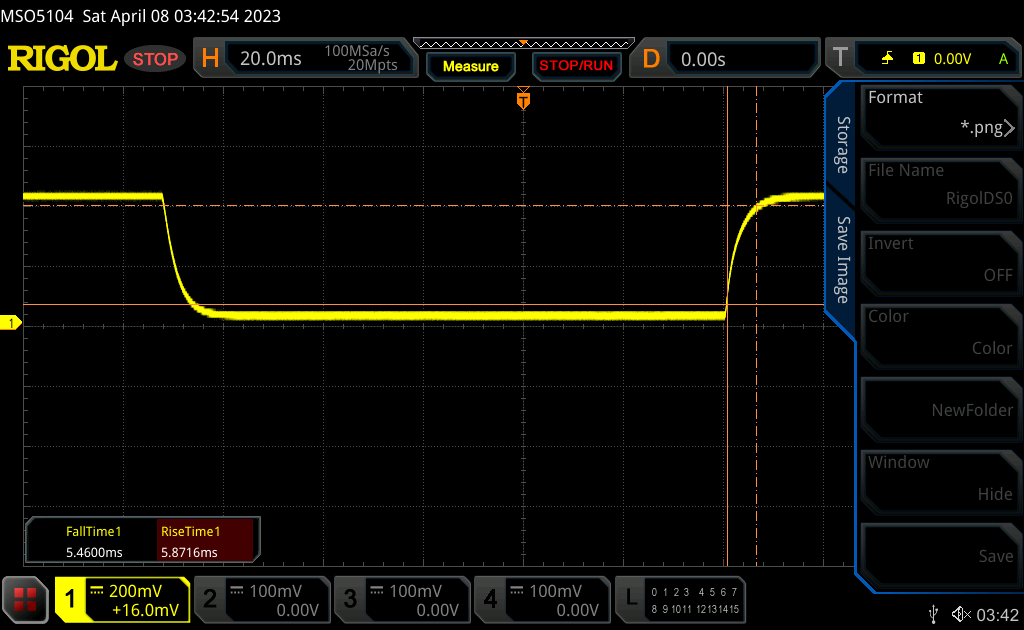 |
| ↘ 5.5 ms hösten | ||
| Skärmen visar bra svarsfrekvens i våra tester, men kan vara för långsam för konkurrenskraftiga spelare. I jämförelse sträcker sig alla testade enheter från 0.1 (minst) till 240 (maximalt) ms. » 31 % av alla enheter är bättre. Det betyder att den uppmätta svarstiden är bättre än genomsnittet av alla testade enheter (19.8 ms). | ||
| ↔ Svarstid 50 % grått till 80 % grått | ||
| 6.2 ms ... stiga ↗ och falla ↘ kombinerat | ↗ 2.8 ms stiga | 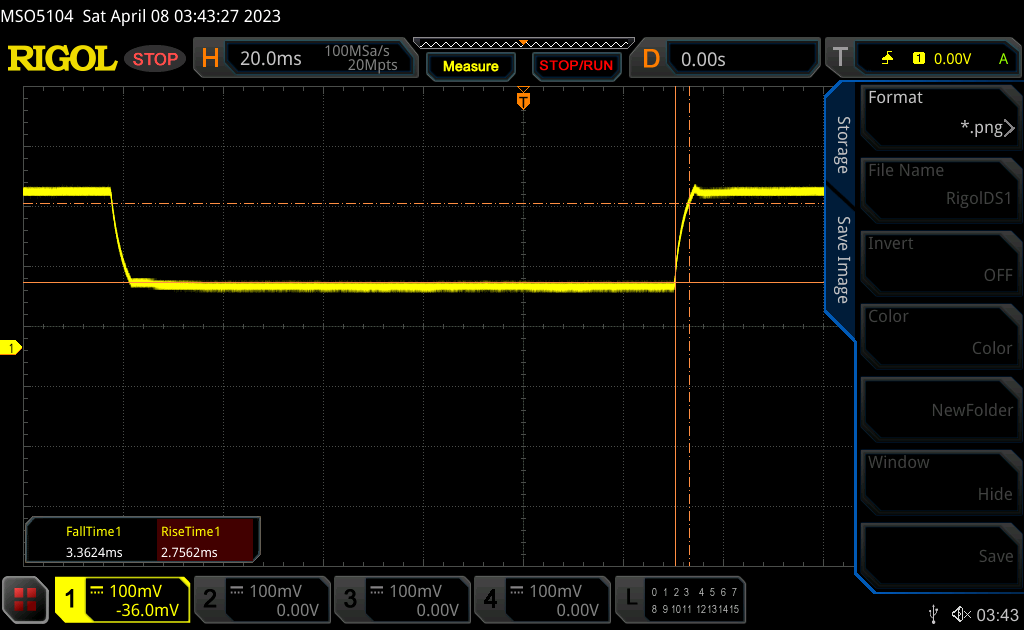 |
| ↘ 3.4 ms hösten | ||
| Skärmen visar väldigt snabba svarsfrekvenser i våra tester och borde vara mycket väl lämpad för fartfyllt spel. I jämförelse sträcker sig alla testade enheter från 0.165 (minst) till 636 (maximalt) ms. » 19 % av alla enheter är bättre. Det betyder att den uppmätta svarstiden är bättre än genomsnittet av alla testade enheter (31 ms). | ||
Skärmflimmer / PWM (Puls-Width Modulation)
| Skärmflimmer / PWM upptäcktes inte | 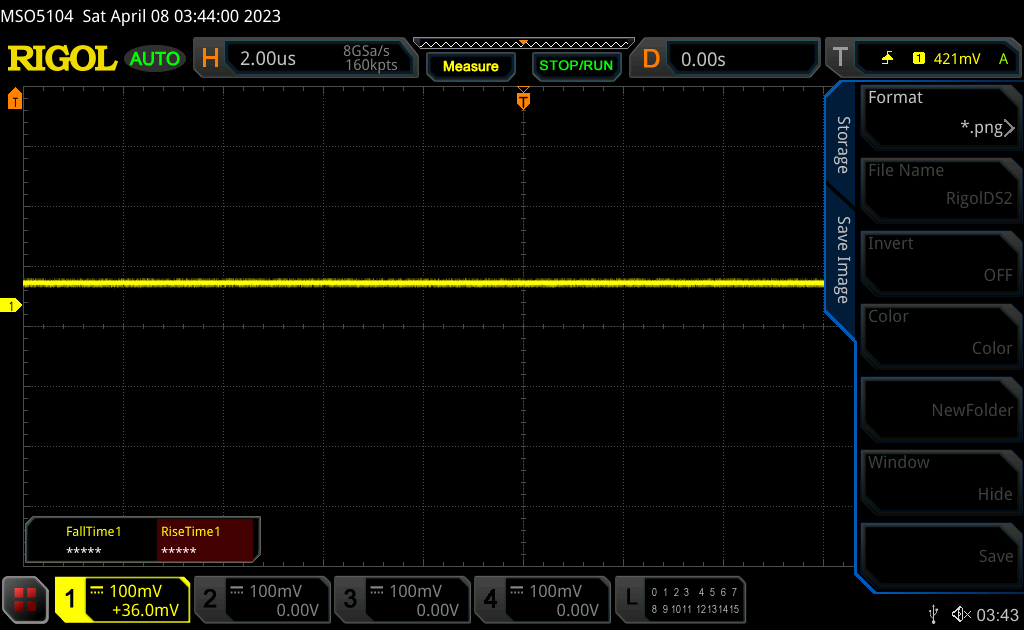 | ||
Som jämförelse: 52 % av alla testade enheter använder inte PWM för att dämpa skärmen. Om PWM upptäcktes mättes ett medelvärde av 7757 (minst: 5 - maximum: 343500) Hz. | |||
Prestanda - Stigande Ryzen
Provningsförhållanden
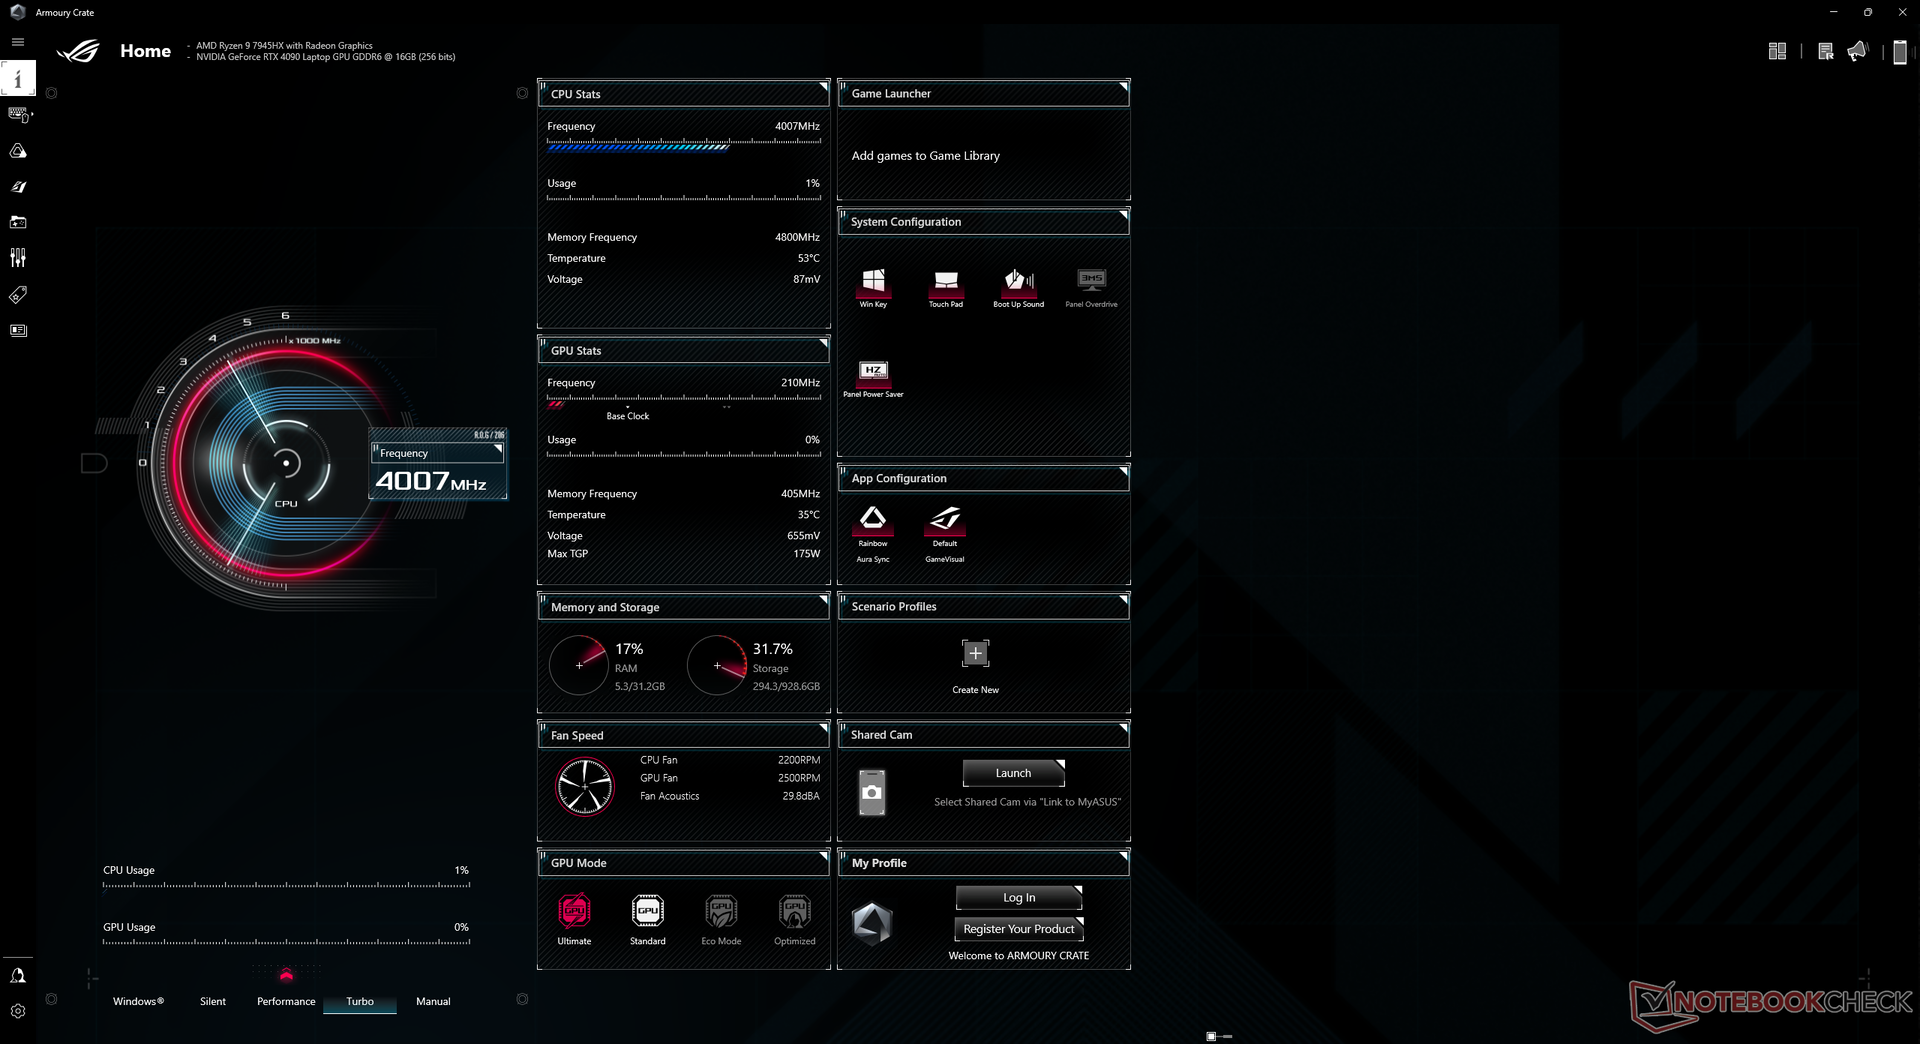
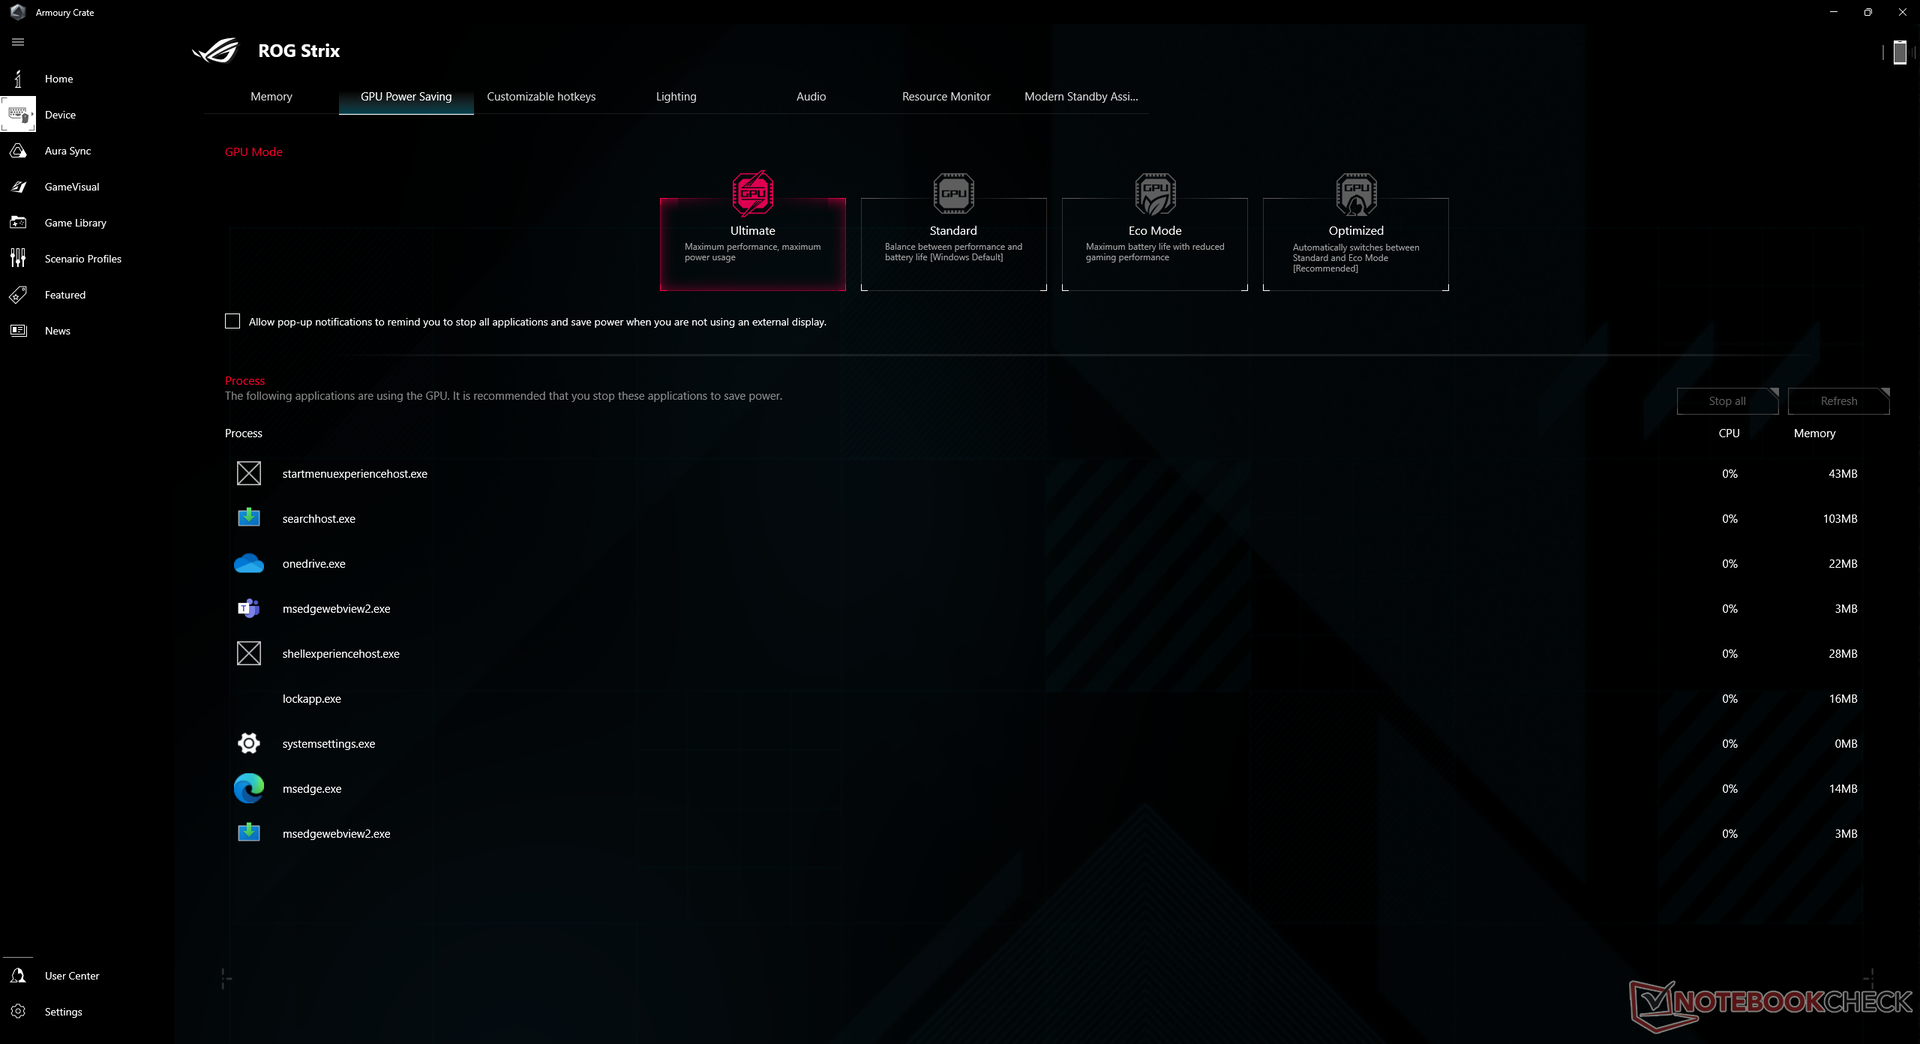
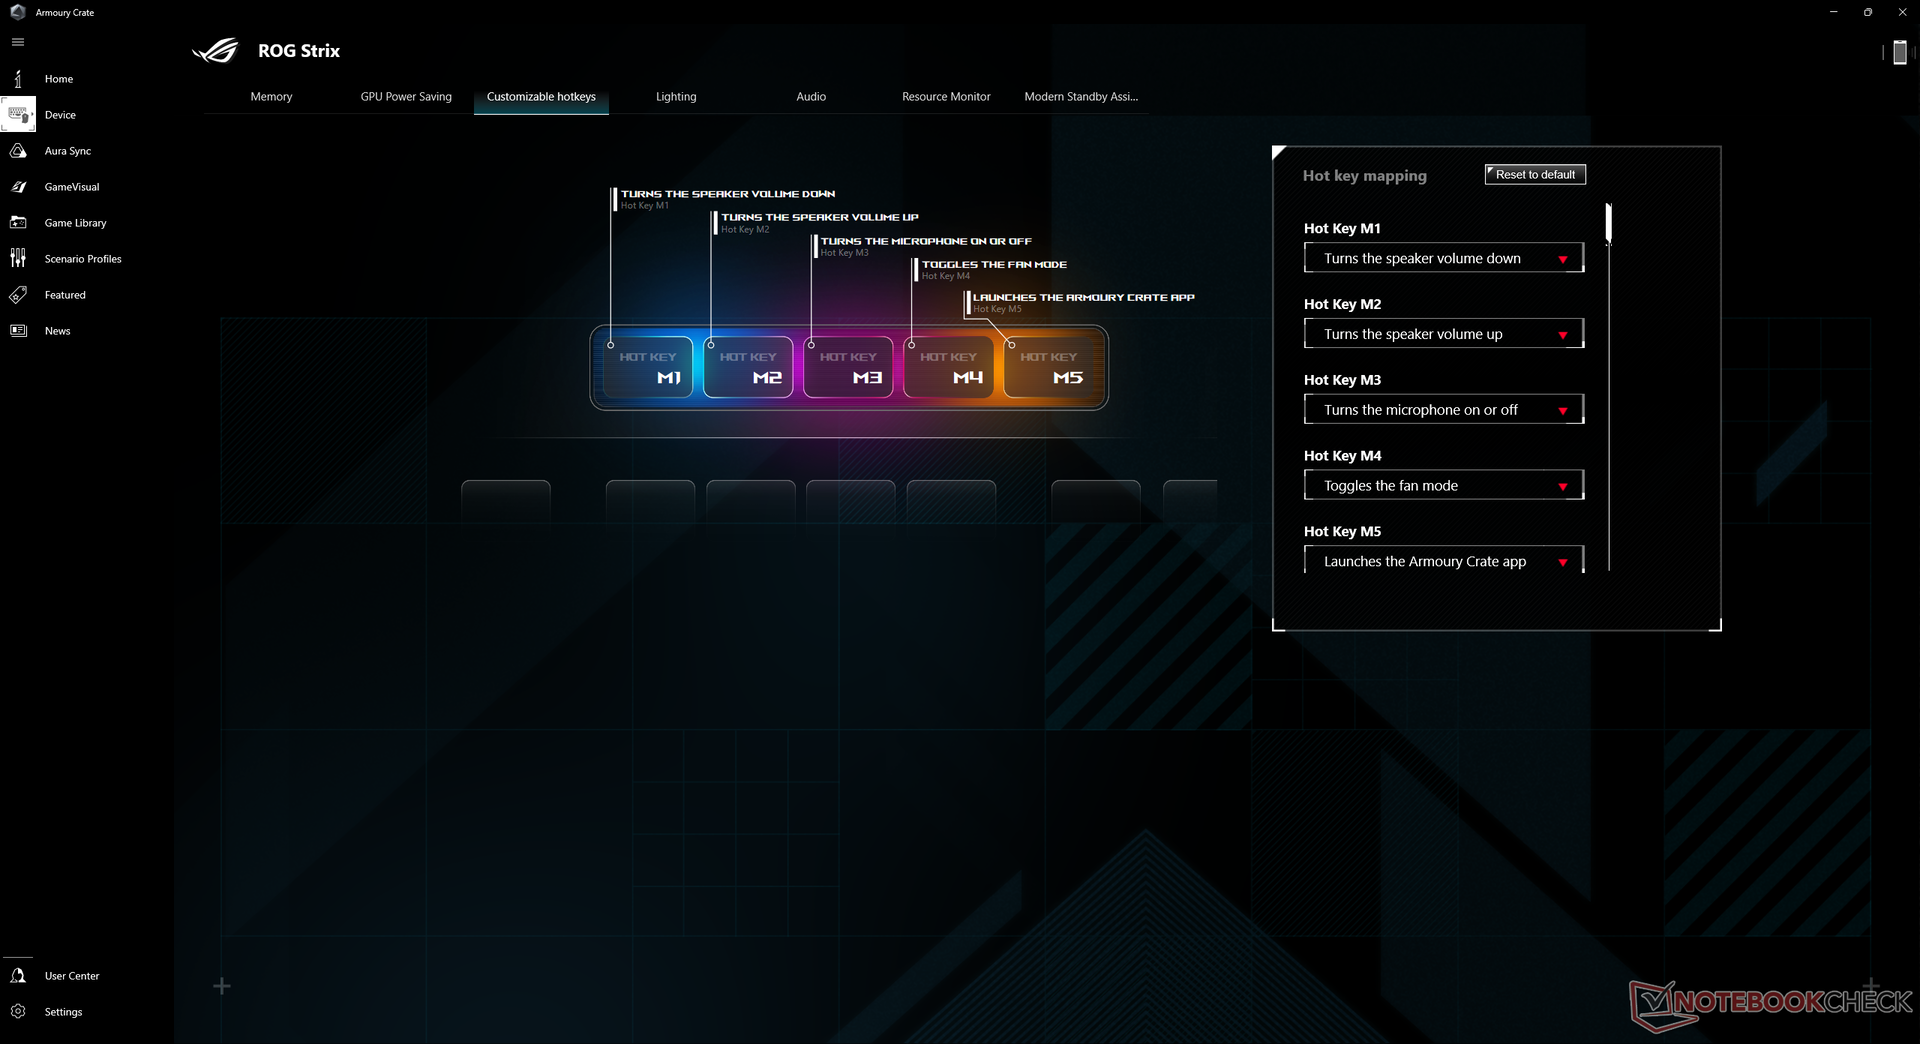
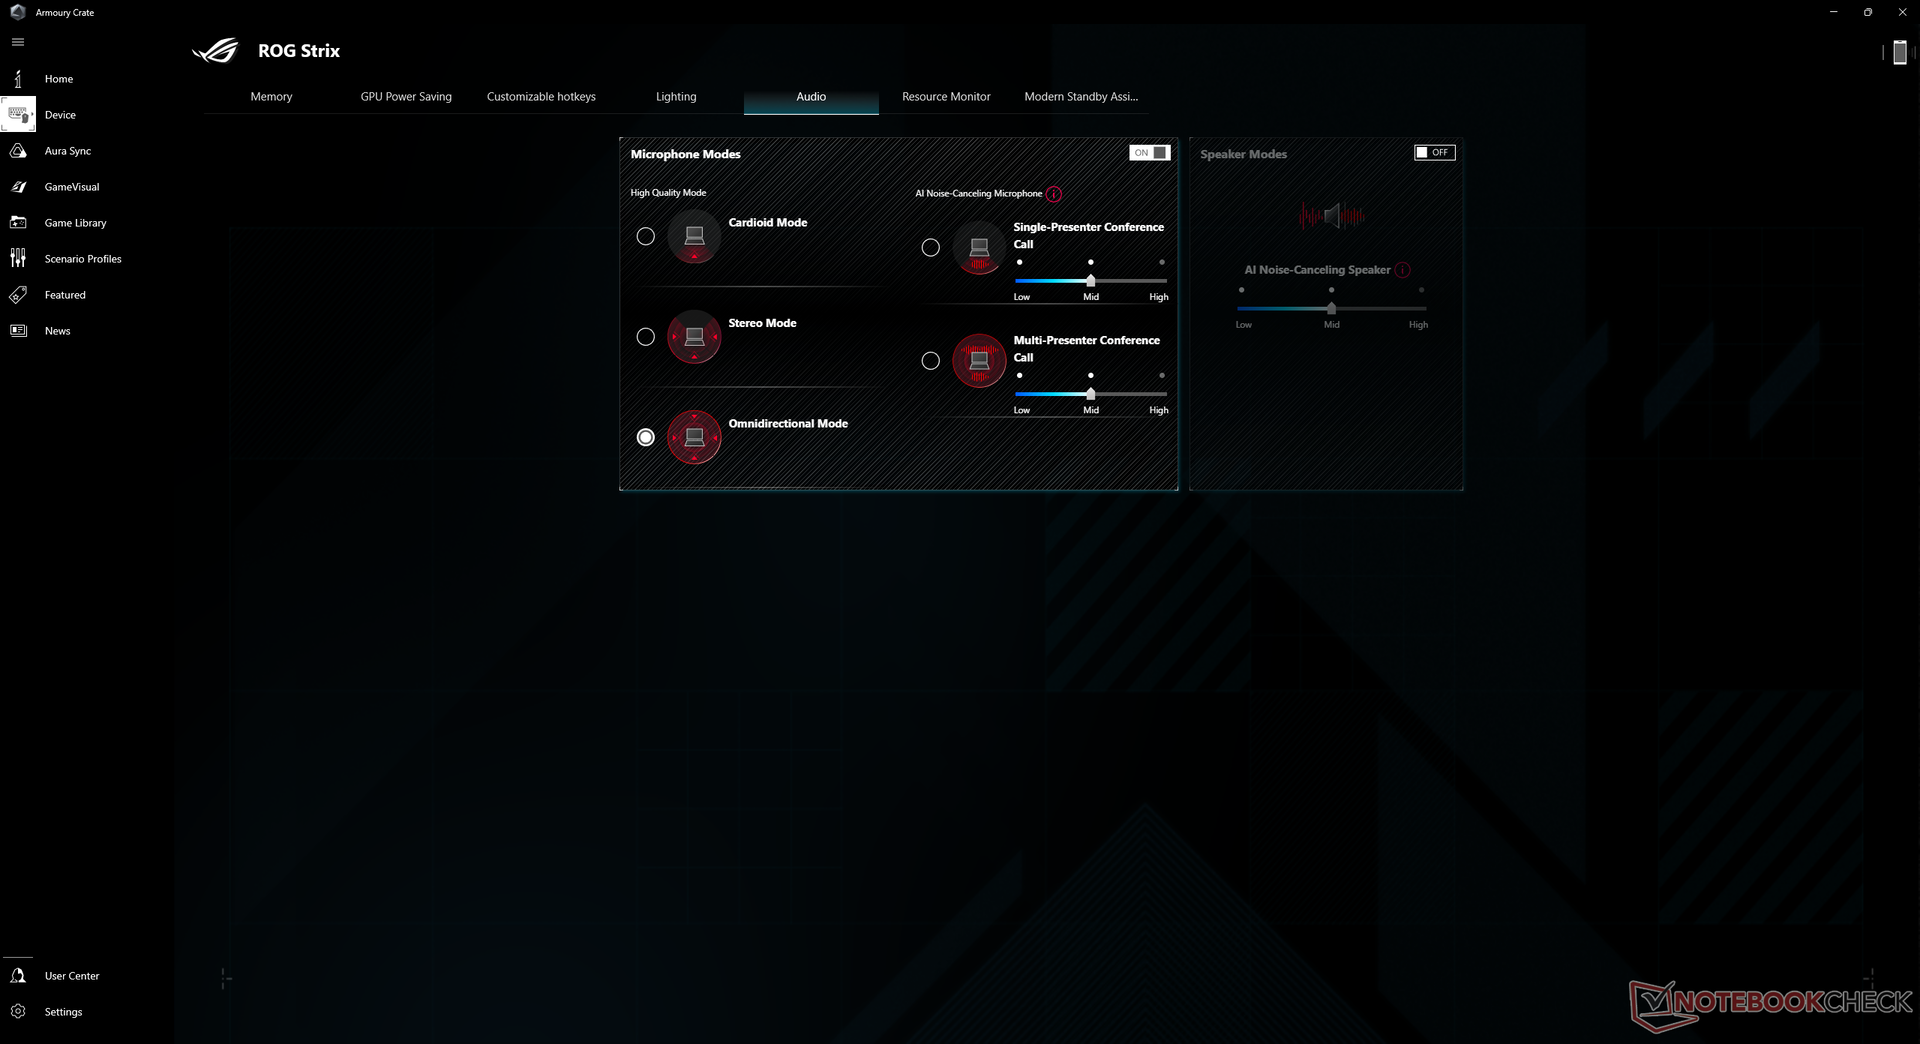
Vi ställde in vår enhet till turboläge och diskret GPU-läge via Asus Armoury Crate innan vi körde alla benchmarks nedan. Ägare uppmanas att bekanta sig med Armoury Crate eftersom det är kontrollhubben för strömlägen, MUX, Asus Aura och andra modellspecifika funktioner och uppdateringar.
Det är värt att notera att vi upplevde ett par problem på vår testenhet. När vi växlade mellan Optimus- och dGPU-lägena misslyckades systemet ibland med att ladda när vi startade om. Det krävdes då en hård omstart.
Processor
Processorprestanda är en av de snabbaste som finns på en bärbar dator, vilket beskrivs i vår recension av Ryzen 9 7945HX. Trots detta ligger den fortfarande efter den konkurrerandeCore i9-13950HX eller i9-13900HX bara något när det gäller enkeltrådade operationer.
Cinebench R15 Multi Loop
Cinebench R23: Multi Core | Single Core
Cinebench R20: CPU (Multi Core) | CPU (Single Core)
Cinebench R15: CPU Multi 64Bit | CPU Single 64Bit
Blender: v2.79 BMW27 CPU
7-Zip 18.03: 7z b 4 | 7z b 4 -mmt1
Geekbench 5.5: Multi-Core | Single-Core
HWBOT x265 Benchmark v2.2: 4k Preset
LibreOffice : 20 Documents To PDF
R Benchmark 2.5: Overall mean
* ... mindre är bättre
AIDA64: FP32 Ray-Trace | FPU Julia | CPU SHA3 | CPU Queen | FPU SinJulia | FPU Mandel | CPU AES | CPU ZLib | FP64 Ray-Trace | CPU PhotoWorxx
| Performance rating | |
| Asus ROG Strix Scar 17 G733PY-XS96 | |
| Genomsnitt AMD Ryzen 9 7945HX | |
| Asus ROG Strix G17 G713PI | |
| Eluktronics Mech-17 GP2 | |
| MSI GE78HX 13VH-070US | |
| Aorus 17X XES | |
| Alienware m17 R5 (R9 6900HX, RX 6850M XT) | |
| AIDA64 / FP32 Ray-Trace | |
| Asus ROG Strix Scar 17 G733PY-XS96 | |
| Genomsnitt AMD Ryzen 9 7945HX (50388 - 60169, n=7) | |
| Asus ROG Strix G17 G713PI | |
| MSI GE78HX 13VH-070US | |
| Eluktronics Mech-17 GP2 | |
| Alienware m17 R5 (R9 6900HX, RX 6850M XT) | |
| Aorus 17X XES | |
| AIDA64 / FPU Julia | |
| Asus ROG Strix Scar 17 G733PY-XS96 | |
| Asus ROG Strix G17 G713PI | |
| Genomsnitt AMD Ryzen 9 7945HX (201874 - 252486, n=7) | |
| MSI GE78HX 13VH-070US | |
| Eluktronics Mech-17 GP2 | |
| Alienware m17 R5 (R9 6900HX, RX 6850M XT) | |
| Aorus 17X XES | |
| AIDA64 / CPU SHA3 | |
| Asus ROG Strix Scar 17 G733PY-XS96 | |
| Genomsnitt AMD Ryzen 9 7945HX (8525 - 10389, n=7) | |
| Asus ROG Strix G17 G713PI | |
| Eluktronics Mech-17 GP2 | |
| MSI GE78HX 13VH-070US | |
| Aorus 17X XES | |
| Alienware m17 R5 (R9 6900HX, RX 6850M XT) | |
| AIDA64 / CPU Queen | |
| Asus ROG Strix Scar 17 G733PY-XS96 | |
| Genomsnitt AMD Ryzen 9 7945HX (175041 - 200651, n=7) | |
| Asus ROG Strix G17 G713PI | |
| Eluktronics Mech-17 GP2 | |
| MSI GE78HX 13VH-070US | |
| Alienware m17 R5 (R9 6900HX, RX 6850M XT) | |
| Aorus 17X XES | |
| AIDA64 / FPU SinJulia | |
| Asus ROG Strix Scar 17 G733PY-XS96 | |
| Genomsnitt AMD Ryzen 9 7945HX (28794 - 32988, n=7) | |
| Asus ROG Strix G17 G713PI | |
| Eluktronics Mech-17 GP2 | |
| MSI GE78HX 13VH-070US | |
| Alienware m17 R5 (R9 6900HX, RX 6850M XT) | |
| Aorus 17X XES | |
| AIDA64 / FPU Mandel | |
| Asus ROG Strix Scar 17 G733PY-XS96 | |
| Genomsnitt AMD Ryzen 9 7945HX (105740 - 134044, n=7) | |
| Asus ROG Strix G17 G713PI | |
| MSI GE78HX 13VH-070US | |
| Eluktronics Mech-17 GP2 | |
| Alienware m17 R5 (R9 6900HX, RX 6850M XT) | |
| Aorus 17X XES | |
| AIDA64 / CPU AES | |
| Eluktronics Mech-17 GP2 | |
| Genomsnitt AMD Ryzen 9 7945HX (126790 - 325960, n=7) | |
| Asus ROG Strix Scar 17 G733PY-XS96 | |
| Asus ROG Strix G17 G713PI | |
| MSI GE78HX 13VH-070US | |
| Aorus 17X XES | |
| Alienware m17 R5 (R9 6900HX, RX 6850M XT) | |
| AIDA64 / CPU ZLib | |
| Asus ROG Strix Scar 17 G733PY-XS96 | |
| Genomsnitt AMD Ryzen 9 7945HX (2022 - 2409, n=7) | |
| Asus ROG Strix G17 G713PI | |
| MSI GE78HX 13VH-070US | |
| Eluktronics Mech-17 GP2 | |
| Aorus 17X XES | |
| Alienware m17 R5 (R9 6900HX, RX 6850M XT) | |
| AIDA64 / FP64 Ray-Trace | |
| Asus ROG Strix Scar 17 G733PY-XS96 | |
| Genomsnitt AMD Ryzen 9 7945HX (26875 - 31796, n=7) | |
| Asus ROG Strix G17 G713PI | |
| MSI GE78HX 13VH-070US | |
| Eluktronics Mech-17 GP2 | |
| Alienware m17 R5 (R9 6900HX, RX 6850M XT) | |
| Aorus 17X XES | |
| AIDA64 / CPU PhotoWorxx | |
| MSI GE78HX 13VH-070US | |
| Eluktronics Mech-17 GP2 | |
| Aorus 17X XES | |
| Genomsnitt AMD Ryzen 9 7945HX (31421 - 40095, n=7) | |
| Asus ROG Strix Scar 17 G733PY-XS96 | |
| Asus ROG Strix G17 G713PI | |
| Alienware m17 R5 (R9 6900HX, RX 6850M XT) | |
Systemets prestanda
CrossMark: Overall | Productivity | Creativity | Responsiveness
| PCMark 10 / Score | |
| Eluktronics Mech-17 GP2 | |
| Genomsnitt AMD Ryzen 9 7945HX, NVIDIA GeForce RTX 4090 Laptop GPU (8733 - 9151, n=2) | |
| MSI GE78HX 13VH-070US | |
| Asus ROG Strix Scar 17 G733PY-XS96 | |
| Aorus 17X XES | |
| Asus ROG Strix G17 G713PI | |
| Alienware m17 R5 (R9 6900HX, RX 6850M XT) | |
| Asus ROG Strix Scar 17 SE G733CX-LL014W | |
| PCMark 10 / Essentials | |
| Eluktronics Mech-17 GP2 | |
| Genomsnitt AMD Ryzen 9 7945HX, NVIDIA GeForce RTX 4090 Laptop GPU (11165 - 12176, n=2) | |
| MSI GE78HX 13VH-070US | |
| Asus ROG Strix G17 G713PI | |
| Asus ROG Strix Scar 17 G733PY-XS96 | |
| Aorus 17X XES | |
| Asus ROG Strix Scar 17 SE G733CX-LL014W | |
| Alienware m17 R5 (R9 6900HX, RX 6850M XT) | |
| PCMark 10 / Productivity | |
| Asus ROG Strix G17 G713PI | |
| Genomsnitt AMD Ryzen 9 7945HX, NVIDIA GeForce RTX 4090 Laptop GPU (10266 - 11833, n=2) | |
| Eluktronics Mech-17 GP2 | |
| MSI GE78HX 13VH-070US | |
| Asus ROG Strix Scar 17 G733PY-XS96 | |
| Aorus 17X XES | |
| Asus ROG Strix Scar 17 SE G733CX-LL014W | |
| Alienware m17 R5 (R9 6900HX, RX 6850M XT) | |
| PCMark 10 / Digital Content Creation | |
| Asus ROG Strix Scar 17 G733PY-XS96 | |
| Eluktronics Mech-17 GP2 | |
| MSI GE78HX 13VH-070US | |
| Genomsnitt AMD Ryzen 9 7945HX, NVIDIA GeForce RTX 4090 Laptop GPU (14432 - 15768, n=2) | |
| Aorus 17X XES | |
| Alienware m17 R5 (R9 6900HX, RX 6850M XT) | |
| Asus ROG Strix Scar 17 SE G733CX-LL014W | |
| Asus ROG Strix G17 G713PI | |
| CrossMark / Overall | |
| Eluktronics Mech-17 GP2 | |
| Aorus 17X XES | |
| Asus ROG Strix Scar 17 SE G733CX-LL014W | |
| Asus ROG Strix G17 G713PI | |
| Genomsnitt AMD Ryzen 9 7945HX, NVIDIA GeForce RTX 4090 Laptop GPU (1993 - 2078, n=2) | |
| Asus ROG Strix Scar 17 G733PY-XS96 | |
| MSI GE78HX 13VH-070US | |
| Alienware m17 R5 (R9 6900HX, RX 6850M XT) | |
| CrossMark / Productivity | |
| Eluktronics Mech-17 GP2 | |
| Aorus 17X XES | |
| Asus ROG Strix Scar 17 SE G733CX-LL014W | |
| Asus ROG Strix G17 G713PI | |
| Genomsnitt AMD Ryzen 9 7945HX, NVIDIA GeForce RTX 4090 Laptop GPU (1838 - 1946, n=2) | |
| MSI GE78HX 13VH-070US | |
| Asus ROG Strix Scar 17 G733PY-XS96 | |
| Alienware m17 R5 (R9 6900HX, RX 6850M XT) | |
| CrossMark / Creativity | |
| Eluktronics Mech-17 GP2 | |
| Genomsnitt AMD Ryzen 9 7945HX, NVIDIA GeForce RTX 4090 Laptop GPU (2334 - 2377, n=2) | |
| Asus ROG Strix Scar 17 SE G733CX-LL014W | |
| Asus ROG Strix Scar 17 G733PY-XS96 | |
| Asus ROG Strix G17 G713PI | |
| Aorus 17X XES | |
| MSI GE78HX 13VH-070US | |
| Alienware m17 R5 (R9 6900HX, RX 6850M XT) | |
| CrossMark / Responsiveness | |
| Aorus 17X XES | |
| Asus ROG Strix Scar 17 SE G733CX-LL014W | |
| Eluktronics Mech-17 GP2 | |
| MSI GE78HX 13VH-070US | |
| Asus ROG Strix G17 G713PI | |
| Genomsnitt AMD Ryzen 9 7945HX, NVIDIA GeForce RTX 4090 Laptop GPU (1584 - 1689, n=2) | |
| Asus ROG Strix Scar 17 G733PY-XS96 | |
| Alienware m17 R5 (R9 6900HX, RX 6850M XT) | |
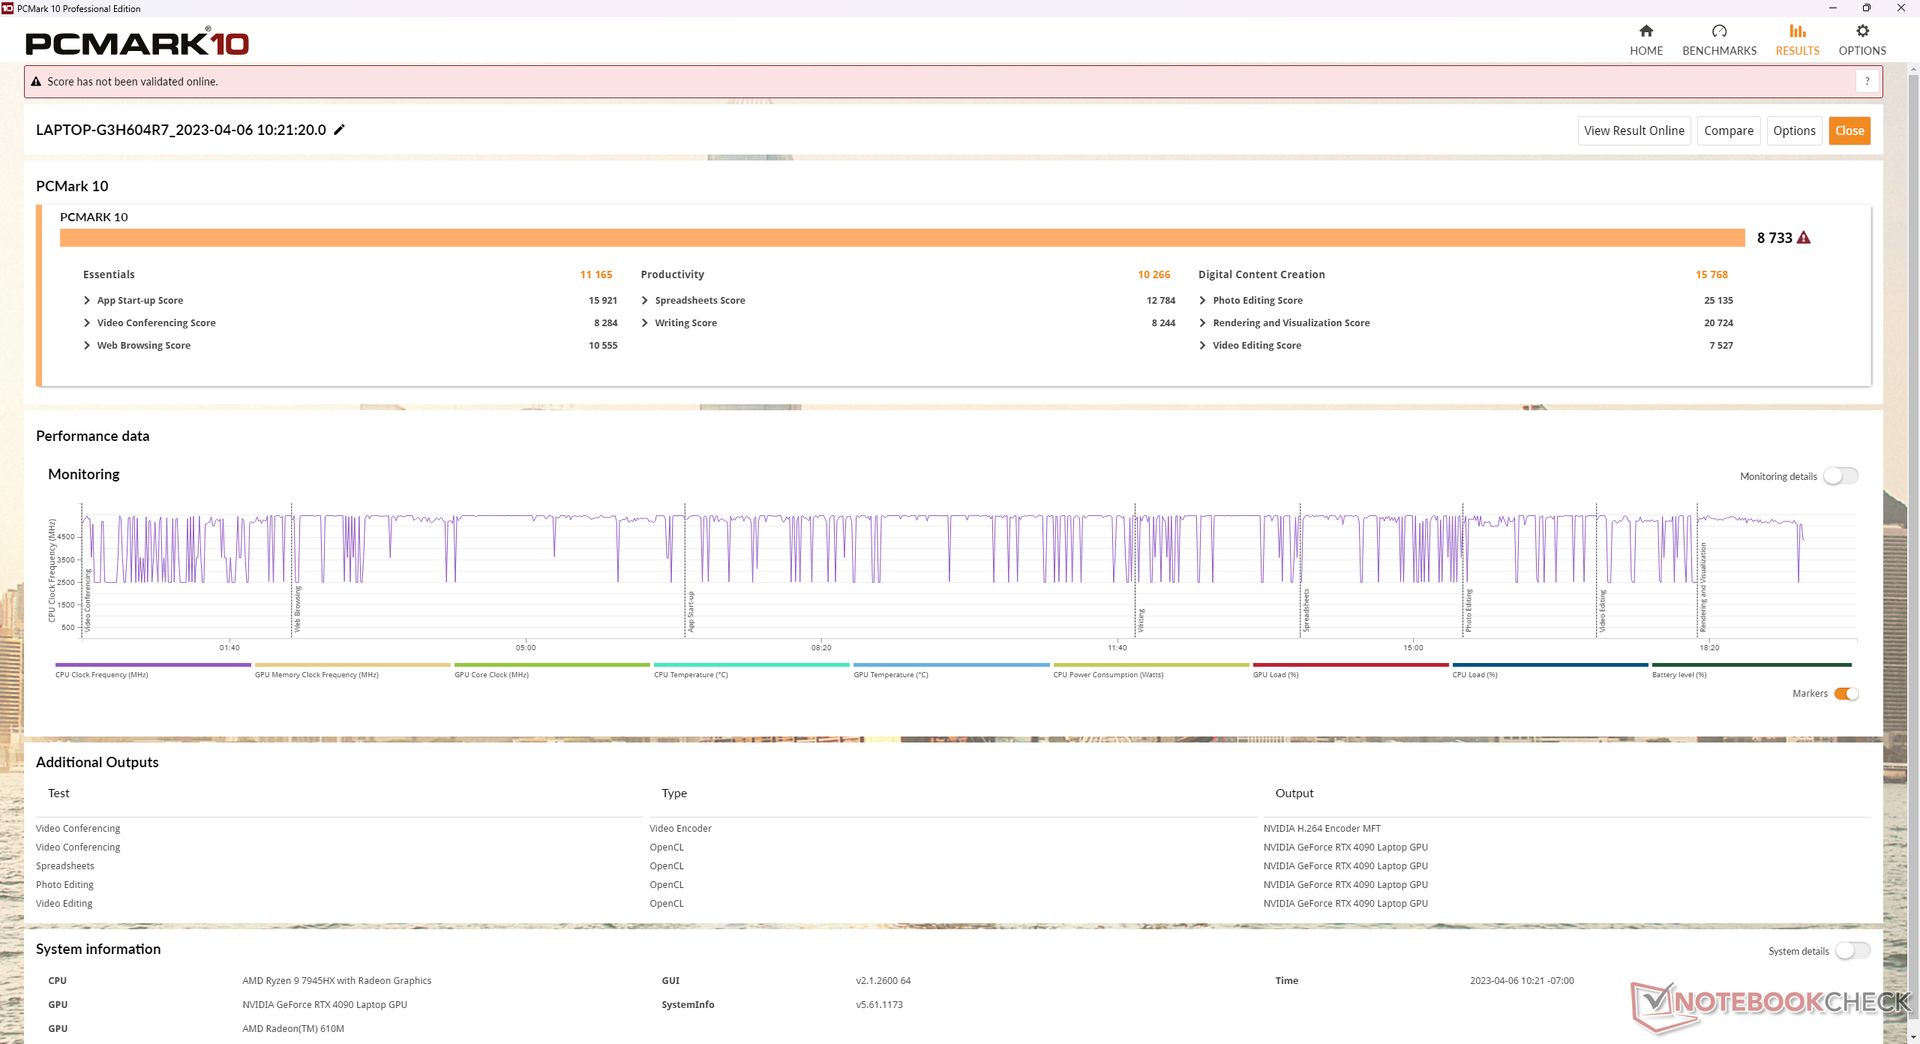
| PCMark 10 Score | 8733 poäng | |
Hjälp | ||
| AIDA64 / Memory Copy | |
| MSI GE78HX 13VH-070US | |
| Eluktronics Mech-17 GP2 | |
| Aorus 17X XES | |
| Genomsnitt AMD Ryzen 9 7945HX (48948 - 57953, n=7) | |
| Alienware m17 R5 (R9 6900HX, RX 6850M XT) | |
| Asus ROG Strix Scar 17 G733PY-XS96 | |
| Asus ROG Strix G17 G713PI | |
| AIDA64 / Memory Read | |
| MSI GE78HX 13VH-070US | |
| Eluktronics Mech-17 GP2 | |
| Aorus 17X XES | |
| Genomsnitt AMD Ryzen 9 7945HX (56910 - 67753, n=7) | |
| Asus ROG Strix G17 G713PI | |
| Asus ROG Strix Scar 17 G733PY-XS96 | |
| Alienware m17 R5 (R9 6900HX, RX 6850M XT) | |
| AIDA64 / Memory Write | |
| MSI GE78HX 13VH-070US | |
| Eluktronics Mech-17 GP2 | |
| Genomsnitt AMD Ryzen 9 7945HX (58602 - 70063, n=7) | |
| Aorus 17X XES | |
| Asus ROG Strix Scar 17 G733PY-XS96 | |
| Asus ROG Strix G17 G713PI | |
| Alienware m17 R5 (R9 6900HX, RX 6850M XT) | |
| AIDA64 / Memory Latency | |
| Alienware m17 R5 (R9 6900HX, RX 6850M XT) | |
| Eluktronics Mech-17 GP2 | |
| Aorus 17X XES | |
| Asus ROG Strix G17 G713PI | |
| MSI GE78HX 13VH-070US | |
| Genomsnitt AMD Ryzen 9 7945HX (77.1 - 91.3, n=7) | |
| Asus ROG Strix Scar 17 G733PY-XS96 | |
* ... mindre är bättre
DPC-latenstid
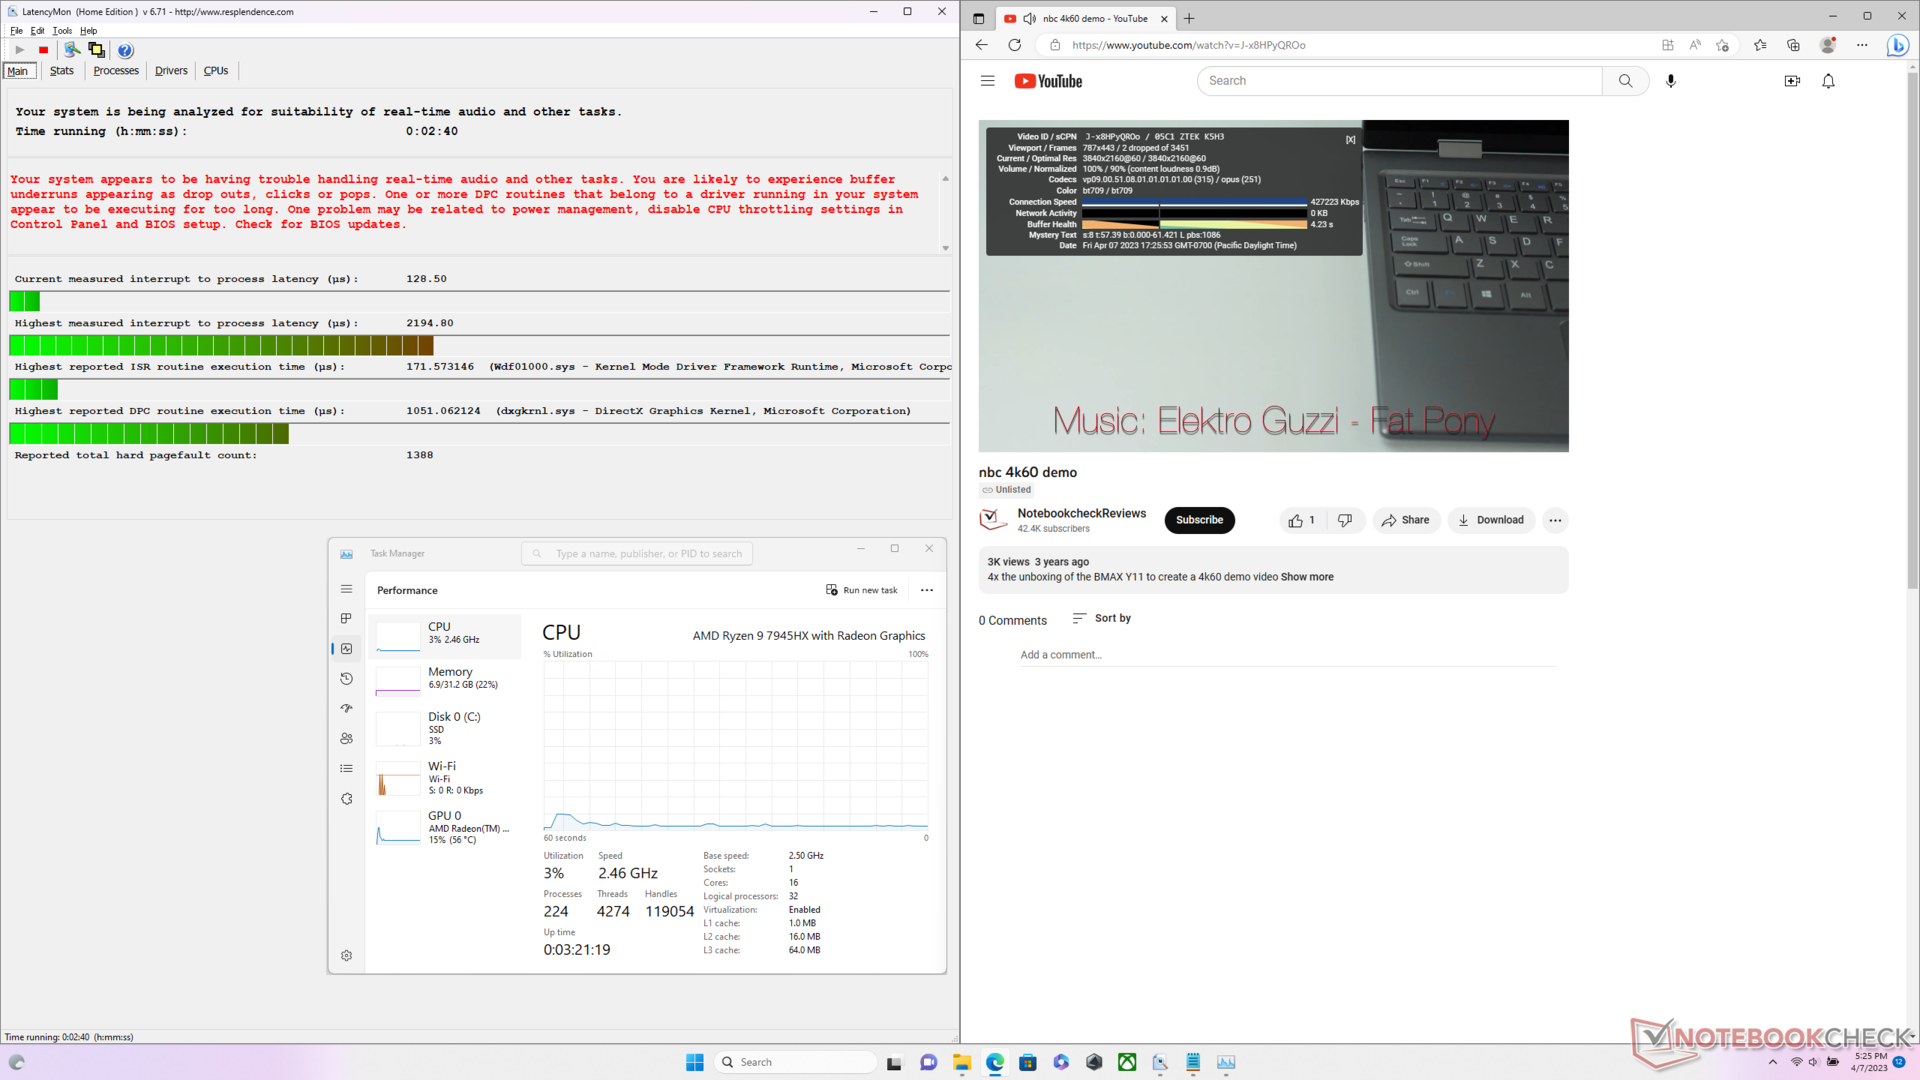
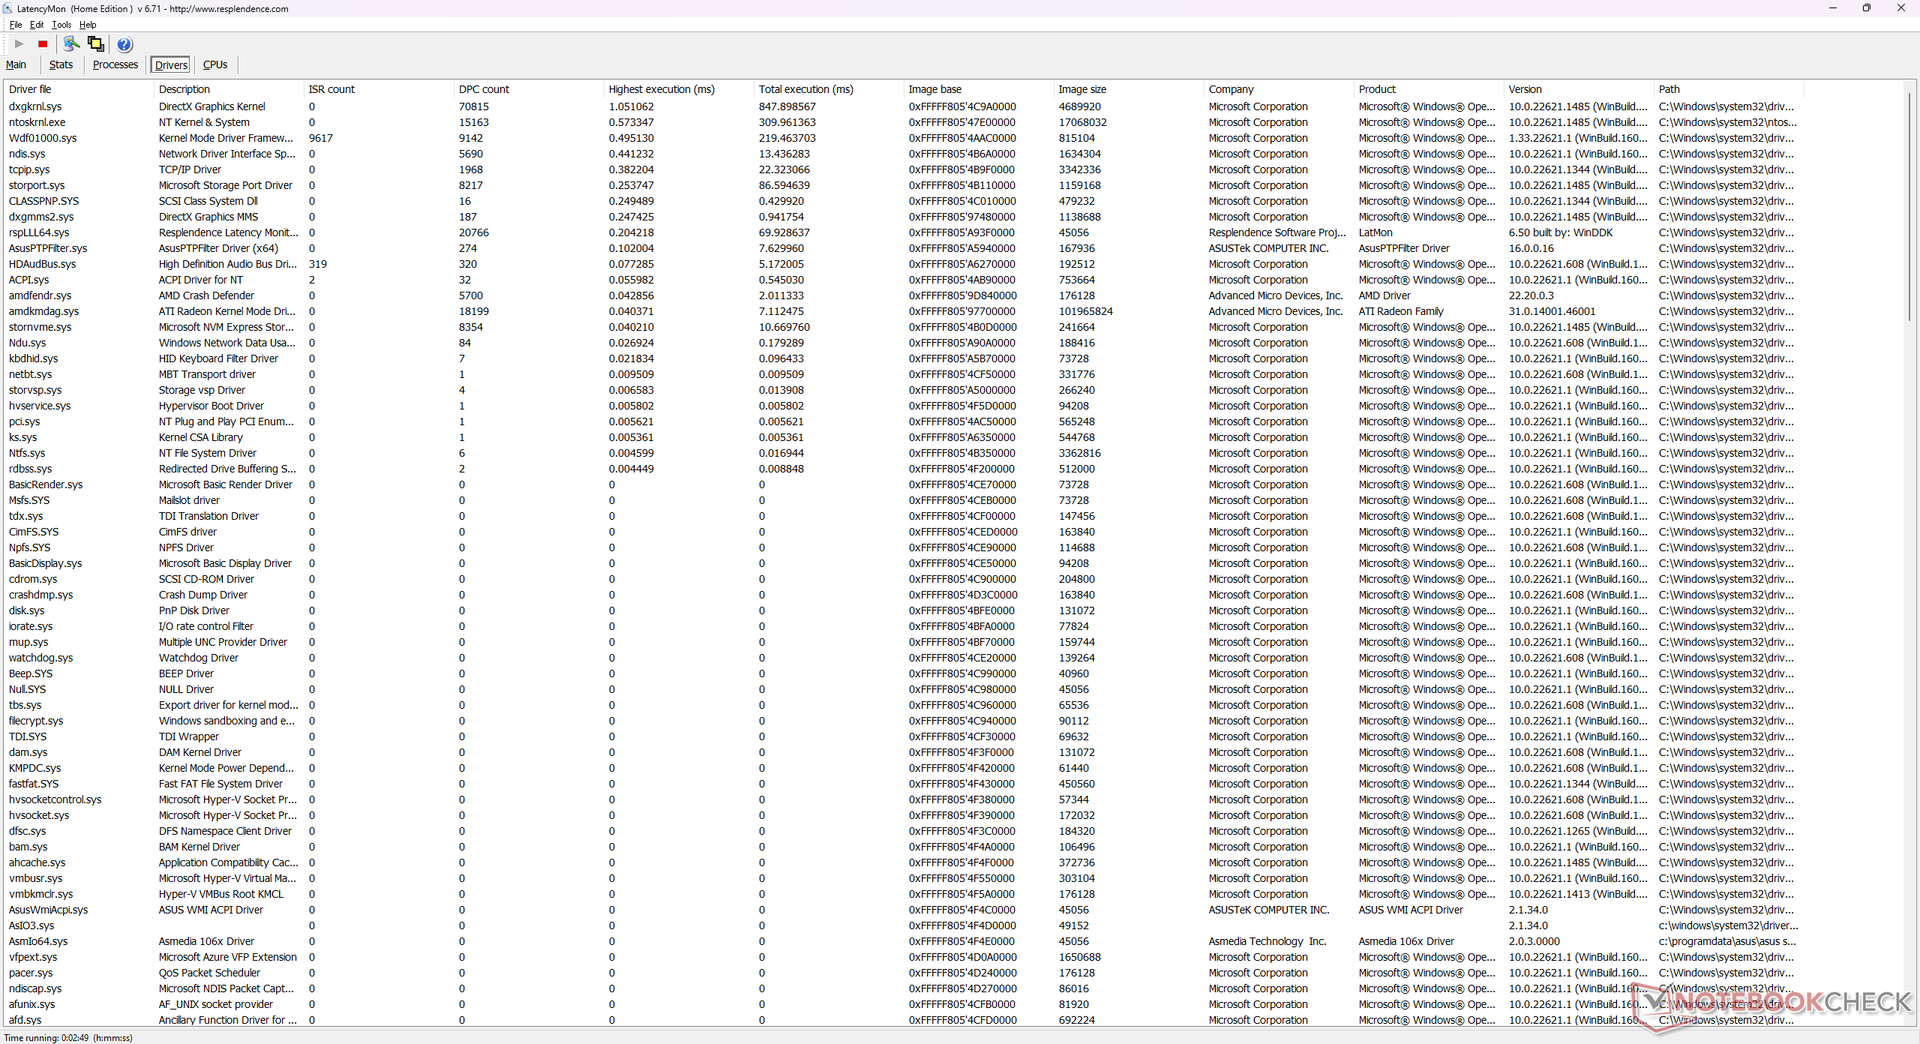
LatencyMon visar inga DPC-problem när flera webbläsarflikar öppnas på vår hemsida. Om Prime95 kördes skulle dock en hög avbrottslatensitet uppstå. Vi kunde registrera 2 tappade bilder när vi spelade upp vår enminuters 4K60-testvideo.
| DPC Latencies / LatencyMon - interrupt to process latency (max), Web, Youtube, Prime95 | |
| MSI GE78HX 13VH-070US | |
| Asus ROG Strix Scar 17 SE G733CX-LL014W | |
| Asus ROG Strix Scar 17 G733PY-XS96 | |
| Asus ROG Strix G17 G713PI | |
| Alienware m17 R5 (R9 6900HX, RX 6850M XT) | |
| Eluktronics Mech-17 GP2 | |
* ... mindre är bättre
Lagringsenheter - Prestanda strypning upptäckt
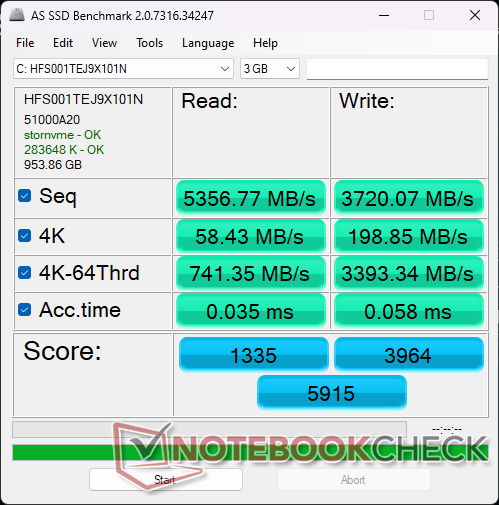
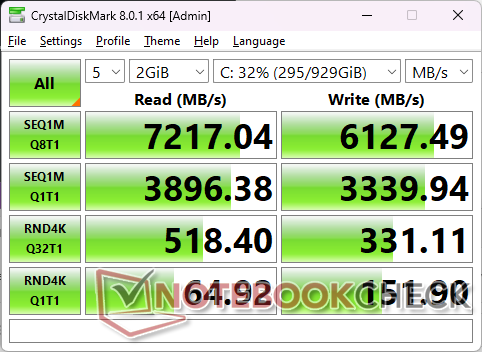
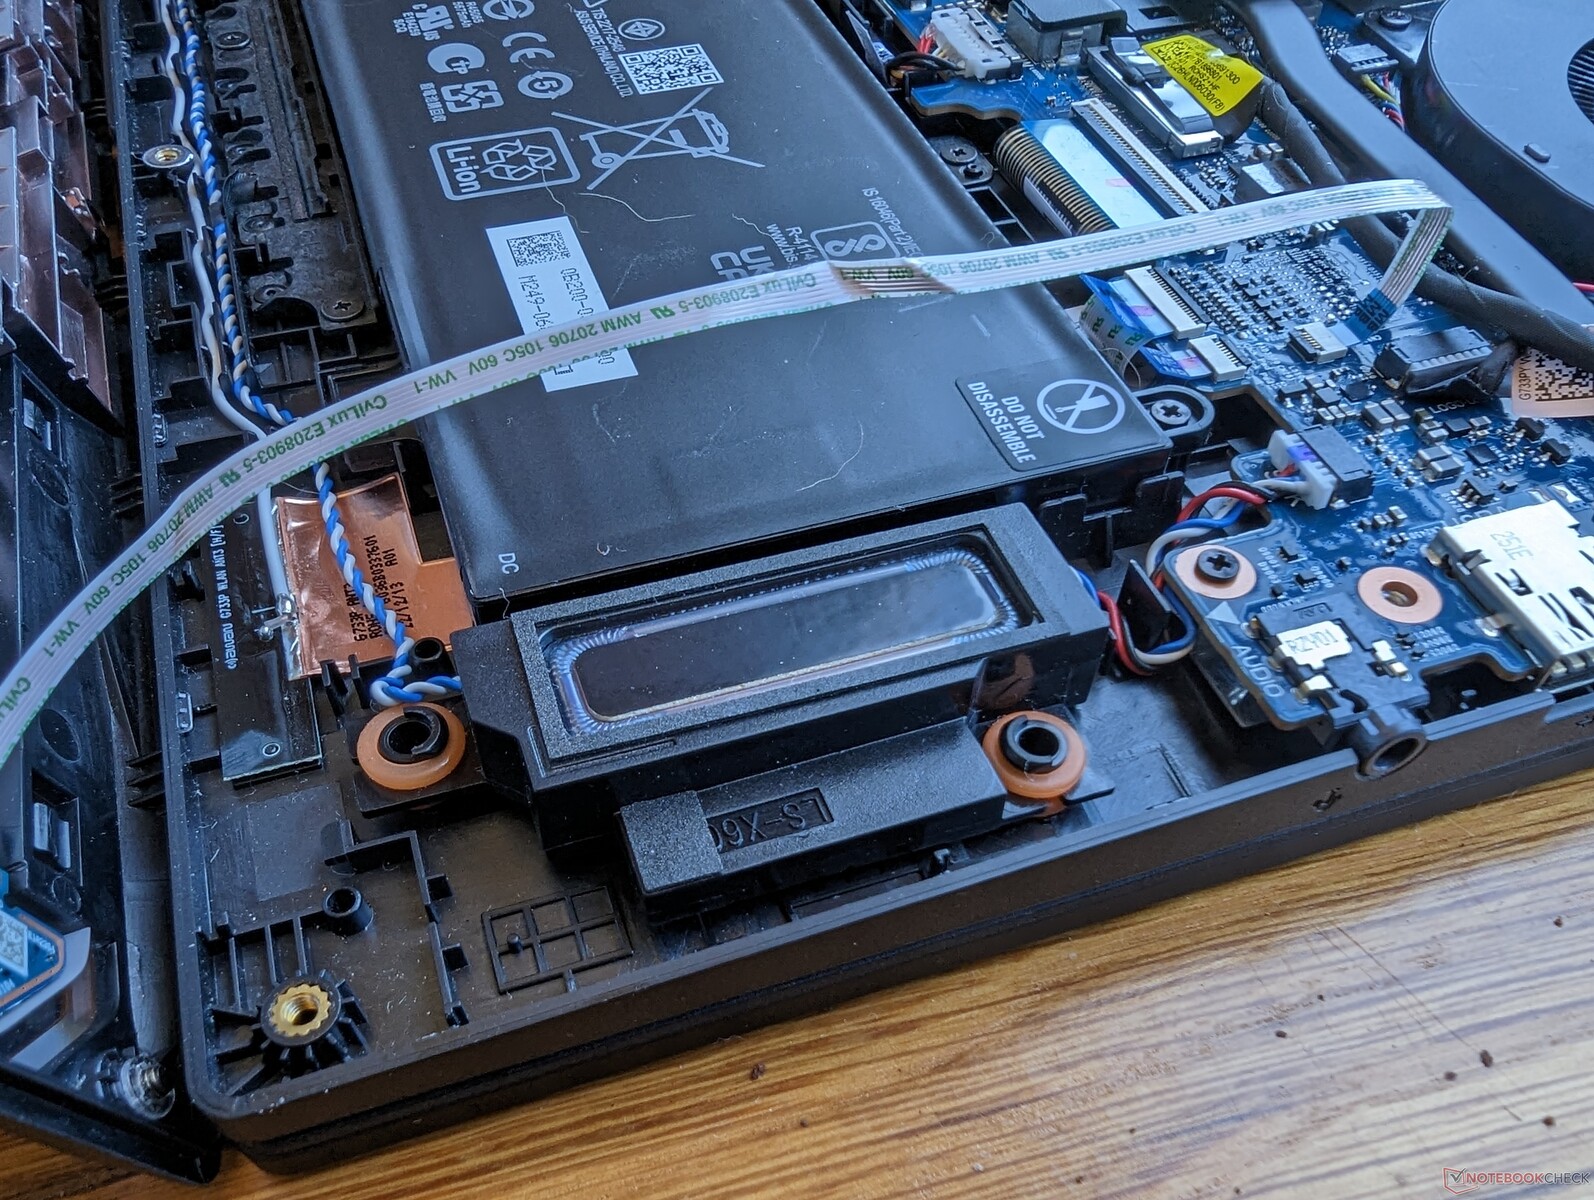
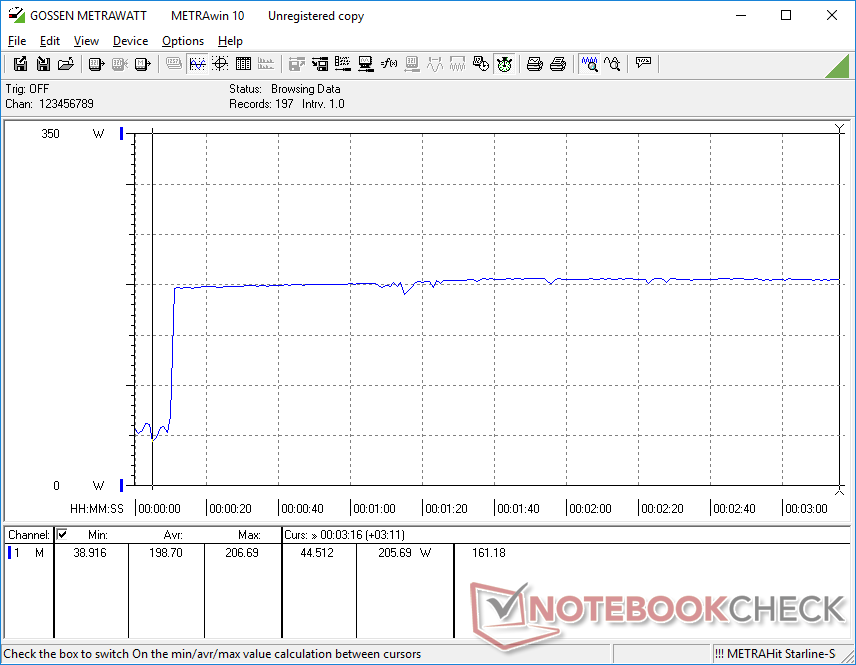
Vår enhet levereras med en 1 TB SK hynix PC801 för sekventiell läs- och skrivhastighet på cirka 7200 MB/s respektive 6200 MB/s. Enheten i vår enhet uppvisade dock problem med prestandaförlust efter cirka 4 minuters belastning, vilket framgår av diagrammet nedan. Det finns ingen värmespridare eller värmekudde på SSD-enheterna för att hjälpa till med värmeavledningen.

| Drive Performance rating - Percent | |
| Aorus 17X XES | |
| MSI GE78HX 13VH-070US | |
| Asus ROG Strix Scar 17 G733PY-XS96 | |
| Eluktronics Mech-17 GP2 | |
| Alienware m17 R5 (R9 6900HX, RX 6850M XT) | |
| Asus ROG Strix G17 G713PI | |
* ... mindre är bättre
Disk Throttling: DiskSpd Read Loop, Queue Depth 8
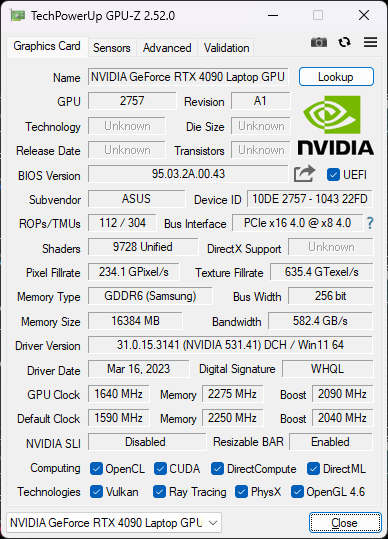
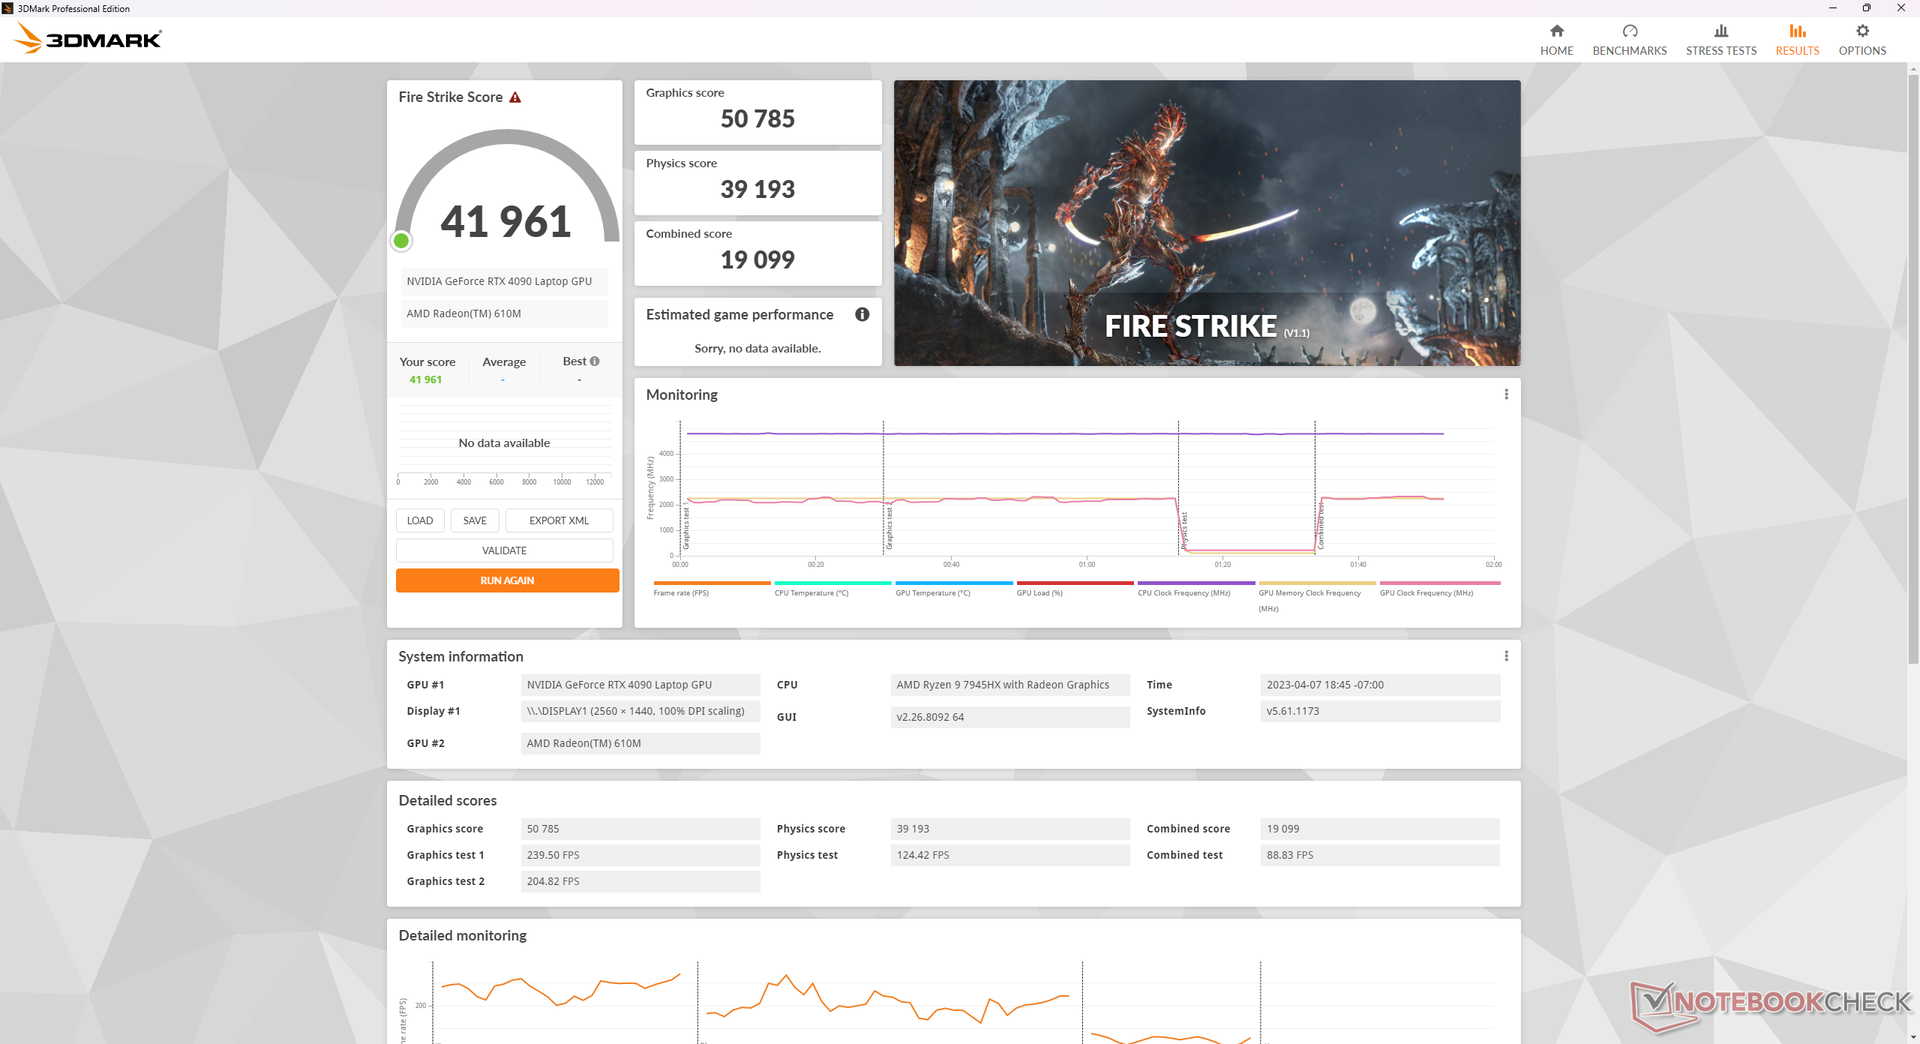
GPU-prestanda - 175 W GeForce RTX 4090
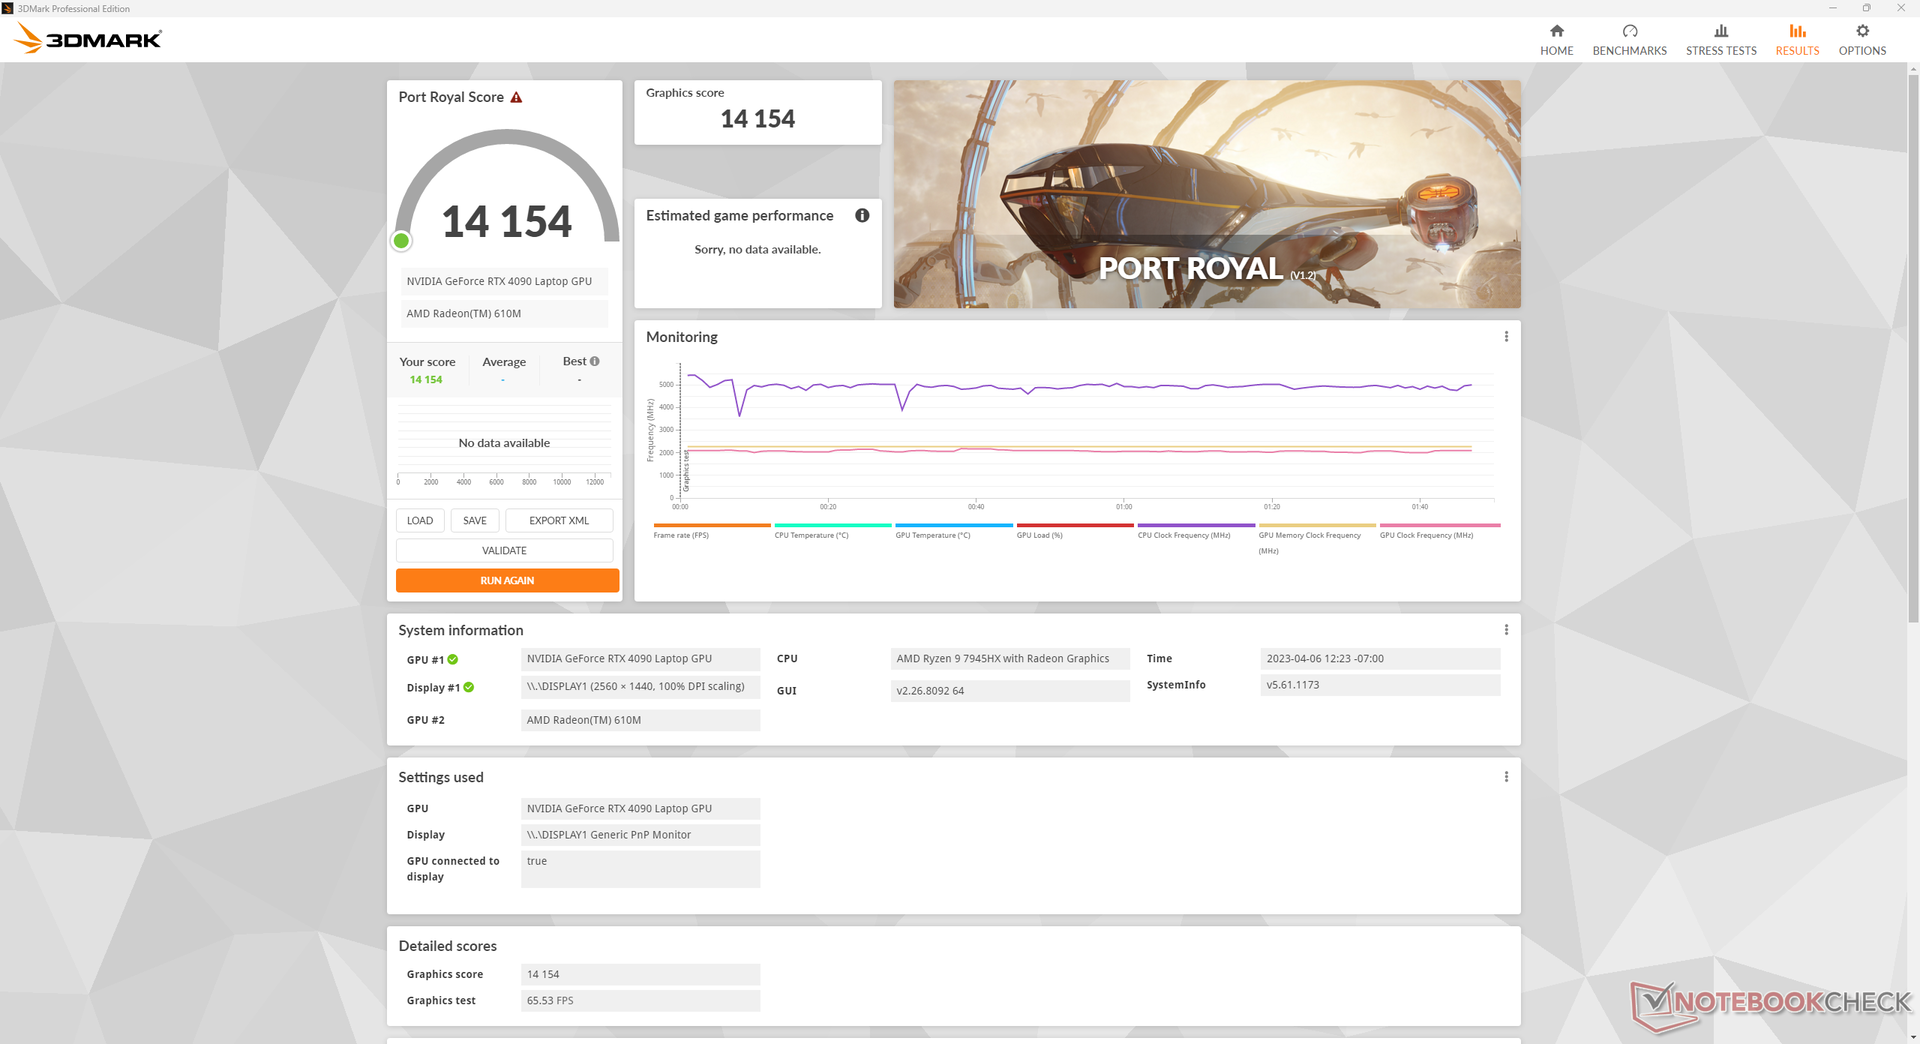
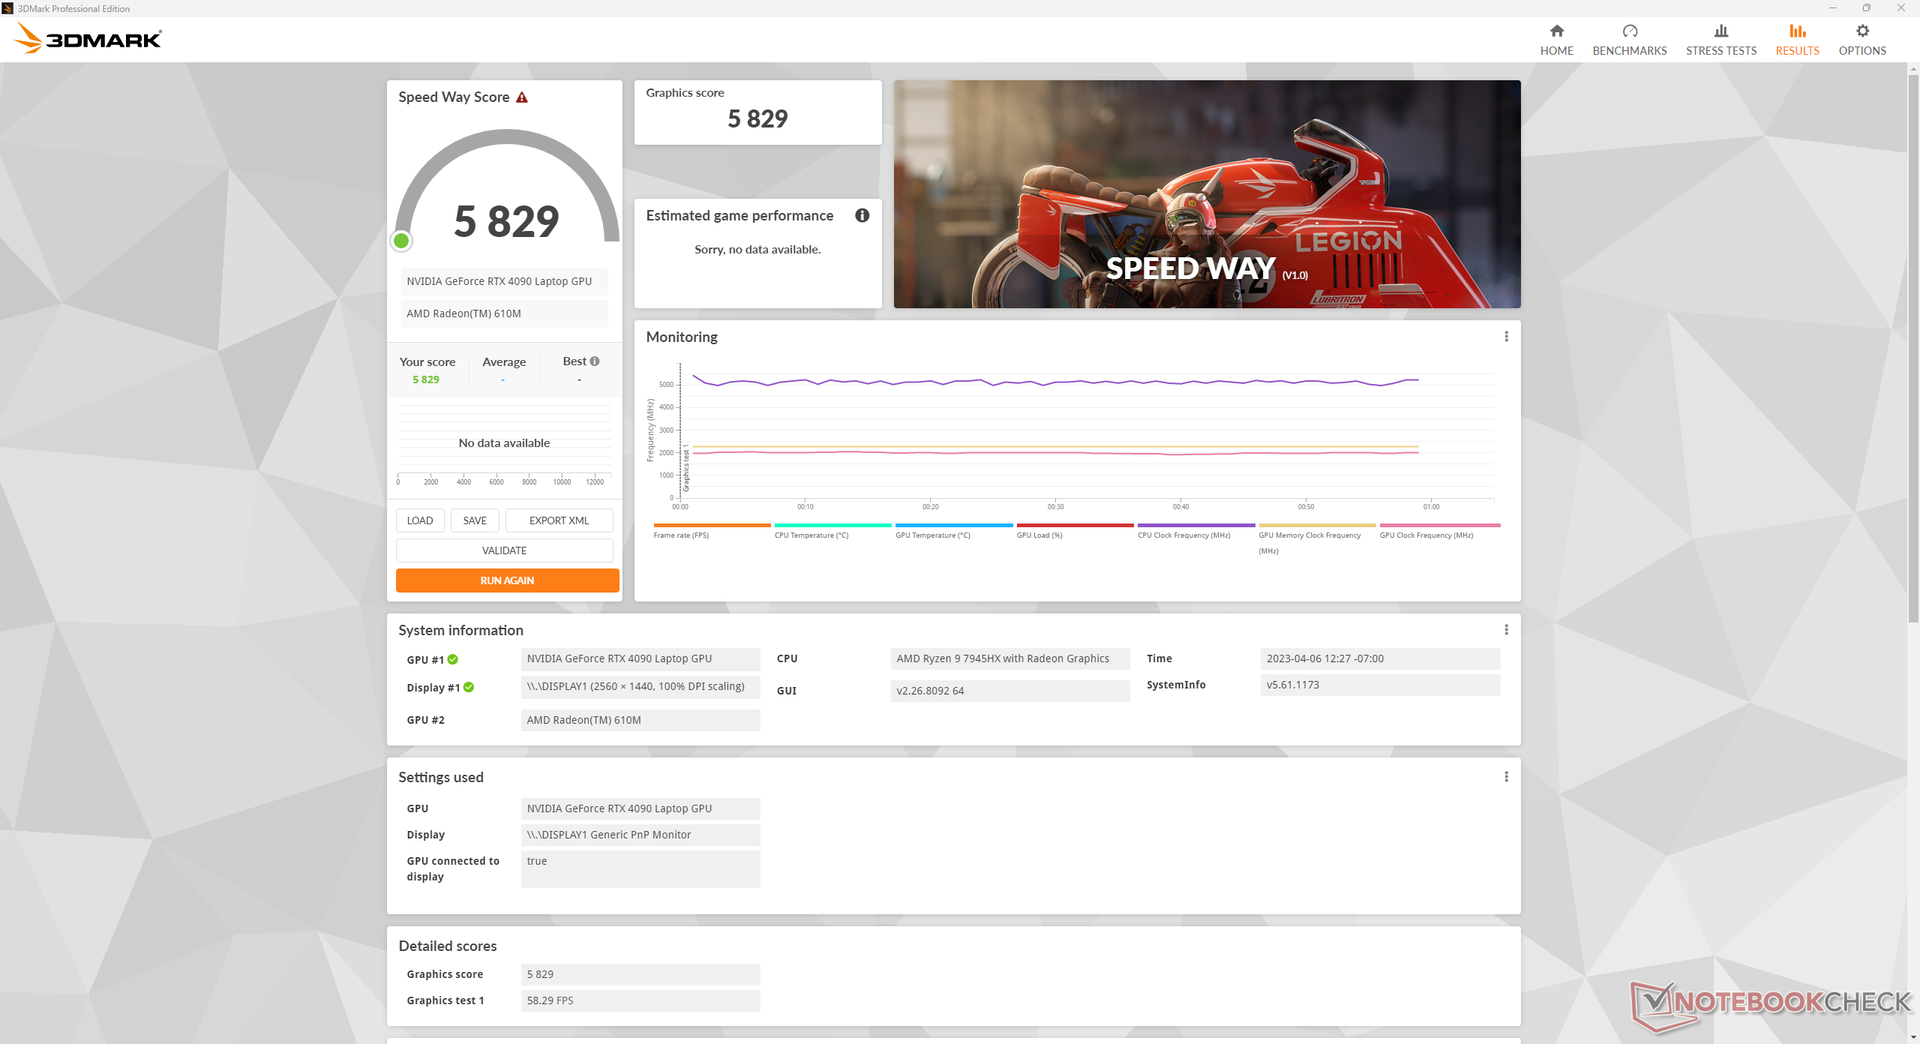
The mobil GeForce RTX 4090 ger 60-80 procent snabbare prestanda än det mobila RTX 3080 Ti i förra årets ROG Strix Scar 17 G733. Således är skillnaden i prestanda från år till år ganska betydande. Nedgradering till RTX 4080 eller 4070 SKU:er förväntas påverka GPU-prestandan med 15-20 procent respektive 40-50 procent. Entusiaster kanske därför vill undvika det mobila RTX 4070 eftersom prestandadämpningen från mobilt RTX 4080 till mobilt RTX 4070 är mycket större än dämpningen från mobilt RTX 4090 till mobilt RTX 4080.
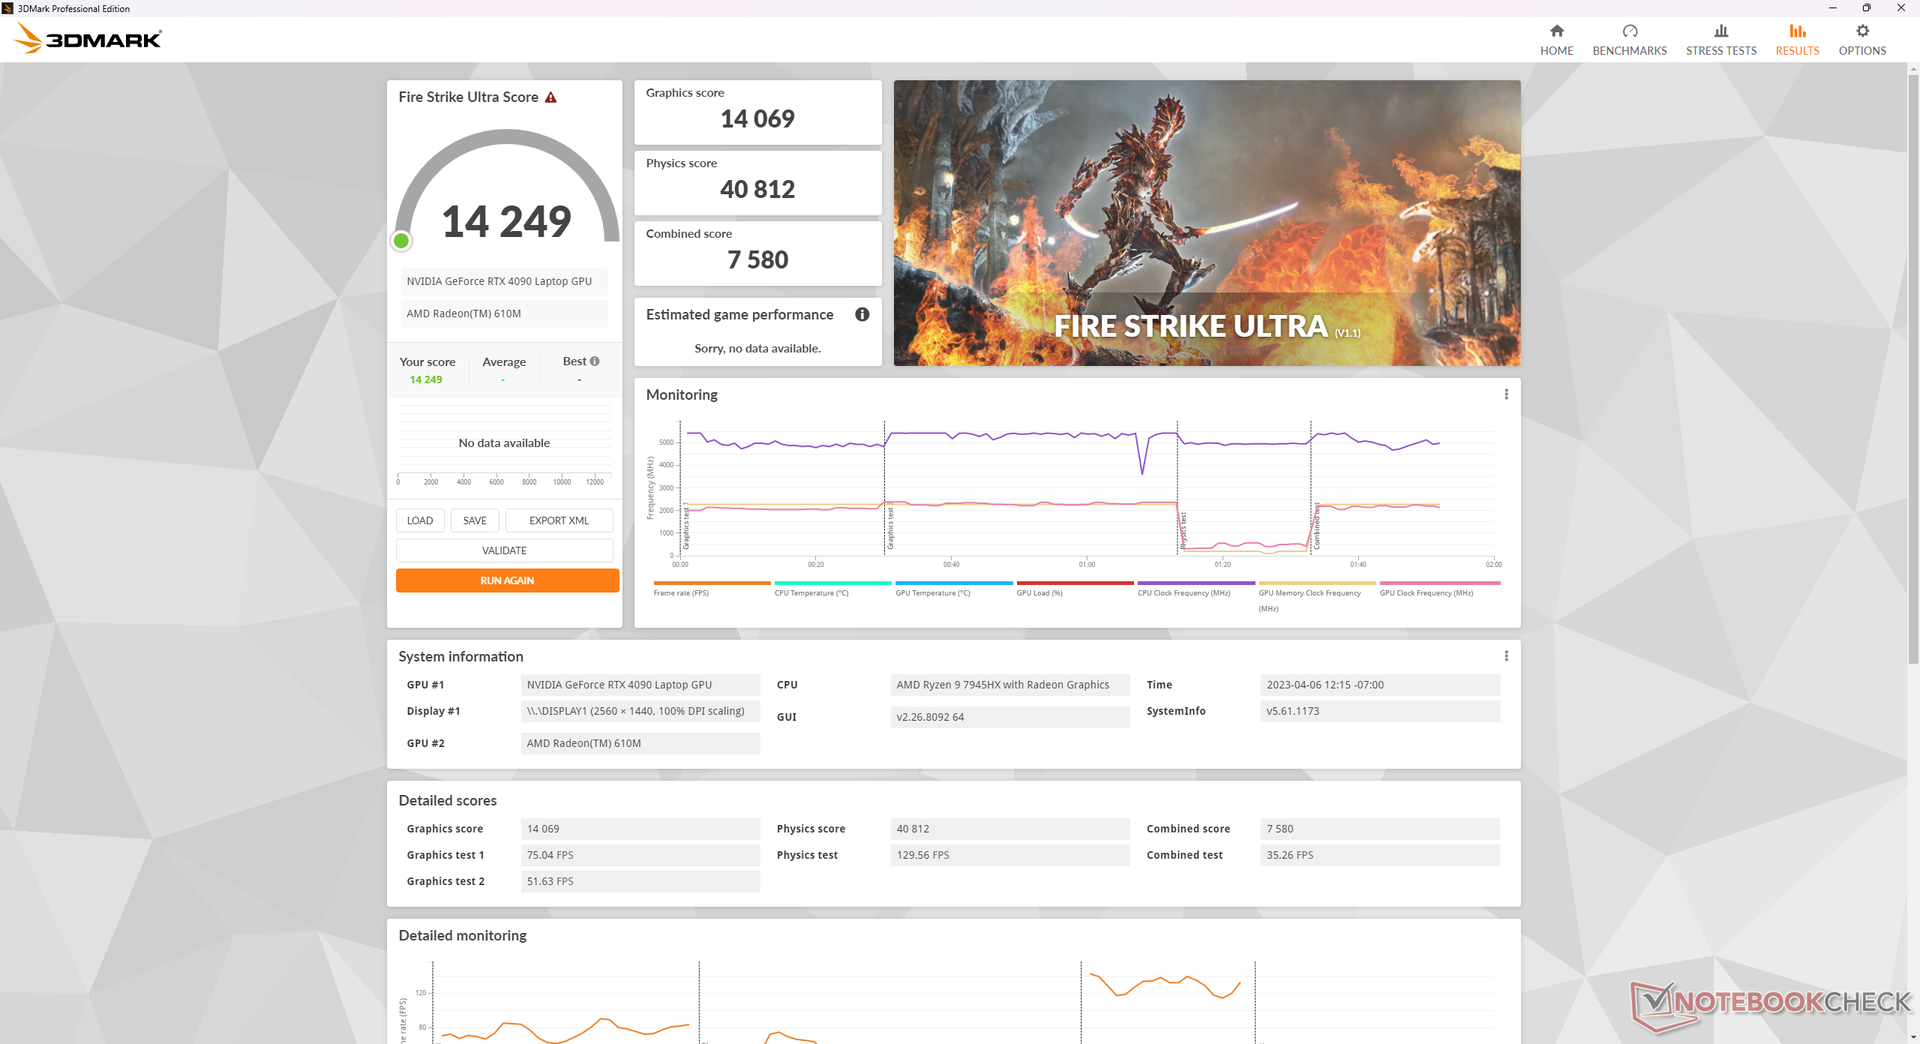
Att köra i prestandaläge i stället för i turboläge påverkar prestandan något. Ett Fire Strike -test i prestandaläget skulle resultera i en minskning av grafikpoängen med 4 till 5 procent. I vårt avsnitt om stresstester nedan utforskas dessa två lägen ytterligare.

| 3DMark 11 Performance | 46484 poäng | |
| 3DMark Fire Strike Score | 43163 poäng | |
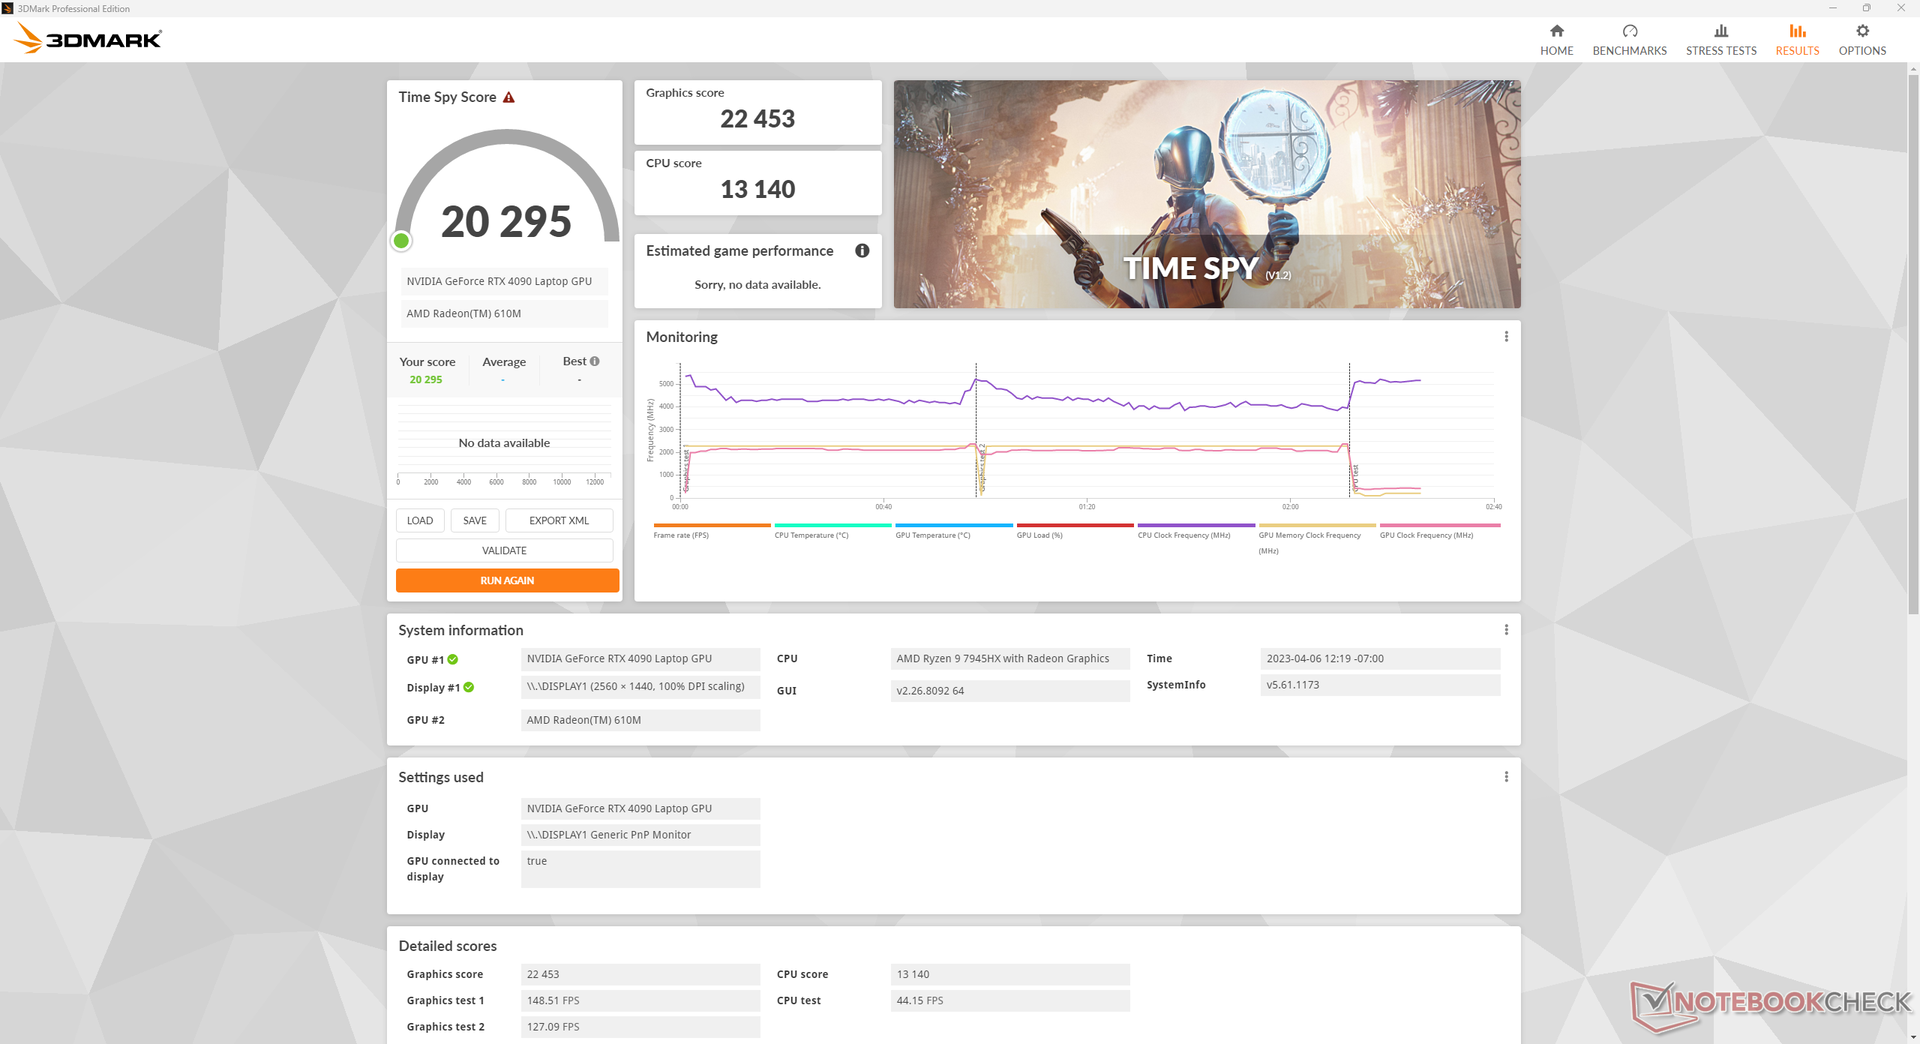
| 3DMark Time Spy Score | 20295 poäng | |
Hjälp | ||
* ... mindre är bättre
| Tiny Tina's Wonderlands | |
| 1920x1080 Low Preset (DX12) | |
| KFA2 GeForce RTX 4090 SG | |
| Genomsnitt NVIDIA GeForce RTX 4090 Laptop GPU (268 - 378, n=8) | |
| Asus ROG Strix Scar 17 G733PY-XS96 | |
| 1920x1080 Medium Preset (DX12) | |
| KFA2 GeForce RTX 4090 SG | |
| Genomsnitt NVIDIA GeForce RTX 4090 Laptop GPU (230 - 302, n=8) | |
| Asus ROG Strix Scar 17 G733PY-XS96 | |
| 1920x1080 High Preset (DX12) | |
| KFA2 GeForce RTX 4090 SG | |
| Genomsnitt NVIDIA GeForce RTX 4090 Laptop GPU (168 - 233, n=9) | |
| Asus ROG Strix Scar 17 G733PY-XS96 | |
| 1920x1080 Badass Preset (DX12) | |
| KFA2 GeForce RTX 4090 SG | |
| Asus ROG Strix Scar 17 G733PY-XS96 | |
| Genomsnitt NVIDIA GeForce RTX 4090 Laptop GPU (141.1 - 189.4, n=14) | |
| 2560x1440 Badass Preset (DX12) | |
| KFA2 GeForce RTX 4090 SG | |
| Asus ROG Strix Scar 17 G733PY-XS96 | |
| Genomsnitt NVIDIA GeForce RTX 4090 Laptop GPU (103.4 - 137.8, n=14) | |
| 3840x2160 Badass Preset (DX12) | |
| KFA2 GeForce RTX 4090 SG | |
| Asus ROG Strix Scar 17 G733PY-XS96 | |
| Genomsnitt NVIDIA GeForce RTX 4090 Laptop GPU (53.3 - 73.7, n=12) | |
Witcher 3 FPS Chart
| låg | med. | hög | ultra | QHD DLSS | QHD FSR | QHD | 4K DLSS | 4K FSR | 4K | |
|---|---|---|---|---|---|---|---|---|---|---|
| GTA V (2015) | 185 | 180.4 | 175.2 | 112.6 | 114.8 | 170.5 | ||||
| The Witcher 3 (2015) | 490.1 | 405.6 | 370.3 | 203.8 | 154.8 | |||||
| Dota 2 Reborn (2015) | 165.6 | 150.5 | 154.2 | 139 | 135.4 | |||||
| Final Fantasy XV Benchmark (2018) | 214 | 205 | 163.9 | 151 | 93.3 | |||||
| X-Plane 11.11 (2018) | 132.2 | 118 | 94.3 | 78.5 | ||||||
| Far Cry 5 (2018) | 157 | 145 | 142 | 108 | ||||||
| Shadow of the Tomb Raider (2018) | 238 | 228 | 190 | 104 | ||||||
| Borderlands 3 (2019) | 121.4 | |||||||||
| Doom Eternal (2020) | 441 | 362 | 200 | |||||||
| Valorant (2020) | 485 | |||||||||
| Assassin´s Creed Valhalla (2020) | 187 | 169 | 135 | 79 | ||||||
| Far Cry 6 (2021) | 117 | 112 | 109 | 82 | ||||||
| Cyberpunk 2077 1.6 (2022) | 146.4 | 140.5 | 132.6 | 133.8 | 104.3 | 48.6 | ||||
| Tiny Tina's Wonderlands (2022) | 267.7 | 230 | 194.6 | 176.2 | 134.2 | 71.9 | ||||
| F1 22 (2022) | 266 | 243 | 221 | 116.3 | 92.1 | 45.8 | ||||
| Call of Duty Modern Warfare 2 2022 (2022) | 188 | 180 | 135 | 82 | ||||||
| Star Wars Jedi Survivor (2023) | 105.6 | 103.1 | 88.4 | 43 | ||||||
| Black Myth: Wukong (2024) | 153 | 117 | 93 | 41 | 43 | 24 | ||||
| Final Fantasy XVI (2024) | 91.6 | 71.2 | 77.5 | |||||||
| God of War Ragnarök (2024) | 138 | 127.1 | 113.9 | 82.8 | ||||||
| Call of Duty Black Ops 6 (2024) | 130 | 126 | 92 | 76 | 72 | 76 | ||||
| Stalker 2 (2024) | 64.2 | 113.2 | 58.6 | 78.2 | 38.9 | |||||
| Marvel Rivals (2024) | 146 | 122 | 101 | 90 | 71 | |||||
| Kingdom Come Deliverance 2 (2025) | 112.5 | 110.4 | 86.7 | 70.8 | 48.4 | |||||
| Monster Hunter Wilds (2025) | 89.2 | 84.7 | 78.1 | 74.7 | 66.6 | 58 | 42.8 | |||
| Civilization 7 (2025) | 161.3 | 155.4 | 154.9 | |||||||
| The Elder Scrolls IV Oblivion Remastered (2025) | 56.8 | 53.7 | 43.1 | 26.4 | ||||||
| Doom: The Dark Ages (2025) | 123.4 | 115 | 105.5 | 95.2 | 95.3 | 73.1 | 57.1 | 39.7 | ||
| F1 25 (2025) | 227 | 216 | 203 | 53.8 | 57.8 | 32.4 | 28.8 | 15 | ||
| Borderlands 4 (2025) | 83.2 | 70 | 54.8 | 37.9 | ||||||
| Battlefield 6 (2025) | 126.8 | 113.7 | 89.9 | 50.9 | ||||||
| The Outer Worlds 2 (2025) | 77.2 | 41.8 | 51.5 | 27.2 | ||||||
| ARC Raiders (2025) | 226 | 205 | 196.7 | 116.5 | 87.7 | 50 | ||||
| Anno 117: Pax Romana (2025) | 96.4 | 59.9 | 59 | 44.4 | 25.9 | |||||
| Call of Duty Black Ops 7 (2025) | 76 | 52 | 27 | |||||||
| Resident Evil Requiem (2026) | 72.4 | 55.6 | 28.3 | |||||||
| Death Stranding 2 (2026) | 88.5 | 82.6 | 68.1 | 63.4 | 42.4 | |||||
| Crimson Desert (2026) | 73.3 | 68.1 | 57.3 | 51.1 | 43.1 | |||||
| Pragmata (2026) | 110.7 | 104.6 | 85.5 | 82.6 | 58.6 | |||||
| War Thunder (2026) | 123 | 85 | 50 | |||||||
| Forza Horizon 6 (2026) | 94 | 61 | 50 | 31 | ||||||
| 007 First Light (2026) | 75.8 | 79.4 | 67.3 | 63.4 | 35.7 |
Utsläpp - Prestanda Tystare än Turbo
Systembrus
Fläktljudet är ständigt närvarande med 23-27 dB(A) mot en tyst bakgrund på 22,7 dB(A) oavsett inställd prestanda. Tack och lov är det här intervallet tillräckligt tyst för att vara nästan omärkligt och fläktarna gör ett bra jobb med att hålla sig under 30 dB(A) när de kör något högre belastningar som webbsurfning eller streaming.
Spel i prestandaläget är tystare än i turboläget. Fläktljud vid körning Witcher 3 i prestandaläget är omkring 46,4 dB(A) jämfört med 51,4-54 dB(A) i turboläget. Användare kan därför vilja äta upp det 5-procentiga underskottet i grafikprestanda för de tystare ljudnivåerna i Performance-läget.
Ljudnivå
| Låg belastning |
| 23.5 / 27.7 / 27.7 dB(A) |
| Hög belastning |
| 30.5 / 54.1 dB(A) |
 | ||
30 dB tyst 40 dB(A) hörbar 50 dB(A) högt ljud |
||
min: | ||
| Asus ROG Strix Scar 17 G733PY-XS96 GeForce RTX 4090 Laptop GPU, R9 7945HX, SK hynix PC801 HFS001TEJ9X101N | MSI GE78HX 13VH-070US GeForce RTX 4080 Laptop GPU, i9-13950HX, Samsung PM9A1 MZVL22T0HBLB | Eluktronics Mech-17 GP2 GeForce RTX 4090 Laptop GPU, i9-13900HX, Samsung PM9A1 MZVL21T0HCLR | Asus ROG Strix G17 G713PI GeForce RTX 4070 Laptop GPU, R9 7945HX, WD PC SN560 SDDPNQE-1T00 | Aorus 17X XES GeForce RTX 3070 Ti Laptop GPU, i9-12900HX, Gigabyte AG470S1TB-SI B10 | Alienware m17 R5 (R9 6900HX, RX 6850M XT) Radeon RX 6850M XT, R9 6900HX, SSSTC CA6-8D1024 | |
|---|---|---|---|---|---|---|
| Noise | -10% | -10% | -9% | -24% | 1% | |
| av / miljö * (dB) | 22.7 | 23.4 -3% | 25.2 -11% | 25 -10% | 26 -15% | 23 -1% |
| Idle Minimum * (dB) | 23.5 | 24.2 -3% | 28 -19% | 26 -11% | 28 -19% | 23 2% |
| Idle Average * (dB) | 27.7 | 25.6 8% | 28 -1% | 29 -5% | 32 -16% | 28.11 -1% |
| Idle Maximum * (dB) | 27.7 | 31 -12% | 30.4 -10% | 30 -8% | 38 -37% | 28.11 -1% |
| Load Average * (dB) | 30.5 | 43.3 -42% | 41 -34% | 46 -51% | 53 -74% | 30.62 -0% |
| Witcher 3 ultra * (dB) | 51.4 | 56.3 -10% | 50.7 1% | 46 11% | 54 -5% | 49.75 3% |
| Load Maximum * (dB) | 54.1 | 59.1 -9% | 52.6 3% | 47 13% | 55 -2% | 50.17 7% |
* ... mindre är bättre
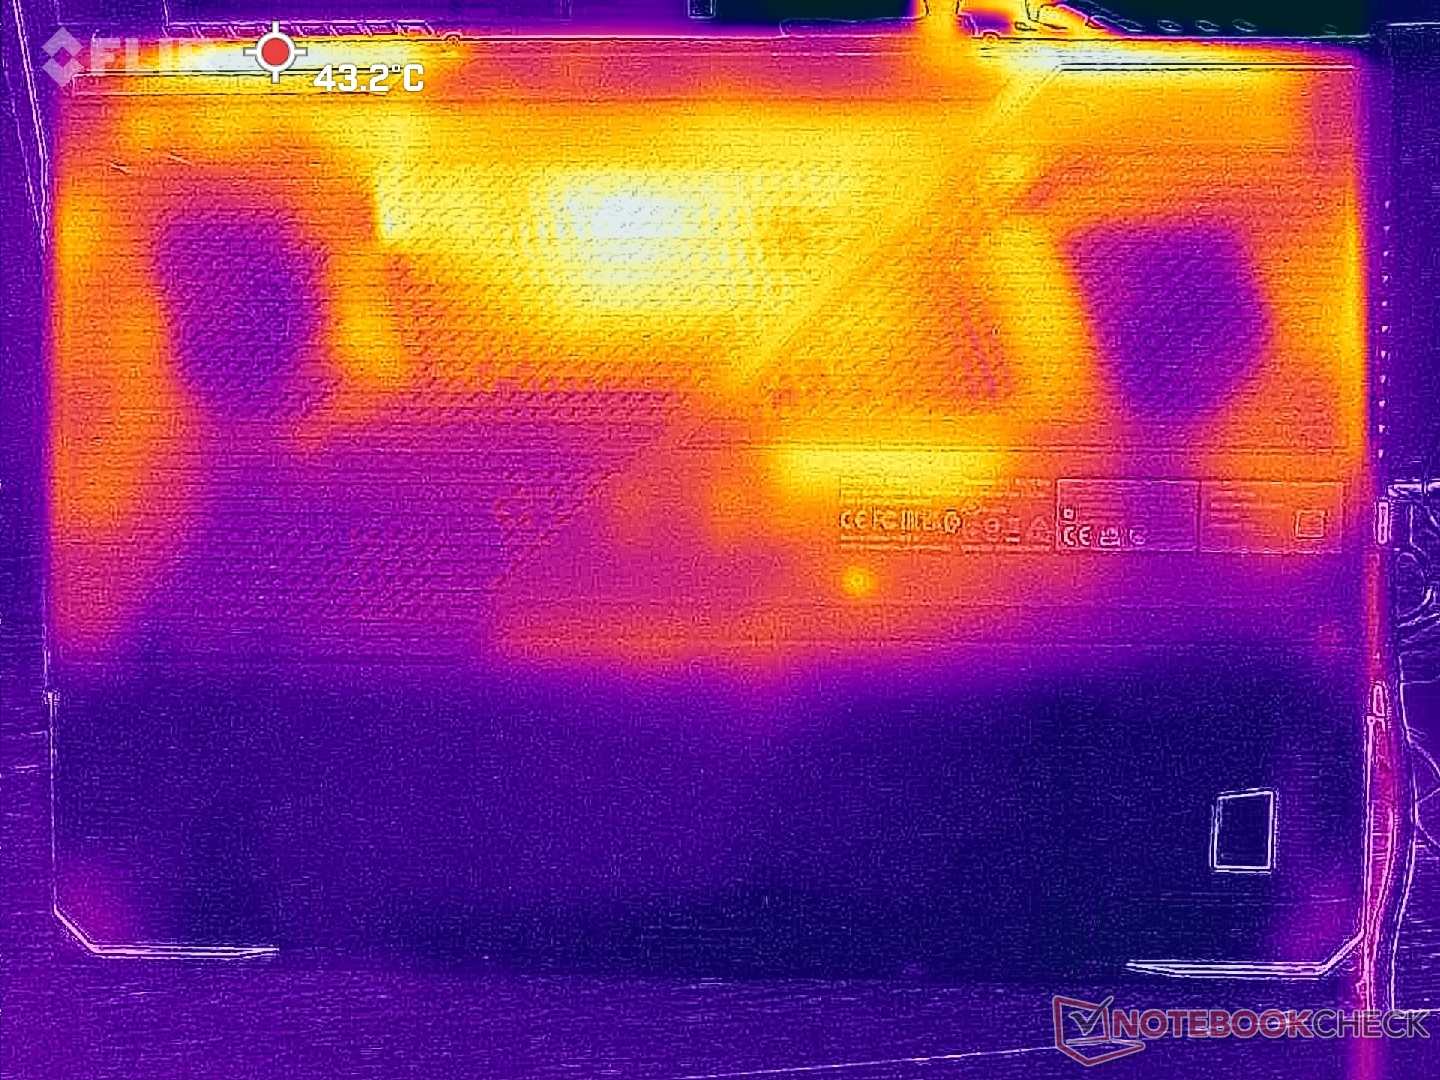
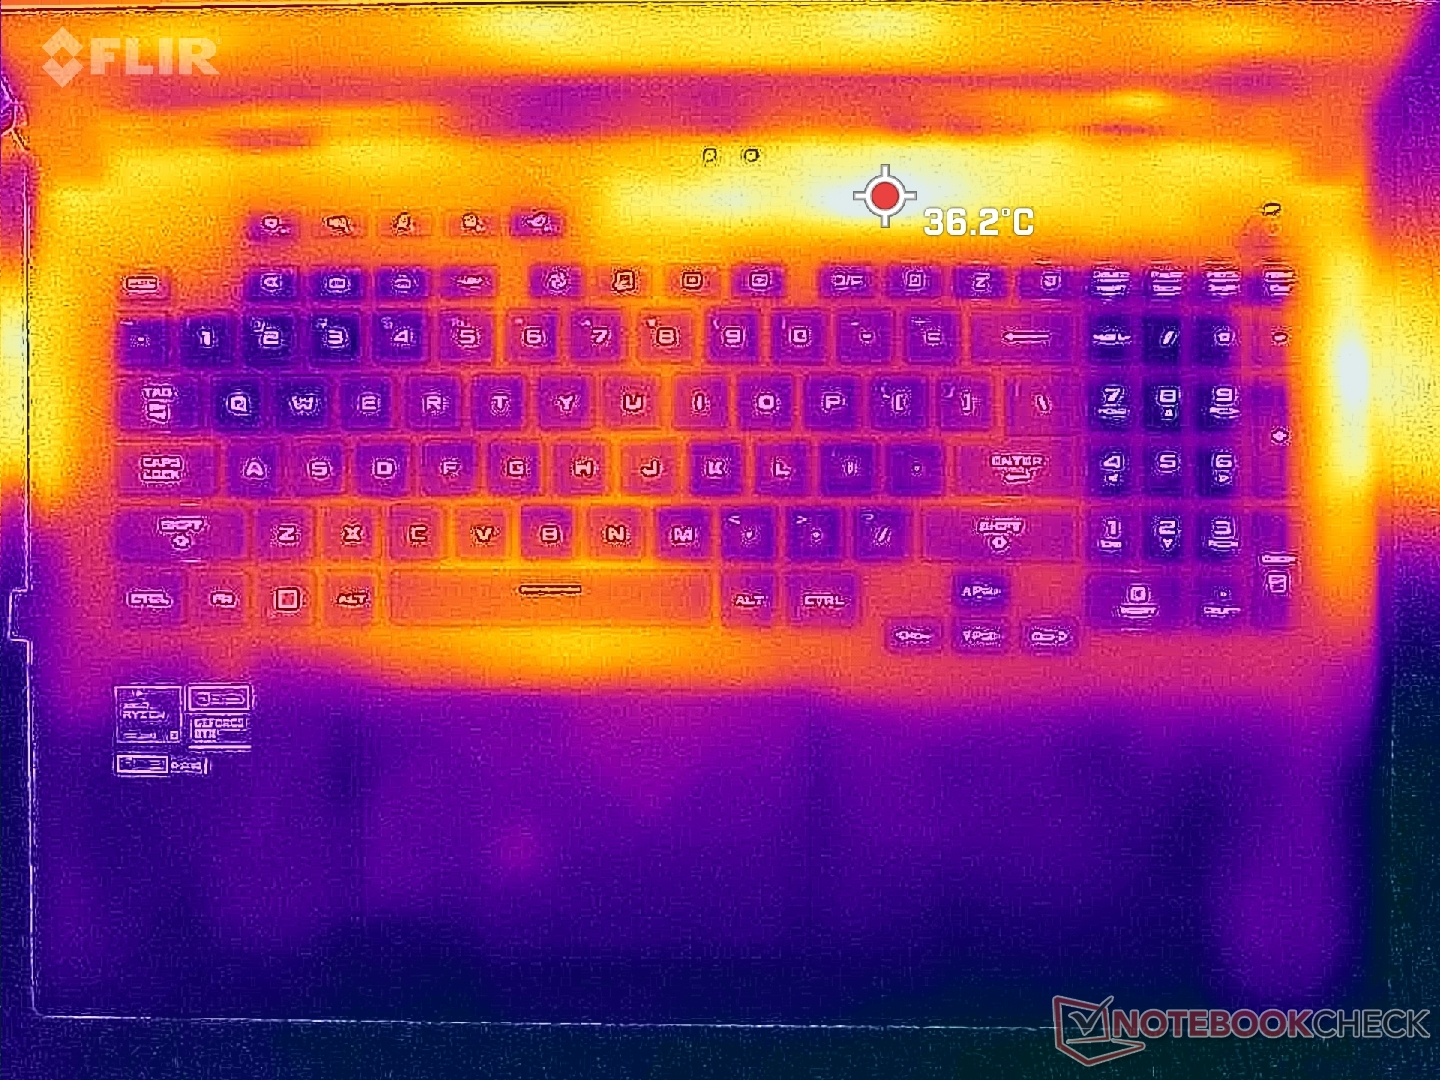
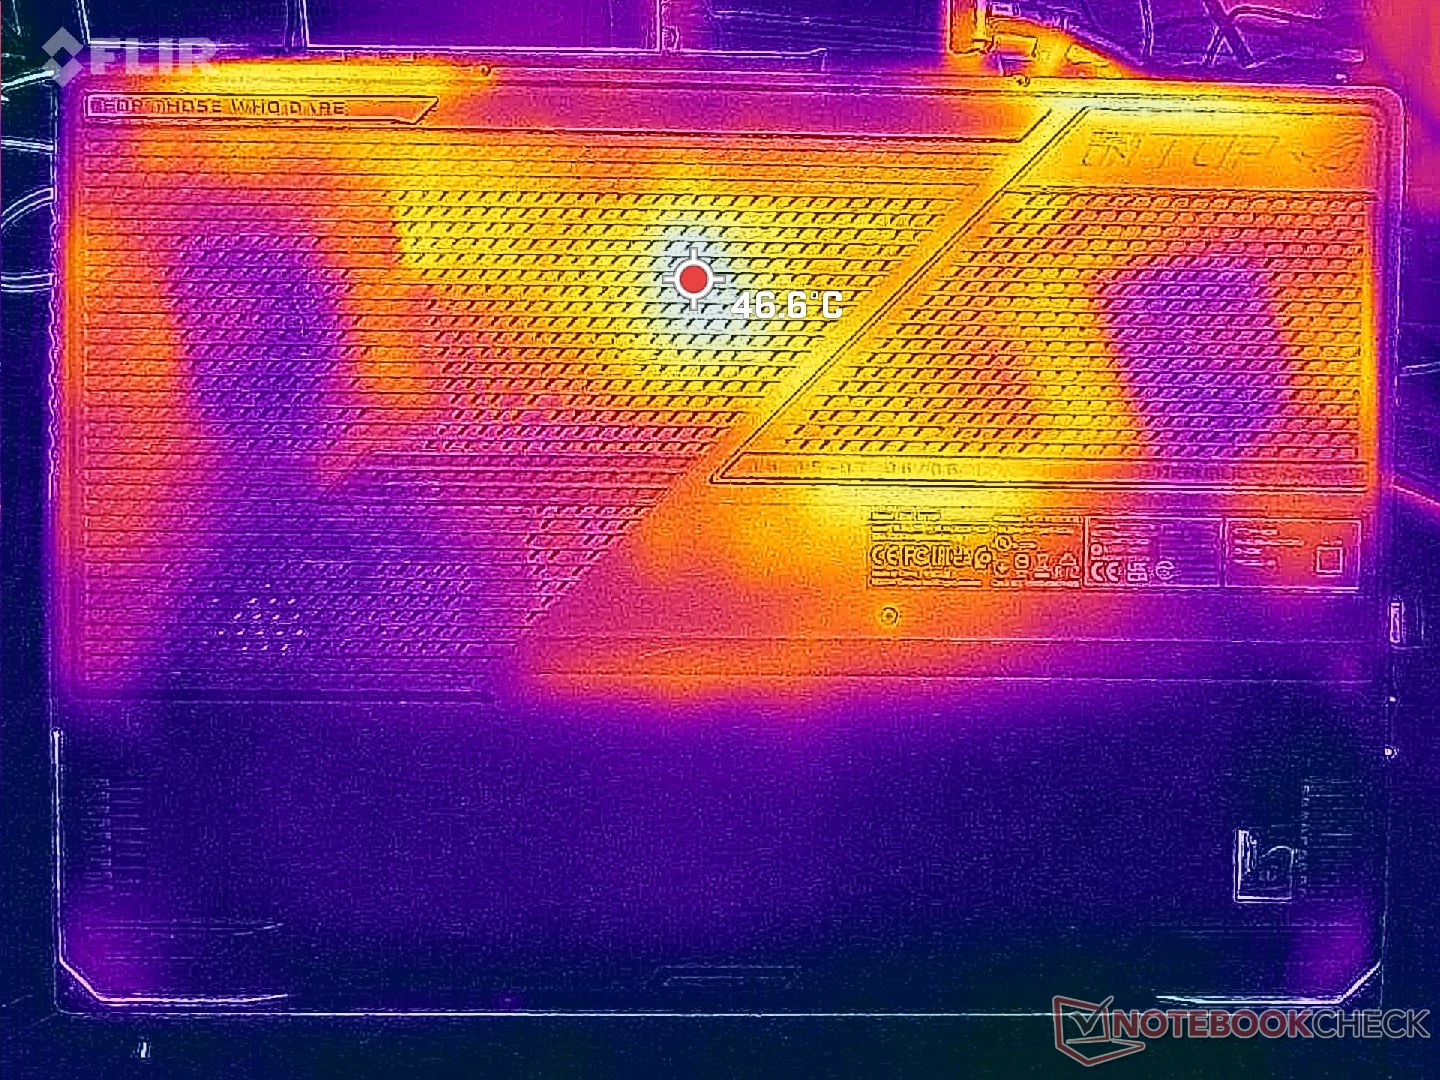
Temperatur
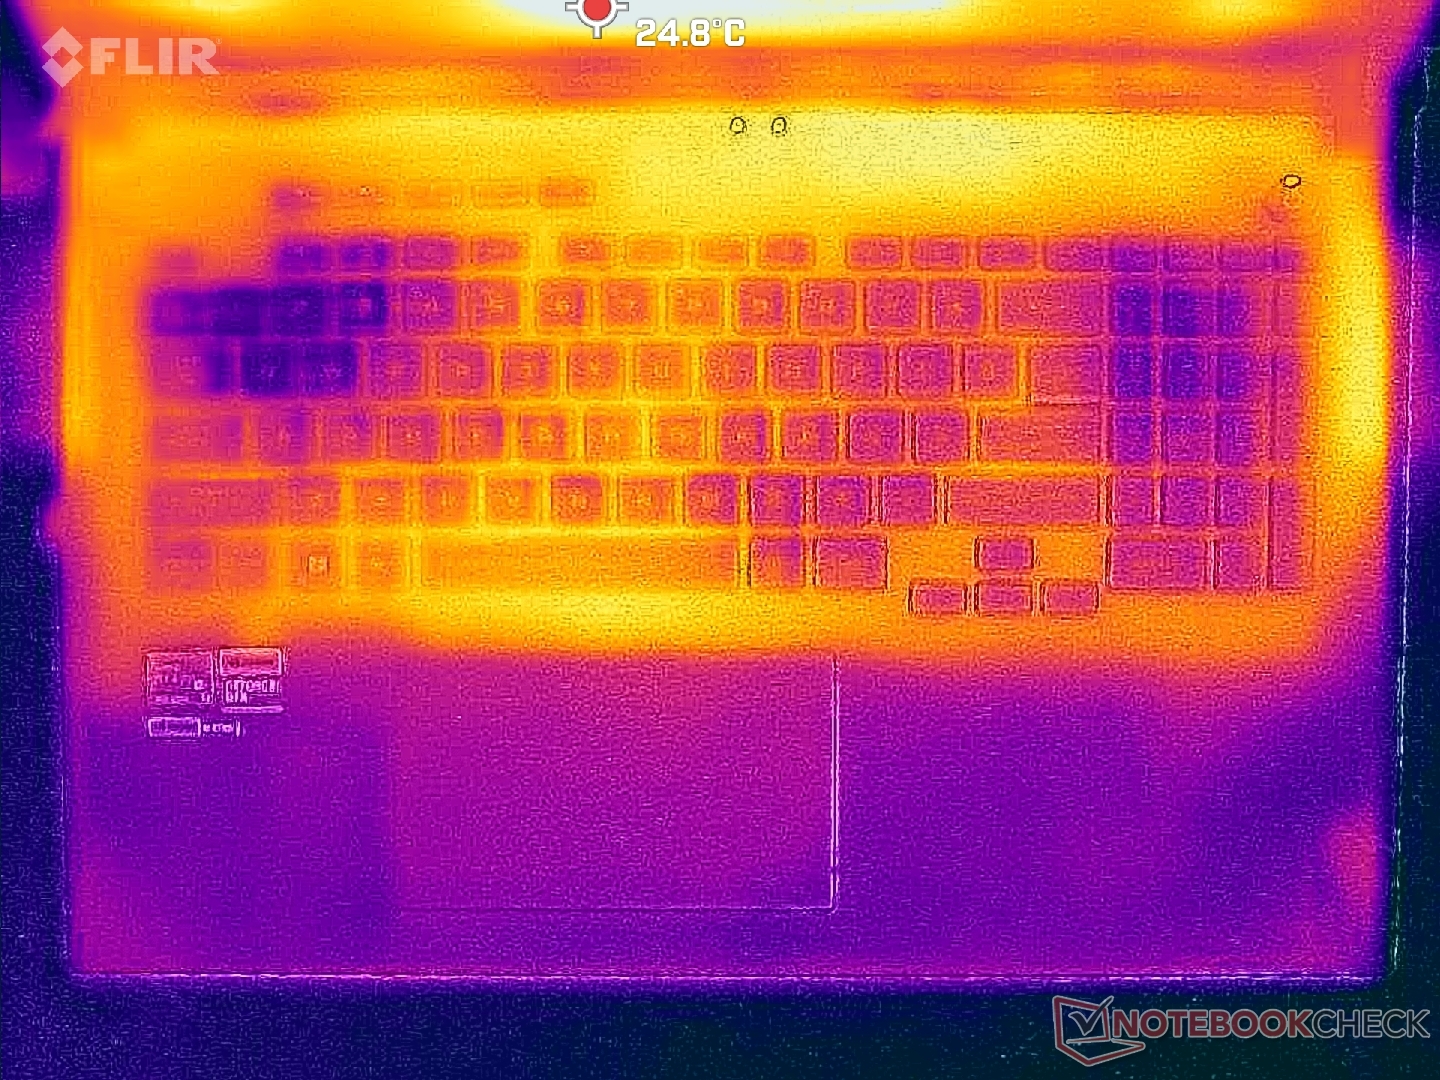
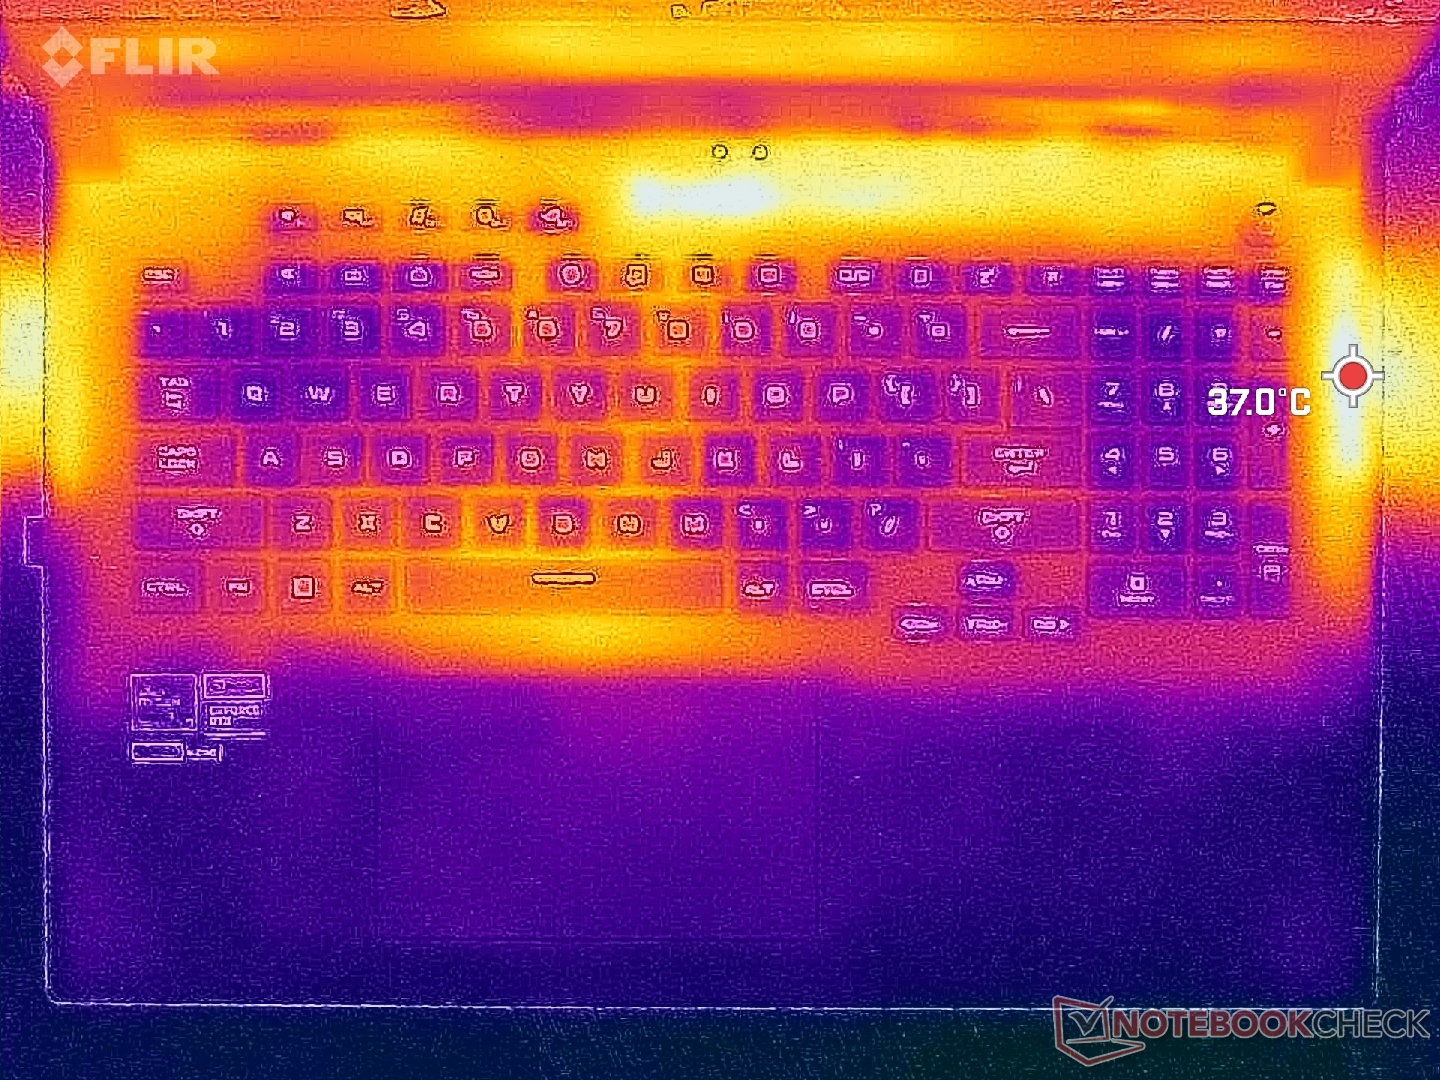
En stor del av tangentbordet och handflatorna förblir svala när du spelar. Varma punkter finns istället längs kanterna på däckets yta, där fingrarna inte rör vid varandra lika ofta.
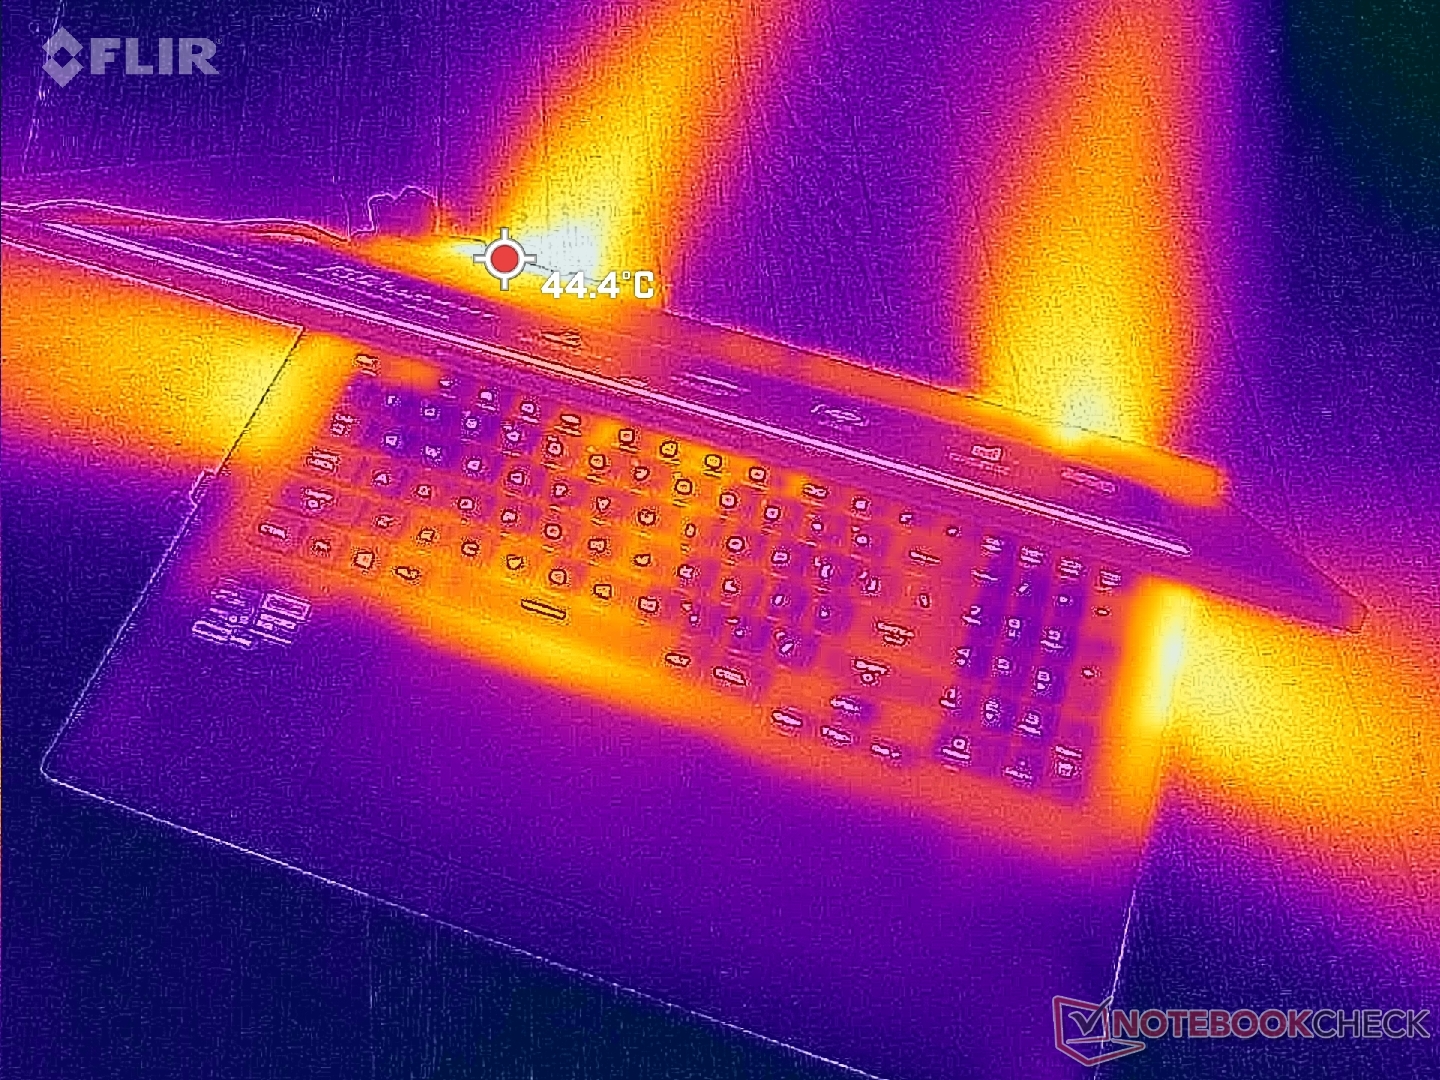
(+) Den maximala temperaturen på ovansidan är 34.6 °C / 94 F, jämfört med genomsnittet av 40.4 °C / 105 F , allt från 21.2 till 68.8 °C för klassen Gaming.
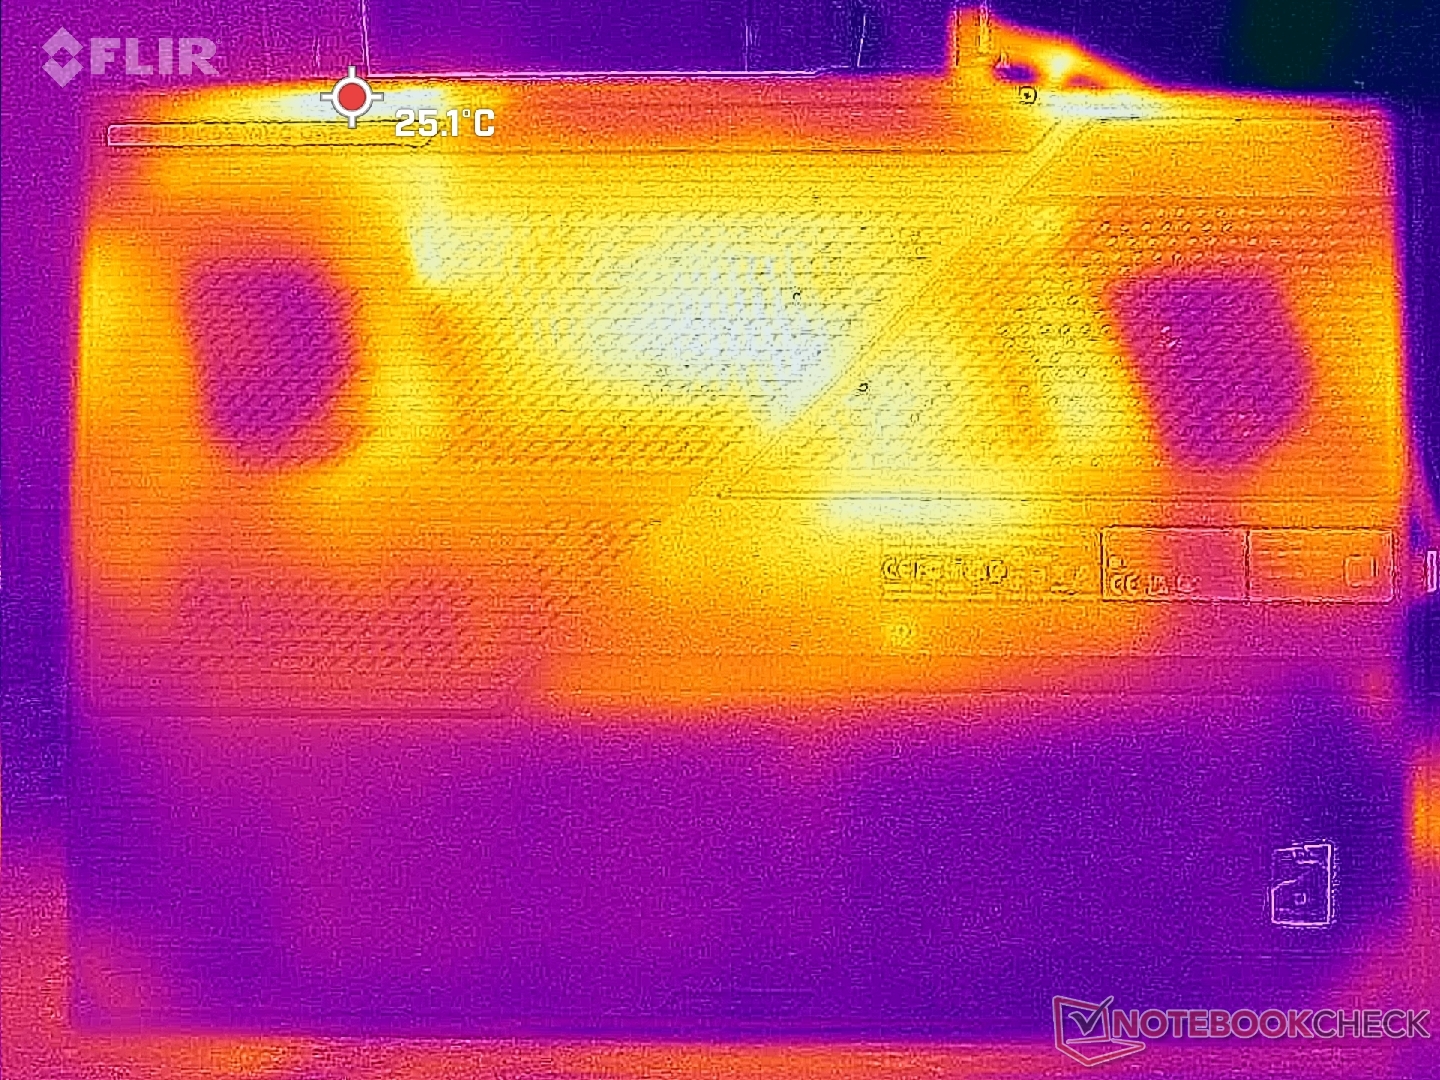
(+) Botten värms upp till maximalt 35.6 °C / 96 F, jämfört med genomsnittet av 43.2 °C / 110 F
(+) Vid tomgångsbruk är medeltemperaturen för ovansidan 23.2 °C / 74 F, jämfört med enhetsgenomsnittet på 33.9 °C / ### class_avg_f### F.
(+) När du spelar The Witcher 3 är medeltemperaturen för ovansidan 27.3 °C / 81 F, jämfört med enhetsgenomsnittet på 33.9 °C / ## #class_avg_f### F.
(+) Handledsstöden och pekplattan är kallare än hudtemperaturen med maximalt 20.8 °C / 69.4 F och är därför svala att ta på.
(+) Medeltemperaturen för handledsstödsområdet på liknande enheter var 28.8 °C / 83.8 F (+8 °C / 14.4 F).
| Asus ROG Strix Scar 17 G733PY-XS96 AMD Ryzen 9 7945HX, NVIDIA GeForce RTX 4090 Laptop GPU | MSI GE78HX 13VH-070US Intel Core i9-13950HX, NVIDIA GeForce RTX 4080 Laptop GPU | Eluktronics Mech-17 GP2 Intel Core i9-13900HX, NVIDIA GeForce RTX 4090 Laptop GPU | Asus ROG Strix G17 G713PI AMD Ryzen 9 7945HX, NVIDIA GeForce RTX 4070 Laptop GPU | Aorus 17X XES Intel Core i9-12900HX, NVIDIA GeForce RTX 3070 Ti Laptop GPU | Alienware m17 R5 (R9 6900HX, RX 6850M XT) AMD Ryzen 9 6900HX, AMD Radeon RX 6850M XT | |
|---|---|---|---|---|---|---|
| Heat | -13% | -13% | -18% | -46% | -29% | |
| Maximum Upper Side * (°C) | 34.6 | 37.4 -8% | 39 -13% | 42 -21% | 54 -56% | 53 -53% |
| Maximum Bottom * (°C) | 35.6 | 45 -26% | 44 -24% | 41 -15% | 58 -63% | 56 -57% |
| Idle Upper Side * (°C) | 27.2 | 29.8 -10% | 31 -14% | 33 -21% | 37 -36% | 30 -10% |
| Idle Bottom * (°C) | 30 | 32.4 -8% | 29.8 1% | 34 -13% | 39 -30% | 29 3% |
* ... mindre är bättre
Stresstest - varm kärntemperatur
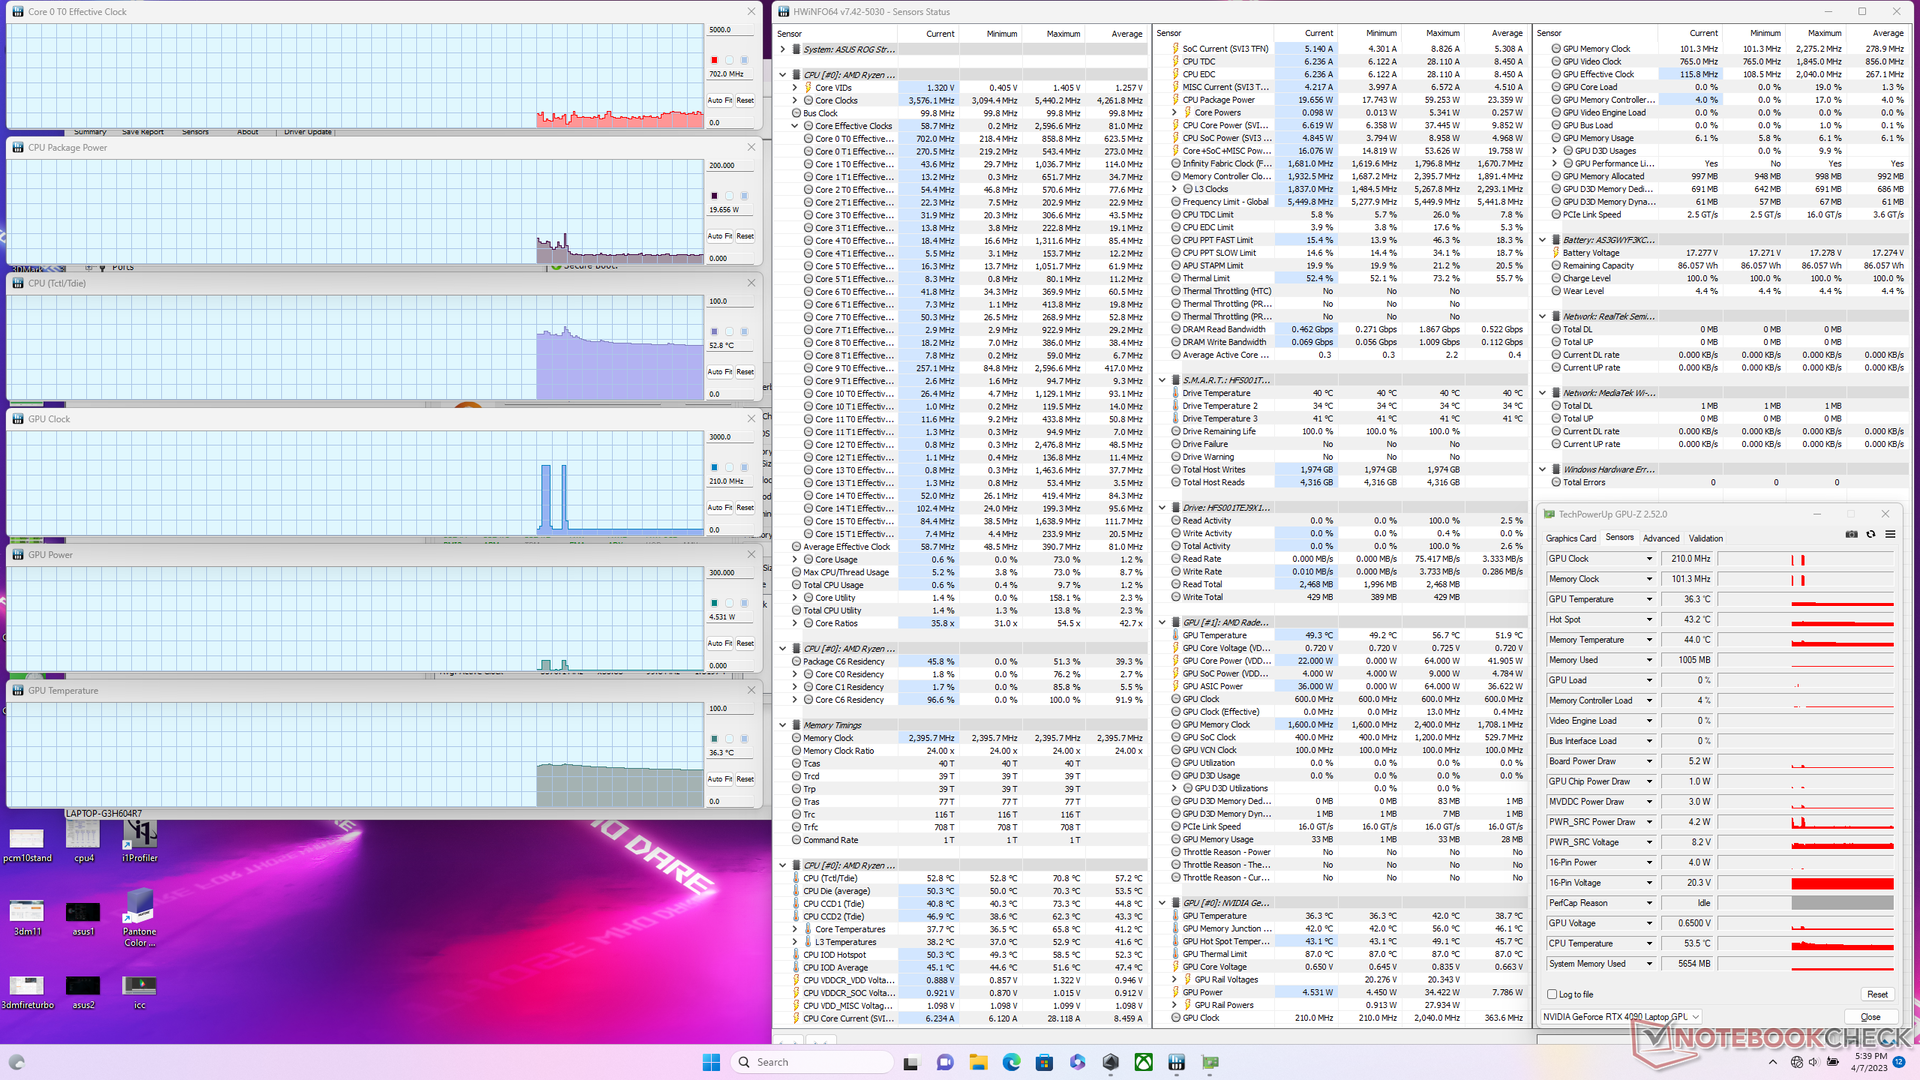
När CPU:n stressades under Prime95 cyklade den mellan 4,2 och 4,9 GHz samtidigt som den hade en CPU-paketeffekt på mellan 114 W och 128 W. Kärnans temperatur var dock mycket hög, över 90 C.
GPU:s klockfrekvens, minnesklockan, temperaturen och kortets effektuttag skulle stabiliseras vid 2055 MHz, 2250 MHz, 79 C respektive 149 W vid körning av Witcher 3 i prestandaläget. Dessa värden skulle ändras till 2280 MHz, 2275 MHz, 74 C och 170 W när de ställs in på Turbo-läget. Turbo-läget krävs alltså om du vill komma närmare de annonserade 175 W TGP för det mobila RTX 4090.
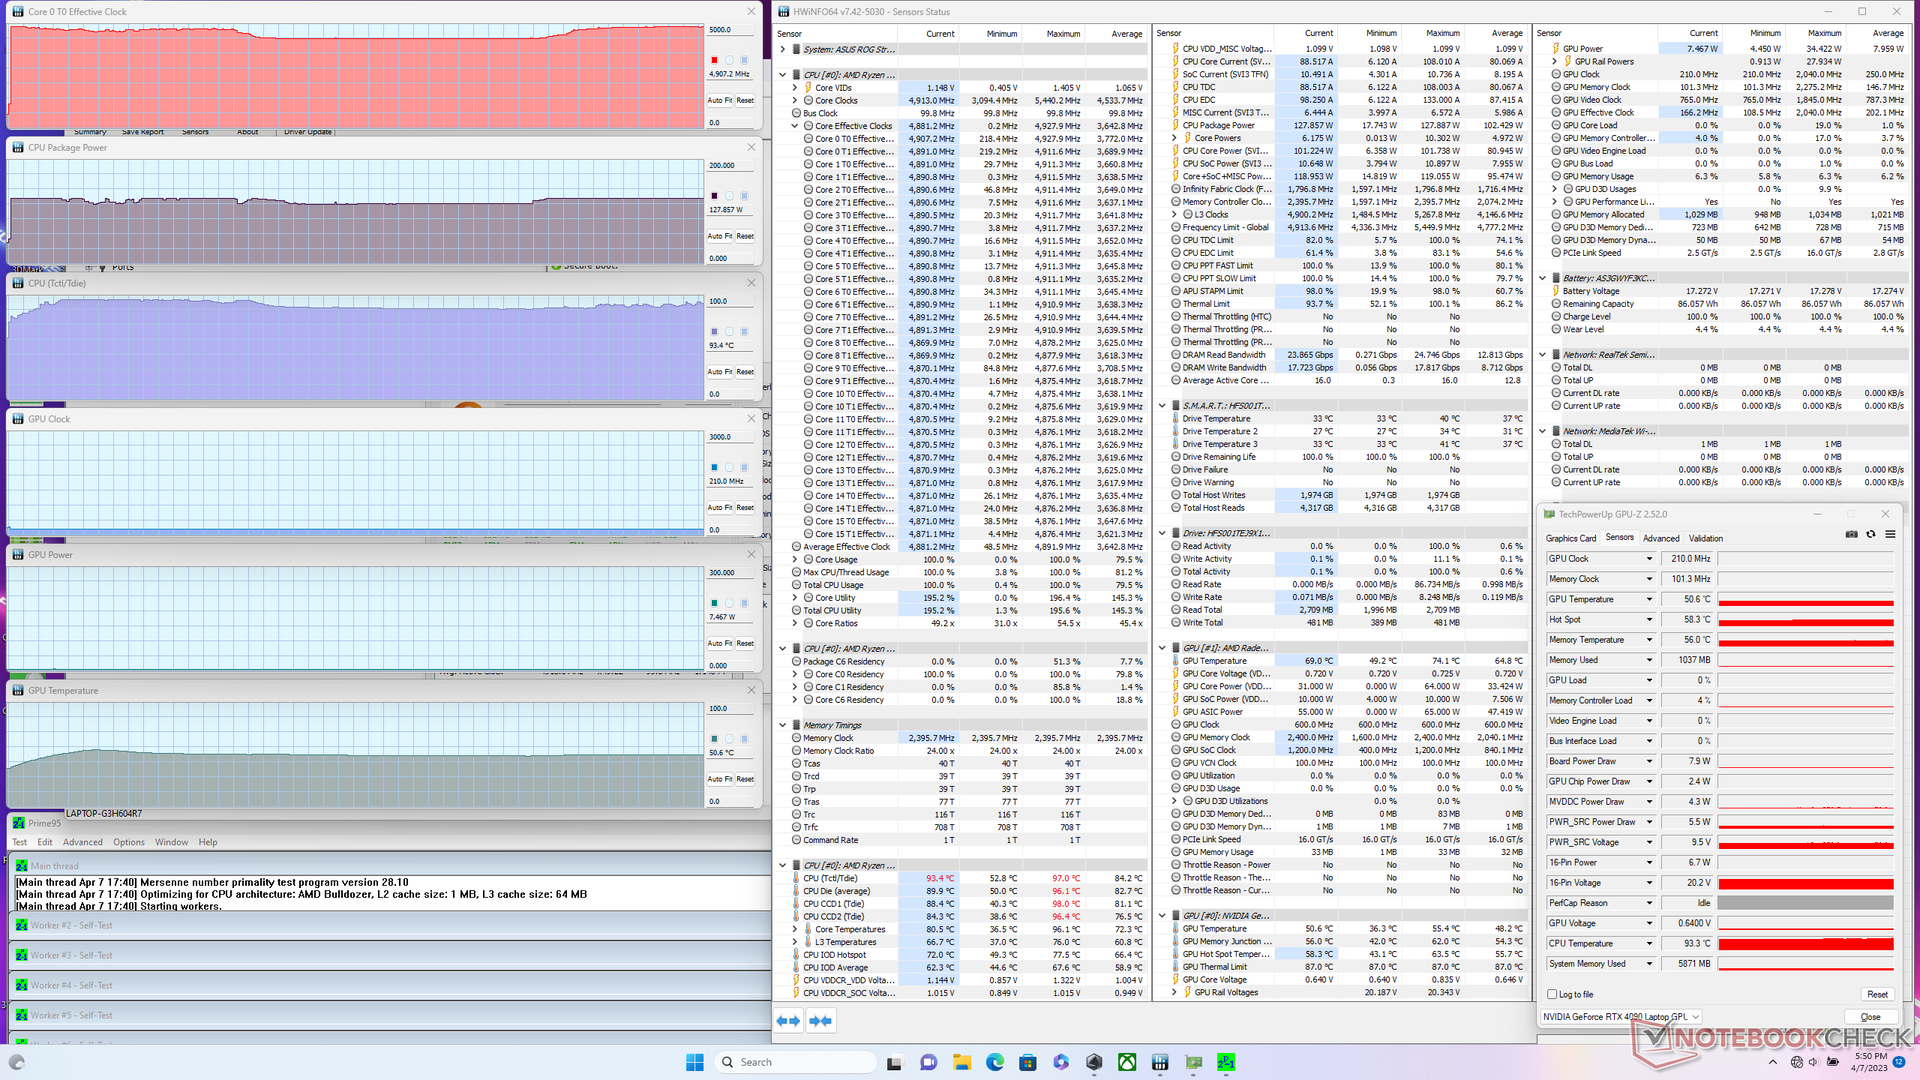
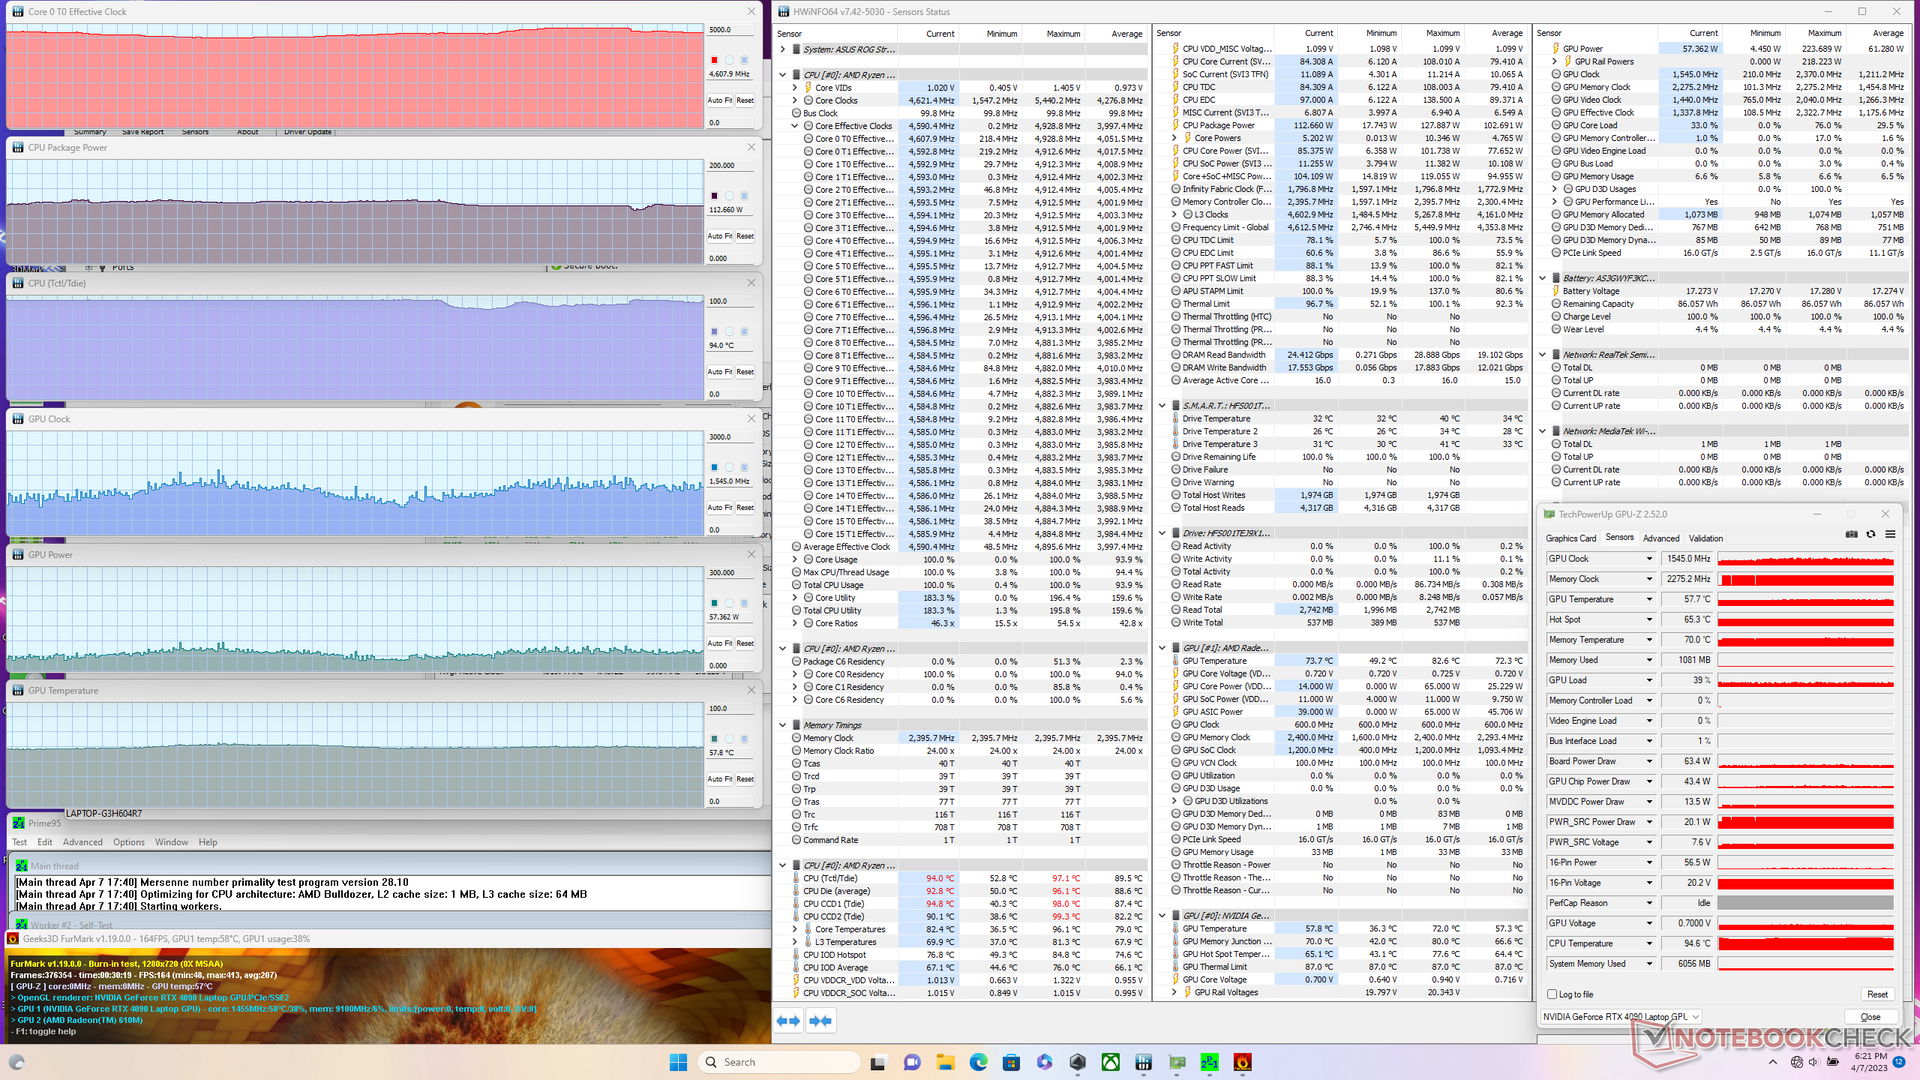
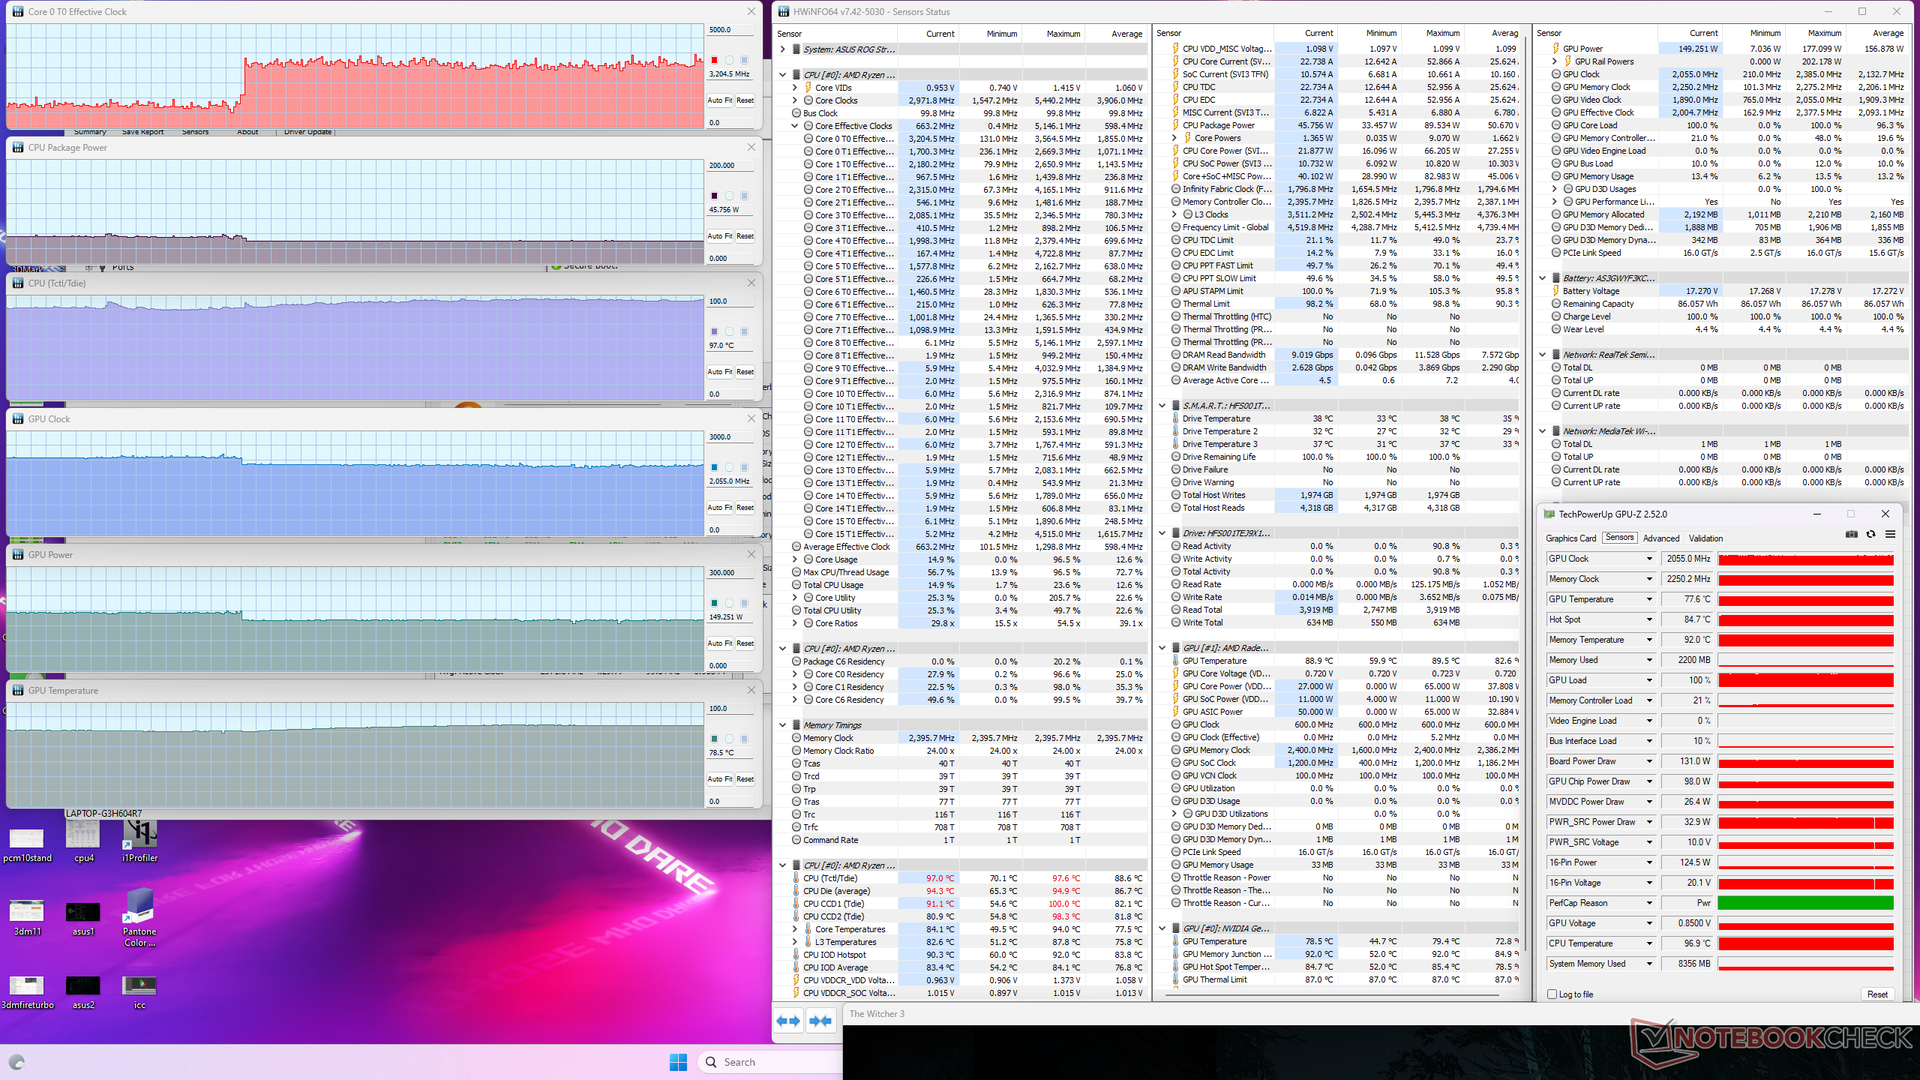
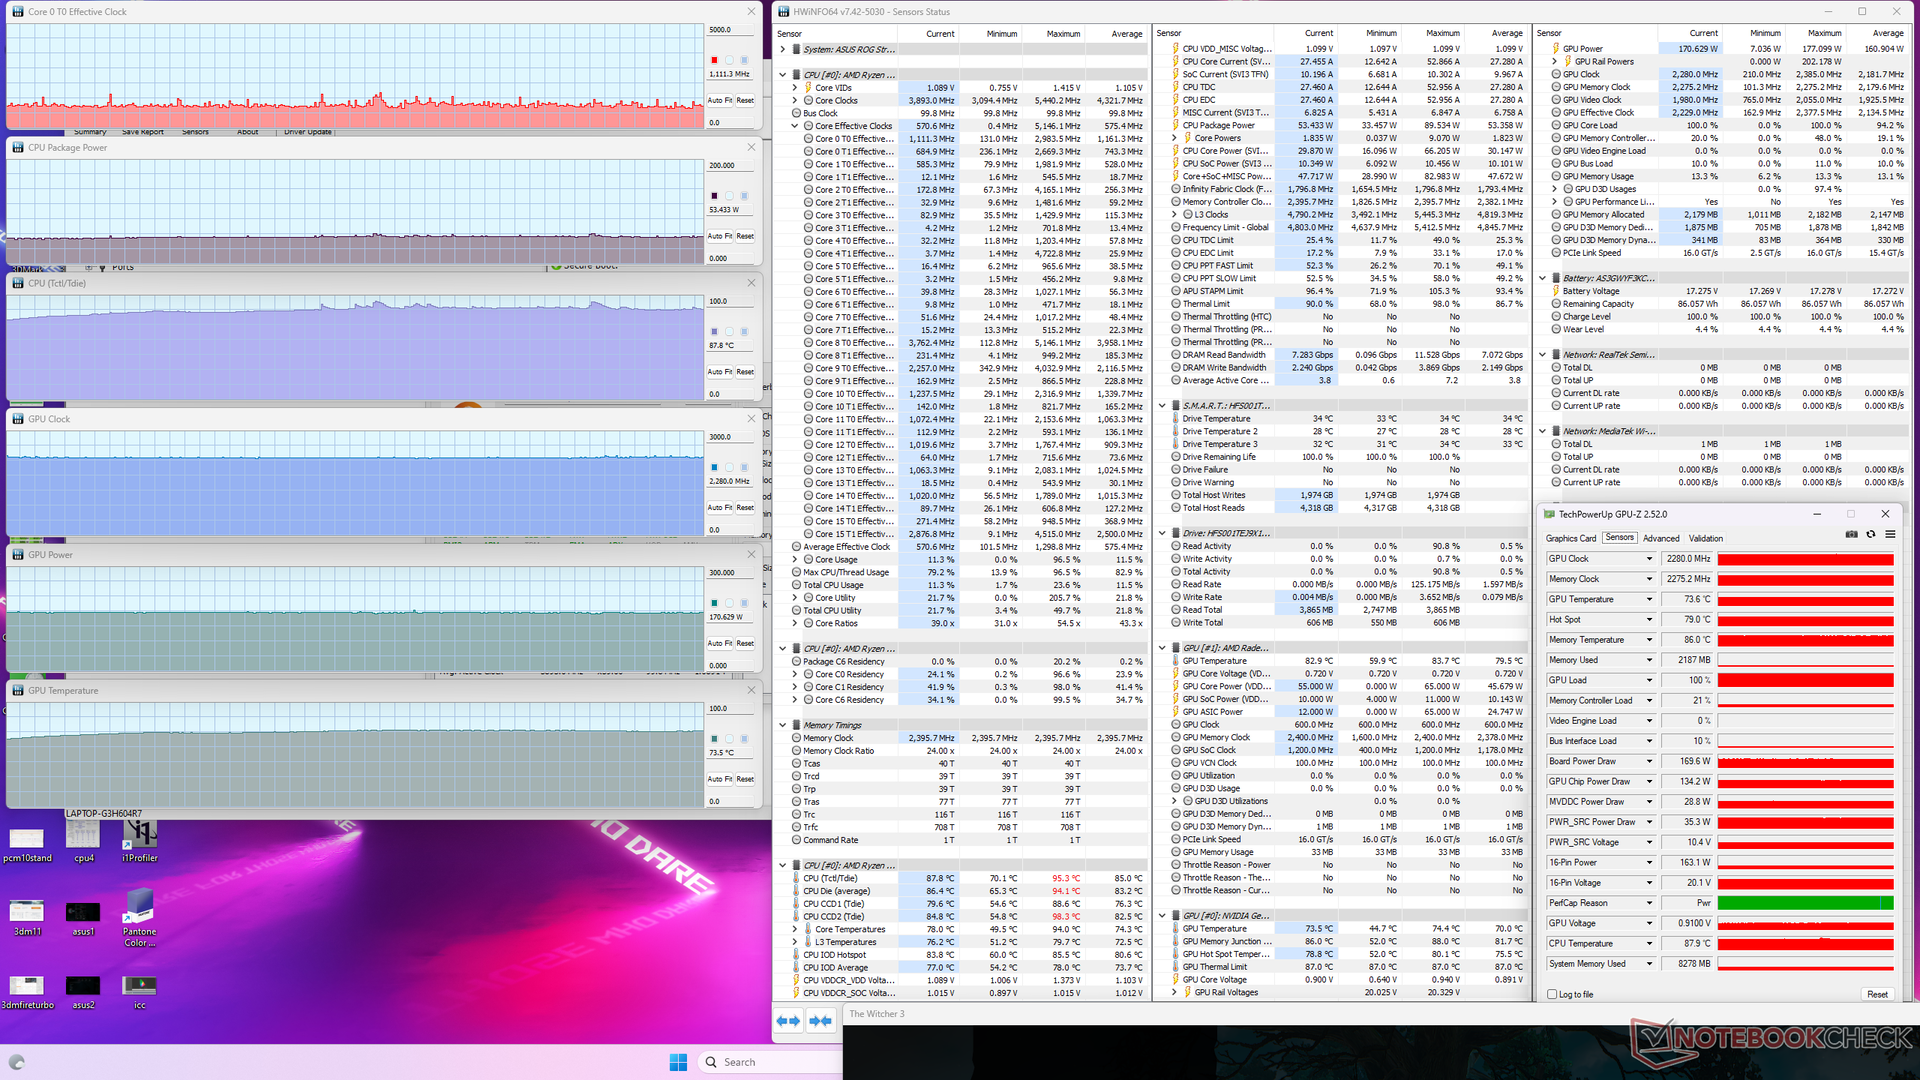
| CPU-klocka (GHz) | GPU-klocka (MHz) | Genomsnittlig CPU-temperatur (°C) | Genomsnittlig GPU-temperatur (°C) | |
| Systemets tomgång | -- | -- | 53 | 36 |
| Prime95 Stress | 4.2 - 4.9 | -- | 90 - 94 | 51 |
| Prime95 + FurMark Stress | 4.2 - 4.8 | ~850 - 1545 | 94 | 58 |
| Witcher 3 Stress (prestationsläge) | ~3,2 | 2055 | 97 | 79 |
| Witcher 3 Stress (Turbo-läge) | ~1,1 | 2280 | 88 | 74 |
Högtalare
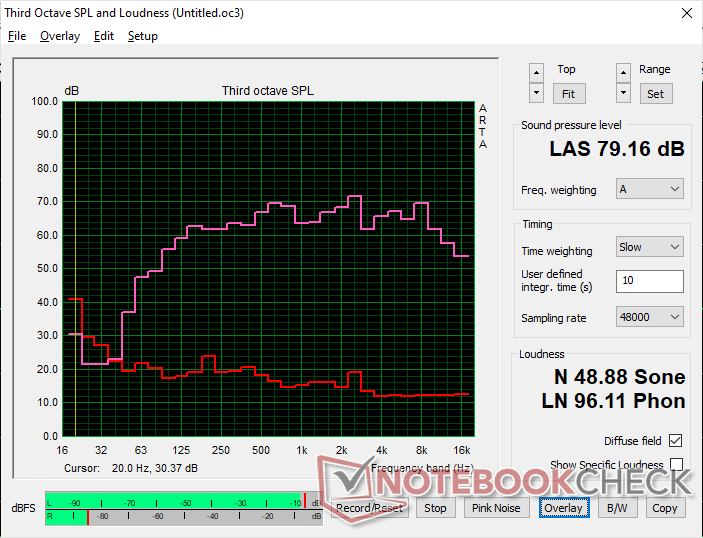
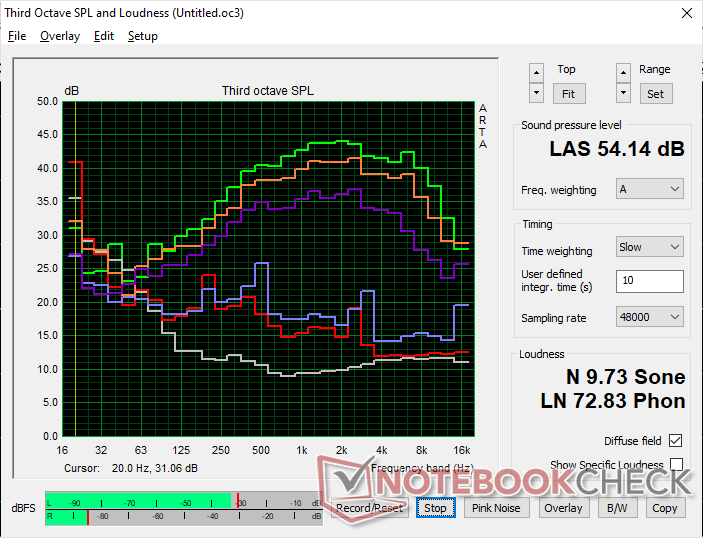
Asus ROG Strix Scar 17 G733PY-XS96 ljudanalys
(±) | högtalarljudstyrkan är genomsnittlig men bra (79.2 dB)
Bas 100 - 315 Hz
(+) | bra bas - bara 2.8% från medianen
(+) | basen är linjär (5.6% delta till föregående frekvens)
Mellan 400 - 2000 Hz
(+) | balanserad mellan - endast 2.9% från medianen
(+) | mids är linjära (4.7% delta till föregående frekvens)
Högsta 2 - 16 kHz
(+) | balanserade toppar - endast 3.5% från medianen
(±) | linjäriteten för toppar är genomsnittlig (10% delta till föregående frekvens)
Totalt 100 - 16 000 Hz
(+) | det totala ljudet är linjärt (9.3% skillnad mot median)
Jämfört med samma klass
» 3% av alla testade enheter i den här klassen var bättre, 2% liknande, 95% sämre
» Den bästa hade ett delta på 6%, genomsnittet var 18%, sämst var 132%
Jämfört med alla testade enheter
» 3% av alla testade enheter var bättre, 1% liknande, 96% sämre
» Den bästa hade ett delta på 4%, genomsnittet var 23%, sämst var 134%
Apple MacBook Pro 16 2021 M1 Pro ljudanalys
(+) | högtalare kan spela relativt högt (84.7 dB)
Bas 100 - 315 Hz
(+) | bra bas - bara 3.8% från medianen
(+) | basen är linjär (5.2% delta till föregående frekvens)
Mellan 400 - 2000 Hz
(+) | balanserad mellan - endast 1.3% från medianen
(+) | mids är linjära (2.1% delta till föregående frekvens)
Högsta 2 - 16 kHz
(+) | balanserade toppar - endast 1.9% från medianen
(+) | toppar är linjära (2.7% delta till föregående frekvens)
Totalt 100 - 16 000 Hz
(+) | det totala ljudet är linjärt (4.6% skillnad mot median)
Jämfört med samma klass
» 0% av alla testade enheter i den här klassen var bättre, 0% liknande, 100% sämre
» Den bästa hade ett delta på 5%, genomsnittet var 17%, sämst var 45%
Jämfört med alla testade enheter
» 0% av alla testade enheter var bättre, 0% liknande, 100% sämre
» Den bästa hade ett delta på 4%, genomsnittet var 23%, sämst var 134%
Energihantering - krävande maskin
Effektförbrukning
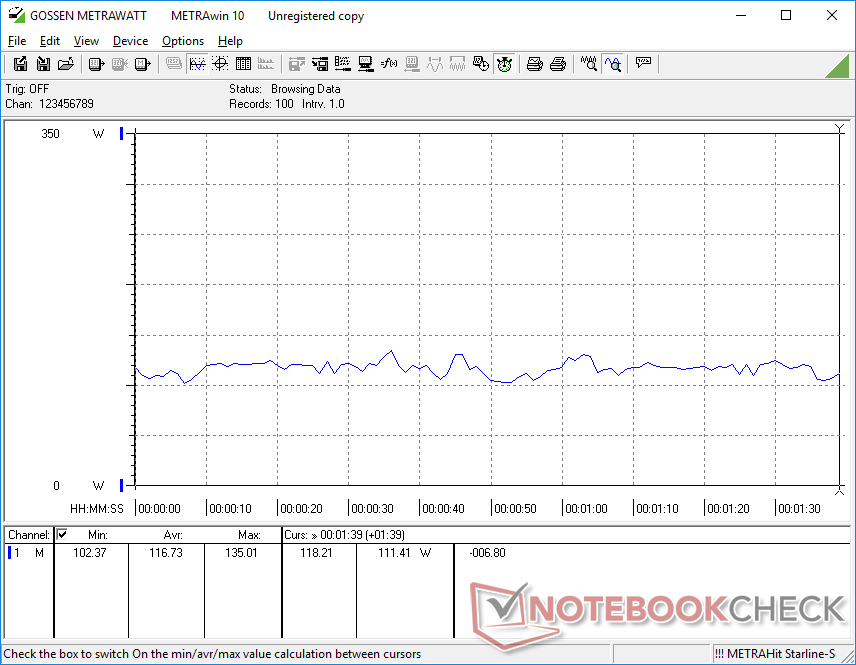
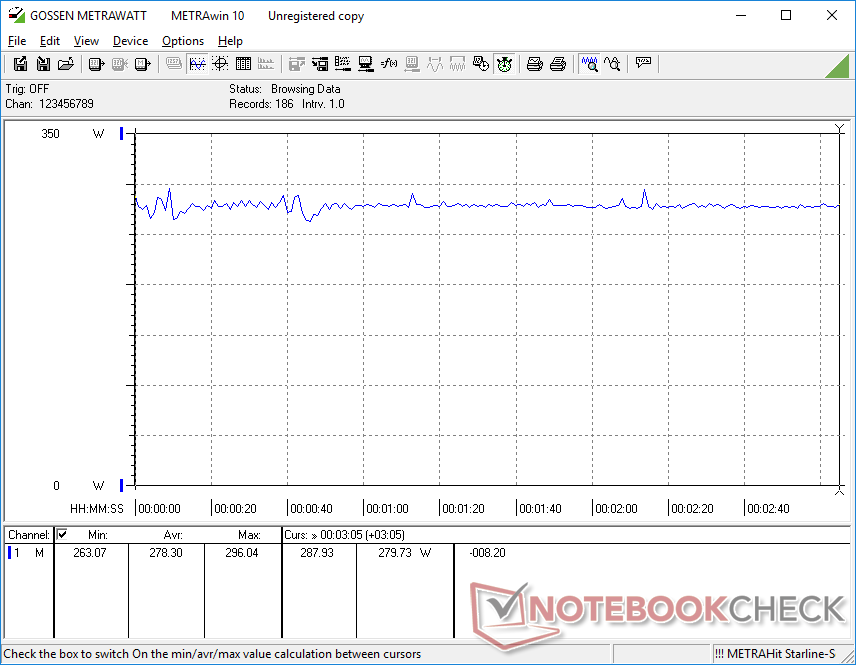
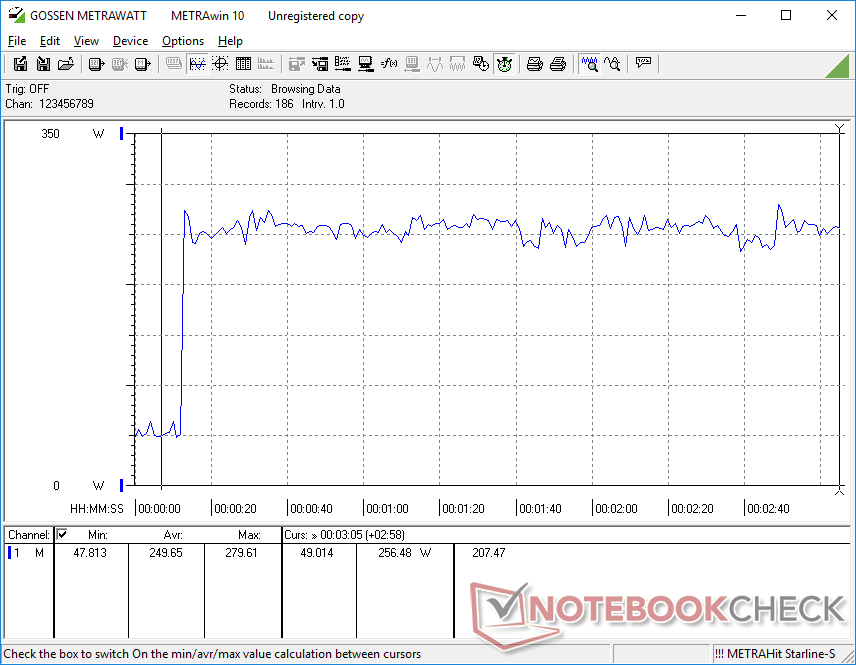
Vår 2023-modell är generellt sett mer energikrävande än den Intel-drivna 2022-modellen. När vi kör Prime95, till exempel, stabiliseras strömförbrukningen på 205 W jämfört med bara 117 W på förra årets i9-12950HX-konfiguration. På samma sätt kan man köra Witcher 3 skulle förbruka cirka 24 procent mer ström jämfört med den äldre RTX 3080 Ti-konfigurationen. Prestandan må vara snabbare från generation till generation, men förbrukningen har också ökat.
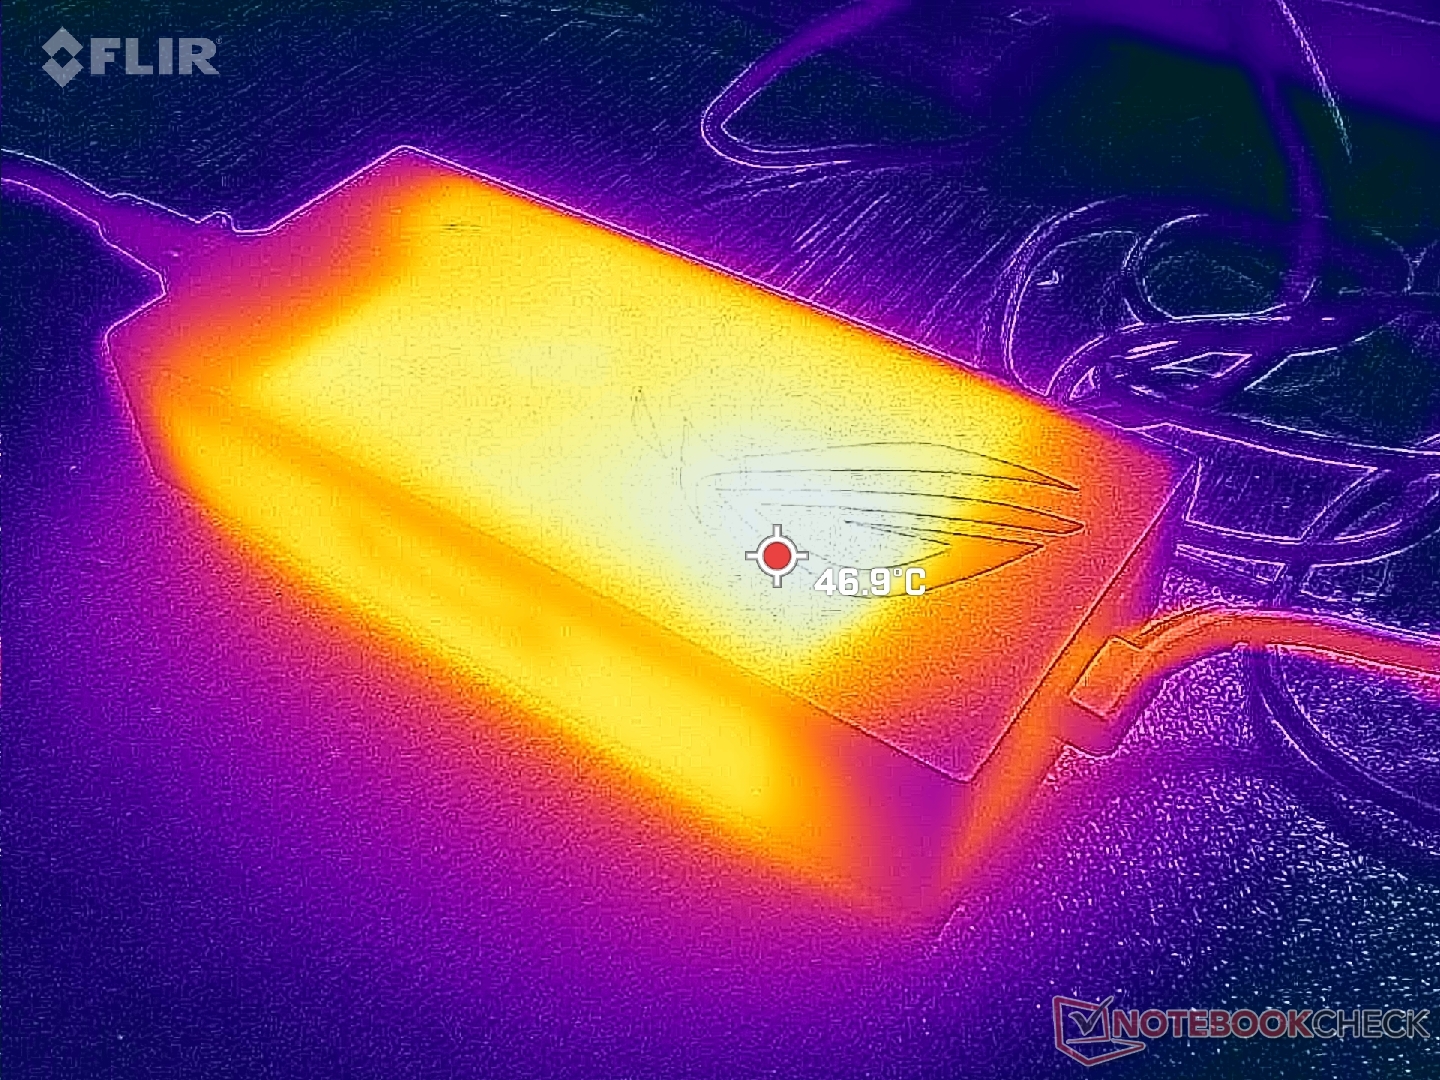
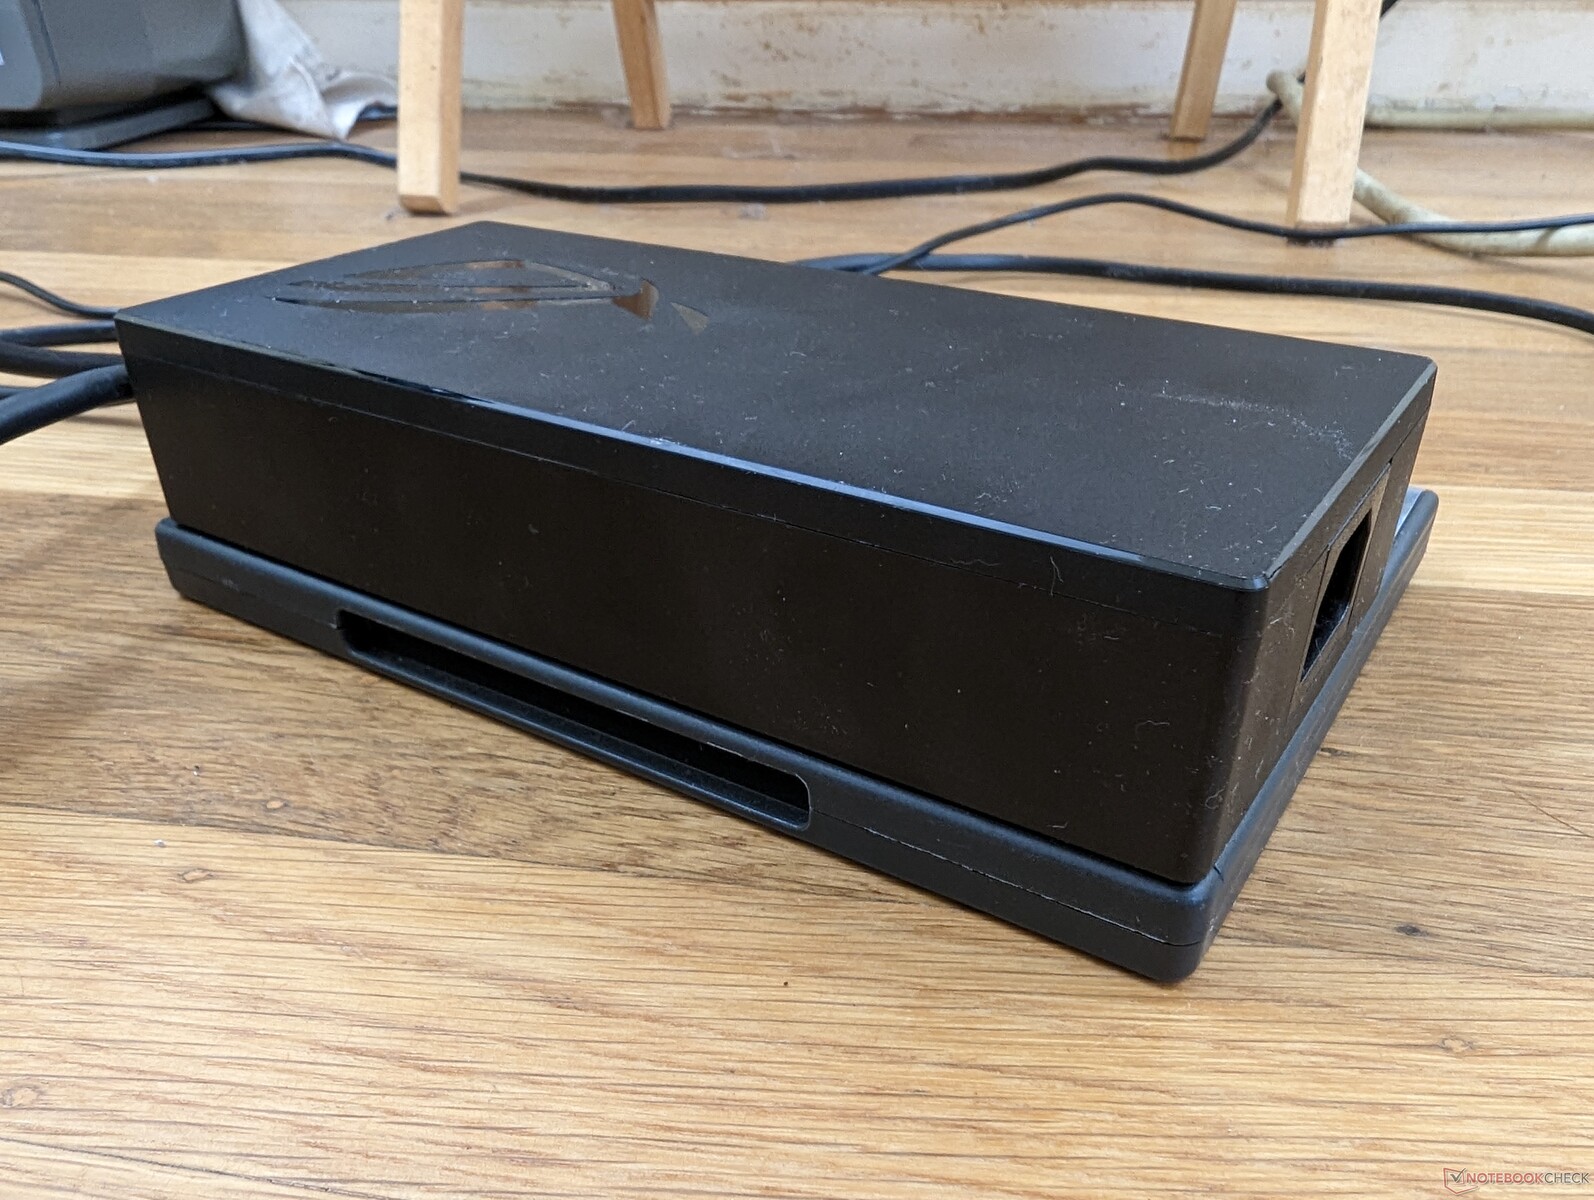
Vi kan registrera ett maximalt uttag på 280 W från den stora (~18,4 x 8,4 x 3,6 cm) 330 W AC-adaptern.
| Av/Standby | |
| Låg belastning | |
| Hög belastning |
|
Förklaring:
min: | |
| Asus ROG Strix Scar 17 G733PY-XS96 R9 7945HX, GeForce RTX 4090 Laptop GPU, SK hynix PC801 HFS001TEJ9X101N, IPS, 2560x1440, 17.3" | MSI GE78HX 13VH-070US i9-13950HX, GeForce RTX 4080 Laptop GPU, Samsung PM9A1 MZVL22T0HBLB, IPS, 2560x1600, 17" | Eluktronics Mech-17 GP2 i9-13900HX, GeForce RTX 4090 Laptop GPU, Samsung PM9A1 MZVL21T0HCLR, IPS, 2560x1600, 17" | Asus ROG Strix G17 G713PI R9 7945HX, GeForce RTX 4070 Laptop GPU, WD PC SN560 SDDPNQE-1T00, IPS, 2560x1440, 17.3" | Aorus 17X XES i9-12900HX, GeForce RTX 3070 Ti Laptop GPU, Gigabyte AG470S1TB-SI B10, IPS, 1920x1080, 17.3" | Alienware m17 R5 (R9 6900HX, RX 6850M XT) R9 6900HX, Radeon RX 6850M XT, SSSTC CA6-8D1024, IPS, 3840x2160, 17" | |
|---|---|---|---|---|---|---|
| Power Consumption | -3% | -1% | 13% | -9% | 23% | |
| Idle Minimum * (Watt) | 14.5 | 16.1 -11% | 14 3% | 15 -3% | 18 -24% | 13 10% |
| Idle Average * (Watt) | 21.1 | 24 -14% | 19.3 9% | 20 5% | 28 -33% | 16.5 22% |
| Idle Maximum * (Watt) | 42.8 | 34 21% | 36.8 14% | 29 32% | 36 16% | 17 60% |
| Load Average * (Watt) | 116.7 | 123.6 -6% | 117.2 -0% | 121 -4% | 153 -31% | 93 20% |
| Witcher 3 ultra * (Watt) | 278 | 286 -3% | 304 -9% | 179.8 35% | 221 21% | 239 14% |
| Load Maximum * (Watt) | 279.6 | 285.7 -2% | 342.5 -22% | 246 12% | 290 -4% | 251 10% |
* ... mindre är bättre
Power Consumption Witcher 3 / Stresstest
Power Consumption external Monitor
Batteritid
WLAN-driftstiden är ungefär genomsnittlig, 4 timmar, när du använder Balanced-profilen med Optimus och iGPU aktiverade. Andra bärbara 17-tums gamingdatorer som t.ex ROG Strix G17 G713PI ellerAorus 17X XES skulle ge liknande resultat.
Systemet kan laddas via USB-C-adaptrar från tredje part. Vissa adaptrar fungerar dock inte; vår 135 W Lenovo USB-C-laddare fungerade utan problem medan vår 130 W Dell XPS USB-C-laddare inte laddade alls.
| Asus ROG Strix Scar 17 G733PY-XS96 R9 7945HX, GeForce RTX 4090 Laptop GPU, 90 Wh | MSI GE78HX 13VH-070US i9-13950HX, GeForce RTX 4080 Laptop GPU, 99 Wh | Eluktronics Mech-17 GP2 i9-13900HX, GeForce RTX 4090 Laptop GPU, 99 Wh | Asus ROG Strix G17 G713PI R9 7945HX, GeForce RTX 4070 Laptop GPU, 90 Wh | Aorus 17X XES i9-12900HX, GeForce RTX 3070 Ti Laptop GPU, 99 Wh | Alienware m17 R5 (R9 6900HX, RX 6850M XT) R9 6900HX, Radeon RX 6850M XT, 97 Wh | |
|---|---|---|---|---|---|---|
| Batteridrifttid | 49% | 24% | 5% | 7% | 17% | |
| WiFi v1.3 (h) | 4.1 | 6.1 49% | 5.1 24% | 4.3 5% | 4.4 7% | 4.8 17% |
| Reader / Idle (h) | 7.3 | |||||
| Load (h) | 1.5 | 1 | 1.4 | 1.8 | ||
| H.264 (h) | 2.8 | 3.8 | 4.9 | |||
| Witcher 3 ultra (h) | 1.1 |
För
Emot
Bedömning - Utmärkt prestanda med ett åldrande utseende
För 2022 introducerade AMD och Nvidia Zen 3+-serien och den mobila GeForce 30 Ti-serien för att ersätta Zen 3 och icke-Ti-alternativen från 2021. Uppgraderingarna visade sig dock vara relativt små, eftersom de nyare alternativen inte förde med sig något nytt på arkitektonisk nivå. För 2023 har Zen 4-serien och den mobila GeForce RTX 40-serien äntligen medfört de betydande prestandauppgraderingar som bärbara spelare har väntat på. Strömförbrukningen kan vara högre, men ökningen av hästkrafter kompenserar för det, särskilt eftersom Ryzen 9 7945HX är både något snabbare och mer strömsnål än den konkurrerande 13:e generationens Core i9-13950HX.
ROG Strix Scar 17 från 2023 visar Ryzen 9 7945HX och GeForce RTX 4090 när de är som bäst. Vissa yttre designdetaljer skulle dock kunna behöva en uppdatering.
Processorerna är imponerande i år, men den övergripande yttre designen på ROG Strix Scar 17 skulle kunna behöva en större uppdatering. CPU-temperaturen när man spelar är till exempel högre än förväntat, medan PCIe4 x4 SSD:n stryps efter några minuters intensiv användning. De små numpad- och piltangenterna är fortfarande trånga och vissa sekundära etiketter på tangentbordstangenterna lyser fortfarande inte upp när bakgrundsbelysningen är aktiv. Vissa konkurrerande modeller som den tunnare MSI GE78 har också gått över till 16:10 medan Strix Scar 17-serien fortsätter att vara 16:9. Modellen riskerar att se och kännas gammalmodig tidigare även om prestandan är allt annat än långsam.
Pris och tillgänglighet
Namn, pris och tillgänglighet för den testade modellen, vid behov med avvikelser från relevanta utrustningsvarianter. Affil länk till en butik från listan i länkfönstret.
Asus ROG Strix Scar 17 G733PY-XS96
- 04/10/2023 v7 (old)
Allen Ngo
Genomskinlighet
Valet av enheter som ska granskas görs av vår redaktion. Testprovet gavs till författaren som ett lån av tillverkaren eller återförsäljaren för denna recension. Långivaren hade inget inflytande på denna recension och inte heller fick tillverkaren en kopia av denna recension innan publiceringen. Det fanns ingen skyldighet att publicera denna recension. Som ett oberoende medieföretag är Notebookcheck inte föremål för auktoritet från tillverkare, återförsäljare eller förlag.
This is how Notebookcheck is testingEvery year, Notebookcheck independently reviews hundreds of laptops and smartphones using standardized procedures to ensure that all results are comparable. We have continuously developed our test methods for around 20 years and set industry standards in the process. In our test labs, high-quality measuring equipment is utilized by experienced technicians and editors. These tests involve a multi-stage validation process. Our complex rating system is based on hundreds of well-founded measurements and benchmarks, which maintains objectivity.
Price comparison

