Test: MSI GF65 9SD - GeForce GTX 1660 Ti för under 10.000 kr (Sammanfattning)
Gradering | Datum | Modell | Vikt | Höjd | Storlek | Upplösning | Pris |
|---|---|---|---|---|---|---|---|
| 78.8 % v7 (old) | 10/2019 | MSI GF65 9SD i7-9750H, GeForce GTX 1660 Ti Mobile | 1.9 kg | 21.7 mm | 15.60" | 1920x1080 | |
| 80.4 % v6 (old) | 07/2019 | Asus TUF FX505DT-EB73 R7 3750H, GeForce GTX 1650 Mobile | 2.2 kg | 26.8 mm | 15.60" | 1920x1080 | |
| 82.3 % v7 (old) | 10/2019 | Dell G7 7590 i7-9750H, GeForce RTX 2060 Mobile | 2.5 kg | 19.9 mm | 15.60" | 1920x1080 | |
| 82.3 % v7 (old) | 08/2019 | Lenovo Legion Y540-15IRH-81SX00B2GE i7-9750H, GeForce GTX 1660 Ti Mobile | 2.2 kg | 26 mm | 15.60" | 1920x1080 |
| Networking | |
| iperf3 transmit AX12 | |
| Aorus 15-SA | |
| Lenovo Legion Y540-15IRH-81SX00B2GE | |
| Asus TUF FX505DT-EB73 | |
| MSI GF63 8RC | |
| MSI GF65 9SD | |
| iperf3 receive AX12 | |
| Aorus 15-SA | |
| MSI GF65 9SD | |
| Lenovo Legion Y540-15IRH-81SX00B2GE | |
| Asus TUF FX505DT-EB73 | |
| MSI GF63 8RC | |
| |||||||||||||||||||||||||
Distribution av ljusstyrkan: 90 %
Mitt på batteriet: 258.5 cd/m²
Kontrast: 923:1 (Svärta: 0.28 cd/m²)
ΔE ColorChecker Calman: 5.36 | ∀{0.5-29.43 Ø4.73}
calibrated: 4.92
ΔE Greyscale Calman: 3.4 | ∀{0.09-98 Ø4.97}
53.8% sRGB (Argyll 1.6.3 3D)
34.2% AdobeRGB 1998 (Argyll 1.6.3 3D)
37.26% AdobeRGB 1998 (Argyll 3D)
54.1% sRGB (Argyll 3D)
36.06% Display P3 (Argyll 3D)
Gamma: 2.06
CCT: 6192 K
| MSI GF65 9SD AU Optronics B156HAN13.0, IPS, 15.6", 1920x1080 | MSI GF63 8RC AU Optronics B156HAN02.1, IPS, 15.6", 1920x1080 | Asus TUF FX505DT-EB73 Panda LM156LF-GL, IPS, 15.6", 1920x1080 | Aorus 15-SA LG Philips LP156WFG-SPB2 (LGD05E8), IPS, 15.6", 1920x1080 | Dell G7 7590 AU Optronics B156HAN, IPS, 15.6", 1920x1080 | Lenovo Legion Y540-15IRH-81SX00B2GE BOE 084D, IPS, 15.6", 1920x1080 | |
|---|---|---|---|---|---|---|
| Display | 9% | 10% | 76% | 73% | 74% | |
| Display P3 Coverage (%) | 36.06 | 39.43 9% | 39.56 10% | 64.3 78% | 64.4 79% | 63.6 76% |
| sRGB Coverage (%) | 54.1 | 59.3 10% | 59.5 10% | 93.6 73% | 90 66% | 91.7 70% |
| AdobeRGB 1998 Coverage (%) | 37.26 | 40.73 9% | 40.91 10% | 65.6 76% | 65.3 75% | 65.2 75% |
| Response Times | 0% | 3% | 53% | 58% | 64% | |
| Response Time Grey 50% / Grey 80% * (ms) | 35.2 ? | 33.2 ? 6% | 30.4 ? 14% | 15.6 ? 56% | 14 ? 60% | 8.8 ? 75% |
| Response Time Black / White * (ms) | 25.6 ? | 27.2 ? -6% | 27.6 ? -8% | 12.8 ? 50% | 11.2 ? 56% | 12 ? 53% |
| PWM Frequency (Hz) | ||||||
| Screen | -3% | -2% | 30% | -3% | 29% | |
| Brightness middle (cd/m²) | 258.5 | 266.6 3% | 286.2 11% | 266 3% | 330.5 28% | 299 16% |
| Brightness (cd/m²) | 254 | 257 1% | 267 5% | 254 0% | 324 28% | 290 14% |
| Brightness Distribution (%) | 90 | 89 -1% | 84 -7% | 90 0% | 91 1% | 89 -1% |
| Black Level * (cd/m²) | 0.28 | 0.29 -4% | 0.33 -18% | 0.28 -0% | 0.71 -154% | 0.29 -4% |
| Contrast (:1) | 923 | 919 0% | 867 -6% | 950 3% | 465 -50% | 1031 12% |
| Colorchecker dE 2000 * | 5.36 | 5.93 -11% | 5.45 -2% | 3.11 42% | 5.33 1% | 3.7 31% |
| Colorchecker dE 2000 max. * | 23.23 | 16.28 30% | 18.08 22% | 5.84 75% | 11.08 52% | 7 70% |
| Colorchecker dE 2000 calibrated * | 4.92 | 3.6 27% | 4.47 9% | 1.37 72% | 3.63 26% | 2 59% |
| Greyscale dE 2000 * | 3.4 | 6.8 -100% | 5.3 -56% | 3.94 -16% | 6.7 -97% | 4.1 -21% |
| Gamma | 2.06 107% | 2.43 91% | 2.1 105% | 2.53 87% | 2.24 98% | 2.19 100% |
| CCT | 6192 105% | 7192 90% | 7679 85% | 6210 105% | 8035 81% | 7166 91% |
| Color Space (Percent of AdobeRGB 1998) (%) | 34.2 | 37.6 10% | 37.6 10% | 60 75% | 58.3 70% | 59.3 73% |
| Color Space (Percent of sRGB) (%) | 53.8 | 59.3 10% | 59.1 10% | 93 73% | 89.5 66% | 91.5 70% |
| Totalt genomsnitt (program/inställningar) | 2% /
-0% | 4% /
1% | 53% /
41% | 43% /
19% | 56% /
42% |
* ... mindre är bättre
Visa svarstider
| ↔ Svarstid svart till vitt | ||
|---|---|---|
| 25.6 ms ... stiga ↗ och falla ↘ kombinerat | ↗ 12.4 ms stiga | 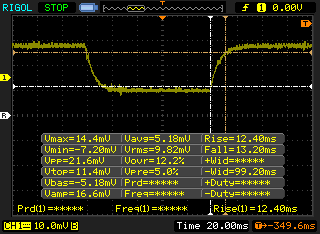 |
| ↘ 13.2 ms hösten | ||
| Skärmen visar relativt långsamma svarsfrekvenser i våra tester och kan vara för långsam för spelare. I jämförelse sträcker sig alla testade enheter från 0.1 (minst) till 240 (maximalt) ms. » 61 % av alla enheter är bättre. Detta innebär att den uppmätta svarstiden är sämre än genomsnittet av alla testade enheter (19.9 ms). | ||
| ↔ Svarstid 50 % grått till 80 % grått | ||
| 35.2 ms ... stiga ↗ och falla ↘ kombinerat | ↗ 18 ms stiga | 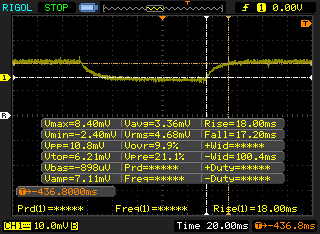 |
| ↘ 17.2 ms hösten | ||
| Skärmen visar långsamma svarsfrekvenser i våra tester och kommer att vara otillfredsställande för spelare. I jämförelse sträcker sig alla testade enheter från 0.165 (minst) till 636 (maximalt) ms. » 49 % av alla enheter är bättre. Detta innebär att den uppmätta svarstiden är sämre än genomsnittet av alla testade enheter (31.1 ms). | ||
Skärmflimmer / PWM (Puls-Width Modulation)
| Skärmflimmer / PWM upptäcktes inte | 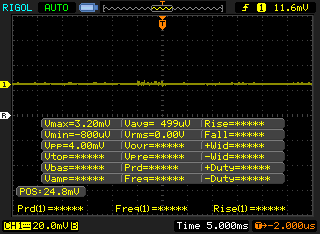 | ||
Som jämförelse: 52 % av alla testade enheter använder inte PWM för att dämpa skärmen. Om PWM upptäcktes mättes ett medelvärde av 7801 (minst: 5 - maximum: 343500) Hz. | |||
| wPrime 2.10 - 1024m | |
| Dell XPS 13 7390 2-in-1 Core i7 | |
| MSI GF62VR 7RF-877 | |
| MSI GV62 8RE-016US | |
| Asus ROG Zephyrus G15 GA502DU | |
| Genomsnitt Intel Core i7-9750H (n=1) | |
| MSI GE75 9SG | |
* ... mindre är bättre
| PCMark 8 Home Score Accelerated v2 | 4205 poäng | |
| PCMark 8 Work Score Accelerated v2 | 5357 poäng | |
| PCMark 10 Score | 5508 poäng | |
Hjälp | ||
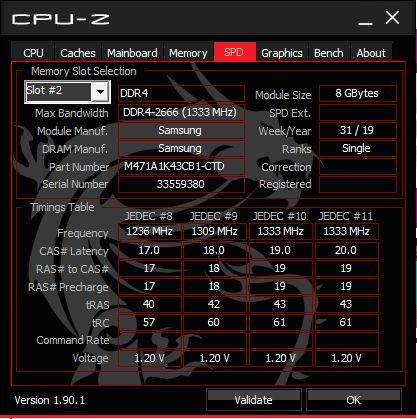
| MSI GF65 9SD Kingston RBUSNS8154P3512GJ | Asus TUF FX505DT-EB73 Intel SSD 660p SSDPEKNW512G8 | Aorus 15-SA Intel SSD 760p SSDPEKKW512G8 | Dell G7 7590 Toshiba BG3 KBG30ZMS256G | Lenovo Legion Y540-15IRH-81SX00B2GE WDC PC SN720 SDAPNTW-512G | |
|---|---|---|---|---|---|
| AS SSD | 7% | 50% | -52% | 92% | |
| Seq Read (MB/s) | 1148 | 1019 -11% | 2601 127% | 1013 -12% | 2927 155% |
| Seq Write (MB/s) | 962 | 889 -8% | 1507 57% | 203.8 -79% | 2149 123% |
| 4K Read (MB/s) | 22.87 | 48.22 111% | 56.3 146% | 29.57 29% | 42.43 86% |
| 4K Write (MB/s) | 80.6 | 115.5 43% | 110.3 37% | 71.4 -11% | 147.1 83% |
| 4K-64 Read (MB/s) | 772 | 321.5 -58% | 877 14% | 332.1 -57% | 1286 67% |
| 4K-64 Write (MB/s) | 711 | 787 11% | 914 29% | 152.9 -78% | 1432 101% |
| Access Time Read * (ms) | 0.125 | 0.065 48% | 0.05 60% | 0.183 -46% | 0.065 48% |
| Access Time Write * (ms) | 0.138 | 0.047 66% | 0.034 75% | 0.248 -80% | 0.026 81% |
| Score Read (Points) | 910 | 472 -48% | 1193 31% | 463 -49% | 1621 78% |
| Score Write (Points) | 887 | 992 12% | 1175 32% | 245 -72% | 1794 102% |
| Score Total (Points) | 2254 | 1717 -24% | 2938 30% | 913 -59% | 4208 87% |
| Copy ISO MB/s (MB/s) | 1103 | 942 -15% | 2104 91% | 263.6 -76% | |
| Copy Program MB/s (MB/s) | 537 | 444.5 -17% | 387.7 -28% | 213.8 -60% | |
| Copy Game MB/s (MB/s) | 997 | 867 -13% | 1021 2% | 188 -81% |
* ... mindre är bättre

| 3DMark | |
| 1280x720 Cloud Gate Standard Graphics | |
| MSI GT75VR 7RF-012 Titan Pro | |
| MSI GF65 9SD | |
| MSI GS63VR 7RG-005 | |
| Genomsnitt NVIDIA GeForce GTX 1660 Ti Mobile (59839 - 104780, n=18) | |
| Zotac GeForce GTX 1660 Ti 6 GB | |
| MSI GP72VR 7RFX | |
| MSI GL73 8SE-010US | |
| MSI GE75 8SF | |
| MSI GF75 Thin 9SC | |
| Asus TUF FX705GE-EW096T | |
| Asus ROG Zephyrus G15 GA502DU | |
| Asus FX504GD | |
| 1920x1080 Fire Strike Graphics | |
| MSI GT75VR 7RF-012 Titan Pro | |
| MSI GE75 8SF | |
| Zotac GeForce GTX 1660 Ti 6 GB | |
| MSI GL73 8SE-010US | |
| MSI GF65 9SD | |
| Genomsnitt NVIDIA GeForce GTX 1660 Ti Mobile (14186 - 16488, n=24) | |
| MSI GS63VR 7RG-005 | |
| Asus ROG Zephyrus G15 GA502DU | |
| MSI GP72VR 7RFX | |
| MSI GF75 Thin 9SC | |
| Asus TUF FX705GE-EW096T | |
| Asus FX504GD | |
| 2560x1440 Time Spy Graphics | |
| MSI GE75 8SF | |
| MSI GT75VR 7RF-012 Titan Pro | |
| Zotac GeForce GTX 1660 Ti 6 GB | |
| MSI GL73 8SE-010US | |
| MSI GF65 9SD | |
| Genomsnitt NVIDIA GeForce GTX 1660 Ti Mobile (5335 - 6123, n=22) | |
| Asus ROG Zephyrus G15 GA502DU | |
| MSI GS63VR 7RG-005 | |
| MSI GP72VR 7RFX | |
| MSI GF75 Thin 9SC | |
| Asus TUF FX705GE-EW096T | |
| Asus FX504GD | |
| 3DMark 11 | |
| 1280x720 Performance GPU | |
| MSI GT75VR 7RF-012 Titan Pro | |
| MSI GE75 8SF | |
| Zotac GeForce GTX 1660 Ti 6 GB | |
| MSI GF65 9SD | |
| MSI GL73 8SE-010US | |
| Genomsnitt NVIDIA GeForce GTX 1660 Ti Mobile (18610 - 22670, n=24) | |
| MSI GS63VR 7RG-005 | |
| Asus ROG Zephyrus G15 GA502DU | |
| MSI GP72VR 7RFX | |
| MSI GF75 Thin 9SC | |
| Asus TUF FX705GE-EW096T | |
| Asus FX504GD | |
| 1280x720 Performance Combined | |
| Zotac GeForce GTX 1660 Ti 6 GB | |
| MSI GF65 9SD | |
| Genomsnitt NVIDIA GeForce GTX 1660 Ti Mobile (9500 - 13311, n=23) | |
| MSI GF75 Thin 9SC | |
| MSI GT75VR 7RF-012 Titan Pro | |
| MSI GL73 8SE-010US | |
| MSI GE75 8SF | |
| Asus TUF FX705GE-EW096T | |
| MSI GS63VR 7RG-005 | |
| MSI GP72VR 7RFX | |
| Asus FX504GD | |
| Asus ROG Zephyrus G15 GA502DU | |
| 3DMark 11 Performance | 18059 poäng | |
| 3DMark Cloud Gate Standard Score | 36975 poäng | |
| 3DMark Fire Strike Score | 13483 poäng | |
| 3DMark Time Spy Score | 5825 poäng | |
Hjälp | ||
| The Witcher 3 - 1920x1080 Ultra Graphics & Postprocessing (HBAO+) | |
| MSI GT76 Titan DT 9SG | |
| MSI P65 Creator 9SF-657 | |
| MSI GT75VR 7RF-012 Titan Pro | |
| MSI GE75 8SF | |
| Dell G7 7590 | |
| Zotac GeForce GTX 1660 Ti 6 GB | |
| MSI GF65 9SD | |
| Genomsnitt NVIDIA GeForce GTX 1660 Ti Mobile (51.6 - 65.1, n=21) | |
| MSI GL73 8SE-010US | |
| Lenovo Legion Y540-15IRH-81SX00B2GE | |
| MSI GS63VR 7RG-005 | |
| Asus ROG Zephyrus G15 GA502DU | |
| MSI GF75 8RD-001 | |
| MSI GF62VR 7RF-877 | |
| MSI GF75 Thin 9SC | |
| MSI GF63 8RC | |
| Dell XPS 13 7390 2-in-1 Core i7 | |
| Shadow of the Tomb Raider - 1920x1080 Highest Preset AA:T | |
| Zotac GeForce GTX 1660 Ti 6 GB | |
| Dell G7 7590 | |
| Genomsnitt NVIDIA GeForce GTX 1660 Ti Mobile (62 - 73, n=8) | |
| MSI GL73 8SE-010US | |
| MSI GF65 9SD | |
| Asus ROG Zephyrus G15 GA502DU | |
| MSI GF75 Thin 9SC | |
| låg | med. | hög | ultra | |
|---|---|---|---|---|
| BioShock Infinite (2013) | 317.1 | 264 | 250.9 | 128.6 |
| The Witcher 3 (2015) | 287.9 | 191.6 | 116 | 60.6 |
| Shadow of the Tomb Raider (2018) | 135 | 81 | 72 | 64 |
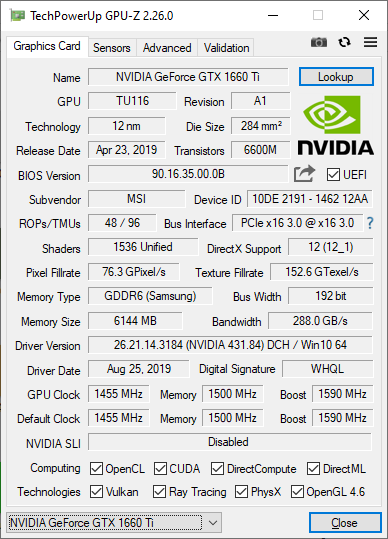
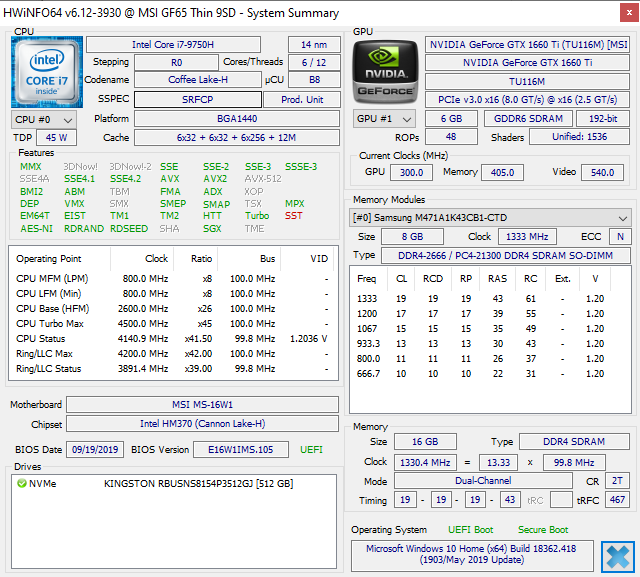
| MSI GF65 9SD GeForce GTX 1660 Ti Mobile, i7-9750H, Kingston RBUSNS8154P3512GJ | MSI GF63 8RC GeForce GTX 1050 Mobile, i5-8300H, Seagate BarraCuda Pro Compute 1TB ST1000LM049 | Lenovo Legion Y540-15IRH-81SX00B2GE GeForce GTX 1660 Ti Mobile, i7-9750H, WDC PC SN720 SDAPNTW-512G | Dell G7 7590 GeForce RTX 2060 Mobile, i7-9750H, Toshiba BG3 KBG30ZMS256G | Aorus 15-SA GeForce GTX 1660 Ti Mobile, i7-9750H, Intel SSD 760p SSDPEKKW512G8 | Asus ROG Zephyrus G15 GA502DU GeForce GTX 1660 Ti Max-Q, R7 3750H, Intel SSD 660p SSDPEKNW512G8 | |
|---|---|---|---|---|---|---|
| Noise | 6% | 12% | 5% | -7% | 3% | |
| av / miljö * (dB) | 28.7 | 28 2% | 29.3 -2% | 28.4 1% | 29 -1% | 28 2% |
| Idle Minimum * (dB) | 33.3 | 33.8 -2% | 29.3 12% | 29.5 11% | 32 4% | 29.4 12% |
| Idle Average * (dB) | 33.9 | 34 -0% | 29.3 14% | 29.6 13% | 35 -3% | 31.9 6% |
| Idle Maximum * (dB) | 33.9 | 34.2 -1% | 29.3 14% | 29.6 13% | 41 -21% | 33 3% |
| Load Average * (dB) | 41 | 37.3 9% | 35.7 13% | 45 -10% | 54 -32% | 41.2 -0% |
| Witcher 3 ultra * (dB) | 49.5 | 43.4 12% | 44.2 11% | 51.5 -4% | 52 -5% | 53.8 -9% |
| Load Maximum * (dB) | 59.5 | 46 23% | 45.6 23% | 53 11% | 56 6% | 55.7 6% |
* ... mindre är bättre
Ljudnivå
| Låg belastning |
| 33.3 / 33.9 / 33.9 dB(A) |
| Hög belastning |
| 41 / 59.5 dB(A) |
 | ||
30 dB tyst 40 dB(A) hörbar 50 dB(A) högt ljud |
||
min: | ||
(-) Den maximala temperaturen på ovansidan är 52.8 °C / 127 F, jämfört med genomsnittet av 40.4 °C / 105 F , allt från 21.2 till 68.8 °C för klassen Gaming.
(-) Botten värms upp till maximalt 53 °C / 127 F, jämfört med genomsnittet av 43.2 °C / 110 F
(+) Vid tomgångsbruk är medeltemperaturen för ovansidan 26.5 °C / 80 F, jämfört med enhetsgenomsnittet på 33.9 °C / ### class_avg_f### F.
(±) När du spelar The Witcher 3 är medeltemperaturen för ovansidan 33.4 °C / 92 F, jämfört med enhetsgenomsnittet på 33.9 °C / ## #class_avg_f### F.
(+) Handledsstöden och pekplattan är kallare än hudtemperaturen med maximalt 26.2 °C / 79.2 F och är därför svala att ta på.
(+) Medeltemperaturen för handledsstödsområdet på liknande enheter var 28.8 °C / 83.8 F (+2.6 °C / 4.6 F).
MSI GF65 9SD ljudanalys
(+) | högtalare kan spela relativt högt (84.6 dB)
Bas 100 - 315 Hz
(-) | nästan ingen bas - i genomsnitt 19.5% lägre än medianen
(-) | basen är inte linjär (15.4% delta till föregående frekvens)
Mellan 400 - 2000 Hz
(+) | balanserad mellan - endast 1.9% från medianen
(+) | mids är linjära (5.8% delta till föregående frekvens)
Högsta 2 - 16 kHz
(+) | balanserade toppar - endast 2.5% från medianen
(±) | linjäriteten för toppar är genomsnittlig (10.5% delta till föregående frekvens)
Totalt 100 - 16 000 Hz
(±) | linjäriteten för det totala ljudet är genomsnittlig (17.4% skillnad mot median)
Jämfört med samma klass
» 48% av alla testade enheter i den här klassen var bättre, 12% liknande, 40% sämre
» Den bästa hade ett delta på 6%, genomsnittet var 18%, sämst var 132%
Jämfört med alla testade enheter
» 33% av alla testade enheter var bättre, 8% liknande, 59% sämre
» Den bästa hade ett delta på 4%, genomsnittet var 24%, sämst var 134%
Apple MacBook 12 (Early 2016) 1.1 GHz ljudanalys
(+) | högtalare kan spela relativt högt (83.6 dB)
Bas 100 - 315 Hz
(±) | reducerad bas - i genomsnitt 11.3% lägre än medianen
(±) | linjäriteten för basen är genomsnittlig (14.2% delta till föregående frekvens)
Mellan 400 - 2000 Hz
(+) | balanserad mellan - endast 2.4% från medianen
(+) | mids är linjära (5.5% delta till föregående frekvens)
Högsta 2 - 16 kHz
(+) | balanserade toppar - endast 2% från medianen
(+) | toppar är linjära (4.5% delta till föregående frekvens)
Totalt 100 - 16 000 Hz
(+) | det totala ljudet är linjärt (10.2% skillnad mot median)
Jämfört med samma klass
» 7% av alla testade enheter i den här klassen var bättre, 2% liknande, 91% sämre
» Den bästa hade ett delta på 5%, genomsnittet var 18%, sämst var 53%
Jämfört med alla testade enheter
» 5% av alla testade enheter var bättre, 1% liknande, 94% sämre
» Den bästa hade ett delta på 4%, genomsnittet var 24%, sämst var 134%
| Av/Standby | |
| Låg belastning | |
| Hög belastning |
|
Förklaring:
min: | |
| MSI GF65 9SD i7-9750H, GeForce GTX 1660 Ti Mobile, Kingston RBUSNS8154P3512GJ, IPS, 1920x1080, 15.6" | Asus ROG Zephyrus G15 GA502DU R7 3750H, GeForce GTX 1660 Ti Max-Q, Intel SSD 660p SSDPEKNW512G8, IPS, 1920x1080, 15.6" | MSI GF63 8RC i5-8300H, GeForce GTX 1050 Mobile, Seagate BarraCuda Pro Compute 1TB ST1000LM049, IPS, 1920x1080, 15.6" | Aorus 15-SA i7-9750H, GeForce GTX 1660 Ti Mobile, Intel SSD 760p SSDPEKKW512G8, IPS, 1920x1080, 15.6" | Dell G7 7590 i7-9750H, GeForce RTX 2060 Mobile, Toshiba BG3 KBG30ZMS256G, IPS, 1920x1080, 15.6" | Lenovo Legion Y7000P-1060 i7-8750H, GeForce GTX 1060 Mobile, Samsung SSD PM981 MZVLB256HAHQ, IPS, 1920x1080, 15.6" | |
|---|---|---|---|---|---|---|
| Power Consumption | 6% | 29% | -38% | -35% | 14% | |
| Idle Minimum * (Watt) | 9.5 | 7.4 22% | 5.4 43% | 20 -111% | 11.2 -18% | 4.9 48% |
| Idle Average * (Watt) | 12.4 | 8.6 31% | 10.4 16% | 23 -85% | 16.3 -31% | 8.1 35% |
| Idle Maximum * (Watt) | 22 | 39.1 -78% | 10.5 52% | 29 -32% | 46.2 -110% | 16.5 25% |
| Load Average * (Watt) | 80.8 | 65.9 18% | 84.7 -5% | 87 -8% | 123.3 -53% | 109.2 -35% |
| Witcher 3 ultra * (Watt) | 133.9 | 106.9 20% | 92.7 31% | 136 -2% | 135.6 -1% | 124.6 7% |
| Load Maximum * (Watt) | 187.1 | 141.3 24% | 119.9 36% | 173 8% | 181.5 3% | 175.2 6% |
* ... mindre är bättre
| MSI GF65 9SD i7-9750H, GeForce GTX 1660 Ti Mobile, 51 Wh | Asus ROG Zephyrus G15 GA502DU R7 3750H, GeForce GTX 1660 Ti Max-Q, 76 Wh | MSI GF63 8RC i5-8300H, GeForce GTX 1050 Mobile, 51 Wh | Lenovo Legion Y540-15IRH-81SX00B2GE i7-9750H, GeForce GTX 1660 Ti Mobile, 57 Wh | Dell G7 7590 i7-9750H, GeForce RTX 2060 Mobile, 60 Wh | Aorus 15-SA i7-9750H, GeForce GTX 1660 Ti Mobile, 62 Wh | |
|---|---|---|---|---|---|---|
| Batteridrifttid | 57% | 8% | -53% | -10% | -45% | |
| WiFi v1.3 (h) | 5.1 | 8 57% | 5.5 8% | 2.4 -53% | 4.6 -10% | 2.8 -45% |
| Reader / Idle (h) | 15.3 | 9.5 | 4 | 11.1 | 3.5 | |
| Load (h) | 2.1 | 0.9 | 1.3 | 1.8 | 2 |
För
Emot

Läs den fullständiga versionen av den här recensionen på engelska här.
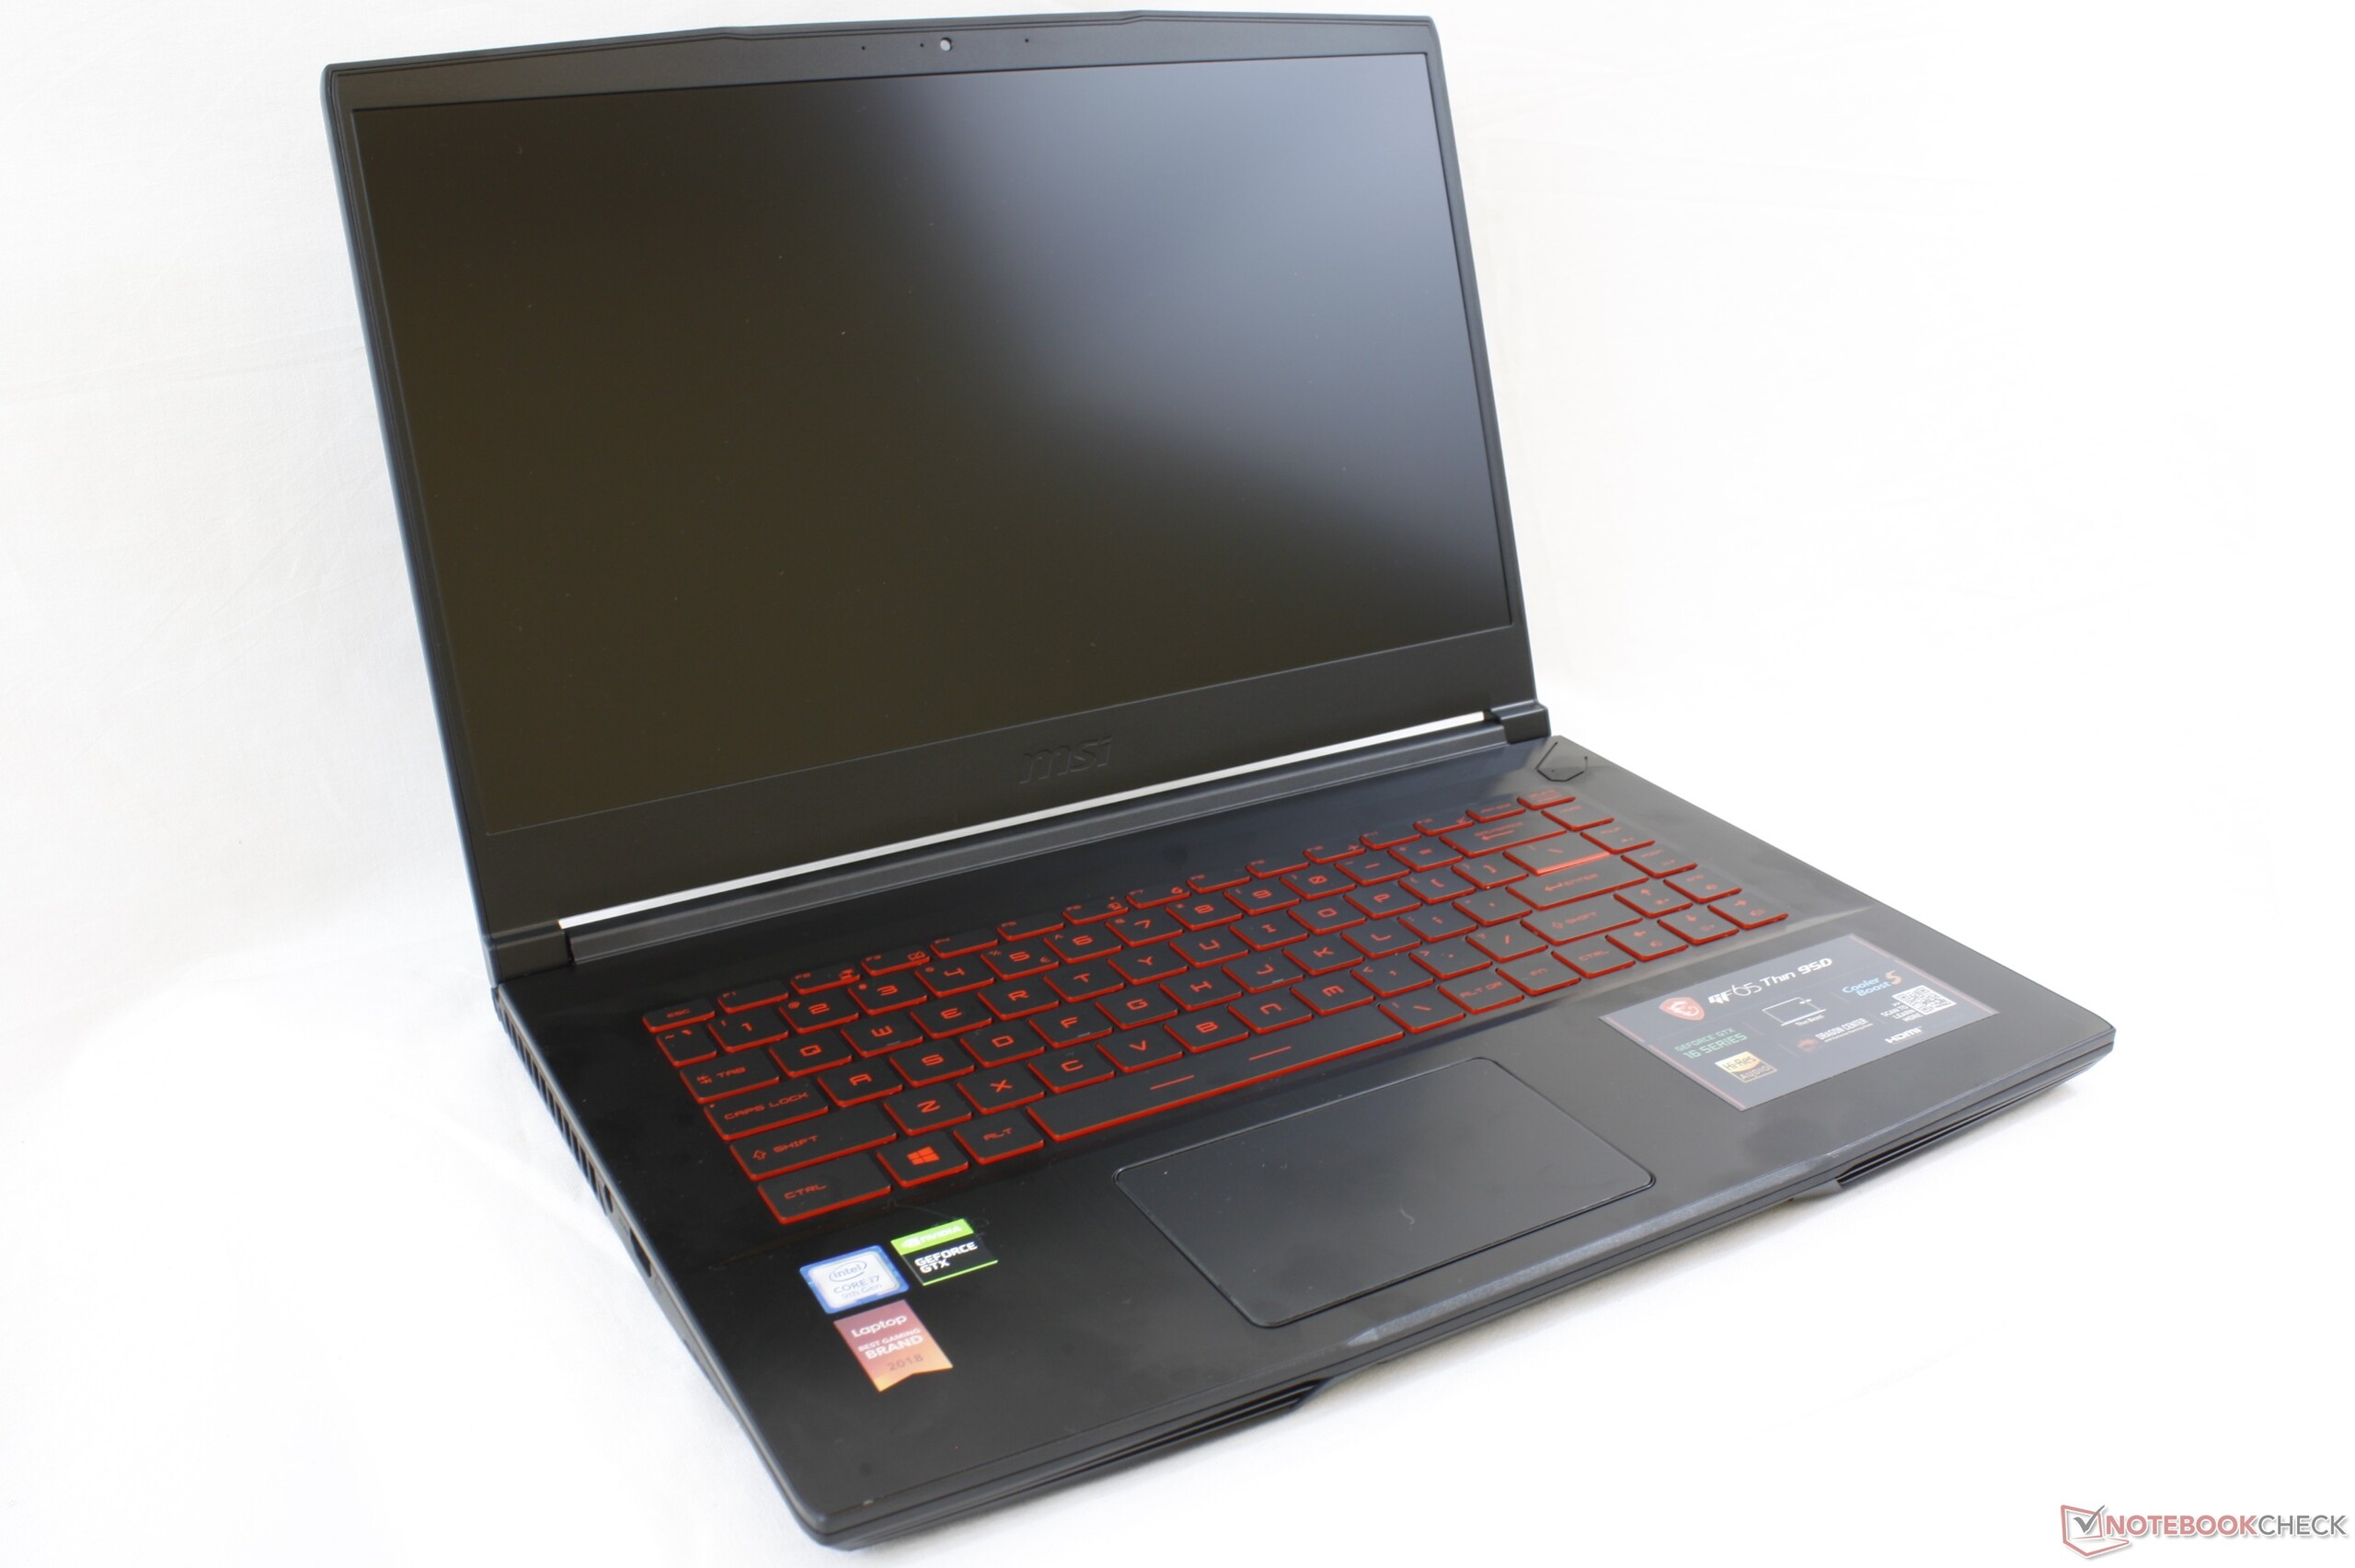
Den största uppgraderingen jämfört med den äldre GF63 är att GF65 har en GTX 1660 Ti GPU. GF63 är begränsad till GTX 1050 Ti som har ungefär 50 procent lägre grafikprestanda än GTX 1660 Ti. Skillnaden i spel kommer vara påtaglig.
Utöver bytet av GPU har GF65 extra M.2-platser, skärmalternativ med stöd för 120/144 Hz, extra fläktar och värmerör i koppar under huven för att kunna inhysa en mer energikrävande GPU. Nästan allt annat är i princip likadant, vilket inkluderar medelmåttig batteritid, medelmåttiga svart-vita responstider, ett budgetchassi, utmärkta högtalare och aningen svårutförd service. En viktig förändring är dock fläktens ljudnivå: GF65 låter mer än sin föregångare när man spelar.
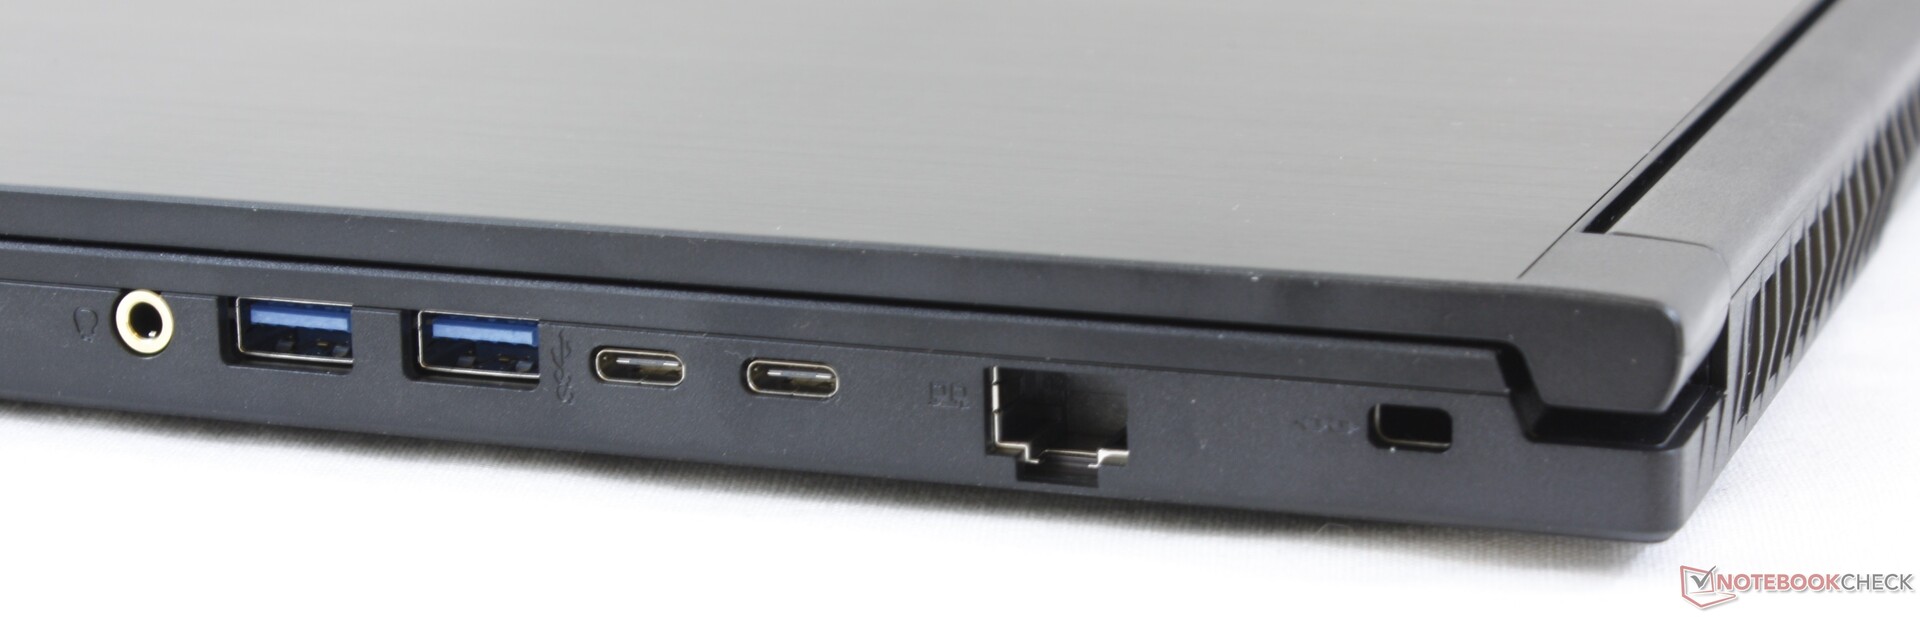
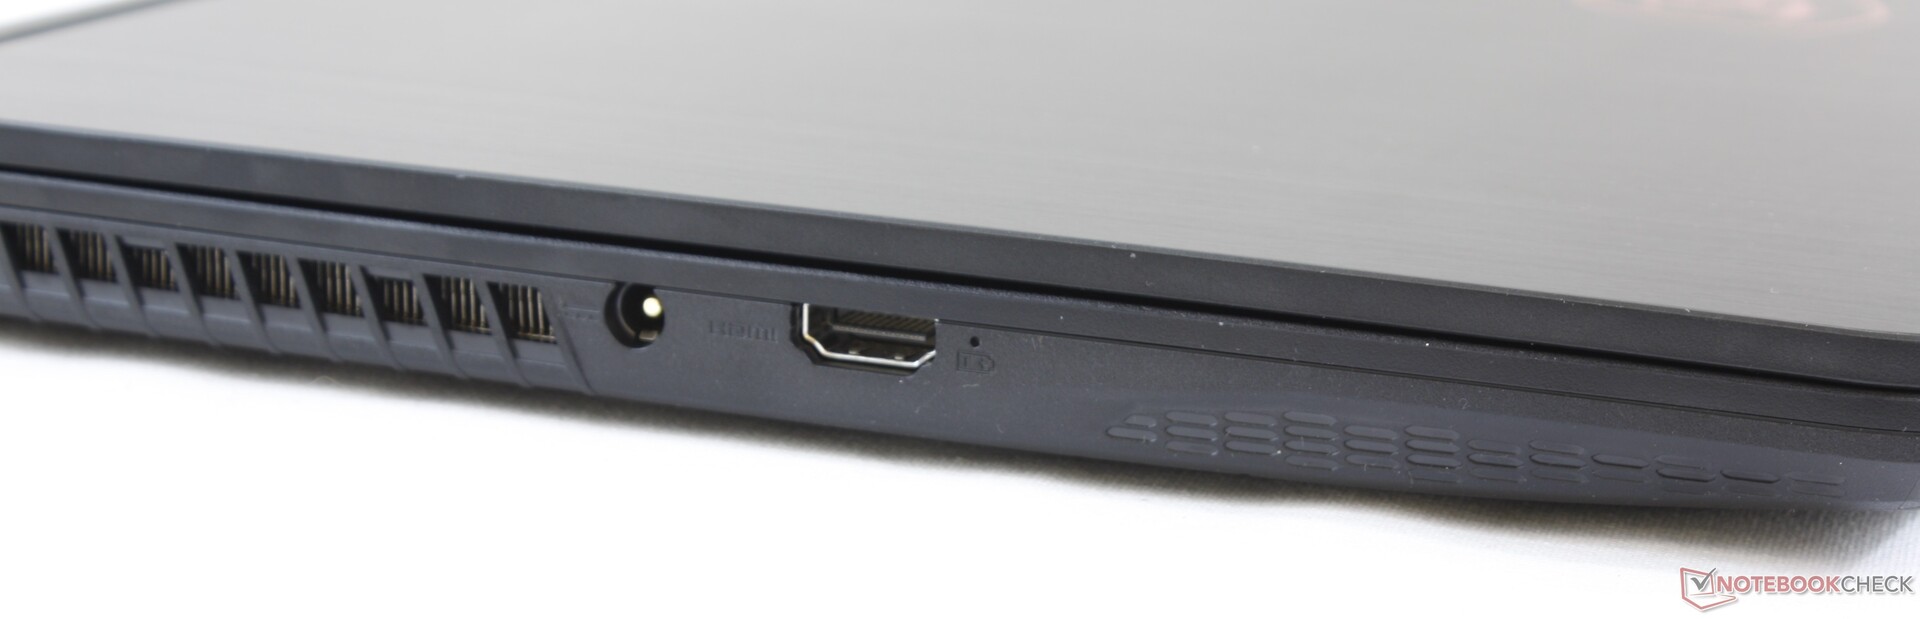
För under 10.000 kronor får du ut mycket spelprestanda ur MSI GF65 GTX 1660 Ti, särskilt med tanke på att långsammare modeller med GTX 1060 har haft betydligt högre priser när de släppts. Du får stå ut med ett högt fläktljud, en måttlig nivå av ghosting och en okonventionell placering av portarna.
MSI GF65 9SD
- 05/15/2020 v7 (old)
Allen Ngo
Price comparison
