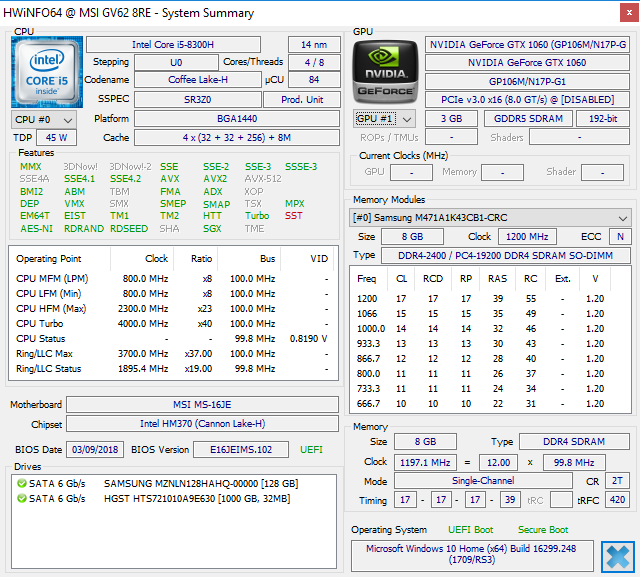
Test: MSI GV62 8RE (i5-8300H, GTX 1060, FHD) Laptop (Sammanfattning)
| SD Card Reader | |
| average JPG Copy Test (av. of 3 runs) | |
| Genomsnitt av klass Gaming (20.9 - 210, n=54, senaste 2 åren) | |
| Acer Predator Helios 300 PH317-52-51M6 (Toshiba Exceria Pro SDXC 64 GB UHS-II) | |
| Dell Inspiron 15 7000 7577 4K (Toshiba Exceria Pro SDXC 64 GB UHS-II) | |
| MSI GV62 8RE-016US (Toshiba Exceria Pro SDXC 64 GB UHS-II) | |
| MSI GF62VR 7RF-877 (Toshiba Exceria Pro SDXC 64 GB UHS-II) | |
| Dell G5 15 5587 (Toshiba Exceria Pro SDXC 64 GB UHS-II) | |
| maximum AS SSD Seq Read Test (1GB) | |
| Genomsnitt av klass Gaming (25.5 - 261, n=51, senaste 2 åren) | |
| Acer Predator Helios 300 PH317-52-51M6 (Toshiba Exceria Pro SDXC 64 GB UHS-II) | |
| Dell G5 15 5587 (Toshiba Exceria Pro SDXC 64 GB UHS-II) | |
| MSI GV62 8RE-016US (Toshiba Exceria Pro SDXC 64 GB UHS-II) | |
| Dell Inspiron 15 7000 7577 4K (Toshiba Exceria Pro SDXC 64 GB UHS-II) | |
| MSI GF62VR 7RF-877 (Toshiba Exceria Pro SDXC 64 GB UHS-II) | |
| |||||||||||||||||||||||||
Distribution av ljusstyrkan: 82 %
Mitt på batteriet: 268.7 cd/m²
Kontrast: 640:1 (Svärta: 0.42 cd/m²)
ΔE ColorChecker Calman: 4.79 | ∀{0.5-29.43 Ø4.71}
calibrated: 4.31
ΔE Greyscale Calman: 3.1 | ∀{0.09-98 Ø4.96}
59% sRGB (Argyll 1.6.3 3D)
38% AdobeRGB 1998 (Argyll 1.6.3 3D)
40.91% AdobeRGB 1998 (Argyll 3D)
59.5% sRGB (Argyll 3D)
39.58% Display P3 (Argyll 3D)
Gamma: 2.28
CCT: 7049 K
| MSI GV62 8RE-016US LG Philips LGD0590, IPS, 15.6", 1920x1080 | Dell Inspiron 15 7000 7577 4K Name: AU Optronics B156ZAN, IPS, 15.6", 3840x2160 | MSI GF62VR 7RF-877 Chi Mei N156HGA-EAL, TN LED, 15.6", 1920x1080 | Lenovo Legion Y520-15IKBN 80WK0042GE LG Philips LP156WF6-SPK3, IPS, 15.6", 1920x1080 | Acer Predator Helios 300 PH317-52-51M6 LG Philips LP173WF4-SPF5 (LGD056D), IPS, 17.3", 1920x1080 | Dell G5 15 5587 LGD053F, 156WF6, IPS, 15.6", 1920x1080 | |
|---|---|---|---|---|---|---|
| Display | 69% | 96% | -1% | 56% | -4% | |
| Display P3 Coverage (%) | 39.58 | 68.4 73% | 85.6 116% | 39.01 -1% | 67.1 70% | 38.13 -4% |
| sRGB Coverage (%) | 59.5 | 97.1 63% | 99.9 68% | 58.4 -2% | 86.1 45% | 56.8 -5% |
| AdobeRGB 1998 Coverage (%) | 40.91 | 69.6 70% | 83.9 105% | 40.34 -1% | 63 54% | 39.47 -4% |
| Response Times | -11% | -25% | -18% | 1% | 2% | |
| Response Time Grey 50% / Grey 80% * (ms) | 33.2 ? | 35.2 ? -6% | 49.6 ? -49% | 39 ? -17% | 36 ? -8% | 33 ? 1% |
| Response Time Black / White * (ms) | 24.4 ? | 28.4 ? -16% | 24.4 ? -0% | 29 ? -19% | 22 ? 10% | 24 ? 2% |
| PWM Frequency (Hz) | 25510 ? | 21000 ? | 122000 ? | |||
| Screen | 24% | -36% | -3% | 15% | -8% | |
| Brightness middle (cd/m²) | 268.7 | 322.9 20% | 223.9 -17% | 283 5% | 365 36% | 229 -15% |
| Brightness (cd/m²) | 246 | 309 26% | 208 -15% | 281 14% | 341 39% | 224 -9% |
| Brightness Distribution (%) | 82 | 90 10% | 88 7% | 91 11% | 89 9% | 87 6% |
| Black Level * (cd/m²) | 0.42 | 0.36 14% | 0.56 -33% | 0.39 7% | 0.32 24% | 0.28 33% |
| Contrast (:1) | 640 | 897 40% | 400 -37% | 726 13% | 1141 78% | 818 28% |
| Colorchecker dE 2000 * | 4.79 | 3.99 17% | 9.7 -103% | 6.1 -27% | 6.51 -36% | 6.1 -27% |
| Colorchecker dE 2000 max. * | 18.13 | 8.97 51% | 19.7 -9% | 11.08 39% | 12.32 32% | 12.2 33% |
| Colorchecker dE 2000 calibrated * | 4.31 | 2.9 33% | 6.12 -42% | |||
| Greyscale dE 2000 * | 3.1 | 5.3 -71% | 12.9 -316% | 5.69 -84% | 7.65 -147% | 5.68 -83% |
| Gamma | 2.28 96% | 2.041 108% | 2.18 101% | 2.44 90% | 2.64 83% | 2.4 92% |
| CCT | 7049 92% | 6941 94% | 15225 43% | 6702 97% | 8066 81% | 6989 93% |
| Color Space (Percent of AdobeRGB 1998) (%) | 38 | 62.9 66% | 75 97% | 37 -3% | 56 47% | 36 -5% |
| Color Space (Percent of sRGB) (%) | 59 | 96.8 64% | 100 69% | 58 -2% | 86 46% | 57 -3% |
| Totalt genomsnitt (program/inställningar) | 27% /
28% | 12% /
-8% | -7% /
-4% | 24% /
21% | -3% /
-6% |
* ... mindre är bättre
Visa svarstider
| ↔ Svarstid svart till vitt | ||
|---|---|---|
| 24.4 ms ... stiga ↗ och falla ↘ kombinerat | ↗ 13.6 ms stiga | 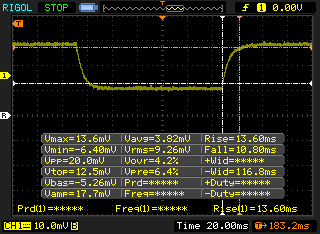 |
| ↘ 10.8 ms hösten | ||
| Skärmen visar bra svarsfrekvens i våra tester, men kan vara för långsam för konkurrenskraftiga spelare. I jämförelse sträcker sig alla testade enheter från 0.1 (minst) till 240 (maximalt) ms. » 58 % av alla enheter är bättre. Detta innebär att den uppmätta svarstiden är sämre än genomsnittet av alla testade enheter (19.8 ms). | ||
| ↔ Svarstid 50 % grått till 80 % grått | ||
| 33.2 ms ... stiga ↗ och falla ↘ kombinerat | ↗ 16.4 ms stiga | 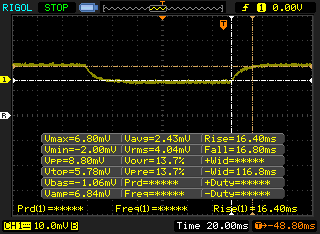 |
| ↘ 16.8 ms hösten | ||
| Skärmen visar långsamma svarsfrekvenser i våra tester och kommer att vara otillfredsställande för spelare. I jämförelse sträcker sig alla testade enheter från 0.165 (minst) till 636 (maximalt) ms. » 46 % av alla enheter är bättre. Det betyder att den uppmätta svarstiden liknar genomsnittet av alla testade enheter (31 ms). | ||
Skärmflimmer / PWM (Puls-Width Modulation)
| Skärmflimmer / PWM upptäcktes inte | 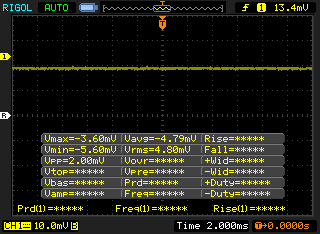 | ||
Som jämförelse: 52 % av alla testade enheter använder inte PWM för att dämpa skärmen. Om PWM upptäcktes mättes ett medelvärde av 7754 (minst: 5 - maximum: 343500) Hz. | |||
* ... mindre är bättre
| PCMark 8 Home Score Accelerated v2 | 3896 poäng | |
| PCMark 8 Creative Score Accelerated v2 | 5251 poäng | |
| PCMark 8 Work Score Accelerated v2 | 5098 poäng | |
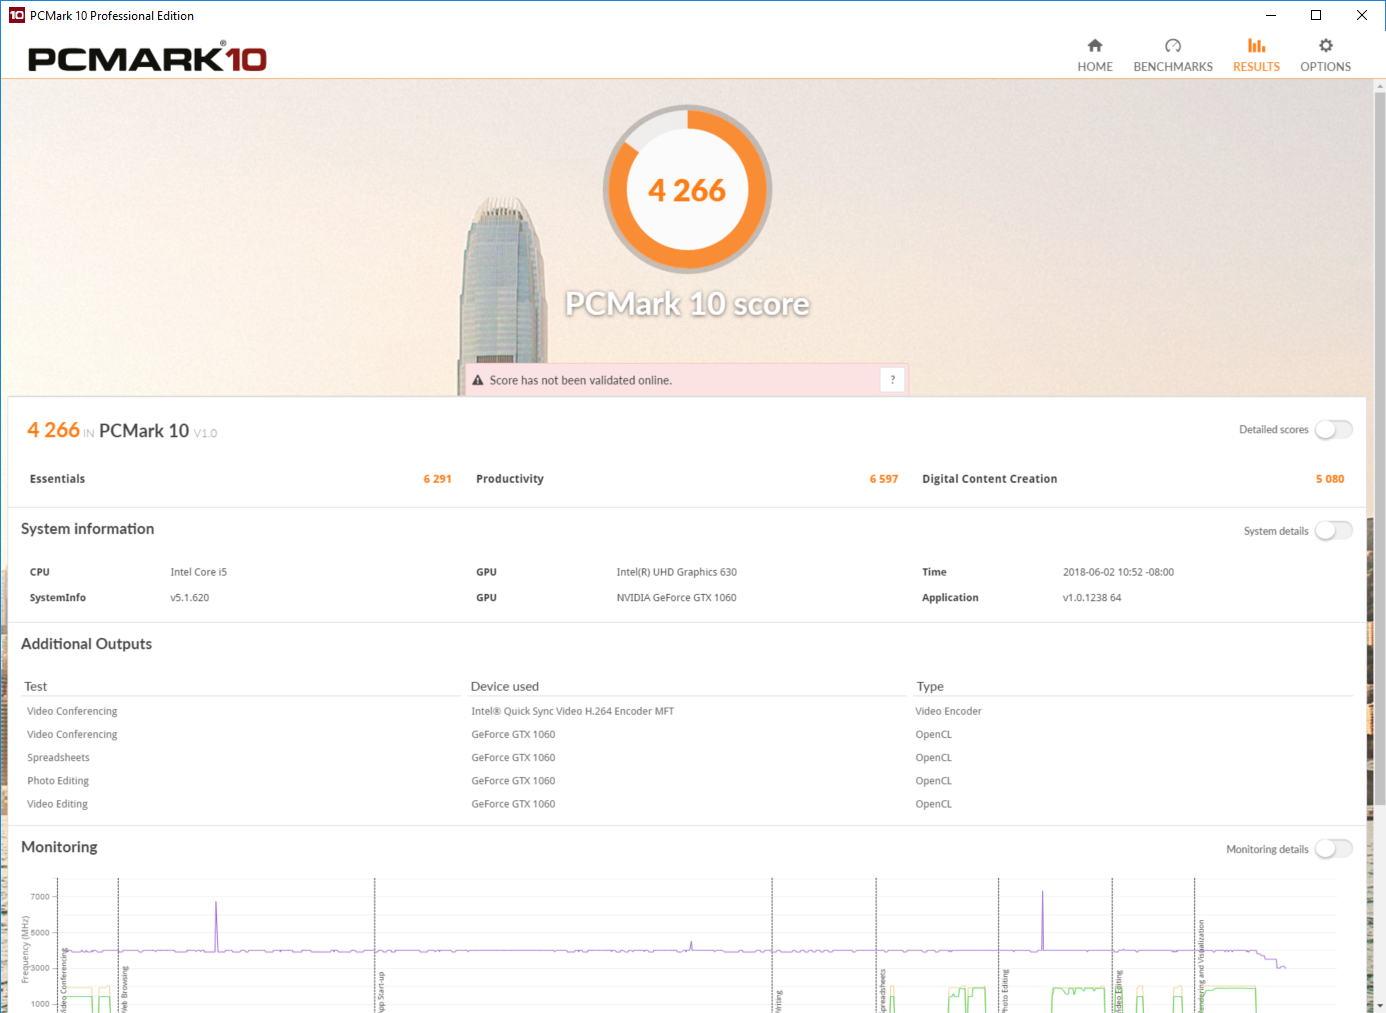
| PCMark 10 Score | 4266 poäng | |
Hjälp | ||
| MSI GV62 8RE-016US Samsung PM871b MZNLN128HAHQ | MSI GF62VR 7RF-877 Intel SSD 600p SSDPEKKW256G7 | Dell Inspiron 15 7000 7577 4K SK hynix SC311 M.2 | Lenovo Legion Y520-15IKBN 80WK0042GE Samsung PM961 NVMe MZVLW128HEGR | Acer Predator Helios 300 PH317-52-51M6 Hynix HFS128G39TND | Dell G5 15 5587 SK hynix SC311 M.2 | Genomsnitt Samsung PM871b MZNLN128HAHQ | |
|---|---|---|---|---|---|---|---|
| AS SSD | 160% | 20% | 133% | -30% | -2% | 34% | |
| Copy Game MB/s (MB/s) | 122.6 | 471.7 285% | 185.4 51% | 197.3 61% | 130.9 7% | 160.6 ? 31% | |
| Copy Program MB/s (MB/s) | 69.2 | 286.5 314% | 142.2 105% | 127.3 84% | 95.7 38% | 134.7 ? 95% | |
| Copy ISO MB/s (MB/s) | 170.5 | 1069 527% | 363.6 113% | 497.6 192% | 146.6 -14% | 299 ? 75% | |
| Score Total (Points) | 703 | 1324 88% | 578 -18% | 1434 104% | 811 15% | 557 -21% | 774 ? 10% |
| Score Write (Points) | 207 | 693 235% | 227 10% | 368 78% | 196 -5% | 199 -4% | 262 ? 27% |
| Score Read (Points) | 334 | 448 34% | 234 -30% | 746 123% | 414 24% | 240 -28% | 335 ? 0% |
| Access Time Write * (ms) | 0.057 | 0.03 47% | 0.058 -2% | 0.032 44% | 0.259 -354% | 0.066 -16% | 0.05417 ? 5% |
| Access Time Read * (ms) | 0.113 | 0.09 20% | 0.126 -12% | 0.07 38% | 0.128 -13% | 0.1102 ? 2% | |
| 4K-64 Write (MB/s) | 129.4 | 551 326% | 127.2 -2% | 158.6 23% | 120.1 -7% | 112.4 -13% | 149.2 ? 15% |
| 4K-64 Read (MB/s) | 257.7 | 280.1 9% | 156.6 -39% | 463.2 80% | 336.6 31% | 164.1 -36% | 256 ? -1% |
| 4K Write (MB/s) | 63.5 | 118.3 86% | 74 17% | 127.9 101% | 62.7 -1% | 62.2 -2% | 73.1 ? 15% |
| 4K Read (MB/s) | 26.23 | 31.27 19% | 26.24 0% | 46.98 79% | 26.5 1% | 24.44 -7% | 29.1 ? 11% |
| Seq Write (MB/s) | 138.1 | 234.9 70% | 259.9 88% | 814 489% | 128.2 -7% | 243.7 76% | 398 ? 188% |
| Seq Read (MB/s) | 503 | 1371 173% | 508 1% | 2362 370% | 513 2% | 511 2% | 496 ? -1% |
* ... mindre är bättre

| 3DMark 11 Performance | 12532 poäng | |
| 3DMark Cloud Gate Standard Score | 27973 poäng | |
| 3DMark Fire Strike Score | 10198 poäng | |
Hjälp | ||
| Rise of the Tomb Raider | |
| 1920x1080 Very High Preset AA:FX AF:16x (sortera efter värde) | |
| MSI GV62 8RE-016US | |
| Dell Inspiron 15 7000 7577 4K | |
| MSI GF62VR 7RF-877 | |
| Dell G5 15 5587 | |
| Genomsnitt NVIDIA GeForce GTX 1060 Mobile (51 - 68.8, n=37) | |
| 1920x1080 High Preset AA:FX AF:4x (sortera efter värde) | |
| MSI GV62 8RE-016US | |
| MSI GF62VR 7RF-877 | |
| Dell G5 15 5587 | |
| Genomsnitt NVIDIA GeForce GTX 1060 Mobile (65.3 - 82, n=24) | |
| 1366x768 Medium Preset AF:2x (sortera efter värde) | |
| MSI GV62 8RE-016US | |
| Dell G5 15 5587 | |
| Genomsnitt NVIDIA GeForce GTX 1060 Mobile (82.2 - 140, n=14) | |
| Middle-earth: Shadow of War | |
| 1920x1080 Ultra Preset AA:T (sortera efter värde) | |
| MSI GV62 8RE-016US | |
| Dell Inspiron 15 7000 7577 4K | |
| Genomsnitt NVIDIA GeForce GTX 1060 Mobile (52 - 54, n=5) | |
| 1920x1080 High Preset AA:T (sortera efter värde) | |
| MSI GV62 8RE-016US | |
| Dell Inspiron 15 7000 7577 4K | |
| Genomsnitt NVIDIA GeForce GTX 1060 Mobile (58 - 74, n=4) | |
| 1920x1080 Medium Preset AA:T (sortera efter värde) | |
| MSI GV62 8RE-016US | |
| Dell Inspiron 15 7000 7577 4K | |
| Genomsnitt NVIDIA GeForce GTX 1060 Mobile (79 - 97, n=2) | |
| låg | med. | hög | ultra | |
|---|---|---|---|---|
| BioShock Infinite (2013) | 234 | 205 | 187 | 112 |
| The Witcher 3 (2015) | 163 | 121 | 67 | 42 |
| Rise of the Tomb Raider (2016) | 162 | 125 | 73 | 59 |
| Middle-earth: Shadow of War (2017) | 110 | 79 | 58 | 52 |
Ljudnivå
| Låg belastning |
| 33.5 / 33.5 / 33.7 dB(A) |
| Hög belastning |
| 41 / 52.3 dB(A) |
 | ||
30 dB tyst 40 dB(A) hörbar 50 dB(A) högt ljud |
||
min: | ||
| MSI GV62 8RE-016US GeForce GTX 1060 Mobile, i5-8300H, Samsung PM871b MZNLN128HAHQ | MSI GF62VR 7RF-877 GeForce GTX 1060 Mobile, i7-7700HQ, Intel SSD 600p SSDPEKKW256G7 | Dell Inspiron 15 7000 7577 4K GeForce GTX 1060 Max-Q, i7-7700HQ, SK hynix SC311 M.2 | Lenovo Legion Y520-15IKBN 80WK0042GE GeForce GTX 1050 Ti Mobile, i5-7300HQ, Samsung PM961 NVMe MZVLW128HEGR | Acer Predator Helios 300 PH317-52-51M6 GeForce GTX 1050 Ti Mobile, i5-8300H, Hynix HFS128G39TND | Dell G5 15 5587 GeForce GTX 1060 Max-Q, i5-8300H, SK hynix SC311 M.2 | |
|---|---|---|---|---|---|---|
| Noise | 1% | 11% | 10% | 4% | 8% | |
| av / miljö * (dB) | 28.2 | 28.1 -0% | 28.5 -1% | 30.6 -9% | 29 -3% | 30.3 -7% |
| Idle Minimum * (dB) | 33.5 | 33.5 -0% | 28.8 14% | 31.9 5% | 29 13% | 31.1 7% |
| Idle Average * (dB) | 33.5 | 33.5 -0% | 29.2 13% | 31.9 5% | 31 7% | 31.1 7% |
| Idle Maximum * (dB) | 33.7 | 33.5 1% | 29.2 13% | 31.9 5% | 33 2% | 34.2 -1% |
| Load Average * (dB) | 41 | 41.3 -1% | 34.6 16% | 34.6 16% | 45 -10% | 34.9 15% |
| Witcher 3 ultra * (dB) | 52.3 | 48.5 7% | 44.1 16% | 39.3 25% | 45 14% | 42.7 18% |
| Load Maximum * (dB) | 52.3 | 53.5 -2% | 49.3 6% | 41.7 20% | 51 2% | 44 16% |
* ... mindre är bättre
(-) Den maximala temperaturen på ovansidan är 47 °C / 117 F, jämfört med genomsnittet av 40.4 °C / 105 F , allt från 21.2 till 68.8 °C för klassen Gaming.
(-) Botten värms upp till maximalt 45.6 °C / 114 F, jämfört med genomsnittet av 43.2 °C / 110 F
(+) Vid tomgångsbruk är medeltemperaturen för ovansidan 27.2 °C / 81 F, jämfört med enhetsgenomsnittet på 33.9 °C / ### class_avg_f### F.
(±) När du spelar The Witcher 3 är medeltemperaturen för ovansidan 36.3 °C / 97 F, jämfört med enhetsgenomsnittet på 33.9 °C / ## #class_avg_f### F.
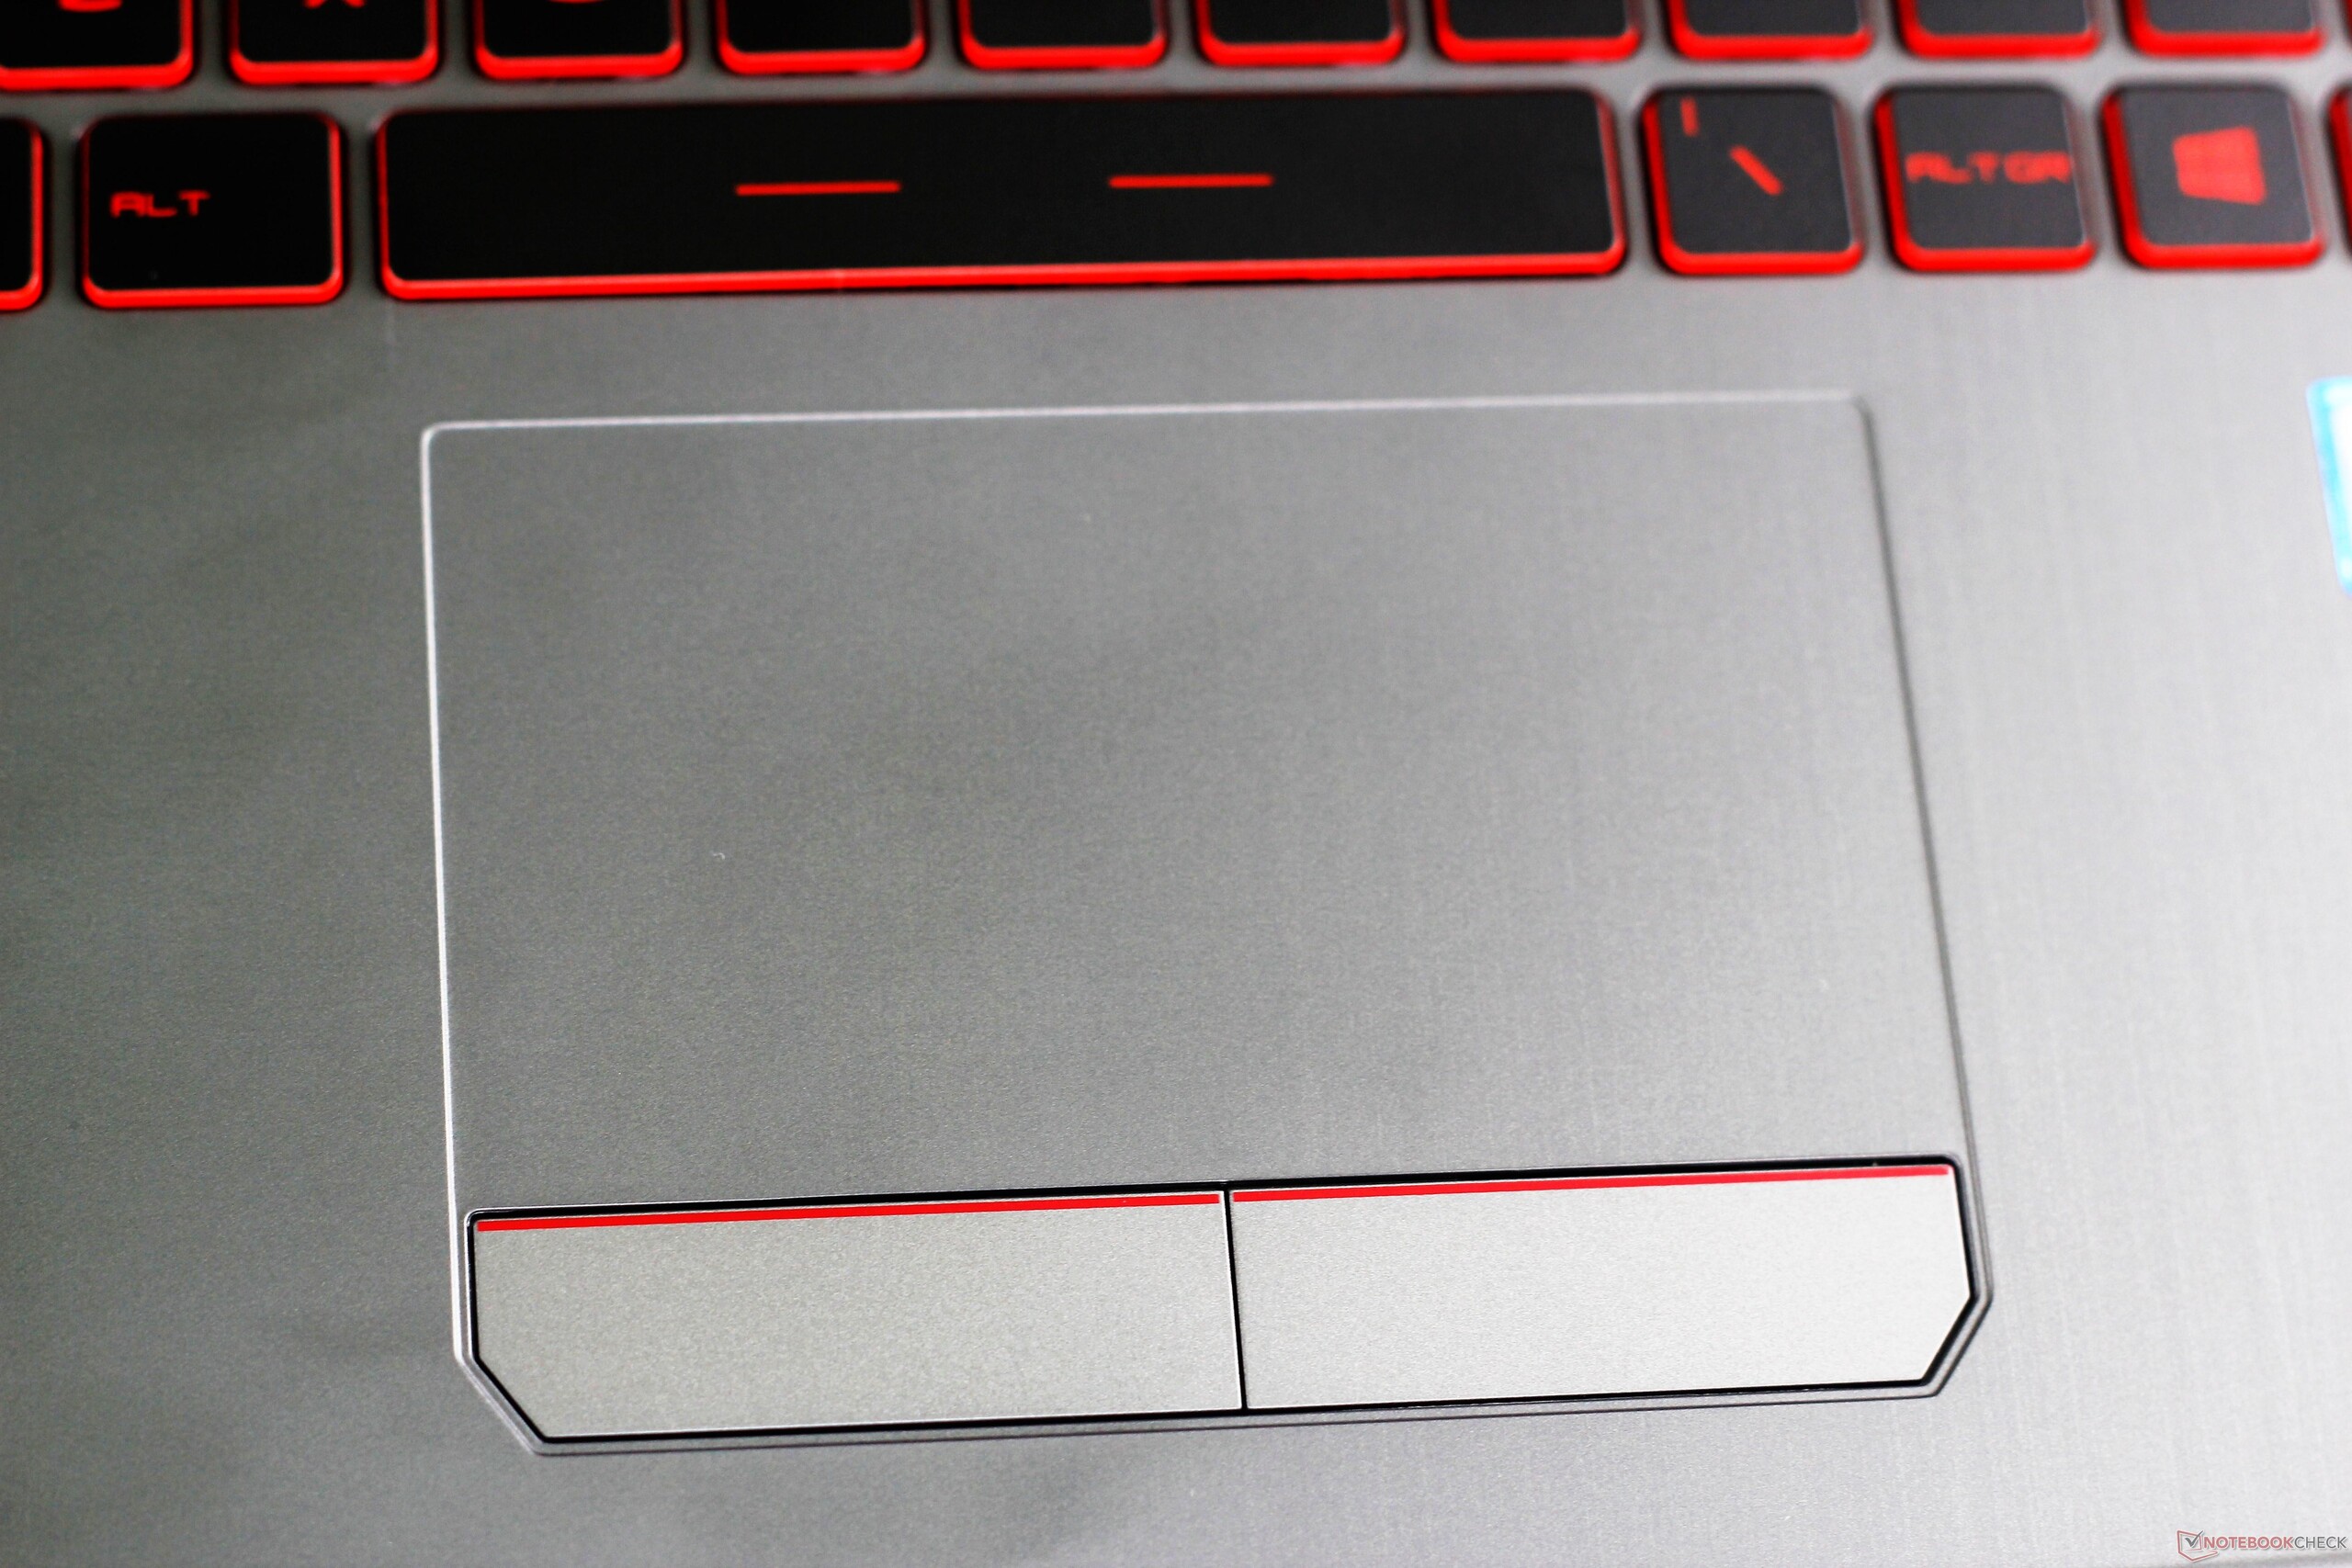
(±) Handledsstöden och pekplattan kan bli väldigt varma vid beröring med maximalt 38.4 °C / 101.1 F.
(-) Medeltemperaturen för handledsstödsområdet på liknande enheter var 28.8 °C / 83.8 F (-9.6 °C / -17.3 F).
MSI GV62 8RE-016US ljudanalys
(±) | högtalarljudstyrkan är genomsnittlig men bra (81.1 dB)
Bas 100 - 315 Hz
(-) | nästan ingen bas - i genomsnitt 28.2% lägre än medianen
(±) | linjäriteten för basen är genomsnittlig (11% delta till föregående frekvens)
Mellan 400 - 2000 Hz
(±) | högre mellan - i genomsnitt 6.4% högre än median
(±) | linjäriteten för mids är genomsnittlig (8.9% delta till föregående frekvens)
Högsta 2 - 16 kHz
(±) | högre toppar - i genomsnitt 5.6% högre än medianen
(±) | linjäriteten för toppar är genomsnittlig (7.6% delta till föregående frekvens)
Totalt 100 - 16 000 Hz
(±) | linjäriteten för det totala ljudet är genomsnittlig (27.3% skillnad mot median)
Jämfört med samma klass
» 93% av alla testade enheter i den här klassen var bättre, 1% liknande, 5% sämre
» Den bästa hade ett delta på 6%, genomsnittet var 18%, sämst var 132%
Jämfört med alla testade enheter
» 83% av alla testade enheter var bättre, 4% liknande, 13% sämre
» Den bästa hade ett delta på 4%, genomsnittet var 23%, sämst var 134%
Dell G5 15 5587 ljudanalys
(-) | inte särskilt höga högtalare (68.5 dB)
Bas 100 - 315 Hz
(±) | reducerad bas - i genomsnitt 12.5% lägre än medianen
(+) | basen är linjär (5.9% delta till föregående frekvens)
Mellan 400 - 2000 Hz
(+) | balanserad mellan - endast 4.6% från medianen
(+) | mids är linjära (5.1% delta till föregående frekvens)
Högsta 2 - 16 kHz
(+) | balanserade toppar - endast 1.1% från medianen
(+) | toppar är linjära (3.6% delta till föregående frekvens)
Totalt 100 - 16 000 Hz
(+) | det totala ljudet är linjärt (14.9% skillnad mot median)
Jämfört med samma klass
» 30% av alla testade enheter i den här klassen var bättre, 7% liknande, 63% sämre
» Den bästa hade ett delta på 6%, genomsnittet var 18%, sämst var 132%
Jämfört med alla testade enheter
» 20% av alla testade enheter var bättre, 4% liknande, 76% sämre
» Den bästa hade ett delta på 4%, genomsnittet var 23%, sämst var 134%
| Av/Standby | |
| Låg belastning | |
| Hög belastning |
|
Förklaring:
min: | |
| MSI GV62 8RE-016US i5-8300H, GeForce GTX 1060 Mobile, Samsung PM871b MZNLN128HAHQ, IPS, 1920x1080, 15.6" | MSI GF62VR 7RF-877 i7-7700HQ, GeForce GTX 1060 Mobile, Intel SSD 600p SSDPEKKW256G7, TN LED, 1920x1080, 15.6" | Dell Inspiron 15 7000 7577 4K i7-7700HQ, GeForce GTX 1060 Max-Q, SK hynix SC311 M.2, IPS, 3840x2160, 15.6" | Lenovo Legion Y520-15IKBN 80WK0042GE i5-7300HQ, GeForce GTX 1050 Ti Mobile, Samsung PM961 NVMe MZVLW128HEGR, IPS, 1920x1080, 15.6" | Acer Predator Helios 300 PH317-52-51M6 i5-8300H, GeForce GTX 1050 Ti Mobile, Hynix HFS128G39TND, IPS, 1920x1080, 17.3" | Dell G5 15 5587 i5-8300H, GeForce GTX 1060 Max-Q, SK hynix SC311 M.2, IPS, 1920x1080, 15.6" | |
|---|---|---|---|---|---|---|
| Power Consumption | -12% | 31% | 40% | 25% | 30% | |
| Idle Minimum * (Watt) | 9.38 | 16.2 -73% | 5.5 41% | 5.2 45% | 6 36% | 4.9 48% |
| Idle Average * (Watt) | 15.95 | 18.2 -14% | 10.5 34% | 8.3 48% | 9 44% | 8.5 47% |
| Idle Maximum * (Watt) | 18.46 | 18.9 -2% | 10.9 41% | 10.1 45% | 13 30% | 9.1 51% |
| Load Average * (Watt) | 95.68 | 82.7 14% | 72 25% | 62.7 34% | 95 1% | 90.7 5% |
| Witcher 3 ultra * (Watt) | 135.6 | 125.7 7% | 97.4 28% | 94 31% | 102 25% | 110 19% |
| Load Maximum * (Watt) | 156.98 | 162.3 -3% | 130.4 17% | 100 36% | 134 15% | 144 8% |
* ... mindre är bättre
| MSI GV62 8RE-016US i5-8300H, GeForce GTX 1060 Mobile, 41 Wh | MSI GF62VR 7RF-877 i7-7700HQ, GeForce GTX 1060 Mobile, 41 Wh | Dell Inspiron 15 7000 7577 4K i7-7700HQ, GeForce GTX 1060 Max-Q, 56 Wh | Lenovo Legion Y520-15IKBN 80WK0042GE i5-7300HQ, GeForce GTX 1050 Ti Mobile, 45 Wh | Acer Predator Helios 300 PH317-52-51M6 i5-8300H, GeForce GTX 1050 Ti Mobile, 48 Wh | Dell G5 15 5587 i5-8300H, GeForce GTX 1060 Max-Q, 56 Wh | |
|---|---|---|---|---|---|---|
| Batteridrifttid | -31% | 86% | 83% | 112% | 141% | |
| Reader / Idle (h) | 5.3 | 2.8 -47% | 10 89% | 10.6 100% | 11.8 123% | 11.8 123% |
| WiFi v1.3 (h) | 3.5 | 1.9 -46% | 5.4 54% | 5.2 49% | 5.9 69% | 6.5 86% |
| Load (h) | 0.7 | 0.7 0% | 1.5 114% | 1.4 100% | 1.7 143% | 2.2 214% |
För
Emot
Läs den fullständiga versionen av den här recensionen på engelska här.
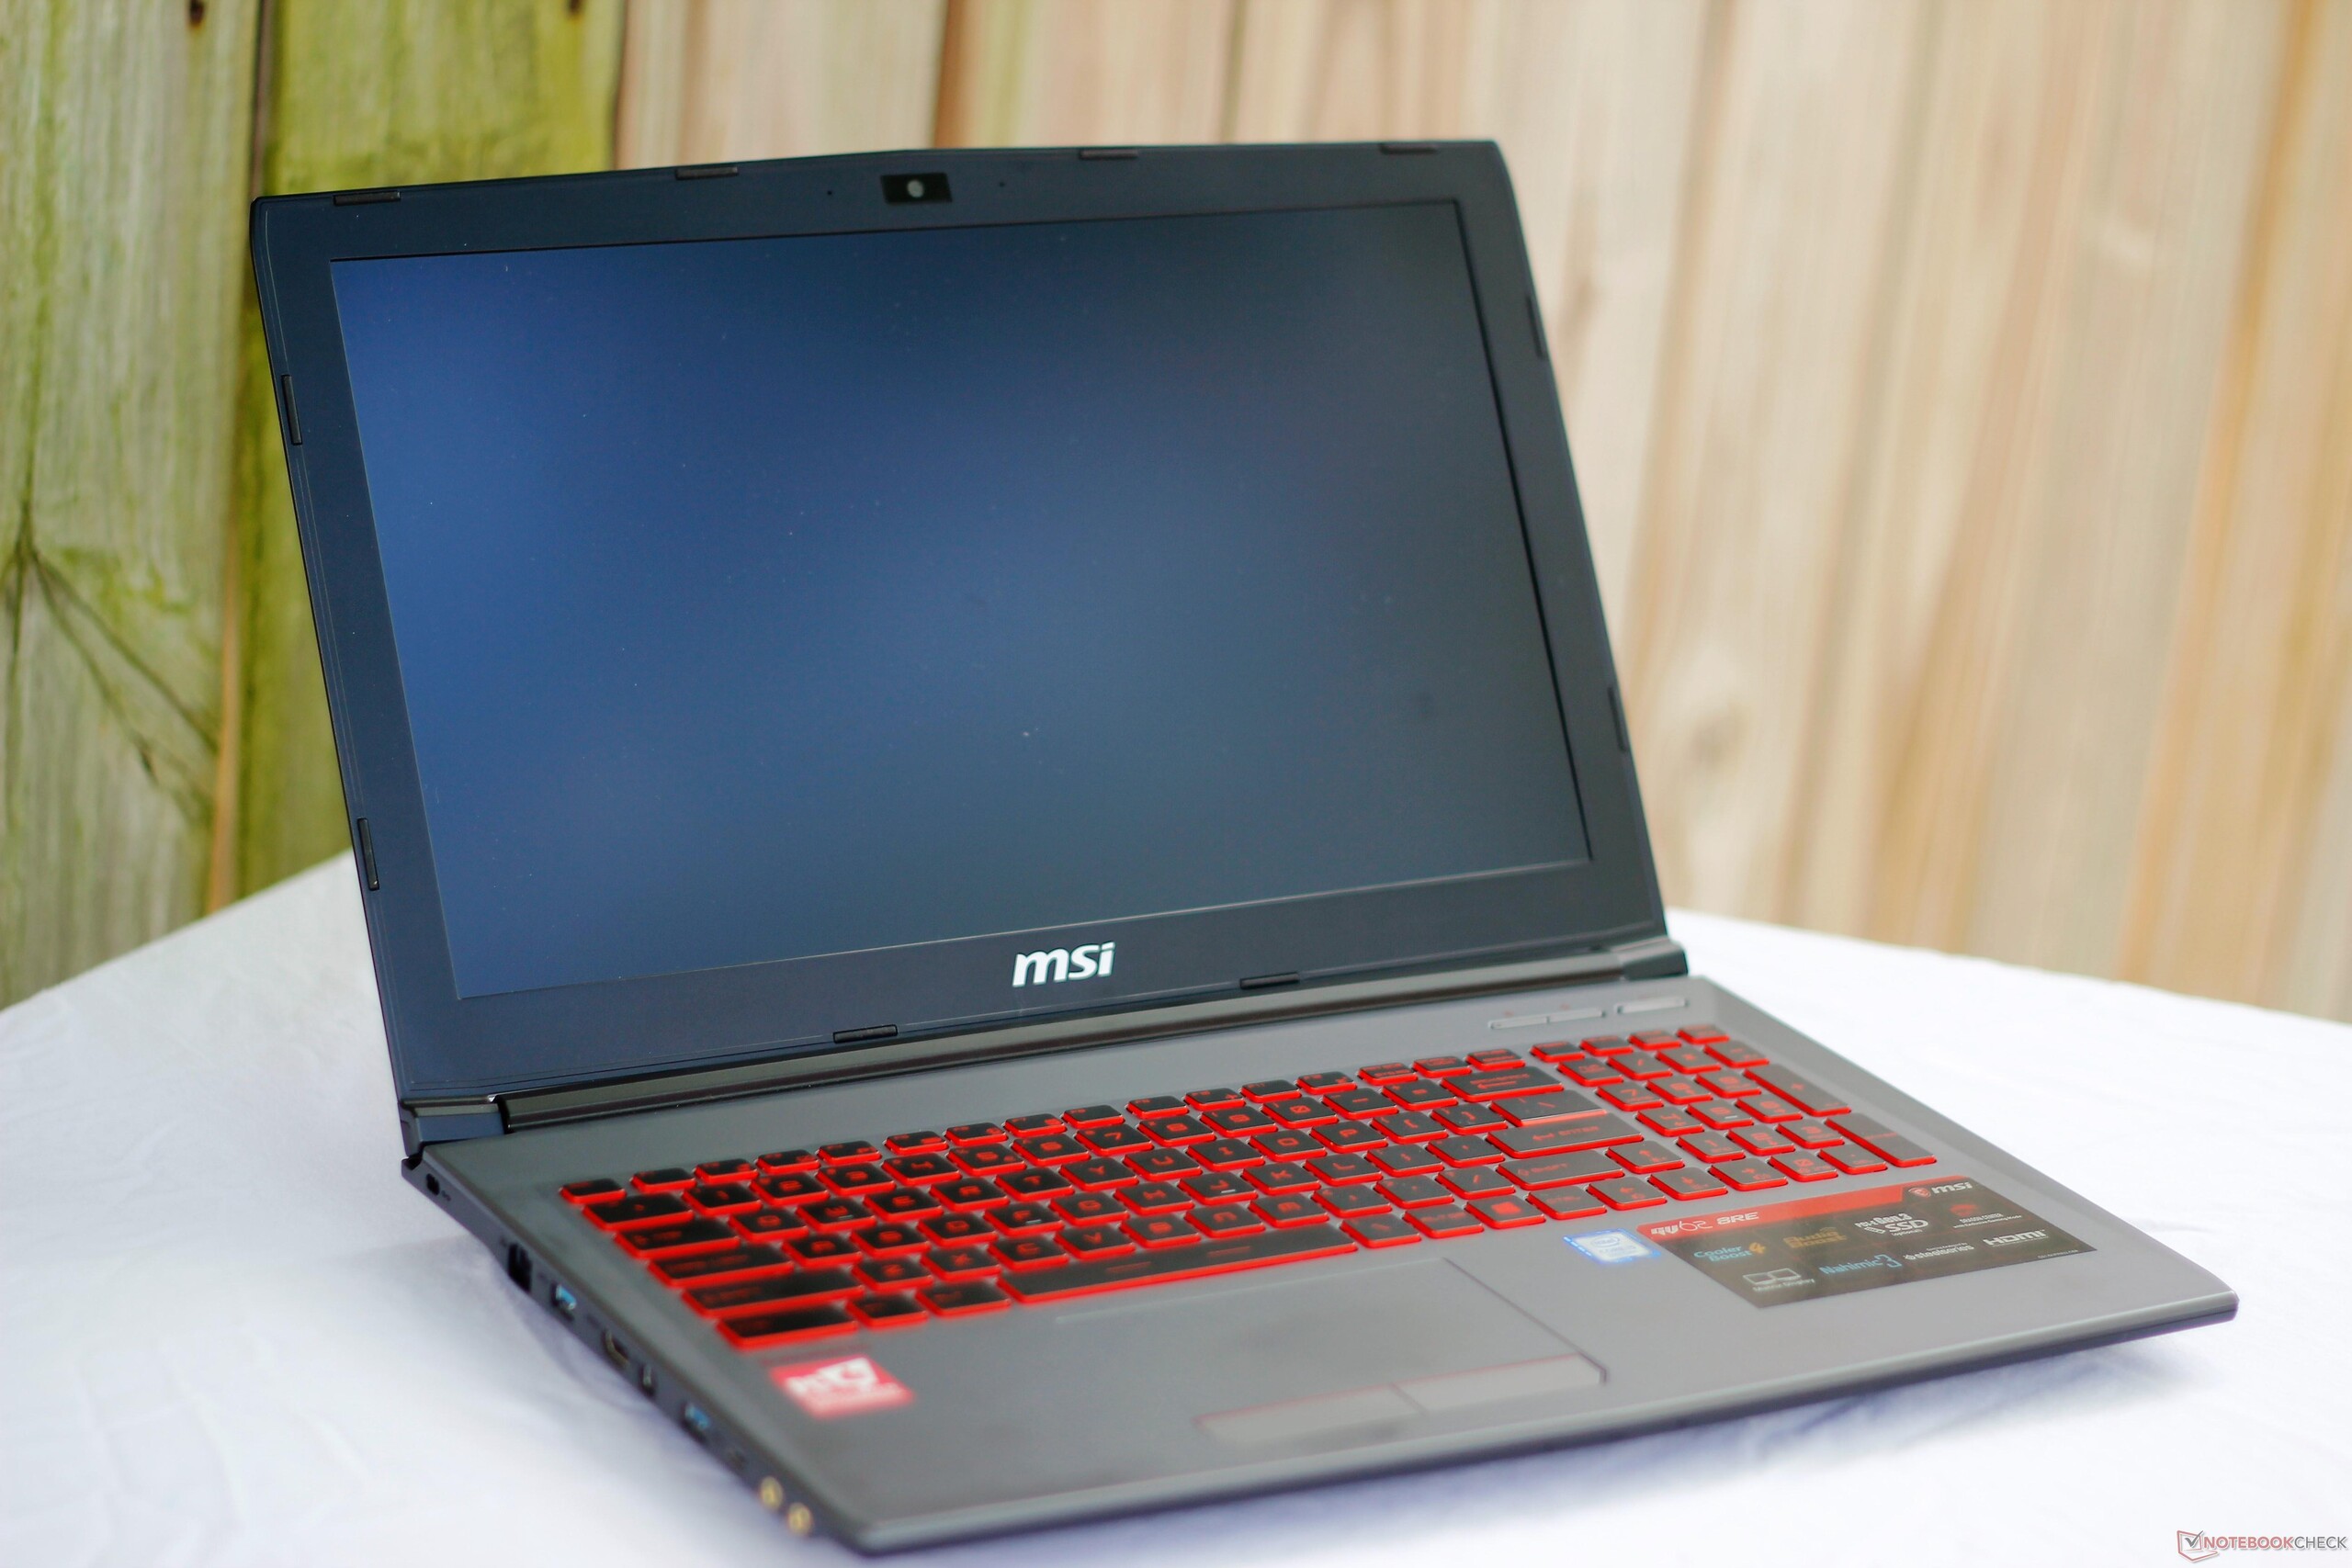
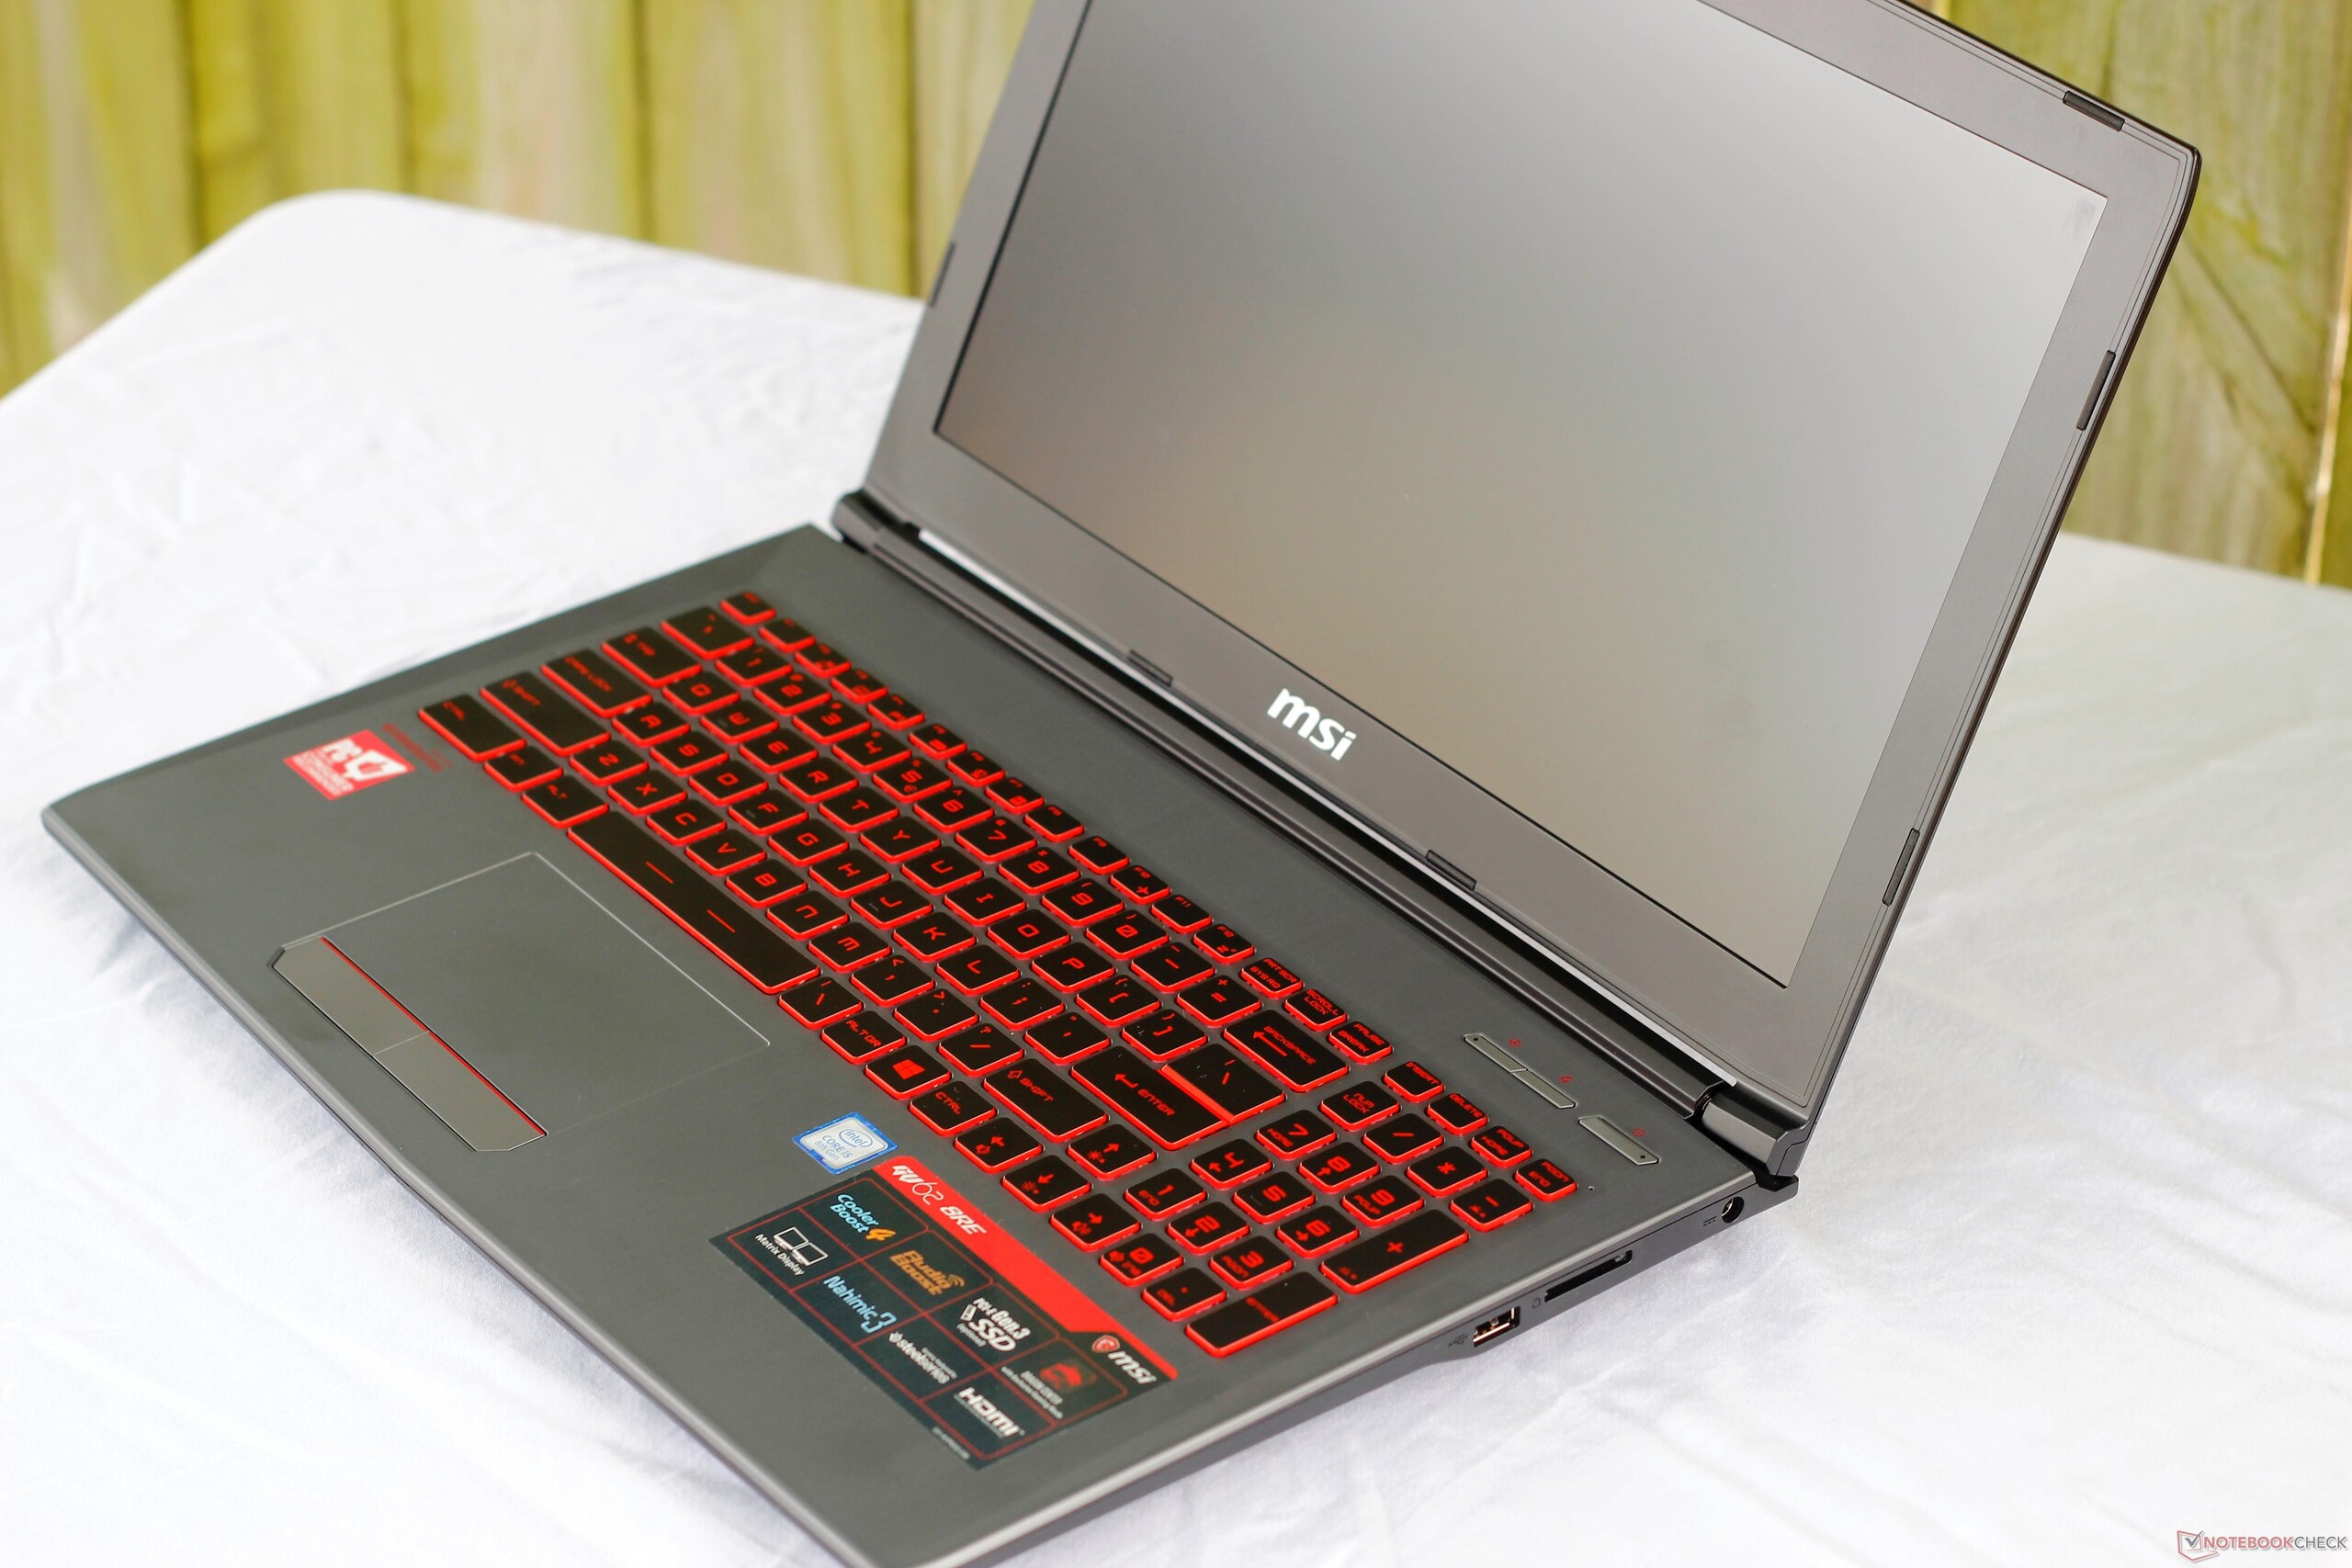
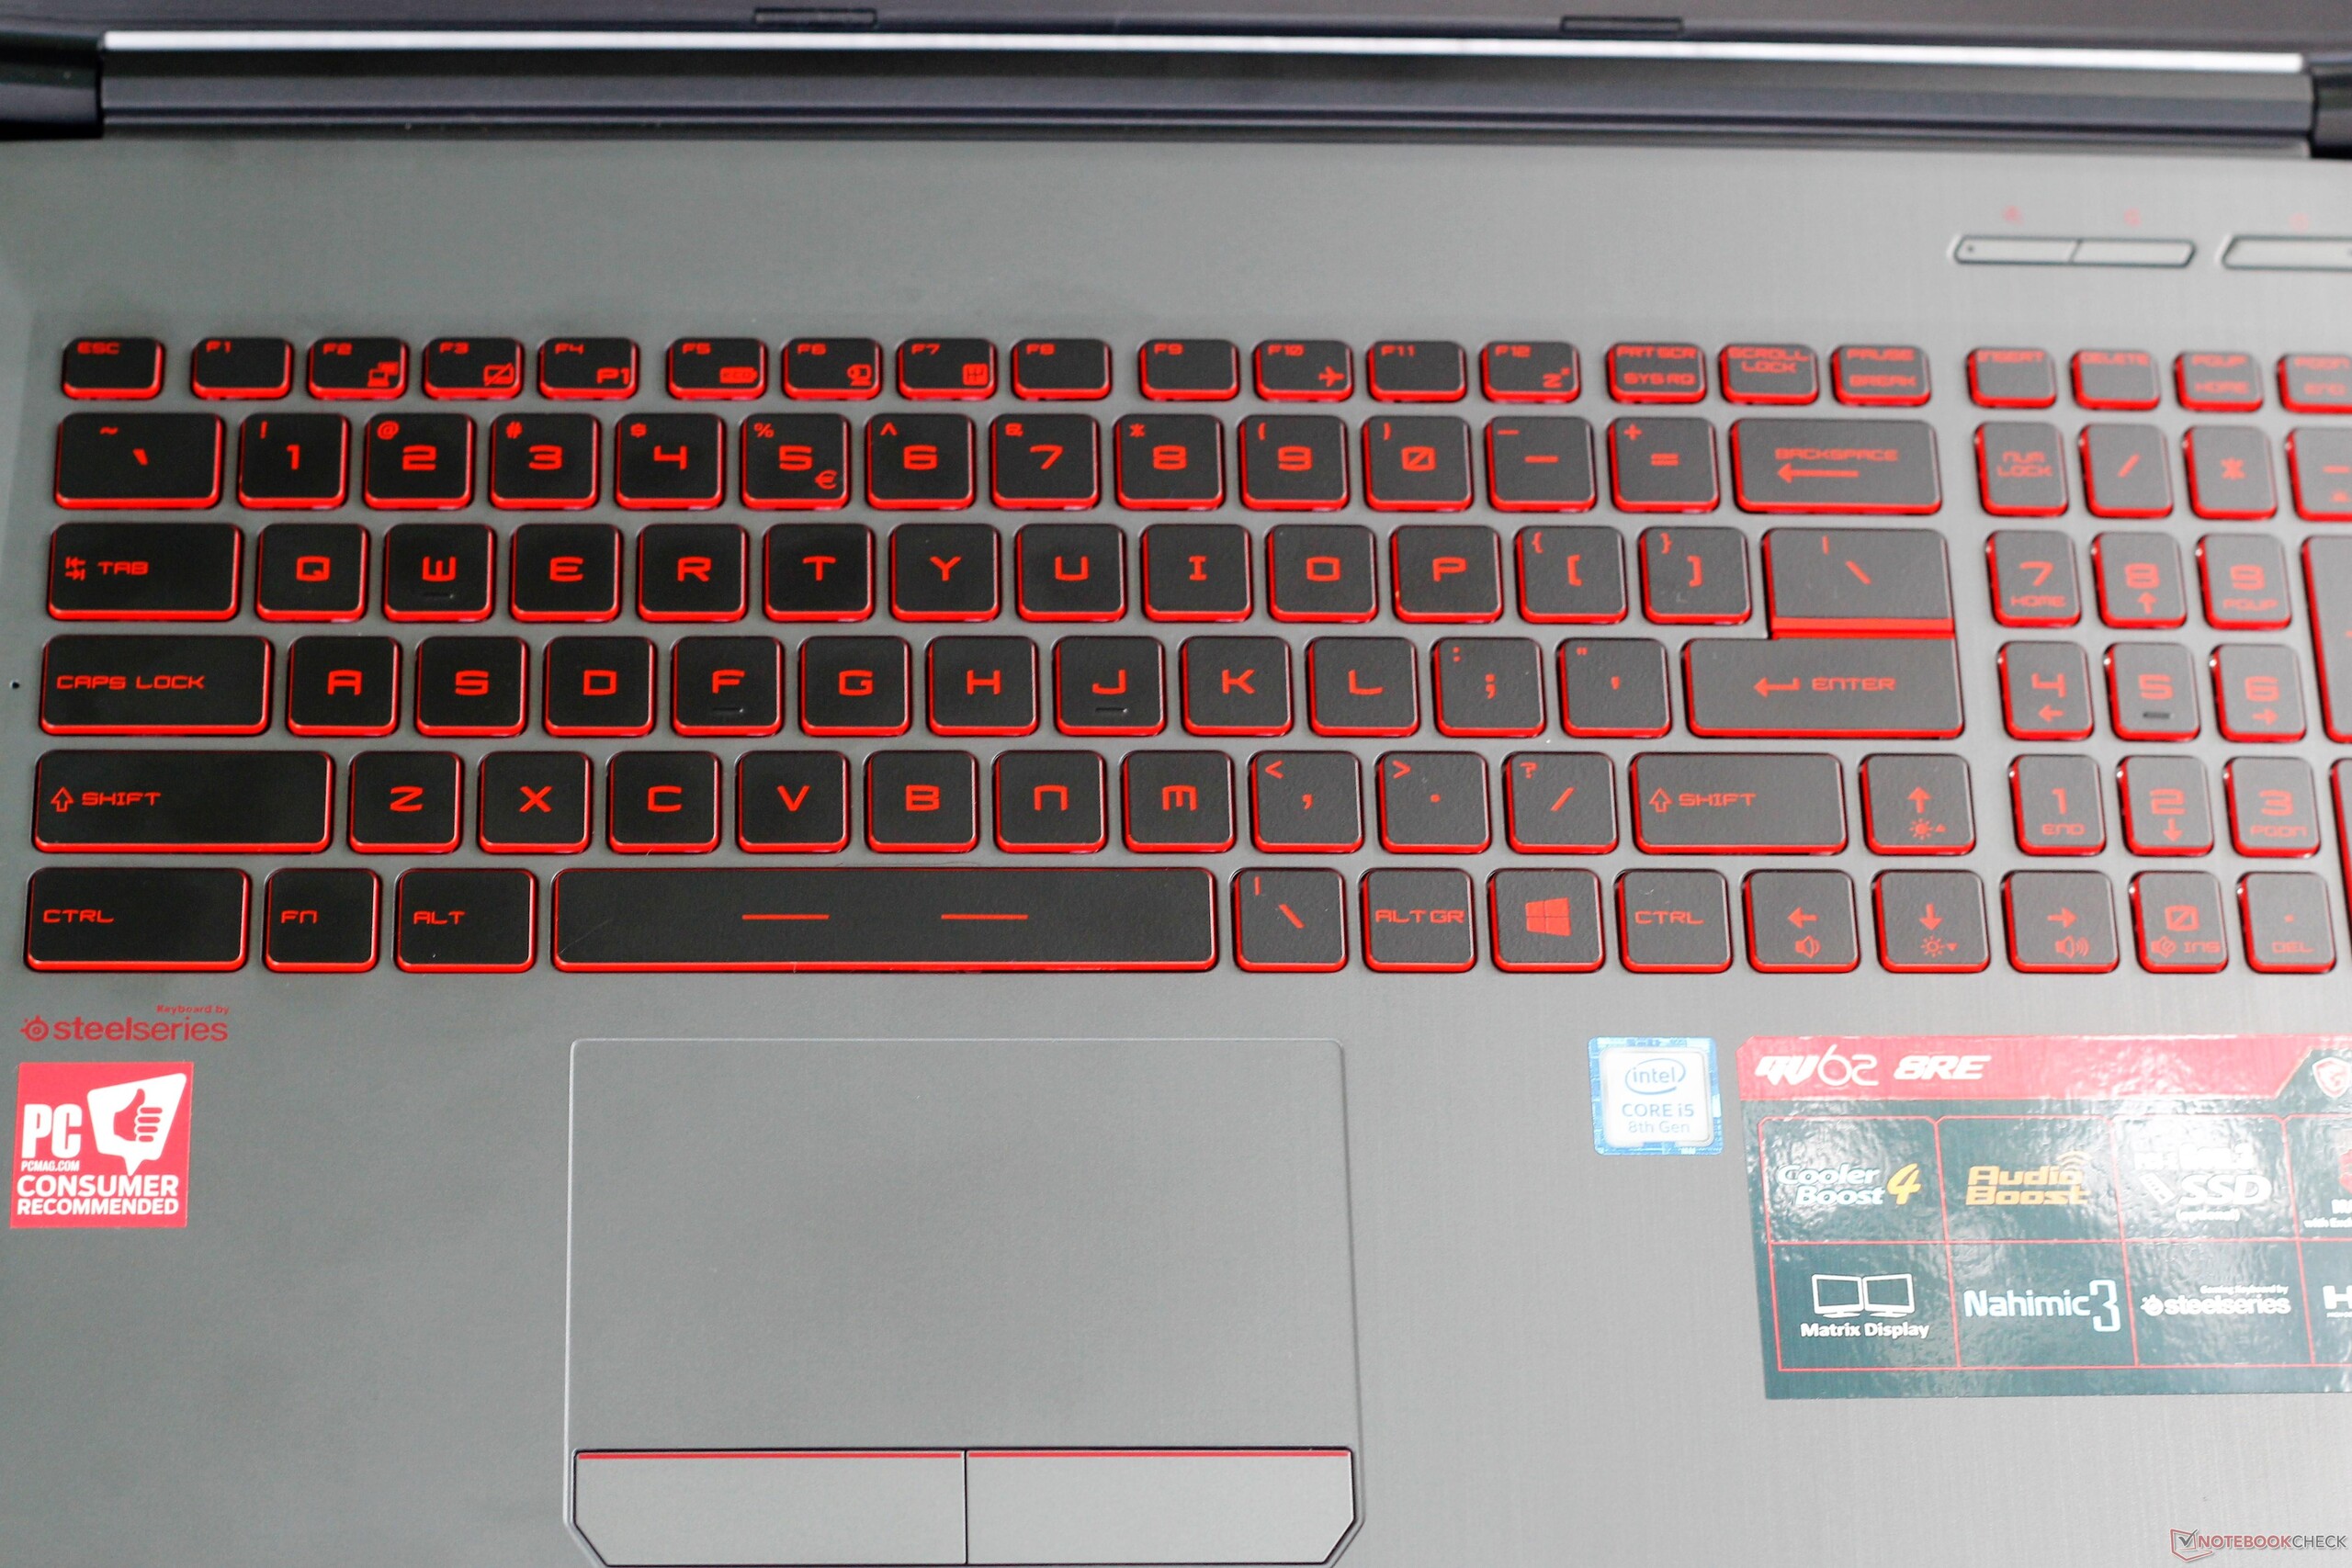
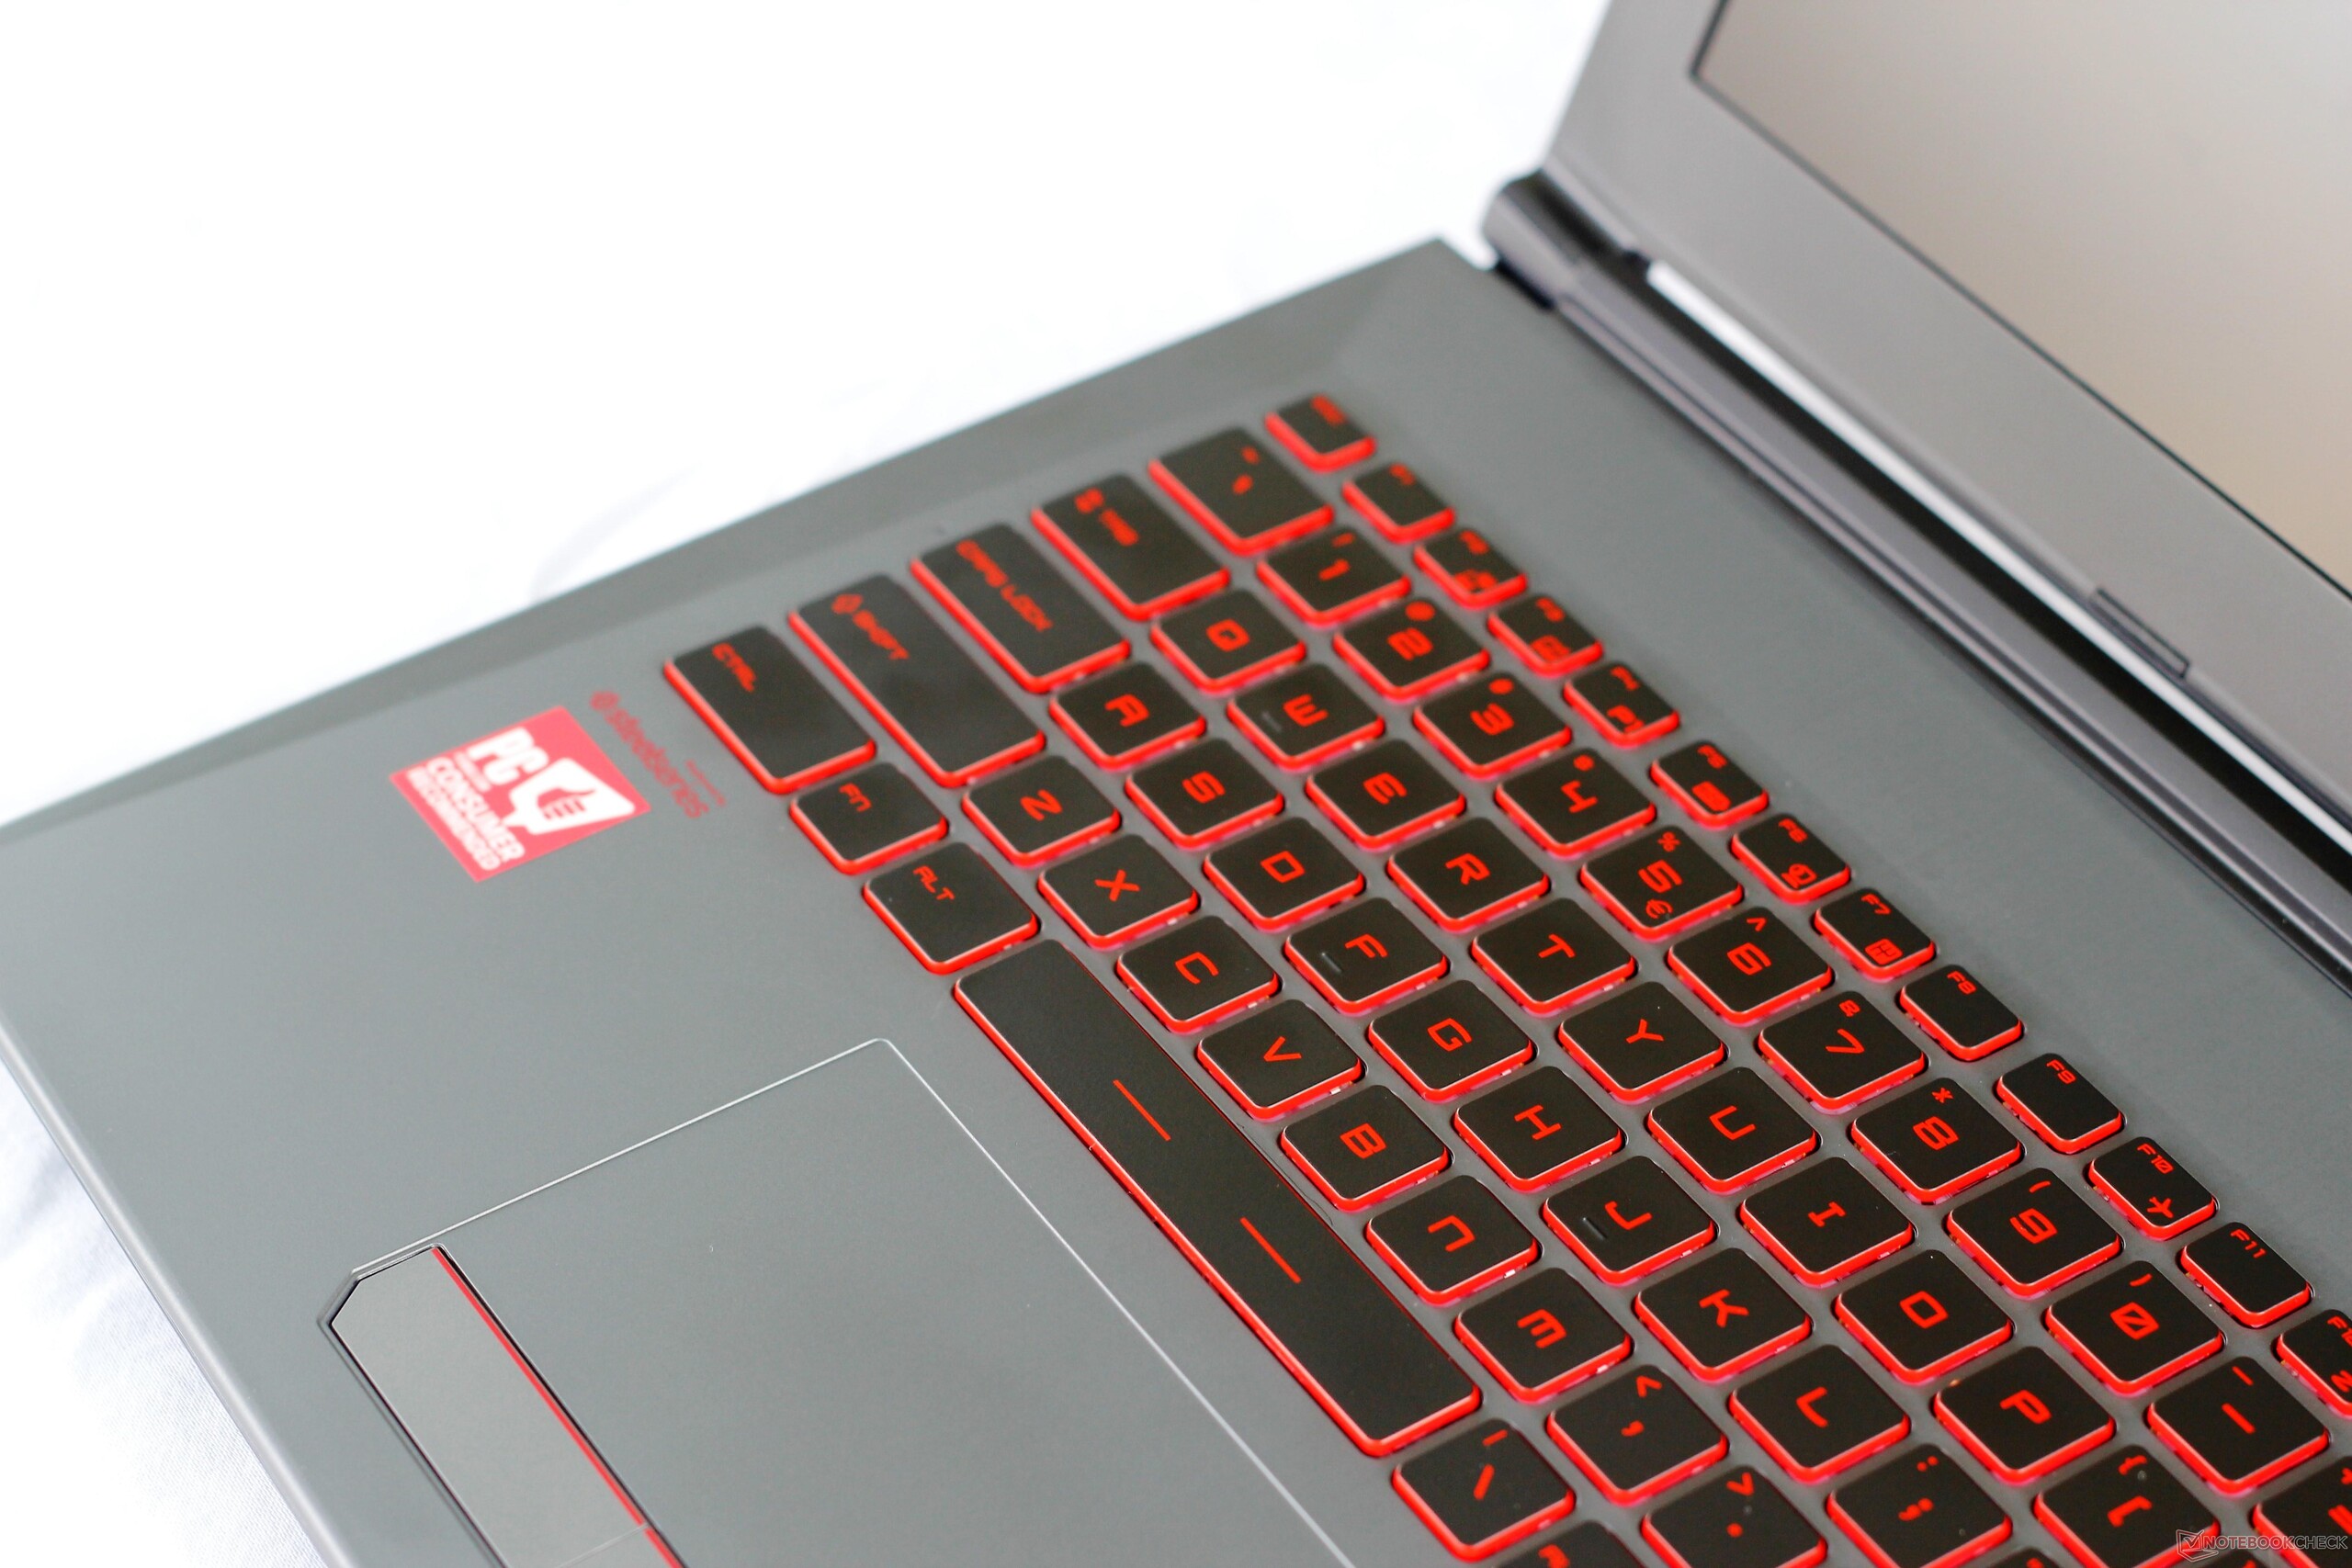
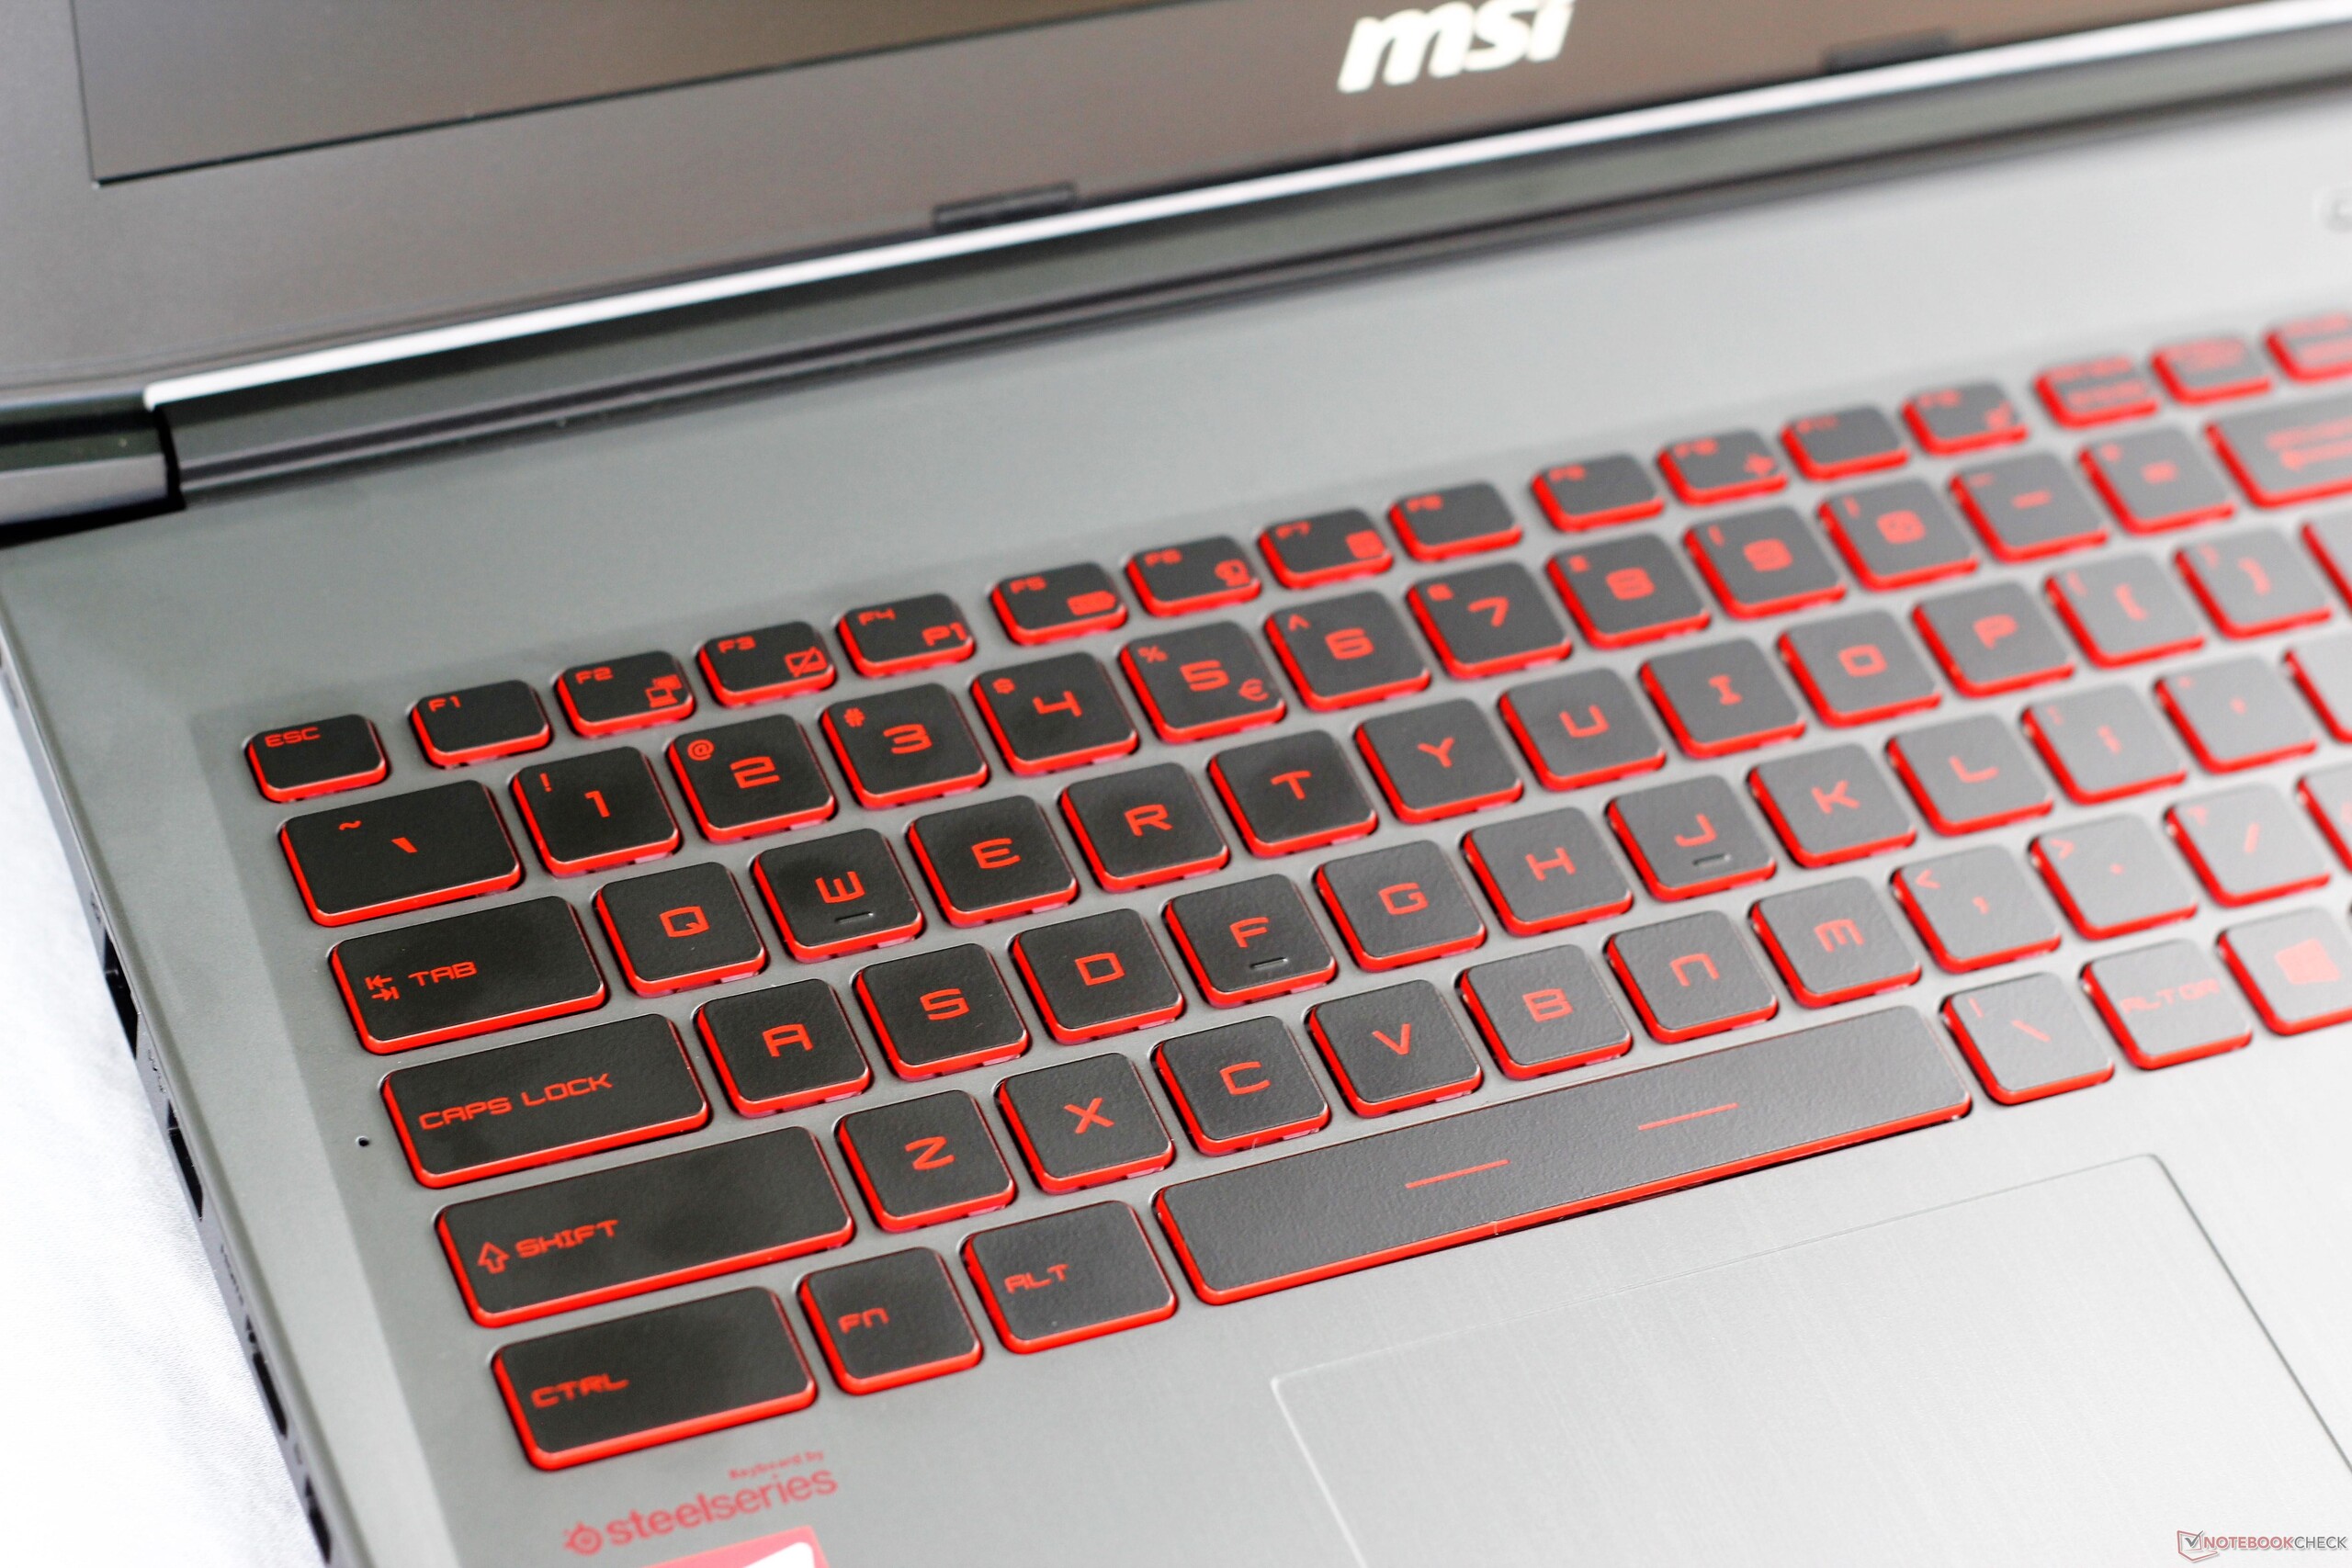
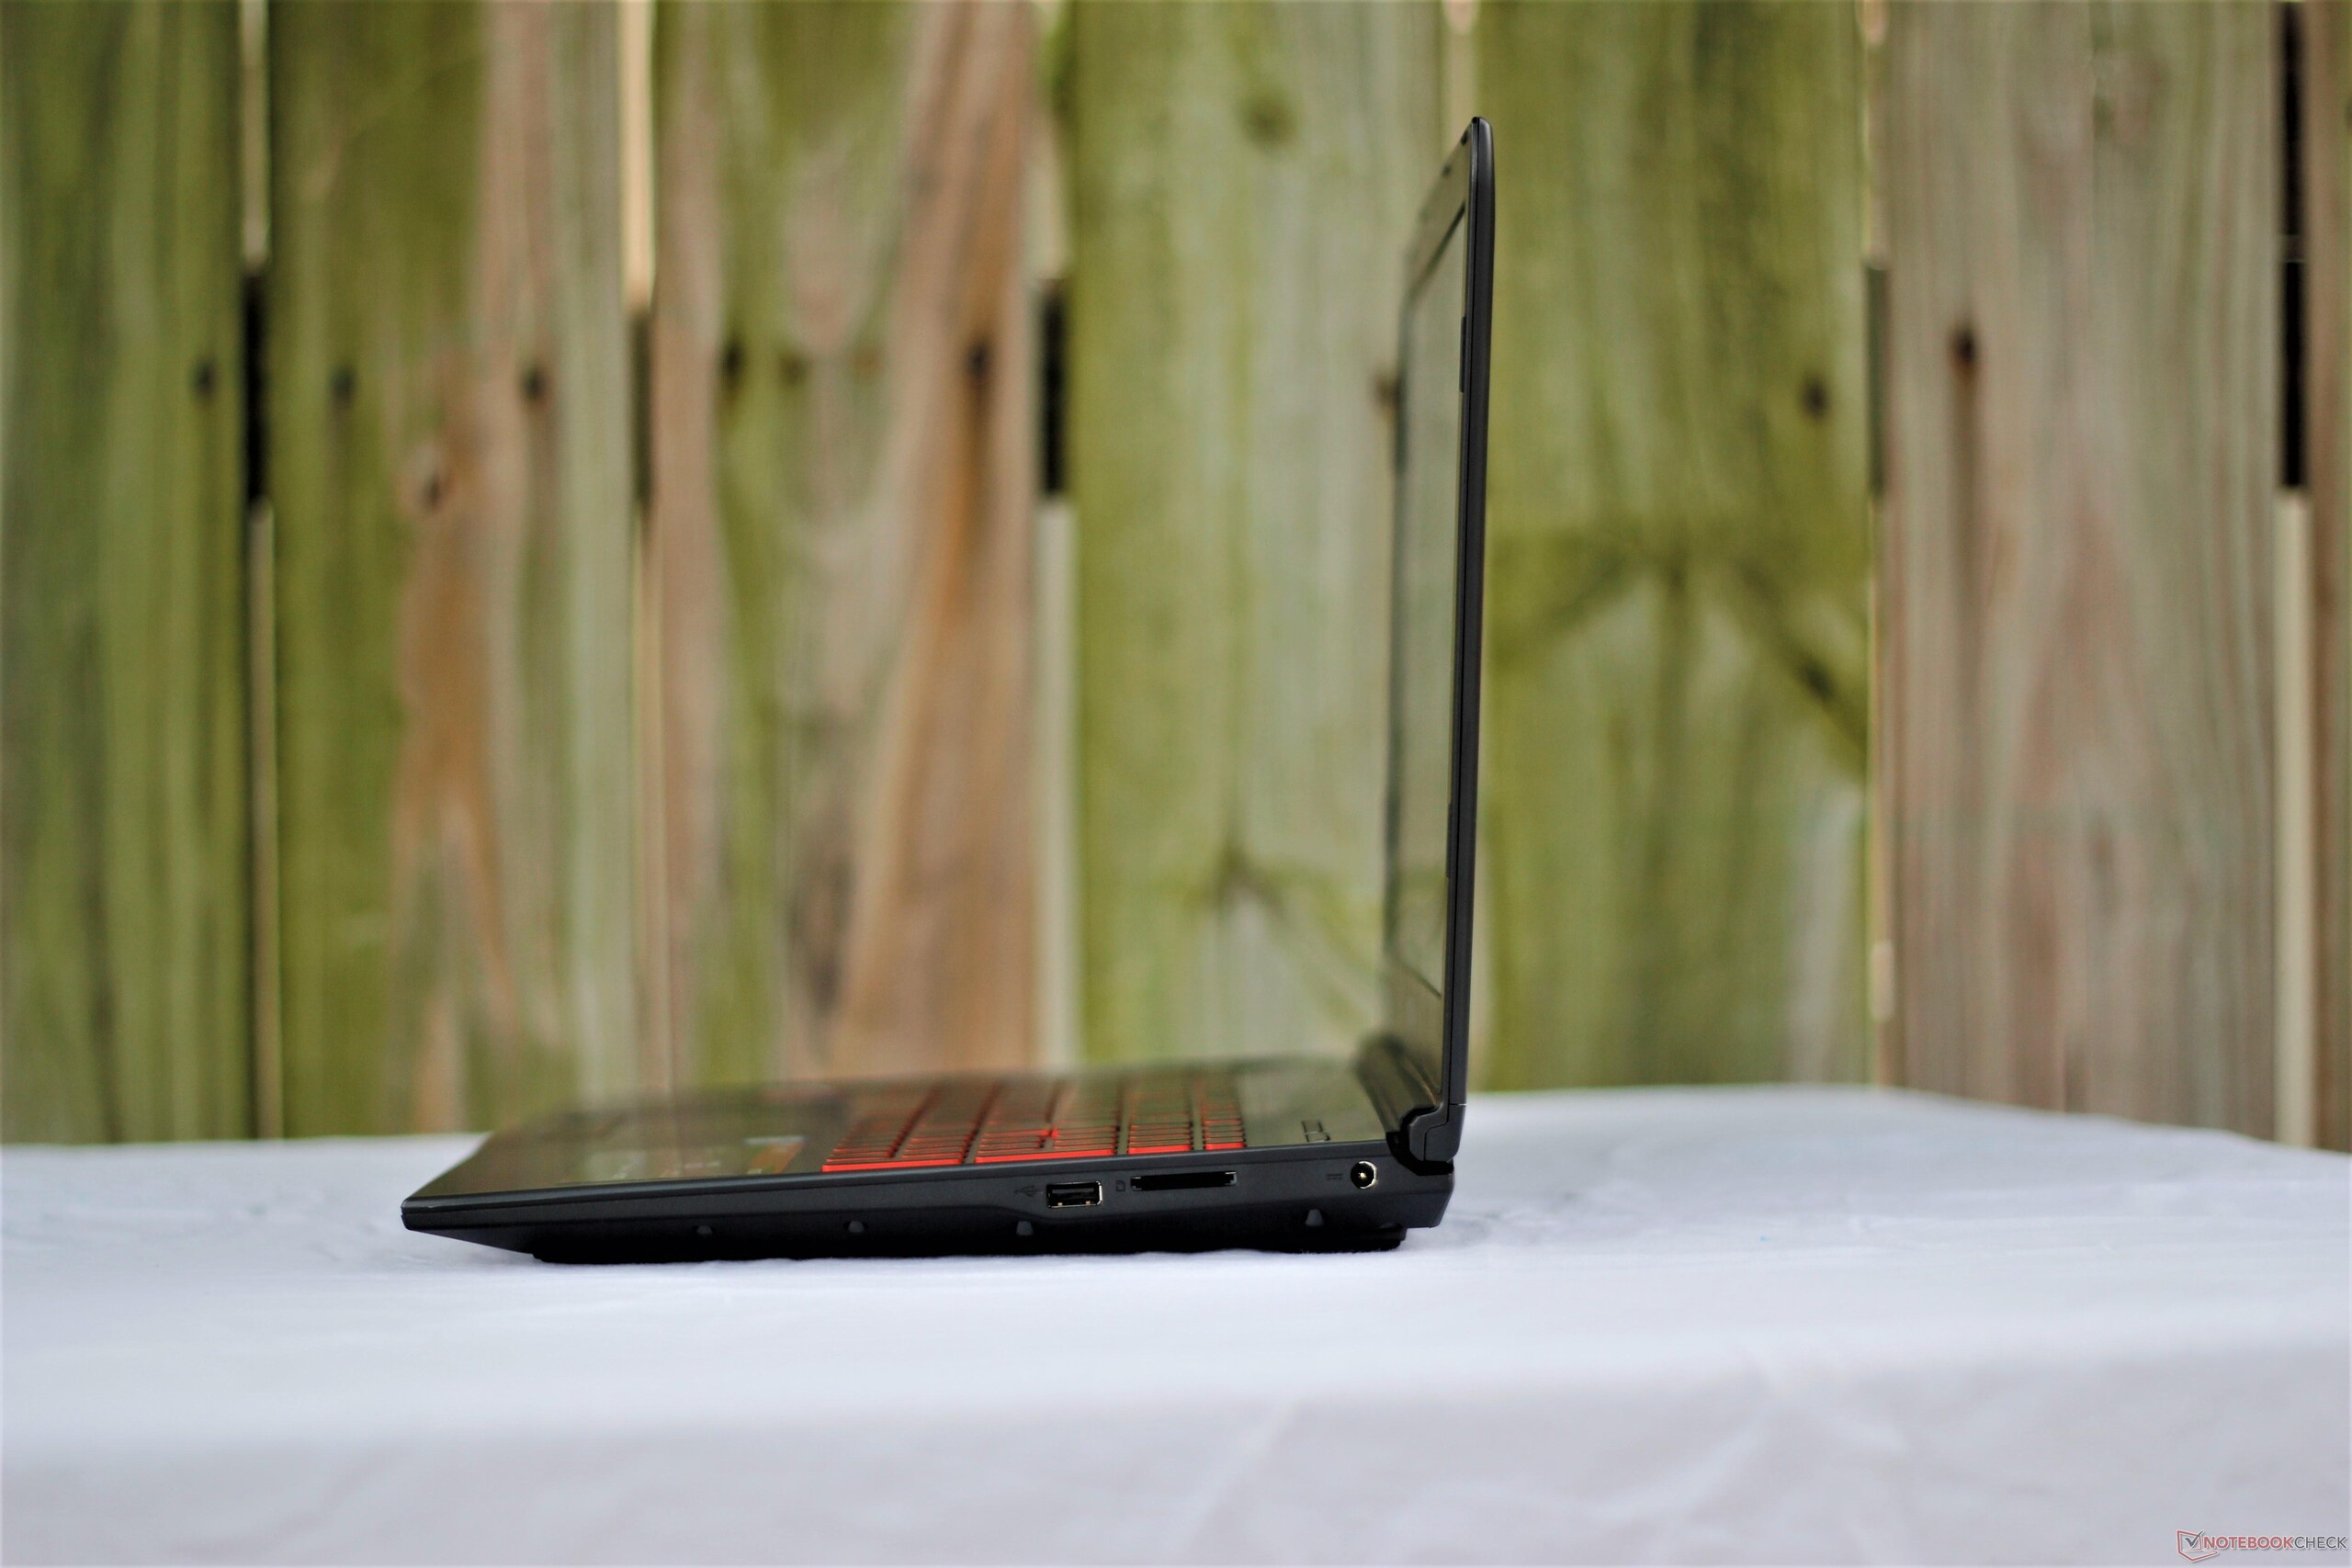
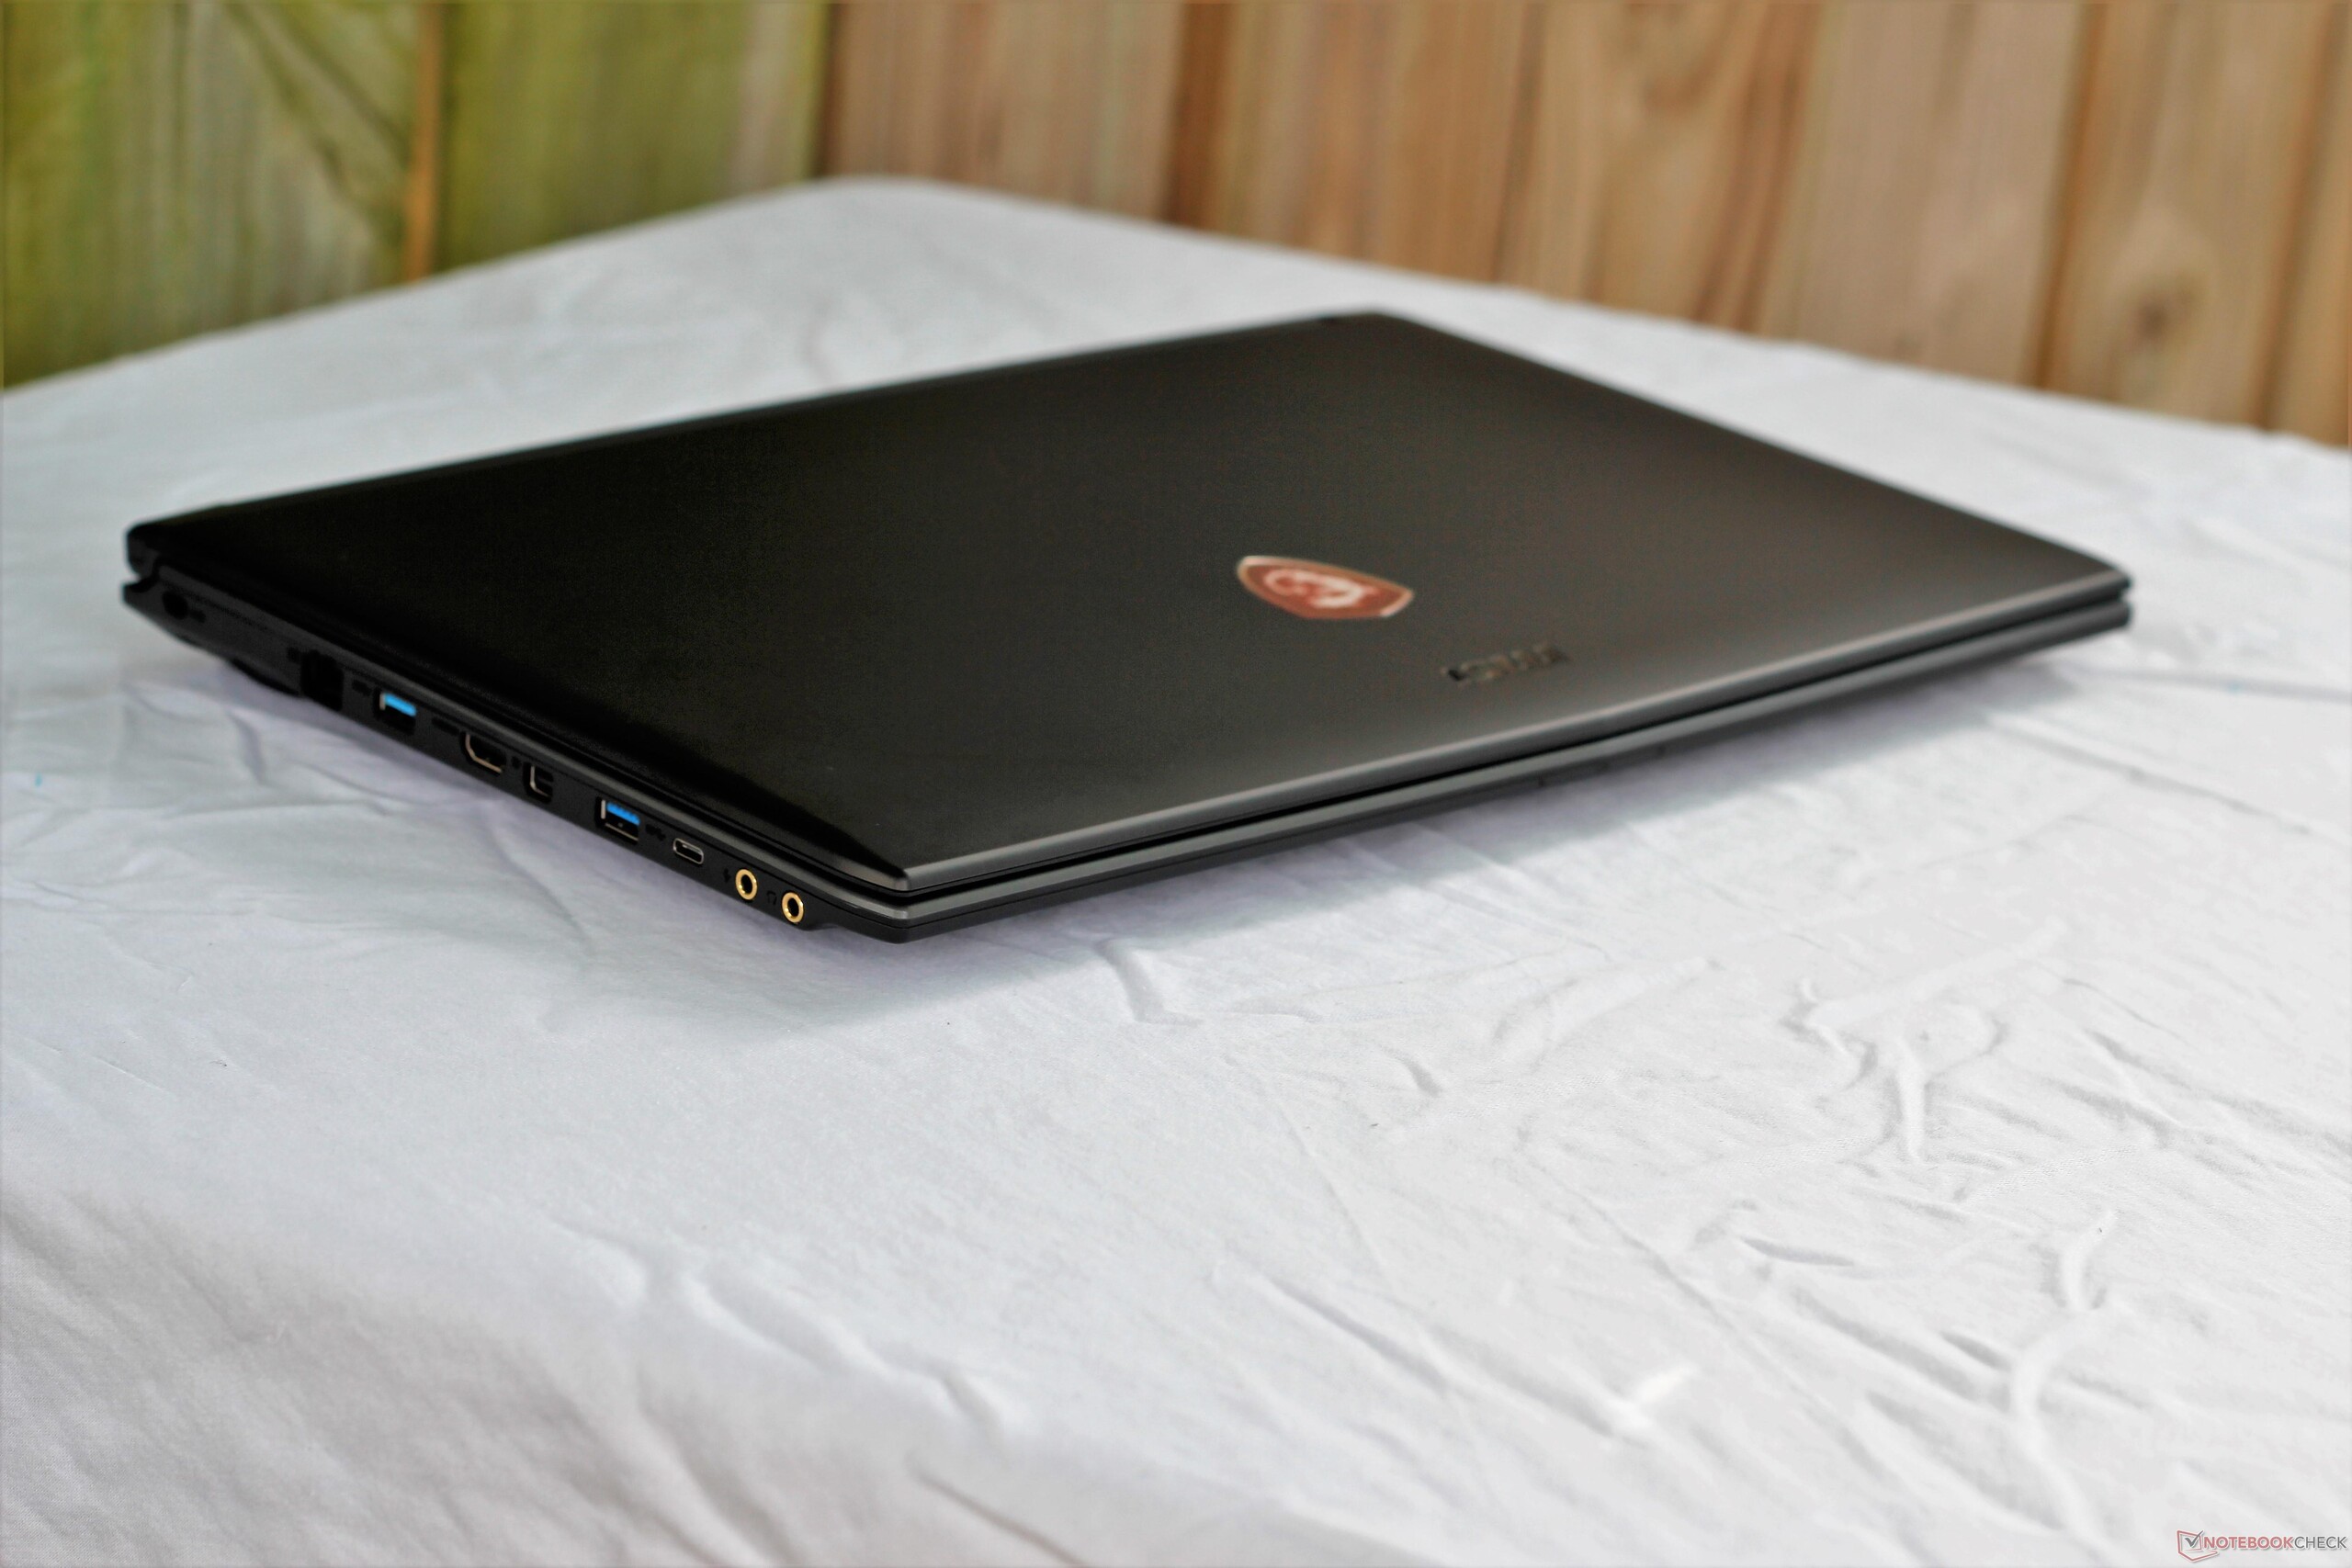
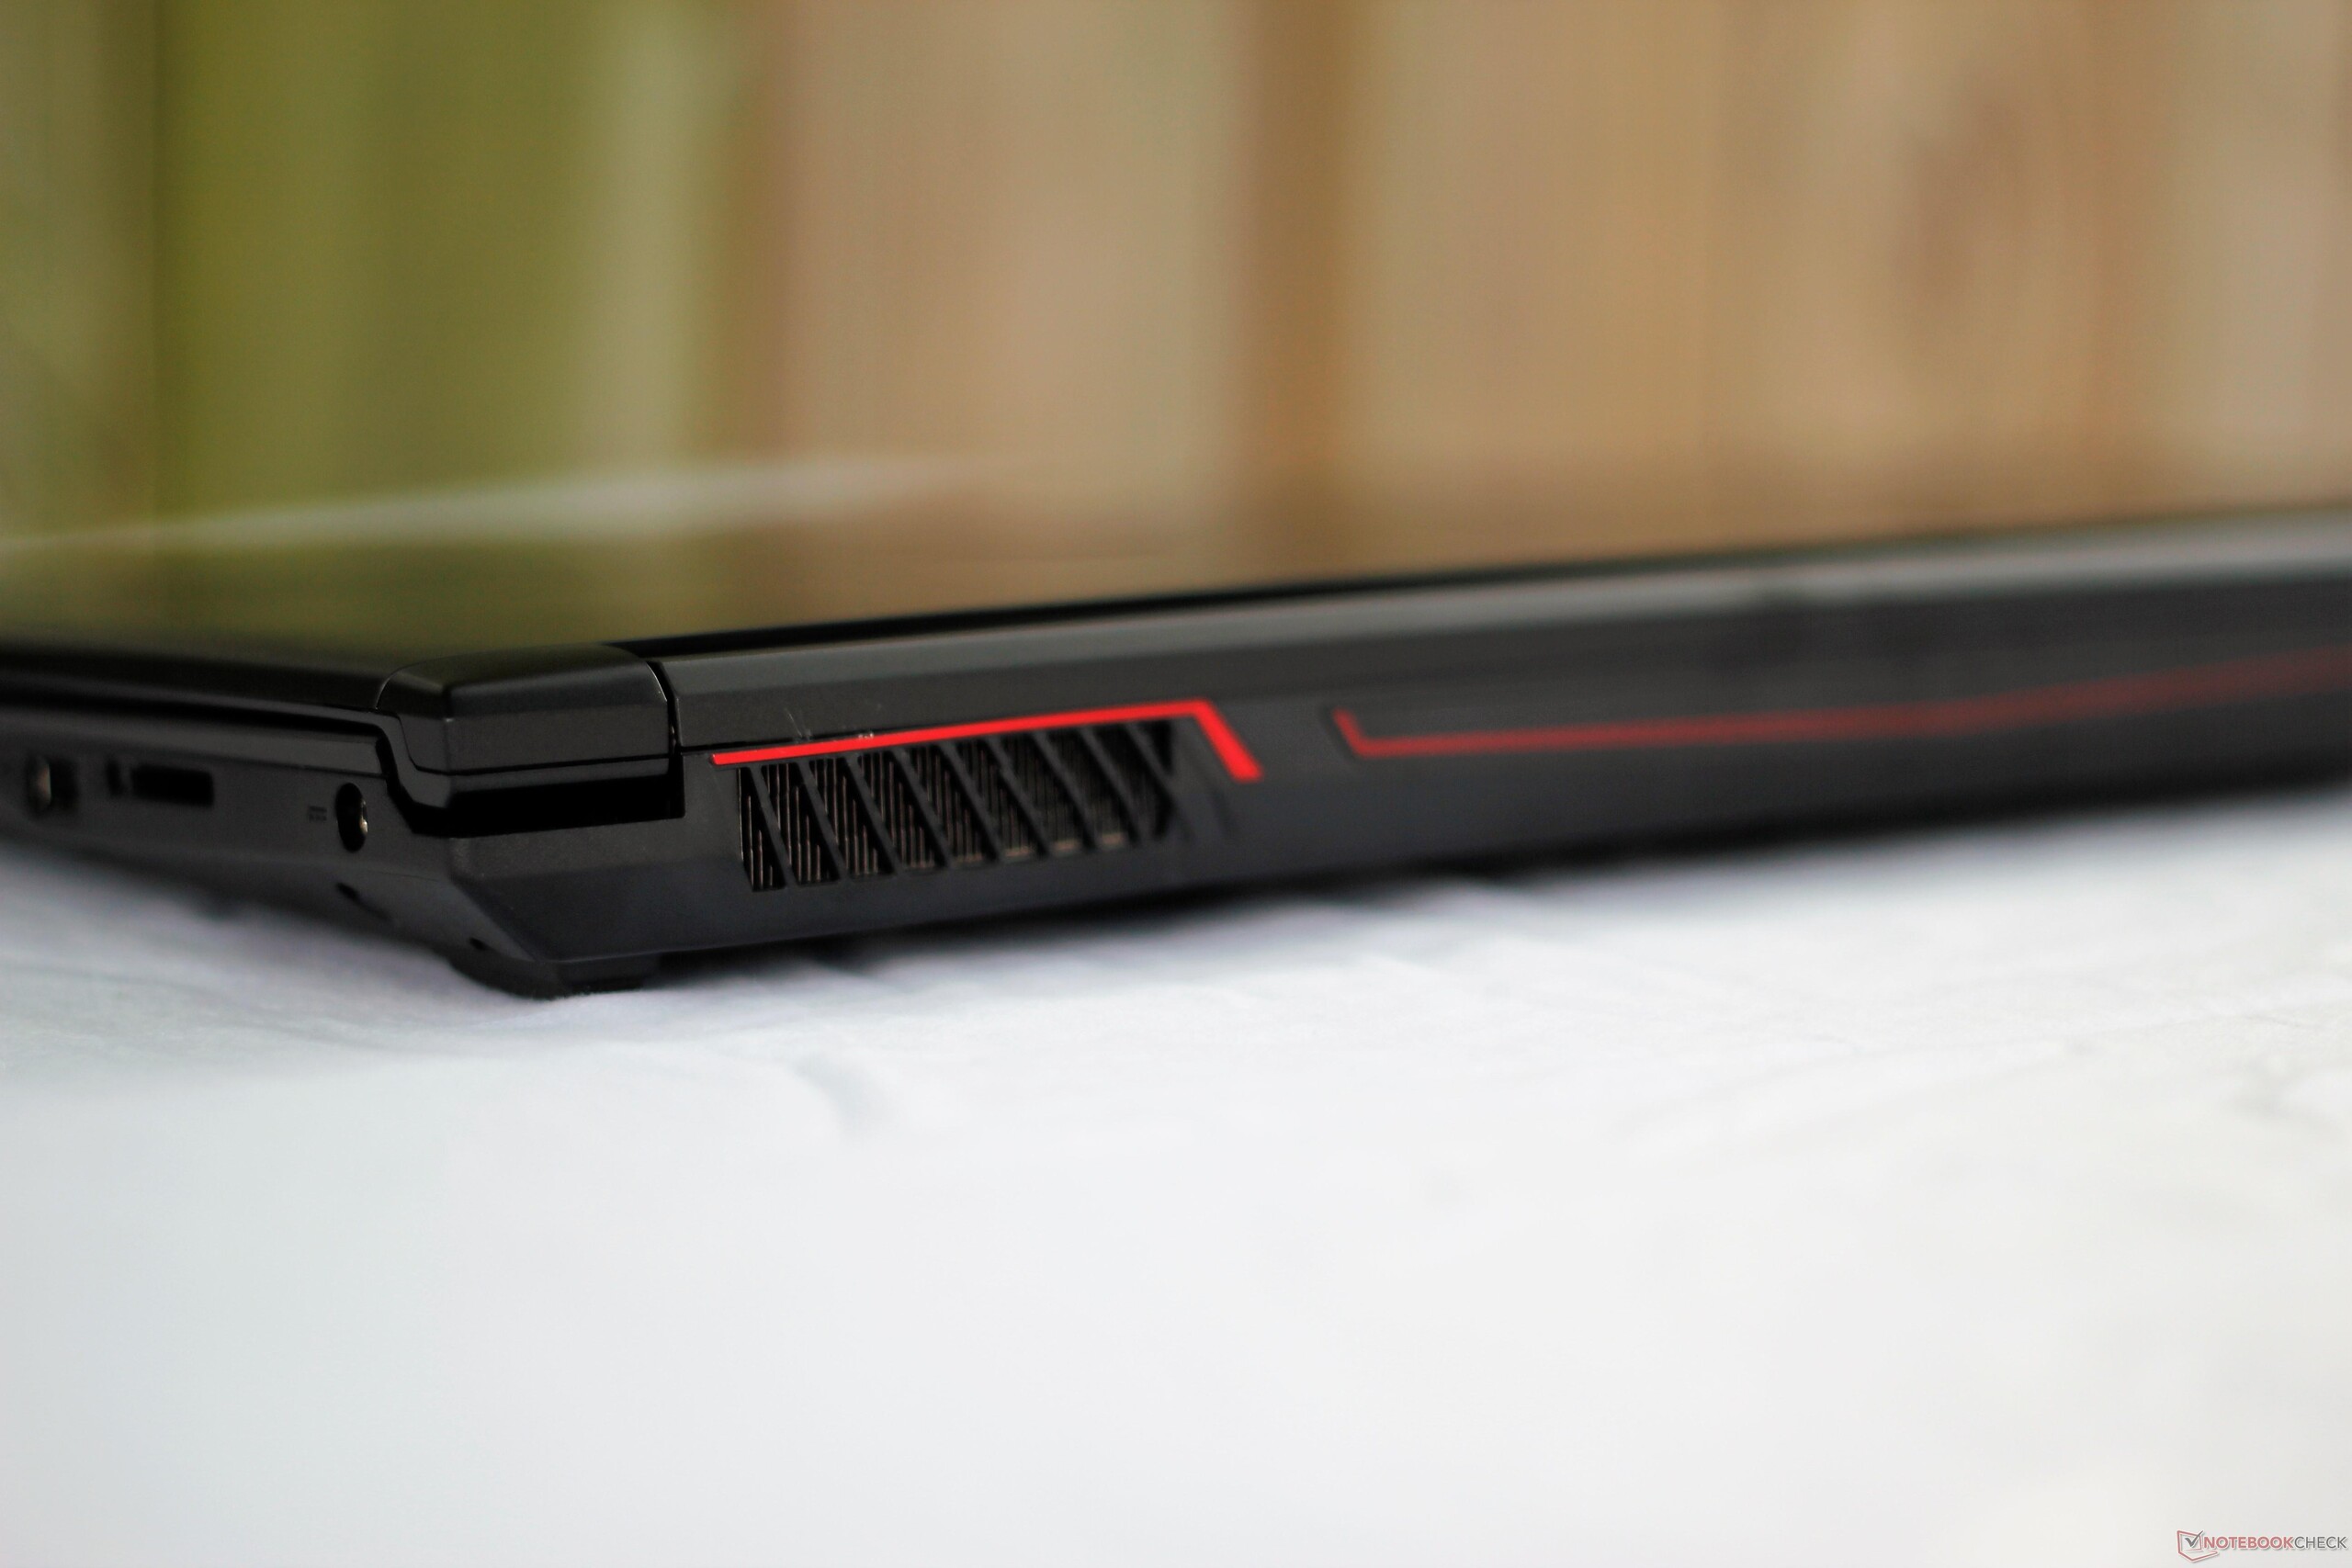
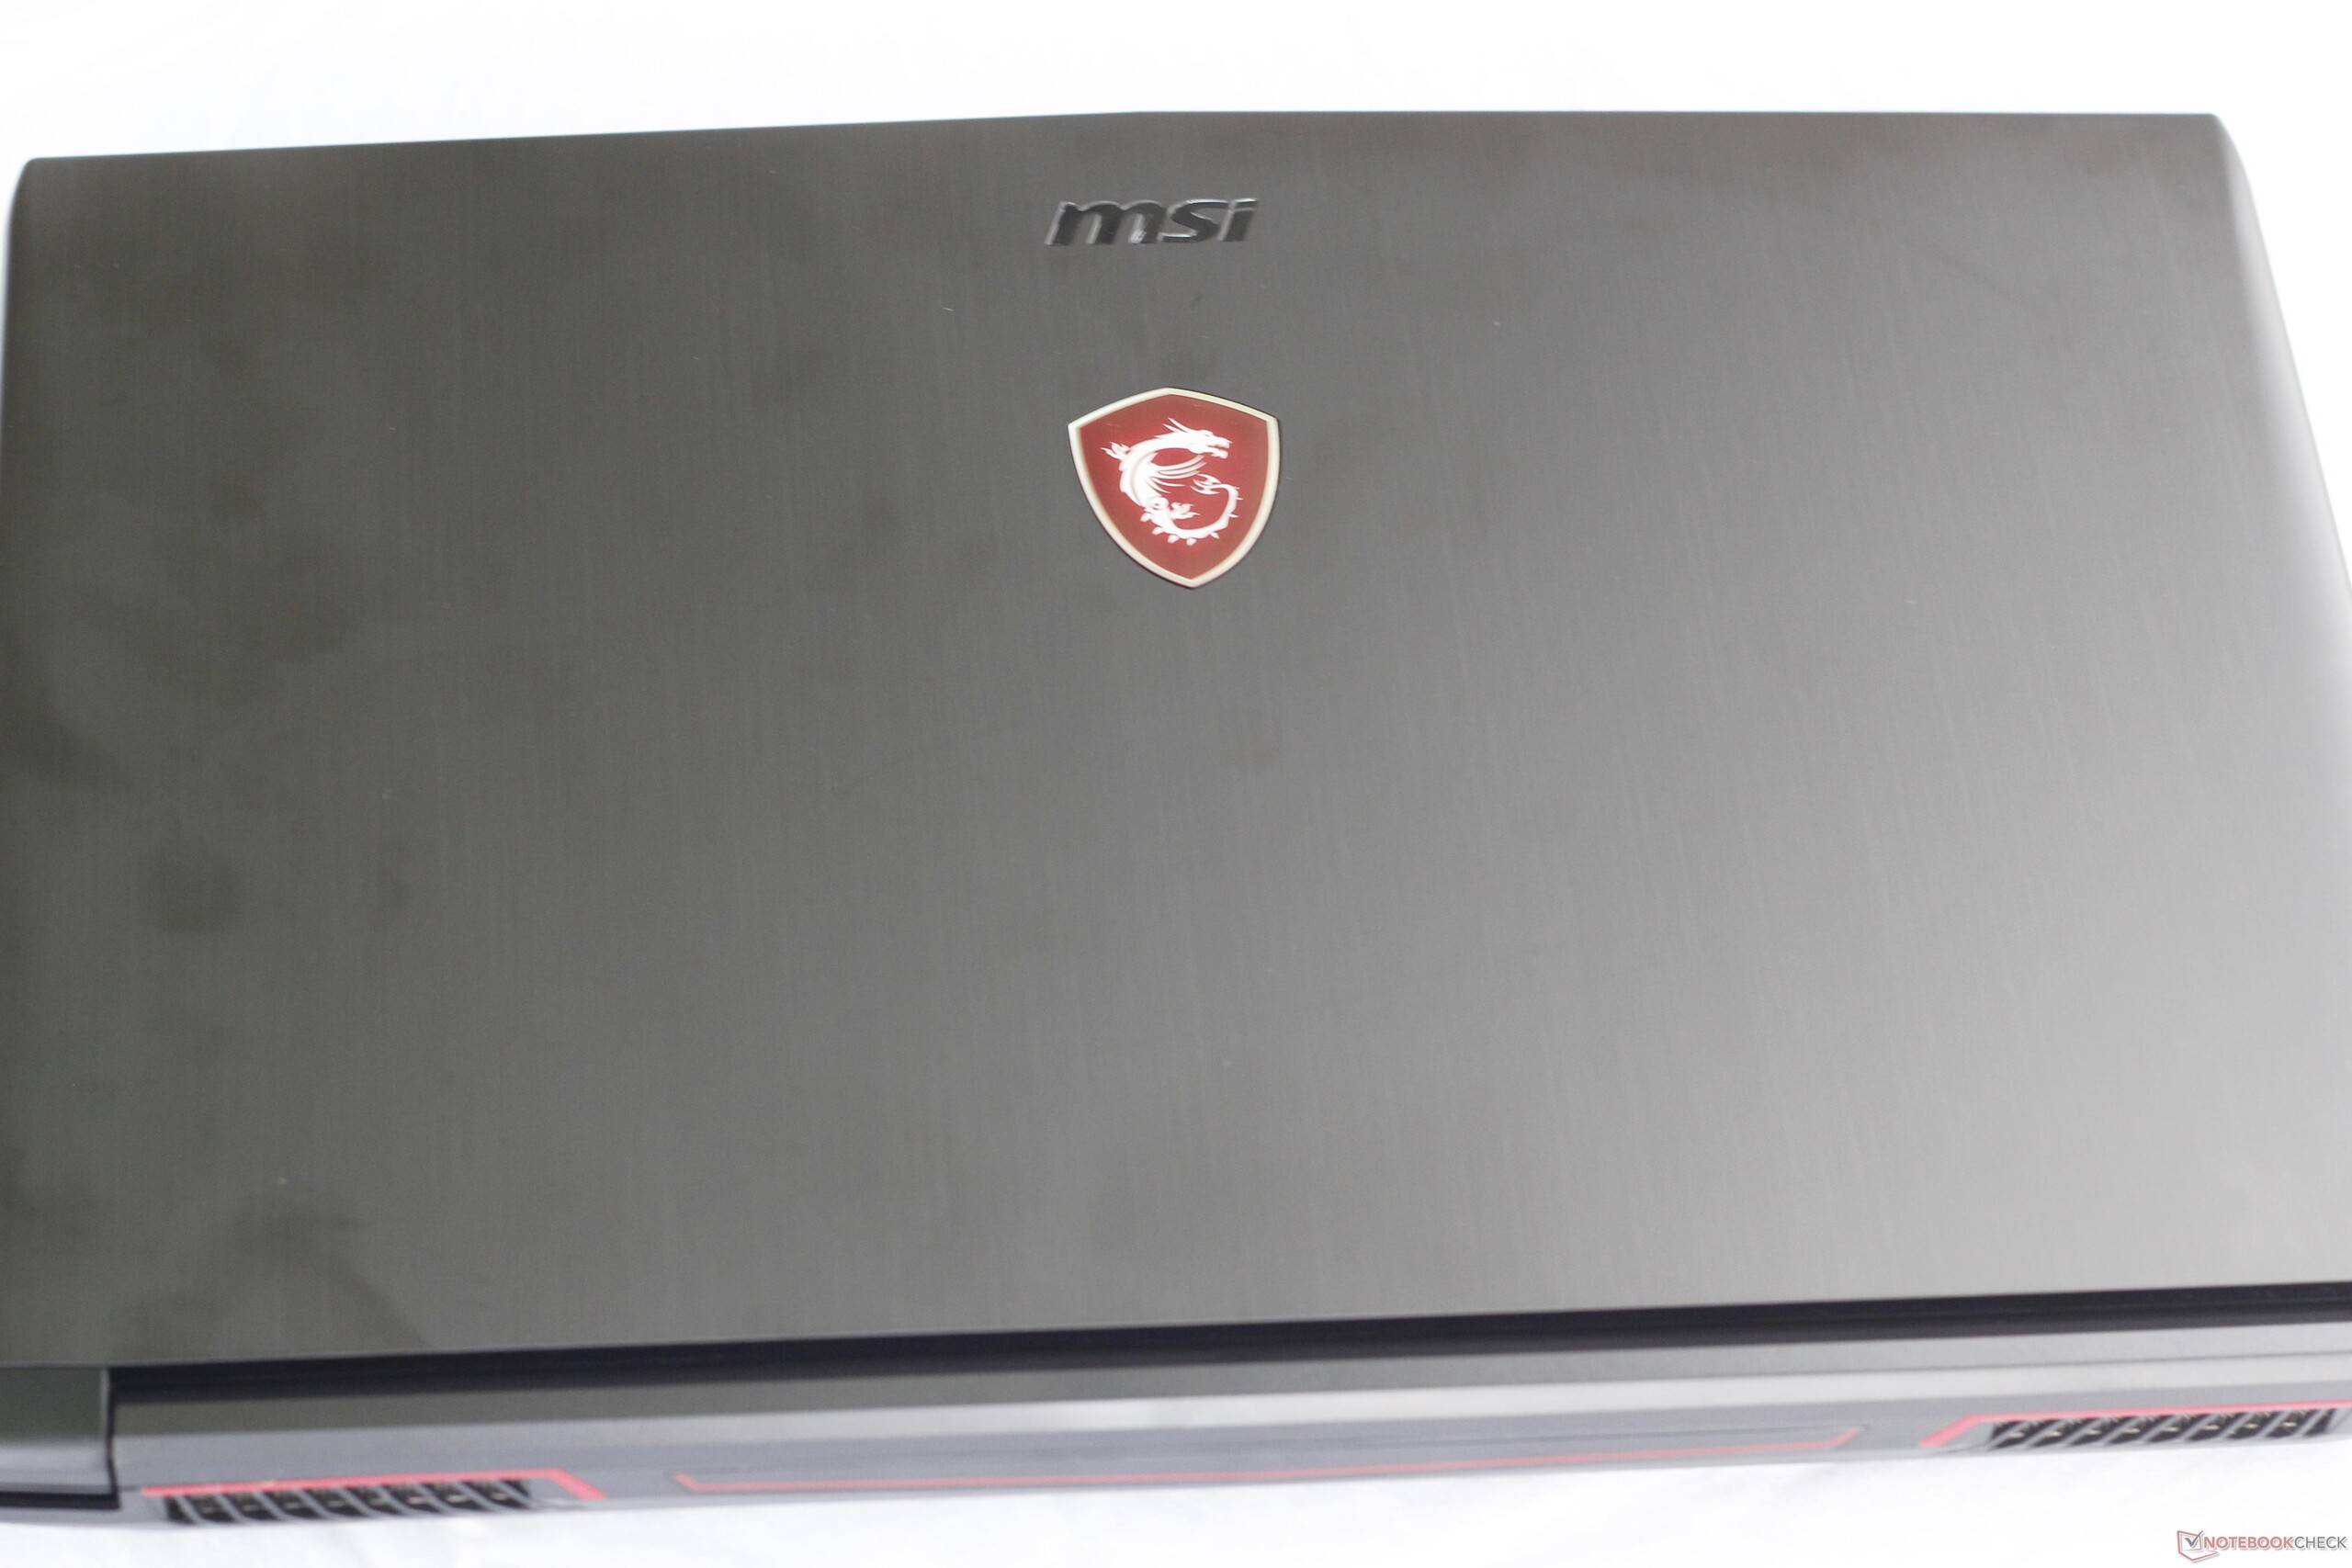
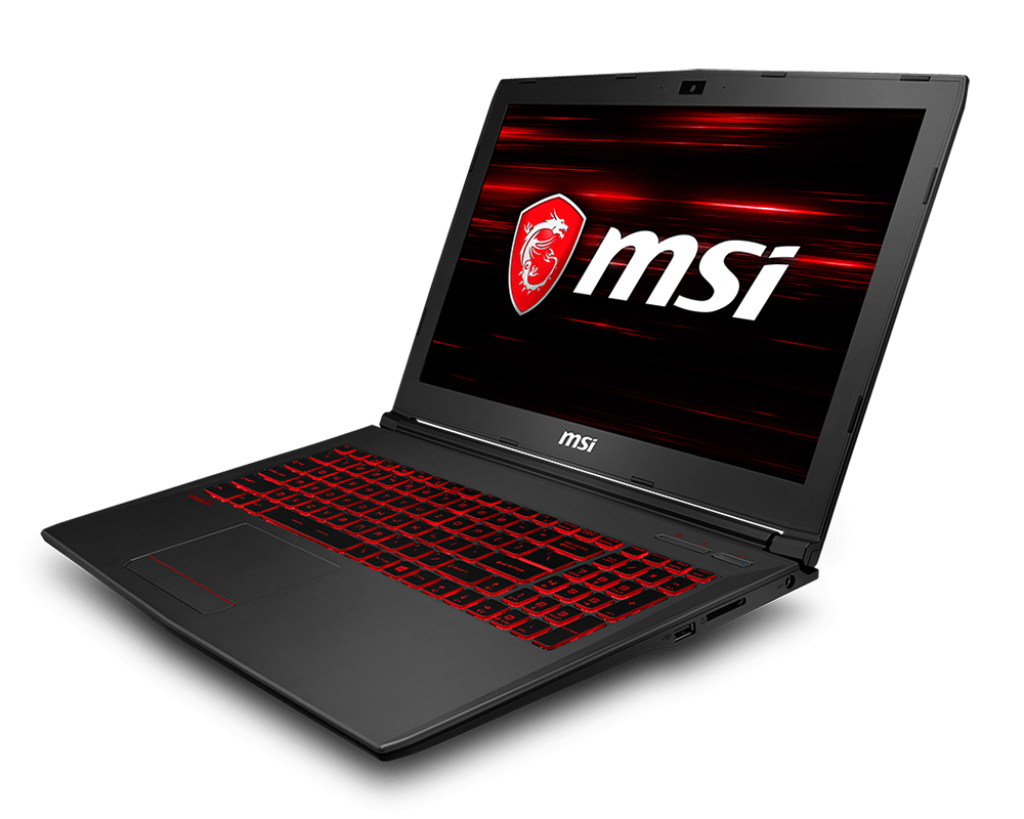
MSI är kända för att erbjuda många alternativ för att passa nästan alla behov, men vid det här laget kan det vara så att dom mättar sin egen marknad. Typexempel: dagens recenserade enhet. GV62 har väldigt lite att erbjuda som inte redan finns i deras andra serier. GV62 är nästan en karbonkopia av GF62VR, GE62VR, GL62VR och GP62VR, modeller som MSI också erbjuder från olika onlineåterförsäljare. Dom har samma höljen, samma tangentbord, samma kyllösningar, samma portutbud, osv. Dom större skillnaderna finns bland specifikationerna. Men alla dessa serier har ändå ganska lika (om inte samma) konfigurationer.
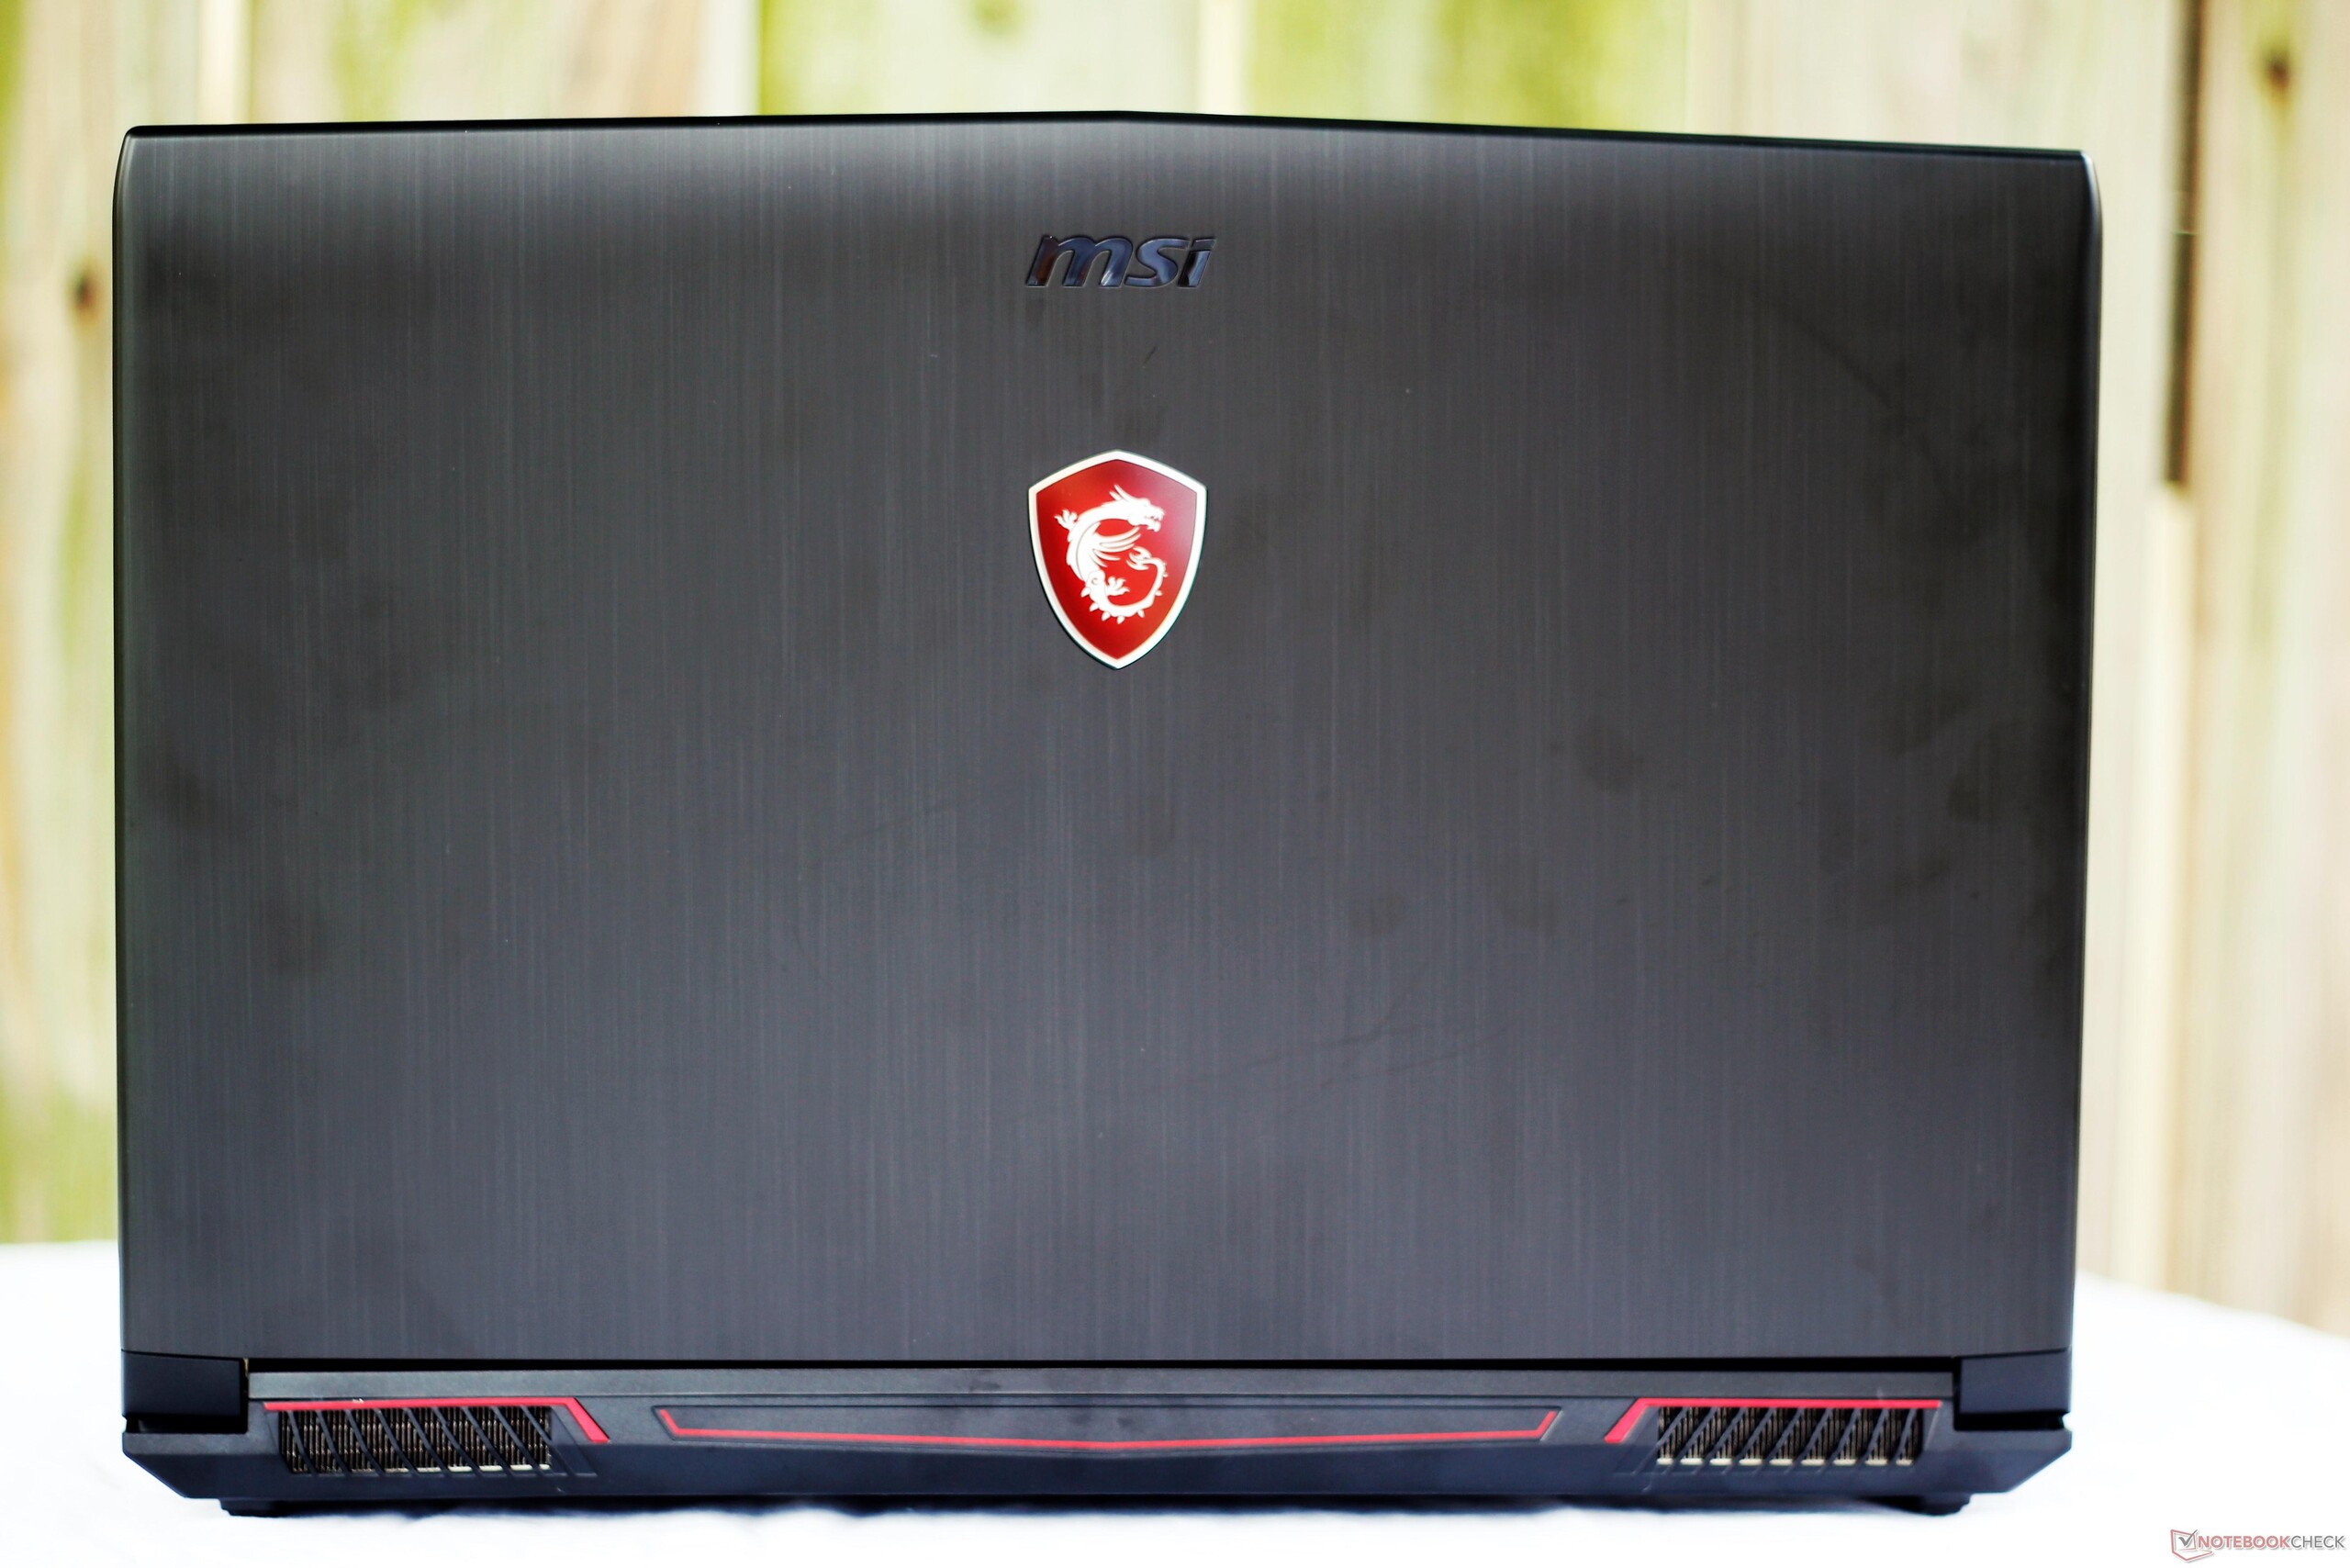
Men bortsett från MSI:s andra modeller så är GV62 en ganska kompetent integslaptop för spel. För 10.500 kronor uppfyller den många önskemål, särskilt när det kommer till prestanda. Core i5-8300H är en perfekt match till GTX1060, en GPU som sällan återfinns i modeller för under 12.000 kronor. Jämfört med andra spellaptops på instegsnivå för runt 10.000 kronor så ger GV62 mer prestanda för pengarna i både spel och flerkärniga arbetsuppgifter. Men ökningen i prestanda kommer på bekostnad av höljets design, skärmens kvalitet och batteritiden.
GV62 är kanske en överflödig enhet, men den är ändå ett bra val för gamers som vill tänka på budgeten. MSI har ett bra alternativ till dom rådande budgetspellaptop-kungarna, Acer Predator Helios 300 och Dell Inspiron 15 7577, och vilken som av dessa modeller är ett bra val för sitt pris. Billiga spellaptops har aldrig varit bättre.
MSI GV62 8RE-016US
- 06/21/2018 v6 (old)
Sam Medley
Price comparison
