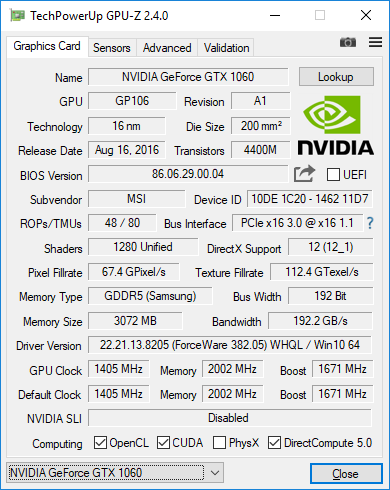
Test: MSI GP72VR 7RFX (i7-7700HQ, GTX 1060) Laptop (Sammanfattning)
| SD Card Reader | |
| average JPG Copy Test (av. of 3 runs) | |
| Acer Predator Helios 300 | |
| Asus GL702ZC-GC104T | |
| Lenovo Legion Y920-17IKB | |
| MSI GP72VR 7RFX | |
| MSI GP62 7REX-1045US | |
| maximum AS SSD Seq Read Test (1GB) | |
| Asus GL702ZC-GC104T | |
| Lenovo Legion Y920-17IKB | |
| Acer Predator Helios 300 | |
| MSI GP72VR 7RFX | |
| MSI GP62 7REX-1045US | |
| |||||||||||||||||||||||||
Distribution av ljusstyrkan: 88 %
Mitt på batteriet: 309 cd/m²
Kontrast: 1405:1 (Svärta: 0.22 cd/m²)
ΔE ColorChecker Calman: 7.2 | ∀{0.5-29.43 Ø4.71}
ΔE Greyscale Calman: 98 | ∀{0.09-98 Ø4.96}
100% sRGB (Argyll 1.6.3 3D)
77% AdobeRGB 1998 (Argyll 1.6.3 3D)
86.5% AdobeRGB 1998 (Argyll 3D)
99.7% sRGB (Argyll 3D)
89.9% Display P3 (Argyll 3D)
Gamma: 1.96
CCT: 10963 K
| MSI GP72VR 7RFX CMN1747, TN LED, 17.3", 1920x1080 | MSI GP62 7REX-1045US CMN N156HGE-EAL, TN LED, 15.6", 1920x1080 | Acer Predator Helios 300 LG LP173WF4-SPF5 (LGD056D), AH-IPS, WLED, 17.3", 1920x1080 | Lenovo Legion Y920-17IKB LP173WF4-SPF5, IPS, 17.3", 1920x1080 | Asus GL702ZC-GC104T LG Philips LP173WF4-SPF5 (LGD04E8), IPS, 17.3", 1920x1080 | Alienware 17 R4 TN LED, 17.3", 2560x1440 | |
|---|---|---|---|---|---|---|
| Display | -3% | -22% | -24% | -22% | -26% | |
| Display P3 Coverage (%) | 89.9 | 85.8 -5% | 66.8 -26% | 66.4 -26% | 67.1 -25% | 61.2 -32% |
| sRGB Coverage (%) | 99.7 | 100 0% | 85.8 -14% | 84 -16% | 85.4 -14% | 82.9 -17% |
| AdobeRGB 1998 Coverage (%) | 86.5 | 84.2 -3% | 62.8 -27% | 61.4 -29% | 62.5 -28% | 60.5 -30% |
| Response Times | -118% | -90% | -90% | -112% | -38% | |
| Response Time Grey 50% / Grey 80% * (ms) | 21.6 ? | 34.4 ? -59% | 36 ? -67% | 28.8 ? -33% | 39.2 ? -81% | 30 ? -39% |
| Response Time Black / White * (ms) | 9.4 ? | 26 ? -177% | 20 ? -113% | 23.2 ? -147% | 22.8 ? -143% | 12.8 ? -36% |
| PWM Frequency (Hz) | 25000 ? | 200 ? | 119000 ? | 20000 | 122000 ? | |
| Screen | -28% | 10% | 2% | 12% | -9% | |
| Brightness middle (cd/m²) | 309 | 265.7 -14% | 384 24% | 422.3 37% | 379 23% | 402.3 30% |
| Brightness (cd/m²) | 290 | 243 -16% | 373 29% | 378 30% | 354 22% | 372 28% |
| Brightness Distribution (%) | 88 | 87 -1% | 93 6% | 81 -8% | 89 1% | 86 -2% |
| Black Level * (cd/m²) | 0.22 | 0.63 -186% | 0.35 -59% | 0.48 -118% | 0.31 -41% | 0.62 -182% |
| Contrast (:1) | 1405 | 422 -70% | 1097 -22% | 880 -37% | 1223 -13% | 649 -54% |
| Colorchecker dE 2000 * | 7.2 | 9.6 -33% | 4.81 33% | 4.4 39% | 4.32 40% | 5.6 22% |
| Colorchecker dE 2000 max. * | 12.8 | 18.5 -45% | 8.69 32% | 9.2 28% | 8.56 33% | 9.8 23% |
| Greyscale dE 2000 * | 98 | 12.7 87% | 5.33 95% | 2.8 97% | 4 96% | 4.7 95% |
| Gamma | 1.96 112% | 2.01 109% | 2.45 90% | 2.22 99% | 2.47 89% | 2.14 103% |
| CCT | 10963 59% | 13654 48% | 7137 91% | 6403 102% | 6984 93% | 7519 86% |
| Color Space (Percent of AdobeRGB 1998) (%) | 77 | 76 -1% | 56 -27% | 55 -29% | 56 -27% | 53.7 -30% |
| Color Space (Percent of sRGB) (%) | 100 | 100 0% | 86 -14% | 84 -16% | 85 -15% | 82.2 -18% |
| Totalt genomsnitt (program/inställningar) | -50% /
-35% | -34% /
-10% | -37% /
-15% | -41% /
-11% | -24% /
-16% |
* ... mindre är bättre
Visa svarstider
| ↔ Svarstid svart till vitt | ||
|---|---|---|
| 9.4 ms ... stiga ↗ och falla ↘ kombinerat | ↗ 7.6 ms stiga | 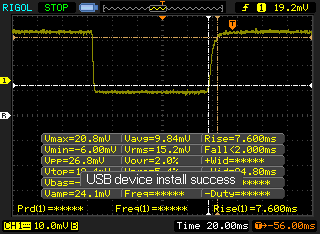 |
| ↘ 1.8 ms hösten | ||
| Skärmen visar snabba svarsfrekvenser i våra tester och bör passa för spel. I jämförelse sträcker sig alla testade enheter från 0.1 (minst) till 240 (maximalt) ms. » 26 % av alla enheter är bättre. Det betyder att den uppmätta svarstiden är bättre än genomsnittet av alla testade enheter (19.8 ms). | ||
| ↔ Svarstid 50 % grått till 80 % grått | ||
| 21.6 ms ... stiga ↗ och falla ↘ kombinerat | ↗ 12 ms stiga | 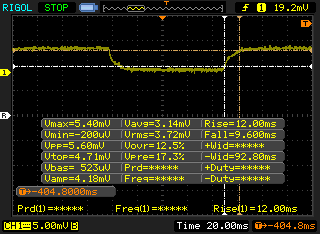 |
| ↘ 9.6 ms hösten | ||
| Skärmen visar bra svarsfrekvens i våra tester, men kan vara för långsam för konkurrenskraftiga spelare. I jämförelse sträcker sig alla testade enheter från 0.165 (minst) till 636 (maximalt) ms. » 33 % av alla enheter är bättre. Det betyder att den uppmätta svarstiden är bättre än genomsnittet av alla testade enheter (30.9 ms). | ||
Skärmflimmer / PWM (Puls-Width Modulation)
| Skärmflimmer / PWM upptäckt | 25000 Hz | ≤ 20 % ljusstyrka inställning | 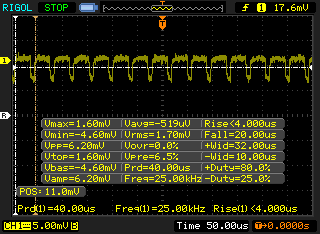 |
Displayens bakgrundsbelysning flimrar vid 25000 Hz (i värsta fall, t.ex. med PWM) Flimrande upptäckt vid en ljusstyrkeinställning på 20 % och lägre. Det ska inte finnas något flimmer eller PWM över denna ljusstyrkeinställning. Frekvensen för 25000 Hz är ganska hög, så de flesta användare som är känsliga för PWM bör inte märka något flimmer. Som jämförelse: 52 % av alla testade enheter använder inte PWM för att dämpa skärmen. Om PWM upptäcktes mättes ett medelvärde av 7748 (minst: 5 - maximum: 343500) Hz. | |||
| wPrime 2.10 - 1024m | |
| MSI GP72VR 7RFX | |
| Lenovo Legion Y920-17IKB | |
| MSI GP62 7REX-1045US | |
| Alienware 17 R4 | |
* ... mindre är bättre
| PCMark 8 | |
| Home Score Accelerated v2 | |
| Lenovo Legion Y920-17IKB | |
| Alienware 17 R4 | |
| Acer Predator Helios 300 | |
| Asus GL702ZC-GC104T | |
| MSI GP72VR 7RFX | |
| MSI GP62 7REX-1045US | |
| Work Score Accelerated v2 | |
| Lenovo Legion Y920-17IKB | |
| MSI GP72VR 7RFX | |
| MSI GP62 7REX-1045US | |
| Acer Predator Helios 300 | |
| Asus GL702ZC-GC104T | |
| Alienware 17 R4 | |
| Creative Score Accelerated v2 | |
| Alienware 17 R4 | |
| Lenovo Legion Y920-17IKB | |
| Acer Predator Helios 300 | |
| MSI GP72VR 7RFX | |
| MSI GP62 7REX-1045US | |
| PCMark 8 Home Score Accelerated v2 | 4075 poäng | |
| PCMark 8 Creative Score Accelerated v2 | 5215 poäng | |
| PCMark 8 Work Score Accelerated v2 | 5160 poäng | |
| PCMark 10 Score | 4633 poäng | |
Hjälp | ||
| MSI GP72VR 7RFX Samsung SM961 MZVKW512HMJP m.2 PCI-e | MSI GP62 7REX-1045US Toshiba NVMe THNSN5128GP | Acer Predator Helios 300 Intel SSD 600p SSDPEKKW512G7 | Lenovo Legion Y920-17IKB Samsung SM961 MZVKW512HMJP m.2 PCI-e | Alienware 17 R4 SK Hynix PC300 NVMe 512 GB | |
|---|---|---|---|---|---|
| AS SSD | -37% | -43% | 3% | -45% | |
| Copy Game MB/s (MB/s) | 894 | 442.8 -50% | 353.9 -60% | 1117 25% | 574 -36% |
| Copy Program MB/s (MB/s) | 259.8 | 326.3 26% | 263.9 2% | 407.8 57% | 446.1 72% |
| Copy ISO MB/s (MB/s) | 1653 | 1128 -32% | 924 -44% | 1975 19% | 1227 -26% |
| Score Total (Points) | 3783 | 1829 -52% | 1588 -58% | 3080 -19% | 2072 -45% |
| Score Write (Points) | 1507 | 600 -60% | 588 -61% | 1506 0% | 858 -43% |
| Score Read (Points) | 1530 | 849 -45% | 690 -55% | 1072 -30% | 831 -46% |
| Access Time Write * (ms) | 0.03 | 0.034 -13% | 0.032 -7% | 0.029 3% | 0.123 -310% |
| Access Time Read * (ms) | 0.051 | 0.079 -55% | 0.072 -41% | 0.044 14% | 0.042 18% |
| 4K-64 Write (MB/s) | 1219 | 428.2 -65% | 421.8 -65% | 1220 0% | 671 -45% |
| 4K-64 Read (MB/s) | 1231 | 628 -49% | 506 -59% | 747 -39% | 620 -50% |
| 4K Write (MB/s) | 122.7 | 112 -9% | 111.3 -9% | 127.1 4% | 113.4 -8% |
| 4K Read (MB/s) | 47.63 | 35.84 -25% | 29.02 -39% | 48.23 1% | 35.61 -25% |
| Seq Write (MB/s) | 1653 | 601 -64% | 552 -67% | 1589 -4% | 735 -56% |
| Seq Read (MB/s) | 2507 | 1848 -26% | 1558 -38% | 2768 10% | 1752 -30% |
* ... mindre är bättre

| 3DMark 06 Standard Score | 26607 poäng | |
| 3DMark 11 Performance | 12008 poäng | |
| 3DMark Ice Storm Standard Score | 114371 poäng | |
| 3DMark Cloud Gate Standard Score | 25432 poäng | |
| 3DMark Fire Strike Score | 10001 poäng | |
| 3DMark Fire Strike Extreme Score | 5270 poäng | |
| 3DMark Time Spy Score | 3697 poäng | |
Hjälp | ||
| Metro: Last Light - 1920x1080 Very High (DX11) AF:16x (sortera efter värde) | |
| MSI GP72VR 7RFX | |
| MSI GP62 7REX-1045US | |
| Lenovo Legion Y920-17IKB | |
| Alienware 17 R4 | |
| Batman: Arkham Knight - 1920x1080 High / On AA:SM AF:16x (sortera efter värde) | |
| MSI GP72VR 7RFX | |
| MSI GP62 7REX-1045US | |
| Lenovo Legion Y920-17IKB | |
| Alienware 17 R4 | |
| låg | med. | hög | ultra | |
|---|---|---|---|---|
| BioShock Infinite (2013) | 105 | |||
| Metro: Last Light (2013) | 74 | |||
| The Witcher 3 (2015) | 40 | |||
| Batman: Arkham Knight (2015) | 81 |
Ljudnivå
| Låg belastning |
| 29.2 / 29.2 / 37 dB(A) |
| Hög belastning |
| 43.7 / 46.4 dB(A) |
 | ||
30 dB tyst 40 dB(A) hörbar 50 dB(A) högt ljud |
||
min: | ||
| MSI GP72VR 7RFX GeForce GTX 1060 Mobile, i7-7700HQ, Samsung SM961 MZVKW512HMJP m.2 PCI-e | MSI GP62 7REX-1045US GeForce GTX 1050 Ti Mobile, i7-7700HQ, Toshiba NVMe THNSN5128GP | Acer Predator Helios 300 GeForce GTX 1060 Mobile, i7-7700HQ, Intel SSD 600p SSDPEKKW512G7 | Lenovo Legion Y920-17IKB GeForce GTX 1070 Mobile, i7-7820HK, Samsung SM961 MZVKW512HMJP m.2 PCI-e | Alienware 17 R4 GeForce GTX 1080 Mobile, i7-7820HK, SK Hynix PC300 NVMe 512 GB | |
|---|---|---|---|---|---|
| Noise | -1% | -4% | 4% | -10% | |
| av / miljö * (dB) | 28.3 | 28 1% | 31 -10% | 28.1 1% | 28.2 -0% |
| Idle Minimum * (dB) | 29.2 | 32.2 -10% | 31 -6% | 29.9 -2% | 35.6 -22% |
| Idle Average * (dB) | 29.2 | 32.2 -10% | 32 -10% | 31.5 -8% | 35.6 -22% |
| Idle Maximum * (dB) | 37 | 32.2 13% | 33 11% | 31.5 15% | 35.7 4% |
| Load Average * (dB) | 43.7 | 40.9 6% | 44 -1% | 33.2 24% | 50.2 -15% |
| Witcher 3 ultra * (dB) | 45.7 | 45.4 1% | 46 -1% | 46.5 -2% | 50.2 -10% |
| Load Maximum * (dB) | 46.4 | 48.6 -5% | 50 -8% | 46.5 -0% | 50.2 -8% |
* ... mindre är bättre
(-) Den maximala temperaturen på ovansidan är 53.8 °C / 129 F, jämfört med genomsnittet av 40.4 °C / 105 F , allt från 21.2 till 68.8 °C för klassen Gaming.
(-) Botten värms upp till maximalt 52.2 °C / 126 F, jämfört med genomsnittet av 43.2 °C / 110 F
(+) Vid tomgångsbruk är medeltemperaturen för ovansidan 30.6 °C / 87 F, jämfört med enhetsgenomsnittet på 33.9 °C / ### class_avg_f### F.
(±) När du spelar The Witcher 3 är medeltemperaturen för ovansidan 38 °C / 100 F, jämfört med enhetsgenomsnittet på 33.9 °C / ## #class_avg_f### F.
(-) Handledsstöden och pekplattan kan bli väldigt varma vid beröring med maximalt 42.8 °C / 109 F.
(-) Medeltemperaturen för handledsstödsområdet på liknande enheter var 28.8 °C / 83.8 F (-14 °C / -25.2 F).
MSI GP72VR 7RFX ljudanalys
(+) | högtalare kan spela relativt högt (85.5 dB)
Bas 100 - 315 Hz
(-) | nästan ingen bas - i genomsnitt 17.4% lägre än medianen
(±) | linjäriteten för basen är genomsnittlig (10% delta till föregående frekvens)
Mellan 400 - 2000 Hz
(+) | balanserad mellan - endast 4.9% från medianen
(±) | linjäriteten för mids är genomsnittlig (7.4% delta till föregående frekvens)
Högsta 2 - 16 kHz
(+) | balanserade toppar - endast 3.7% från medianen
(±) | linjäriteten för toppar är genomsnittlig (7.3% delta till föregående frekvens)
Totalt 100 - 16 000 Hz
(±) | linjäriteten för det totala ljudet är genomsnittlig (17.3% skillnad mot median)
Jämfört med samma klass
» 47% av alla testade enheter i den här klassen var bättre, 12% liknande, 41% sämre
» Den bästa hade ett delta på 6%, genomsnittet var 18%, sämst var 132%
Jämfört med alla testade enheter
» 33% av alla testade enheter var bättre, 8% liknande, 59% sämre
» Den bästa hade ett delta på 4%, genomsnittet var 23%, sämst var 134%
Apple MacBook 12 (Early 2016) 1.1 GHz ljudanalys
(+) | högtalare kan spela relativt högt (83.6 dB)
Bas 100 - 315 Hz
(±) | reducerad bas - i genomsnitt 11.3% lägre än medianen
(±) | linjäriteten för basen är genomsnittlig (14.2% delta till föregående frekvens)
Mellan 400 - 2000 Hz
(+) | balanserad mellan - endast 2.4% från medianen
(+) | mids är linjära (5.5% delta till föregående frekvens)
Högsta 2 - 16 kHz
(+) | balanserade toppar - endast 2% från medianen
(+) | toppar är linjära (4.5% delta till föregående frekvens)
Totalt 100 - 16 000 Hz
(+) | det totala ljudet är linjärt (10.2% skillnad mot median)
Jämfört med samma klass
» 7% av alla testade enheter i den här klassen var bättre, 2% liknande, 90% sämre
» Den bästa hade ett delta på 5%, genomsnittet var 18%, sämst var 53%
Jämfört med alla testade enheter
» 5% av alla testade enheter var bättre, 1% liknande, 94% sämre
» Den bästa hade ett delta på 4%, genomsnittet var 23%, sämst var 134%
| Av/Standby | |
| Låg belastning | |
| Hög belastning |
|
Förklaring:
min: | |
| MSI GP72VR 7RFX i7-7700HQ, GeForce GTX 1060 Mobile, Samsung SM961 MZVKW512HMJP m.2 PCI-e, TN LED, 1920x1080, 17.3" | MSI GP62 7REX-1045US i7-7700HQ, GeForce GTX 1050 Ti Mobile, Toshiba NVMe THNSN5128GP, TN LED, 1920x1080, 15.6" | Acer Predator Helios 300 i7-7700HQ, GeForce GTX 1060 Mobile, Intel SSD 600p SSDPEKKW512G7, AH-IPS, WLED, 1920x1080, 17.3" | Lenovo Legion Y920-17IKB i7-7820HK, GeForce GTX 1070 Mobile, Samsung SM961 MZVKW512HMJP m.2 PCI-e, IPS, 1920x1080, 17.3" | Alienware 17 R4 i7-7820HK, GeForce GTX 1080 Mobile, SK Hynix PC300 NVMe 512 GB, TN LED, 2560x1440, 17.3" | |
|---|---|---|---|---|---|
| Power Consumption | 17% | 20% | -36% | -68% | |
| Idle Minimum * (Watt) | 17.3 | 14.6 16% | 7 60% | 29.4 -70% | 37.5 -117% |
| Idle Average * (Watt) | 22.5 | 17.2 24% | 13 42% | 30.9 -37% | 37.6 -67% |
| Idle Maximum * (Watt) | 22.5 | 17.3 23% | 20 11% | 31.9 -42% | 37.6 -67% |
| Load Average * (Watt) | 85.1 | 82.7 3% | 81 5% | 87.4 -3% | 122.4 -44% |
| Witcher 3 ultra * (Watt) | 141.7 | 107 24% | 127 10% | 182 -28% | 180.3 -27% |
| Load Maximum * (Watt) | 151.3 | 136.7 10% | 162 -7% | 201.5 -33% | 277.4 -83% |
* ... mindre är bättre
| MSI GP72VR 7RFX i7-7700HQ, GeForce GTX 1060 Mobile, 41 Wh | MSI GP62 7REX-1045US i7-7700HQ, GeForce GTX 1050 Ti Mobile, 41 Wh | Acer Predator Helios 300 i7-7700HQ, GeForce GTX 1060 Mobile, 48 Wh | Lenovo Legion Y920-17IKB i7-7820HK, GeForce GTX 1070 Mobile, 90 Wh | Asus GL702ZC-GC104T R7 1700, Radeon RX 580 (Laptop), 76 Wh | Alienware 17 R4 i7-7820HK, GeForce GTX 1080 Mobile, 99 Wh | |
|---|---|---|---|---|---|---|
| Batteridrifttid | 158% | 469% | 275% | 13% | 178% | |
| Reader / Idle (h) | 0.7 | 4.3 514% | 10.2 1357% | 5.9 743% | 1.7 143% | 4.6 557% |
| WiFi v1.3 (h) | 2.1 | 2.9 38% | 4.7 124% | 4.7 124% | 1.5 -29% | 3 43% |
| Load (h) | 3.4 | 0.7 -79% | 0.9 -74% | 2 -41% | 0.9 -74% | 1.2 -65% |
För
Emot
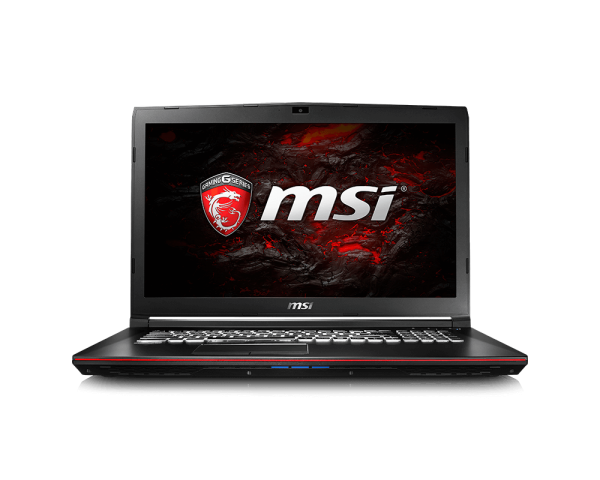
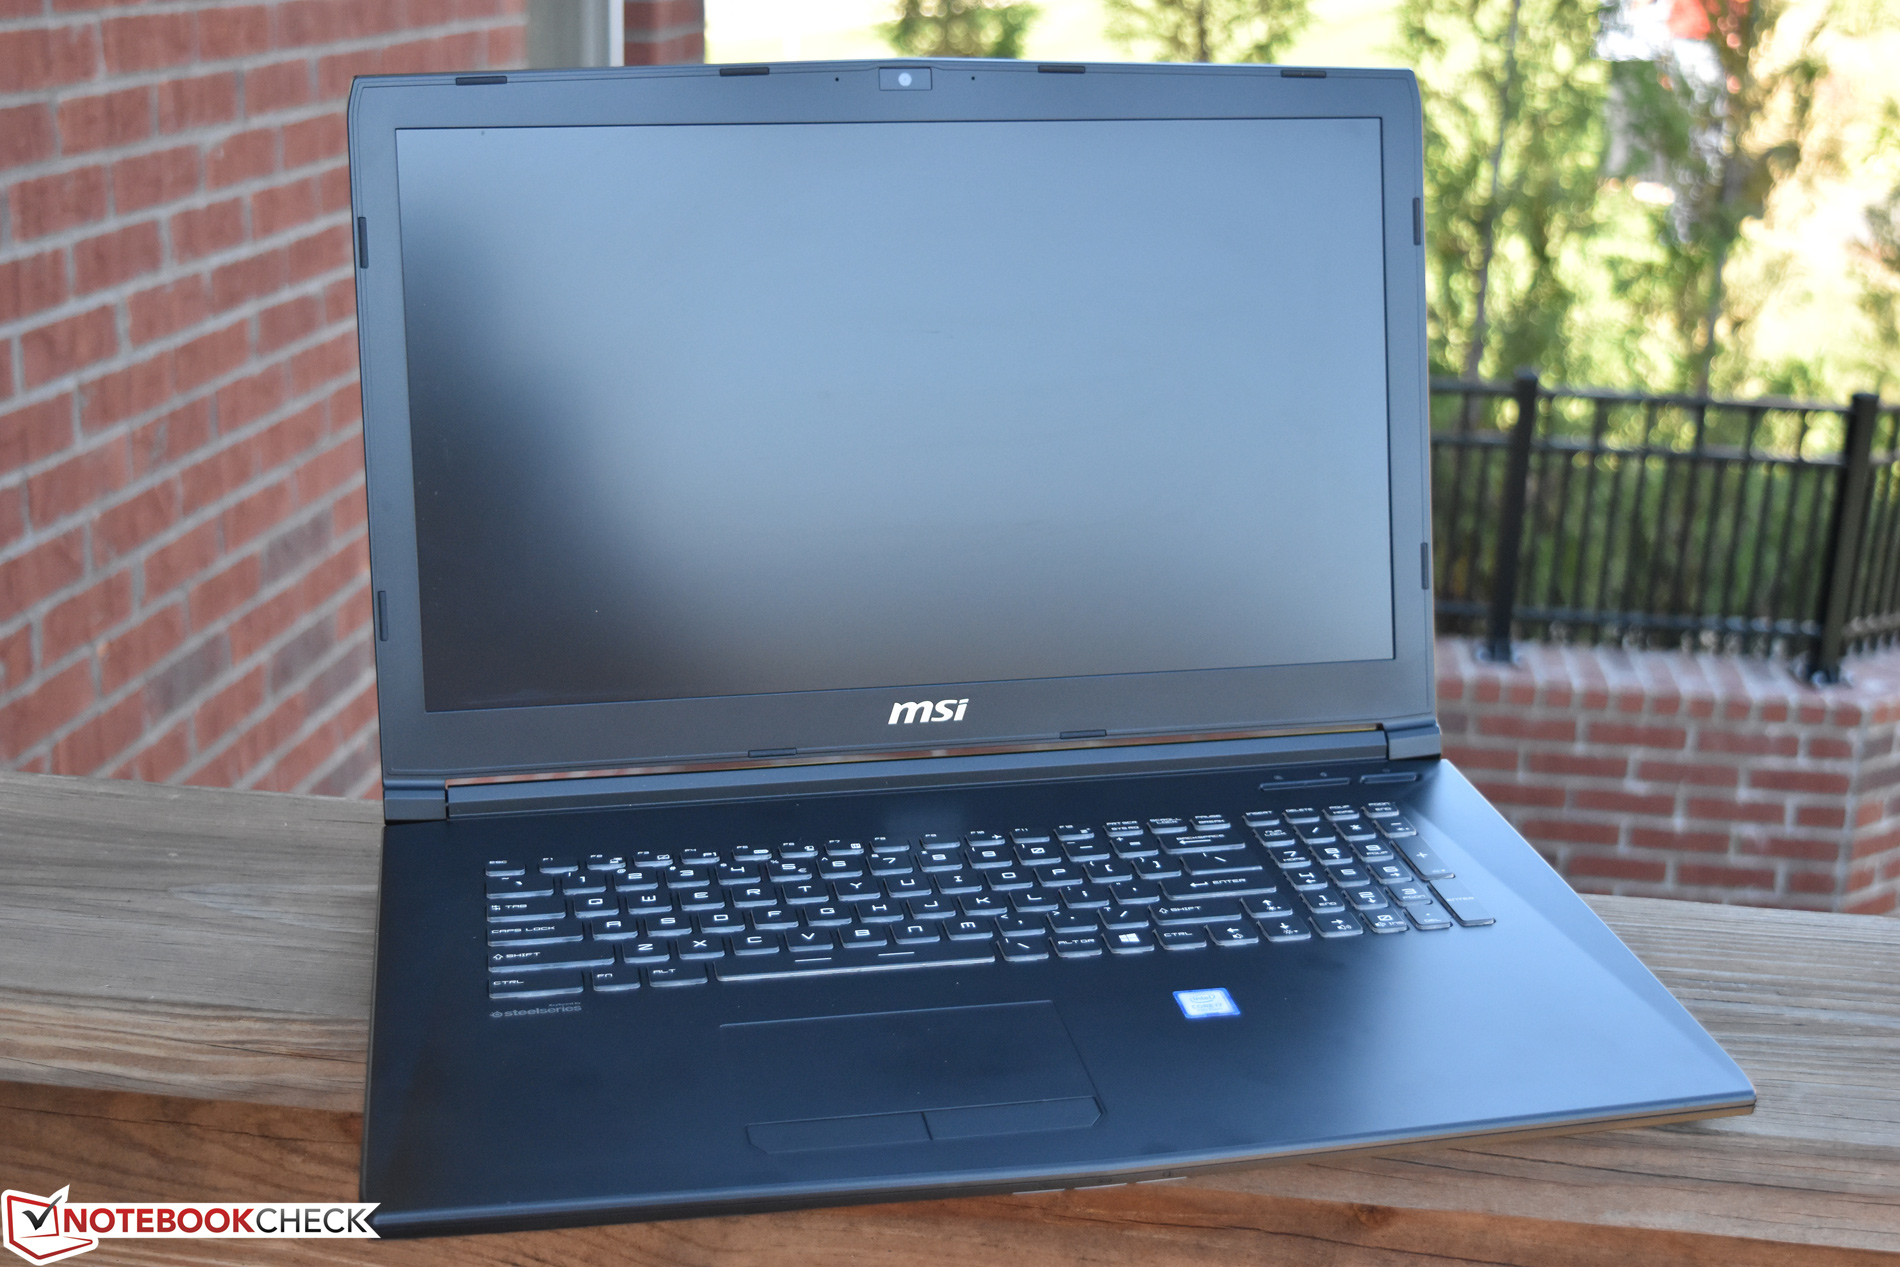
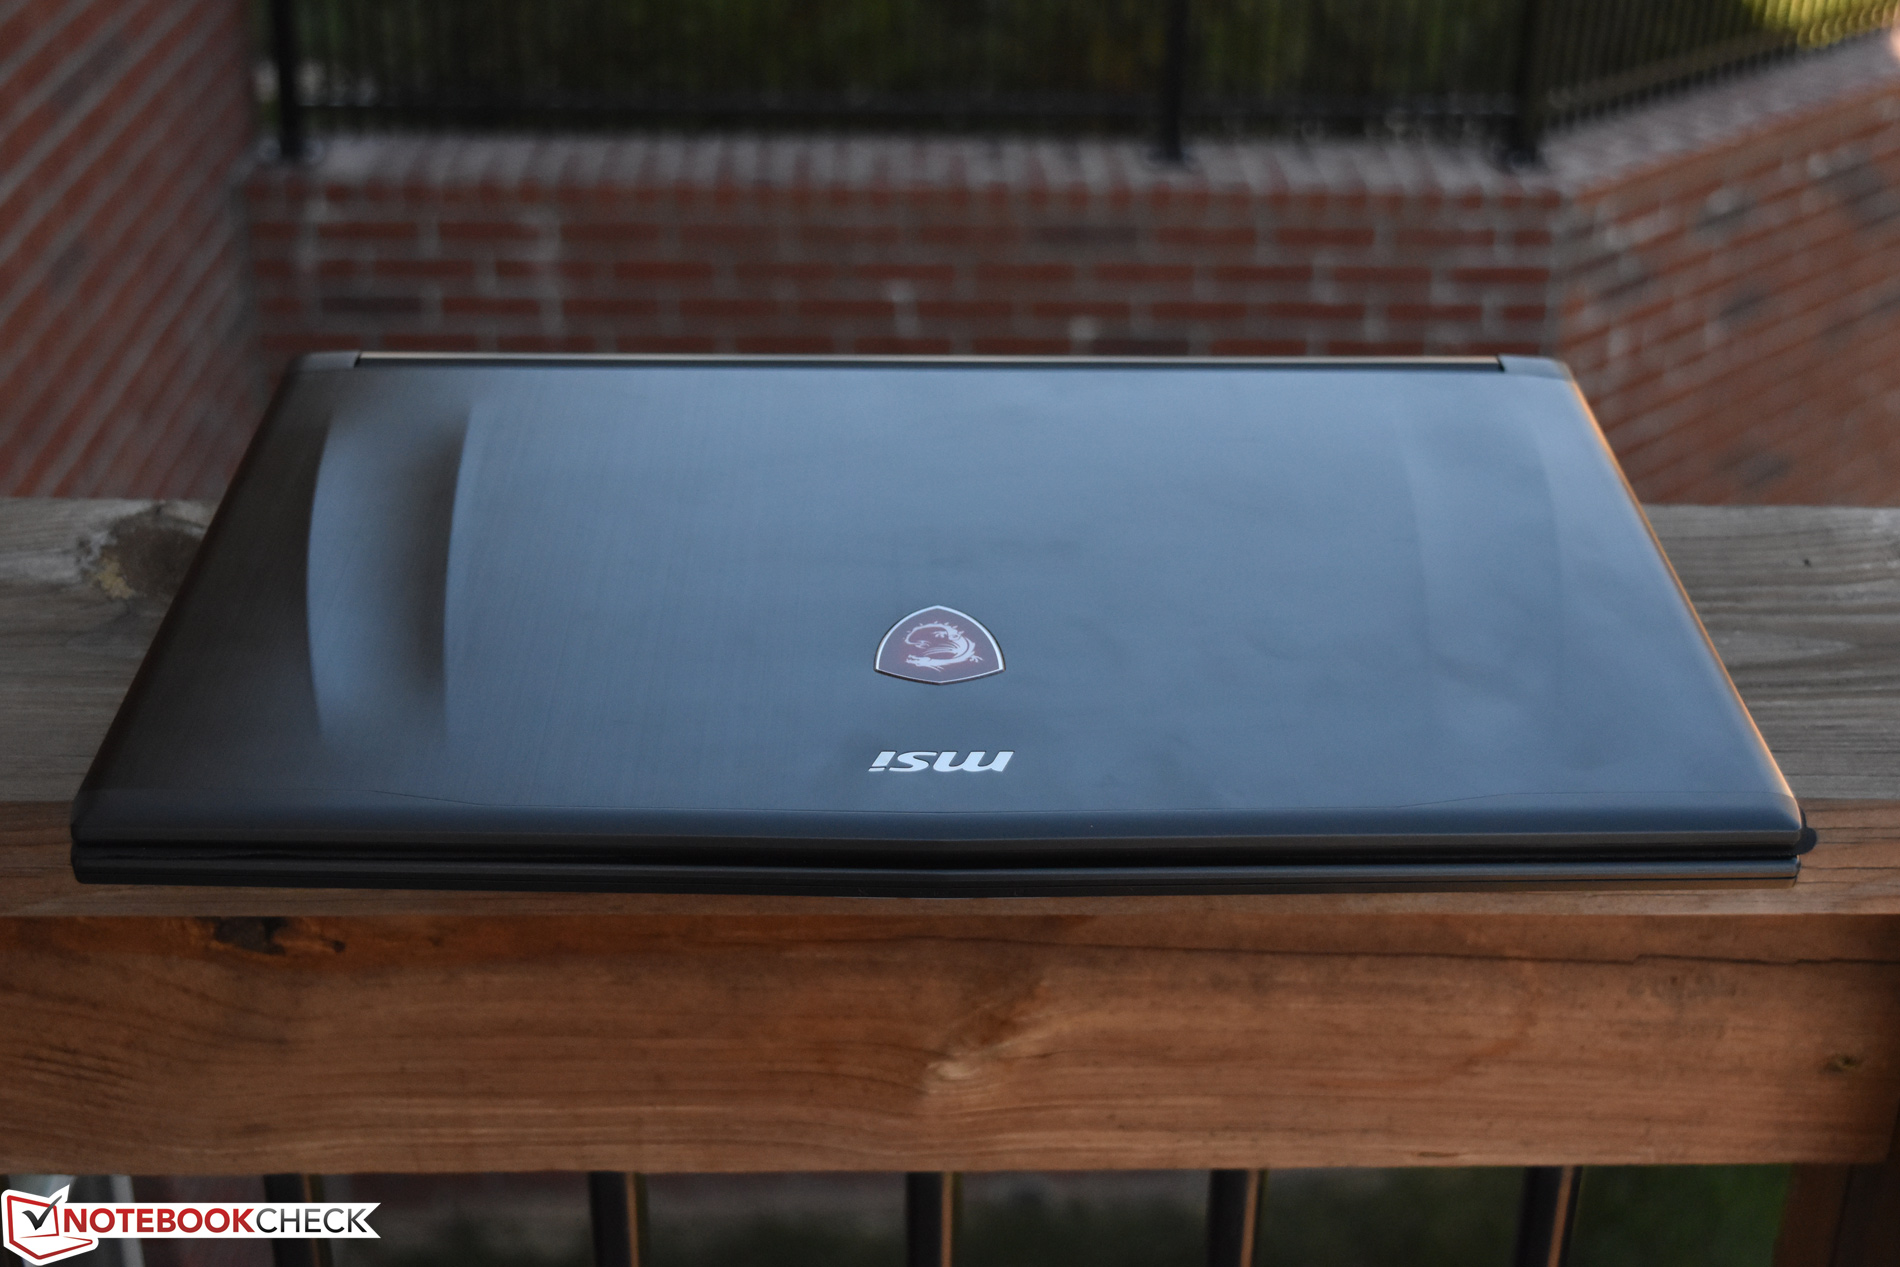
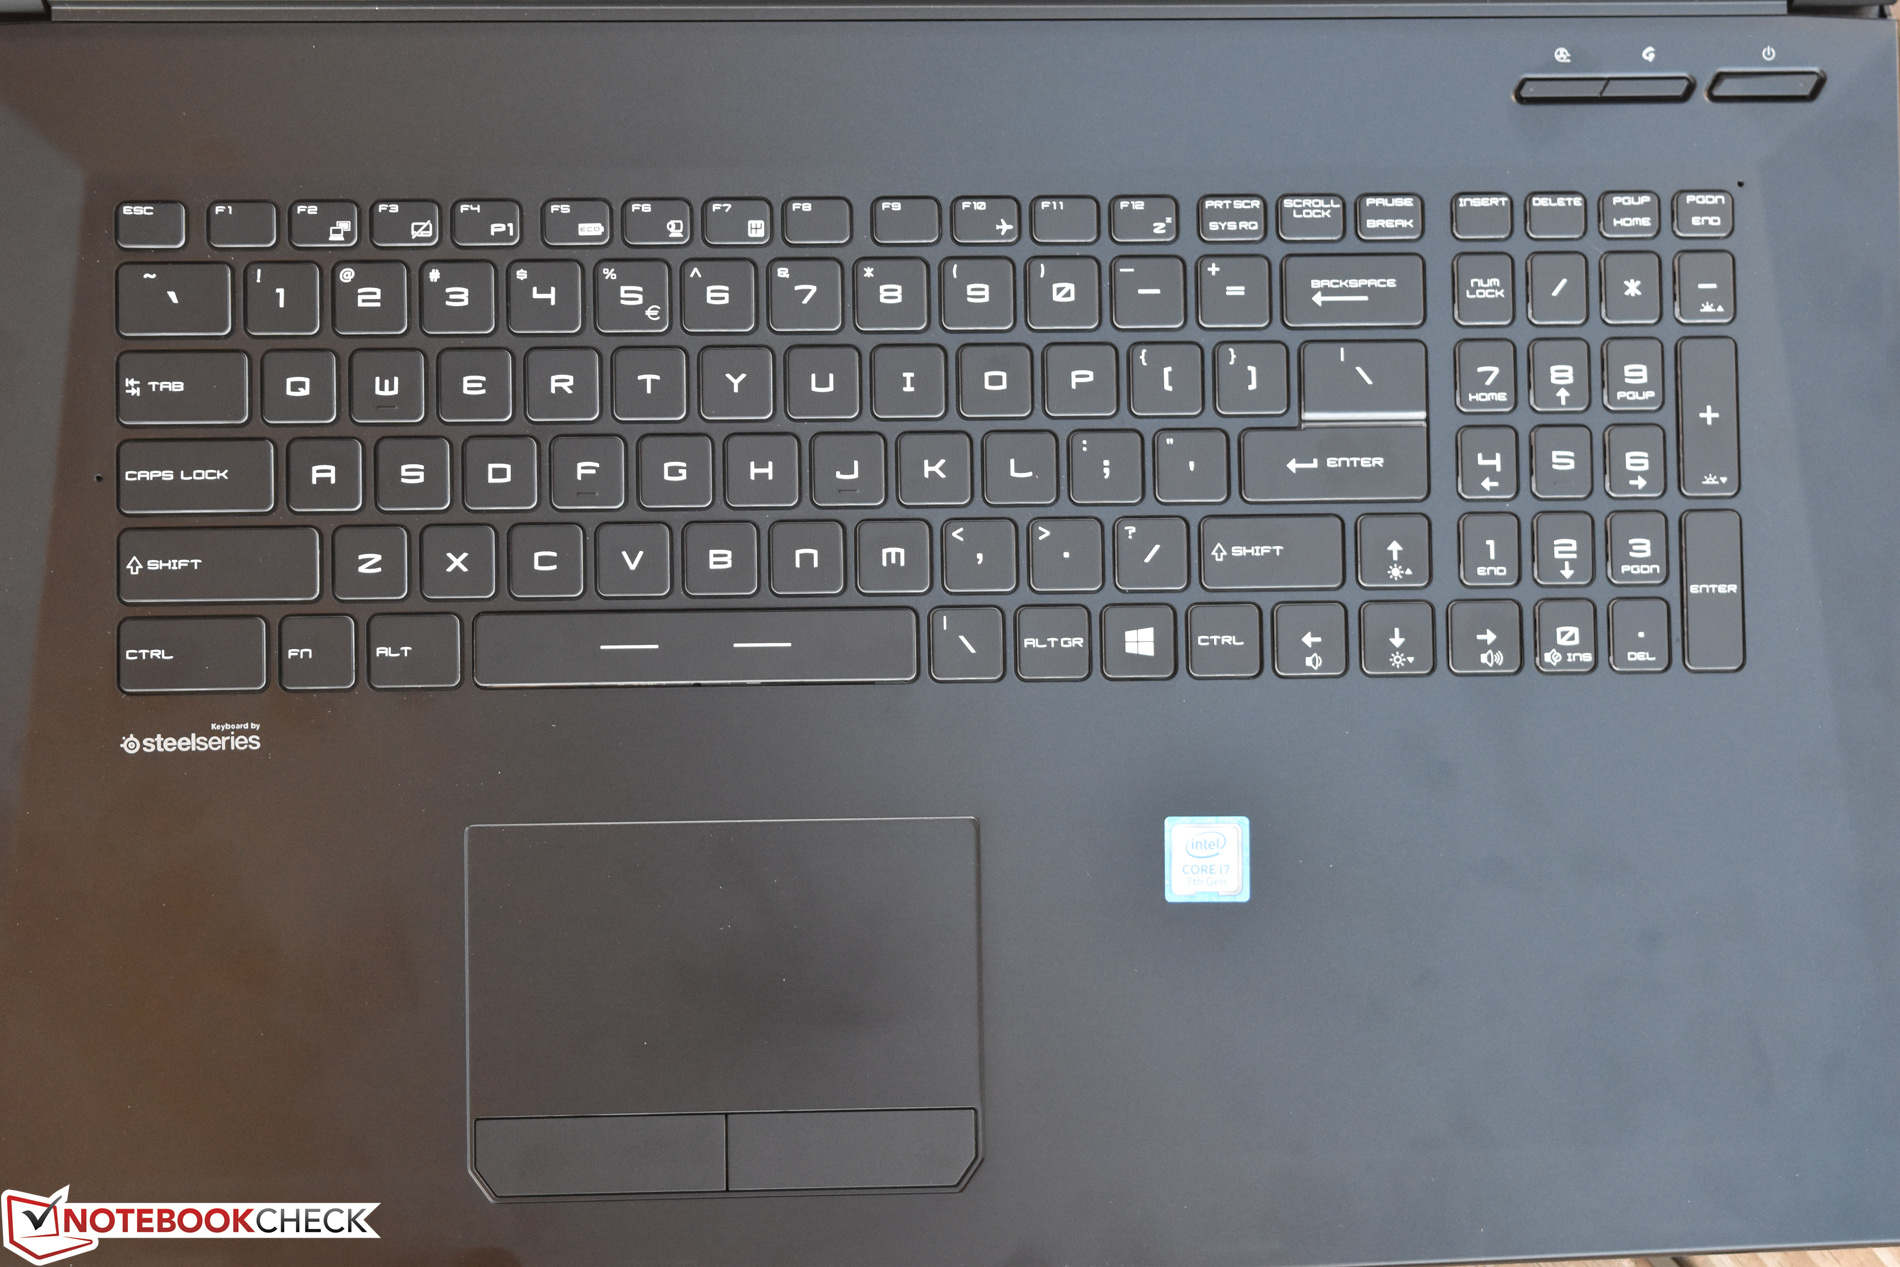
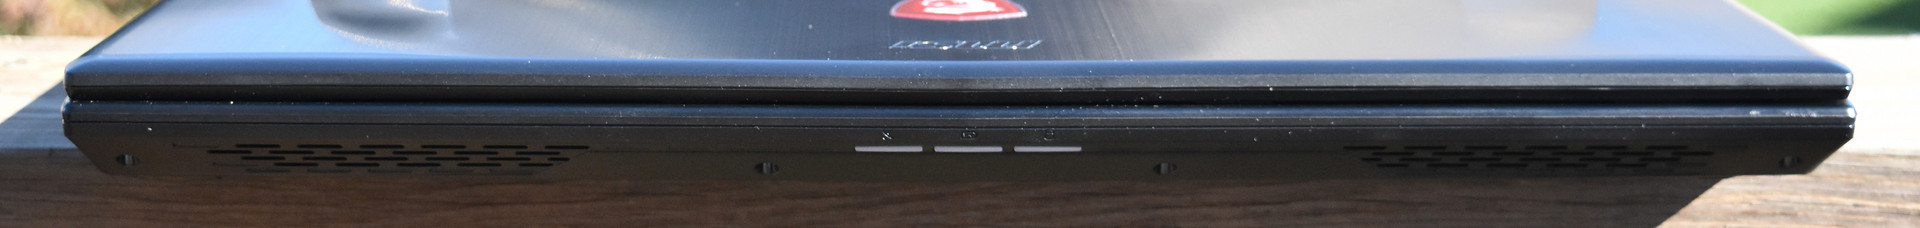
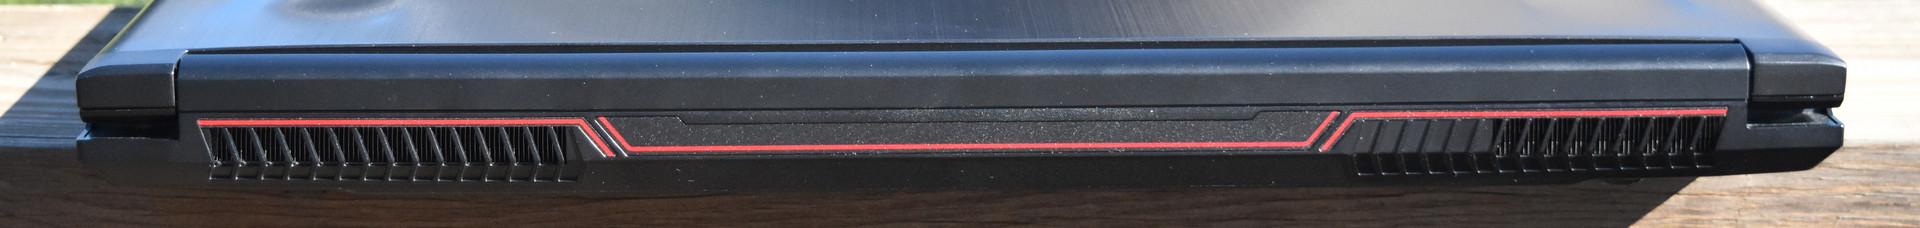
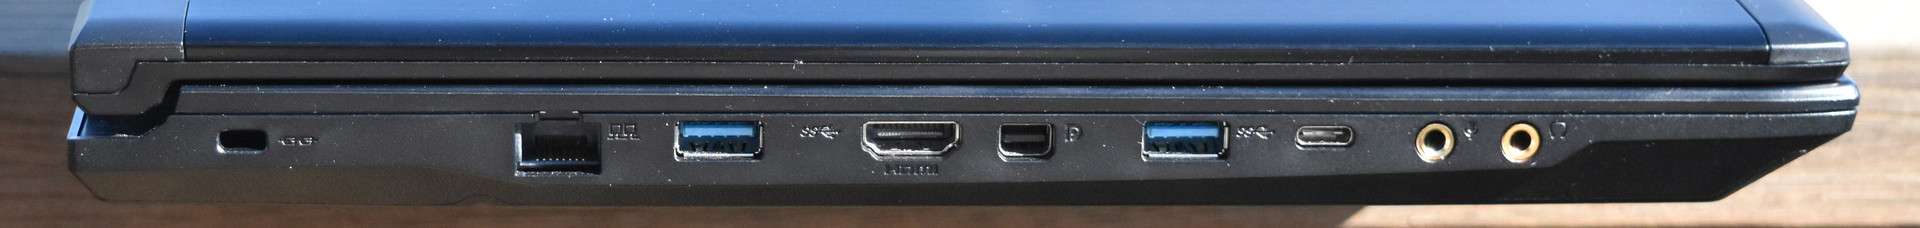
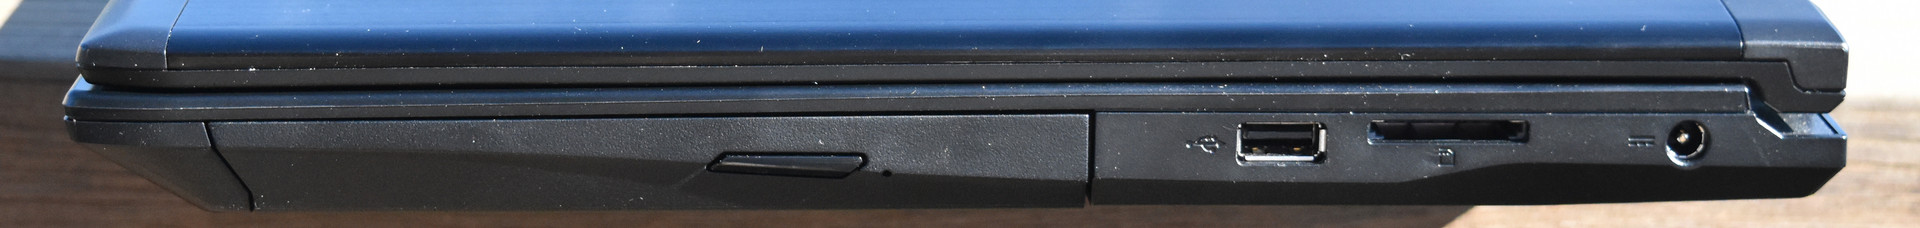
Med GP72VR Leopard Pro får vi en annan stor-skärmad spellaptop från MSI, tillsammans med alla dom typiskt grundläggande saker vi kommit att förvänta oss: ett (utmärkt) SteelSeries RGB-bakgrundsbelyst tangentbord, praktisk och mångsidig systemhanteringsmjukvara, tillräckligt stabil svart plastkonstruktion och - viktigast - bra spelprestanda för inträdespriset. Den erbjuder också super-snabb NVMe-lagringshastighet, en utmärkt 120 Hz skärm och dugligt bra fyra-högtalarsljud.
Den ~13 000 kronors ($1.600) MSI GP72VR Leopard Pro får jobbet gjort och matchar sina jämlikar i fråga om prestanda och täcker upp det mesta som spelare letar efter i en pålitlig enhet.
Men på toppen av allt detta har GP72VR också en överraskning i rockärmen: den är förvånansvärt lättviktig för sin klass. På bara 2.836 kg är den ännu lättare än Acer Predator Helios 300. Så långt som 17.3-tumsmaskiner går så är den här så skaplig i fråga om vikt och storlek som vi kan förvänta oss.
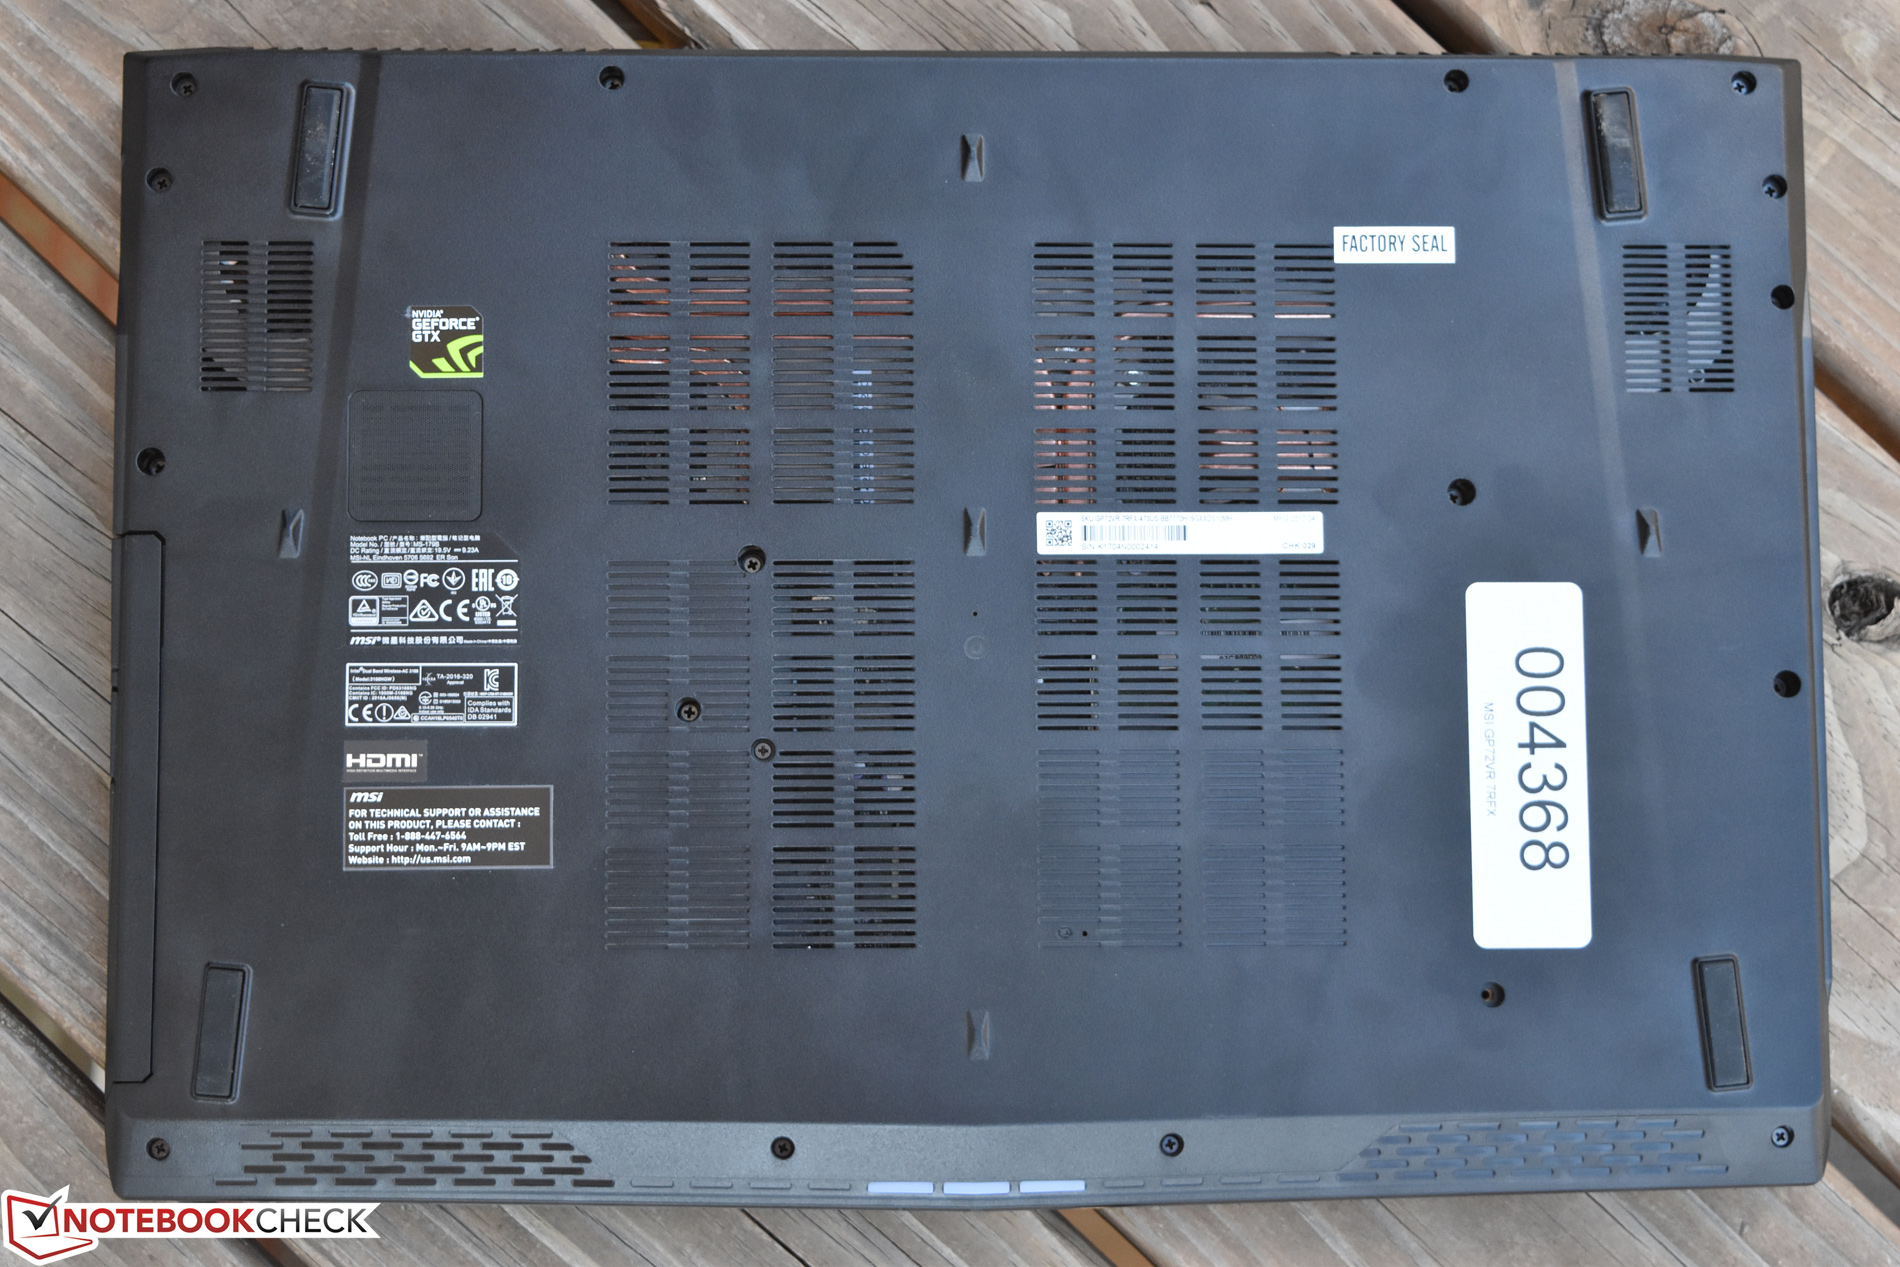
Den minskade vikten kommer dock med en uppoffring: batteritiden från det interna batteriet på 41 Wh är bland det kortaste bland moderna spel-laptops. Det är som tur är av begränsad vikt för dom flesta gamers, som antagligen kommer att värdera den minskade vikten och storleken framför förlusten av lite batteritid när datorn inte är ansluten. Bortsett från det så råkade vi också på några olyckliga problem som uppstod vid våra försök att ta isär datorn. (Problem bortsett från dom vanliga garantiklistermärkes-bekymren) — så dom som tänker sig att köpa och uppgradera senare kan vilja lyssna på varningen: antingen så förlorade vi tillverknings-lotteriet med vår testenhet eller så kommer dom som försöker ta bort bottenpanelen att finna det en nervpåfrestande upplevelse. Till slut, fördelningen av värme under belastning är också suboptimal för att uttrycka det milt, mycket av värmen sprider sig till toppen av skalet och kommer ut ur mitten av tangentbordet och styrplattan.
Det bästa alternativet till den här maskinen skulle vara Acer Predator Helios 300, som är lättare att montera ned och uppgradera, men som också ger några färre portar och en vanlig 60 Hz-skärm. Trots kritiken får ~13 000 kronors ($1.600) MSI GP72VR Leopard Pro jobbet gjort och matchar sina jämlikar i fråga om prestanda och täcker upp det mesta som spelare letar efter i en pålitlig enhet.
MSI GP72VR 7RFX
- 10/11/2017 v6 (old)
Steve Schardein
Price comparison
