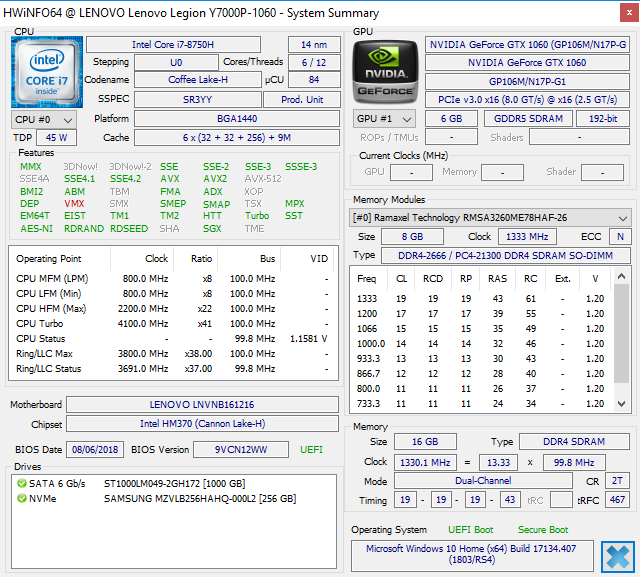
Test: Lenovo Legion Y7000 (i7-8750H, GTX 1060) Laptop (Sammanfattning)
| Networking | |
| iperf3 transmit AX12 | |
| Lenovo Legion Y7000P-1060 | |
| Lenovo Legion Y530-15ICH | |
| HP Pavilion Gaming 15t-cx0000 | |
| Dell XPS 15 9570 i7 UHD | |
| iperf3 receive AX12 | |
| HP Pavilion Gaming 15t-cx0000 | |
| Lenovo Legion Y530-15ICH | |
| Lenovo Legion Y7000P-1060 | |
| Dell XPS 15 9570 i7 UHD | |
| |||||||||||||||||||||||||
Distribution av ljusstyrkan: 88 %
Mitt på batteriet: 312.9 cd/m²
Kontrast: 846:1 (Svärta: 0.37 cd/m²)
ΔE ColorChecker Calman: 5.49 | ∀{0.5-29.43 Ø4.72}
calibrated: 3.99
ΔE Greyscale Calman: 4.7 | ∀{0.09-98 Ø4.97}
86.1% sRGB (Argyll 1.6.3 3D)
56.3% AdobeRGB 1998 (Argyll 1.6.3 3D)
63.1% AdobeRGB 1998 (Argyll 3D)
86.4% sRGB (Argyll 3D)
66.1% Display P3 (Argyll 3D)
Gamma: 2.29
CCT: 6779 K
| Lenovo Legion Y7000P-1060 BOE NV156FHM-N61, IPS, 15.6", 1920x1080 | Dell XPS 15 2018 i5 FHD 97Wh Sharp SHP149A LQ156M1, LED IGZO IPS InfinityEdge, 15.6", 1920x1080 | MSI GF63 8RC AU Optronics B156HAN02.1, IPS, 15.6", 1920x1080 | HP Pavilion Gaming 15t-cx0000 AU Optronics AUO82ED, IPS, 15.6", 1920x1080 | Lenovo Legion Y530-15ICH B156HAN02.1, IPS, 15.6", 1920x1080 | Dell G7 15-7588 LG Philips LGD053F, IPS, 15.6", 1920x1080 | |
|---|---|---|---|---|---|---|
| Display | 6% | -35% | 4% | -38% | -39% | |
| Display P3 Coverage (%) | 66.1 | 66 0% | 39.43 -40% | 66.5 1% | 38.31 -42% | 37.82 -43% |
| sRGB Coverage (%) | 86.4 | 96.5 12% | 59.3 -31% | 91.7 6% | 57.3 -34% | 56.2 -35% |
| AdobeRGB 1998 Coverage (%) | 63.1 | 66.7 6% | 40.73 -35% | 67.1 6% | 39.58 -37% | 39.2 -38% |
| Response Times | 2% | 23% | 64% | 4% | 18% | |
| Response Time Grey 50% / Grey 80% * (ms) | 42.8 ? | 49 ? -14% | 33.2 ? 22% | 17.6 ? 59% | 43.6 ? -2% | 38.8 ? 9% |
| Response Time Black / White * (ms) | 36 ? | 30 ? 17% | 27.2 ? 24% | 11.2 ? 69% | 32.4 ? 10% | 26.8 ? 26% |
| PWM Frequency (Hz) | 21740 ? | 961 ? | ||||
| Screen | 33% | -17% | 14% | -18% | -39% | |
| Brightness middle (cd/m²) | 312.9 | 413 32% | 266.6 -15% | 357.5 14% | 282.8 -10% | 250.9 -20% |
| Brightness (cd/m²) | 296 | 378 28% | 257 -13% | 351 19% | 264 -11% | 246 -17% |
| Brightness Distribution (%) | 88 | 86 -2% | 89 1% | 85 -3% | 88 0% | 89 1% |
| Black Level * (cd/m²) | 0.37 | 0.29 22% | 0.29 22% | 0.36 3% | 0.42 -14% | 0.34 8% |
| Contrast (:1) | 846 | 1424 68% | 919 9% | 993 17% | 673 -20% | 738 -13% |
| Colorchecker dE 2000 * | 5.49 | 2.44 56% | 5.93 -8% | 4.19 24% | 4.93 10% | 7.34 -34% |
| Colorchecker dE 2000 max. * | 8.78 | 4.46 49% | 16.28 -85% | 6.97 21% | 17.65 -101% | 28.66 -226% |
| Colorchecker dE 2000 calibrated * | 3.99 | 2.48 38% | 3.6 10% | 3.2 20% | 4.07 -2% | 4.42 -11% |
| Greyscale dE 2000 * | 4.7 | 2.48 47% | 6.8 -45% | 3.5 26% | 3.8 19% | 6.8 -45% |
| Gamma | 2.29 96% | 2.43 91% | 2.43 91% | 2.324 95% | 2.449 90% | 2.164 102% |
| CCT | 6779 96% | 7006 93% | 7192 90% | 7028 92% | 6112 106% | 6780 96% |
| Color Space (Percent of AdobeRGB 1998) (%) | 56.3 | 62 10% | 37.6 -33% | 60 7% | 36 -36% | 36 -36% |
| Color Space (Percent of sRGB) (%) | 86.1 | 96 11% | 59.3 -31% | 91 6% | 57 -34% | 56 -35% |
| Totalt genomsnitt (program/inställningar) | 14% /
24% | -10% /
-16% | 27% /
18% | -17% /
-19% | -20% /
-32% |
* ... mindre är bättre
Visa svarstider
| ↔ Svarstid svart till vitt | ||
|---|---|---|
| 36 ms ... stiga ↗ och falla ↘ kombinerat | ↗ 19.6 ms stiga | 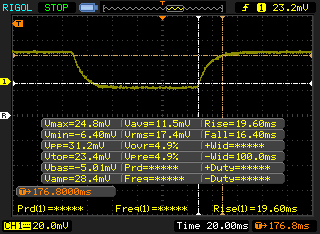 |
| ↘ 16.4 ms hösten | ||
| Skärmen visar långsamma svarsfrekvenser i våra tester och kommer att vara otillfredsställande för spelare. I jämförelse sträcker sig alla testade enheter från 0.1 (minst) till 240 (maximalt) ms. » 94 % av alla enheter är bättre. Detta innebär att den uppmätta svarstiden är sämre än genomsnittet av alla testade enheter (19.8 ms). | ||
| ↔ Svarstid 50 % grått till 80 % grått | ||
| 42.8 ms ... stiga ↗ och falla ↘ kombinerat | ↗ 22.4 ms stiga | 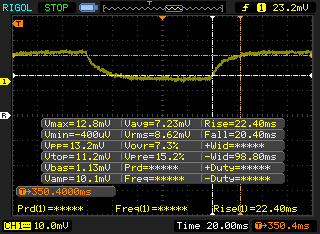 |
| ↘ 20.4 ms hösten | ||
| Skärmen visar långsamma svarsfrekvenser i våra tester och kommer att vara otillfredsställande för spelare. I jämförelse sträcker sig alla testade enheter från 0.165 (minst) till 636 (maximalt) ms. » 70 % av alla enheter är bättre. Detta innebär att den uppmätta svarstiden är sämre än genomsnittet av alla testade enheter (31 ms). | ||
Skärmflimmer / PWM (Puls-Width Modulation)
| Skärmflimmer / PWM upptäckt | 21740 Hz | ≤ 99 % ljusstyrka inställning | 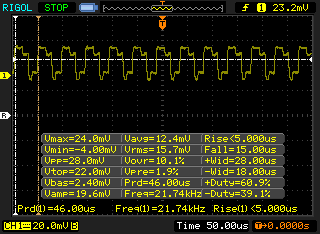 |
Displayens bakgrundsbelysning flimrar vid 21740 Hz (i värsta fall, t.ex. med PWM) Flimrande upptäckt vid en ljusstyrkeinställning på 99 % och lägre. Det ska inte finnas något flimmer eller PWM över denna ljusstyrkeinställning. Frekvensen för 21740 Hz är ganska hög, så de flesta användare som är känsliga för PWM bör inte märka något flimmer. Som jämförelse: 52 % av alla testade enheter använder inte PWM för att dämpa skärmen. Om PWM upptäcktes mättes ett medelvärde av 7772 (minst: 5 - maximum: 343500) Hz. | |||
| PCMark 8 Home Score Accelerated v2 | 4403 poäng | |
| PCMark 8 Work Score Accelerated v2 | 5282 poäng | |
| PCMark 10 Score | 5250 poäng | |
Hjälp | ||
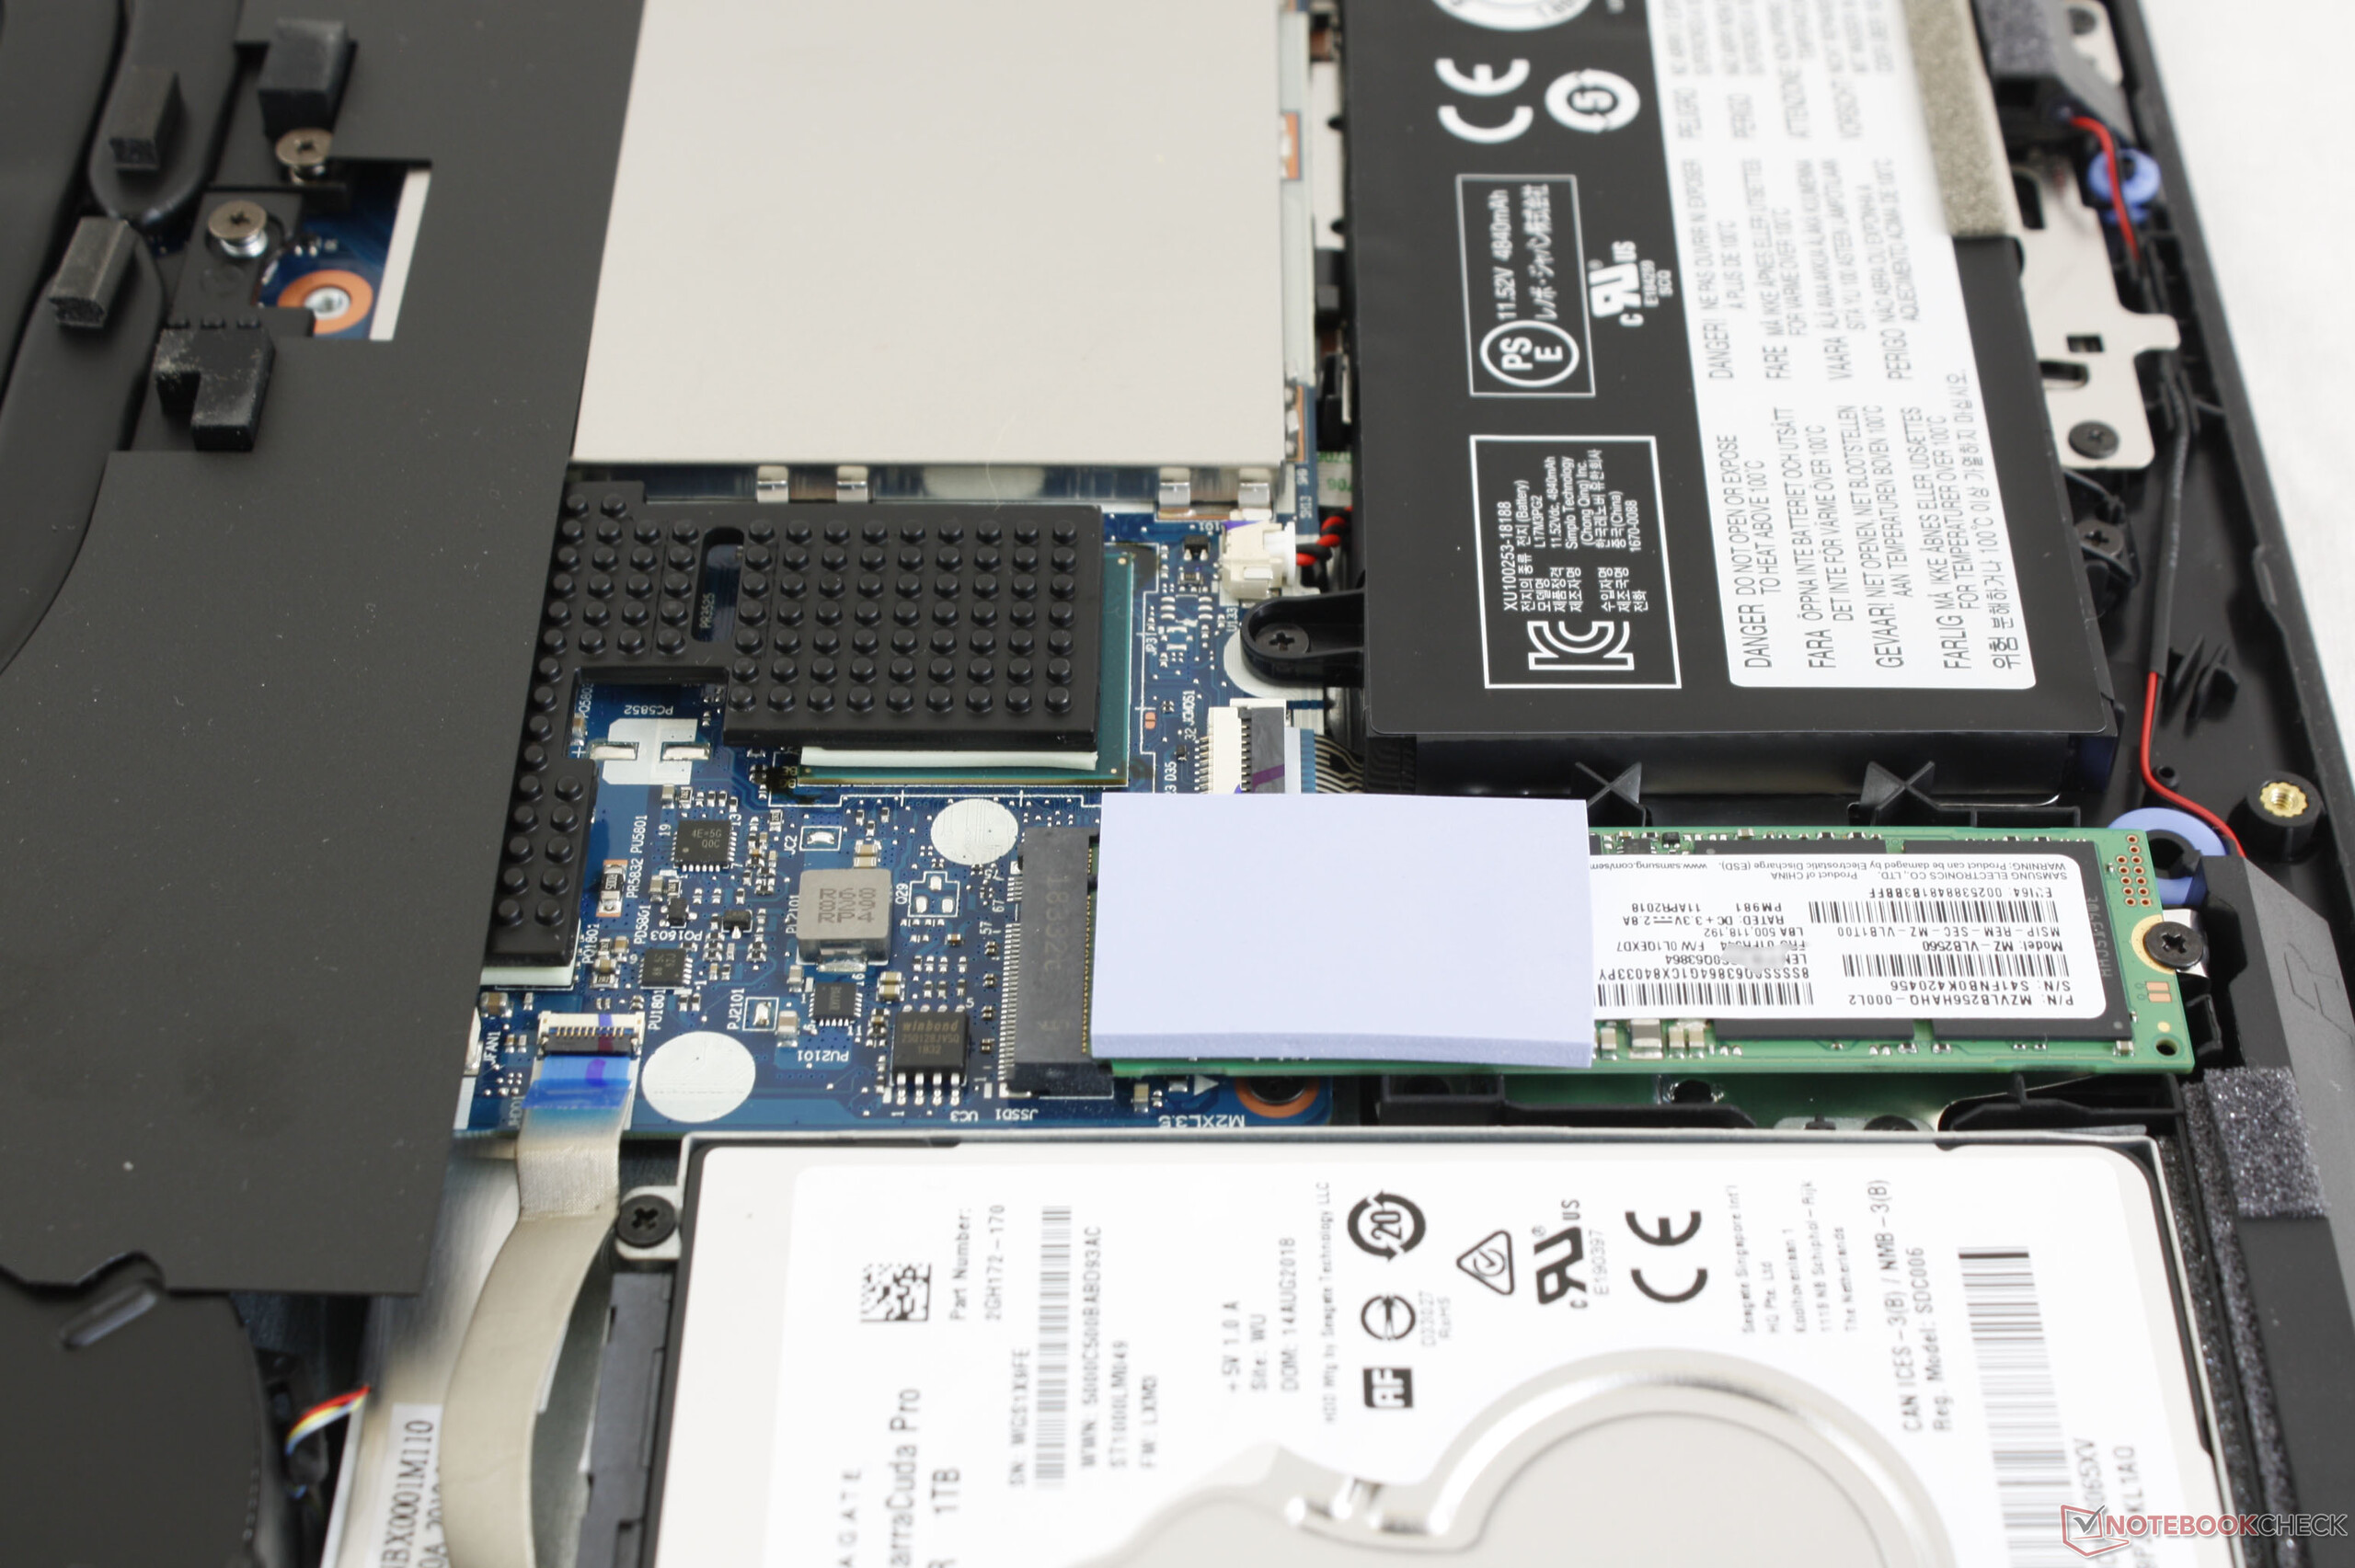
| Lenovo Legion Y7000P-1060 Samsung SSD PM981 MZVLB256HAHQ | HP Pavilion Gaming 15t-cx0000 Samsung SSD PM981 MZVLB512HAJQ | Lenovo Legion Y530-15ICH Toshiba KBG30ZMT128G | Asus Zephyrus S GX531GS WDC PC SN520 SDAPNUW-512G | Eurocom Sky X4C Samsung SSD 960 Pro 1TB m.2 NVMe | |
|---|---|---|---|---|---|
| AS SSD | 30% | -137% | 7% | 46% | |
| Seq Read (MB/s) | 864 | 1235 43% | 1231 42% | 903 5% | 2541 194% |
| Seq Write (MB/s) | 1646 | 1829 11% | 131.6 -92% | 1261 -23% | 1989 21% |
| 4K Read (MB/s) | 32.4 | 35.03 8% | 38.71 19% | 40.02 24% | 44.83 38% |
| 4K Write (MB/s) | 88 | 95.9 9% | 35.74 -59% | 103.6 18% | 129.6 47% |
| 4K-64 Read (MB/s) | 770 | 1160 51% | 335.3 -56% | 1030 34% | 1646 114% |
| 4K-64 Write (MB/s) | 1392 | 1808 30% | 78.9 -94% | 1285 -8% | 1375 -1% |
| Access Time Read * (ms) | 0.103 | 0.051 50% | 0.626 -508% | 0.129 -25% | 0.032 69% |
| Access Time Write * (ms) | 0.044 | 0.038 14% | 0.287 -552% | 0.036 18% | 0.03 32% |
| Score Read (Points) | 888 | 1319 49% | 497 -44% | 1161 31% | 1945 119% |
| Score Write (Points) | 1644 | 2087 27% | 128 -92% | 1515 -8% | 1703 4% |
| Score Total (Points) | 3032 | 4113 36% | 838 -72% | 3294 9% | 4615 52% |
| Copy ISO MB/s (MB/s) | 1677 | 1908 14% | |||
| Copy Program MB/s (MB/s) | 764 | 467.2 -39% | |||
| Copy Game MB/s (MB/s) | 1298 | 1055 -19% | |||
| CrystalDiskMark 5.2 / 6 | 31% | -39% | 0% | 55% | |
| Write 4K (MB/s) | 92.3 | 129.5 40% | 71.8 -22% | 98.2 6% | 158.6 72% |
| Read 4K (MB/s) | 39.04 | 44.61 14% | 41.03 5% | 39.43 1% | 55.2 41% |
| Write Seq (MB/s) | 1218 | 1268 4% | 349 -71% | 1386 14% | 1568 29% |
| Read Seq (MB/s) | 755 | 992 31% | 736 -3% | 1100 46% | 1411 87% |
| Write 4K Q32T1 (MB/s) | 280.7 | 535 91% | 105.3 -62% | 270.3 -4% | 545 94% |
| Read 4K Q32T1 (MB/s) | 328 | 601 83% | 308 -6% | 340.3 4% | 661 102% |
| Write Seq Q32T1 (MB/s) | 1698 | 1938 14% | 151.4 -91% | 1454 -14% | 2054 21% |
| Read Seq Q32T1 (MB/s) | 3430 | 2306 -33% | 1262 -63% | 1681 -51% | 3155 -8% |
| Totalt genomsnitt (program/inställningar) | 31% /
30% | -88% /
-96% | 4% /
4% | 51% /
49% |
* ... mindre är bättre

| 3DMark | |
| 1920x1080 Fire Strike Graphics | |
| Eurocom Sky X4C | |
| Nvidia GeForce GTX 1060 Founders Edition 6 GB | |
| Lenovo Legion Y7000P-1060 | |
| Genomsnitt NVIDIA GeForce GTX 1060 Mobile (10708 - 12298, n=77) | |
| Dell G7 15-7588 | |
| Lenovo IdeaPad Y900 | |
| Lenovo Legion Y530-15ICH | |
| Dell XPS 15 9570 i7 UHD | |
| Lenovo Ideapad 720S-15IKB 81AC001AGE | |
| Dell XPS 15 2018 i5 FHD 97Wh | |
| Lenovo Legion Y520-15IKBA-80WY001VGE | |
| Lenovo Ideapad Y700 17ISK 80Q0 | |
| 2560x1440 Time Spy Graphics | |
| Genomsnitt NVIDIA GeForce GTX 1060 Mobile (3396 - 3790, n=20) | |
| Dell XPS 15 9570 i7 UHD | |
| 3DMark 11 Performance | 13743 poäng | |
| 3DMark Cloud Gate Standard Score | 33931 poäng | |
| 3DMark Fire Strike Score | 10343 poäng | |
Hjälp | ||
| The Witcher 3 - 1920x1080 Ultra Graphics & Postprocessing (HBAO+) | |
| Asus Zephyrus S GX531GS | |
| Nvidia GeForce GTX 1060 Founders Edition 6 GB | |
| MSI GS65 Stealth Thin 8RE-051US | |
| Lenovo Legion Y7000P-1060 | |
| Asus G752VY-GC110T | |
| Medion Erazer P6705-MD61131 | |
| låg | med. | hög | ultra | |
|---|---|---|---|---|
| BioShock Infinite (2013) | 277.1 | 244 | 224.2 | 111.7 |
| The Witcher 3 (2015) | 194.7 | 130.4 | 73.1 | 37 |
| Rise of the Tomb Raider (2016) | 164.1 | 131.4 | 75.2 | 61.4 |
| Lenovo Legion Y7000P-1060 GeForce GTX 1060 Mobile, i7-8750H, Samsung SSD PM981 MZVLB256HAHQ | Asus Zephyrus S GX531GS GeForce GTX 1070 Max-Q, i7-8750H, WDC PC SN520 SDAPNUW-512G | MSI GS65 Stealth Thin 8RE-051US GeForce GTX 1060 Mobile, i7-8750H, Samsung SSD PM981 MZVLB256HAHQ | Lenovo Legion Y530-15ICH GeForce GTX 1050 Ti Mobile, i5-8300H, Toshiba KBG30ZMT128G | Dell G7 15-7588 GeForce GTX 1060 Max-Q, i7-8750H, SK hynix SC311 SATA | |
|---|---|---|---|---|---|
| Noise | -10% | 4% | 9% | 2% | |
| av / miljö * (dB) | 28.4 | 29 -2% | 28.4 -0% | 28 1% | 28.1 1% |
| Idle Minimum * (dB) | 31.1 | 33 -6% | 28.4 9% | 28 10% | 29 7% |
| Idle Average * (dB) | 31.1 | 34 -9% | 28.4 9% | 28 10% | 29 7% |
| Idle Maximum * (dB) | 31.2 | 40 -28% | 29.6 5% | 28.5 9% | 29.2 6% |
| Load Average * (dB) | 43.2 | 47 -9% | 43.5 -1% | 34.9 19% | 40.6 6% |
| Witcher 3 ultra * (dB) | 45.3 | 51 -13% | 45.7 -1% | 40 12% | 49.8 -10% |
| Load Maximum * (dB) | 50 | 53 -6% | 45.7 9% | 49.6 1% | 49.8 -0% |
* ... mindre är bättre
Ljudnivå
| Låg belastning |
| 31.1 / 31.1 / 31.2 dB(A) |
| Hårddisk |
| 31.2 dB(A) |
| Hög belastning |
| 43.2 / 50 dB(A) |
 | ||
30 dB tyst 40 dB(A) hörbar 50 dB(A) högt ljud |
||
min: | ||
(-) Den maximala temperaturen på ovansidan är 53.4 °C / 128 F, jämfört med genomsnittet av 40.4 °C / 105 F , allt från 21.2 till 68.8 °C för klassen Gaming.
(-) Botten värms upp till maximalt 51 °C / 124 F, jämfört med genomsnittet av 43.2 °C / 110 F
(+) Vid tomgångsbruk är medeltemperaturen för ovansidan 27.1 °C / 81 F, jämfört med enhetsgenomsnittet på 33.9 °C / ### class_avg_f### F.
(±) När du spelar The Witcher 3 är medeltemperaturen för ovansidan 33.2 °C / 92 F, jämfört med enhetsgenomsnittet på 33.9 °C / ## #class_avg_f### F.
(+) Handledsstöden och pekplattan är kallare än hudtemperaturen med maximalt 31 °C / 87.8 F och är därför svala att ta på.
(-) Medeltemperaturen för handledsstödsområdet på liknande enheter var 28.8 °C / 83.8 F (-2.2 °C / -4 F).
Lenovo Legion Y7000P-1060 ljudanalys
(±) | högtalarljudstyrkan är genomsnittlig men bra (73.2 dB)
Bas 100 - 315 Hz
(±) | reducerad bas - i genomsnitt 8% lägre än medianen
(±) | linjäriteten för basen är genomsnittlig (8.3% delta till föregående frekvens)
Mellan 400 - 2000 Hz
(±) | högre mellan - i genomsnitt 5.5% högre än median
(+) | mids är linjära (6.3% delta till föregående frekvens)
Högsta 2 - 16 kHz
(±) | högre toppar - i genomsnitt 6.1% högre än medianen
(+) | toppar är linjära (6.6% delta till föregående frekvens)
Totalt 100 - 16 000 Hz
(±) | linjäriteten för det totala ljudet är genomsnittlig (20.6% skillnad mot median)
Jämfört med samma klass
» 74% av alla testade enheter i den här klassen var bättre, 5% liknande, 21% sämre
» Den bästa hade ett delta på 6%, genomsnittet var 18%, sämst var 132%
Jämfört med alla testade enheter
» 55% av alla testade enheter var bättre, 8% liknande, 37% sämre
» Den bästa hade ett delta på 4%, genomsnittet var 24%, sämst var 134%
Apple MacBook 12 (Early 2016) 1.1 GHz ljudanalys
(+) | högtalare kan spela relativt högt (83.6 dB)
Bas 100 - 315 Hz
(±) | reducerad bas - i genomsnitt 11.3% lägre än medianen
(±) | linjäriteten för basen är genomsnittlig (14.2% delta till föregående frekvens)
Mellan 400 - 2000 Hz
(+) | balanserad mellan - endast 2.4% från medianen
(+) | mids är linjära (5.5% delta till föregående frekvens)
Högsta 2 - 16 kHz
(+) | balanserade toppar - endast 2% från medianen
(+) | toppar är linjära (4.5% delta till föregående frekvens)
Totalt 100 - 16 000 Hz
(+) | det totala ljudet är linjärt (10.2% skillnad mot median)
Jämfört med samma klass
» 7% av alla testade enheter i den här klassen var bättre, 2% liknande, 91% sämre
» Den bästa hade ett delta på 5%, genomsnittet var 18%, sämst var 53%
Jämfört med alla testade enheter
» 5% av alla testade enheter var bättre, 1% liknande, 94% sämre
» Den bästa hade ett delta på 4%, genomsnittet var 24%, sämst var 134%
| Av/Standby | |
| Låg belastning | |
| Hög belastning |
|
Förklaring:
min: | |
| Lenovo Legion Y7000P-1060 i7-8750H, GeForce GTX 1060 Mobile, Samsung SSD PM981 MZVLB256HAHQ, IPS, 1920x1080, 15.6" | MSI GF63 8RC i5-8300H, GeForce GTX 1050 Mobile, Seagate BarraCuda Pro Compute 1TB ST1000LM049, IPS, 1920x1080, 15.6" | Lenovo Legion Y530-15ICH i5-8300H, GeForce GTX 1050 Ti Mobile, Toshiba KBG30ZMT128G, IPS, 1920x1080, 15.6" | Dell G7 15-7588 i7-8750H, GeForce GTX 1060 Max-Q, SK hynix SC311 SATA, IPS, 1920x1080, 15.6" | Asus Zephyrus S GX531GS i7-8750H, GeForce GTX 1070 Max-Q, WDC PC SN520 SDAPNUW-512G, IPS, 1920x1080, 15.6" | Asus Strix GL502VY-DS71 6700HQ, GeForce GTX 980M, SanDisk SD8SN8U1T001122, IPS, 1920x1080, 15.6" | |
|---|---|---|---|---|---|---|
| Power Consumption | 13% | 10% | 12% | -86% | -110% | |
| Idle Minimum * (Watt) | 4.9 | 5.4 -10% | 4.5 8% | 5.5 -12% | 17 -247% | 20.6 -320% |
| Idle Average * (Watt) | 8.1 | 10.4 -28% | 10 -23% | 7.6 6% | 20 -147% | 22.1 -173% |
| Idle Maximum * (Watt) | 16.5 | 10.5 36% | 13.8 16% | 9 45% | 29 -76% | 22.5 -36% |
| Load Average * (Watt) | 109.2 | 84.7 22% | 92.5 15% | 94 14% | 112 -3% | 130.6 -20% |
| Witcher 3 ultra * (Watt) | 124.6 | 92.7 26% | 108.1 13% | 116.3 7% | 152 -22% | |
| Load Maximum * (Watt) | 175.2 | 119.9 32% | 123.2 30% | 154.4 12% | 211 -20% | 177.2 -1% |
* ... mindre är bättre
| Lenovo Legion Y7000P-1060 i7-8750H, GeForce GTX 1060 Mobile, 57 Wh | MSI GF63 8RC i5-8300H, GeForce GTX 1050 Mobile, 51 Wh | Dell XPS 15 9570 i7 UHD i7-8750H, GeForce GTX 1050 Ti Max-Q, 97 Wh | Lenovo Legion Y530-15ICH i5-8300H, GeForce GTX 1050 Ti Mobile, 52.5 Wh | Dell G7 15-7588 i7-8750H, GeForce GTX 1060 Max-Q, 56 Wh | Asus Zephyrus S GX531GS i7-8750H, GeForce GTX 1070 Max-Q, 50 Wh | |
|---|---|---|---|---|---|---|
| Batteridrifttid | -7% | 65% | -29% | 61% | -47% | |
| Reader / Idle (h) | 13.6 | 9.5 -30% | 10.9 -20% | 3.6 -74% | ||
| WiFi v1.3 (h) | 5.8 | 5.5 -5% | 9.6 66% | 4.1 -29% | 7.5 29% | 2.6 -55% |
| Load (h) | 0.8 | 0.9 13% | 1.3 63% | 2.2 175% | 0.7 -13% | |
| Witcher 3 ultra (h) | 1 |
För
Emot
Läs den fullständiga versionen av den här recensionen på engelska här.
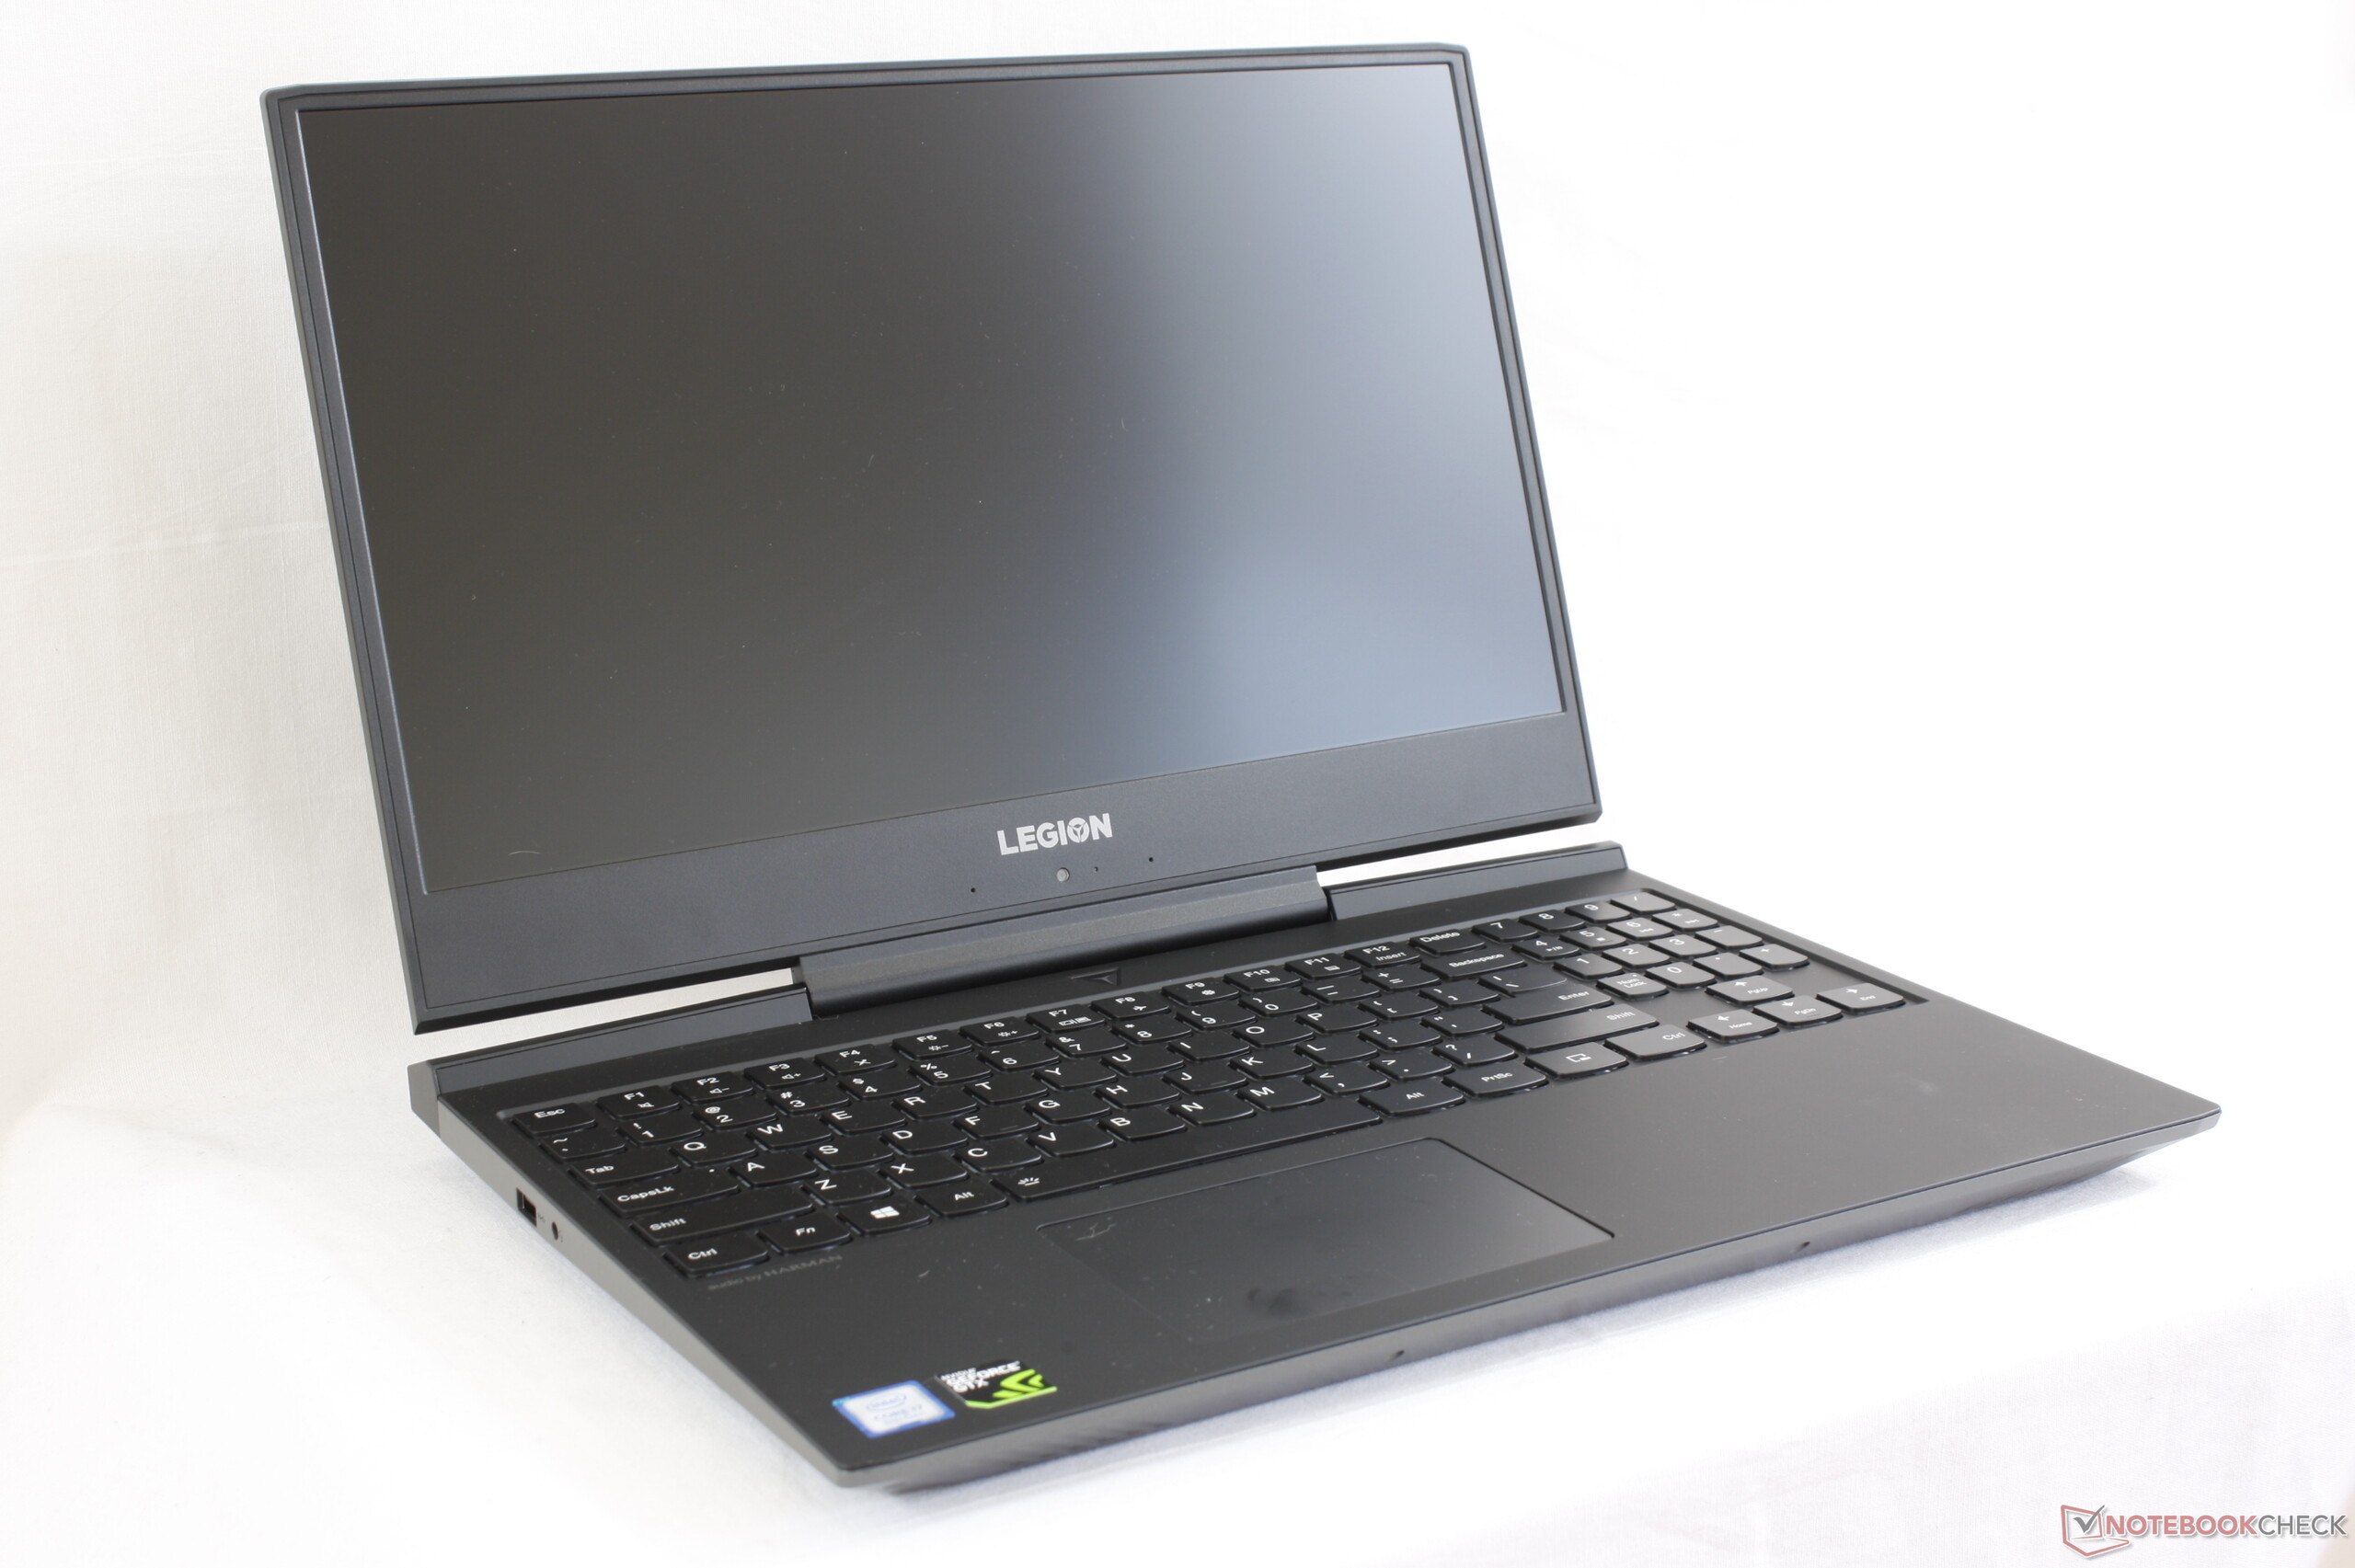
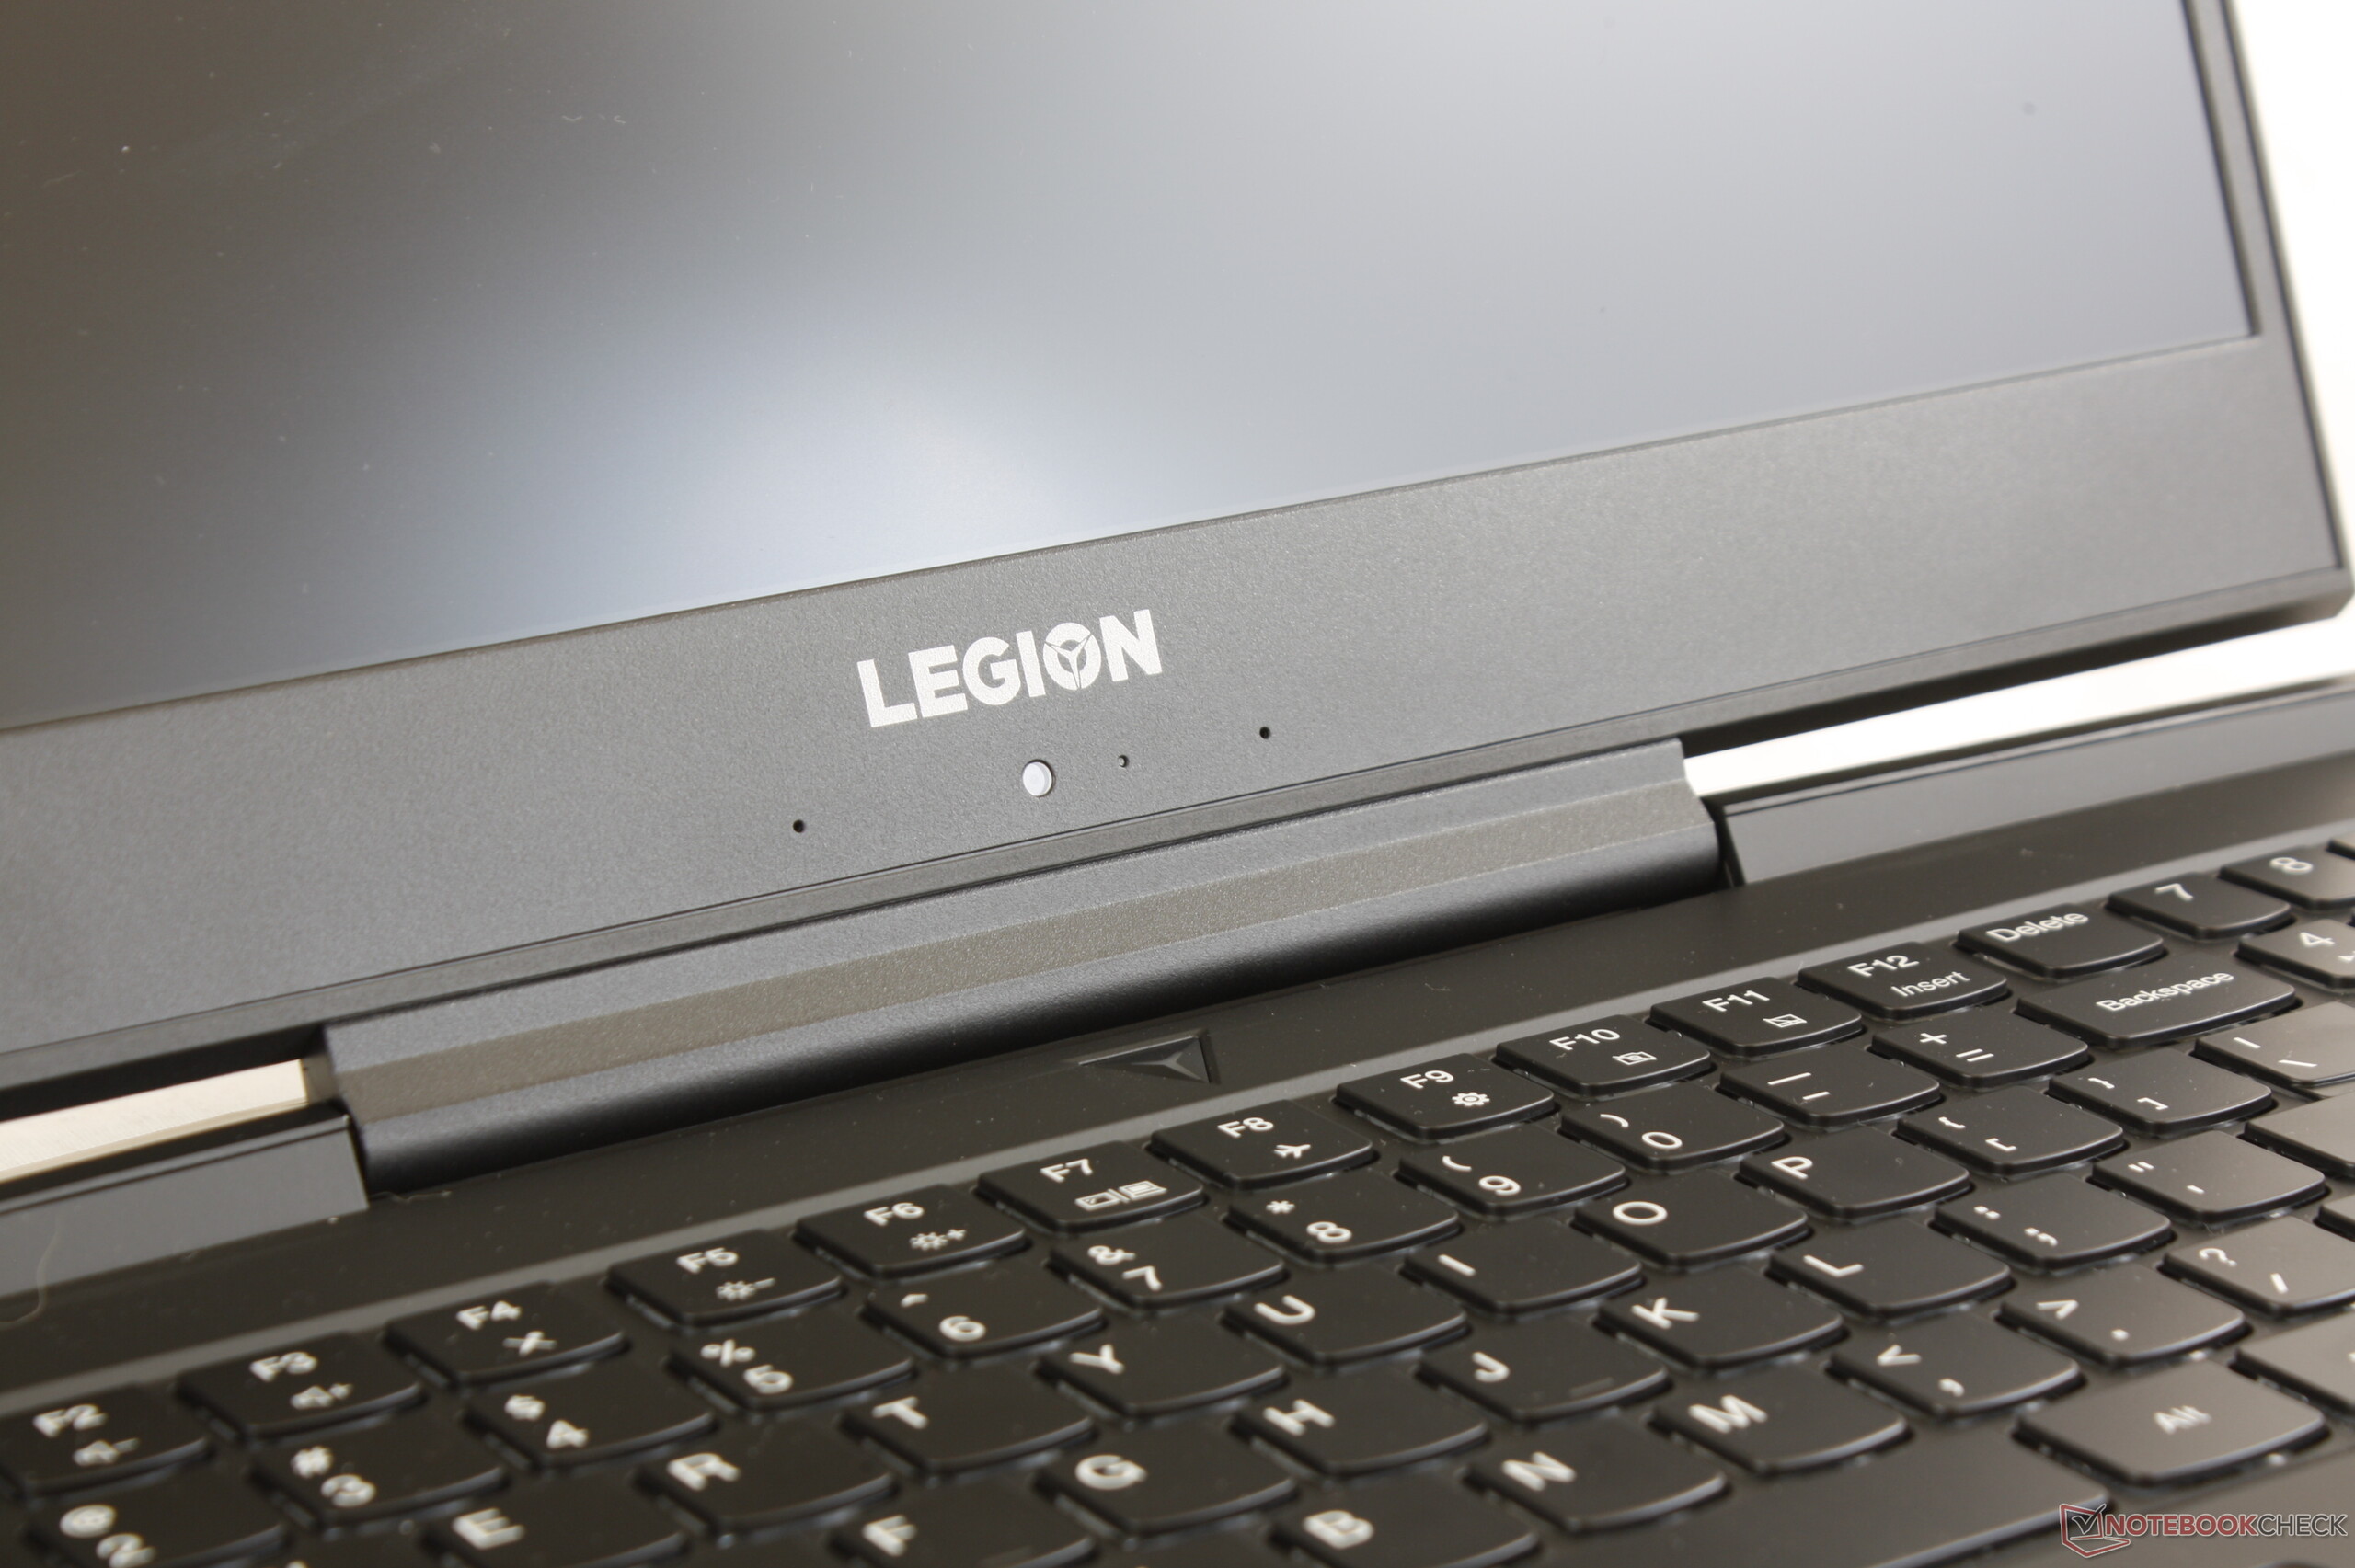
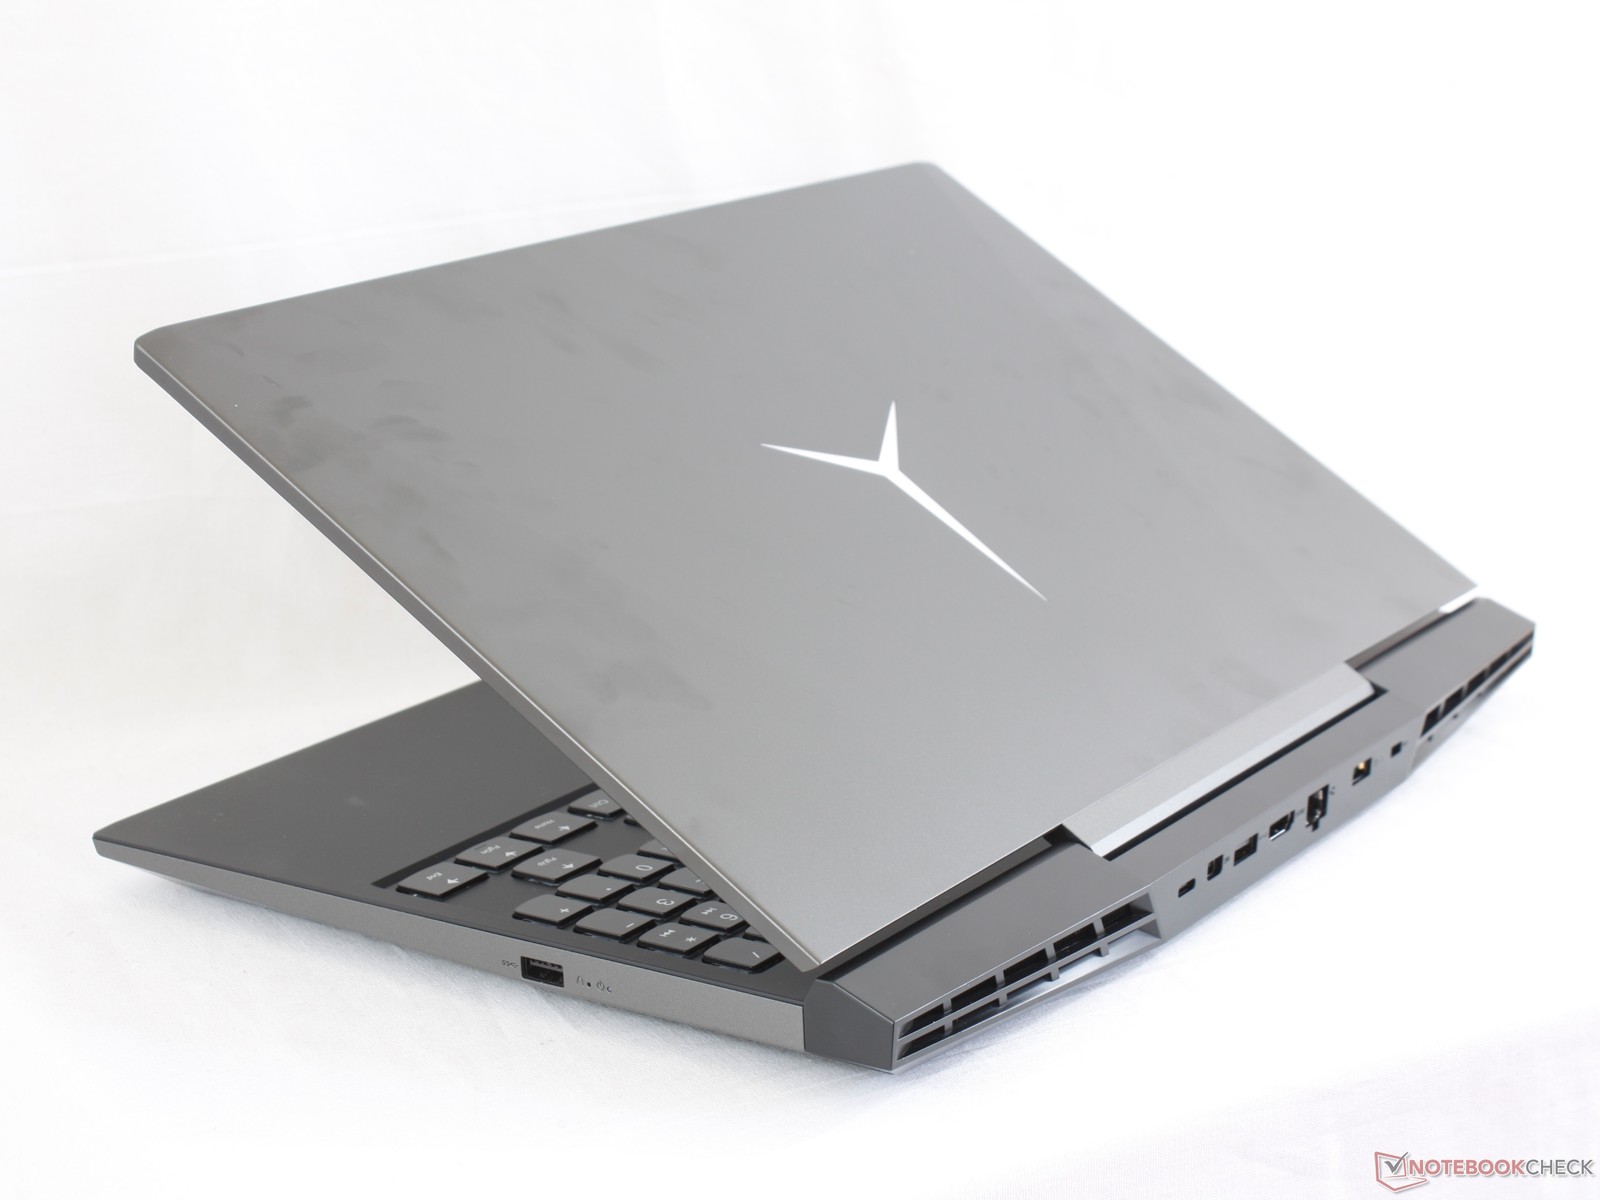
Lenovo Legion Y7000 kan bäst beskrivas som en Asus ROG GL504GM men med färre funktioner och bättre prestanda per krona. Båda systemen har samma CPU och GPU och de är nästan identiska i storlek. Den som väljer att betala mer för Asus-modellen betalar inte nödvändigtvis för mer prestanda utan snarare för en del funktioner som saknas på Lenovo-modellen såsom en SD-kortläsare och RGB-bakgrundsbelysning med flera zoner. Från det perspektivet erbjuder Legion Y7000 fantastisk spelprestanda för tusentals kronor mindre samtidigt som den ser lika vass ut.
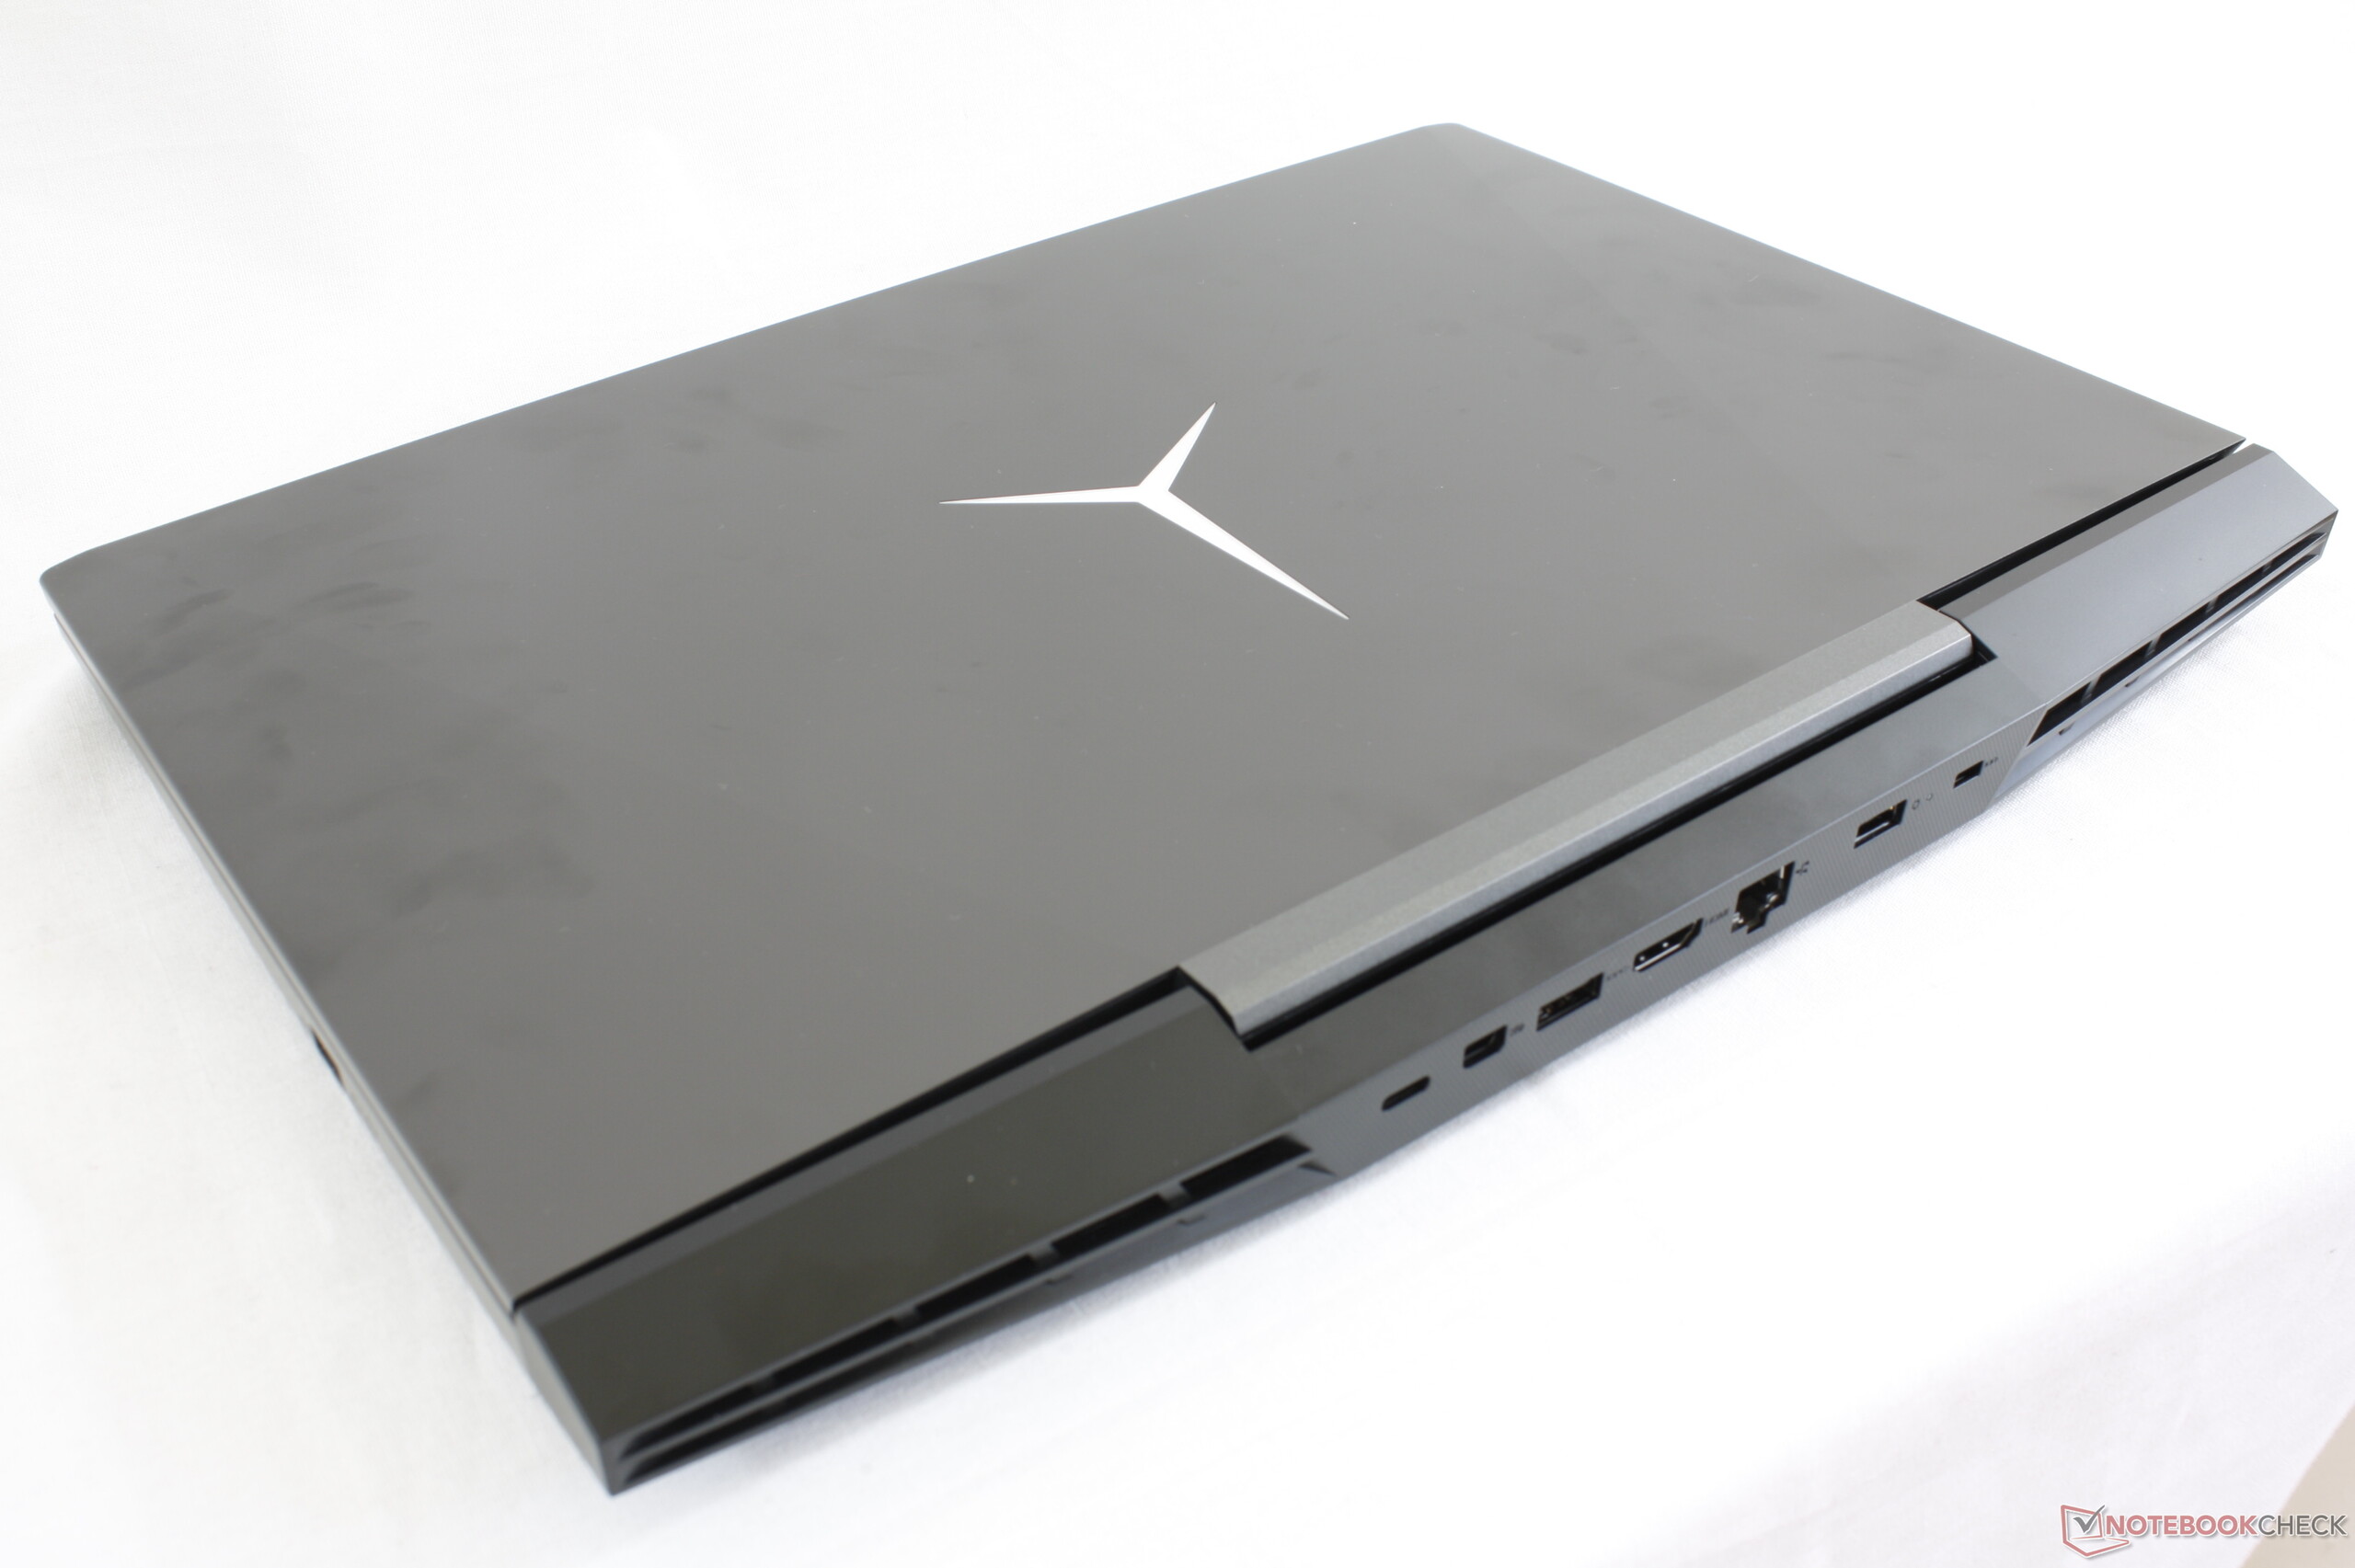
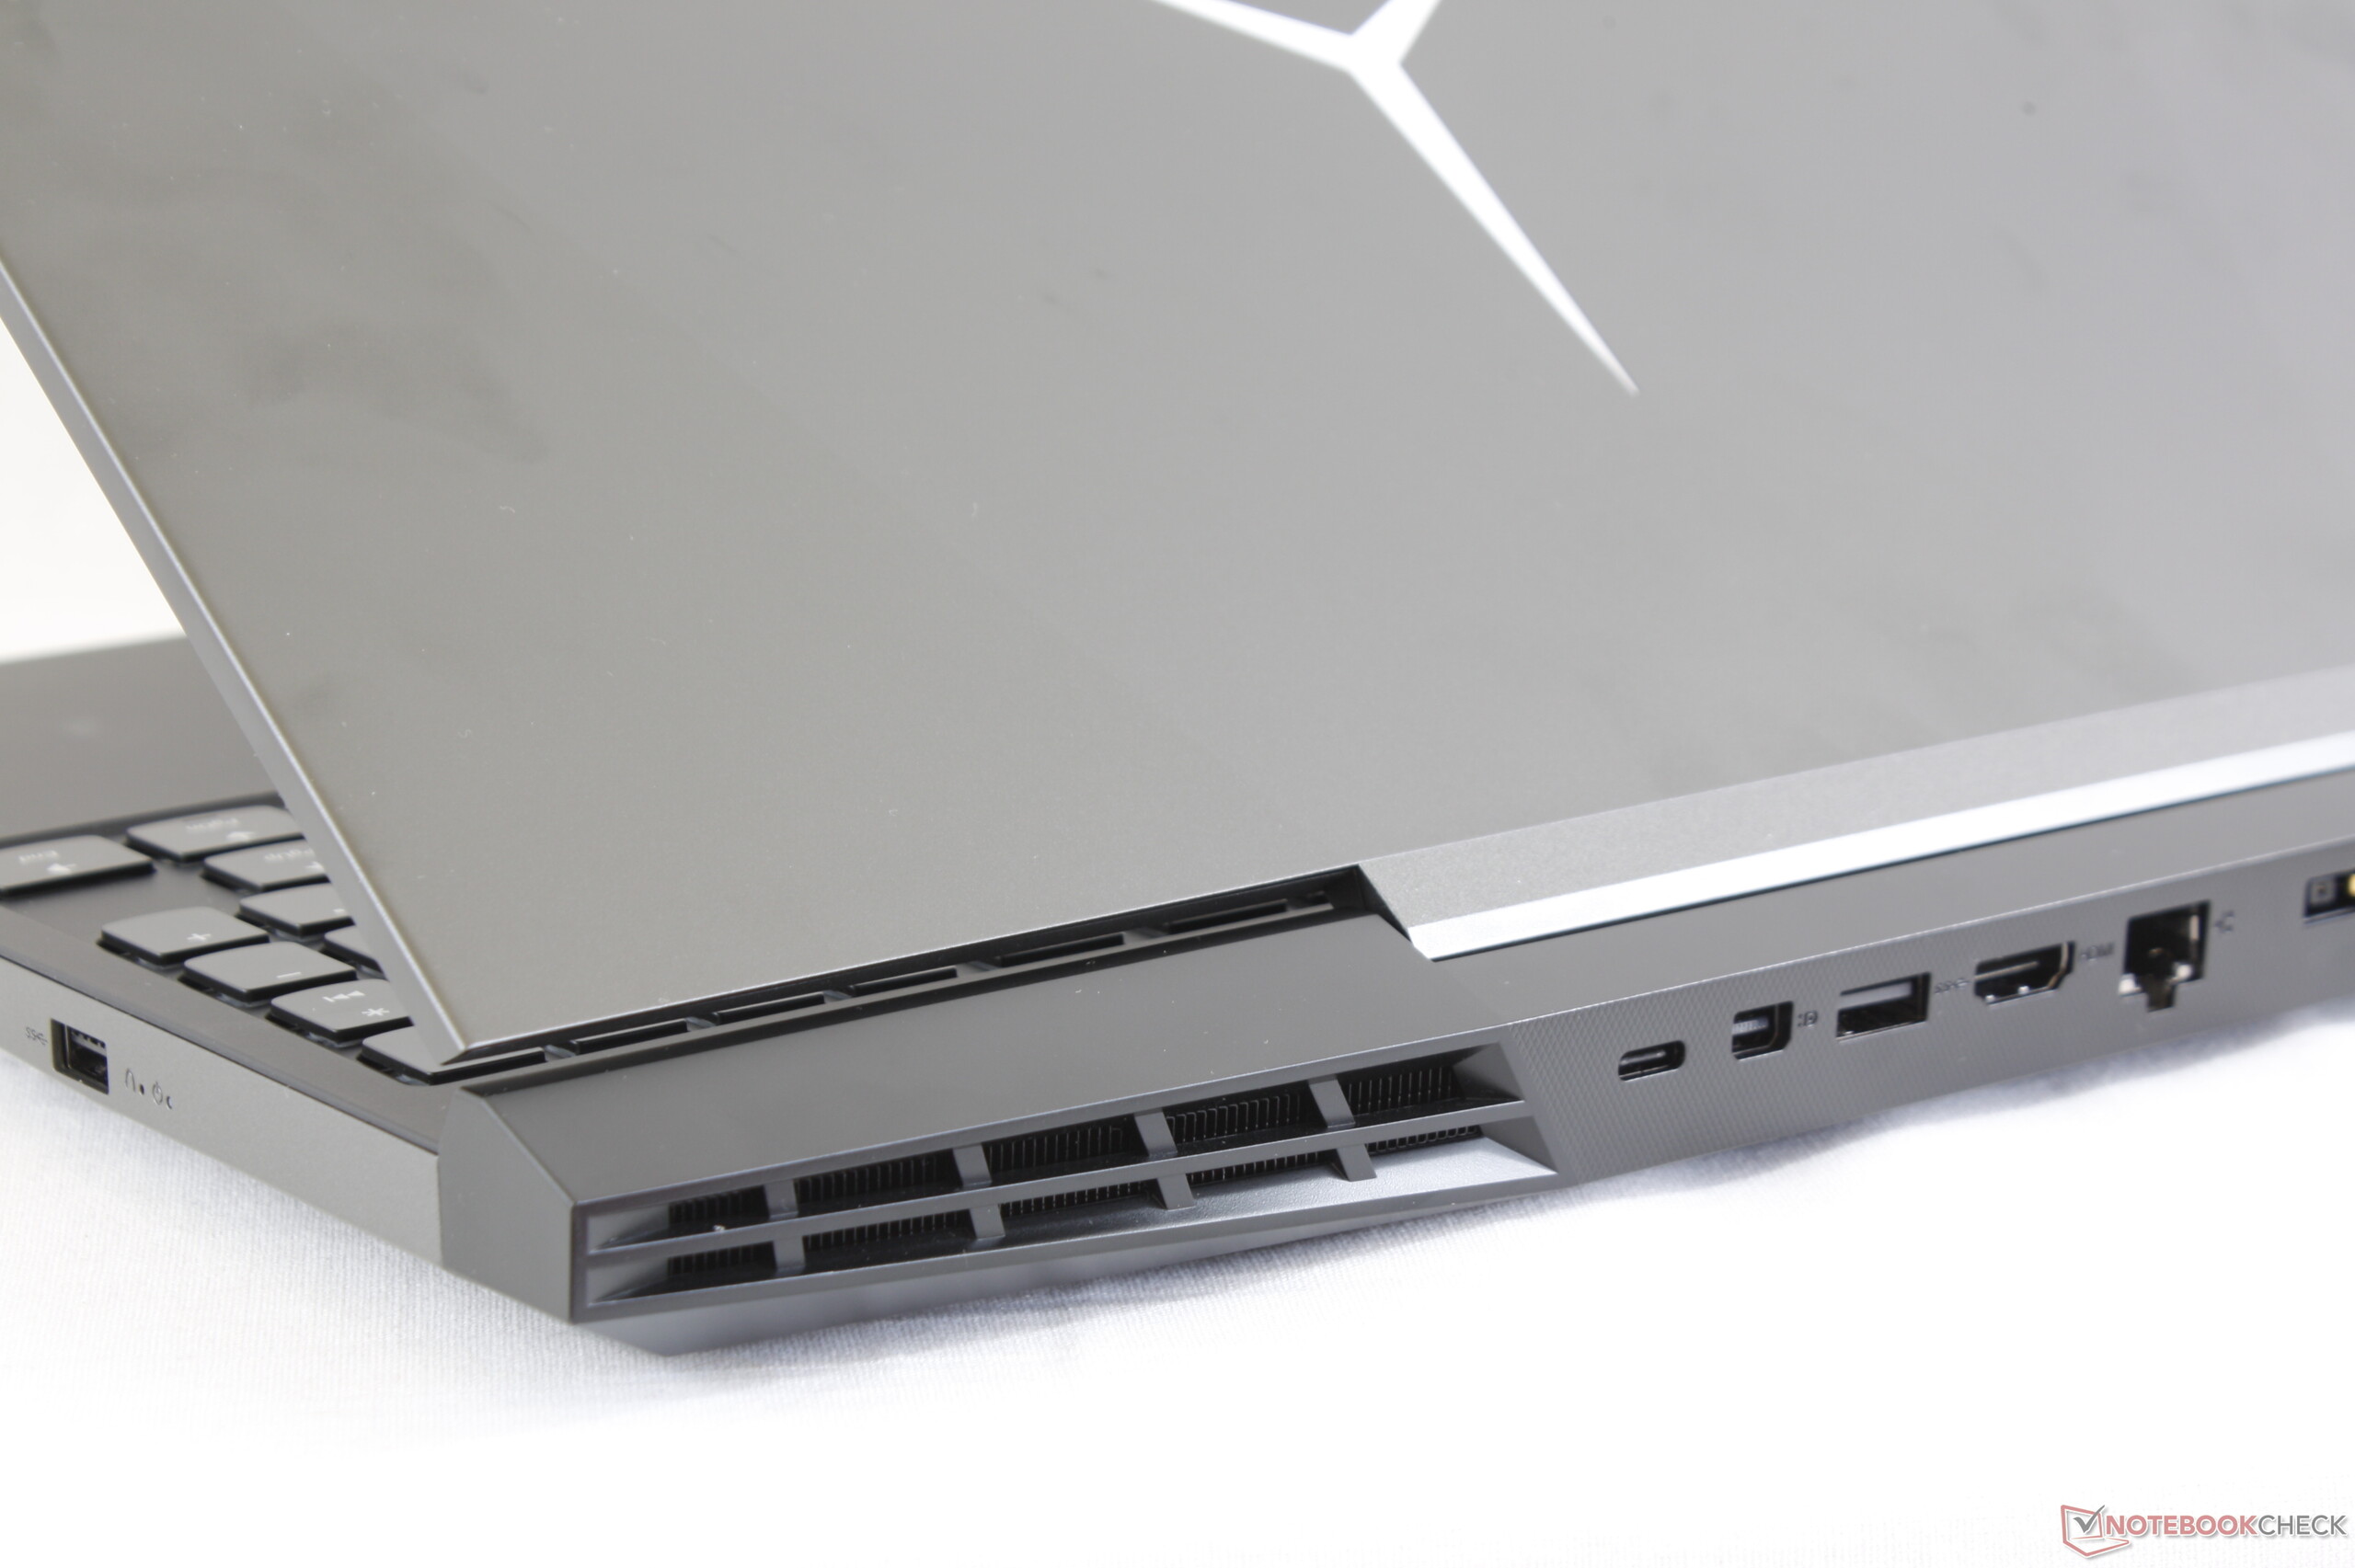
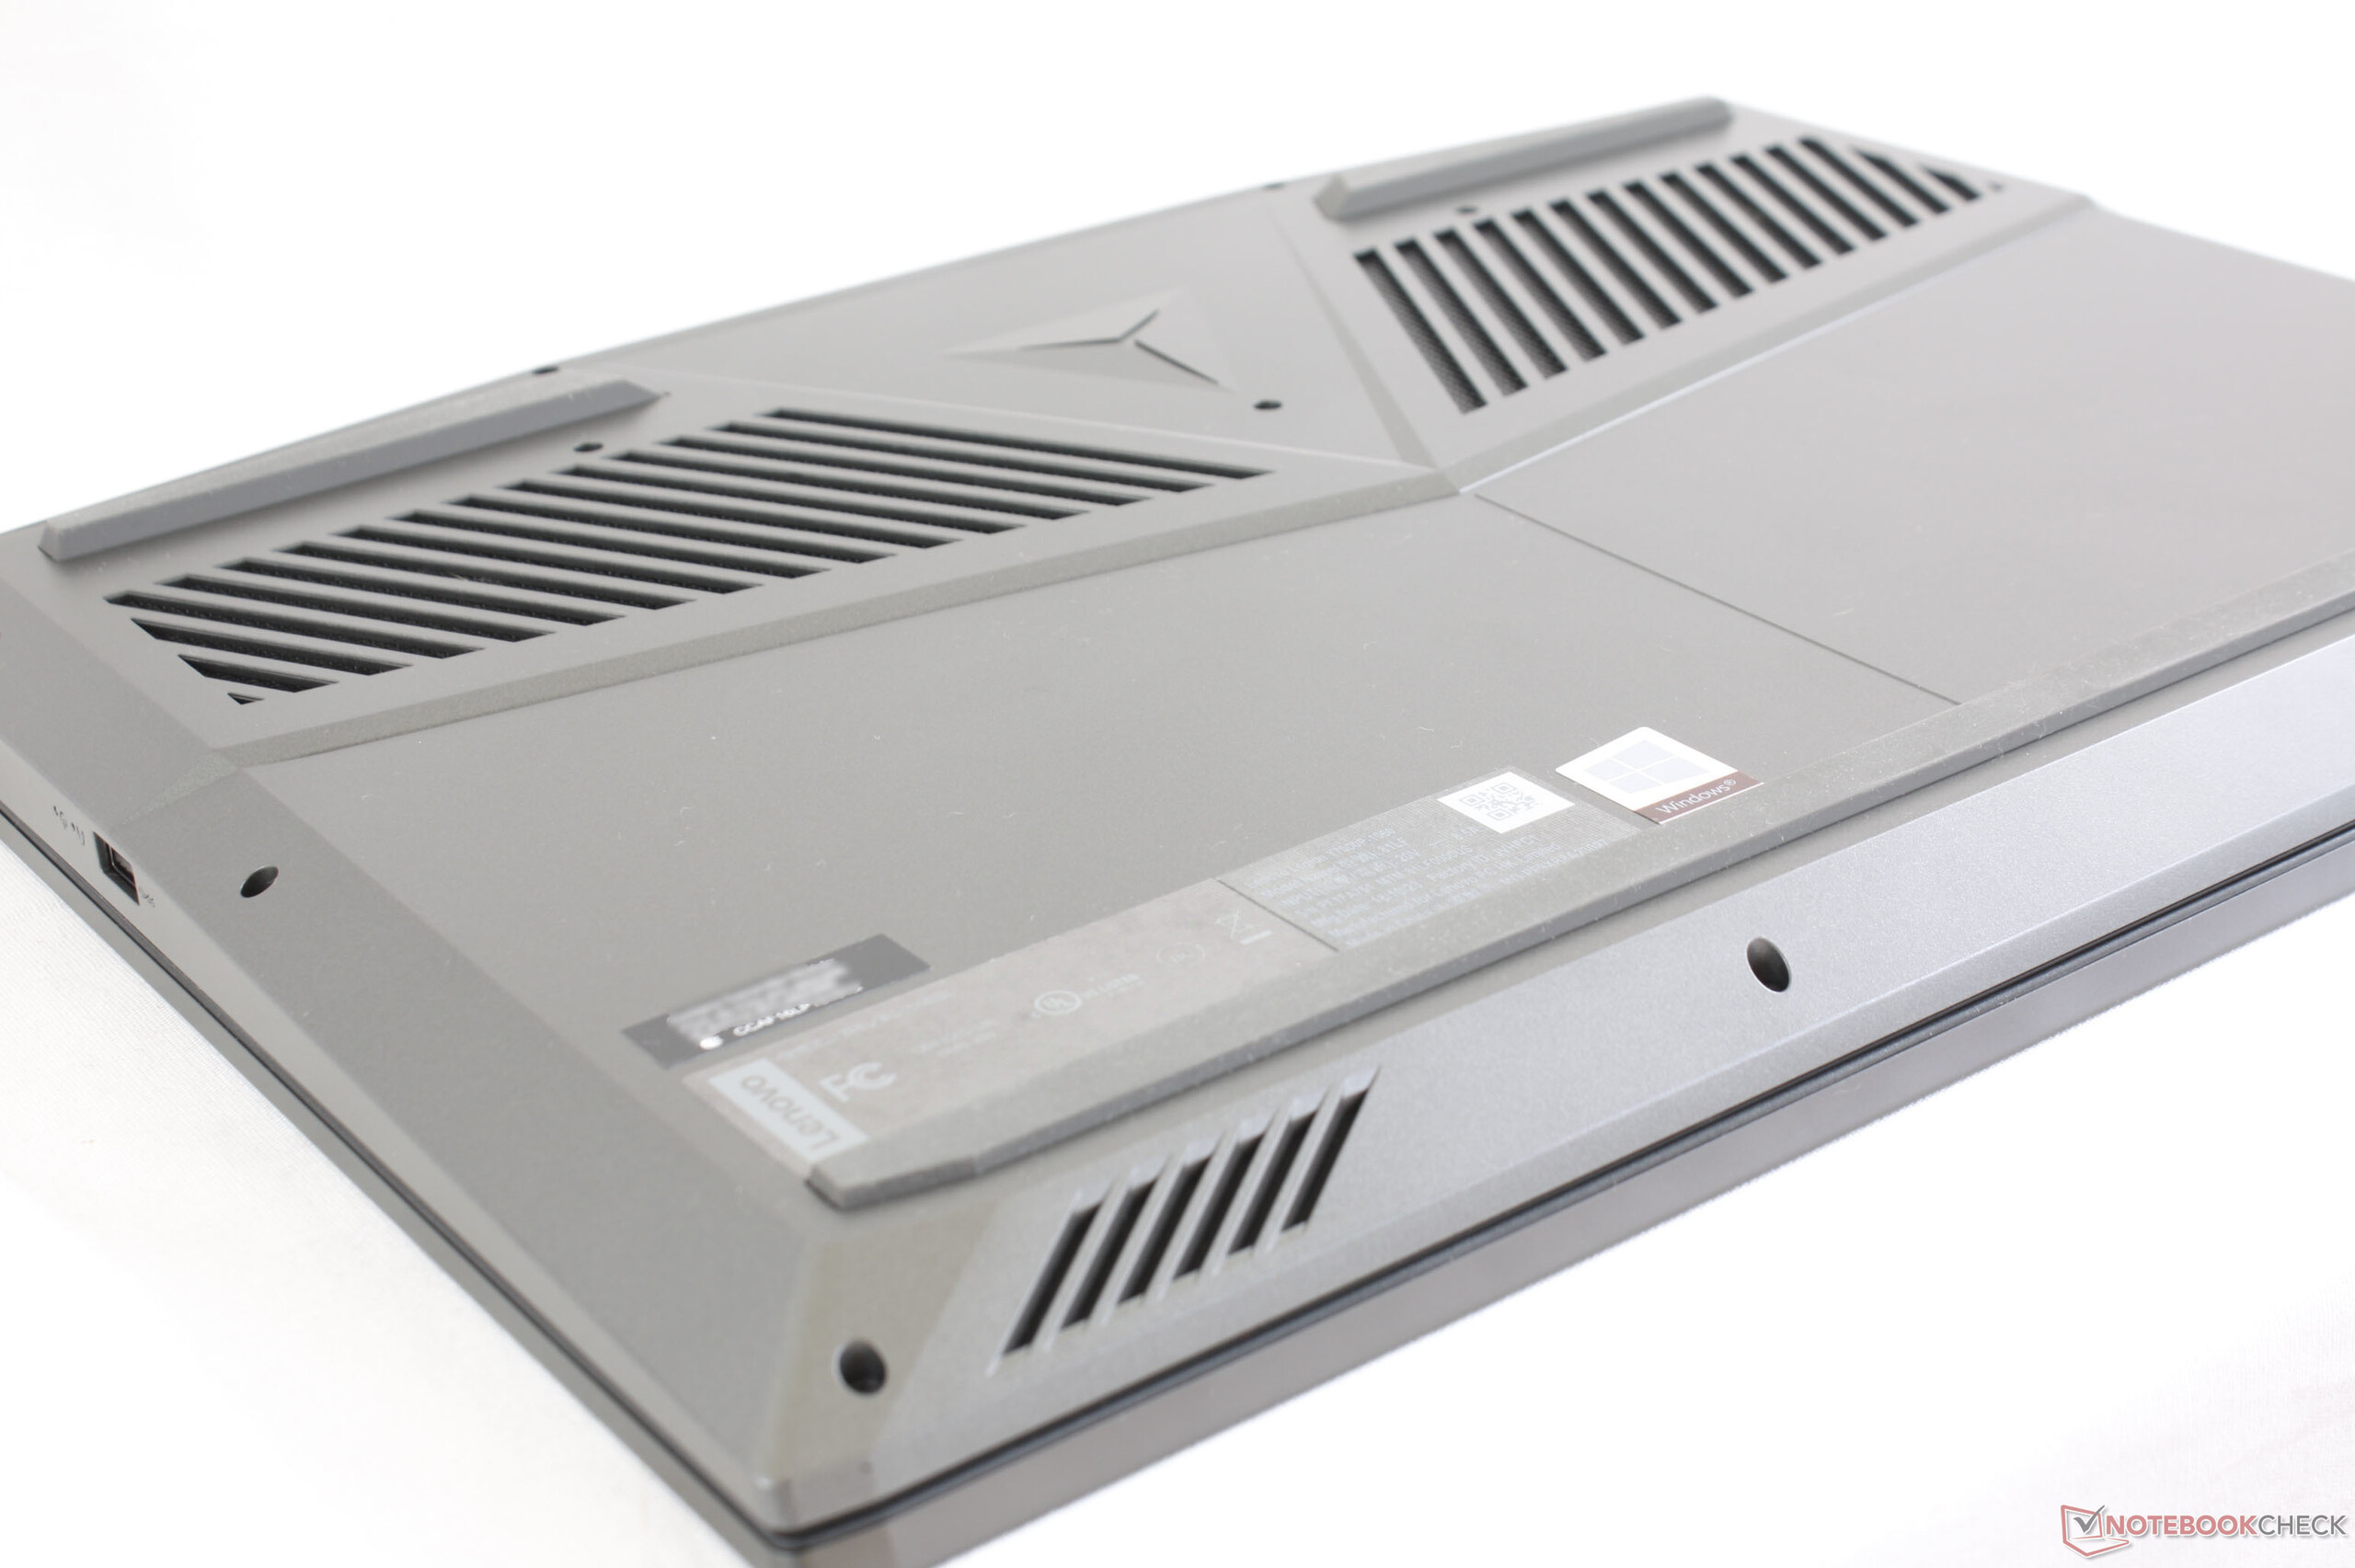
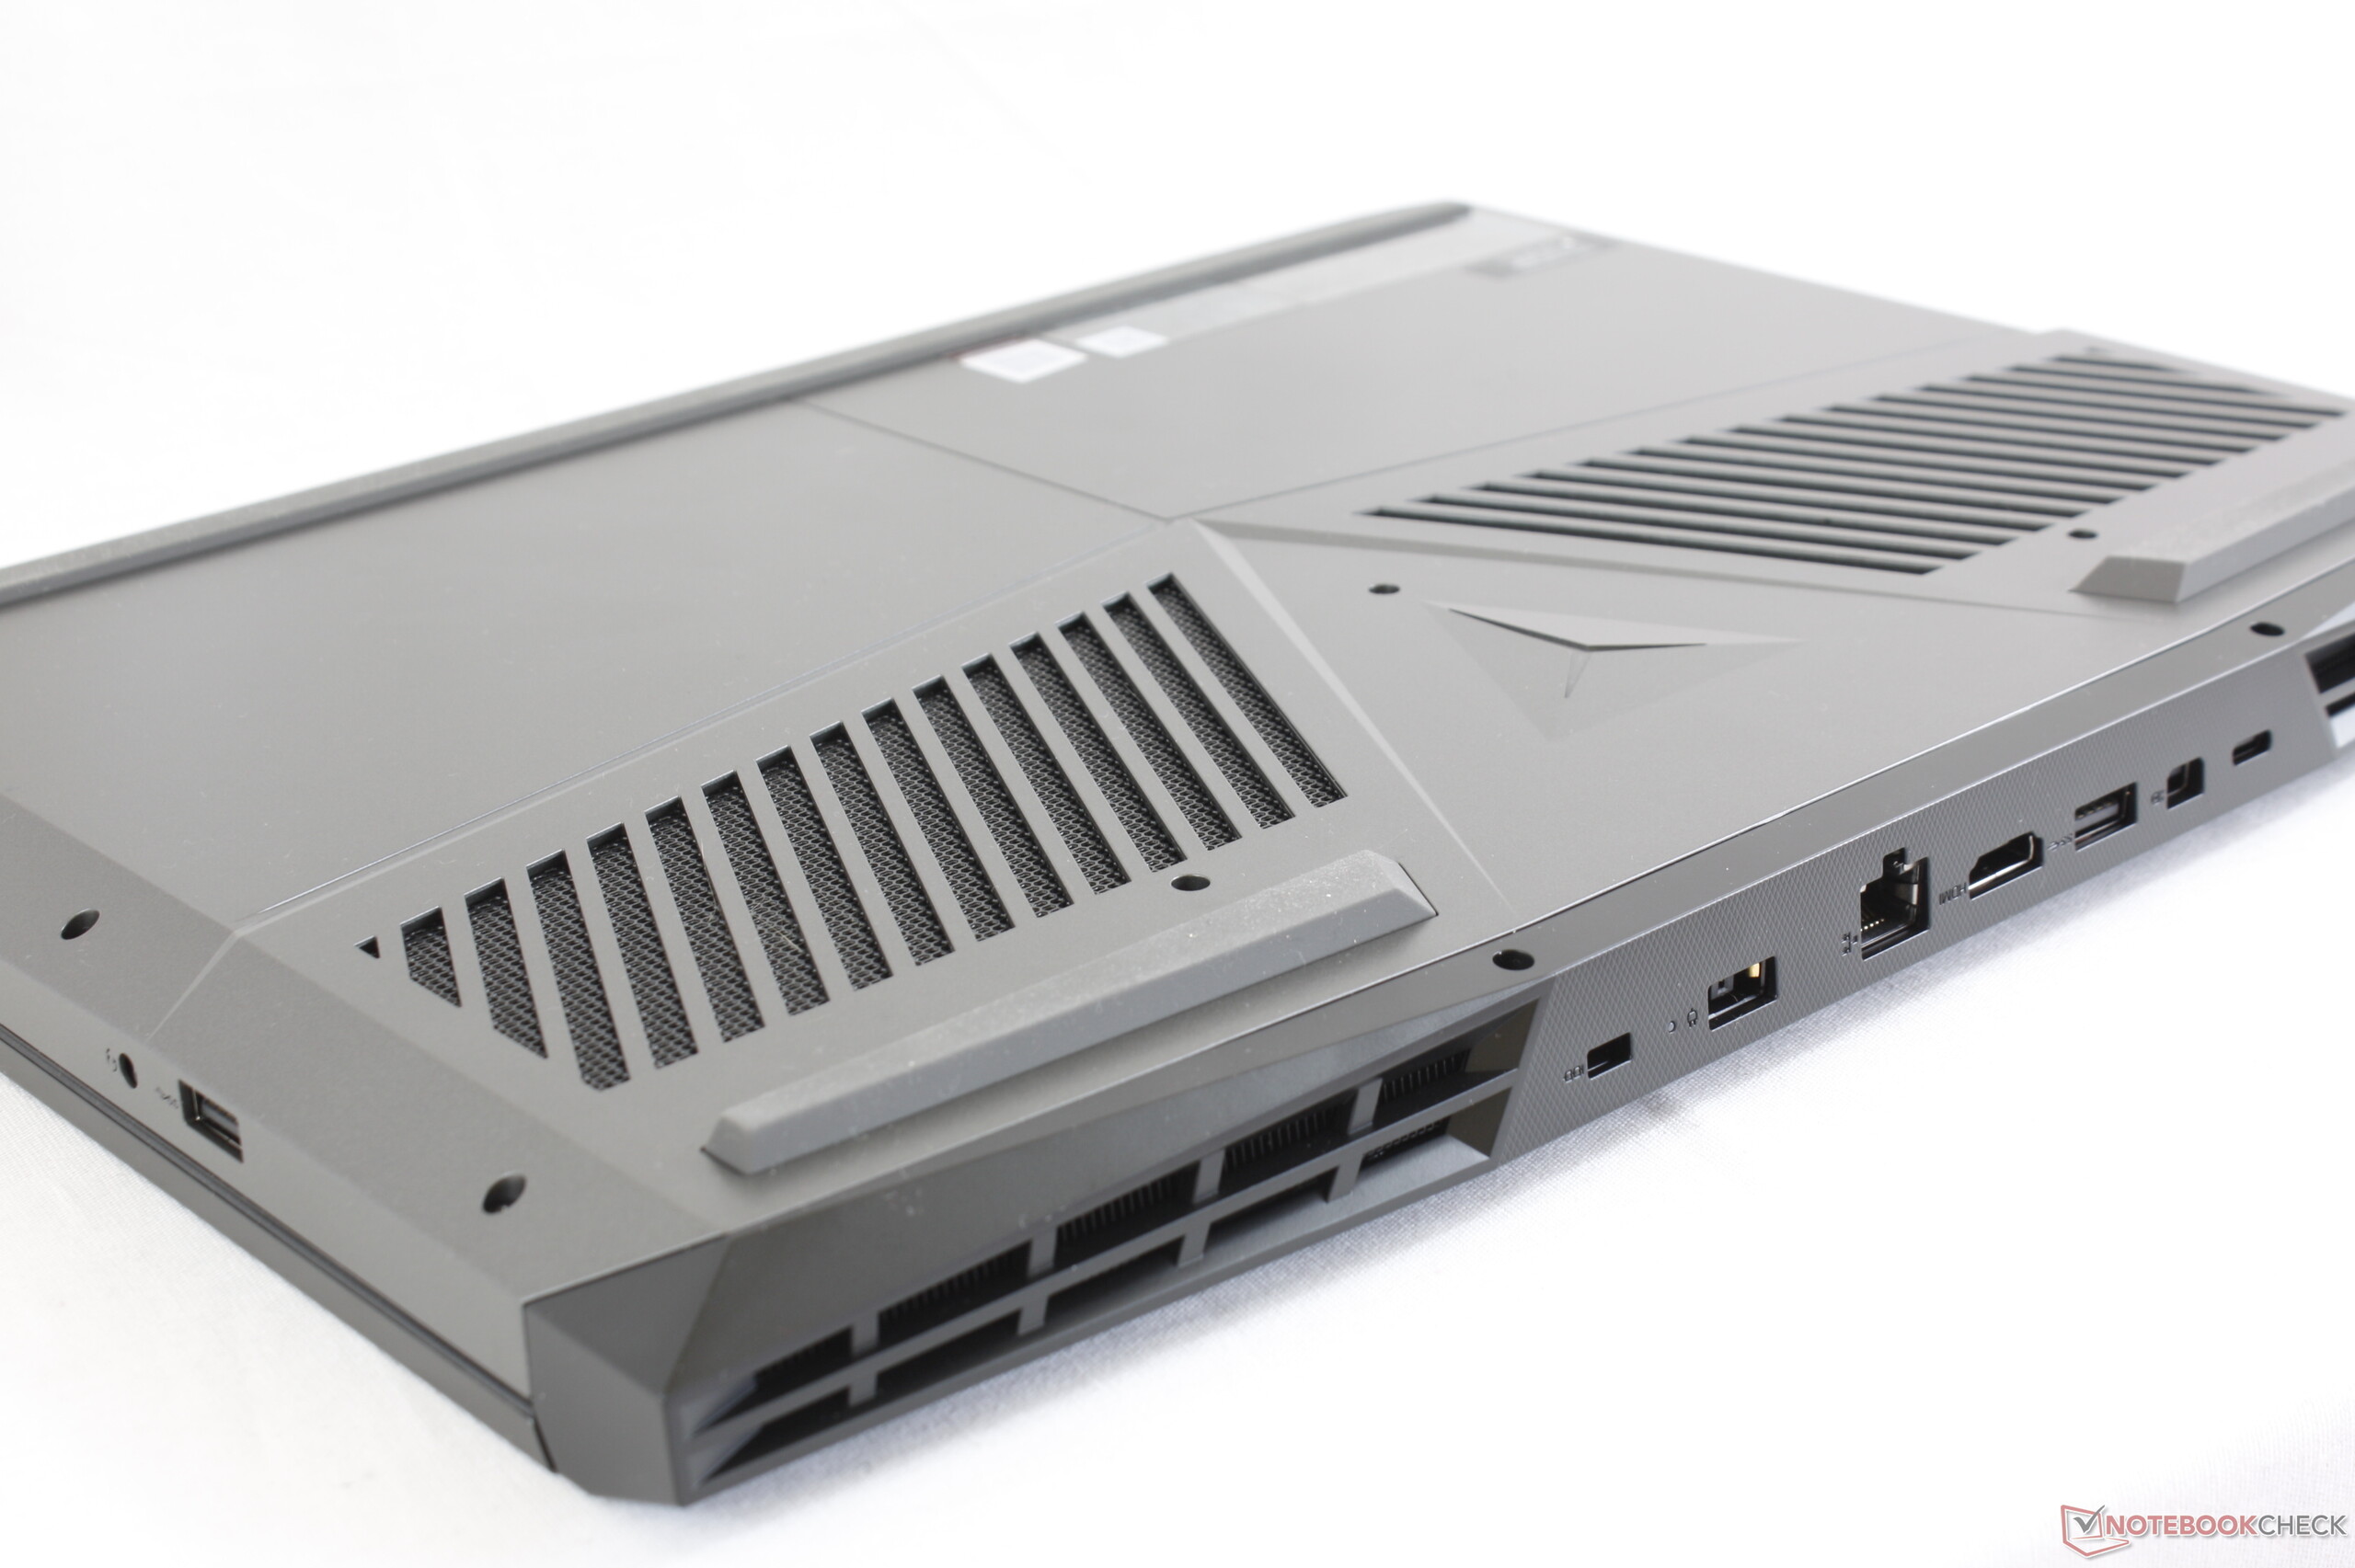
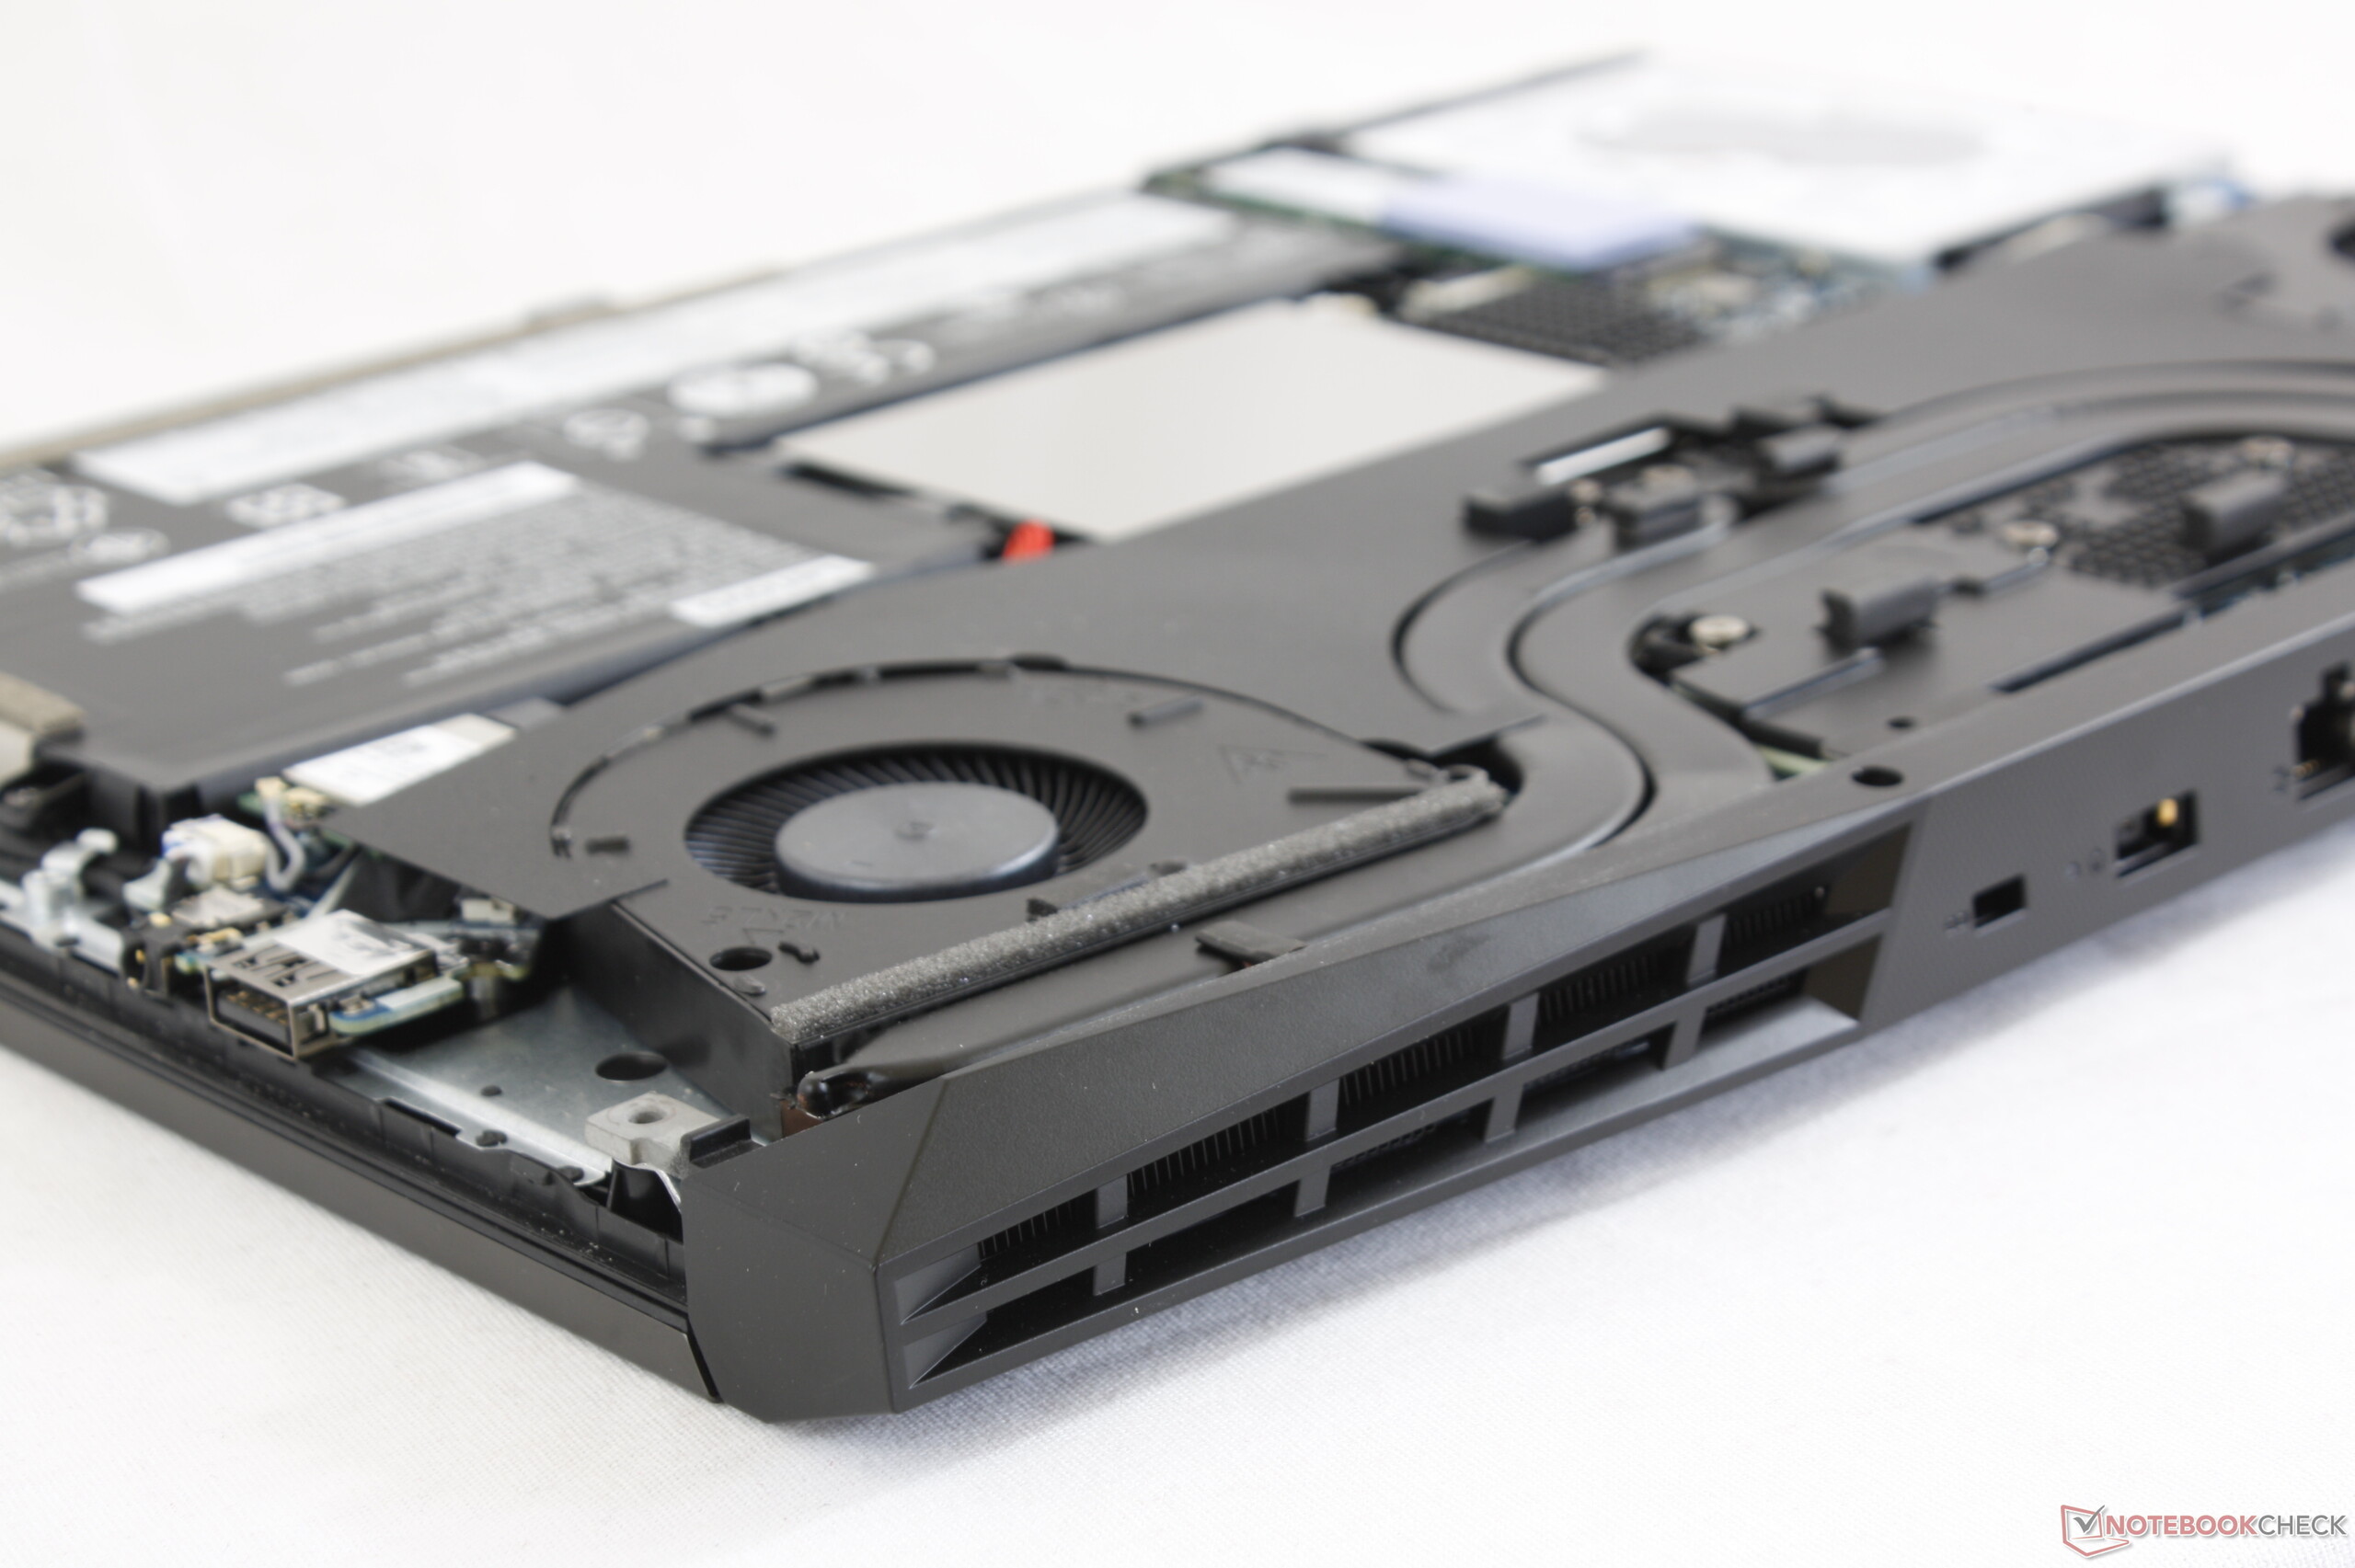
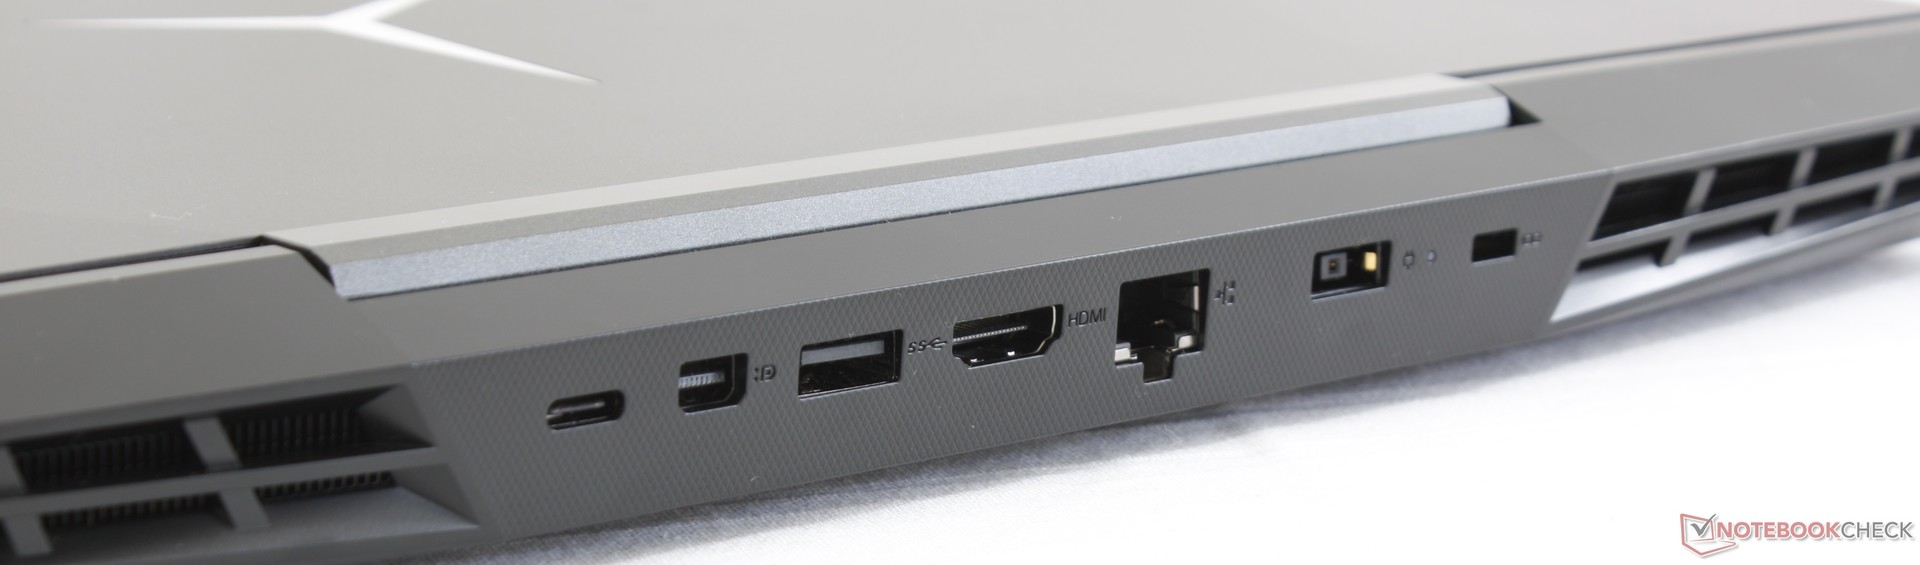
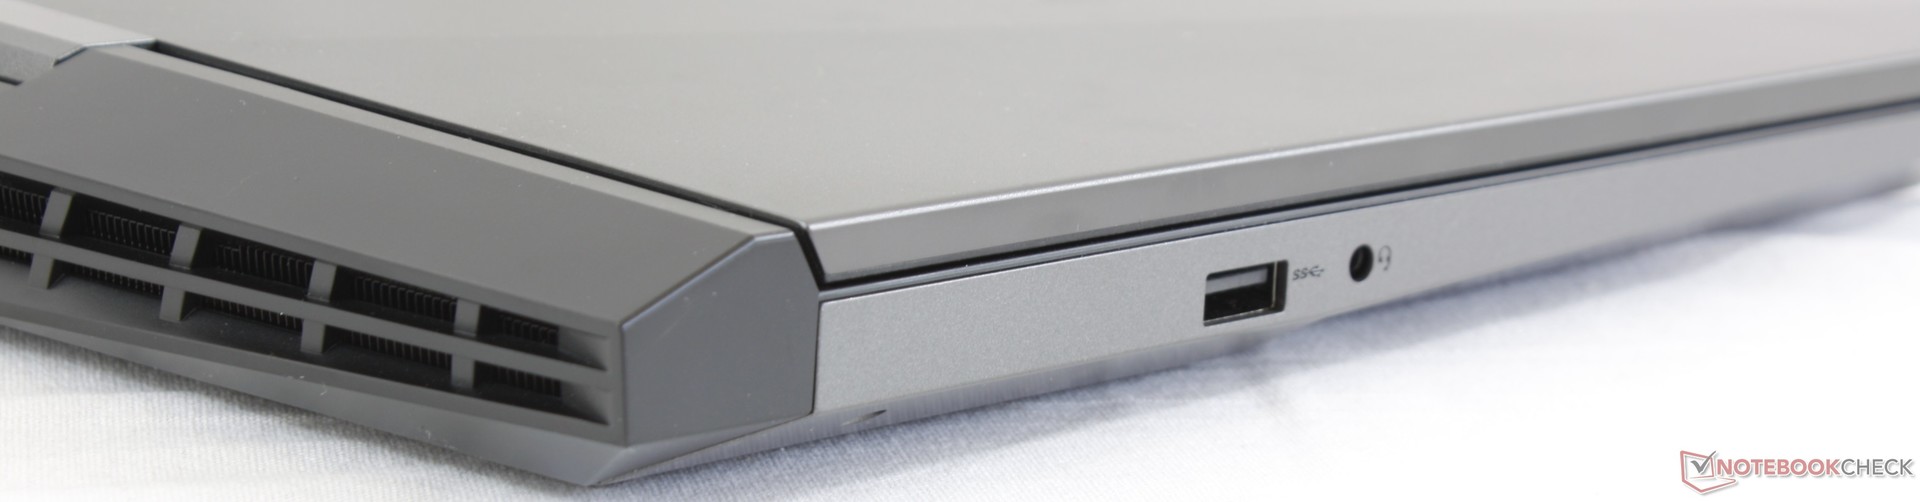
Systemets nackdelar är rätt små, men totalt blir de ganska många. Placeringen av portarna är kanske inte ideal för alla användare och servicemöjligheterna kunde varit bättre. Mer praktiska fläktkontroller och bättre placering av webbkameran, ett fastare lock, en mer precis styrplatta och kanske också ytor som inte drar åt sig så mycket fingeravtryck hade förbättrat användarupplevelsen utan att priset hade behövt öka. Den är också en aning tyngre och tjockare än konkurrerande tunt infattade alternativ som MSI GF63 eller tidigare nämnda ROG GL504. Mer seriösa FPS-gamers bör känna till att standardskärmalternativet på 60 Hz har relativt långsamma svart-vita responstider.
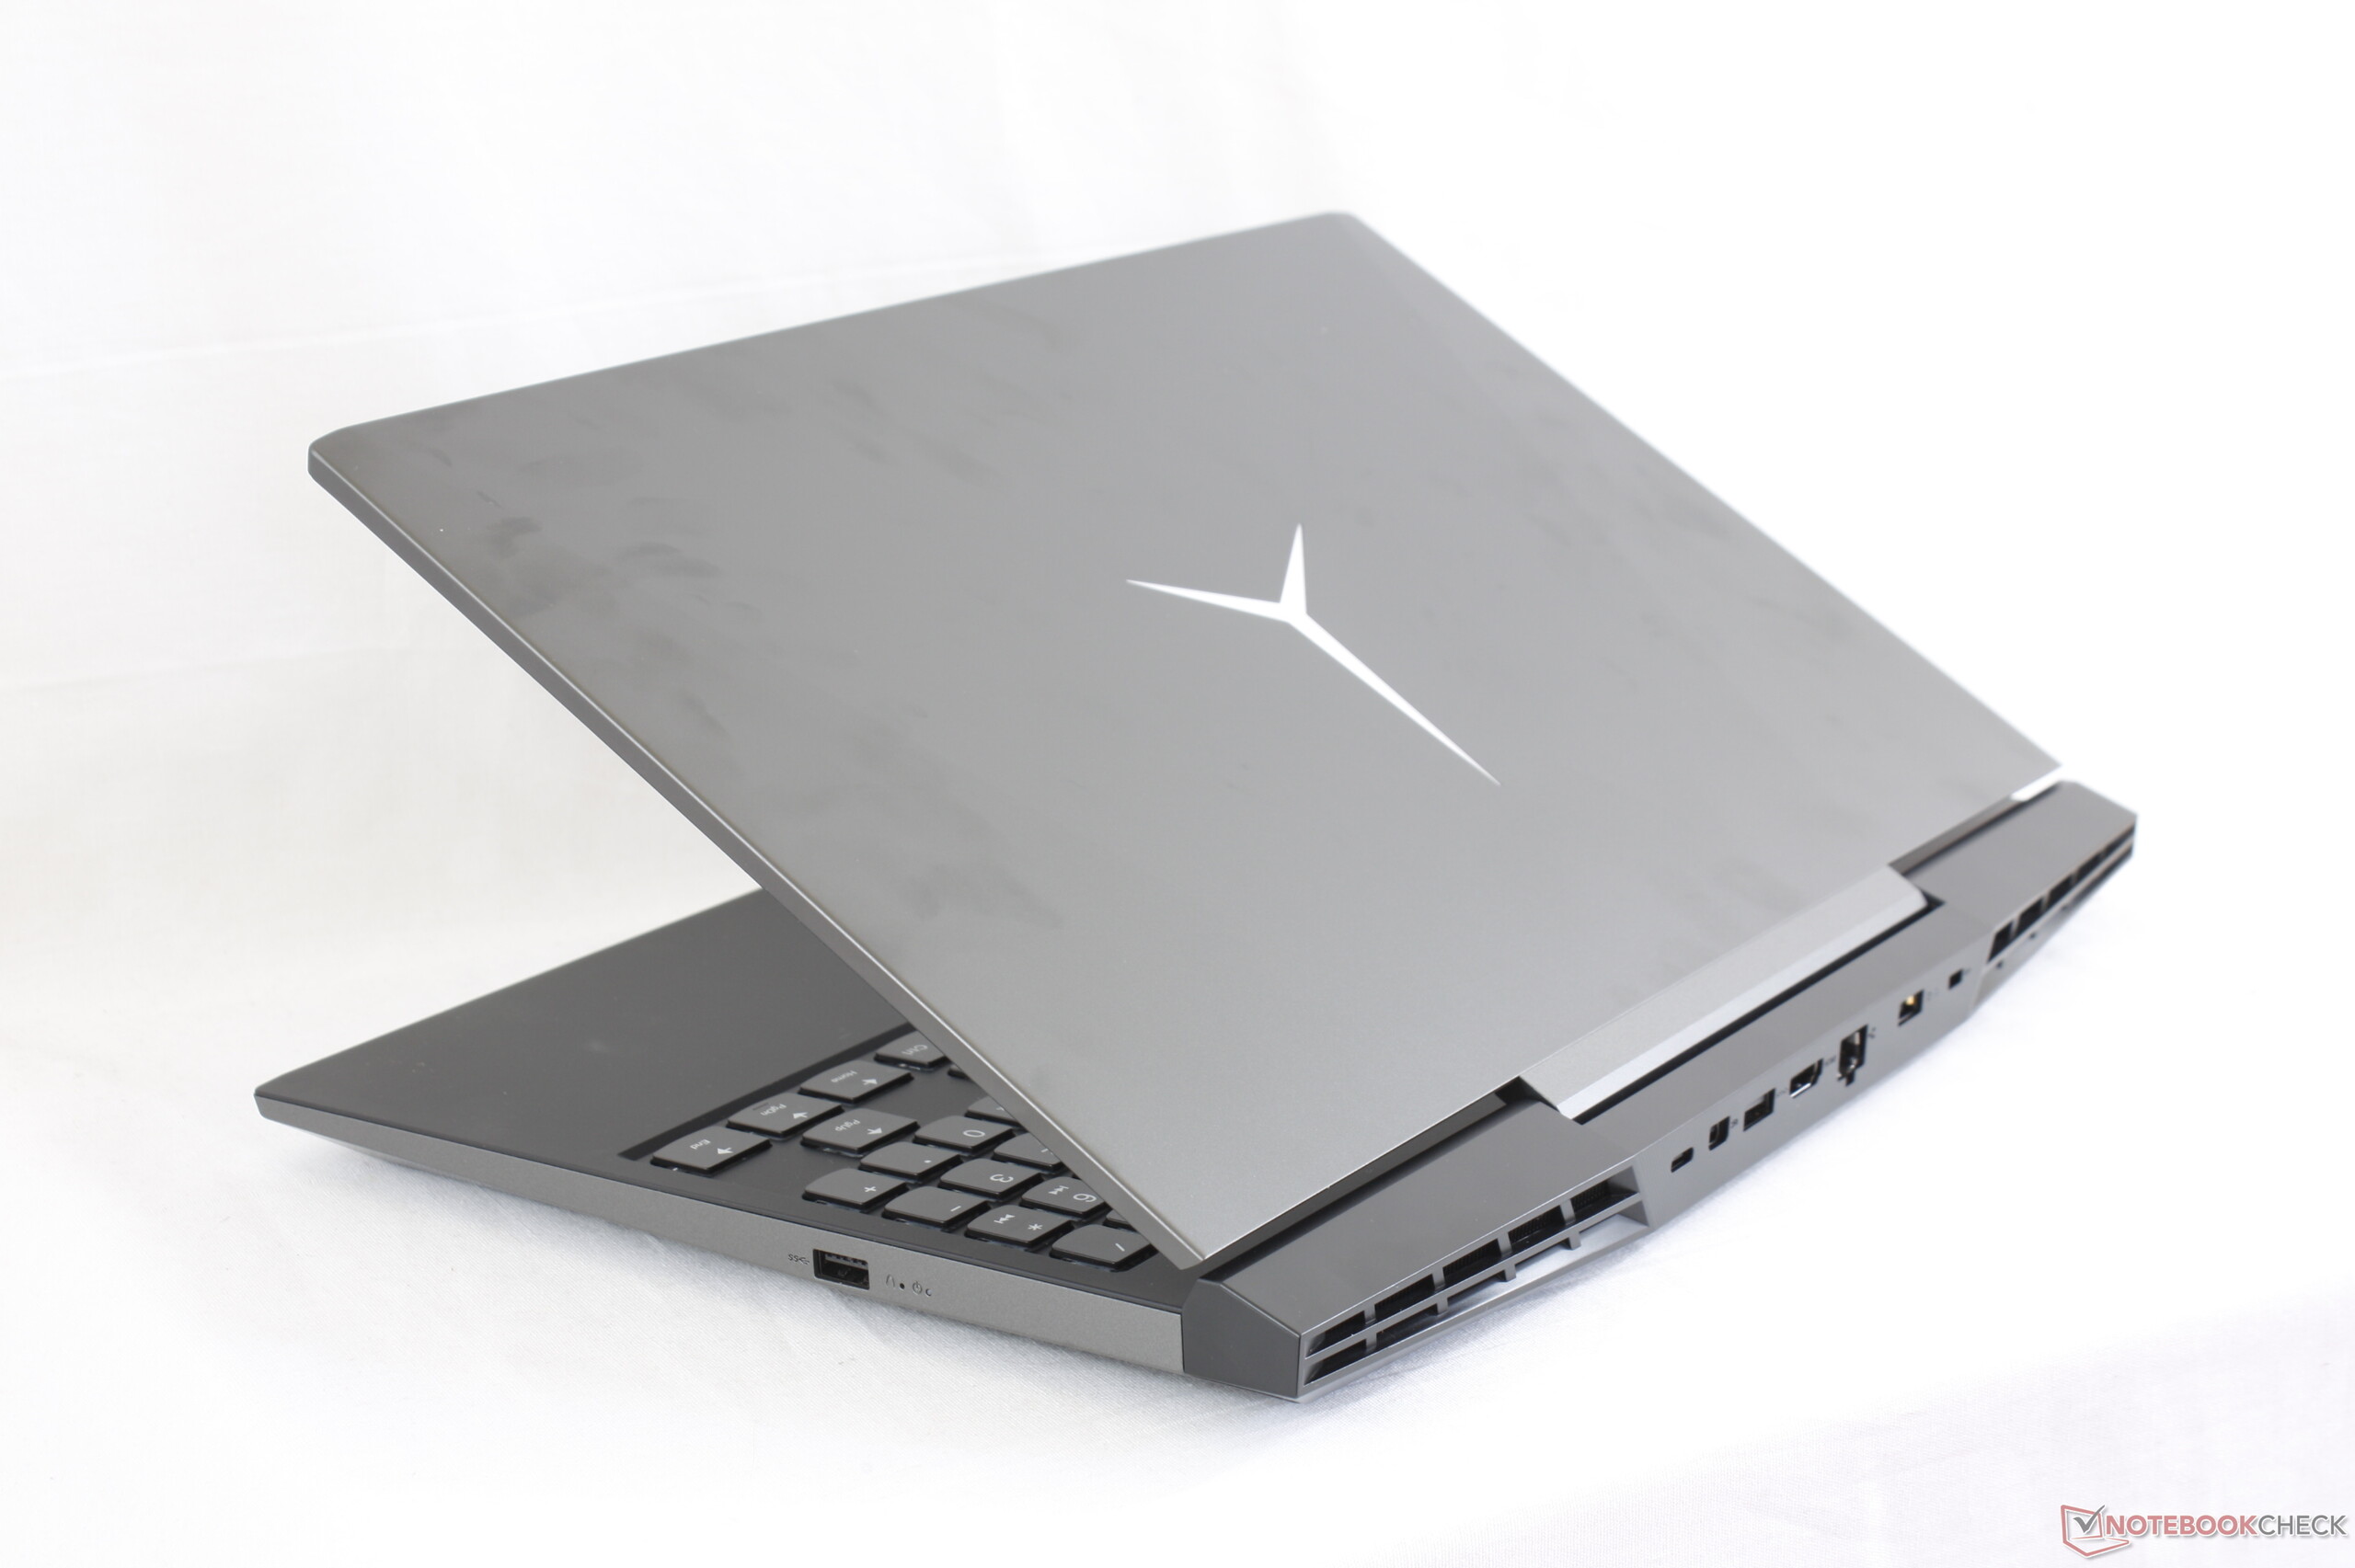
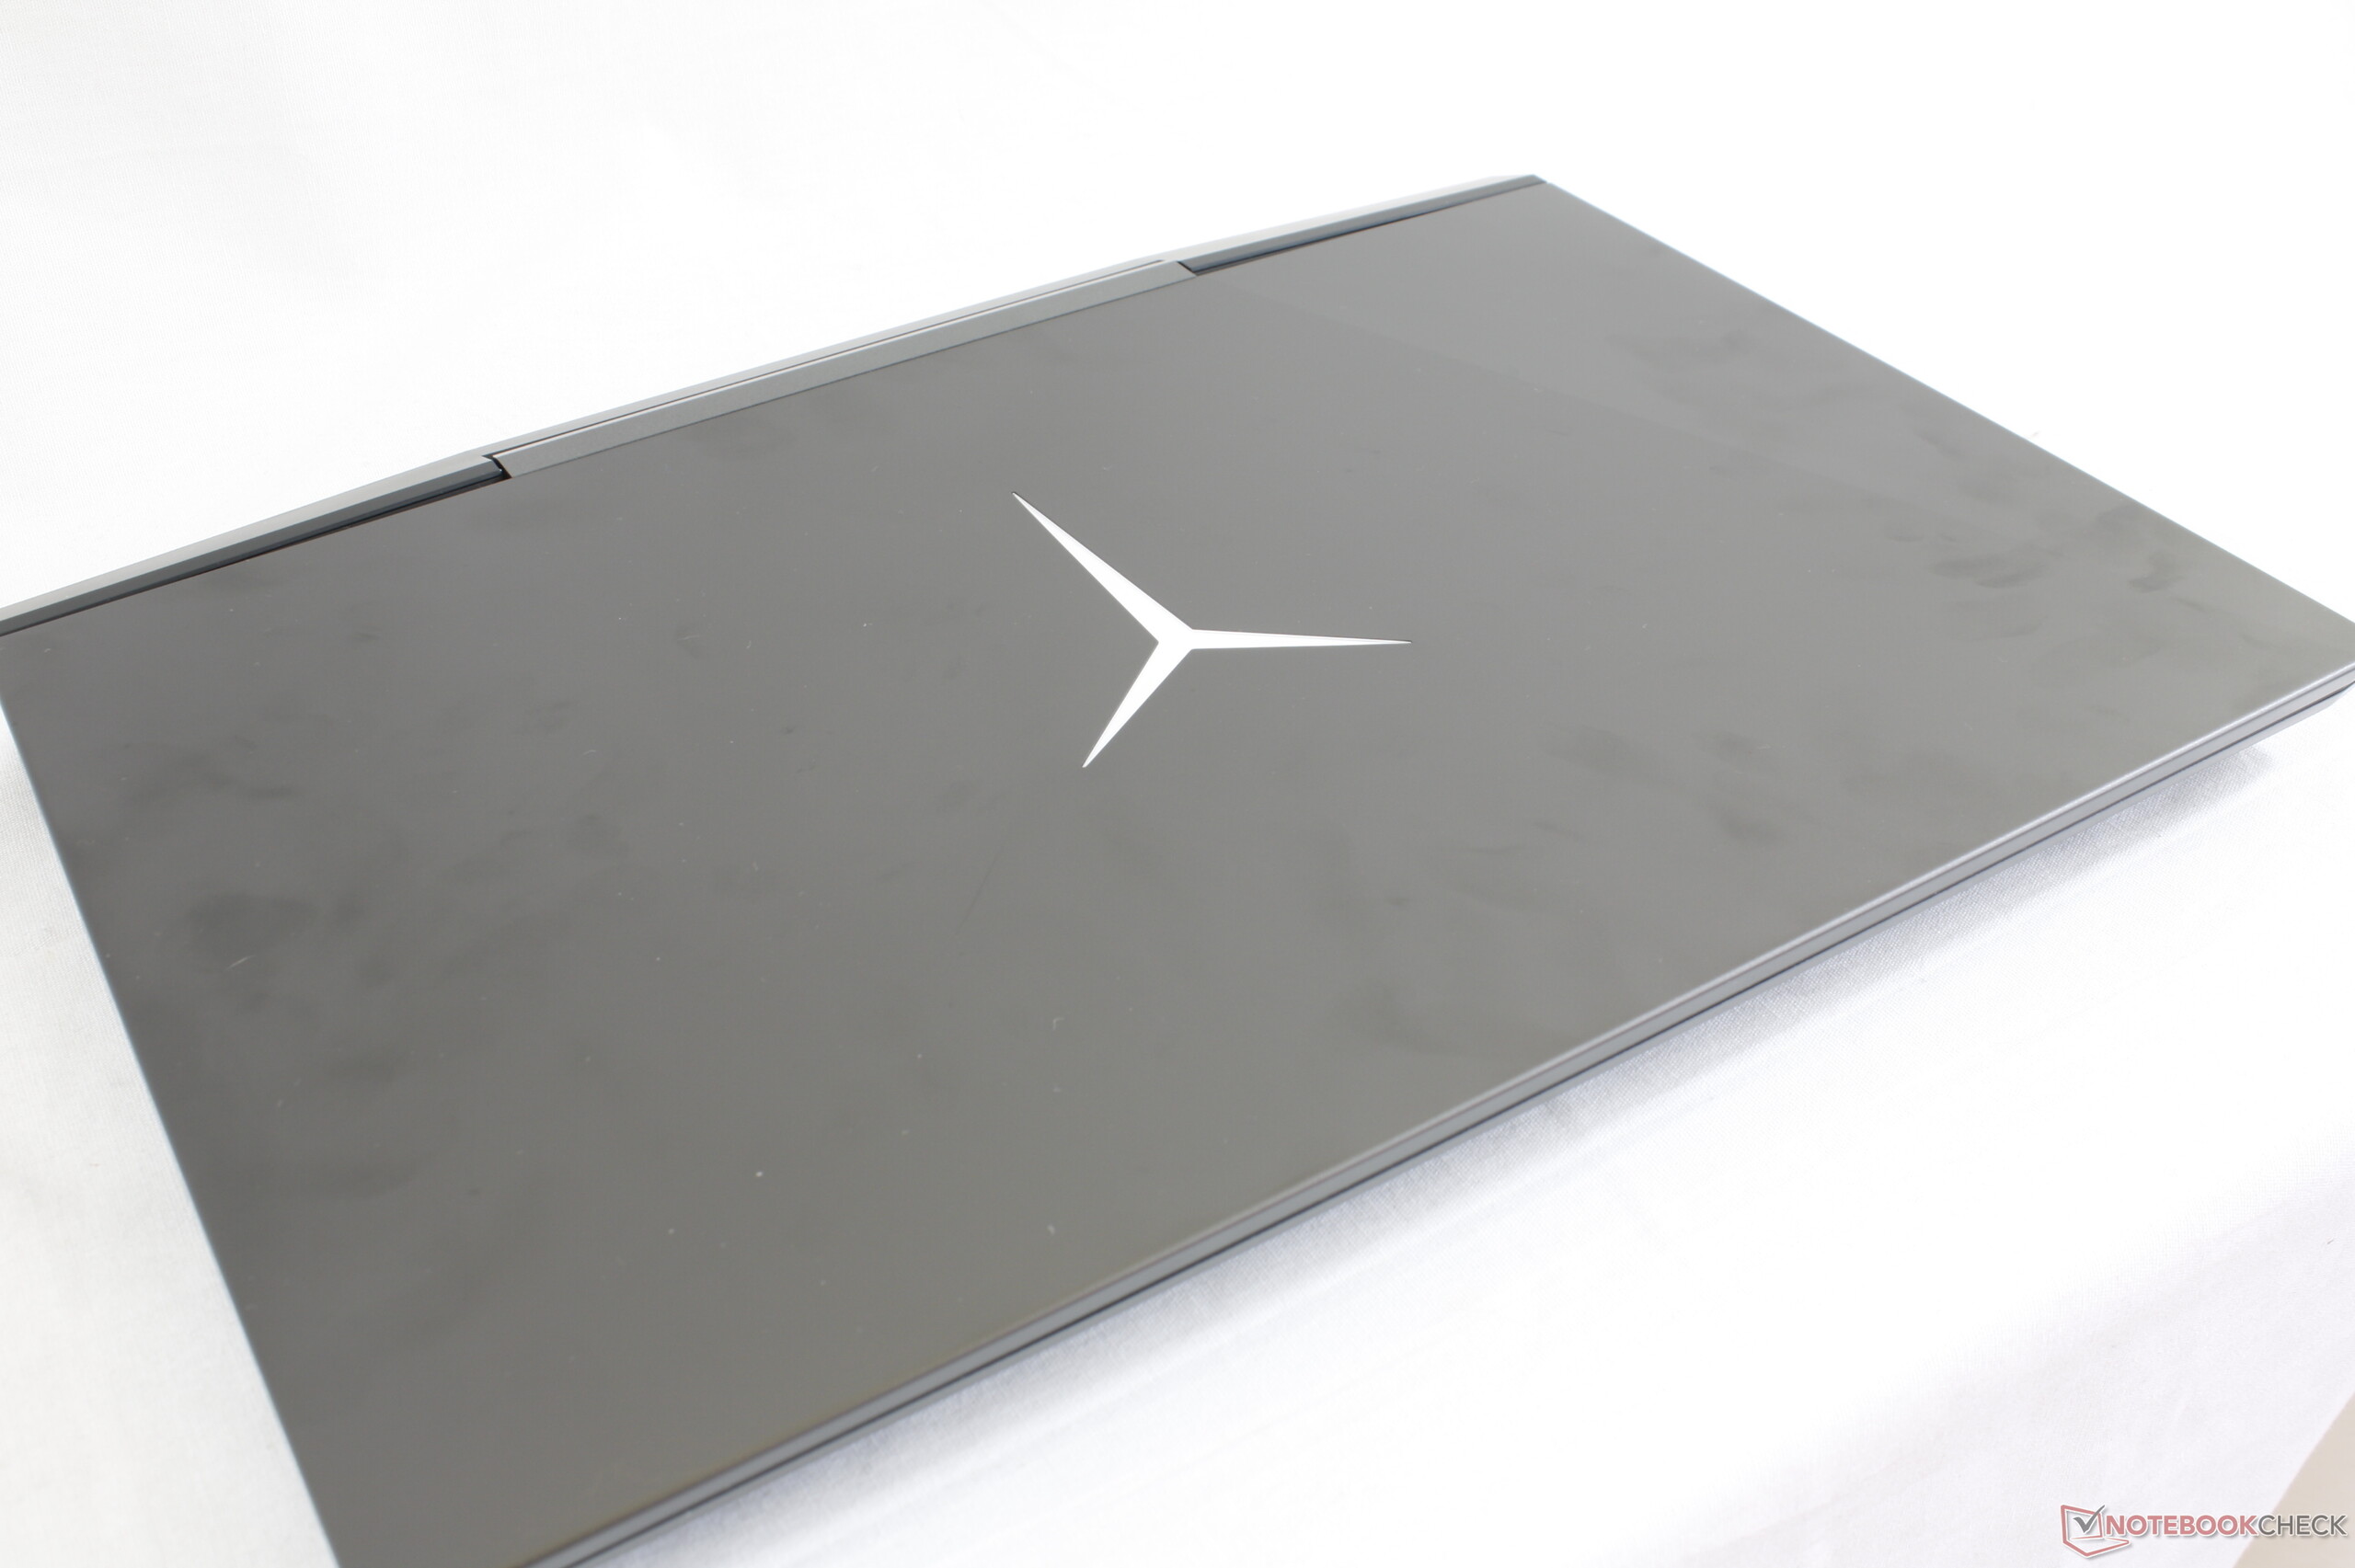
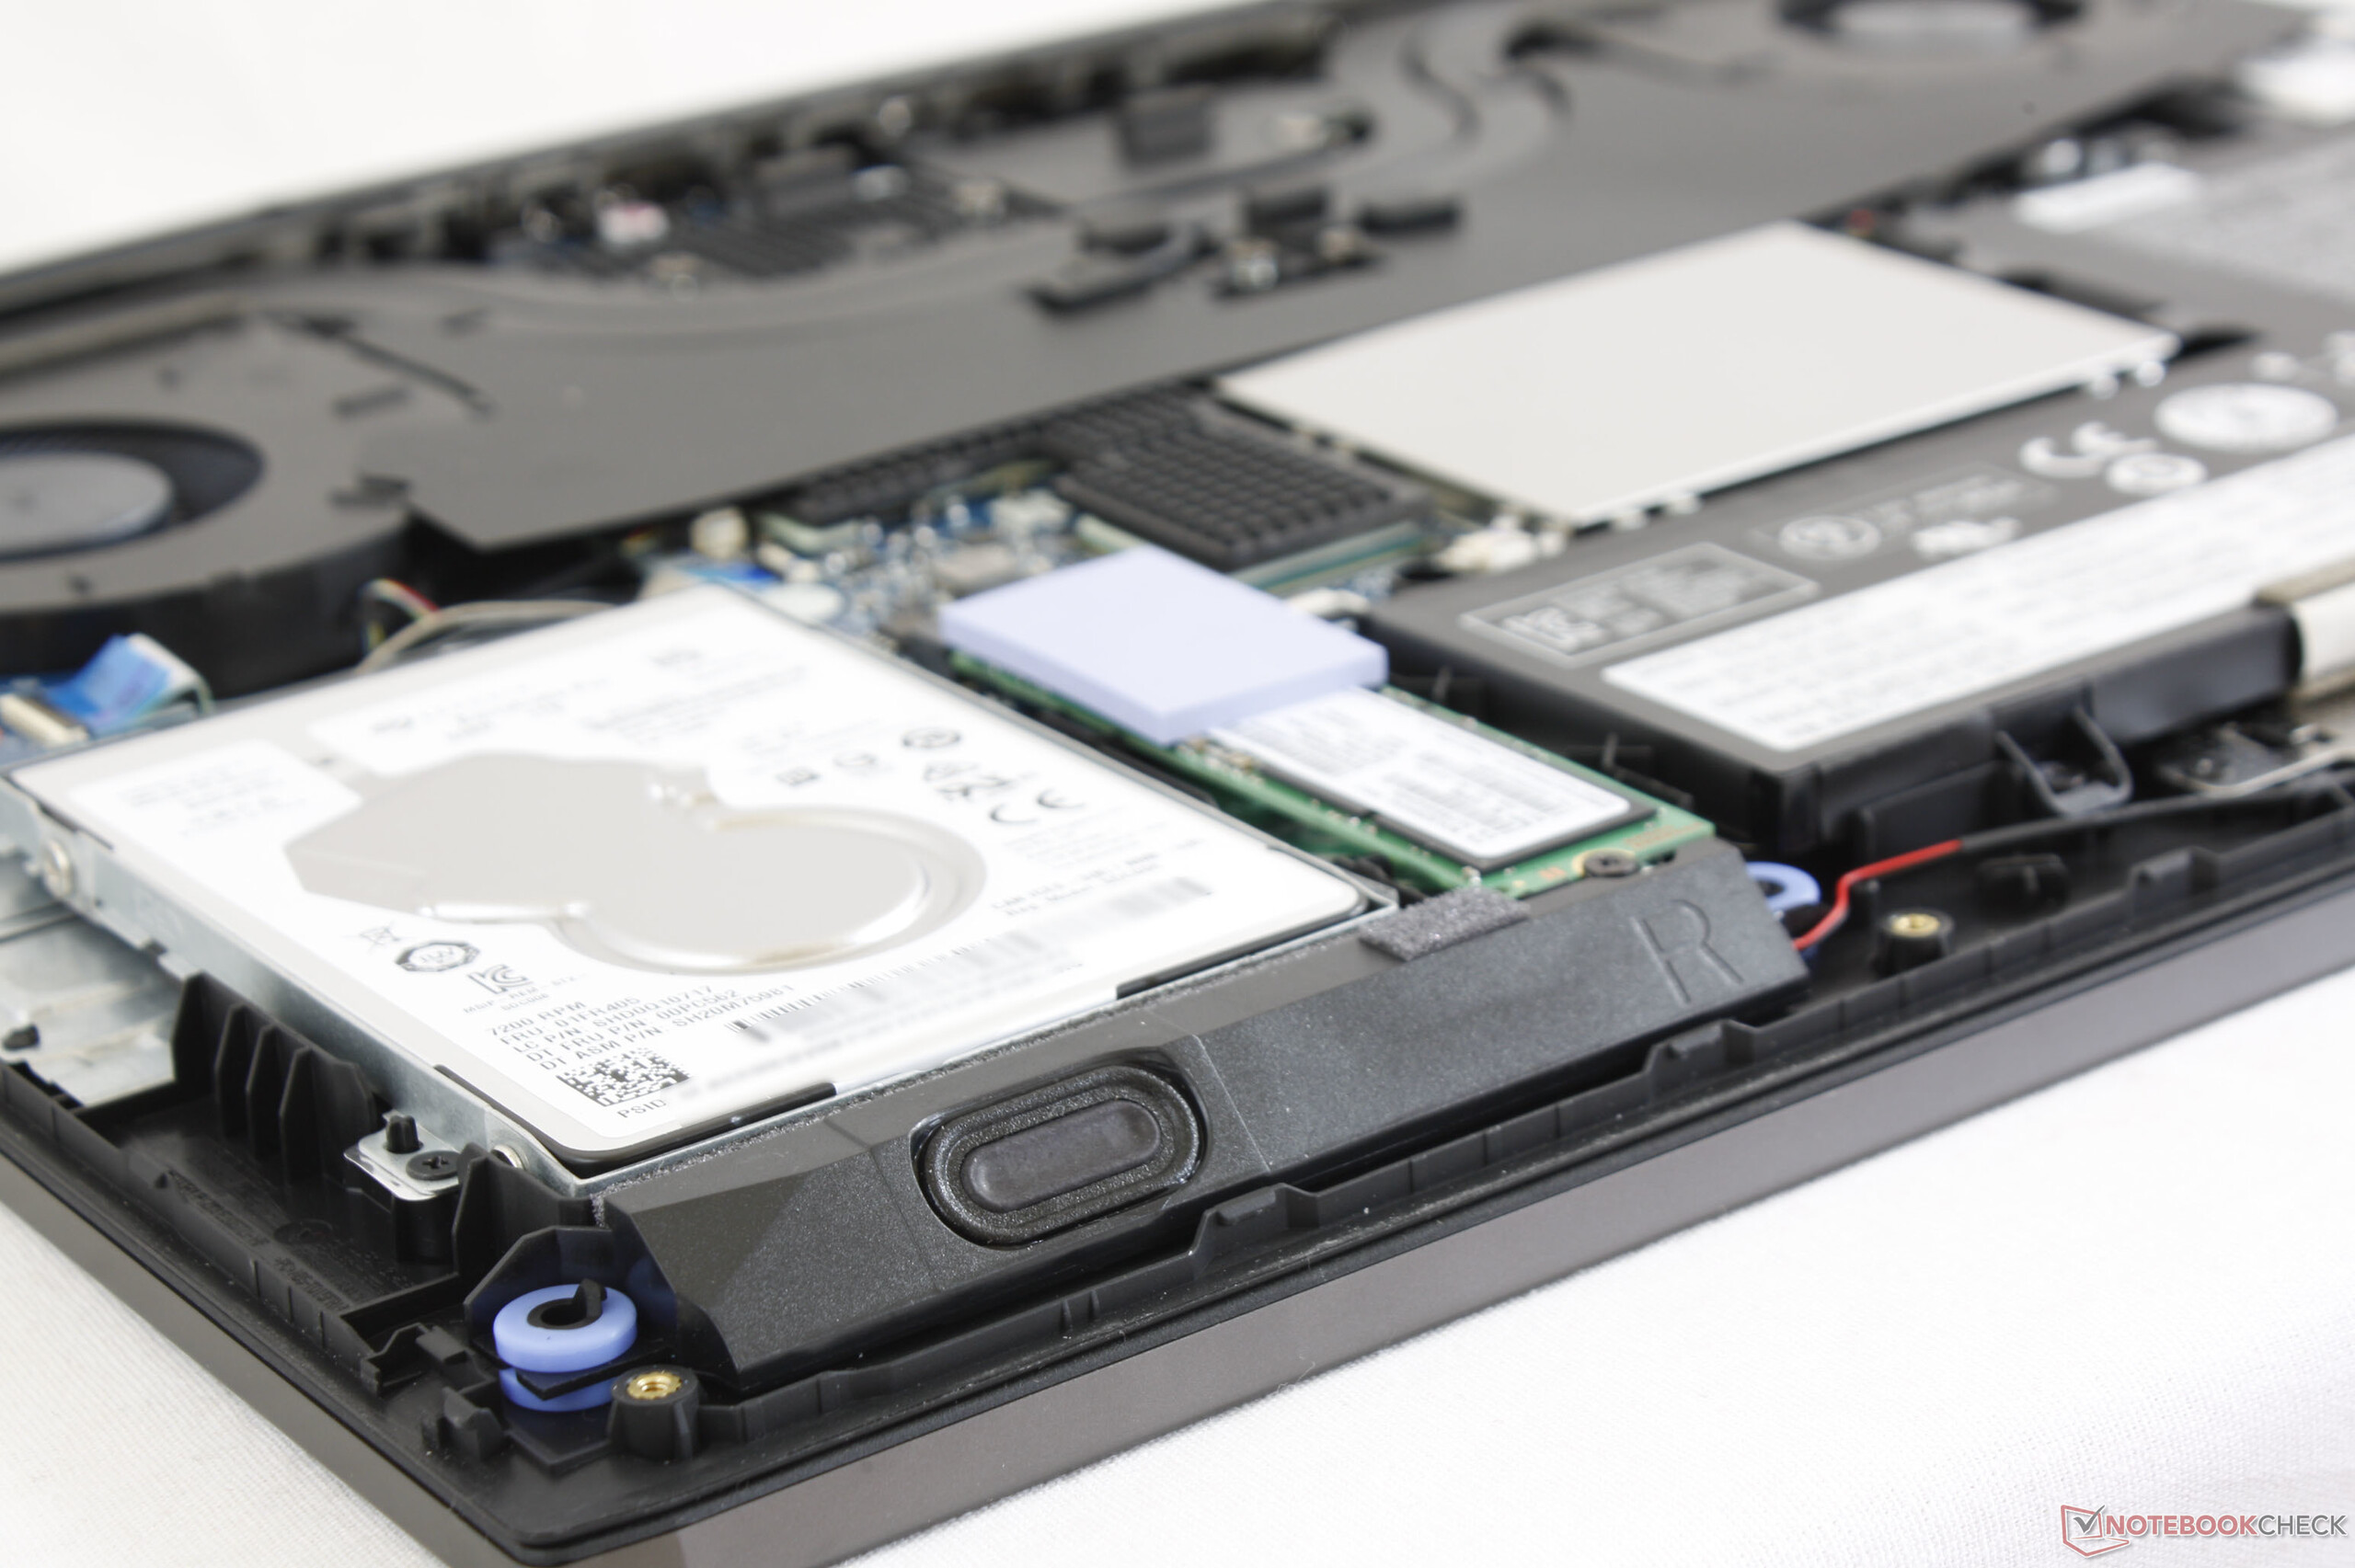
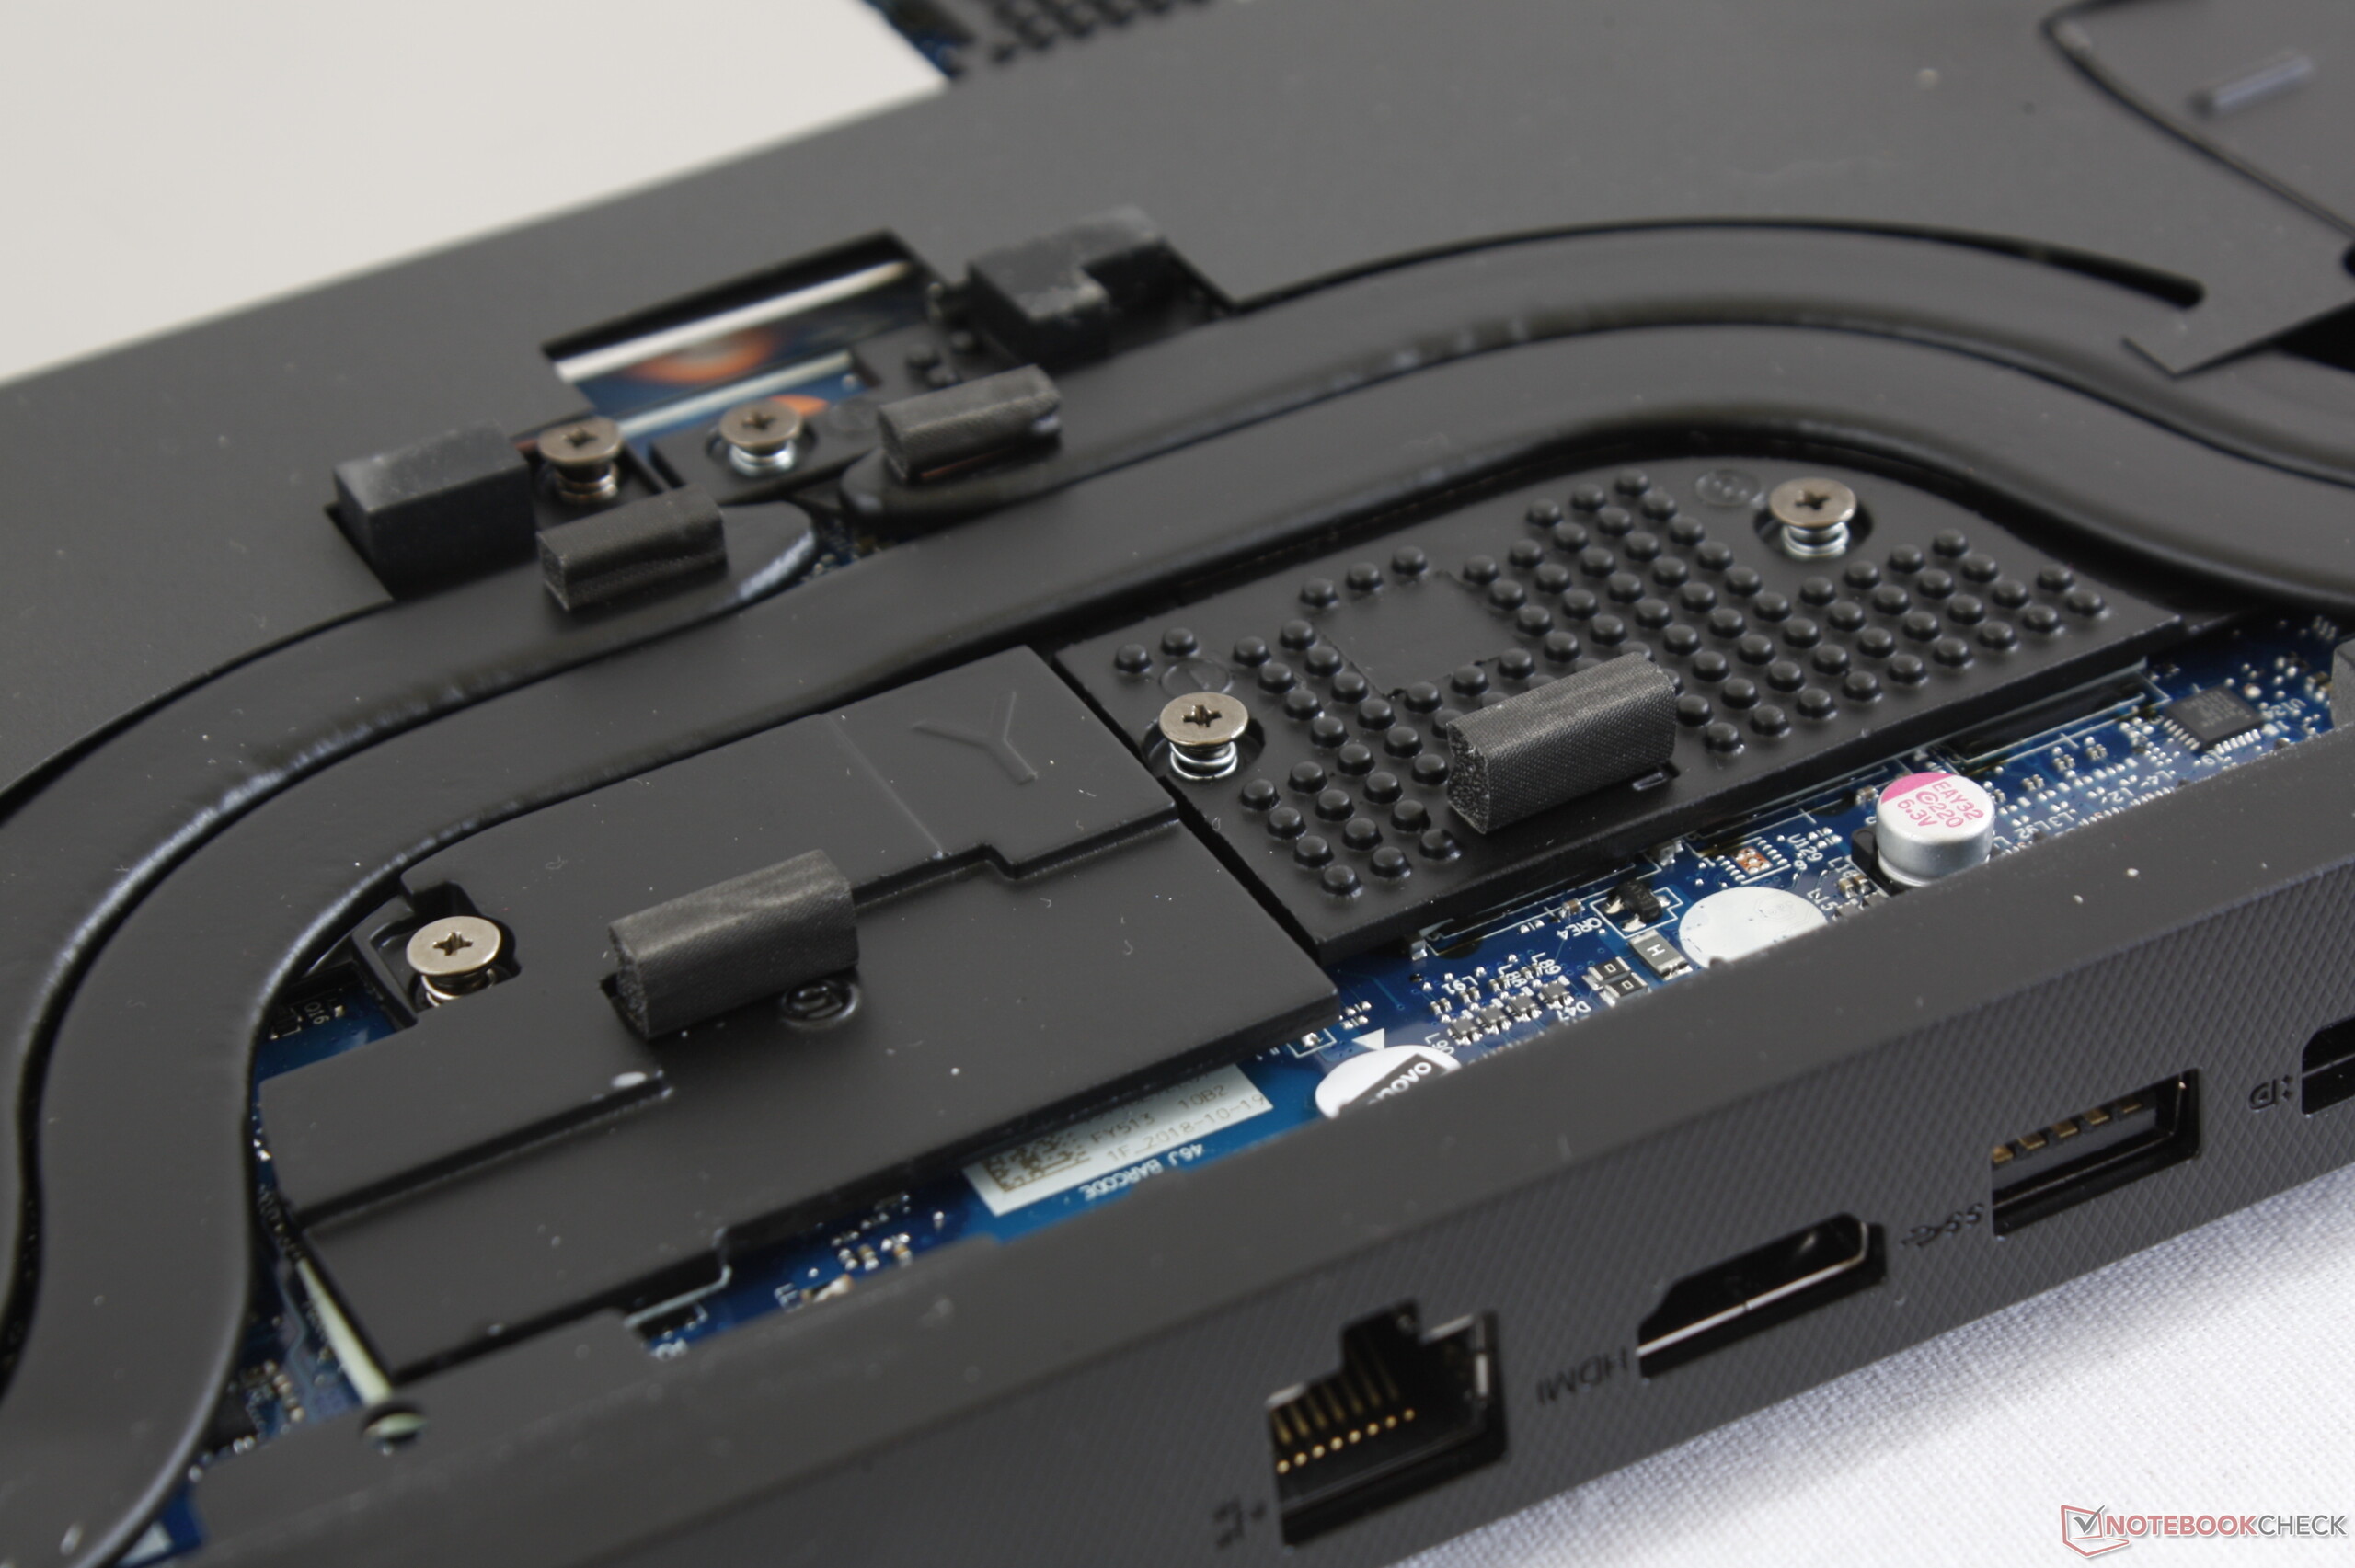
En värd spelmaskin som inte känns som eller ser ut som en billig budgetprodukt. Lenovo Legion Y7000 lyckas bra med kärnprestandan samtidigt som den kastar av sig extrafunktioner för att hålla priset nere. Delar av de nya designvalen kan dock vara irriterande, som att ytorna älskar fingeravtryck, att portplaceringen är opraktisk och att den är svår att underhålla.
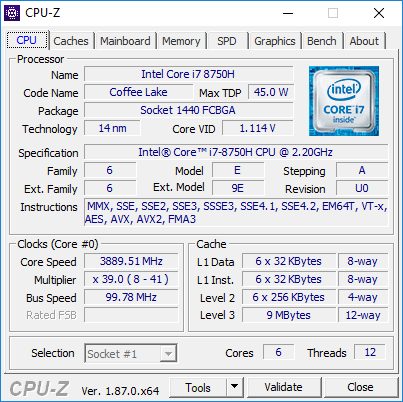
Lenovo Legion Y7000P-1060
- 09/20/2019 v7 (old)
Allen Ngo
Price comparison
