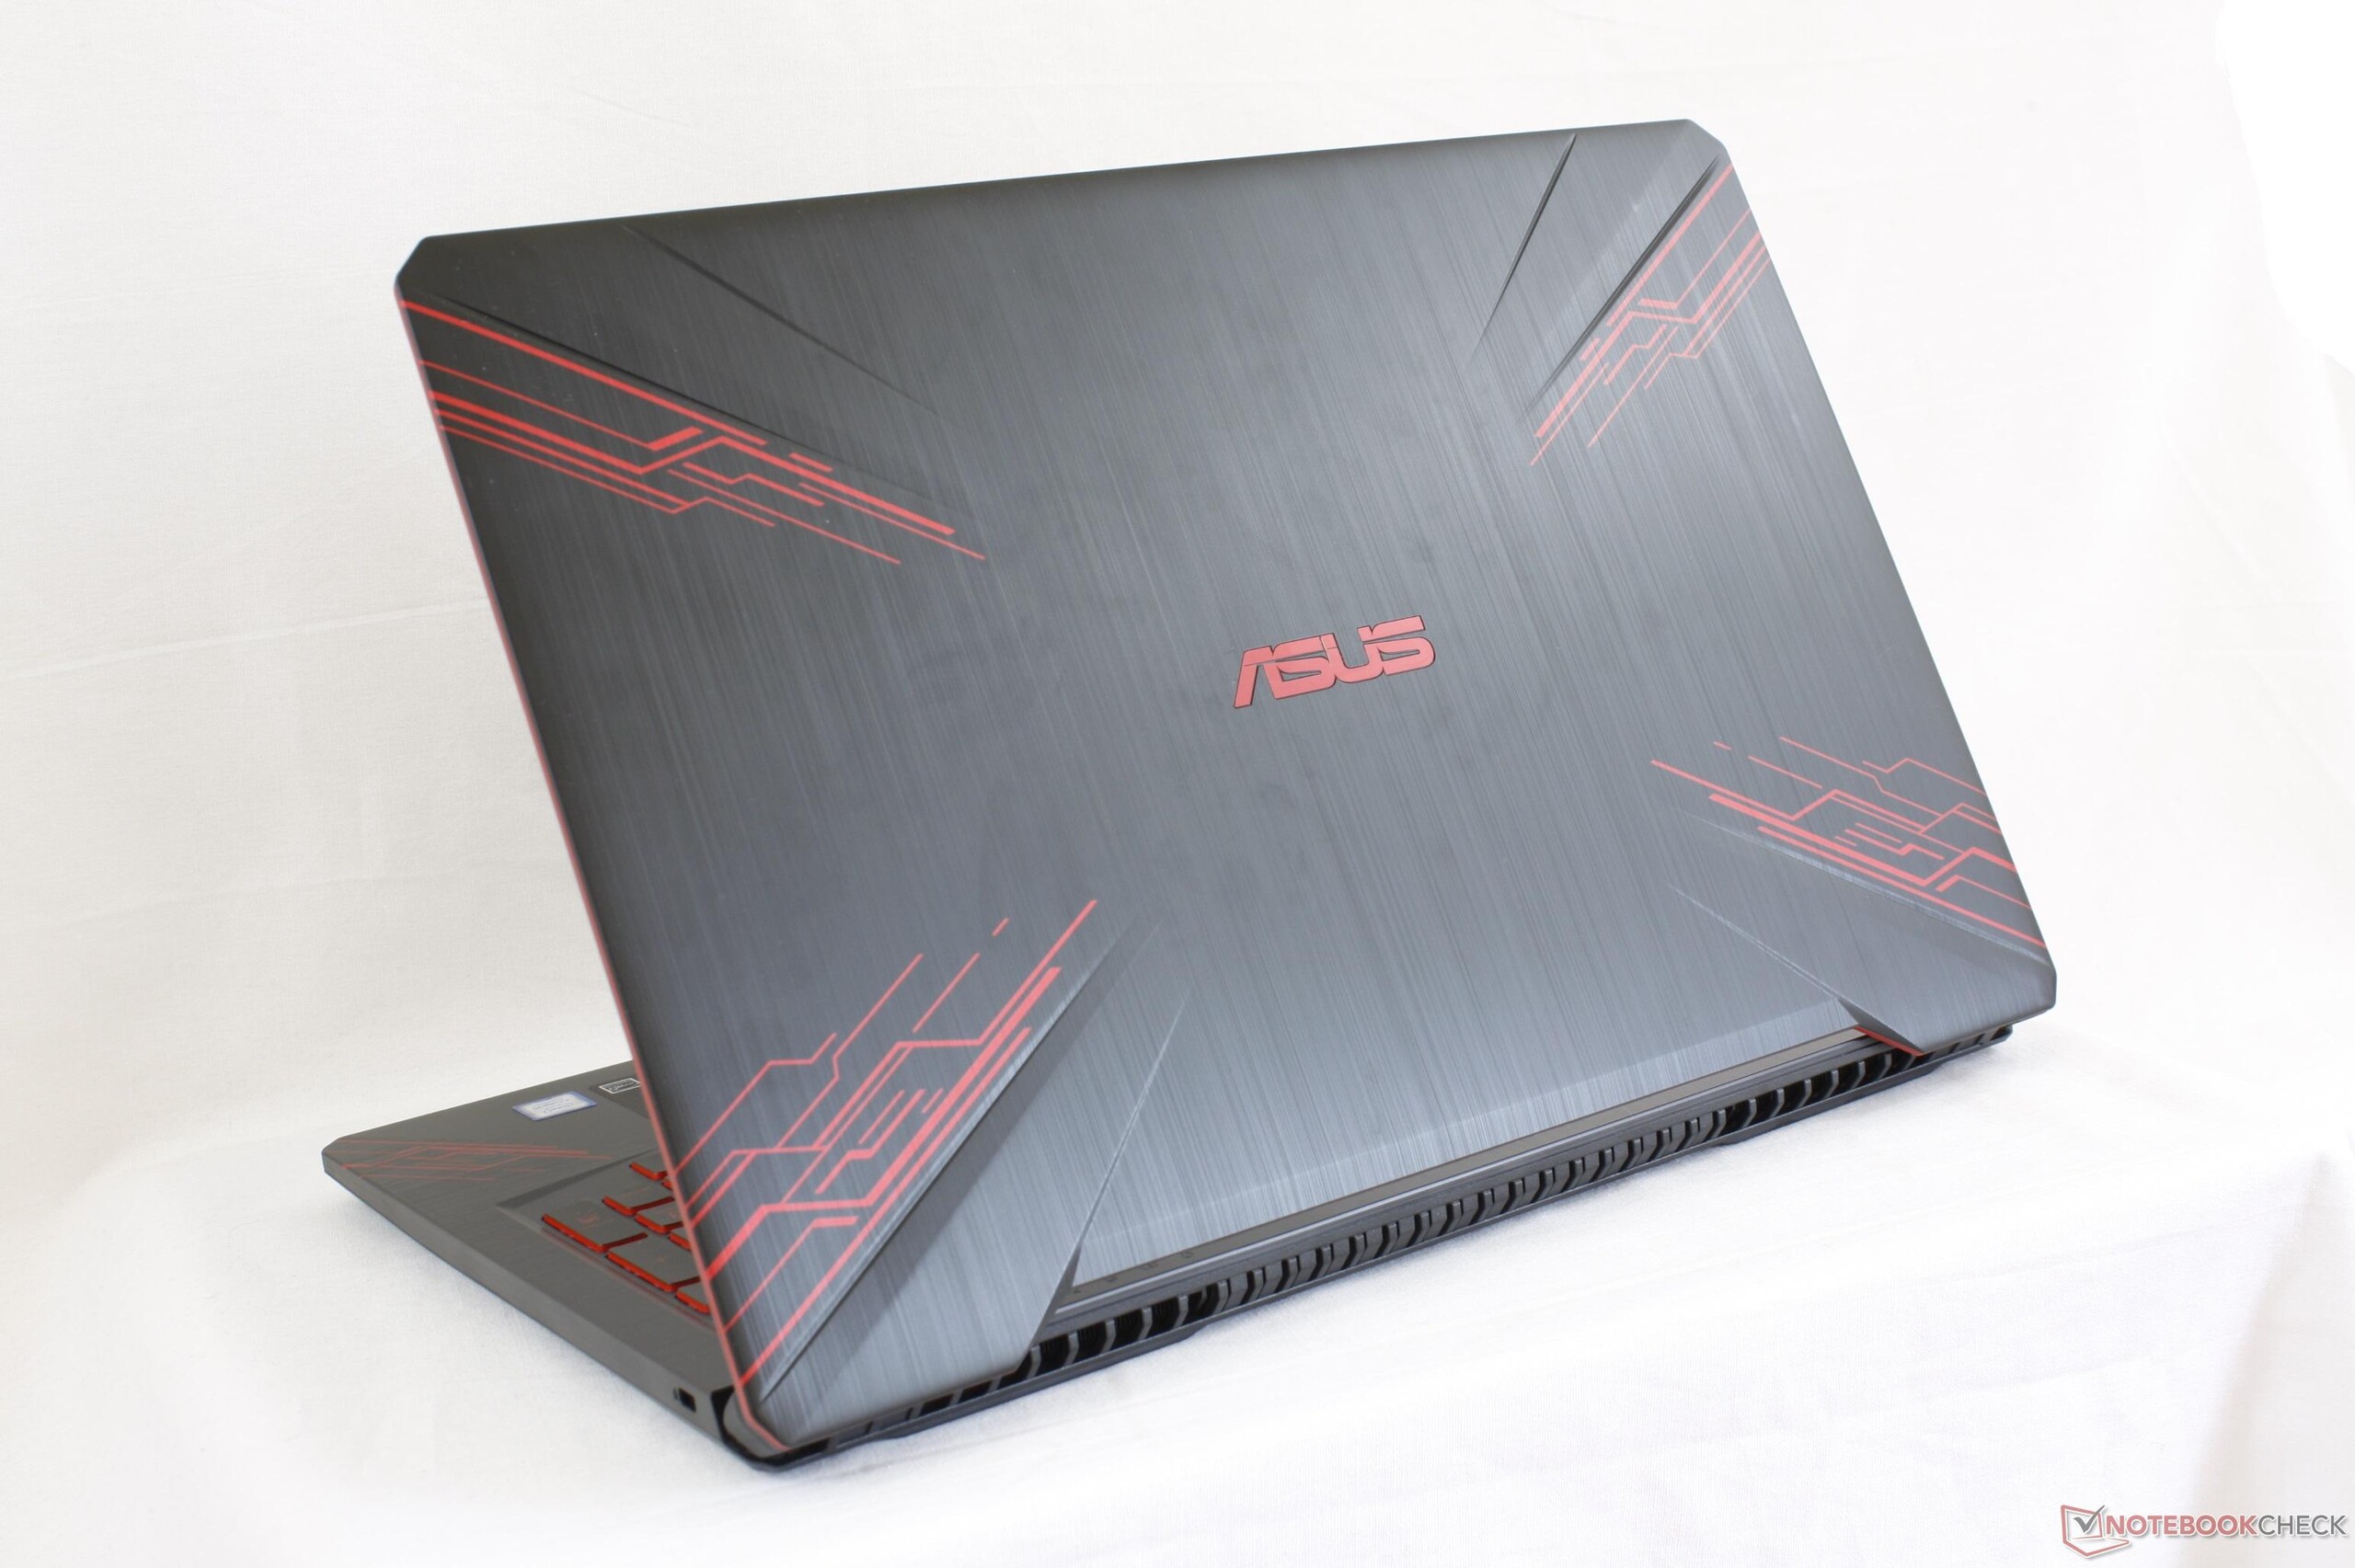
Test: Asus TUF FX504GD (Core i5-8300H, GTX 1050) Laptop (Sammanfattning)
| Networking | |
| iperf3 transmit AX12 | |
| Asus FX504GD | |
| Asus FX503VM-EH73 | |
| MSI GP62 7REX-1045US | |
| iperf3 receive AX12 | |
| Asus FX504GD | |
| Asus FX503VM-EH73 | |
| MSI GP62 7REX-1045US | |
| |||||||||||||||||||||||||
Distribution av ljusstyrkan: 85 %
Mitt på batteriet: 260 cd/m²
Kontrast: 473:1 (Svärta: 0.55 cd/m²)
ΔE ColorChecker Calman: 7 | ∀{0.5-29.43 Ø4.71}
calibrated: 5.27
ΔE Greyscale Calman: 6.1 | ∀{0.09-98 Ø4.96}
61% sRGB (Argyll 1.6.3 3D)
35.5% AdobeRGB 1998 (Argyll 1.6.3 3D)
38.34% AdobeRGB 1998 (Argyll 3D)
55.8% sRGB (Argyll 3D)
37.09% Display P3 (Argyll 3D)
Gamma: 1.97
CCT: 7894 K
| Asus FX504GD AU Optronics B156HTN03.8, TN LED, 15.6", 1920x1080 | Lenovo Legion Y520-15IKBN 80WK0042GE LG Philips LP156WF6-SPK3, IPS, 15.6", 1920x1080 | Asus FX503VM-EH73 AU Optronics B156HAN06.1, IPS, 15.6", 1920x1080 | Dell Inspiron 15 7000 7577 ID: LG Philips LGD053F, Name: 156WF6, Dell P/N: 4XK13, IPS, 15.6", 1920x1080 | MSI GP62 7REX-1045US CMN N156HGE-EAL, TN LED, 15.6", 1920x1080 | Gigabyte Aero 15X v8 LGD05C0, IPS, 15.6", 1920x1080 | |
|---|---|---|---|---|---|---|
| Display | 5% | 1% | 9% | 110% | 69% | |
| Display P3 Coverage (%) | 37.09 | 39.01 5% | 37.48 1% | 40.4 9% | 85.8 131% | 63.6 71% |
| sRGB Coverage (%) | 55.8 | 58.4 5% | 56.3 1% | 60.5 8% | 100 79% | 93.8 68% |
| AdobeRGB 1998 Coverage (%) | 38.34 | 40.34 5% | 38.72 1% | 41.77 9% | 84.2 120% | 64.9 69% |
| Response Times | -43% | -48% | -42% | -27% | 43% | |
| Response Time Grey 50% / Grey 80% * (ms) | 41.6 ? | 39 ? 6% | 36.8 ? 12% | 41 ? 1% | 34.4 ? 17% | 16.8 ? 60% |
| Response Time Black / White * (ms) | 15.2 ? | 29 ? -91% | 31.6 ? -108% | 28 ? -84% | 26 ? -71% | 11.2 ? 26% |
| PWM Frequency (Hz) | 21000 ? | 200 ? | ||||
| Screen | 19% | 21% | 39% | 3% | 56% | |
| Brightness middle (cd/m²) | 260 | 283 9% | 235.9 -9% | 257 -1% | 265.7 2% | 313 20% |
| Brightness (cd/m²) | 241 | 281 17% | 235 -2% | 229 -5% | 243 1% | 300 24% |
| Brightness Distribution (%) | 85 | 91 7% | 91 7% | 84 -1% | 87 2% | 78 -8% |
| Black Level * (cd/m²) | 0.55 | 0.39 29% | 0.27 51% | 0.17 69% | 0.63 -15% | 0.33 40% |
| Contrast (:1) | 473 | 726 53% | 874 85% | 1512 220% | 422 -11% | 948 100% |
| Colorchecker dE 2000 * | 7 | 6.1 13% | 4.81 31% | 5.34 24% | 9.6 -37% | 1.29 82% |
| Colorchecker dE 2000 max. * | 22.52 | 11.08 51% | 21.55 4% | 9.99 56% | 18.5 18% | 2.04 91% |
| Colorchecker dE 2000 calibrated * | 5.27 | |||||
| Greyscale dE 2000 * | 6.1 | 5.69 7% | 3.1 49% | 4.82 21% | 12.7 -108% | 0.69 89% |
| Gamma | 1.97 112% | 2.44 90% | 2.31 95% | 2.46 89% | 2.01 109% | 2.43 91% |
| CCT | 7894 82% | 6702 97% | 6984 93% | 6587 99% | 13654 48% | 6550 99% |
| Color Space (Percent of AdobeRGB 1998) (%) | 35.5 | 37 4% | 36 1% | 38 7% | 76 114% | 60 69% |
| Color Space (Percent of sRGB) (%) | 61 | 58 -5% | 56 -8% | 60 -2% | 100 64% | 94 54% |
| Totalt genomsnitt (program/inställningar) | -6% /
8% | -9% /
8% | 2% /
22% | 29% /
20% | 56% /
57% |
* ... mindre är bättre
Visa svarstider
| ↔ Svarstid svart till vitt | ||
|---|---|---|
| 15.2 ms ... stiga ↗ och falla ↘ kombinerat | ↗ 10 ms stiga | 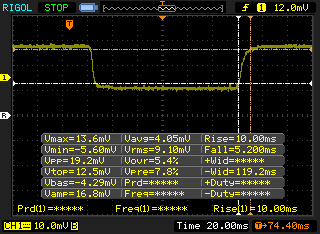 |
| ↘ 5.2 ms hösten | ||
| Skärmen visar bra svarsfrekvens i våra tester, men kan vara för långsam för konkurrenskraftiga spelare. I jämförelse sträcker sig alla testade enheter från 0.1 (minst) till 240 (maximalt) ms. » 37 % av alla enheter är bättre. Det betyder att den uppmätta svarstiden är bättre än genomsnittet av alla testade enheter (19.8 ms). | ||
| ↔ Svarstid 50 % grått till 80 % grått | ||
| 41.6 ms ... stiga ↗ och falla ↘ kombinerat | ↗ 19.6 ms stiga | 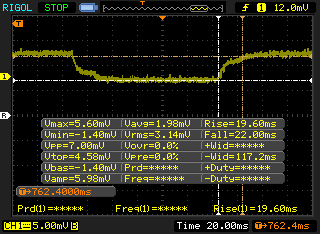 |
| ↘ 22 ms hösten | ||
| Skärmen visar långsamma svarsfrekvenser i våra tester och kommer att vara otillfredsställande för spelare. I jämförelse sträcker sig alla testade enheter från 0.165 (minst) till 636 (maximalt) ms. » 67 % av alla enheter är bättre. Detta innebär att den uppmätta svarstiden är sämre än genomsnittet av alla testade enheter (31 ms). | ||
Skärmflimmer / PWM (Puls-Width Modulation)
| Skärmflimmer / PWM upptäcktes inte | 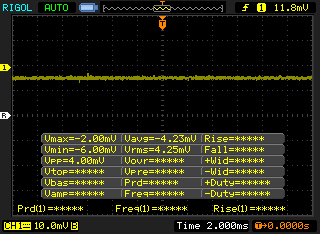 | ||
Som jämförelse: 52 % av alla testade enheter använder inte PWM för att dämpa skärmen. Om PWM upptäcktes mättes ett medelvärde av 7757 (minst: 5 - maximum: 343500) Hz. | |||
| Cinebench R10 | |
| Rendering Multiple CPUs 32Bit | |
| Aorus X9 DT | |
| Test: Ryzen 5 2600 och Ryzen 7 2700 (Sammanfattning) | |
| Asus GL703GE-ES73 | |
| Genomsnitt Intel Core i5-8300H (20061 - 24718, n=4) | |
| Asus FX503VM-EH73 | |
| Asus FX504GD | |
| Lenovo Yoga 730-13IKB-81CT | |
| MSI GE72VR-6RF16H21 | |
| Dell Inspiron 15 7000 7577 | |
| Rendering Single 32Bit | |
| Aorus X9 DT | |
| Asus FX504GD | |
| Genomsnitt Intel Core i5-8300H (6115 - 6524, n=4) | |
| Asus GL703GE-ES73 | |
| Asus FX503VM-EH73 | |
| Lenovo Yoga 730-13IKB-81CT | |
| Dell Inspiron 15 7000 7577 | |
| MSI GE72VR-6RF16H21 | |
| Test: Ryzen 5 2600 och Ryzen 7 2700 (Sammanfattning) | |
* ... mindre är bättre
| PCMark 10 - Score | |
| Gigabyte Aero 15X v8 | |
| Asus FX503VM-EH73 | |
| MSI GP62 7REX-1045US | |
| Lenovo Legion Y520-15IKBN 80WK0042GE | |
| Asus FX504GD | |
| Dell Inspiron 15 7000 7577 | |
| PCMark 8 Home Score Accelerated v2 | 3909 poäng | |
| PCMark 8 Creative Score Accelerated v2 | 4646 poäng | |
| PCMark 8 Work Score Accelerated v2 | 5018 poäng | |
| PCMark 10 Score | 3808 poäng | |
Hjälp | ||
| Asus FX504GD Seagate Mobile HDD 1TB ST1000LX015-1U7172 | Asus FX503VM-EH73 SanDisk SD8SN8U128G1002 | Dell Inspiron 15 7000 7577 Seagate Mobile HDD 1TB ST1000LX015-1U7172 | MSI GP62 7REX-1045US Toshiba NVMe THNSN5128GP | Gigabyte Aero 15X v8 Toshiba NVMe THNSN5512GPU7 | Genomsnitt Seagate Mobile HDD 1TB ST1000LX015-1U7172 | |
|---|---|---|---|---|---|---|
| CrystalDiskMark 5.2 / 6 | 17375% | -10% | 38865% | 24087% | 25% | |
| Write 4K (MB/s) | 0.27 | 51.2 18863% | 0.42 56% | 158.4 58567% | 94.4 34863% | 0.4682 ? 73% |
| Read 4K (MB/s) | 0.586 | 24.82 4135% | 0.41 -30% | 45.04 7586% | 37.65 6325% | 0.533 ? -9% |
| Write Seq (MB/s) | 86.8 | 313.1 261% | 55.6 -36% | 622 617% | 1335 1438% | 75.6 ? -13% |
| Read Seq (MB/s) | 113.2 | 458.3 305% | 114.3 1% | 1592 1306% | 1404 1140% | 116.1 ? 3% |
| Write 4K Q32T1 (MB/s) | 0.242 | 208.1 85892% | 0.238 -2% | 434.2 179321% | 268.6 110892% | 0.643 ? 166% |
| Read 4K Q32T1 (MB/s) | 0.963 | 279.3 28903% | 0.942 -2% | 590 61167% | 332.8 34459% | 1.067 ? 11% |
| Write Seq Q32T1 (MB/s) | 98.4 | 337.9 243% | 68.2 -31% | 630 540% | 1375 1297% | 81.9 ? -17% |
| Read Seq Q32T1 (MB/s) | 110.2 | 545 395% | 69.6 -37% | 2108 1813% | 2627 2284% | 97 ? -12% |

| 3DMark 11 | |
| 1280x720 Performance GPU | |
| Asus FX503VM-EH73 | |
| Dell Inspiron 15 7000 7577 | |
| Asus Strix GL502VY-DS71 | |
| Dell XPS 15 9575 i7-8705G | |
| Asus Strix GL502VT-DS74 | |
| Asus GL703GE-ES73 | |
| Genomsnitt NVIDIA GeForce GTX 1050 Mobile (6744 - 8903, n=42) | |
| Asus FX504GD | |
| Asus Zenbook UX510UW-CN044T | |
| Lenovo ThinkPad T580-20LAS01H00 | |
| 1280x720 Performance Combined | |
| Asus GL703GE-ES73 | |
| Dell XPS 15 9575 i7-8705G | |
| Asus Strix GL502VY-DS71 | |
| Asus Strix GL502VT-DS74 | |
| Asus FX503VM-EH73 | |
| Asus FX504GD | |
| Genomsnitt NVIDIA GeForce GTX 1050 Mobile (4446 - 7607, n=42) | |
| Dell Inspiron 15 7000 7577 | |
| Asus Zenbook UX510UW-CN044T | |
| Lenovo ThinkPad T580-20LAS01H00 | |
| 3DMark 11 Performance | 6971 poäng | |
| 3DMark Ice Storm Standard Score | 128216 poäng | |
| 3DMark Cloud Gate Standard Score | 18404 poäng | |
| 3DMark Fire Strike Score | 5656 poäng | |
| 3DMark Fire Strike Extreme Score | 2702 poäng | |
| 3DMark Time Spy Score | 1729 poäng | |
Hjälp | ||
| BioShock Infinite - 1920x1080 Ultra Preset, DX11 (DDOF) | |
| Alienware 13 R3 (i5-7300HQ, GTX 1050 Ti) | |
| Asus Strix GL502VT-DS74 | |
| Asus GL503VD-DB74 | |
| Dell Inspiron 15 7000 7577 | |
| Asus FX504GD | |
| Asus ZenBook Flip 15 UX561UD | |
| Huawei Matebook X Pro i5 | |
| låg | med. | hög | ultra | |
|---|---|---|---|---|
| BioShock Infinite (2013) | 192.7 | 167.8 | 151.5 | 63 |
| The Witcher 3 (2015) | 119.9 | 72.2 | 40.9 | 22.2 |
| Rise of the Tomb Raider (2016) | 85.9 | 71.8 | 38.2 | 31.9 |
Ljudnivå
| Låg belastning |
| 29 / 29.2 / 29.7 dB(A) |
| Hög belastning |
| 44.3 / 47.7 dB(A) |
 | ||
30 dB tyst 40 dB(A) hörbar 50 dB(A) högt ljud |
||
min: | ||
| Asus FX504GD GeForce GTX 1050 Mobile, i5-8300H, Seagate Mobile HDD 1TB ST1000LX015-1U7172 | Lenovo Legion Y520-15IKBN 80WK0042GE GeForce GTX 1050 Ti Mobile, i5-7300HQ, Samsung PM961 NVMe MZVLW128HEGR | Asus FX503VM-EH73 GeForce GTX 1060 Mobile, i7-7700HQ, SanDisk SD8SN8U128G1002 | Dell Inspiron 15 7000 7577 GeForce GTX 1050 Mobile, i5-7300HQ, Seagate Mobile HDD 1TB ST1000LX015-1U7172 | MSI GP62 7REX-1045US GeForce GTX 1050 Ti Mobile, i7-7700HQ, Toshiba NVMe THNSN5128GP | Gigabyte Aero 15X v8 GeForce GTX 1070 Max-Q, i7-8750H, Toshiba NVMe THNSN5512GPU7 | |
|---|---|---|---|---|---|---|
| Noise | 0% | -3% | -3% | -5% | -11% | |
| av / miljö * (dB) | 28.1 | 30.6 -9% | 27.8 1% | 31 -10% | 28 -0% | 29 -3% |
| Idle Minimum * (dB) | 29 | 31.9 -10% | 29.6 -2% | 32.7 -13% | 32.2 -11% | 30 -3% |
| Idle Average * (dB) | 29.2 | 31.9 -9% | 29.6 -1% | 32.7 -12% | 32.2 -10% | 31 -6% |
| Idle Maximum * (dB) | 29.7 | 31.9 -7% | 29.6 -0% | 32.7 -10% | 32.2 -8% | 35 -18% |
| Load Average * (dB) | 44.3 | 34.6 22% | 37.3 16% | 38.7 13% | 40.9 8% | 49 -11% |
| Witcher 3 ultra * (dB) | 40.7 | 39.3 3% | 49.8 -22% | 39 4% | 45.4 -12% | 51 -25% |
| Load Maximum * (dB) | 47.7 | 41.7 13% | 53.7 -13% | 44.6 6% | 48.6 -2% | 54 -13% |
* ... mindre är bättre
(-) Den maximala temperaturen på ovansidan är 55.8 °C / 132 F, jämfört med genomsnittet av 40.4 °C / 105 F , allt från 21.2 till 68.8 °C för klassen Gaming.
(-) Botten värms upp till maximalt 51.4 °C / 125 F, jämfört med genomsnittet av 43.2 °C / 110 F
(+) Vid tomgångsbruk är medeltemperaturen för ovansidan 25.3 °C / 78 F, jämfört med enhetsgenomsnittet på 33.9 °C / ### class_avg_f### F.
(±) När du spelar The Witcher 3 är medeltemperaturen för ovansidan 37.3 °C / 99 F, jämfört med enhetsgenomsnittet på 33.9 °C / ## #class_avg_f### F.
(+) Handledsstöden och pekplattan når maximal hudtemperatur (32.4 °C / 90.3 F) och är därför inte varma.
(-) Medeltemperaturen för handledsstödsområdet på liknande enheter var 28.8 °C / 83.8 F (-3.6 °C / -6.5 F).
Asus FX504GD ljudanalys
(-) | inte särskilt höga högtalare (70.4 dB)
Bas 100 - 315 Hz
(-) | nästan ingen bas - i genomsnitt 17.6% lägre än medianen
(±) | linjäriteten för basen är genomsnittlig (10.9% delta till föregående frekvens)
Mellan 400 - 2000 Hz
(+) | balanserad mellan - endast 3.9% från medianen
(±) | linjäriteten för mids är genomsnittlig (7.7% delta till föregående frekvens)
Högsta 2 - 16 kHz
(±) | högre toppar - i genomsnitt 5.3% högre än medianen
(±) | linjäriteten för toppar är genomsnittlig (9.8% delta till föregående frekvens)
Totalt 100 - 16 000 Hz
(±) | linjäriteten för det totala ljudet är genomsnittlig (25% skillnad mot median)
Jämfört med samma klass
» 90% av alla testade enheter i den här klassen var bättre, 3% liknande, 7% sämre
» Den bästa hade ett delta på 6%, genomsnittet var 18%, sämst var 132%
Jämfört med alla testade enheter
» 76% av alla testade enheter var bättre, 5% liknande, 18% sämre
» Den bästa hade ett delta på 4%, genomsnittet var 23%, sämst var 134%
Apple MacBook 12 (Early 2016) 1.1 GHz ljudanalys
(+) | högtalare kan spela relativt högt (83.6 dB)
Bas 100 - 315 Hz
(±) | reducerad bas - i genomsnitt 11.3% lägre än medianen
(±) | linjäriteten för basen är genomsnittlig (14.2% delta till föregående frekvens)
Mellan 400 - 2000 Hz
(+) | balanserad mellan - endast 2.4% från medianen
(+) | mids är linjära (5.5% delta till föregående frekvens)
Högsta 2 - 16 kHz
(+) | balanserade toppar - endast 2% från medianen
(+) | toppar är linjära (4.5% delta till föregående frekvens)
Totalt 100 - 16 000 Hz
(+) | det totala ljudet är linjärt (10.2% skillnad mot median)
Jämfört med samma klass
» 7% av alla testade enheter i den här klassen var bättre, 2% liknande, 90% sämre
» Den bästa hade ett delta på 5%, genomsnittet var 18%, sämst var 53%
Jämfört med alla testade enheter
» 5% av alla testade enheter var bättre, 1% liknande, 94% sämre
» Den bästa hade ett delta på 4%, genomsnittet var 23%, sämst var 134%
| Av/Standby | |
| Låg belastning | |
| Hög belastning |
|
Förklaring:
min: | |
| Asus FX504GD i5-8300H, GeForce GTX 1050 Mobile, Seagate Mobile HDD 1TB ST1000LX015-1U7172, TN LED, 1920x1080, 15.6" | Lenovo Legion Y520-15IKBN 80WK0042GE i5-7300HQ, GeForce GTX 1050 Ti Mobile, Samsung PM961 NVMe MZVLW128HEGR, IPS, 1920x1080, 15.6" | Asus FX503VM-EH73 i7-7700HQ, GeForce GTX 1060 Mobile, SanDisk SD8SN8U128G1002, IPS, 1920x1080, 15.6" | MSI GP62 7REX-1045US i7-7700HQ, GeForce GTX 1050 Ti Mobile, Toshiba NVMe THNSN5128GP, TN LED, 1920x1080, 15.6" | Gigabyte Aero 15X v8 i7-8750H, GeForce GTX 1070 Max-Q, Toshiba NVMe THNSN5512GPU7, IPS, 1920x1080, 15.6" | Dell Inspiron 15 7000 7577 4K i7-7700HQ, GeForce GTX 1060 Max-Q, SK hynix SC311 M.2, IPS, 3840x2160, 15.6" | |
|---|---|---|---|---|---|---|
| Power Consumption | 15% | -35% | -44% | -65% | 3% | |
| Idle Minimum * (Watt) | 7.2 | 5.2 28% | 12.8 -78% | 14.6 -103% | 14 -94% | 5.5 24% |
| Idle Average * (Watt) | 10.2 | 8.3 19% | 15.4 -51% | 17.2 -69% | 18 -76% | 10.5 -3% |
| Idle Maximum * (Watt) | 10.9 | 10.1 7% | 15.9 -46% | 17.3 -59% | 22 -102% | 10.9 -0% |
| Load Average * (Watt) | 93.3 | 62.7 33% | 78 16% | 82.7 11% | 91 2% | 72 23% |
| Witcher 3 ultra * (Watt) | 95.8 | 94 2% | 107.3 -12% | 107 -12% | 142 -48% | 97.4 -2% |
| Load Maximum * (Watt) | 102.5 | 100 2% | 143.4 -40% | 136.7 -33% | 173 -69% | 130.4 -27% |
* ... mindre är bättre
| Asus FX504GD i5-8300H, GeForce GTX 1050 Mobile, 48 Wh | Lenovo Legion Y520-15IKBN 80WK0042GE i5-7300HQ, GeForce GTX 1050 Ti Mobile, 45 Wh | Asus FX503VM-EH73 i7-7700HQ, GeForce GTX 1060 Mobile, 64 Wh | Dell Inspiron 15 7000 7577 i5-7300HQ, GeForce GTX 1050 Mobile, 56 Wh | MSI GP62 7REX-1045US i7-7700HQ, GeForce GTX 1050 Ti Mobile, 41 Wh | Gigabyte Aero 15X v8 i7-8750H, GeForce GTX 1070 Max-Q, 94.24 Wh | |
|---|---|---|---|---|---|---|
| Batteridrifttid | 46% | 7% | 77% | -29% | 130% | |
| Reader / Idle (h) | 7.5 | 10.6 41% | 5.7 -24% | 11.1 48% | 4.3 -43% | 12.7 69% |
| WiFi v1.3 (h) | 3.7 | 5.2 41% | 4.6 24% | 6.8 84% | 2.9 -22% | 8.6 132% |
| Load (h) | 0.9 | 1.4 56% | 1.1 22% | 1.8 100% | 0.7 -22% | 2.6 189% |
För
Emot
Läs den fullständiga versionen av den här recensionen på engelska här.
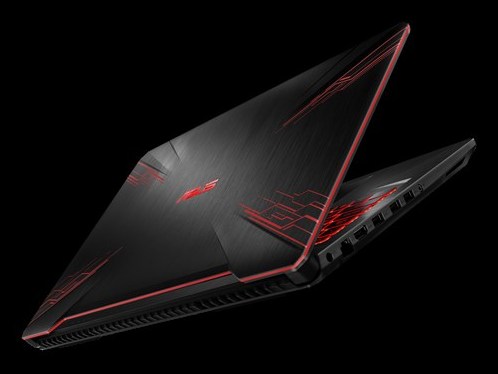
Vi välkomnar billigare spellaptops så länge dom behåller kärnfunktioner och erbjuder en balanserad upplevelse. För mycket nedskärningar och nackdelarna kan bli distraherande. För 6 000 kronor så offrar FX504 skärmkvalitet och har ingen SSD-enhet, vilket totalt sett ger en sämre upplevelse. Det vore bättre att investera 1 000 - 2 000 kronor mer på en liten primär SSD och en IPS-skärm med högre kvalitet.
Den som redan har en spellaptop med i5-7300HQ eller i7-7700HQ behöver inte uppgradera till i5-8300H om spel är prioriterat. Det hade varit mycket smartare att investera i ett system med dom äldre i7-7700HQ och GTX 1060 istället för ett system med dom nyare i5-8300H och GTX 1050 eller 1050 Ti.
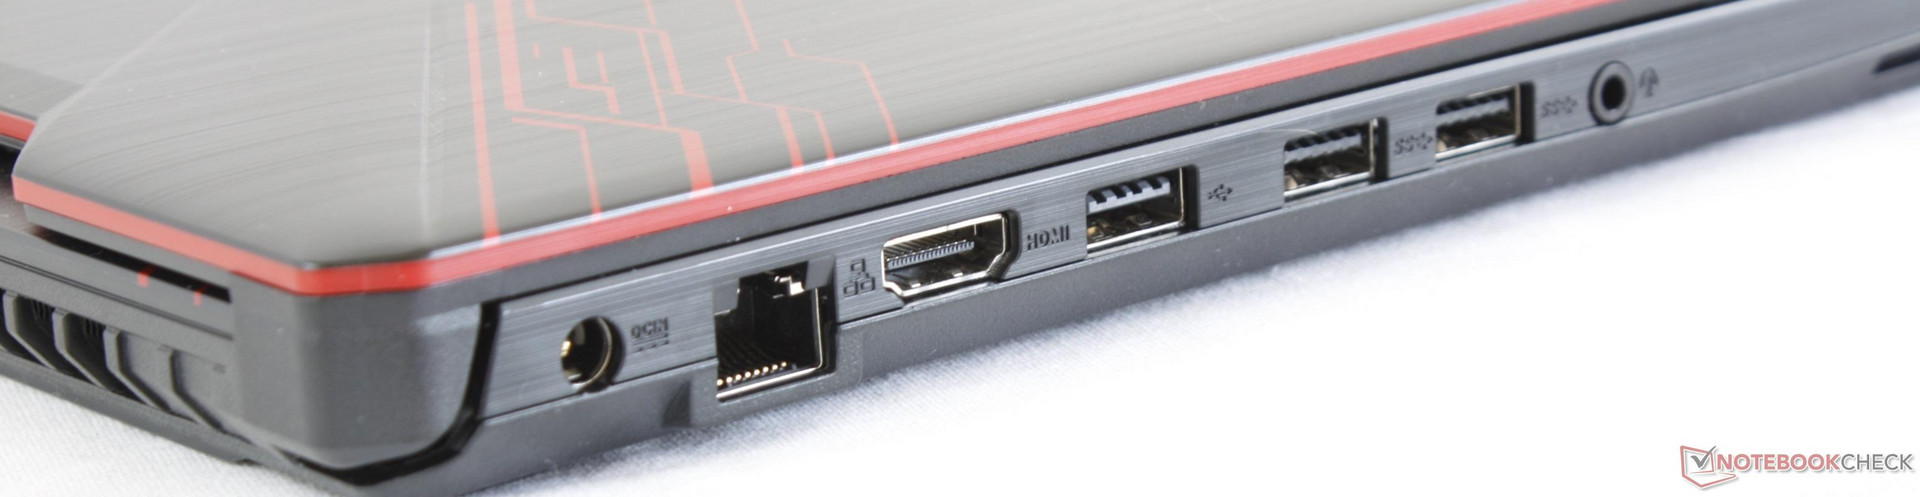
FX504 vacklar även när den jämförs med andra billiga spelsystem. Alternativ som Legion Y520, Sabre 15, och Inspiron 7577 har längre batteritid och fler portar inklusive USB Typ C och SD-kortsläsare. Gamers som vill tänka på budgeten kan vilja överväga FX503 istället för FX504 då den förstnämnda i princip är samma system men med bättre servicemöjligheter, ett större batteri och mer balanserade CPU- och GPU-alternativ.
FX504GD är en av dom billigaste spellaptop-modellerna som finns tillgänglig med GTX 1050. Men vi rekommenderar ändå att spendera lite mer på en mer högkvalitativ SKU med alternativ för IPS och SSD, eller att till och med köpa den äldre GTX 1060-baserade FX503 som kostar ungefär lika mycket.
Asus FX504GD
- 05/24/2018 v6 (old)
Allen Ngo
Price comparison
