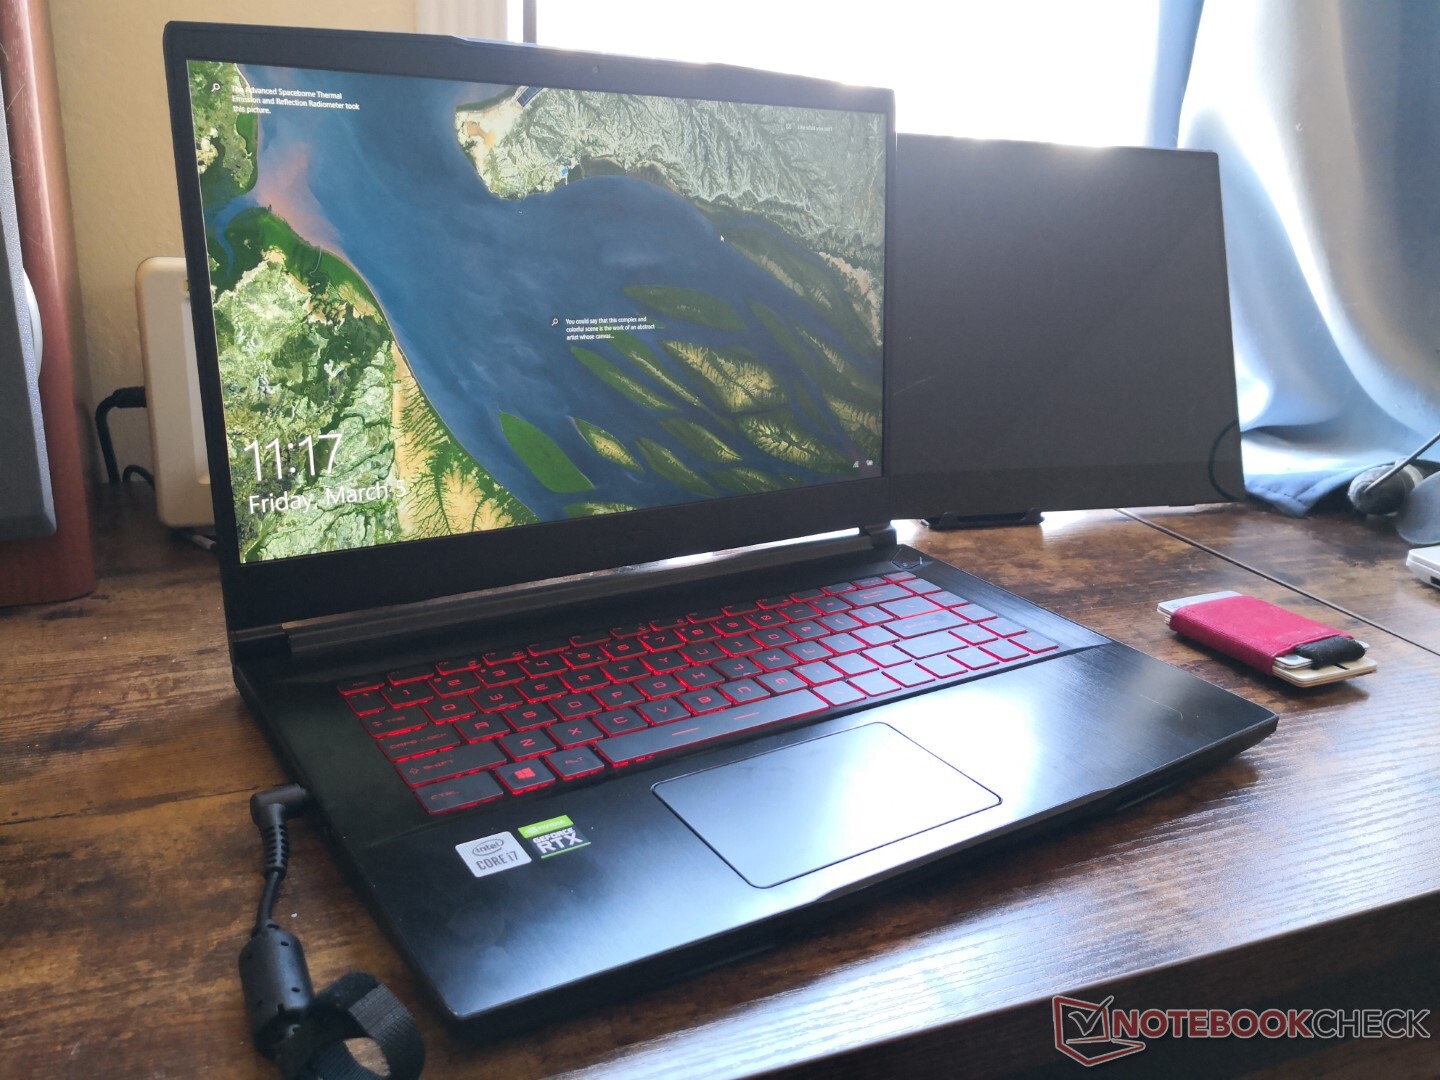
Test: MSI GF65 Thin 10UE - GeForce RTX 3060 till budgetpris (Sammanfattning)
Testgrupp
Gradering | Datum | Modell | Vikt | Höjd | Storlek | Upplösning | Pris |
|---|---|---|---|---|---|---|---|
| 80.4 % v7 (old) | 03/2021 | MSI GF65 Thin 10UE i7-10750H, GeForce RTX 3060 Laptop GPU | 1.9 kg | 21.7 mm | 15.60" | 1920x1080 | |
| 85 % v7 (old) | 02/2021 | Asus ROG Strix G15 G513QR R9 5900HX, GeForce RTX 3070 Laptop GPU | 2.3 kg | 27.2 mm | 15.60" | 1920x1080 | |
| 84.9 % v7 (old) | Schenker XMG Core 15 Ampere R7 4800H, GeForce RTX 3060 Laptop GPU | 2 kg | 22.9 mm | 15.60" | 2560x1440 | ||
| 84 % v7 (old) | 09/2021 | MSI GS66 Stealth 10UG i7-10870H, GeForce RTX 3070 Laptop GPU | 2.1 kg | 19.8 mm | 15.60" | 1920x1080 | |
| 86.4 % v7 (old) | 02/2021 | Aorus 15G XC i7-10870H, GeForce RTX 3070 Laptop GPU | 2.1 kg | 23 mm | 15.60" | 1920x1080 | |
| 86.3 % v7 (old) | 12/2020 | Lenovo Legion 7 15IMH05-81YT001VGE i9-10980HK, GeForce RTX 2080 Super Max-Q | 2.4 kg | 19.9 mm | 15.60" | 1920x1080 |

| Networking | |
| iperf3 transmit AX12 | |
| Schenker XMG Core 15 Ampere | |
| Lenovo Legion 7 15IMH05-81YT001VGE | |
| Asus ROG Strix G15 G513QR | |
| MSI GF65 Thin 10UE | |
| Aorus 15G XC | |
| MSI GS66 Stealth 10UG | |
| iperf3 receive AX12 | |
| Schenker XMG Core 15 Ampere | |
| Lenovo Legion 7 15IMH05-81YT001VGE | |
| MSI GF65 Thin 10UE | |
| Aorus 15G XC | |
| Asus ROG Strix G15 G513QR | |
| MSI GS66 Stealth 10UG | |


| |||||||||||||||||||||||||
Distribution av ljusstyrkan: 91 %
Mitt på batteriet: 266.5 cd/m²
Kontrast: 1481:1 (Svärta: 0.18 cd/m²)
ΔE ColorChecker Calman: 5.33 | ∀{0.5-29.43 Ø4.71}
calibrated: 4.36
ΔE Greyscale Calman: 4.5 | ∀{0.09-98 Ø4.96}
55.8% sRGB (Argyll 1.6.3 3D)
35.6% AdobeRGB 1998 (Argyll 1.6.3 3D)
38.9% AdobeRGB 1998 (Argyll 3D)
56.3% sRGB (Argyll 3D)
37.65% Display P3 (Argyll 3D)
Gamma: 2.35
CCT: 6289 K
| MSI GF65 Thin 10UE AU Optronics B156HAN08.4, IPS, 15.6", 1920x1080 | Asus ROG Strix G15 G513QR LQ156M1JW25, IPS, 15.6", 1920x1080 | Schenker XMG Core 15 Ampere BOE CQ NE156QHM-NY2, IPS, 15.6", 2560x1440 | MSI GS66 Stealth 10UG AU Optronics B156HAN12.0, IPS, 15.6", 1920x1080 | Aorus 15G XC Sharp LQ156M1JW03, IPS, 15.6", 1920x1080 | Lenovo Legion 7 15IMH05-81YT001VGE AUO048E, IPS, 15.6", 1920x1080 | |
|---|---|---|---|---|---|---|
| Display | 74% | 81% | 78% | 73% | 82% | |
| Display P3 Coverage (%) | 37.65 | 67.7 80% | 69.8 85% | 67.7 80% | 65.6 74% | 70.3 87% |
| sRGB Coverage (%) | 56.3 | 94.3 67% | 98.8 75% | 98.4 75% | 97.5 73% | 99.4 77% |
| AdobeRGB 1998 Coverage (%) | 38.9 | 68.2 75% | 70.7 82% | 69.1 78% | 67.1 72% | 71.3 83% |
| Response Times | 75% | 64% | 62% | 72% | 77% | |
| Response Time Grey 50% / Grey 80% * (ms) | 36.8 ? | 8.2 ? 78% | 14.8 ? 60% | 14.4 ? 61% | 9.6 ? 74% | 8 ? 78% |
| Response Time Black / White * (ms) | 31.6 ? | 9.2 ? 71% | 10.4 ? 67% | 11.6 ? 63% | 9.6 ? 70% | 8 ? 75% |
| PWM Frequency (Hz) | 24040 ? | |||||
| Screen | 27% | 40% | 29% | 37% | 47% | |
| Brightness middle (cd/m²) | 266.5 | 308 16% | 347 30% | 259.5 -3% | 288 8% | 470 76% |
| Brightness (cd/m²) | 262 | 288 10% | 328 25% | 264 1% | 270 3% | 468 79% |
| Brightness Distribution (%) | 91 | 86 -5% | 89 -2% | 90 -1% | 89 -2% | 85 -7% |
| Black Level * (cd/m²) | 0.18 | 0.23 -28% | 0.27 -50% | 0.25 -39% | 0.25 -39% | 0.21 -17% |
| Contrast (:1) | 1481 | 1339 -10% | 1285 -13% | 1038 -30% | 1152 -22% | 2238 51% |
| Colorchecker dE 2000 * | 5.33 | 3.28 38% | 1.66 69% | 2.52 53% | 1.19 78% | 3.28 38% |
| Colorchecker dE 2000 max. * | 18.28 | 8.51 53% | 3.03 83% | 5.55 70% | 3.79 79% | 7.31 60% |
| Colorchecker dE 2000 calibrated * | 4.36 | 0.83 81% | 1.23 72% | 1.93 56% | 0.71 84% | 0.8 82% |
| Greyscale dE 2000 * | 4.5 | 5 -11% | 1.6 64% | 1.7 62% | 1.6 64% | 4.49 -0% |
| Gamma | 2.35 94% | 2.057 107% | 2.278 97% | 2.04 108% | 2.229 99% | 2.4 92% |
| CCT | 6289 103% | 7393 88% | 6430 101% | 6414 101% | 6539 99% | 7438 87% |
| Color Space (Percent of AdobeRGB 1998) (%) | 35.6 | 68 91% | 71 99% | 63.3 78% | 67 88% | 65 83% |
| Color Space (Percent of sRGB) (%) | 55.8 | 90 61% | 94 68% | 98.8 77% | 90 61% | 99 77% |
| Totalt genomsnitt (program/inställningar) | 59% /
42% | 62% /
51% | 56% /
43% | 61% /
48% | 69% /
58% |
* ... mindre är bättre
Visa svarstider
| ↔ Svarstid svart till vitt | ||
|---|---|---|
| 31.6 ms ... stiga ↗ och falla ↘ kombinerat | ↗ 18.4 ms stiga | 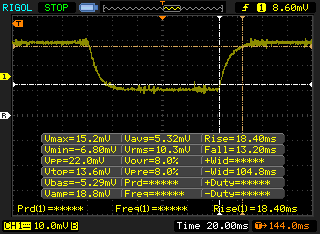 |
| ↘ 13.2 ms hösten | ||
| Skärmen visar långsamma svarsfrekvenser i våra tester och kommer att vara otillfredsställande för spelare. I jämförelse sträcker sig alla testade enheter från 0.1 (minst) till 240 (maximalt) ms. » 85 % av alla enheter är bättre. Detta innebär att den uppmätta svarstiden är sämre än genomsnittet av alla testade enheter (19.8 ms). | ||
| ↔ Svarstid 50 % grått till 80 % grått | ||
| 36.8 ms ... stiga ↗ och falla ↘ kombinerat | ↗ 19.2 ms stiga | 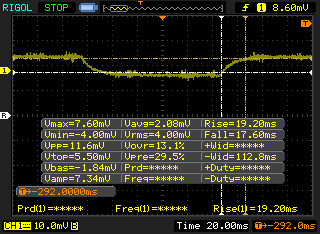 |
| ↘ 17.6 ms hösten | ||
| Skärmen visar långsamma svarsfrekvenser i våra tester och kommer att vara otillfredsställande för spelare. I jämförelse sträcker sig alla testade enheter från 0.165 (minst) till 636 (maximalt) ms. » 53 % av alla enheter är bättre. Detta innebär att den uppmätta svarstiden är sämre än genomsnittet av alla testade enheter (31 ms). | ||
Skärmflimmer / PWM (Puls-Width Modulation)
| Skärmflimmer / PWM upptäcktes inte | 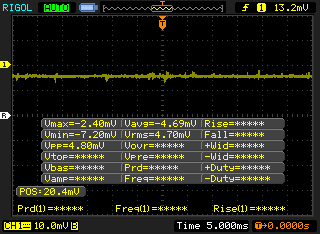 | ||
Som jämförelse: 52 % av alla testade enheter använder inte PWM för att dämpa skärmen. Om PWM upptäcktes mättes ett medelvärde av 7754 (minst: 5 - maximum: 343500) Hz. | |||
Cinebench R15: CPU Multi 64Bit | CPU Single 64Bit
Blender: v2.79 BMW27 CPU
7-Zip 18.03: 7z b 4 -mmt1 | 7z b 4
Geekbench 5.5: Single-Core | Multi-Core
HWBOT x265 Benchmark v2.2: 4k Preset
LibreOffice : 20 Documents To PDF
R Benchmark 2.5: Overall mean
| Cinebench R20 / CPU (Multi Core) | |
| Schenker XMG Core 15 Ampere | |
| Asus Zephyrus G14 GA401IV | |
| Asus ROG Strix Scar 15 G532LWS | |
| Aorus 15P XC | |
| MSI GE65 Raider 9SF-049US | |
| HP Pavilion Gaming 15-ec1206ng | |
| Genomsnitt Intel Core i7-10750H (1749 - 3325, n=43) | |
| Maingear Vector 15 | |
| MSI GF65 Thin 10UE | |
| Gateway Creator Series 15.6 GWTN156-3BK | |
| MSI GF63 Thin 9SC | |
| Cinebench R20 / CPU (Single Core) | |
| Asus Zephyrus G14 GA401IV | |
| Asus ROG Strix Scar 15 G532LWS | |
| Schenker XMG Core 15 Ampere | |
| MSI GF65 Thin 10UE | |
| MSI GE65 Raider 9SF-049US | |
| Aorus 15P XC | |
| Genomsnitt Intel Core i7-10750H (431 - 504, n=43) | |
| Gateway Creator Series 15.6 GWTN156-3BK | |
| HP Pavilion Gaming 15-ec1206ng | |
| Maingear Vector 15 | |
| MSI GF63 Thin 9SC | |
| Cinebench R15 / CPU Multi 64Bit | |
| Schenker XMG Core 15 Ampere | |
| Asus Zephyrus G14 GA401IV | |
| Asus ROG Strix Scar 15 G532LWS | |
| Aorus 15P XC | |
| MSI GE65 Raider 9SF-049US | |
| HP Pavilion Gaming 15-ec1206ng | |
| Maingear Vector 15 | |
| Genomsnitt Intel Core i7-10750H (804 - 1418, n=50) | |
| MSI GF65 Thin 10UE | |
| Gateway Creator Series 15.6 GWTN156-3BK | |
| MSI GF63 Thin 9SC | |
| Cinebench R15 / CPU Single 64Bit | |
| Asus ROG Strix Scar 15 G532LWS | |
| MSI GF65 Thin 10UE | |
| Aorus 15P XC | |
| MSI GE65 Raider 9SF-049US | |
| Genomsnitt Intel Core i7-10750H (184 - 213, n=45) | |
| Asus Zephyrus G14 GA401IV | |
| Schenker XMG Core 15 Ampere | |
| Maingear Vector 15 | |
| Gateway Creator Series 15.6 GWTN156-3BK | |
| HP Pavilion Gaming 15-ec1206ng | |
| MSI GF63 Thin 9SC | |
| Blender / v2.79 BMW27 CPU | |
| Gateway Creator Series 15.6 GWTN156-3BK | |
| MSI GF65 Thin 10UE | |
| Genomsnitt Intel Core i7-10750H (322 - 587, n=43) | |
| HP Pavilion Gaming 15-ec1206ng | |
| Asus Zephyrus G14 GA401IV | |
| Aorus 15P XC | |
| Asus ROG Strix Scar 15 G532LWS | |
| Schenker XMG Core 15 Ampere | |
| 7-Zip 18.03 / 7z b 4 -mmt1 | |
| Asus ROG Strix Scar 15 G532LWS | |
| Aorus 15P XC | |
| MSI GF65 Thin 10UE | |
| Genomsnitt Intel Core i7-10750H (4504 - 5470, n=43) | |
| Schenker XMG Core 15 Ampere | |
| Asus Zephyrus G14 GA401IV | |
| Gateway Creator Series 15.6 GWTN156-3BK | |
| HP Pavilion Gaming 15-ec1206ng | |
| 7-Zip 18.03 / 7z b 4 | |
| Schenker XMG Core 15 Ampere | |
| Asus Zephyrus G14 GA401IV | |
| Asus ROG Strix Scar 15 G532LWS | |
| Aorus 15P XC | |
| HP Pavilion Gaming 15-ec1206ng | |
| Genomsnitt Intel Core i7-10750H (26040 - 37345, n=43) | |
| MSI GF65 Thin 10UE | |
| Gateway Creator Series 15.6 GWTN156-3BK | |
| Geekbench 5.5 / Single-Core | |
| Asus ROG Strix Scar 15 G532LWS | |
| MSI GF65 Thin 10UE | |
| Aorus 15P XC | |
| Genomsnitt Intel Core i7-10750H (1114 - 1333, n=43) | |
| Asus Zephyrus G14 GA401IV | |
| Schenker XMG Core 15 Ampere | |
| HP Pavilion Gaming 15-ec1206ng | |
| Gateway Creator Series 15.6 GWTN156-3BK | |
| Geekbench 5.5 / Multi-Core | |
| Asus ROG Strix Scar 15 G532LWS | |
| Schenker XMG Core 15 Ampere | |
| Aorus 15P XC | |
| Asus Zephyrus G14 GA401IV | |
| MSI GF65 Thin 10UE | |
| Genomsnitt Intel Core i7-10750H (4443 - 6674, n=43) | |
| HP Pavilion Gaming 15-ec1206ng | |
| Gateway Creator Series 15.6 GWTN156-3BK | |
| HWBOT x265 Benchmark v2.2 / 4k Preset | |
| Schenker XMG Core 15 Ampere | |
| Asus ROG Strix Scar 15 G532LWS | |
| Aorus 15P XC | |
| Asus Zephyrus G14 GA401IV | |
| HP Pavilion Gaming 15-ec1206ng | |
| Genomsnitt Intel Core i7-10750H (5.54 - 11.6, n=43) | |
| MSI GF65 Thin 10UE | |
| Gateway Creator Series 15.6 GWTN156-3BK | |
| LibreOffice / 20 Documents To PDF | |
| HP Pavilion Gaming 15-ec1206ng | |
| Schenker XMG Core 15 Ampere | |
| Gateway Creator Series 15.6 GWTN156-3BK | |
| Aorus 15P XC | |
| Genomsnitt Intel Core i7-10750H (43.1 - 99.2, n=43) | |
| Asus ROG Strix Scar 15 G532LWS | |
| MSI GF65 Thin 10UE | |
| R Benchmark 2.5 / Overall mean | |
| Gateway Creator Series 15.6 GWTN156-3BK | |
| Genomsnitt Intel Core i7-10750H (0.578 - 0.708, n=42) | |
| HP Pavilion Gaming 15-ec1206ng | |
| MSI GF65 Thin 10UE | |
| Aorus 15P XC | |
| Schenker XMG Core 15 Ampere | |
| Asus ROG Strix Scar 15 G532LWS | |
* ... mindre är bättre
| PCMark 10 | |
| Score | |
| Asus ROG Strix G15 G513QR | |
| Lenovo Legion 7 15IMH05-81YT001VGE | |
| Aorus 15G XC | |
| MSI GS66 Stealth 10UG | |
| Schenker XMG Core 15 Ampere | |
| MSI GF65 9SD | |
| MSI GF65 Thin 10UE | |
| Essentials | |
| Lenovo Legion 7 15IMH05-81YT001VGE | |
| MSI GS66 Stealth 10UG | |
| Schenker XMG Core 15 Ampere | |
| Aorus 15G XC | |
| MSI GF65 9SD | |
| MSI GF65 Thin 10UE | |
| Productivity | |
| Lenovo Legion 7 15IMH05-81YT001VGE | |
| Aorus 15G XC | |
| MSI GS66 Stealth 10UG | |
| Schenker XMG Core 15 Ampere | |
| MSI GF65 Thin 10UE | |
| MSI GF65 9SD | |
| Digital Content Creation | |
| Lenovo Legion 7 15IMH05-81YT001VGE | |
| Aorus 15G XC | |
| Schenker XMG Core 15 Ampere | |
| MSI GS66 Stealth 10UG | |
| MSI GF65 9SD | |
| MSI GF65 Thin 10UE | |
| PCMark 10 Score | 5390 poäng | |
Hjälp | ||
| DPC Latencies / LatencyMon - interrupt to process latency (max), Web, Youtube, Prime95 | |
| Aorus 15G XC | |
| Lenovo Legion 7 15IMH05-81YT001VGE | |
| MSI GF65 Thin 10UE | |
| MSI GS66 Stealth 10UG | |
| Schenker XMG Core 15 Ampere | |
| Asus ROG Strix G15 G513QR | |
* ... mindre är bättre
| MSI GF65 Thin 10UE Samsung SSD PM981 MZVLB1T0HALR | Asus ROG Strix G15 G513QR SK Hynix HFM001TD3JX013N | Schenker XMG Core 15 Ampere Samsung SSD 970 EVO Plus 1TB | MSI GS66 Stealth 10UG WDC PC SN730 SDBPNTY-1T00 | Lenovo Legion 7 15IMH05-81YT001VGE 2x Samsung PM981a MZVLB1T0HBLR (RAID 0) | |
|---|---|---|---|---|---|
| AS SSD | -7% | 10% | -4% | -7% | |
| Seq Read (MB/s) | 3002 | 2881 -4% | 2829 -6% | 2198 -27% | 3088 3% |
| Seq Write (MB/s) | 2420 | 1570 -35% | 2646 9% | 2596 7% | 2561 6% |
| 4K Read (MB/s) | 48.46 | 52.4 8% | 54.8 13% | 43.81 -10% | 43.01 -11% |
| 4K Write (MB/s) | 114.3 | 124 8% | 179.1 57% | 115.5 1% | 102 -11% |
| 4K-64 Read (MB/s) | 1873 | 1334 -29% | 1734 -7% | 1692 -10% | 1549 -17% |
| 4K-64 Write (MB/s) | 1882 | 2189 16% | 2396 27% | 2162 15% | 1378 -27% |
| Access Time Read * (ms) | 0.045 | 0.055 -22% | 0.033 27% | 0.056 -24% | 0.051 -13% |
| Access Time Write * (ms) | 0.101 | 0.03 70% | 0.021 79% | 0.098 3% | 0.037 63% |
| Score Read (Points) | 2221 | 1675 -25% | 2072 -7% | 1956 -12% | 1901 -14% |
| Score Write (Points) | 2238 | 2470 10% | 2839 27% | 2537 13% | 1737 -22% |
| Score Total (Points) | 5565 | 4943 -11% | 5965 7% | 5513 -1% | 4583 -18% |
| Copy ISO MB/s (MB/s) | 2421 | 1277 -47% | 2119 -12% | 2236 -8% | 2684 11% |
| Copy Program MB/s (MB/s) | 705 | 575 -18% | 406.1 -42% | 690 -2% | 544 -23% |
| Copy Game MB/s (MB/s) | 1490 | 1272 -15% | 1086 -27% | 1546 4% | 1116 -25% |
| CrystalDiskMark 5.2 / 6 | 14% | 4% | 8% | ||
| Write 4K (MB/s) | 157.3 | 139.1 -12% | 163.1 4% | 110.4 -30% | |
| Read 4K (MB/s) | 46.69 | 47.59 2% | 48.97 5% | 55.1 18% | |
| Write Seq (MB/s) | 2389 | 2917 22% | 2607 9% | ||
| Read Seq (MB/s) | 2196 | 2586 18% | 2316 5% | ||
| Write 4K Q32T1 (MB/s) | 407.6 | 511 25% | 338 -17% | 466.6 14% | |
| Read 4K Q32T1 (MB/s) | 519 | 571 10% | 475.6 -8% | 517 0% | |
| Write Seq Q32T1 (MB/s) | 2401 | 3263 36% | 3090 29% | 3424 43% | |
| Read Seq Q32T1 (MB/s) | 3344 | 3567 7% | 3421 2% | 3519 5% | |
| Write 4K Q8T8 (MB/s) | 1496 | ||||
| Read 4K Q8T8 (MB/s) | 1597 | ||||
| Totalt genomsnitt (program/inställningar) | -7% /
-7% | 12% /
12% | 0% /
-1% | 1% /
-2% |
* ... mindre är bättre

DiskSpd Read Loop, Queue Depth 8
| 3DMark 11 Performance | 19718 poäng | |
| 3DMark Cloud Gate Standard Score | 35778 poäng | |
| 3DMark Fire Strike Score | 16156 poäng | |
| 3DMark Time Spy Score | 6946 poäng | |
Hjälp | ||
| Dota 2 Reborn - 3840x2160 ultra (3/3) best looking | |
| MSI GF65 Thin 10UE | |
| Genomsnitt NVIDIA GeForce RTX 3060 Laptop GPU (46.9 - 107, n=11) | |
| låg | med. | hög | ultra | QHD | 4K | |
|---|---|---|---|---|---|---|
| GTA V (2015) | 164 | 152 | 120 | 69.2 | ||
| The Witcher 3 (2015) | 294 | 223.2 | 134.2 | 68.7 | ||
| Dota 2 Reborn (2015) | 125 | 116 | 109 | 90.7 | 94.9 | |
| Final Fantasy XV Benchmark (2018) | 124 | 89.8 | 70.3 | 53.6 | 30.7 | |
| X-Plane 11.11 (2018) | 83.6 | 73 | 62.2 | 62.3 | ||
| Far Cry 5 (2018) | 131 | 108 | 103 | 97 | ||
| Strange Brigade (2018) | 269 | 172 | 138 | 121 |
| MSI GF65 Thin 10UE GeForce RTX 3060 Laptop GPU, i7-10750H, Samsung SSD PM981 MZVLB1T0HALR | Asus ROG Strix G15 G513QR GeForce RTX 3070 Laptop GPU, R9 5900HX, SK Hynix HFM001TD3JX013N | Schenker XMG Core 15 Ampere GeForce RTX 3060 Laptop GPU, R7 4800H, Samsung SSD 970 EVO Plus 1TB | MSI GS66 Stealth 10UG GeForce RTX 3070 Laptop GPU, i7-10870H, WDC PC SN730 SDBPNTY-1T00 | Aorus 15G XC GeForce RTX 3070 Laptop GPU, i7-10870H, ESR512GTLCG-EAC-4 | Lenovo Legion 7 15IMH05-81YT001VGE GeForce RTX 2080 Super Max-Q, i9-10980HK, 2x Samsung PM981a MZVLB1T0HBLR (RAID 0) | MSI GF65 9SD GeForce GTX 1660 Ti Mobile, i7-9750H, Kingston RBUSNS8154P3512GJ | |
|---|---|---|---|---|---|---|---|
| Noise | 4% | 6% | -5% | 4% | 8% | -6% | |
| av / miljö * (dB) | 24.7 | 24 3% | 24 3% | 26.2 -6% | 25 -1% | 24.4 1% | 28.7 -16% |
| Idle Minimum * (dB) | 33.1 | 25 24% | 26 21% | 34 -3% | 29 12% | 24.4 26% | 33.3 -1% |
| Idle Average * (dB) | 33.1 | 31 6% | 28 15% | 34 -3% | 30 9% | 24.4 26% | 33.9 -2% |
| Idle Maximum * (dB) | 33.1 | 33 -0% | 30 9% | 34 -3% | 31 6% | 24.4 26% | 33.9 -2% |
| Load Average * (dB) | 42.7 | 45 -5% | 42 2% | 47.2 -11% | 41 4% | 49.3 -15% | 41 4% |
| Witcher 3 ultra * (dB) | 40.6 | 48 -18% | 50 -23% | 46.3 -14% | 47 -16% | 54 -33% | 49.5 -22% |
| Load Maximum * (dB) | 59.4 | 50 16% | 52 12% | 58.2 2% | 51 14% | 46.6 22% | 59.5 -0% |
* ... mindre är bättre
Ljudnivå
| Låg belastning |
| 33.1 / 33.1 / 33.1 dB(A) |
| Hög belastning |
| 42.7 / 59.4 dB(A) |
 | ||
30 dB tyst 40 dB(A) hörbar 50 dB(A) högt ljud |
||
min: | ||
(±) Den maximala temperaturen på ovansidan är 43.4 °C / 110 F, jämfört med genomsnittet av 40.4 °C / 105 F , allt från 21.2 till 68.8 °C för klassen Gaming.
(±) Botten värms upp till maximalt 41.8 °C / 107 F, jämfört med genomsnittet av 43.2 °C / 110 F
(+) Vid tomgångsbruk är medeltemperaturen för ovansidan 27.6 °C / 82 F, jämfört med enhetsgenomsnittet på 33.9 °C / ### class_avg_f### F.
(±) När du spelar The Witcher 3 är medeltemperaturen för ovansidan 33.9 °C / 93 F, jämfört med enhetsgenomsnittet på 33.9 °C / ## #class_avg_f### F.
(+) Handledsstöden och pekplattan är kallare än hudtemperaturen med maximalt 27.4 °C / 81.3 F och är därför svala att ta på.
(±) Medeltemperaturen för handledsstödsområdet på liknande enheter var 28.8 °C / 83.8 F (+1.4 °C / 2.5 F).
MSI GF65 Thin 10UE ljudanalys
(±) | högtalarljudstyrkan är genomsnittlig men bra (80.7 dB)
Bas 100 - 315 Hz
(-) | nästan ingen bas - i genomsnitt 19.6% lägre än medianen
(-) | basen är inte linjär (16.1% delta till föregående frekvens)
Mellan 400 - 2000 Hz
(+) | balanserad mellan - endast 3.2% från medianen
(±) | linjäriteten för mids är genomsnittlig (7.6% delta till föregående frekvens)
Högsta 2 - 16 kHz
(+) | balanserade toppar - endast 3.6% från medianen
(±) | linjäriteten för toppar är genomsnittlig (8.6% delta till föregående frekvens)
Totalt 100 - 16 000 Hz
(±) | linjäriteten för det totala ljudet är genomsnittlig (17.9% skillnad mot median)
Jämfört med samma klass
» 55% av alla testade enheter i den här klassen var bättre, 9% liknande, 37% sämre
» Den bästa hade ett delta på 6%, genomsnittet var 18%, sämst var 132%
Jämfört med alla testade enheter
» 37% av alla testade enheter var bättre, 8% liknande, 55% sämre
» Den bästa hade ett delta på 4%, genomsnittet var 23%, sämst var 134%
Apple MacBook 12 (Early 2016) 1.1 GHz ljudanalys
(+) | högtalare kan spela relativt högt (83.6 dB)
Bas 100 - 315 Hz
(±) | reducerad bas - i genomsnitt 11.3% lägre än medianen
(±) | linjäriteten för basen är genomsnittlig (14.2% delta till föregående frekvens)
Mellan 400 - 2000 Hz
(+) | balanserad mellan - endast 2.4% från medianen
(+) | mids är linjära (5.5% delta till föregående frekvens)
Högsta 2 - 16 kHz
(+) | balanserade toppar - endast 2% från medianen
(+) | toppar är linjära (4.5% delta till föregående frekvens)
Totalt 100 - 16 000 Hz
(+) | det totala ljudet är linjärt (10.2% skillnad mot median)
Jämfört med samma klass
» 7% av alla testade enheter i den här klassen var bättre, 2% liknande, 90% sämre
» Den bästa hade ett delta på 5%, genomsnittet var 18%, sämst var 53%
Jämfört med alla testade enheter
» 5% av alla testade enheter var bättre, 1% liknande, 94% sämre
» Den bästa hade ett delta på 4%, genomsnittet var 23%, sämst var 134%
| Av/Standby | |
| Låg belastning | |
| Hög belastning |
|
Förklaring:
min: | |
| MSI GF65 Thin 10UE i7-10750H, GeForce RTX 3060 Laptop GPU, Samsung SSD PM981 MZVLB1T0HALR, IPS, 1920x1080, 15.6" | Asus ROG Strix G15 G513QR R9 5900HX, GeForce RTX 3070 Laptop GPU, SK Hynix HFM001TD3JX013N, IPS, 1920x1080, 15.6" | Schenker XMG Core 15 Ampere R7 4800H, GeForce RTX 3060 Laptop GPU, Samsung SSD 970 EVO Plus 1TB, IPS, 2560x1440, 15.6" | Aorus 15G XC i7-10870H, GeForce RTX 3070 Laptop GPU, ESR512GTLCG-EAC-4, IPS, 1920x1080, 15.6" | Lenovo Legion 7 15IMH05-81YT001VGE i9-10980HK, GeForce RTX 2080 Super Max-Q, 2x Samsung PM981a MZVLB1T0HBLR (RAID 0), IPS, 1920x1080, 15.6" | MSI GF65 9SD i7-9750H, GeForce GTX 1660 Ti Mobile, Kingston RBUSNS8154P3512GJ, IPS, 1920x1080, 15.6" | |
|---|---|---|---|---|---|---|
| Power Consumption | -27% | -35% | -48% | -24% | -17% | |
| Idle Minimum * (Watt) | 5.4 | 4 26% | 11 -104% | 13 -141% | 9 -67% | 9.5 -76% |
| Idle Average * (Watt) | 12.8 | 9 30% | 14 -9% | 16 -25% | 12.6 2% | 12.4 3% |
| Idle Maximum * (Watt) | 19.5 | 36 -85% | 20 -3% | 30 -54% | 17 13% | 22 -13% |
| Load Average * (Watt) | 86.6 | 130 -50% | 94 -9% | 92 -6% | 115 -33% | 80.8 7% |
| Witcher 3 ultra * (Watt) | 115.7 | 174 -50% | 167 -44% | 154 -33% | 159 -37% | 133.9 -16% |
| Load Maximum * (Watt) | 175.2 | 227 -30% | 251 -43% | 223 -27% | 216 -23% | 187.1 -7% |
* ... mindre är bättre
| MSI GF65 Thin 10UE i7-10750H, GeForce RTX 3060 Laptop GPU, 51 Wh | Asus ROG Strix G15 G513QR R9 5900HX, GeForce RTX 3070 Laptop GPU, 90 Wh | Schenker XMG Core 15 Ampere R7 4800H, GeForce RTX 3060 Laptop GPU, 62 Wh | MSI GS66 Stealth 10UG i7-10870H, GeForce RTX 3070 Laptop GPU, 99.9 Wh | Aorus 15G XC i7-10870H, GeForce RTX 3070 Laptop GPU, 99 Wh | Lenovo Legion 7 15IMH05-81YT001VGE i9-10980HK, GeForce RTX 2080 Super Max-Q, 80 Wh | MSI GF65 9SD i7-9750H, GeForce GTX 1660 Ti Mobile, 51 Wh | |
|---|---|---|---|---|---|---|---|
| Batteridrifttid | 58% | 2% | 50% | 44% | 1% | 11% | |
| Reader / Idle (h) | 11.1 | 7.8 -30% | 10.8 -3% | 9.6 -14% | |||
| WiFi v1.3 (h) | 4.6 | 7.4 61% | 5.8 26% | 7.1 54% | 6.3 37% | 3.4 -26% | 5.1 11% |
| Load (h) | 1.1 | 1.7 55% | 1.2 9% | 2.2 100% | 2.3 109% | 1.4 27% |
För
Emot


Läs den fullständiga versionen av den här recensionen på engelska här.
Mobila GeForce RTX 3060 kan användas inom ett brett spann av TGP-värden mellan 60W och 115W. Laptop-tillverkarna är fria att välja vilket TGP-värde de vill inom det spannet, vilket innebär att ett högre TGP-värde ger högre prestanda. Det innebär också att en del bärbara datorer kan prestera en aning långsammare än andra trots att de använder samma GPU.
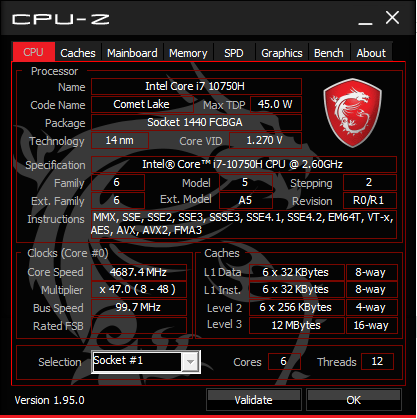
MSI GF65 10UE är en relativt billig laptop med RTX 3060 och kanske inte helt oväntat kommer den också med en RTX 3060 GPU som är långsammare än på genomsnittet. Andra modeller vi testat tidigare med samma GPU är runt 10 till 15 procent snabbare. CPU-prestandan ligger också en aning under genomsnittet om man inte väljer att aktivera Cooler Boost-läget. Färger, svart-vita responstider, Thunderbolt och Displayport är antingen medelmåttiga eller saknas helt.
Gamers som vill maximera prestandan per krona utan att offra möjligheten att uppgradera RAM och SSD kan tilltalas av MSI:s lätta GF65. Vill man ha högre råprestanda är de flesta andra bärbara speldatorerna med GeForce RTX 3060 snabbare.
Enkel service, skärm med snabb bilduppdatering och relativt svala kärntemperaturer när man spelar är andra saker vi gillar med GF65. Men intresserade köpare bör känna till vad man missar.
MSI GF65 Thin 10UE
- 03/08/2021 v7 (old)
Allen Ngo
Price comparison
