Test: MSI GL65 9SEK - Mycket mer portabel än GL63 (Sammanfattning)
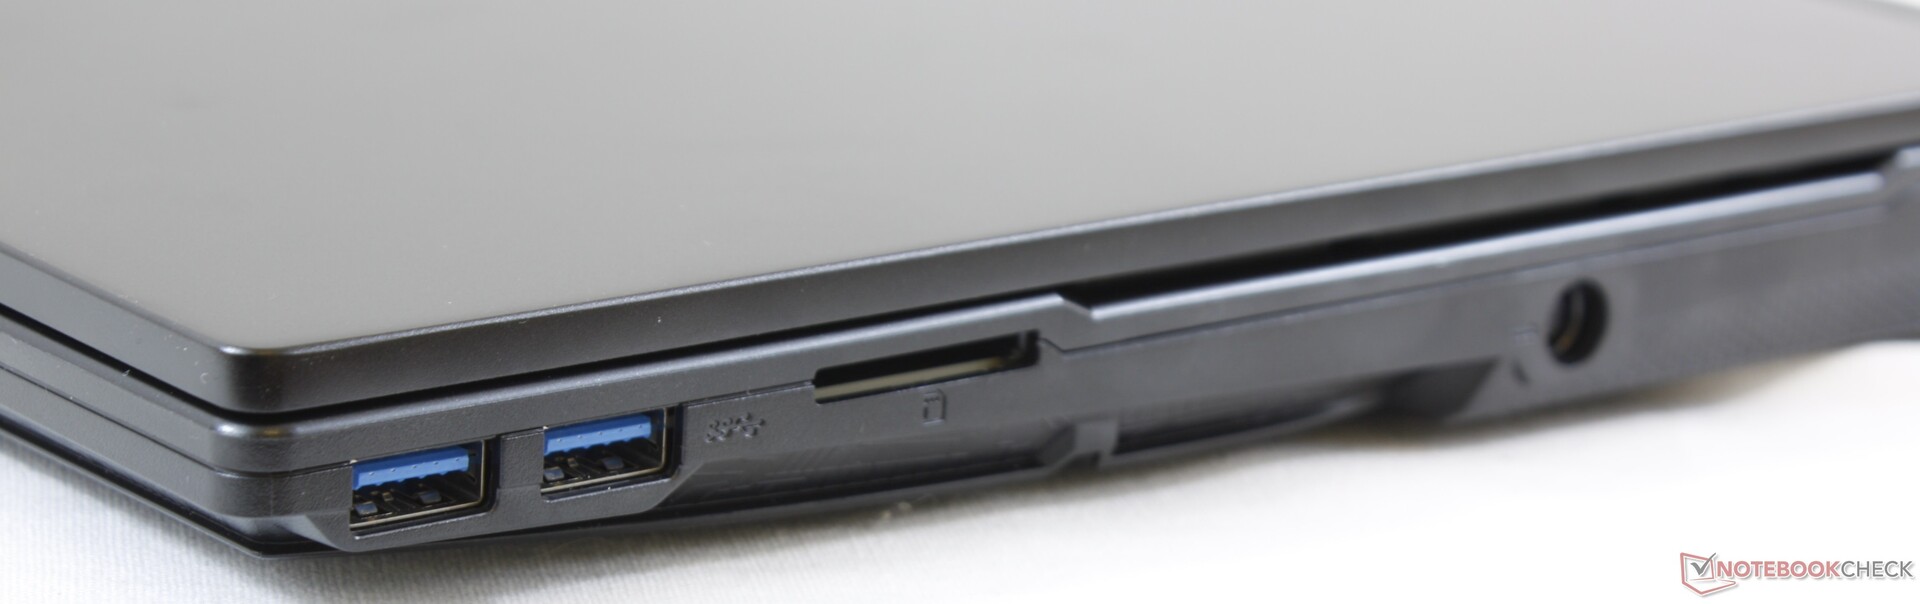
| SD Card Reader | |
| average JPG Copy Test (av. of 3 runs) | |
| Gigabyte Aero 15 Classic-XA (Toshiba Exceria Pro SDXC 64 GB UHS-II) | |
| Dell XPS 15 7590 9980HK GTX 1650 (Toshiba Exceria Pro SDXC 64 GB UHS-II) | |
| MSI GL65 9SEK (Toshiba Exceria Pro SDXC 64 GB UHS-II) | |
| MSI GL63 8RC-069US (Toshiba Exceria Pro SDXC 64 GB UHS-II) | |
| maximum AS SSD Seq Read Test (1GB) | |
| Gigabyte Aero 15 Classic-XA (Toshiba Exceria Pro SDXC 64 GB UHS-II) | |
| Dell XPS 15 7590 9980HK GTX 1650 (Toshiba Exceria Pro SDXC 64 GB UHS-II) | |
| MSI GL65 9SEK (Toshiba Exceria Pro SDXC 64 GB UHS-II) | |
| MSI GL63 8RC-069US (Toshiba Exceria Pro SDXC 64 GB UHS-II) | |
| Networking | |
| iperf3 transmit AX12 | |
| Gigabyte Aero 15 Classic-XA | |
| MSI GS65 Stealth 9SG | |
| MSI GL65 9SEK | |
| MSI GL63 8RC-069US | |
| iperf3 receive AX12 | |
| Gigabyte Aero 15 Classic-XA | |
| MSI GS65 Stealth 9SG | |
| MSI GL65 9SEK | |
| MSI GL63 8RC-069US | |
| |||||||||||||||||||||||||
Distribution av ljusstyrkan: 86 %
Mitt på batteriet: 277.3 cd/m²
Kontrast: 1387:1 (Svärta: 0.2 cd/m²)
ΔE ColorChecker Calman: 5.25 | ∀{0.5-29.43 Ø4.73}
calibrated: 4.39
ΔE Greyscale Calman: 3.5 | ∀{0.09-98 Ø4.97}
55% sRGB (Argyll 1.6.3 3D)
35% AdobeRGB 1998 (Argyll 1.6.3 3D)
37.85% AdobeRGB 1998 (Argyll 3D)
55% sRGB (Argyll 3D)
36.63% Display P3 (Argyll 3D)
Gamma: 2.1
CCT: 6895 K
| MSI GL65 9SEK AU Optronics B156HAN13.0, IPS, 15.6", 1920x1080 | MSI GL63 8RC-069US LG Philips LP156WF6-SPK6, IPS, 15.6", 1920x1080 | MSI GS65 Stealth 9SG Sharp LQ156M1JW03 (SHP14C5), IPS, 15.6", 1920x1080 | Gigabyte Aero 15 Classic-XA Sharp LQ156M1JW03 (SHP14C5), IGZO, 15.6", 1920x1080 | Asus Zephyrus S GX531GX AU Optronics B156HAN08.2, IPS, 15.6", 1920x1080 | Alienware m15 R2 P87F Sharp LQ156M1, IPS, 15.6", 1920x1080 | |
|---|---|---|---|---|---|---|
| Display | 8% | 81% | 76% | 75% | 75% | |
| Display P3 Coverage (%) | 36.63 | 39.4 8% | 67.6 85% | 65.3 78% | 65.6 79% | 65.3 78% |
| sRGB Coverage (%) | 55 | 59.2 8% | 97.5 77% | 95.5 74% | 92.2 68% | 95.1 73% |
| AdobeRGB 1998 Coverage (%) | 37.85 | 40.72 8% | 68.9 82% | 66.5 76% | 66.9 77% | 65.9 74% |
| Response Times | -4% | 54% | 53% | 71% | 55% | |
| Response Time Grey 50% / Grey 80% * (ms) | 26.4 ? | 33.6 ? -27% | 13.6 ? 48% | 15.2 ? 42% | 7 ? 73% | 16.4 ? 38% |
| Response Time Black / White * (ms) | 30 ? | 24 ? 20% | 12 ? 60% | 11.2 ? 63% | 9.6 ? 68% | 8.8 ? 71% |
| PWM Frequency (Hz) | 23260 ? | 23580 ? | 23810 ? | |||
| Screen | -10% | 34% | 23% | 26% | 3% | |
| Brightness middle (cd/m²) | 277.3 | 286.5 3% | 282.3 2% | 266 -4% | 323.6 17% | 324.2 17% |
| Brightness (cd/m²) | 256 | 258 1% | 269 5% | 248 -3% | 315 23% | 304 19% |
| Brightness Distribution (%) | 86 | 82 -5% | 90 5% | 89 3% | 91 6% | 90 5% |
| Black Level * (cd/m²) | 0.2 | 0.34 -70% | 0.32 -60% | 0.31 -55% | 0.29 -45% | 0.38 -90% |
| Contrast (:1) | 1387 | 843 -39% | 882 -36% | 858 -38% | 1116 -20% | 853 -39% |
| Colorchecker dE 2000 * | 5.25 | 5.57 -6% | 1.17 78% | 2.78 47% | 3.31 37% | 5.01 5% |
| Colorchecker dE 2000 max. * | 19.43 | 16.8 14% | 3.29 83% | 5.96 69% | 5.74 70% | 12.7 35% |
| Colorchecker dE 2000 calibrated * | 4.39 | 4.16 5% | 1.06 76% | 0.91 79% | 2.73 38% | 1.64 63% |
| Greyscale dE 2000 * | 3.5 | 4.6 -31% | 1.3 63% | 3.58 -2% | 2.9 17% | 7.9 -126% |
| Gamma | 2.1 105% | 2.15 102% | 2.2 100% | 2.46 89% | 2.29 96% | 2.35 94% |
| CCT | 6895 94% | 7564 86% | 6643 98% | 7186 90% | 6765 96% | 8455 77% |
| Color Space (Percent of AdobeRGB 1998) (%) | 35 | 37.4 7% | 63.8 82% | 62 77% | 59.7 71% | 60.8 74% |
| Color Space (Percent of sRGB) (%) | 55 | 58.9 7% | 97.5 77% | 96 75% | 91.8 67% | 95.5 74% |
| Totalt genomsnitt (program/inställningar) | -2% /
-6% | 56% /
45% | 51% /
36% | 57% /
40% | 44% /
23% |
* ... mindre är bättre
Visa svarstider
| ↔ Svarstid svart till vitt | ||
|---|---|---|
| 30 ms ... stiga ↗ och falla ↘ kombinerat | ↗ 17.6 ms stiga | 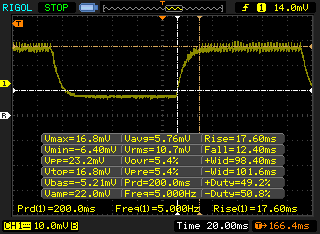 |
| ↘ 12.4 ms hösten | ||
| Skärmen visar långsamma svarsfrekvenser i våra tester och kommer att vara otillfredsställande för spelare. I jämförelse sträcker sig alla testade enheter från 0.1 (minst) till 240 (maximalt) ms. » 80 % av alla enheter är bättre. Detta innebär att den uppmätta svarstiden är sämre än genomsnittet av alla testade enheter (19.9 ms). | ||
| ↔ Svarstid 50 % grått till 80 % grått | ||
| 26.4 ms ... stiga ↗ och falla ↘ kombinerat | ↗ 13.2 ms stiga | 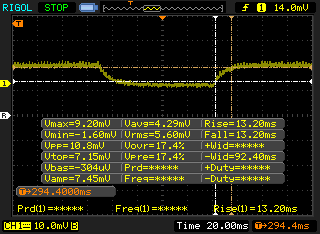 |
| ↘ 13.2 ms hösten | ||
| Skärmen visar relativt långsamma svarsfrekvenser i våra tester och kan vara för långsam för spelare. I jämförelse sträcker sig alla testade enheter från 0.165 (minst) till 636 (maximalt) ms. » 36 % av alla enheter är bättre. Det betyder att den uppmätta svarstiden är bättre än genomsnittet av alla testade enheter (31.1 ms). | ||
Skärmflimmer / PWM (Puls-Width Modulation)
| Skärmflimmer / PWM upptäcktes inte | 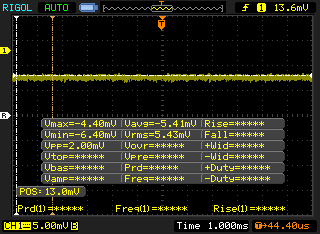 | ||
Som jämförelse: 52 % av alla testade enheter använder inte PWM för att dämpa skärmen. Om PWM upptäcktes mättes ett medelvärde av 7794 (minst: 5 - maximum: 343500) Hz. | |||
| PCMark 8 Home Score Accelerated v2 | 4136 poäng | |
| PCMark 8 Work Score Accelerated v2 | 5287 poäng | |
| PCMark 10 Score | 5761 poäng | |
Hjälp | ||
| MSI GL65 9SEK WDC PC SN520 SDAPNUW-512G | MSI GL63 8RC-069US Toshiba HG6 THNSNJ256G8NY | MSI GS65 Stealth 9SG Samsung SSD PM981 MZVLB512HAJQ | Gigabyte Aero 15 Classic-XA Intel SSD 760p SSDPEKKW512G8 | Asus Zephyrus S GX531GX Intel SSD 660p SSDPEKNW512G8 | Alienware m15 R2 P87F 2x Toshiba XG6 KXG60ZNV512G (RAID 0) | |
|---|---|---|---|---|---|---|
| AS SSD | -60% | 59% | 27% | -7% | 33% | |
| Seq Read (MB/s) | 1315 | 512 -61% | 2005 52% | 2517 91% | 1239 -6% | 1925 46% |
| Seq Write (MB/s) | 1378 | 456.4 -67% | 1580 15% | 924 -33% | 920 -33% | 2371 72% |
| 4K Read (MB/s) | 25.31 | 16.18 -36% | 49.33 95% | 59.1 134% | 45.74 81% | 37.2 47% |
| 4K Write (MB/s) | 118.2 | 57.1 -52% | 103.8 -12% | 126.5 7% | 95.7 -19% | 108.9 -8% |
| 4K-64 Read (MB/s) | 839 | 342.3 -59% | 1241 48% | 876 4% | 322 -62% | 1177 40% |
| 4K-64 Write (MB/s) | 720 | 127.3 -82% | 1730 140% | 922 28% | 722 0% | 1135 58% |
| Access Time Read * (ms) | 0.116 | 0.197 -70% | 0.054 53% | 0.042 64% | 0.073 37% | 0.065 44% |
| Access Time Write * (ms) | 0.091 | 0.061 33% | 0.036 60% | 0.065 29% | 0.047 48% | 0.108 -19% |
| Score Read (Points) | 996 | 410 -59% | 1490 50% | 1186 19% | 492 -51% | 1407 41% |
| Score Write (Points) | 976 | 230 -76% | 1991 104% | 1141 17% | 910 -7% | 1481 52% |
| Score Total (Points) | 2485 | 850 -66% | 4230 70% | 2870 15% | 1654 -33% | 3633 46% |
| Copy ISO MB/s (MB/s) | 1279 | 325.6 -75% | 3025 137% | 2086 63% | 1236 -3% | 2073 62% |
| Copy Program MB/s (MB/s) | 889 | 84.8 -90% | 713 -20% | 454.2 -49% | 703 -21% | 576 -35% |
| Copy Game MB/s (MB/s) | 1218 | 202.6 -83% | 1554 28% | 1141 -6% | 812 -33% | 1426 17% |
* ... mindre är bättre

| 3DMark 11 | |
| 1280x720 Performance GPU | |
| Acer Predator Helios 700 PH717-71-785M | |
| HP Omen X 17-ap0xx | |
| Eurocom Nightsky RX15 | |
| MSI RTX 2060 Gaming Z 6G | |
| MSI GS65 Stealth 9SG | |
| Alienware 17 R5 | |
| Genomsnitt NVIDIA GeForce RTX 2060 Mobile (19143 - 24662, n=40) | |
| MSI GL65 9SEK | |
| Eurocom Nightsky Ti15 | |
| Asus Strix GL703VM-DB74 | |
| Acer Aspire 7 A715-74G-50U5 | |
| Asus TUF FX705GE-EW096T | |
| 1280x720 Performance Combined | |
| Eurocom Nightsky RX15 | |
| MSI RTX 2060 Gaming Z 6G | |
| Acer Predator Helios 700 PH717-71-785M | |
| MSI GS65 Stealth 9SG | |
| MSI GL65 9SEK | |
| Eurocom Nightsky Ti15 | |
| Genomsnitt NVIDIA GeForce RTX 2060 Mobile (1107 - 14726, n=40) | |
| Alienware 17 R5 | |
| HP Omen X 17-ap0xx | |
| Acer Aspire 7 A715-74G-50U5 | |
| Asus TUF FX705GE-EW096T | |
| Asus Strix GL703VM-DB74 | |
| 3DMark 11 Performance | 18334 poäng | |
| 3DMark Cloud Gate Standard Score | 34921 poäng | |
| 3DMark Fire Strike Score | 14827 poäng | |
| 3DMark Time Spy Score | 6197 poäng | |
Hjälp | ||
| Shadow of the Tomb Raider - 1920x1080 Highest Preset AA:T | |
| MSI GE75 9SG | |
| Eurocom Nightsky RX15 | |
| MSI RTX 2060 Gaming Z 6G | |
| MSI GS65 Stealth 9SG | |
| MSI GL65 9SEK | |
| Eurocom Nightsky Ti15 | |
| Asus ROG Zephyrus G15 GA502DU | |
| Dell XPS 15 7590 9980HK GTX 1650 | |
| Asus TUF FX705GE-EW096T | |
| The Witcher 3 - 1920x1080 Ultra Graphics & Postprocessing (HBAO+) | |
| Acer Predator Helios 700 PH717-71-785M | |
| MSI GE75 9SG | |
| Eurocom Nightsky RX15 | |
| Asus Zephyrus S GX531GX | |
| Schenker XMG Ultra 15 Turing | |
| MSI RTX 2060 Gaming Z 6G | |
| MSI GE75 8SF | |
| MSI GS65 Stealth 9SG | |
| HP Omen X 17-ap0xx | |
| Gigabyte Aero 15 Classic-XA | |
| Alienware 17 R5 | |
| Eurocom Nightsky Ti15 | |
| MSI GL65 9SEK | |
| Lenovo Legion Y540-17IRH | |
| Asus ROG Zephyrus G15 GA502DU | |
| Asus Strix GL703VM-DB74 | |
| Acer Aspire 7 A715-74G-50U5 | |
| Asus FX503VM-EH73 | |
| Dell XPS 15 7590 9980HK GTX 1650 | |
| Asus TUF FX705GE-EW096T | |
| MSI GL63 8RC-069US | |
| låg | med. | hög | ultra | |
|---|---|---|---|---|
| BioShock Infinite (2013) | 345.1 | 285.1 | 277.4 | 150.3 |
| The Witcher 3 (2015) | 286 | 204 | 117.5 | 58.7 |
| Rocket League (2017) | 244 | 249.3 | 246.9 | |
| Shadow of the Tomb Raider (2018) | 130 | 96 | 88 | 76 |
| MSI GL65 9SEK GeForce RTX 2060 Mobile, i7-9750H, WDC PC SN520 SDAPNUW-512G | MSI GL63 8RC-069US GeForce GTX 1050 Mobile, i5-8300H, Toshiba HG6 THNSNJ256G8NY | MSI GS65 Stealth 9SG GeForce RTX 2080 Max-Q, i7-9750H, Samsung SSD PM981 MZVLB512HAJQ | Gigabyte Aero 15 Classic-XA GeForce RTX 2070 Max-Q, i7-9750H, Intel SSD 760p SSDPEKKW512G8 | Asus Zephyrus S GX531GX GeForce RTX 2080 Max-Q, i7-8750H, Intel SSD 660p SSDPEKNW512G8 | Alienware m15 R2 P87F GeForce RTX 2080 Max-Q, i7-9750H, 2x Toshiba XG6 KXG60ZNV512G (RAID 0) | |
|---|---|---|---|---|---|---|
| Noise | 8% | 8% | -3% | 0% | -3% | |
| av / miljö * (dB) | 28.1 | 28.6 -2% | 28.3 -1% | 30 -7% | 28.7 -2% | 28.3 -1% |
| Idle Minimum * (dB) | 31.4 | 28.6 9% | 30.4 3% | 31 1% | 29.8 5% | 28.5 9% |
| Idle Average * (dB) | 31.5 | 31.6 -0% | 30.5 3% | 34 -8% | 32.4 -3% | 28.5 10% |
| Idle Maximum * (dB) | 33.5 | 31.6 6% | 30.6 9% | 39 -16% | 38 -13% | 49 -46% |
| Load Average * (dB) | 49.3 | 38.6 22% | 37.6 24% | 46 7% | 38.2 23% | 49 1% |
| Witcher 3 ultra * (dB) | 51.3 | 40.6 21% | 46 10% | 53 -3% | 56.6 -10% | 49 4% |
| Load Maximum * (dB) | 58 | 56.8 2% | 55.1 5% | 55 5% | 56.6 2% | 55 5% |
* ... mindre är bättre
Ljudnivå
| Låg belastning |
| 31.4 / 31.5 / 33.5 dB(A) |
| Hög belastning |
| 49.3 / 58 dB(A) |
 | ||
30 dB tyst 40 dB(A) hörbar 50 dB(A) högt ljud |
||
min: | ||
(-) Den maximala temperaturen på ovansidan är 49 °C / 120 F, jämfört med genomsnittet av 40.4 °C / 105 F , allt från 21.2 till 68.8 °C för klassen Gaming.
(-) Botten värms upp till maximalt 54.2 °C / 130 F, jämfört med genomsnittet av 43.2 °C / 110 F
(±) Vid tomgångsbruk är medeltemperaturen för ovansidan 35.9 °C / 97 F, jämfört med enhetsgenomsnittet på 33.9 °C / ### class_avg_f### F.
(-) När du spelar The Witcher 3 är medeltemperaturen för ovansidan 38.4 °C / 101 F, jämfört med enhetsgenomsnittet på 33.9 °C / ## #class_avg_f### F.
(±) Handledsstöden och pekplattan kan bli väldigt varma vid beröring med maximalt 36 °C / 96.8 F.
(-) Medeltemperaturen för handledsstödsområdet på liknande enheter var 28.8 °C / 83.8 F (-7.2 °C / -13 F).
MSI GL65 9SEK ljudanalys
(+) | högtalare kan spela relativt högt (85.3 dB)
Bas 100 - 315 Hz
(-) | nästan ingen bas - i genomsnitt 25.1% lägre än medianen
(±) | linjäriteten för basen är genomsnittlig (9.9% delta till föregående frekvens)
Mellan 400 - 2000 Hz
(±) | högre mellan - i genomsnitt 5.8% högre än median
(±) | linjäriteten för mids är genomsnittlig (9.8% delta till föregående frekvens)
Högsta 2 - 16 kHz
(+) | balanserade toppar - endast 4.1% från medianen
(±) | linjäriteten för toppar är genomsnittlig (11.7% delta till föregående frekvens)
Totalt 100 - 16 000 Hz
(±) | linjäriteten för det totala ljudet är genomsnittlig (25.4% skillnad mot median)
Jämfört med samma klass
» 91% av alla testade enheter i den här klassen var bättre, 2% liknande, 7% sämre
» Den bästa hade ett delta på 6%, genomsnittet var 18%, sämst var 132%
Jämfört med alla testade enheter
» 78% av alla testade enheter var bättre, 5% liknande, 17% sämre
» Den bästa hade ett delta på 4%, genomsnittet var 24%, sämst var 134%
Apple MacBook 12 (Early 2016) 1.1 GHz ljudanalys
(+) | högtalare kan spela relativt högt (83.6 dB)
Bas 100 - 315 Hz
(±) | reducerad bas - i genomsnitt 11.3% lägre än medianen
(±) | linjäriteten för basen är genomsnittlig (14.2% delta till föregående frekvens)
Mellan 400 - 2000 Hz
(+) | balanserad mellan - endast 2.4% från medianen
(+) | mids är linjära (5.5% delta till föregående frekvens)
Högsta 2 - 16 kHz
(+) | balanserade toppar - endast 2% från medianen
(+) | toppar är linjära (4.5% delta till föregående frekvens)
Totalt 100 - 16 000 Hz
(+) | det totala ljudet är linjärt (10.2% skillnad mot median)
Jämfört med samma klass
» 7% av alla testade enheter i den här klassen var bättre, 2% liknande, 91% sämre
» Den bästa hade ett delta på 5%, genomsnittet var 18%, sämst var 53%
Jämfört med alla testade enheter
» 5% av alla testade enheter var bättre, 1% liknande, 94% sämre
» Den bästa hade ett delta på 4%, genomsnittet var 24%, sämst var 134%
| Av/Standby | |
| Låg belastning | |
| Hög belastning |
|
Förklaring:
min: | |
| MSI GL65 9SEK i7-9750H, GeForce RTX 2060 Mobile, WDC PC SN520 SDAPNUW-512G, IPS, 1920x1080, 15.6" | MSI GL63 8RC-069US i5-8300H, GeForce GTX 1050 Mobile, Toshiba HG6 THNSNJ256G8NY, IPS, 1920x1080, 15.6" | MSI GS65 Stealth 9SG i7-9750H, GeForce RTX 2080 Max-Q, Samsung SSD PM981 MZVLB512HAJQ, IPS, 1920x1080, 15.6" | Gigabyte Aero 15 Classic-XA i7-9750H, GeForce RTX 2070 Max-Q, Intel SSD 760p SSDPEKKW512G8, IGZO, 1920x1080, 15.6" | MSI GP65 Leopard 9SE-225US i7-9750H, GeForce RTX 2060 Mobile, Toshiba KBG30ZMT512G, IPS, 1920x1080, 15.6" | MSI GS65 Stealth Thin 8RE-051US i7-8750H, GeForce GTX 1060 Mobile, Samsung SSD PM981 MZVLB256HAHQ, IPS, 1920x1080, 15.6" | |
|---|---|---|---|---|---|---|
| Power Consumption | 54% | 25% | 22% | 30% | 42% | |
| Idle Minimum * (Watt) | 41 | 7.1 83% | 18.3 55% | 21 49% | 13.6 67% | 8.7 79% |
| Idle Average * (Watt) | 45.3 | 9.8 78% | 22 51% | 23 49% | 17.9 60% | 13 71% |
| Idle Maximum * (Watt) | 47.1 | 10.4 78% | 28.8 39% | 32 32% | 20.6 56% | 14.3 70% |
| Load Average * (Watt) | 94.9 | 88.8 6% | 93 2% | 97 -2% | 96 -1% | 107.4 -13% |
| Witcher 3 ultra * (Watt) | 149.4 | 93.3 38% | 142.6 5% | 148 1% | 154.6 -3% | 129 14% |
| Load Maximum * (Watt) | 214.2 | 132.5 38% | 215.9 -1% | 213 1% | 218.6 -2% | 151.5 29% |
* ... mindre är bättre
| MSI GL65 9SEK i7-9750H, GeForce RTX 2060 Mobile, 51 Wh | MSI GL63 8RC-069US i5-8300H, GeForce GTX 1050 Mobile, 41 Wh | MSI GS65 Stealth 9SG i7-9750H, GeForce RTX 2080 Max-Q, 82 Wh | Gigabyte Aero 15 Classic-XA i7-9750H, GeForce RTX 2070 Max-Q, 94.24 Wh | Asus Zephyrus S GX531GX i7-8750H, GeForce RTX 2080 Max-Q, 50 Wh | Alienware m15 R2 P87F i7-9750H, GeForce RTX 2080 Max-Q, 76 Wh | |
|---|---|---|---|---|---|---|
| Batteridrifttid | 16% | 58% | 130% | -21% | 41% | |
| Reader / Idle (h) | 4.4 | 7.3 66% | 9.1 107% | 9.2 109% | ||
| WiFi v1.3 (h) | 3.8 | 4.3 13% | 6 58% | 7 84% | 3 -21% | 5.5 45% |
| Load (h) | 1 | 0.7 -30% | 3 200% | 0.7 -30% |
För
Emot


Läs den fullständiga versionen av den här recensionen på engelska här.
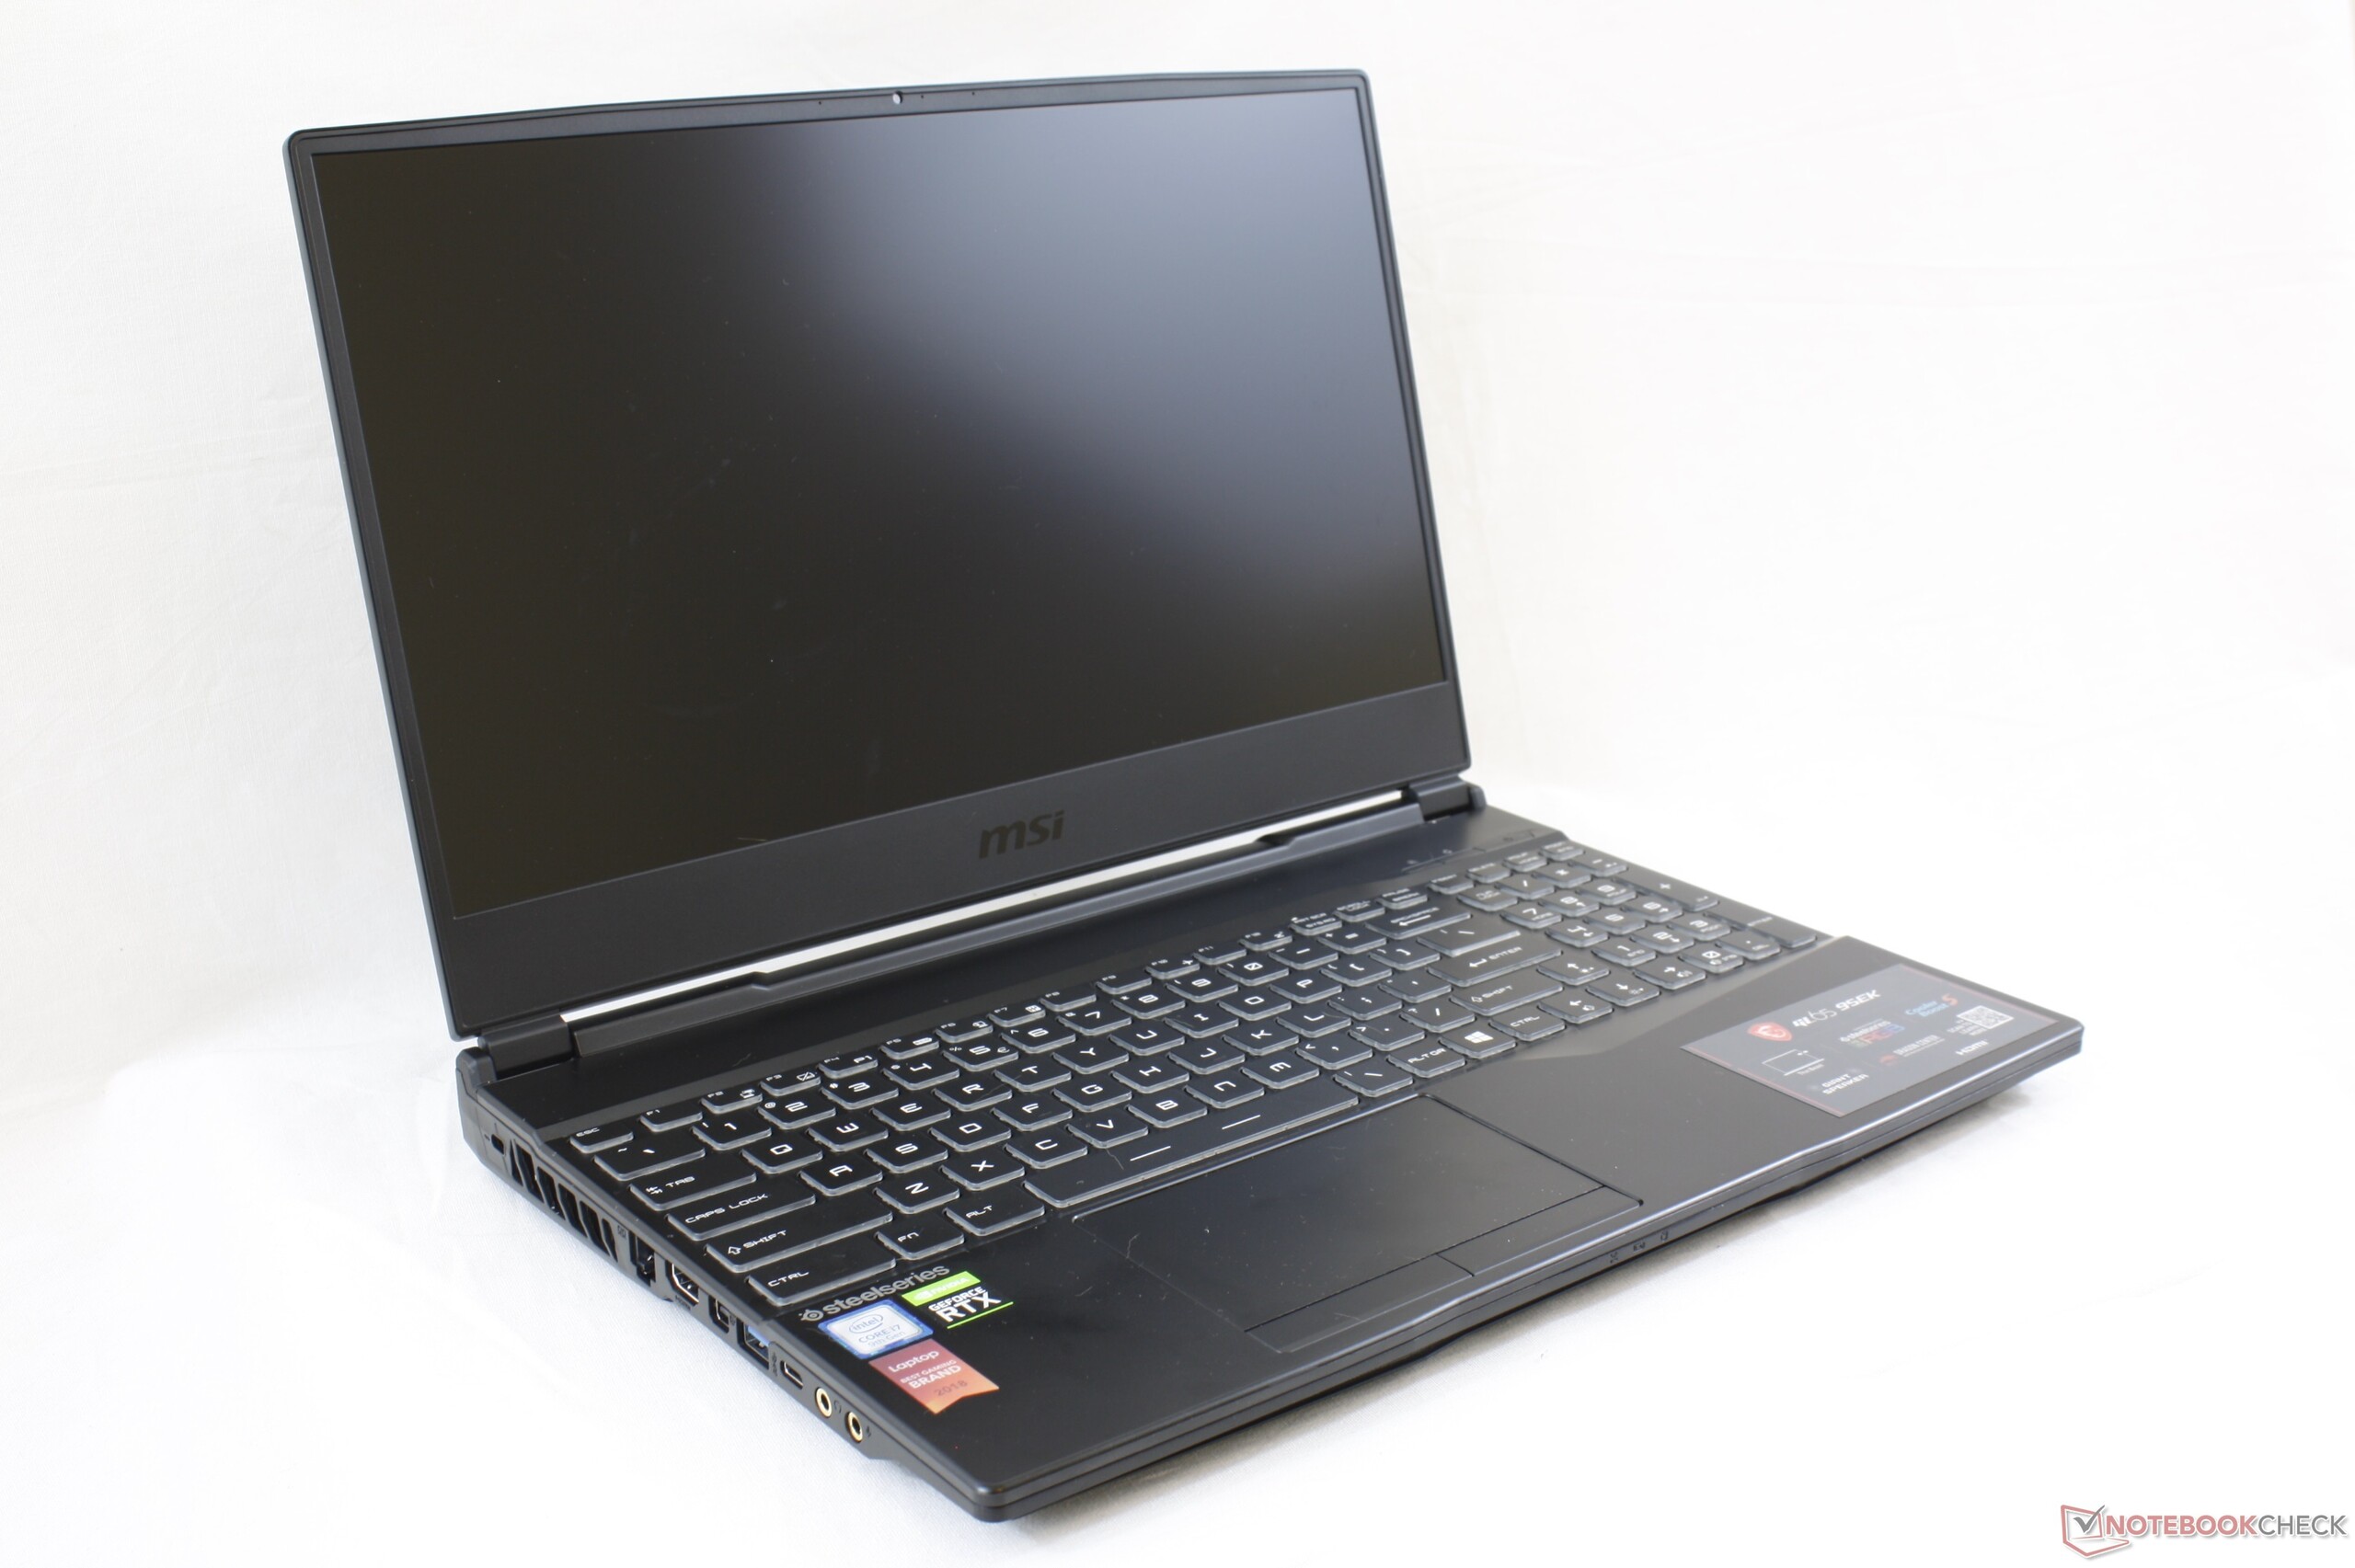
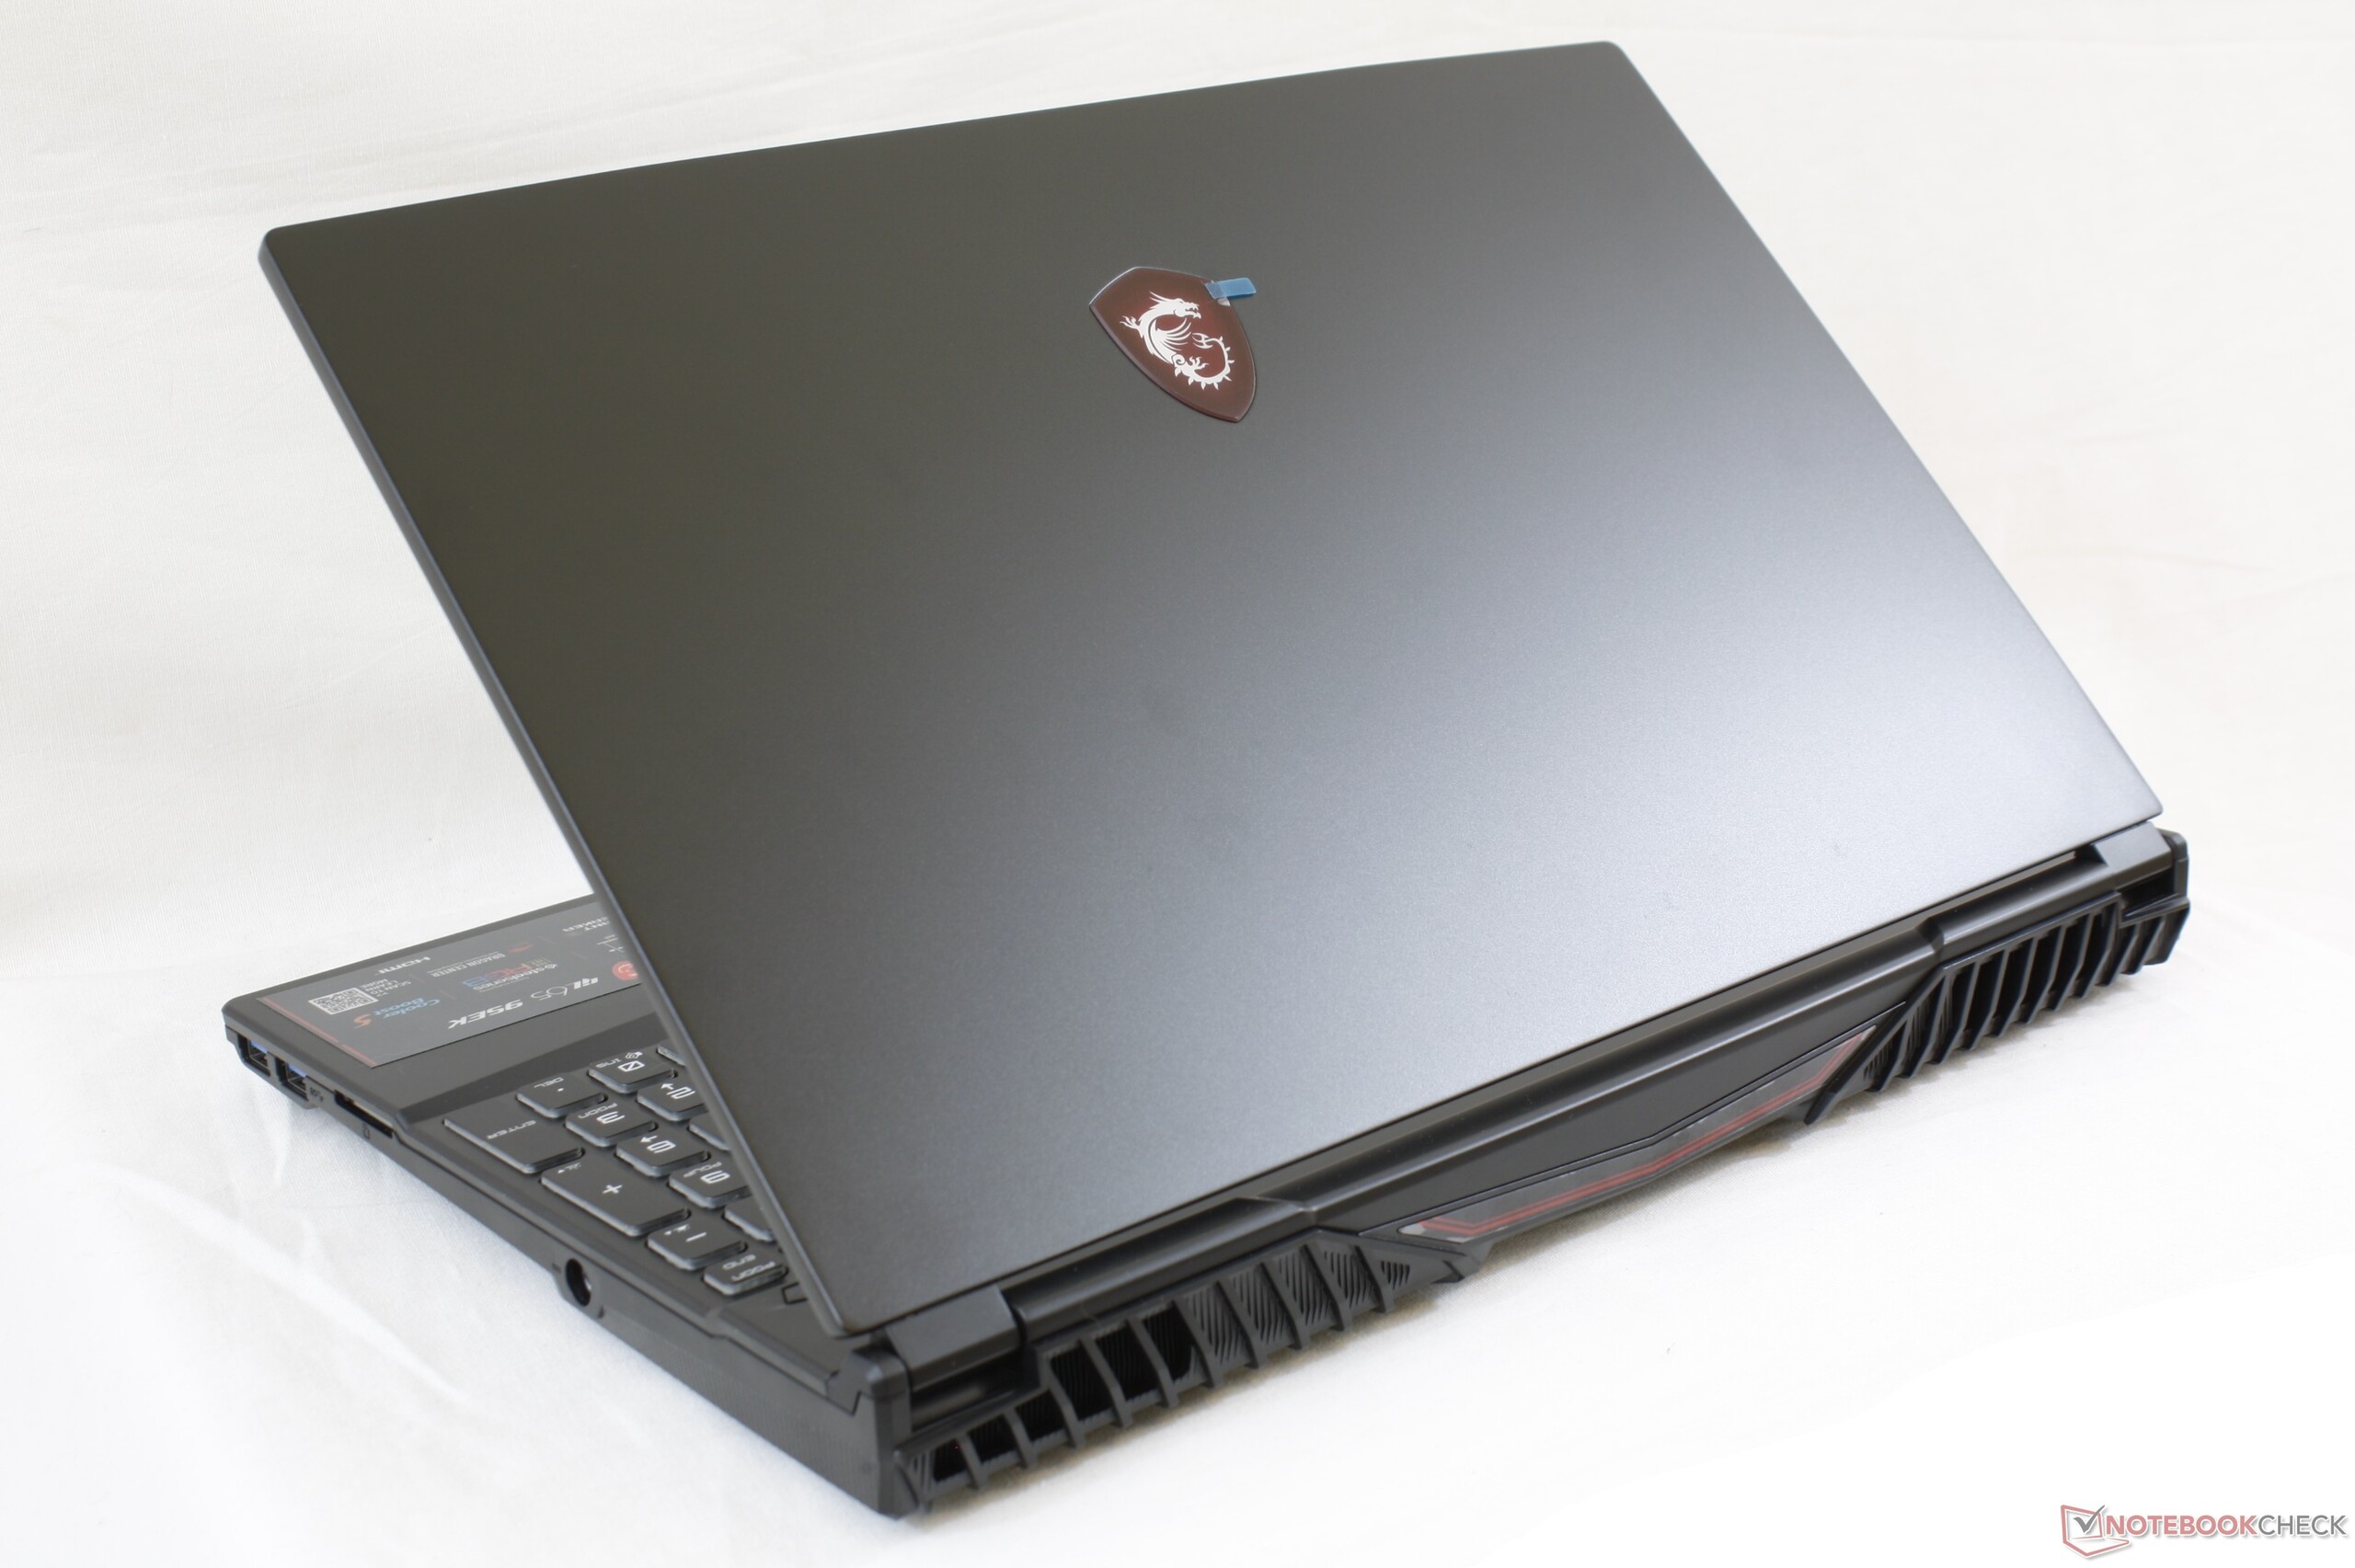
Den största och tydligaste förbättringen GL65 har gentemot GL63 är ett mindre och mer portabelt chassi. Den är runt 16 procent mindre än sin föregångare samtidigt som den har en uppgraderad processor som ger en påtaglig ökning i prestanda.
Annars är nästan allt annat med GL65 likadant som på GL63. MSI hade chansen att förbättra skärmen och den dåliga batteritiden, de kunde använt tystare fläktar eller erbjudit en snabbare SD-kortläsare, men alla dessa saker är i princip oförändrade jämfört med förra generationen. Du får skaffa en mer avancerad modell från GS65-serien om du behöver dessa egenskaper i ditt dagliga arbete.
En spelmaskin från mittenskiktet som ser bra ut och presterar bra men som kompromissar med batteritid och skärm. Du får offra lång uthållighet och exakta färger om du skaffar MSI GL65.
MSI GL65 9SEK
- 10/02/2019 v7 (old)
Allen Ngo
Price comparison
