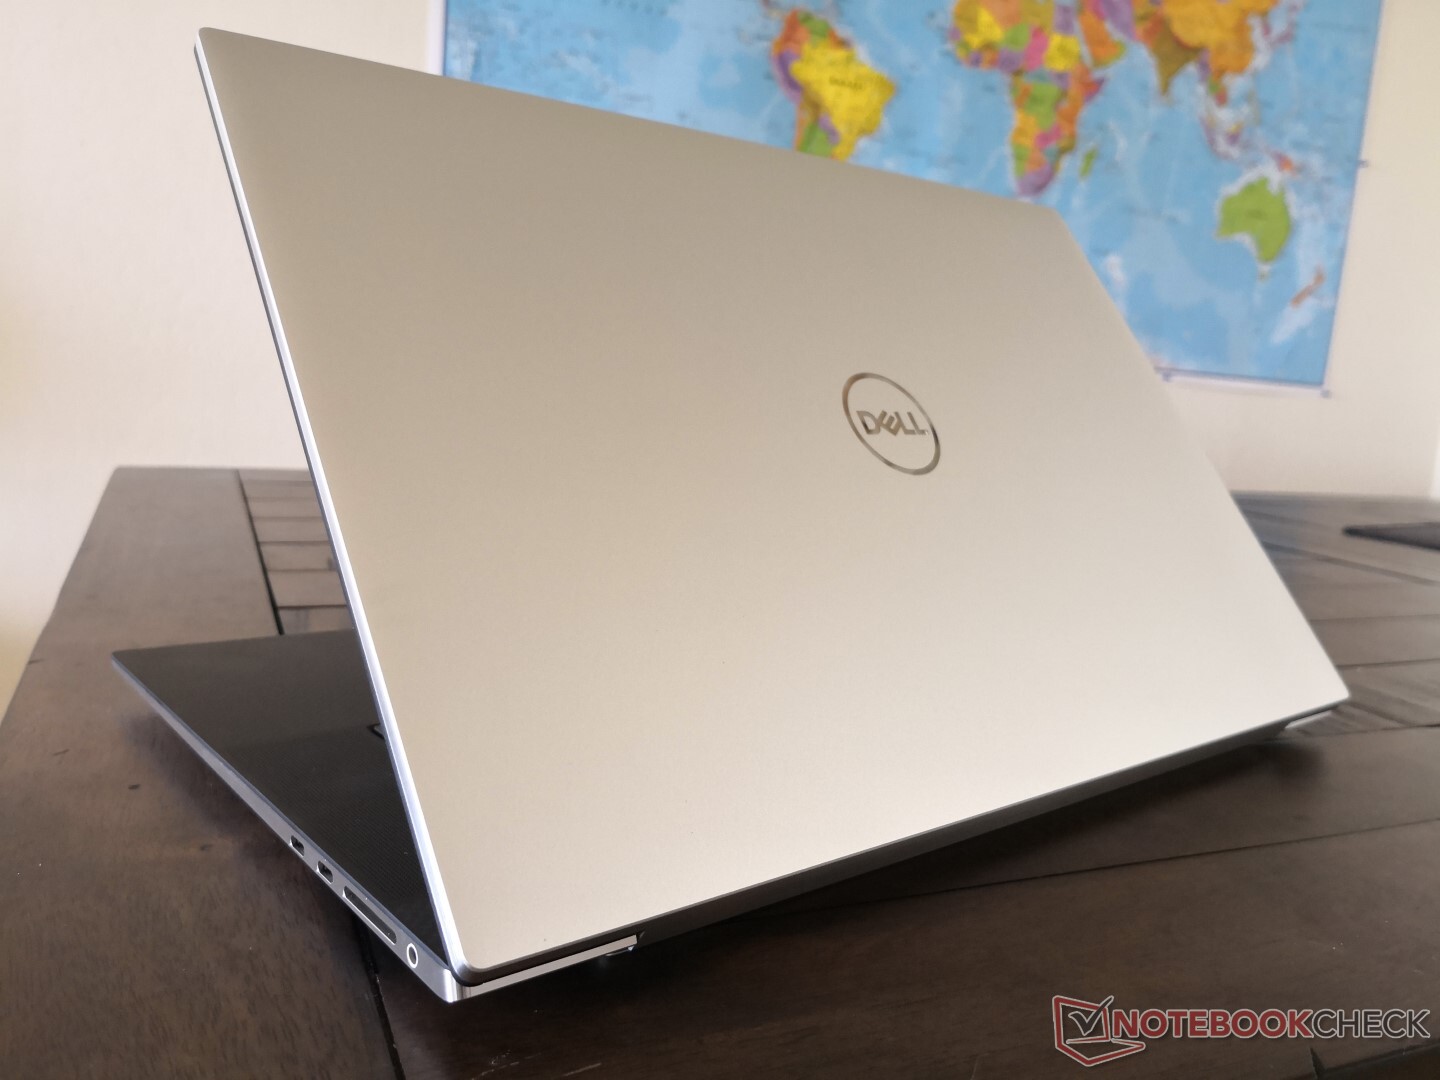
Test: Dell XPS 17 9700 Core i7 - I princip en MacBook Pro 17 (Sammanfattning)
Gradering | Datum | Modell | Vikt | Höjd | Storlek | Upplösning | Pris |
|---|---|---|---|---|---|---|---|
| 87.9 % v7 (old) | 07/2020 | Dell XPS 17 9700 Core i7 RTX 2060 Max-Q i7-10875H, GeForce RTX 2060 Max-Q | 2.5 kg | 19.5 mm | 17.00" | 3840x2400 | |
| 82.5 % v7 (old) | 07/2020 | MSI Creator 17 A10SGS i7-10875H, GeForce RTX 2080 Super Max-Q | 2.4 kg | 20 mm | 17.30" | 3840x2160 | |
| 80.9 % v7 (old) | 06/2020 | HP Envy 17t-cg000 i7-1065G7, GeForce MX330 | 2.7 kg | 19.3 mm | 17.30" | 3840x2160 | |
| 87 % v7 (old) | 04/2020 | Gigabyte Aero 17 HDR XB i7-10875H, GeForce RTX 2070 Super Max-Q | 2.7 kg | 21 mm | 17.30" | 3840x2160 | |
| 87.4 % v7 (old) | 06/2020 | Razer Blade Pro 17 RTX 2070 Max-Q 300 Hz i7-10875H, GeForce RTX 2070 Max-Q | 2.7 kg | 19.9 mm | 17.30" | 1920x1080 |

| SD Card Reader | |
| average JPG Copy Test (av. of 3 runs) | |
| Razer Blade Pro 17 RTX 2070 Max-Q 300 Hz (Toshiba Exceria Pro SDXC 64 GB UHS-II) | |
| Gigabyte Aero 17 HDR XB (Toshiba Exceria Pro SDXC 64 GB UHS-II) | |
| Dell XPS 17 9700 Core i7 RTX 2060 Max-Q (Toshiba Exceria Pro SDXC 64 GB UHS-II) | |
| HP Envy 17t-cg000 (Toshiba Exceria Pro SDXC 64 GB UHS-II) | |
| maximum AS SSD Seq Read Test (1GB) | |
| Gigabyte Aero 17 HDR XB (Toshiba Exceria Pro SDXC 64 GB UHS-II) | |
| Razer Blade Pro 17 RTX 2070 Max-Q 300 Hz (Toshiba Exceria Pro SDXC 64 GB UHS-II) | |
| Dell XPS 17 9700 Core i7 RTX 2060 Max-Q (Toshiba Exceria Pro SDXC 64 GB UHS-II) | |
| HP Envy 17t-cg000 (Toshiba Exceria Pro SDXC 64 GB UHS-II) | |


| |||||||||||||||||||||||||
Distribution av ljusstyrkan: 84 %
Mitt på batteriet: 539.4 cd/m²
Kontrast: 1686:1 (Svärta: 0.32 cd/m²)
ΔE ColorChecker Calman: 4.12 | ∀{0.5-29.43 Ø4.71}
calibrated: 3.91
ΔE Greyscale Calman: 1.5 | ∀{0.09-98 Ø4.96}
100% sRGB (Argyll 1.6.3 3D)
90.4% AdobeRGB 1998 (Argyll 1.6.3 3D)
99.8% AdobeRGB 1998 (Argyll 3D)
100% sRGB (Argyll 3D)
90.5% Display P3 (Argyll 3D)
Gamma: 2.15
CCT: 6438 K
| Dell XPS 17 9700 Core i7 RTX 2060 Max-Q Sharp LQ170R1, IPS, 17", 3840x2400 | Razer Blade Pro 17 RTX 2070 Max-Q 300 Hz Sharp LQ173M1JW02, IPS, 17.3", 1920x1080 | MSI Creator 17 A10SGS B173ZAN05.0 (AUO278E), Mini-LED IPS-Level, 17.3", 3840x2160 | HP Envy 17t-cg000 AU Optronics AUO168E, IPS, 17.3", 3840x2160 | Gigabyte Aero 17 HDR XB AUO B173ZAN03.2 (AUO329B), IPS, 17.3", 3840x2160 | Apple MacBook Pro 16 2019 i9 5500M APPA044, IPS, 16", 3072x1920 | |
|---|---|---|---|---|---|---|
| Display | -16% | -9% | -2% | -1% | ||
| Display P3 Coverage (%) | 90.5 | 72.2 -20% | 82 -9% | 86.2 -5% | 86.5 -4% | |
| sRGB Coverage (%) | 100 | 98.5 -1% | 97.5 -2% | 100 0% | 100 0% | |
| AdobeRGB 1998 Coverage (%) | 99.8 | 73 -27% | 84 -16% | 99.8 0% | 100 0% | |
| Response Times | 80% | 72% | 10% | 6% | -6% | |
| Response Time Grey 50% / Grey 80% * (ms) | 51.2 ? | 5.6 ? 89% | 45.2 ? 12% | 55.2 ? -8% | 52.4 ? -2% | |
| Response Time Black / White * (ms) | 32 ? | 9.6 ? 70% | 8.8 ? 72% | 29.6 ? 7% | 26 ? 19% | 34.9 ? -9% |
| PWM Frequency (Hz) | 26600 ? | 131700 | ||||
| Screen | -46% | -6% | -46% | 17% | 12% | |
| Brightness middle (cd/m²) | 539.4 | 328 -39% | 996 85% | 383.4 -29% | 487 -10% | 519 -4% |
| Brightness (cd/m²) | 494 | 329 -33% | 952 93% | 382 -23% | 475 -4% | 477 -3% |
| Brightness Distribution (%) | 84 | 78 -7% | 93 11% | 86 2% | 95 13% | 86 2% |
| Black Level * (cd/m²) | 0.32 | 0.35 -9% | 0.68 -113% | 0.34 -6% | 0.38 -19% | 0.39 -22% |
| Contrast (:1) | 1686 | 937 -44% | 1465 -13% | 1128 -33% | 1282 -24% | 1331 -21% |
| Colorchecker dE 2000 * | 4.12 | 4.74 -15% | 4.21 -2% | 6.24 -51% | 1.19 71% | 2.28 45% |
| Colorchecker dE 2000 max. * | 7.65 | 8.99 -18% | 6.79 11% | 10.18 -33% | 2.43 68% | 6.54 15% |
| Colorchecker dE 2000 calibrated * | 3.91 | 2.12 46% | 2.03 48% | 3.7 5% | 0.5 87% | 0.86 78% |
| Greyscale dE 2000 * | 1.5 | 6.8 -353% | 4.1 -173% | 6.6 -340% | 1.45 3% | 0.9 40% |
| Gamma | 2.15 102% | 2.2 100% | 2.207 100% | 2.272 97% | 2.21 100% | 2145 0% |
| CCT | 6438 101% | 6446 101% | 7491 87% | 5973 109% | 6557 99% | 6572 99% |
| Color Space (Percent of AdobeRGB 1998) (%) | 90.4 | 64.8 -28% | 84 -7% | 88 -3% | 88 -3% | 78 -14% |
| Color Space (Percent of sRGB) (%) | 100 | 98.6 -1% | 97 -3% | 100 0% | 100 0% | |
| Totalt genomsnitt (program/inställningar) | 6% /
-24% | 19% /
-1% | -13% /
-31% | 7% /
12% | 3% /
9% |
* ... mindre är bättre
Visa svarstider
| ↔ Svarstid svart till vitt | ||
|---|---|---|
| 32 ms ... stiga ↗ och falla ↘ kombinerat | ↗ 18 ms stiga | 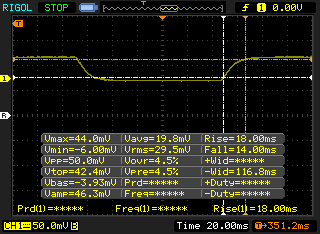 |
| ↘ 14 ms hösten | ||
| Skärmen visar långsamma svarsfrekvenser i våra tester och kommer att vara otillfredsställande för spelare. I jämförelse sträcker sig alla testade enheter från 0.1 (minst) till 240 (maximalt) ms. » 86 % av alla enheter är bättre. Detta innebär att den uppmätta svarstiden är sämre än genomsnittet av alla testade enheter (19.8 ms). | ||
| ↔ Svarstid 50 % grått till 80 % grått | ||
| 51.2 ms ... stiga ↗ och falla ↘ kombinerat | ↗ 27.2 ms stiga |  |
| ↘ 24 ms hösten | ||
| Skärmen visar långsamma svarsfrekvenser i våra tester och kommer att vara otillfredsställande för spelare. I jämförelse sträcker sig alla testade enheter från 0.165 (minst) till 636 (maximalt) ms. » 88 % av alla enheter är bättre. Detta innebär att den uppmätta svarstiden är sämre än genomsnittet av alla testade enheter (30.9 ms). | ||
Skärmflimmer / PWM (Puls-Width Modulation)
| Skärmflimmer / PWM upptäcktes inte | 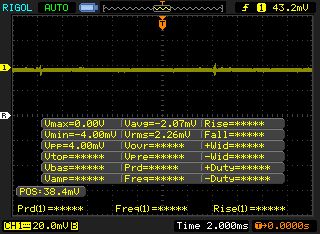 | ||
Som jämförelse: 52 % av alla testade enheter använder inte PWM för att dämpa skärmen. Om PWM upptäcktes mättes ett medelvärde av 7744 (minst: 5 - maximum: 343500) Hz. | |||

Cinebench R15: CPU Multi 64Bit | CPU Single 64Bit
Blender: v2.79 BMW27 CPU
7-Zip 18.03: 7z b 4 -mmt1 | 7z b 4
Geekbench 5.5: Single-Core | Multi-Core
HWBOT x265 Benchmark v2.2: 4k Preset
LibreOffice : 20 Documents To PDF
R Benchmark 2.5: Overall mean
| Cinebench R20 / CPU (Multi Core) | |
| MSI Bravo 17 A4DDR | |
| Asus Zephyrus G14 GA401IV | |
| Alienware m17 R2 P41E | |
| Asus Strix Scar 17 G732LXS | |
| MSI GE75 9SG | |
| Genomsnitt Intel Core i7-10875H (1986 - 4176, n=32) | |
| Dell XPS 17 9700 Core i7 RTX 2060 Max-Q | |
| Acer Nitro 5 AN515-44-R5FT | |
| MSI GE75 Raider 10SE-008US | |
| Dell G5 15 5590 | |
| Asus ROG Zephyrus S GX701GXR | |
| Dell XPS 15 9500 Core i5 | |
| Cinebench R20 / CPU (Single Core) | |
| Asus Zephyrus G14 GA401IV | |
| Asus Strix Scar 17 G732LXS | |
| Genomsnitt Intel Core i7-10875H (430 - 524, n=32) | |
| Dell XPS 17 9700 Core i7 RTX 2060 Max-Q | |
| MSI Bravo 17 A4DDR | |
| Alienware m17 R2 P41E | |
| MSI GE75 Raider 10SE-008US | |
| Dell XPS 15 9500 Core i5 | |
| MSI GE75 9SG | |
| Acer Nitro 5 AN515-44-R5FT | |
| Asus ROG Zephyrus S GX701GXR | |
| Dell G5 15 5590 | |
| Cinebench R15 / CPU Multi 64Bit | |
| MSI Bravo 17 A4DDR | |
| Asus Zephyrus G14 GA401IV | |
| Alienware m17 R2 P41E | |
| Asus Strix Scar 17 G732LXS | |
| MSI GE75 9SG | |
| Genomsnitt Intel Core i7-10875H (1003 - 1833, n=38) | |
| Dell XPS 17 9700 Core i7 RTX 2060 Max-Q | |
| Acer Nitro 5 AN515-44-R5FT | |
| MSI GE75 Raider 10SE-008US | |
| Dell G5 15 5590 | |
| Asus ROG Zephyrus S GX701GXR | |
| Dell XPS 15 9500 Core i5 | |
| Cinebench R15 / CPU Single 64Bit | |
| Genomsnitt Intel Core i7-10875H (190 - 220, n=37) | |
| Asus Strix Scar 17 G732LXS | |
| Dell XPS 17 9700 Core i7 RTX 2060 Max-Q | |
| Alienware m17 R2 P41E | |
| Asus Zephyrus G14 GA401IV | |
| MSI GE75 9SG | |
| MSI Bravo 17 A4DDR | |
| MSI GE75 Raider 10SE-008US | |
| Dell XPS 15 9500 Core i5 | |
| Acer Nitro 5 AN515-44-R5FT | |
| Asus ROG Zephyrus S GX701GXR | |
| Dell G5 15 5590 | |
| Blender / v2.79 BMW27 CPU | |
| Dell XPS 15 9500 Core i5 | |
| MSI GE75 Raider 10SE-008US | |
| Acer Nitro 5 AN515-44-R5FT | |
| Dell XPS 17 9700 Core i7 RTX 2060 Max-Q | |
| Genomsnitt Intel Core i7-10875H (259 - 535, n=30) | |
| Asus Zephyrus G14 GA401IV | |
| MSI GE75 9SG | |
| Asus Strix Scar 17 G732LXS | |
| MSI Bravo 17 A4DDR | |
| 7-Zip 18.03 / 7z b 4 -mmt1 | |
| Genomsnitt Intel Core i7-10875H (5071 - 5780, n=31) | |
| Asus Strix Scar 17 G732LXS | |
| Dell XPS 17 9700 Core i7 RTX 2060 Max-Q | |
| MSI GE75 Raider 10SE-008US | |
| MSI GE75 9SG | |
| Dell XPS 15 9500 Core i5 | |
| MSI Bravo 17 A4DDR | |
| Asus Zephyrus G14 GA401IV | |
| Acer Nitro 5 AN515-44-R5FT | |
| 7-Zip 18.03 / 7z b 4 | |
| MSI Bravo 17 A4DDR | |
| Asus Zephyrus G14 GA401IV | |
| MSI GE75 9SG | |
| Asus Strix Scar 17 G732LXS | |
| Genomsnitt Intel Core i7-10875H (29844 - 49562, n=31) | |
| Dell XPS 17 9700 Core i7 RTX 2060 Max-Q | |
| Acer Nitro 5 AN515-44-R5FT | |
| MSI GE75 Raider 10SE-008US | |
| Dell XPS 15 9500 Core i5 | |
| Geekbench 5.5 / Single-Core | |
| Dell XPS 17 9700 Core i7 RTX 2060 Max-Q | |
| Genomsnitt Intel Core i7-10875H (1233 - 1371, n=29) | |
| Asus Strix Scar 17 G732LXS | |
| MSI GE75 Raider 10SE-008US | |
| Asus Zephyrus G14 GA401IV | |
| MSI Bravo 17 A4DDR | |
| Dell XPS 15 9500 Core i5 | |
| Acer Nitro 5 AN515-44-R5FT | |
| Geekbench 5.5 / Multi-Core | |
| Asus Strix Scar 17 G732LXS | |
| MSI Bravo 17 A4DDR | |
| Dell XPS 17 9700 Core i7 RTX 2060 Max-Q | |
| Genomsnitt Intel Core i7-10875H (5715 - 8620, n=29) | |
| Asus Zephyrus G14 GA401IV | |
| MSI GE75 Raider 10SE-008US | |
| Acer Nitro 5 AN515-44-R5FT | |
| Dell XPS 15 9500 Core i5 | |
| HWBOT x265 Benchmark v2.2 / 4k Preset | |
| MSI Bravo 17 A4DDR | |
| Asus Strix Scar 17 G732LXS | |
| Asus Zephyrus G14 GA401IV | |
| MSI GE75 9SG | |
| Genomsnitt Intel Core i7-10875H (7.27 - 14.1, n=27) | |
| Dell XPS 17 9700 Core i7 RTX 2060 Max-Q | |
| MSI GE75 Raider 10SE-008US | |
| Acer Nitro 5 AN515-44-R5FT | |
| Dell XPS 15 9500 Core i5 | |
| LibreOffice / 20 Documents To PDF | |
| MSI Bravo 17 A4DDR | |
| Acer Nitro 5 AN515-44-R5FT | |
| Dell XPS 15 9500 Core i5 | |
| MSI GE75 Raider 10SE-008US | |
| Asus Strix Scar 17 G732LXS | |
| Genomsnitt Intel Core i7-10875H (30.2 - 84.3, n=30) | |
| Dell XPS 17 9700 Core i7 RTX 2060 Max-Q | |
| R Benchmark 2.5 / Overall mean | |
| Dell XPS 15 9500 Core i5 | |
| Acer Nitro 5 AN515-44-R5FT | |
| MSI GE75 Raider 10SE-008US | |
| Dell XPS 17 9700 Core i7 RTX 2060 Max-Q | |
| Genomsnitt Intel Core i7-10875H (0.546 - 0.662, n=29) | |
| Asus Strix Scar 17 G732LXS | |
| MSI Bravo 17 A4DDR | |
* ... mindre är bättre
| PCMark 8 | |
| Home Score Accelerated v2 | |
| Razer Blade Pro 17 RTX 2070 Max-Q 300 Hz | |
| HP Envy 17t-cg000 | |
| Dell XPS 17 9700 Core i7 RTX 2060 Max-Q | |
| Work Score Accelerated v2 | |
| Razer Blade Pro 17 RTX 2070 Max-Q 300 Hz | |
| HP Envy 17t-cg000 | |
| Dell XPS 17 9700 Core i7 RTX 2060 Max-Q | |
| PCMark 8 Home Score Accelerated v2 | 3649 poäng | |
| PCMark 8 Work Score Accelerated v2 | 4385 poäng | |
| PCMark 10 Score | 5672 poäng | |
Hjälp | ||
| DPC Latencies / LatencyMon - interrupt to process latency (max), Web, Youtube, Prime95 | |
| HP Envy 17t-cg000 | |
| Gigabyte Aero 17 HDR XB | |
| Razer Blade Pro 17 RTX 2070 Max-Q 300 Hz | |
| MSI Creator 17 A10SGS | |
| Dell XPS 17 9700 Core i7 RTX 2060 Max-Q | |
| Asus Zephyrus S17 GX701LXS | |
* ... mindre är bättre
| Dell XPS 17 9700 Core i7 RTX 2060 Max-Q Micron 2200S 1TB MTFDHBA1T0TCK | Razer Blade Pro 17 RTX 2070 Max-Q 300 Hz Lite-On CA5-8D512 | HP Envy 17t-cg000 WDC PC SN520 SDAPNUW-512G | Gigabyte Aero 17 HDR XB Samsung SSD PM981a MZVLB512HBJQ | Apple MacBook Pro 16 2019 i9 5500M Apple SSD AP1024 7171 | Asus ProArt StudioBook Pro 17 W700G3T Samsung SSD PM981 MZVLB1T0HALR | |
|---|---|---|---|---|---|---|
| AS SSD | 19% | 20% | 79% | 39% | 104% | |
| Seq Read (MB/s) | 1141 | 2019 77% | 1161 2% | 1762 54% | 2531 122% | 2958 159% |
| Seq Write (MB/s) | 994 | 1314 32% | 809 -19% | 2309 132% | 2289 130% | 2350 136% |
| 4K Read (MB/s) | 31.98 | 46.61 46% | 40.63 27% | 49.45 55% | 15.85 -50% | 56.6 77% |
| 4K Write (MB/s) | 61 | 90.2 48% | 138.6 127% | 117.1 92% | 39.88 -35% | 106.1 74% |
| 4K-64 Read (MB/s) | 790 | 665 -16% | 857 8% | 1237 57% | 1267 60% | 1836 132% |
| 4K-64 Write (MB/s) | 845 | 813 -4% | 1041 23% | 1986 135% | 1749 107% | 1789 112% |
| Access Time Read * (ms) | 0.063 | 0.058 8% | 0.067 -6% | 0.076 -21% | 0.122 -94% | 0.061 3% |
| Access Time Write * (ms) | 0.679 | 0.167 75% | 0.026 96% | 0.032 95% | 0.095 86% | 0.036 95% |
| Score Read (Points) | 966 | 913 -5% | 1013 5% | 1463 51% | 1536 59% | 2189 127% |
| Score Write (Points) | 1005 | 1034 3% | 1260 25% | 2334 132% | 2018 101% | 2130 112% |
| Score Total (Points) | 2448 | 2392 -2% | 2783 14% | 4581 87% | 4317 76% | 5411 121% |
| Copy ISO MB/s (MB/s) | 1732 | 1715 -1% | 1350 -22% | 1995 15% | ||
| Copy Program MB/s (MB/s) | 717 | 622 -13% | 766 7% | 584 -19% | ||
| Copy Game MB/s (MB/s) | 1343 | 1506 12% | 1190 -11% | 1135 -15% | ||
| CrystalDiskMark 5.2 / 6 | 48% | 11% | 53% | 22% | 53% | |
| Write 4K (MB/s) | 64.1 | 119 86% | 124.2 94% | 123.4 93% | 55.5 -13% | 147.6 130% |
| Read 4K (MB/s) | 39.93 | 51.9 30% | 46.11 15% | 45.59 14% | 16.21 -59% | 47.57 19% |
| Write Seq (MB/s) | 1191 | 2258 90% | 2320 95% | 1959 64% | 2222 87% | |
| Read Seq (MB/s) | 1418 | 2283 61% | 2013 42% | 1763 24% | 2543 79% | |
| Write 4K Q32T1 (MB/s) | 450.3 | 491 9% | 447 -1% | 489.3 9% | 398.5 -12% | 459.2 2% |
| Read 4K Q32T1 (MB/s) | 365 | 540 48% | 350.1 -4% | 559 53% | 648 78% | 515 41% |
| Write Seq Q32T1 (MB/s) | 1563 | 2253 44% | 1463 -6% | 2979 91% | 2727 74% | 2167 39% |
| Read Seq Q32T1 (MB/s) | 2683 | 3172 18% | 1751 -35% | 3432 28% | 3242 21% | 3430 28% |
| Write 4K Q8T8 (MB/s) | 445.5 | |||||
| Read 4K Q8T8 (MB/s) | 926 | |||||
| Totalt genomsnitt (program/inställningar) | 34% /
29% | 16% /
17% | 66% /
68% | 31% /
33% | 79% /
83% |
* ... mindre är bättre

Kontinuerlig inläsning: DiskSpd Read Loop, Queue Depth 8
| 3DMark 11 Performance | 18021 poäng | |
| 3DMark Cloud Gate Standard Score | 31845 poäng | |
| 3DMark Fire Strike Score | 13173 poäng | |
| 3DMark Time Spy Score | 5637 poäng | |
Hjälp | ||
| The Witcher 3 - 1920x1080 Ultra Graphics & Postprocessing (HBAO+) | |
| Gigabyte Aero 17 HDR XB | |
| MSI RTX 2060 Gaming Z 6G | |
| Dell G5 15 SE 5505 P89F | |
| Genomsnitt NVIDIA GeForce RTX 2060 Max-Q (51.2 - 62.9, n=4) | |
| Dell XPS 17 9700 Core i7 RTX 2060 Max-Q | |
| Asus TUF A17 FA706IU-AS76 | |
| MSI Bravo 15 A4DCR | |
| MSI GF75 Thin 10SCXR | |
| Asus TUF FX705GM | |
| Shadow of the Tomb Raider - 1920x1080 Highest Preset AA:T | |
| Gigabyte Aero 17 HDR XB | |
| MSI RTX 2060 Gaming Z 6G | |
| Asus TUF A17 FA706IU-AS76 | |
| Genomsnitt NVIDIA GeForce RTX 2060 Max-Q (65 - 74, n=2) | |
| Dell G5 15 SE 5505 P89F | |
| Dell XPS 17 9700 Core i7 RTX 2060 Max-Q | |
| Asus TUF FX705GM | |
| MSI GF75 Thin 10SCXR | |
| MSI Bravo 15 A4DCR | |
| låg | med. | hög | ultra | 4K | |
|---|---|---|---|---|---|
| The Witcher 3 (2015) | 284.8 | 182.1 | 109 | 56.1 | 24.9 |
| Dota 2 Reborn (2015) | 152 | 140 | 131 | 123 | 75.5 |
| X-Plane 11.11 (2018) | 111 | 97.8 | 79.8 | 63.7 | |
| Shadow of the Tomb Raider (2018) | 118 | 84 | 75 | 65 | 20 |
| Far Cry New Dawn (2019) | 105 | 75 | 70 | 63 | |
| Dirt Rally 2.0 (2019) | 276.7 | 125.3 | 105.3 | 60.5 | 24.4 |
| Control (2019) | 183.7 | 67.1 | 50.4 | ||
| GRID 2019 (2019) | 157.4 | 109.4 | 103.4 | 73.5 | 33.1 |
| Star Wars Jedi Fallen Order (2019) | 92.9 | 88 | 77.8 | ||
| Gears Tactics (2020) | 257.9 | 120.4 | 76.4 | 56.9 | 18.9 |
| Dell XPS 17 9700 Core i7 RTX 2060 Max-Q GeForce RTX 2060 Max-Q, i7-10875H, Micron 2200S 1TB MTFDHBA1T0TCK | Razer Blade Pro 17 RTX 2070 Max-Q 300 Hz GeForce RTX 2070 Max-Q, i7-10875H, Lite-On CA5-8D512 | MSI Creator 17 A10SGS GeForce RTX 2080 Super Max-Q, i7-10875H, Samsung SSD PM981 MZVLB2T0HMLB | HP Envy 17t-cg000 GeForce MX330, i7-1065G7, WDC PC SN520 SDAPNUW-512G | Gigabyte Aero 17 HDR XB GeForce RTX 2070 Super Max-Q, i7-10875H, Samsung SSD PM981a MZVLB512HBJQ | Asus Zephyrus S17 GX701LXS GeForce RTX 2080 Super Max-Q, i7-10875H, Samsung PM981a MZVLB1T0HBLR | |
|---|---|---|---|---|---|---|
| Noise | -4% | -11% | 2% | -16% | -8% | |
| av / miljö * (dB) | 28 | 28.2 -1% | 30 -7% | 28.2 -1% | 30 -7% | 25 11% |
| Idle Minimum * (dB) | 28 | 28.2 -1% | 32 -14% | 28.2 -1% | 35 -25% | 32 -14% |
| Idle Average * (dB) | 28 | 28.2 -1% | 33 -18% | 28.2 -1% | 36 -29% | 35 -25% |
| Idle Maximum * (dB) | 28 | 30.5 -9% | 40 -43% | 29.5 -5% | 38 -36% | 43 -54% |
| Load Average * (dB) | 43.2 | 42.2 2% | 47 -9% | 43.9 -2% | 47 -9% | 44 -2% |
| Witcher 3 ultra * (dB) | 49 | 53 -8% | 46 6% | 43.9 10% | 49 -0% | 41 16% |
| Load Maximum * (dB) | 50.5 | 55.5 -10% | 48 5% | 43.9 13% | 54 -7% | 45 11% |
* ... mindre är bättre
Ljudnivå
| Låg belastning |
| 28 / 28 / 28 dB(A) |
| Hög belastning |
| 43.2 / 50.5 dB(A) |
 | ||
30 dB tyst 40 dB(A) hörbar 50 dB(A) högt ljud |
||
min: | ||
(-) Den maximala temperaturen på ovansidan är 53 °C / 127 F, jämfört med genomsnittet av 36.8 °C / 98 F , allt från 21 till 71 °C för klassen Multimedia.
(+) Botten värms upp till maximalt 39.2 °C / 103 F, jämfört med genomsnittet av 39.1 °C / 102 F
(+) Vid tomgångsbruk är medeltemperaturen för ovansidan 31.4 °C / 89 F, jämfört med enhetsgenomsnittet på 31.3 °C / ### class_avg_f### F.
(±) När du spelar The Witcher 3 är medeltemperaturen för ovansidan 37.3 °C / 99 F, jämfört med enhetsgenomsnittet på 31.3 °C / ## #class_avg_f### F.
(+) Handledsstöden och pekplattan når maximal hudtemperatur (34.2 °C / 93.6 F) och är därför inte varma.
(-) Medeltemperaturen för handledsstödsområdet på liknande enheter var 28.7 °C / 83.7 F (-5.5 °C / -9.9 F).
Dell XPS 17 9700 Core i7 RTX 2060 Max-Q ljudanalys
(±) | högtalarljudstyrkan är genomsnittlig men bra (75.8 dB)
Bas 100 - 315 Hz
(±) | reducerad bas - i genomsnitt 8.3% lägre än medianen
(±) | linjäriteten för basen är genomsnittlig (8.6% delta till föregående frekvens)
Mellan 400 - 2000 Hz
(+) | balanserad mellan - endast 2.2% från medianen
(+) | mids är linjära (3.8% delta till föregående frekvens)
Högsta 2 - 16 kHz
(+) | balanserade toppar - endast 2.1% från medianen
(+) | toppar är linjära (5.3% delta till föregående frekvens)
Totalt 100 - 16 000 Hz
(+) | det totala ljudet är linjärt (10.9% skillnad mot median)
Jämfört med samma klass
» 16% av alla testade enheter i den här klassen var bättre, 3% liknande, 81% sämre
» Den bästa hade ett delta på 5%, genomsnittet var 17%, sämst var 45%
Jämfört med alla testade enheter
» 6% av alla testade enheter var bättre, 2% liknande, 92% sämre
» Den bästa hade ett delta på 4%, genomsnittet var 23%, sämst var 134%
Apple MacBook 12 (Early 2016) 1.1 GHz ljudanalys
(+) | högtalare kan spela relativt högt (83.6 dB)
Bas 100 - 315 Hz
(±) | reducerad bas - i genomsnitt 11.3% lägre än medianen
(±) | linjäriteten för basen är genomsnittlig (14.2% delta till föregående frekvens)
Mellan 400 - 2000 Hz
(+) | balanserad mellan - endast 2.4% från medianen
(+) | mids är linjära (5.5% delta till föregående frekvens)
Högsta 2 - 16 kHz
(+) | balanserade toppar - endast 2% från medianen
(+) | toppar är linjära (4.5% delta till föregående frekvens)
Totalt 100 - 16 000 Hz
(+) | det totala ljudet är linjärt (10.2% skillnad mot median)
Jämfört med samma klass
» 7% av alla testade enheter i den här klassen var bättre, 2% liknande, 90% sämre
» Den bästa hade ett delta på 5%, genomsnittet var 18%, sämst var 53%
Jämfört med alla testade enheter
» 5% av alla testade enheter var bättre, 1% liknande, 94% sämre
» Den bästa hade ett delta på 4%, genomsnittet var 23%, sämst var 134%
| Av/Standby | |
| Låg belastning | |
| Hög belastning |
|
Förklaring:
min: | |
| Dell XPS 17 9700 Core i7 RTX 2060 Max-Q i7-10875H, GeForce RTX 2060 Max-Q, Micron 2200S 1TB MTFDHBA1T0TCK, IPS, 3840x2400, 17" | Acer Aspire Nitro 5 AN517-51-7887 i7-9750H, GeForce GTX 1660 Ti Mobile, WDC PC SN520 SDAPNUW-512G, IPS, 1920x1080, 17.3" | MSI Creator 17 A10SGS i7-10875H, GeForce RTX 2080 Super Max-Q, Samsung SSD PM981 MZVLB2T0HMLB, Mini-LED IPS-Level, 3840x2160, 17.3" | HP Envy 17t-cg000 i7-1065G7, GeForce MX330, WDC PC SN520 SDAPNUW-512G, IPS, 3840x2160, 17.3" | Gigabyte Aero 17 HDR XB i7-10875H, GeForce RTX 2070 Super Max-Q, Samsung SSD PM981a MZVLB512HBJQ, IPS, 3840x2160, 17.3" | Apple MacBook Pro 16 2019 i9 5500M i9-9880H, Radeon Pro 5500M, Apple SSD AP1024 7171, IPS, 3072x1920, 16" | |
|---|---|---|---|---|---|---|
| Power Consumption | 11% | -78% | 24% | -69% | 18% | |
| Idle Minimum * (Watt) | 5.8 | 3.9 33% | 15 -159% | 6.1 -5% | 16 -176% | 3.7 36% |
| Idle Average * (Watt) | 20.6 | 8.9 57% | 20 3% | 13 37% | 19 8% | 12.1 41% |
| Idle Maximum * (Watt) | 21 | 12.2 42% | 42 -100% | 13.5 36% | 30 -43% | 17 19% |
| Load Average * (Watt) | 104.7 | 83 21% | 150 -43% | 72.7 31% | 109 -4% | 91.5 13% |
| Witcher 3 ultra * (Watt) | 99.2 | 130 -31% | 170 -71% | 62.2 37% | 167 -68% | 103 -4% |
| Load Maximum * (Watt) | 107.6 | 168 -56% | 210 -95% | 97.1 10% | 246 -129% | 102.3 5% |
* ... mindre är bättre
| Dell XPS 17 9700 Core i7 RTX 2060 Max-Q i7-10875H, GeForce RTX 2060 Max-Q, 97 Wh | Razer Blade Pro 17 RTX 2070 Max-Q 300 Hz i7-10875H, GeForce RTX 2070 Max-Q, 70 Wh | MSI Creator 17 A10SGS i7-10875H, GeForce RTX 2080 Super Max-Q, 82 Wh | HP Envy 17t-cg000 i7-1065G7, GeForce MX330, 55 Wh | Gigabyte Aero 17 HDR XB i7-10875H, GeForce RTX 2070 Super Max-Q, 94 Wh | Apple MacBook Pro 16 2019 i9 5500M i9-9880H, Radeon Pro 5500M, 99.8 Wh | |
|---|---|---|---|---|---|---|
| Batteridrifttid | -49% | -57% | -39% | -26% | -13% | |
| Reader / Idle (h) | 23.8 | 7.2 -70% | 15.4 -35% | 9.9 -58% | ||
| WiFi v1.3 (h) | 9.7 | 4.9 -49% | 4.4 -55% | 4.6 -53% | 6.2 -36% | 12 24% |
| Load (h) | 2 | 1.1 -45% | 1.4 -30% | 2.3 15% | 1 -50% | |
| Witcher 3 ultra (h) | 0.9 |
För
Emot
Omdöme — Unik
Läs den fullständiga versionen av den här recensionen på engelska här.
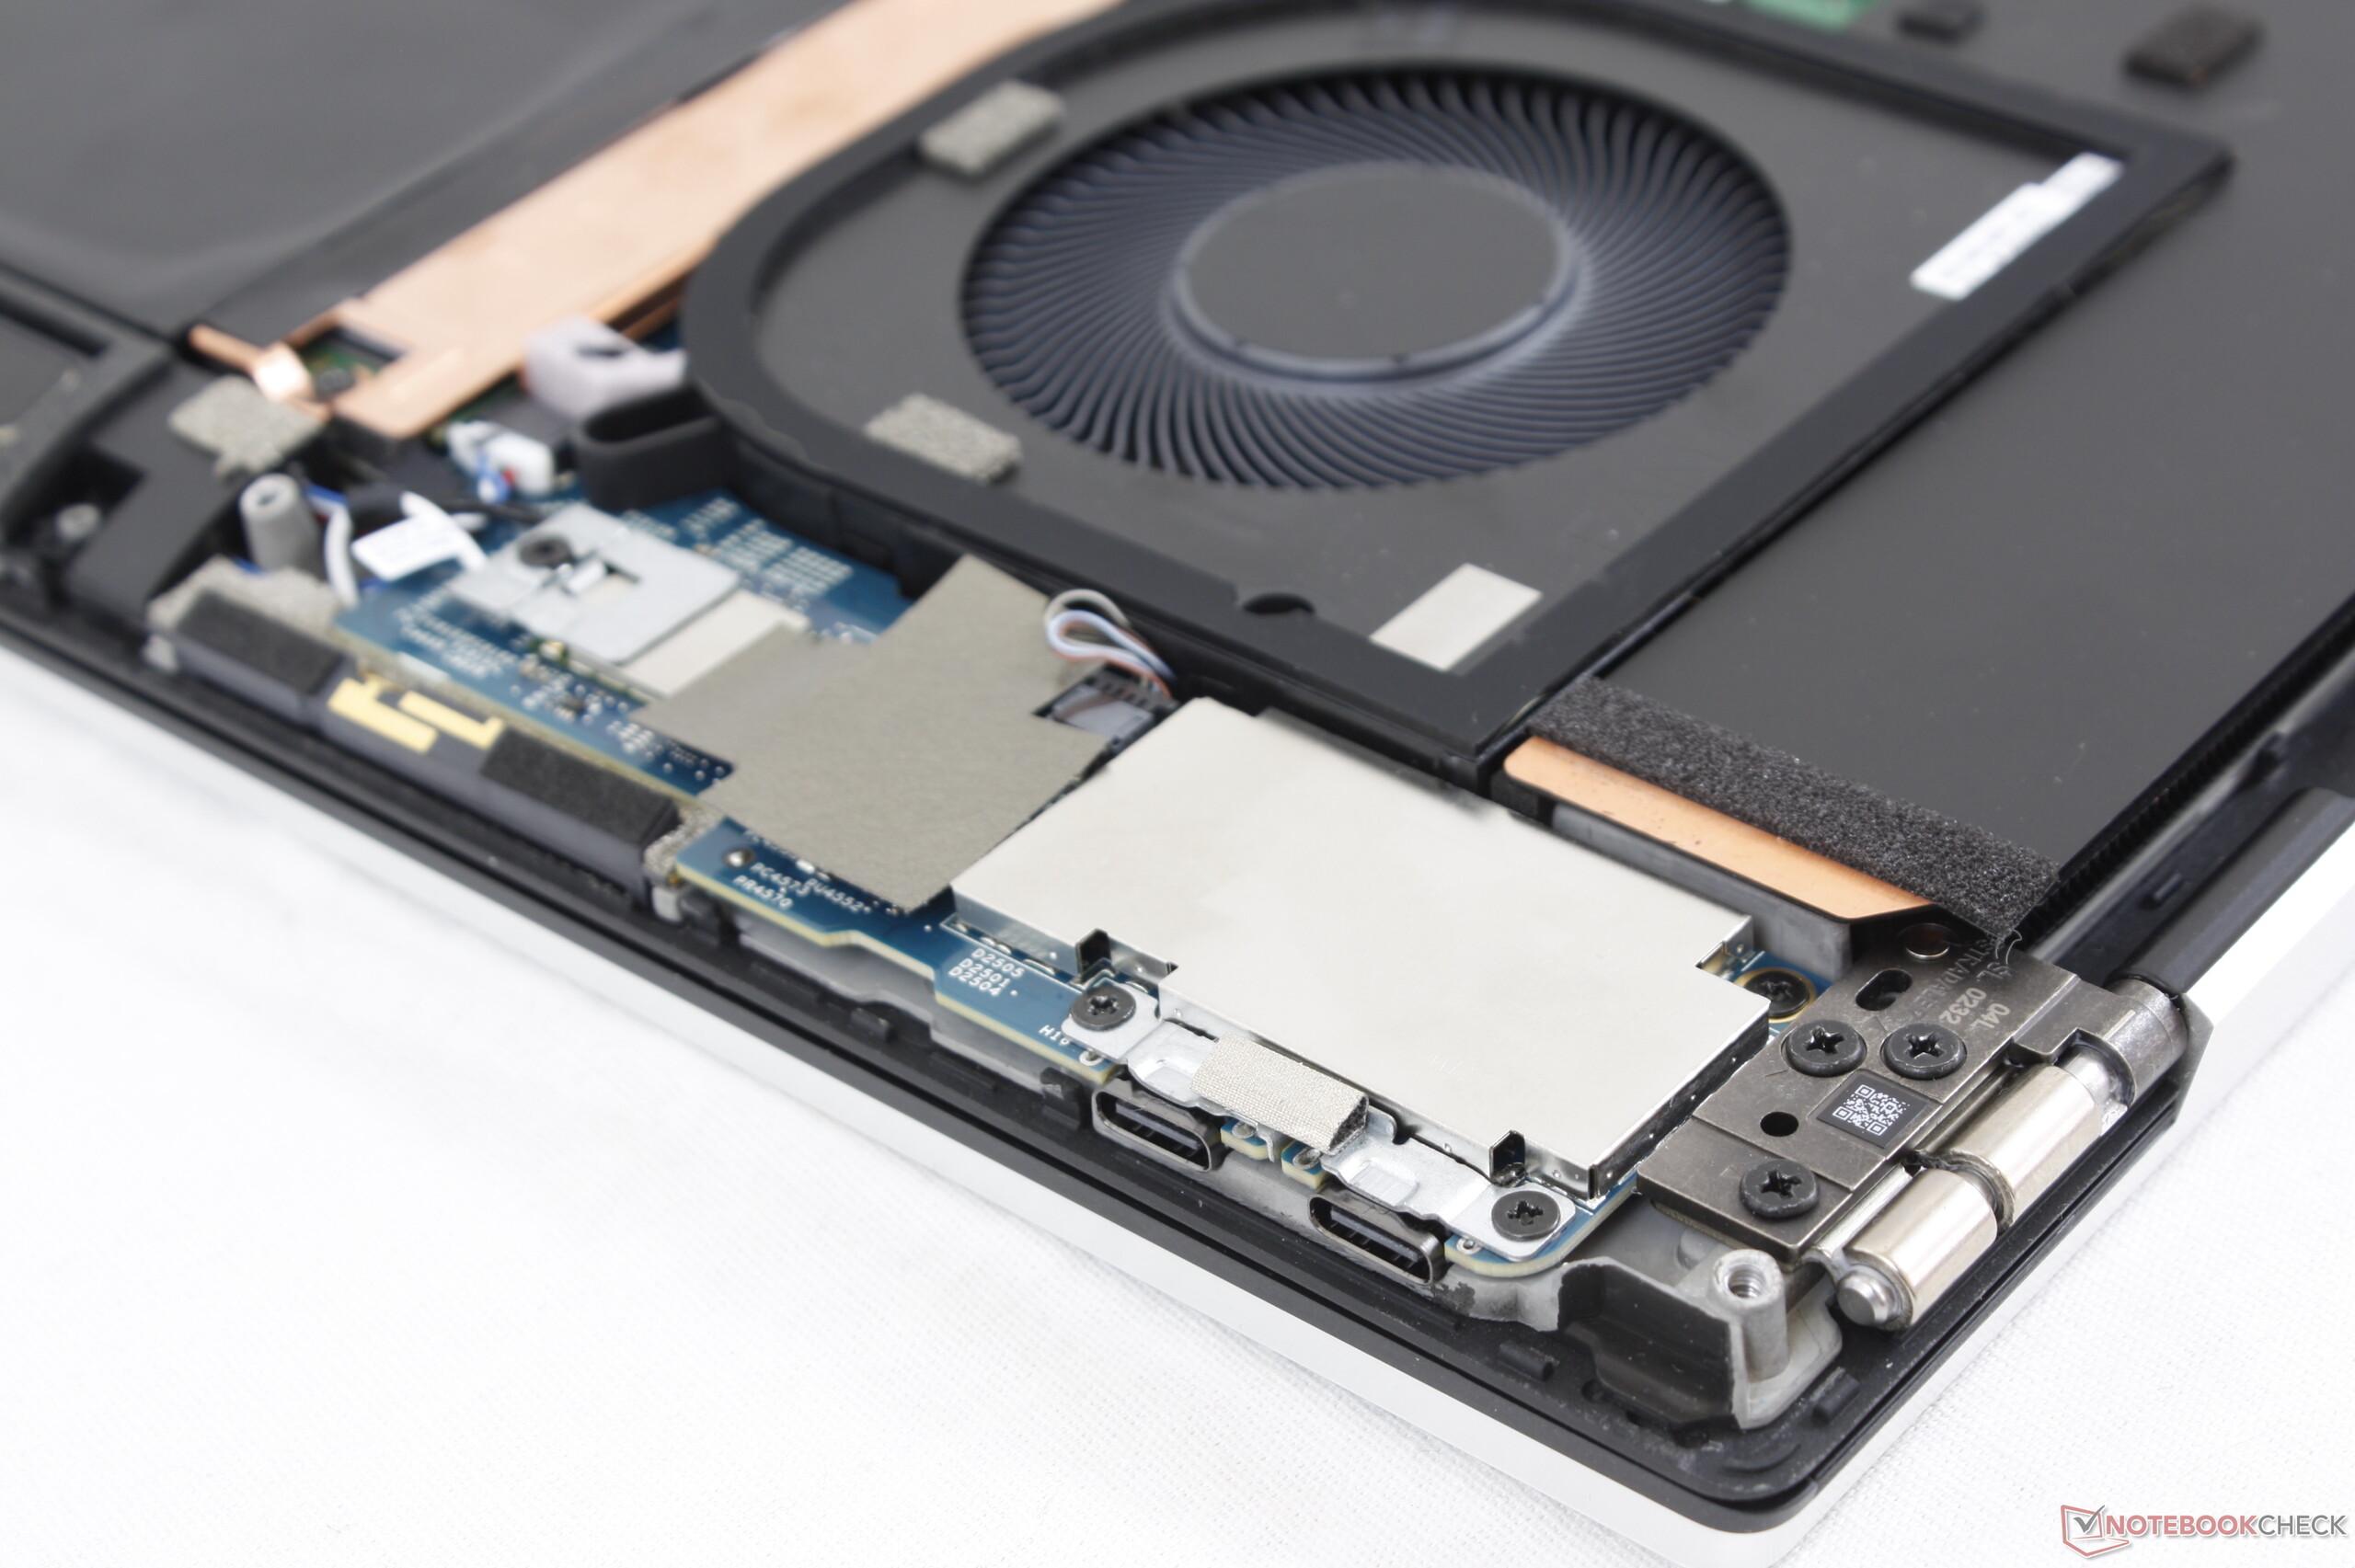
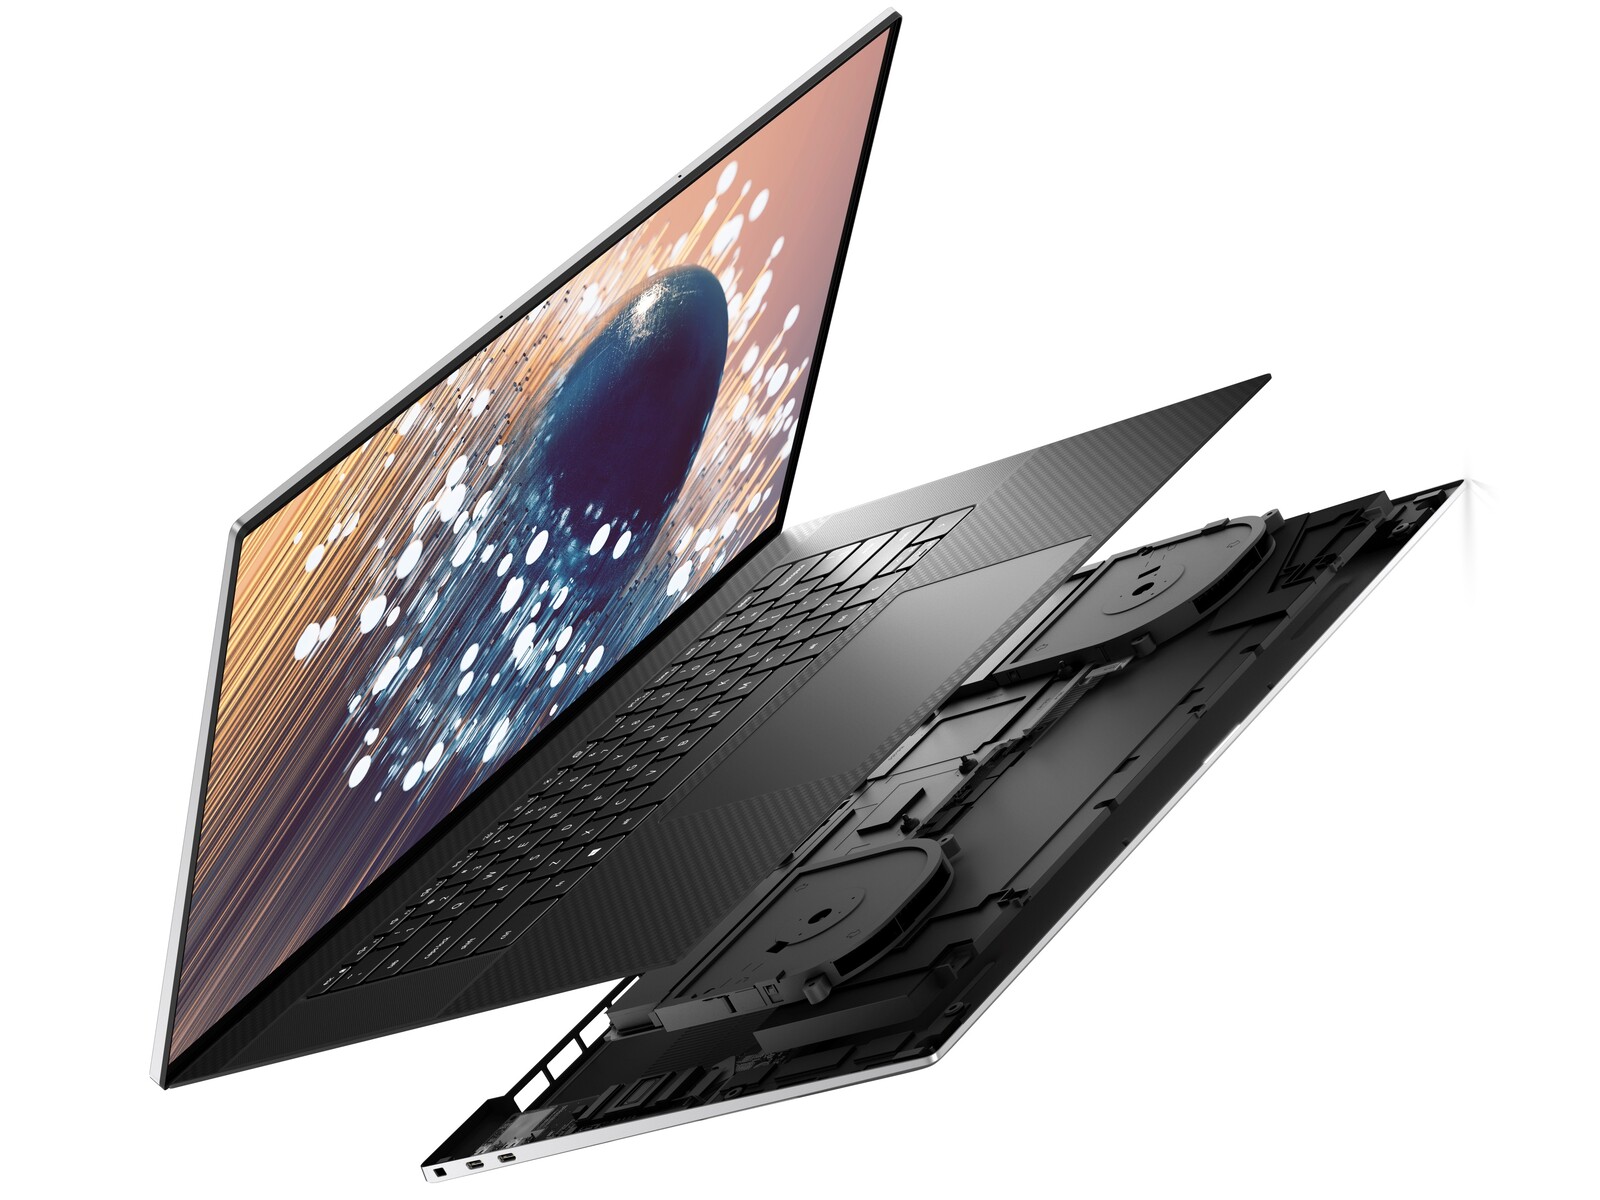
Vi får ge XPS 17 en eloge för att den flyttar fram gränserna i större utsträckning än vad de flesta andra tillverkare där ute gör. Ingen annan har en ultratunn 16:10-laptop på 17 tum med en åttakärnig i7 CPU (snart en Core i9) som körs i 99 C vid full belastning bredvid en GeForce RTX 2060 Max-Q GPU samtidigt som allt drivs av en USB-C adapter. Den har till och med en ångkammarkylare — något som vanligen bara förekommer på ett fåtal bärbara speldatorer. Riskerna och hårdvaran som ingår är ganska galna jämfört med alternativen, som oftast tar det säkra före det osäkra.
Efter att ha testat systemet känner vi att det kunde haft nytta av att ta ett steg tillbaka och fokusera på en del av det grundläggande. Starkare gångjärn, fastare klickplatte-knappar, ett inbyggt skydd för webbkameran och snabbare laddning — aspekter som många bärbara datorer som bara kostar hälften så mycket har lyckats med.
Vill man köra XPS 17 med hög belastning under längre perioder bör man känna till en del brister. För det första kan det hända att batteriet inte laddar eftersom USB-C adaptern är begränsad till 130 W. Det finns en anledning till att de flesta andra bärbara datorer utrustade med ett GeForce RTX-kort inte använder USB-C adaptrar utan istället förlitar sig på propretiära runda laddare som kan leverera mer kraft åt de krävande systemen. För det andra var den ihållande spelprestandan inte så stabil: vi mätte återkommande tapp i bilduppdateringen. Det, tillsammans med märkbar ghosting, gör att man inte borde se detta som en spelmaskin trots Killer-WiFi och GeForce RTX-grafik.
XPS 17 fungerar som bäst för "spurtiga" ändamål, som att surfa på nätet eller redigera video, där systemet inte används fullt ut timme efter timme. Det är skärmen, designen och prestandan i förhållande till volymen som gör detta till ett mer tilltalande alternativ än de flesta andra modeller på 15.6 eller 17.3 tum.
Ett unikt kraftpaket på 17 tum som inte direkt påminner om något annat. Imponerande hårdvara och tilltalande visuell design drar blicken till sig, men delar av grunderna kunde behövt lite mer uppmärksamhet.
Dell XPS 17 9700 Core i7 RTX 2060 Max-Q
- 07/15/2020 v7 (old)
Allen Ngo
Price comparison
