Test: Razer Blade Pro 17 2020 - Behöver du verkligen en laptop med 300 Hz? (Sammanfattning)
Gradering | Datum | Modell | Vikt | Höjd | Storlek | Upplösning | Pris |
|---|---|---|---|---|---|---|---|
| 87.4 % v7 (old) | 06/2020 | Razer Blade Pro 17 RTX 2070 Max-Q 300 Hz i7-10875H, GeForce RTX 2070 Max-Q | 2.7 kg | 19.9 mm | 17.30" | 1920x1080 | |
| 81.2 % v7 (old) | 12/2019 | Asus ROG Zephyrus S GX701GXR i7-9750H, GeForce RTX 2080 Max-Q | 2.7 kg | 18.7 mm | 17.30" | 1920x1080 | |
| 82.9 % v7 (old) | 07/2019 | MSI GS75 Stealth 9SG i7-9750H, GeForce RTX 2080 Max-Q | 2.3 kg | 18.9 mm | 17.30" | 1920x1080 | |
| 84.2 % v7 (old) | 03/2020 | Alienware m17 R2 P41E i9-9980HK, GeForce RTX 2080 Max-Q | 2.6 kg | 20.5 mm | 17.30" | 1920x1080 | |
| 86.5 % v7 (old) | 06/2020 | Aorus 17G XB i7-10875H, GeForce RTX 2070 Super Max-Q | 2.7 kg | 26 mm | 17.30" | 1920x1080 |
| SD Card Reader | |
| average JPG Copy Test (av. of 3 runs) | |
| Aorus 17G XB (Toshiba Exceria Pro SDXC 64 GB UHS-II) | |
| Razer Blade Pro 17 RTX 2070 Max-Q 300 Hz (Toshiba Exceria Pro SDXC 64 GB UHS-II) | |
| Dell XPS 15 9500 Core i7 4K UHD (Toshiba Exceria Pro SDXC 64 GB UHS-II) | |
| Razer Blade Pro 17 4K UHD 120 Hz (Toshiba Exceria Pro SDXC 64 GB UHS-II) | |
| MSI GS63VR 7RG-005 (Toshiba Exceria Pro SDXC 64 GB UHS-II) | |
| maximum AS SSD Seq Read Test (1GB) | |
| Aorus 17G XB (Toshiba Exceria Pro SDXC 64 GB UHS-II) | |
| Razer Blade Pro 17 RTX 2070 Max-Q 300 Hz (Toshiba Exceria Pro SDXC 64 GB UHS-II) | |
| MSI GS63VR 7RG-005 (Toshiba Exceria Pro SDXC 64 GB UHS-II) | |
| Razer Blade Pro 17 4K UHD 120 Hz (Toshiba Exceria Pro SDXC 64 GB UHS-II) | |
| Dell XPS 15 9500 Core i7 4K UHD (Toshiba Exceria Pro SDXC 64 GB UHS-II) | |


| |||||||||||||||||||||||||
Distribution av ljusstyrkan: 78 %
Mitt på batteriet: 328 cd/m²
Kontrast: 937:1 (Svärta: 0.35 cd/m²)
ΔE ColorChecker Calman: 4.74 | ∀{0.5-29.43 Ø4.73}
calibrated: 2.12
ΔE Greyscale Calman: 6.8 | ∀{0.09-98 Ø4.97}
98.6% sRGB (Argyll 1.6.3 3D)
64.8% AdobeRGB 1998 (Argyll 1.6.3 3D)
73% AdobeRGB 1998 (Argyll 3D)
98.5% sRGB (Argyll 3D)
72.2% Display P3 (Argyll 3D)
Gamma: 2.2
CCT: 6446 K
| Razer Blade Pro 17 RTX 2070 Max-Q 300 Hz Sharp LQ173M1JW02, IPS, 17.3", 1920x1080 | Asus ROG Zephyrus S GX701GXR AU Optronics B173HAN05.1, IPS, 17.3", 1920x1080 | MSI GS75 Stealth 9SG Chi Mei N173HCE-G33 (CMN175C), IPS, 17.3", 1920x1080 | Alienware m17 R2 P41E Chi Mei 173HCE, CMN175F, IPS, 17.3", 1920x1080 | Aorus 17G XB AU Optronics B173HAN05.0 (AUO509D), IPS, 17.3", 1920x1080 | Razer Blade Pro 17 4K UHD 120 Hz AU Optronics B173ZAN03.3, IPS, 17.3", 3840x2160 | |
|---|---|---|---|---|---|---|
| Display | -2% | -10% | -1% | -1% | 18% | |
| Display P3 Coverage (%) | 72.2 | 70 -3% | 62.6 -13% | 70.8 -2% | 70.6 -2% | 84.8 17% |
| sRGB Coverage (%) | 98.5 | 96.6 -2% | 93.5 -5% | 98.5 0% | 97.2 -1% | 99.9 1% |
| AdobeRGB 1998 Coverage (%) | 73 | 72.3 -1% | 64.7 -11% | 72.2 -1% | 72.8 0% | 98.6 35% |
| Response Times | 11% | -17% | -110% | -106% | -90% | |
| Response Time Grey 50% / Grey 80% * (ms) | 5.6 ? | 5.6 ? -0% | 7.2 ? -29% | 17.2 ? -207% | 16 ? -186% | 15.2 ? -171% |
| Response Time Black / White * (ms) | 9.6 ? | 7.6 ? 21% | 10 ? -4% | 10.8 ? -13% | 12 ? -25% | 10.4 ? -8% |
| PWM Frequency (Hz) | 25510 ? | 26320 ? | ||||
| Screen | 23% | 31% | 32% | 31% | 3% | |
| Brightness middle (cd/m²) | 328 | 288 -12% | 366 12% | 384.2 17% | 293 -11% | 346.7 6% |
| Brightness (cd/m²) | 329 | 276 -16% | 343 4% | 357 9% | 285 -13% | 332 1% |
| Brightness Distribution (%) | 78 | 93 19% | 91 17% | 90 15% | 95 22% | 91 17% |
| Black Level * (cd/m²) | 0.35 | 0.24 31% | 0.29 17% | 0.29 17% | 0.24 31% | 0.27 23% |
| Contrast (:1) | 937 | 1200 28% | 1262 35% | 1325 41% | 1221 30% | 1284 37% |
| Colorchecker dE 2000 * | 4.74 | 1.92 59% | 1.51 68% | 1.35 72% | 1.27 73% | 5.62 -19% |
| Colorchecker dE 2000 max. * | 8.99 | 4.57 49% | 3.22 64% | 3.45 62% | 2.24 75% | 9.36 -4% |
| Colorchecker dE 2000 calibrated * | 2.12 | 1.14 46% | 0.71 67% | 1.42 33% | 1.06 50% | 3.81 -80% |
| Greyscale dE 2000 * | 6.8 | 3.08 55% | 1.93 72% | 1.2 82% | 1.34 80% | 5.5 19% |
| Gamma | 2.2 100% | 2.42 91% | 2.38 92% | 2.23 99% | 2.38 92% | 2.25 98% |
| CCT | 6446 101% | 7055 92% | 6881 94% | 6580 99% | 6542 99% | 6175 105% |
| Color Space (Percent of AdobeRGB 1998) (%) | 64.8 | 65 0% | 60 -7% | 65.5 1% | 73 13% | 87.2 35% |
| Color Space (Percent of sRGB) (%) | 98.6 | 96 -3% | 94 -5% | 98.5 0% | 94 -5% | 100 1% |
| Totalt genomsnitt (program/inställningar) | 11% /
17% | 1% /
18% | -26% /
8% | -25% /
8% | -23% /
-6% |
* ... mindre är bättre
Visa svarstider
| ↔ Svarstid svart till vitt | ||
|---|---|---|
| 9.6 ms ... stiga ↗ och falla ↘ kombinerat | ↗ 5.2 ms stiga | 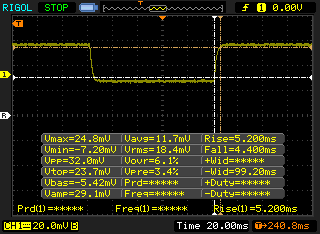 |
| ↘ 4.4 ms hösten | ||
| Skärmen visar snabba svarsfrekvenser i våra tester och bör passa för spel. I jämförelse sträcker sig alla testade enheter från 0.1 (minst) till 240 (maximalt) ms. » 26 % av alla enheter är bättre. Det betyder att den uppmätta svarstiden är bättre än genomsnittet av alla testade enheter (19.9 ms). | ||
| ↔ Svarstid 50 % grått till 80 % grått | ||
| 5.6 ms ... stiga ↗ och falla ↘ kombinerat | ↗ 2.6 ms stiga | 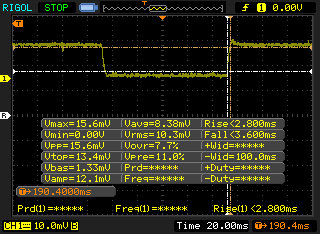 |
| ↘ 3 ms hösten | ||
| Skärmen visar väldigt snabba svarsfrekvenser i våra tester och borde vara mycket väl lämpad för fartfyllt spel. I jämförelse sträcker sig alla testade enheter från 0.165 (minst) till 636 (maximalt) ms. » 18 % av alla enheter är bättre. Det betyder att den uppmätta svarstiden är bättre än genomsnittet av alla testade enheter (31.1 ms). | ||
Skärmflimmer / PWM (Puls-Width Modulation)
| Skärmflimmer / PWM upptäcktes inte | 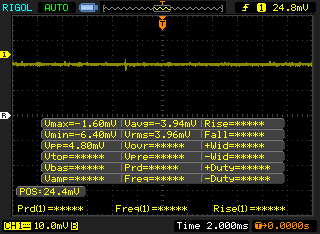 | ||
Som jämförelse: 52 % av alla testade enheter använder inte PWM för att dämpa skärmen. Om PWM upptäcktes mättes ett medelvärde av 7798 (minst: 5 - maximum: 343500) Hz. | |||
Cinebench R15: CPU Multi 64Bit | CPU Single 64Bit
Blender: v2.79 BMW27 CPU
7-Zip 18.03: 7z b 4 -mmt1 | 7z b 4
Geekbench 5.5: Single-Core | Multi-Core
HWBOT x265 Benchmark v2.2: 4k Preset
LibreOffice : 20 Documents To PDF
R Benchmark 2.5: Overall mean
| Cinebench R20 / CPU (Multi Core) | |
| Asus Zephyrus G14 GA401IV | |
| Alienware m17 R2 P41E | |
| Asus TUF A17 FA706IU-AS76 | |
| MSI GE66 Raider 10SFS | |
| MSI GE75 9SG | |
| Genomsnitt Intel Core i7-10875H (1986 - 4176, n=32) | |
| Razer Blade Pro 17 RTX 2070 Max-Q 300 Hz | |
| Acer Nitro 5 AN515-44-R5FT | |
| Acer Nitro 5 AN517-52-77DS | |
| Razer Blade Pro 17 4K UHD 120 Hz | |
| MSI GF75 Thin 10SCXR | |
| Cinebench R20 / CPU (Single Core) | |
| Asus Zephyrus G14 GA401IV | |
| Genomsnitt Intel Core i7-10875H (430 - 524, n=32) | |
| Razer Blade Pro 17 RTX 2070 Max-Q 300 Hz | |
| Alienware m17 R2 P41E | |
| Acer Nitro 5 AN517-52-77DS | |
| Asus TUF A17 FA706IU-AS76 | |
| MSI GE66 Raider 10SFS | |
| MSI GE75 9SG | |
| MSI GF75 Thin 10SCXR | |
| Razer Blade Pro 17 4K UHD 120 Hz | |
| Acer Nitro 5 AN515-44-R5FT | |
| Cinebench R15 / CPU Multi 64Bit | |
| Asus Zephyrus G14 GA401IV | |
| Asus TUF A17 FA706IU-AS76 | |
| Alienware m17 R2 P41E | |
| MSI GE75 9SG | |
| MSI GE66 Raider 10SFS | |
| Genomsnitt Intel Core i7-10875H (1003 - 1833, n=38) | |
| Razer Blade Pro 17 RTX 2070 Max-Q 300 Hz | |
| Acer Nitro 5 AN515-44-R5FT | |
| Acer Nitro 5 AN517-52-77DS | |
| Razer Blade Pro 17 4K UHD 120 Hz | |
| MSI GF75 Thin 10SCXR | |
| Cinebench R15 / CPU Single 64Bit | |
| MSI GE66 Raider 10SFS | |
| Genomsnitt Intel Core i7-10875H (190 - 220, n=37) | |
| Razer Blade Pro 17 RTX 2070 Max-Q 300 Hz | |
| Acer Nitro 5 AN517-52-77DS | |
| Alienware m17 R2 P41E | |
| Asus Zephyrus G14 GA401IV | |
| MSI GE75 9SG | |
| Asus TUF A17 FA706IU-AS76 | |
| MSI GF75 Thin 10SCXR | |
| Acer Nitro 5 AN515-44-R5FT | |
| Razer Blade Pro 17 4K UHD 120 Hz | |
| Blender / v2.79 BMW27 CPU | |
| MSI GF75 Thin 10SCXR | |
| Acer Nitro 5 AN517-52-77DS | |
| Acer Nitro 5 AN515-44-R5FT | |
| Genomsnitt Intel Core i7-10875H (259 - 535, n=30) | |
| Razer Blade Pro 17 RTX 2070 Max-Q 300 Hz | |
| Asus Zephyrus G14 GA401IV | |
| MSI GE75 9SG | |
| MSI GE66 Raider 10SFS | |
| Asus TUF A17 FA706IU-AS76 | |
| 7-Zip 18.03 / 7z b 4 -mmt1 | |
| MSI GE66 Raider 10SFS | |
| Genomsnitt Intel Core i7-10875H (5071 - 5780, n=31) | |
| Razer Blade Pro 17 RTX 2070 Max-Q 300 Hz | |
| Acer Nitro 5 AN517-52-77DS | |
| MSI GE75 9SG | |
| Asus TUF A17 FA706IU-AS76 | |
| MSI GF75 Thin 10SCXR | |
| Asus Zephyrus G14 GA401IV | |
| Acer Nitro 5 AN515-44-R5FT | |
| 7-Zip 18.03 / 7z b 4 | |
| Asus TUF A17 FA706IU-AS76 | |
| Asus Zephyrus G14 GA401IV | |
| MSI GE66 Raider 10SFS | |
| MSI GE75 9SG | |
| Genomsnitt Intel Core i7-10875H (29844 - 49562, n=31) | |
| Acer Nitro 5 AN515-44-R5FT | |
| Razer Blade Pro 17 RTX 2070 Max-Q 300 Hz | |
| Acer Nitro 5 AN517-52-77DS | |
| MSI GF75 Thin 10SCXR | |
| Geekbench 5.5 / Single-Core | |
| MSI GE66 Raider 10SFS | |
| Genomsnitt Intel Core i7-10875H (1233 - 1371, n=29) | |
| Razer Blade Pro 17 RTX 2070 Max-Q 300 Hz | |
| Acer Nitro 5 AN517-52-77DS | |
| Asus Zephyrus G14 GA401IV | |
| Asus TUF A17 FA706IU-AS76 | |
| MSI GF75 Thin 10SCXR | |
| Acer Nitro 5 AN515-44-R5FT | |
| Geekbench 5.5 / Multi-Core | |
| MSI GE66 Raider 10SFS | |
| Asus TUF A17 FA706IU-AS76 | |
| Genomsnitt Intel Core i7-10875H (5715 - 8620, n=29) | |
| Asus Zephyrus G14 GA401IV | |
| Razer Blade Pro 17 RTX 2070 Max-Q 300 Hz | |
| Acer Nitro 5 AN517-52-77DS | |
| Acer Nitro 5 AN515-44-R5FT | |
| MSI GF75 Thin 10SCXR | |
| HWBOT x265 Benchmark v2.2 / 4k Preset | |
| MSI GE66 Raider 10SFS | |
| Asus TUF A17 FA706IU-AS76 | |
| Asus Zephyrus G14 GA401IV | |
| MSI GE75 9SG | |
| Genomsnitt Intel Core i7-10875H (7.27 - 14.1, n=27) | |
| Acer Nitro 5 AN517-52-77DS | |
| Acer Nitro 5 AN515-44-R5FT | |
| MSI GF75 Thin 10SCXR | |
| LibreOffice / 20 Documents To PDF | |
| Acer Nitro 5 AN515-44-R5FT | |
| Asus TUF A17 FA706IU-AS76 | |
| MSI GF75 Thin 10SCXR | |
| Razer Blade Pro 17 RTX 2070 Max-Q 300 Hz | |
| MSI GE66 Raider 10SFS | |
| Genomsnitt Intel Core i7-10875H (30.2 - 84.3, n=30) | |
| Acer Nitro 5 AN517-52-77DS | |
| R Benchmark 2.5 / Overall mean | |
| MSI GF75 Thin 10SCXR | |
| Acer Nitro 5 AN517-52-77DS | |
| Acer Nitro 5 AN515-44-R5FT | |
| Asus TUF A17 FA706IU-AS76 | |
| Genomsnitt Intel Core i7-10875H (0.546 - 0.662, n=29) | |
| MSI GE66 Raider 10SFS | |
* ... mindre är bättre
| PCMark 10 | |
| Score | |
| Aorus 17G XB | |
| Razer Blade Pro 17 RTX 2070 Max-Q 300 Hz | |
| Razer Blade Pro 17 4K UHD 120 Hz | |
| Asus ROG Zephyrus S GX701GXR | |
| MSI GS75 Stealth 9SG | |
| Alienware m17 R2 P41E | |
| Essentials | |
| Aorus 17G XB | |
| Alienware m17 R2 P41E | |
| Razer Blade Pro 17 4K UHD 120 Hz | |
| Razer Blade Pro 17 RTX 2070 Max-Q 300 Hz | |
| MSI GS75 Stealth 9SG | |
| Asus ROG Zephyrus S GX701GXR | |
| Productivity | |
| Alienware m17 R2 P41E | |
| Aorus 17G XB | |
| Razer Blade Pro 17 RTX 2070 Max-Q 300 Hz | |
| Asus ROG Zephyrus S GX701GXR | |
| MSI GS75 Stealth 9SG | |
| Razer Blade Pro 17 4K UHD 120 Hz | |
| Digital Content Creation | |
| Aorus 17G XB | |
| Razer Blade Pro 17 4K UHD 120 Hz | |
| Razer Blade Pro 17 RTX 2070 Max-Q 300 Hz | |
| Asus ROG Zephyrus S GX701GXR | |
| MSI GS75 Stealth 9SG | |
| Alienware m17 R2 P41E | |
| PCMark 8 | |
| Home Score Accelerated v2 | |
| Asus ROG Zephyrus S GX701GXR | |
| Razer Blade Pro 17 RTX 2070 Max-Q 300 Hz | |
| MSI GS75 Stealth 9SG | |
| Alienware m17 R2 P41E | |
| Razer Blade Pro 17 4K UHD 120 Hz | |
| Work Score Accelerated v2 | |
| Asus ROG Zephyrus S GX701GXR | |
| Razer Blade Pro 17 RTX 2070 Max-Q 300 Hz | |
| Alienware m17 R2 P41E | |
| MSI GS75 Stealth 9SG | |
| Razer Blade Pro 17 4K UHD 120 Hz | |
| PCMark 8 Home Score Accelerated v2 | 5217 poäng | |
| PCMark 8 Work Score Accelerated v2 | 6317 poäng | |
| PCMark 10 Score | 6290 poäng | |
Hjälp | ||
| DPC Latencies / LatencyMon - interrupt to process latency (max), Web, Youtube, Prime95 | |
| Asus TUF A17 FA706IU-AS76 | |
| MSI GF75 Thin 10SCXR | |
| Asus Zephyrus G14 GA401IV | |
| Razer Blade Pro 17 RTX 2070 Max-Q 300 Hz | |
* ... mindre är bättre
| Razer Blade Pro 17 RTX 2070 Max-Q 300 Hz Lite-On CA5-8D512 | MSI GS75 Stealth 9SG 2x Samsung SSD PM981 MZVLB1T0HALR (RAID 0) | Alienware m17 R2 P41E 2x SK Hynix PC601 NVMe 512 GB (RAID 0) | Aorus 17G XB Samsung SSD PM981a MZVLB512HBJQ | Razer Blade Pro 17 4K UHD 120 Hz Samsung SSD PM981 MZVLB1T0HALR | |
|---|---|---|---|---|---|
| AS SSD | 41% | 26% | 68% | 54% | |
| Seq Read (MB/s) | 2019 | 2855 41% | 1938 -4% | 1791 -11% | 1881 -7% |
| Seq Write (MB/s) | 1314 | 2687 104% | 2094 59% | 2193 67% | 2354 79% |
| 4K Read (MB/s) | 46.61 | 30.31 -35% | 25.88 -44% | 50.7 9% | 43.42 -7% |
| 4K Write (MB/s) | 90.2 | 96.3 7% | 100.8 12% | 116.8 29% | 104.1 15% |
| 4K-64 Read (MB/s) | 665 | 1460 120% | 1217 83% | 1525 129% | 1805 171% |
| 4K-64 Write (MB/s) | 813 | 1224 51% | 1137 40% | 1958 141% | 1775 118% |
| Access Time Read * (ms) | 0.058 | 0.054 7% | 0.051 12% | 0.07 -21% | 0.049 16% |
| Access Time Write * (ms) | 0.167 | 0.038 77% | 0.107 36% | 0.032 81% | 0.106 37% |
| Score Read (Points) | 913 | 1776 95% | 1437 57% | 1755 92% | 2037 123% |
| Score Write (Points) | 1034 | 1589 54% | 1447 40% | 2294 122% | 2115 105% |
| Score Total (Points) | 2392 | 4259 78% | 3624 52% | 4972 108% | 5215 118% |
| Copy ISO MB/s (MB/s) | 1715 | 2226 30% | 1926 12% | 1877 9% | |
| Copy Program MB/s (MB/s) | 622 | 426.4 -31% | 626 1% | 539 -13% | |
| Copy Game MB/s (MB/s) | 1506 | 1152 -24% | 1533 2% | 1368 -9% | |
| CrystalDiskMark 5.2 / 6 | 4% | -3% | 5% | -10% | |
| Write 4K (MB/s) | 119 | 95.5 -20% | 110.6 -7% | 123.4 4% | 121.7 2% |
| Read 4K (MB/s) | 51.9 | 42.59 -18% | 41.46 -20% | 45.02 -13% | 43.81 -16% |
| Write Seq (MB/s) | 2258 | 2851 26% | 2378 5% | 2526 12% | 1276 -43% |
| Read Seq (MB/s) | 2283 | 2696 18% | 2114 -7% | 2062 -10% | 1183 -48% |
| Write 4K Q32T1 (MB/s) | 491 | 402.6 -18% | 445.4 -9% | 497.9 1% | 527 7% |
| Read 4K Q32T1 (MB/s) | 540 | 443.9 -18% | 509 -6% | 579 7% | 592 10% |
| Write Seq Q32T1 (MB/s) | 2253 | 3420 52% | 2735 21% | 2982 32% | 2379 6% |
| Read Seq Q32T1 (MB/s) | 3172 | 3514 11% | 3206 1% | 3440 8% | 3213 1% |
| Totalt genomsnitt (program/inställningar) | 23% /
28% | 12% /
15% | 37% /
41% | 22% /
31% |
* ... mindre är bättre

Diskstrypning: DiskSpd Read Loop, Queue Depth 8
| 3DMark 11 Performance | 23306 poäng | |
| 3DMark Cloud Gate Standard Score | 48701 poäng | |
| 3DMark Fire Strike Score | 18543 poäng | |
| 3DMark Time Spy Score | 8236 poäng | |
Hjälp | ||
| låg | med. | hög | ultra | |
|---|---|---|---|---|
| The Witcher 3 (2015) | 355.6 | 254.3 | 151.4 | 80.9 |
| Dota 2 Reborn (2015) | 143 | 138 | 135 | 126 |
| X-Plane 11.11 (2018) | 112 | 101 | 85.3 |
| Razer Blade Pro 17 RTX 2070 Max-Q 300 Hz GeForce RTX 2070 Max-Q, i7-10875H, Lite-On CA5-8D512 | Asus ROG Zephyrus S GX701GXR GeForce RTX 2080 Max-Q, i7-9750H, Samsung SSD PM981 MZVLB1T0HALR | MSI GS75 Stealth 9SG GeForce RTX 2080 Max-Q, i7-9750H, 2x Samsung SSD PM981 MZVLB1T0HALR (RAID 0) | Alienware m17 R2 P41E GeForce RTX 2080 Max-Q, i9-9980HK, 2x SK Hynix PC601 NVMe 512 GB (RAID 0) | Aorus 17G XB GeForce RTX 2070 Super Max-Q, i7-10875H, Samsung SSD PM981a MZVLB512HBJQ | Razer Blade Pro 17 RTX 2080 Max-Q GeForce RTX 2080 Max-Q, i7-9750H, Samsung SSD PM981 MZVLB512HAJQ | |
|---|---|---|---|---|---|---|
| Noise | -3% | -6% | -3% | -12% | 1% | |
| av / miljö * (dB) | 28.2 | 30 -6% | 30 -6% | 29.1 -3% | 30 -6% | 28.2 -0% |
| Idle Minimum * (dB) | 28.2 | 32 -13% | 31 -10% | 29.4 -4% | 35 -24% | 28.2 -0% |
| Idle Average * (dB) | 28.2 | 33 -17% | 32 -13% | 29.4 -4% | 36 -28% | 28.2 -0% |
| Idle Maximum * (dB) | 30.5 | 34 -11% | 38 -25% | 31.5 -3% | 41 -34% | 30.8 -1% |
| Load Average * (dB) | 42.2 | 40 5% | 47 -11% | 49.7 -18% | 47 -11% | 42 -0% |
| Witcher 3 ultra * (dB) | 53 | 49 8% | 48 9% | 49.5 7% | 48 9% | 51 4% |
| Load Maximum * (dB) | 55.5 | 50 10% | 49 12% | 53.3 4% | 49 12% | 53 5% |
* ... mindre är bättre
Ljudnivå
| Låg belastning |
| 28.2 / 28.2 / 30.5 dB(A) |
| Hög belastning |
| 42.2 / 55.5 dB(A) |
 | ||
30 dB tyst 40 dB(A) hörbar 50 dB(A) högt ljud |
||
min: | ||
(±) Den maximala temperaturen på ovansidan är 40.8 °C / 105 F, jämfört med genomsnittet av 40.4 °C / 105 F , allt från 21.2 till 68.8 °C för klassen Gaming.
(-) Botten värms upp till maximalt 48.4 °C / 119 F, jämfört med genomsnittet av 43.2 °C / 110 F
(±) Vid tomgångsbruk är medeltemperaturen för ovansidan 33.3 °C / 92 F, jämfört med enhetsgenomsnittet på 33.9 °C / ### class_avg_f### F.
(±) När du spelar The Witcher 3 är medeltemperaturen för ovansidan 35.4 °C / 96 F, jämfört med enhetsgenomsnittet på 33.9 °C / ## #class_avg_f### F.
(+) Handledsstöden och pekplattan når maximal hudtemperatur (33.2 °C / 91.8 F) och är därför inte varma.
(-) Medeltemperaturen för handledsstödsområdet på liknande enheter var 28.8 °C / 83.8 F (-4.4 °C / -8 F).
| Av/Standby | |
| Låg belastning | |
| Hög belastning |
|
Förklaring:
min: | |
| Razer Blade Pro 17 RTX 2070 Max-Q 300 Hz i7-10875H, GeForce RTX 2070 Max-Q, Lite-On CA5-8D512, IPS, 1920x1080, 17.3" | Asus ROG Zephyrus S GX701GXR i7-9750H, GeForce RTX 2080 Max-Q, Samsung SSD PM981 MZVLB1T0HALR, IPS, 1920x1080, 17.3" | MSI GS75 Stealth 9SG i7-9750H, GeForce RTX 2080 Max-Q, 2x Samsung SSD PM981 MZVLB1T0HALR (RAID 0), IPS, 1920x1080, 17.3" | Alienware m17 R2 P41E i9-9980HK, GeForce RTX 2080 Max-Q, 2x SK Hynix PC601 NVMe 512 GB (RAID 0), IPS, 1920x1080, 17.3" | Aorus 17G XB i7-10875H, GeForce RTX 2070 Super Max-Q, Samsung SSD PM981a MZVLB512HBJQ, IPS, 1920x1080, 17.3" | Razer Blade Pro 17 4K UHD 120 Hz i7-9750H, GeForce RTX 2080 Max-Q, Samsung SSD PM981 MZVLB1T0HALR, IPS, 3840x2160, 17.3" | |
|---|---|---|---|---|---|---|
| Power Consumption | -14% | 16% | -39% | -3% | -32% | |
| Idle Minimum * (Watt) | 19.6 | 32 -63% | 13 34% | 24.7 -26% | 20 -2% | 34.2 -74% |
| Idle Average * (Watt) | 21.7 | 34 -57% | 17 22% | 35.9 -65% | 23 -6% | 37.2 -71% |
| Idle Maximum * (Watt) | 36.1 | 36 -0% | 25 31% | 69.6 -93% | 38 -5% | 50 -39% |
| Load Average * (Watt) | 115.6 | 95 18% | 96 17% | 141.8 -23% | 105 9% | 106.1 8% |
| Witcher 3 ultra * (Watt) | 157 | 155 1% | 156 1% | 185.8 -18% | 158 -1% | 178.7 -14% |
| Load Maximum * (Watt) | 219.9 | 187 15% | 239 -9% | 235.4 -7% | 243 -11% | 223.6 -2% |
* ... mindre är bättre
| Razer Blade Pro 17 RTX 2070 Max-Q 300 Hz i7-10875H, GeForce RTX 2070 Max-Q, 70 Wh | Asus ROG Zephyrus S GX701GXR i7-9750H, GeForce RTX 2080 Max-Q, 76 Wh | MSI GS75 Stealth 9SG i7-9750H, GeForce RTX 2080 Max-Q, 80.25 Wh | Alienware m17 R2 P41E i9-9980HK, GeForce RTX 2080 Max-Q, 76 Wh | Aorus 17G XB i7-10875H, GeForce RTX 2070 Super Max-Q, 94 Wh | Razer Blade Pro 17 4K UHD 120 Hz i7-9750H, GeForce RTX 2080 Max-Q, 70 Wh | |
|---|---|---|---|---|---|---|
| Batteridrifttid | -39% | 22% | -2% | 53% | -24% | |
| WiFi v1.3 (h) | 4.9 | 3 -39% | 6 22% | 4.8 -2% | 7.5 53% | 3.7 -24% |
| Reader / Idle (h) | 4.1 | 7.7 | 7.1 | 10 | ||
| Load (h) | 1.2 | 1.2 | 0.5 | 2.2 |
För
Emot
Läs den fullständiga versionen av den här recensionen på engelska här.
I likehet med hur Blade 15 2020 är en mindre uppdatering till Blade 15 2019 är Blade Pro 17 2020 en mindre uppdatering av Blade Pro 17 2019. En ny åttakärnig CPU, Super Max-Q grafikkort och en 300 Hz-skärm är huvudanledningarna att skaffa 2020 års modell framför den från 2019, som istället har en sexkärnig CPU, Max-Q grafikkort och en 240 Hz-skärm. Uppdateringarna på insidan förbättrar bara spelprestandan en aning och man missar inte mycket om man istället väljer förra årets modell. Kom ihåg att du inte behöver nå 300 FPS när du spelar för att dra nytta av en 300 Hz-skärm.
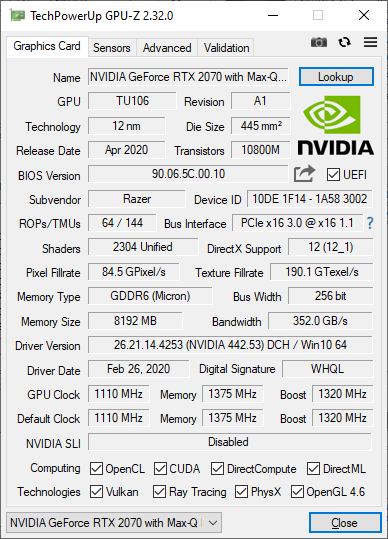
En mer förvånande aspekt av Blade Pro 17 är inte den 10:e generationens Core CPU eller 300 Hz-skärmen utan hur snabbt systemet kan köra sin GeForce RTX 2070 Max-Q GPU. 3DMark-resultaten är runt 20 procent snabbare än genomsnittet i vår databas för GeForce RTX 2070 Max-Q. Därmed ger RTX 2070 Max-Q i Blade Pro 17 högre grafikprestanda än en del andra modellers nyare RTX 2070 Super Max-Q eller RTX 2080 Super Max-Q. Om du väljer den modellen av Blade Pro 17 2020 kan du vara säker på att du har ett av de snabbaste alternativen som finns med en GeForce RTX 2070 Max-Q GPU.
300 Hz bilduppdatering är en lyx som bara de allra mest dedikerade spelarna kommer vilja ha. För alla andra räcker 240 Hz gott och väl. Av den anledningen tilltalar 2019 års Blade Pro-serie en bredare publik eftersom den dyrare versionen från 2020 inte erbjuder särskilt mycket bättre prestanda än förra årets modell.
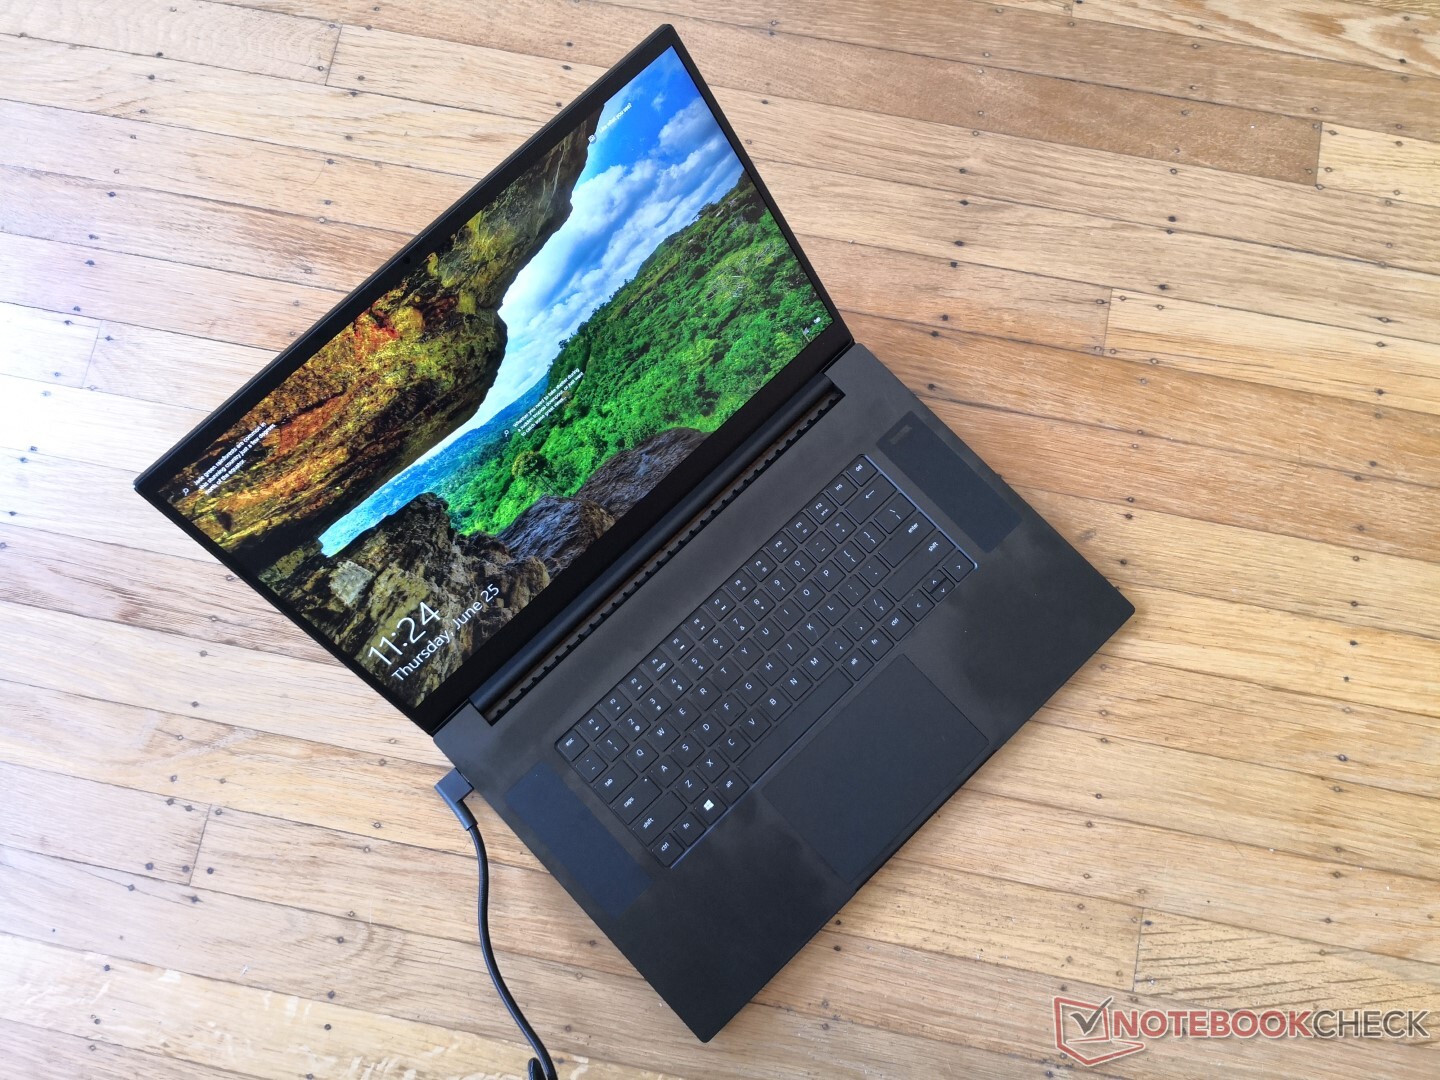
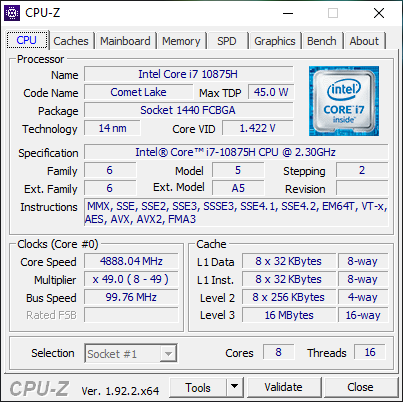
Razer Blade Pro 17 RTX 2070 Max-Q 300 Hz
- 06/27/2020 v7 (old)
Allen Ngo
Price comparison
