Test: Gigabyte Aero 17 HDR XB - Super Max-Q redan från start (Sammanfattning)
Gradering | Datum | Modell | Vikt | Höjd | Storlek | Upplösning | Pris |
|---|---|---|---|---|---|---|---|
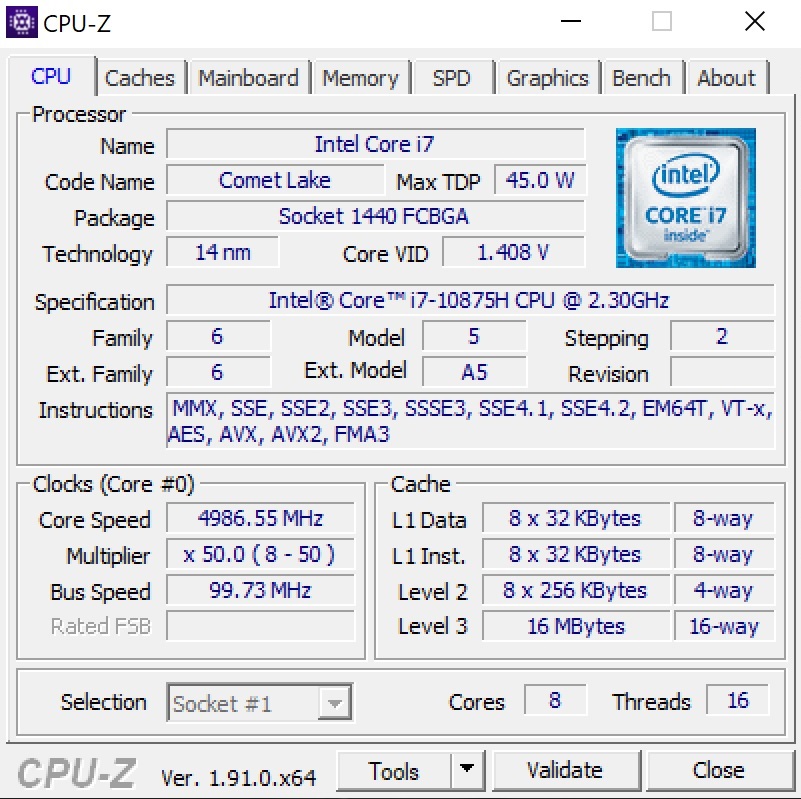
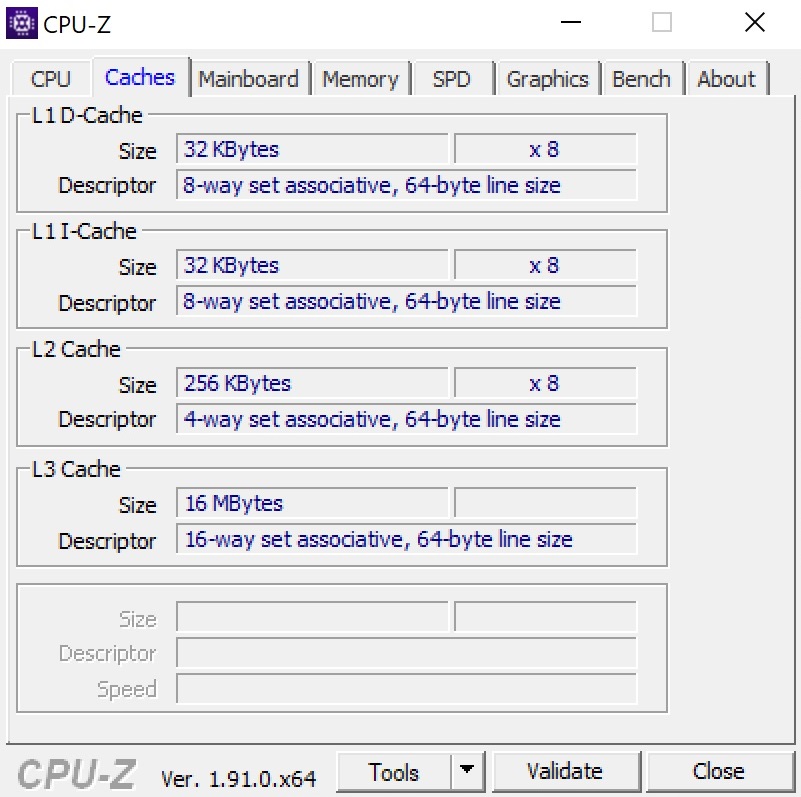
| 87 % v7 (old) | 04/2020 | Gigabyte Aero 17 HDR XB i7-10875H, GeForce RTX 2070 Super Max-Q | 2.7 kg | 21 mm | 17.30" | 3840x2160 | |
| 86.1 % v7 (old) | 09/2019 | Gigabyte Aero 17 XA RP77 i9-9980HK, GeForce RTX 2070 Max-Q | 2.5 kg | 21.4 mm | 17.30" | 3840x2160 | |
| 84.2 % v7 (old) | 03/2020 | Alienware m17 R2 P41E i9-9980HK, GeForce RTX 2080 Max-Q | 2.6 kg | 20.5 mm | 17.30" | 1920x1080 | |
| 82.9 % v7 (old) | 07/2019 | MSI GS75 Stealth 9SG i7-9750H, GeForce RTX 2080 Max-Q | 2.3 kg | 18.9 mm | 17.30" | 1920x1080 | |
| 81.2 % v7 (old) | 12/2019 | Asus ROG Zephyrus S GX701GXR i7-9750H, GeForce RTX 2080 Max-Q | 2.7 kg | 18.7 mm | 17.30" | 1920x1080 | |
| 87.7 % v7 (old) | 06/2019 | Razer Blade Pro 17 RTX 2080 Max-Q i7-9750H, GeForce RTX 2080 Max-Q | 2.8 kg | 19.9 mm | 17.30" | 1920x1080 |
| SD Card Reader | |
| average JPG Copy Test (av. of 3 runs) | |
| Gigabyte Aero 17 HDR XB (Toshiba Exceria Pro SDXC 64 GB UHS-II) | |
| Gigabyte Aero 17 XA RP77 (Toshiba Exceria Pro SDXC 64 GB UHS-II) | |
| Razer Blade Pro 17 RTX 2080 Max-Q (Toshiba Exceria Pro SDXC 64 GB UHS-II) | |
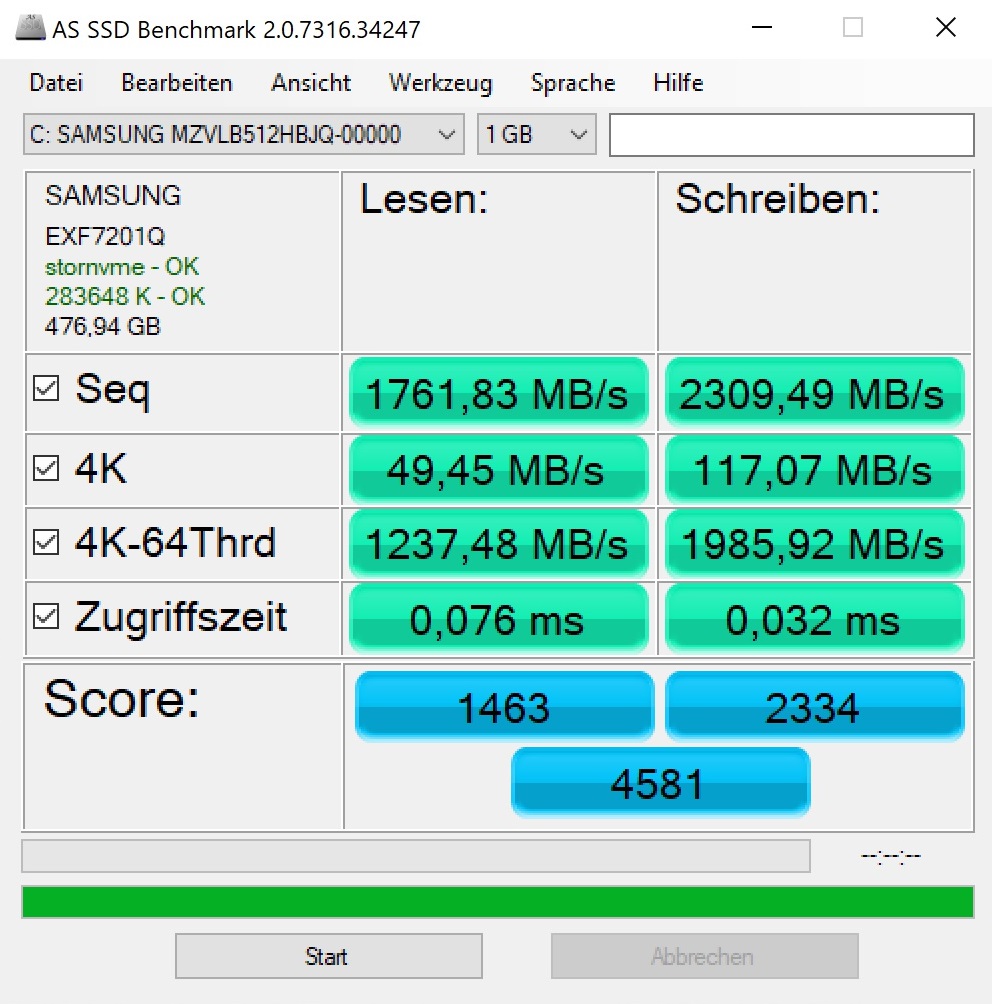
| maximum AS SSD Seq Read Test (1GB) | |
| Gigabyte Aero 17 HDR XB (Toshiba Exceria Pro SDXC 64 GB UHS-II) | |
| Gigabyte Aero 17 XA RP77 (Toshiba Exceria Pro SDXC 64 GB UHS-II) | |
| Razer Blade Pro 17 RTX 2080 Max-Q (Toshiba Exceria Pro SDXC 64 GB UHS-II) | |
| Networking | |
| iperf3 transmit AX12 | |
| Gigabyte Aero 17 HDR XB | |
| Asus ROG Zephyrus S GX701GXR | |
| iperf3 receive AX12 | |
| Gigabyte Aero 17 HDR XB | |
| Asus ROG Zephyrus S GX701GXR | |


| |||||||||||||||||||||||||
Distribution av ljusstyrkan: 95 %
Mitt på batteriet: 487 cd/m²
Kontrast: 1282:1 (Svärta: 0.38 cd/m²)
ΔE ColorChecker Calman: 1.19 | ∀{0.5-29.43 Ø4.73}
calibrated: 0.5
ΔE Greyscale Calman: 1.45 | ∀{0.09-98 Ø4.97}
100% sRGB (Argyll 1.6.3 3D)
88% AdobeRGB 1998 (Argyll 1.6.3 3D)
100% AdobeRGB 1998 (Argyll 3D)
100% sRGB (Argyll 3D)
86.5% Display P3 (Argyll 3D)
Gamma: 2.21
CCT: 6557 K
| Gigabyte Aero 17 HDR XB AUO B173ZAN03.2 (AUO329B), IPS, 3840x2160 | Gigabyte Aero 17 XA RP77 AU Optronics B173ZAN03.2, IPS, 3840x2160 | Alienware m17 R2 P41E Chi Mei 173HCE, CMN175F, IPS, 1920x1080 | MSI GS75 Stealth 9SG Chi Mei N173HCE-G33 (CMN175C), IPS, 1920x1080 | Asus ROG Zephyrus S GX701GXR AU Optronics B173HAN05.1, IPS, 1920x1080 | Razer Blade Pro 17 RTX 2080 Max-Q AU Optronics B173HAN04.0, IPS, 1920x1080 | |
|---|---|---|---|---|---|---|
| Display | 0% | -16% | -23% | -17% | -26% | |
| Display P3 Coverage (%) | 86.5 | 86.8 0% | 70.8 -18% | 62.6 -28% | 70 -19% | 60.6 -30% |
| sRGB Coverage (%) | 100 | 100 0% | 98.5 -1% | 93.5 -6% | 96.6 -3% | 89 -11% |
| AdobeRGB 1998 Coverage (%) | 100 | 99.5 0% | 72.2 -28% | 64.7 -35% | 72.3 -28% | 62.1 -38% |
| Response Times | 0% | 64% | 75% | 81% | 76% | |
| Response Time Grey 50% / Grey 80% * (ms) | 55.2 ? | 45.6 ? 17% | 17.2 ? 69% | 7.2 ? 87% | 5.6 ? 90% | 6.8 ? 88% |
| Response Time Black / White * (ms) | 26 ? | 30.4 ? -17% | 10.8 ? 58% | 10 ? 62% | 7.6 ? 71% | 9.6 ? 63% |
| PWM Frequency (Hz) | 26320 ? | 25510 ? | ||||
| Screen | -86% | -25% | -19% | -43% | -86% | |
| Brightness middle (cd/m²) | 487 | 667.3 37% | 384.2 -21% | 366 -25% | 288 -41% | 299.3 -39% |
| Brightness (cd/m²) | 475 | 633 33% | 357 -25% | 343 -28% | 276 -42% | 294 -38% |
| Brightness Distribution (%) | 95 | 90 -5% | 90 -5% | 91 -4% | 93 -2% | 94 -1% |
| Black Level * (cd/m²) | 0.38 | 0.46 -21% | 0.29 24% | 0.29 24% | 0.24 37% | 0.29 24% |
| Contrast (:1) | 1282 | 1451 13% | 1325 3% | 1262 -2% | 1200 -6% | 1032 -20% |
| Colorchecker dE 2000 * | 1.19 | 3.53 -197% | 1.35 -13% | 1.51 -27% | 1.92 -61% | 2.55 -114% |
| Colorchecker dE 2000 max. * | 2.43 | 6.88 -183% | 3.45 -42% | 3.22 -33% | 4.57 -88% | 4.73 -95% |
| Colorchecker dE 2000 calibrated * | 0.5 | 3.79 -658% | 1.42 -184% | 0.71 -42% | 1.14 -128% | 2.9 -480% |
| Greyscale dE 2000 * | 1.45 | 0.9 38% | 1.2 17% | 1.93 -33% | 3.08 -112% | 3.5 -141% |
| Gamma | 2.21 100% | 2.17 101% | 2.23 99% | 2.38 92% | 2.42 91% | 2.28 96% |
| CCT | 6557 99% | 6533 99% | 6580 99% | 6881 94% | 7055 92% | 7101 92% |
| Color Space (Percent of AdobeRGB 1998) (%) | 88 | 87.1 -1% | 65.5 -26% | 60 -32% | 65 -26% | 57 -35% |
| Color Space (Percent of sRGB) (%) | 100 | 100 0% | 98.5 -1% | 94 -6% | 96 -4% | 88.7 -11% |
| Totalt genomsnitt (program/inställningar) | -29% /
-59% | 8% /
-12% | 11% /
-8% | 7% /
-23% | -12% /
-55% |
* ... mindre är bättre
Visa svarstider
| ↔ Svarstid svart till vitt | ||
|---|---|---|
| 26 ms ... stiga ↗ och falla ↘ kombinerat | ↗ 9.2 ms stiga | 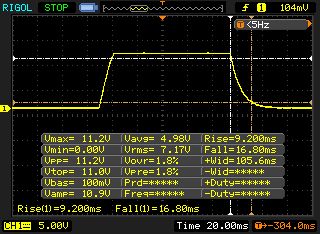 |
| ↘ 16.8 ms hösten | ||
| Skärmen visar relativt långsamma svarsfrekvenser i våra tester och kan vara för långsam för spelare. I jämförelse sträcker sig alla testade enheter från 0.1 (minst) till 240 (maximalt) ms. » 62 % av alla enheter är bättre. Detta innebär att den uppmätta svarstiden är sämre än genomsnittet av alla testade enheter (19.9 ms). | ||
| ↔ Svarstid 50 % grått till 80 % grått | ||
| 55.2 ms ... stiga ↗ och falla ↘ kombinerat | ↗ 26.8 ms stiga | 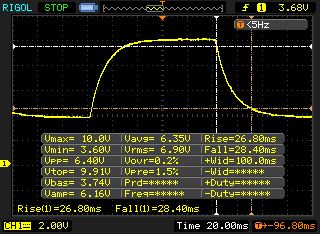 |
| ↘ 28.4 ms hösten | ||
| Skärmen visar långsamma svarsfrekvenser i våra tester och kommer att vara otillfredsställande för spelare. I jämförelse sträcker sig alla testade enheter från 0.165 (minst) till 636 (maximalt) ms. » 92 % av alla enheter är bättre. Detta innebär att den uppmätta svarstiden är sämre än genomsnittet av alla testade enheter (31.1 ms). | ||
Skärmflimmer / PWM (Puls-Width Modulation)
| Skärmflimmer / PWM upptäcktes inte | 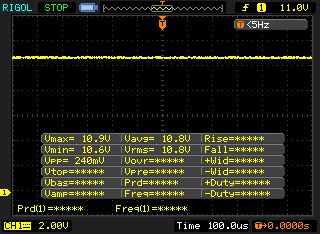 | ||
Som jämförelse: 52 % av alla testade enheter använder inte PWM för att dämpa skärmen. Om PWM upptäcktes mättes ett medelvärde av 7801 (minst: 5 - maximum: 343500) Hz. | |||
| DPC Latencies / LatencyMon - interrupt to process latency (max), Web, Youtube, Prime95 | |
| Gigabyte Aero 17 HDR XB | |
* ... mindre är bättre
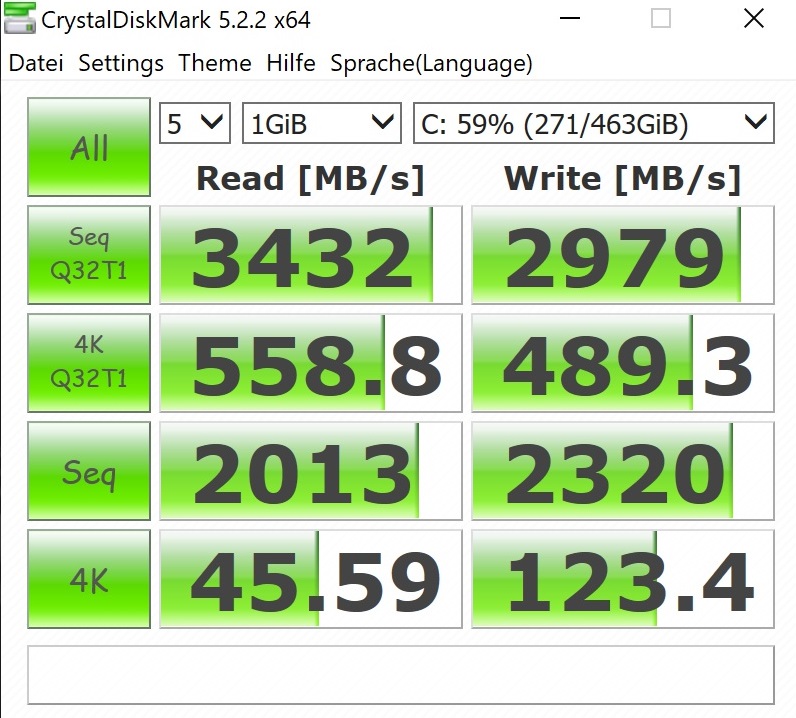
| Gigabyte Aero 17 HDR XB Samsung SSD PM981a MZVLB512HBJQ | Gigabyte Aero 17 XA RP77 Intel SSD 760p SSDPEKKW512G8 | Alienware m17 R2 P41E 2x SK Hynix PC601 NVMe 512 GB (RAID 0) | MSI GS75 Stealth 9SG 2x Samsung SSD PM981 MZVLB1T0HALR (RAID 0) | Asus ROG Zephyrus S GX701GXR Samsung SSD PM981 MZVLB1T0HALR | Razer Blade Pro 17 RTX 2080 Max-Q Samsung SSD PM981 MZVLB512HAJQ | |
|---|---|---|---|---|---|---|
| CrystalDiskMark 5.2 / 6 | -5% | -6% | 1% | -26% | -27% | |
| Write 4K (MB/s) | 123.4 | 169.6 37% | 110.6 -10% | 95.5 -23% | 96.1 -22% | 100.7 -18% |
| Read 4K (MB/s) | 45.59 | 58 27% | 41.46 -9% | 42.59 -7% | 40.86 -10% | 41.03 -10% |
| Write Seq (MB/s) | 2320 | 1516 -35% | 2378 2% | 2851 23% | 1317 -43% | 1146 -51% |
| Read Seq (MB/s) | 2013 | 2362 17% | 2114 5% | 2696 34% | 1030 -49% | 1115 -45% |
| Write 4K Q32T1 (MB/s) | 489.3 | 481.8 -2% | 445.4 -9% | 402.6 -18% | 350.4 -28% | 384.6 -21% |
| Read 4K Q32T1 (MB/s) | 559 | 506 -9% | 509 -9% | 443.9 -21% | 404.1 -28% | 429.5 -23% |
| Write Seq Q32T1 (MB/s) | 2979 | 1530 -49% | 2735 -8% | 3420 15% | 2396 -20% | 1859 -38% |
| Read Seq Q32T1 (MB/s) | 3432 | 2645 -23% | 3206 -7% | 3514 2% | 3194 -7% | 3179 -7% |

| 3DMark 06 Standard Score | 43406 poäng | |
| 3DMark Vantage P Result | 65101 poäng | |
| 3DMark 11 Performance | 24130 poäng | |
| 3DMark Cloud Gate Standard Score | 38593 poäng | |
| 3DMark Fire Strike Score | 18582 poäng | |
| 3DMark Time Spy Score | 7650 poäng | |
Hjälp | ||
| 3DMark 11 - 1280x720 Performance GPU | |
| Razer Blade Pro 17 RTX 2080 Max-Q | |
| Alienware m17 R2 P41E | |
| Asus ROG Zephyrus S GX701GXR | |
| Gigabyte Aero 17 HDR XB | |
| MSI GS75 Stealth 9SG | |
| Gigabyte Aero 17 XA RP77 | |
| SPECviewperf 13 | |
| 3ds Max (3dsmax-06) | |
| Gigabyte Aero 17 HDR XB | |
| Catia (catia-05) | |
| Gigabyte Aero 17 HDR XB | |
| Creo (creo-02) | |
| Gigabyte Aero 17 HDR XB | |
| Energy (energy-02) | |
| Gigabyte Aero 17 HDR XB | |
| Maya (maya-05) | |
| Gigabyte Aero 17 HDR XB | |
| Medical (medical-02) | |
| Gigabyte Aero 17 HDR XB | |
| Showcase (showcase-02) | |
| Gigabyte Aero 17 HDR XB | |
| Siemens NX (snx-03) | |
| Gigabyte Aero 17 HDR XB | |
| Solidworks (sw-04) | |
| Gigabyte Aero 17 HDR XB | |
| The Witcher 3 | |
| 1920x1080 Ultra Graphics & Postprocessing (HBAO+) | |
| Razer Blade Pro 17 RTX 2080 Max-Q | |
| Asus ROG Zephyrus S GX701GXR | |
| Alienware m17 R2 P41E | |
| MSI GS75 Stealth 9SG | |
| Gigabyte Aero 17 HDR XB | |
| Gigabyte Aero 17 XA RP77 | |
| 3840x2160 High Graphics & Postprocessing (Nvidia HairWorks Off) | |
| Gigabyte Aero 17 HDR XB | |
| Gigabyte Aero 17 XA RP77 | |
| låg | med. | hög | ultra | QHD | 4K | |
|---|---|---|---|---|---|---|
| GTA V (2015) | 182 | 175 | 160 | 89.9 | ||
| The Witcher 3 (2015) | 240 | 142 | 75.3 | 49.7 | ||
| Dota 2 Reborn (2015) | 163.9 | 146.6 | 139.5 | 131.4 | ||
| Fortnite (2018) | 133 | 132 | 108 | 86.2 | 43 | |
| Final Fantasy XV Benchmark (2018) | 104 | 80 | 33 | |||
| Kingdom Come: Deliverance (2018) | 127 | 108 | 75.9 | 54.4 | 27.9 | |
| X-Plane 11.11 (2018) | 119 | 104 | 87.6 | |||
| Monster Hunter World (2018) | 113 | 102 | 84.2 | 55.7 | 27.5 | |
| Shadow of the Tomb Raider (2018) | 118 | 110 | 99 | 68 | 36 | |
| Assassin´s Creed Odyssey (2018) | 99 | 81 | 62 | 47 | 32 | |
| Hitman 2 (2018) | 89.2 | 83.2 | 79.7 | 76.1 | 41.5 | |
| Battlefield V (2018) | 144 | 135 | 125 | 99.4 | 56.8 | |
| Darksiders III (2018) | 135 | 118 | 107 | 71.6 | 36.4 | |
| Just Cause 4 (2018) | 137 | 101 | 93.4 | 63.6 | 34.5 | |
| Apex Legends (2019) | 144 | 144 | 143 | 109 | 61.1 | |
| Far Cry New Dawn (2019) | 98 | 92 | 83 | 70 | 43 | |
| Metro Exodus (2019) | 92 | 72 | 57.7 | 49.1 | 26.5 | |
| Dirt Rally 2.0 (2019) | 183 | 155 | 85.8 | 66 | ||
| The Division 2 (2019) | 123 | 113 | 81 | 60 | 29 | |
| Anno 1800 (2019) | 112 | 85.5 | 47.4 | 36.6 | 21.1 | |
| Rage 2 (2019) | 119 | 99.5 | 97.1 | 62.8 | 30.1 | |
| F1 2019 (2019) | 191 | 159 | 143 | 107 | 61 | |
| Control (2019) | 92.6 | 68.4 | 43.9 | 21.1 | ||
| Borderlands 3 (2019) | 112 | 78 | 59.6 | 41.7 | 22.2 | |
| FIFA 20 (2019) | 271 | 259 | 257 | 253 | 186 | |
| Ghost Recon Breakpoint (2019) | 101 | 89 | 66 | 49 | 28 | |
| GRID 2019 (2019) | 131 | 104 | 71.1 | 60.6 | 39.7 | |
| Call of Duty Modern Warfare 2019 (2019) | 134 | 126 | 104 | 72.3 | 41 | |
| Need for Speed Heat (2019) | 103 | 94 | 82.6 | 60.5 | 33.4 | |
| Star Wars Jedi Fallen Order (2019) | 109 | 104 | 94.1 | 71.3 | 35.9 | |
| Red Dead Redemption 2 (2019) | 91.3 | 61.8 | 40.2 | 32 | 20.5 | |
| Escape from Tarkov (2020) | 121 | 116 | 107 | 79.8 | 36.8 | |
| Hunt Showdown (2020) | 109 | 96.8 | 56.8 | 27.4 | ||
| Doom Eternal (2020) | 157 | 139 | 135 | 99.6 | 51.2 |
Ljudnivå
| Låg belastning |
| 35 / 36 / 38 dB(A) |
| Hög belastning |
| 47 / 54 dB(A) |
 | ||
30 dB tyst 40 dB(A) hörbar 50 dB(A) högt ljud |
||
min: | ||
| Gigabyte Aero 17 HDR XB i7-10875H, GeForce RTX 2070 Super Max-Q | Gigabyte Aero 17 XA RP77 i9-9980HK, GeForce RTX 2070 Max-Q | Alienware m17 R2 P41E i9-9980HK, GeForce RTX 2080 Max-Q | MSI GS75 Stealth 9SG i7-9750H, GeForce RTX 2080 Max-Q | Asus ROG Zephyrus S GX701GXR i7-9750H, GeForce RTX 2080 Max-Q | Razer Blade Pro 17 RTX 2080 Max-Q i7-9750H, GeForce RTX 2080 Max-Q | |
|---|---|---|---|---|---|---|
| Noise | 6% | 7% | 5% | 7% | 11% | |
| av / miljö * (dB) | 30 | 29.3 2% | 29.1 3% | 30 -0% | 30 -0% | 28.2 6% |
| Idle Minimum * (dB) | 35 | 33 6% | 29.4 16% | 31 11% | 32 9% | 28.2 19% |
| Idle Average * (dB) | 36 | 33 8% | 29.4 18% | 32 11% | 33 8% | 28.2 22% |
| Idle Maximum * (dB) | 38 | 33 13% | 31.5 17% | 38 -0% | 34 11% | 30.8 19% |
| Load Average * (dB) | 47 | 42.5 10% | 49.7 -6% | 47 -0% | 40 15% | 42 11% |
| Witcher 3 ultra * (dB) | 49 | 42 14% | 49.5 -1% | 48 2% | 49 -0% | 51 -4% |
| Load Maximum * (dB) | 54 | 59.6 -10% | 53.3 1% | 49 9% | 50 7% | 53 2% |
* ... mindre är bättre
(-) Den maximala temperaturen på ovansidan är 53 °C / 127 F, jämfört med genomsnittet av 40.4 °C / 105 F , allt från 21.2 till 68.8 °C för klassen Gaming.
(-) Botten värms upp till maximalt 59 °C / 138 F, jämfört med genomsnittet av 43.2 °C / 110 F
(+) Vid tomgångsbruk är medeltemperaturen för ovansidan 25.9 °C / 79 F, jämfört med enhetsgenomsnittet på 33.9 °C / ### class_avg_f### F.
(-) När du spelar The Witcher 3 är medeltemperaturen för ovansidan 40 °C / 104 F, jämfört med enhetsgenomsnittet på 33.9 °C / ## #class_avg_f### F.
(±) Handledsstöden och pekplattan kan bli väldigt varma vid beröring med maximalt 38 °C / 100.4 F.
(-) Medeltemperaturen för handledsstödsområdet på liknande enheter var 28.8 °C / 83.8 F (-9.2 °C / -16.6 F).
| Gigabyte Aero 17 HDR XB i7-10875H, GeForce RTX 2070 Super Max-Q | Gigabyte Aero 17 XA RP77 i9-9980HK, GeForce RTX 2070 Max-Q | Alienware m17 R2 P41E i9-9980HK, GeForce RTX 2080 Max-Q | MSI GS75 Stealth 9SG i7-9750H, GeForce RTX 2080 Max-Q | Asus ROG Zephyrus S GX701GXR i7-9750H, GeForce RTX 2080 Max-Q | Razer Blade Pro 17 RTX 2080 Max-Q i7-9750H, GeForce RTX 2080 Max-Q | |
|---|---|---|---|---|---|---|
| Heat | -4% | -20% | -9% | -3% | 9% | |
| Maximum Upper Side * (°C) | 53 | 46.8 12% | 54.2 -2% | 55 -4% | 50 6% | 43 19% |
| Maximum Bottom * (°C) | 59 | 62.2 -5% | 61.4 -4% | 65 -10% | 47 20% | 47.2 20% |
| Idle Upper Side * (°C) | 27 | 29 -7% | 37.8 -40% | 30 -11% | 33 -22% | 27.2 -1% |
| Idle Bottom * (°C) | 29 | 34 -17% | 38.6 -33% | 32 -10% | 34 -17% | 30 -3% |
* ... mindre är bättre
Gigabyte Aero 17 HDR XB ljudanalys
(+) | högtalare kan spela relativt högt (86 dB)
Bas 100 - 315 Hz
(-) | nästan ingen bas - i genomsnitt 18.7% lägre än medianen
(±) | linjäriteten för basen är genomsnittlig (9.5% delta till föregående frekvens)
Mellan 400 - 2000 Hz
(+) | balanserad mellan - endast 4.6% från medianen
(+) | mids är linjära (6.4% delta till föregående frekvens)
Högsta 2 - 16 kHz
(+) | balanserade toppar - endast 4% från medianen
(+) | toppar är linjära (6.1% delta till föregående frekvens)
Totalt 100 - 16 000 Hz
(±) | linjäriteten för det totala ljudet är genomsnittlig (15.5% skillnad mot median)
Jämfört med samma klass
» 35% av alla testade enheter i den här klassen var bättre, 7% liknande, 58% sämre
» Den bästa hade ett delta på 6%, genomsnittet var 18%, sämst var 132%
Jämfört med alla testade enheter
» 23% av alla testade enheter var bättre, 4% liknande, 73% sämre
» Den bästa hade ett delta på 4%, genomsnittet var 24%, sämst var 134%
Alienware m17 R2 P41E ljudanalys
(+) | högtalare kan spela relativt högt (85.8 dB)
Bas 100 - 315 Hz
(-) | nästan ingen bas - i genomsnitt 17.1% lägre än medianen
(±) | linjäriteten för basen är genomsnittlig (12.3% delta till föregående frekvens)
Mellan 400 - 2000 Hz
(+) | balanserad mellan - endast 3.9% från medianen
(±) | linjäriteten för mids är genomsnittlig (8.2% delta till föregående frekvens)
Högsta 2 - 16 kHz
(+) | balanserade toppar - endast 3.1% från medianen
(±) | linjäriteten för toppar är genomsnittlig (8.4% delta till föregående frekvens)
Totalt 100 - 16 000 Hz
(±) | linjäriteten för det totala ljudet är genomsnittlig (17% skillnad mot median)
Jämfört med samma klass
» 45% av alla testade enheter i den här klassen var bättre, 12% liknande, 43% sämre
» Den bästa hade ett delta på 6%, genomsnittet var 18%, sämst var 132%
Jämfört med alla testade enheter
» 30% av alla testade enheter var bättre, 8% liknande, 62% sämre
» Den bästa hade ett delta på 4%, genomsnittet var 24%, sämst var 134%
| Av/Standby | |
| Låg belastning | |
| Hög belastning |
|
Förklaring:
min: | |
| Gigabyte Aero 17 HDR XB i7-10875H, GeForce RTX 2070 Super Max-Q | Gigabyte Aero 17 XA RP77 i9-9980HK, GeForce RTX 2070 Max-Q | Alienware m17 R2 P41E i9-9980HK, GeForce RTX 2080 Max-Q | MSI GS75 Stealth 9SG i7-9750H, GeForce RTX 2080 Max-Q | Asus ROG Zephyrus S GX701GXR i7-9750H, GeForce RTX 2080 Max-Q | Razer Blade Pro 17 RTX 2080 Max-Q i7-9750H, GeForce RTX 2080 Max-Q | |
|---|---|---|---|---|---|---|
| Power Consumption | -7% | -52% | 12% | -26% | 3% | |
| Idle Minimum * (Watt) | 16 | 13.9 13% | 24.7 -54% | 13 19% | 32 -100% | 16.2 -1% |
| Idle Average * (Watt) | 19 | 24.3 -28% | 35.9 -89% | 17 11% | 34 -79% | 20.4 -7% |
| Idle Maximum * (Watt) | 30 | 35.5 -18% | 69.6 -132% | 25 17% | 36 -20% | 26.1 13% |
| Load Average * (Watt) | 109 | 127.6 -17% | 141.8 -30% | 96 12% | 95 13% | 96.5 11% |
| Witcher 3 ultra * (Watt) | 167 | 158 5% | 185.8 -11% | 156 7% | 155 7% | 182.9 -10% |
| Load Maximum * (Watt) | 246 | 237.5 3% | 235.4 4% | 239 3% | 187 24% | 214.3 13% |
* ... mindre är bättre
| Gigabyte Aero 17 HDR XB i7-10875H, GeForce RTX 2070 Super Max-Q, 94 Wh | Gigabyte Aero 17 XA RP77 i9-9980HK, GeForce RTX 2070 Max-Q, 94.24 Wh | Alienware m17 R2 P41E i9-9980HK, GeForce RTX 2080 Max-Q, 76 Wh | MSI GS75 Stealth 9SG i7-9750H, GeForce RTX 2080 Max-Q, 80.25 Wh | Asus ROG Zephyrus S GX701GXR i7-9750H, GeForce RTX 2080 Max-Q, 76 Wh | Razer Blade Pro 17 RTX 2080 Max-Q i7-9750H, GeForce RTX 2080 Max-Q, 70 Wh | |
|---|---|---|---|---|---|---|
| Batteridrifttid | 2% | -43% | -24% | -53% | -38% | |
| Reader / Idle (h) | 9.9 | 11.9 20% | 7.1 -28% | 7.7 -22% | 4.1 -59% | 4.9 -51% |
| WiFi v1.3 (h) | 6.2 | 7.2 16% | 4.8 -23% | 6 -3% | 3 -52% | 4.7 -24% |
| Load (h) | 2.3 | 1.6 -30% | 0.5 -78% | 1.2 -48% | 1.2 -48% | 1.4 -39% |
| H.264 (h) | 6.8 | 2.8 |
För
Emot
Läs den fullständiga versionen av den här recensionen på engelska här.
En uppdatering av Gigabyte Aero 17 HDR som borde göra de flesta typer av användare nöjda.
Även om kreatörer kommer uppskatta den ljusstarka 4K-skärmen med sina exakta färger kommer även gamers få vad de önskar tack vare en åttakärnig CPU och en GPU från toppskiktet. Gigabyte har tänkt på (nästan) allt annat också. Det robusta höljet får poäng för bra inmatningsenheter och den har ett rikligt utbud av portar som inkluderar Thunderbolt 3. Batteritiden imponerade också för en spellaptop.
Om det inte vore för den höga ljudnivån vid belastning och ett fåtal detaljer (oturlig placering av webbkameran, ingen belysning för sekundära funktioner och suboptimal portplacering) hade vi gillat allt med Aero 17 HDR.
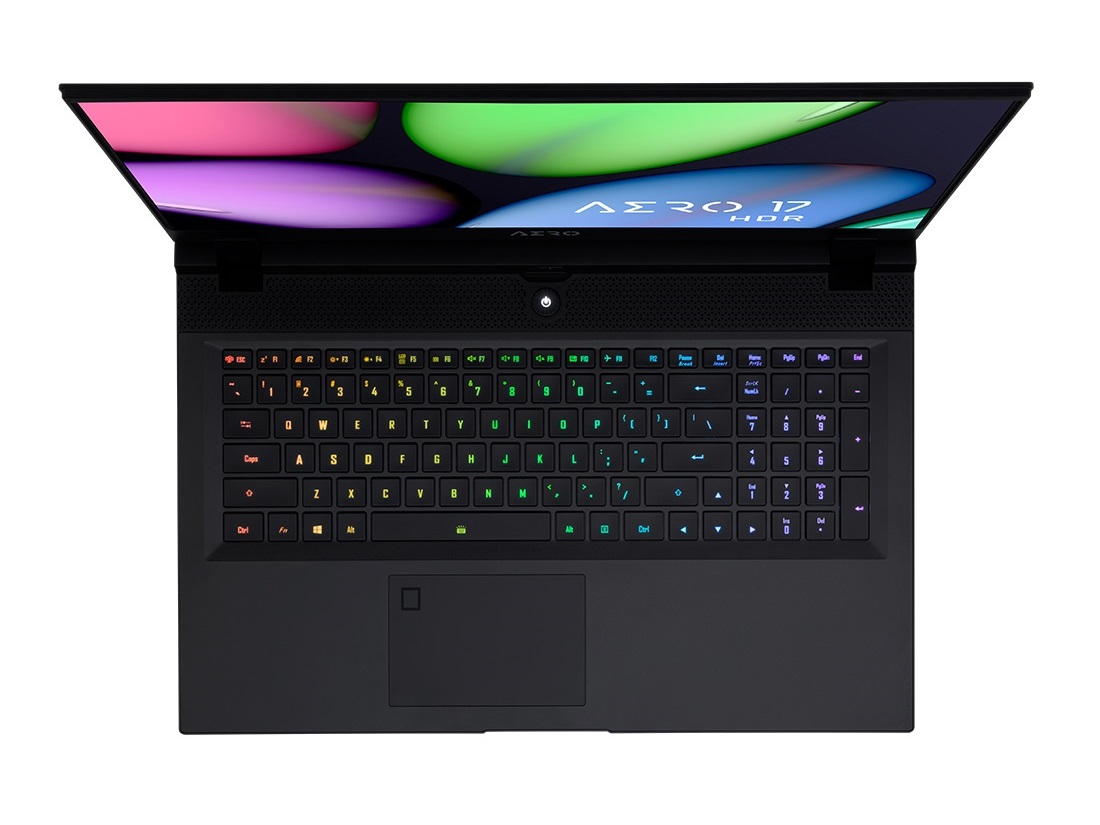
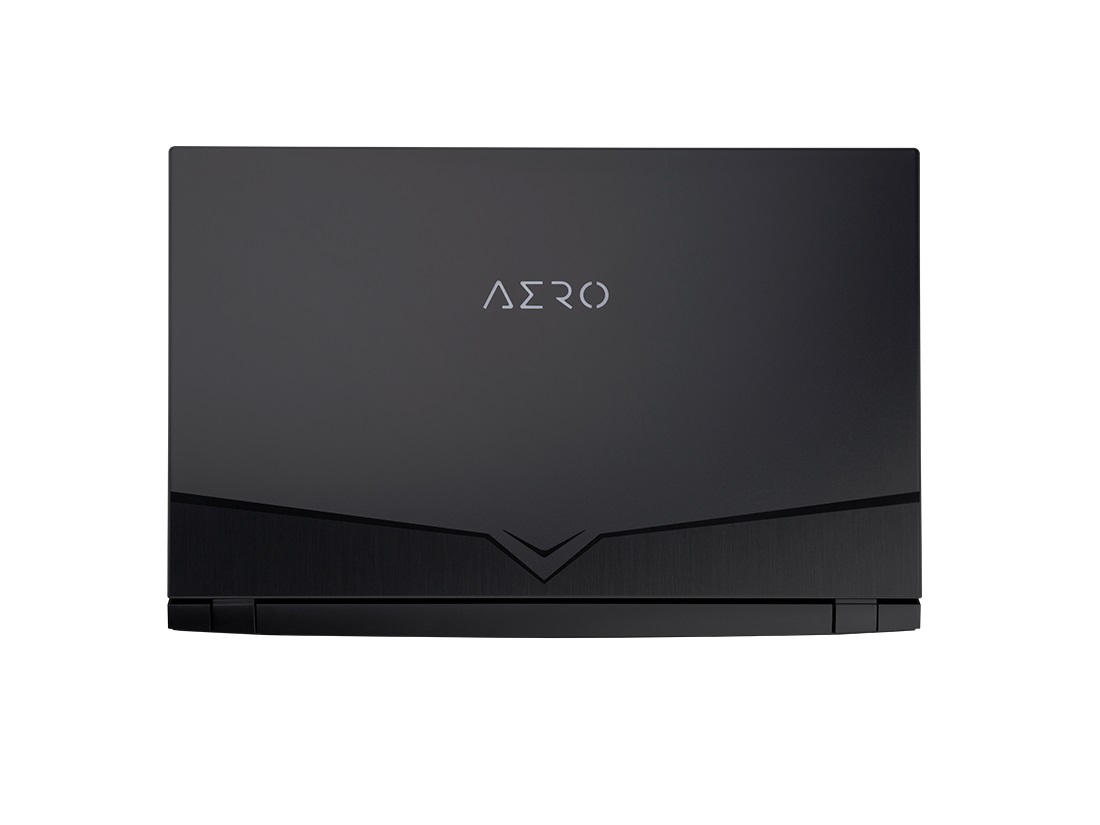
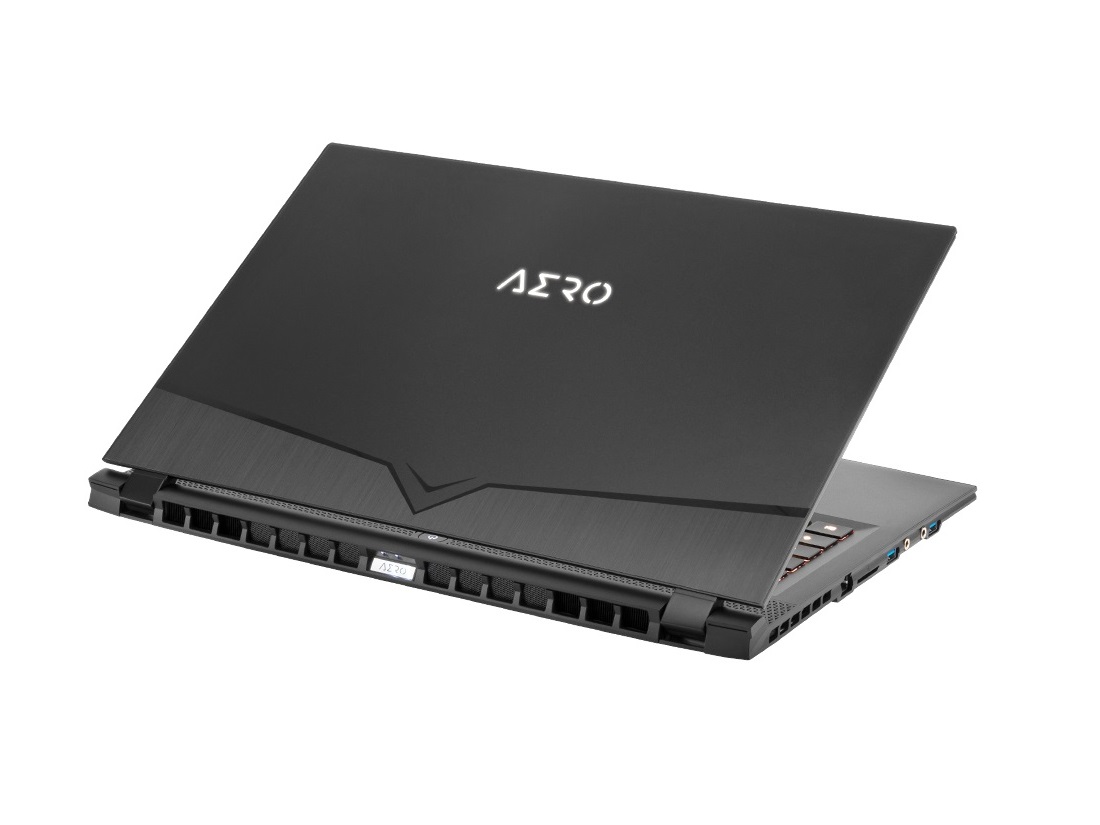
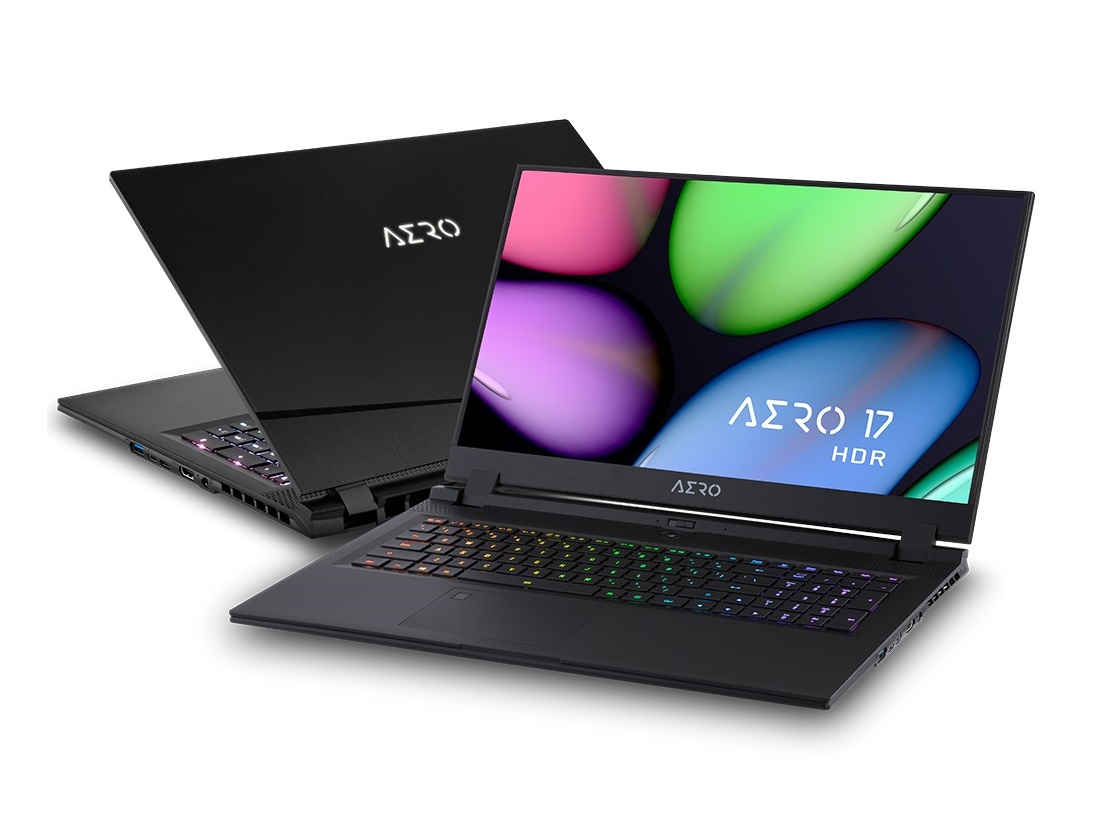
Gigabyte Aero 17 HDR XB
- 04/21/2020 v7 (old)
Florian Glaser
Price comparison