Test: Asus TUF FX705GM (i7-8750H, GTX 1060, FHD) Laptop (Sammanfattning)
| Networking | |
| iperf3 transmit AX12 | |
| Asus TUF FX705GM | |
| Schenker XMG A707 Coffee Lake | |
| Acer Predator Helios 300 PH317-52-51M6 | |
| Asus Strix GL703GM-DS74 | |
| MSI GS73 Stealth 8RF-011 | |
| iperf3 receive AX12 | |
| Schenker XMG A707 Coffee Lake | |
| Acer Predator Helios 300 PH317-52-51M6 | |
| Asus TUF FX705GM | |
| Asus Strix GL703GM-DS74 | |
| MSI GS73 Stealth 8RF-011 | |
| |||||||||||||||||||||||||
Distribution av ljusstyrkan: 85 %
Mitt på batteriet: 205 cd/m²
Kontrast: 1170:1 (Svärta: 0.2 cd/m²)
ΔE ColorChecker Calman: 2.16 | ∀{0.5-29.43 Ø4.73}
calibrated: 2.02
ΔE Greyscale Calman: 2 | ∀{0.09-98 Ø4.97}
89% sRGB (Argyll 1.6.3 3D)
58% AdobeRGB 1998 (Argyll 1.6.3 3D)
63.8% AdobeRGB 1998 (Argyll 3D)
88.8% sRGB (Argyll 3D)
62.4% Display P3 (Argyll 3D)
Gamma: 2.46
CCT: 6394 K
| Asus TUF FX705GM AU Optronics B173HAN04.0 (AUO409D), IPS, 1920x1080 | Asus Strix GL703GM-DS74 Chi Mei CMN1747 M173JJE-G32, TN LED, 1920x1080 | MSI GS73 Stealth 8RF-011 CMN N173HHE-G32 (CMN1747), TN, 1920x1080 | Schenker XMG A707 Coffee Lake LG Philips LP173WF4-SPF5 (LGD056D), IPS, 1920x1080 | Acer Predator Helios 300 PH317-52-51M6 LG Philips LP173WF4-SPF5 (LGD056D), IPS, 1920x1080 | |
|---|---|---|---|---|---|
| Display | 30% | 31% | -1% | 1% | |
| Display P3 Coverage (%) | 62.4 | 90 44% | 90.8 46% | 66.1 6% | 67.1 8% |
| sRGB Coverage (%) | 88.8 | 100 13% | 99.9 13% | 84.4 -5% | 86.1 -3% |
| AdobeRGB 1998 Coverage (%) | 63.8 | 84.8 33% | 85.8 34% | 61.7 -3% | 63 -1% |
| Response Times | 4% | 17% | -281% | -253% | |
| Response Time Grey 50% / Grey 80% * (ms) | 7.4 ? | 8.8 ? -19% | 7.8 ? -5% | 39.2 ? -430% | 36 ? -386% |
| Response Time Black / White * (ms) | 10 ? | 7.4 ? 26% | 6.2 ? 38% | 23.2 ? -132% | 22 ? -120% |
| PWM Frequency (Hz) | 25510 ? | 25510 ? | 119000 ? | 122000 ? | |
| Screen | -33% | -15% | -61% | -68% | |
| Brightness middle (cd/m²) | 234 | 297.8 27% | 262 12% | 362 55% | 365 56% |
| Brightness (cd/m²) | 228 | 285 25% | 261 14% | 350 54% | 341 50% |
| Brightness Distribution (%) | 85 | 84 -1% | 94 11% | 91 7% | 89 5% |
| Black Level * (cd/m²) | 0.2 | 0.33 -65% | 0.2 -0% | 0.29 -45% | 0.32 -60% |
| Contrast (:1) | 1170 | 902 -23% | 1310 12% | 1248 7% | 1141 -2% |
| Colorchecker dE 2000 * | 2.16 | 3.68 -70% | 3.96 -83% | 6.06 -181% | 6.51 -201% |
| Colorchecker dE 2000 max. * | 3.39 | 7.71 -127% | 7.29 -115% | 11.6 -242% | 12.32 -263% |
| Colorchecker dE 2000 calibrated * | 2.02 | 2.71 -34% | 2.18 -8% | 3.13 -55% | 2.9 -44% |
| Greyscale dE 2000 * | 2 | 5 -150% | 3.09 -55% | 7.22 -261% | 7.65 -283% |
| Gamma | 2.46 89% | 2.06 107% | 2.48 89% | 2.51 88% | 2.64 83% |
| CCT | 6394 102% | 6728 97% | 6977 93% | 7659 85% | 8066 81% |
| Color Space (Percent of AdobeRGB 1998) (%) | 58 | 84.77 46% | 76 31% | 55 -5% | 56 -3% |
| Color Space (Percent of sRGB) (%) | 89 | 99.97 12% | 100 12% | 84 -6% | 86 -3% |
| Totalt genomsnitt (program/inställningar) | 0% /
-16% | 11% /
-3% | -114% /
-77% | -107% /
-78% |
* ... mindre är bättre
Visa svarstider
| ↔ Svarstid svart till vitt | ||
|---|---|---|
| 10 ms ... stiga ↗ och falla ↘ kombinerat | ↗ 4.8 ms stiga | 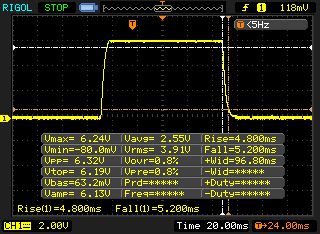 |
| ↘ 5.2 ms hösten | ||
| Skärmen visar bra svarsfrekvens i våra tester, men kan vara för långsam för konkurrenskraftiga spelare. I jämförelse sträcker sig alla testade enheter från 0.1 (minst) till 240 (maximalt) ms. » 27 % av alla enheter är bättre. Det betyder att den uppmätta svarstiden är bättre än genomsnittet av alla testade enheter (19.9 ms). | ||
| ↔ Svarstid 50 % grått till 80 % grått | ||
| 7.4 ms ... stiga ↗ och falla ↘ kombinerat | ↗ 3.8 ms stiga | 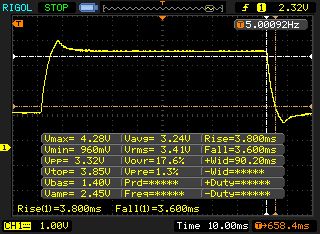 |
| ↘ 3.6 ms hösten | ||
| Skärmen visar väldigt snabba svarsfrekvenser i våra tester och borde vara mycket väl lämpad för fartfyllt spel. I jämförelse sträcker sig alla testade enheter från 0.165 (minst) till 636 (maximalt) ms. » 20 % av alla enheter är bättre. Det betyder att den uppmätta svarstiden är bättre än genomsnittet av alla testade enheter (31.1 ms). | ||
Skärmflimmer / PWM (Puls-Width Modulation)
| Skärmflimmer / PWM upptäcktes inte | 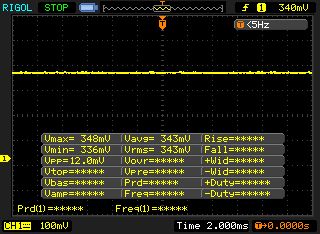 | ||
Som jämförelse: 52 % av alla testade enheter använder inte PWM för att dämpa skärmen. Om PWM upptäcktes mättes ett medelvärde av 7784 (minst: 5 - maximum: 343500) Hz. | |||
| Cinebench R15 | |
| CPU Single 64Bit | |
| Genomsnitt av klass Gaming (188.8 - 343, n=109, senaste 2 åren) | |
| MSI GS73 Stealth 8RF-011 | |
| Asus TUF FX705GM | |
| Schenker XMG A707 Coffee Lake | |
| Acer Predator Helios 300 PH317-52-51M6 | |
| Asus Strix GL703GM-DS74 | |
| CPU Multi 64Bit | |
| Genomsnitt av klass Gaming (1578 - 6271, n=109, senaste 2 åren) | |
| Asus TUF FX705GM | |
| MSI GS73 Stealth 8RF-011 | |
| Schenker XMG A707 Coffee Lake | |
| Asus Strix GL703GM-DS74 | |
| Acer Predator Helios 300 PH317-52-51M6 | |
| Cinebench R11.5 | |
| CPU Single 64Bit | |
| Genomsnitt av klass Gaming (3.3 - 3.98, n=8, senaste 2 åren) | |
| Asus TUF FX705GM | |
| Schenker XMG A707 Coffee Lake | |
| MSI GS73 Stealth 8RF-011 | |
| Acer Predator Helios 300 PH317-52-51M6 | |
| Asus Strix GL703GM-DS74 | |
| CPU Multi 64Bit | |
| Genomsnitt av klass Gaming (29.8 - 70.7, n=8, senaste 2 åren) | |
| Asus TUF FX705GM | |
| MSI GS73 Stealth 8RF-011 | |
| Schenker XMG A707 Coffee Lake | |
| Asus Strix GL703GM-DS74 | |
| Acer Predator Helios 300 PH317-52-51M6 | |
| PCMark 10 - Score | |
| Genomsnitt av klass Gaming (5828 - 11574, n=94, senaste 2 åren) | |
| Asus Strix GL703GM-DS74 | |
| Asus TUF FX705GM | |
| Schenker XMG A707 Coffee Lake | |
| PCMark 8 | |
| Home Score Accelerated v2 | |
| Genomsnitt av klass Gaming (n=1senaste 2 åren) | |
| Asus Strix GL703GM-DS74 | |
| Asus TUF FX705GM | |
| MSI GS73 Stealth 8RF-011 | |
| Acer Predator Helios 300 PH317-52-51M6 | |
| Schenker XMG A707 Coffee Lake | |
| Work Score Accelerated v2 | |
| Asus TUF FX705GM | |
| Asus Strix GL703GM-DS74 | |
| Schenker XMG A707 Coffee Lake | |
| Acer Predator Helios 300 PH317-52-51M6 | |
| MSI GS73 Stealth 8RF-011 | |
| Genomsnitt av klass Gaming (n=1senaste 2 åren) | |
| PCMark 8 Home Score Accelerated v2 | 4660 poäng | |
| PCMark 8 Work Score Accelerated v2 | 5719 poäng | |
| PCMark 10 Score | 5169 poäng | |
Hjälp | ||
| Asus TUF FX705GM WDC PC SN520 SDAPNUW-256G | Asus Strix GL703GM-DS74 Samsung PM961 MZVLW256HEHP | MSI GS73 Stealth 8RF-011 Samsung PM961 MZVLW256HEHP | Schenker XMG A707 Coffee Lake Samsung SSD 970 EVO 250GB | Acer Predator Helios 300 PH317-52-51M6 Hynix HFS128G39TND | |
|---|---|---|---|---|---|
| AS SSD | 8% | 12% | 34% | -61% | |
| Seq Read (MB/s) | 1571 | 1993 27% | 1749 11% | 2589 65% | 513 -67% |
| Seq Write (MB/s) | 1236 | 1031 -17% | 1173 -5% | 1449 17% | 128.2 -90% |
| 4K Read (MB/s) | 38.49 | 35.76 -7% | 42.81 11% | 52.8 37% | 26.5 -31% |
| 4K Write (MB/s) | 101.9 | 88.4 -13% | 98.4 -3% | 112.3 10% | 62.7 -38% |
| Score Read (Points) | 913 | 1520 66% | 1456 59% | 1153 26% | 414 -55% |
| Score Write (Points) | 1082 | 825 -24% | 906 -16% | 1592 47% | 196 -82% |
| Score Total (Points) | 2458 | 3075 25% | 3083 25% | 3291 34% | 811 -67% |

| 3DMark 11 - 1280x720 Performance GPU | |
| Genomsnitt av klass Gaming (21841 - 80022, n=106, senaste 2 åren) | |
| MSI GS73 Stealth 8RF-011 | |
| Asus Strix GL703GM-DS74 | |
| Asus TUF FX705GM | |
| Schenker XMG A707 Coffee Lake | |
| Acer Predator Helios 300 PH317-52-51M6 | |
| 3DMark 11 Performance | 13450 poäng | |
Hjälp | ||
| The Witcher 3 | |
| 1920x1080 High Graphics & Postprocessing (Nvidia HairWorks Off) | |
| Genomsnitt av klass Gaming (181 - 341, n=3, senaste 2 åren) | |
| MSI GS73 Stealth 8RF-011 | |
| Asus TUF FX705GM | |
| Asus Strix GL703GM-DS74 | |
| Acer Predator Helios 300 PH317-52-51M6 | |
| Schenker XMG A707 Coffee Lake | |
| 1920x1080 Ultra Graphics & Postprocessing (HBAO+) | |
| Genomsnitt av klass Gaming (95 - 240, n=8, senaste 2 åren) | |
| MSI GS73 Stealth 8RF-011 | |
| Asus Strix GL703GM-DS74 | |
| Asus TUF FX705GM | |
| Acer Predator Helios 300 PH317-52-51M6 | |
| Schenker XMG A707 Coffee Lake | |
| låg | med. | hög | ultra | |
|---|---|---|---|---|
| The Witcher 3 (2015) | 66.2 | 36.5 | ||
| The Crew 2 (2018) | 60 | 60 | ||
| Monster Hunter World (2018) | 50.8 | 40.6 | ||
| F1 2018 (2018) | 92 | 58 | ||
| Shadow of the Tomb Raider (2018) | 53 | 47 | ||
| FIFA 19 (2018) | 205 | 203 | ||
| Forza Horizon 4 (2018) | 85 | 66 | ||
| Assassin´s Creed Odyssey (2018) | 52 | 37 | ||
| Call of Duty Black Ops 4 (2018) | 69.4 | 63.1 |
Ljudnivå
| Låg belastning |
| 32 / 33 / 44 dB(A) |
| Hårddisk |
| 33 dB(A) |
| Hög belastning |
| 46 / 50 dB(A) |
 | ||
30 dB tyst 40 dB(A) hörbar 50 dB(A) högt ljud |
||
min: | ||
| Asus TUF FX705GM i7-8750H, GeForce GTX 1060 Mobile | Asus Strix GL703GM-DS74 i7-8750H, GeForce GTX 1060 Mobile | MSI GS73 Stealth 8RF-011 i7-8750H, GeForce GTX 1070 Max-Q | Schenker XMG A707 Coffee Lake i7-8750H, GeForce GTX 1050 Ti Mobile | Acer Predator Helios 300 PH317-52-51M6 i5-8300H, GeForce GTX 1050 Ti Mobile | Genomsnitt av klass Gaming | |
|---|---|---|---|---|---|---|
| Noise | 8% | 6% | 4% | 7% | 14% | |
| av / miljö * (dB) | 29 | 28.6 1% | 30 -3% | 29 -0% | 29 -0% | 24.1 ? 17% |
| Idle Minimum * (dB) | 32 | 29.4 8% | 30 6% | 31 3% | 29 9% | 25.8 ? 19% |
| Idle Average * (dB) | 33 | 29.4 11% | 34 -3% | 32 3% | 31 6% | 27.4 ? 17% |
| Idle Maximum * (dB) | 44 | 33.7 23% | 36 18% | 44 -0% | 33 25% | 29.9 ? 32% |
| Load Average * (dB) | 46 | 41.2 10% | 43 7% | 44 4% | 45 2% | 43 ? 7% |
| Witcher 3 ultra * (dB) | 48 | 47.3 1% | 45 6% | 42 12% | 45 6% | |
| Load Maximum * (dB) | 50 | 48.3 3% | 45 10% | 46 8% | 51 -2% | 54 ? -8% |
* ... mindre är bättre
(-) Den maximala temperaturen på ovansidan är 54 °C / 129 F, jämfört med genomsnittet av 40.4 °C / 105 F , allt från 21.2 till 68.8 °C för klassen Gaming.
(-) Botten värms upp till maximalt 53 °C / 127 F, jämfört med genomsnittet av 43.2 °C / 110 F
(+) Vid tomgångsbruk är medeltemperaturen för ovansidan 27.3 °C / 81 F, jämfört med enhetsgenomsnittet på 33.9 °C / ### class_avg_f### F.
(-) När du spelar The Witcher 3 är medeltemperaturen för ovansidan 39.8 °C / 104 F, jämfört med enhetsgenomsnittet på 33.9 °C / ## #class_avg_f### F.
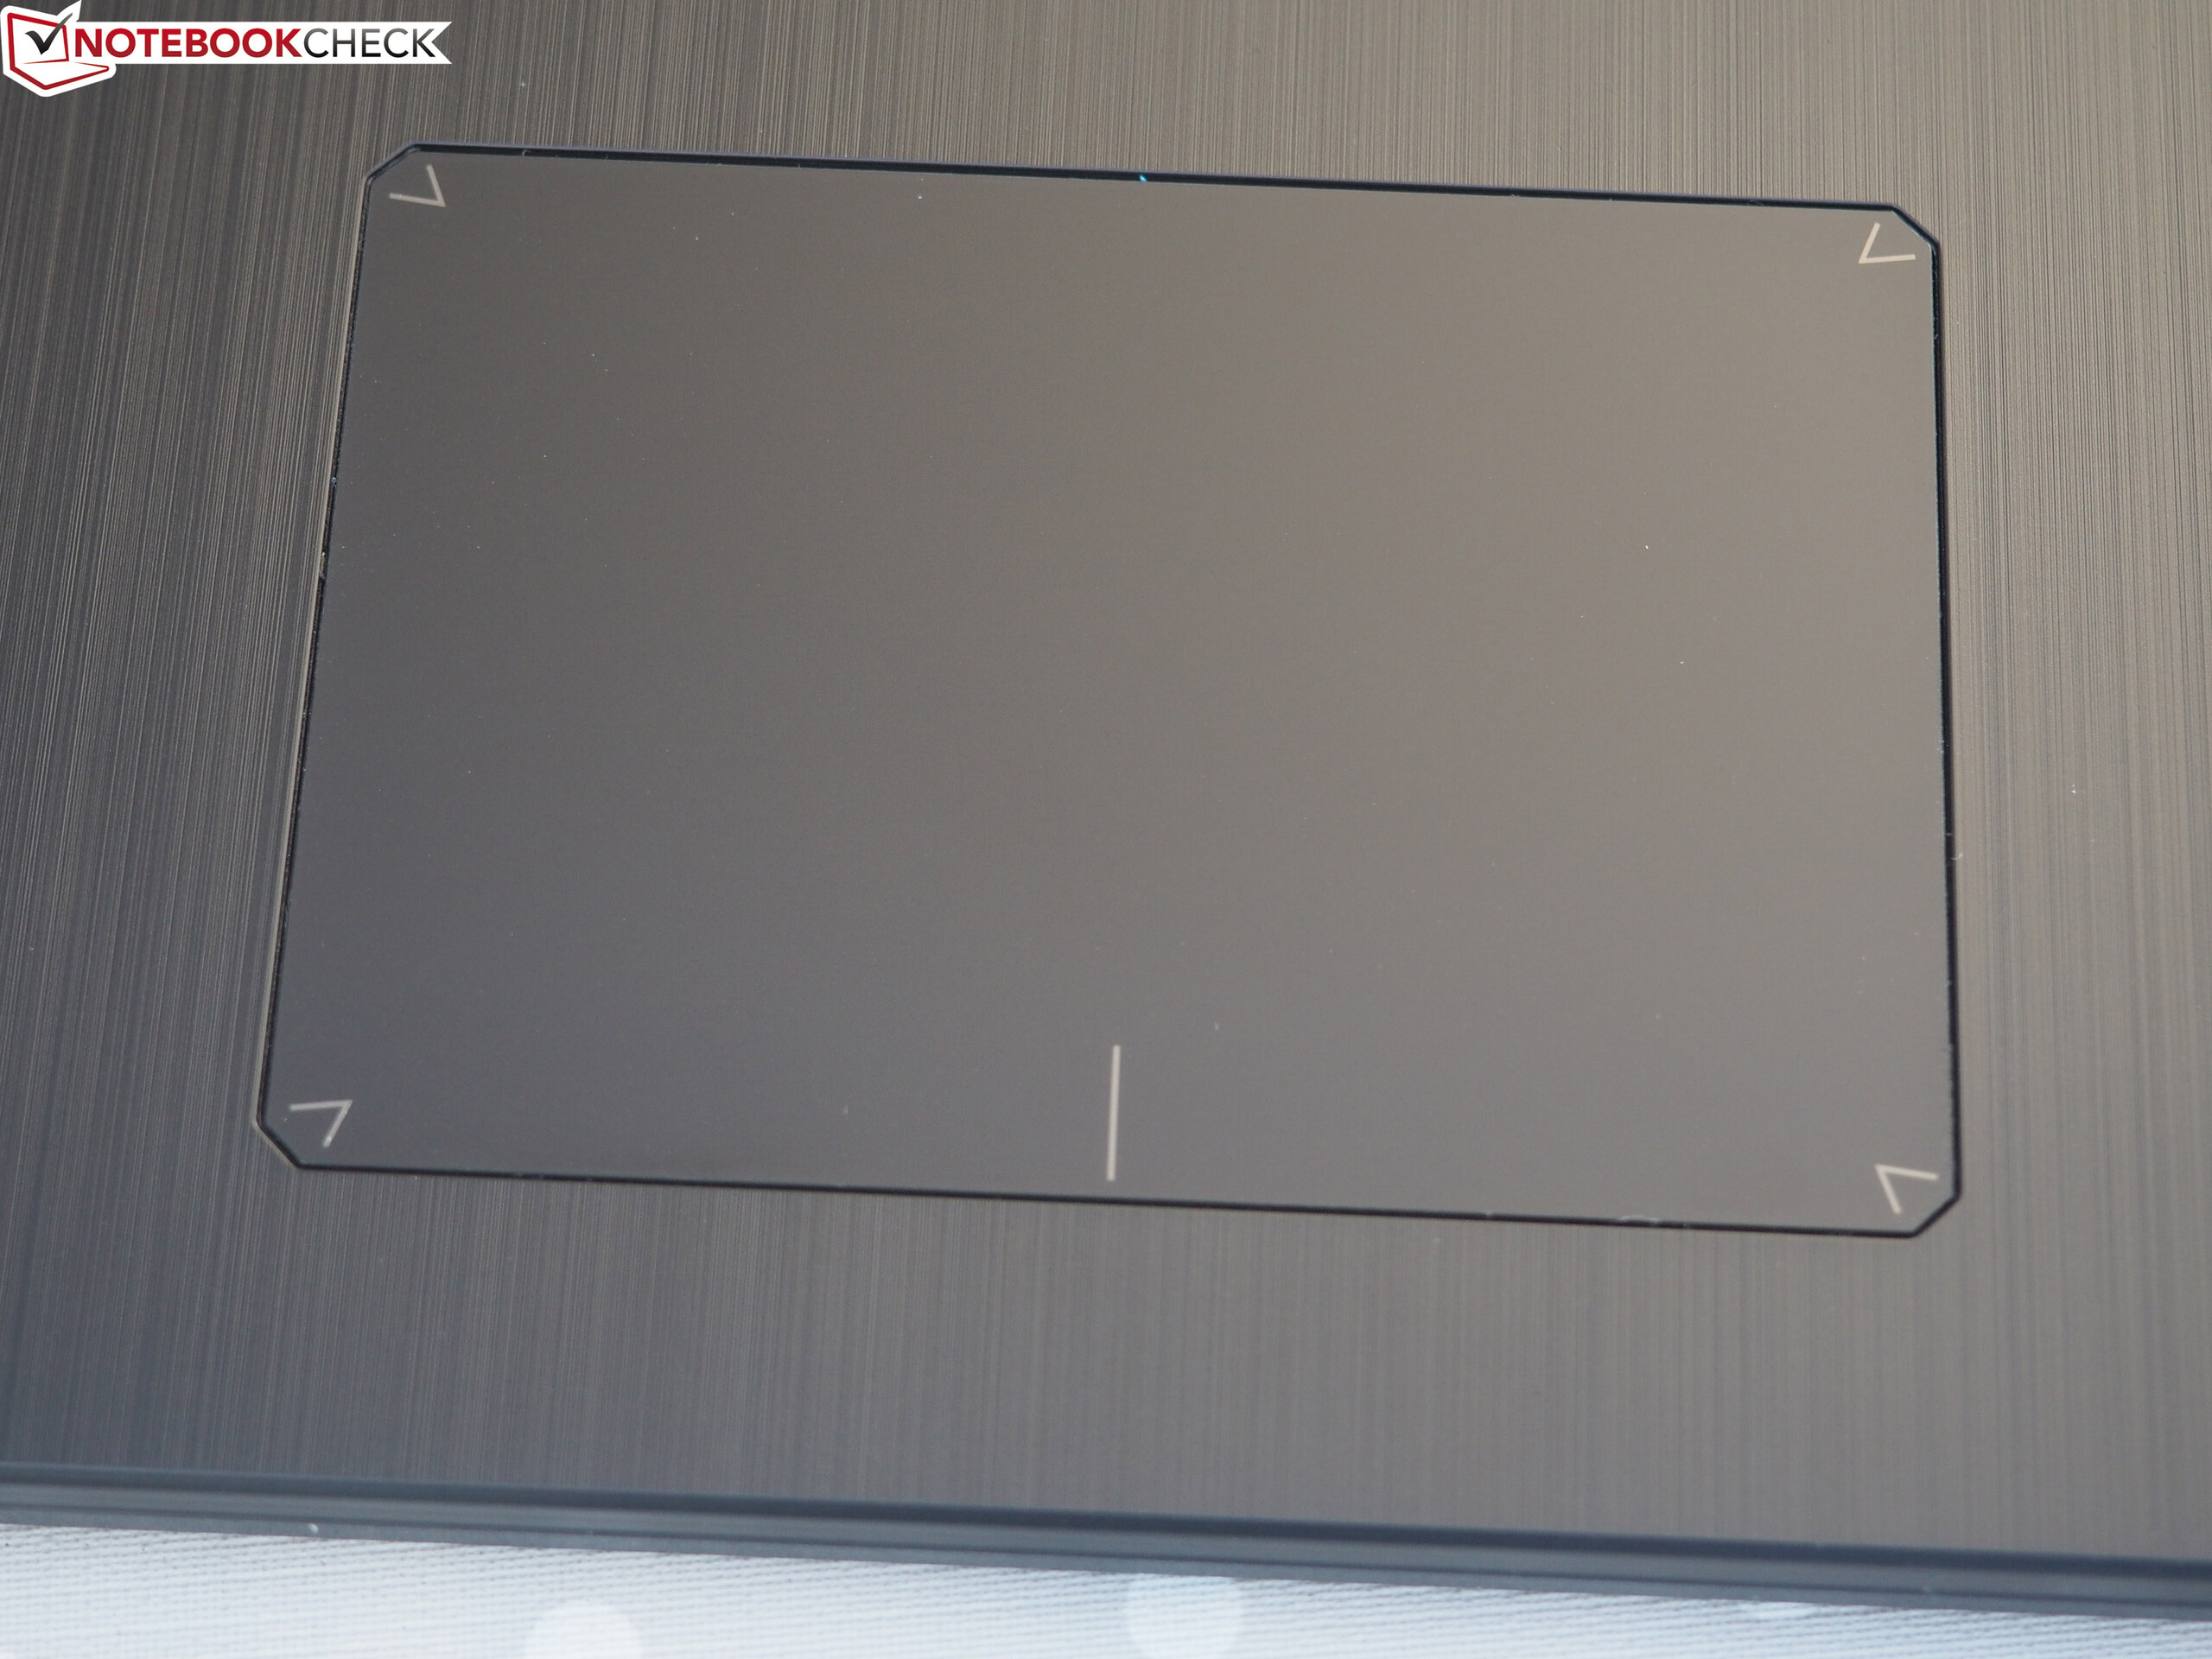
(+) Handledsstöden och pekplattan är kallare än hudtemperaturen med maximalt 31 °C / 87.8 F och är därför svala att ta på.
(-) Medeltemperaturen för handledsstödsområdet på liknande enheter var 28.8 °C / 83.8 F (-2.2 °C / -4 F).
| Asus TUF FX705GM i7-8750H, GeForce GTX 1060 Mobile | Asus Strix GL703GM-DS74 i7-8750H, GeForce GTX 1060 Mobile | MSI GS73 Stealth 8RF-011 i7-8750H, GeForce GTX 1070 Max-Q | Schenker XMG A707 Coffee Lake i7-8750H, GeForce GTX 1050 Ti Mobile | Acer Predator Helios 300 PH317-52-51M6 i5-8300H, GeForce GTX 1050 Ti Mobile | Genomsnitt av klass Gaming | |
|---|---|---|---|---|---|---|
| Heat | -3% | -8% | -4% | -0% | 2% | |
| Maximum Upper Side * (°C) | 54 | 54.6 -1% | 58 -7% | 55 -2% | 50 7% | 45.2 ? 16% |
| Maximum Bottom * (°C) | 53 | 41.2 22% | 63 -19% | 49 8% | 52 2% | 47.9 ? 10% |
| Idle Upper Side * (°C) | 30 | 35 -17% | 32 -7% | 32 -7% | 33 -10% | 31.1 ? -4% |
| Idle Bottom * (°C) | 30 | 35.2 -17% | 30 -0% | 34 -13% | 30 -0% | 34.2 ? -14% |
* ... mindre är bättre
Asus TUF FX705GM ljudanalys
(±) | högtalarljudstyrkan är genomsnittlig men bra (76 dB)
Bas 100 - 315 Hz
(-) | nästan ingen bas - i genomsnitt 16.1% lägre än medianen
(±) | linjäriteten för basen är genomsnittlig (11.5% delta till föregående frekvens)
Mellan 400 - 2000 Hz
(+) | balanserad mellan - endast 4% från medianen
(+) | mids är linjära (5.7% delta till föregående frekvens)
Högsta 2 - 16 kHz
(±) | högre toppar - i genomsnitt 5.1% högre än medianen
(+) | toppar är linjära (4.6% delta till föregående frekvens)
Totalt 100 - 16 000 Hz
(±) | linjäriteten för det totala ljudet är genomsnittlig (21.6% skillnad mot median)
Jämfört med samma klass
» 77% av alla testade enheter i den här klassen var bättre, 5% liknande, 18% sämre
» Den bästa hade ett delta på 6%, genomsnittet var 18%, sämst var 132%
Jämfört med alla testade enheter
» 61% av alla testade enheter var bättre, 7% liknande, 32% sämre
» Den bästa hade ett delta på 4%, genomsnittet var 24%, sämst var 134%
Asus Strix GL703GM-DS74 ljudanalys
(-) | inte särskilt höga högtalare (69.7 dB)
Bas 100 - 315 Hz
(±) | reducerad bas - i genomsnitt 7.3% lägre än medianen
(±) | linjäriteten för basen är genomsnittlig (10.8% delta till föregående frekvens)
Mellan 400 - 2000 Hz
(+) | balanserad mellan - endast 2.2% från medianen
(+) | mids är linjära (5.6% delta till föregående frekvens)
Högsta 2 - 16 kHz
(+) | balanserade toppar - endast 4.2% från medianen
(±) | linjäriteten för toppar är genomsnittlig (13.1% delta till föregående frekvens)
Totalt 100 - 16 000 Hz
(±) | linjäriteten för det totala ljudet är genomsnittlig (15.6% skillnad mot median)
Jämfört med samma klass
» 36% av alla testade enheter i den här klassen var bättre, 6% liknande, 58% sämre
» Den bästa hade ett delta på 6%, genomsnittet var 18%, sämst var 132%
Jämfört med alla testade enheter
» 23% av alla testade enheter var bättre, 5% liknande, 72% sämre
» Den bästa hade ett delta på 4%, genomsnittet var 24%, sämst var 134%
| Av/Standby | |
| Låg belastning | |
| Hög belastning |
|
Förklaring:
min: | |
| Asus TUF FX705GM i7-8750H, GeForce GTX 1060 Mobile | Asus Strix GL703GM-DS74 i7-8750H, GeForce GTX 1060 Mobile | MSI GS73 Stealth 8RF-011 i7-8750H, GeForce GTX 1070 Max-Q | Schenker XMG A707 Coffee Lake i7-8750H, GeForce GTX 1050 Ti Mobile | Acer Predator Helios 300 PH317-52-51M6 i5-8300H, GeForce GTX 1050 Ti Mobile | Genomsnitt av klass Gaming | |
|---|---|---|---|---|---|---|
| Power Consumption | -18% | 10% | 20% | 36% | -12% | |
| Idle Minimum * (Watt) | 13 | 18.88 -45% | 8 38% | 11 15% | 6 54% | 13.2 ? -2% |
| Idle Average * (Watt) | 17 | 24.36 -43% | 14 18% | 14 18% | 9 47% | 18.9 ? -11% |
| Idle Maximum * (Watt) | 24 | 32.27 -34% | 22 8% | 20 17% | 13 46% | 24.3 ? -1% |
| Load Average * (Watt) | 106 | 107.74 -2% | 92 13% | 96 9% | 95 10% | 108.3 ? -2% |
| Witcher 3 ultra * (Watt) | 151 | 142 6% | 154 -2% | 97 36% | 102 32% | |
| Load Maximum * (Watt) | 179 | 160.28 10% | 207 -16% | 136 24% | 134 25% | 254 ? -42% |
* ... mindre är bättre
| Asus TUF FX705GM i7-8750H, GeForce GTX 1060 Mobile, 64 Wh | Asus Strix GL703GM-DS74 i7-8750H, GeForce GTX 1060 Mobile, 74 Wh | MSI GS73 Stealth 8RF-011 i7-8750H, GeForce GTX 1070 Max-Q, 51 Wh | Schenker XMG A707 Coffee Lake i7-8750H, GeForce GTX 1050 Ti Mobile, 62 Wh | Acer Predator Helios 300 PH317-52-51M6 i5-8300H, GeForce GTX 1050 Ti Mobile, 48 Wh | Genomsnitt av klass Gaming | |
|---|---|---|---|---|---|---|
| Batteridrifttid | -20% | -24% | 59% | 41% | 45% | |
| Reader / Idle (h) | 6.3 | 5.3 -16% | 5.8 -8% | 11.7 86% | 11.8 87% | 8.71 ? 38% |
| H.264 (h) | 4.3 | 8.26 ? 92% | ||||
| WiFi v1.3 (h) | 4.5 | 3.6 -20% | 3.3 -27% | 6.3 40% | 5.9 31% | 7.04 ? 56% |
| Load (h) | 1.6 | 1.2 -25% | 1 -37% | 2.4 50% | 1.7 6% | 1.47 ? -8% |
För
Emot
Läs den fullständiga versionen av den här recensionen på engelska här.
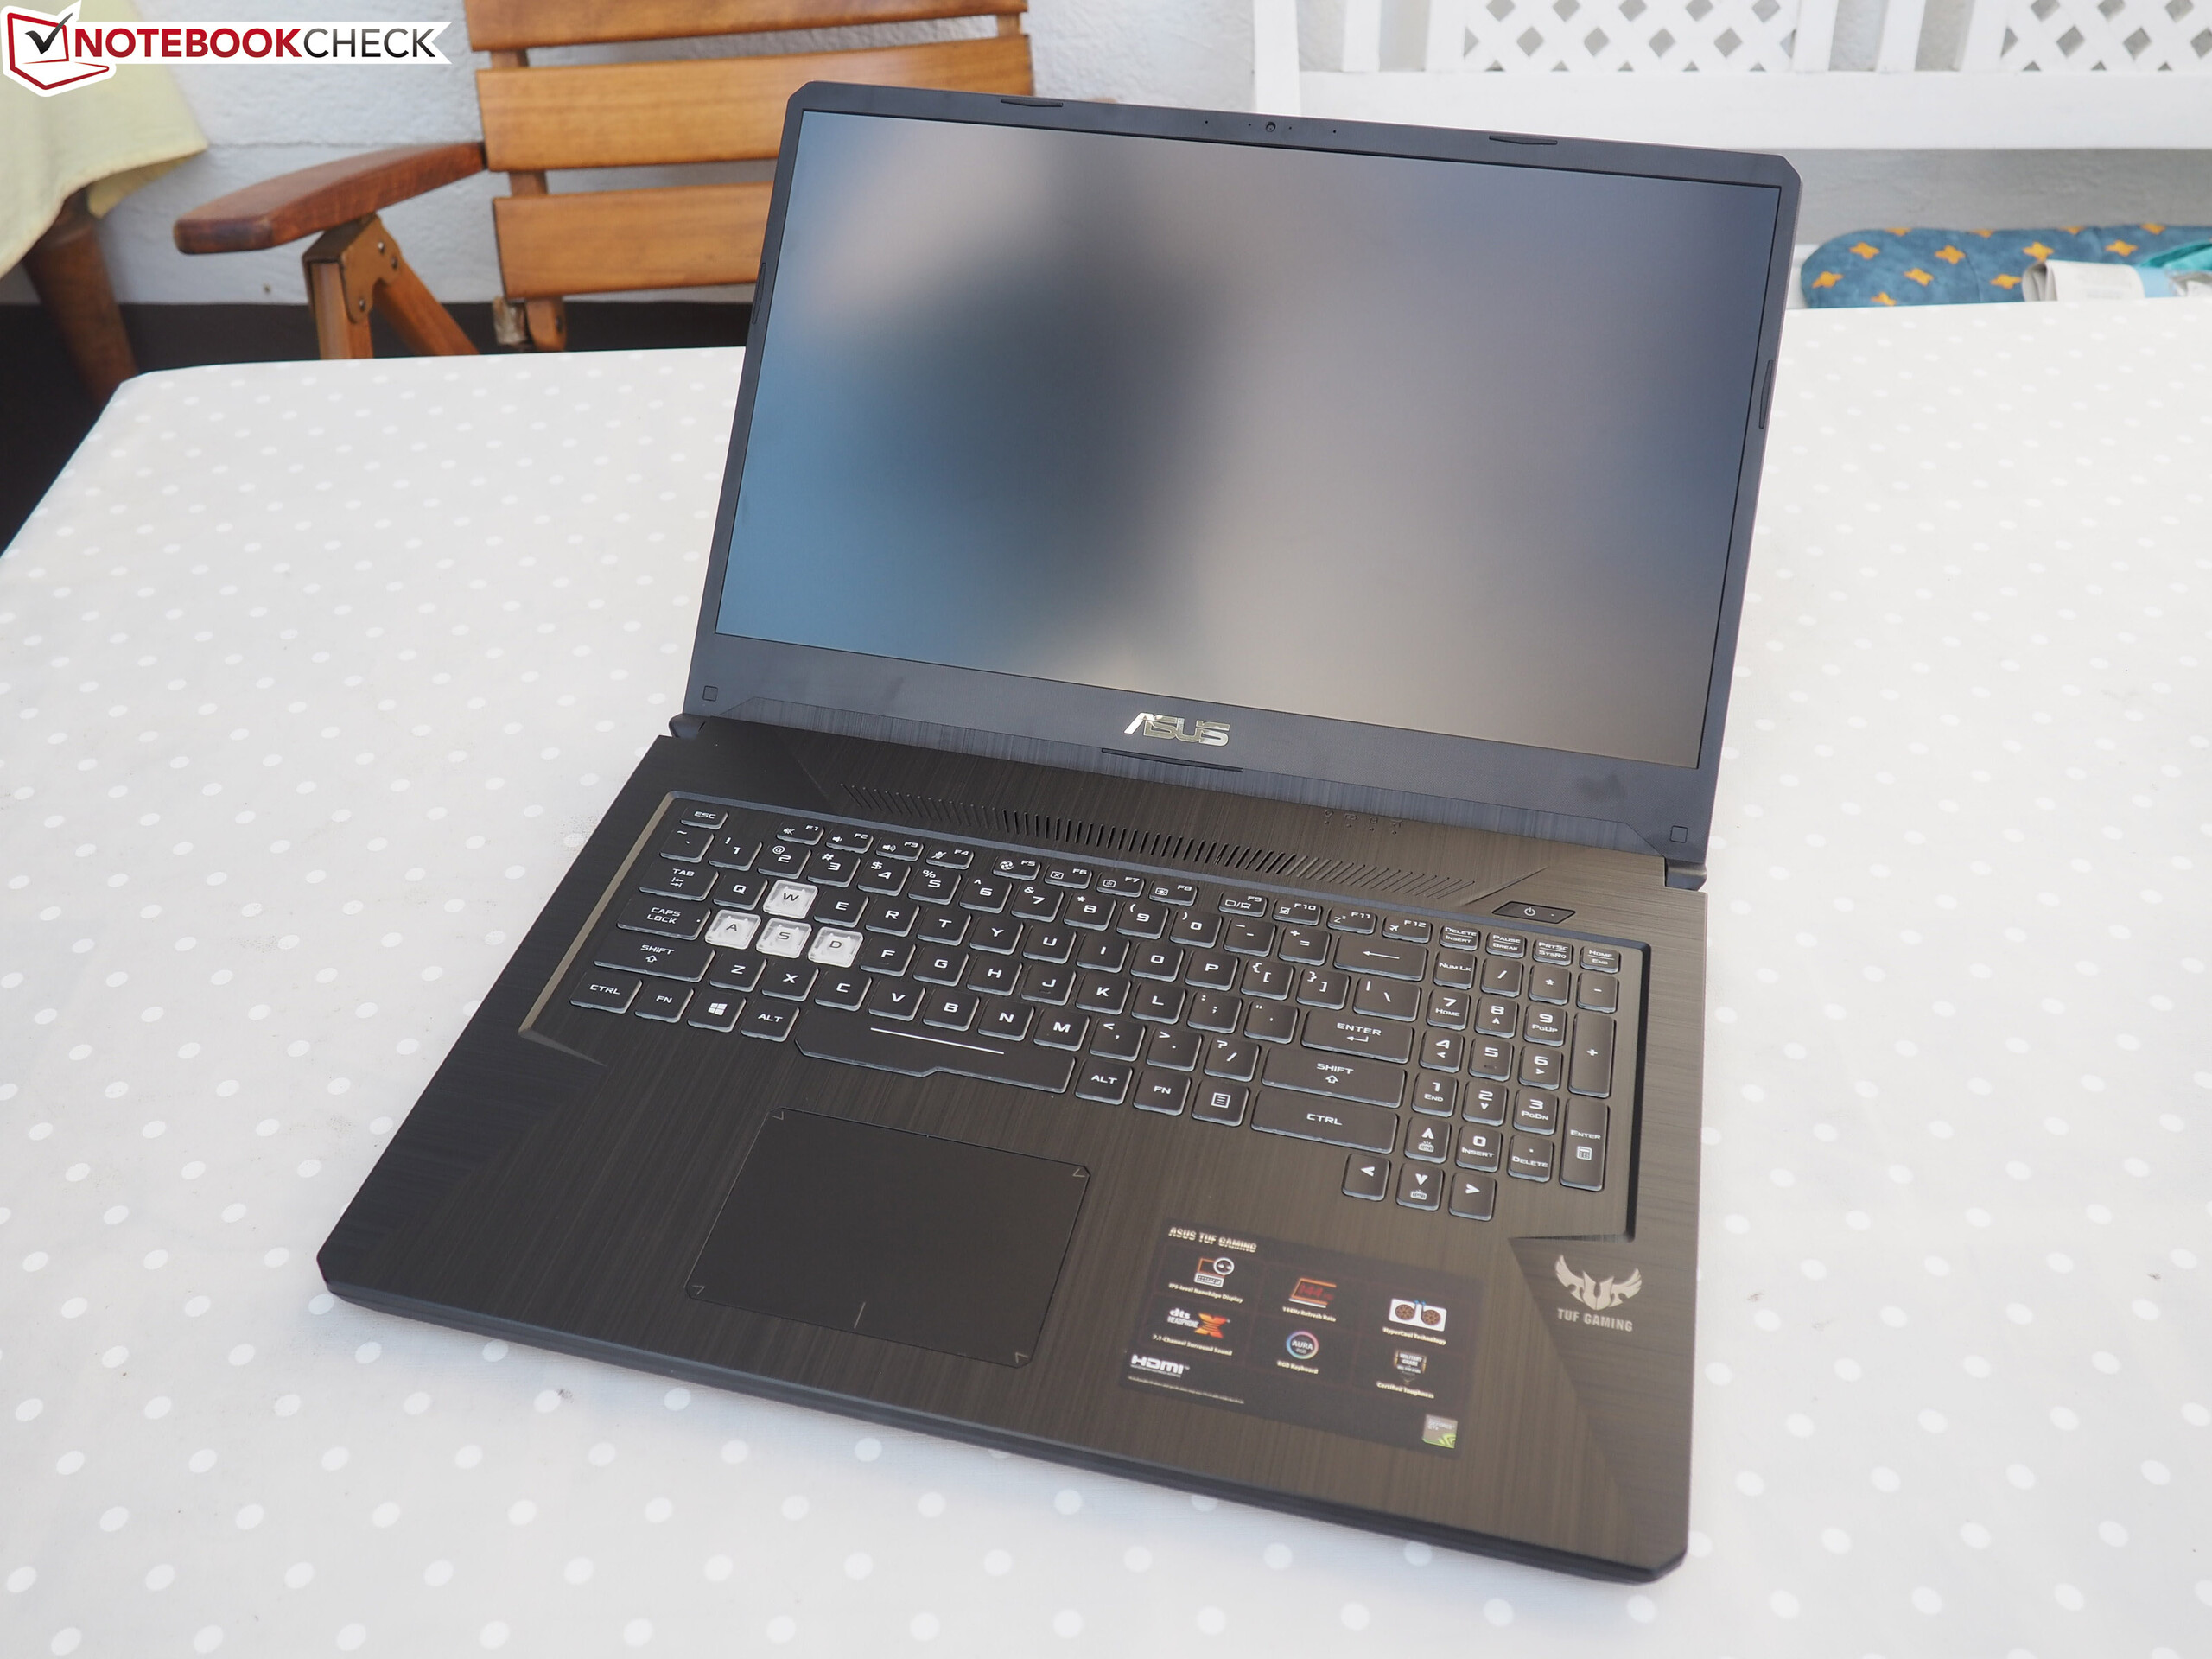
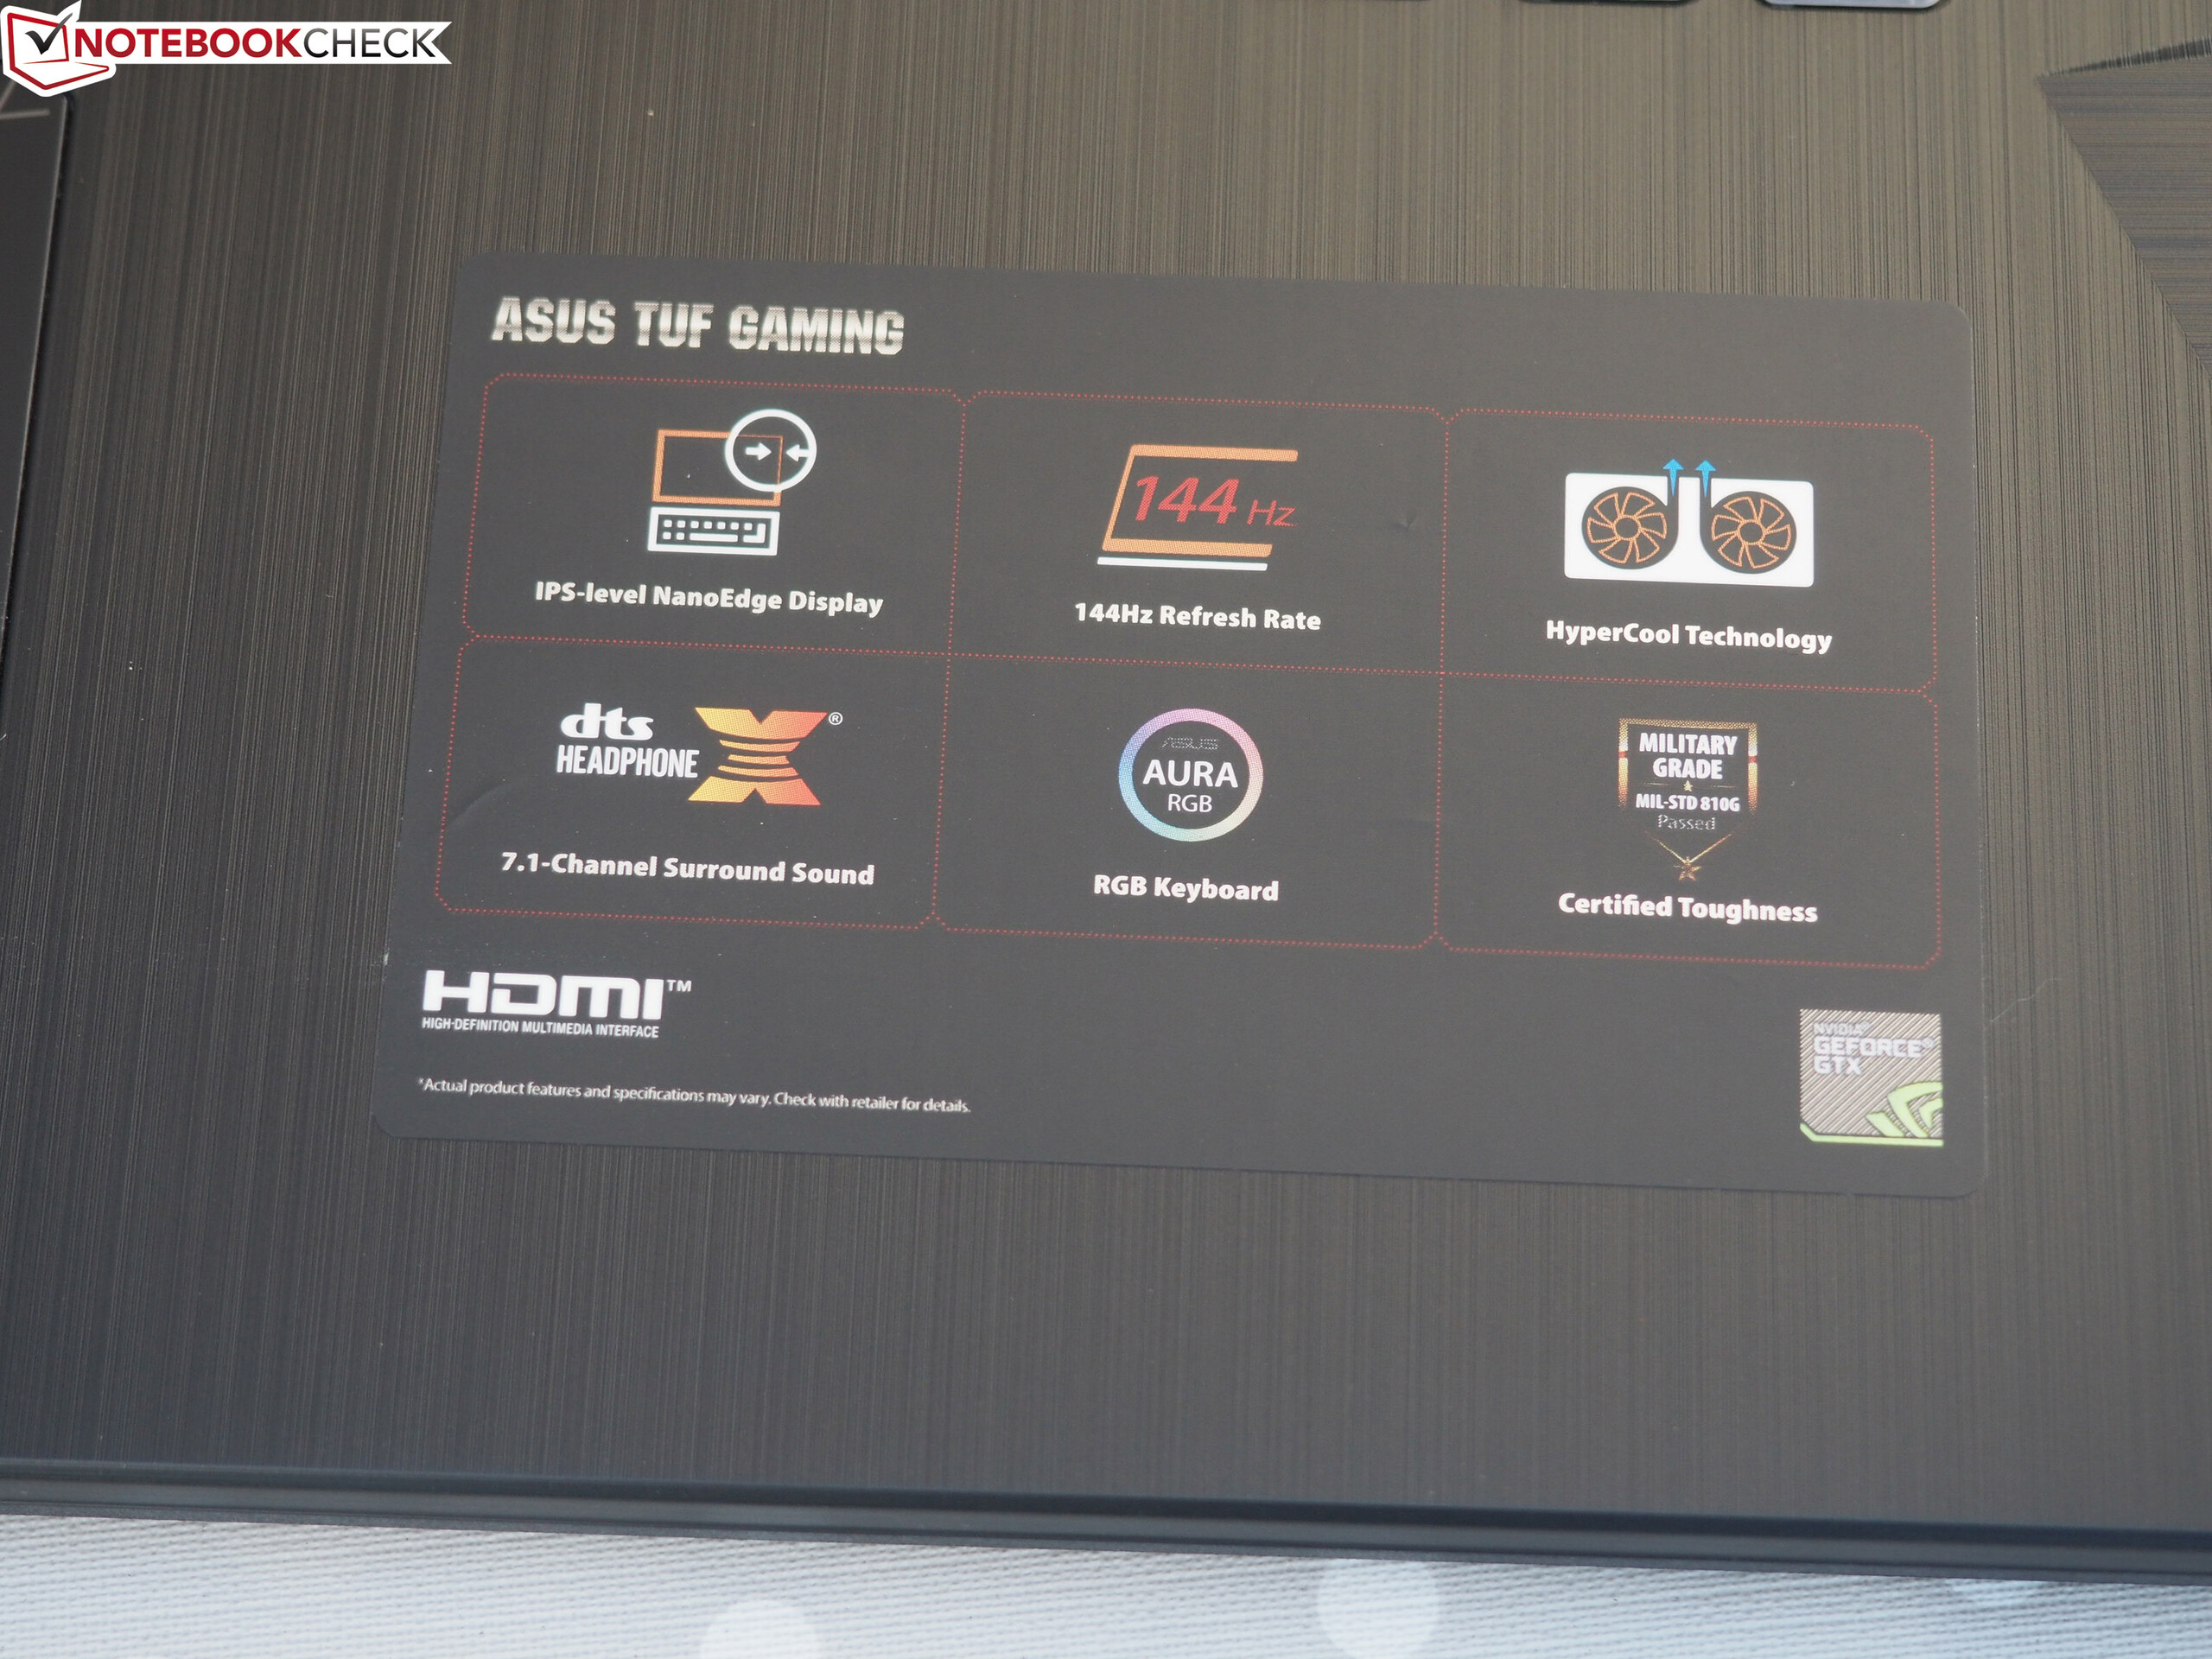
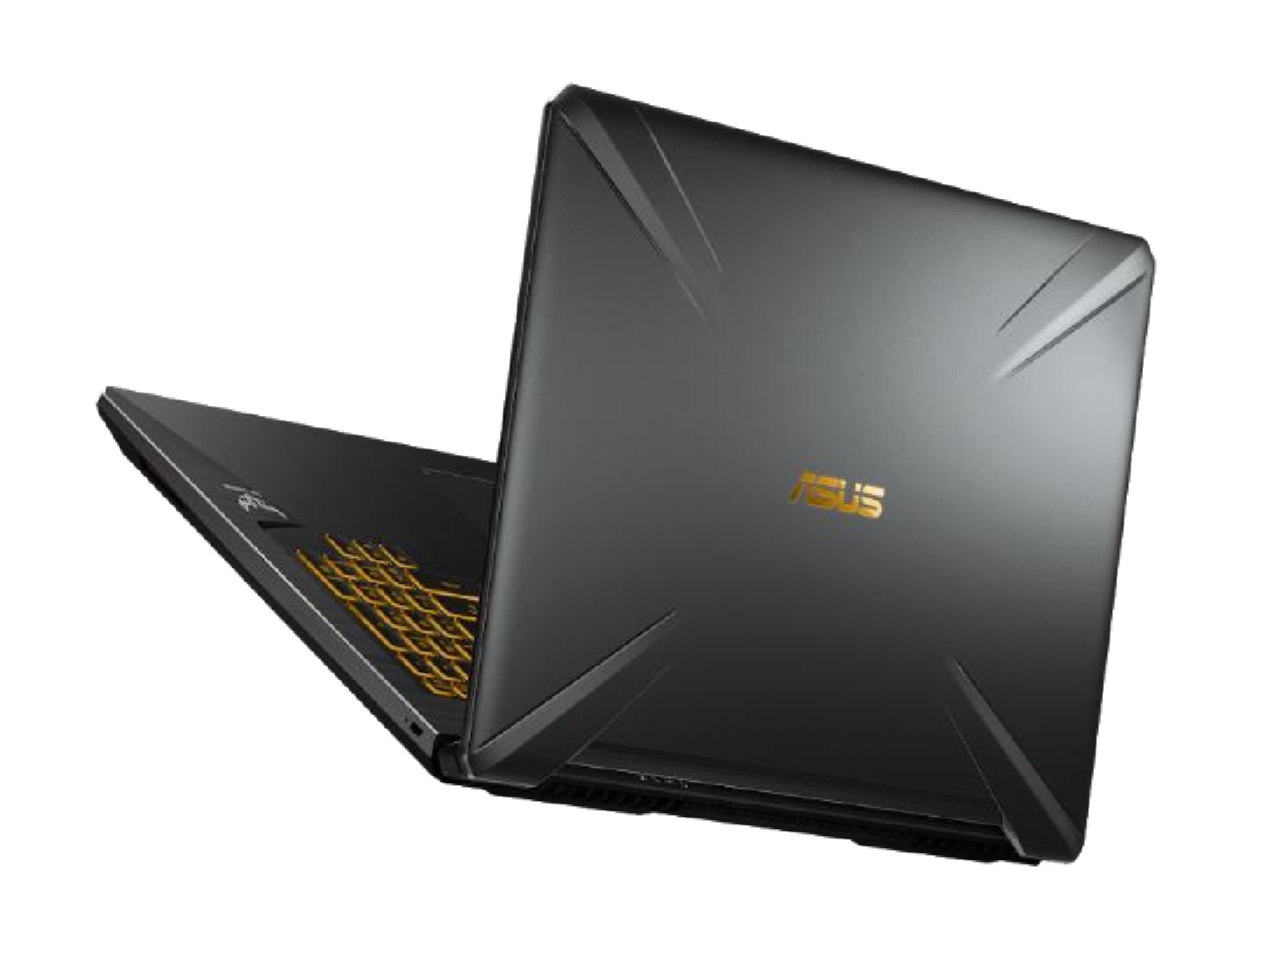
Med sin TUF-serie visar Asus att en potent spellaptop inte behöver vara överdrivet dyr.
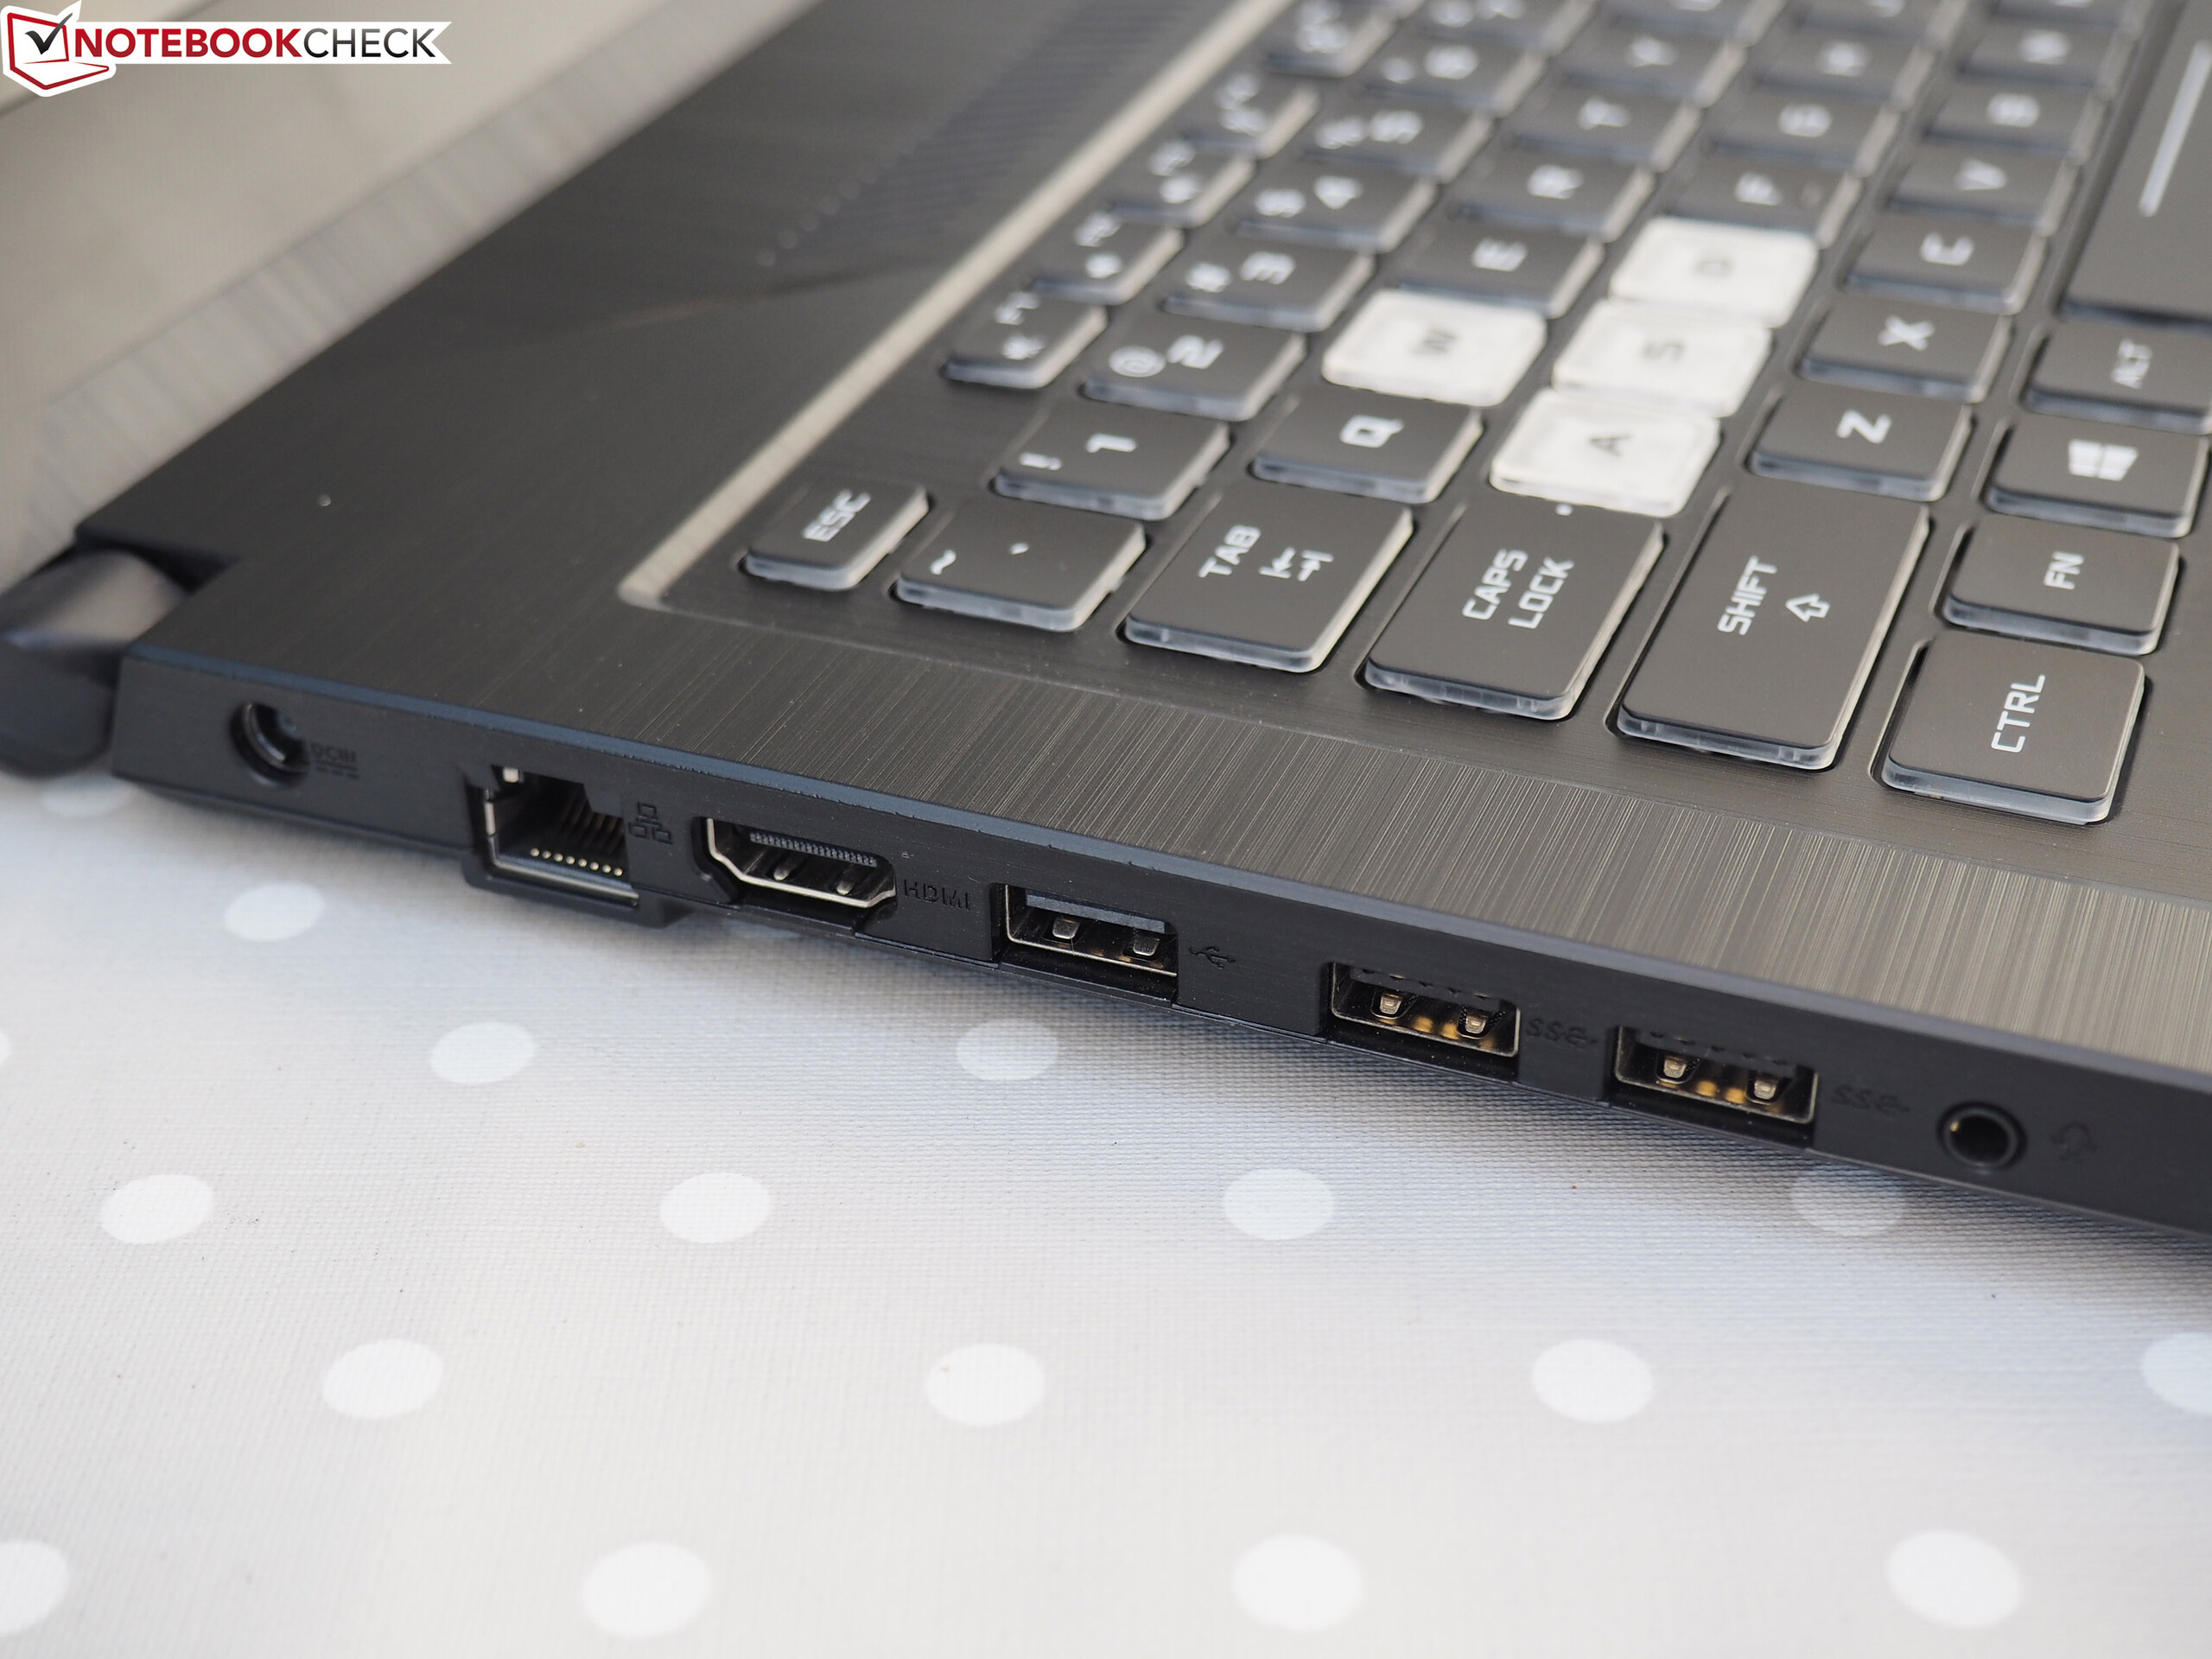
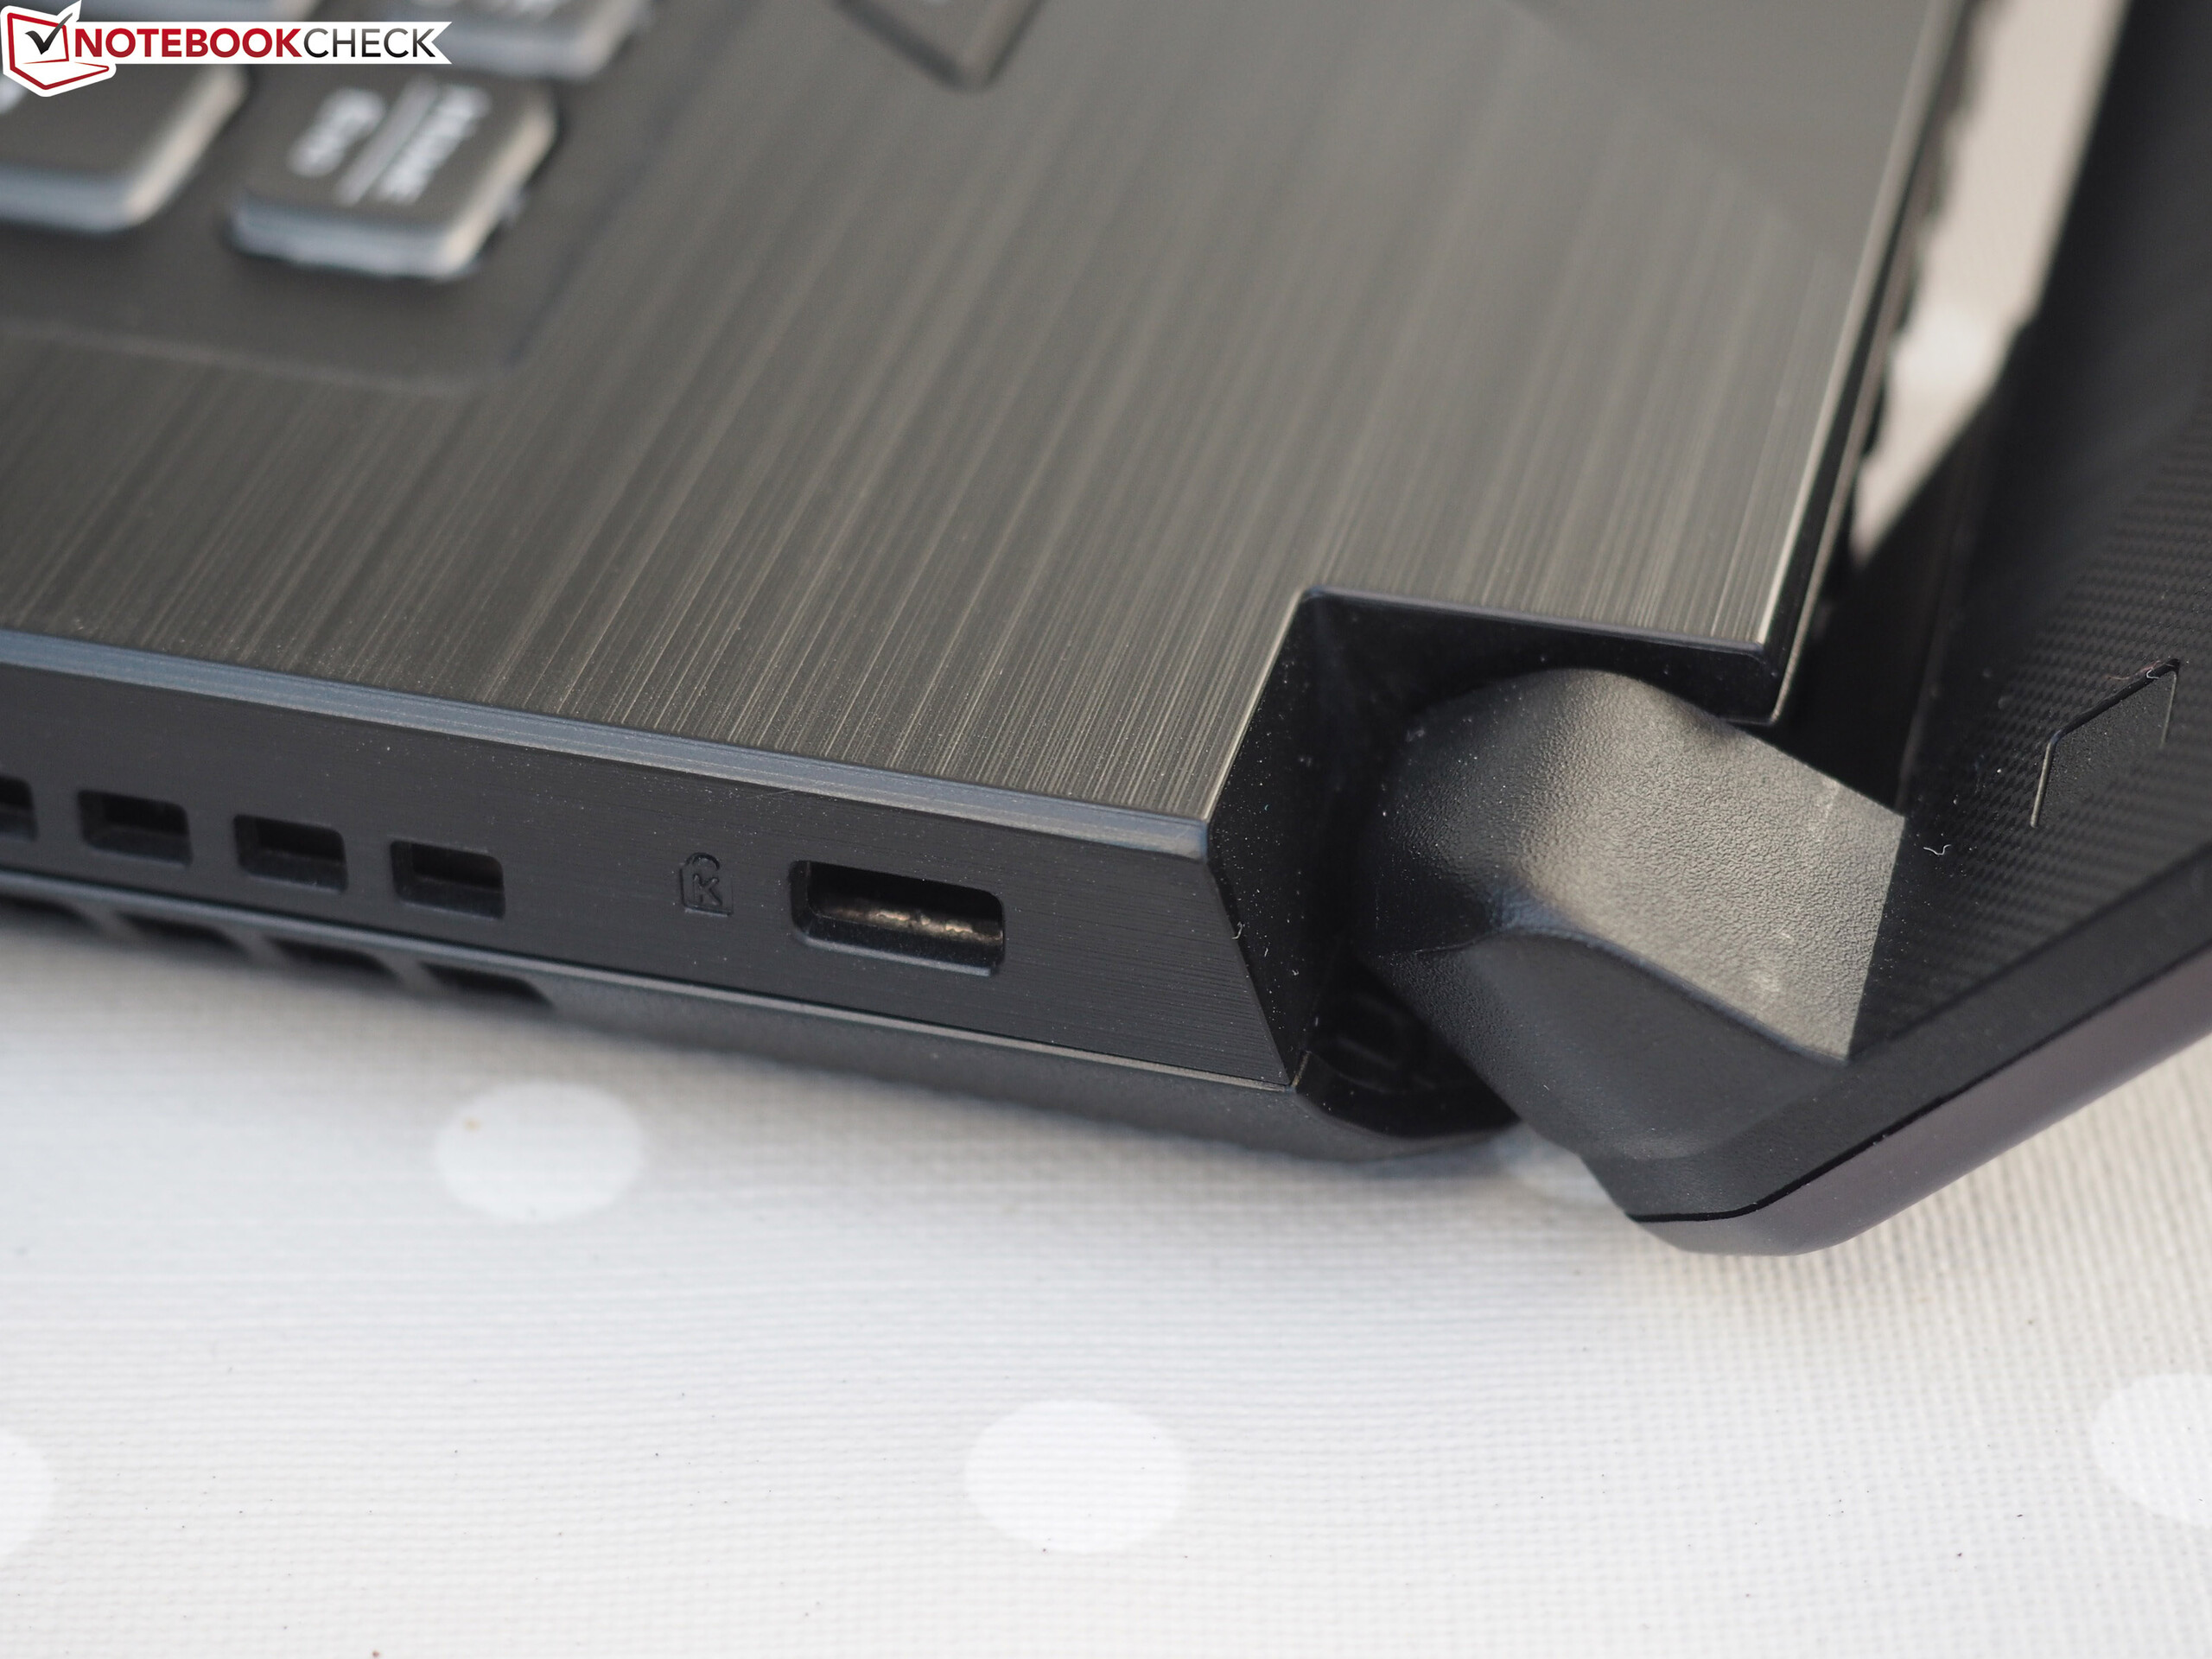
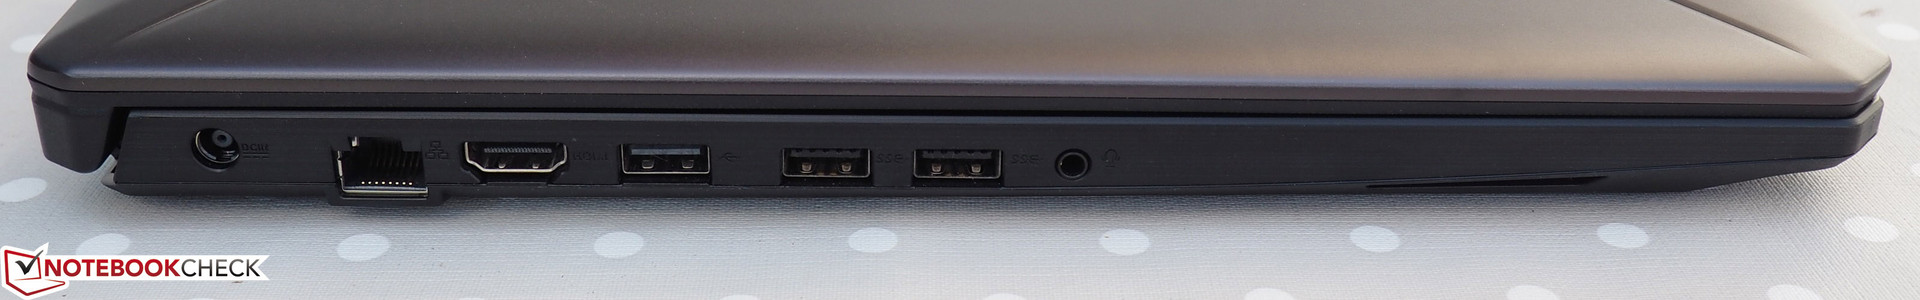
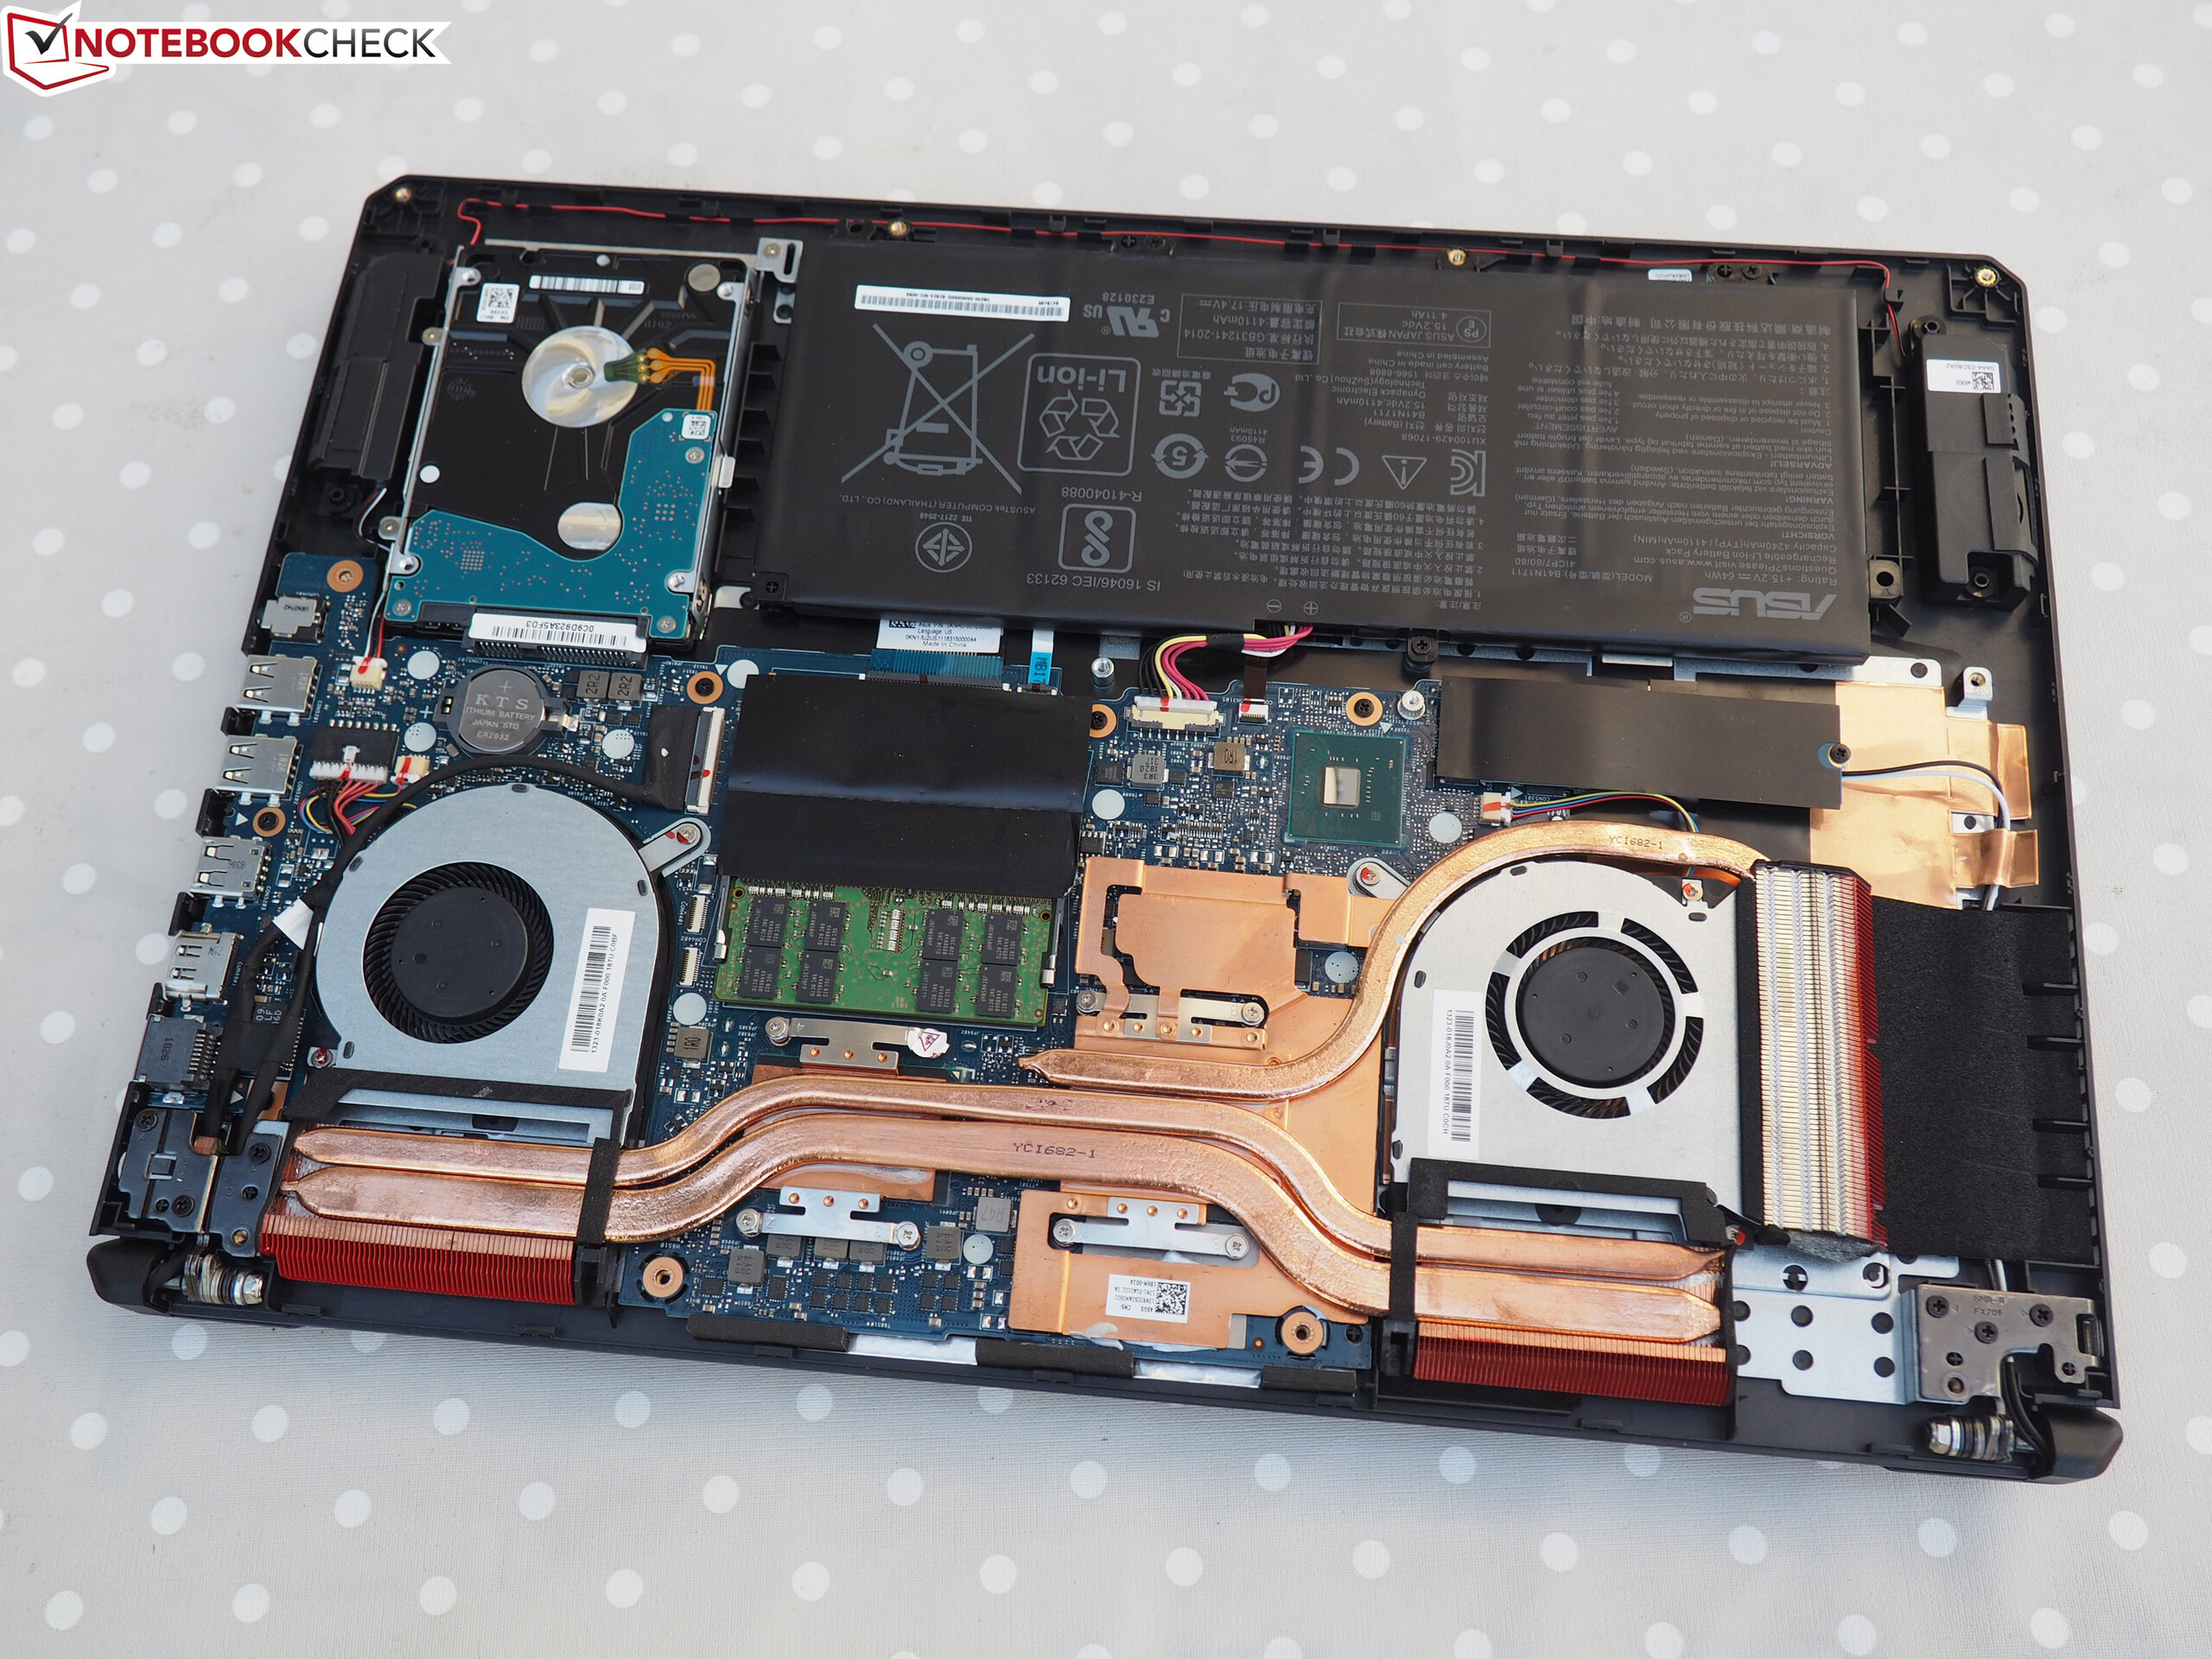
Bortsett från det magra portutbudet (ingen kortläsare, ingen Thunderbolt 3, ingen USB 3.1 Gen 2) och det medelmåttiga ljudet så är det inte mycket som saknas hos FX705. Denna modell på 17 tum med sin blixtsnabba 144 Hz-skärm med hög kontrast drivs av en sexkärnig processor och ett välpresterande GeForce GTX 1060.
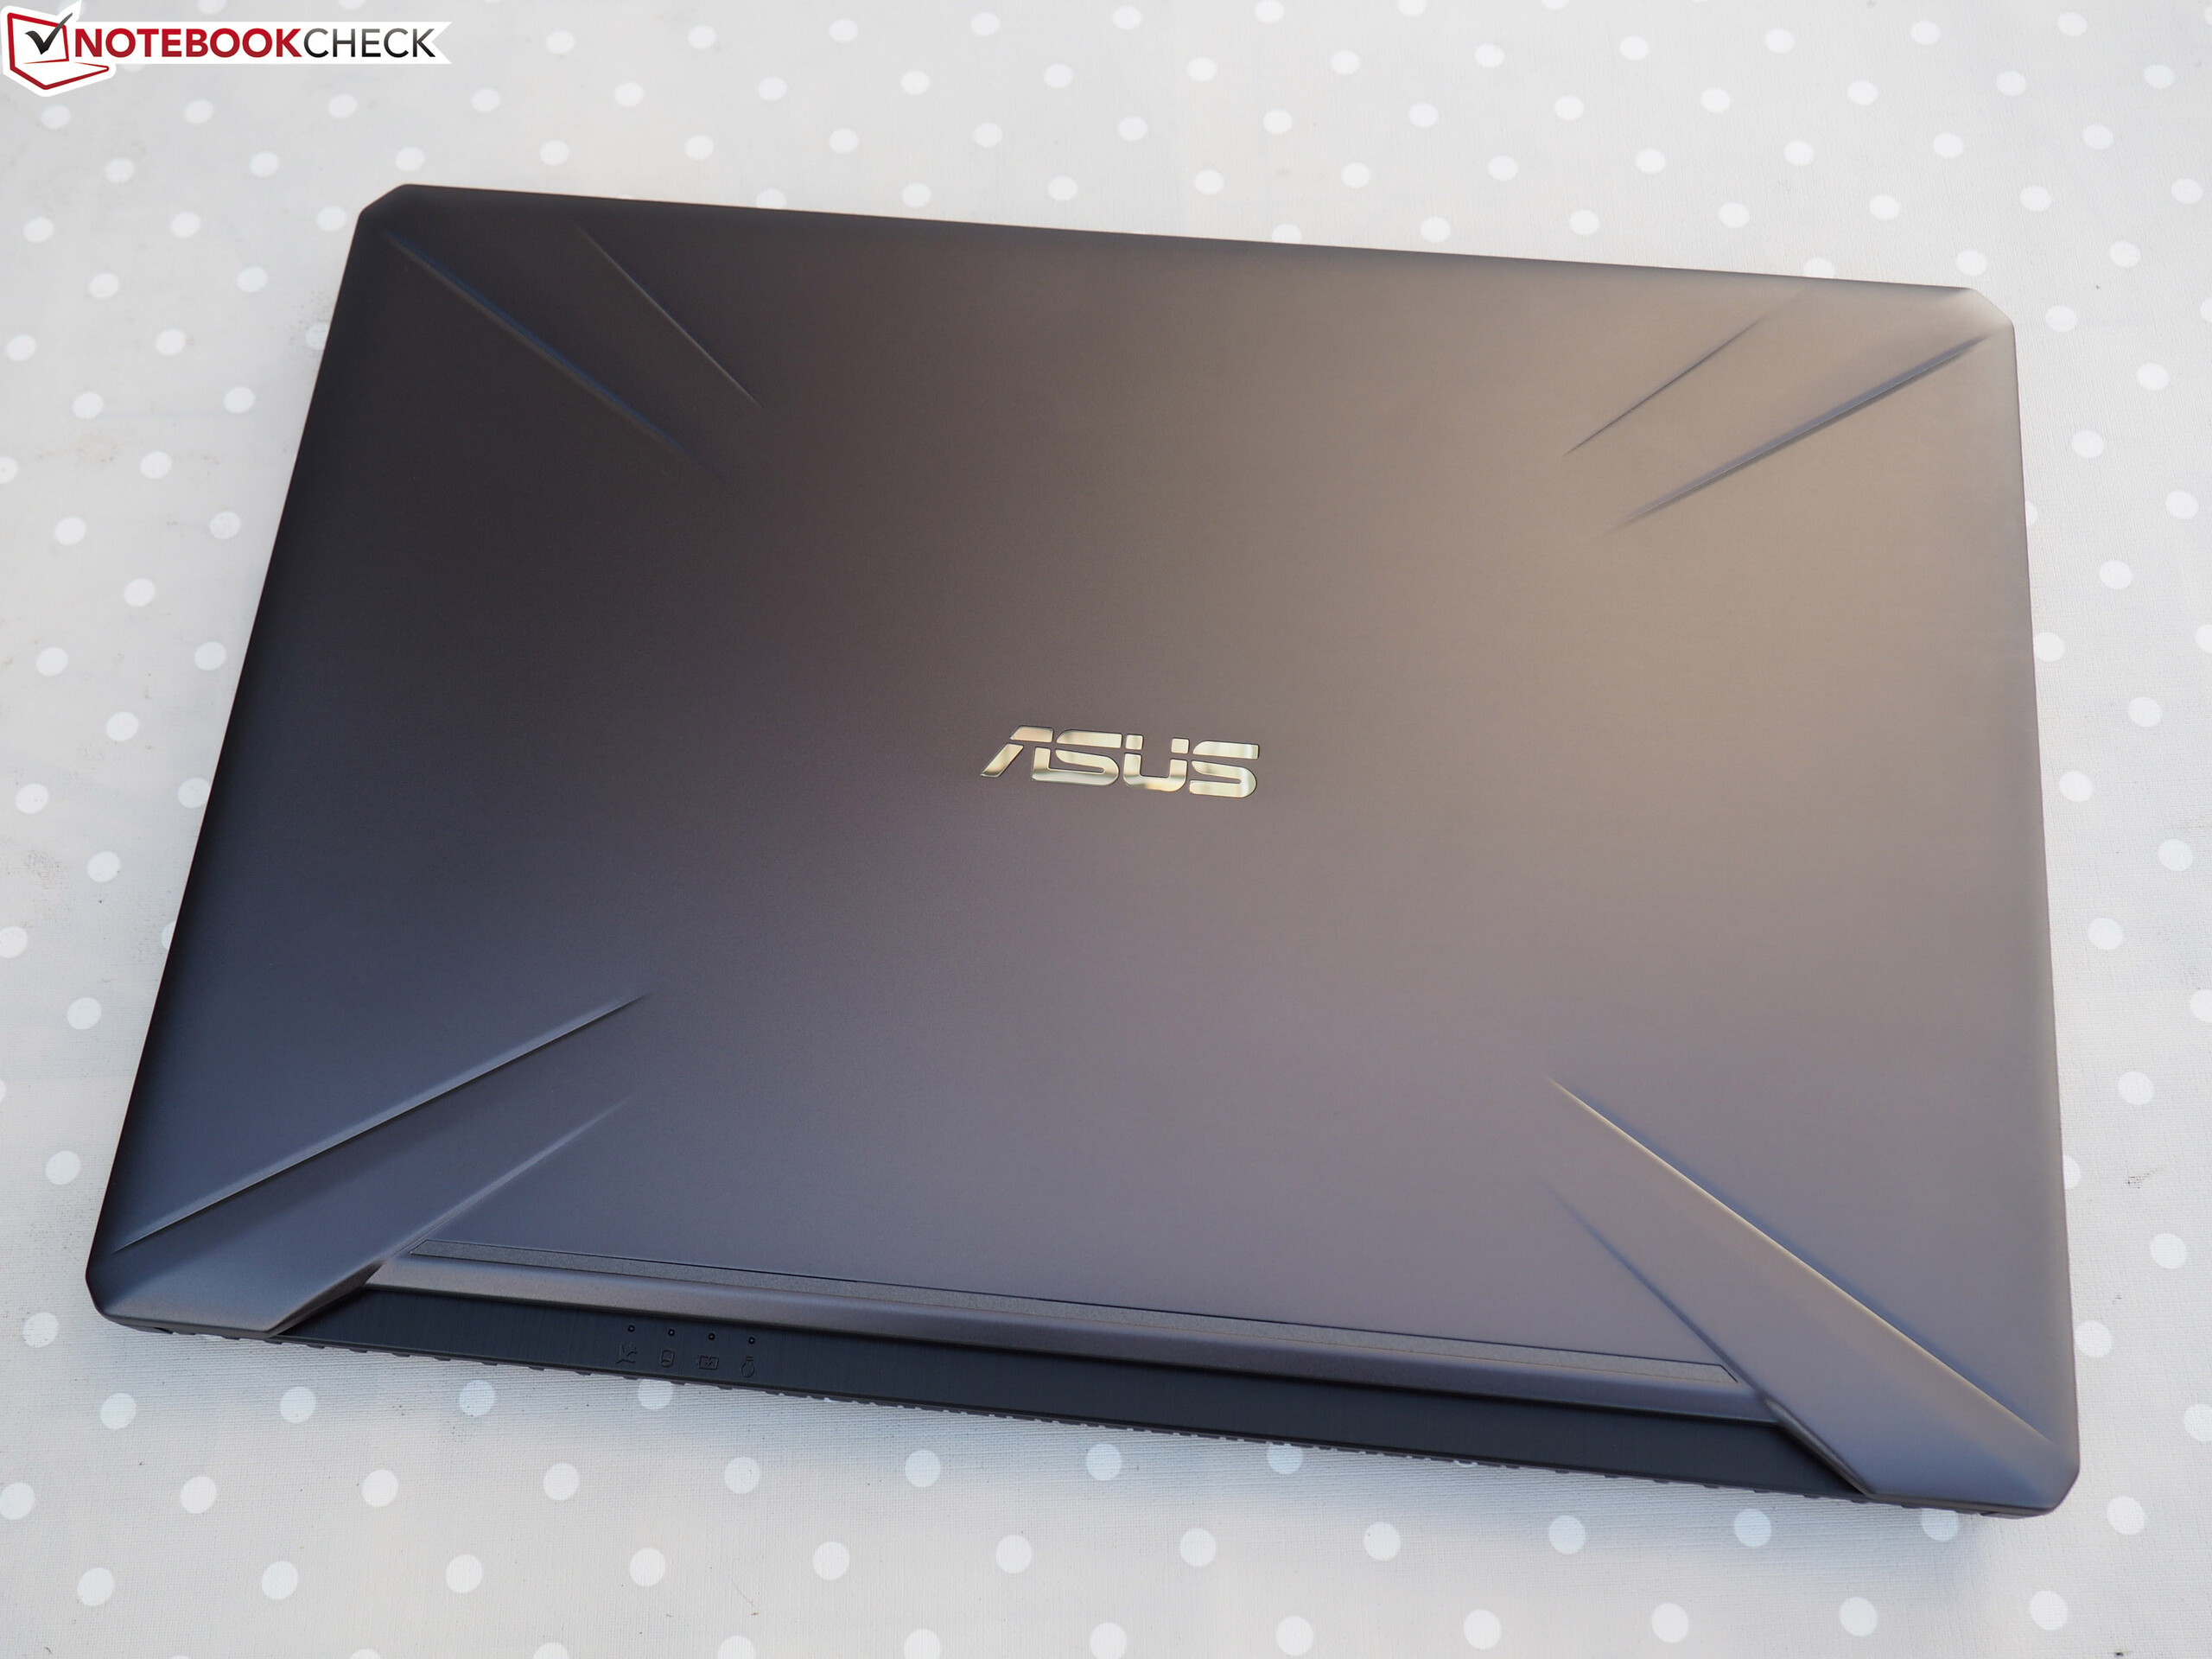
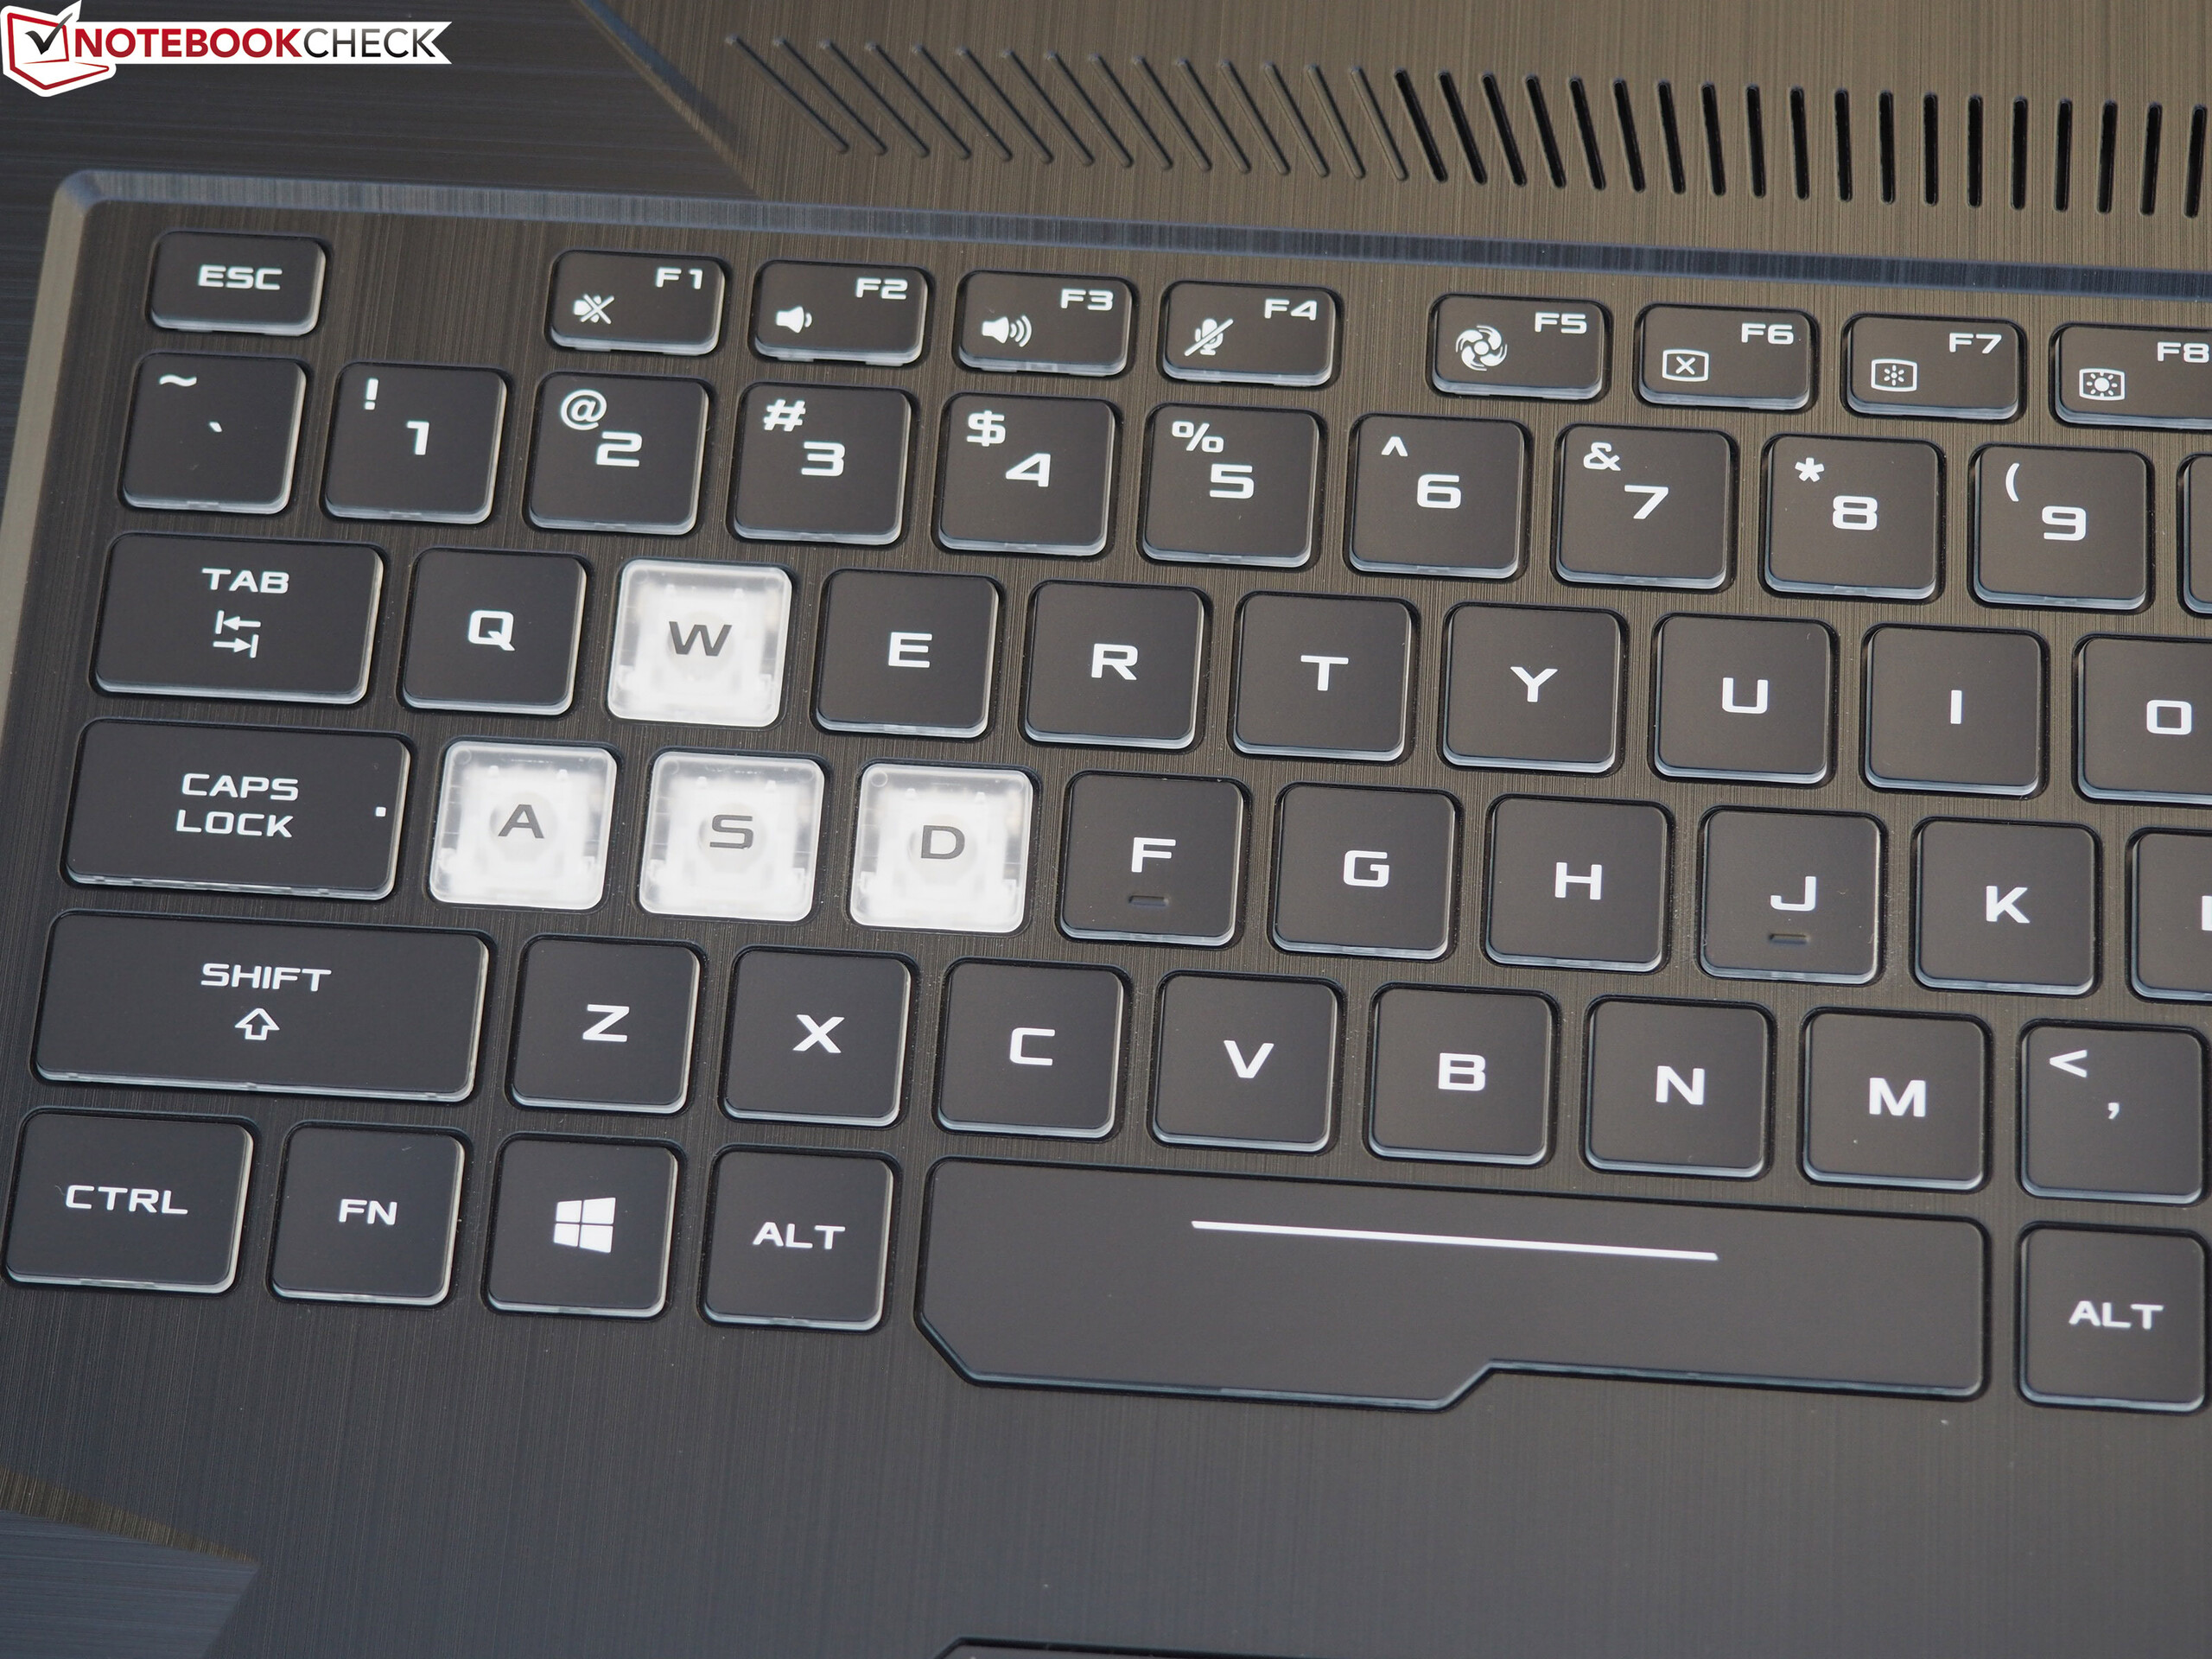
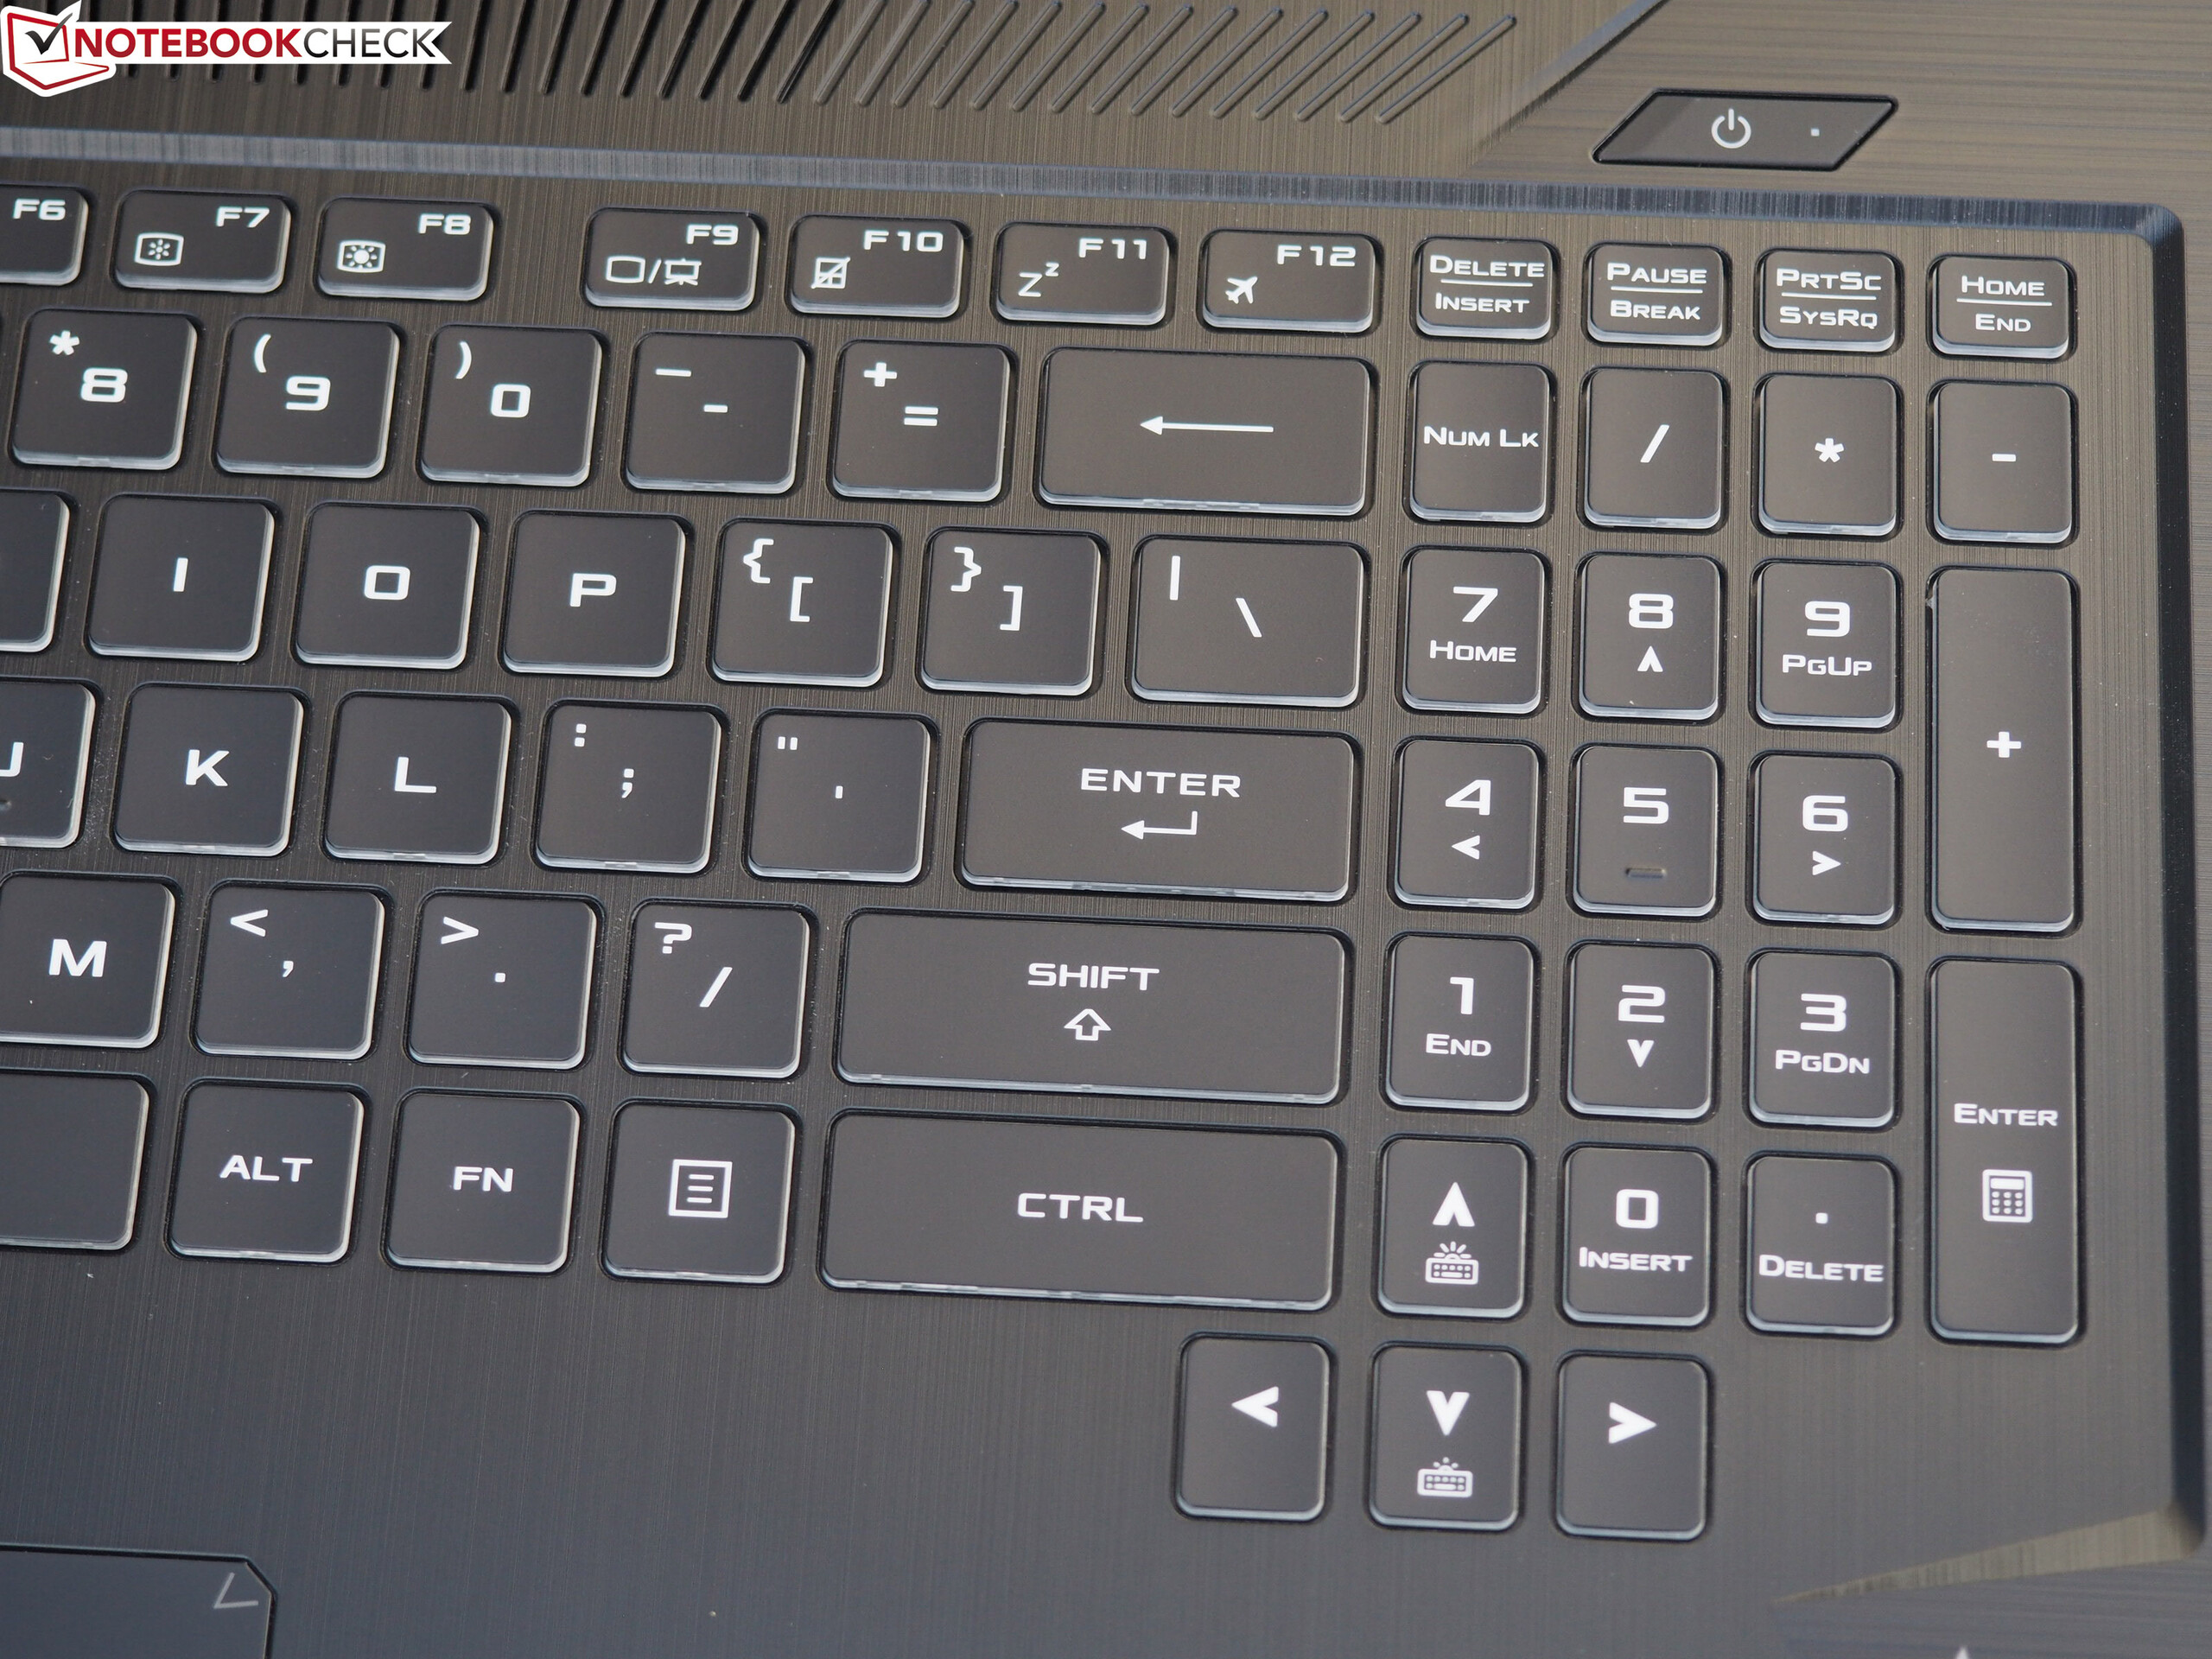
Höljet och batteritiden är heller inte så dåliga. Chassits kvalitet bör göra de flesta köpare nöjda. Dessutom kommer gamers vara glada över det RGB-belysta tangentbordet (Var försiktig: det finns två varianter av höljet med flera skillnader; se ovan).
Men det finns en hälsosam mängd konkurrens i 17-tumssektorn, såsom MSI GS73, Schenker XMG A707 och Acer Predator Helios 300. Även om de två sistnämnda modellerna hamnade en aning efter i fråga om poäng (82% istället för 83%) så har MSI fått aningen bättre poäng totalt.
Asus TUF FX705GM
- 10/19/2018 v6 (old)
Florian Glaser
Price comparison