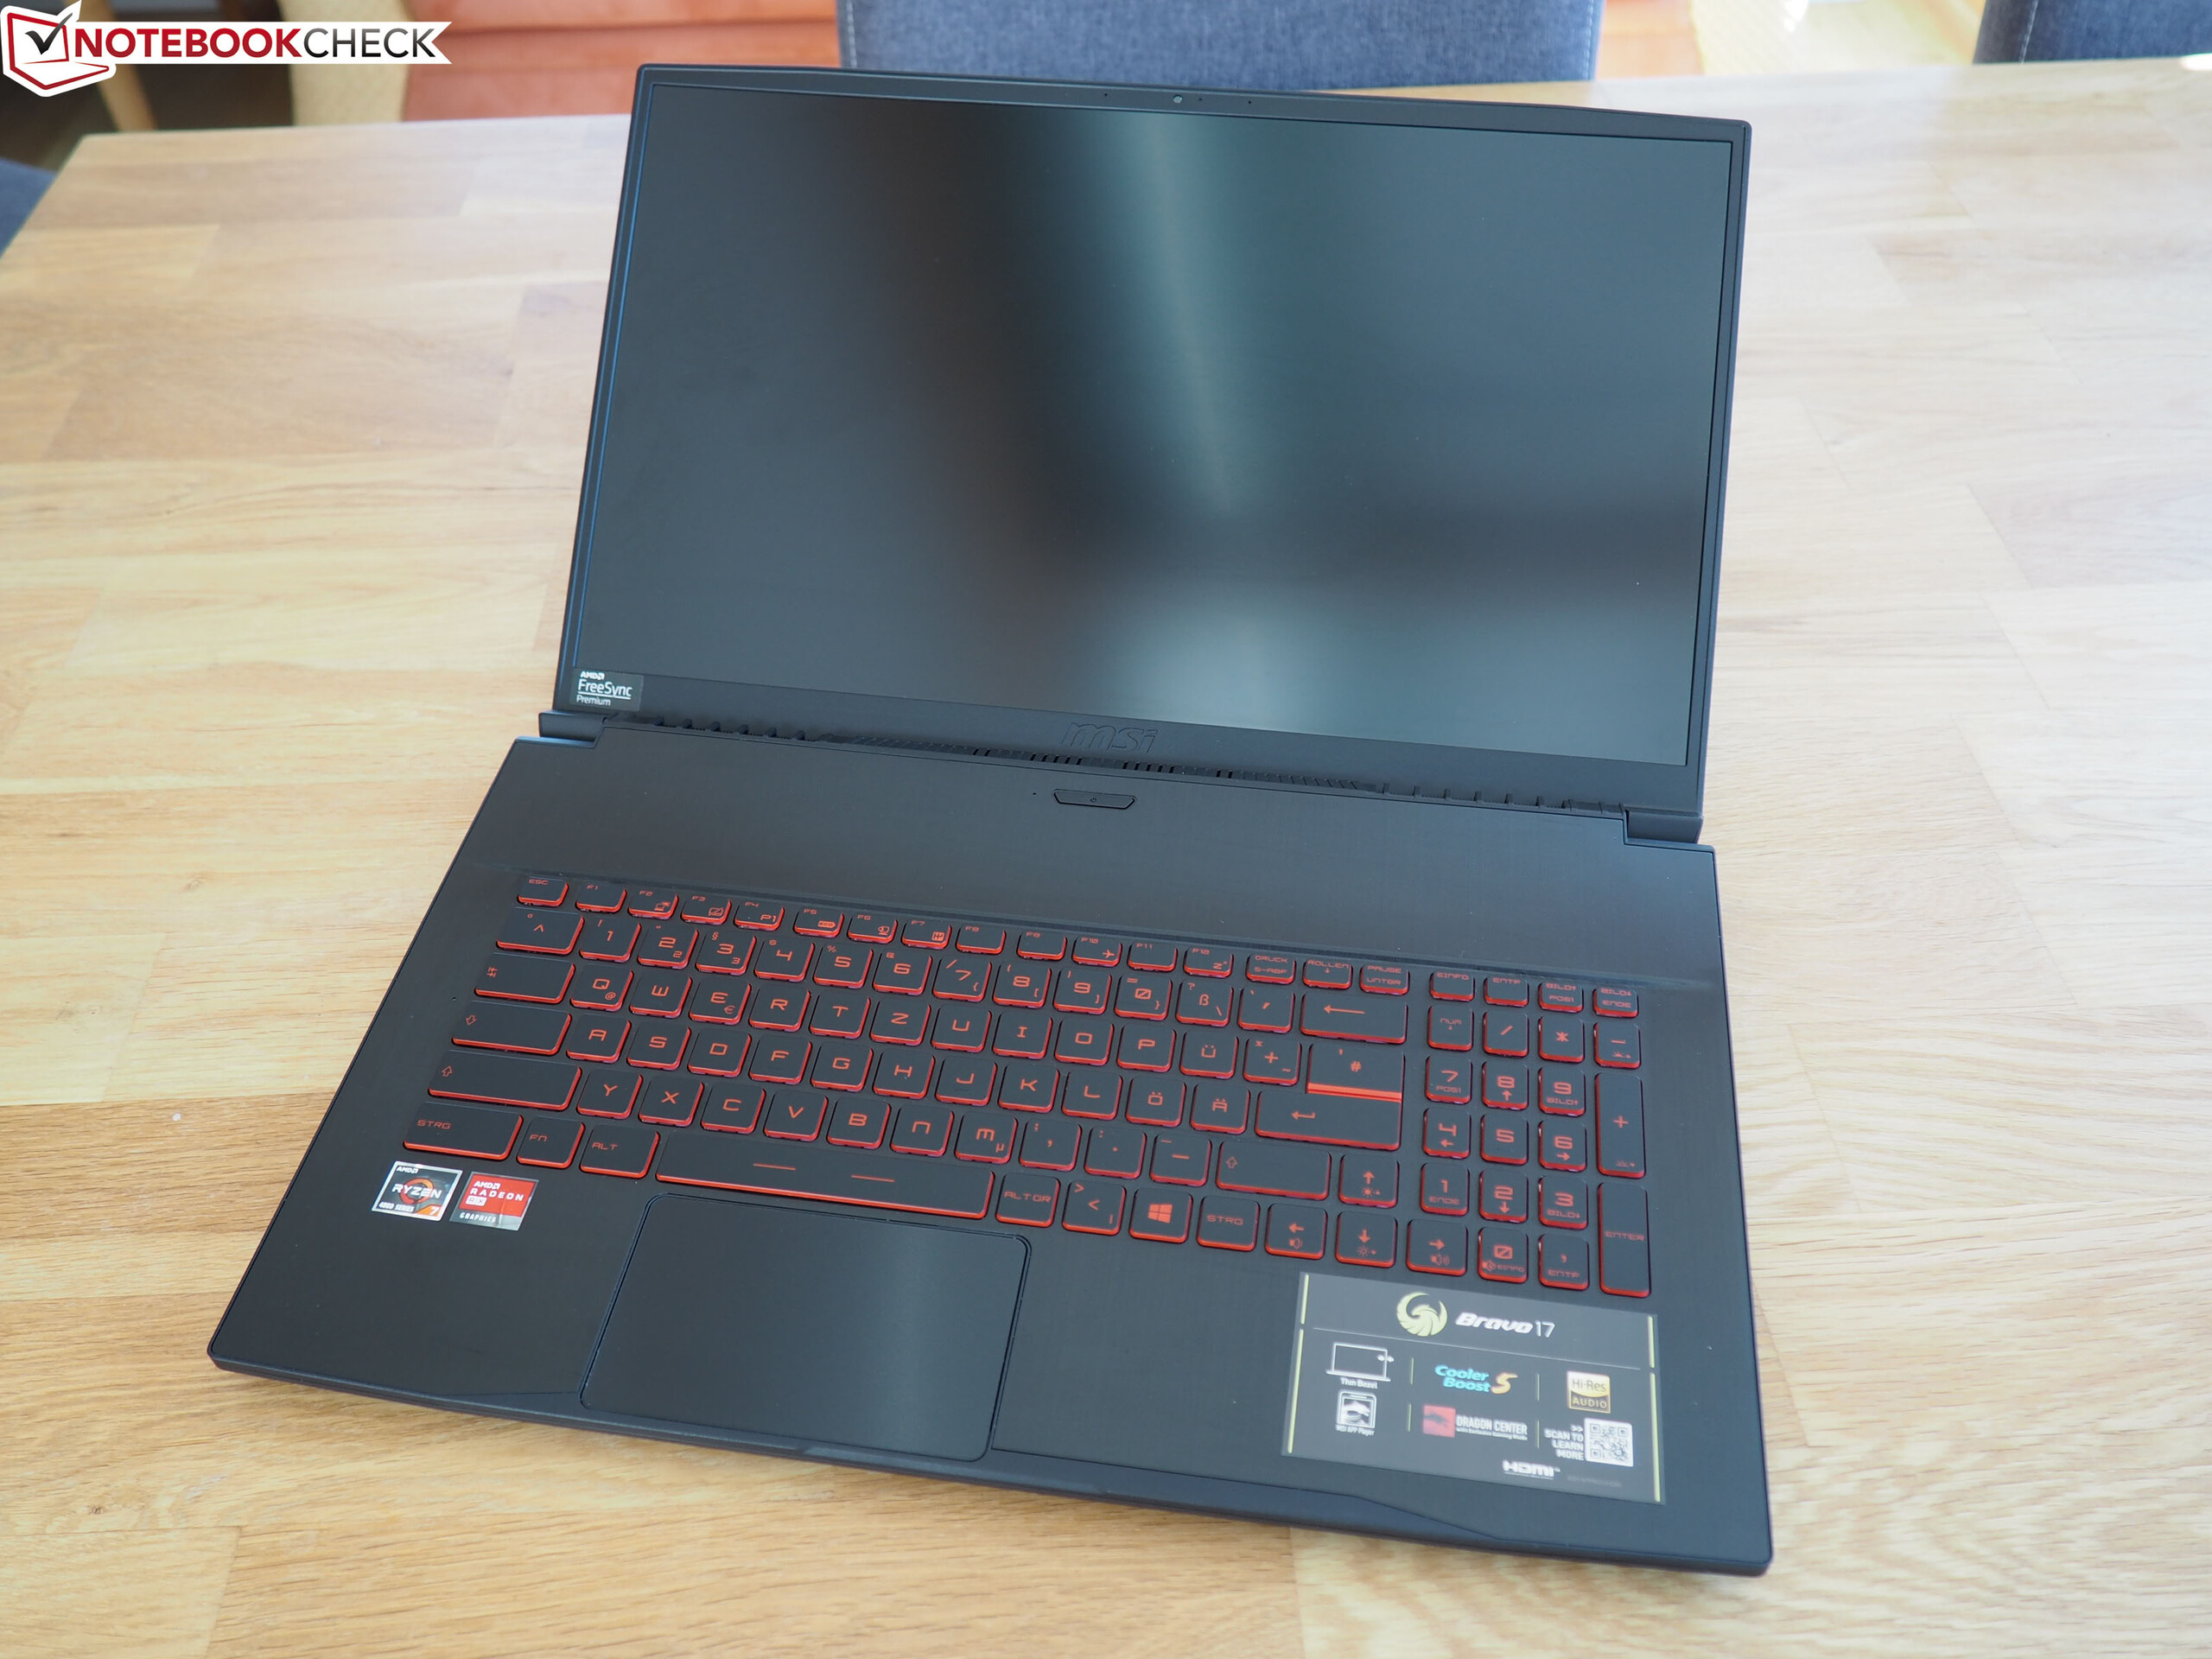
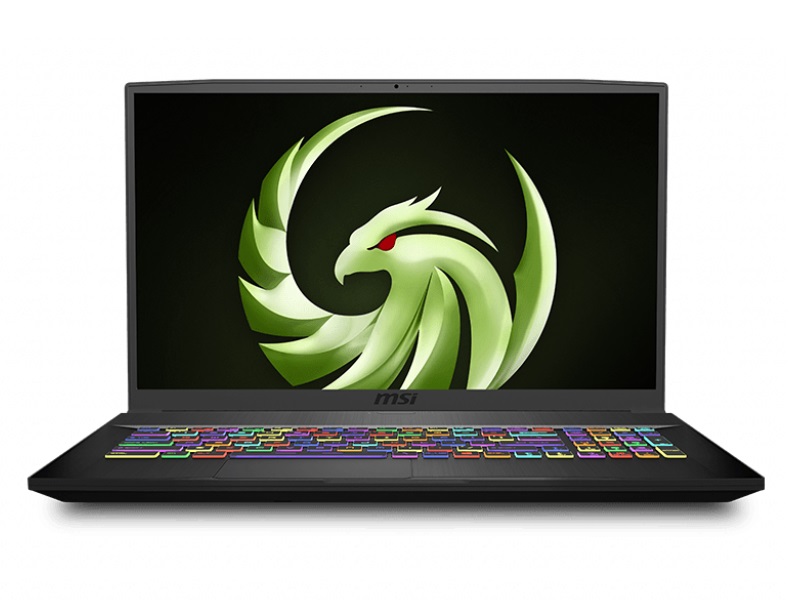
Test: MSI Bravo 17 - AMD-exklusiv spelmaskin (Sammanfattning)
Gradering | Datum | Modell | Vikt | Höjd | Storlek | Upplösning | Pris |
|---|---|---|---|---|---|---|---|
| 80.9 % v7 (old) | 07/2020 | MSI Bravo 17 A4DDR R7 4800H, Radeon RX 5500M | 2.2 kg | 23 mm | 17.30" | 1920x1080 | |
| 78.8 % v7 (old) | 02/2020 | MSI Alpha 15 A3DDK-034 R7 3750H, Radeon RX 5500M | 2.3 kg | 27.5 mm | 15.60" | 1920x1080 | |
| 78 % v7 (old) | MSI GF75 Thin 9SC i7-9750H, GeForce GTX 1650 Mobile | 2.3 kg | 23.1 mm | 17.30" | 1920x1080 | ||
| 77.8 % v7 (old) | 06/2019 | Asus TUF FX705DT-AU068T R5 3550H, GeForce GTX 1650 Mobile | 2.7 kg | 26.6 mm | 17.30" | 1920x1080 | |
| 82.9 % v7 (old) | 05/2020 | Asus TUF A17 FA706IU-AS76 R7 4800H, GeForce GTX 1660 Ti Mobile | 2.6 kg | 26 mm | 17.30" | 1920x1080 | |
| 82.3 % v7 (old) | 07/2019 | Lenovo Legion Y540-17IRH i5-9300H, GeForce GTX 1660 Ti Mobile | 2.8 kg | 26.3 mm | 17.30" | 1920x1080 |
| Networking | |
| iperf3 transmit AX12 | |
| MSI Bravo 17 A4DDR | |
| Lenovo Legion Y540-17IRH | |
| MSI GF75 Thin 9SC | |
| MSI Alpha 15 A3DDK-034 | |
| Asus TUF A17 FA706IU-AS76 | |
| Asus TUF FX705DT-AU068T | |
| iperf3 receive AX12 | |
| MSI Bravo 17 A4DDR | |
| Lenovo Legion Y540-17IRH | |
| MSI Alpha 15 A3DDK-034 | |
| MSI GF75 Thin 9SC | |
| Asus TUF A17 FA706IU-AS76 | |
| Asus TUF FX705DT-AU068T | |


| |||||||||||||||||||||||||
Distribution av ljusstyrkan: 88 %
Mitt på batteriet: 264 cd/m²
Kontrast: 1148:1 (Svärta: 0.23 cd/m²)
ΔE ColorChecker Calman: 3.85 | ∀{0.5-29.43 Ø4.72}
calibrated: 3.4
ΔE Greyscale Calman: 1.95 | ∀{0.09-98 Ø4.97}
60% sRGB (Argyll 1.6.3 3D)
42% AdobeRGB 1998 (Argyll 1.6.3 3D)
41.88% AdobeRGB 1998 (Argyll 3D)
60.1% sRGB (Argyll 3D)
40.54% Display P3 (Argyll 3D)
Gamma: 2.52
CCT: 6371 K
| MSI Bravo 17 A4DDR AU Optronics B173HAN04.7 (AUO479D), IPS, 1920x1080 | MSI Alpha 15 A3DDK-034 AU Optronics B156HAN08.0 (AUO80ED), IPS, 1920x1080 | MSI GF75 Thin 9SC AU Optronics B173HAN04.2, IPS, 1920x1080 | Asus TUF FX705DT-AU068T AU Optronics B173HAN04.2, IPS, 1920x1080 | Asus TUF A17 FA706IU-AS76 BOE NV173FHM-NX1, IPS, 1920x1080 | Lenovo Legion Y540-17IRH AU Optronics B173HAN04.4 (AUO449D), IPS, 1920x1080 | |
|---|---|---|---|---|---|---|
| Display | 58% | 52% | 51% | -0% | 68% | |
| Display P3 Coverage (%) | 40.54 | 66.4 64% | 62.5 54% | 62.3 54% | 40.55 0% | 69 70% |
| sRGB Coverage (%) | 60.1 | 91 51% | 90 50% | 89.1 48% | 59.7 -1% | 98.3 64% |
| AdobeRGB 1998 Coverage (%) | 41.88 | 66.6 59% | 64 53% | 63.7 52% | 41.89 0% | 70.7 69% |
| Response Times | 74% | 6% | -2% | 40% | 56% | |
| Response Time Grey 50% / Grey 80% * (ms) | 40 ? | 7 ? 82% | 34 ? 15% | 41 ? -2% | 22.4 ? 44% | 18 ? 55% |
| Response Time Black / White * (ms) | 29.6 ? | 10.4 ? 65% | 30.4 ? -3% | 30 ? -1% | 19.2 ? 35% | 12.8 ? 57% |
| PWM Frequency (Hz) | ||||||
| Screen | -2% | 9% | 7% | -18% | 13% | |
| Brightness middle (cd/m²) | 264 | 310 17% | 344.7 31% | 316 20% | 264.8 0% | 286 8% |
| Brightness (cd/m²) | 244 | 310 27% | 332 36% | 294 20% | 253 4% | 282 16% |
| Brightness Distribution (%) | 88 | 86 -2% | 91 3% | 84 -5% | 90 2% | 87 -1% |
| Black Level * (cd/m²) | 0.23 | 0.29 -26% | 0.3 -30% | 0.32 -39% | 0.31 -35% | 0.19 17% |
| Contrast (:1) | 1148 | 1069 -7% | 1149 0% | 988 -14% | 854 -26% | 1505 31% |
| Colorchecker dE 2000 * | 3.85 | 4.78 -24% | 3.08 20% | 3.39 12% | 4.73 -23% | 3.57 7% |
| Colorchecker dE 2000 max. * | 9.13 | 8.1 11% | 6.32 31% | 5.56 39% | 18.89 -107% | 7.5 18% |
| Colorchecker dE 2000 calibrated * | 3.4 | 2.36 31% | 2.94 14% | 2.14 37% | 4.64 -36% | 1.31 61% |
| Greyscale dE 2000 * | 1.95 | 4.78 -145% | 3.8 -95% | 3.17 -63% | 1.4 28% | 4.51 -131% |
| Gamma | 2.52 87% | 2.43 91% | 2.17 101% | 2.39 92% | 2.16 102% | 2.36 93% |
| CCT | 6371 102% | 7739 84% | 7284 89% | 7098 92% | 6641 98% | 7411 88% |
| Color Space (Percent of AdobeRGB 1998) (%) | 42 | 59 40% | 58 38% | 51 21% | 38.4 -9% | 64 52% |
| Color Space (Percent of sRGB) (%) | 60 | 91 52% | 89.6 49% | 89 48% | 59.3 -1% | 98 63% |
| Totalt genomsnitt (program/inställningar) | 43% /
18% | 22% /
17% | 19% /
14% | 7% /
-8% | 46% /
29% |
* ... mindre är bättre
Visa svarstider
| ↔ Svarstid svart till vitt | ||
|---|---|---|
| 29.6 ms ... stiga ↗ och falla ↘ kombinerat | ↗ 16.4 ms stiga | 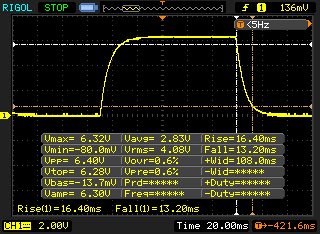 |
| ↘ 13.2 ms hösten | ||
| Skärmen visar relativt långsamma svarsfrekvenser i våra tester och kan vara för långsam för spelare. I jämförelse sträcker sig alla testade enheter från 0.1 (minst) till 240 (maximalt) ms. » 79 % av alla enheter är bättre. Detta innebär att den uppmätta svarstiden är sämre än genomsnittet av alla testade enheter (19.8 ms). | ||
| ↔ Svarstid 50 % grått till 80 % grått | ||
| 40 ms ... stiga ↗ och falla ↘ kombinerat | ↗ 19.2 ms stiga | 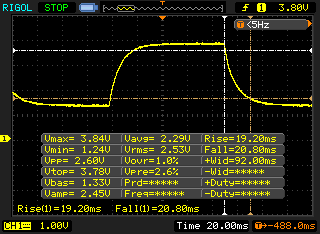 |
| ↘ 20.8 ms hösten | ||
| Skärmen visar långsamma svarsfrekvenser i våra tester och kommer att vara otillfredsställande för spelare. I jämförelse sträcker sig alla testade enheter från 0.165 (minst) till 636 (maximalt) ms. » 61 % av alla enheter är bättre. Detta innebär att den uppmätta svarstiden är sämre än genomsnittet av alla testade enheter (31 ms). | ||
Skärmflimmer / PWM (Puls-Width Modulation)
| Skärmflimmer / PWM upptäcktes inte | 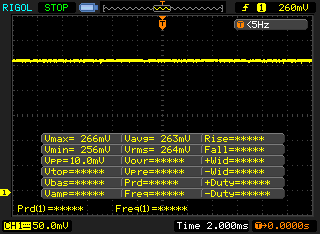 | ||
Som jämförelse: 52 % av alla testade enheter använder inte PWM för att dämpa skärmen. Om PWM upptäcktes mättes ett medelvärde av 7769 (minst: 5 - maximum: 343500) Hz. | |||
| Cinebench R15 | |
| CPU Single 64Bit | |
| MSI GF75 Thin 9SC | |
| Asus TUF A17 FA706IU-AS76 | |
| MSI Bravo 17 A4DDR | |
| Lenovo Legion Y540-17IRH | |
| Asus TUF FX705DT-AU068T | |
| MSI Alpha 15 A3DDK-034 | |
| CPU Multi 64Bit | |
| MSI Bravo 17 A4DDR | |
| Asus TUF A17 FA706IU-AS76 | |
| MSI GF75 Thin 9SC | |
| Lenovo Legion Y540-17IRH | |
| Asus TUF FX705DT-AU068T | |
| MSI Alpha 15 A3DDK-034 | |
| Blender - v2.79 BMW27 CPU | |
| Asus TUF A17 FA706IU-AS76 | |
| MSI Bravo 17 A4DDR | |
| 7-Zip 18.03 | |
| 7z b 4 -mmt1 | |
| Asus TUF A17 FA706IU-AS76 | |
| MSI Bravo 17 A4DDR | |
| 7z b 4 | |
| MSI Bravo 17 A4DDR | |
| Asus TUF A17 FA706IU-AS76 | |
| Geekbench 5.5 | |
| Single-Core | |
| MSI Bravo 17 A4DDR | |
| Asus TUF A17 FA706IU-AS76 | |
| MSI Alpha 15 A3DDK-034 | |
| Multi-Core | |
| MSI Bravo 17 A4DDR | |
| Asus TUF A17 FA706IU-AS76 | |
| MSI Alpha 15 A3DDK-034 | |
| HWBOT x265 Benchmark v2.2 - 4k Preset | |
| MSI Bravo 17 A4DDR | |
| Asus TUF A17 FA706IU-AS76 | |
| LibreOffice - 20 Documents To PDF | |
| MSI Bravo 17 A4DDR | |
| Asus TUF A17 FA706IU-AS76 | |
| R Benchmark 2.5 - Overall mean | |
| Asus TUF A17 FA706IU-AS76 | |
| MSI Bravo 17 A4DDR | |
* ... mindre är bättre
| PCMark 10 - Score | |
| MSI Bravo 17 A4DDR | |
| Asus TUF A17 FA706IU-AS76 | |
| Lenovo Legion Y540-17IRH | |
| MSI GF75 Thin 9SC | |
| MSI Alpha 15 A3DDK-034 | |
| Asus TUF FX705DT-AU068T | |
| DPC Latencies / LatencyMon - interrupt to process latency (max), Web, Youtube, Prime95 | |
| Asus TUF A17 FA706IU-AS76 | |
| MSI Bravo 17 A4DDR | |
* ... mindre är bättre
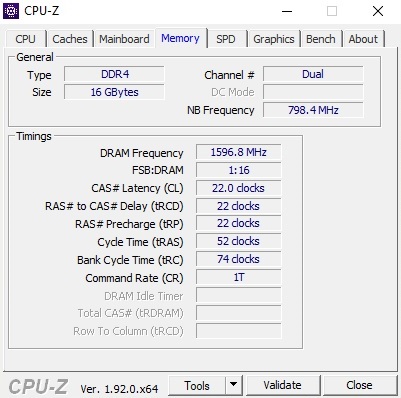
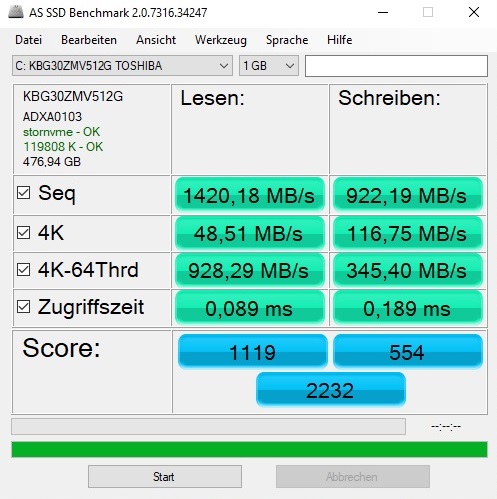
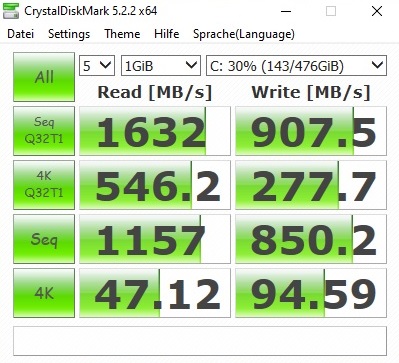
| MSI Bravo 17 A4DDR Toshiba KBG30ZMV512G | MSI Alpha 15 A3DDK-034 Kingston RBUSNS8154P3512GJ | MSI GF75 Thin 9SC Crucial P1 SSD CT1000P1SSD8 | Asus TUF FX705DT-AU068T WDC PC SN520 SDAPNUW-256G | Asus TUF A17 FA706IU-AS76 Intel SSD 660p 1TB SSDPEKNW010T8 | Lenovo Legion Y540-17IRH WDC PC SN520 SDAPNUW-512G | |
|---|---|---|---|---|---|---|
| CrystalDiskMark 5.2 / 6 | -1% | 43% | 15% | 56% | 8% | |
| Write 4K (MB/s) | 94.6 | 105.4 11% | 133 41% | 145 53% | 189.7 101% | 105.1 11% |
| Read 4K (MB/s) | 47.12 | 33.24 -29% | 55.6 18% | 45.28 -4% | 62.3 32% | 34.41 -27% |
| Write Seq (MB/s) | 850 | 1029 21% | 1623 91% | 1301 53% | 1681 98% | 1298 53% |
| Read Seq (MB/s) | 1157 | 1098 -5% | 1386 20% | 1362 18% | 1608 39% | 1099 -5% |
| Write 4K Q32T1 (MB/s) | 277.7 | 322.1 16% | 501 80% | 249.1 -10% | 468.6 69% | 335.7 21% |
| Read 4K Q32T1 (MB/s) | 546 | 352 -36% | 584 7% | 342.1 -37% | 541 -1% | 231.4 -58% |
| Write Seq Q32T1 (MB/s) | 908 | 1036 14% | 1696 87% | 1301 43% | 1770 95% | 1454 60% |
| Read Seq Q32T1 (MB/s) | 1632 | 1606 -2% | 1572 -4% | 1732 6% | 1898 16% | 1740 7% |

Kontinuerlig inläsning: DiskSpd Read Loop, Queue Depth 8
| 3DMark | |
| 1920x1080 Fire Strike Graphics | |
| Asus TUF A17 FA706IU-AS76 | |
| Lenovo Legion Y540-17IRH | |
| MSI Bravo 17 A4DDR | |
| MSI Alpha 15 A3DDK-034 | |
| MSI GF75 Thin 9SC | |
| Asus TUF FX705DT-AU068T | |
| 2560x1440 Time Spy Graphics | |
| Asus TUF A17 FA706IU-AS76 | |
| Lenovo Legion Y540-17IRH | |
| MSI Bravo 17 A4DDR | |
| MSI Alpha 15 A3DDK-034 | |
| Asus TUF FX705DT-AU068T | |
| MSI GF75 Thin 9SC | |
| 3DMark 11 - 1280x720 Performance GPU | |
| Asus TUF A17 FA706IU-AS76 | |
| Lenovo Legion Y540-17IRH | |
| MSI Bravo 17 A4DDR | |
| MSI Alpha 15 A3DDK-034 | |
| Asus TUF FX705DT-AU068T | |
| MSI GF75 Thin 9SC | |
| 3DMark 11 Performance | 16271 poäng | |
| 3DMark Cloud Gate Standard Score | 39492 poäng | |
| 3DMark Fire Strike Score | 11461 poäng | |
| 3DMark Time Spy Score | 4712 poäng | |
Hjälp | ||
| The Witcher 3 | |
| 1920x1080 High Graphics & Postprocessing (Nvidia HairWorks Off) | |
| Lenovo Legion Y540-17IRH | |
| Asus TUF A17 FA706IU-AS76 | |
| MSI Alpha 15 A3DDK-034 | |
| MSI Bravo 17 A4DDR | |
| MSI GF75 Thin 9SC | |
| Asus TUF FX705DT-AU068T | |
| 1920x1080 Ultra Graphics & Postprocessing (HBAO+) | |
| Asus TUF A17 FA706IU-AS76 | |
| Lenovo Legion Y540-17IRH | |
| MSI Bravo 17 A4DDR | |
| MSI Alpha 15 A3DDK-034 | |
| MSI GF75 Thin 9SC | |
| Asus TUF FX705DT-AU068T | |
| låg | med. | hög | ultra | |
|---|---|---|---|---|
| GTA V (2015) | 168 | 104 | 53.1 | |
| The Witcher 3 (2015) | 72 | 45.4 | ||
| Dota 2 Reborn (2015) | 120 | 113 | 106 | 103 |
| X-Plane 11.11 (2018) | 49.4 | 37.9 | 34.1 | |
| Shadow of the Tomb Raider (2018) | 65 | 54 | ||
| Battlefield V (2018) | 93 | 88.2 | ||
| Borderlands 3 (2019) | 47.9 | 35.9 | ||
| Escape from Tarkov (2020) | 81.5 | 64.5 | ||
| Hunt Showdown (2020) | 56.5 | |||
| Doom Eternal (2020) | 0 | 0 | ||
| Gears Tactics (2020) | 78.5 | 55.1 |
Ljudnivå
| Låg belastning |
| 33 / 34 / 35 dB(A) |
| Hög belastning |
| 39 / 52 dB(A) |
 | ||
30 dB tyst 40 dB(A) hörbar 50 dB(A) högt ljud |
||
min: | ||
| MSI Bravo 17 A4DDR R7 4800H, Radeon RX 5500M | MSI Alpha 15 A3DDK-034 R7 3750H, Radeon RX 5500M | MSI GF75 Thin 9SC i7-9750H, GeForce GTX 1650 Mobile | Asus TUF FX705DT-AU068T R5 3550H, GeForce GTX 1650 Mobile | Asus TUF A17 FA706IU-AS76 R7 4800H, GeForce GTX 1660 Ti Mobile | Lenovo Legion Y540-17IRH i5-9300H, GeForce GTX 1660 Ti Mobile | |
|---|---|---|---|---|---|---|
| Noise | -13% | 6% | 6% | 3% | 0% | |
| av / miljö * (dB) | 30 | 29 3% | 28.2 6% | 30.8 -3% | 28.7 4% | 30 -0% |
| Idle Minimum * (dB) | 33 | 36 -9% | 33.6 -2% | 30.8 7% | 28.7 13% | 30 9% |
| Idle Average * (dB) | 34 | 37 -9% | 33.6 1% | 30.8 9% | 30.5 10% | 32 6% |
| Idle Maximum * (dB) | 35 | 46 -31% | 33.8 3% | 32.2 8% | 32.5 7% | 34 3% |
| Load Average * (dB) | 39 | 50 -28% | 37.2 5% | 38.6 1% | 42.5 -9% | 44 -13% |
| Witcher 3 ultra * (dB) | 48 | 51 -6% | 40.6 15% | 50.1 -4% | 50 -4% | |
| Load Maximum * (dB) | 52 | 57 -10% | 44.4 15% | 44.8 14% | 53.4 -3% | 52 -0% |
* ... mindre är bättre
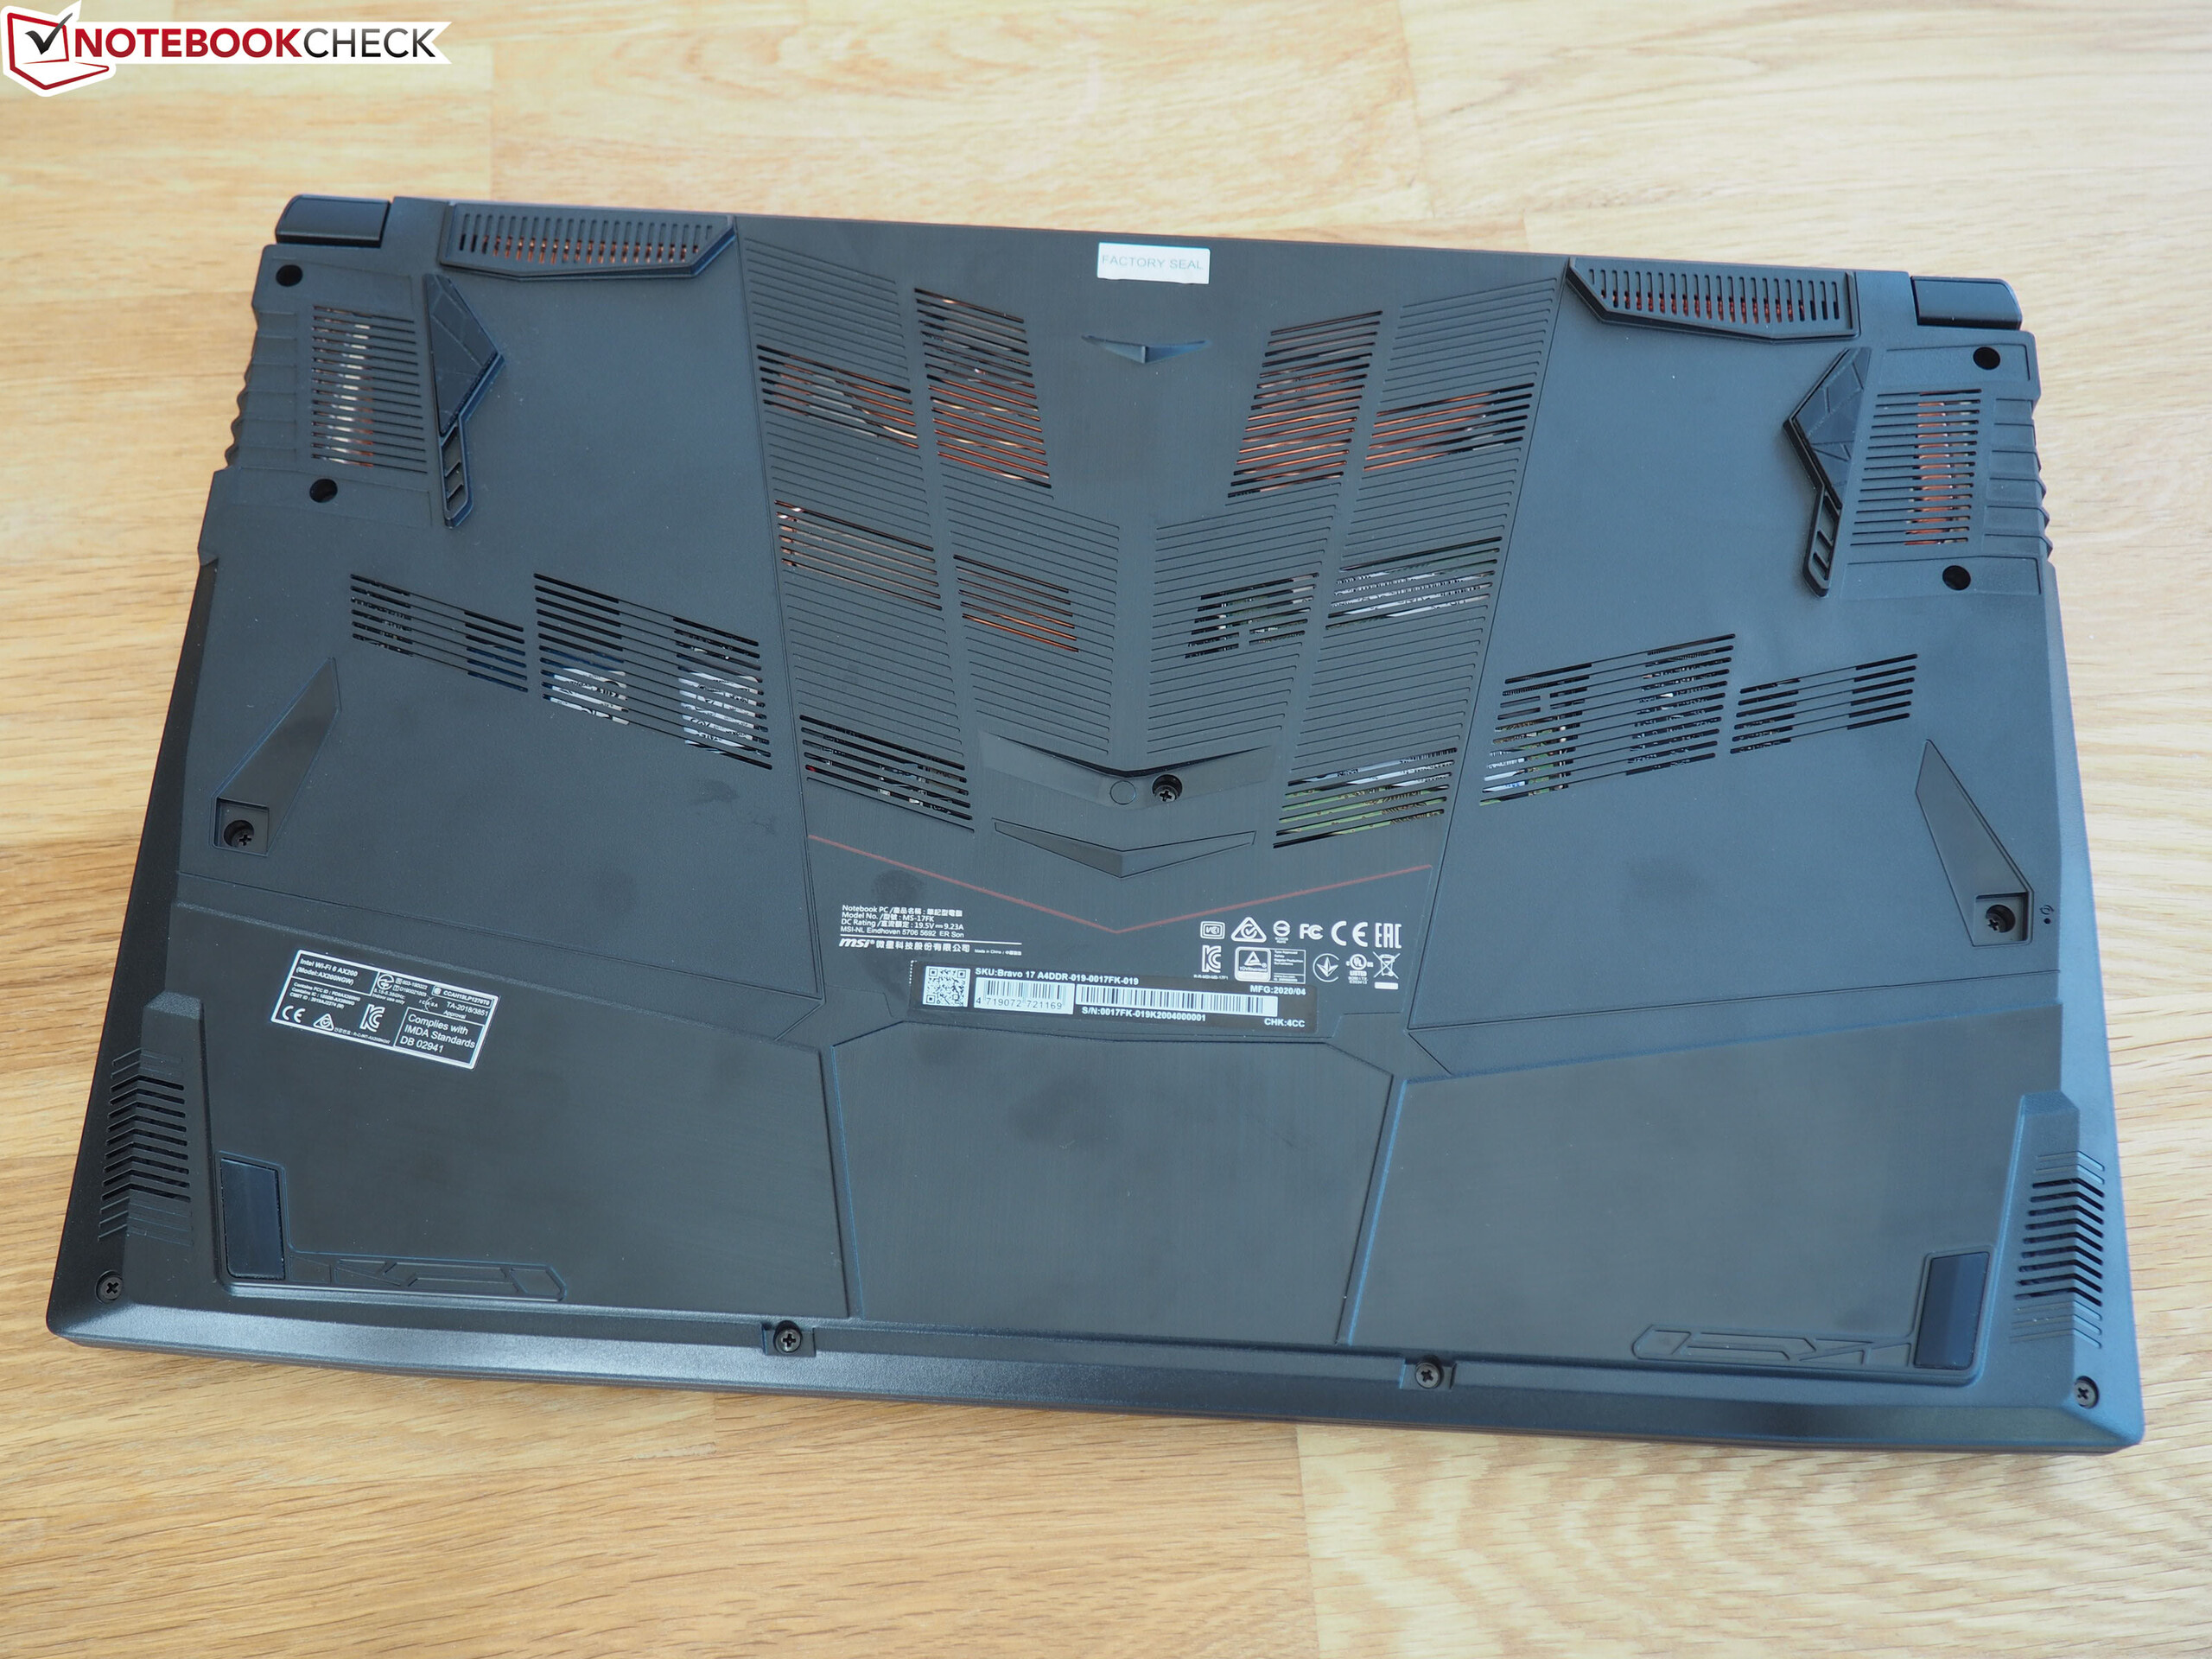
(-) Den maximala temperaturen på ovansidan är 48 °C / 118 F, jämfört med genomsnittet av 40.4 °C / 105 F , allt från 21.2 till 68.8 °C för klassen Gaming.
(-) Botten värms upp till maximalt 50 °C / 122 F, jämfört med genomsnittet av 43.2 °C / 110 F
(+) Vid tomgångsbruk är medeltemperaturen för ovansidan 24 °C / 75 F, jämfört med enhetsgenomsnittet på 33.9 °C / ### class_avg_f### F.
(-) När du spelar The Witcher 3 är medeltemperaturen för ovansidan 40.3 °C / 105 F, jämfört med enhetsgenomsnittet på 33.9 °C / ## #class_avg_f### F.
(+) Handledsstöden och pekplattan når maximal hudtemperatur (33 °C / 91.4 F) och är därför inte varma.
(-) Medeltemperaturen för handledsstödsområdet på liknande enheter var 28.8 °C / 83.8 F (-4.2 °C / -7.6 F).
| MSI Bravo 17 A4DDR R7 4800H, Radeon RX 5500M | MSI Alpha 15 A3DDK-034 R7 3750H, Radeon RX 5500M | MSI GF75 Thin 9SC i7-9750H, GeForce GTX 1650 Mobile | Asus TUF FX705DT-AU068T R5 3550H, GeForce GTX 1650 Mobile | Asus TUF A17 FA706IU-AS76 R7 4800H, GeForce GTX 1660 Ti Mobile | Lenovo Legion Y540-17IRH i5-9300H, GeForce GTX 1660 Ti Mobile | |
|---|---|---|---|---|---|---|
| Heat | -1% | -15% | -1% | -11% | -26% | |
| Maximum Upper Side * (°C) | 48 | 44 8% | 47.8 -0% | 41.6 13% | 47.6 1% | 48 -0% |
| Maximum Bottom * (°C) | 50 | 49 2% | 57 -14% | 38 24% | 50.8 -2% | 56 -12% |
| Idle Upper Side * (°C) | 25 | 26 -4% | 30.2 -21% | 31.7 -27% | 33 -32% | 36 -44% |
| Idle Bottom * (°C) | 26 | 28 -8% | 32 -23% | 29.5 -13% | 29 -12% | 38 -46% |
* ... mindre är bättre
MSI Bravo 17 A4DDR ljudanalys
(+) | högtalare kan spela relativt högt (84 dB)
Bas 100 - 315 Hz
(-) | nästan ingen bas - i genomsnitt 18.2% lägre än medianen
(±) | linjäriteten för basen är genomsnittlig (11.7% delta till föregående frekvens)
Mellan 400 - 2000 Hz
(+) | balanserad mellan - endast 3.3% från medianen
(+) | mids är linjära (3.7% delta till föregående frekvens)
Högsta 2 - 16 kHz
(+) | balanserade toppar - endast 2.7% från medianen
(+) | toppar är linjära (4.7% delta till föregående frekvens)
Totalt 100 - 16 000 Hz
(+) | det totala ljudet är linjärt (14.8% skillnad mot median)
Jämfört med samma klass
» 29% av alla testade enheter i den här klassen var bättre, 7% liknande, 64% sämre
» Den bästa hade ett delta på 6%, genomsnittet var 18%, sämst var 132%
Jämfört med alla testade enheter
» 20% av alla testade enheter var bättre, 4% liknande, 76% sämre
» Den bästa hade ett delta på 4%, genomsnittet var 24%, sämst var 134%
MSI Alpha 15 A3DDK-034 ljudanalys
(+) | högtalare kan spela relativt högt (91 dB)
Bas 100 - 315 Hz
(-) | nästan ingen bas - i genomsnitt 31.4% lägre än medianen
(+) | basen är linjär (5.8% delta till föregående frekvens)
Mellan 400 - 2000 Hz
(±) | reducerade mids - i genomsnitt 7.4% lägre än median
(±) | linjäriteten för mids är genomsnittlig (9.9% delta till föregående frekvens)
Högsta 2 - 16 kHz
(+) | balanserade toppar - endast 2.1% från medianen
(+) | toppar är linjära (3.7% delta till föregående frekvens)
Totalt 100 - 16 000 Hz
(±) | linjäriteten för det totala ljudet är genomsnittlig (19.5% skillnad mot median)
Jämfört med samma klass
» 68% av alla testade enheter i den här klassen var bättre, 7% liknande, 26% sämre
» Den bästa hade ett delta på 6%, genomsnittet var 18%, sämst var 132%
Jämfört med alla testade enheter
» 48% av alla testade enheter var bättre, 7% liknande, 44% sämre
» Den bästa hade ett delta på 4%, genomsnittet var 24%, sämst var 134%
| Av/Standby | |
| Låg belastning | |
| Hög belastning |
|
Förklaring:
min: | |
| MSI Bravo 17 A4DDR R7 4800H, Radeon RX 5500M | MSI Alpha 15 A3DDK-034 R7 3750H, Radeon RX 5500M | MSI GF75 Thin 9SC i7-9750H, GeForce GTX 1650 Mobile | Asus TUF FX705DT-AU068T R5 3550H, GeForce GTX 1650 Mobile | Asus TUF A17 FA706IU-AS76 R7 4800H, GeForce GTX 1660 Ti Mobile | Lenovo Legion Y540-17IRH i5-9300H, GeForce GTX 1660 Ti Mobile | |
|---|---|---|---|---|---|---|
| Power Consumption | -44% | -13% | 29% | -9% | -63% | |
| Idle Minimum * (Watt) | 9 | 14 -56% | 6.1 32% | 3.9 57% | 7.4 18% | 19 -111% |
| Idle Average * (Watt) | 10 | 18 -80% | 11.2 -12% | 9.6 4% | 10.5 -5% | 22 -120% |
| Idle Maximum * (Watt) | 13 | 32 -146% | 24.5 -88% | 12.2 6% | 17 -31% | 30 -131% |
| Load Average * (Watt) | 69 | 64 7% | 94.7 -37% | 59 14% | 103.7 -50% | 79 -14% |
| Witcher 3 ultra * (Watt) | 128 | 123 4% | 105.8 17% | 128.1 -0% | 134 -5% | |
| Load Maximum * (Watt) | 214 | 193 10% | 192.2 10% | 80 63% | 183.2 14% | 201 6% |
* ... mindre är bättre
| MSI Bravo 17 A4DDR R7 4800H, Radeon RX 5500M, 51 Wh | MSI Alpha 15 A3DDK-034 R7 3750H, Radeon RX 5500M, 51 Wh | MSI GF75 Thin 9SC i7-9750H, GeForce GTX 1650 Mobile, 51 Wh | Asus TUF FX705DT-AU068T R5 3550H, GeForce GTX 1650 Mobile, 64 Wh | Asus TUF A17 FA706IU-AS76 R7 4800H, GeForce GTX 1660 Ti Mobile, 90 Wh | Lenovo Legion Y540-17IRH i5-9300H, GeForce GTX 1660 Ti Mobile, 57 Wh | |
|---|---|---|---|---|---|---|
| Batteridrifttid | -28% | -10% | 63% | 78% | -25% | |
| Reader / Idle (h) | 7.7 | 5.8 -25% | 13.6 77% | 9.1 18% | 5.2 -32% | |
| WiFi v1.3 (h) | 5.2 | 4.1 -21% | 4.7 -10% | 7.8 50% | 8.5 63% | 3.7 -29% |
| Load (h) | 1.3 | 0.8 -38% | 2.1 62% | 3.3 154% | 1.1 -15% | |
| H.264 (h) | 3.9 | 8.1 | 3.4 |
För
Emot
Läs den fullständiga versionen av den här recensionen på engelska här.
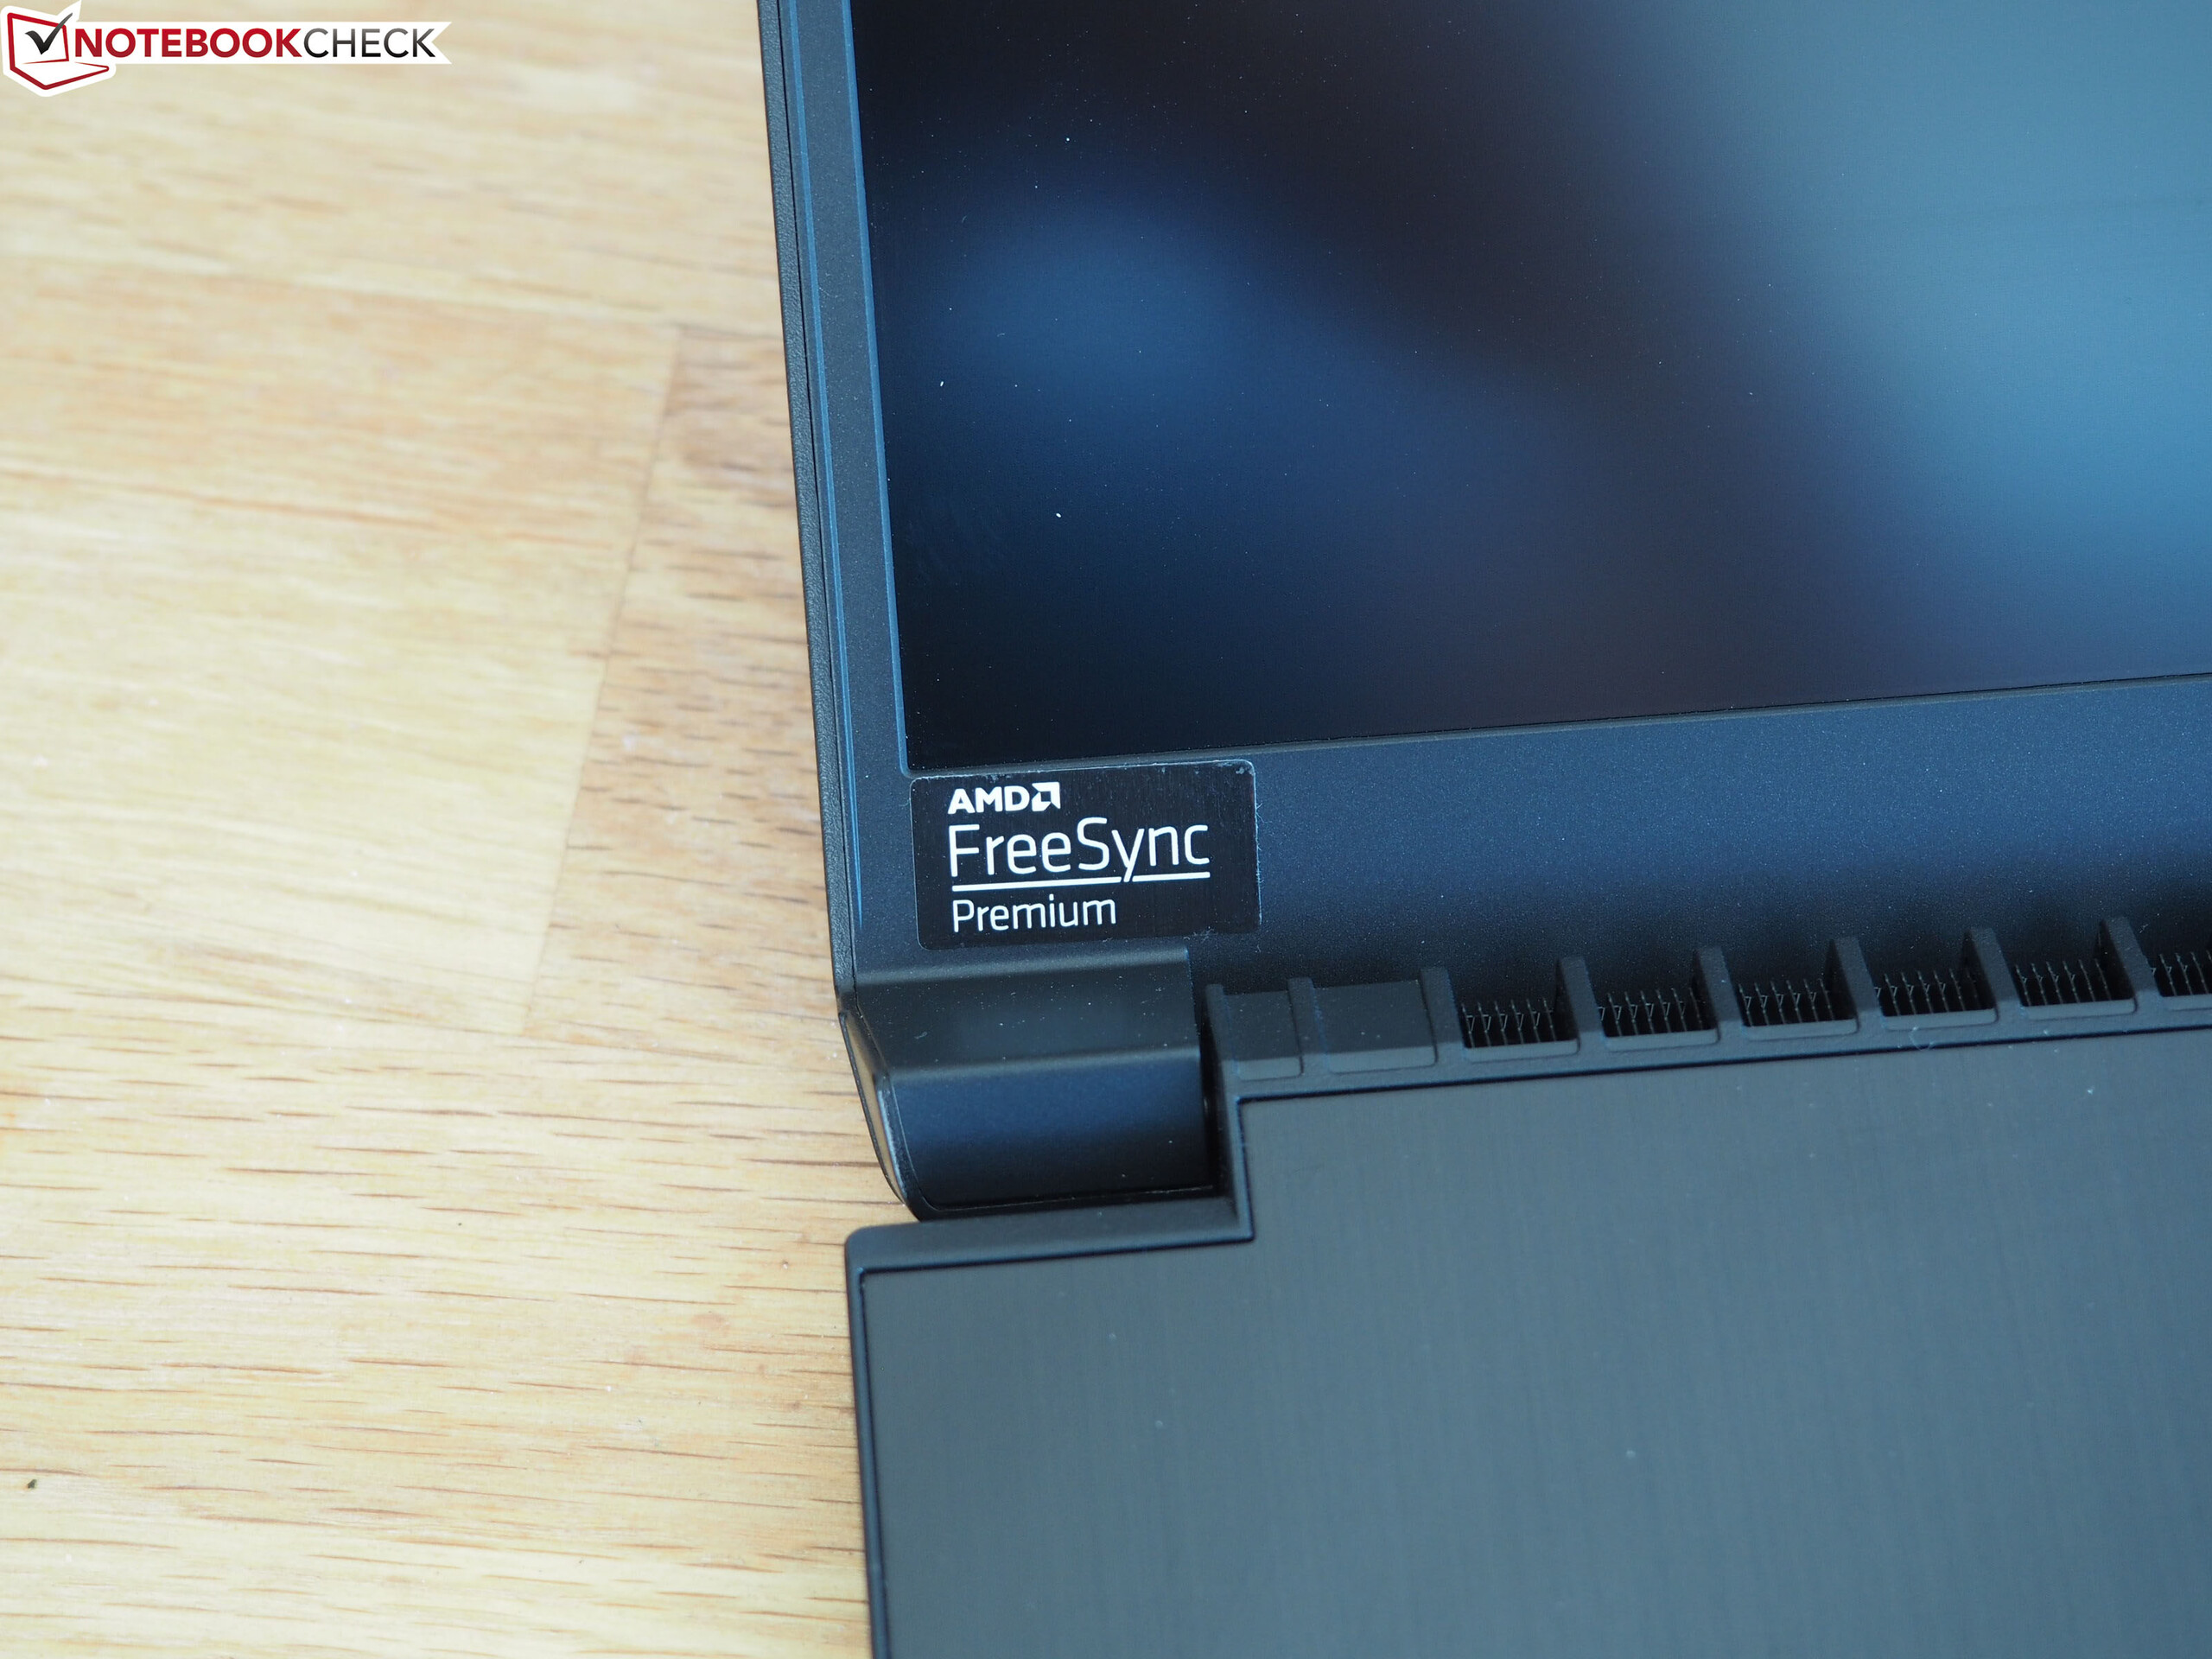
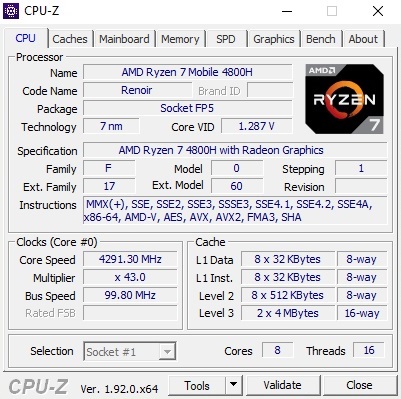
AMD är tillbaka - så det smäller om det: Inte nödvändigtvis på GPU-sidan, men definitivt på CPU-sidan.
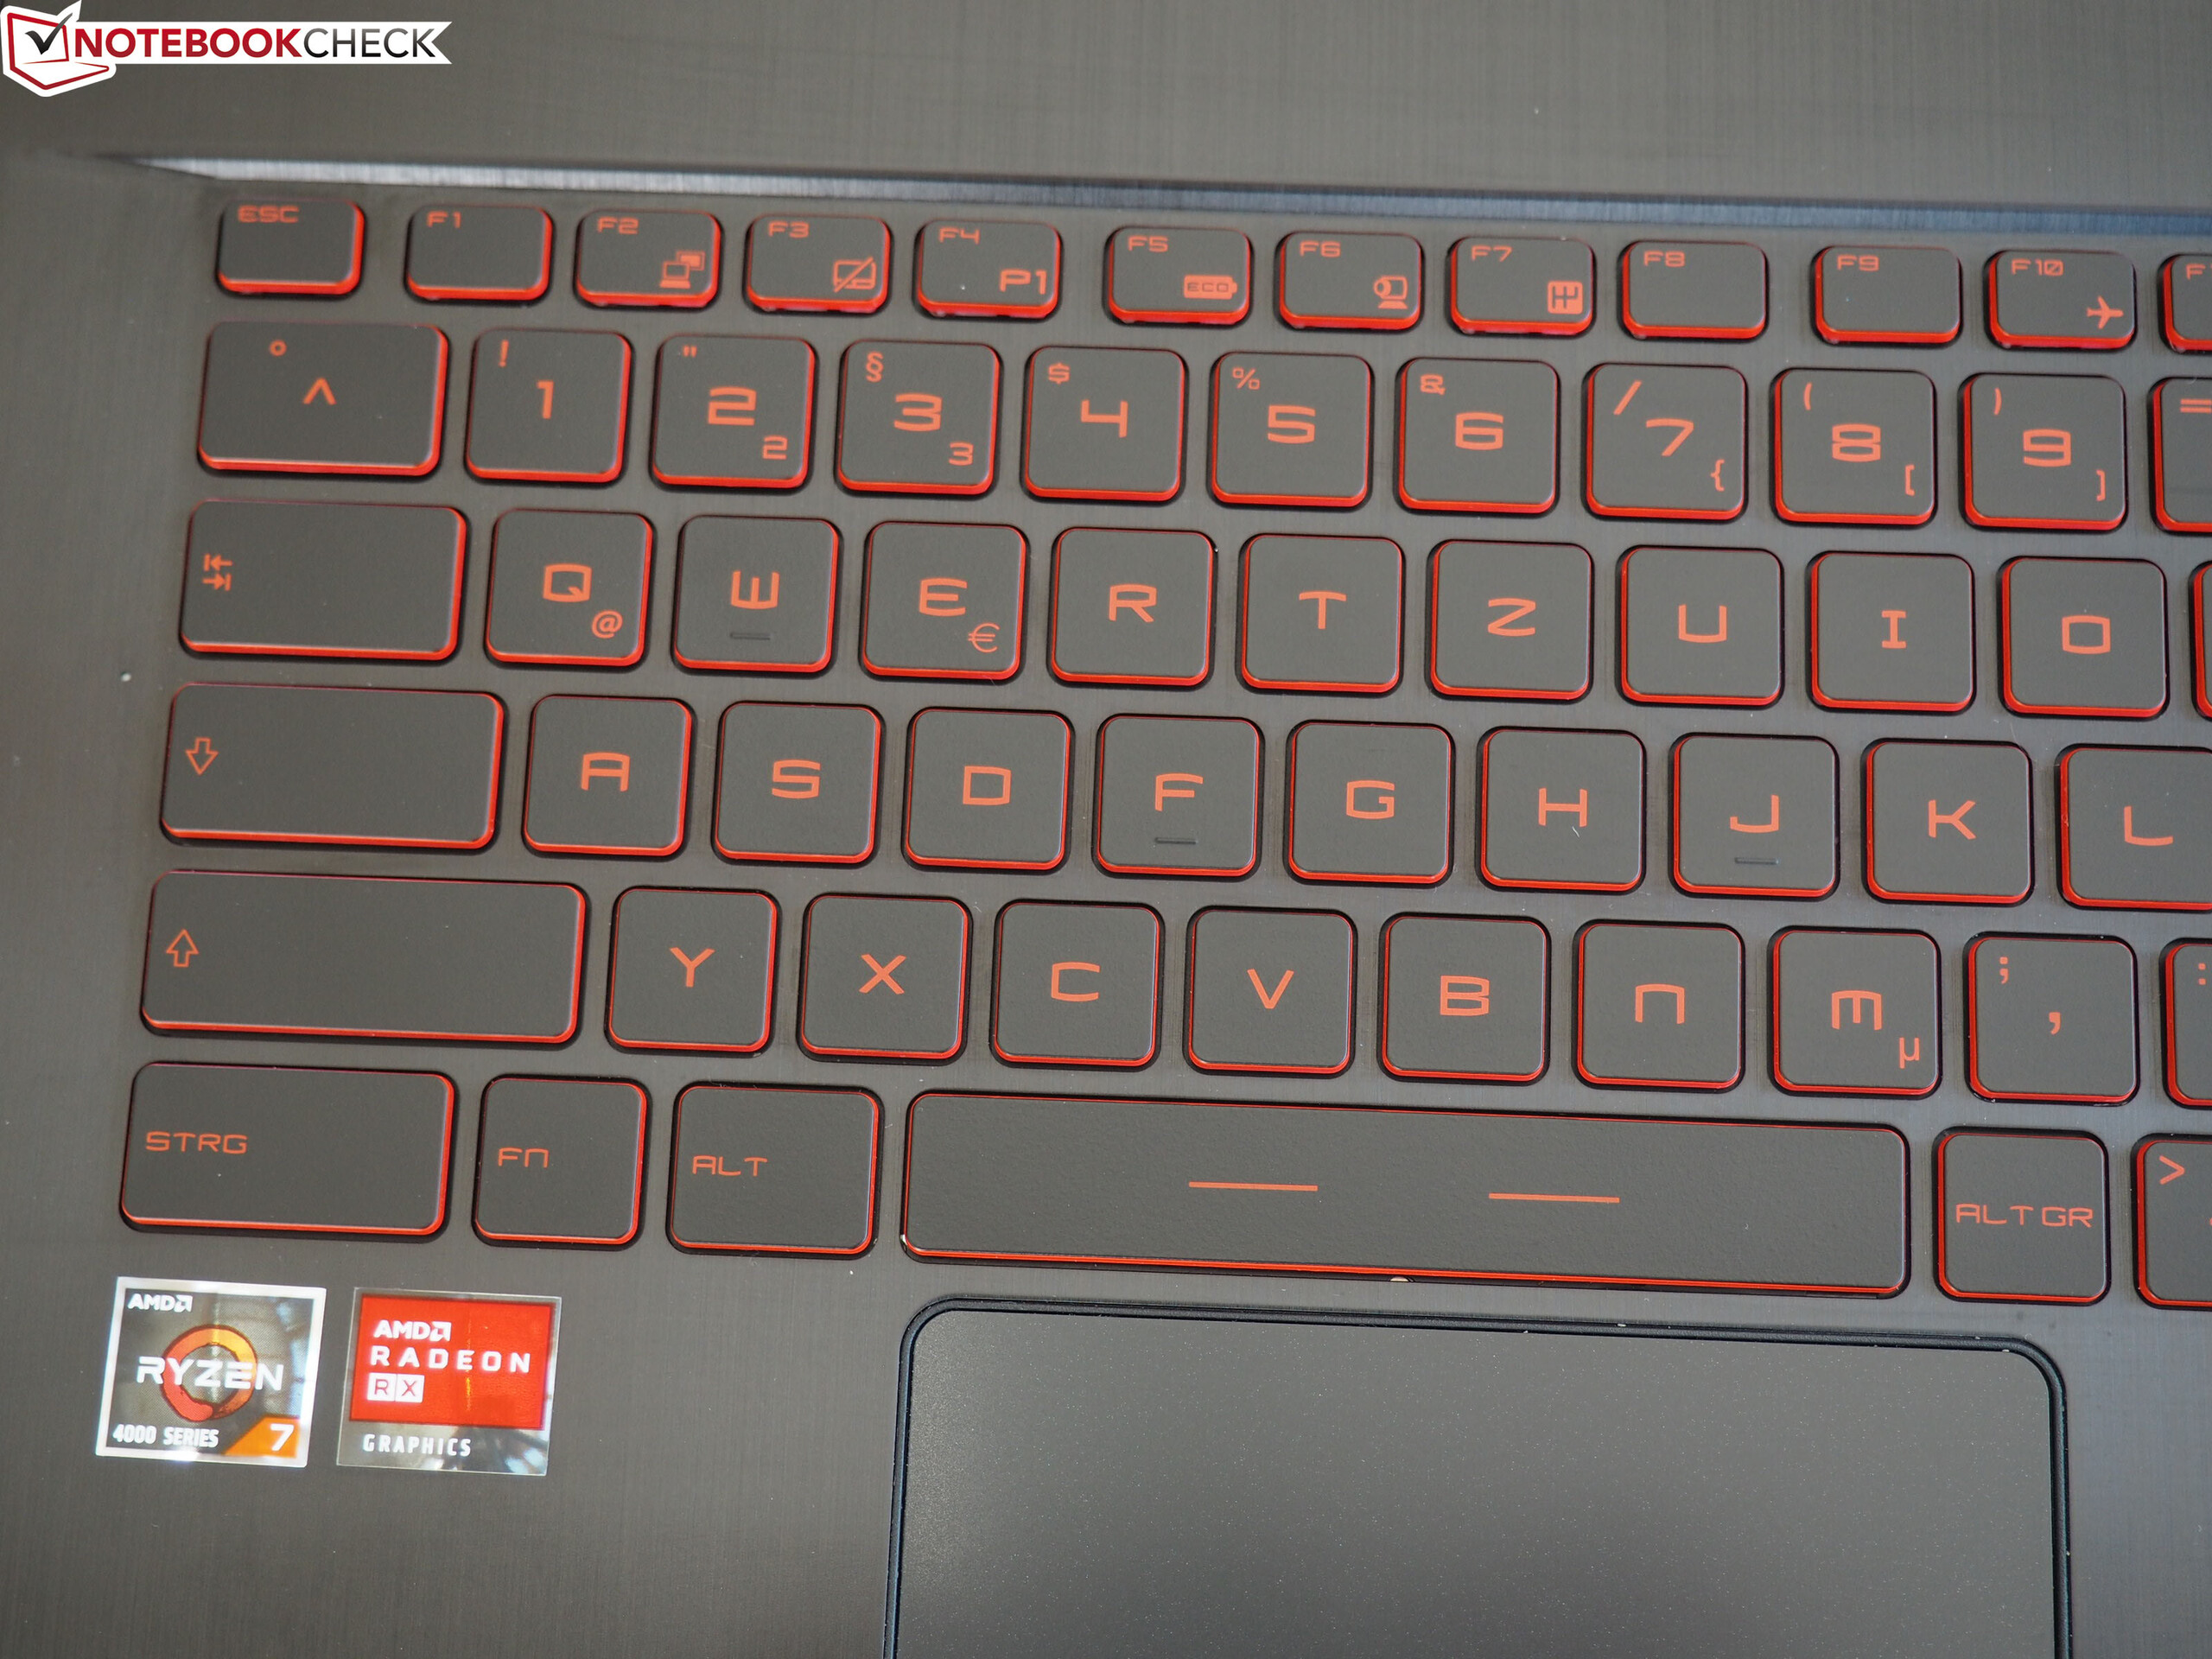
Ryzen 7 4800H imponerar med riktigt hög prestanda som verkligen sätter prismässigt jämförbara Intel-alternativ (exempelvis Core i7-9750H) på sin plats. Så mycket CPU-prestanda har tidigare bara funnits på bärbara speldatorer för över 15.000 kronor.
Med undantag för dålig anslutbarhet, en skärm med låg ljusstyrka och hög ljudnivå vid belastning lämnar Bravo 17 ett gott intryck. AMD-fans som vill hålla koll på budgeten kan slå till utan att behöva tveka.
MSI Bravo 17 A4DDR
- 07/02/2020 v7 (old)
Florian Glaser
Price comparison