Recension av Dell XPS 17 9720 RTX 3060 - 50 procent snabbare processor än tidigare
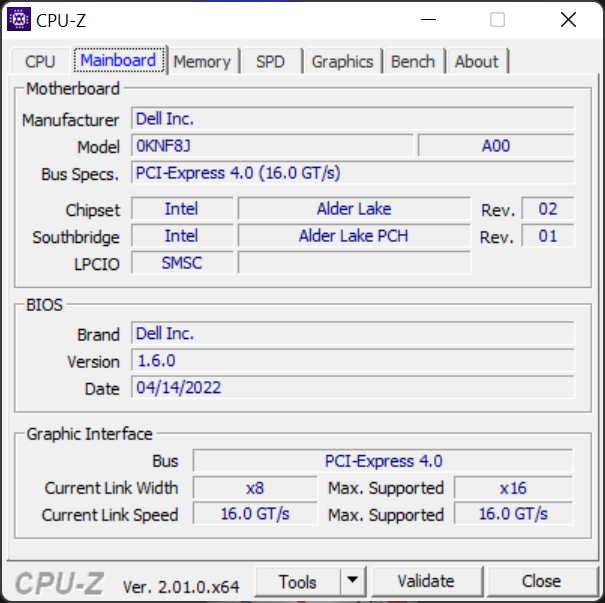
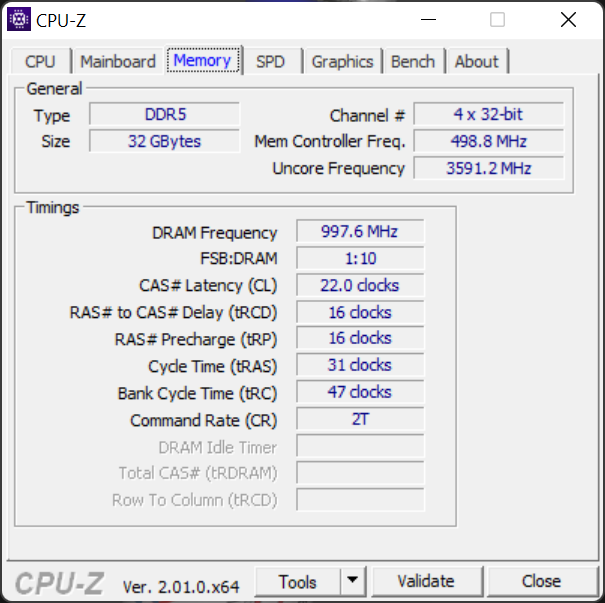
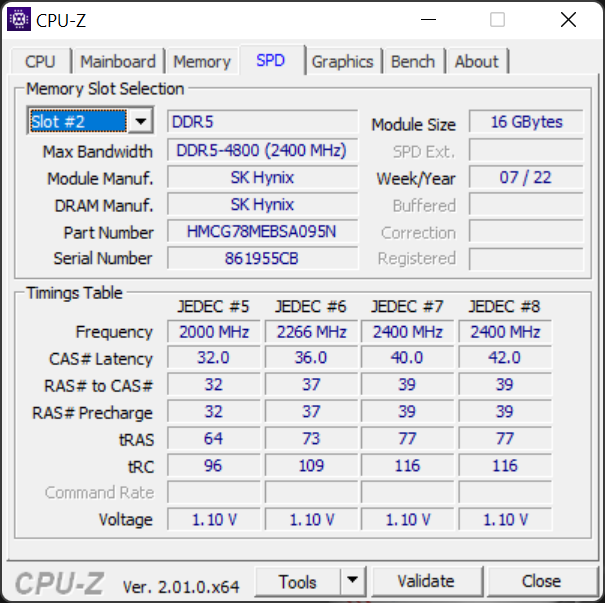
Dell XPS 17 9720 är den tredje versionen av 17,0-tums XPS 17-serien som började med 2020 års XPS 17 9700. Medan XPS 17 9700- och 2021 9710-versionerna skulle levereras med 10:e respektive 11:e generationens Intel-processorer har 2022 9720 lagt till 12:e generationens processorer och DDR5 RAM-alternativ till mixen. Andra centrala egenskaper som chassi och GPU-alternativ är i övrigt identiska med XPS 17 9700 eller 9710 och vi rekommenderar därför att du kollar in våra befintliga recensioner om serien för att lära dig mer om modellens fysiska egenskaper
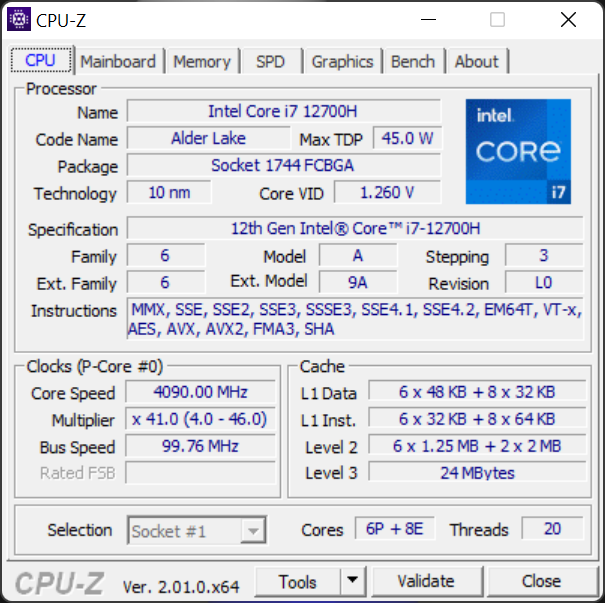
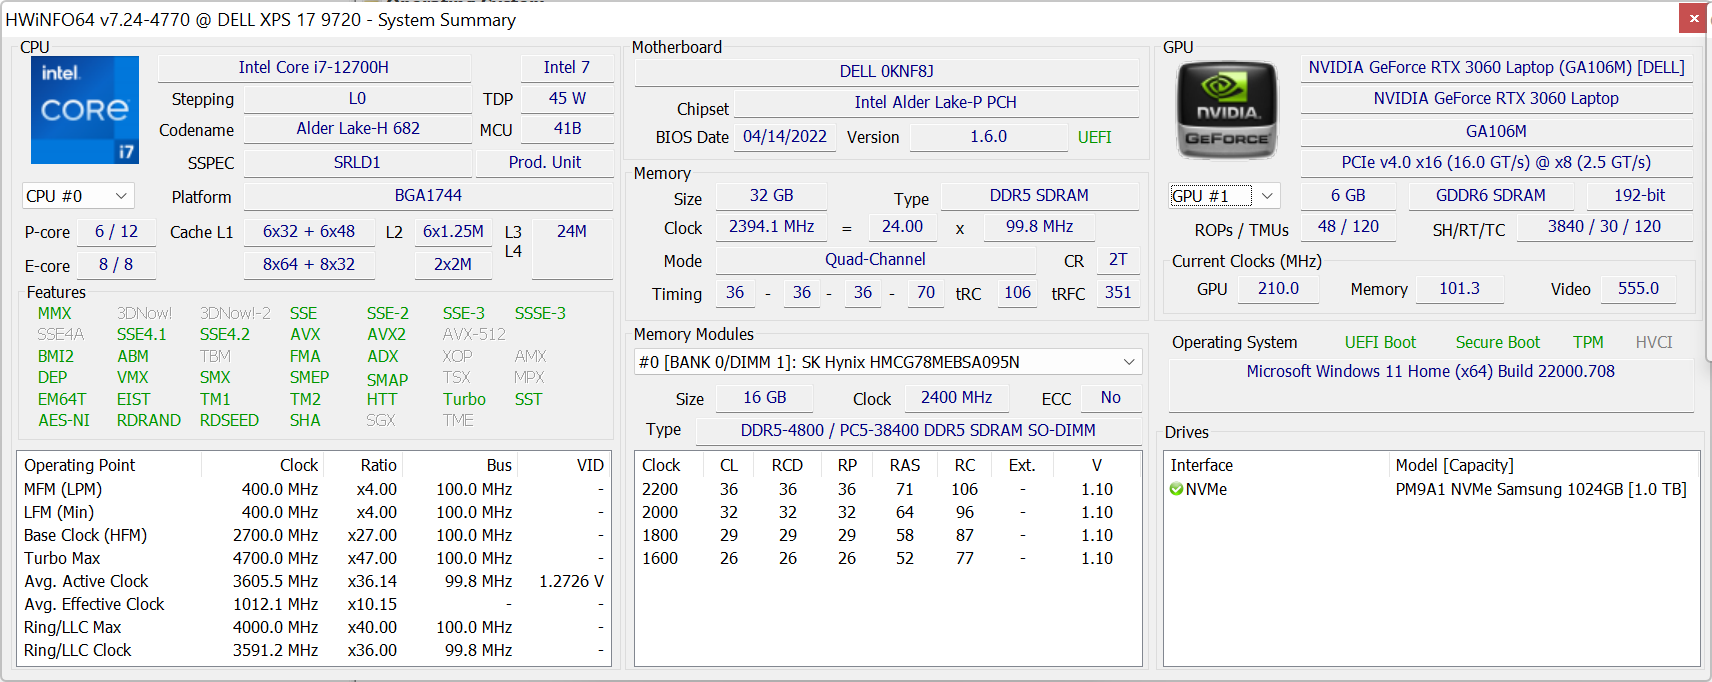
Vår enhet i recensionen är en konfiguration i övre mellanklassen med Core i7-12700H CPU, UHD+ (3840 x 2400) IPS-pekskärm och GeForce RTX 3060 GPU för cirka 3 000 USD. Andra SKU:er finns också tillgängliga med i5-12500H, i9-12900HK, GeForce RTX 3050 Ti, 1200p-skärm eller enbart integrerad grafik
Konkurrenterna till XPS 17 9720 är bland annat bärbara 17,3-tums multimedie- eller prosumer-datorer som t.ex Gigabyte Aero 17, Razer Blade 17, HP Envy 17, eller Lenovo Legion 5 17
Fler recensioner om Dell
Jämförelse med potentiella konkurrenter
Gradering | Datum | Modell | Vikt | Höjd | Storlek | Upplösning | Pris |
|---|---|---|---|---|---|---|---|
| 88.8 % v7 (old) | 06/2022 | Dell XPS 17 9720 RTX 3060 i7-12700H, GeForce RTX 3060 Laptop GPU | 2.5 kg | 19.5 mm | 17.00" | 3840x2400 | |
| 82.4 % v7 (old) | HP Envy 17-cg i5-1135G7, GeForce MX450 | 2.7 kg | 19.3 mm | 17.30" | 1920x1080 | ||
| 87.9 % v7 (old) | 09/2021 | Dell XPS 17 9710 Core i7 RTX 3060 i7-11800H, GeForce RTX 3060 Laptop GPU | 2.5 kg | 19.5 mm | 17.00" | 3840x2400 | |
| 87.9 % v7 (old) | 07/2020 | Dell XPS 17 9700 Core i7 RTX 2060 Max-Q i7-10875H, GeForce RTX 2060 Max-Q | 2.5 kg | 19.5 mm | 17.00" | 3840x2400 | |
| 85.2 % v7 (old) | 02/2022 | Lenovo Legion 5 17ACH6H-82JY0003GE R5 5600H, GeForce RTX 3060 Laptop GPU | 3.1 kg | 24.3 mm | 17.30" | 1920x1080 | |
| 76.5 % v7 (old) | 05/2022 | Asus VivoBook 17 F712JA-AU708W i7-1065G7, Iris Plus Graphics G7 (Ice Lake 64 EU) | 2.2 kg | 21.4 mm | 17.30" | 1920x1080 | |
| 90.1 % v7 (old) | 05/2022 | Razer Blade 17 (i7-12800H, RTX 3070 Ti) i7-12800H, GeForce RTX 3070 Ti Laptop GPU | 2.8 kg | 19.9 mm | 17.30" | 2560x1440 |
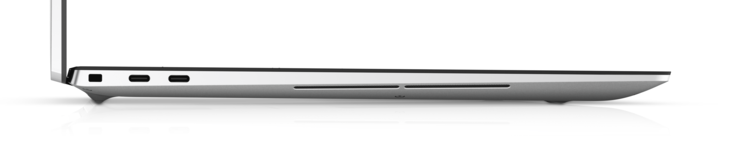
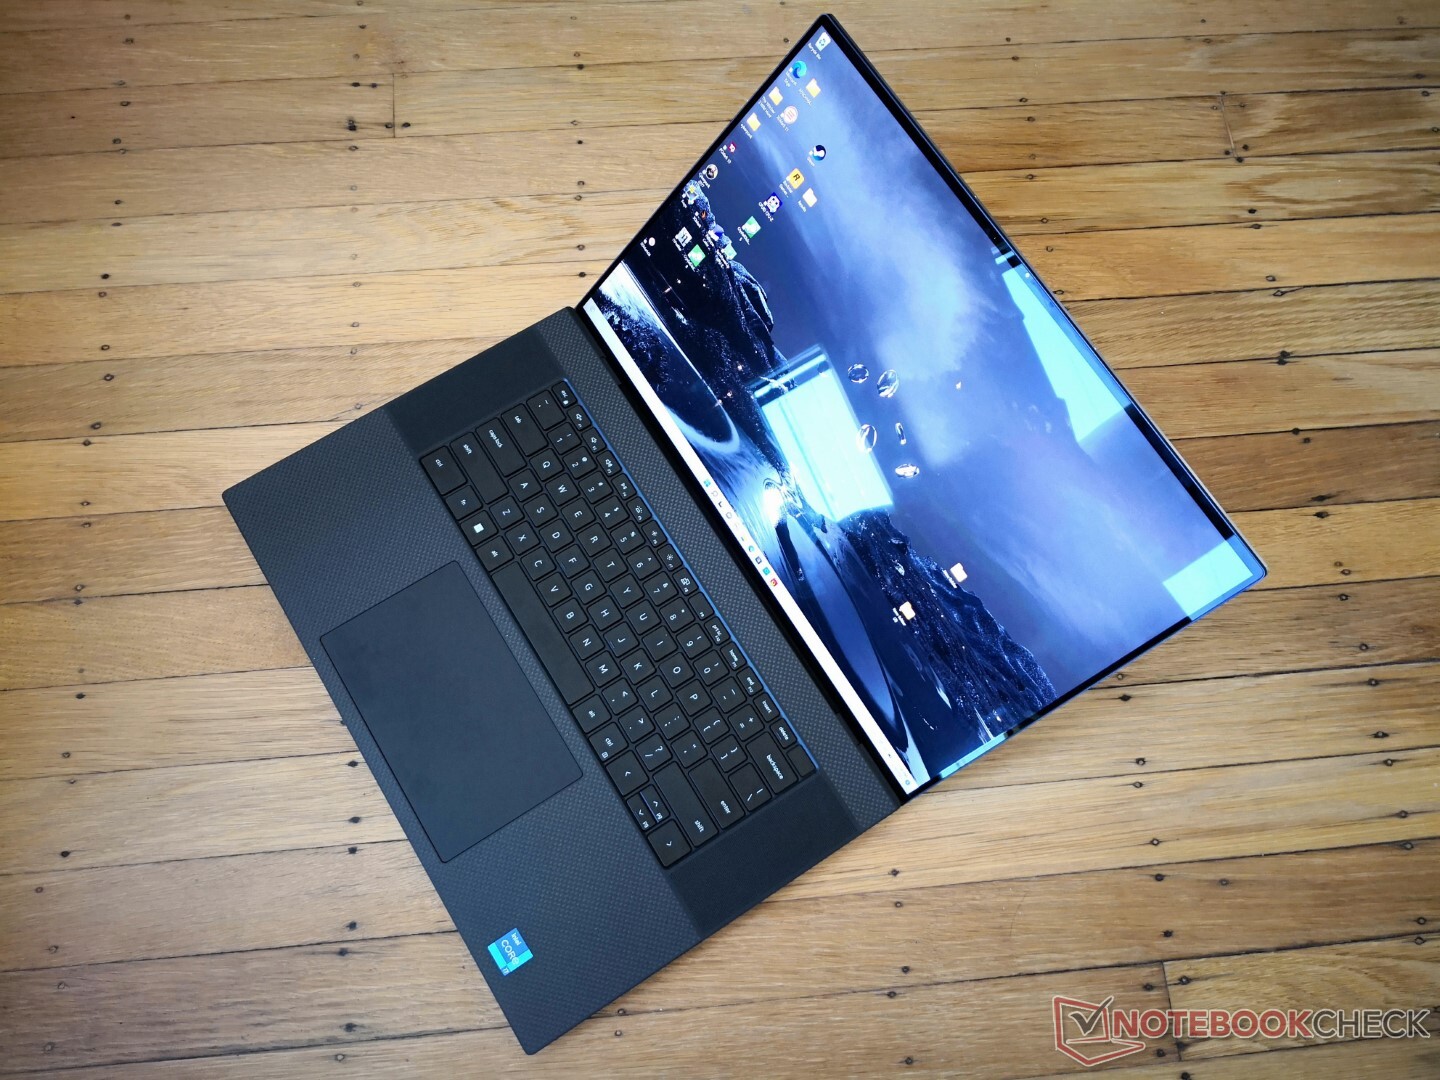
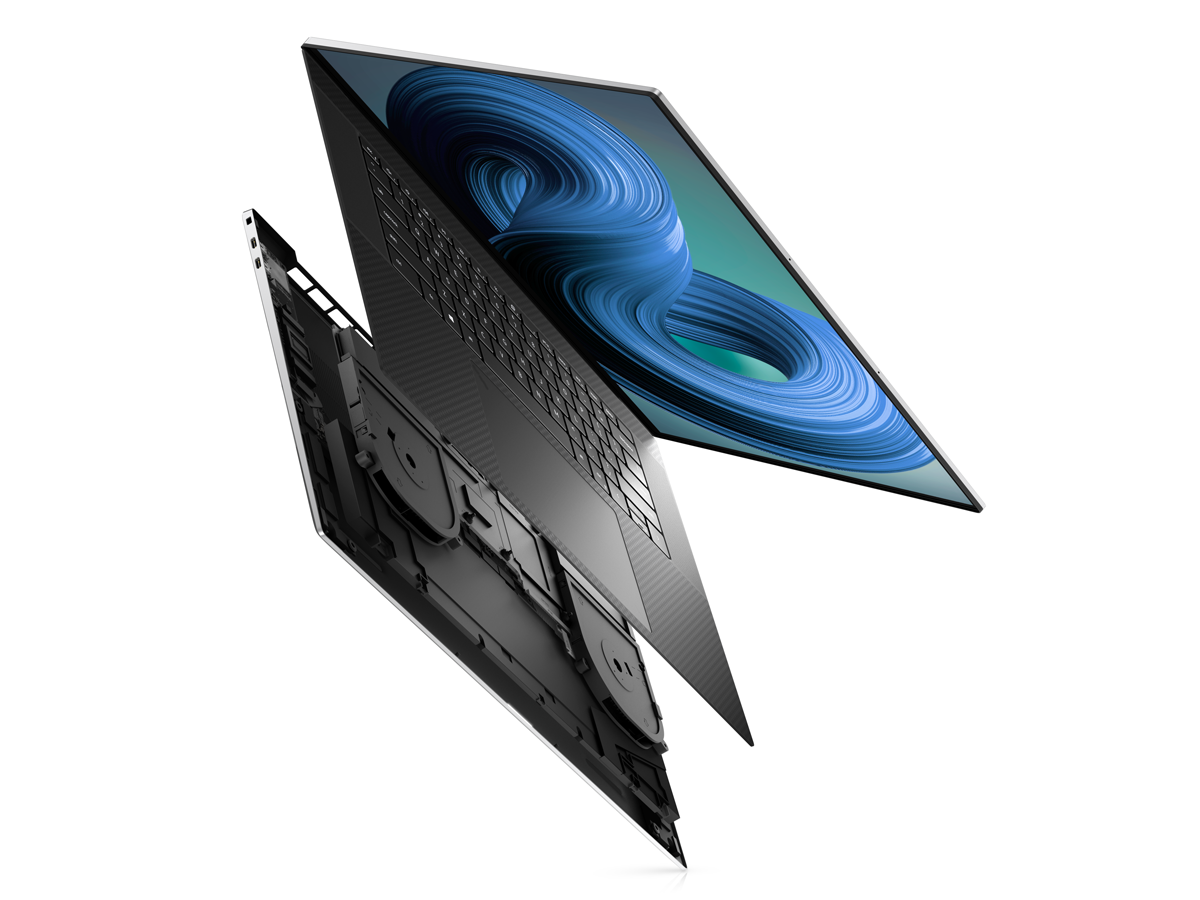
Hölje - Samma men fortfarande bra
Chassit har inte ändrats jämfört med XPS 17 9700 eller XPS 17 9700 9710. Trots att det är en två år gammal design gör den unika 16:10-formatfaktorn på 17,0 tum att modellen är märkbart mindre och tunnare än andra modeller i samma storlekskategori.
SD-kortläsare
| SD Card Reader | |
| average JPG Copy Test (av. of 3 runs) | |
| Dell XPS 17 9720 RTX 3060 (Toshiba Exceria Pro SDXC 64 GB UHS-II) | |
| Dell XPS 17 9700 Core i7 RTX 2060 Max-Q (Toshiba Exceria Pro SDXC 64 GB UHS-II) | |
| Dell XPS 17 9710 Core i7 RTX 3060 (AV PRO microSD 128 GB V60) | |
| Razer Blade 17 (i7-12800H, RTX 3070 Ti) | |
| Lenovo Legion 5 17ACH6H-82JY0003GE (AV Pro SD microSD 128 GB V60) | |
| HP Envy 17-cg (AV Pro microSD 128 GB V60) | |
| Asus VivoBook 17 F712JA-AU708W (AV Pro SD microSD 128 GB V60) | |
| maximum AS SSD Seq Read Test (1GB) | |
| Dell XPS 17 9720 RTX 3060 (Toshiba Exceria Pro SDXC 64 GB UHS-II) | |
| Dell XPS 17 9700 Core i7 RTX 2060 Max-Q (Toshiba Exceria Pro SDXC 64 GB UHS-II) | |
| Razer Blade 17 (i7-12800H, RTX 3070 Ti) | |
| Dell XPS 17 9710 Core i7 RTX 3060 (AV PRO microSD 128 GB V60) | |
| Lenovo Legion 5 17ACH6H-82JY0003GE (AV Pro SD microSD 128 GB V60) | |
| HP Envy 17-cg (AV Pro microSD 128 GB V60) | |
| Asus VivoBook 17 F712JA-AU708W (AV Pro SD microSD 128 GB V60) | |
Kommunikation - Ingen Wi-Fi 6E
Dell har uppgraderat WLAN från Intel AX1650 på XPS 17 9710 till Intel AX1675 (eller AX211) på XPS 17 9720. Det nyare chipet stöder Wi-Fi 6E, men funktionen är inaktiverad på XPS 17 9720, precis som på XPS 17 9720 vad vi upptäckte på XPS 15 9520. Användarna kommer alltså bara att kunna ansluta till 2,4 GHz- eller 5 GHz-nätverk och inte 6 GHz-nätverk.
| Networking | |
| iperf3 transmit AX12 | |
| HP Envy 17-cg | |
| Dell XPS 17 9710 Core i7 RTX 3060 | |
| Asus VivoBook 17 F712JA-AU708W | |
| Lenovo Legion 5 17ACH6H-82JY0003GE | |
| Dell XPS 17 9700 Core i7 RTX 2060 Max-Q | |
| iperf3 receive AX12 | |
| HP Envy 17-cg | |
| Dell XPS 17 9710 Core i7 RTX 3060 | |
| Dell XPS 17 9700 Core i7 RTX 2060 Max-Q | |
| Asus VivoBook 17 F712JA-AU708W | |
| Lenovo Legion 5 17ACH6H-82JY0003GE | |
| iperf3 receive AXE11000 | |
| Dell XPS 17 9720 RTX 3060 | |
| iperf3 transmit AXE11000 | |
| Dell XPS 17 9720 RTX 3060 | |
Webbkamera
Kameran är fortfarande bara 720p utan någon sekretessbrytare. Den låga ursprungliga upplösningen kombineras dåligt med den högupplösta skärmen, vilket ger en oundvikligt lerig bild. Dell säger att IR- och RGB-sensorerna är separata nu för bättre prestanda, men pixeltätheten är fortfarande mycket låg. Som jämförelse levereras Razer Blade 17 istället med en 1080p-kamera med högre upplösning i 1080p.
Windows Hello stöds fortfarande.


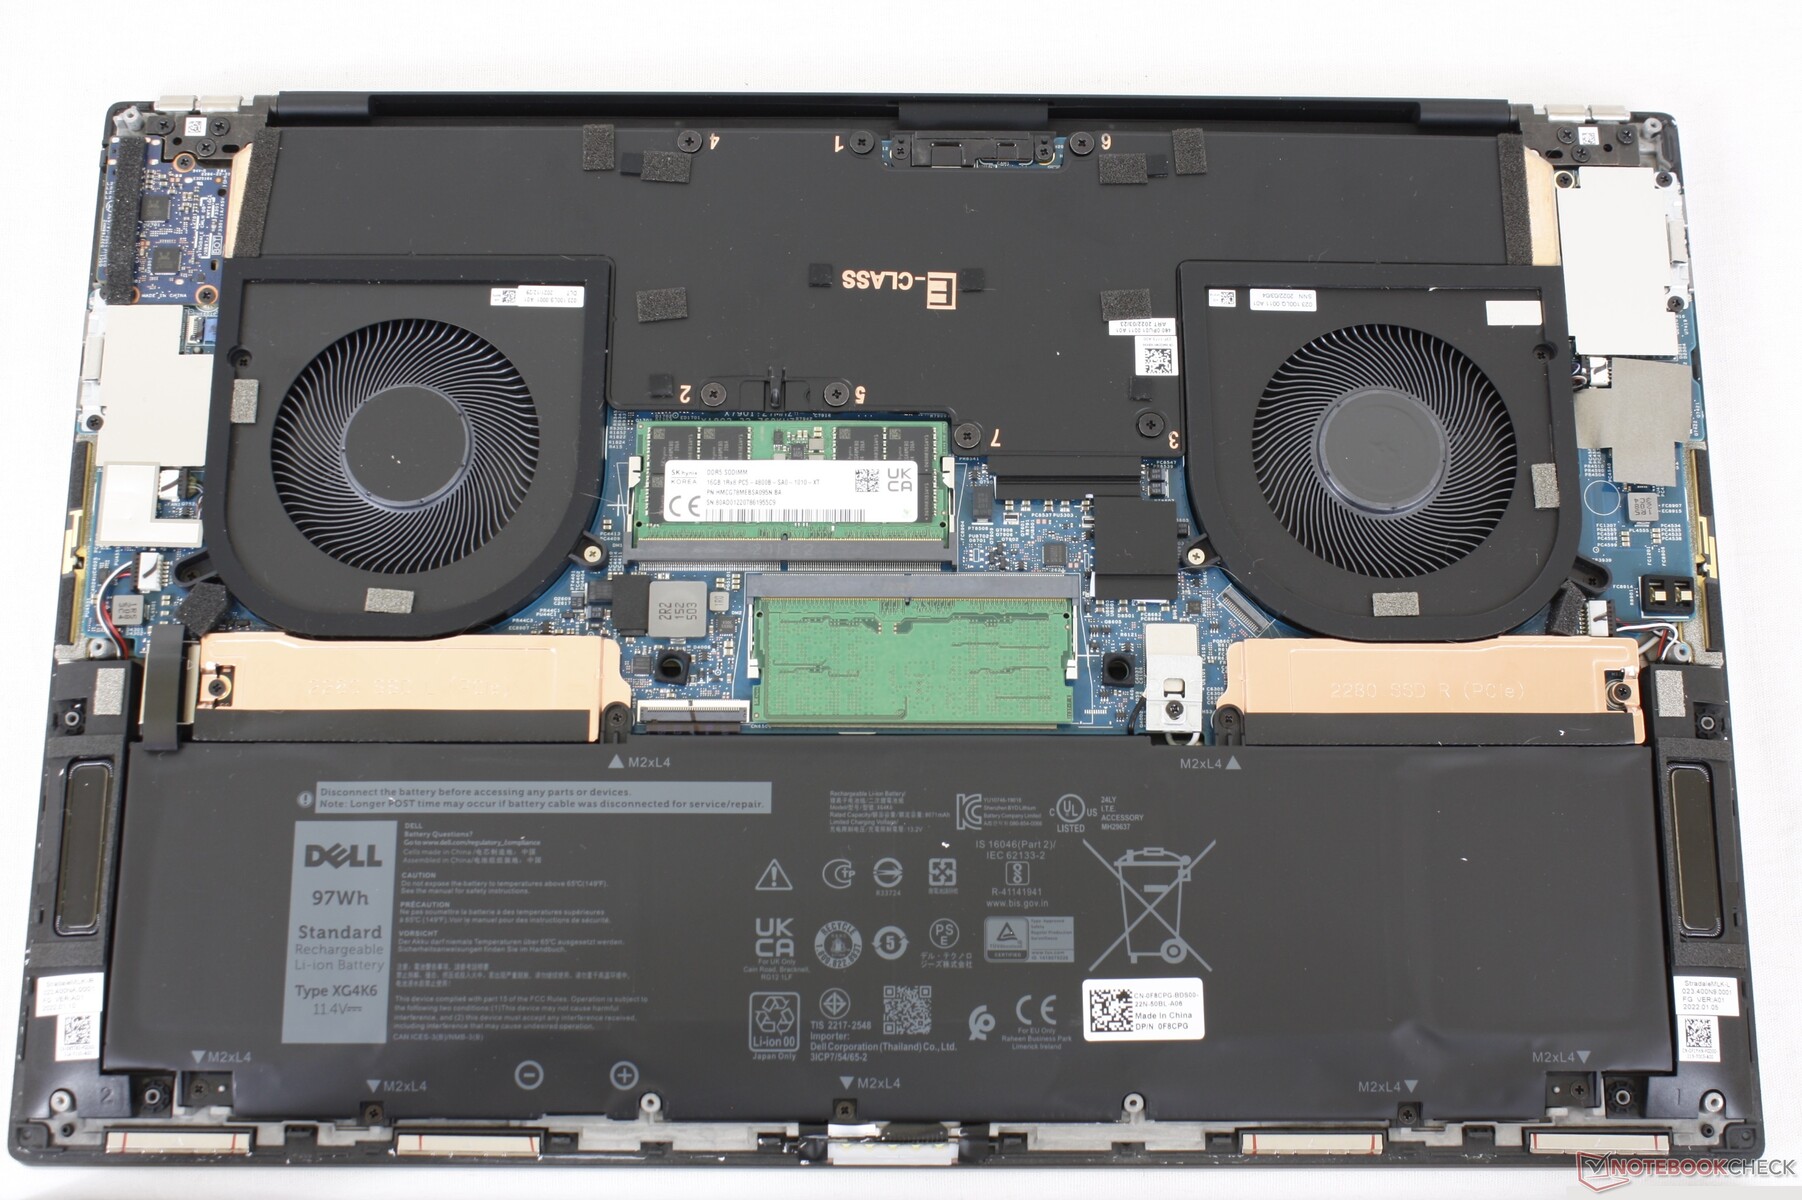
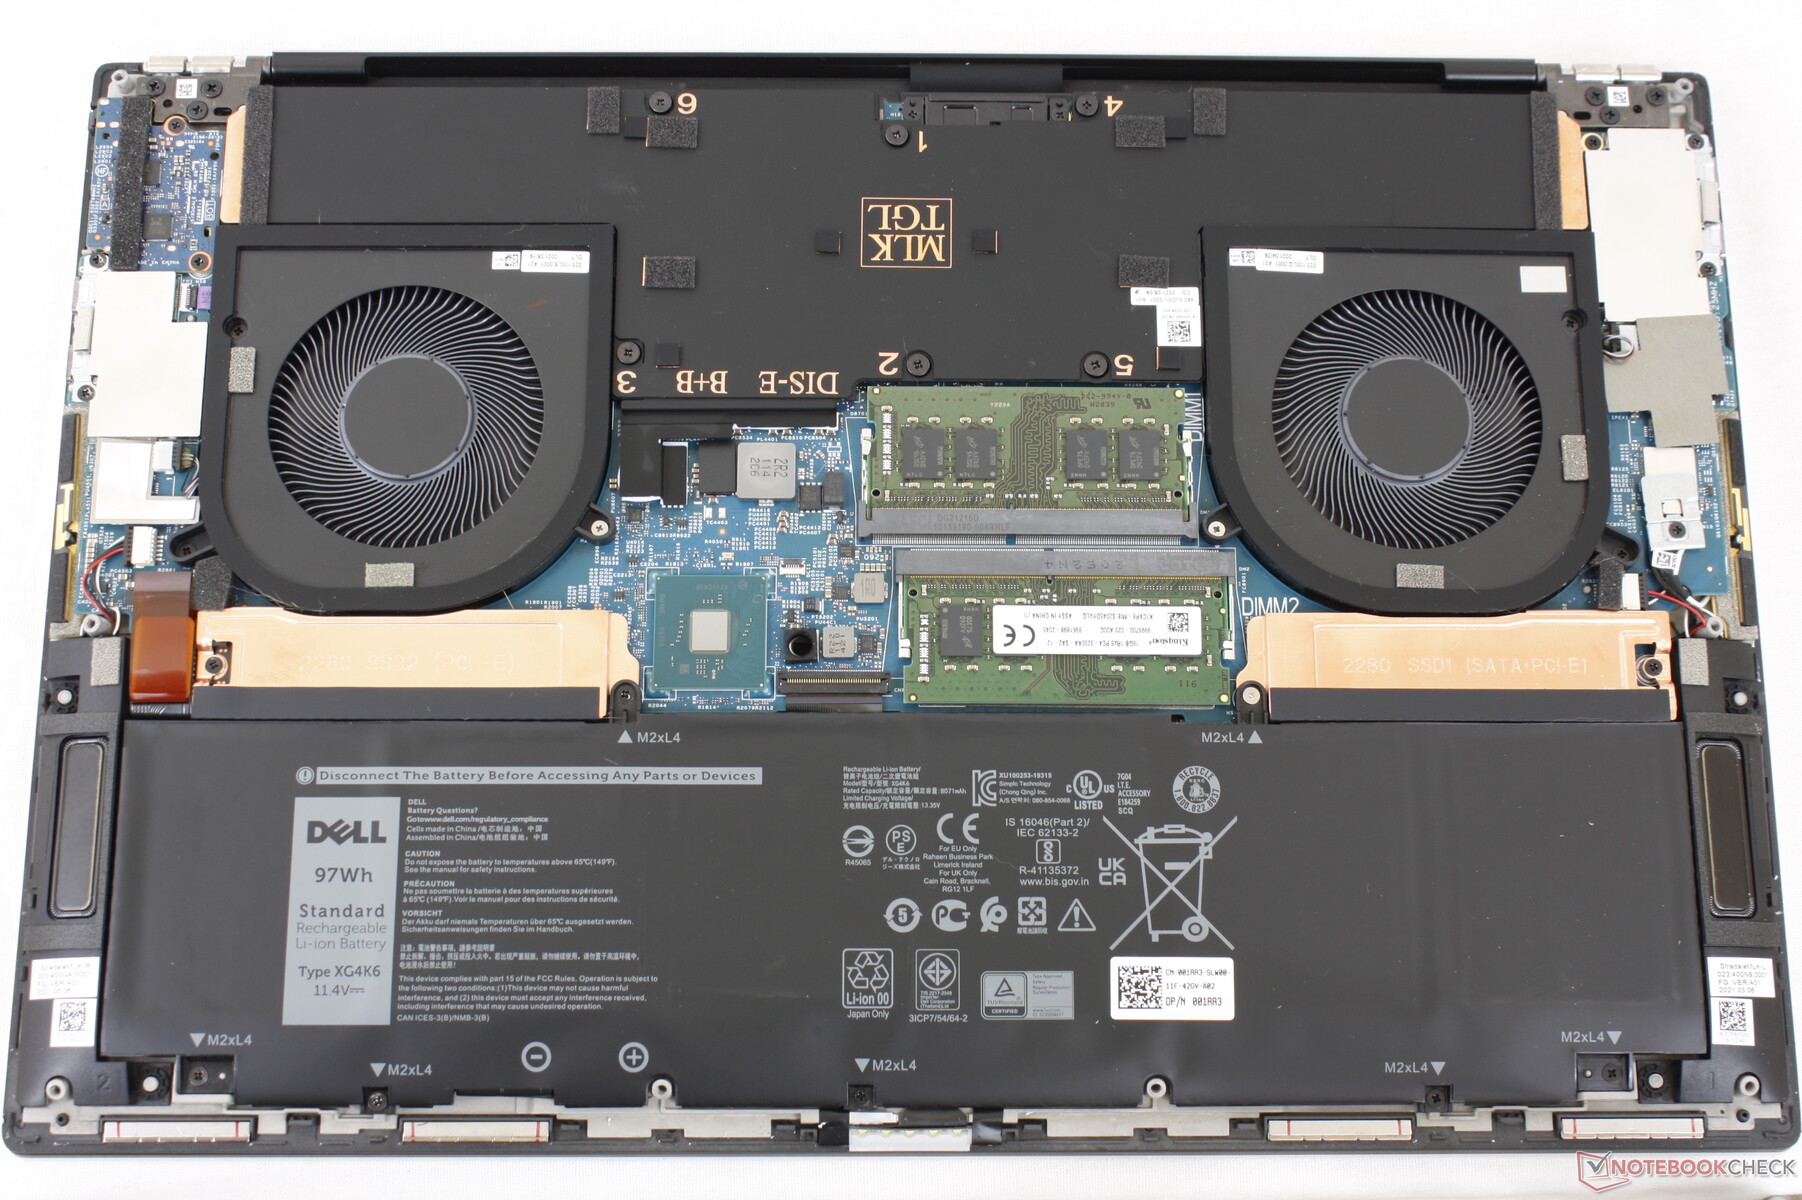
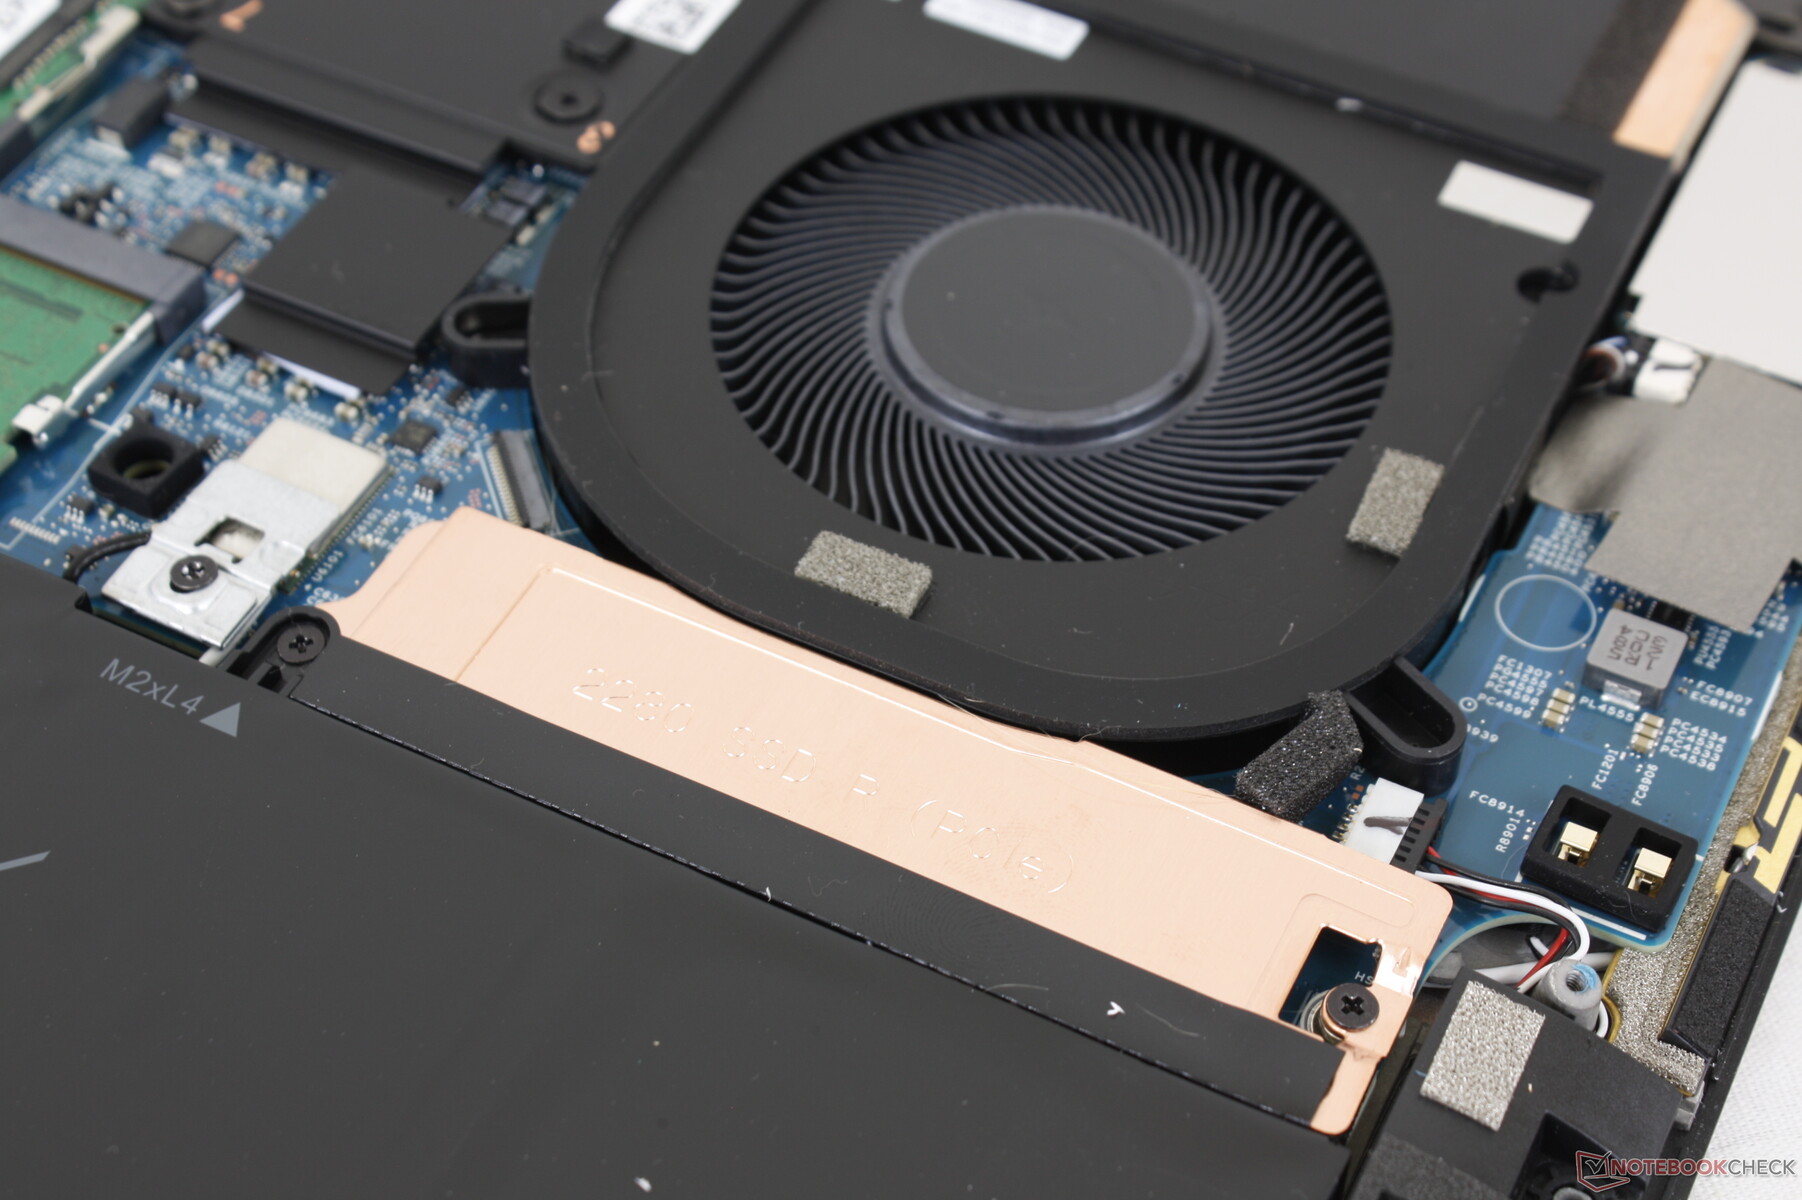
Underhåll
Tillbehör och garanti
XPS 17 9720 levereras med samma 130 W AC-adapter och USB-C- till HDMI- och USB-A-adapter som XPS 15 9520, XPS 17 9710 och XPS 17 9700. En begränsad tillverkargaranti på ett år gäller om den köps i USA.
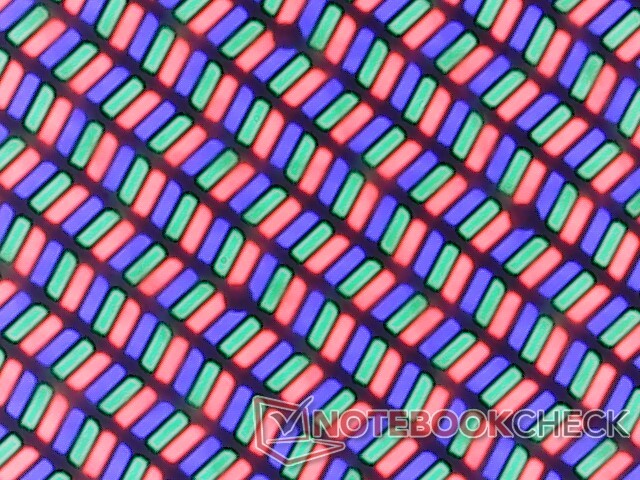
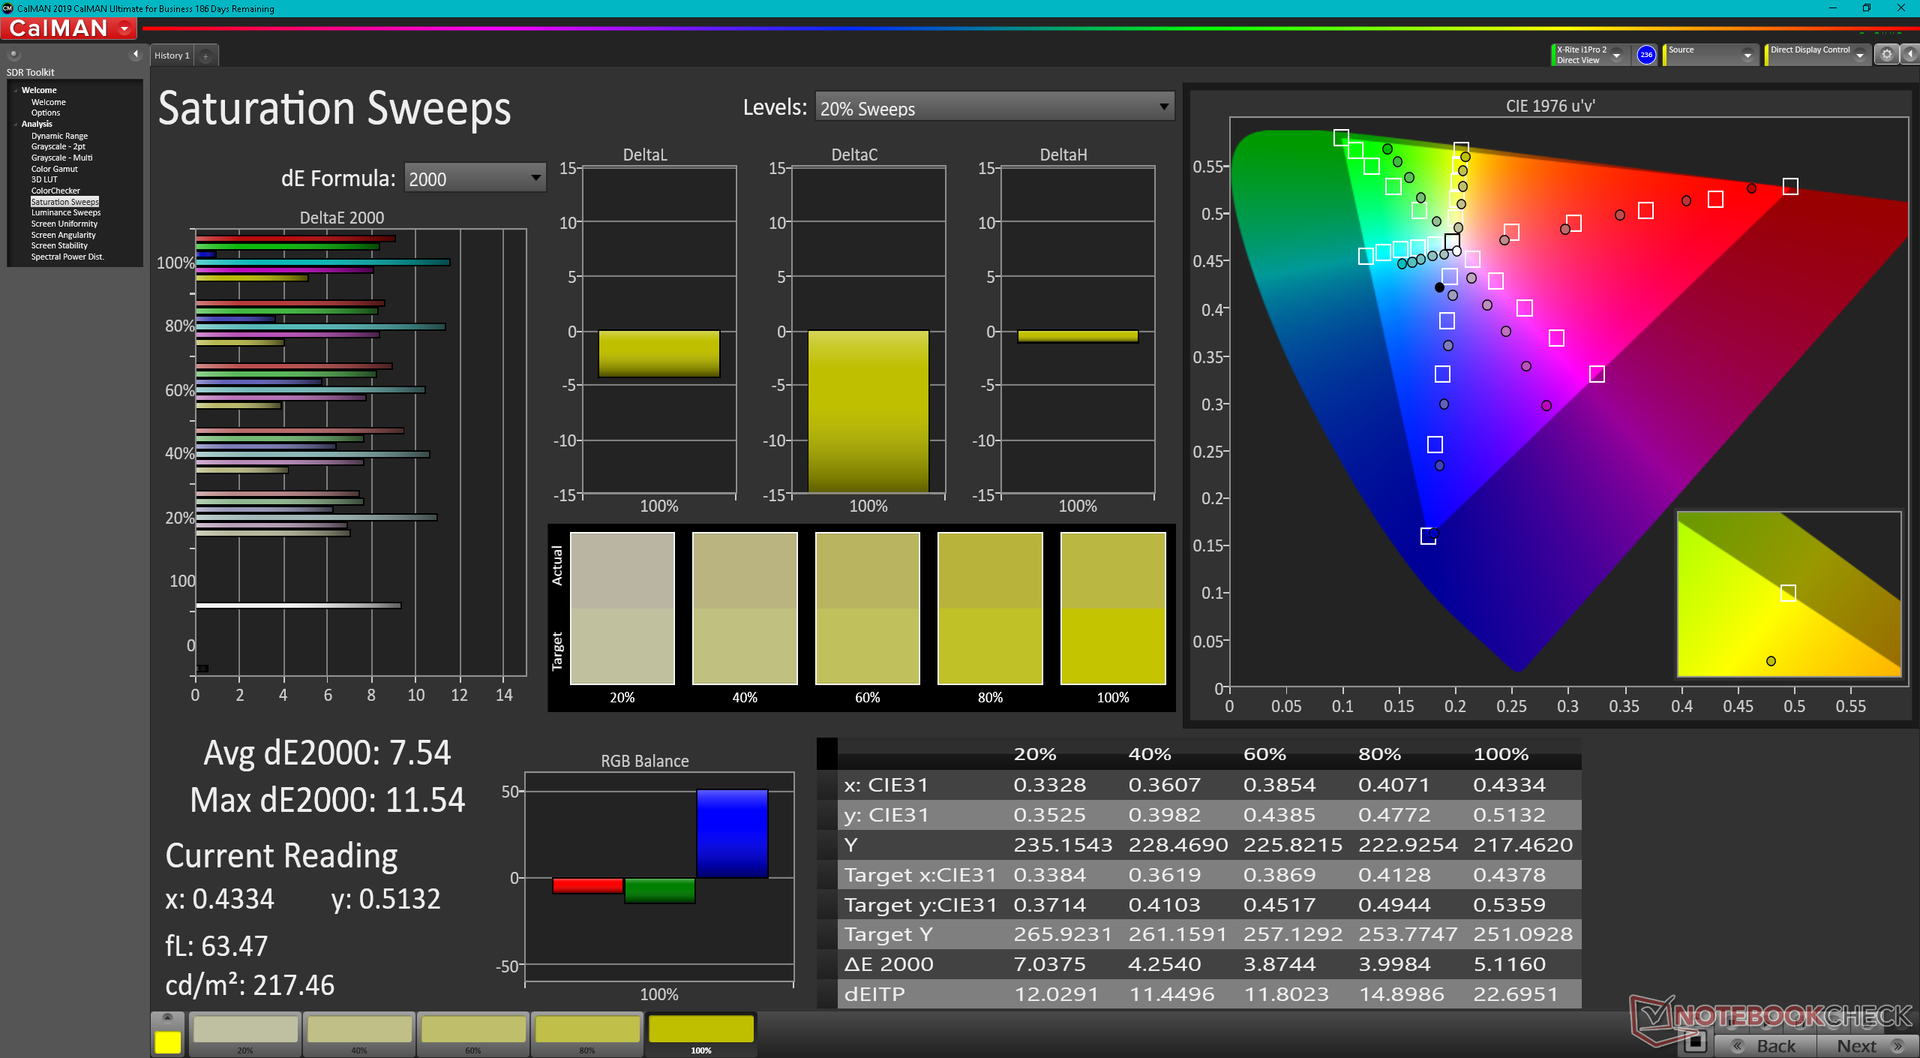
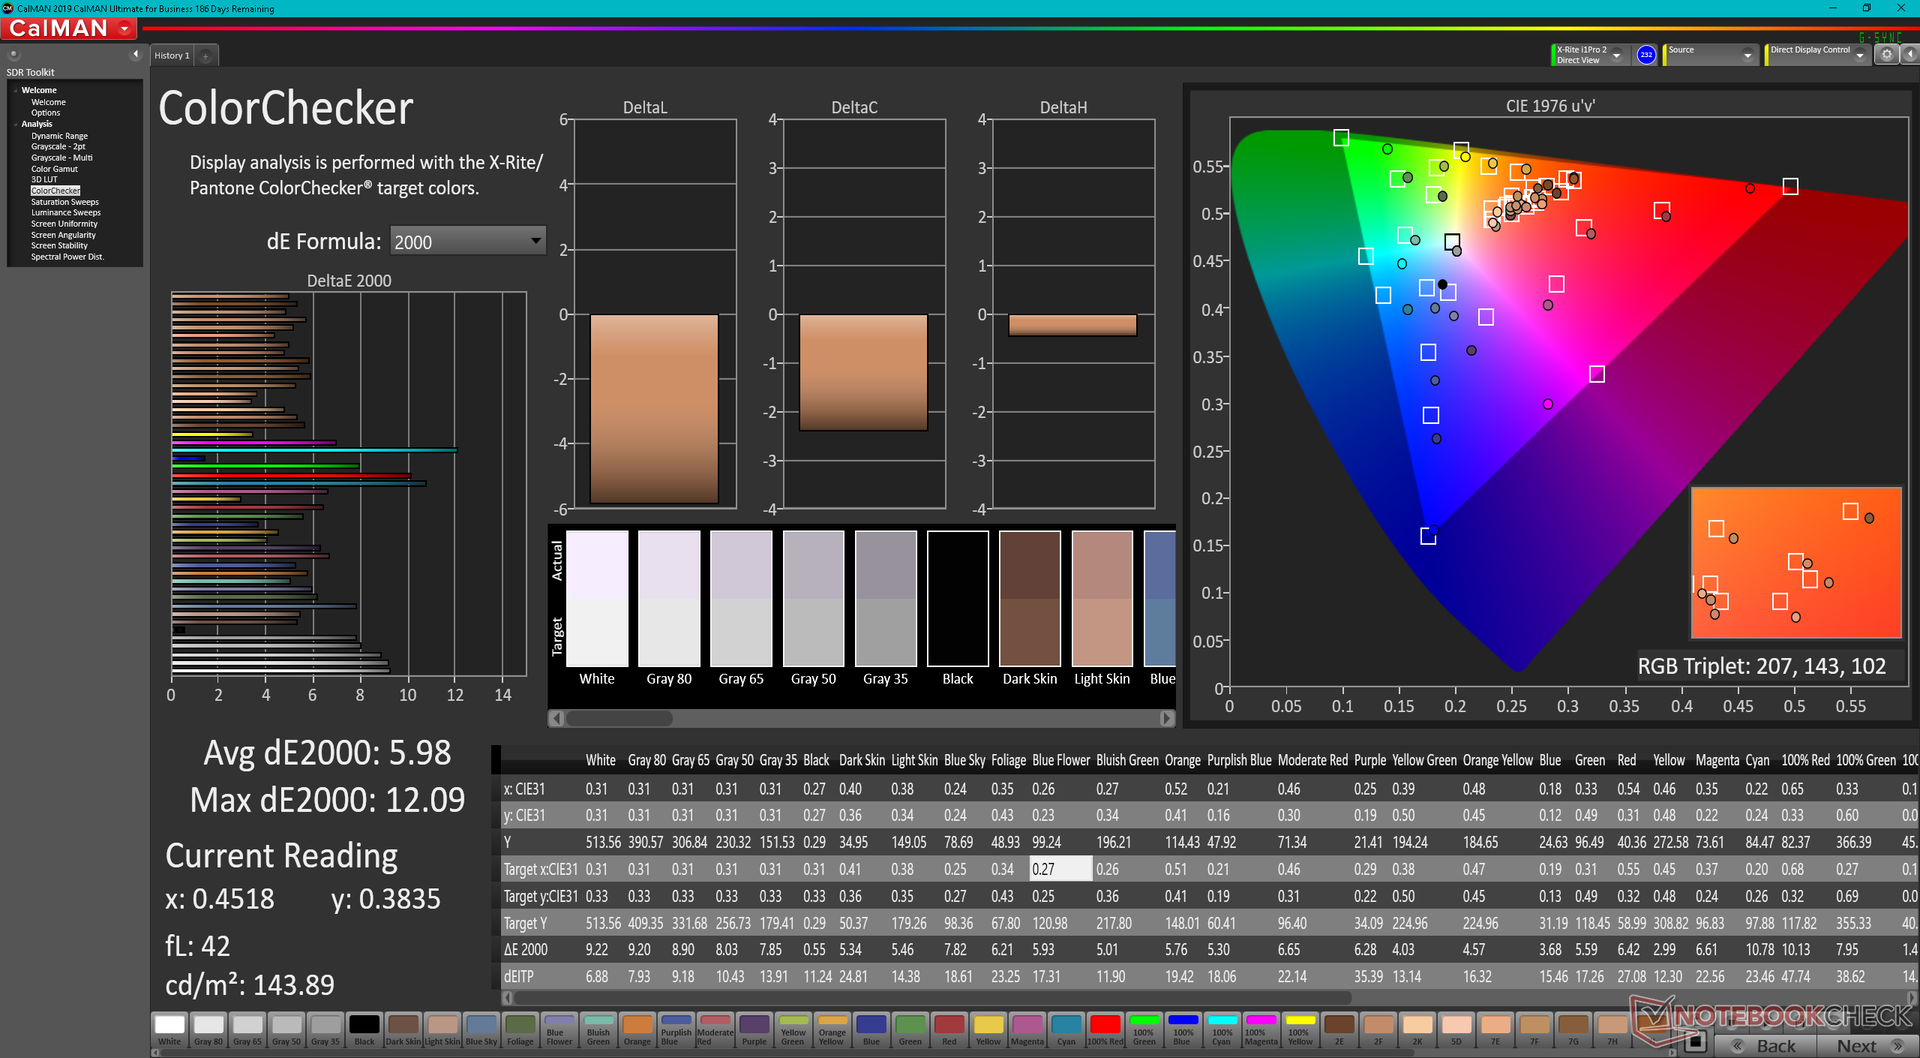
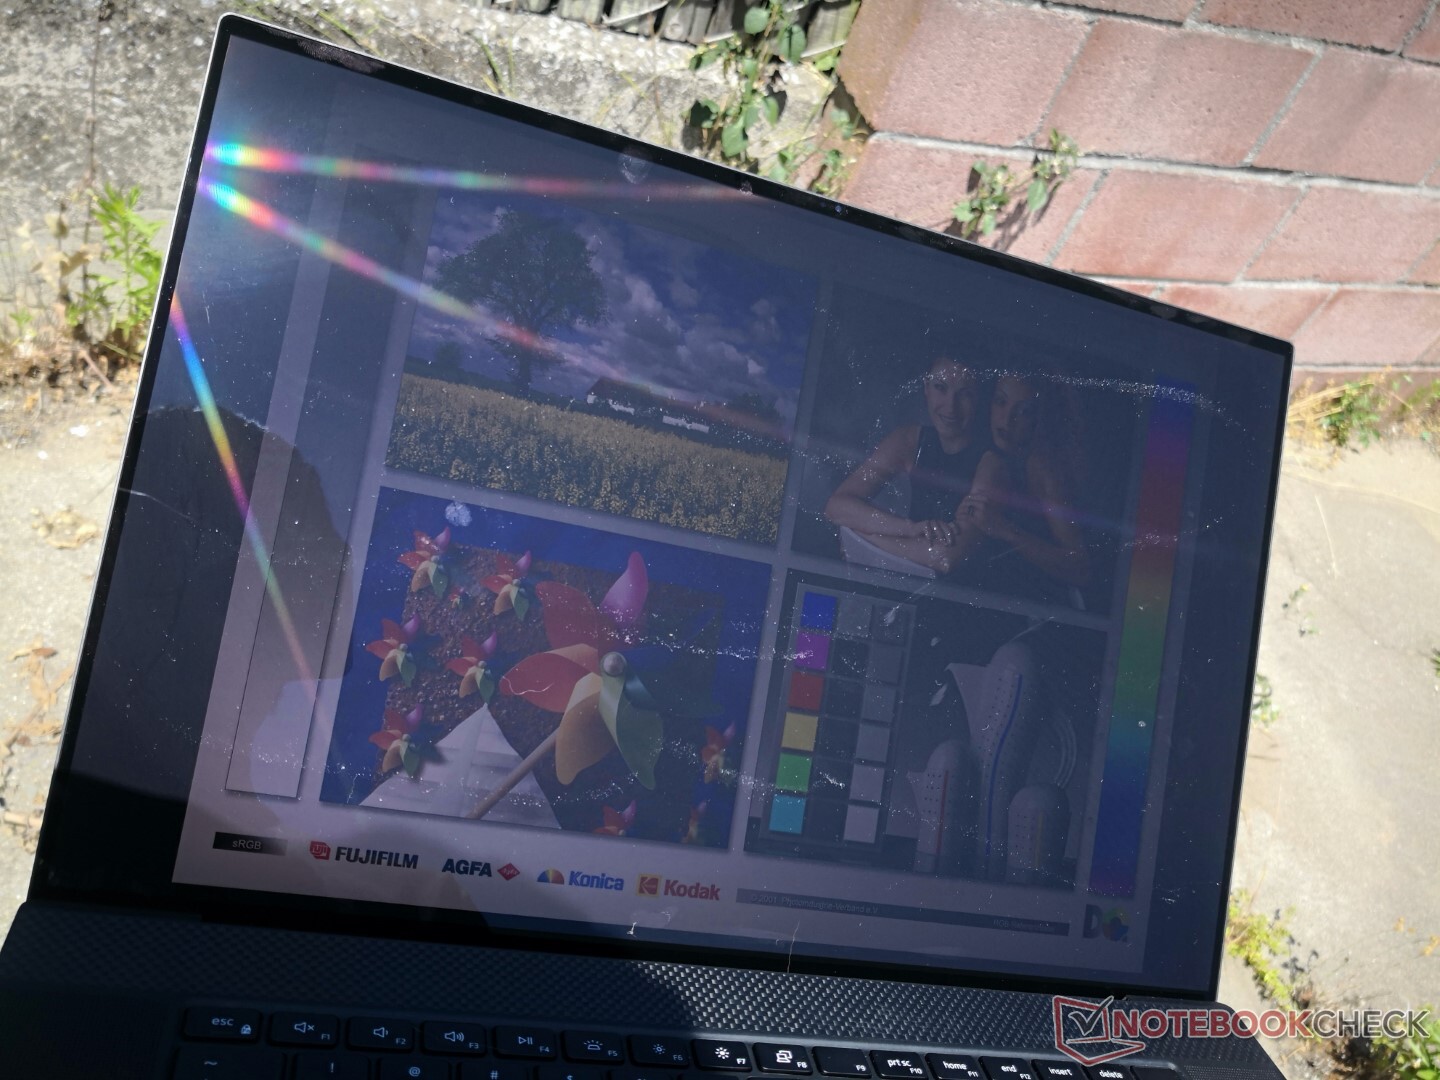
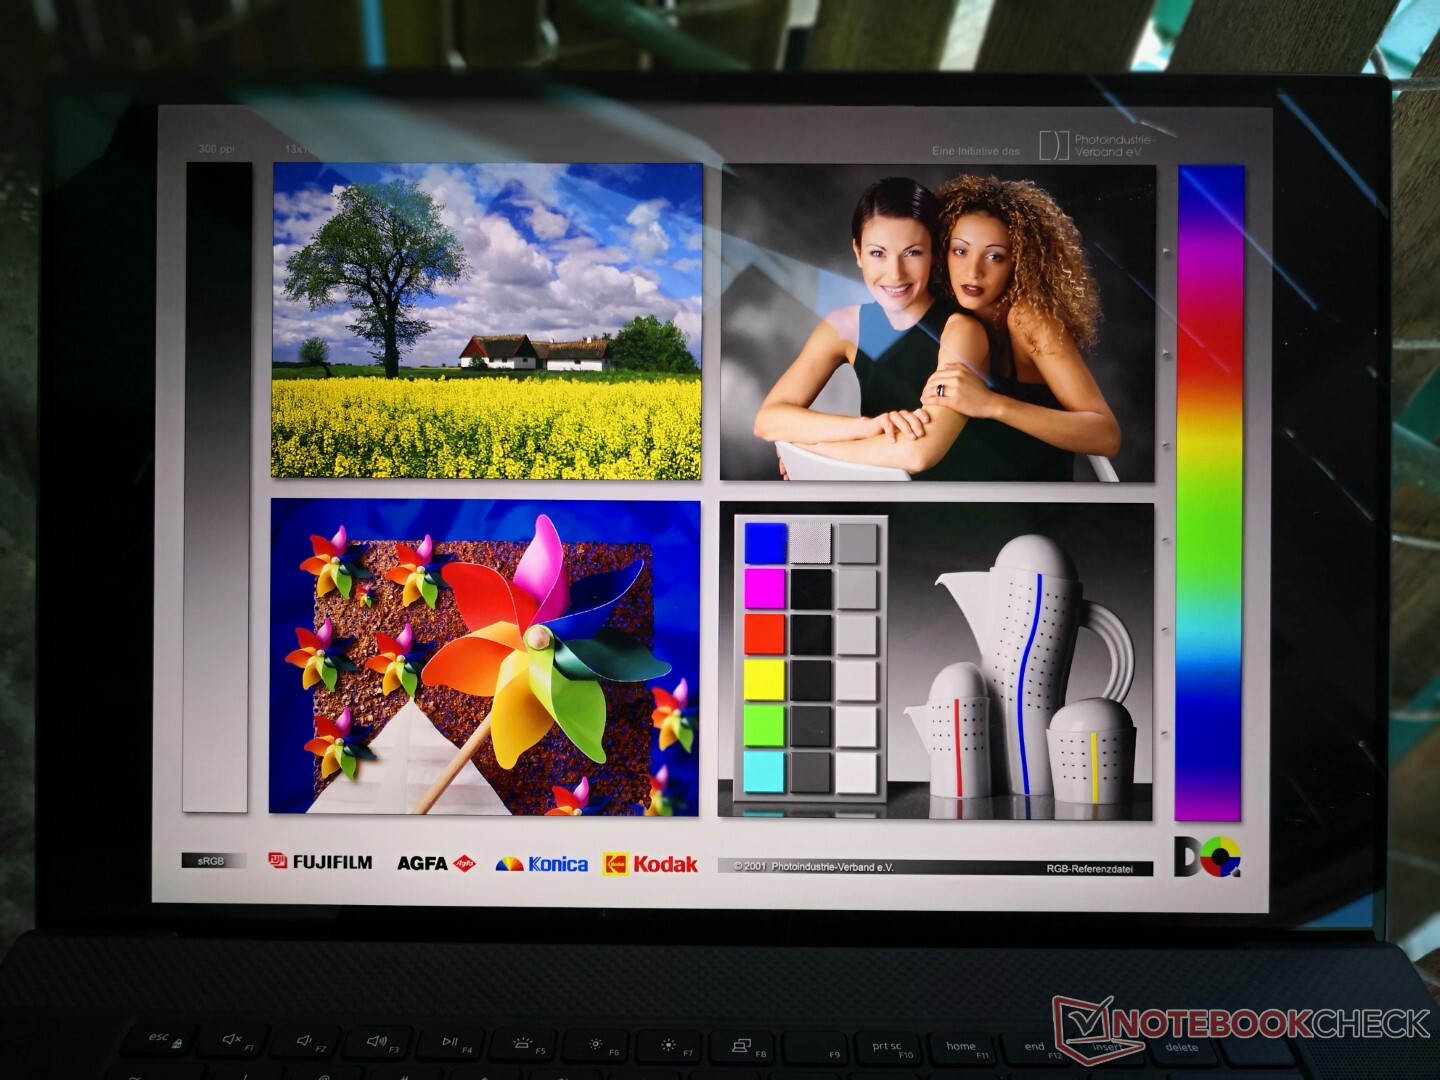
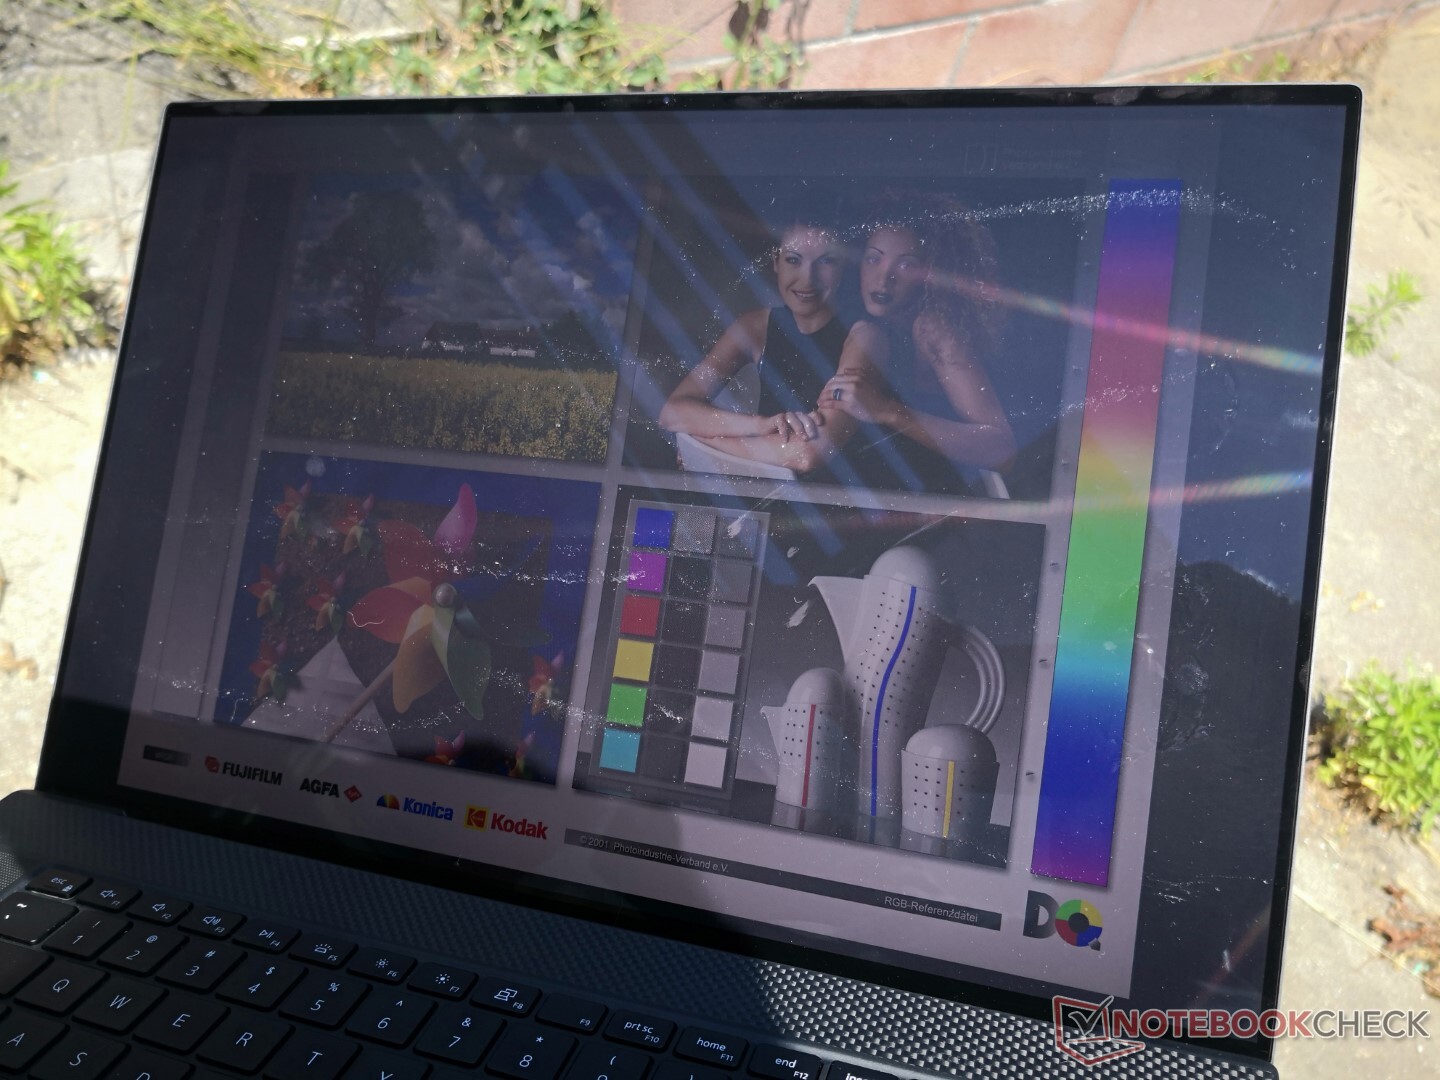
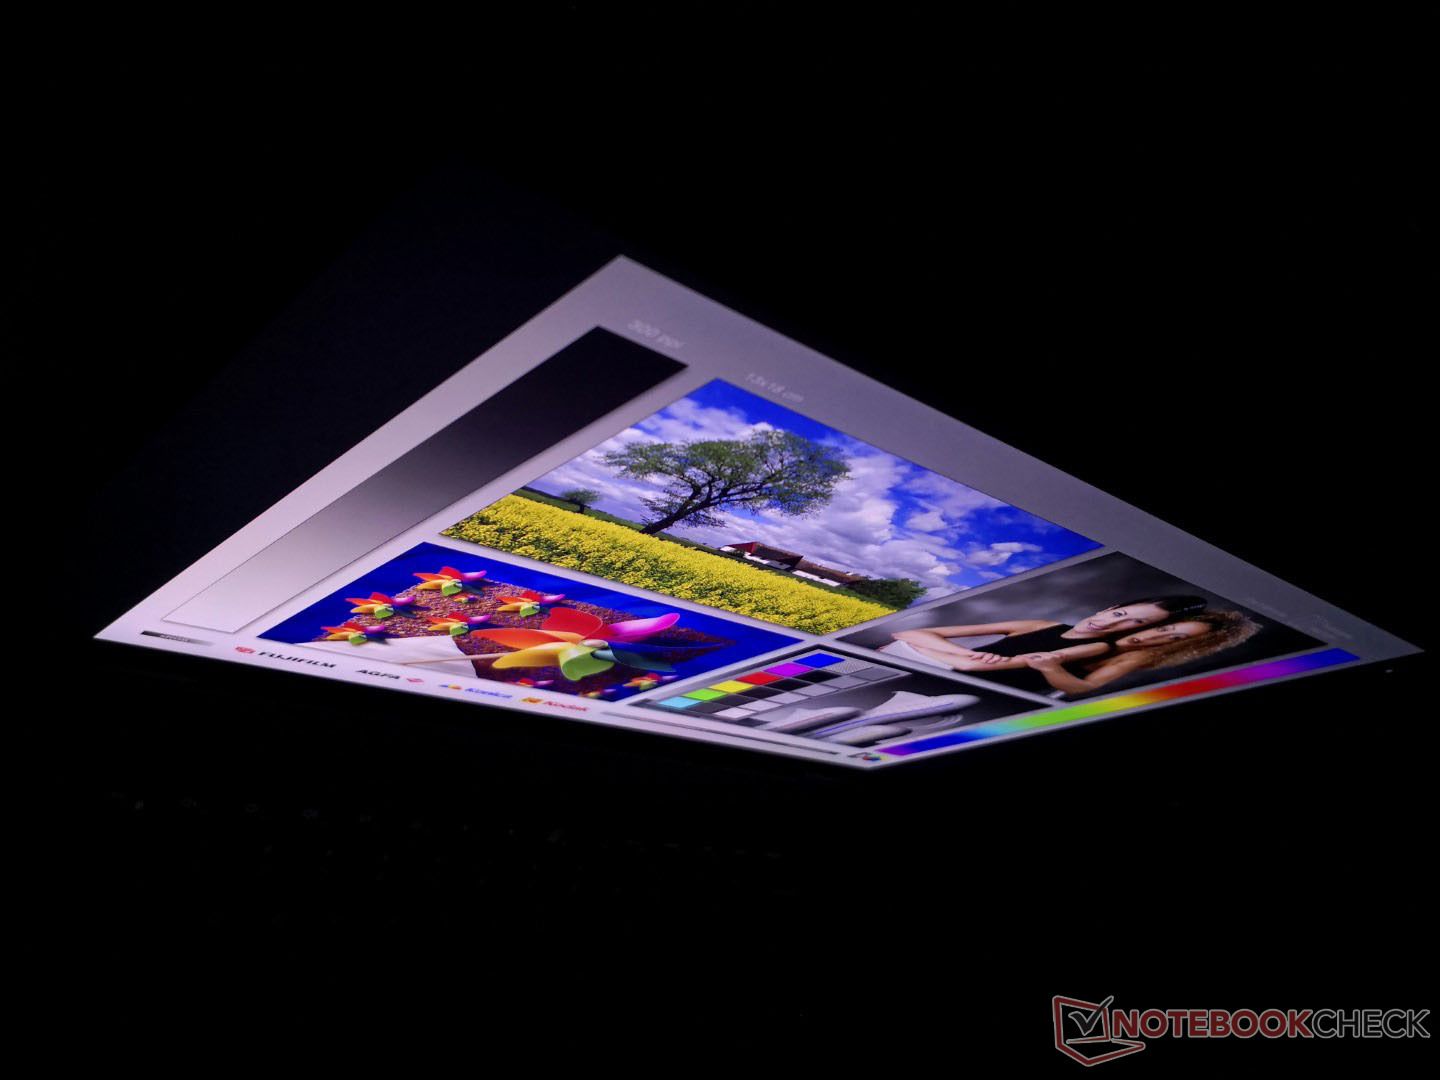
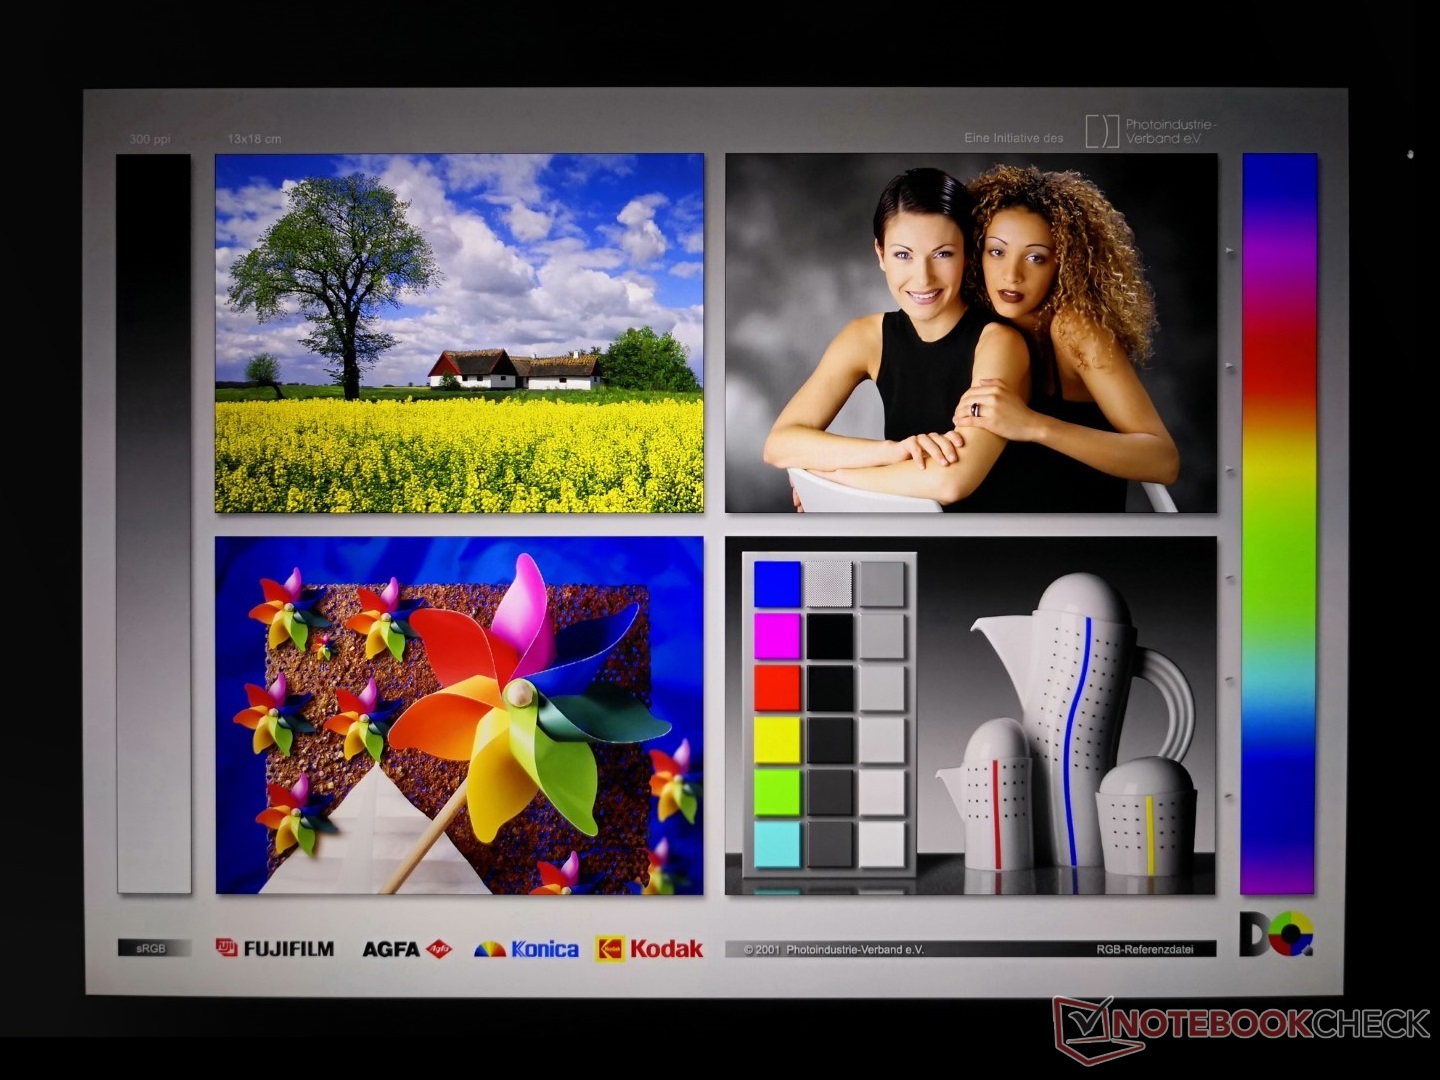
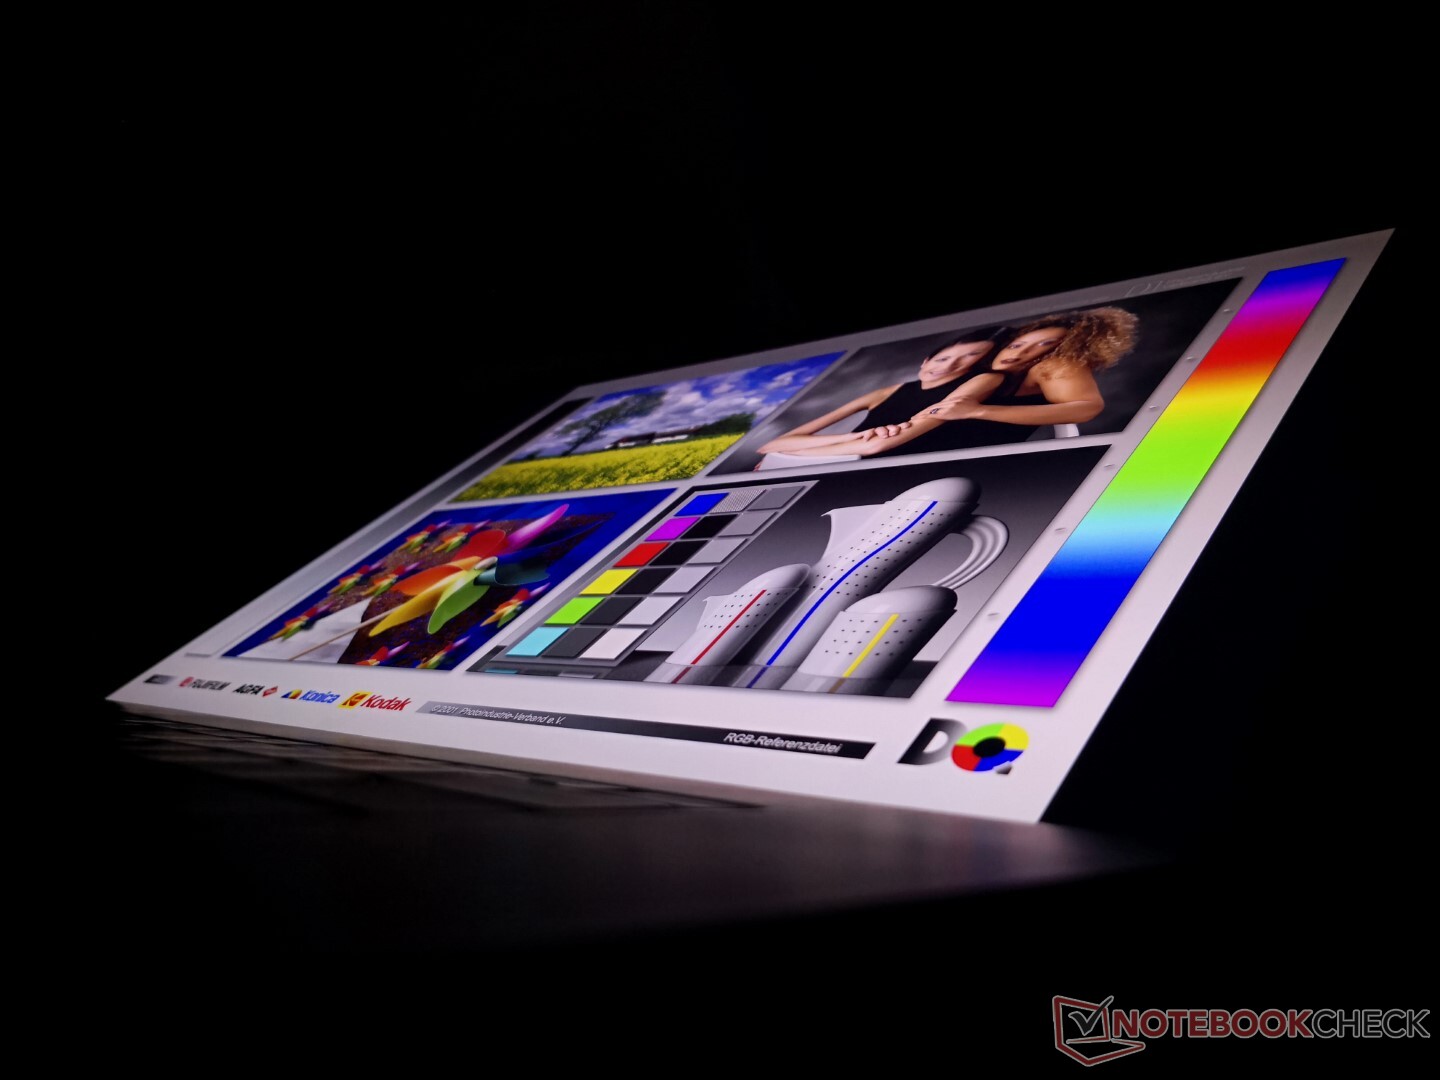
Skärm - 16:10 60 Hz IPS
Du kan välja mellan två bildskärmsalternativ (1200p och 2400p) jämfört med tre på XPS 15 9520. Panelen på vår enhet kommer med samma Sharp LQ170R1 IPS-panel som finns på XPS 17 9710 eller 9700 vilket innebär att visningsupplevelsen inte har förändrats sedan den ursprungliga 2020-modellen. Det var en utmärkt skärm då och det är den fortfarande nu, särskilt när det gäller kontrastförhållandet i förhållande till andra IPS-paneler, men vi skulle vilja se 90 Hz uppdateringsfrekvens eller snabbare alternativ i framtiden i likhet med vad som redan finns tillgängligt på den senaste IdeaPad Slim 7i Pro eller den kommande Zenbook Pro 14 Duo.
| |||||||||||||||||||||||||
Distribution av ljusstyrkan: 85 %
Mitt på batteriet: 512.7 cd/m²
Kontrast: 1602:1 (Svärta: 0.32 cd/m²)
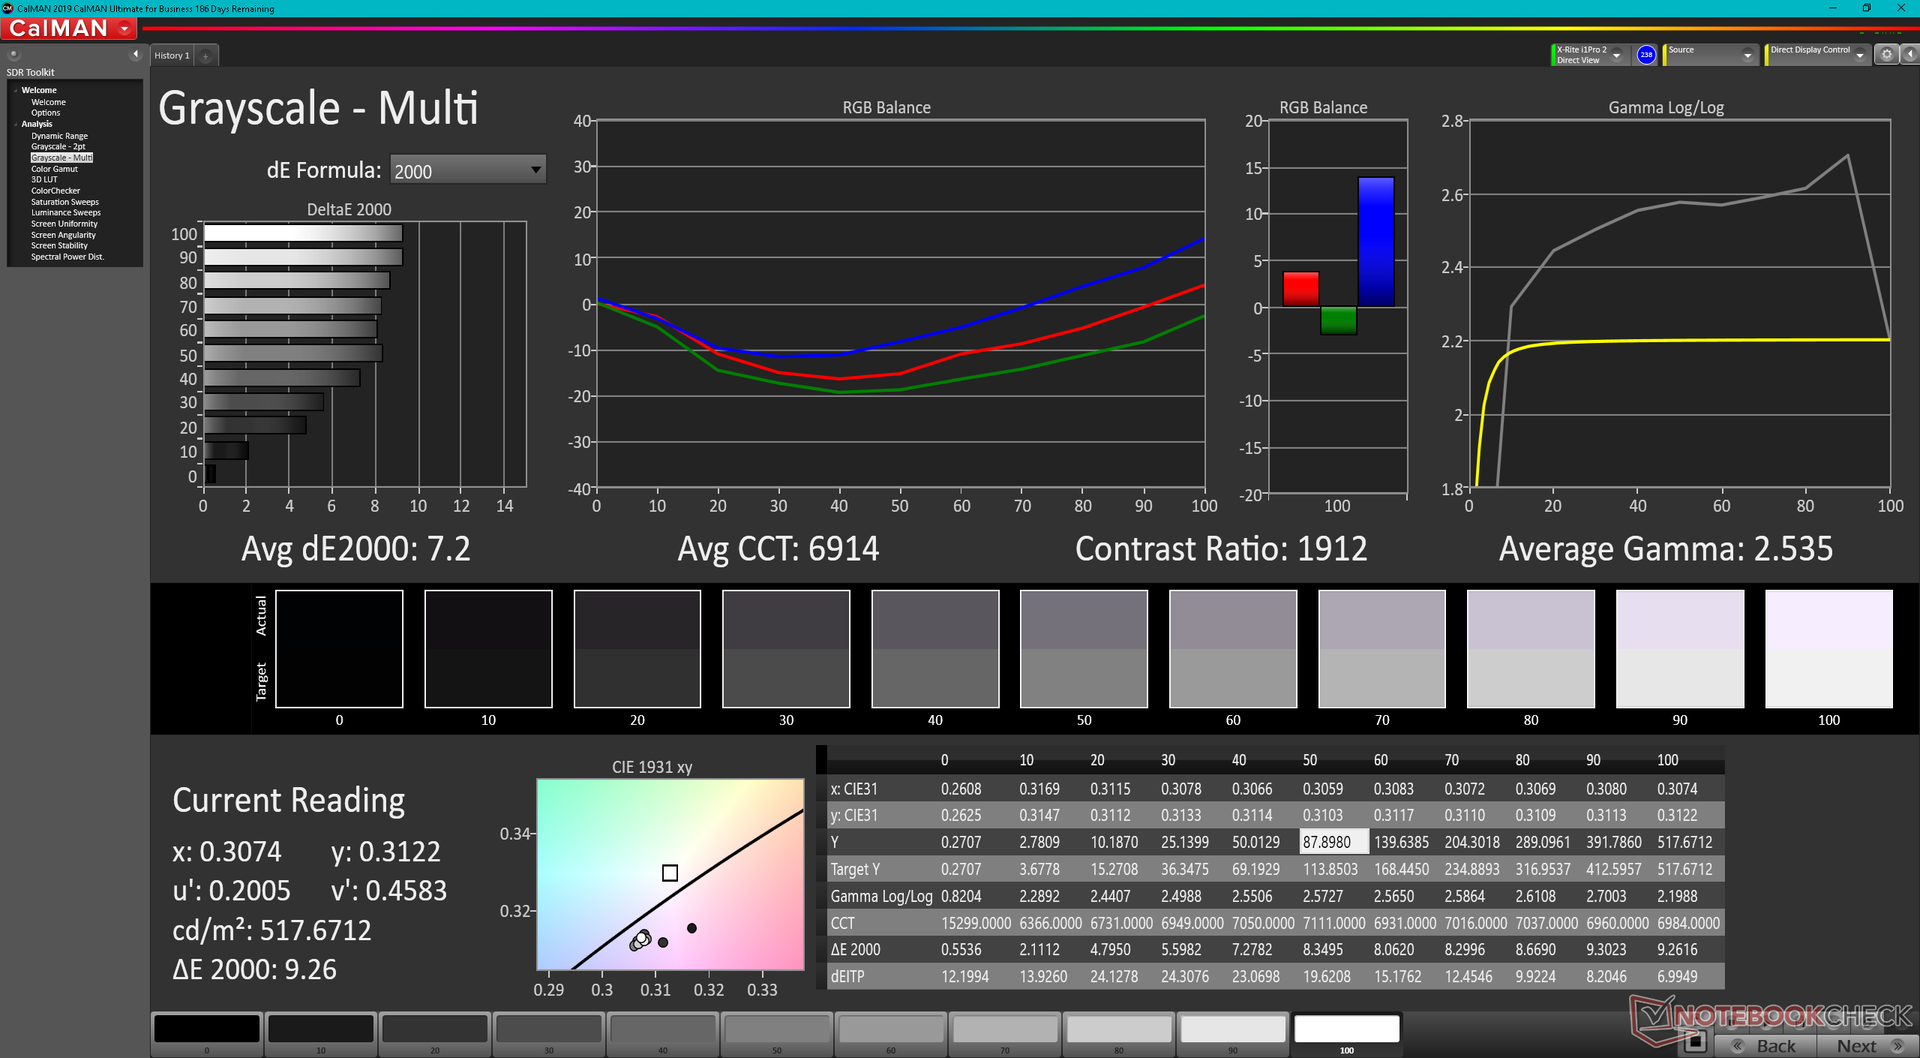
ΔE ColorChecker Calman: 5.98 | ∀{0.5-29.43 Ø4.71}
ΔE Greyscale Calman: 7.2 | ∀{0.09-98 Ø4.96}
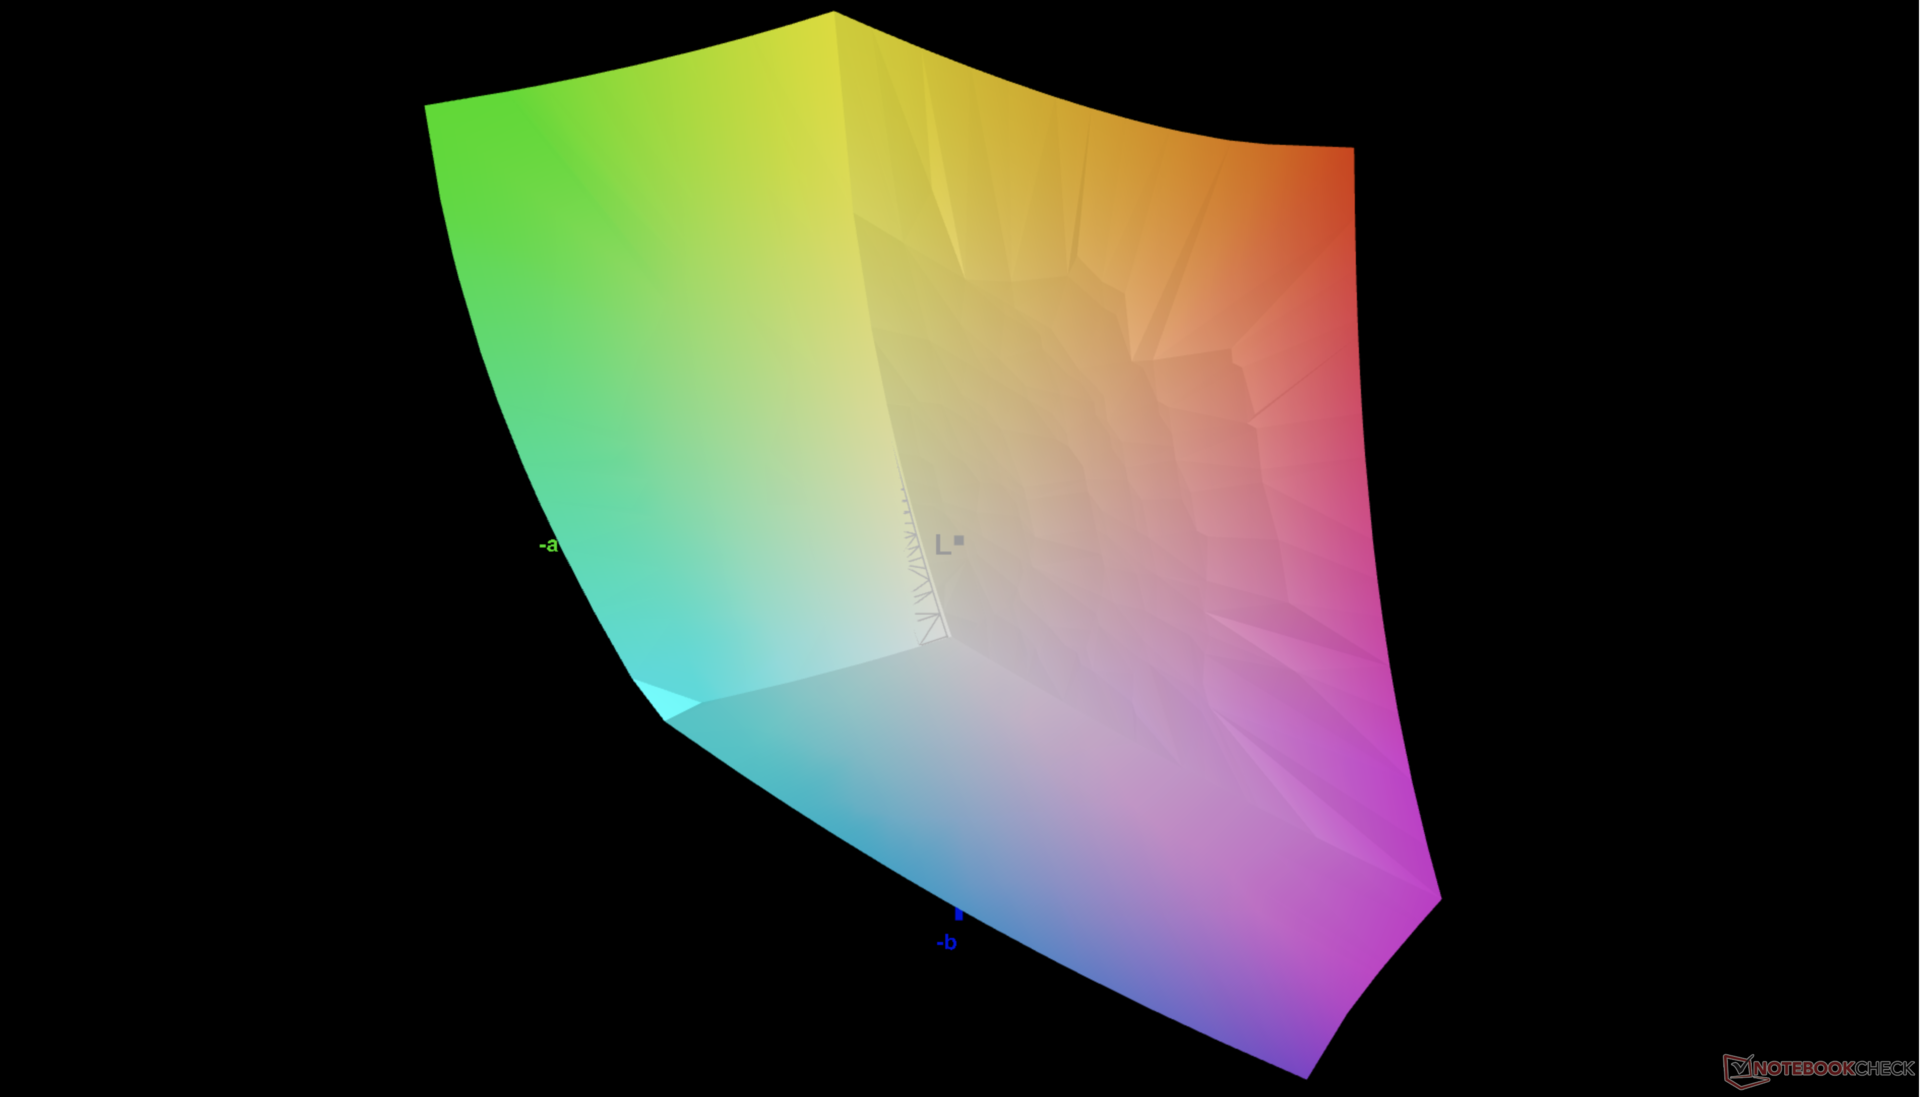
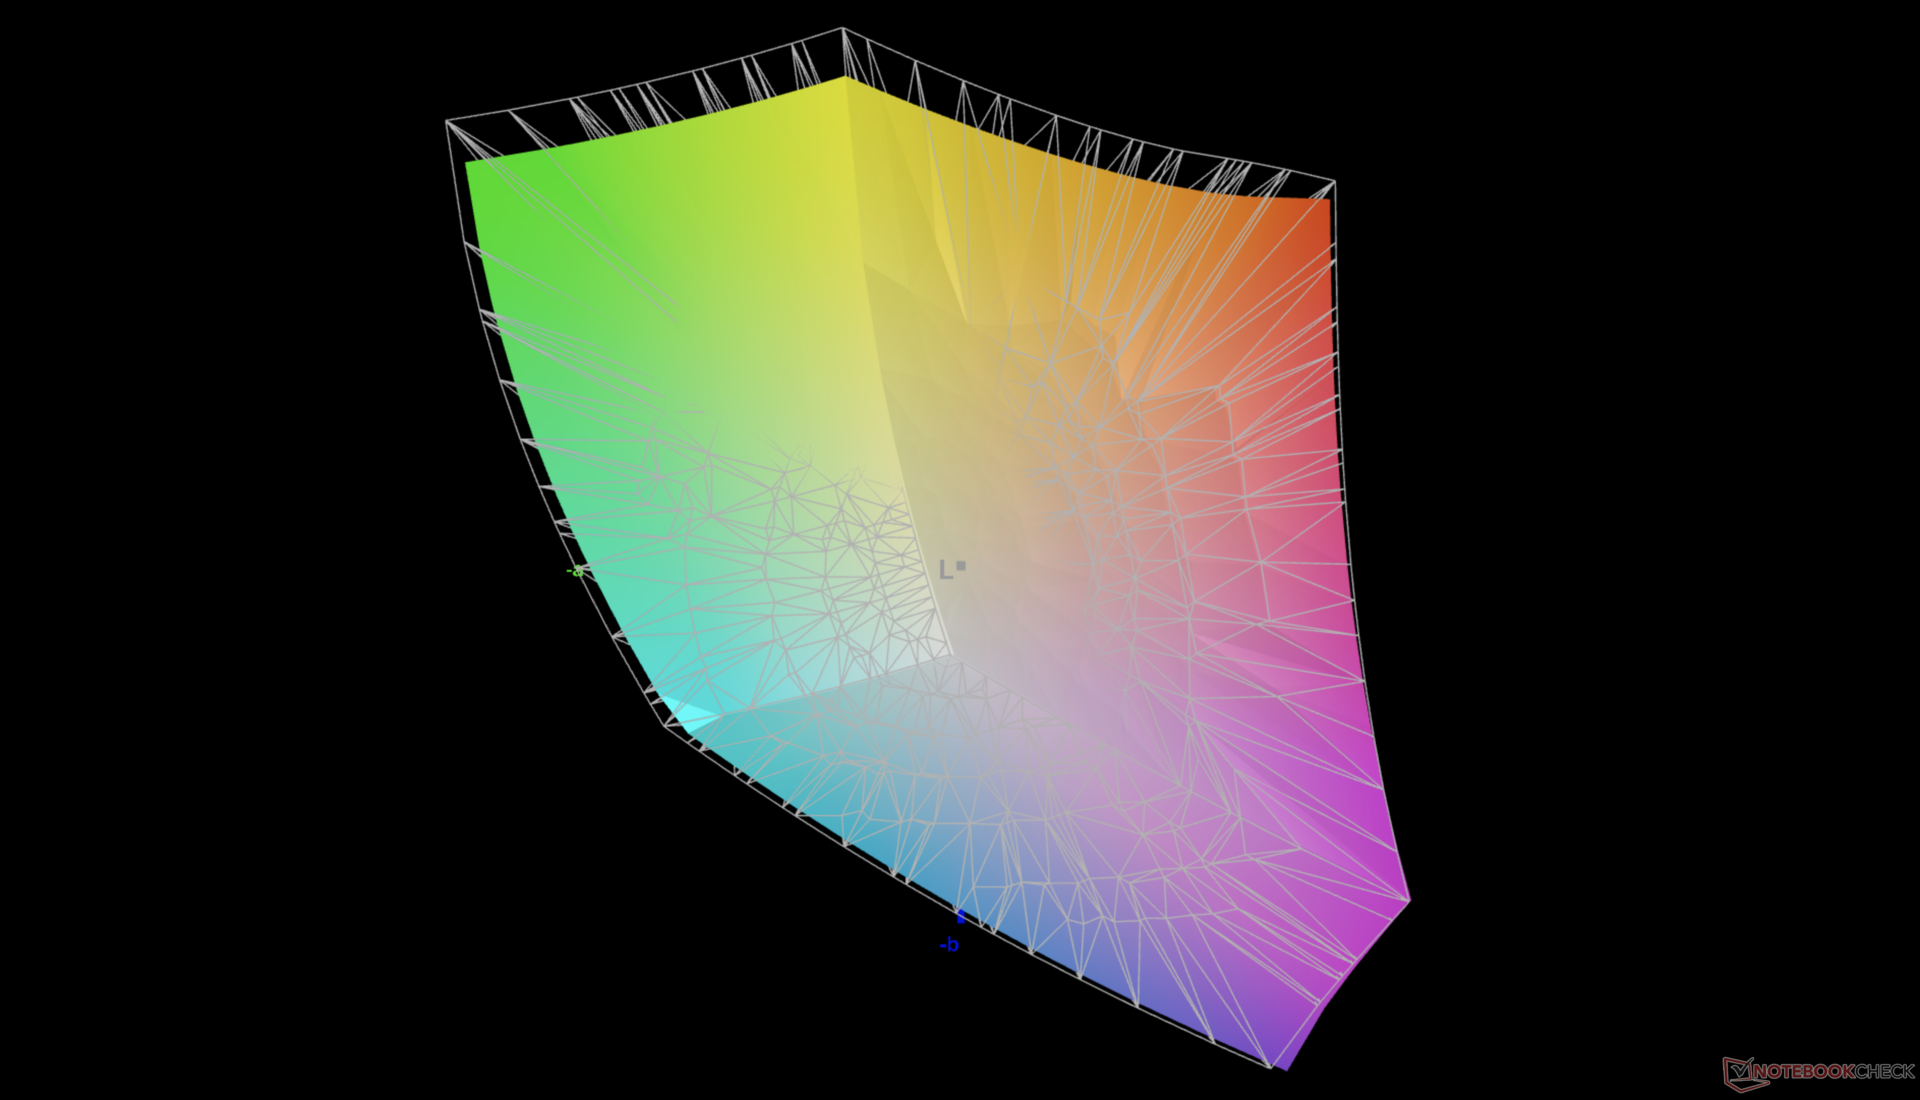
85.3% AdobeRGB 1998 (Argyll 3D)
100% sRGB (Argyll 3D)
92.9% Display P3 (Argyll 3D)
Gamma: 2.54
CCT: 6914 K
| Dell XPS 17 9720 RTX 3060 Sharp LQ170R1, IPS, 3840x2400, 17" | Dell XPS 17 9700 Core i7 RTX 2060 Max-Q Sharp LQ170R1, IPS, 3840x2400, 17" | Dell XPS 17 9700 i5-10300H SHP14D7, IPS, 1920x1200, 17.3" | HP Envy 17-cg AU Optronics AUO439D, IPS, 1920x1080, 17.3" | Lenovo Legion 5 17ACH6H-82JY0003GE LEN173FHD, IPS, 1920x1080, 17.3" | Asus VivoBook 17 F712JA-AU708W BOE NV173FHM-N49, IPS, 1920x1080, 17.3" | Razer Blade 17 (i7-12800H, RTX 3070 Ti) BOE CQ NE173QHM-NZ1 (BOE09F9), IPS, 2560x1440, 17.3" | |
|---|---|---|---|---|---|---|---|
| Display | 5% | -9% | -17% | -18% | -50% | 2% | |
| Display P3 Coverage (%) | 92.9 | 90.5 -3% | 77.4 -17% | 68 -27% | 64.8 -30% | 39.53 -57% | 97.9 5% |
| sRGB Coverage (%) | 100 | 100 0% | 100 0% | 95 -5% | 97.2 -3% | 58.85 -41% | 99.9 0% |
| AdobeRGB 1998 Coverage (%) | 85.3 | 99.8 17% | 76.6 -10% | 69 -19% | 66.7 -22% | 40.84 -52% | 85.5 0% |
| Response Times | 5% | -13% | 19% | 73% | 57% | 69% | |
| Response Time Grey 50% / Grey 80% * (ms) | 51.2 ? | 51.2 ? -0% | 60.4 ? -18% | 40 ? 22% | 15 ? 71% | 22 ? 57% | 15.2 ? 70% |
| Response Time Black / White * (ms) | 35.2 ? | 32 ? 9% | 37.6 ? -7% | 30 ? 15% | 9 ? 74% | 15 ? 57% | 11.2 ? 68% |
| PWM Frequency (Hz) | 2500 ? | ||||||
| Screen | 20% | 33% | 6% | 16% | -16% | -9% | |
| Brightness middle (cd/m²) | 512.7 | 539.4 5% | 636 24% | 347 -32% | 323 -37% | 269 -48% | 341 -33% |
| Brightness (cd/m²) | 463 | 494 7% | 580 25% | 329 -29% | 305 -34% | 263 -43% | 308 -33% |
| Brightness Distribution (%) | 85 | 84 -1% | 86 1% | 89 5% | 89 5% | 88 4% | 82 -4% |
| Black Level * (cd/m²) | 0.32 | 0.32 -0% | 0.34 -6% | 0.27 16% | 0.25 22% | 0.3 6% | 0.45 -41% |
| Contrast (:1) | 1602 | 1686 5% | 1871 17% | 1285 -20% | 1292 -19% | 897 -44% | 758 -53% |
| Colorchecker dE 2000 * | 5.98 | 4.12 31% | 2.4 60% | 3.75 37% | 1.87 69% | 5.8 3% | 4.16 30% |
| Colorchecker dE 2000 max. * | 12.09 | 7.65 37% | 3.5 71% | 7.53 38% | 4.84 60% | 18.46 -53% | 8.14 33% |
| Greyscale dE 2000 * | 7.2 | 1.5 79% | 2 72% | 4.88 32% | 2.57 64% | 3.64 49% | 5.09 29% |
| Gamma | 2.54 87% | 2.15 102% | 2.08 106% | 2.53 87% | 2.42 91% | 2.35 94% | 2.48 89% |
| CCT | 6914 94% | 6438 101% | 6704 97% | 6624 98% | 7012 93% | 6995 93% | 6884 94% |
| Colorchecker dE 2000 calibrated * | 3.91 | 1.5 | 0.92 | 3 | |||
| Color Space (Percent of AdobeRGB 1998) (%) | 90.4 | 67.5 | |||||
| Color Space (Percent of sRGB) (%) | 100 | 100 | |||||
| Totalt genomsnitt (program/inställningar) | 10% /
14% | 4% /
16% | 3% /
3% | 24% /
17% | -3% /
-12% | 21% /
5% |
* ... mindre är bättre
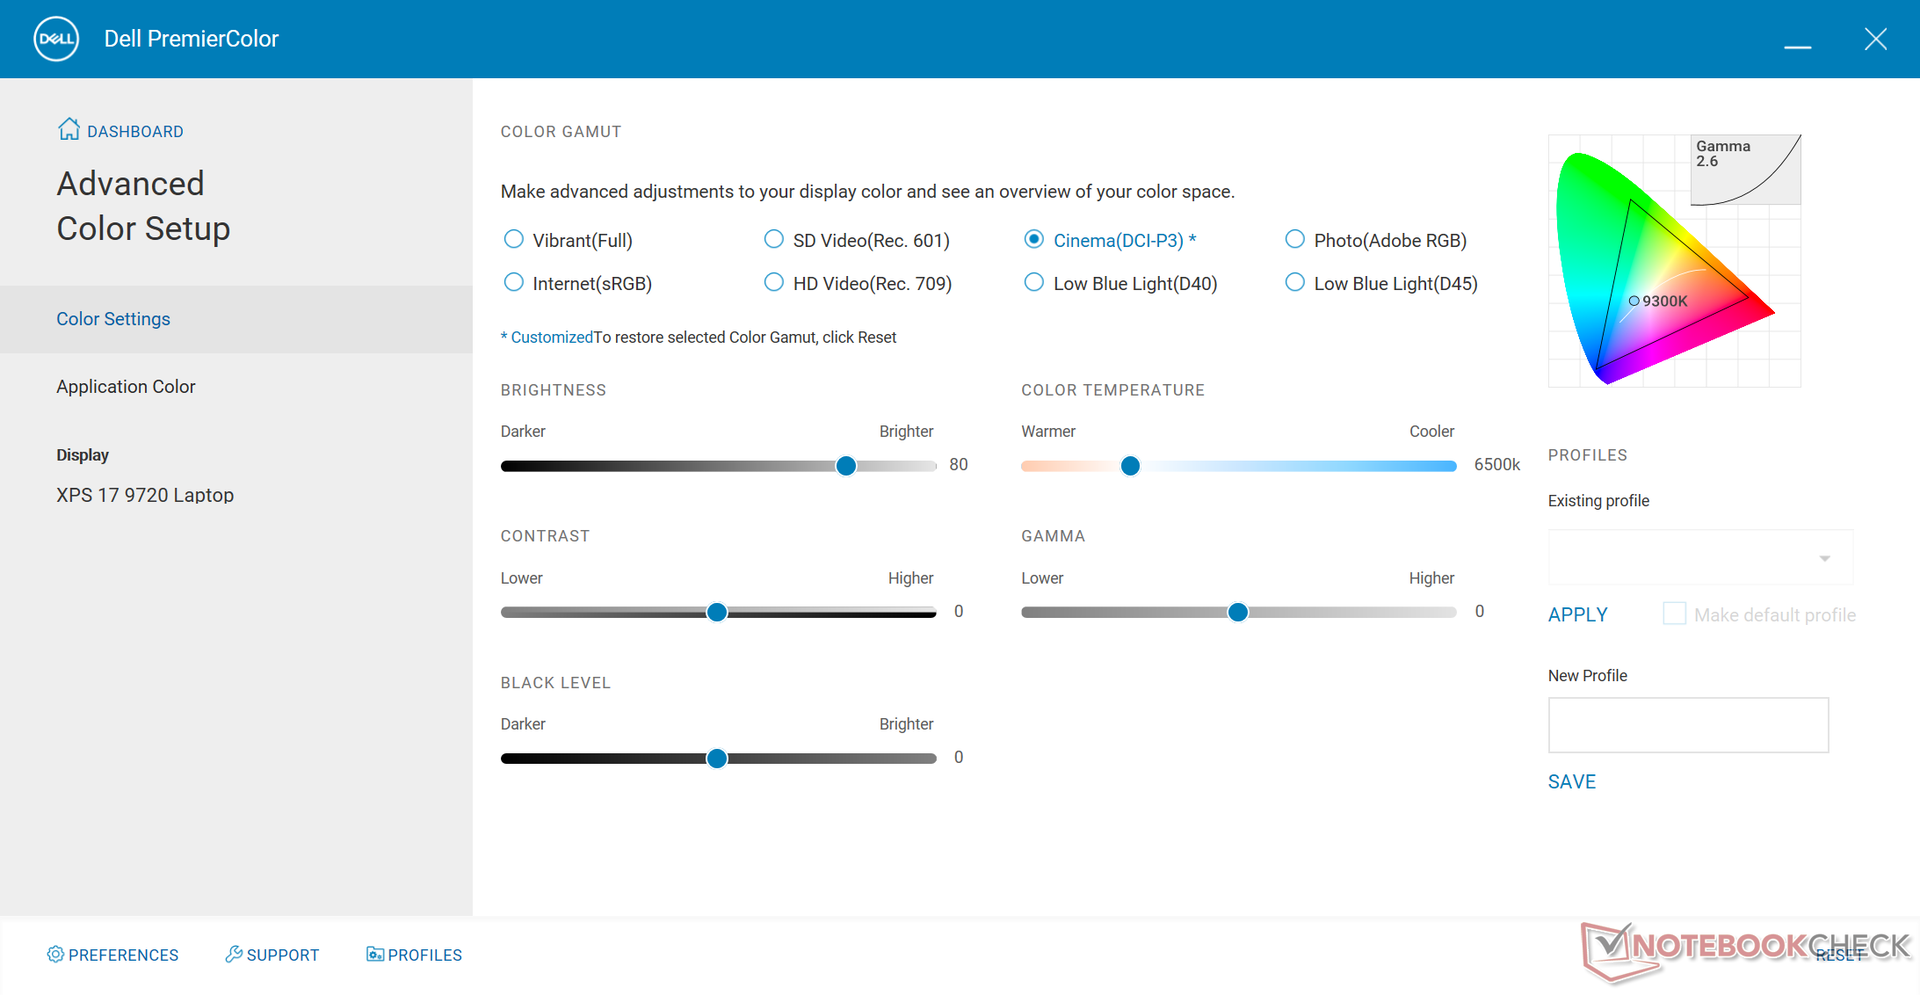
Färgtemperaturen är varmare än förväntat när den är inställd på DCI-P3-färgstandarden via Dell PremierColor-programvaran. Till skillnad från många bärbara datorer för professionellt bruk som Dell Precision, Gigabyte Aero eller HP ZBook-serien är XPS-serien inte X-Rite-kalibrerad på fabriken. En kalibrering av slutanvändaren skulle vara nödvändig för att bättre utnyttja panelens breda färgskala.
Visa svarstider
| ↔ Svarstid svart till vitt | ||
|---|---|---|
| 35.2 ms ... stiga ↗ och falla ↘ kombinerat | ↗ 18.8 ms stiga | 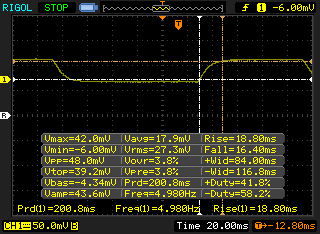 |
| ↘ 16.4 ms hösten | ||
| Skärmen visar långsamma svarsfrekvenser i våra tester och kommer att vara otillfredsställande för spelare. I jämförelse sträcker sig alla testade enheter från 0.1 (minst) till 240 (maximalt) ms. » 93 % av alla enheter är bättre. Detta innebär att den uppmätta svarstiden är sämre än genomsnittet av alla testade enheter (19.8 ms). | ||
| ↔ Svarstid 50 % grått till 80 % grått | ||
| 51.2 ms ... stiga ↗ och falla ↘ kombinerat | ↗ 26 ms stiga | 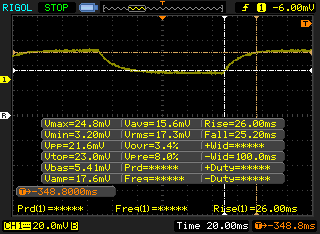 |
| ↘ 25.2 ms hösten | ||
| Skärmen visar långsamma svarsfrekvenser i våra tester och kommer att vara otillfredsställande för spelare. I jämförelse sträcker sig alla testade enheter från 0.165 (minst) till 636 (maximalt) ms. » 88 % av alla enheter är bättre. Detta innebär att den uppmätta svarstiden är sämre än genomsnittet av alla testade enheter (31 ms). | ||
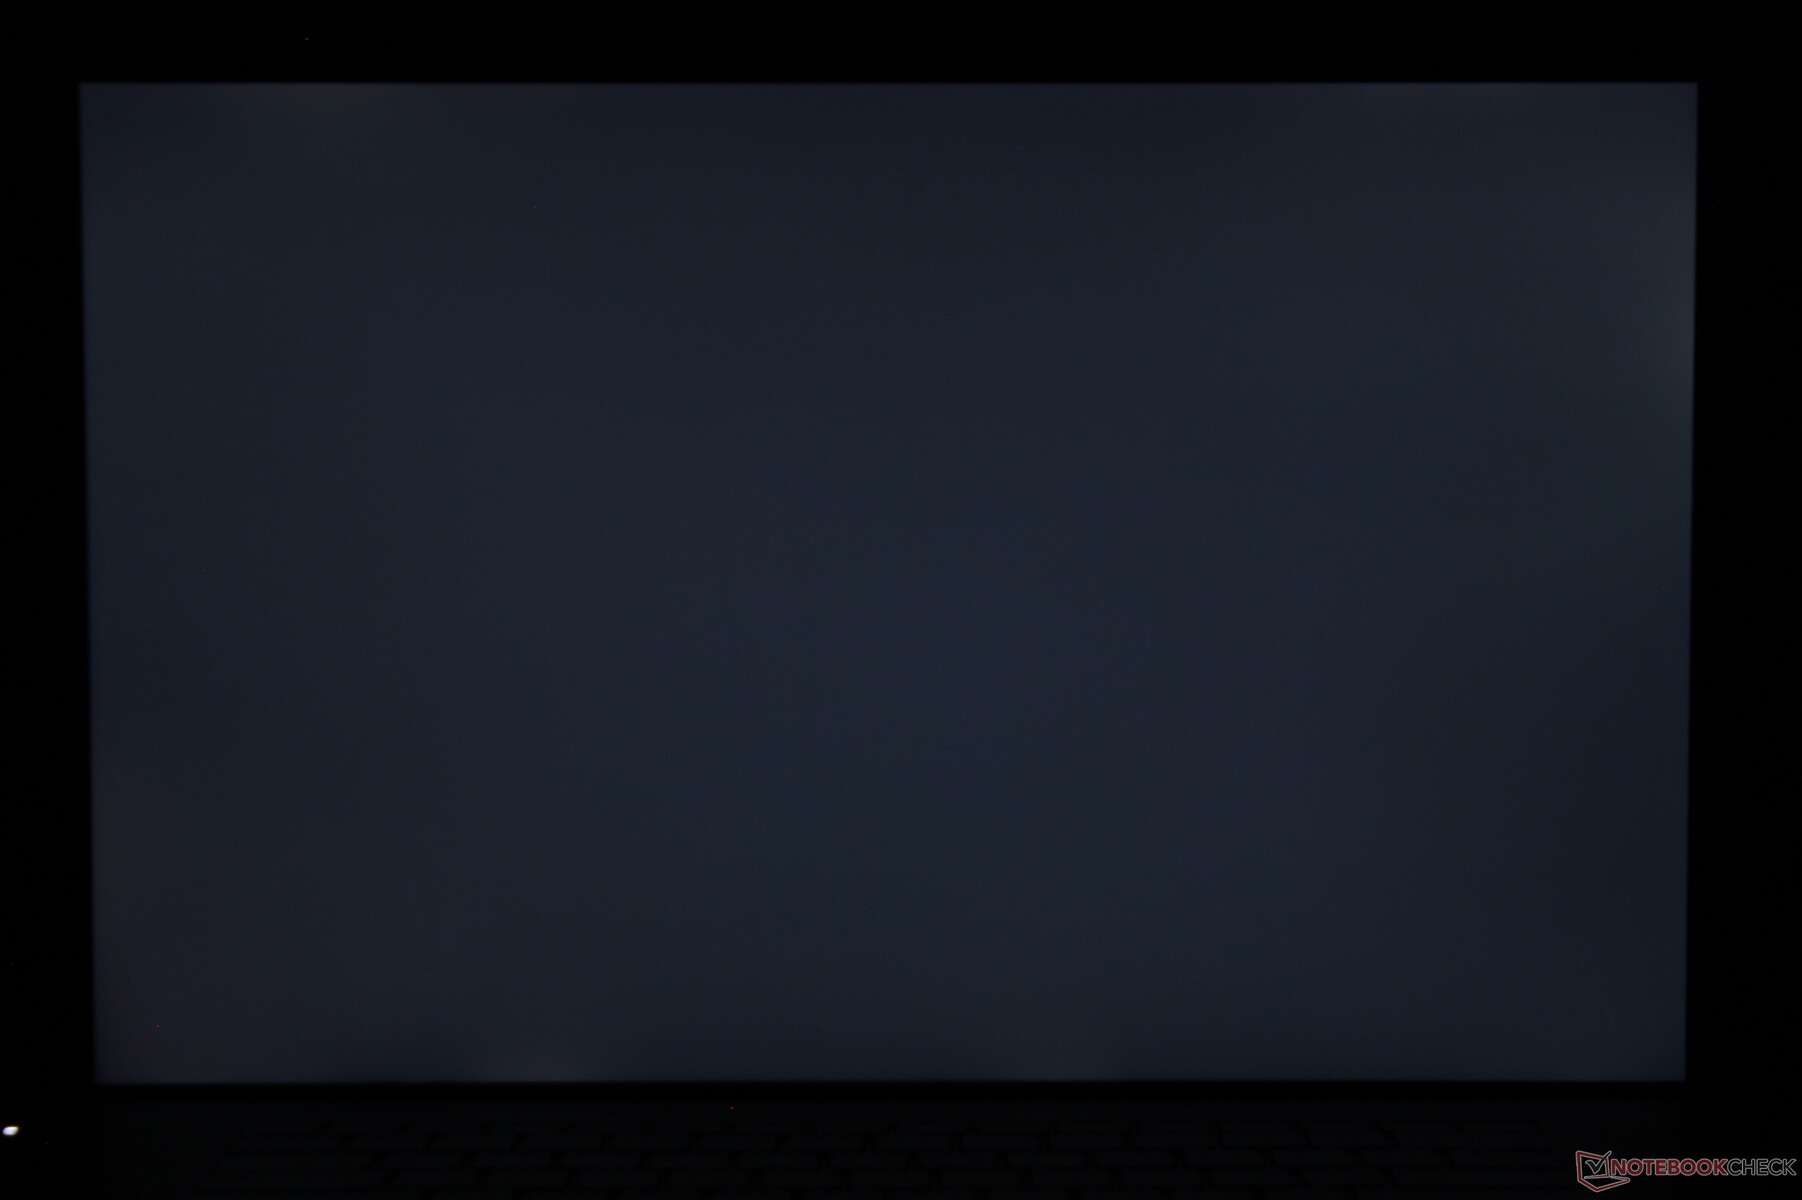
Skärmflimmer / PWM (Puls-Width Modulation)
| Skärmflimmer / PWM upptäcktes inte |  | ||
Som jämförelse: 52 % av alla testade enheter använder inte PWM för att dämpa skärmen. Om PWM upptäcktes mättes ett medelvärde av 7757 (minst: 5 - maximum: 343500) Hz. | |||
Prestationer - Alder Lake-H höjer priset
Provningsförhållanden
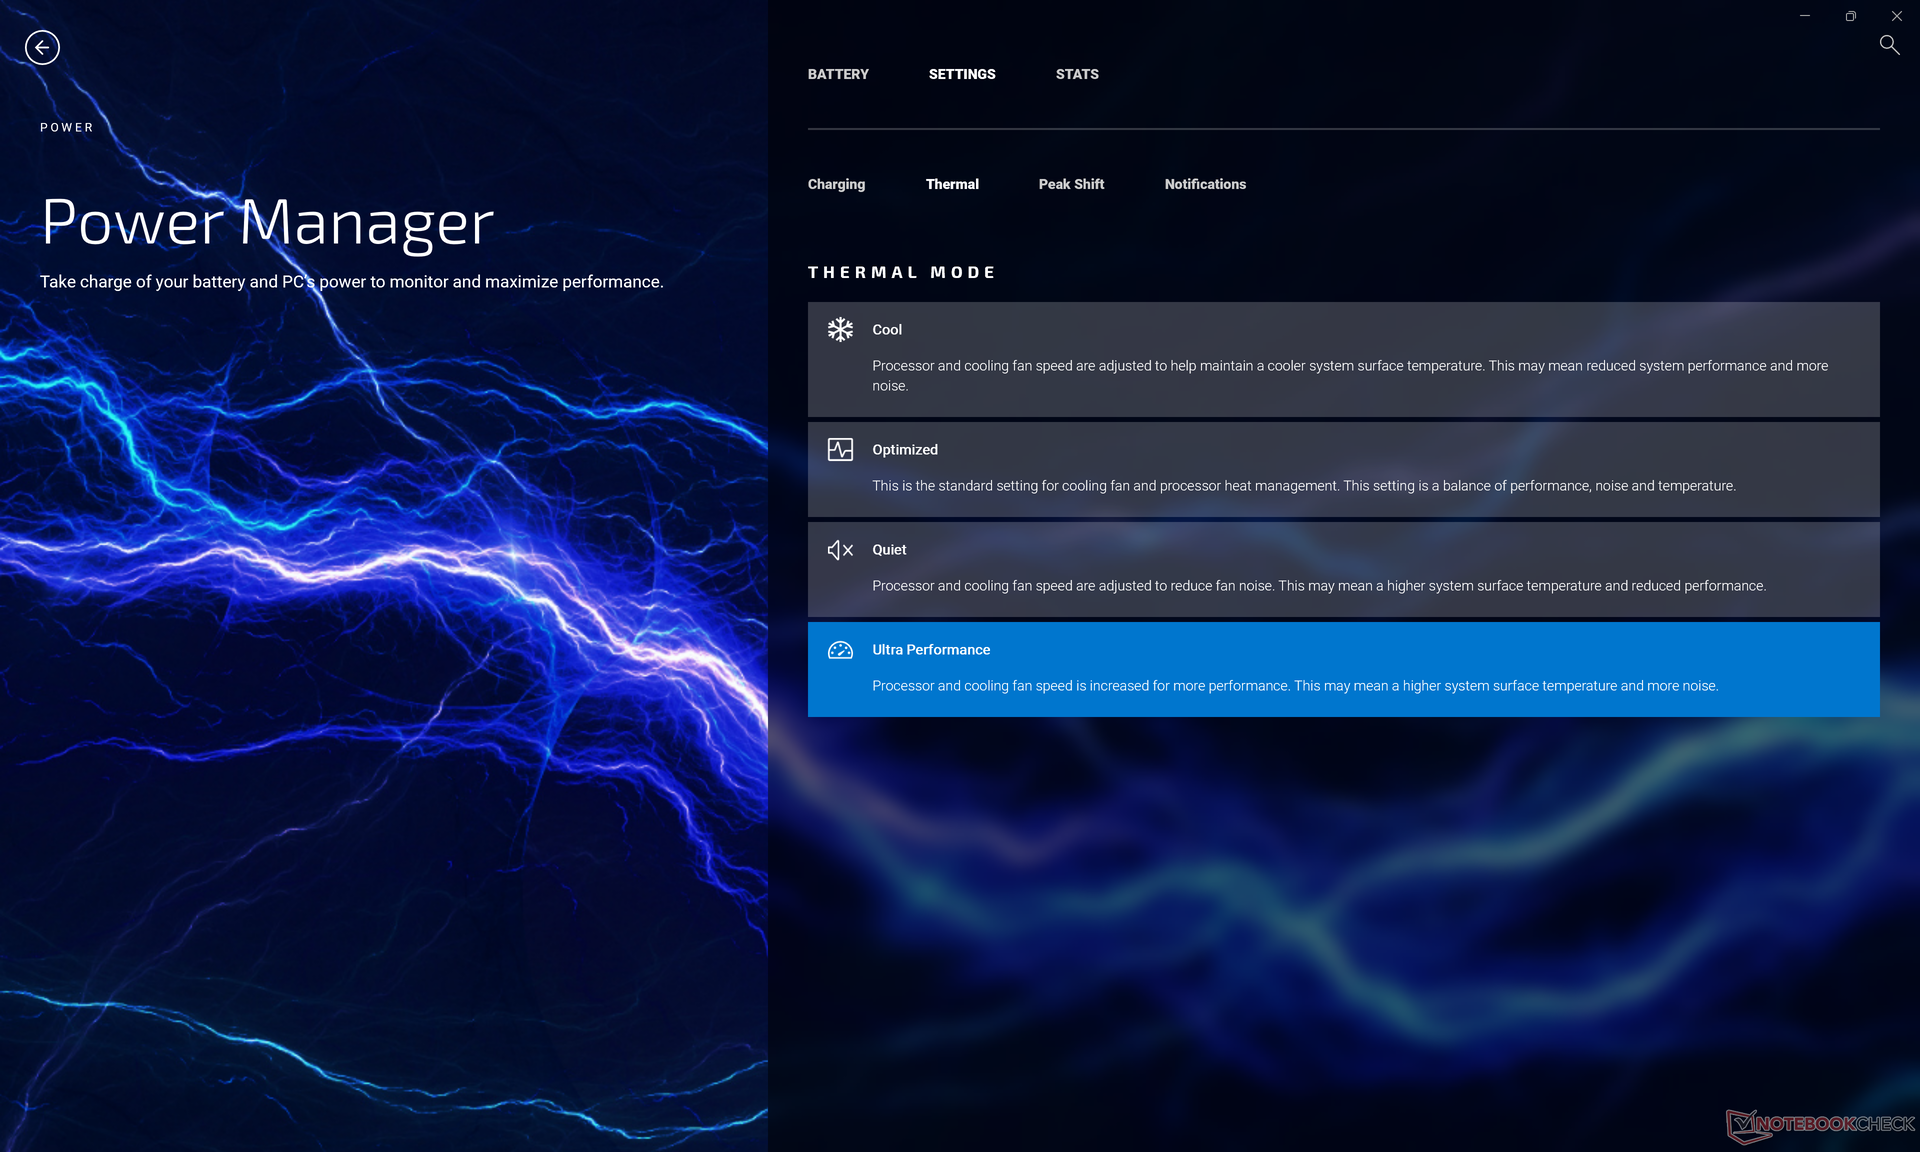
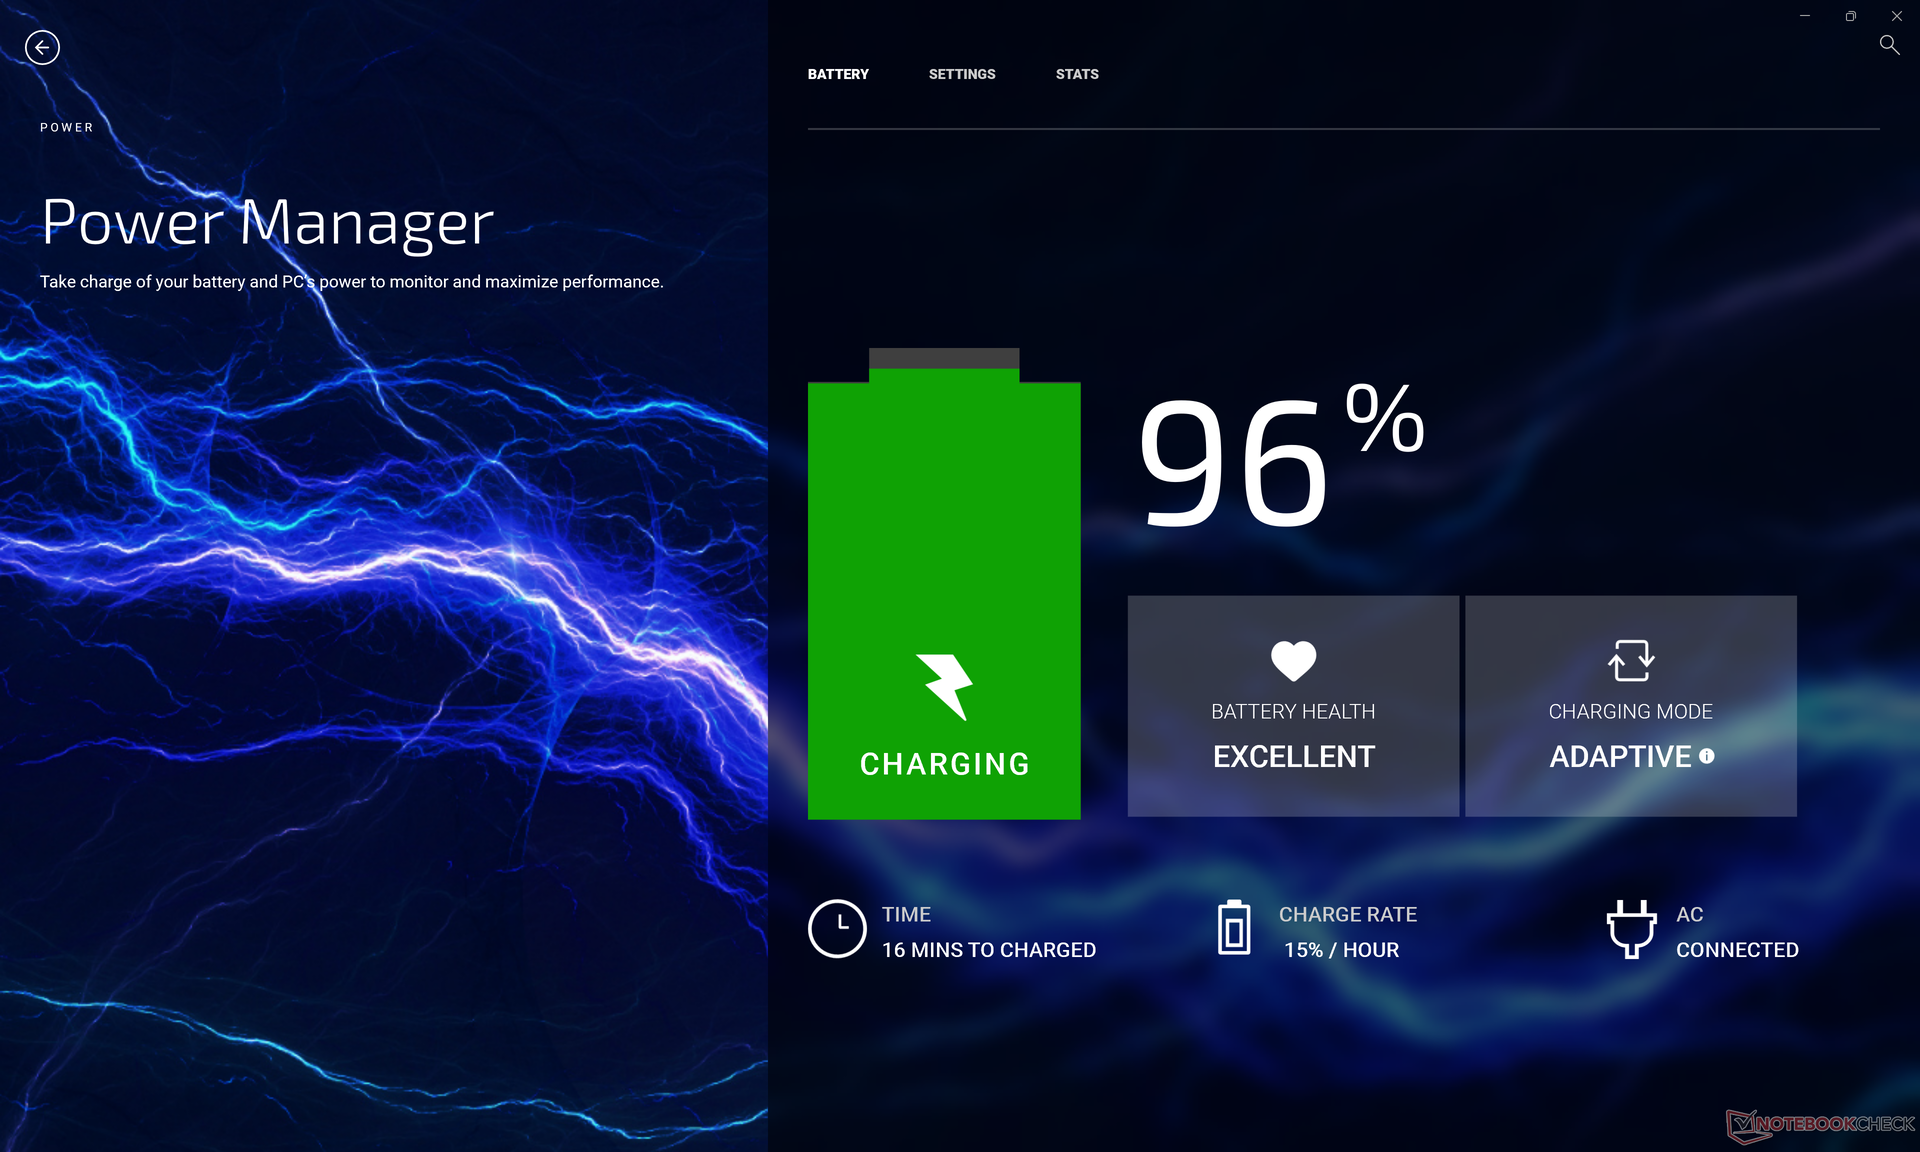
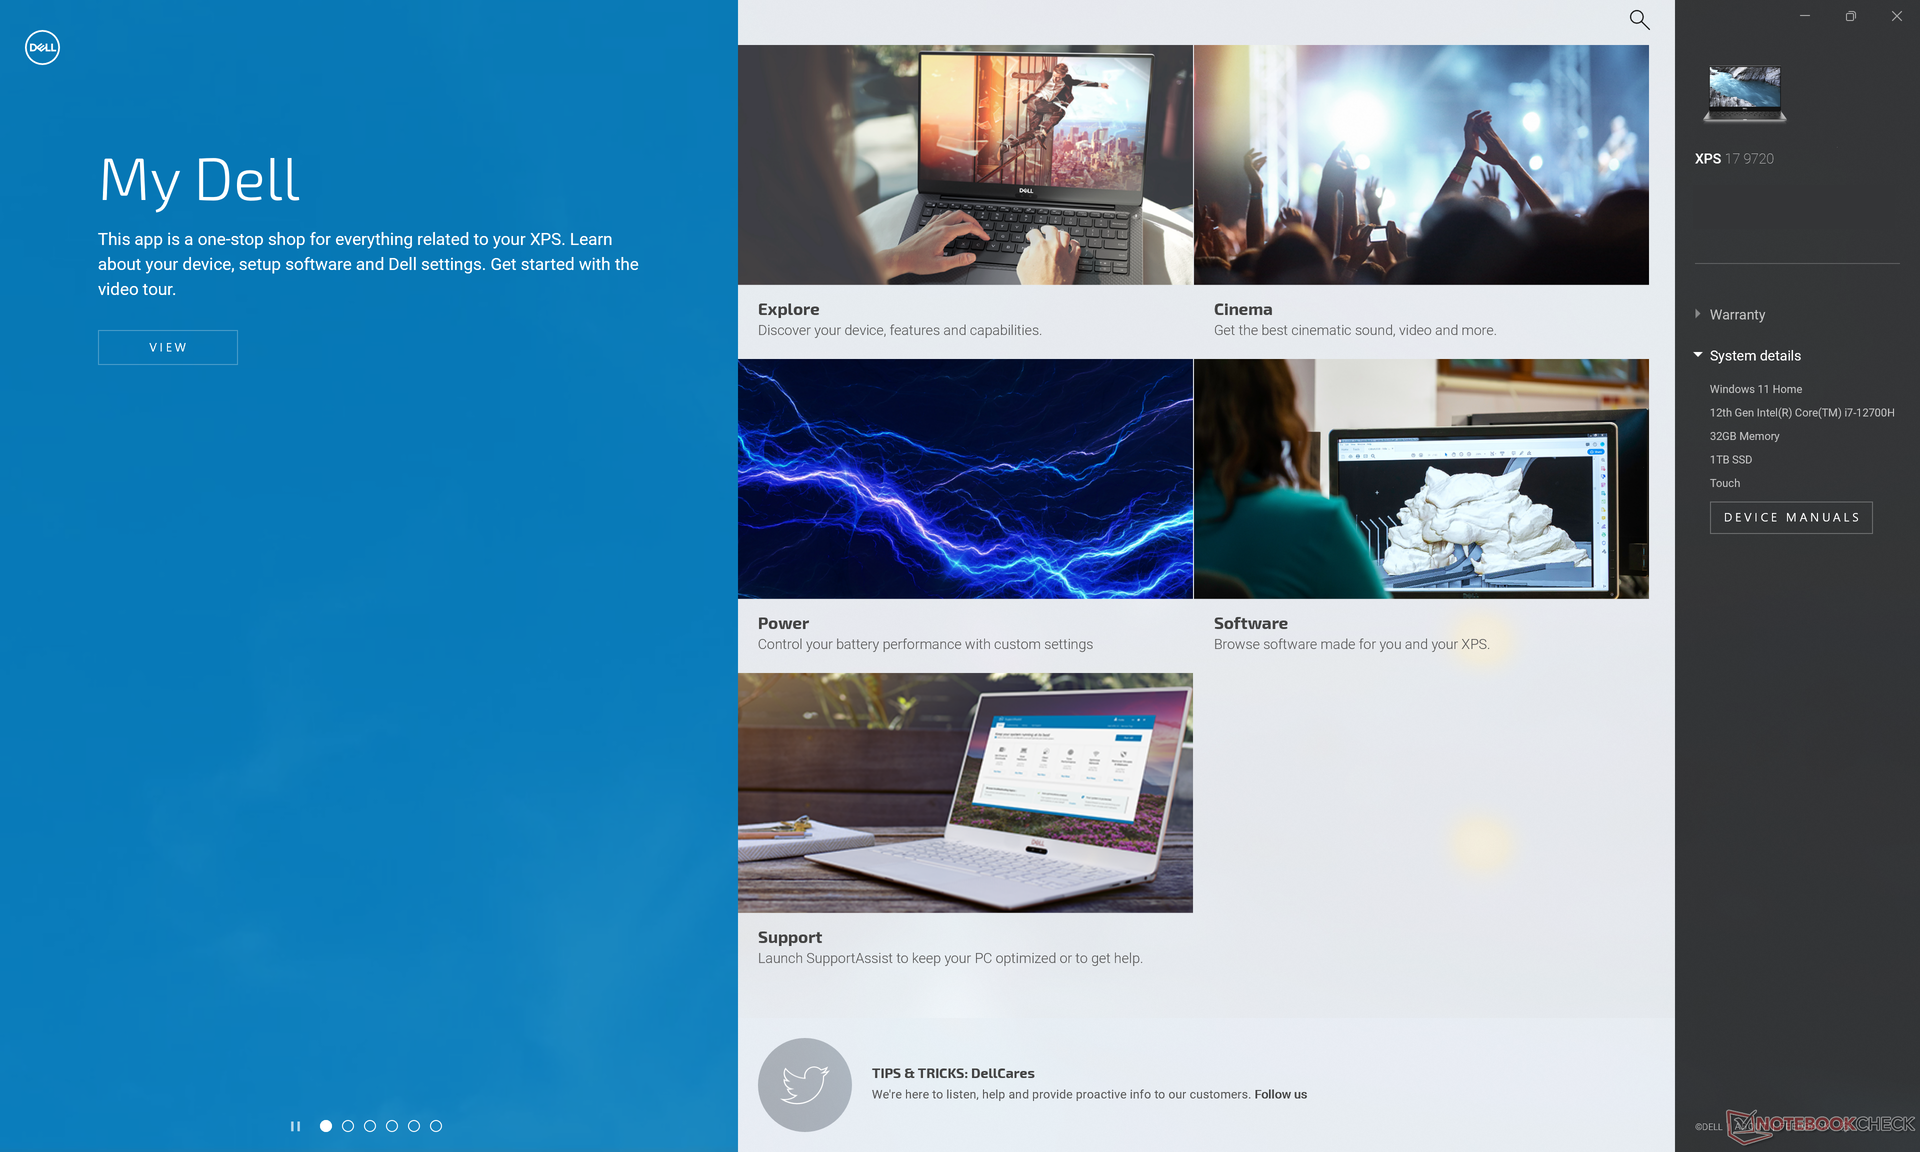
Vår enhet ställdes in på Ultra Performance-läge via My Dell-programvaran innan vi körde de nedanstående benchmarks för att få högsta möjliga poäng. Vi rekommenderar att användarna bekantar sig med programvarorna My Dell, Dell Update och PremierColor eftersom viktiga funktioner i systemet kan ställas in via dessa program
Optimus 1.0 är standard för automatisk grafikväxling mellan den integrerade GPU:n och diskret GeForce RTX 3060. Intern adaptiv synkronisering och MUX stöds inte eftersom XPS 17 inte är en spelmaskin.
Processor
CineBench xT-benchmarks och vissa AIDA64-undertester kan vara upp till 50 procent snabbare än på XPS 15 9710 som är utrustad med den senaste generationens Core i7-11800H för att representera en betydande förbättring av processorprestanda från år till år. Vinsterna är dock mycket mindre i andra tester, bland annat Blender och HWBOT x265, men de genomsnittliga vinsterna är fortfarande större än vad vi observerade mellan XPS 17 9700 och XPS 17 9710.
Märkligt nog har Core i7-12700H bakom den 10:e generationens Core i7-10875H i ett antal AIDA64-benchmarks, vilket visas nedan.
Vissa tjockare bärbara datorer med samma Core i7-12800H-processor kan köra processorn med högre klockfrekvens och upp till 20 procent snabbare, som t.ex. på HP Omen 16
Att köra CineBench R15 xT i en slinga visar inga större problem med strypning av prestanda när den utsätts för extrema bearbetningsbelastningar under långa perioder.
Cinebench R15 Multi Loop
Cinebench R23: Multi Core | Single Core
Cinebench R15: CPU Multi 64Bit | CPU Single 64Bit
Blender: v2.79 BMW27 CPU
7-Zip 18.03: 7z b 4 | 7z b 4 -mmt1
Geekbench 5.5: Multi-Core | Single-Core
HWBOT x265 Benchmark v2.2: 4k Preset
LibreOffice : 20 Documents To PDF
R Benchmark 2.5: Overall mean
| Cinebench R20 / CPU (Multi Core) | |
| Alienware x17 R2 P48E | |
| Dell XPS 17 9720 RTX 3060 | |
| Razer Blade 17 RTX 3080 Ti | |
| Genomsnitt Intel Core i7-12700H (1576 - 7407, n=64) | |
| Alienware x17 RTX 3080 P48E | |
| Asus ROG Strix G17 G713QE-RB74 | |
| MSI GS76 Stealth 11UH | |
| Dell XPS 17 9710 Core i7 RTX 3060 | |
| Dell XPS 17 9700 Core i7 RTX 2060 Max-Q | |
| Schenker XMG Core 17 (Early 2021) | |
| Acer Nitro 5 AN517-53-54DQ | |
| Asus ROG Zephyrus S GX701GXR | |
| Dell XPS 17 9700 i5-10300H | |
| Cinebench R20 / CPU (Single Core) | |
| Alienware x17 R2 P48E | |
| Razer Blade 17 RTX 3080 Ti | |
| Genomsnitt Intel Core i7-12700H (300 - 704, n=64) | |
| Dell XPS 17 9720 RTX 3060 | |
| MSI GS76 Stealth 11UH | |
| Alienware x17 RTX 3080 P48E | |
| Dell XPS 17 9710 Core i7 RTX 3060 | |
| Asus ROG Strix G17 G713QE-RB74 | |
| Acer Nitro 5 AN517-53-54DQ | |
| Dell XPS 17 9700 Core i7 RTX 2060 Max-Q | |
| Schenker XMG Core 17 (Early 2021) | |
| Dell XPS 17 9700 i5-10300H | |
| Asus ROG Zephyrus S GX701GXR | |
| Cinebench R23 / Multi Core | |
| Alienware x17 R2 P48E | |
| Dell XPS 17 9720 RTX 3060 | |
| Genomsnitt Intel Core i7-12700H (4032 - 19330, n=64) | |
| Razer Blade 17 RTX 3080 Ti | |
| Alienware x17 RTX 3080 P48E | |
| MSI GS76 Stealth 11UH | |
| Asus ROG Strix G17 G713QE-RB74 | |
| Dell XPS 17 9710 Core i7 RTX 3060 | |
| Schenker XMG Core 17 (Early 2021) | |
| Acer Nitro 5 AN517-53-54DQ | |
| Cinebench R23 / Single Core | |
| Alienware x17 R2 P48E | |
| Razer Blade 17 RTX 3080 Ti | |
| Dell XPS 17 9720 RTX 3060 | |
| Genomsnitt Intel Core i7-12700H (778 - 1826, n=63) | |
| MSI GS76 Stealth 11UH | |
| Alienware x17 RTX 3080 P48E | |
| Dell XPS 17 9710 Core i7 RTX 3060 | |
| Acer Nitro 5 AN517-53-54DQ | |
| Asus ROG Strix G17 G713QE-RB74 | |
| Schenker XMG Core 17 (Early 2021) | |
| Cinebench R15 / CPU Multi 64Bit | |
| Alienware x17 R2 P48E | |
| Genomsnitt Intel Core i7-12700H (1379 - 2916, n=70) | |
| Razer Blade 17 RTX 3080 Ti | |
| Dell XPS 17 9720 RTX 3060 | |
| Alienware x17 RTX 3080 P48E | |
| MSI GS76 Stealth 11UH | |
| Asus ROG Strix G17 G713QE-RB74 | |
| Dell XPS 17 9710 Core i7 RTX 3060 | |
| Dell XPS 17 9700 Core i7 RTX 2060 Max-Q | |
| Schenker XMG Core 17 (Early 2021) | |
| Asus ROG Zephyrus S GX701GXR | |
| Acer Nitro 5 AN517-53-54DQ | |
| Dell XPS 17 9700 i5-10300H | |
| Cinebench R15 / CPU Single 64Bit | |
| Alienware x17 R2 P48E | |
| Razer Blade 17 RTX 3080 Ti | |
| Dell XPS 17 9720 RTX 3060 | |
| Genomsnitt Intel Core i7-12700H (113 - 263, n=65) | |
| MSI GS76 Stealth 11UH | |
| Asus ROG Strix G17 G713QE-RB74 | |
| Dell XPS 17 9710 Core i7 RTX 3060 | |
| Alienware x17 RTX 3080 P48E | |
| Acer Nitro 5 AN517-53-54DQ | |
| Dell XPS 17 9700 Core i7 RTX 2060 Max-Q | |
| Schenker XMG Core 17 (Early 2021) | |
| Dell XPS 17 9700 i5-10300H | |
| Asus ROG Zephyrus S GX701GXR | |
| Blender / v2.79 BMW27 CPU | |
| Dell XPS 17 9700 i5-10300H | |
| Acer Nitro 5 AN517-53-54DQ | |
| Dell XPS 17 9700 Core i7 RTX 2060 Max-Q | |
| Schenker XMG Core 17 (Early 2021) | |
| Dell XPS 17 9710 Core i7 RTX 3060 | |
| MSI GS76 Stealth 11UH | |
| Asus ROG Strix G17 G713QE-RB74 | |
| Genomsnitt Intel Core i7-12700H (168 - 732, n=63) | |
| Razer Blade 17 RTX 3080 Ti | |
| Alienware x17 RTX 3080 P48E | |
| Dell XPS 17 9720 RTX 3060 | |
| Alienware x17 R2 P48E | |
| 7-Zip 18.03 / 7z b 4 | |
| Dell XPS 17 9720 RTX 3060 | |
| Alienware x17 R2 P48E | |
| Razer Blade 17 RTX 3080 Ti | |
| Genomsnitt Intel Core i7-12700H (22844 - 73067, n=63) | |
| Asus ROG Strix G17 G713QE-RB74 | |
| Alienware x17 RTX 3080 P48E | |
| MSI GS76 Stealth 11UH | |
| Dell XPS 17 9710 Core i7 RTX 3060 | |
| Dell XPS 17 9700 Core i7 RTX 2060 Max-Q | |
| Schenker XMG Core 17 (Early 2021) | |
| Acer Nitro 5 AN517-53-54DQ | |
| Dell XPS 17 9700 i5-10300H | |
| 7-Zip 18.03 / 7z b 4 -mmt1 | |
| Razer Blade 17 RTX 3080 Ti | |
| Alienware x17 R2 P48E | |
| Dell XPS 17 9720 RTX 3060 | |
| Genomsnitt Intel Core i7-12700H (2743 - 5972, n=63) | |
| MSI GS76 Stealth 11UH | |
| Asus ROG Strix G17 G713QE-RB74 | |
| Dell XPS 17 9710 Core i7 RTX 3060 | |
| Schenker XMG Core 17 (Early 2021) | |
| Alienware x17 RTX 3080 P48E | |
| Dell XPS 17 9700 Core i7 RTX 2060 Max-Q | |
| Acer Nitro 5 AN517-53-54DQ | |
| Dell XPS 17 9700 i5-10300H | |
| Geekbench 5.5 / Multi-Core | |
| Alienware x17 R2 P48E | |
| Razer Blade 17 RTX 3080 Ti | |
| Dell XPS 17 9720 RTX 3060 | |
| Genomsnitt Intel Core i7-12700H (5144 - 13745, n=64) | |
| MSI GS76 Stealth 11UH | |
| Dell XPS 17 9700 Core i7 RTX 2060 Max-Q | |
| Schenker XMG Core 17 (Early 2021) | |
| Acer Nitro 5 AN517-53-54DQ | |
| Dell XPS 17 9700 i5-10300H | |
| Geekbench 5.5 / Single-Core | |
| Alienware x17 R2 P48E | |
| Razer Blade 17 RTX 3080 Ti | |
| Genomsnitt Intel Core i7-12700H (803 - 1851, n=64) | |
| Dell XPS 17 9720 RTX 3060 | |
| MSI GS76 Stealth 11UH | |
| Acer Nitro 5 AN517-53-54DQ | |
| Dell XPS 17 9700 Core i7 RTX 2060 Max-Q | |
| Schenker XMG Core 17 (Early 2021) | |
| Dell XPS 17 9700 i5-10300H | |
| HWBOT x265 Benchmark v2.2 / 4k Preset | |
| Alienware x17 R2 P48E | |
| Alienware x17 RTX 3080 P48E | |
| Razer Blade 17 RTX 3080 Ti | |
| Genomsnitt Intel Core i7-12700H (4.67 - 21.8, n=64) | |
| Dell XPS 17 9720 RTX 3060 | |
| MSI GS76 Stealth 11UH | |
| Asus ROG Strix G17 G713QE-RB74 | |
| Dell XPS 17 9710 Core i7 RTX 3060 | |
| Dell XPS 17 9700 Core i7 RTX 2060 Max-Q | |
| Schenker XMG Core 17 (Early 2021) | |
| Acer Nitro 5 AN517-53-54DQ | |
| Dell XPS 17 9700 i5-10300H | |
| LibreOffice / 20 Documents To PDF | |
| Schenker XMG Core 17 (Early 2021) | |
| Asus ROG Strix G17 G713QE-RB74 | |
| Dell XPS 17 9700 i5-10300H | |
| Acer Nitro 5 AN517-53-54DQ | |
| MSI GS76 Stealth 11UH | |
| Dell XPS 17 9700 Core i7 RTX 2060 Max-Q | |
| Alienware x17 RTX 3080 P48E | |
| Razer Blade 17 RTX 3080 Ti | |
| Genomsnitt Intel Core i7-12700H (34.2 - 95.3, n=63) | |
| Dell XPS 17 9710 Core i7 RTX 3060 | |
| Dell XPS 17 9720 RTX 3060 | |
| Alienware x17 R2 P48E | |
| R Benchmark 2.5 / Overall mean | |
| Dell XPS 17 9700 i5-10300H | |
| Acer Nitro 5 AN517-53-54DQ | |
| Dell XPS 17 9700 Core i7 RTX 2060 Max-Q | |
| Schenker XMG Core 17 (Early 2021) | |
| Alienware x17 RTX 3080 P48E | |
| Dell XPS 17 9710 Core i7 RTX 3060 | |
| MSI GS76 Stealth 11UH | |
| Asus ROG Strix G17 G713QE-RB74 | |
| Genomsnitt Intel Core i7-12700H (0.4441 - 1.052, n=63) | |
| Dell XPS 17 9720 RTX 3060 | |
| Razer Blade 17 RTX 3080 Ti | |
| Alienware x17 R2 P48E | |
Cinebench R23: Multi Core | Single Core
Cinebench R15: CPU Multi 64Bit | CPU Single 64Bit
Blender: v2.79 BMW27 CPU
7-Zip 18.03: 7z b 4 | 7z b 4 -mmt1
Geekbench 5.5: Multi-Core | Single-Core
HWBOT x265 Benchmark v2.2: 4k Preset
LibreOffice : 20 Documents To PDF
R Benchmark 2.5: Overall mean
* ... mindre är bättre
| AIDA64 / FP32 Ray-Trace | |
| Eurocom RX315 NH57AF1 | |
| Lenovo Legion 5 17ACH6H-82JY0003GE | |
| Genomsnitt Intel Core i7-12700H (2585 - 17957, n=64) | |
| Dell XPS 17 9700 Core i7 RTX 2060 Max-Q | |
| Razer Blade 17 (i7-12800H, RTX 3070 Ti) | |
| Dell XPS 17 9720 RTX 3060 | |
| Asus VivoBook 17 F712JA-AU708W | |
| AIDA64 / FPU Julia | |
| Lenovo Legion 5 17ACH6H-82JY0003GE | |
| Eurocom RX315 NH57AF1 | |
| Genomsnitt Intel Core i7-12700H (12439 - 90760, n=64) | |
| Dell XPS 17 9700 Core i7 RTX 2060 Max-Q | |
| Razer Blade 17 (i7-12800H, RTX 3070 Ti) | |
| Dell XPS 17 9720 RTX 3060 | |
| Asus VivoBook 17 F712JA-AU708W | |
| AIDA64 / CPU SHA3 | |
| Eurocom RX315 NH57AF1 | |
| Genomsnitt Intel Core i7-12700H (833 - 4242, n=64) | |
| Razer Blade 17 (i7-12800H, RTX 3070 Ti) | |
| Lenovo Legion 5 17ACH6H-82JY0003GE | |
| Dell XPS 17 9720 RTX 3060 | |
| Dell XPS 17 9700 Core i7 RTX 2060 Max-Q | |
| Asus VivoBook 17 F712JA-AU708W | |
| AIDA64 / CPU Queen | |
| Dell XPS 17 9720 RTX 3060 | |
| Genomsnitt Intel Core i7-12700H (57923 - 103202, n=63) | |
| Razer Blade 17 (i7-12800H, RTX 3070 Ti) | |
| Eurocom RX315 NH57AF1 | |
| Dell XPS 17 9700 Core i7 RTX 2060 Max-Q | |
| Lenovo Legion 5 17ACH6H-82JY0003GE | |
| Asus VivoBook 17 F712JA-AU708W | |
| AIDA64 / FPU SinJulia | |
| Eurocom RX315 NH57AF1 | |
| Razer Blade 17 (i7-12800H, RTX 3070 Ti) | |
| Lenovo Legion 5 17ACH6H-82JY0003GE | |
| Genomsnitt Intel Core i7-12700H (3249 - 9939, n=64) | |
| Dell XPS 17 9720 RTX 3060 | |
| Dell XPS 17 9700 Core i7 RTX 2060 Max-Q | |
| Asus VivoBook 17 F712JA-AU708W | |
| AIDA64 / FPU Mandel | |
| Lenovo Legion 5 17ACH6H-82JY0003GE | |
| Eurocom RX315 NH57AF1 | |
| Genomsnitt Intel Core i7-12700H (7135 - 44760, n=64) | |
| Dell XPS 17 9700 Core i7 RTX 2060 Max-Q | |
| Razer Blade 17 (i7-12800H, RTX 3070 Ti) | |
| Dell XPS 17 9720 RTX 3060 | |
| Asus VivoBook 17 F712JA-AU708W | |
| AIDA64 / CPU ZLib | |
| Razer Blade 17 (i7-12800H, RTX 3070 Ti) | |
| Genomsnitt Intel Core i7-12700H (305 - 1171, n=64) | |
| Dell XPS 17 9720 RTX 3060 | |
| Eurocom RX315 NH57AF1 | |
| Lenovo Legion 5 17ACH6H-82JY0003GE | |
| Dell XPS 17 9700 Core i7 RTX 2060 Max-Q | |
| Asus VivoBook 17 F712JA-AU708W | |
| Dell XPS 17 9710 Core i7 RTX 3060 | |
| HP Envy 17-cg | |
| AIDA64 / FP64 Ray-Trace | |
| Eurocom RX315 NH57AF1 | |
| Lenovo Legion 5 17ACH6H-82JY0003GE | |
| Genomsnitt Intel Core i7-12700H (1437 - 9692, n=64) | |
| Dell XPS 17 9700 Core i7 RTX 2060 Max-Q | |
| Dell XPS 17 9720 RTX 3060 | |
| Razer Blade 17 (i7-12800H, RTX 3070 Ti) | |
| Asus VivoBook 17 F712JA-AU708W | |
| AIDA64 / CPU PhotoWorxx | |
| Dell XPS 17 9720 RTX 3060 | |
| Genomsnitt Intel Core i7-12700H (12863 - 52207, n=64) | |
| Razer Blade 17 (i7-12800H, RTX 3070 Ti) | |
| Dell XPS 17 9700 Core i7 RTX 2060 Max-Q | |
| Eurocom RX315 NH57AF1 | |
| Asus VivoBook 17 F712JA-AU708W | |
| Lenovo Legion 5 17ACH6H-82JY0003GE | |
Systemets prestanda
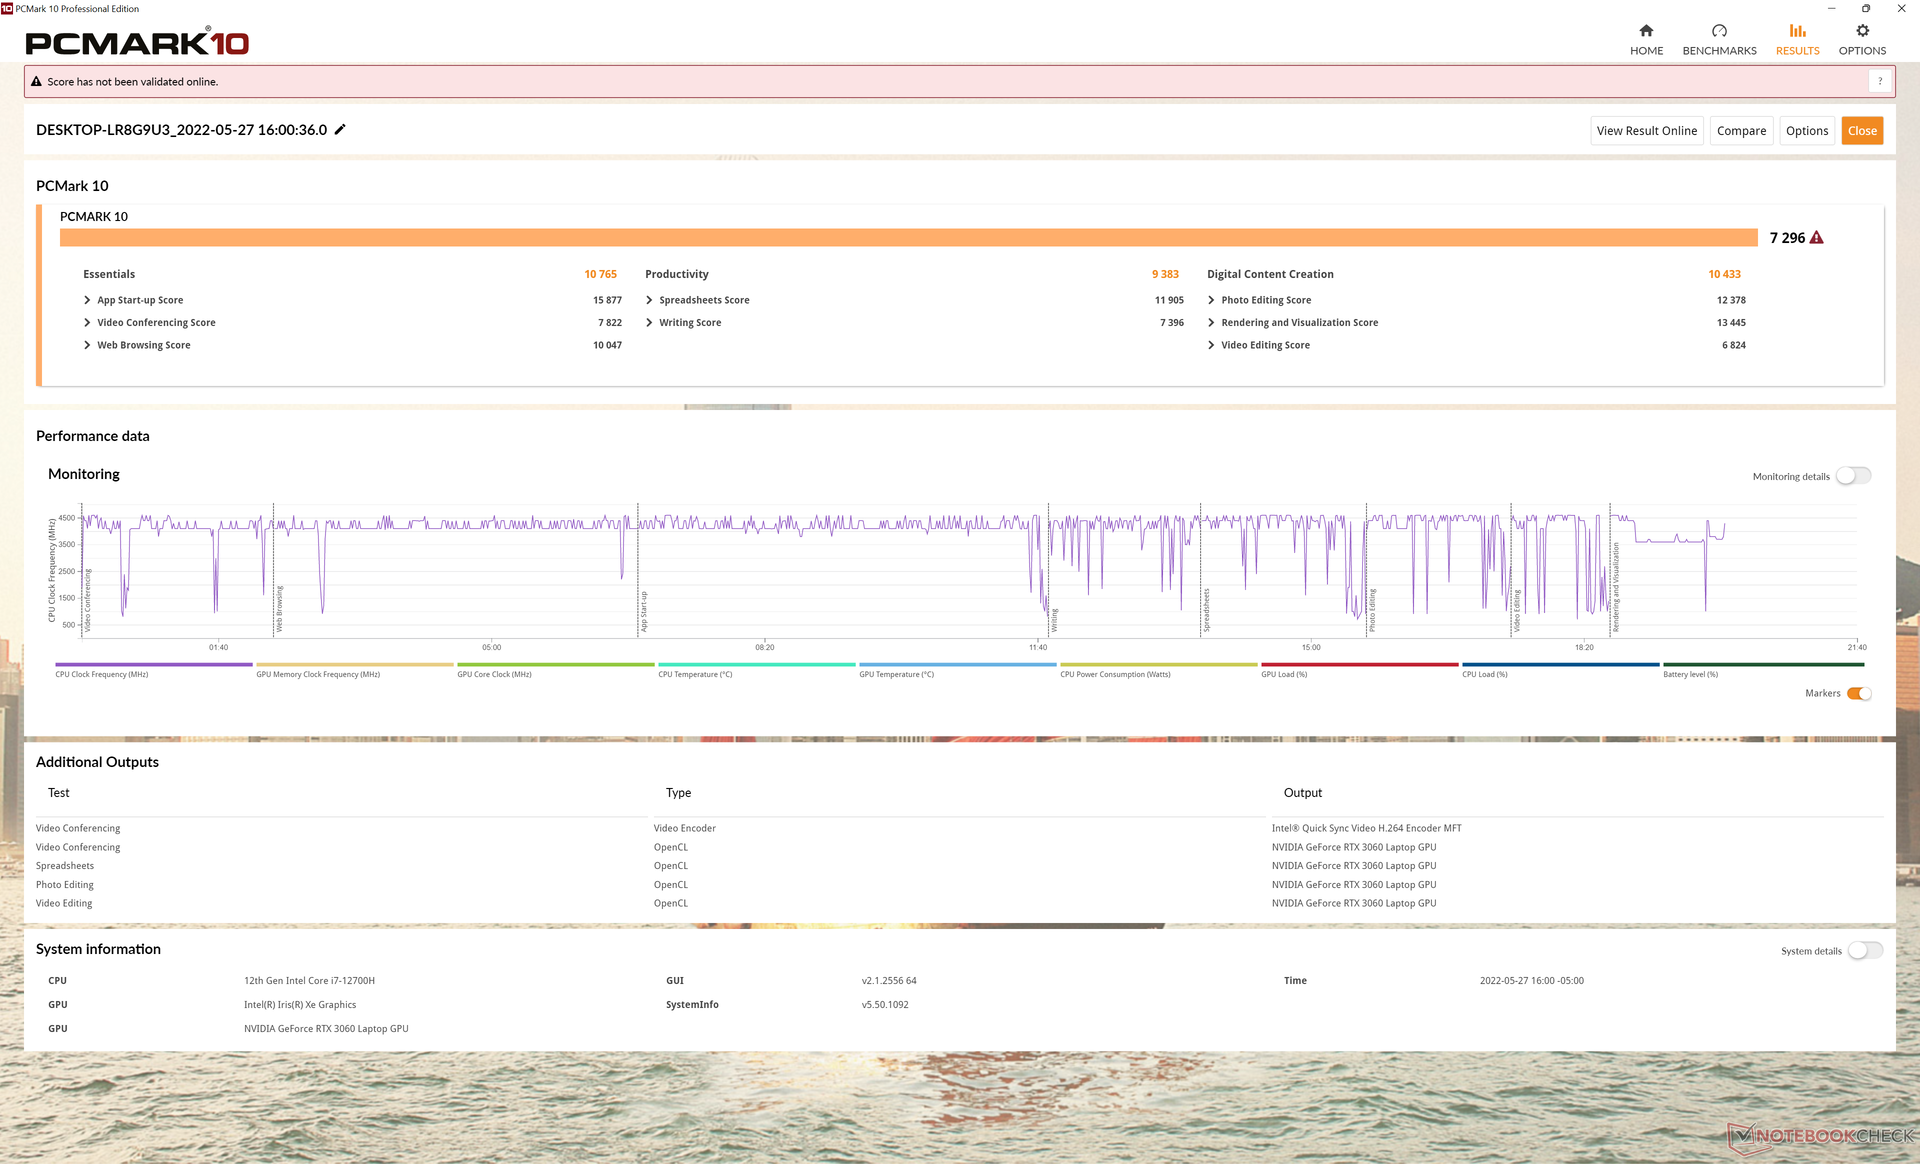
PCMark 10-resultaten är genomgående högre än vad vi registrerade på XPS 17 9710, om än knappt. Våra resultat för XPS 17 9720 är fortfarande några av de snabbaste i multimediakategorin.
Vi upplevde en bugg på vår enhet där strömförbrukningen konstigt nog stabiliserades på 40 W när den var i viloläge istället för den vanliga <2 W vilket ledde till mycket varma yttemperaturer och slösad energi. Att växla strömprofilerna via My Dell verkar vara en tillfällig lösning på problemet.
CrossMark: Overall | Productivity | Creativity | Responsiveness
| PCMark 10 / Score | |
| Genomsnitt av klass Multimedia (4325 - 10386, n=54, senaste 2 åren) | |
| Dell XPS 17 9720 RTX 3060 | |
| Razer Blade 17 (i7-12800H, RTX 3070 Ti) | |
| Genomsnitt Intel Core i7-12700H, NVIDIA GeForce RTX 3060 Laptop GPU (5986 - 8156, n=12) | |
| Dell XPS 17 9710 Core i7 RTX 3060 | |
| Lenovo Legion 5 17ACH6H-82JY0003GE | |
| Dell XPS 17 9700 Core i7 RTX 2060 Max-Q | |
| HP Envy 17-cg | |
| Asus VivoBook 17 F712JA-AU708W | |
| PCMark 10 / Essentials | |
| Dell XPS 17 9720 RTX 3060 | |
| Genomsnitt Intel Core i7-12700H, NVIDIA GeForce RTX 3060 Laptop GPU (9289 - 12144, n=12) | |
| Genomsnitt av klass Multimedia (8025 - 11664, n=53, senaste 2 åren) | |
| Razer Blade 17 (i7-12800H, RTX 3070 Ti) | |
| Dell XPS 17 9710 Core i7 RTX 3060 | |
| Lenovo Legion 5 17ACH6H-82JY0003GE | |
| Dell XPS 17 9700 Core i7 RTX 2060 Max-Q | |
| HP Envy 17-cg | |
| Asus VivoBook 17 F712JA-AU708W | |
| PCMark 10 / Productivity | |
| Genomsnitt av klass Multimedia (7323 - 18233, n=53, senaste 2 åren) | |
| Dell XPS 17 9720 RTX 3060 | |
| Genomsnitt Intel Core i7-12700H, NVIDIA GeForce RTX 3060 Laptop GPU (6161 - 10362, n=12) | |
| Razer Blade 17 (i7-12800H, RTX 3070 Ti) | |
| Lenovo Legion 5 17ACH6H-82JY0003GE | |
| Dell XPS 17 9710 Core i7 RTX 3060 | |
| HP Envy 17-cg | |
| Dell XPS 17 9700 Core i7 RTX 2060 Max-Q | |
| Asus VivoBook 17 F712JA-AU708W | |
| PCMark 10 / Digital Content Creation | |
| Razer Blade 17 (i7-12800H, RTX 3070 Ti) | |
| Genomsnitt Intel Core i7-12700H, NVIDIA GeForce RTX 3060 Laptop GPU (8950 - 12554, n=12) | |
| Genomsnitt av klass Multimedia (3651 - 16240, n=53, senaste 2 åren) | |
| Dell XPS 17 9720 RTX 3060 | |
| Dell XPS 17 9710 Core i7 RTX 3060 | |
| Lenovo Legion 5 17ACH6H-82JY0003GE | |
| Dell XPS 17 9700 Core i7 RTX 2060 Max-Q | |
| HP Envy 17-cg | |
| Asus VivoBook 17 F712JA-AU708W | |
| CrossMark / Overall | |
| Dell XPS 17 9720 RTX 3060 | |
| Genomsnitt av klass Multimedia (866 - 2728, n=62, senaste 2 åren) | |
| Genomsnitt Intel Core i7-12700H, NVIDIA GeForce RTX 3060 Laptop GPU (1649 - 2017, n=11) | |
| Razer Blade 17 (i7-12800H, RTX 3070 Ti) | |
| Lenovo Legion 5 17ACH6H-82JY0003GE | |
| Asus VivoBook 17 F712JA-AU708W | |
| CrossMark / Productivity | |
| Genomsnitt av klass Multimedia (931 - 2489, n=62, senaste 2 åren) | |
| Dell XPS 17 9720 RTX 3060 | |
| Genomsnitt Intel Core i7-12700H, NVIDIA GeForce RTX 3060 Laptop GPU (1536 - 1958, n=11) | |
| Razer Blade 17 (i7-12800H, RTX 3070 Ti) | |
| Lenovo Legion 5 17ACH6H-82JY0003GE | |
| Asus VivoBook 17 F712JA-AU708W | |
| CrossMark / Creativity | |
| Genomsnitt av klass Multimedia (907 - 3465, n=62, senaste 2 åren) | |
| Dell XPS 17 9720 RTX 3060 | |
| Genomsnitt Intel Core i7-12700H, NVIDIA GeForce RTX 3060 Laptop GPU (1816 - 2084, n=11) | |
| Razer Blade 17 (i7-12800H, RTX 3070 Ti) | |
| Lenovo Legion 5 17ACH6H-82JY0003GE | |
| Asus VivoBook 17 F712JA-AU708W | |
| CrossMark / Responsiveness | |
| Dell XPS 17 9720 RTX 3060 | |
| Genomsnitt Intel Core i7-12700H, NVIDIA GeForce RTX 3060 Laptop GPU (1210 - 2207, n=11) | |
| Razer Blade 17 (i7-12800H, RTX 3070 Ti) | |
| Genomsnitt av klass Multimedia (605 - 2024, n=62, senaste 2 åren) | |
| Lenovo Legion 5 17ACH6H-82JY0003GE | |
| Asus VivoBook 17 F712JA-AU708W | |
| PCMark 10 Score | 7296 poäng | |
Hjälp | ||
| AIDA64 / Memory Copy | |
| Dell XPS 17 9720 RTX 3060 | |
| Genomsnitt Intel Core i7-12700H (25615 - 80511, n=64) | |
| Razer Blade 17 (i7-12800H, RTX 3070 Ti) | |
| Dell XPS 17 9700 Core i7 RTX 2060 Max-Q | |
| Lenovo Legion 5 17ACH6H-82JY0003GE | |
| Asus VivoBook 17 F712JA-AU708W | |
| AIDA64 / Memory Read | |
| Dell XPS 17 9720 RTX 3060 | |
| Genomsnitt Intel Core i7-12700H (25586 - 79442, n=64) | |
| Razer Blade 17 (i7-12800H, RTX 3070 Ti) | |
| Lenovo Legion 5 17ACH6H-82JY0003GE | |
| Dell XPS 17 9700 Core i7 RTX 2060 Max-Q | |
| Asus VivoBook 17 F712JA-AU708W | |
| AIDA64 / Memory Write | |
| Dell XPS 17 9720 RTX 3060 | |
| Genomsnitt Intel Core i7-12700H (23679 - 88660, n=64) | |
| Razer Blade 17 (i7-12800H, RTX 3070 Ti) | |
| Dell XPS 17 9700 Core i7 RTX 2060 Max-Q | |
| Lenovo Legion 5 17ACH6H-82JY0003GE | |
| Asus VivoBook 17 F712JA-AU708W | |
| AIDA64 / Memory Latency | |
| Dell XPS 17 9720 RTX 3060 | |
| Asus VivoBook 17 F712JA-AU708W | |
| Lenovo Legion 5 17ACH6H-82JY0003GE | |
| Genomsnitt Intel Core i7-12700H (76.2 - 133.9, n=62) | |
| Dell XPS 17 9700 Core i7 RTX 2060 Max-Q | |
| Dell XPS 17 9710 Core i7 RTX 3060 | |
| HP Envy 17-cg | |
| Razer Blade 17 (i7-12800H, RTX 3070 Ti) | |
* ... mindre är bättre
DPC-latenstid
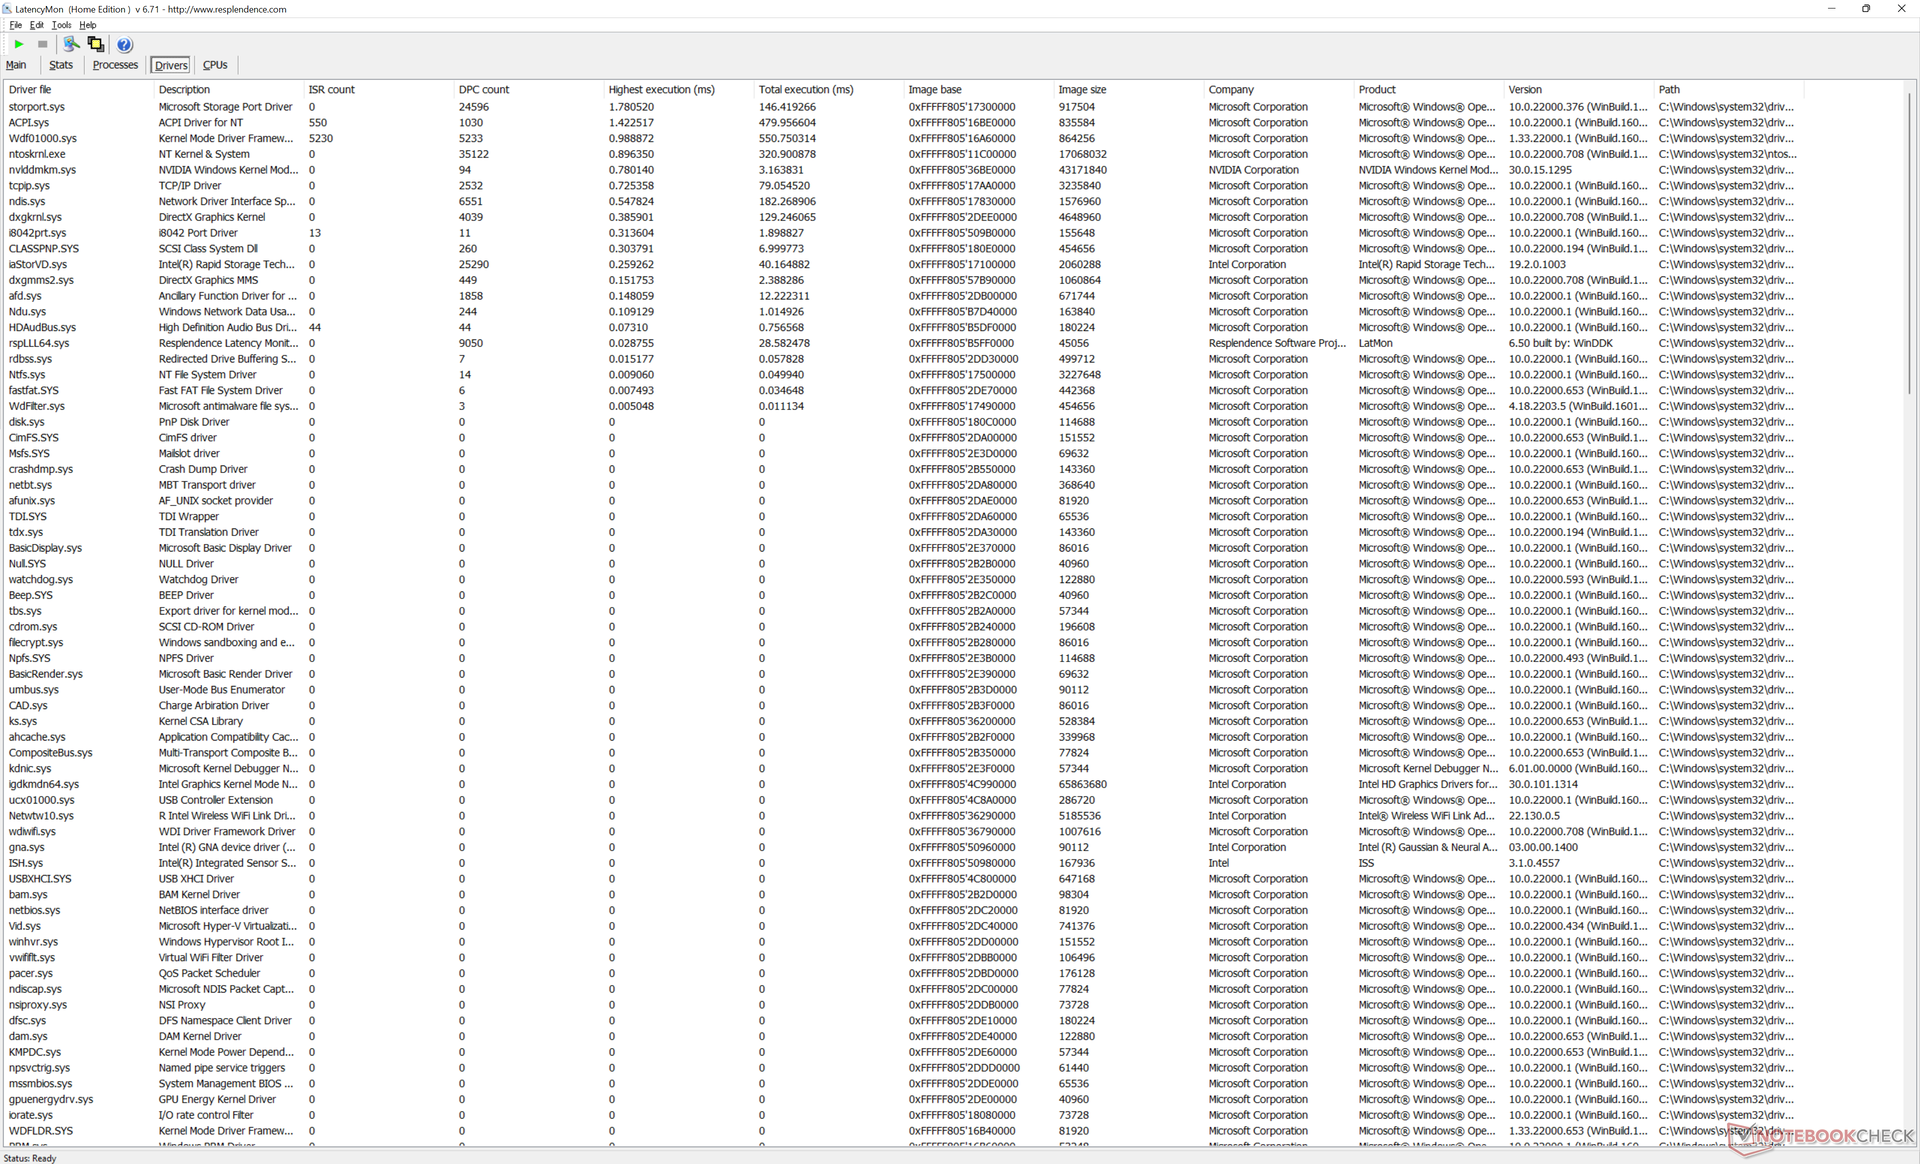
LatencyMon visar mindre DPC-problem när vi öppnar flera webbläsarflikar på vår hemsida, precis som vi observerade på XPS 17 9710 och 9700. uppspelning av 4K-video vid 60 FPS är annars helt smidig utan några tappade bilder, vilket man kan förvänta sig av en bärbar dator med Core H-drift för multimedia.

| DPC Latencies / LatencyMon - interrupt to process latency (max), Web, Youtube, Prime95 | |
| HP Envy 17-cg | |
| Lenovo Legion 5 17ACH6H-82JY0003GE | |
| Asus VivoBook 17 F712JA-AU708W | |
| Razer Blade 17 (i7-12800H, RTX 3070 Ti) | |
| Dell XPS 17 9700 Core i7 RTX 2060 Max-Q | |
| Dell XPS 17 9710 Core i7 RTX 3060 | |
| Dell XPS 17 9720 RTX 3060 | |
* ... mindre är bättre
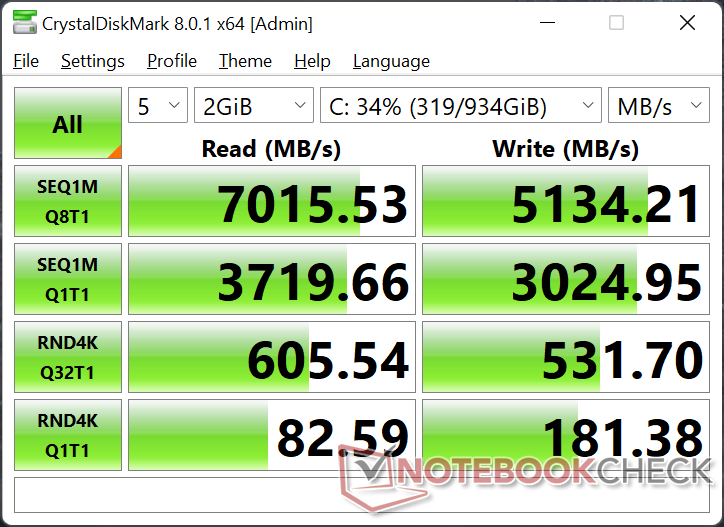
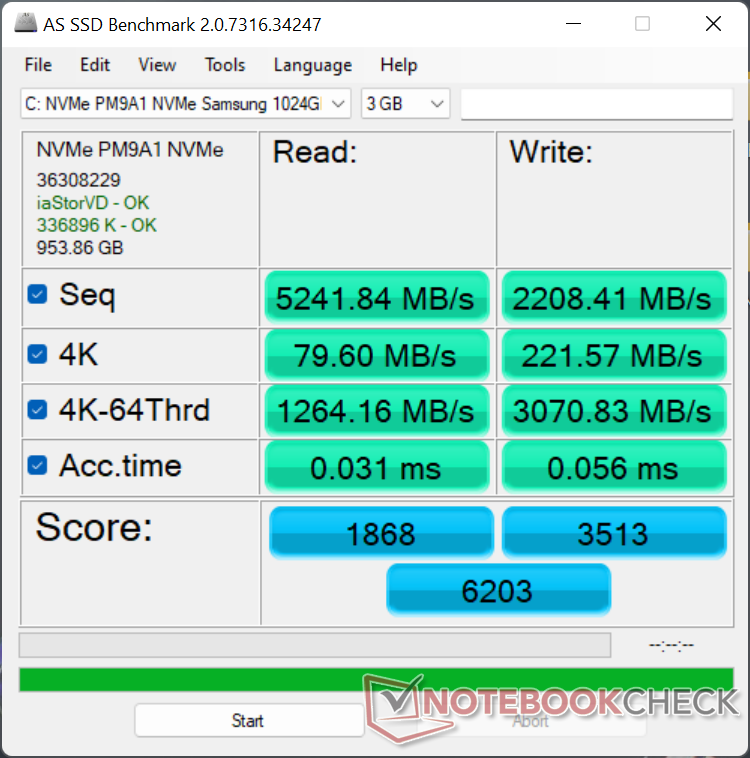
Lagringsenheter
XPS 17 9710 levererades vid en tidpunkt då PCIe4 x4 NVMe SSD-diskar ännu inte var allmänt tillgängliga och därför kunde SKU:erna endast levereras med PCIe3 x4-alternativ i stället. PCIe4-enheter är tack och lov vanligare numera och det är bra att se att XPS 17 9720 har antagit en snabbSamsung PM9A1 lösning. Våra stresstester visar att enheten i vår enhet inte skulle ha några problem med att bibehålla sin maximala sekventiella läshastighet på över 7000 MB/s under längre perioder utan att behöva strypa, även om den totala prestandan fortfarande är långsammare än vad vi noterade påRazer Blade 17 som är utrustad med samma 1 TB Samsung-enhet.

* ... mindre är bättre
Disk Throttling: DiskSpd Read Loop, Queue Depth 8
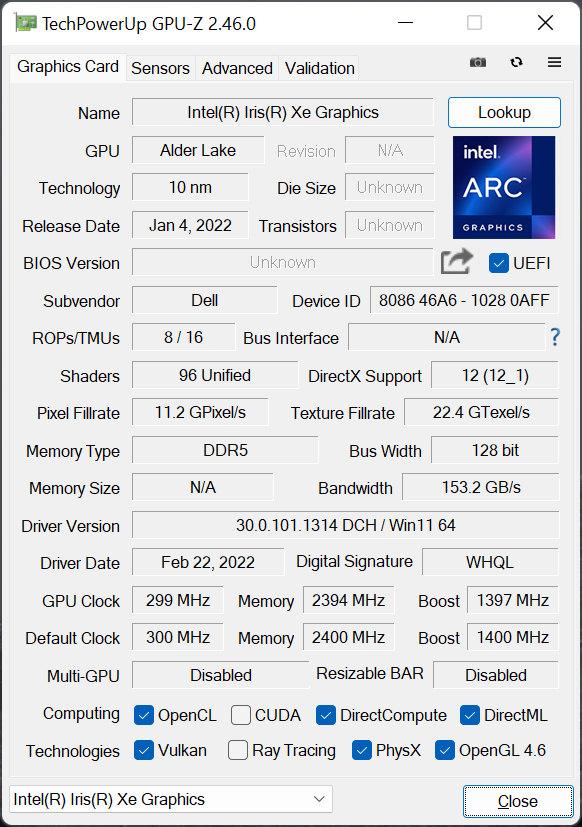
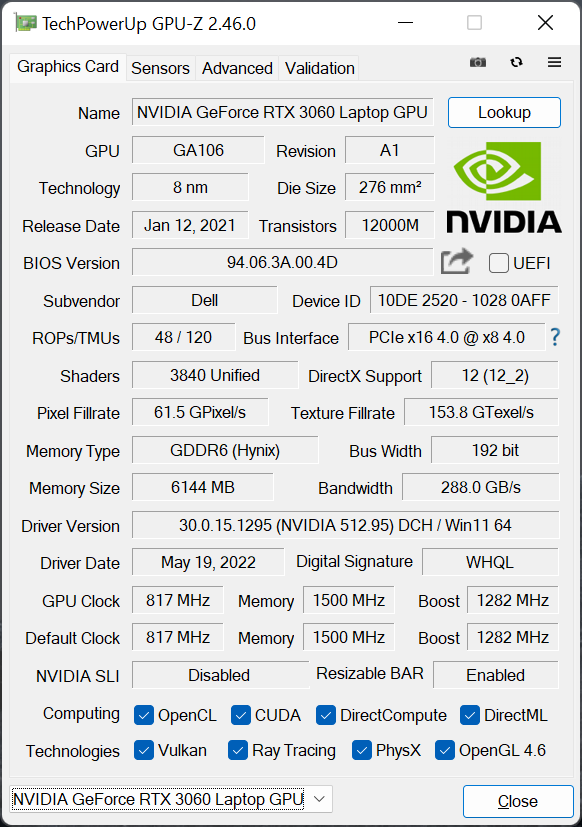
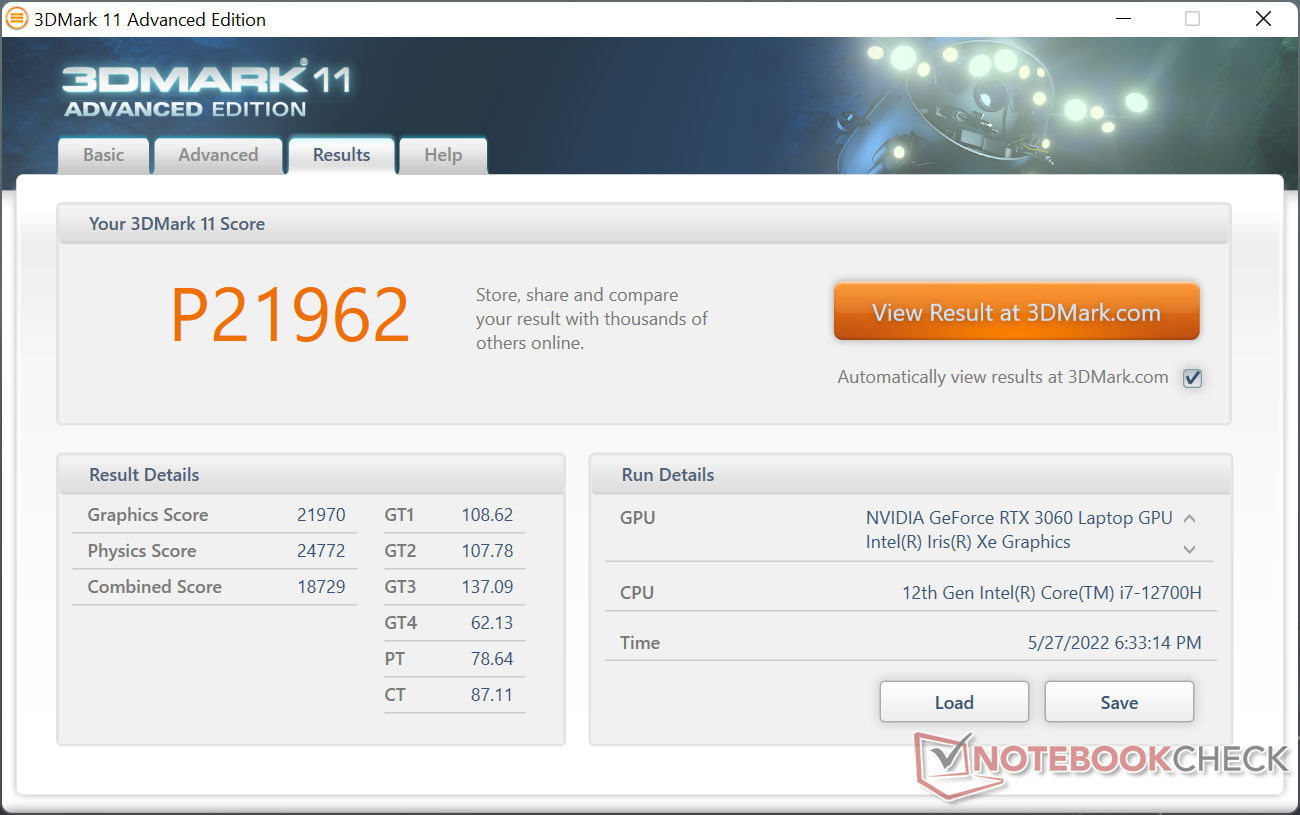
GPU-prestanda
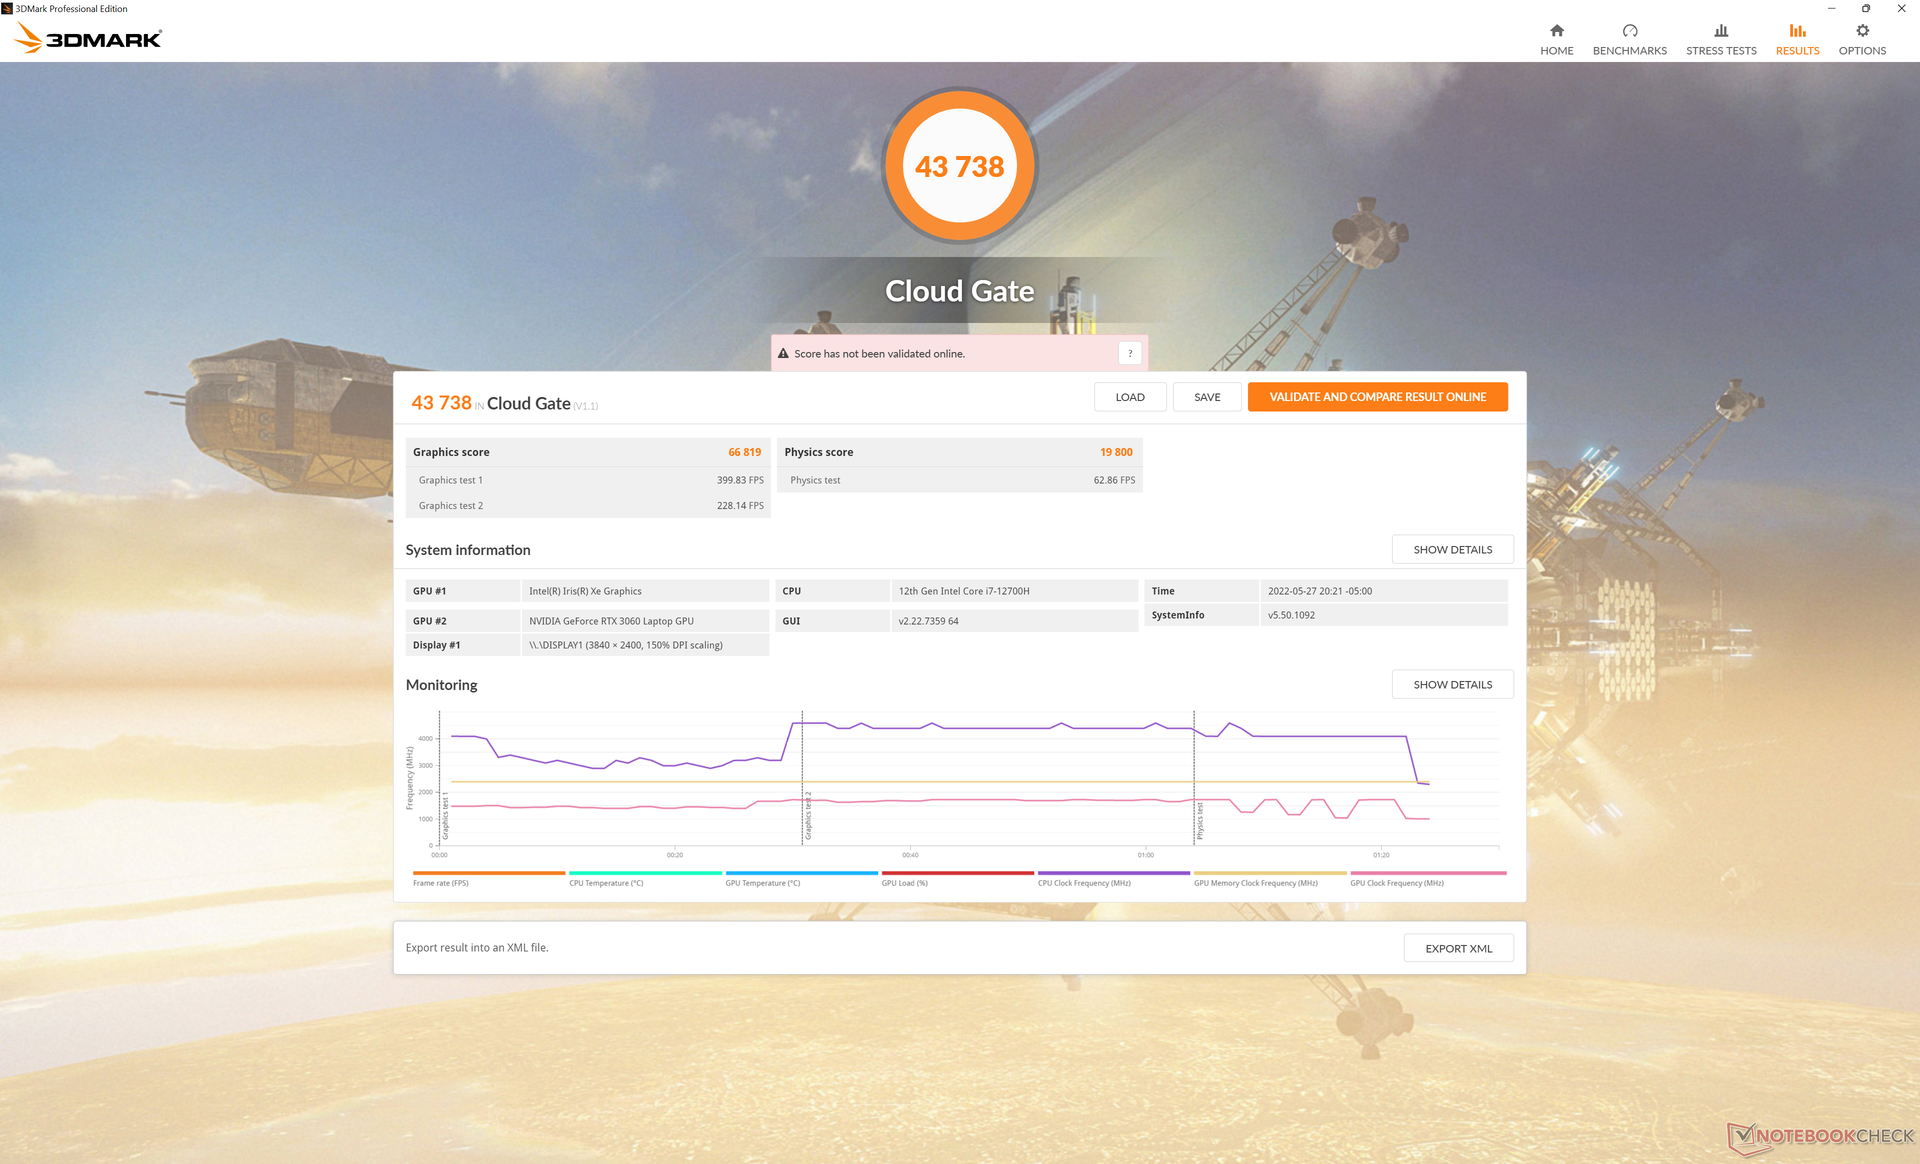
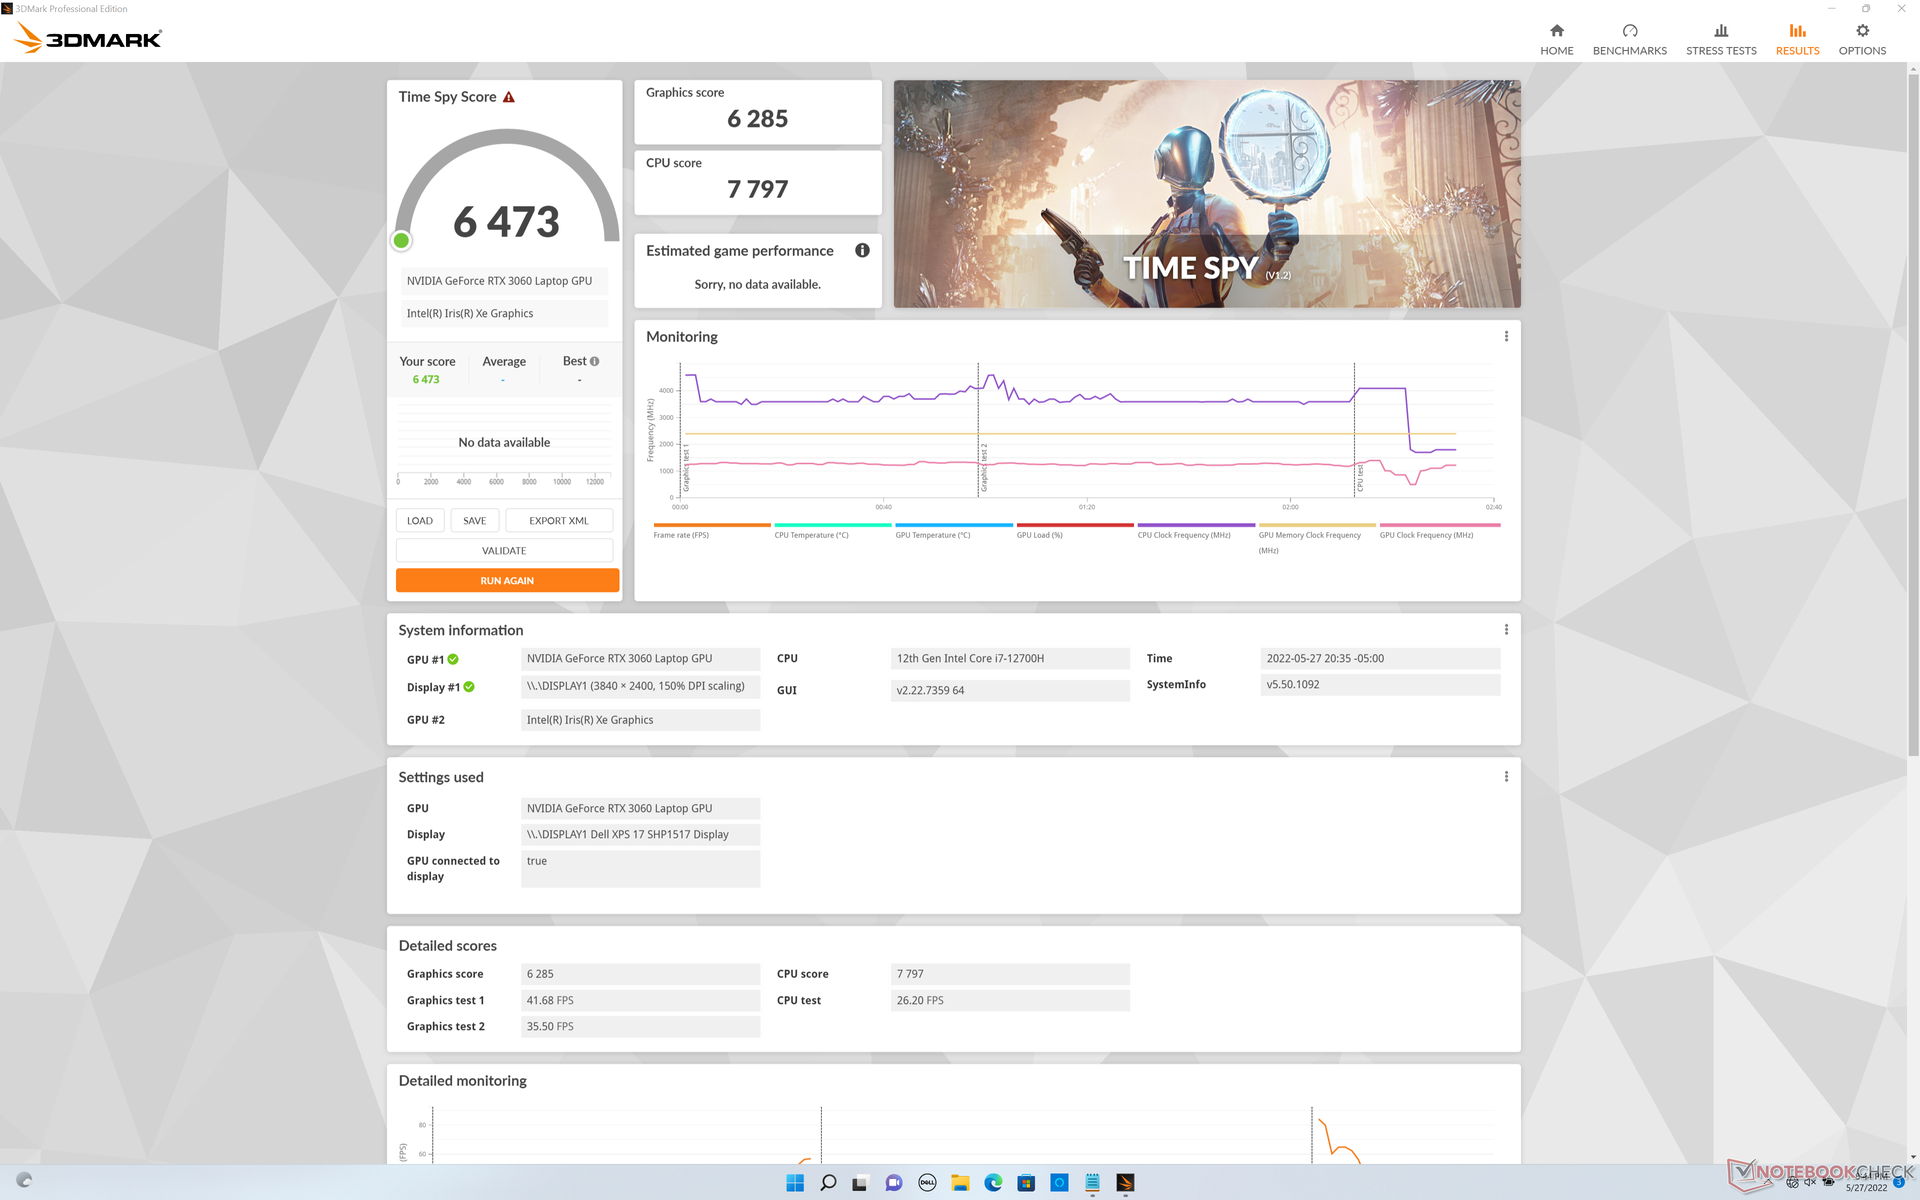
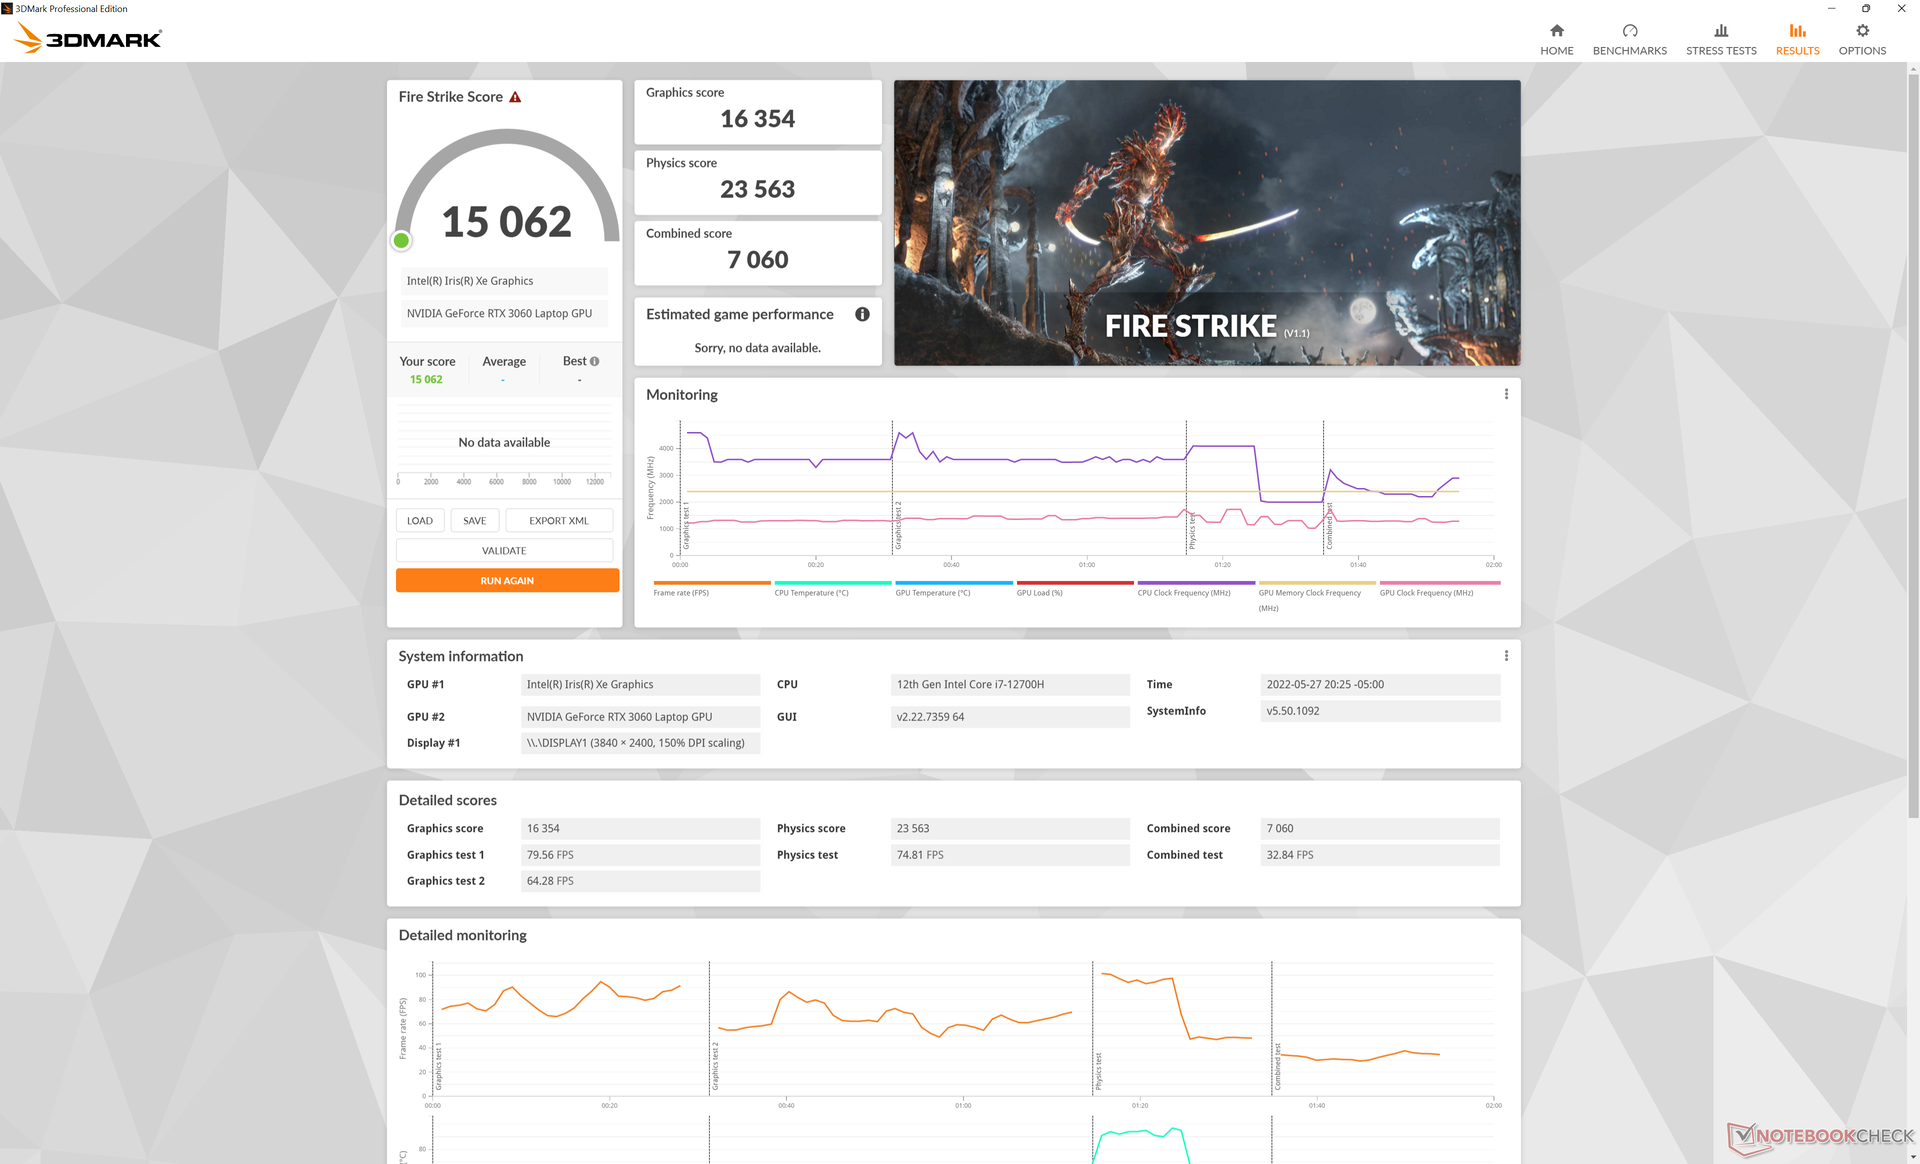
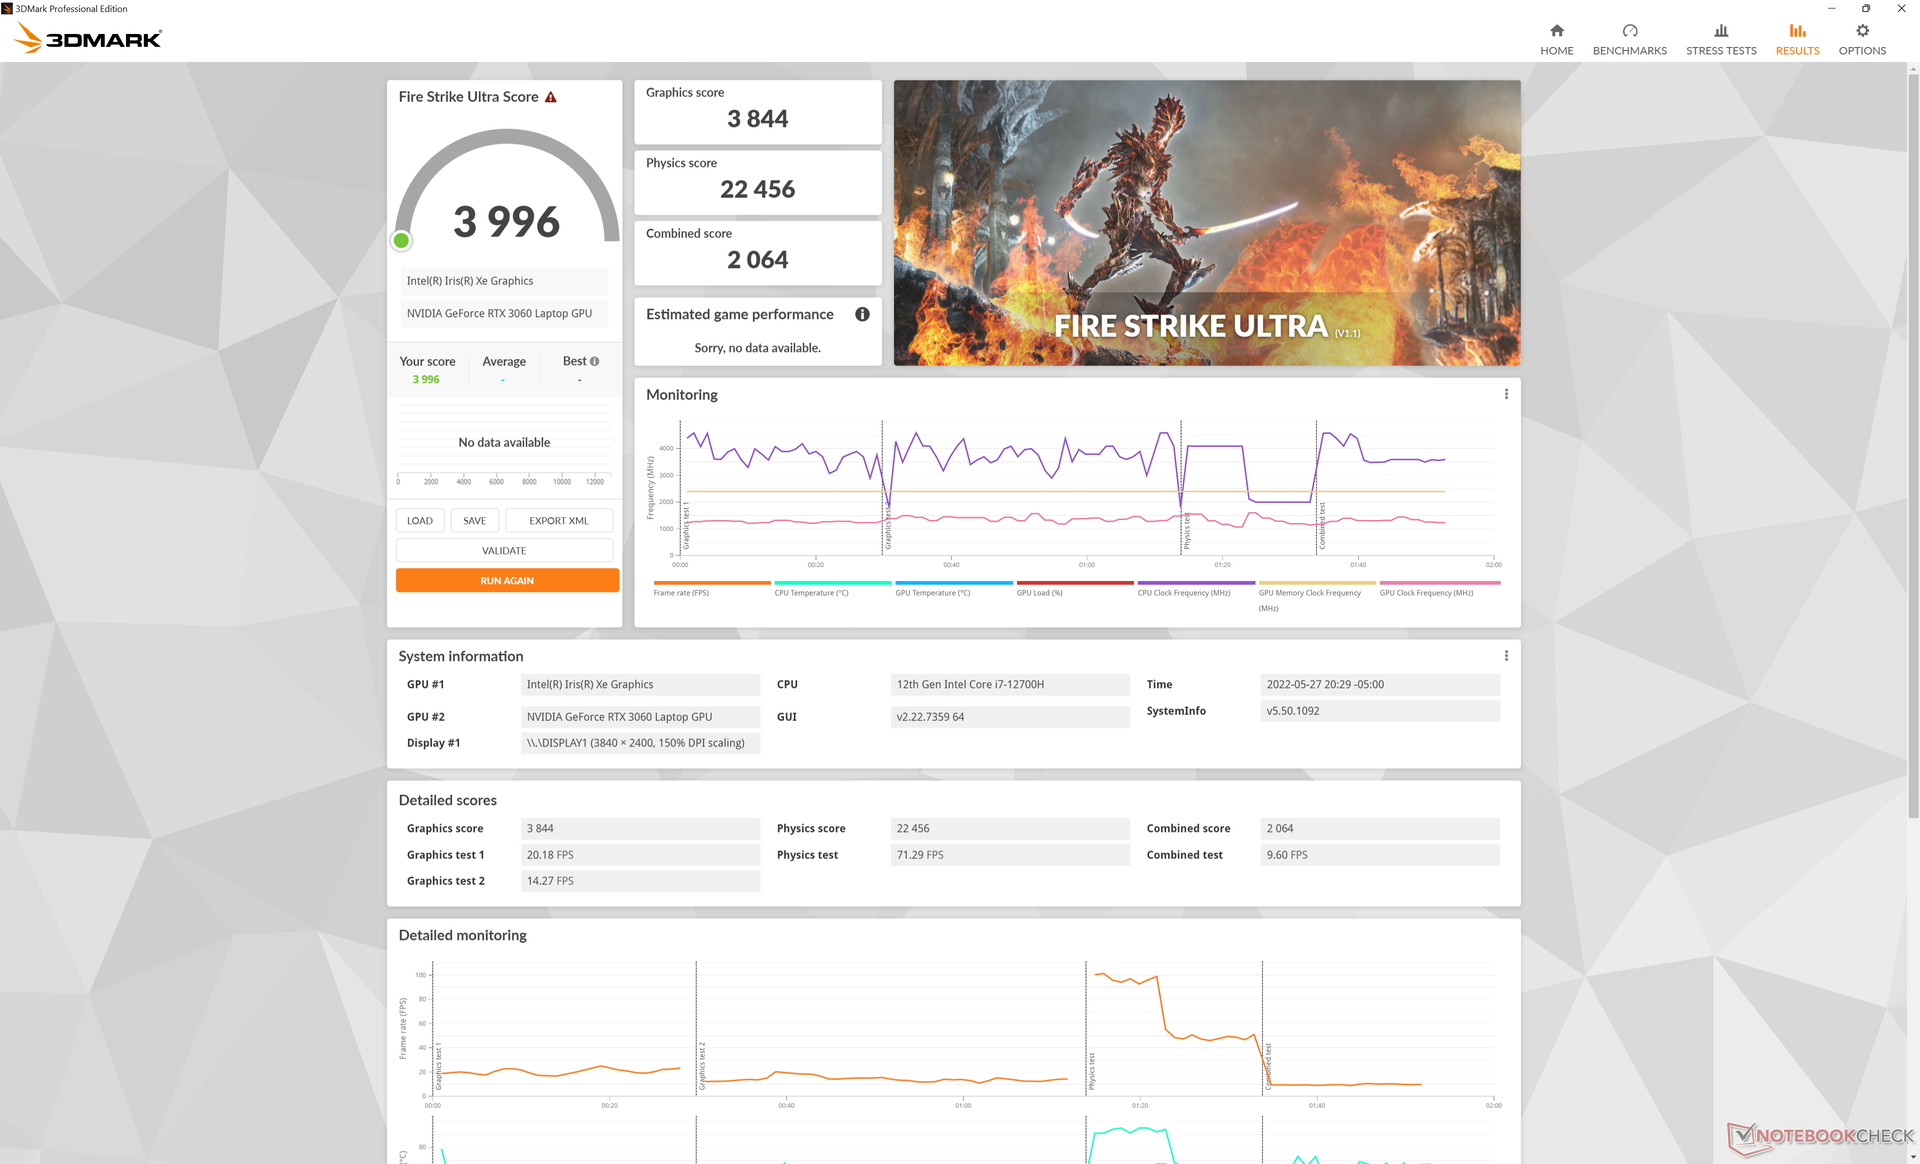
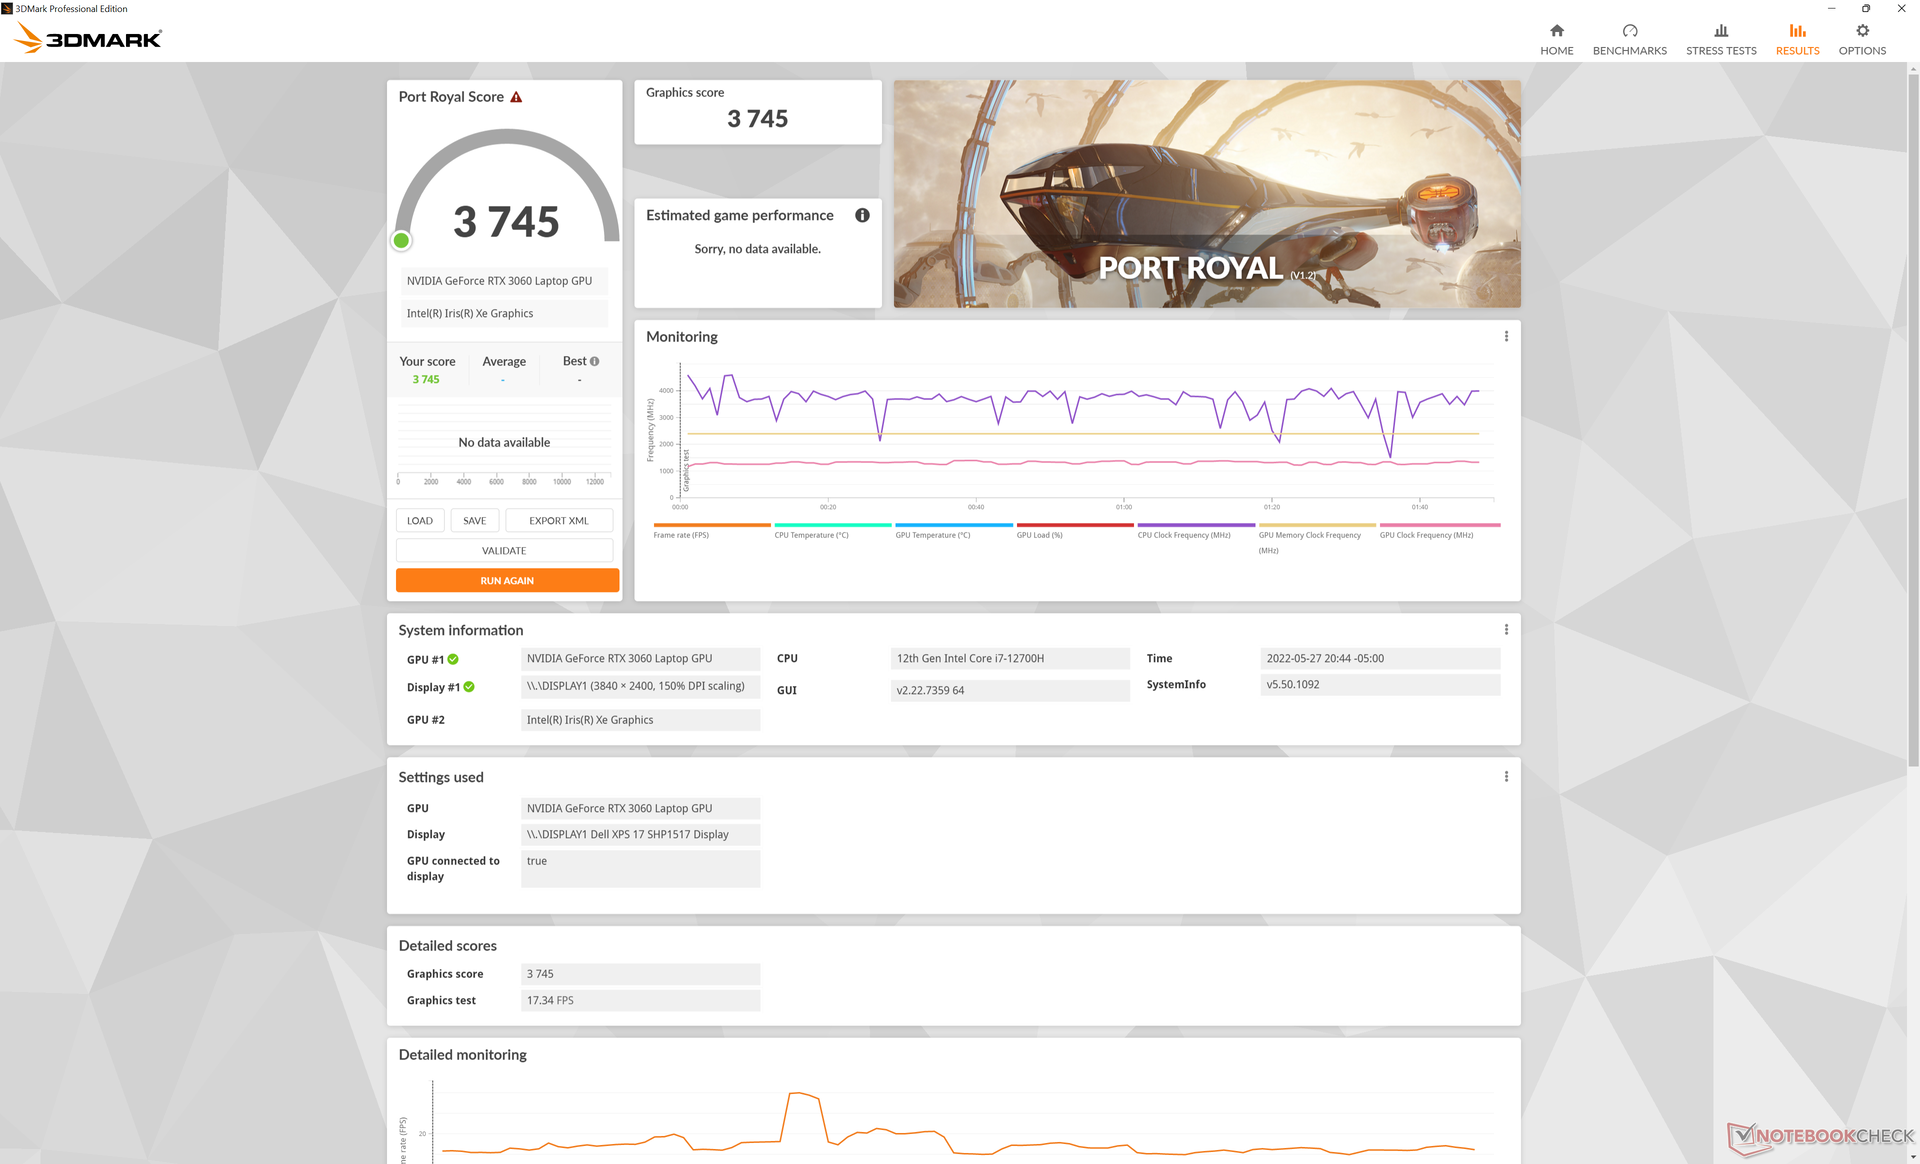
Dell har nedgraderat GeForce RTX 3060 TGP från 70 W på XPS 17 9710 till 65 W på XPS 17 9720. Även om Dell annonserar en GPU på 60 W för 9720 kan vi bekräfta att Nvidias kontrollpanel i stället visar 65 W, vilket ligger närmare våra egna oberoende resultat under testerna. Effekten är en 10-procentig minskning av den råa grafikprestandan enligt 3DMark-benchmarks och testade GPU-bundna spel som t.ex Witcher 3, Final Fantasy XV eller Strange Brigade.
Jämfört med den genomsnittliga bärbara datorn med samma GeForce RTX 3060 GPU är den i XPS 17 9720 cirka 20 procent långsammare. Det är värt att notera att de flesta andra bärbara datorer med RTX 3060 vanligtvis siktar på högre TGP-tak på 80 W eller mer. Åtminstone är GPU:n här fortfarande bättre än RTX 2060 Max-Q i den ursprungliga XPS 17 9700 med cirka 15 procent. Samtidigt skulle en nedgradering till RTX 3050 Ti SKU resultera i ett prestandaförlust på 25 till 30 procent
.
| 3DMark 11 - 1280x720 Performance GPU | |
| Razer Blade 17 RTX 3070 | |
| Inno3D GeForce RTX 3060 Twin X2 | |
| Genomsnitt NVIDIA GeForce RTX 3060 Laptop GPU (13799 - 30772, n=43) | |
| Dell XPS 17 9710 Core i7 RTX 3060 | |
| Dell XPS 17 9720 RTX 3060 | |
| MSI GF75 Thin 10SDR | |
| Dell XPS 17 9700 Core i7 RTX 2060 Max-Q | |
| Dell XPS 17 9720 | |
| Asus Strix GL703VM-DB74 | |
| Dell XPS 15 9520 RTX 3050 Ti | |
| LG Ultra 17U70N | |
| Dell XPS 17 9700 i5-10300H | |
| 3DMark 11 Performance | 21962 poäng | |
| 3DMark Cloud Gate Standard Score | 43738 poäng | |
| 3DMark Fire Strike Score | 15062 poäng | |
| 3DMark Time Spy Score | 6473 poäng | |
Hjälp | ||
Witcher 3 FPS Chart
| låg | med. | hög | ultra | QHD | 4K | |
|---|---|---|---|---|---|---|
| GTA V (2015) | 186.6 | 179 | 152.8 | 83.8 | 63.4 | |
| The Witcher 3 (2015) | 347.7 | 214.6 | 133.9 | 67.8 | ||
| Dota 2 Reborn (2015) | 185.7 | 169.9 | 163 | 133.5 | 84.6 | |
| Final Fantasy XV Benchmark (2018) | 137.9 | 90.5 | 69.3 | 49.1 | 28.3 | |
| X-Plane 11.11 (2018) | 133.3 | 111.6 | 93.8 | 92.3 | ||
| Strange Brigade (2018) | 352 | 162.6 | 130.6 | 113.4 | 82.3 | |
| Cyberpunk 2077 1.6 (2022) | 95.4 | 78.1 | 60 | 48.9 | 29 | 11.6 |
Utsläpp - Buller och temperaturer för bärbara datorer för spel
Systembrus
Fläktljudet och dess beteende har inte förändrats sedan den ursprungliga XPS 17 9700, vilket innebär att fläktljudet fortfarande når en toppnivå på nästan 50 db(A) när du spelar eller kör andra höga belastningar. Ljudet är jämförbart med många bärbara speldatorer när de utsätts för sådana stressiga förhållanden.
Fläktarna kommer att pulsera från tyst till högljudd ganska snabbt när medelhög till medelhög belastning introduceras och därför rekommenderar vi den tysta strömprofilen för att begränsa fläktpulsering om de extra hästkrafterna inte behövs.
Ljudnivå
| Låg belastning |
| 24.1 / 24.1 / 24.1 dB(A) |
| Hög belastning |
| 43.2 / 48 dB(A) |
 | ||
30 dB tyst 40 dB(A) hörbar 50 dB(A) högt ljud |
||
min: | ||
| Dell XPS 17 9720 RTX 3060 GeForce RTX 3060 Laptop GPU, i7-12700H, Samsung PM9A1 MZVL21T0HCLR | HP Envy 17-cg GeForce MX450, i5-1135G7, Samsung PM991 MZVLQ1T0HALB | Dell XPS 17 9710 Core i7 RTX 3060 GeForce RTX 3060 Laptop GPU, i7-11800H, Micron 2300 1TB MTFDHBA1T0TDV | Dell XPS 17 9700 Core i7 RTX 2060 Max-Q GeForce RTX 2060 Max-Q, i7-10875H, Micron 2200S 1TB MTFDHBA1T0TCK | Lenovo Legion 5 17ACH6H-82JY0003GE GeForce RTX 3060 Laptop GPU, R5 5600H, Samsung PM991a MZALQ512HBLU | Asus VivoBook 17 F712JA-AU708W Iris Plus Graphics G7 (Ice Lake 64 EU), i7-1065G7, Kingston OM8PCP3512F-AB | Razer Blade 17 (i7-12800H, RTX 3070 Ti) GeForce RTX 3070 Ti Laptop GPU, i7-12800H, Samsung PM9A1 MZVL21T0HCLR | |
|---|---|---|---|---|---|---|---|
| Noise | -9% | -5% | -10% | -6% | -14% | 4% | |
| av / miljö * (dB) | 23.8 | 26 -9% | 25.5 -7% | 28 -18% | 25 -5% | 29.6 -24% | 23 3% |
| Idle Minimum * (dB) | 24.1 | 26 -8% | 25.2 -5% | 28 -16% | 25 -4% | 31.4 -30% | 23 5% |
| Idle Average * (dB) | 24.1 | 31.7 -32% | 25.2 -5% | 28 -16% | 25 -4% | 31.4 -30% | 23 5% |
| Idle Maximum * (dB) | 24.1 | 25.2 -5% | 28 -16% | 30.5 -27% | 31.4 -30% | 23 5% | |
| Load Average * (dB) | 43.2 | 43.2 -0% | 45.9 -6% | 43.2 -0% | 37.5 13% | 36.1 16% | 36.92 15% |
| Witcher 3 ultra * (dB) | 48 | 49 -2% | 49 -2% | 50 -4% | |||
| Load Maximum * (dB) | 48 | 46.6 3% | 50.4 -5% | 50.5 -5% | 51 -6% | 40.1 16% | 50 -4% |
* ... mindre är bättre
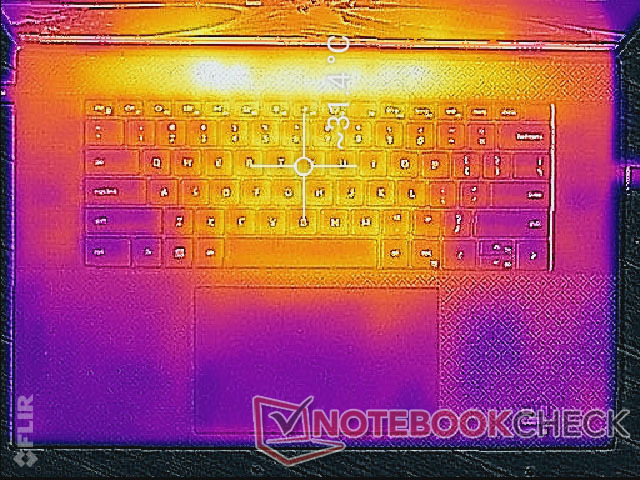
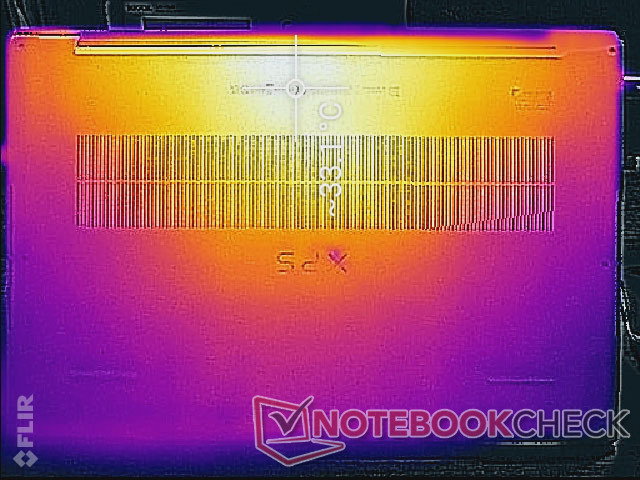
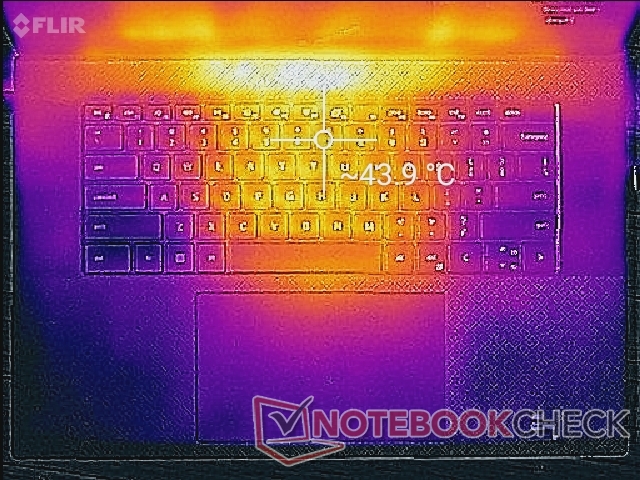
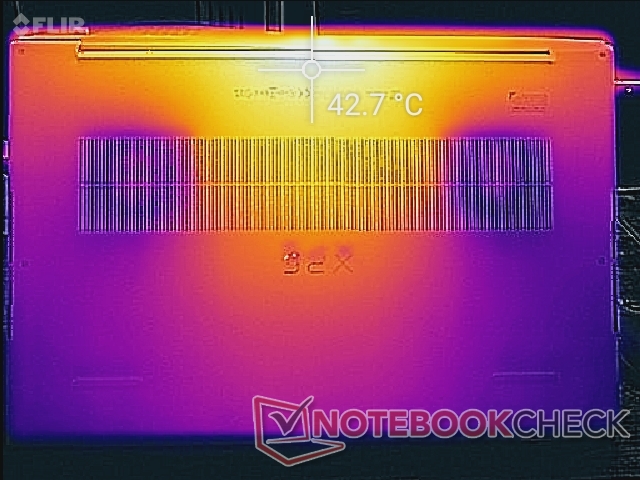
Temperatur
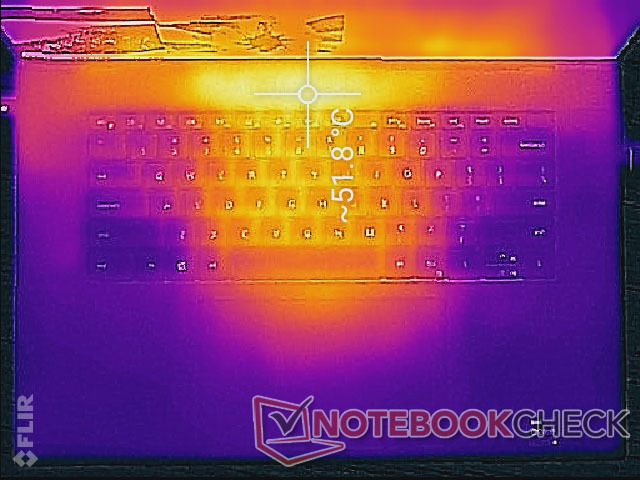
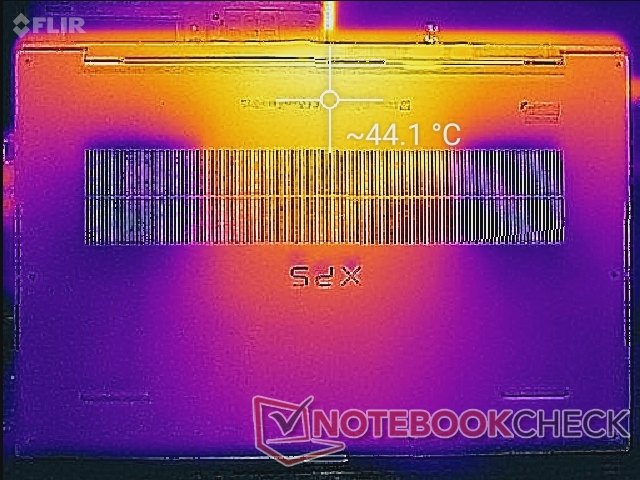
Vid långvarig belastning kan heta punkter nå över 52 C och 44 C på över- respektive undersidan. Dessa områden är strategiskt placerade mot baksidan av chassit och bort från handflatorna och de flesta tangenterna. Bottenytan kommer dock fortfarande att kännas mycket varm eftersom bottenplattan är en enda bit metall.
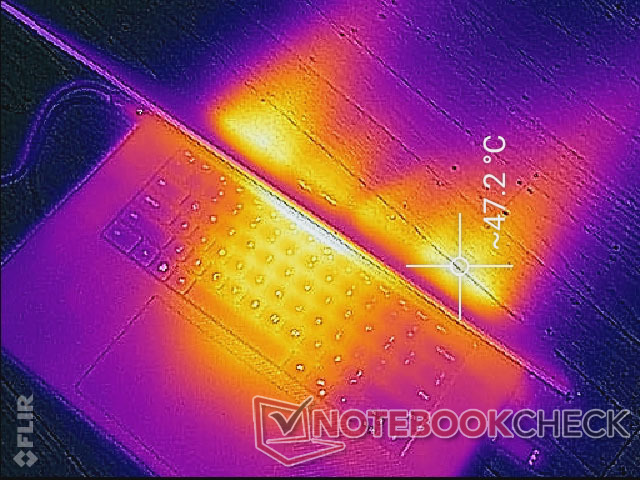
(-) Den maximala temperaturen på ovansidan är 51.8 °C / 125 F, jämfört med genomsnittet av 36.8 °C / 98 F , allt från 21 till 71 °C för klassen Multimedia.
(±) Botten värms upp till maximalt 44.2 °C / 112 F, jämfört med genomsnittet av 39.1 °C / 102 F
(+) Vid tomgångsbruk är medeltemperaturen för ovansidan 28.6 °C / 83 F, jämfört med enhetsgenomsnittet på 31.3 °C / ### class_avg_f### F.
(±) När du spelar The Witcher 3 är medeltemperaturen för ovansidan 33.9 °C / 93 F, jämfört med enhetsgenomsnittet på 31.3 °C / ## #class_avg_f### F.
(+) Handledsstöden och pekplattan når maximal hudtemperatur (33.2 °C / 91.8 F) och är därför inte varma.
(-) Medeltemperaturen för handledsstödsområdet på liknande enheter var 28.7 °C / 83.7 F (-4.5 °C / -8.1 F).
| Dell XPS 17 9720 RTX 3060 Intel Core i7-12700H, NVIDIA GeForce RTX 3060 Laptop GPU | HP Envy 17-cg Intel Core i5-1135G7, NVIDIA GeForce MX450 | Dell XPS 17 9710 Core i7 RTX 3060 Intel Core i7-11800H, NVIDIA GeForce RTX 3060 Laptop GPU | Dell XPS 17 9700 Core i7 RTX 2060 Max-Q Intel Core i7-10875H, NVIDIA GeForce RTX 2060 Max-Q | Lenovo Legion 5 17ACH6H-82JY0003GE AMD Ryzen 5 5600H, NVIDIA GeForce RTX 3060 Laptop GPU | Asus VivoBook 17 F712JA-AU708W Intel Core i7-1065G7, Intel Iris Plus Graphics G7 (Ice Lake 64 EU) | Razer Blade 17 (i7-12800H, RTX 3070 Ti) Intel Core i7-12800H, NVIDIA GeForce RTX 3070 Ti Laptop GPU | |
|---|---|---|---|---|---|---|---|
| Heat | 14% | 1% | -1% | 2% | 12% | 6% | |
| Maximum Upper Side * (°C) | 51.8 | 45.9 11% | 50.2 3% | 53 -2% | 42.2 19% | 40.2 22% | 43 17% |
| Maximum Bottom * (°C) | 44.2 | 49.7 -12% | 38.4 13% | 39.2 11% | 50.9 -15% | 47.9 -8% | 44 -0% |
| Idle Upper Side * (°C) | 34.8 | 24.2 30% | 37.6 -8% | 37 -6% | 34.3 1% | 27.3 22% | 32 8% |
| Idle Bottom * (°C) | 33.2 | 24.8 25% | 34.2 -3% | 35.8 -8% | 32 4% | 28.9 13% | 34 -2% |
* ... mindre är bättre
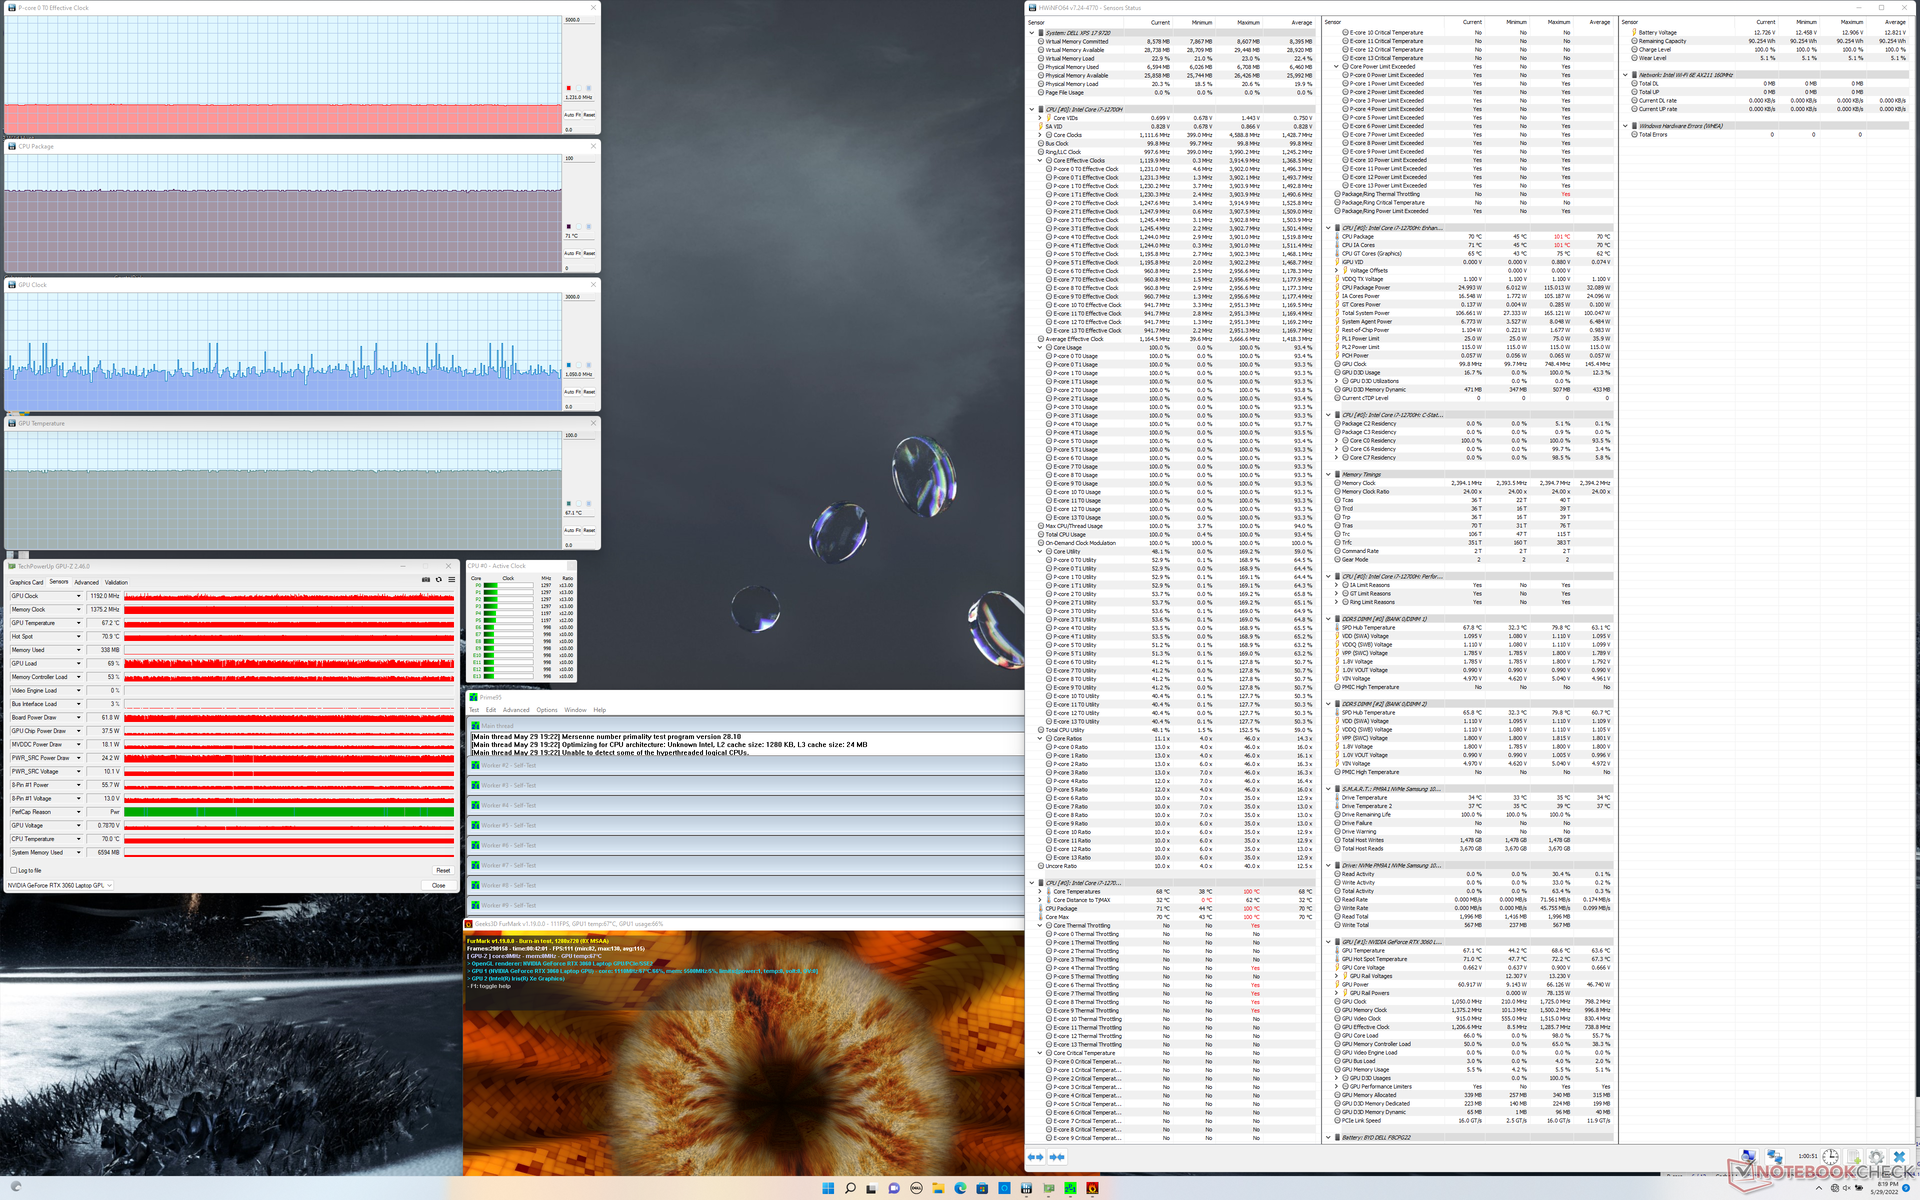
Stresstest
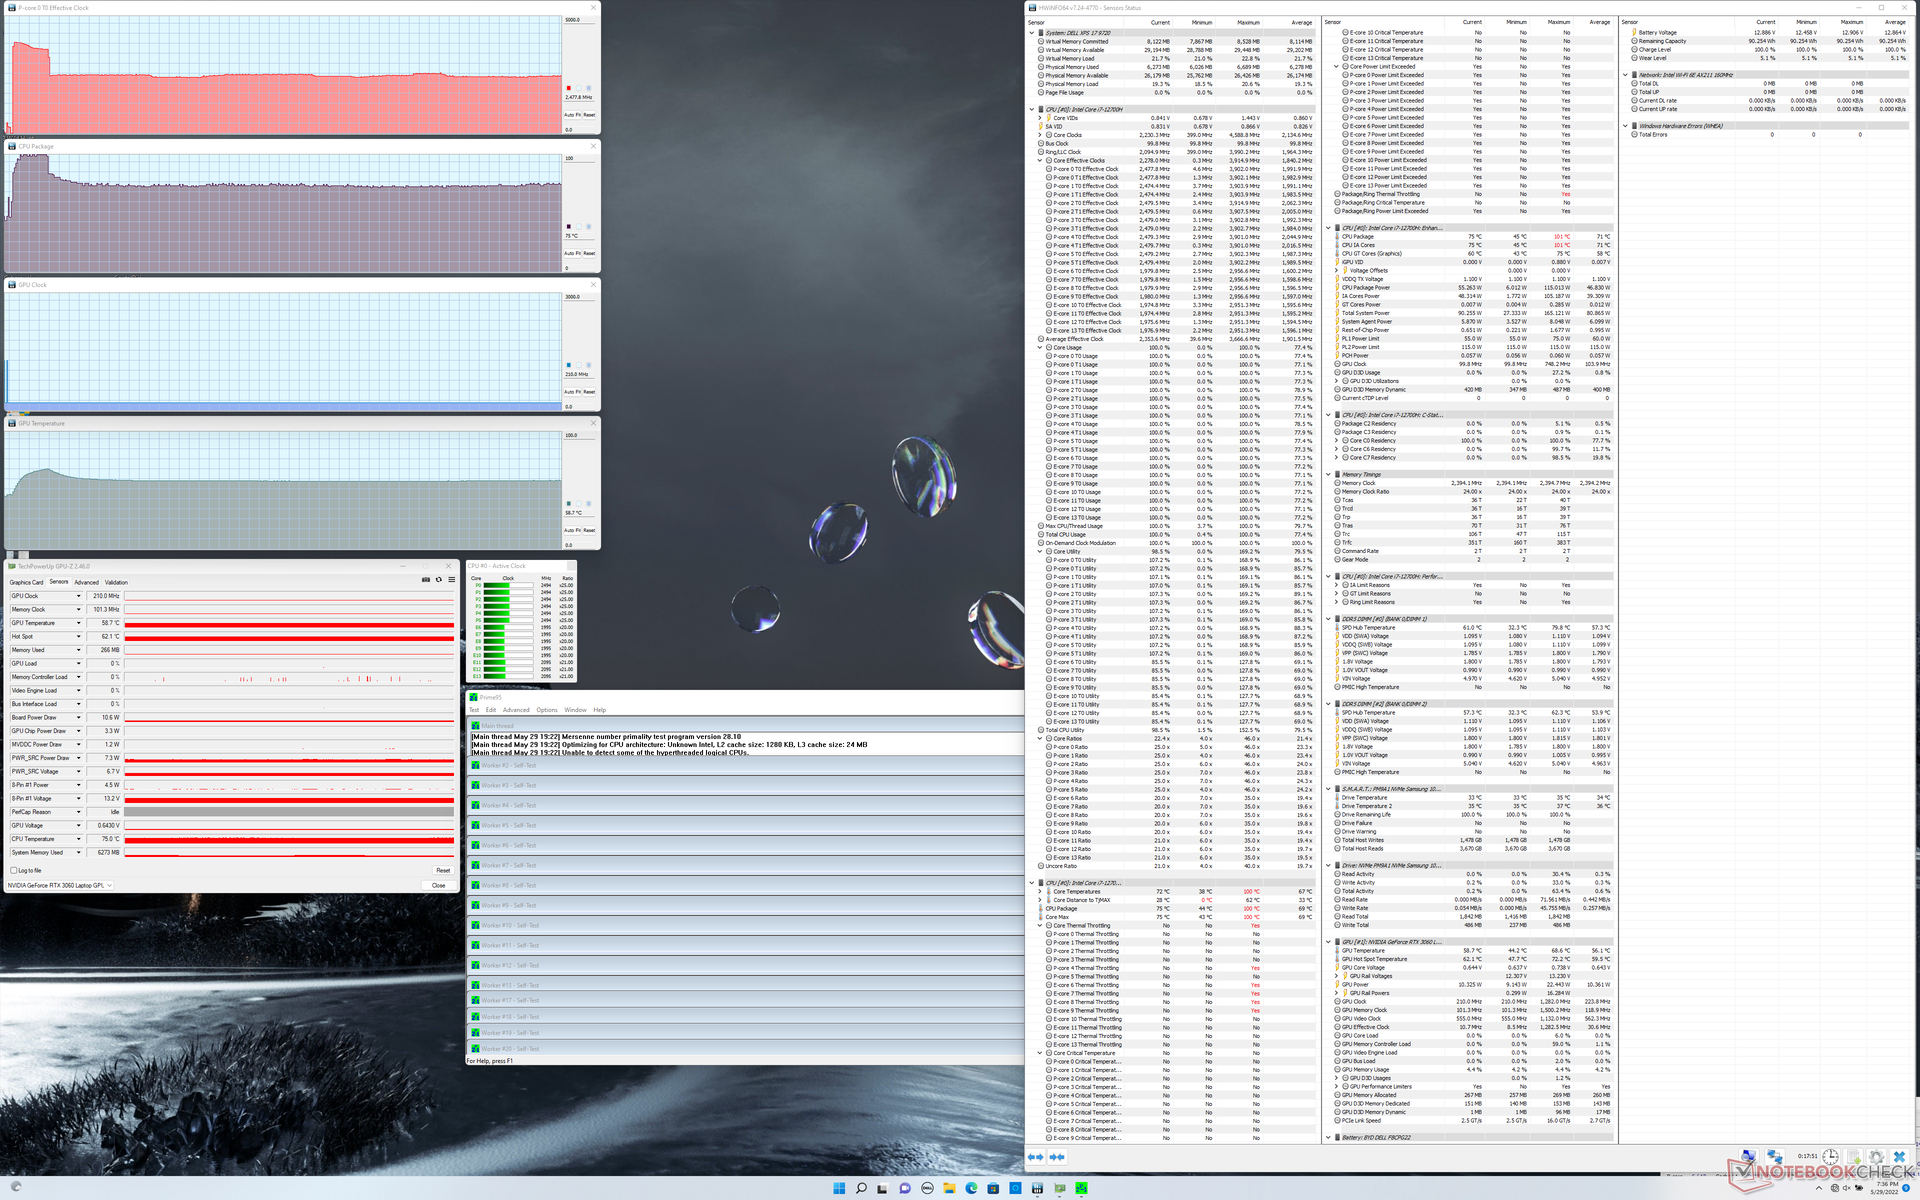
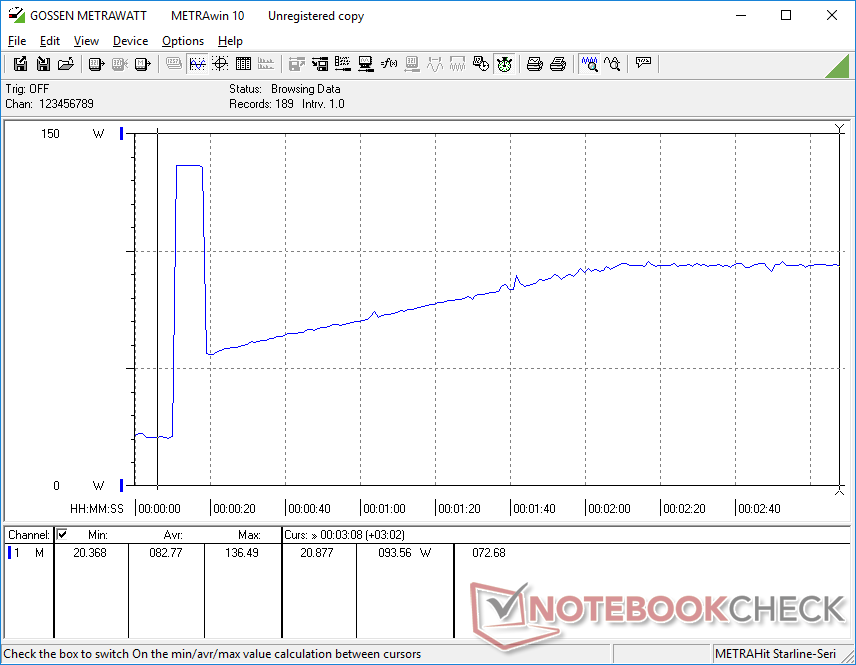
När processorn stressades under Prime95 ökade den till 3,8 GHz, 100 C och 115 W i cirka 10-15 sekunder innan den sjönk och stabiliserades på 2,5 GHz, 75 C och 55 W. Jämfört med Core i7-11800H XPS 17 9710 kan vår 9720-enhet nå en högre initial effektuttag (115 W jämfört med 87 W) samtidigt som den stabiliseras vid en svalare kärntemperatur (75 C jämfört med 82 C) och vid ett identiskt effektuttag (55 W). XPS-systemet kan alltså bara utnyttja Alder Lake-plattformens högre TDP-områden eller högre klockfrekvenser under korta perioder innan de termiska begränsningarna börjar gälla.
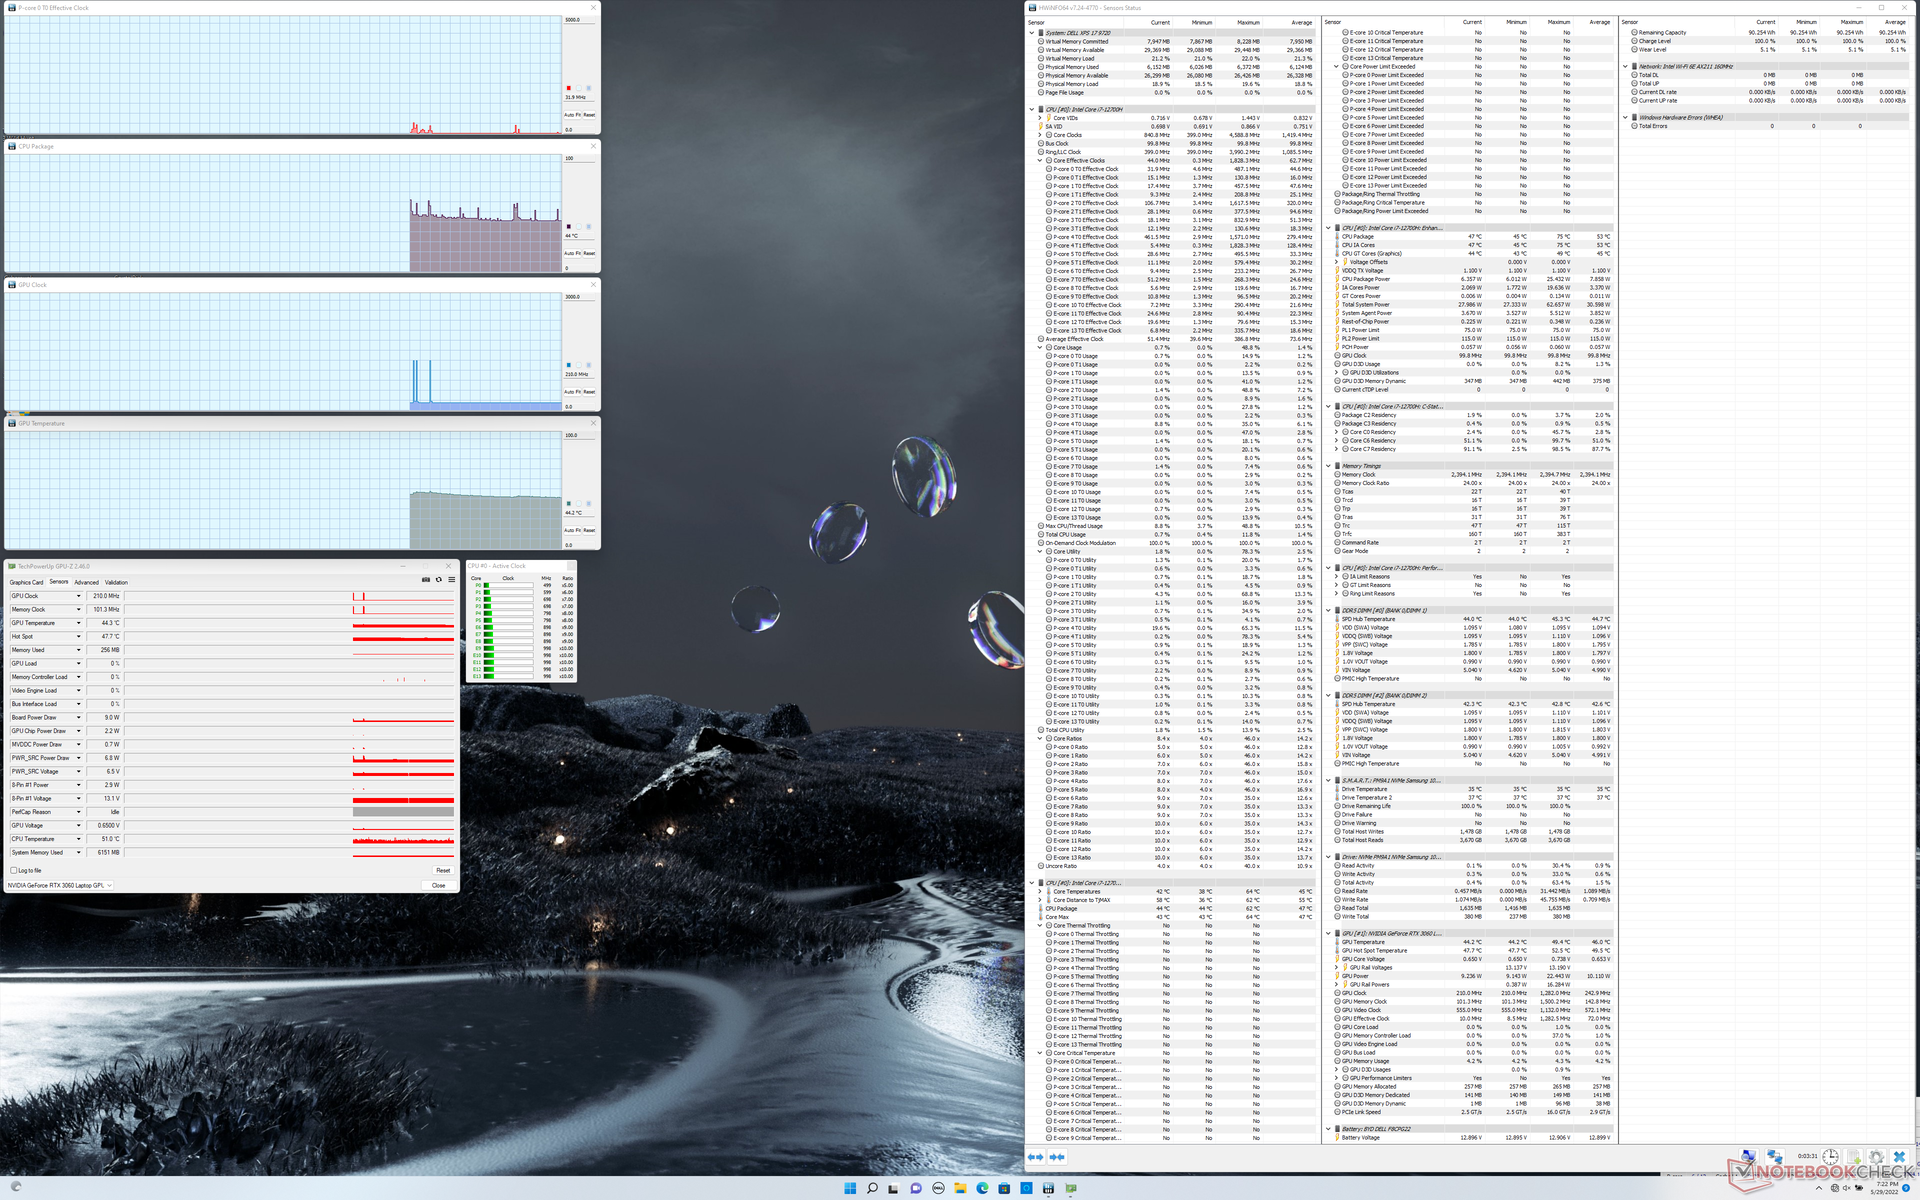
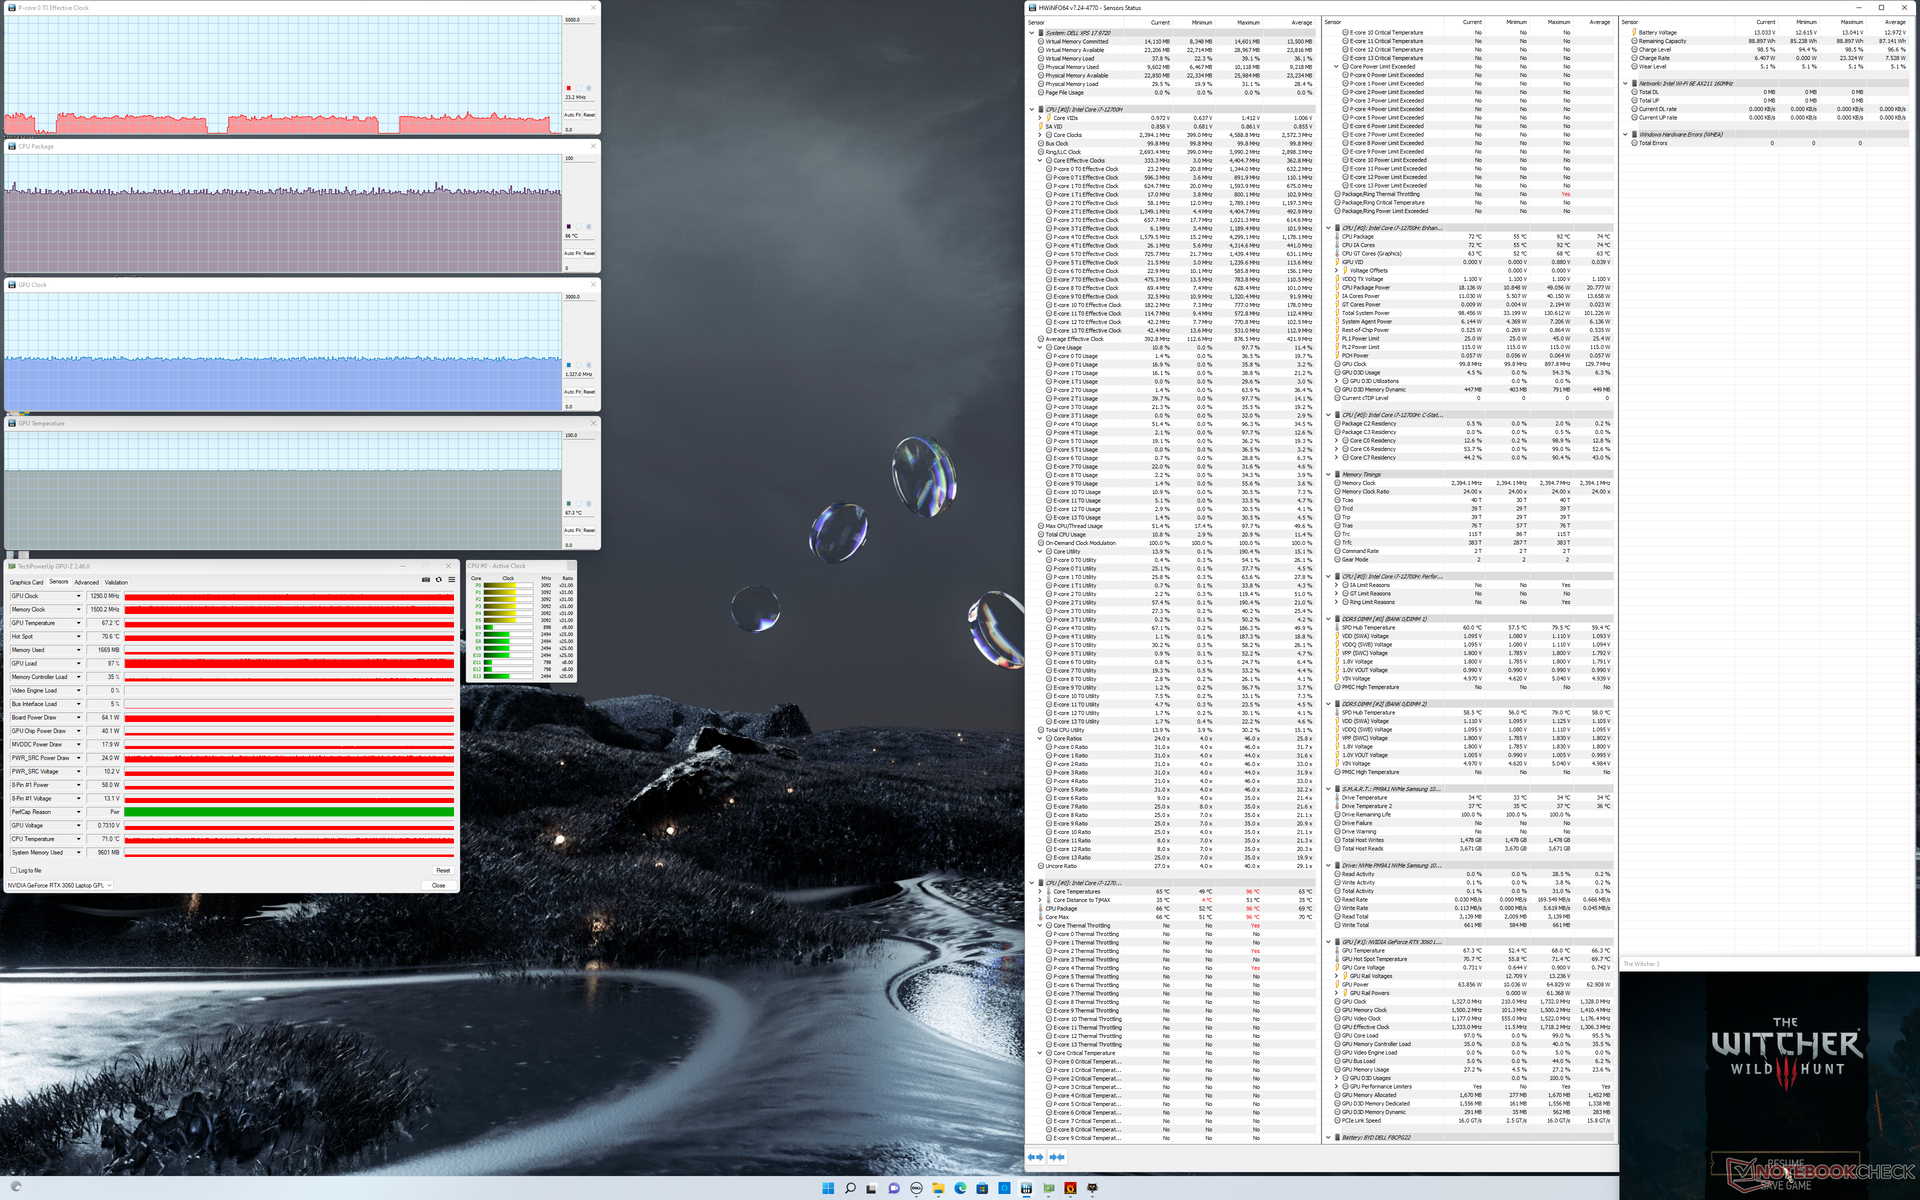
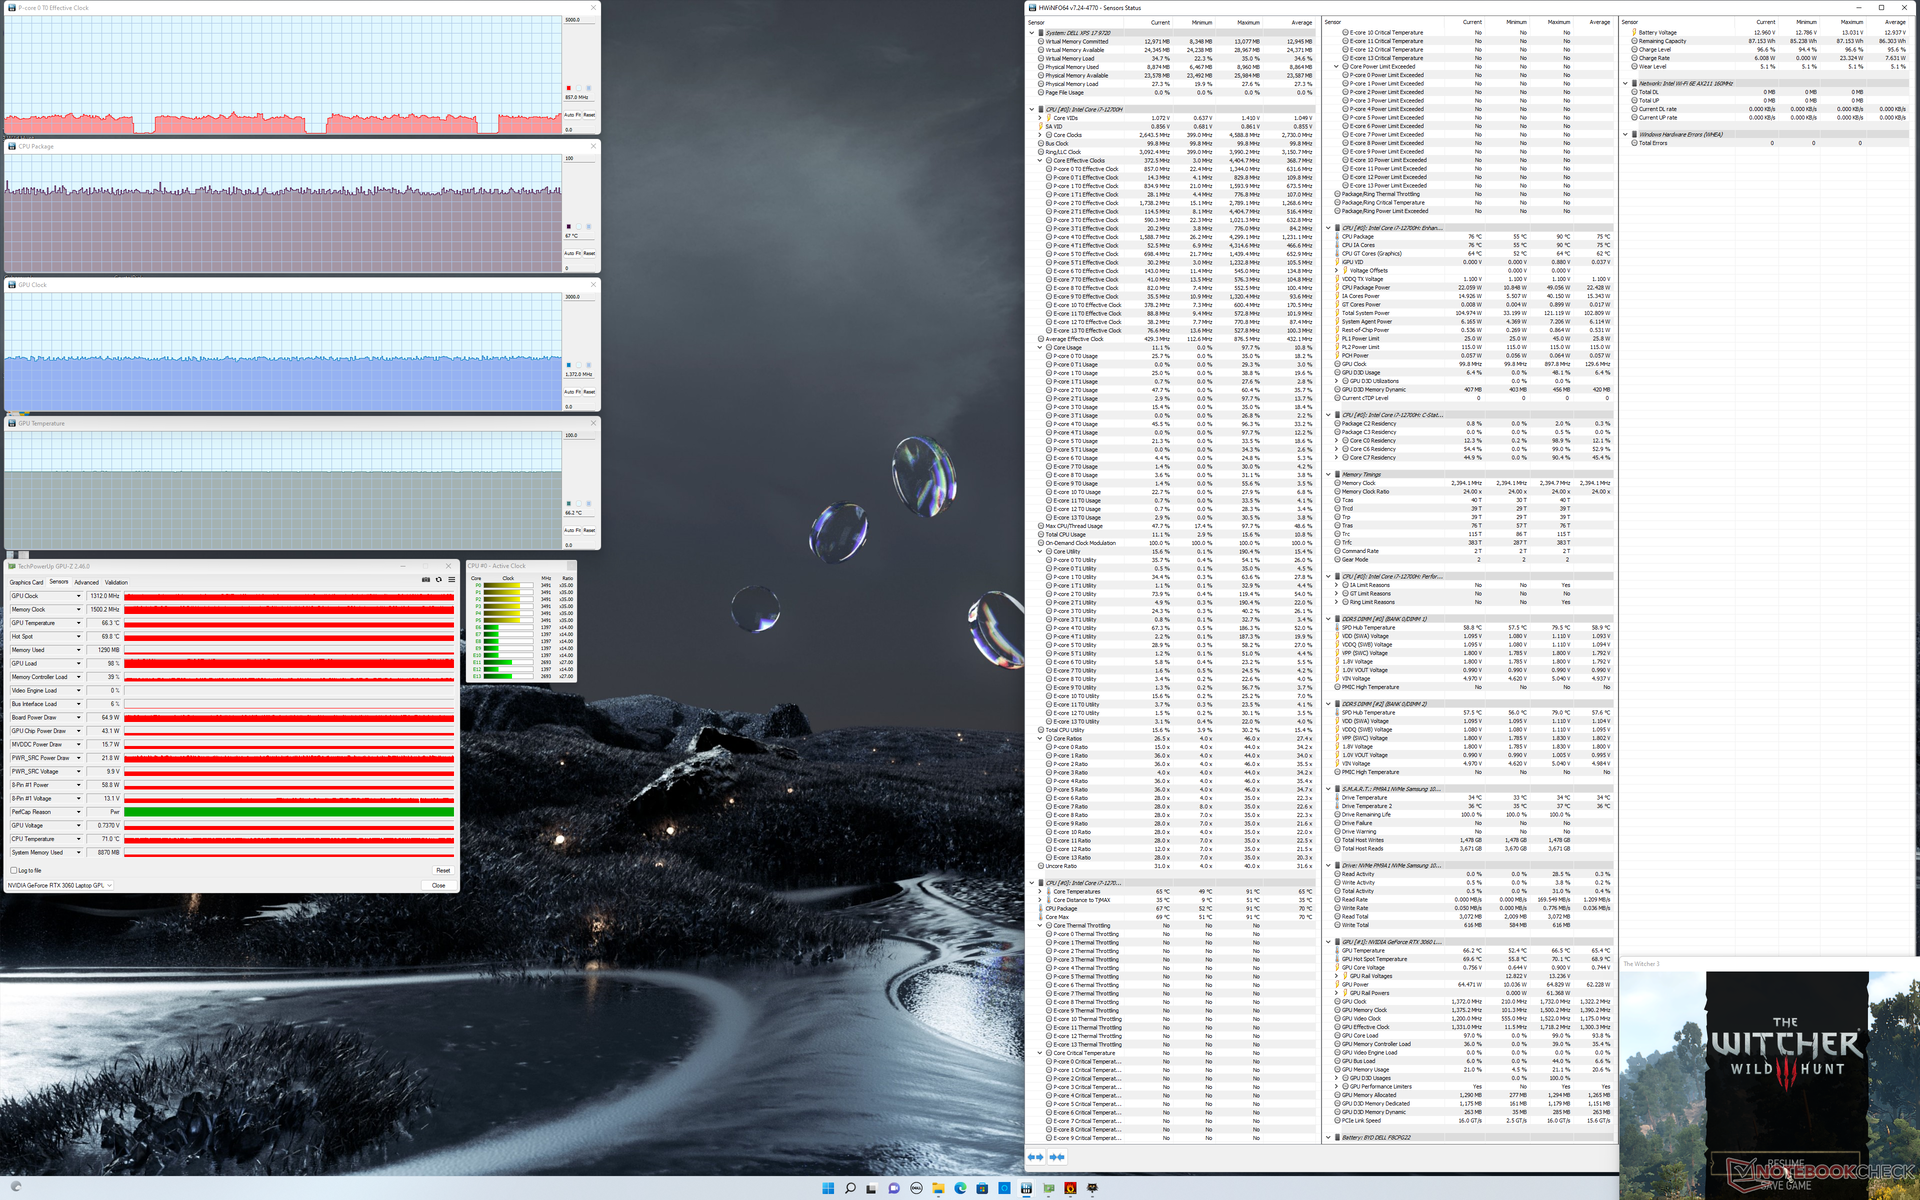
GPU-klockfrekvens, temperatur och strömförbrukning på kortet vid körning på batterier Witcher 3 skulle stabiliseras vid 1312 MHz, 66 C och 65 W, jämfört med 1530 MHz, 67 C och 69 W på XPS 17 9710. Den totalt sett långsammare grafikprestandan från år till år återspeglar våra sämre 3DMark-resultat som registrerats ovan.
GPU-prestandaökningen från att köra i Ultra Performance-läge jämfört med optimerat läge verkar vara försumbar.
Att köra på batterier begränsar både CPU- och GPU-prestanda. Ett Fire Strike -test på batteridrift skulle ge fysik- och grafikresultat på 14770 respektive 24927 poäng, jämfört med 16354 och 23563 poäng vid nätanslutning.
| CPU-klocka (GHz) | GPU-klocka (MHz) | Genomsnittlig CPU-temperatur (°C) | Genomsnittlig GPU-temperatur (°C) | |
| System Idle | -- | -- | 44 | 44 |
| Prime95 Stress | 2.5 | -- | 75 | 59 |
| Prime95 + FurMark Stress | ||||
| Witcher 3 Stress (optimerat läge) | ~0,7 | 1290 | 66 | 67 |
| Witcher 3 Stress (Ultra Performance-läge) | ~0,8 | 1312 | 67 | 66 |
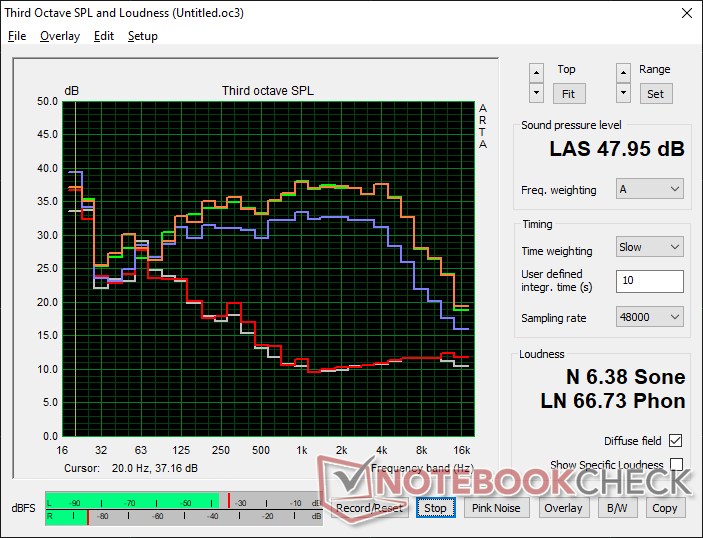
Högtalare
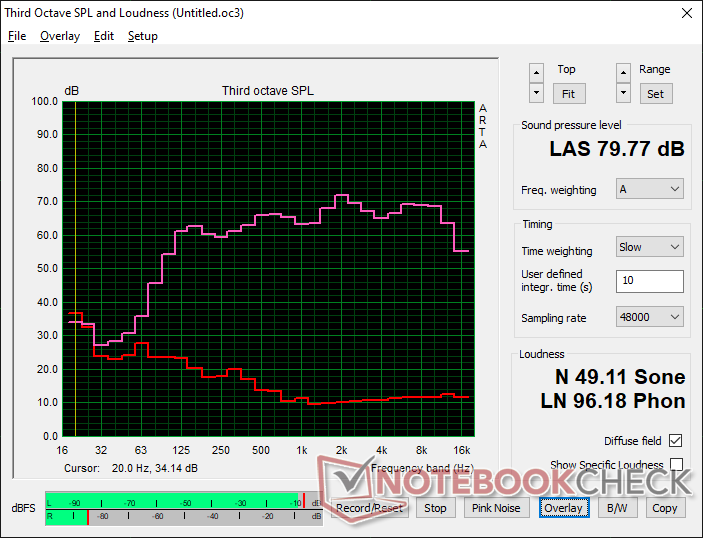
Dell XPS 17 9720 RTX 3060 ljudanalys
(±) | högtalarljudstyrkan är genomsnittlig men bra (79.8 dB)
Bas 100 - 315 Hz
(±) | reducerad bas - i genomsnitt 5.2% lägre än medianen
(±) | linjäriteten för basen är genomsnittlig (7% delta till föregående frekvens)
Mellan 400 - 2000 Hz
(+) | balanserad mellan - endast 2.2% från medianen
(+) | mids är linjära (3.8% delta till föregående frekvens)
Högsta 2 - 16 kHz
(+) | balanserade toppar - endast 2.8% från medianen
(+) | toppar är linjära (3.1% delta till föregående frekvens)
Totalt 100 - 16 000 Hz
(+) | det totala ljudet är linjärt (8.3% skillnad mot median)
Jämfört med samma klass
» 9% av alla testade enheter i den här klassen var bättre, 2% liknande, 89% sämre
» Den bästa hade ett delta på 5%, genomsnittet var 17%, sämst var 45%
Jämfört med alla testade enheter
» 2% av alla testade enheter var bättre, 1% liknande, 97% sämre
» Den bästa hade ett delta på 4%, genomsnittet var 23%, sämst var 134%
Apple MacBook Pro 16 2021 M1 Pro ljudanalys
(+) | högtalare kan spela relativt högt (84.7 dB)
Bas 100 - 315 Hz
(+) | bra bas - bara 3.8% från medianen
(+) | basen är linjär (5.2% delta till föregående frekvens)
Mellan 400 - 2000 Hz
(+) | balanserad mellan - endast 1.3% från medianen
(+) | mids är linjära (2.1% delta till föregående frekvens)
Högsta 2 - 16 kHz
(+) | balanserade toppar - endast 1.9% från medianen
(+) | toppar är linjära (2.7% delta till föregående frekvens)
Totalt 100 - 16 000 Hz
(+) | det totala ljudet är linjärt (4.6% skillnad mot median)
Jämfört med samma klass
» 0% av alla testade enheter i den här klassen var bättre, 0% liknande, 100% sämre
» Den bästa hade ett delta på 5%, genomsnittet var 17%, sämst var 45%
Jämfört med alla testade enheter
» 0% av alla testade enheter var bättre, 0% liknande, 100% sämre
» Den bästa hade ett delta på 4%, genomsnittet var 23%, sämst var 134%
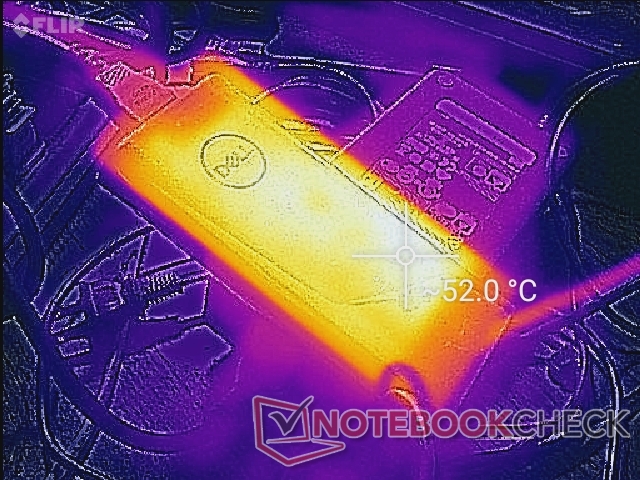
Energihantering - Högre strömförbrukning för Turbo Boost
Effektförbrukning
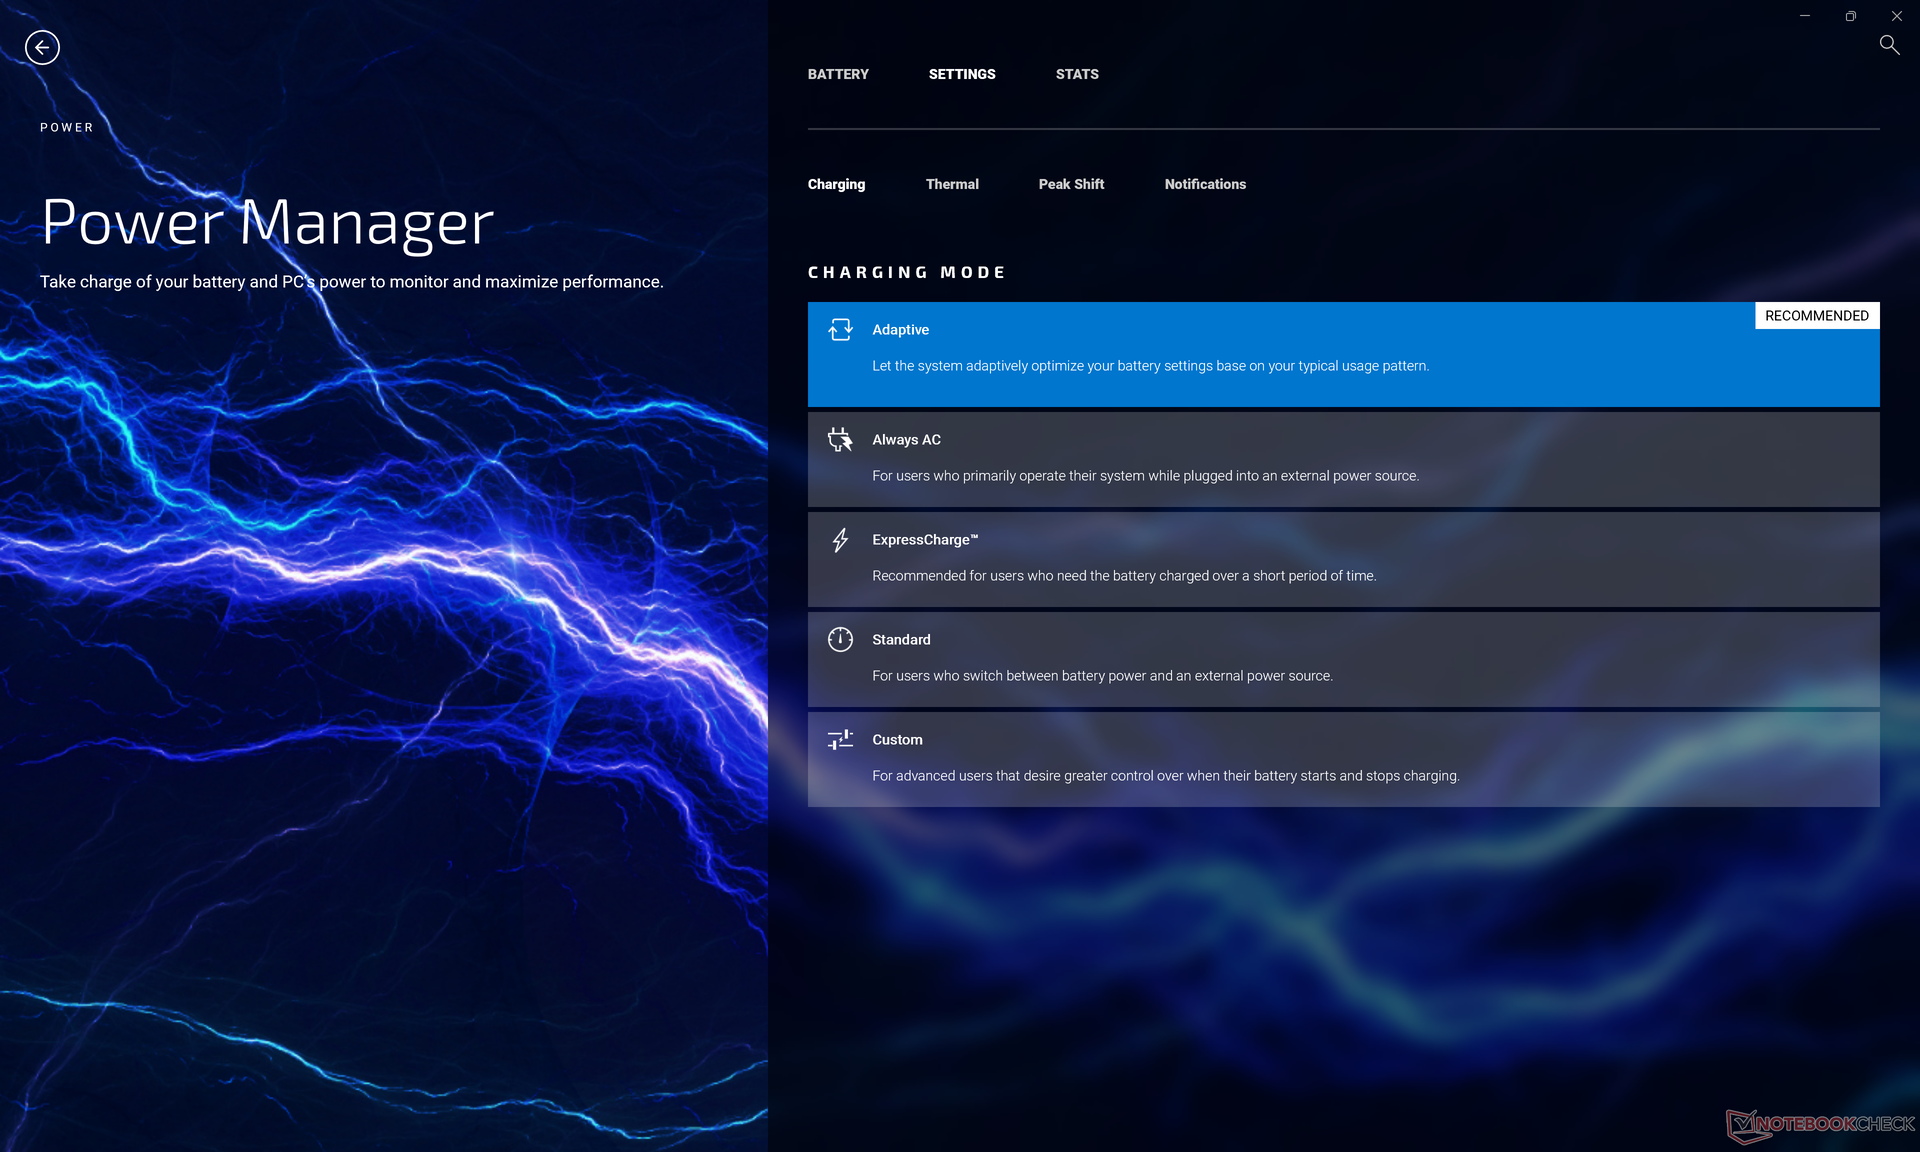
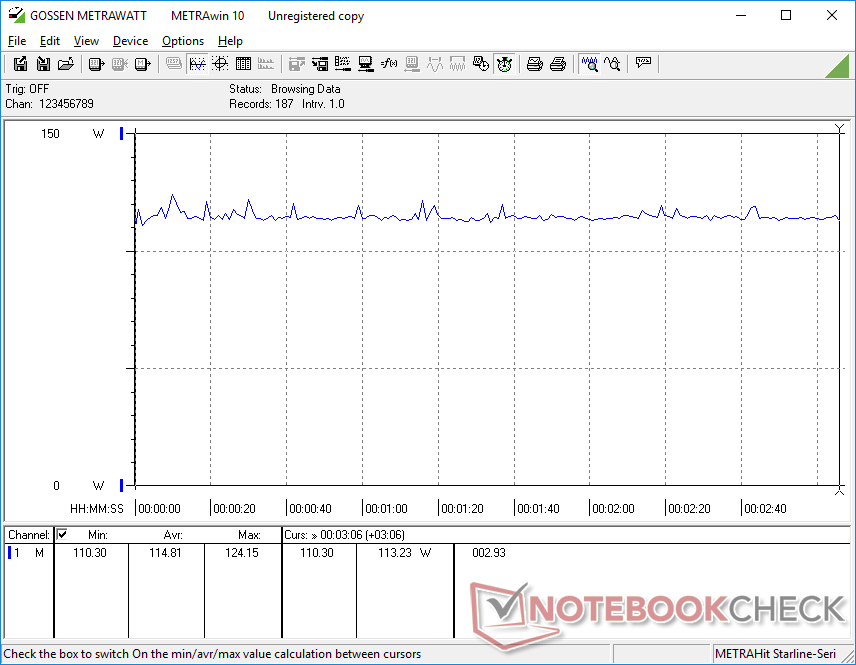
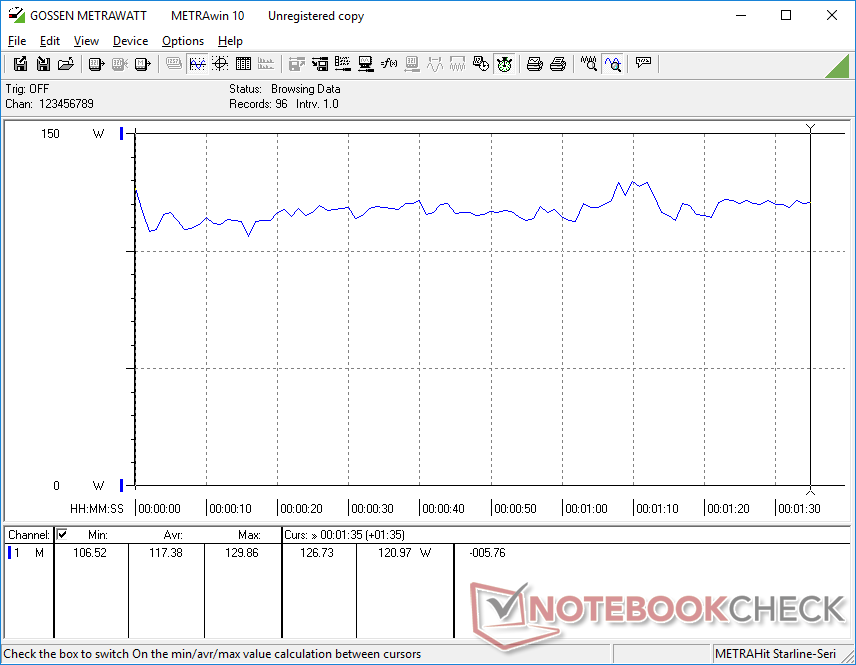
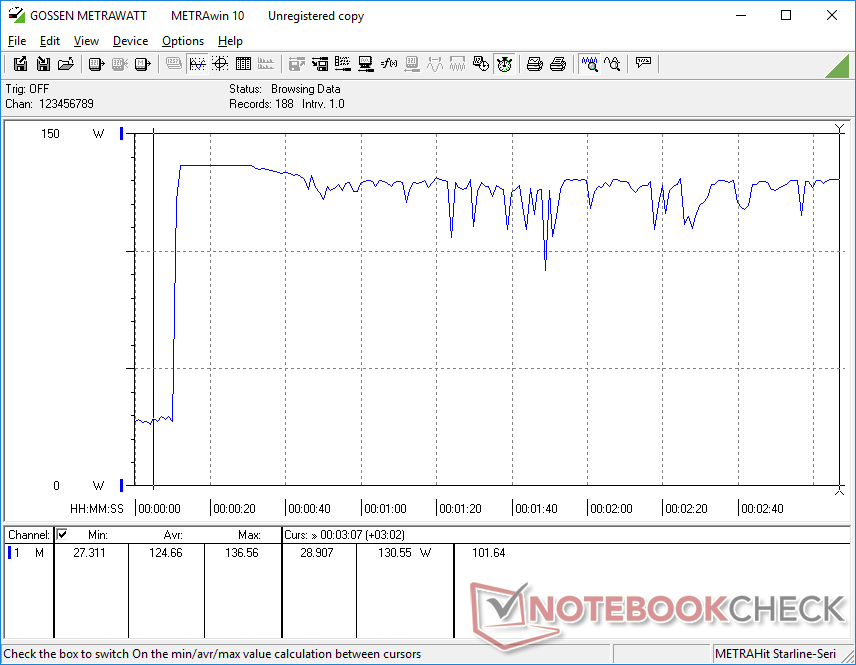
XPS 17 9700 uppvisade problem med laddning där systemet inte kunde dra mer än 100 W från 130 W-adaptern. Tack och lov tog Dell itu med problemet i den efterföljande XPS 17 9710 och 9720 är inte annorlunda. När man kör Witcher 3drar vår 9720-enhet 115 W, vilket är nästan identiskt med vad vi noterade på den äldre 9710-enheten. XPS 15-serien och XPS 17-serien fortsätter att vara de enda modellerna på marknaden som levereras med en 130 W USB-C-adapter.
Noterbart är att strömförbrukningen när Prime95 körs är något högre än på 9710 i början av testet innan den stabiliseras på cirka 94 W vardera. Den högre strömförbrukningen för 12:e generationens processor är alltså kortvarig innan den blir likadan som för 9710-modellen med 11:e generationens processorer
Laddningen bromsas betydligt när man spelar eller kör hög belastning. När du kör Witcher 3 vid 13 procent batterikapacitet och på växelström, till exempel, skulle batteriet bara öka med ytterligare 12 procent under loppet av en timme.
| Av/Standby | |
| Låg belastning | |
| Hög belastning |
|
Förklaring:
min: | |
| Dell XPS 17 9720 RTX 3060 i7-12700H, GeForce RTX 3060 Laptop GPU, Samsung PM9A1 MZVL21T0HCLR, IPS, 3840x2400, 17" | HP Envy 17-cg i5-1135G7, GeForce MX450, Samsung PM991 MZVLQ1T0HALB, IPS, 1920x1080, 17.3" | Dell XPS 17 9710 Core i7 RTX 3060 i7-11800H, GeForce RTX 3060 Laptop GPU, Micron 2300 1TB MTFDHBA1T0TDV, IPS, 3840x2400, 17" | Dell XPS 17 9700 Core i7 RTX 2060 Max-Q i7-10875H, GeForce RTX 2060 Max-Q, Micron 2200S 1TB MTFDHBA1T0TCK, IPS, 3840x2400, 17" | Lenovo Legion 5 17ACH6H-82JY0003GE R5 5600H, GeForce RTX 3060 Laptop GPU, Samsung PM991a MZALQ512HBLU, IPS, 1920x1080, 17.3" | Asus VivoBook 17 F712JA-AU708W i7-1065G7, Iris Plus Graphics G7 (Ice Lake 64 EU), Kingston OM8PCP3512F-AB, IPS, 1920x1080, 17.3" | Razer Blade 17 (i7-12800H, RTX 3070 Ti) i7-12800H, GeForce RTX 3070 Ti Laptop GPU, Samsung PM9A1 MZVL21T0HCLR, IPS, 2560x1440, 17.3" | |
|---|---|---|---|---|---|---|---|
| Power Consumption | 46% | 3% | 7% | -40% | 61% | -54% | |
| Idle Minimum * (Watt) | 5.9 | 3.8 36% | 7.5 -27% | 5.8 2% | 15.6 -164% | 4.2 29% | 14.4 -144% |
| Idle Average * (Watt) | 15.8 | 9.4 41% | 15.7 1% | 20.6 -30% | 20.7 -31% | 7.9 50% | 20 -27% |
| Idle Maximum * (Watt) | 26.7 | 10.1 62% | 23.1 13% | 21 21% | 22.9 14% | 8.8 67% | 21.5 19% |
| Load Average * (Watt) | 117.4 | 64.4 45% | 87.2 26% | 104.7 11% | 134 -14% | 29.7 75% | 119 -1% |
| Witcher 3 ultra * (Watt) | 114.8 | 64.4 44% | 116 -1% | 99.2 14% | 135 -18% | 28.8 75% | 218 -90% |
| Load Maximum * (Watt) | 136.6 | 68 50% | 131.6 4% | 107.6 21% | 170 -24% | 44 68% | 248 -82% |
* ... mindre är bättre
Power Consumption Witcher 3 / Stresstest
Power Consumption external Monitor
Batteritid
Körtiderna har inte ändrats nämnvärt jämfört med den tidigare generationen av modellerna 9710 och 9700. Räkna med knappt 9 timmars verklig WLAN-användning när du använder balanserad eller optimerad strömprofil med den integrerade GPU:n aktiv. Laddning från tom till full kapacitet tar drygt 2 timmar om du antar att du inte kör några krävande program som nämns ovan.
| Dell XPS 17 9720 RTX 3060 i7-12700H, GeForce RTX 3060 Laptop GPU, 97 Wh | HP Envy 17-cg i5-1135G7, GeForce MX450, 55.67 Wh | Dell XPS 17 9710 Core i7 RTX 3060 i7-11800H, GeForce RTX 3060 Laptop GPU, 97 Wh | Dell XPS 17 9700 Core i7 RTX 2060 Max-Q i7-10875H, GeForce RTX 2060 Max-Q, 97 Wh | Lenovo Legion 5 17ACH6H-82JY0003GE R5 5600H, GeForce RTX 3060 Laptop GPU, 80 Wh | Asus VivoBook 17 F712JA-AU708W i7-1065G7, Iris Plus Graphics G7 (Ice Lake 64 EU), 32 Wh | Razer Blade 17 (i7-12800H, RTX 3070 Ti) i7-12800H, GeForce RTX 3070 Ti Laptop GPU, 82 Wh | |
|---|---|---|---|---|---|---|---|
| Batteridrifttid | 46% | 74% | 56% | 21% | 11% | 24% | |
| WiFi v1.3 (h) | 8.7 | 7.9 -9% | 7.6 -13% | 9.7 11% | 4.4 -49% | 4.4 -49% | 5.9 -32% |
| Load (h) | 1 | 2 100% | 2.6 160% | 2 100% | 1.9 90% | 1.7 70% | 1.8 80% |
| Reader / Idle (h) | 17.7 | 17.7 | 23.8 | 5.5 | |||
| H.264 (h) | 3.5 | 4.9 |
För
Emot
Omdöme - Handlar helt om processorn
Det finns lite att klaga på den uppdaterade processorn. Även om det är sant att Alder Lake-plattformen kan vara mycket strömslukande är prestandaförbättringarna åtminstone respektabla. Kraftanvändare som vet att de kan utnyttja den extra prestandan kommer säkert att uppskatta kompromissen i detta avseende.
Dell XPS 17 9720 introducerar en helt ny processor med betydande prestandavinster jämfört med äldre alternativ från 10:e och 11:e generationen. Bortsett från processorn kvarstår dock samma nackdelar från XPS 17 9710 eller 9700.
Tyvärr finns det några mindre nackdelar som ännu inte har åtgärdats två år efter den här designen. Webbkamerans videokvalitet är fortfarande dålig, laddningen är betydligt långsammare när man kör krävande belastningar, locket är svårt att öppna med sitt dåliga grepp och det finns fortfarande ingen sekretessbrytare för webbkameran eller stöd för Wi-Fi 6E. Det faktum att GPU:n har tagit en smäll till synes från ingenstans kan vara ett svårt piller att svälja för XPS-entusiaster. De största fördelarna med XPS 17 9720 jämfört med alternativ med fler funktioner som t.ex Gigabyte Aero 17 fortsätter att vara dess mer kompakta chassistorlek och 16:10-format.
Pris och tillgänglighet
Amazon har endast en XPS 17 9720 SKU tillgänglig för tillfället för 2250 USD med Core i7-12700H, GeForce RTX 3050 och 1200p-skärm. Om du vill ha fler alternativ kan du beställa direkt från Dell i stället.
Dell XPS 17 9720 RTX 3060
- 05/31/2022 v7 (old)
Allen Ngo
Price comparison

