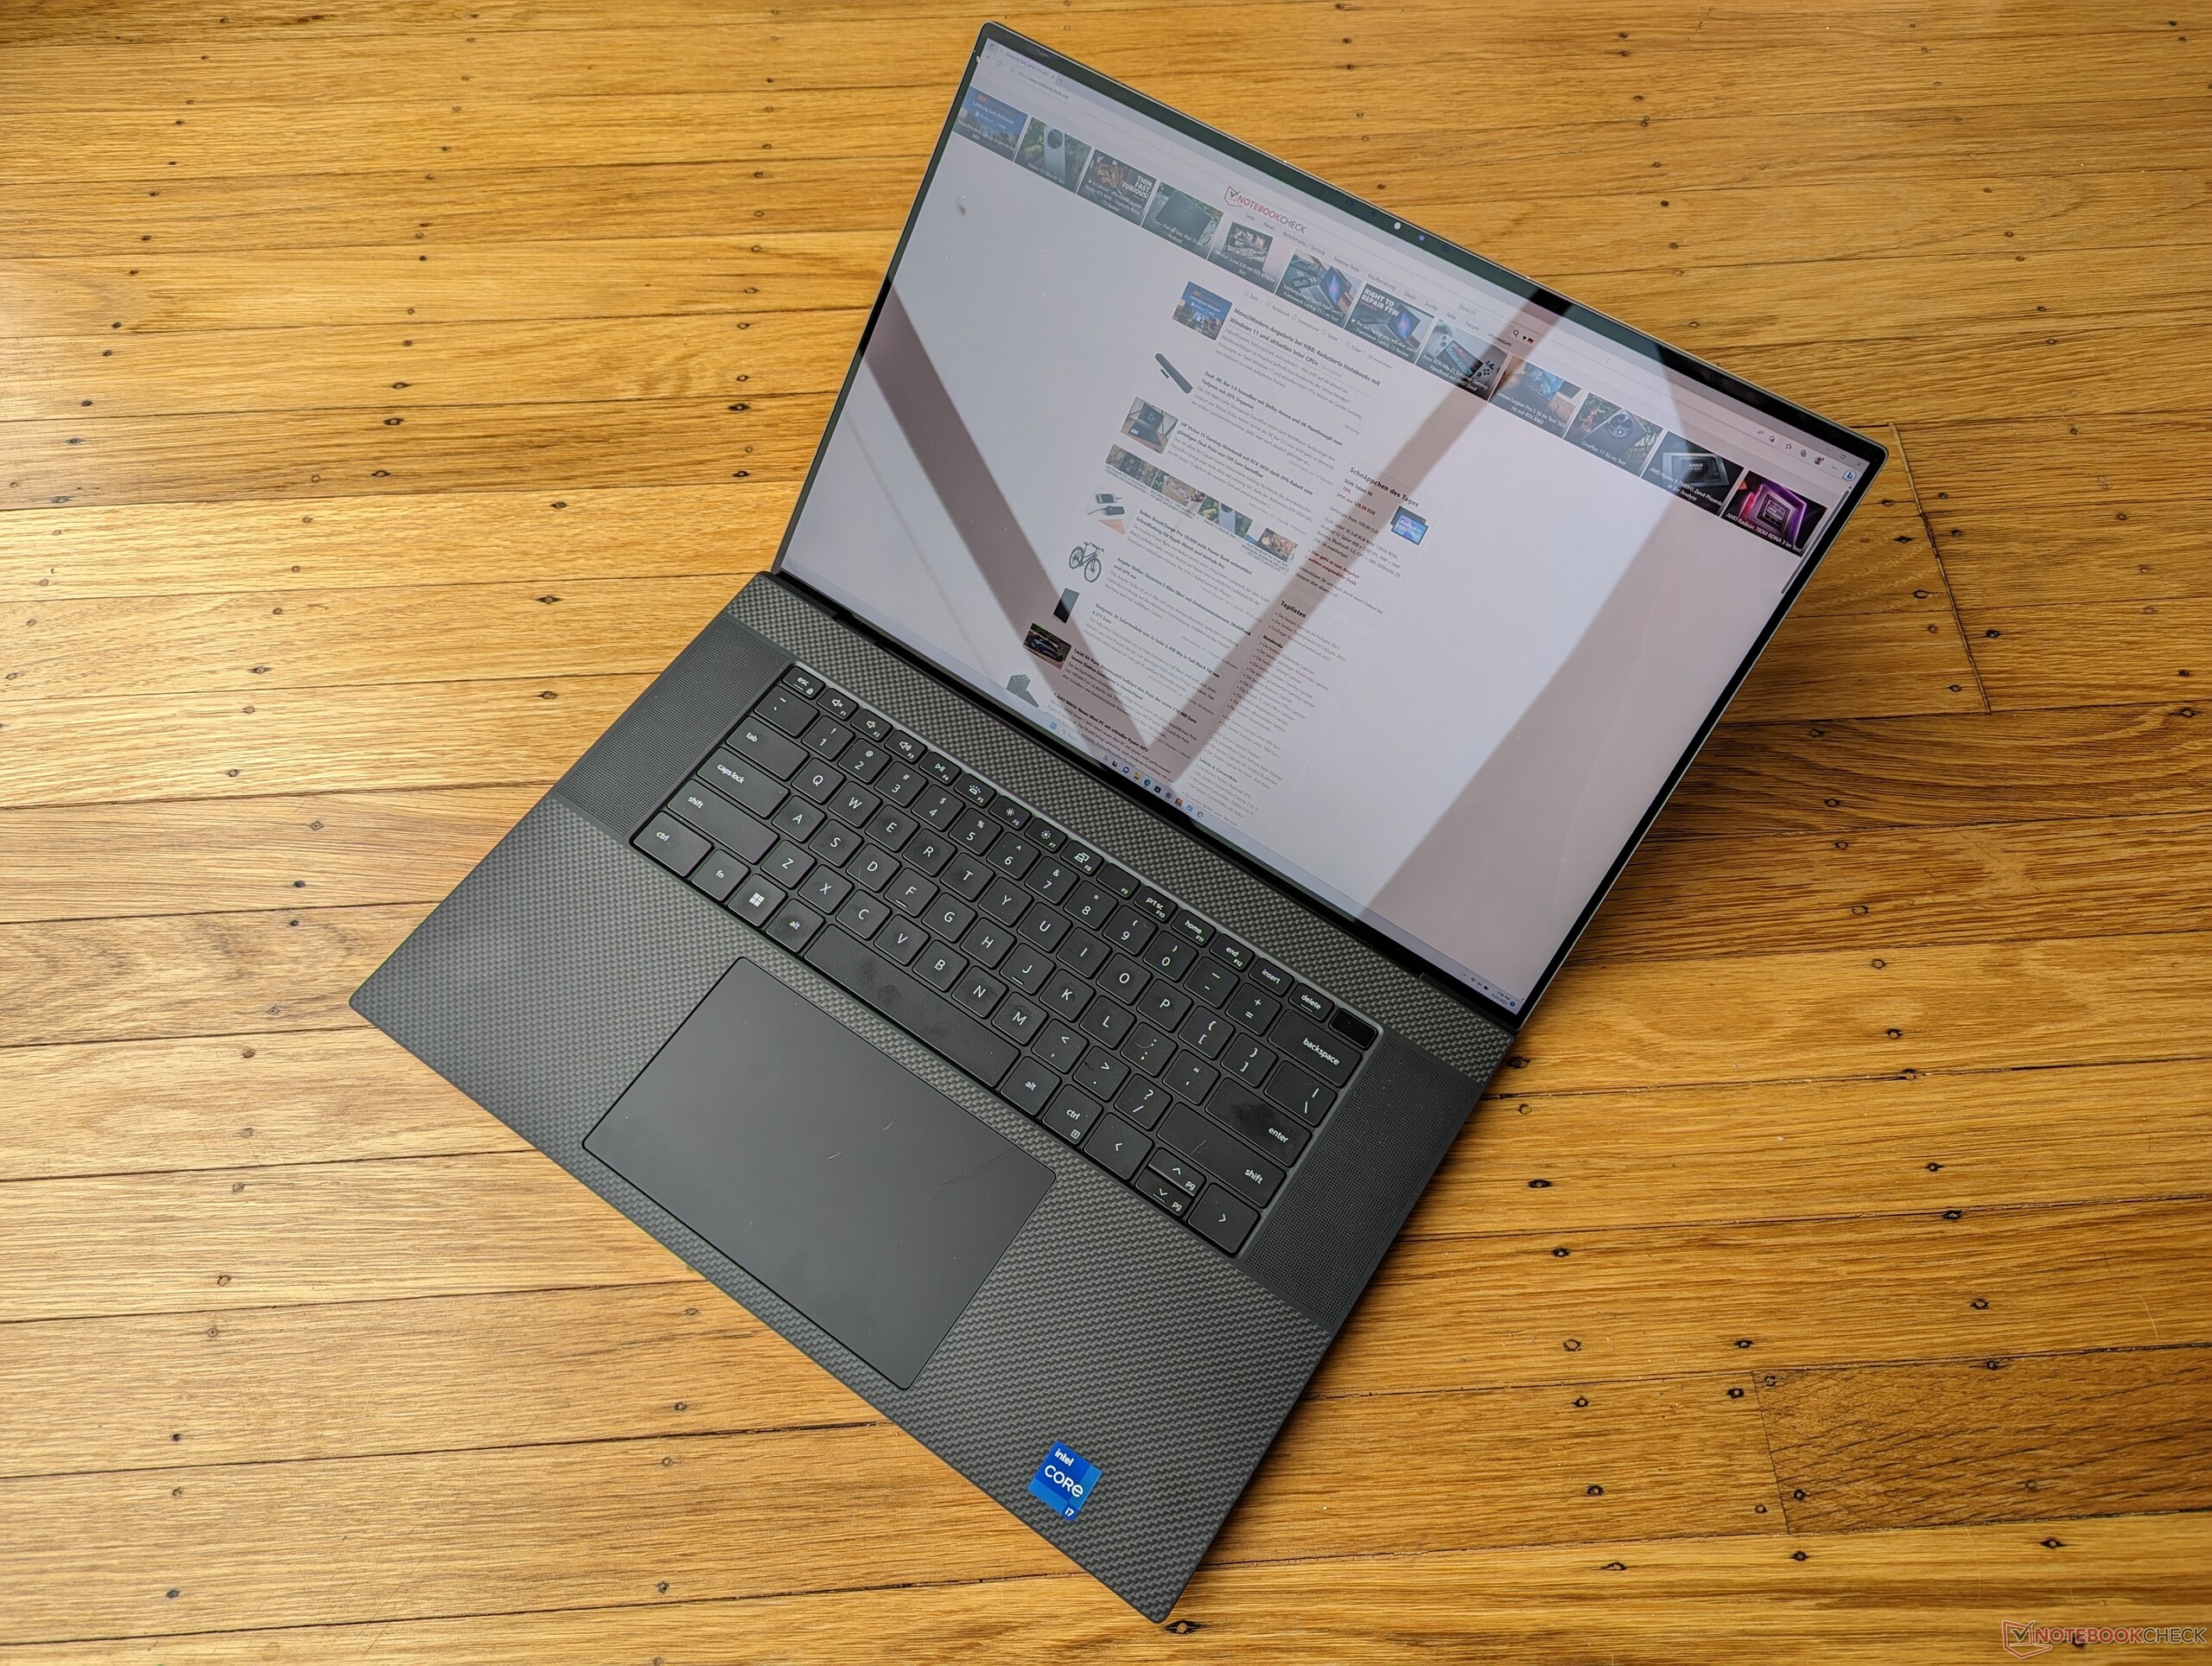
Dell XPS 17 9730 laptop recension: GeForce RTX 4070 multimediamonster

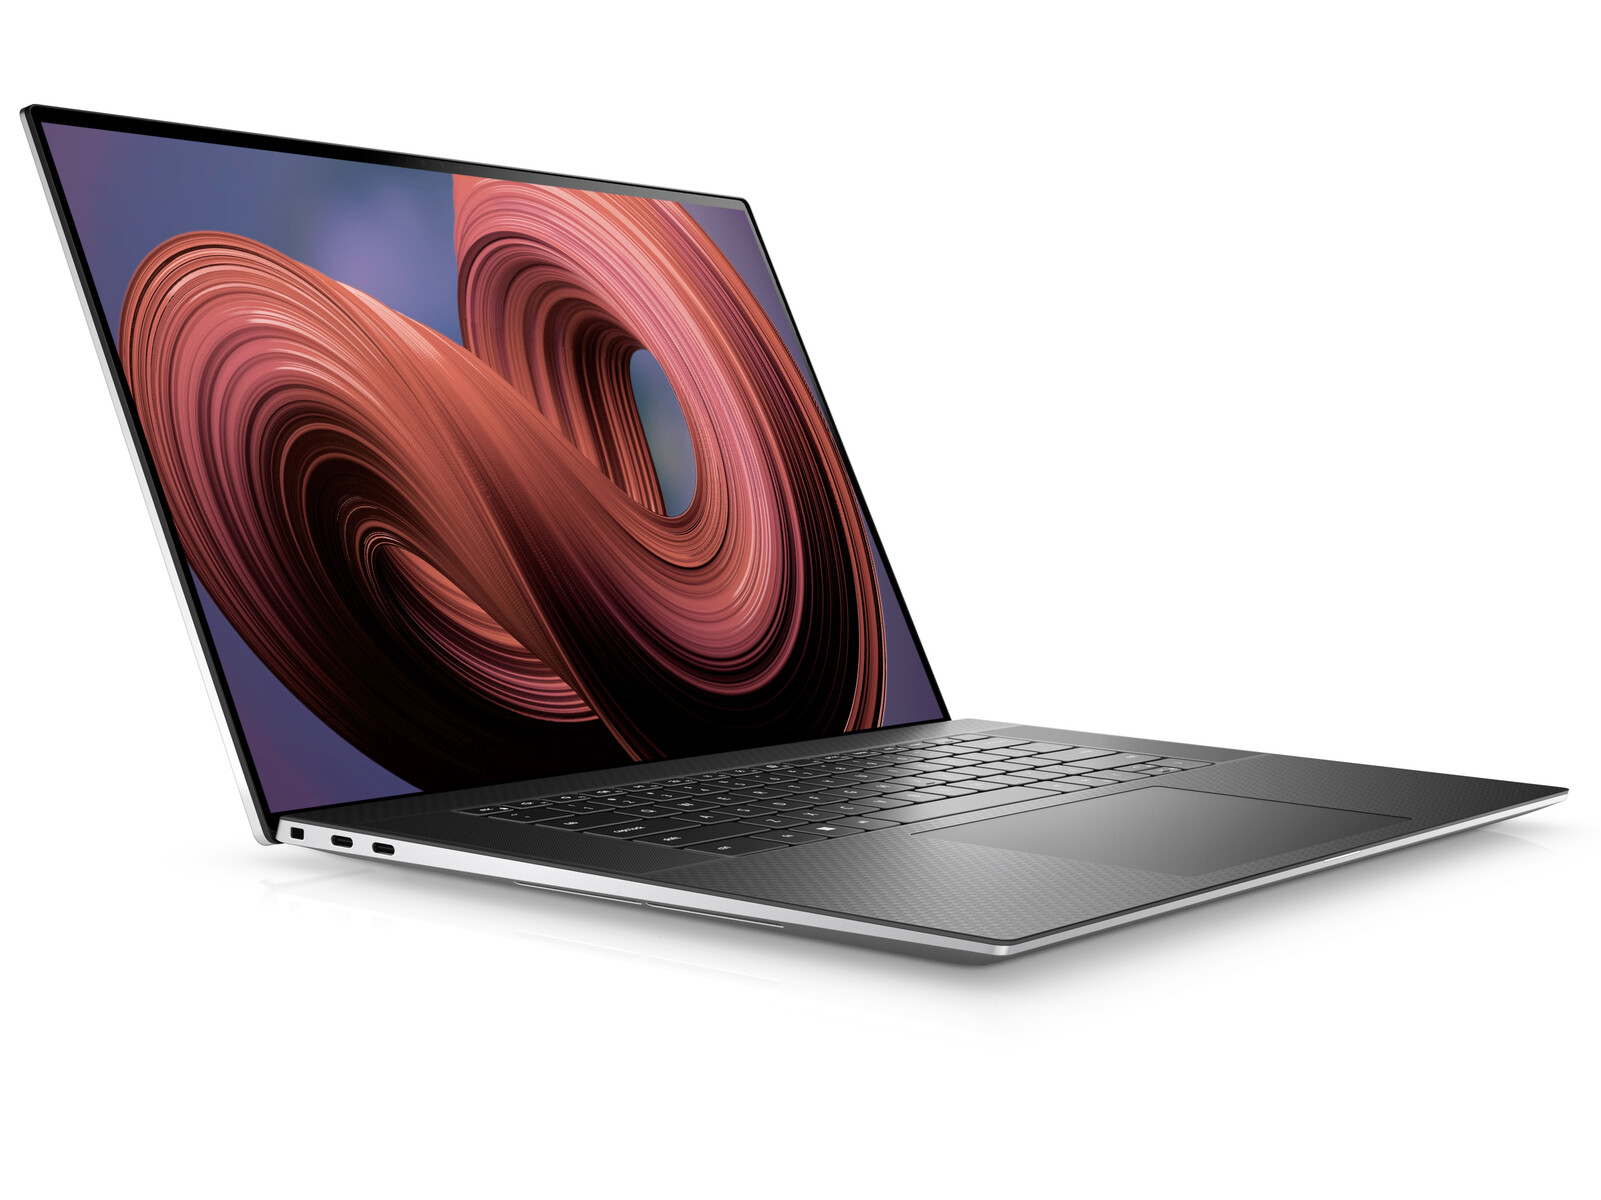
2023 XPS 17 9730 är den fjärde upplagan av den ursprungliga ursprungliga 2020 XPS 17 9700 design. Det är en intern uppdatering med 13:e generationens Intel Raptor Lake-H-processorer och Nvidia Ada Lovelace GPU:er för att ersätta förra årets 12:e generationens Alder Lake-H- respektive Ampere-alternativ. Det finns annars inga större ytliga förändringar och därför rekommenderar vi att du kollar in vår recension på ursprungliga XPS 17 9700 för att lära dig mer om de fysiska egenskaperna hos den bärbara datorn. Eventuella framtida redesigner kommer sannolikt att ta inspiration från den senaste XPS 13 Plus-serien.
Vår specifika konfiguration är en avancerad SKU med Core i7-13700H, GeForce RTX 4070 och UHD+ 2400p glossy touchscreen för ca $3500 USD i butik. Andra SKU:er är tillgängliga med RTX 4050, RTX 4060, RTX 4080, Core i9-13900H, eller 1200p matt skärm istället. Intressant nog måste alla konfigurationer levereras med diskret grafik medan tidigare XPS 17-modeller hade billigare integrerade UHD- eller Iris Xe-alternativ.
Konkurrenterna i detta segment inkluderar andra 17-tums bärbara multimediadatorer med flaggskepp som LG Gram 17, HP Envy 17,MSI Creator Z17eller 16-tumsApple MacBook Pro 16.
Fler recensioner av Dell:
Potentiella konkurrenter i jämförelse
Gradering | Datum | Modell | Vikt | Höjd | Storlek | Upplösning | Pris |
|---|---|---|---|---|---|---|---|
| 90 % v7 (old) | 05/2023 | Dell XPS 17 9730 RTX 4070 i7-13700H, GeForce RTX 4070 Laptop GPU | 2.5 kg | 19.5 mm | 17.00" | 3840x2400 | |
| 88.8 % v7 (old) | 06/2022 | Dell XPS 17 9720 RTX 3060 i7-12700H, GeForce RTX 3060 Laptop GPU | 2.5 kg | 19.5 mm | 17.00" | 3840x2400 | |
| 86.4 % v7 (old) | 05/2023 | LG Gram 17 (2023) i7-1360P, Iris Xe G7 96EUs | 1.4 kg | 17.8 mm | 17.00" | 2560x1600 | |
| 86.3 % v7 (old) | 04/2023 | HP Envy 17-cr0079ng i7-1255U, GeForce RTX 2050 Mobile | 2.6 kg | 19.6 mm | 17.30" | 3840x2160 | |
| 83.8 % v7 (old) | 09/2022 | MSI Creator Z17 A12UGST-054 i9-12900H, GeForce RTX 3070 Ti Laptop GPU | 2.5 kg | 19 mm | 17.00" | 2560x1600 | |
| 93.7 % v7 (old) | 03/2023 | Apple MacBook Pro 16 2023 M2 Max M2 Max, M2 Max 38-Core GPU | 2.2 kg | 16.8 mm | 16.20" | 3456x2234 |
Case - Samma design tre år i rad
SD-kortläsare
| SD Card Reader | |
| average JPG Copy Test (av. of 3 runs) | |
| Dell XPS 17 9720 RTX 3060 (Toshiba Exceria Pro SDXC 64 GB UHS-II) | |
| Dell XPS 17 9730 RTX 4070 (Toshiba Exceria Pro SDXC 64 GB UHS-II) | |
| Apple MacBook Pro 16 2023 M2 Max (Angelbird AV Pro V60) | |
| MSI Creator Z17 A12UGST-054 (AV Pro SD microSD 128 GB V60) | |
| HP Envy 17-cr0079ng (AV Pro SD microSD 128 GB V60) | |
| LG Gram 17 (2023) (AV Pro SD microSD 128 GB V60) | |
| maximum AS SSD Seq Read Test (1GB) | |
| Apple MacBook Pro 16 2023 M2 Max (Angelbird AV Pro V60) | |
| Dell XPS 17 9730 RTX 4070 (Toshiba Exceria Pro SDXC 64 GB UHS-II) | |
| Dell XPS 17 9720 RTX 3060 (Toshiba Exceria Pro SDXC 64 GB UHS-II) | |
| LG Gram 17 (2023) (AV Pro SD microSD 128 GB V60) | |
| MSI Creator Z17 A12UGST-054 (AV Pro SD microSD 128 GB V60) | |
| HP Envy 17-cr0079ng (AV Pro SD microSD 128 GB V60) | |
Kommunikation - Ingen Wi-Fi 6E
XPS 15 och XPS 17 fortsätter att vara de enda bärbara datorerna på senare tid som levereras med Wi-Fi 6E WLAN-moduler och ändå INTE stöder Wi-Fi 6E-anslutning. Du kommer alltså inte att kunna ansluta till något 6 GHz Wi-Fi-nätverk. Detta bör inte vara ett stort problem för de flesta användare, men det är ändå en besvikelse för en bärbar dator som kostar över 3 500 USD.
| Networking | |
| iperf3 transmit AXE11000 | |
| LG Gram 17 (2023) | |
| Dell XPS 17 9720 RTX 3060 | |
| HP Envy 17-cr0079ng | |
| Dell XPS 17 9730 RTX 4070 | |
| iperf3 receive AXE11000 | |
| LG Gram 17 (2023) | |
| HP Envy 17-cr0079ng | |
| Dell XPS 17 9720 RTX 3060 | |
| Dell XPS 17 9730 RTX 4070 | |
| iperf3 transmit AXE11000 6GHz | |
| Apple MacBook Pro 16 2023 M2 Max | |
| LG Gram 17 (2023) | |
| HP Envy 17-cr0079ng | |
| MSI Creator Z17 A12UGST-054 | |
| iperf3 receive AXE11000 6GHz | |
| Apple MacBook Pro 16 2023 M2 Max | |
| MSI Creator Z17 A12UGST-054 | |
| HP Envy 17-cr0079ng | |
| LG Gram 17 (2023) | |
Webbkamera - Endast 720p
XPS 15 och XPS 17 är förmodligen de enda bärbara flaggskeppsdatorer som fortfarande levereras med lågupplösta webbkameror på 1 MP eller 720p och utan sekretesslucka. Konkurrerande tillverkare som Lenovo, HP, Asus och andra har redan gått vidare till 2 MP eller till och med 8 MP-lösningar. Dell menar att den supersmala skärmkanten i XPS-designen begränsar kvaliteten på webbkamerasensorn.


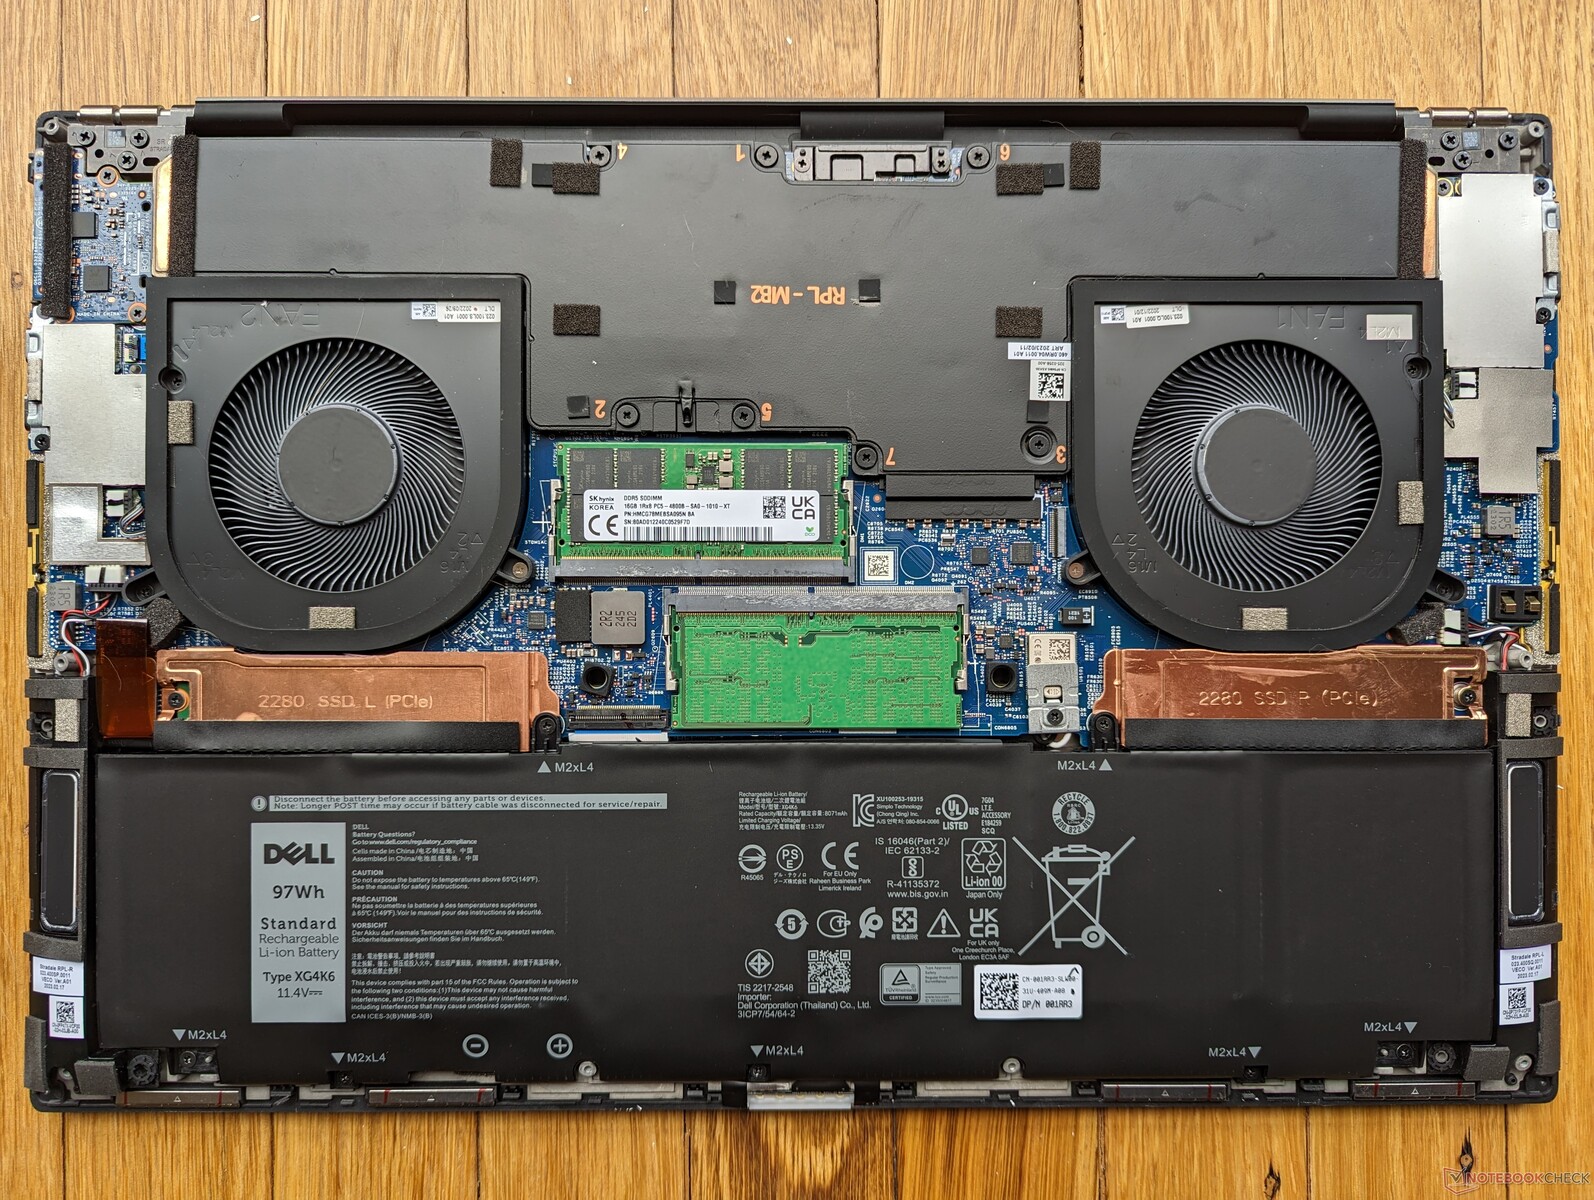
Underhåll
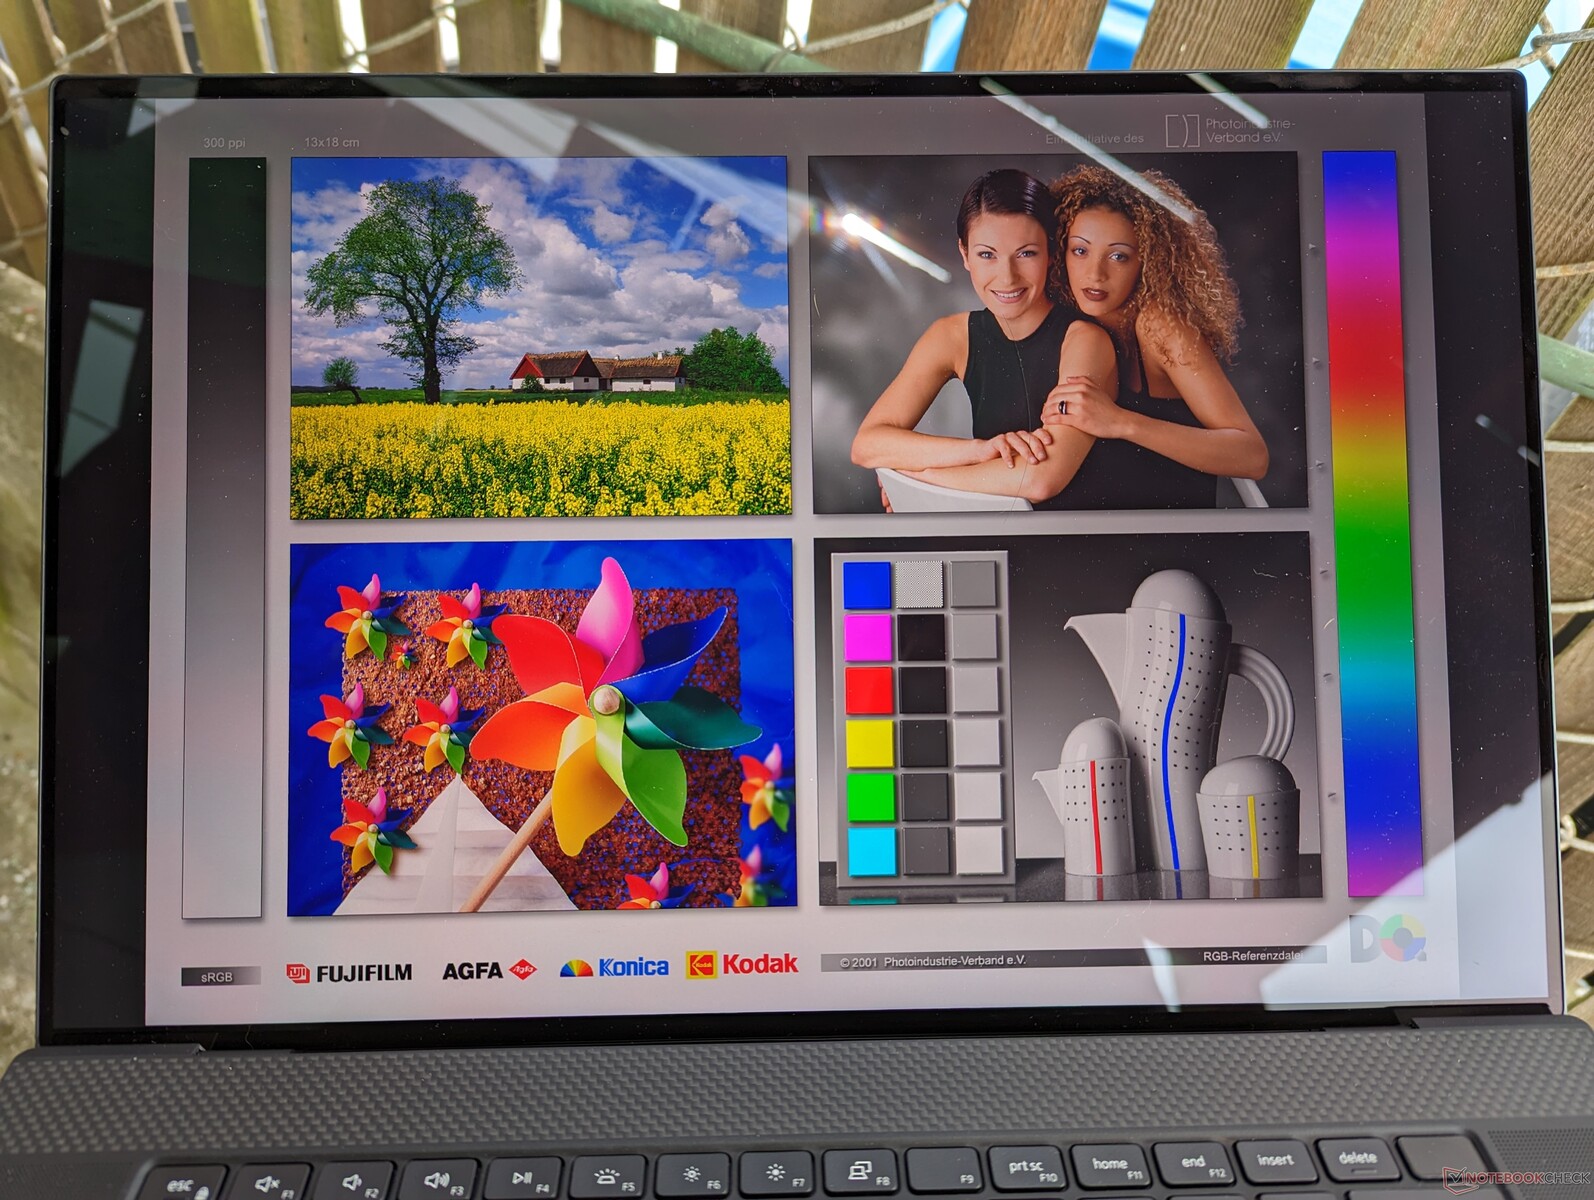
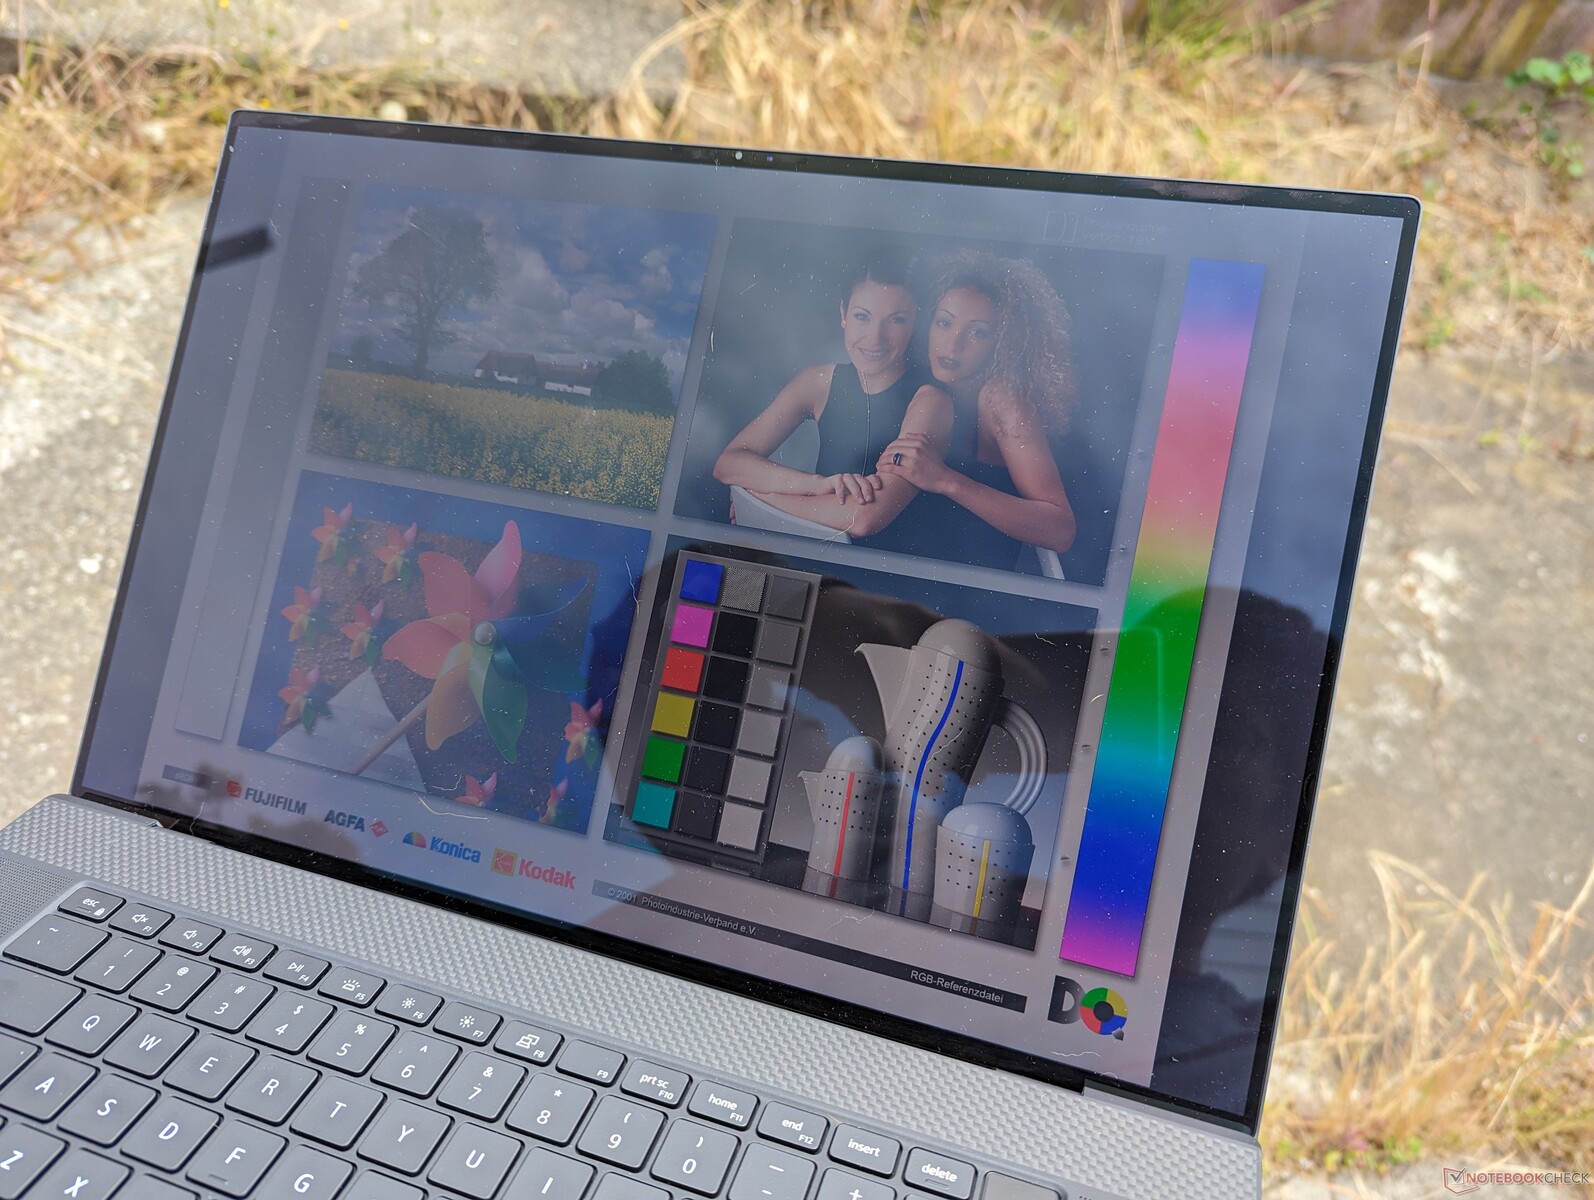
Display - fortfarande bra, men inget 120 Hz-alternativ
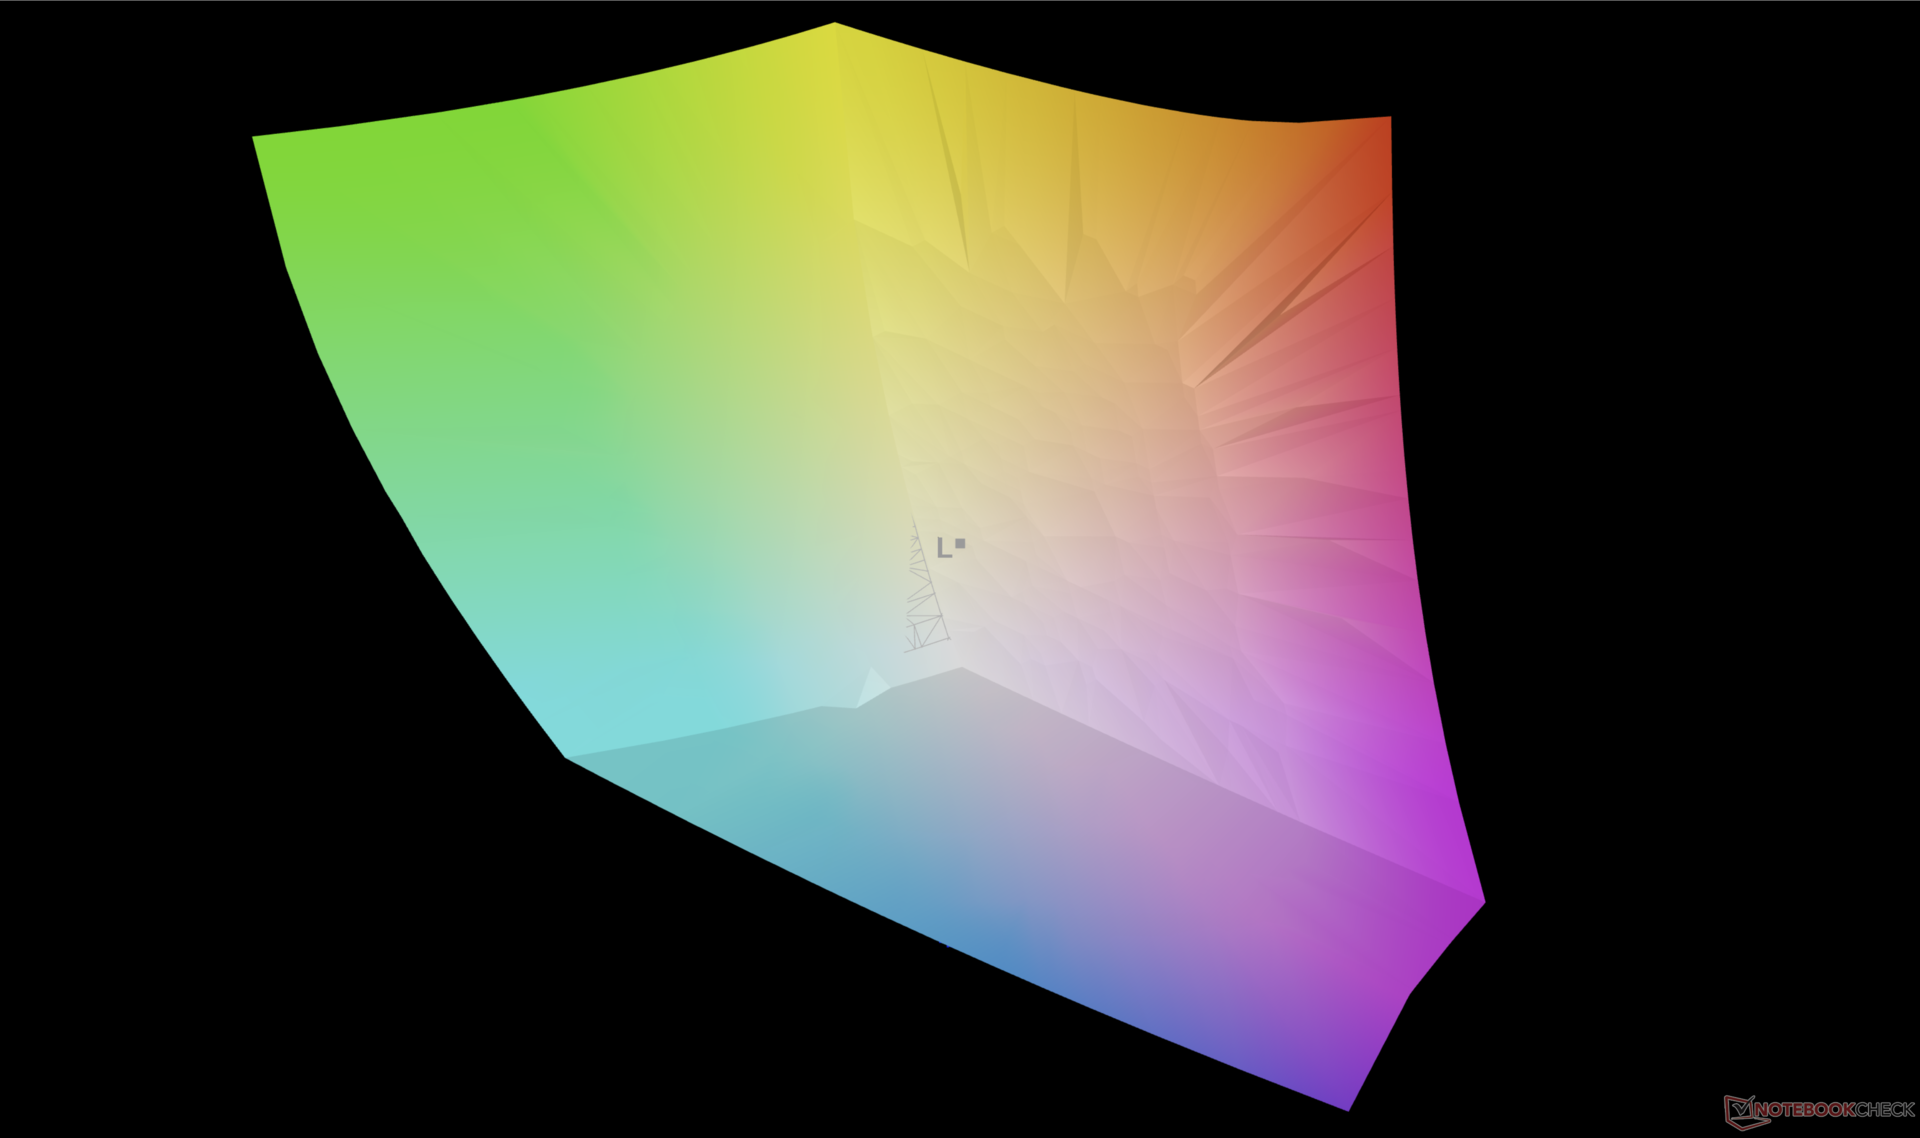
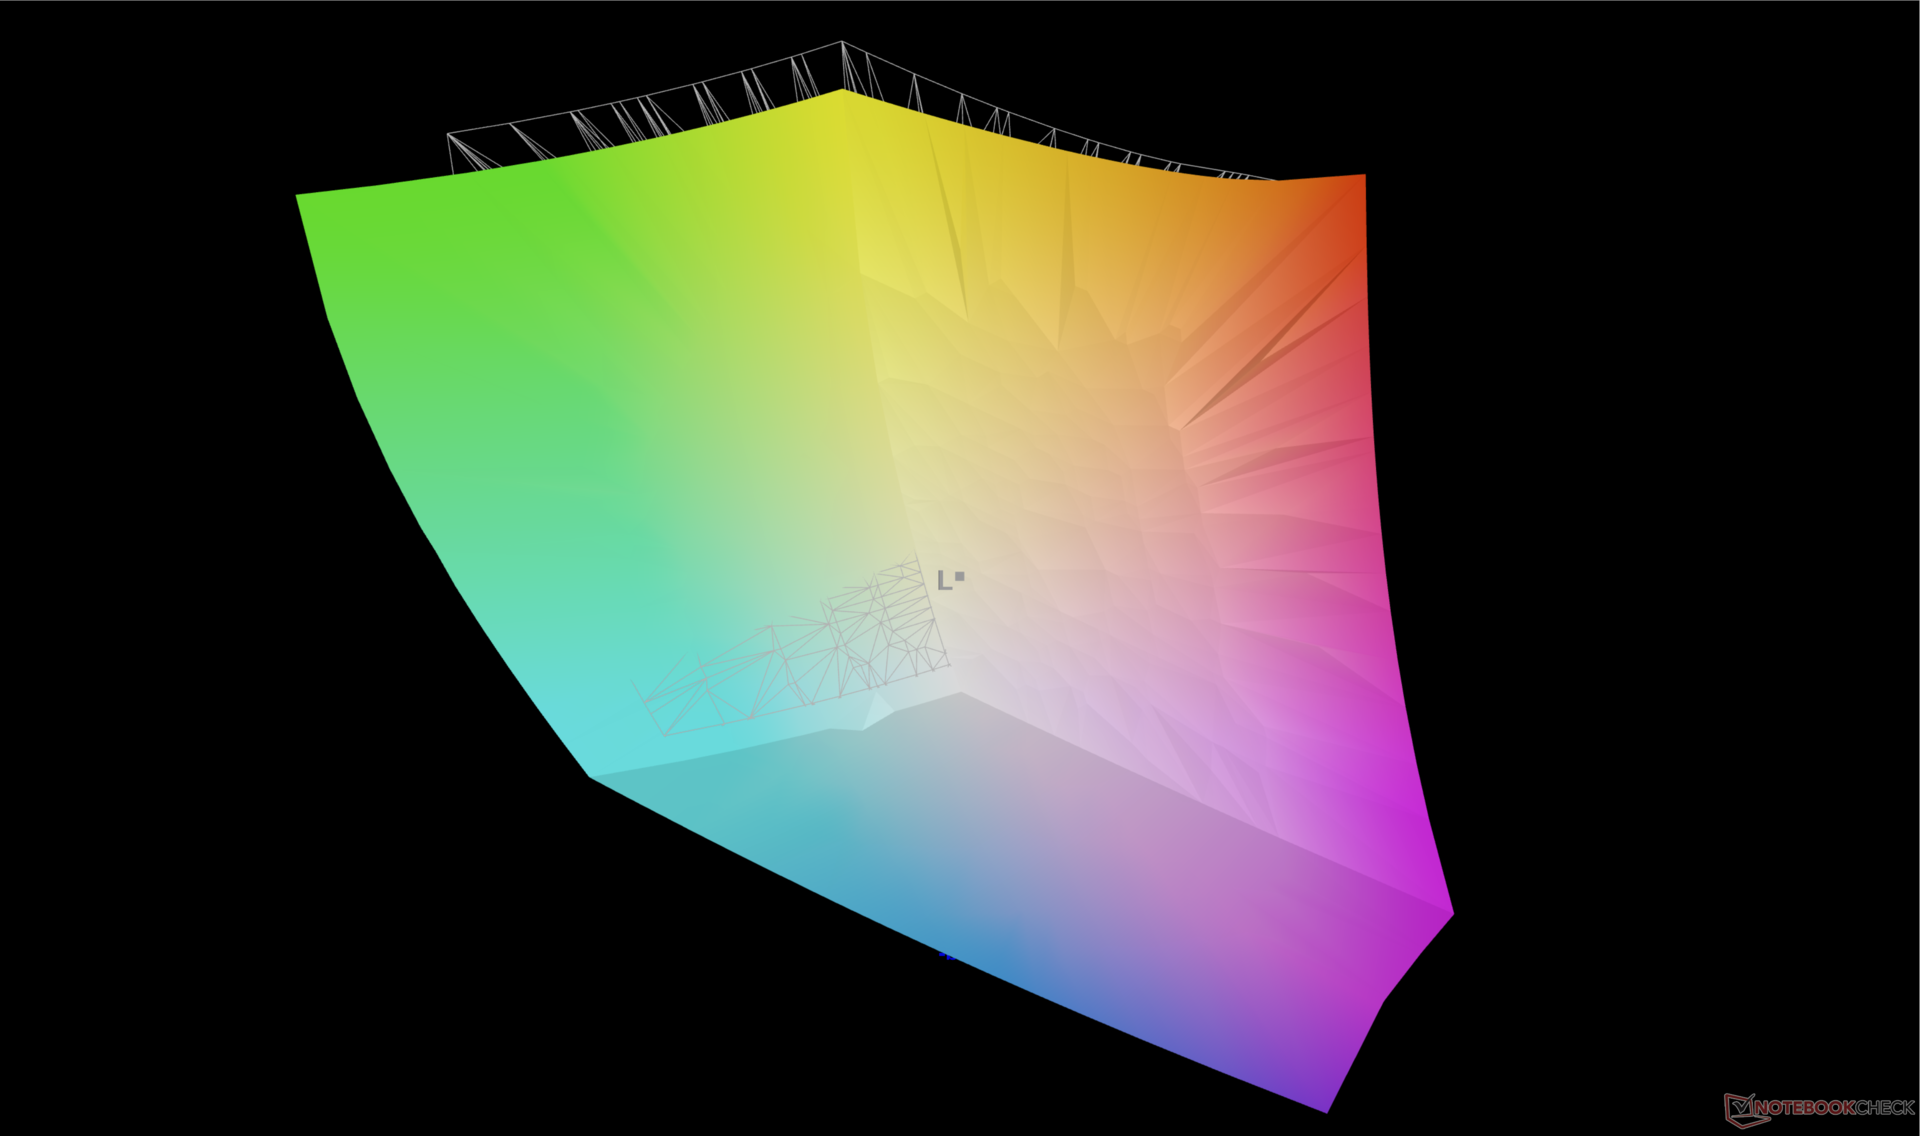
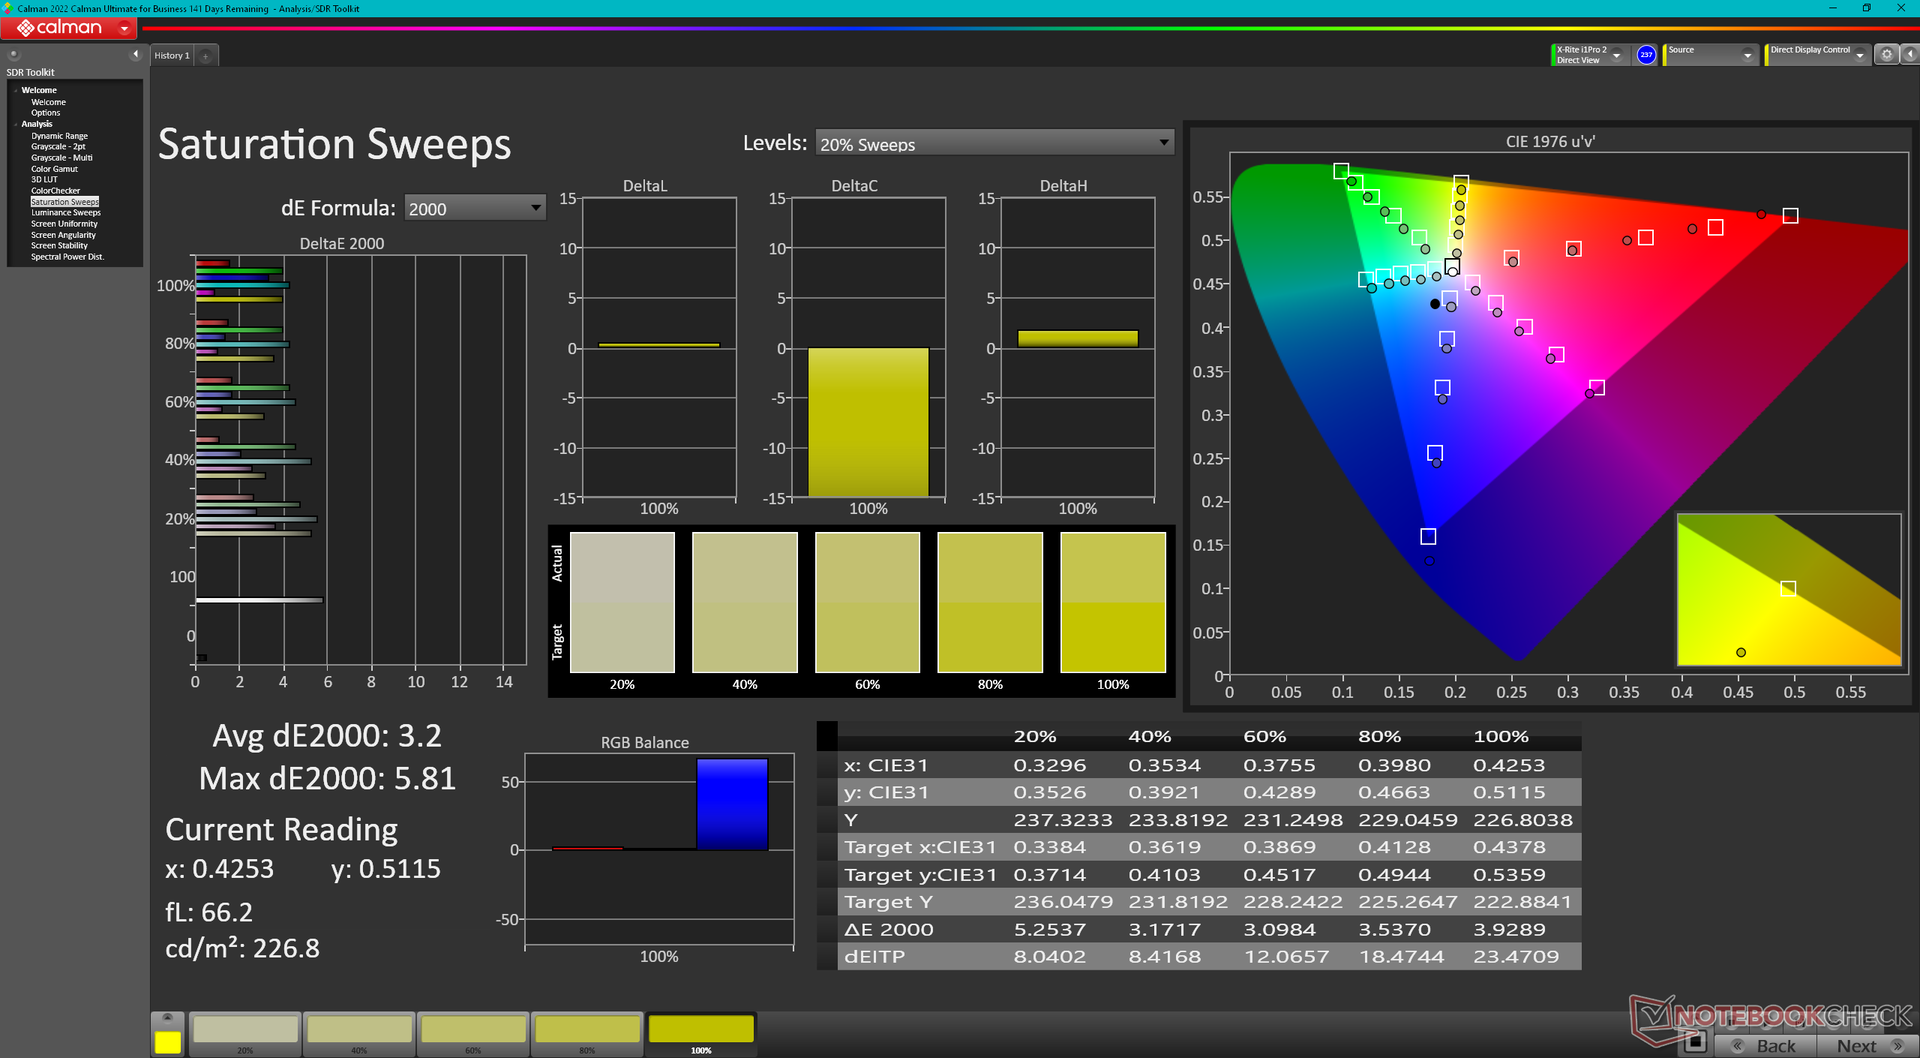
Dell har använt exakt samma 17,0-tums Sharp LQ170R1 IPS-pekskärmspanel för sin XPS 17-serie sedan den ursprungliga 2020-modellen. Således har den visuella upplevelsen varit identisk sedan dess och vi rekommenderar att du kollar in våra befintliga recensioner av 9720, 9710eller 9700 modellerna för att lära dig mer om skärmen. Även om de breda DCI-P3-färgerna, bra maximal ljusstyrka, skarp UHD+-upplösning och bra 1500:1 kontrastförhållande fortfarande är bra, börjar 60 Hz uppdateringsfrekvens visa sin ålder eftersom 90 Hz eller snabbare paneler blir allt vanligare på andra bärbara multimediadatorer som t.ex Asus ZenBook 14 eller Lenovo Slim 7i.

| |||||||||||||||||||||||||
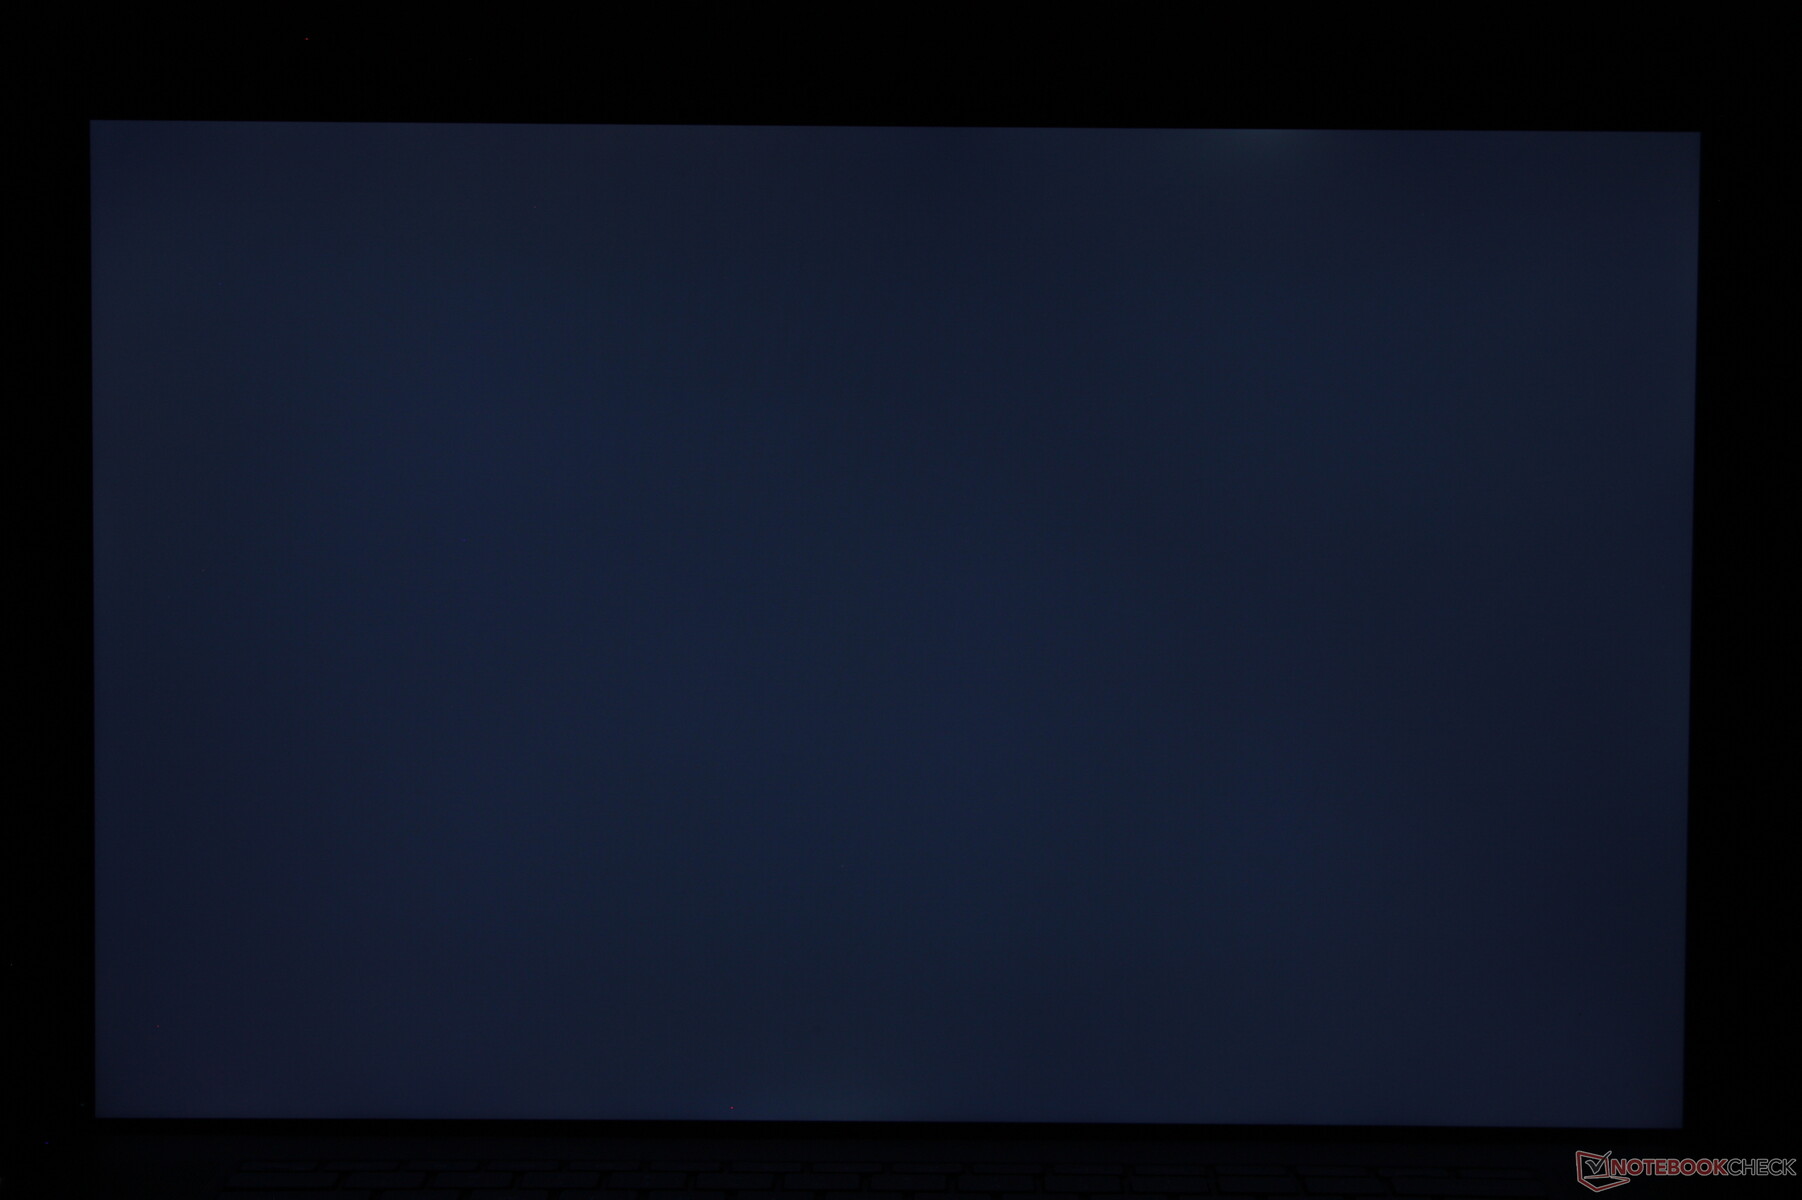
Distribution av ljusstyrkan: 85 %
Mitt på batteriet: 457.4 cd/m²
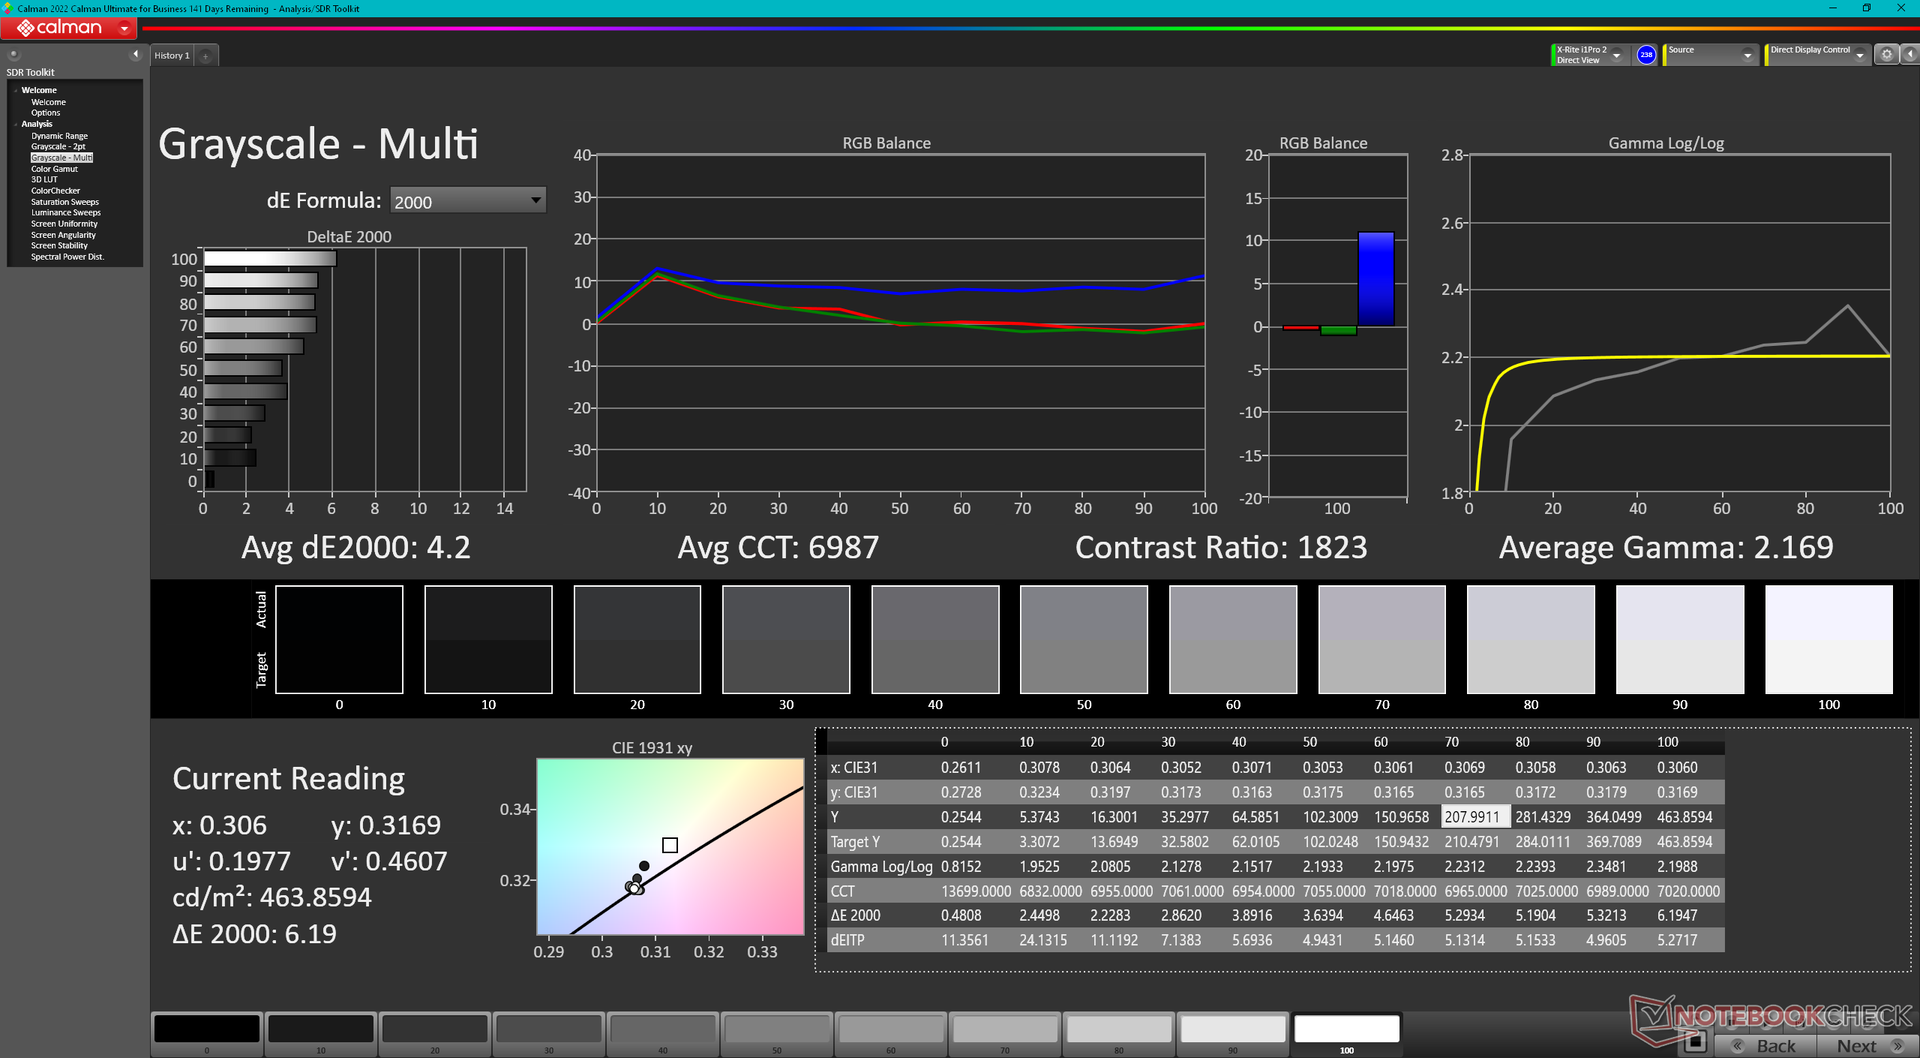
Kontrast: 1475:1 (Svärta: 0.31 cd/m²)
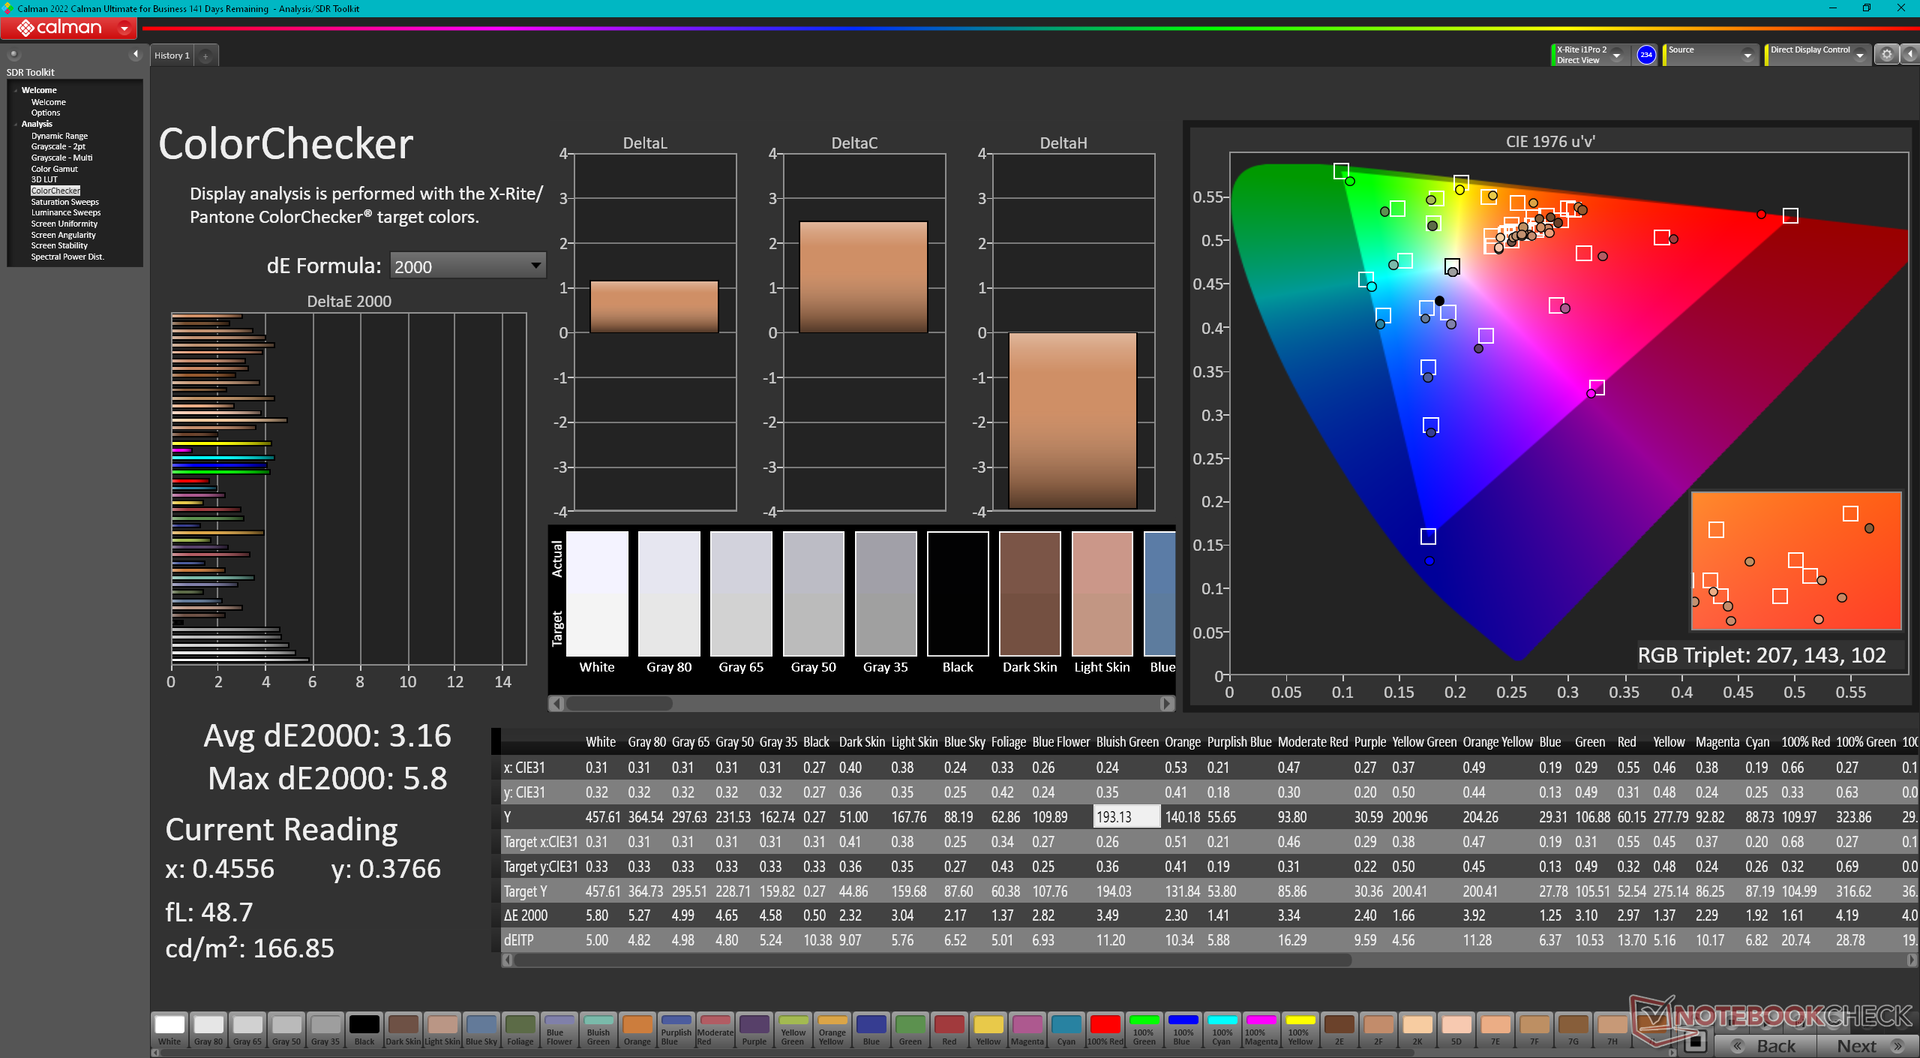
ΔE ColorChecker Calman: 3.16 | ∀{0.5-29.43 Ø4.73}
ΔE Greyscale Calman: 4.2 | ∀{0.09-98 Ø4.97}
100% AdobeRGB 1998 (Argyll 3D)
100% sRGB (Argyll 3D)
95.2% Display P3 (Argyll 3D)
Gamma: 2.17
CCT: 6987 K
| Dell XPS 17 9730 RTX 4070 10-point capacitive, Sharp LQ170R1, 3840x2400, 17" | Dell XPS 17 9720 RTX 3060 Sharp LQ170R1, IPS, 3840x2400, 17" | LG Gram 17 (2023) LG Display LP170WQ1-SPF2, IPS, 2560x1600, 17" | HP Envy 17-cr0079ng BOE0A66, IPS, 3840x2160, 17.3" | MSI Creator Z17 A12UGST-054 AUO3C9B (B170QAN01.0), IPS, 2560x1600, 17" | Apple MacBook Pro 16 2023 M2 Max Mini-LED, 3456x2234, 16.2" | |
|---|---|---|---|---|---|---|
| Display | -6% | -4% | -3% | -3% | -2% | |
| Display P3 Coverage (%) | 95.2 | 92.9 -2% | 97 2% | 98.31 3% | 98.9 4% | 99 4% |
| sRGB Coverage (%) | 100 | 100 0% | 99.8 0% | 100 0% | 99.9 0% | 100 0% |
| AdobeRGB 1998 Coverage (%) | 100 | 85.3 -15% | 84.9 -15% | 87.03 -13% | 86.4 -14% | 88.5 -11% |
| Response Times | -16% | 80% | 88% | 79% | -70% | |
| Response Time Grey 50% / Grey 80% * (ms) | 42.9 ? | 51.2 ? -19% | 2 ? 95% | 1 98% | 11 ? 74% | 80.5 ? -88% |
| Response Time Black / White * (ms) | 31.3 ? | 35.2 ? -12% | 11 ? 65% | 7 ? 78% | 5 ? 84% | 47.2 ? -51% |
| PWM Frequency (Hz) | 14880 ? | |||||
| Screen | -30% | -6% | 9% | -13% | 4294% | |
| Brightness middle (cd/m²) | 457.4 | 512.7 12% | 405 -11% | 390 -15% | 444 -3% | 504 10% |
| Brightness (cd/m²) | 430 | 463 8% | 363 -16% | 385 -10% | 415 -3% | 487 13% |
| Brightness Distribution (%) | 85 | 85 0% | 82 -4% | 86 1% | 88 4% | 94 11% |
| Black Level * (cd/m²) | 0.31 | 0.32 -3% | 0.225 27% | 0.395 -27% | 0.7 -126% | 0.001 100% |
| Contrast (:1) | 1475 | 1602 9% | 1800 22% | 987 -33% | 634 -57% | 504000 34069% |
| Colorchecker dE 2000 * | 3.16 | 5.98 -89% | 3.35 -6% | 1.66 47% | 2.48 22% | 1.5 53% |
| Colorchecker dE 2000 max. * | 5.8 | 12.09 -108% | 7.96 -37% | 2.9 50% | 3.52 39% | 3.3 43% |
| Greyscale dE 2000 * | 4.2 | 7.2 -71% | 5.28 -26% | 1.83 56% | 3.33 21% | 2.1 50% |
| Gamma | 2.17 101% | 2.54 87% | 2.43 91% | 2.25 98% | 2.33 94% | 2.25 98% |
| CCT | 6987 93% | 6914 94% | 7424 88% | 6727 97% | 6230 104% | 6882 94% |
| Colorchecker dE 2000 calibrated * | 1.34 | 1.16 | 2.91 | |||
| Totalt genomsnitt (program/inställningar) | -17% /
-22% | 23% /
7% | 31% /
18% | 21% /
3% | 1407% /
2631% |
* ... mindre är bättre
Visa svarstider
| ↔ Svarstid svart till vitt | ||
|---|---|---|
| 31.3 ms ... stiga ↗ och falla ↘ kombinerat | ↗ 16.9 ms stiga | 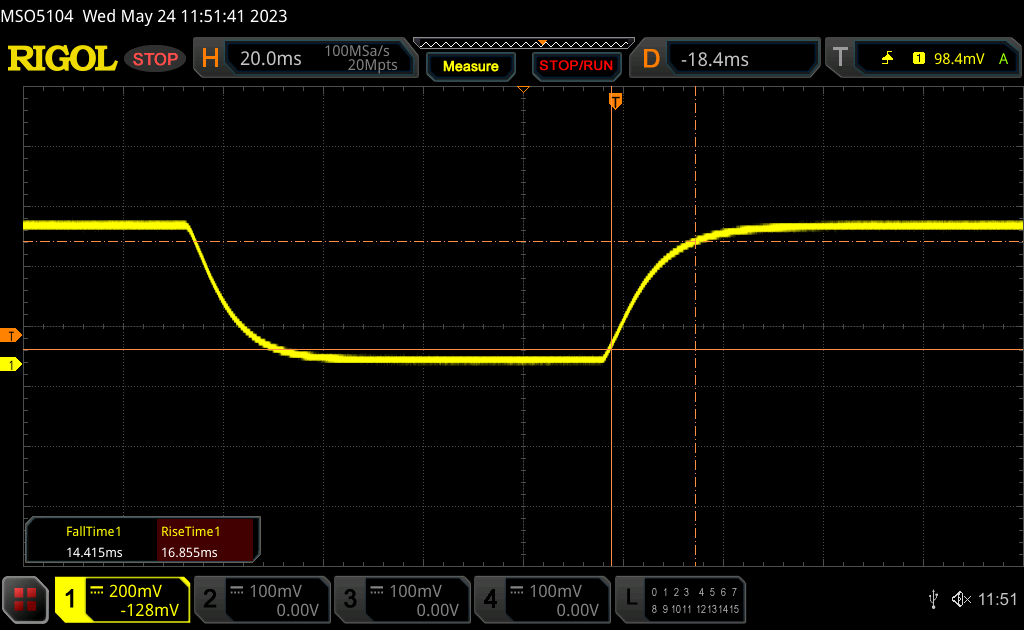 |
| ↘ 14.4 ms hösten | ||
| Skärmen visar långsamma svarsfrekvenser i våra tester och kommer att vara otillfredsställande för spelare. I jämförelse sträcker sig alla testade enheter från 0.1 (minst) till 240 (maximalt) ms. » 85 % av alla enheter är bättre. Detta innebär att den uppmätta svarstiden är sämre än genomsnittet av alla testade enheter (19.9 ms). | ||
| ↔ Svarstid 50 % grått till 80 % grått | ||
| 42.9 ms ... stiga ↗ och falla ↘ kombinerat | ↗ 19.9 ms stiga | 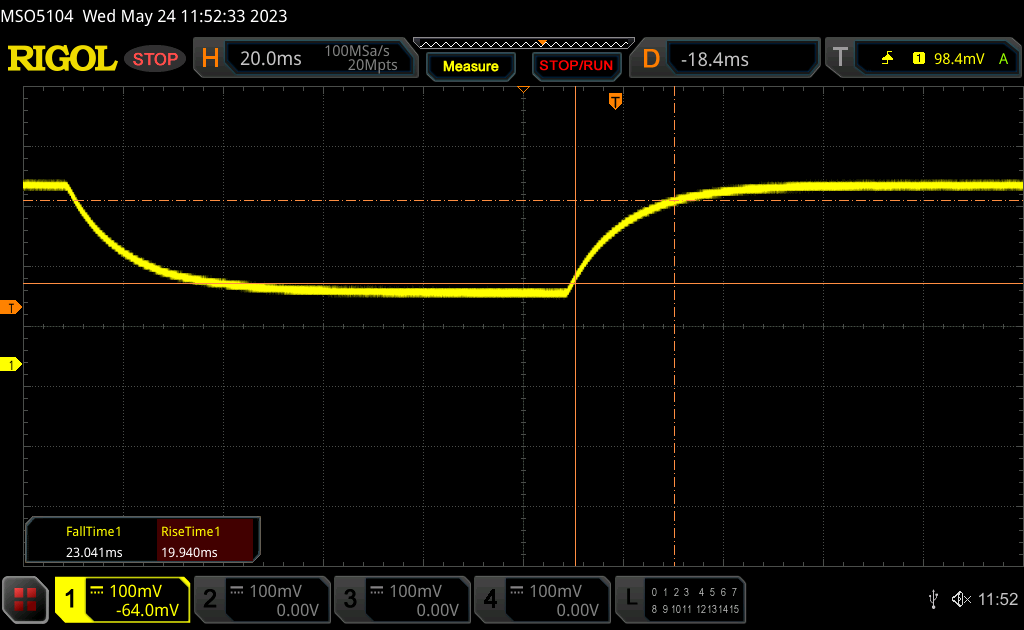 |
| ↘ 23 ms hösten | ||
| Skärmen visar långsamma svarsfrekvenser i våra tester och kommer att vara otillfredsställande för spelare. I jämförelse sträcker sig alla testade enheter från 0.165 (minst) till 636 (maximalt) ms. » 71 % av alla enheter är bättre. Detta innebär att den uppmätta svarstiden är sämre än genomsnittet av alla testade enheter (31.1 ms). | ||
Skärmflimmer / PWM (Puls-Width Modulation)
| Skärmflimmer / PWM upptäcktes inte | 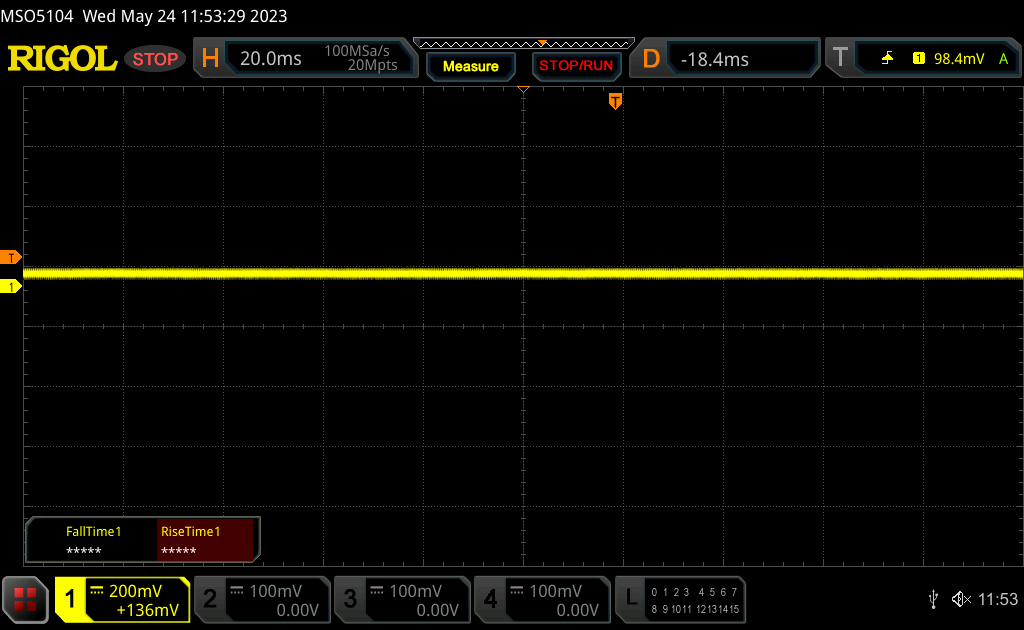 | ||
Som jämförelse: 52 % av alla testade enheter använder inte PWM för att dämpa skärmen. Om PWM upptäcktes mättes ett medelvärde av 7794 (minst: 5 - maximum: 343500) Hz. | |||
Prestanda - 13:e generationens Intel + Nvidia Ada Lovelace
Villkor för testning
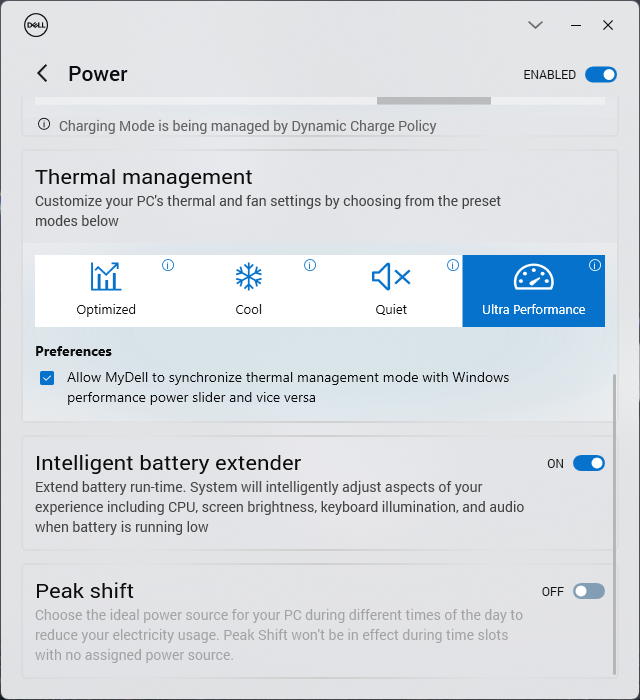
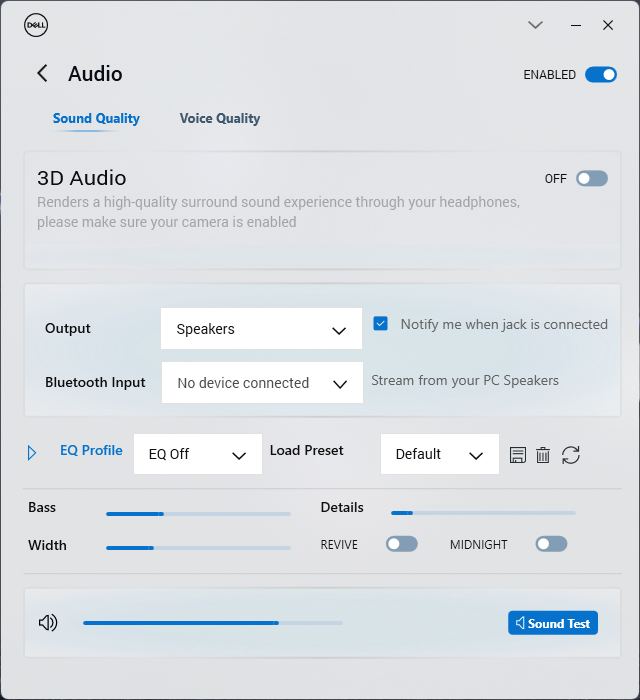
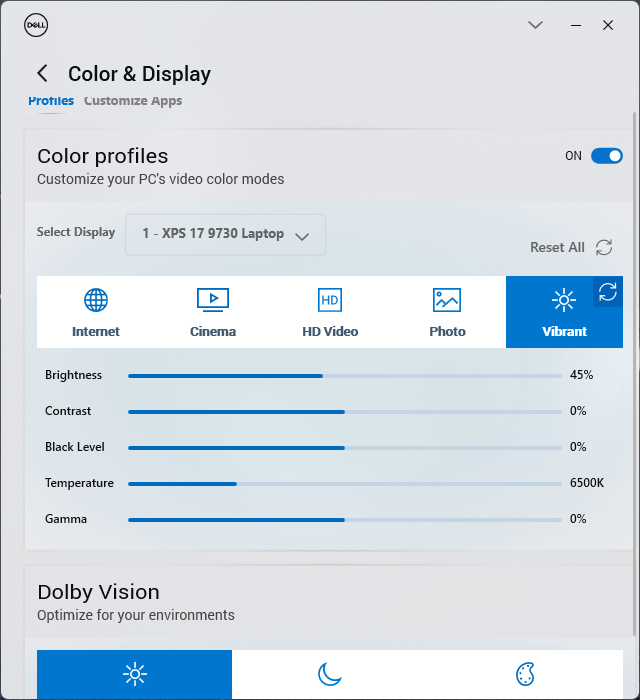
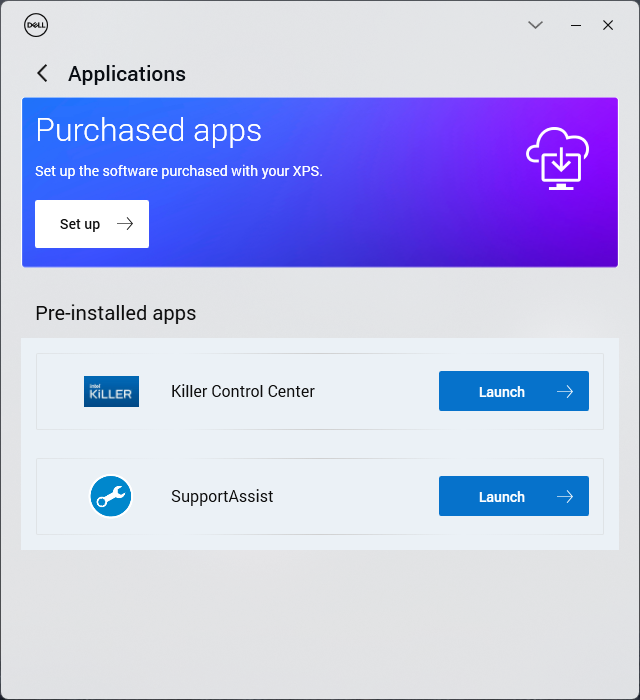
Vi ställde in vår enhet på prestandaläge via MyDell-programvaran innan vi körde några riktmärken nedan. Dells energiprofilinställningar är bekvämt synkroniserade med Windows energiprofilinställningar till skillnad från på de flesta andra bärbara datorer.
Vi rekommenderar att användare bekantar sig med MyDell eftersom det är det centrala navet för att justera ljud, färger, ström och andra förinstallerade Dell-appar som SupportAssist. Dell har gjort om MyDells användargränssnitt ännu en gång för att det ska likna Dell Optimizer-programvaran som levereras med många bärbara företagsdatorer från samma tillverkare. Det är irriterande att appfönstret är mycket litet och att det inte går att maximera det.
Optimus levereras som standard för automatisk växling mellan iGPU och dGPU. Det finns inget stöd för Advanced Optimus eller MUX.
Processor
Core i7-137H Core i7-13700H i XPS 17 presterar mycket bra med benchmarkresultat som är något högre än de flesta andra bärbara datorer i vår databas som är utrustade med samma processor, inklusive den senaste XPS 15 9530. Turbo Boost är i synnerhet imponerande med en prestandafördel på 25 procent jämfört med Core i7-12700H i förra årets XPS 17 9720 modell.
Det finns dock en anmärkningsvärd hake att hålla i minnet. CPU Turbo Boost är inte obegränsad, vilket framgår av vår graf nedan när vi körde CineBench R15 xT i en loop. Prestandan sjönk med cirka 25 procent efter 9 eller 10 körningar, vilket är brantare jämfört med de flesta andra bärbara datorer som drivs av processorer i H-serien. Om man tar hänsyn till denna minskning skulle Core i7-13700H faktiskt prestera nästan identiskt med Core i7-12700H. Core i7-13700H är alltså bäst när hög prestanda behövs i korta stunder, t.ex. när program startas, bilder redigeras eller korta videoklipp kodas. I övrigt erbjuder den bara små prestandafördelar jämfört med förra årets Core i7-12700H.
Uppgradering till Core i9-13900H förväntas öka prestandan för flertrådar med cirka 10 till 20 procent baserat på vår erfarenhet medMSI Stealth 17 Studio. Single-thread-prestandan skulle dock förbli ungefär densamma om inte något långsammare med Core i9.
Cinebench R15 Multi Loop
Cinebench R23: Multi Core | Single Core
Cinebench R20: CPU (Multi Core) | CPU (Single Core)
Cinebench R15: CPU Multi 64Bit | CPU Single 64Bit
Blender: v2.79 BMW27 CPU
7-Zip 18.03: 7z b 4 | 7z b 4 -mmt1
Geekbench 5.5: Multi-Core | Single-Core
HWBOT x265 Benchmark v2.2: 4k Preset
LibreOffice : 20 Documents To PDF
R Benchmark 2.5: Overall mean
* ... mindre är bättre
AIDA64: FP32 Ray-Trace | FPU Julia | CPU SHA3 | CPU Queen | FPU SinJulia | FPU Mandel | CPU AES | CPU ZLib | FP64 Ray-Trace | CPU PhotoWorxx
| Performance rating | |
| Dell XPS 17 9730 RTX 4070 | |
| Genomsnitt Intel Core i7-13700H | |
| MSI Creator Z17 A12UGST-054 | |
| Dell XPS 17 9720 RTX 3060 | |
| LG Gram 17 (2023) | |
| HP Envy 17-cr0079ng | |
| AIDA64 / FP32 Ray-Trace | |
| Dell XPS 17 9730 RTX 4070 | |
| Genomsnitt Intel Core i7-13700H (4986 - 18908, n=29) | |
| LG Gram 17 (2023) | |
| MSI Creator Z17 A12UGST-054 | |
| HP Envy 17-cr0079ng | |
| Dell XPS 17 9720 RTX 3060 | |
| AIDA64 / FPU Julia | |
| Dell XPS 17 9730 RTX 4070 | |
| Genomsnitt Intel Core i7-13700H (25360 - 92359, n=29) | |
| HP Envy 17-cr0079ng | |
| LG Gram 17 (2023) | |
| MSI Creator Z17 A12UGST-054 | |
| Dell XPS 17 9720 RTX 3060 | |
| AIDA64 / CPU SHA3 | |
| Dell XPS 17 9730 RTX 4070 | |
| Genomsnitt Intel Core i7-13700H (1339 - 4224, n=29) | |
| MSI Creator Z17 A12UGST-054 | |
| Dell XPS 17 9720 RTX 3060 | |
| HP Envy 17-cr0079ng | |
| LG Gram 17 (2023) | |
| AIDA64 / CPU Queen | |
| MSI Creator Z17 A12UGST-054 | |
| Dell XPS 17 9720 RTX 3060 | |
| Dell XPS 17 9730 RTX 4070 | |
| Genomsnitt Intel Core i7-13700H (59324 - 107159, n=29) | |
| LG Gram 17 (2023) | |
| HP Envy 17-cr0079ng | |
| AIDA64 / FPU SinJulia | |
| Dell XPS 17 9730 RTX 4070 | |
| MSI Creator Z17 A12UGST-054 | |
| Dell XPS 17 9720 RTX 3060 | |
| Genomsnitt Intel Core i7-13700H (4800 - 11050, n=29) | |
| LG Gram 17 (2023) | |
| HP Envy 17-cr0079ng | |
| AIDA64 / FPU Mandel | |
| Dell XPS 17 9730 RTX 4070 | |
| Genomsnitt Intel Core i7-13700H (12321 - 45118, n=29) | |
| MSI Creator Z17 A12UGST-054 | |
| LG Gram 17 (2023) | |
| Dell XPS 17 9720 RTX 3060 | |
| HP Envy 17-cr0079ng | |
| AIDA64 / CPU AES | |
| MSI Creator Z17 A12UGST-054 | |
| Dell XPS 17 9720 RTX 3060 | |
| Genomsnitt Intel Core i7-13700H (28769 - 151254, n=29) | |
| Dell XPS 17 9730 RTX 4070 | |
| LG Gram 17 (2023) | |
| HP Envy 17-cr0079ng | |
| AIDA64 / CPU ZLib | |
| Dell XPS 17 9730 RTX 4070 | |
| MSI Creator Z17 A12UGST-054 | |
| Genomsnitt Intel Core i7-13700H (389 - 1215, n=29) | |
| Dell XPS 17 9720 RTX 3060 | |
| HP Envy 17-cr0079ng | |
| LG Gram 17 (2023) | |
| AIDA64 / FP64 Ray-Trace | |
| Dell XPS 17 9730 RTX 4070 | |
| Genomsnitt Intel Core i7-13700H (2540 - 10135, n=29) | |
| LG Gram 17 (2023) | |
| MSI Creator Z17 A12UGST-054 | |
| Dell XPS 17 9720 RTX 3060 | |
| HP Envy 17-cr0079ng | |
| AIDA64 / CPU PhotoWorxx | |
| LG Gram 17 (2023) | |
| Dell XPS 17 9730 RTX 4070 | |
| Dell XPS 17 9720 RTX 3060 | |
| Genomsnitt Intel Core i7-13700H (12872 - 52727, n=29) | |
| MSI Creator Z17 A12UGST-054 | |
| HP Envy 17-cr0079ng | |
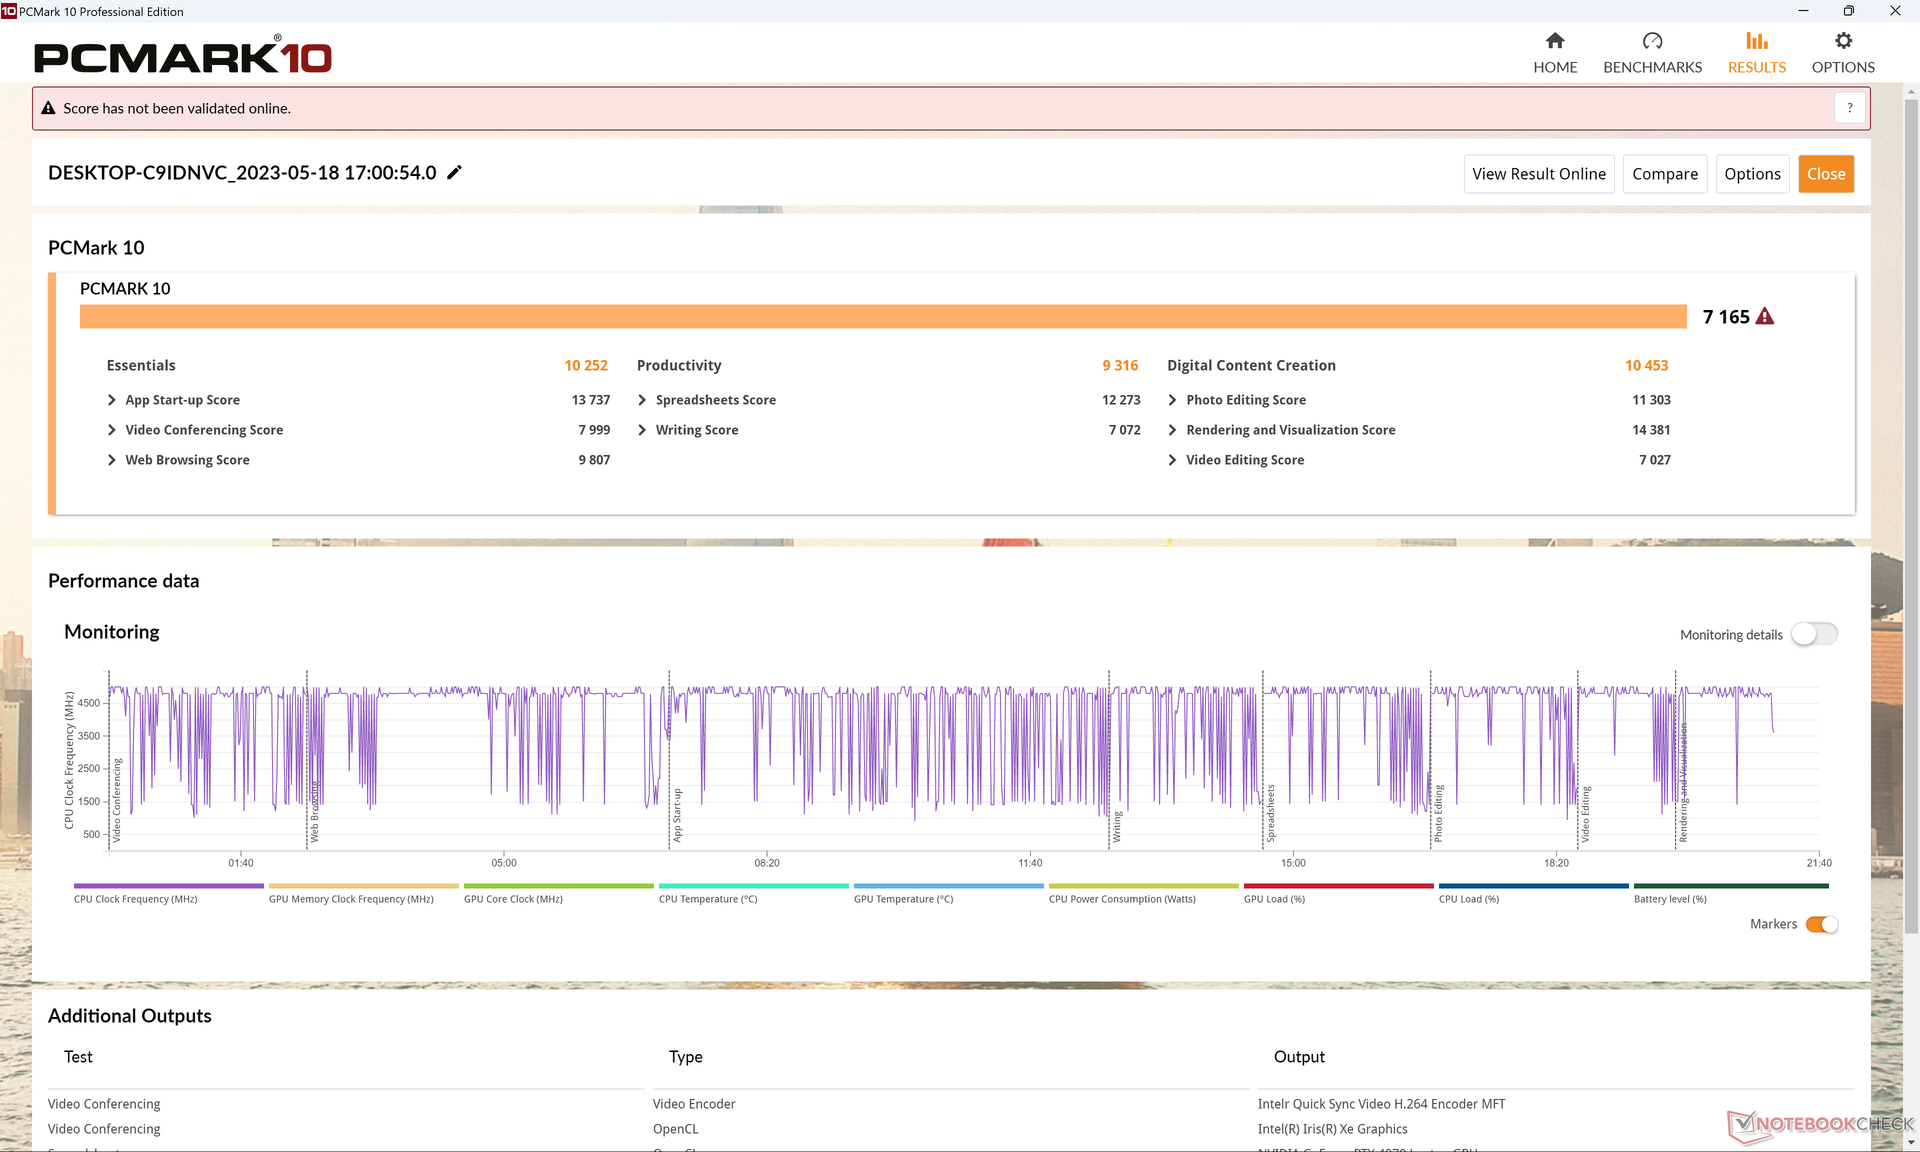
Systemets prestanda
PCMark-resultaten är nästan identiska med förra årets XPS 17 9720 trots prestandaförbättringarna från år till år. Detta tyder på att dagliga arbetsbelastningar och lättare kontorsaktiviteter inte är märkbart snabbare på den senaste modellen. Om dina arbetsuppgifter främst består av webbsurfning, kalkylblad och ordbehandling kan en mindre XPS 17-konfiguration med RTX 4050 vara mer lämplig än vår RTX 4070-konfiguration.
CrossMark: Overall | Productivity | Creativity | Responsiveness
| PCMark 10 / Score | |
| Genomsnitt Intel Core i7-13700H, NVIDIA GeForce RTX 4070 Laptop GPU (7158 - 7956, n=8) | |
| Dell XPS 17 9720 RTX 3060 | |
| Dell XPS 17 9730 RTX 4070 | |
| MSI Creator Z17 A12UGST-054 | |
| HP Envy 17-cr0079ng | |
| LG Gram 17 (2023) | |
| PCMark 10 / Essentials | |
| LG Gram 17 (2023) | |
| Dell XPS 17 9720 RTX 3060 | |
| Genomsnitt Intel Core i7-13700H, NVIDIA GeForce RTX 4070 Laptop GPU (10252 - 11449, n=8) | |
| HP Envy 17-cr0079ng | |
| MSI Creator Z17 A12UGST-054 | |
| Dell XPS 17 9730 RTX 4070 | |
| PCMark 10 / Productivity | |
| Genomsnitt Intel Core i7-13700H, NVIDIA GeForce RTX 4070 Laptop GPU (8501 - 10769, n=8) | |
| MSI Creator Z17 A12UGST-054 | |
| Dell XPS 17 9720 RTX 3060 | |
| Dell XPS 17 9730 RTX 4070 | |
| HP Envy 17-cr0079ng | |
| LG Gram 17 (2023) | |
| PCMark 10 / Digital Content Creation | |
| Genomsnitt Intel Core i7-13700H, NVIDIA GeForce RTX 4070 Laptop GPU (10358 - 12908, n=8) | |
| Dell XPS 17 9730 RTX 4070 | |
| Dell XPS 17 9720 RTX 3060 | |
| MSI Creator Z17 A12UGST-054 | |
| HP Envy 17-cr0079ng | |
| LG Gram 17 (2023) | |
| CrossMark / Overall | |
| MSI Creator Z17 A12UGST-054 | |
| Apple MacBook Pro 16 2023 M2 Max | |
| Genomsnitt Intel Core i7-13700H, NVIDIA GeForce RTX 4070 Laptop GPU (1768 - 2073, n=6) | |
| Dell XPS 17 9720 RTX 3060 | |
| Dell XPS 17 9730 RTX 4070 | |
| LG Gram 17 (2023) | |
| HP Envy 17-cr0079ng | |
| CrossMark / Productivity | |
| MSI Creator Z17 A12UGST-054 | |
| Genomsnitt Intel Core i7-13700H, NVIDIA GeForce RTX 4070 Laptop GPU (1645 - 2006, n=6) | |
| Dell XPS 17 9720 RTX 3060 | |
| Dell XPS 17 9730 RTX 4070 | |
| Apple MacBook Pro 16 2023 M2 Max | |
| LG Gram 17 (2023) | |
| HP Envy 17-cr0079ng | |
| CrossMark / Creativity | |
| Apple MacBook Pro 16 2023 M2 Max | |
| MSI Creator Z17 A12UGST-054 | |
| Dell XPS 17 9720 RTX 3060 | |
| Genomsnitt Intel Core i7-13700H, NVIDIA GeForce RTX 4070 Laptop GPU (1936 - 2137, n=6) | |
| Dell XPS 17 9730 RTX 4070 | |
| LG Gram 17 (2023) | |
| HP Envy 17-cr0079ng | |
| CrossMark / Responsiveness | |
| MSI Creator Z17 A12UGST-054 | |
| Genomsnitt Intel Core i7-13700H, NVIDIA GeForce RTX 4070 Laptop GPU (1451 - 2202, n=6) | |
| Dell XPS 17 9720 RTX 3060 | |
| Dell XPS 17 9730 RTX 4070 | |
| LG Gram 17 (2023) | |
| Apple MacBook Pro 16 2023 M2 Max | |
| HP Envy 17-cr0079ng | |
| PCMark 10 Score | 7165 poäng | |
Hjälp | ||
| AIDA64 / Memory Copy | |
| LG Gram 17 (2023) | |
| Dell XPS 17 9730 RTX 4070 | |
| Dell XPS 17 9720 RTX 3060 | |
| MSI Creator Z17 A12UGST-054 | |
| Genomsnitt Intel Core i7-13700H (24334 - 78081, n=29) | |
| HP Envy 17-cr0079ng | |
| AIDA64 / Memory Read | |
| Dell XPS 17 9730 RTX 4070 | |
| Dell XPS 17 9720 RTX 3060 | |
| MSI Creator Z17 A12UGST-054 | |
| Genomsnitt Intel Core i7-13700H (23681 - 79656, n=29) | |
| LG Gram 17 (2023) | |
| HP Envy 17-cr0079ng | |
| AIDA64 / Memory Write | |
| LG Gram 17 (2023) | |
| Dell XPS 17 9730 RTX 4070 | |
| Genomsnitt Intel Core i7-13700H (22986 - 99898, n=29) | |
| MSI Creator Z17 A12UGST-054 | |
| Dell XPS 17 9720 RTX 3060 | |
| HP Envy 17-cr0079ng | |
| AIDA64 / Memory Latency | |
| LG Gram 17 (2023) | |
| MSI Creator Z17 A12UGST-054 | |
| Dell XPS 17 9730 RTX 4070 | |
| Genomsnitt Intel Core i7-13700H (82.4 - 136.8, n=29) | |
| Dell XPS 17 9720 RTX 3060 | |
| HP Envy 17-cr0079ng | |
* ... mindre är bättre
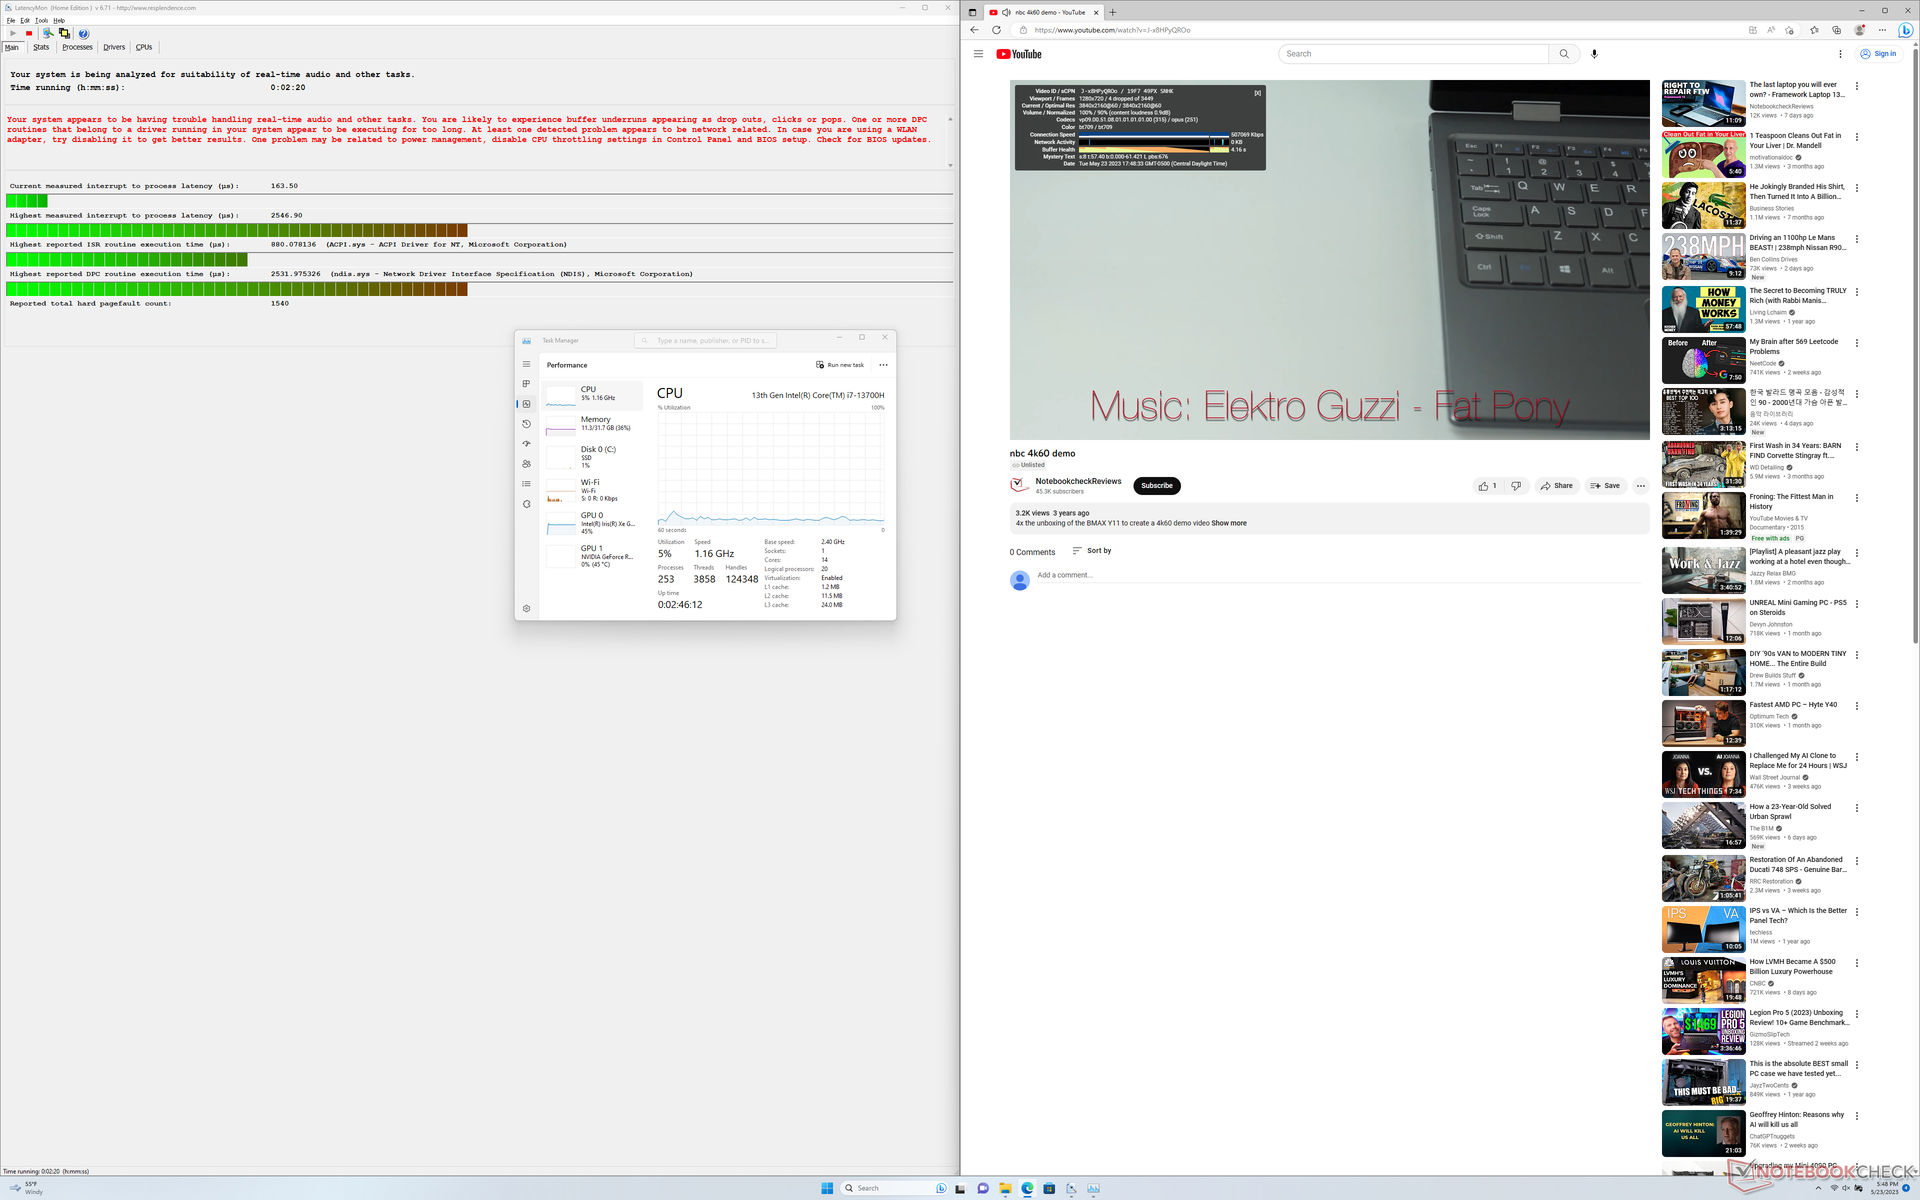
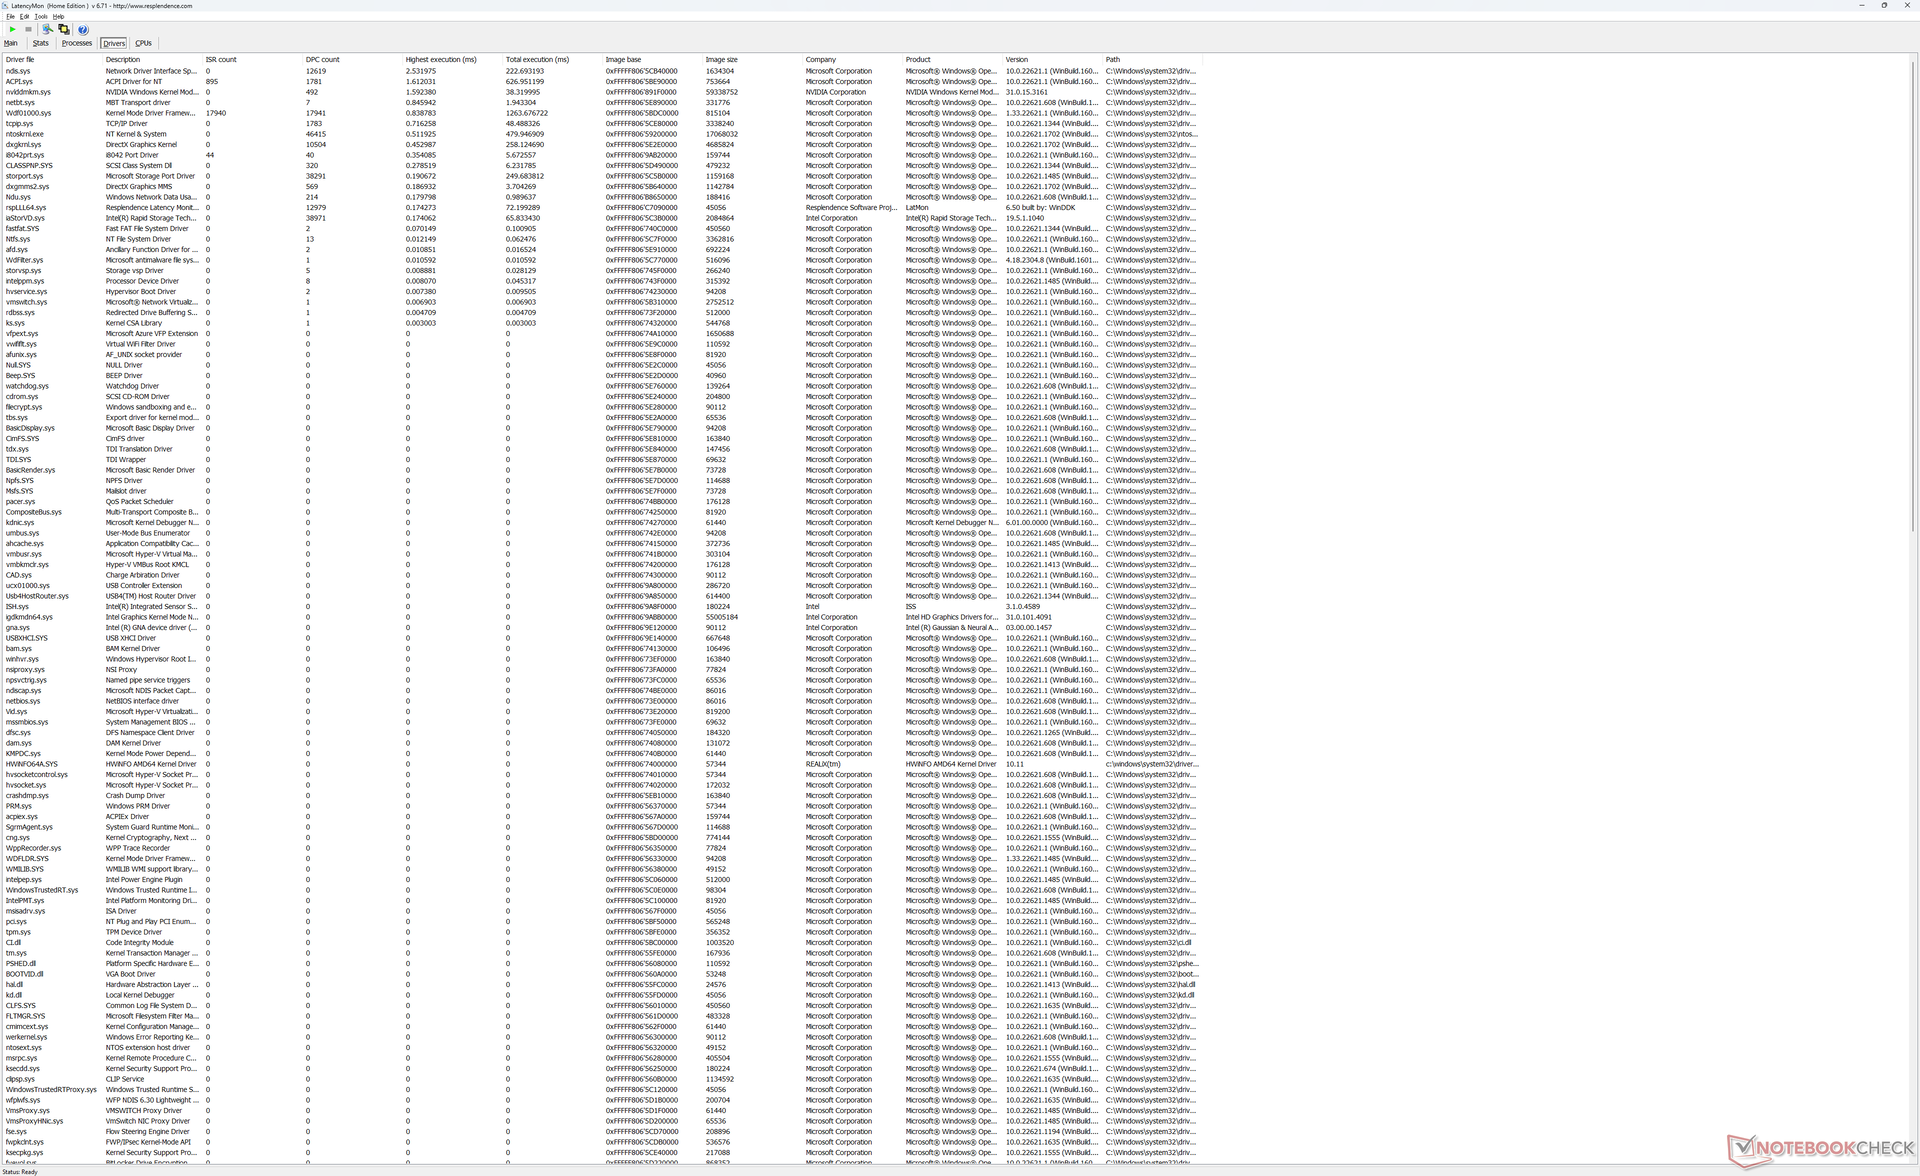
DPC-fördröjning
LatencyMon avslöjar DPC-problem när vi öppnar flera webbläsarflikar på vår hemsida, även efter flera försök. Resultaten är en besvikelse med tanke på att vi inte stötte på några problem på den senaste XPS 15 9530 eller på förra årets XPS 17 9720.
uppspelning av 4K-video med 60 FPS är perfekt förutom i början där den alltid tappar 4 bildrutor. Intressant nog uppstod samma problem även på XPS 15 9530.
| DPC Latencies / LatencyMon - interrupt to process latency (max), Web, Youtube, Prime95 | |
| HP Envy 17-cr0079ng | |
| Dell XPS 17 9730 RTX 4070 | |
| LG Gram 17 (2023) | |
| MSI Creator Z17 A12UGST-054 | |
| Dell XPS 15 9530 RTX 4070 | |
| Dell XPS 17 9720 RTX 3060 | |
* ... mindre är bättre
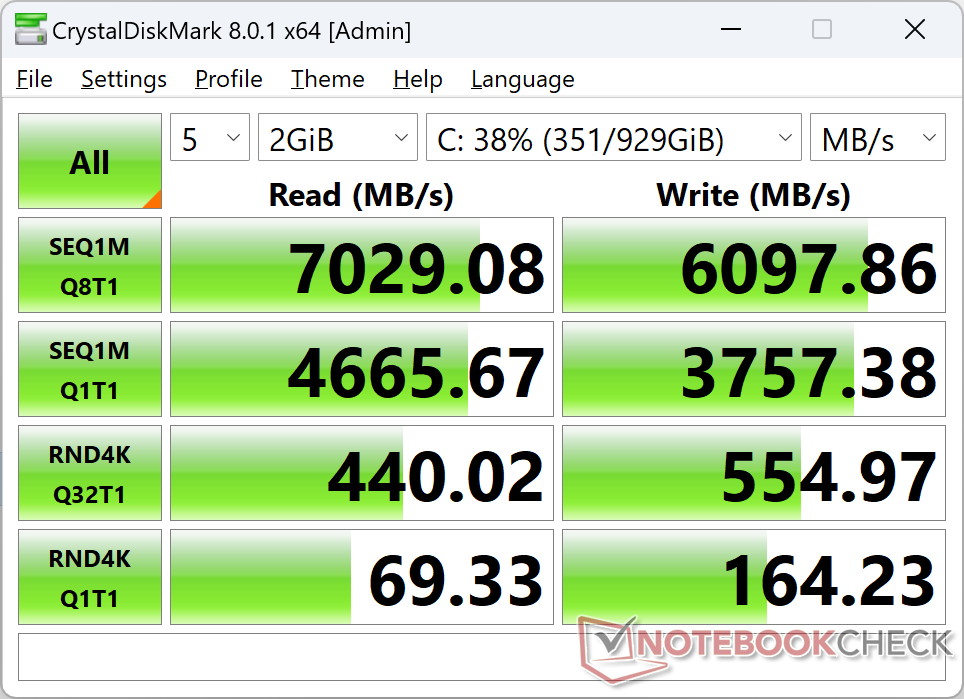
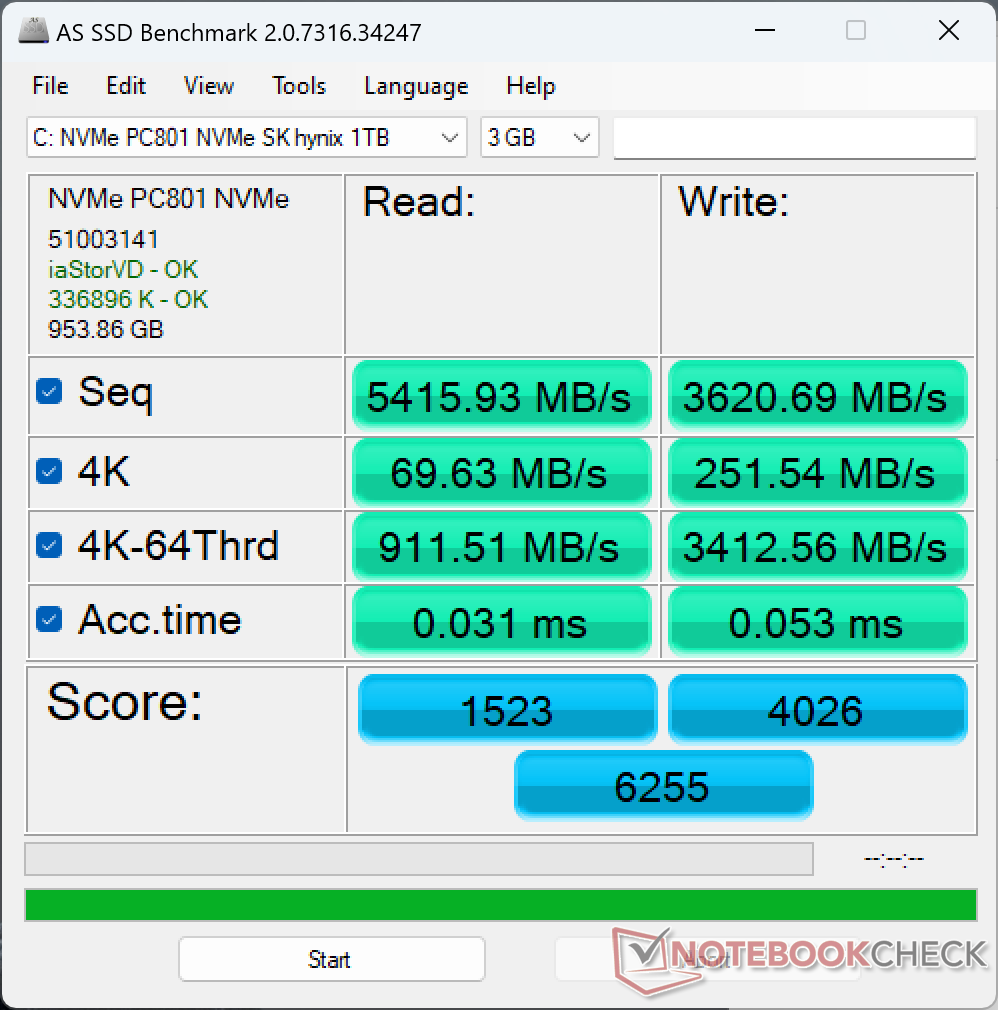
Lagringsenheter
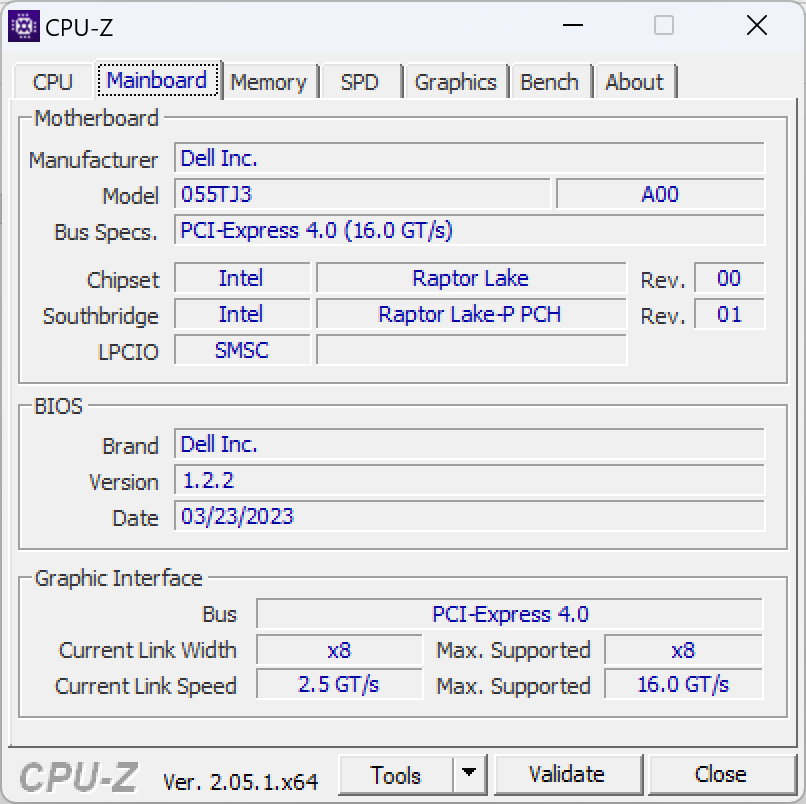
XPS-enheter kan levereras med SSD-enheter från Samsung, Micron, Western Digital eller SK Hynix. I vårt specifika fall levereras vår testenhet med SK Hynix PC801 PCIe4 x4 NVMe SSD. Prestandan är utmärkt och jämförbar med Samsung PM9A1 utan några nedgångar i överföringshastigheter vid stress.
En andra M.2 SSD kan installeras vid behov. Var och en av de två M.2-platserna har en värmespridare som hjälper till att kyla enheterna.

| Drive Performance rating - Percent | |
| LG Gram 17 (2023) | |
| MSI Creator Z17 A12UGST-054 | |
| Dell XPS 17 9730 RTX 4070 | |
| Dell XPS 17 9720 RTX 3060 | |
| HP Envy 17-cr0079ng | |
* ... mindre är bättre
Disk Throttling: DiskSpd Read Loop, Queue Depth 8
GPU-prestanda - mycket snabbare än XPS 15 9530
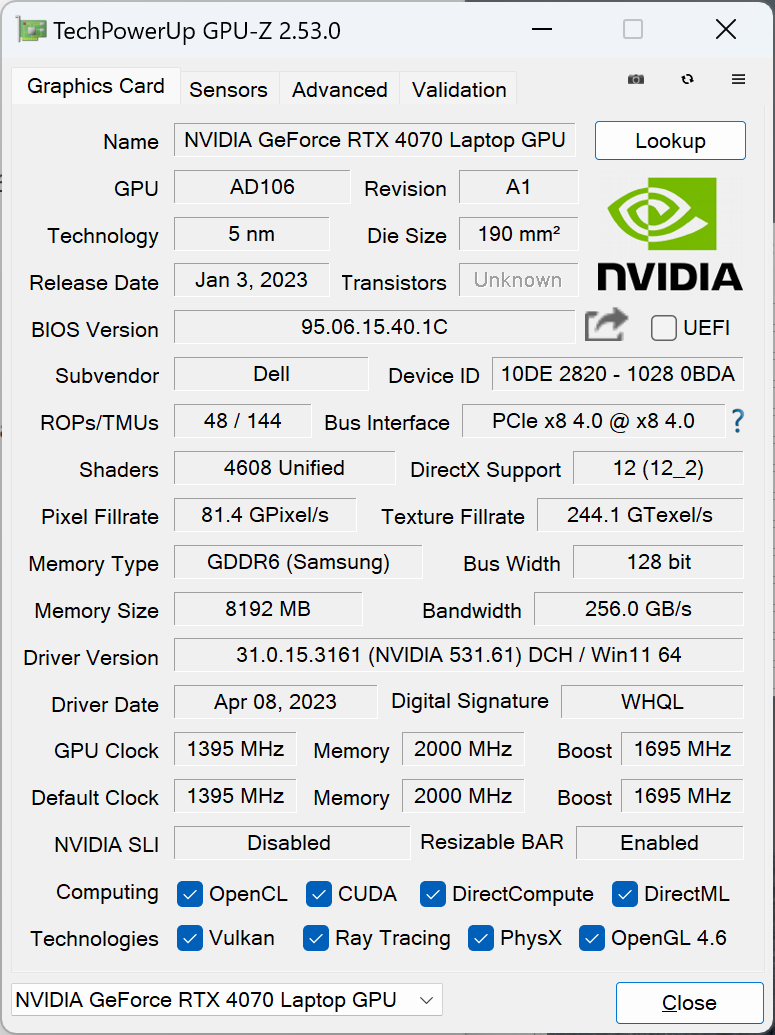
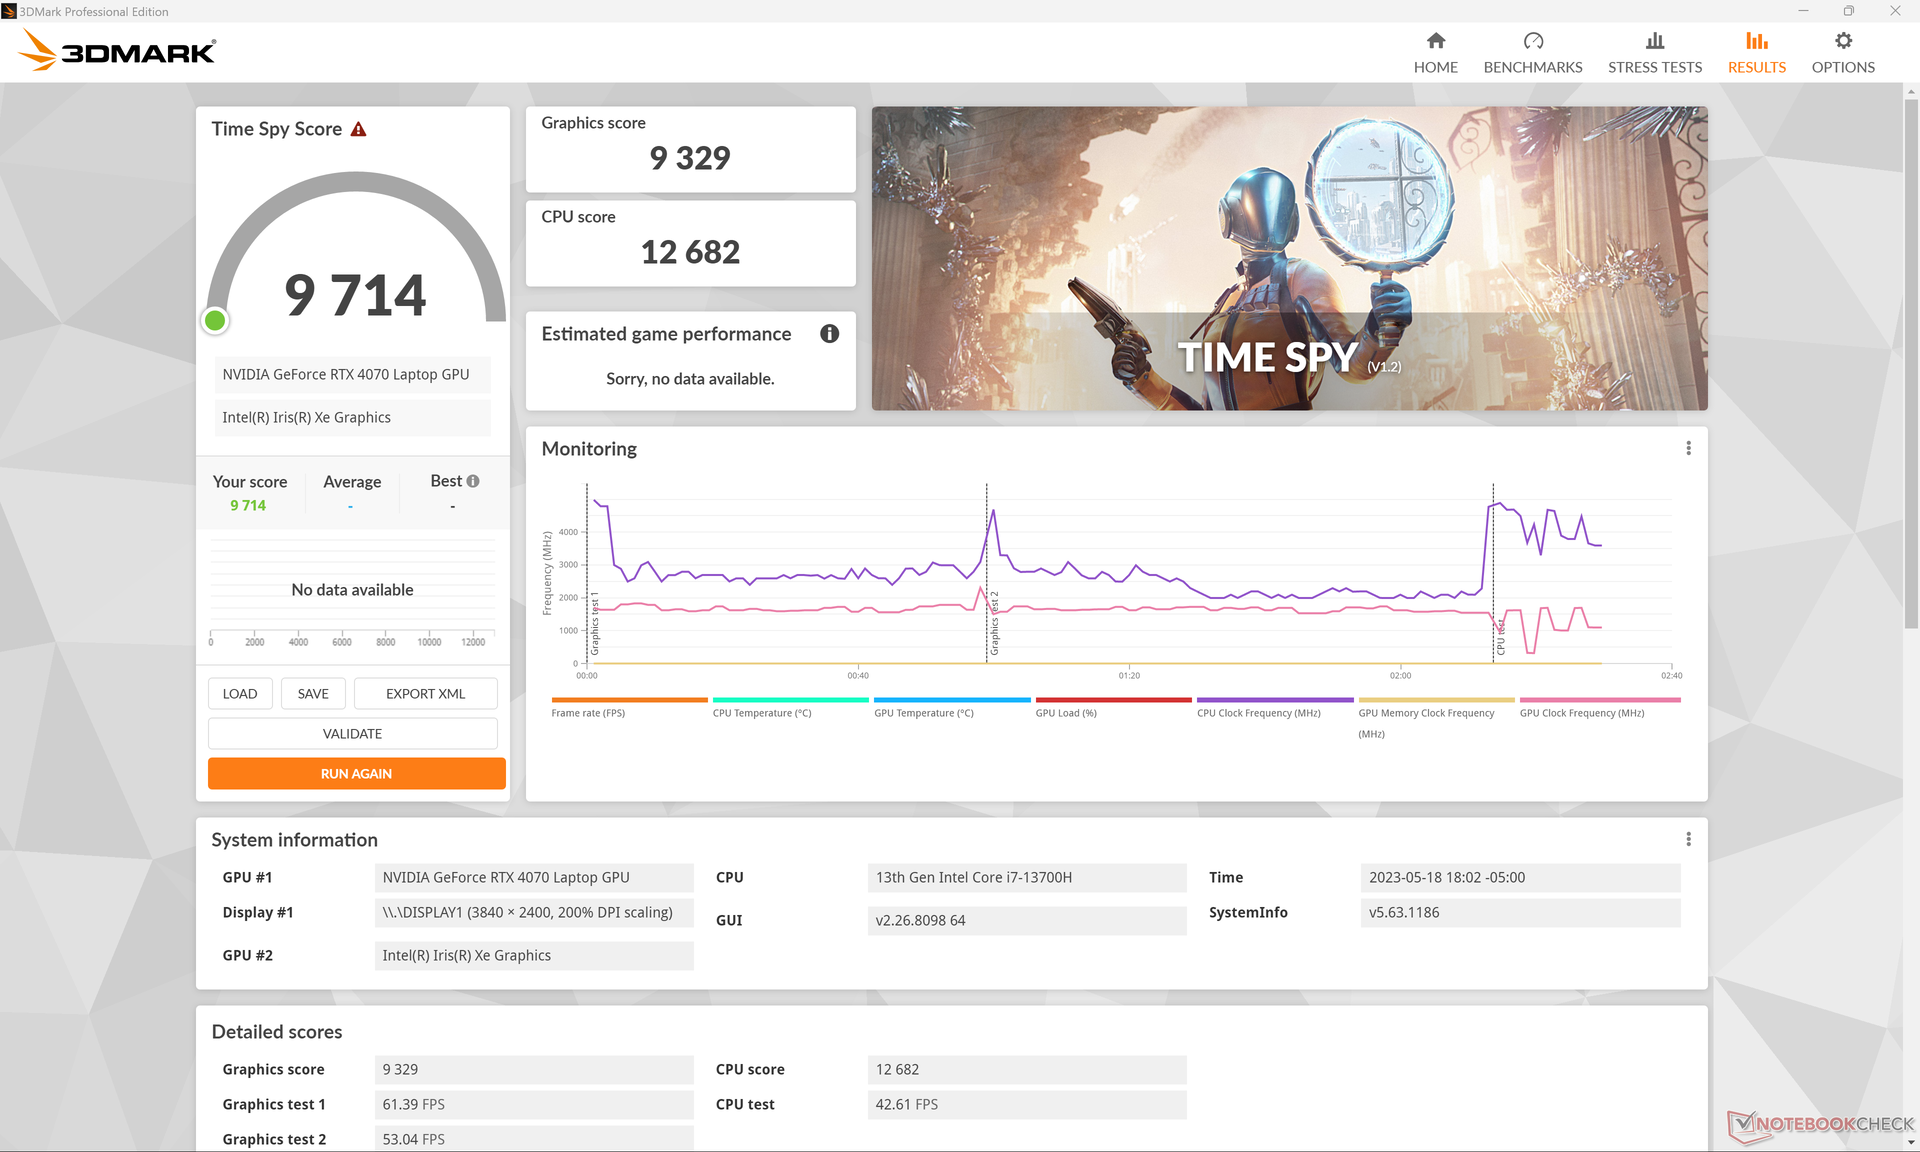
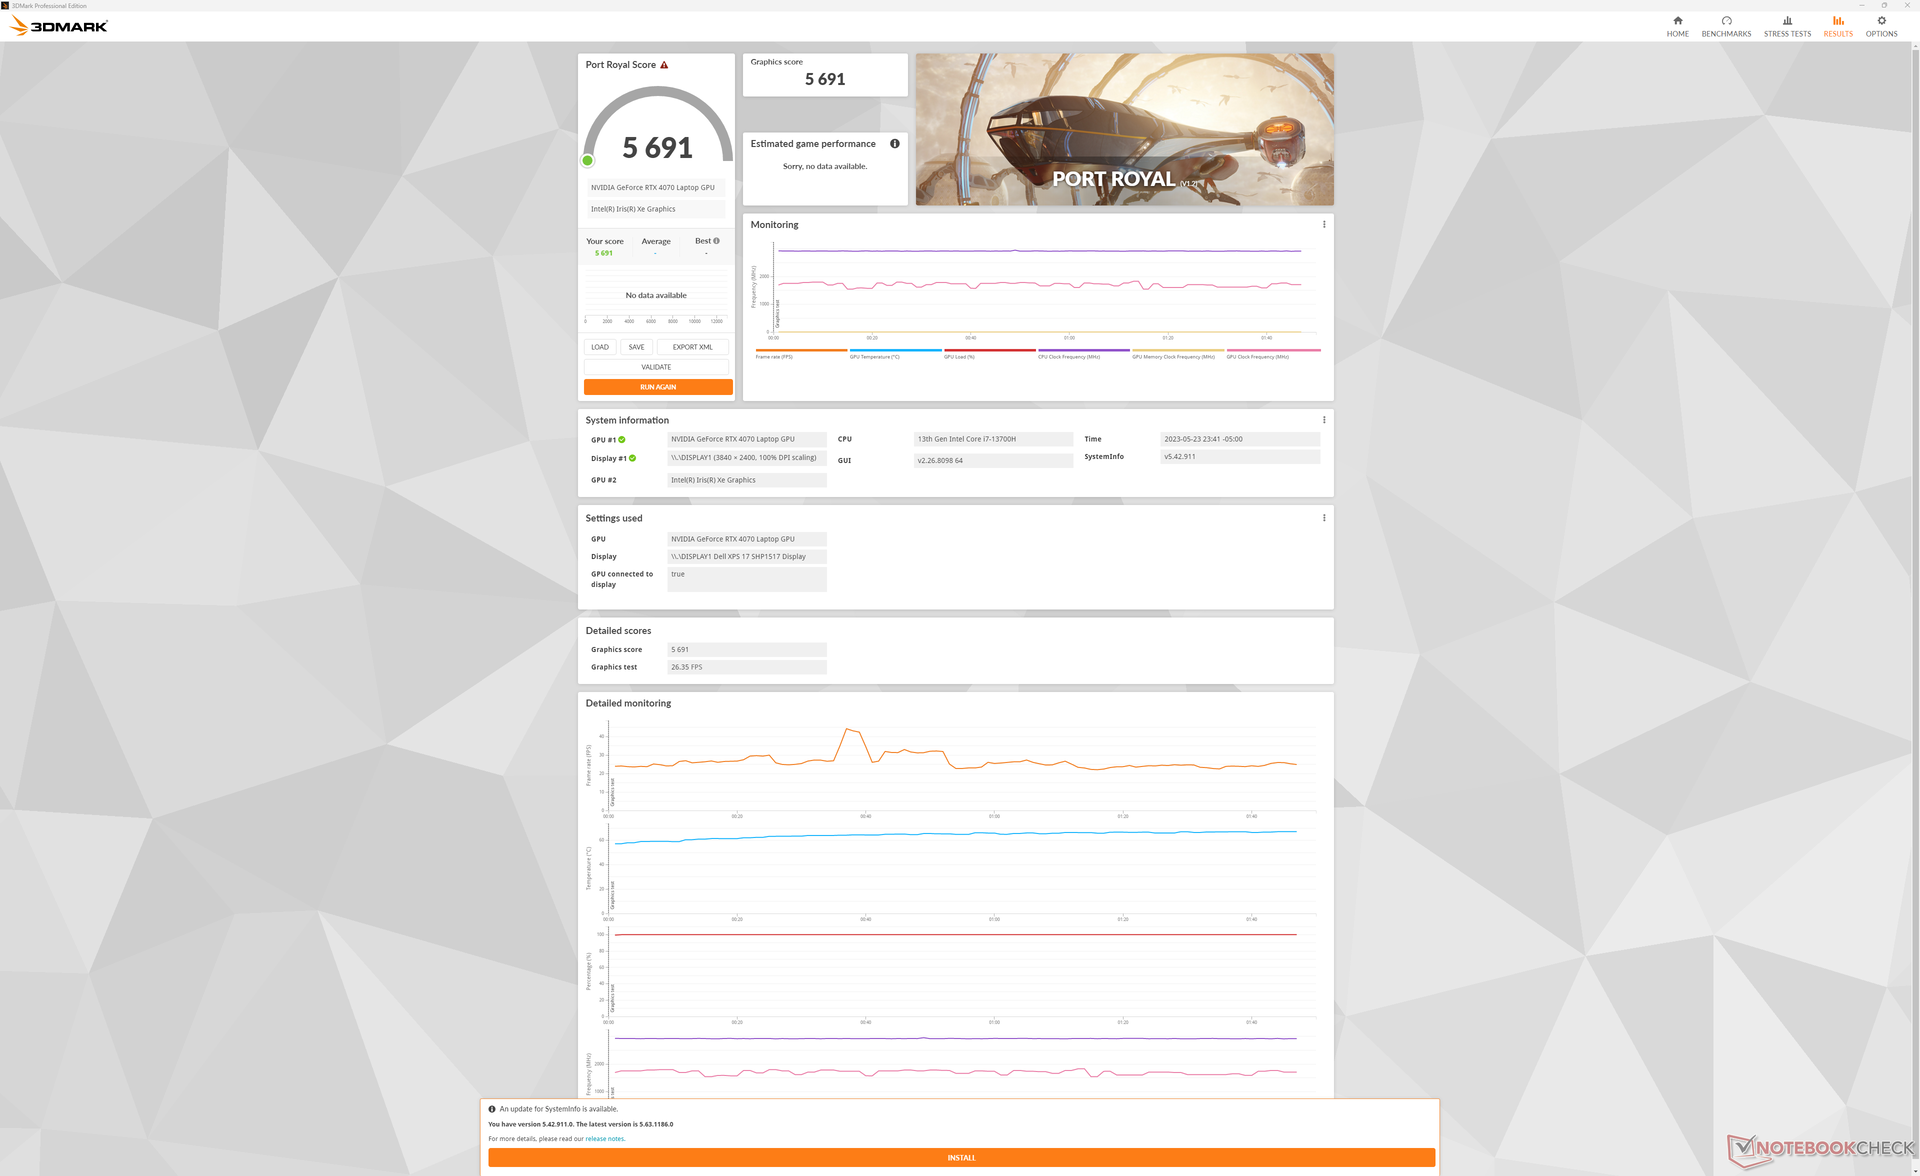
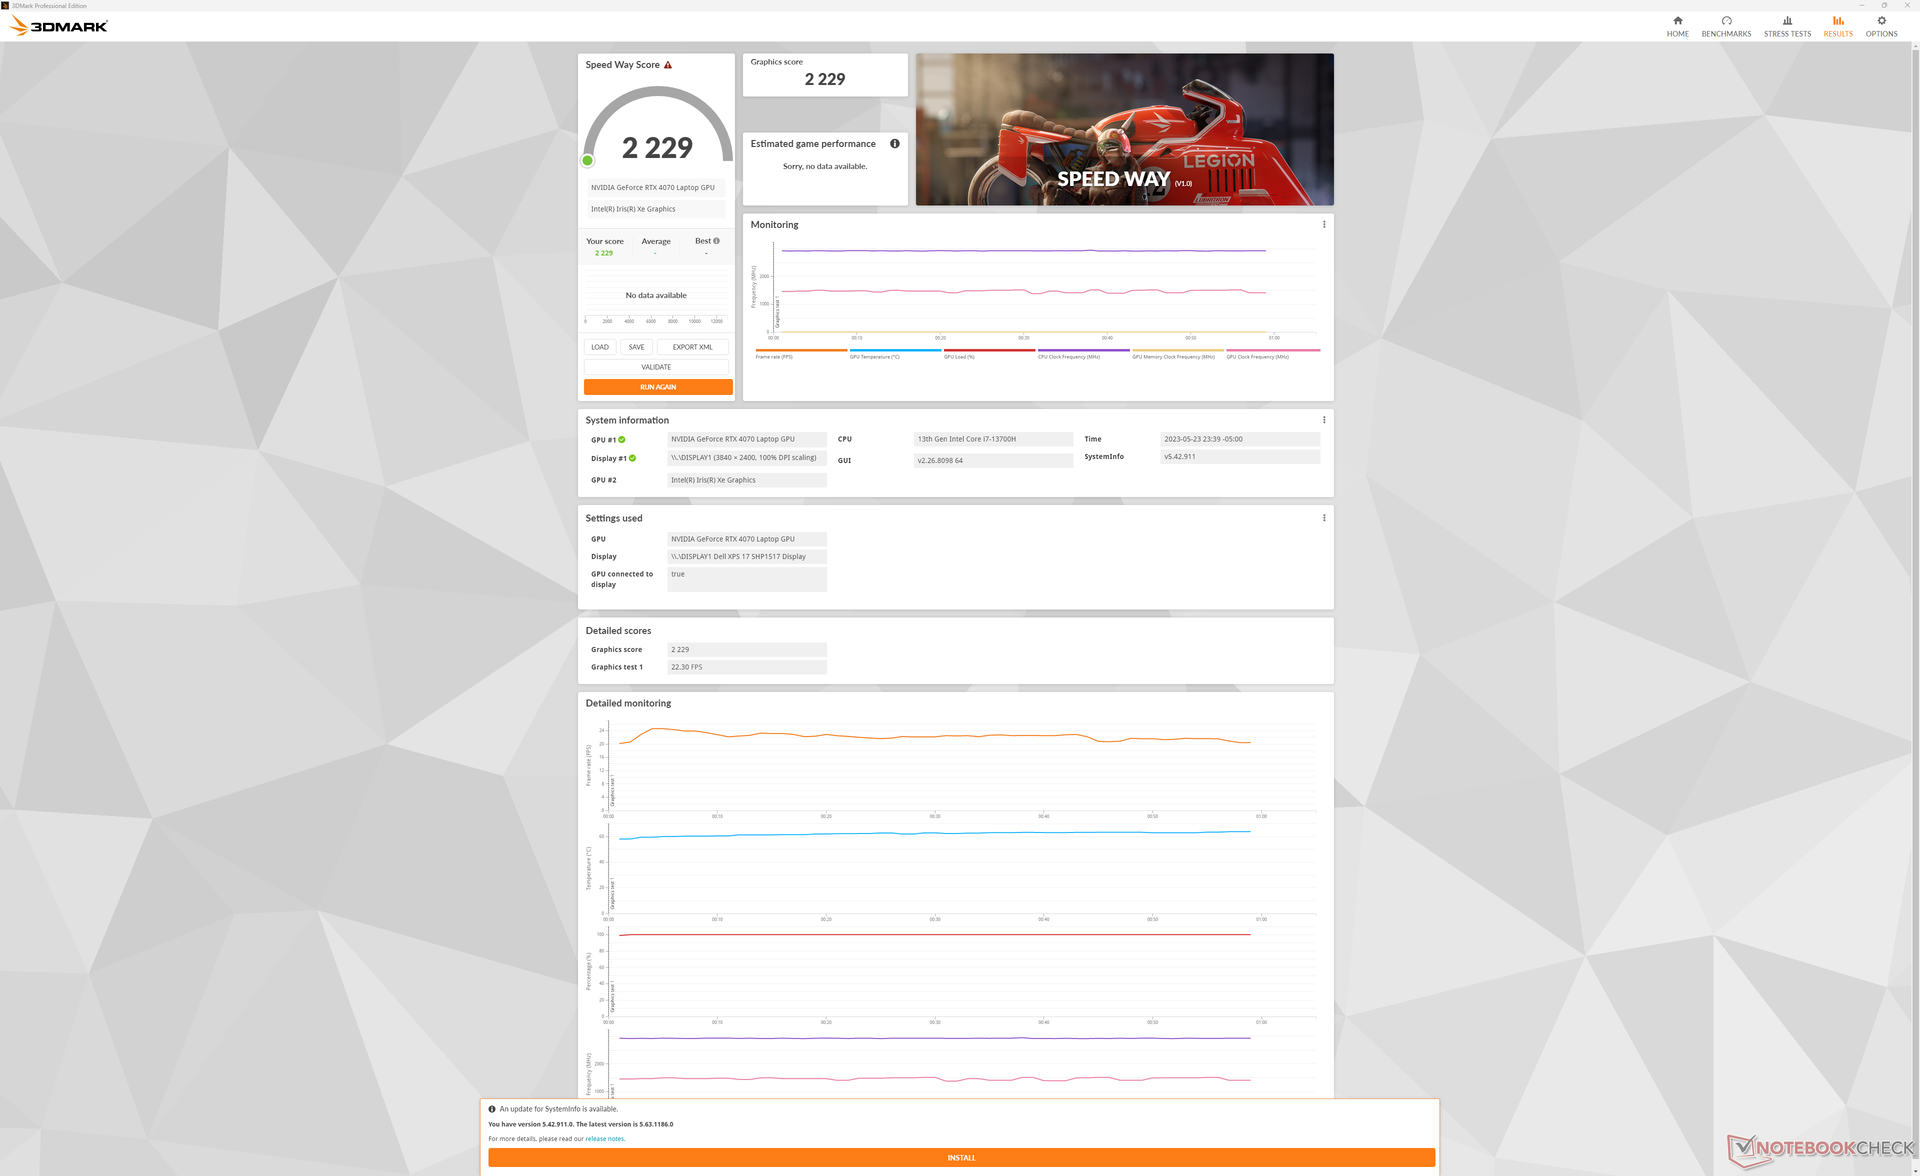
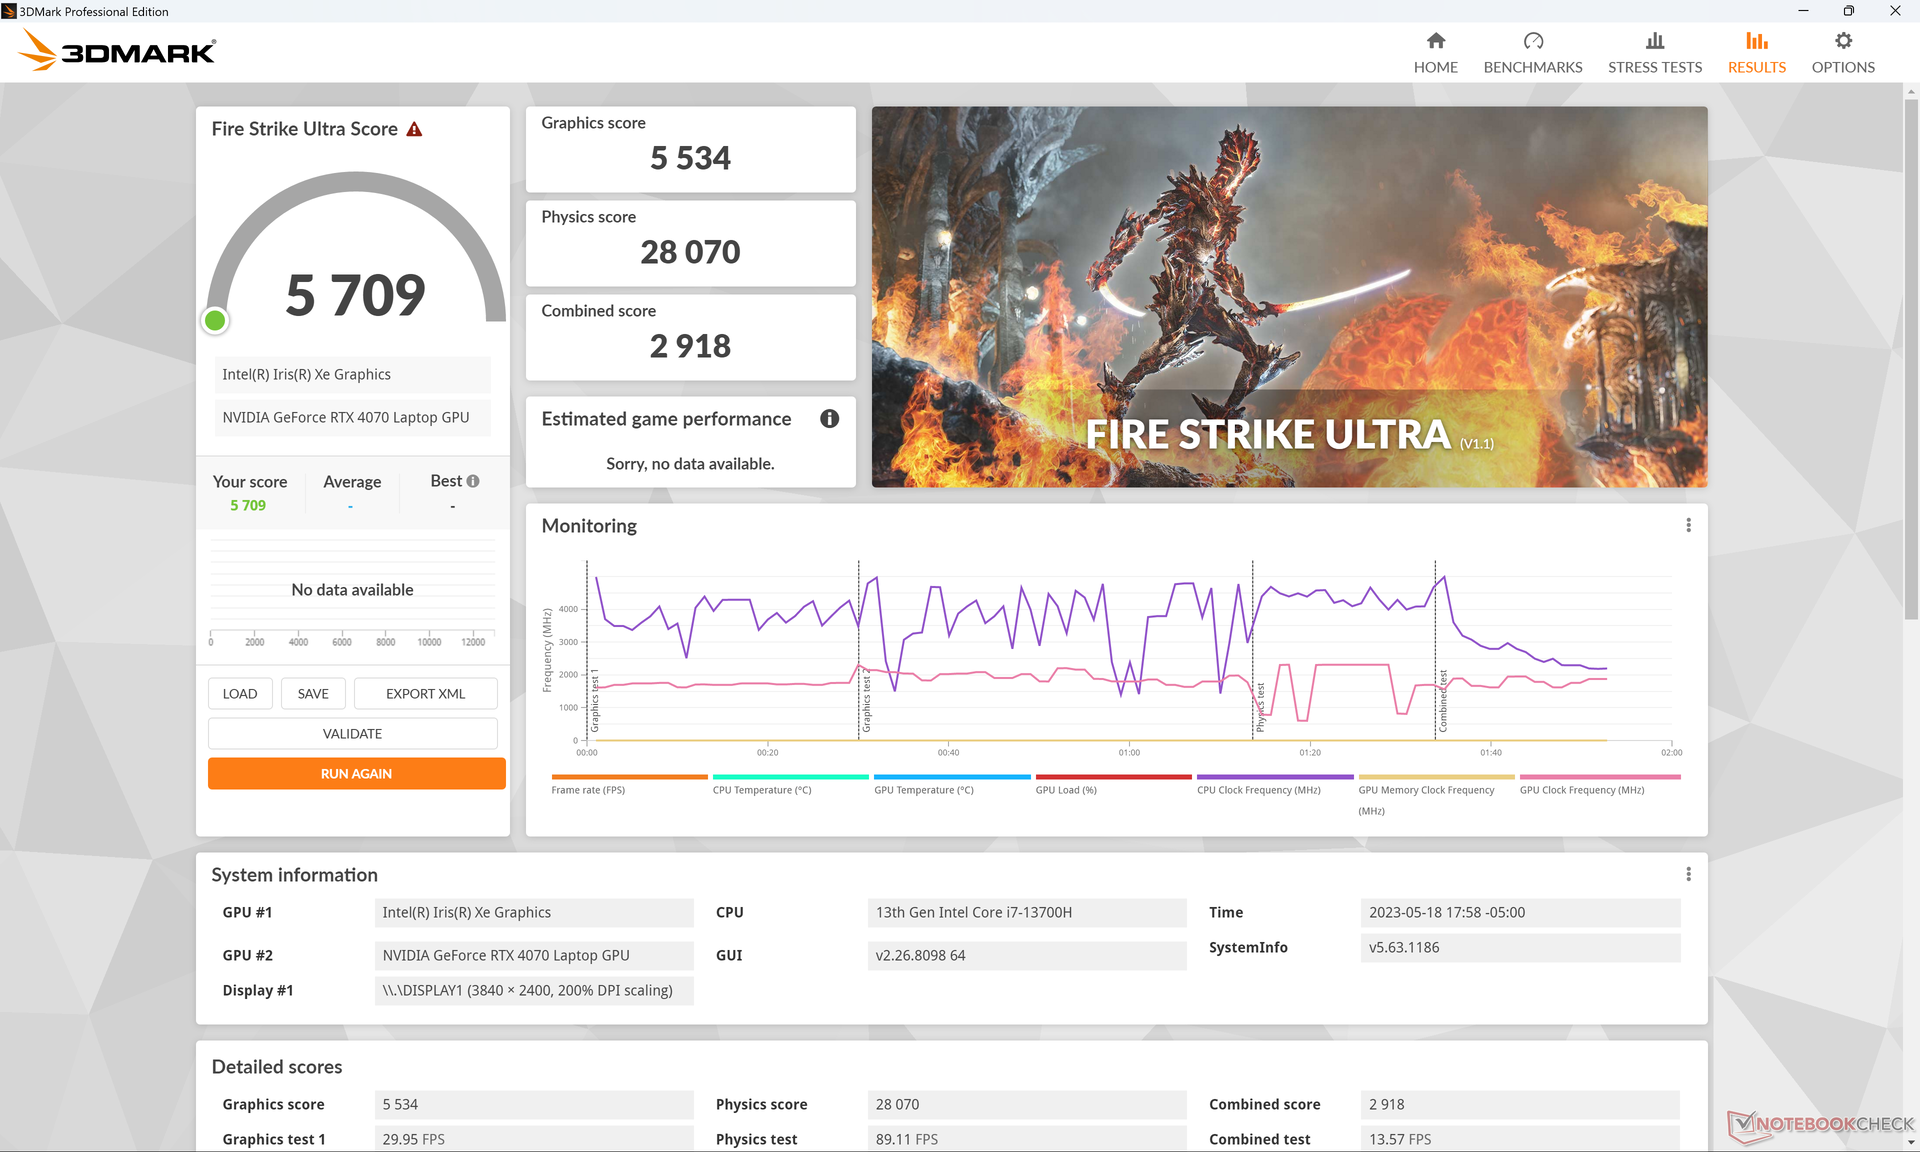
Den mobila GeForce RTX 4070 i XPS 17 har en TGP på 60 W till 70 W medan samma GPU i den mindre XPS 15 har en TGP på 40 W. Denna till synes lilla förändring gör stor skillnad eftersom 3DMark-poängen för både DirectX och ray tracing är 50 till 60 procent snabbare på XPS 17 9730 jämfört med XPS 15. Prestandaförbättringen är så stor att RTX 4070 i XPS 17 bara ligger 10 till 15 procent efter den genomsnittliga bärbara speldatorn som är utrustad med samma GPU. Detta är det prestandaintervall som vi hoppades få se från XPS 15 9530.
Blender GPU-acceleration får också en boost jämfört med samma GPU i XPS 15. Det är en mindre prestandaökning på 20 procent för att få XPS 17 i linje med de flesta andra RTX 4070-bärbara datorer.
Dell erbjuder ett ännu högre RTX 4080-alternativ för XPS 17, men vi förväntar oss att det kommer att underprestera jämfört med de flesta andra RTX 4080-laptops på grund av den begränsade 130 W USB-C-strömförsörjningen. DenMSI Stealth 17 Studioerbjuder till exempel RTX 4080 om än med en mycket mer kapabel 240 W AC-adapter.
Det högsta GPU-alternativet för XPS 17-serien före XPS 17 9730 var RTX 3060. Jämfört med den konfigurationen kan vår RTX 4070 erbjuda 20 procent respektive 30 procent snabbare innehållsskapande och grafikprestanda.
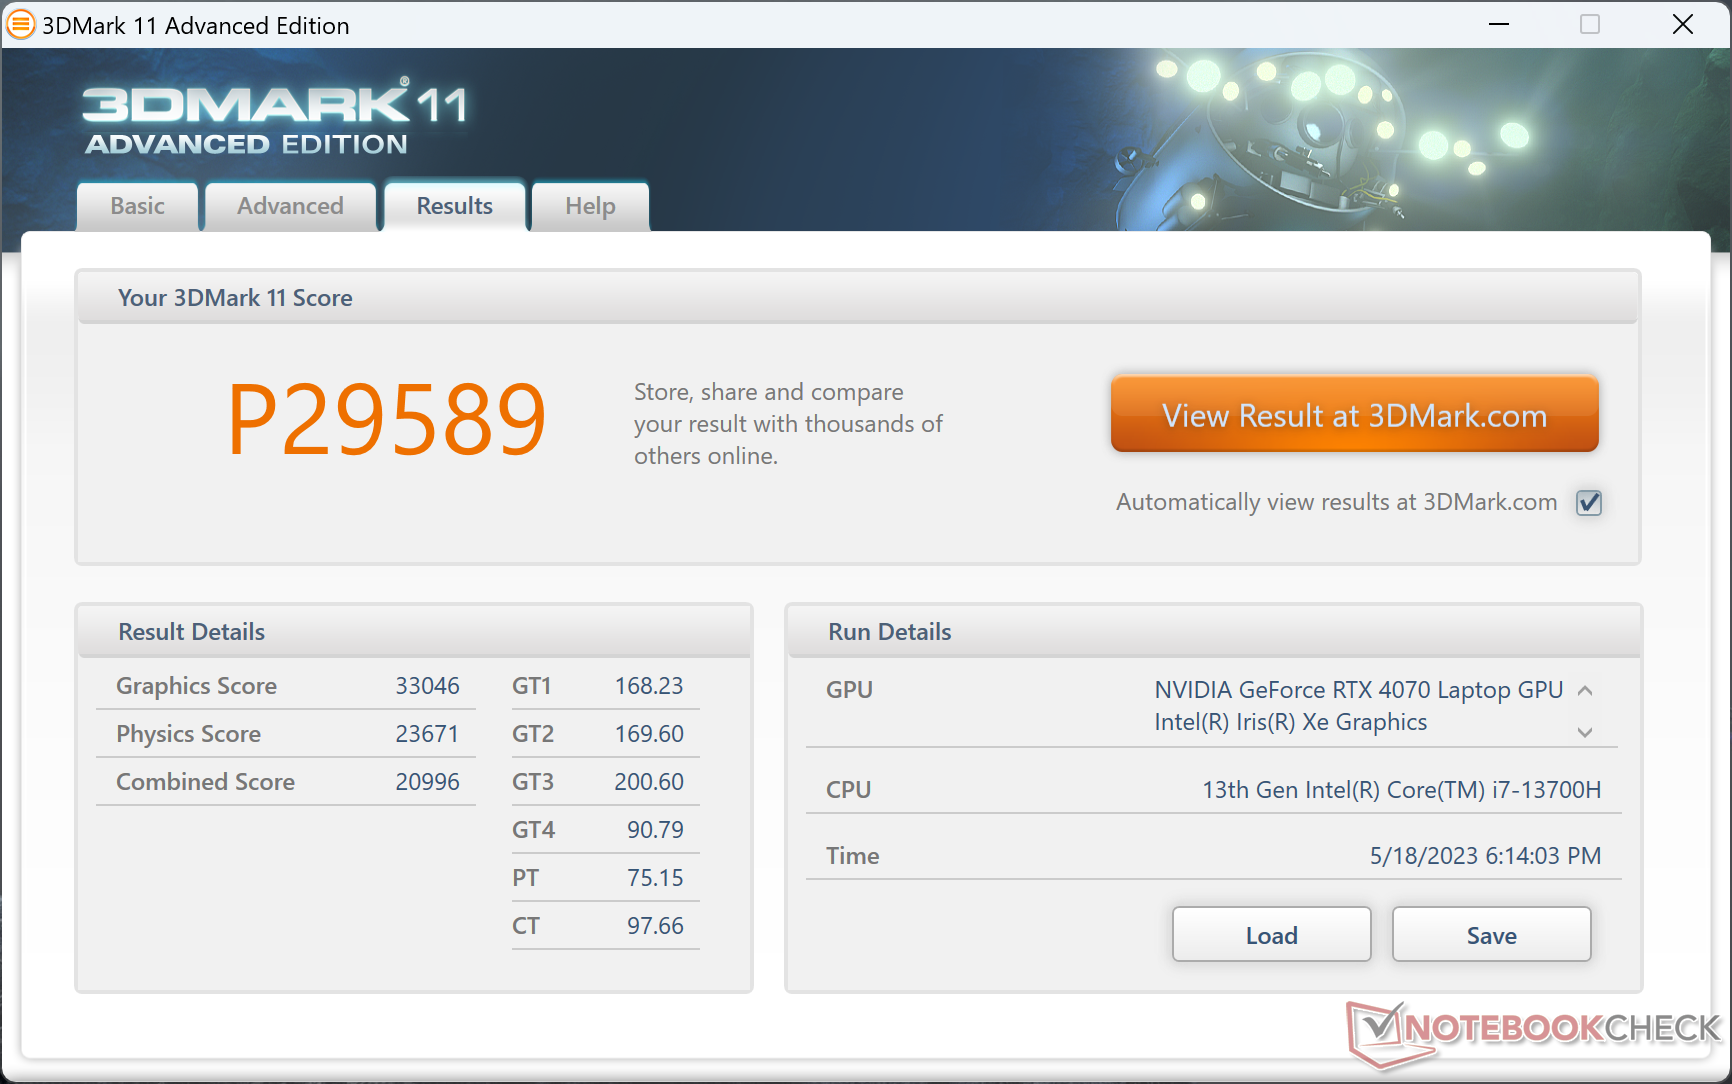
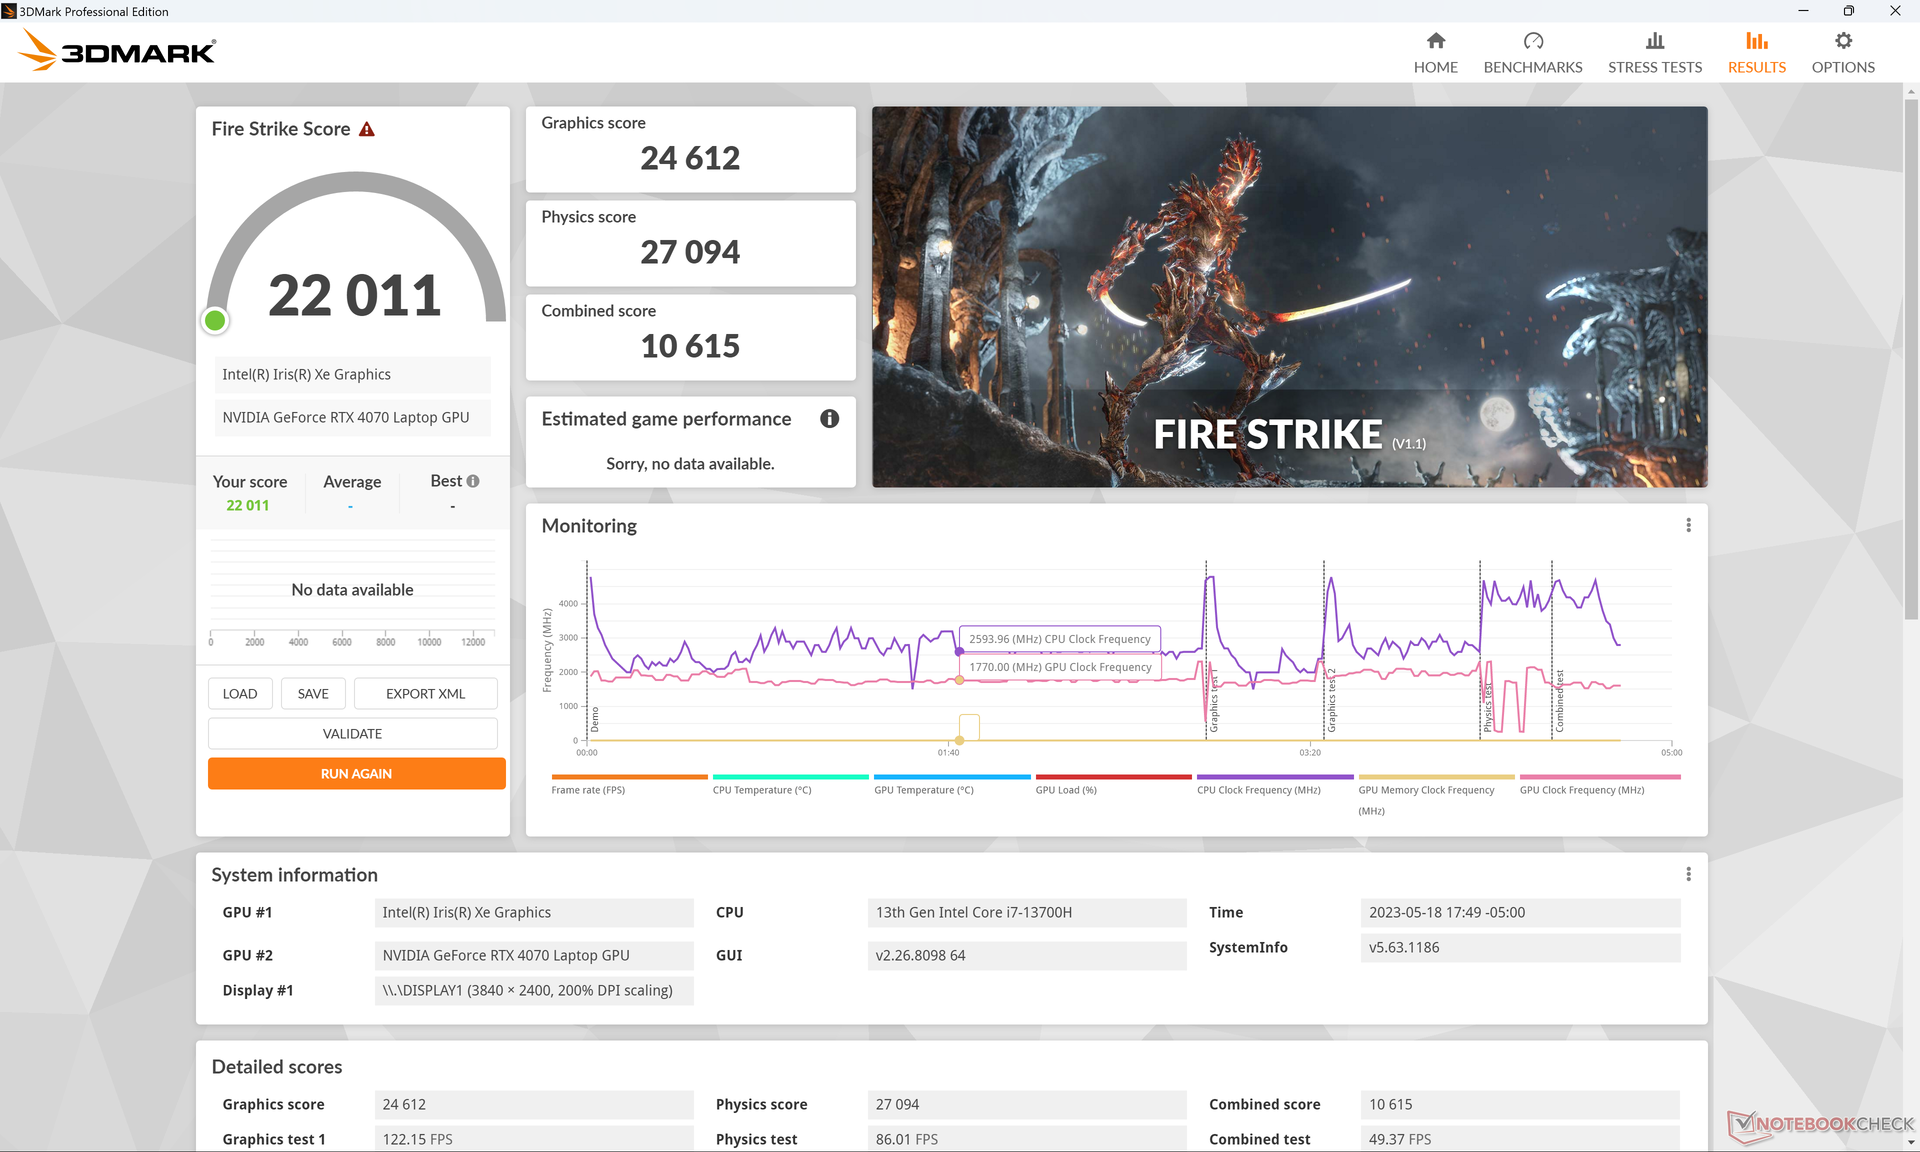
| 3DMark 11 Performance | 29589 poäng | |
| 3DMark Fire Strike Score | 22011 poäng | |
| 3DMark Time Spy Score | 9714 poäng | |
Hjälp | ||
* ... mindre är bättre
Spelprestanda
Systemet fungerar bra som en sekundär spelmaskin. Eftersom 70 W RTX 4070 inte är lika underdimensionerad som 40 W-versionen i XPS 15, kan XPS 17 köra de senaste spelen med QHD-upplösning och 60 FPS på medelhöga till medelhöga inställningar. 4K UHD är fortfarande utom räckhåll för de flesta, men GPU:n skulle passa bra ihop med externa FHD- eller QHD-skärmar för speländamål.
De kanske två viktigaste faktorerna som hindrar XPS 17 från att vara en "riktig" bärbar dator för spel är dess relativt långsamma svarstider och avsaknaden av G-Sync-stöd för den interna skärmen. Tappade bildrutor, screen tearing och spökbilder är därför mer vanligt förekommande när man spelar på XPS 17. Naturligtvis kan mycket av detta undvikas genom att helt enkelt spela på en extern bildskärm.
| Returnal | |
| 1280x720 Low Preset | |
| Aorus 17X AZF | |
| Genomsnitt NVIDIA GeForce RTX 4070 Laptop GPU (126 - 150, n=5) | |
| 1920x1080 Low Preset | |
| Aorus 17X AZF | |
| Genomsnitt NVIDIA GeForce RTX 4070 Laptop GPU (65 - 119, n=11) | |
| Dell XPS 17 9730 RTX 4070 | |
| 1920x1080 Medium Preset | |
| Aorus 17X AZF | |
| Genomsnitt NVIDIA GeForce RTX 4070 Laptop GPU (69 - 117, n=12) | |
| Dell XPS 17 9730 RTX 4070 | |
| 1920x1080 High Preset | |
| Aorus 17X AZF | |
| Genomsnitt NVIDIA GeForce RTX 4070 Laptop GPU (64 - 106, n=12) | |
| Dell XPS 17 9730 RTX 4070 | |
| 1920x1080 Epic Preset | |
| Aorus 17X AZF | |
| Genomsnitt NVIDIA GeForce RTX 4070 Laptop GPU (54 - 90, n=12) | |
| Dell XPS 17 9730 RTX 4070 | |
| 2560x1440 Epic Preset | |
| Aorus 17X AZF | |
| Genomsnitt NVIDIA GeForce RTX 4070 Laptop GPU (39 - 66, n=12) | |
| Dell XPS 17 9730 RTX 4070 | |
| 3840x2160 Epic Preset | |
| Aorus 17X AZF | |
| Genomsnitt NVIDIA GeForce RTX 4070 Laptop GPU (21 - 39, n=8) | |
| Dell XPS 17 9730 RTX 4070 | |
| Tiny Tina's Wonderlands | |
| 1920x1080 Low Preset (DX12) | |
| Aorus 17X AZF | |
| Genomsnitt NVIDIA GeForce RTX 4070 Laptop GPU (98.1 - 283, n=15) | |
| Dell XPS 17 9730 RTX 4070 | |
| 1920x1080 Medium Preset (DX12) | |
| Aorus 17X AZF | |
| Genomsnitt NVIDIA GeForce RTX 4070 Laptop GPU (92.5 - 231, n=15) | |
| Dell XPS 17 9730 RTX 4070 | |
| 1920x1080 High Preset (DX12) | |
| Aorus 17X AZF | |
| Genomsnitt NVIDIA GeForce RTX 4070 Laptop GPU (74.3 - 151.4, n=15) | |
| Dell XPS 17 9730 RTX 4070 | |
| 1920x1080 Badass Preset (DX12) | |
| Aorus 17X AZF | |
| Genomsnitt NVIDIA GeForce RTX 4070 Laptop GPU (58.6 - 115.9, n=18) | |
| Dell XPS 17 9730 RTX 4070 | |
| 2560x1440 Badass Preset (DX12) | |
| Aorus 17X AZF | |
| Genomsnitt NVIDIA GeForce RTX 4070 Laptop GPU (49.8 - 79.5, n=17) | |
| Dell XPS 17 9730 RTX 4070 | |
| 3840x2160 Badass Preset (DX12) | |
| Aorus 17X AZF | |
| Genomsnitt NVIDIA GeForce RTX 4070 Laptop GPU (28.3 - 39.7, n=13) | |
| Dell XPS 17 9730 RTX 4070 | |
Witcher 3 FPS Chart
| låg | med. | hög | ultra | QHD | 4K | |
|---|---|---|---|---|---|---|
| GTA V (2015) | 186.6 | 182.5 | 167.9 | 102.7 | 75.5 | 76.9 |
| The Witcher 3 (2015) | 415.2 | 297.6 | 181.4 | 96.2 | 59 | |
| Dota 2 Reborn (2015) | 193.5 | 174.5 | 165.9 | 156.9 | 108 | |
| Final Fantasy XV Benchmark (2018) | 174.8 | 128.3 | 94.7 | 69.9 | 38.2 | |
| X-Plane 11.11 (2018) | 154.6 | 133.1 | 106.4 | 90 | ||
| Strange Brigade (2018) | 431 | 238 | 192 | 165.4 | 113.6 | 61.7 |
| Cyberpunk 2077 1.6 (2022) | 102.1 | 99.4 | 85.6 | 71 | 43 | 18.7 |
| Tiny Tina's Wonderlands (2022) | 183.5 | 153.3 | 104.9 | 82.4 | 55.7 | 28.3 |
| F1 22 (2022) | 206 | 196.4 | 158.2 | 60.7 | 39.4 | 18.8 |
| Returnal (2023) | 72 | 71 | 67 | 59 | 41 | 21 |
Utsläpp
Systemljud - Högt ljud endast när det behövs
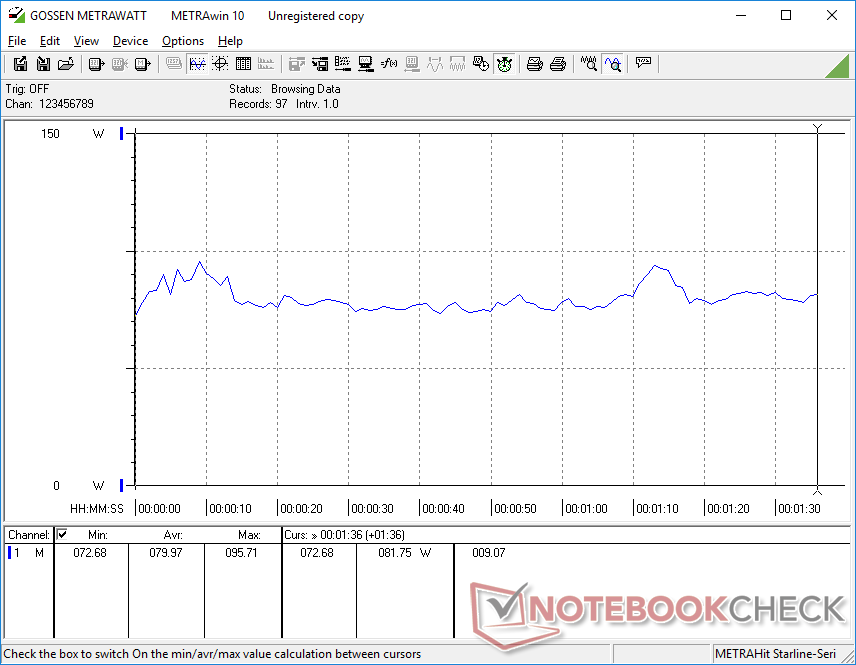
Fläktljudet har inte förändrats drastiskt trots prestandaförbättringarna. XPS 17 brukar ligga på knappt hörbara 25,6 dB(A) mot en tyst bakgrund på 22,7 dB(A) när man surfar på webben eller strömmar video. Om man kör mycket krävande belastningar som spel, börjar dock fläktljudet närma sig nivån för vissa bärbara speldatorer på upp till 50 dB(A). XPS-modellen erbjuder trots allt specifikationer på spelnivå.
Ljudnivå
| Låg belastning |
| 22.8 / 22.8 / 22.8 dB(A) |
| Hög belastning |
| 38.9 / 50.2 dB(A) |
 | ||
30 dB tyst 40 dB(A) hörbar 50 dB(A) högt ljud |
||
min: | ||
| Dell XPS 17 9730 RTX 4070 GeForce RTX 4070 Laptop GPU, i7-13700H, SK hynix PC801 HFS001TEJ9X101N | Dell XPS 17 9720 RTX 3060 GeForce RTX 3060 Laptop GPU, i7-12700H, Samsung PM9A1 MZVL21T0HCLR | LG Gram 17 (2023) Iris Xe G7 96EUs, i7-1360P, Samsung PM9A1 MZVL21T0HCLR | HP Envy 17-cr0079ng GeForce RTX 2050 Mobile, i7-1255U, Samsung PM991a MZVLQ1T0HBLB | MSI Creator Z17 A12UGST-054 GeForce RTX 3070 Ti Laptop GPU, i9-12900H, Micron 3400 1TB MTFDKBA1T0TFH | Apple MacBook Pro 16 2023 M2 Max M2 Max 38-Core GPU, M2 Max, Apple SSD AP2048Z | |
|---|---|---|---|---|---|---|
| Noise | -4% | -11% | -16% | -28% | 4% | |
| av / miljö * (dB) | 22.7 | 23.8 -5% | 25.2 -11% | 26.5 -17% | 26 -15% | 23.9 -5% |
| Idle Minimum * (dB) | 22.8 | 24.1 -6% | 25.2 -11% | 28.5 -25% | 31.8 -39% | 23.9 -5% |
| Idle Average * (dB) | 22.8 | 24.1 -6% | 25.7 -13% | 28.5 -25% | 31.8 -39% | 23.9 -5% |
| Idle Maximum * (dB) | 22.8 | 24.1 -6% | 29.3 -29% | 29.7 -30% | 31.8 -39% | 23.9 -5% |
| Load Average * (dB) | 38.9 | 43.2 -11% | 44.4 -14% | 39.5 -2% | 53.9 -39% | 36.6 6% |
| Witcher 3 ultra * (dB) | 47.4 | 48 -1% | 53.9 -14% | 35.1 26% | ||
| Load Maximum * (dB) | 50.2 | 48 4% | 45.2 10% | 48 4% | 54.9 -9% | 43.2 14% |
* ... mindre är bättre
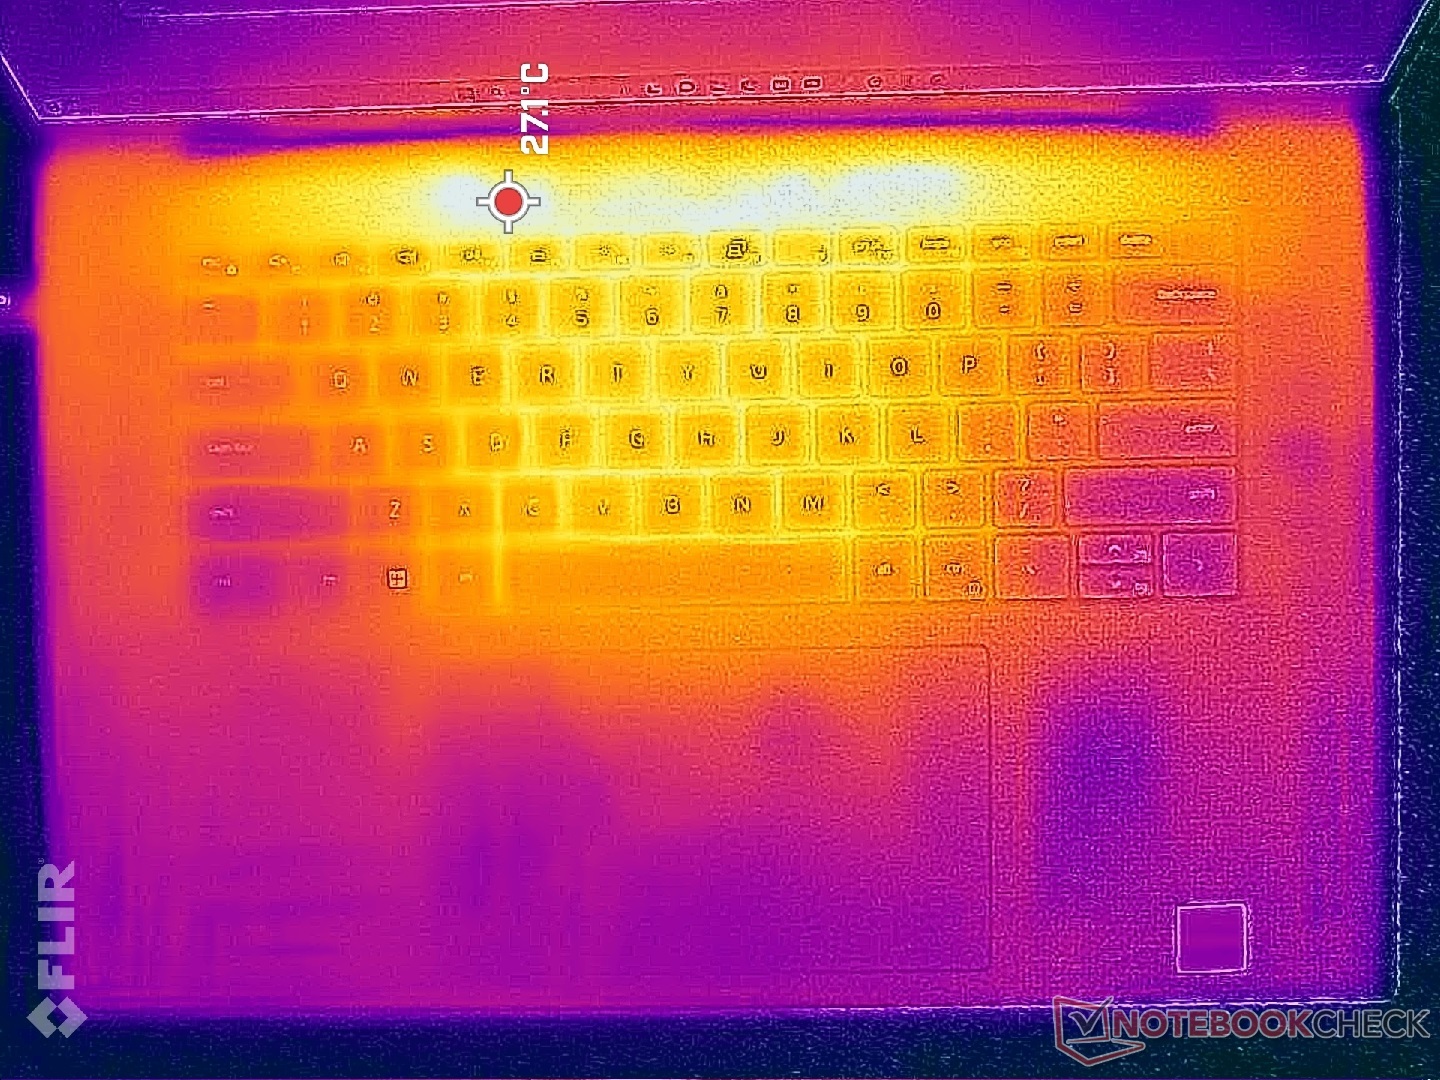
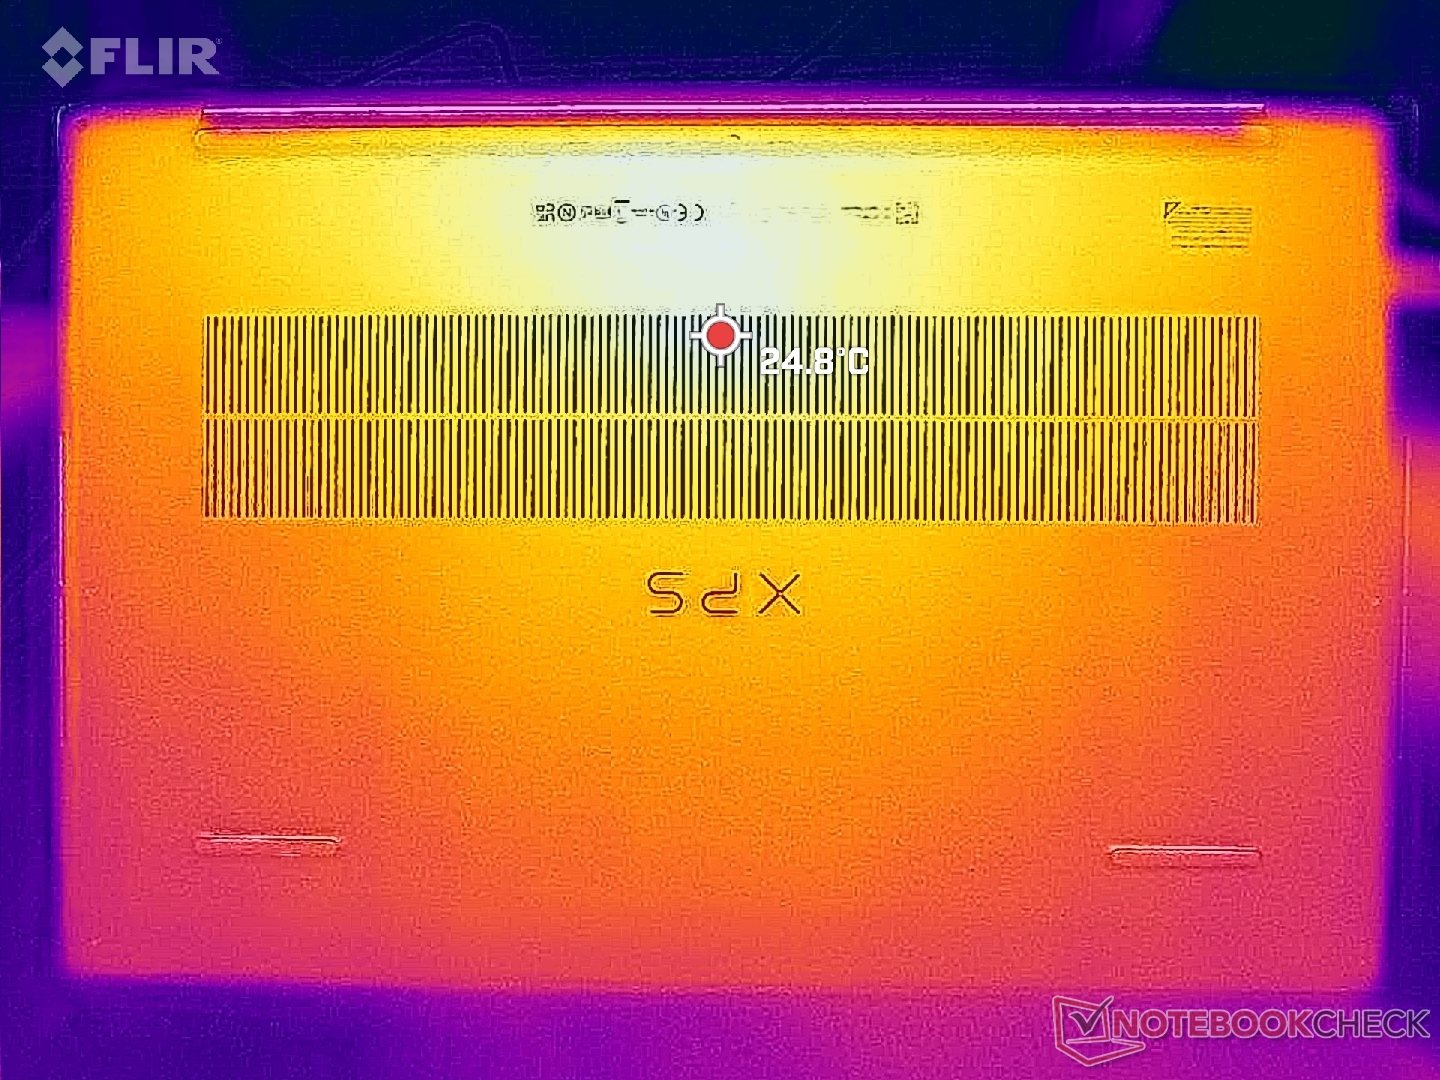
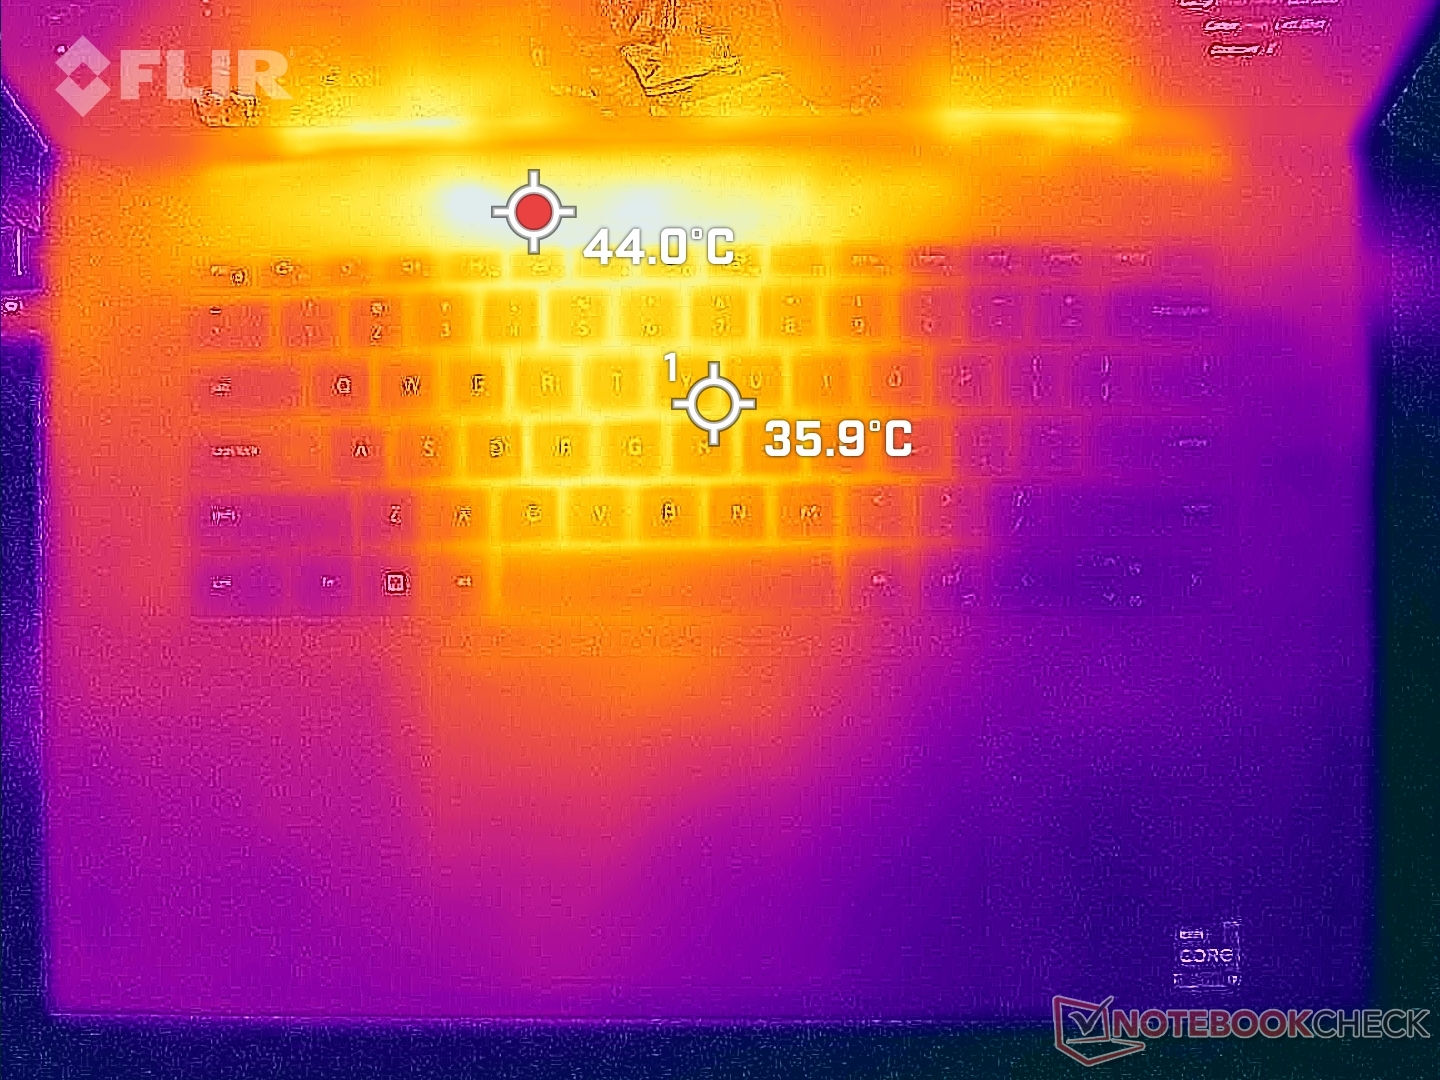
Temperatur
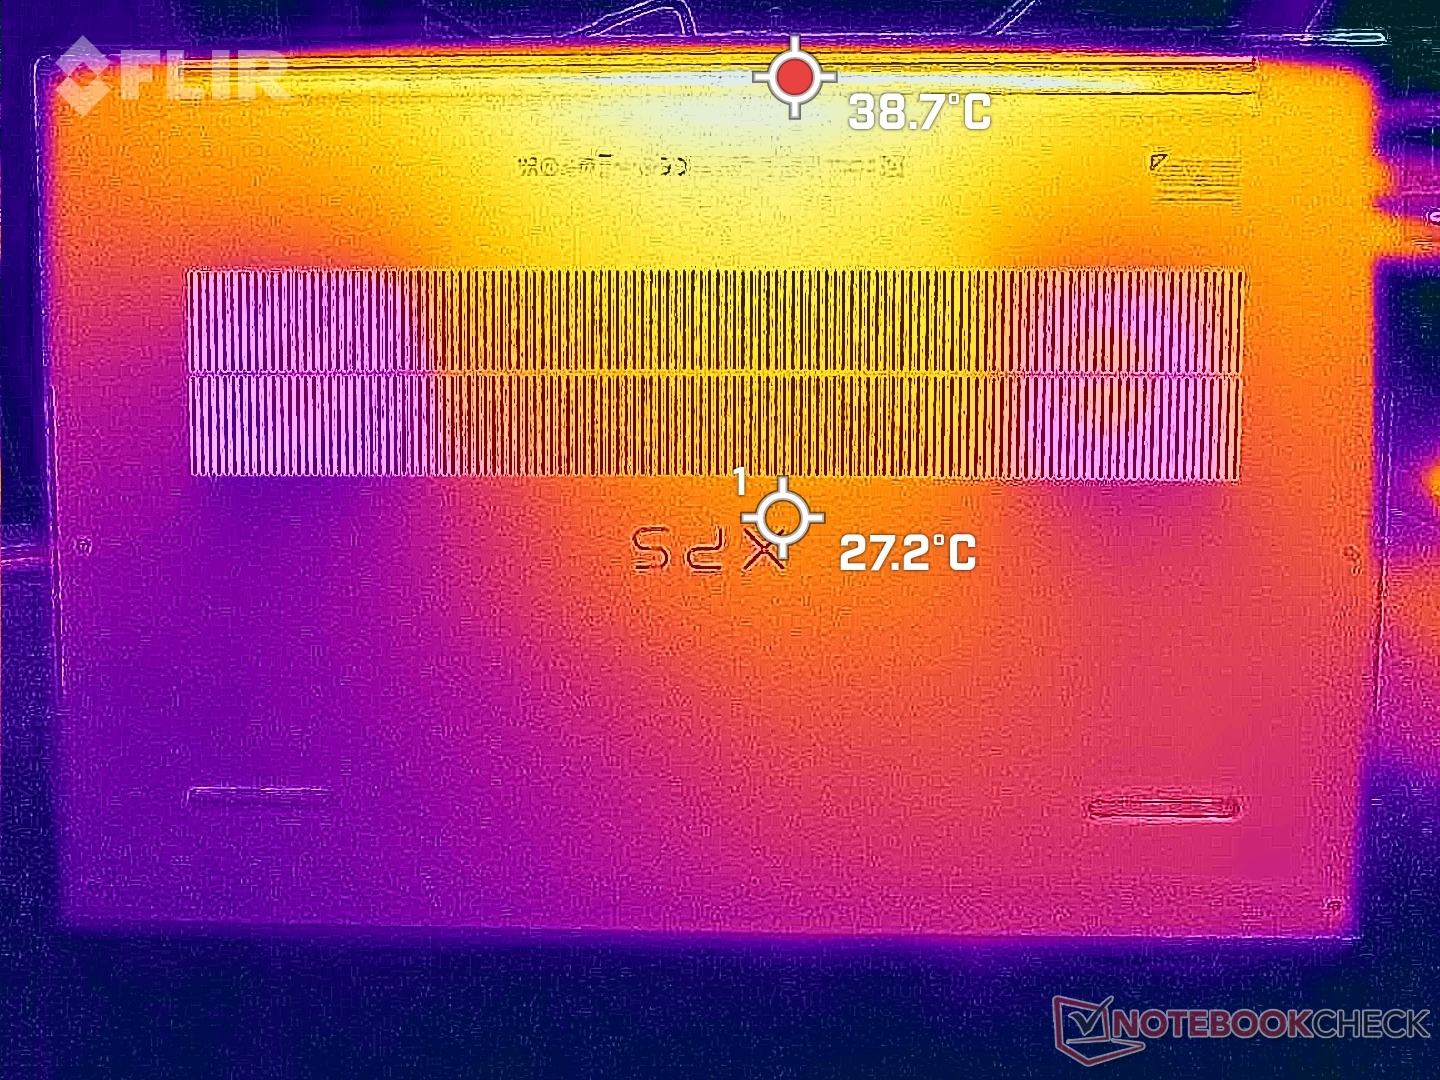
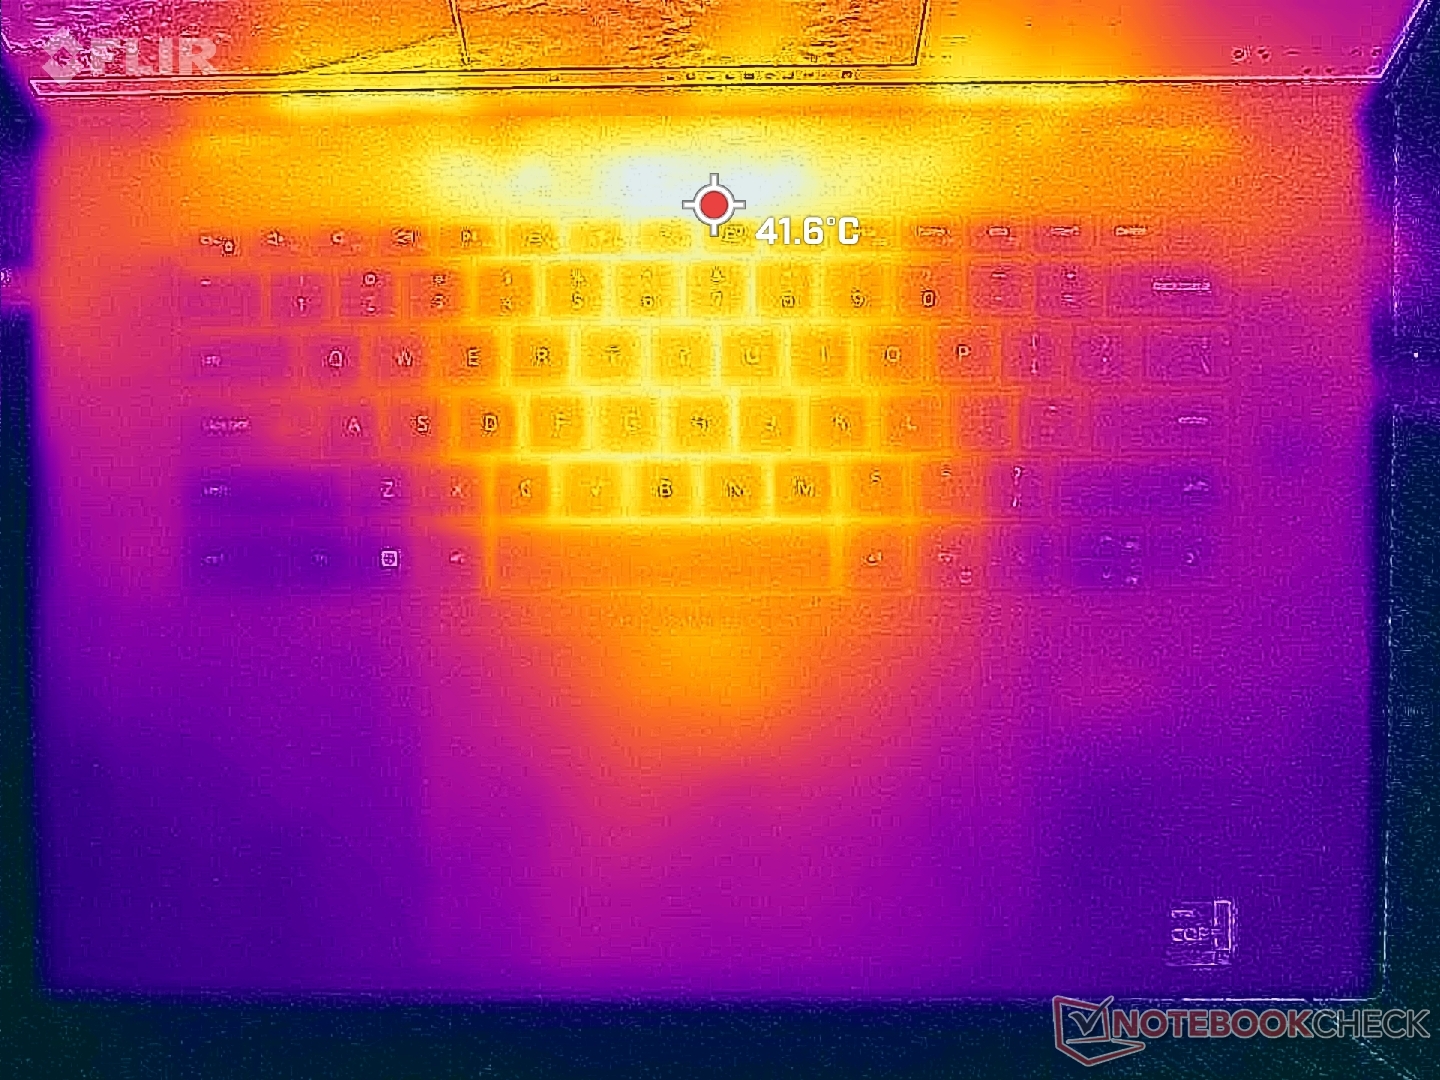
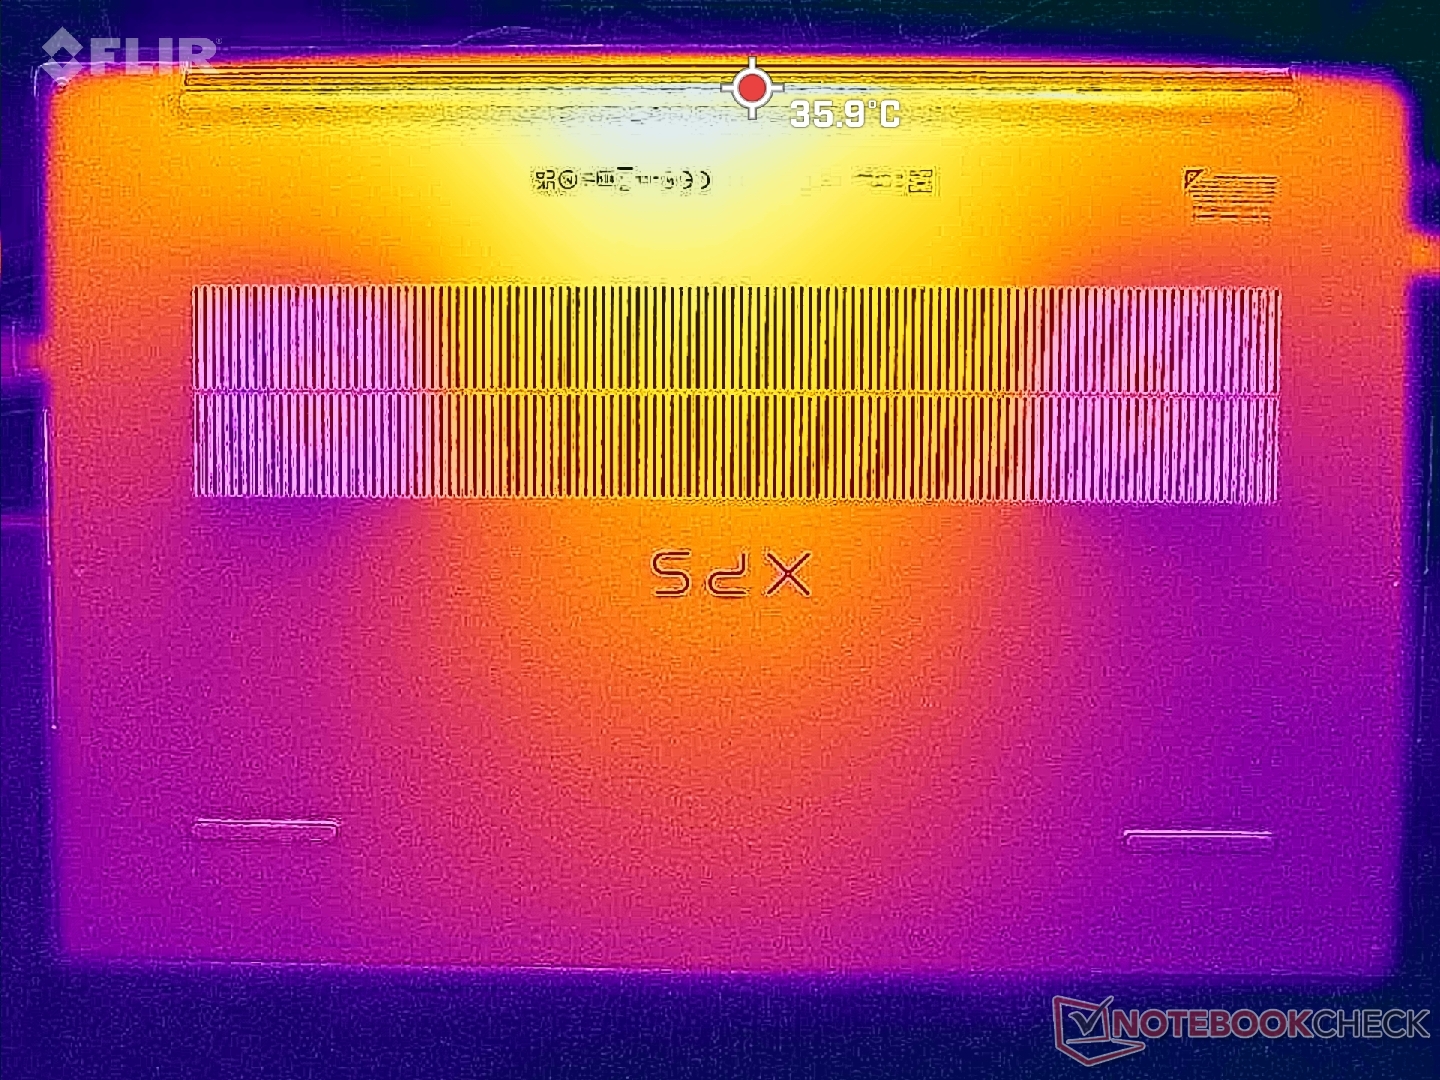
Yttemperaturerna är svalare än förväntat jämfört med andra bärbara datorer som drivs av liknande Core H-seriens processorer och GeForce RTX GPU:er. De konkurrerandeMSI Creator Z17skulle till exempel ha hot spots så varma som 60+ C medan vår Dell bara skulle ligga på 43 C när den körde liknande tunga belastningar. De lägre yttemperaturerna på Dell kan tillskrivas ångkammarkylaren, GORE värmeisolering och generellt lägre strömförbrukning.
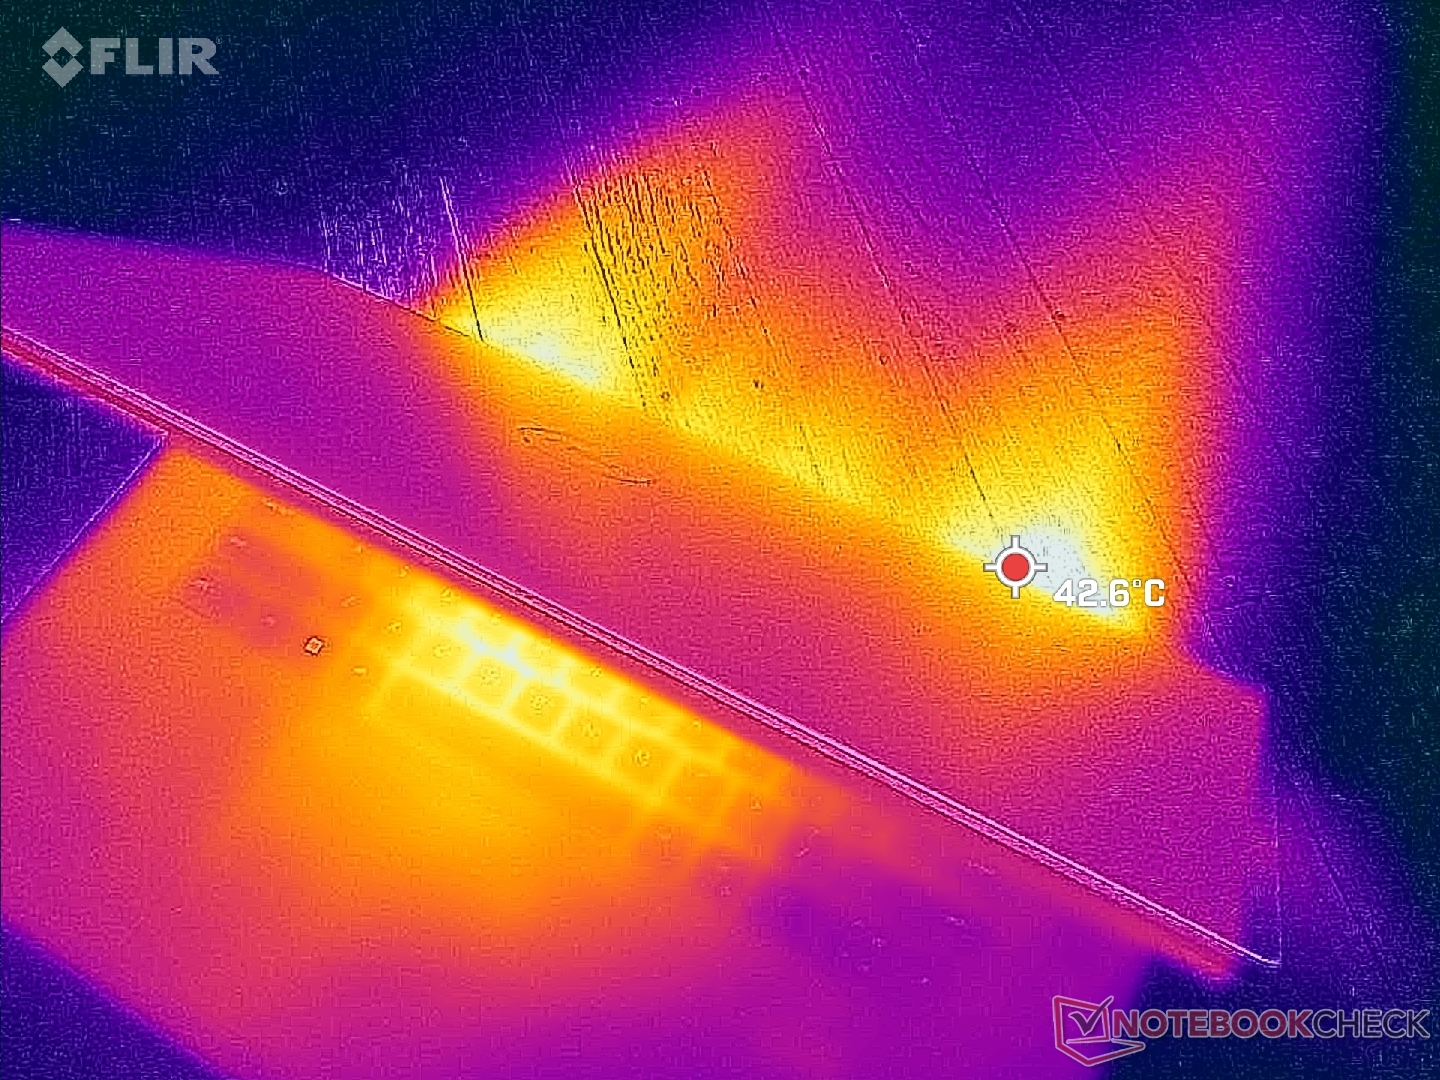
(±) Den maximala temperaturen på ovansidan är 43.2 °C / 110 F, jämfört med genomsnittet av 36.8 °C / 98 F , allt från 21 till 71 °C för klassen Multimedia.
(+) Botten värms upp till maximalt 31.8 °C / 89 F, jämfört med genomsnittet av 39.1 °C / 102 F
(+) Vid tomgångsbruk är medeltemperaturen för ovansidan 28.2 °C / 83 F, jämfört med enhetsgenomsnittet på 31.3 °C / ### class_avg_f### F.
(±) När du spelar The Witcher 3 är medeltemperaturen för ovansidan 33.7 °C / 93 F, jämfört med enhetsgenomsnittet på 31.3 °C / ## #class_avg_f### F.
(+) Handledsstöden och pekplattan är kallare än hudtemperaturen med maximalt 31 °C / 87.8 F och är därför svala att ta på.
(-) Medeltemperaturen för handledsstödsområdet på liknande enheter var 28.7 °C / 83.7 F (-2.3 °C / -4.1 F).
| Dell XPS 17 9730 RTX 4070 Intel Core i7-13700H, NVIDIA GeForce RTX 4070 Laptop GPU | Dell XPS 17 9720 RTX 3060 Intel Core i7-12700H, NVIDIA GeForce RTX 3060 Laptop GPU | LG Gram 17 (2023) Intel Core i7-1360P, Intel Iris Xe Graphics G7 96EUs | HP Envy 17-cr0079ng Intel Core i7-1255U, NVIDIA GeForce RTX 2050 Mobile | MSI Creator Z17 A12UGST-054 Intel Core i9-12900H, NVIDIA GeForce RTX 3070 Ti Laptop GPU | Apple MacBook Pro 16 2023 M2 Max Apple M2 Max, Apple M2 Max 38-Core GPU | |
|---|---|---|---|---|---|---|
| Heat | -19% | -7% | -3% | -37% | 5% | |
| Maximum Upper Side * (°C) | 43.2 | 51.8 -20% | 43.9 -2% | 47.1 -9% | 63.9 -48% | 44.2 -2% |
| Maximum Bottom * (°C) | 31.8 | 44.2 -39% | 45.5 -43% | 43.8 -38% | 68 -114% | 42.9 -35% |
| Idle Upper Side * (°C) | 32.8 | 34.8 -6% | 28.4 13% | 25.2 23% | 28.3 14% | 22.4 32% |
| Idle Bottom * (°C) | 29.8 | 33.2 -11% | 28.2 5% | 25.9 13% | 30.2 -1% | 22.3 25% |
* ... mindre är bättre
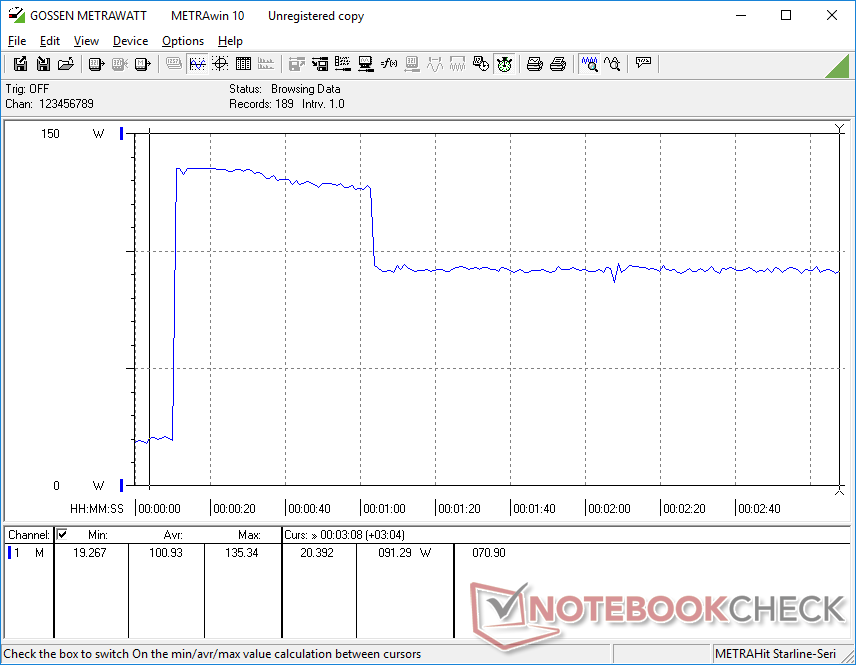
Stresstest
När Prime95 kördes för att stressa processorn, steg klockfrekvensen och paketeffekten till 4,1 GHz respektive 122 W, vilket varade i bara några sekunder. Processorn skulle sedan stadigt sjunka till 3,4 GHz och 80 W och sedan slutligen till 2,6 GHz och 55 W några korta minuter senare. Den slutliga stabila strömförbrukningen på 55 W matchar vad vi observerade på förra årets XPS 19 9720 vilket skulle förklara deras liknande processorprestanda efter att ha tagit hänsyn till strypning som nämnts ovan. Kärntemperaturen skulle vara mycket hög vid 95 C till 100 C under de första minuterna av testet när Turbo Boost är mest aktiv innan den faller och stabiliseras vid 74 C.
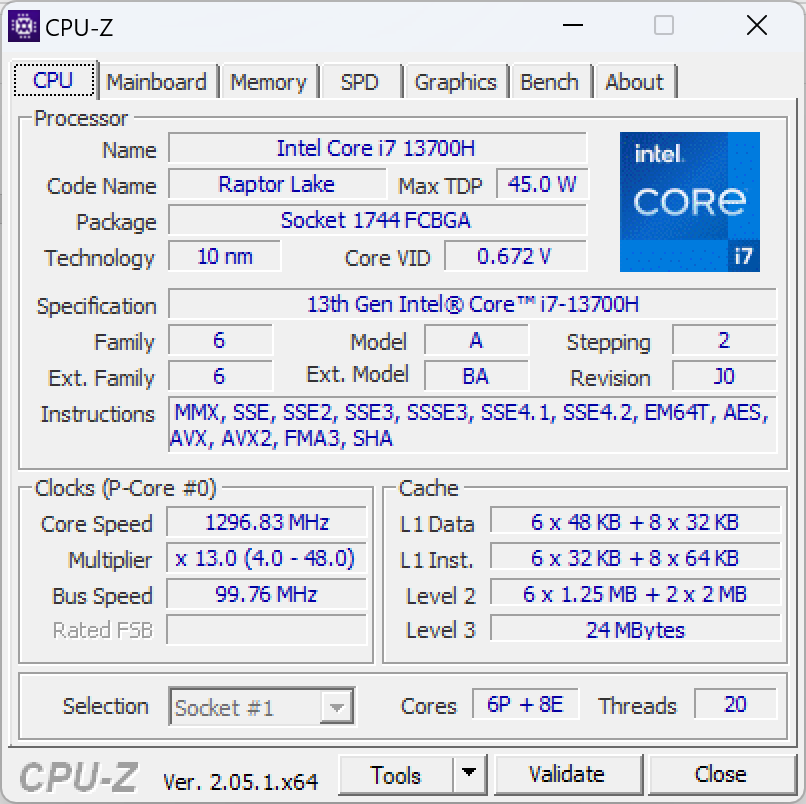
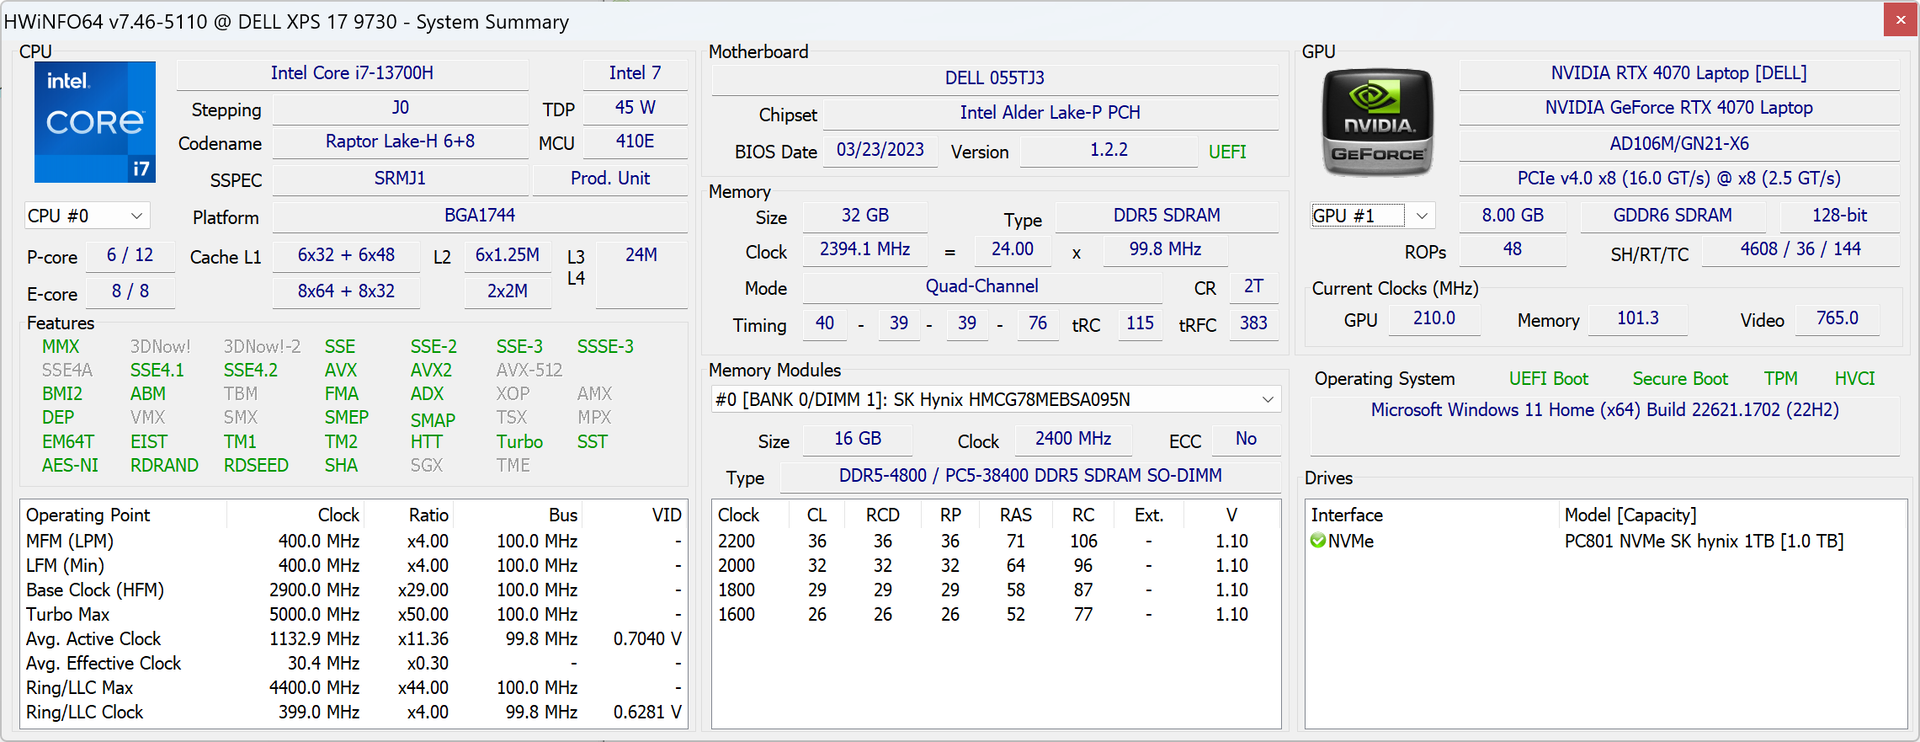
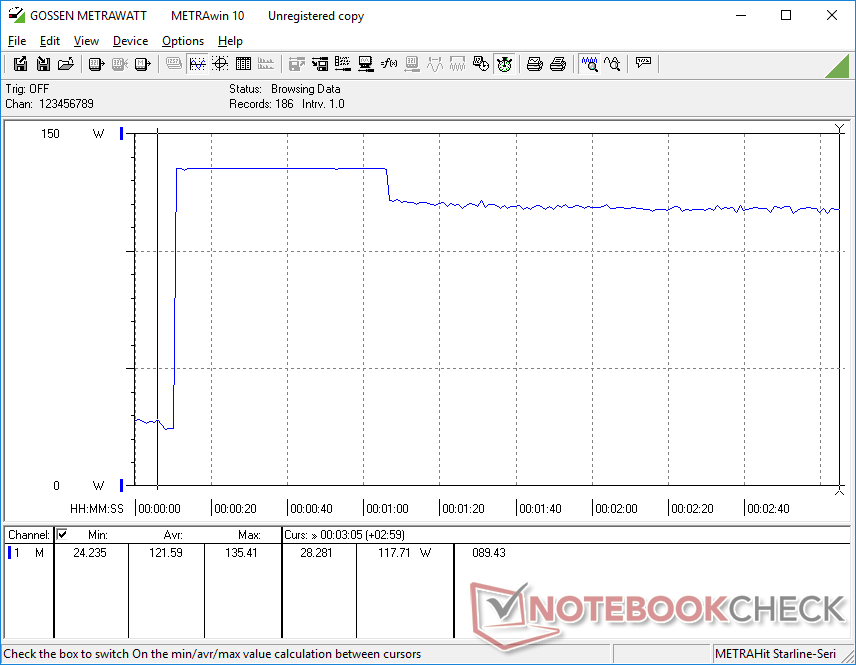
GPU-klockfrekvenser och temperatur under körning Witcher 3 skulle stabiliseras vid 2115 MHz respektive 67 C, varav den senare matchar vad vi observerade på förra årets RTX 3060-drivna XPS 17 9720. Intressant nog skulle GPU-Z rapportera en lägre strömförbrukning på 52 W medan HWiNFO skulle rapportera 70 W, vilket visas i vår skärmdump nedan. Båda värdena verkar dock vara stabila.
Att köra på batteri begränsar prestandan. Ett Fire Strike -test på batterier skulle ge fysik- och grafikresultat på 24847 respektive 21172 poäng, jämfört med 27094 och 24612 poäng vid nätdrift.
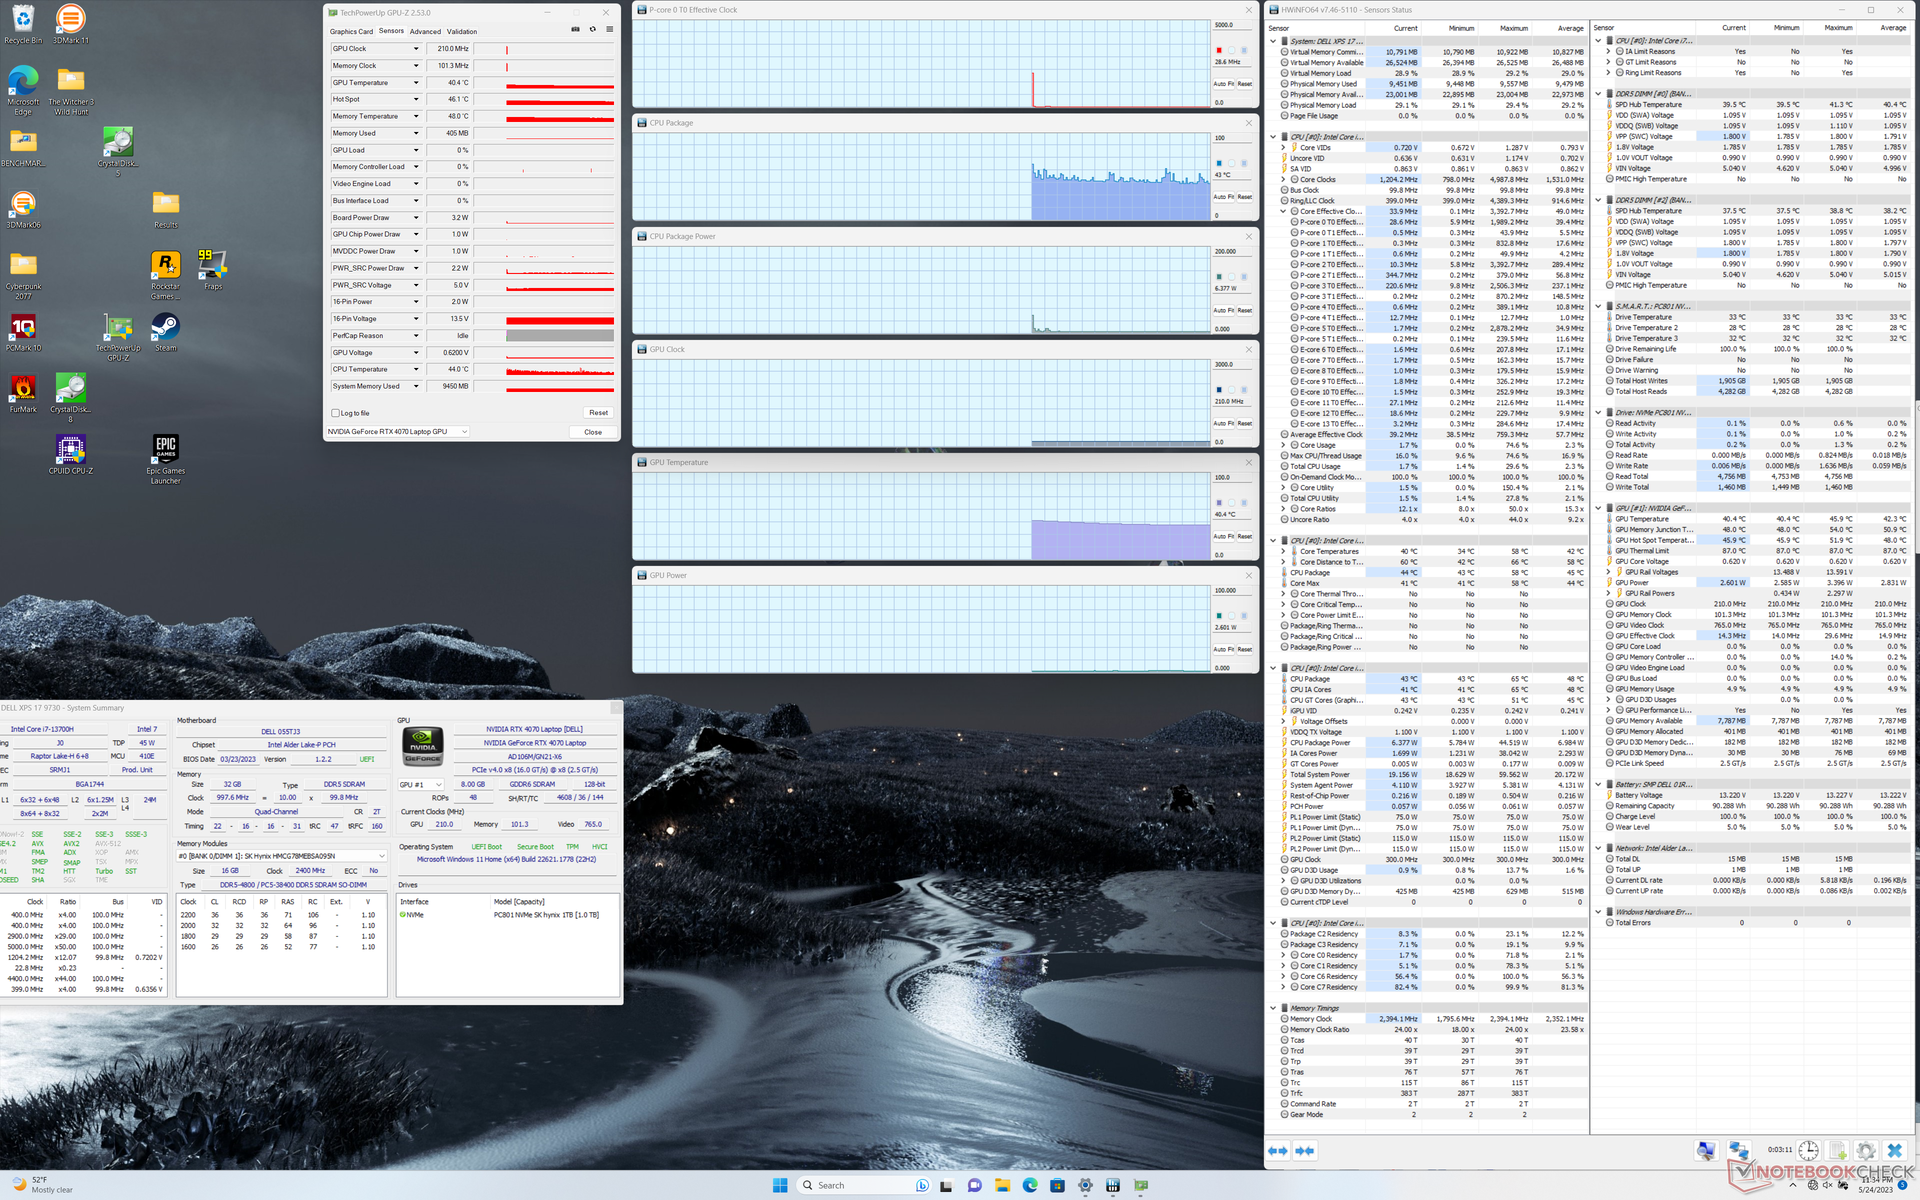
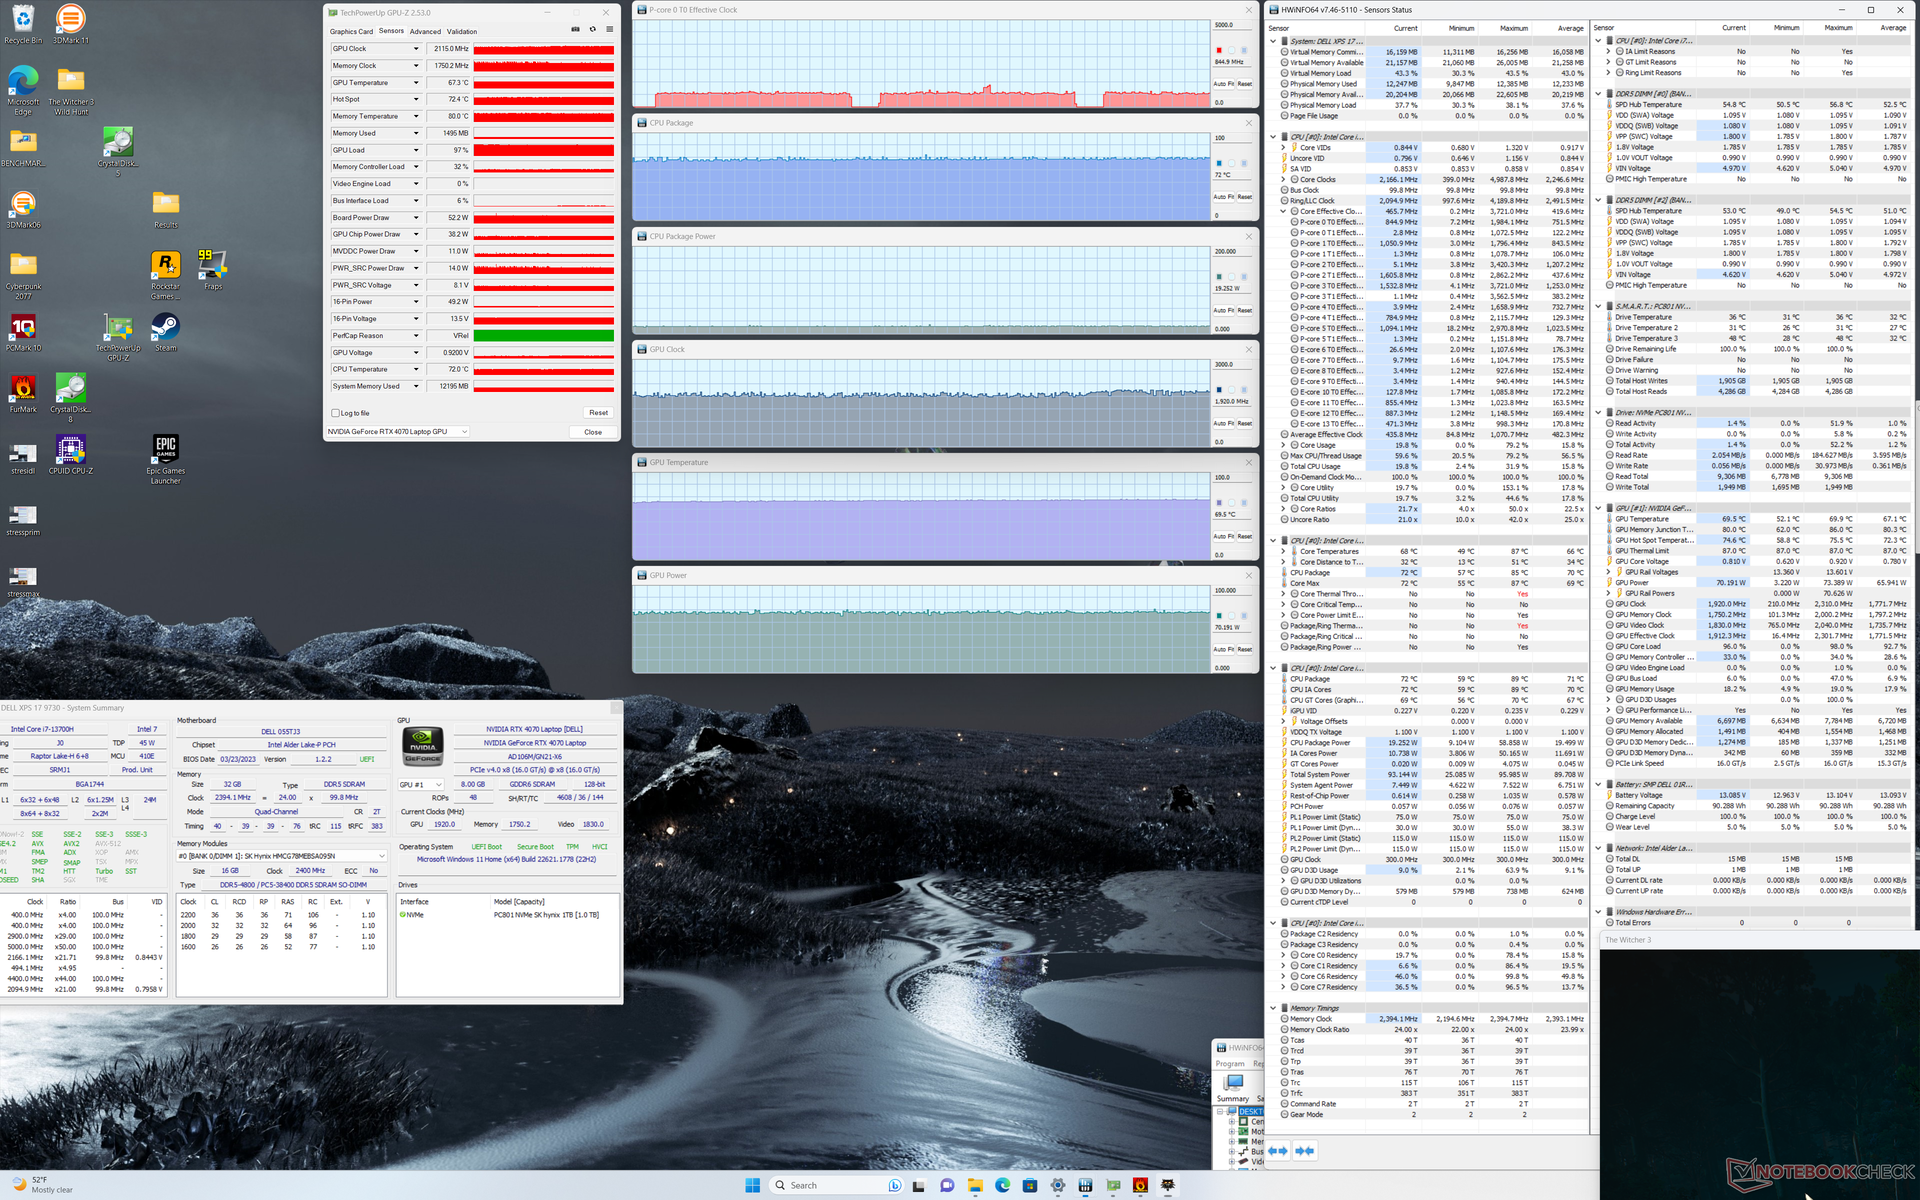
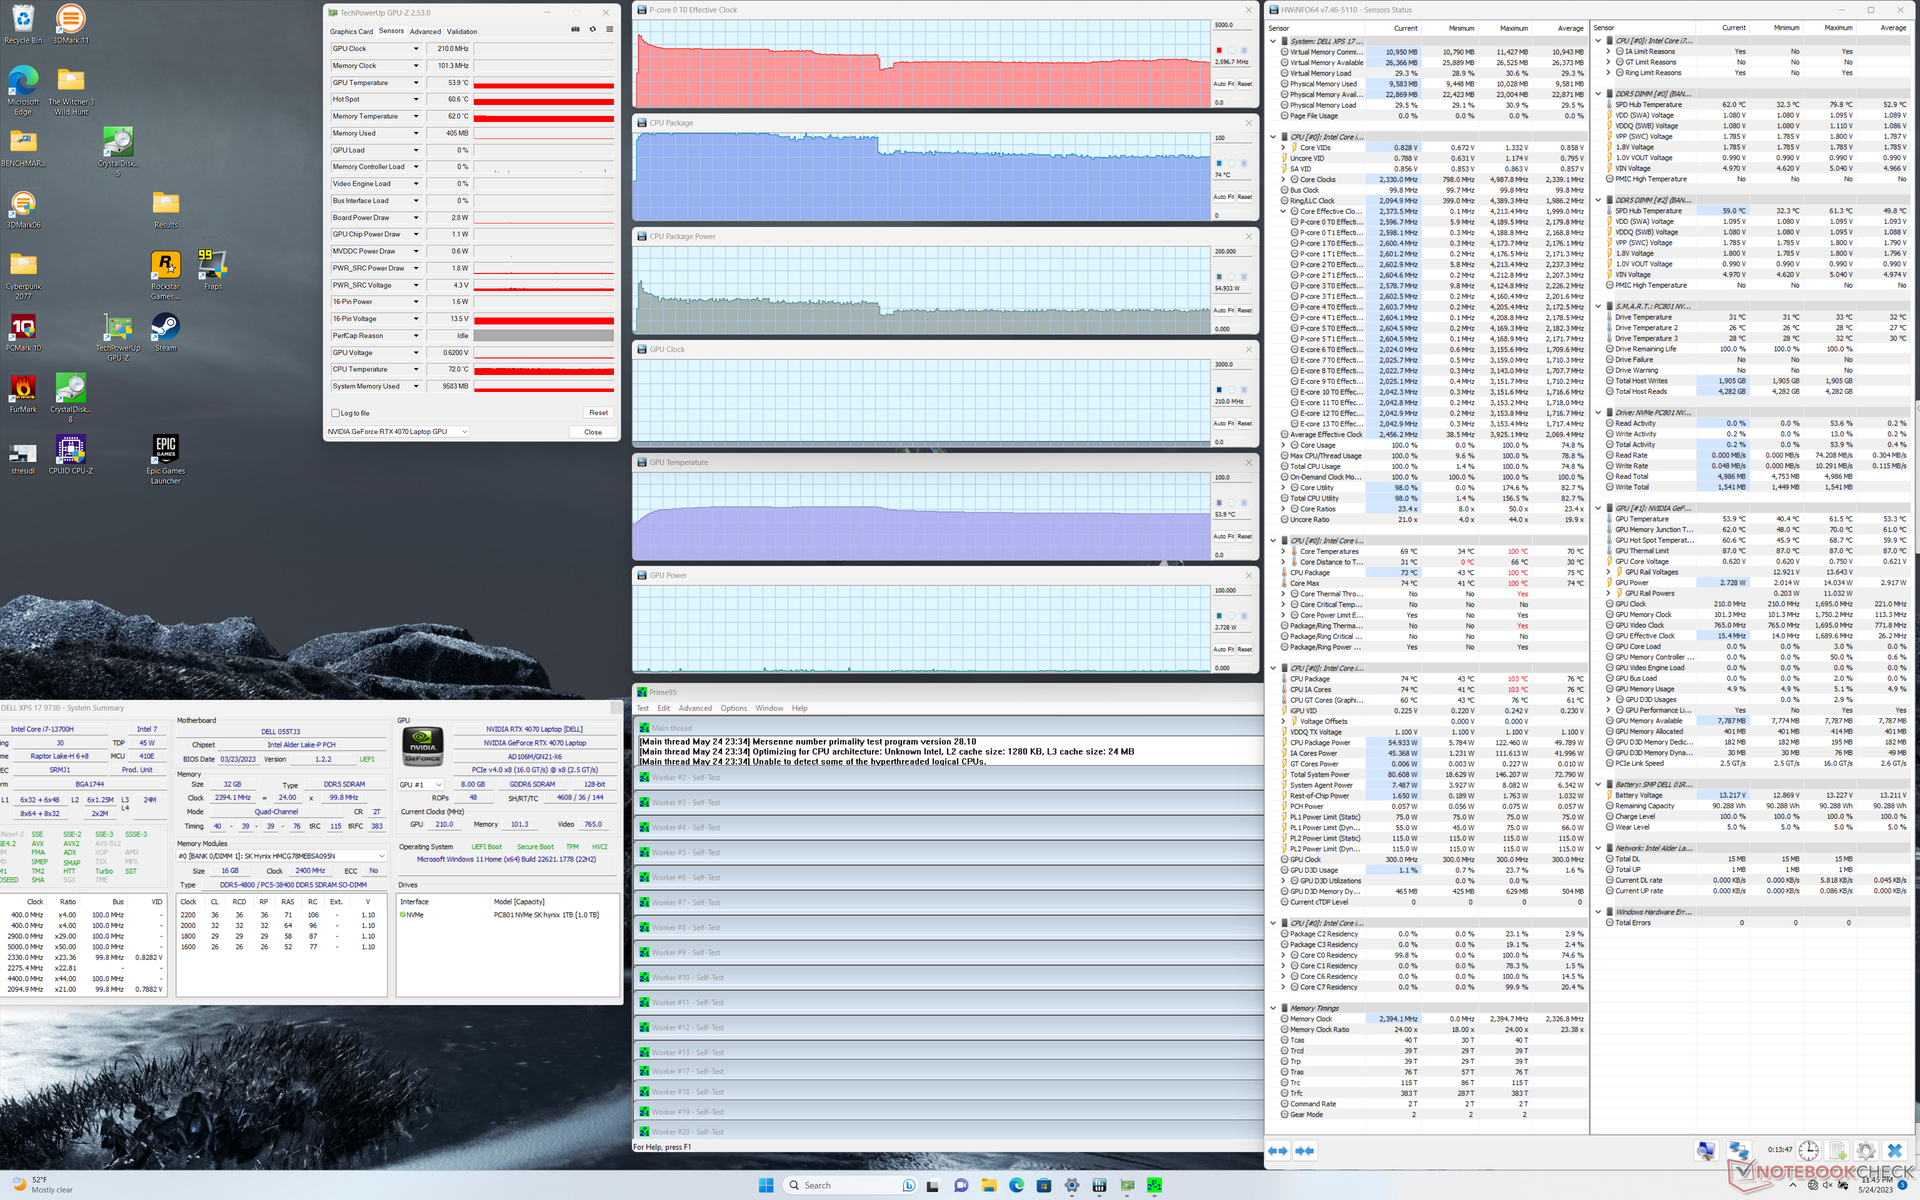
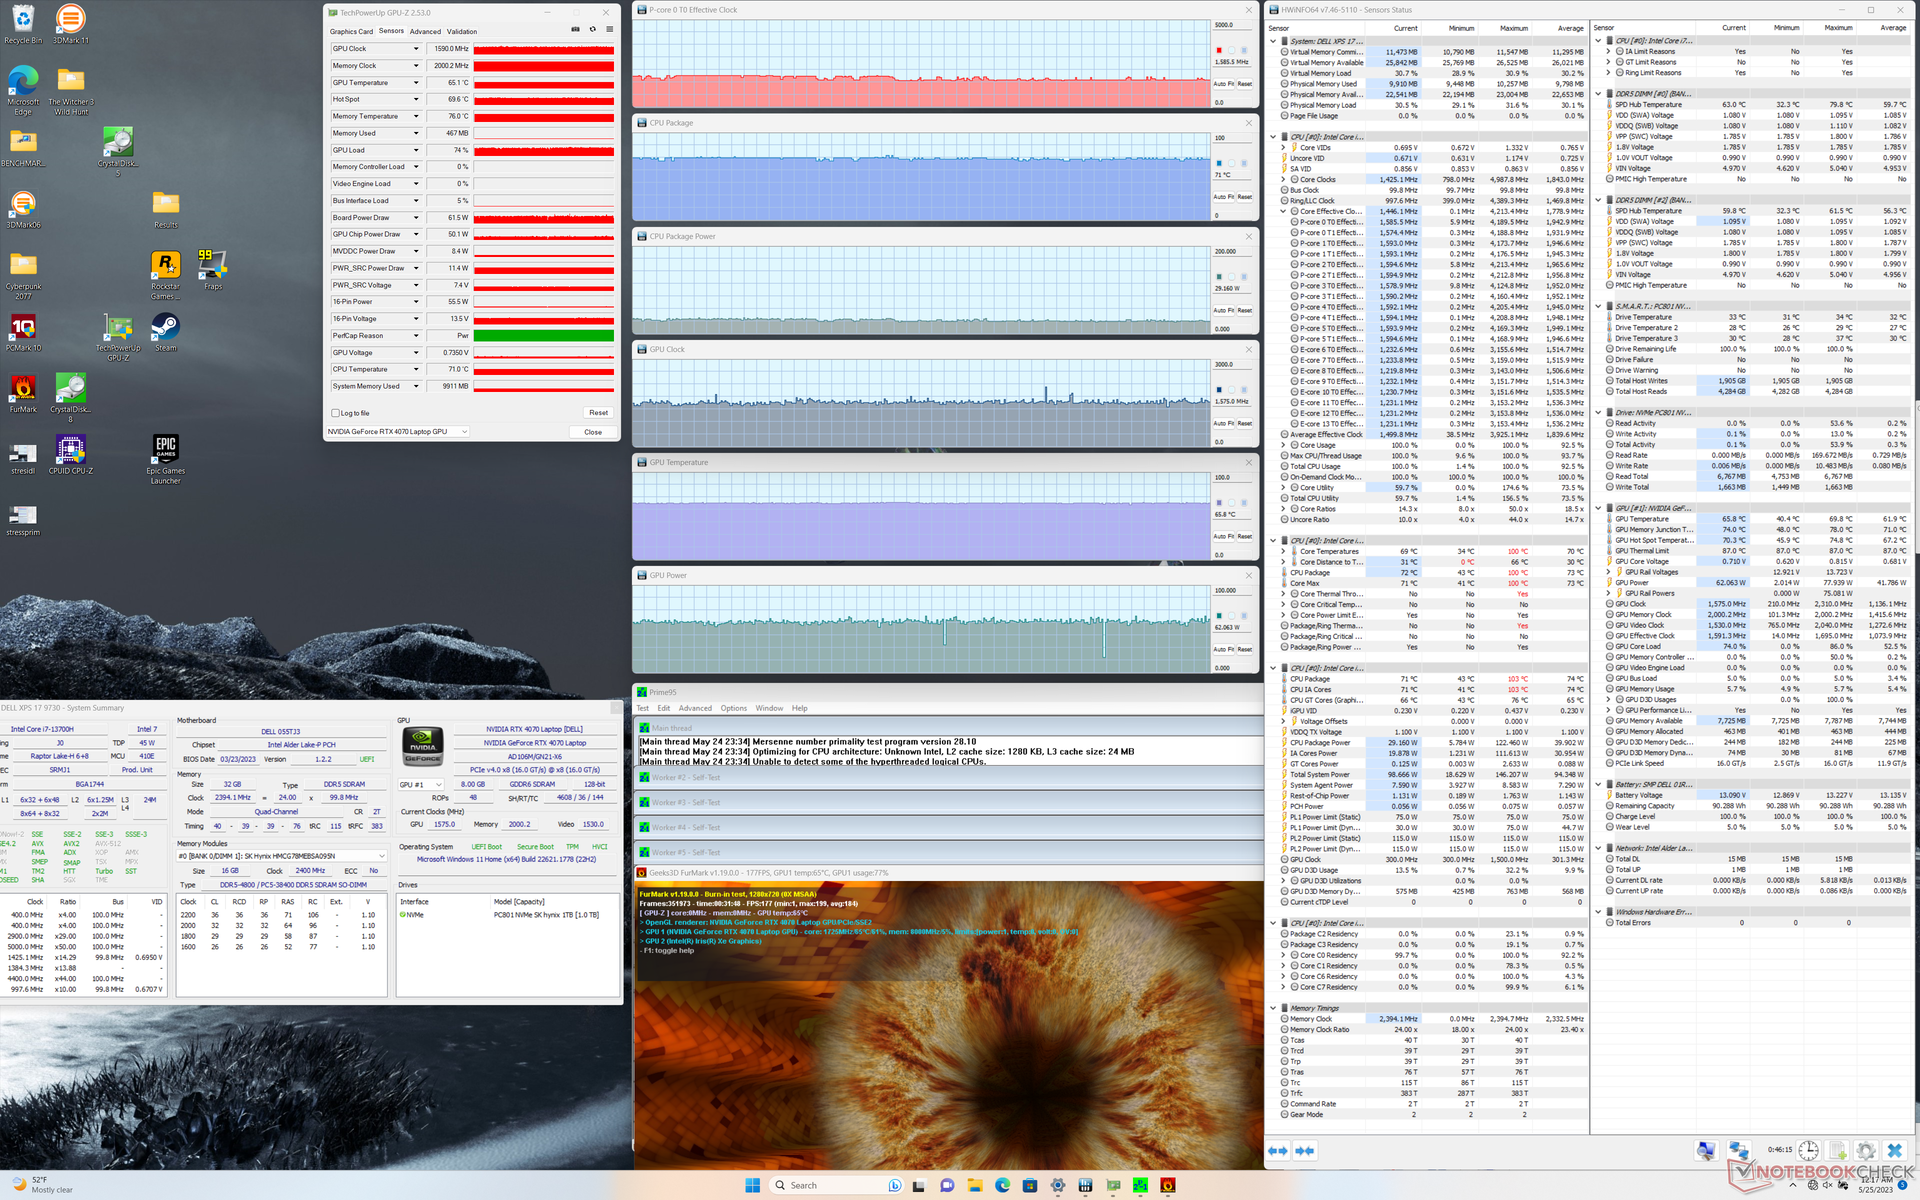
| CPU-klocka (GHz) | GPU-klocka (MHz) | Genomsnittlig CPU-temperatur (°C) | Genomsnittlig GPU-temperatur (°C) | |
| System i viloläge | -- | -- | 43 | 40 |
| Prime95 Stress | 2.6 | -- | 74 | 54 |
| Prime95 + FurMark Stress | 1,6 | 1590 | 71 | 65 |
| Witcher 3 Stress | 0,8 | 2115 | 72 | 67 |
Högtalare
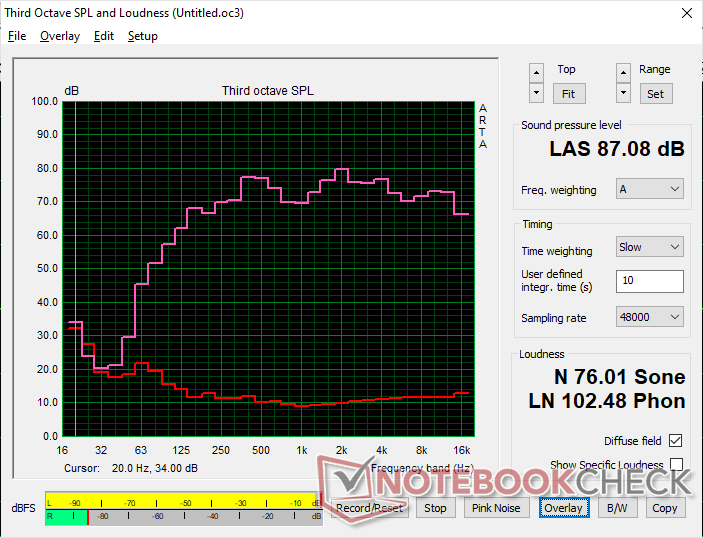
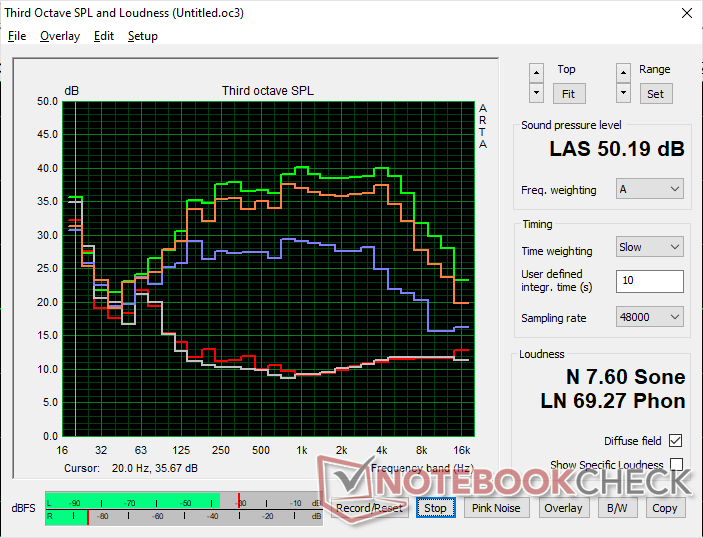
Dell XPS 17 9730 RTX 4070 ljudanalys
(+) | högtalare kan spela relativt högt (87.1 dB)
Bas 100 - 315 Hz
(±) | reducerad bas - i genomsnitt 7.2% lägre än medianen
(+) | basen är linjär (5.9% delta till föregående frekvens)
Mellan 400 - 2000 Hz
(+) | balanserad mellan - endast 3.3% från medianen
(+) | mids är linjära (5.1% delta till föregående frekvens)
Högsta 2 - 16 kHz
(+) | balanserade toppar - endast 1.9% från medianen
(+) | toppar är linjära (3.4% delta till föregående frekvens)
Totalt 100 - 16 000 Hz
(+) | det totala ljudet är linjärt (7% skillnad mot median)
Jämfört med samma klass
» 5% av alla testade enheter i den här klassen var bättre, 1% liknande, 94% sämre
» Den bästa hade ett delta på 5%, genomsnittet var 17%, sämst var 45%
Jämfört med alla testade enheter
» 1% av alla testade enheter var bättre, 0% liknande, 99% sämre
» Den bästa hade ett delta på 4%, genomsnittet var 24%, sämst var 134%
Apple MacBook Pro 16 2021 M1 Pro ljudanalys
(+) | högtalare kan spela relativt högt (84.7 dB)
Bas 100 - 315 Hz
(+) | bra bas - bara 3.8% från medianen
(+) | basen är linjär (5.2% delta till föregående frekvens)
Mellan 400 - 2000 Hz
(+) | balanserad mellan - endast 1.3% från medianen
(+) | mids är linjära (2.1% delta till föregående frekvens)
Högsta 2 - 16 kHz
(+) | balanserade toppar - endast 1.9% från medianen
(+) | toppar är linjära (2.7% delta till föregående frekvens)
Totalt 100 - 16 000 Hz
(+) | det totala ljudet är linjärt (4.6% skillnad mot median)
Jämfört med samma klass
» 0% av alla testade enheter i den här klassen var bättre, 0% liknande, 100% sämre
» Den bästa hade ett delta på 5%, genomsnittet var 17%, sämst var 45%
Jämfört med alla testade enheter
» 0% av alla testade enheter var bättre, 0% liknande, 100% sämre
» Den bästa hade ett delta på 4%, genomsnittet var 24%, sämst var 134%
Energihantering - USB-C I arbete
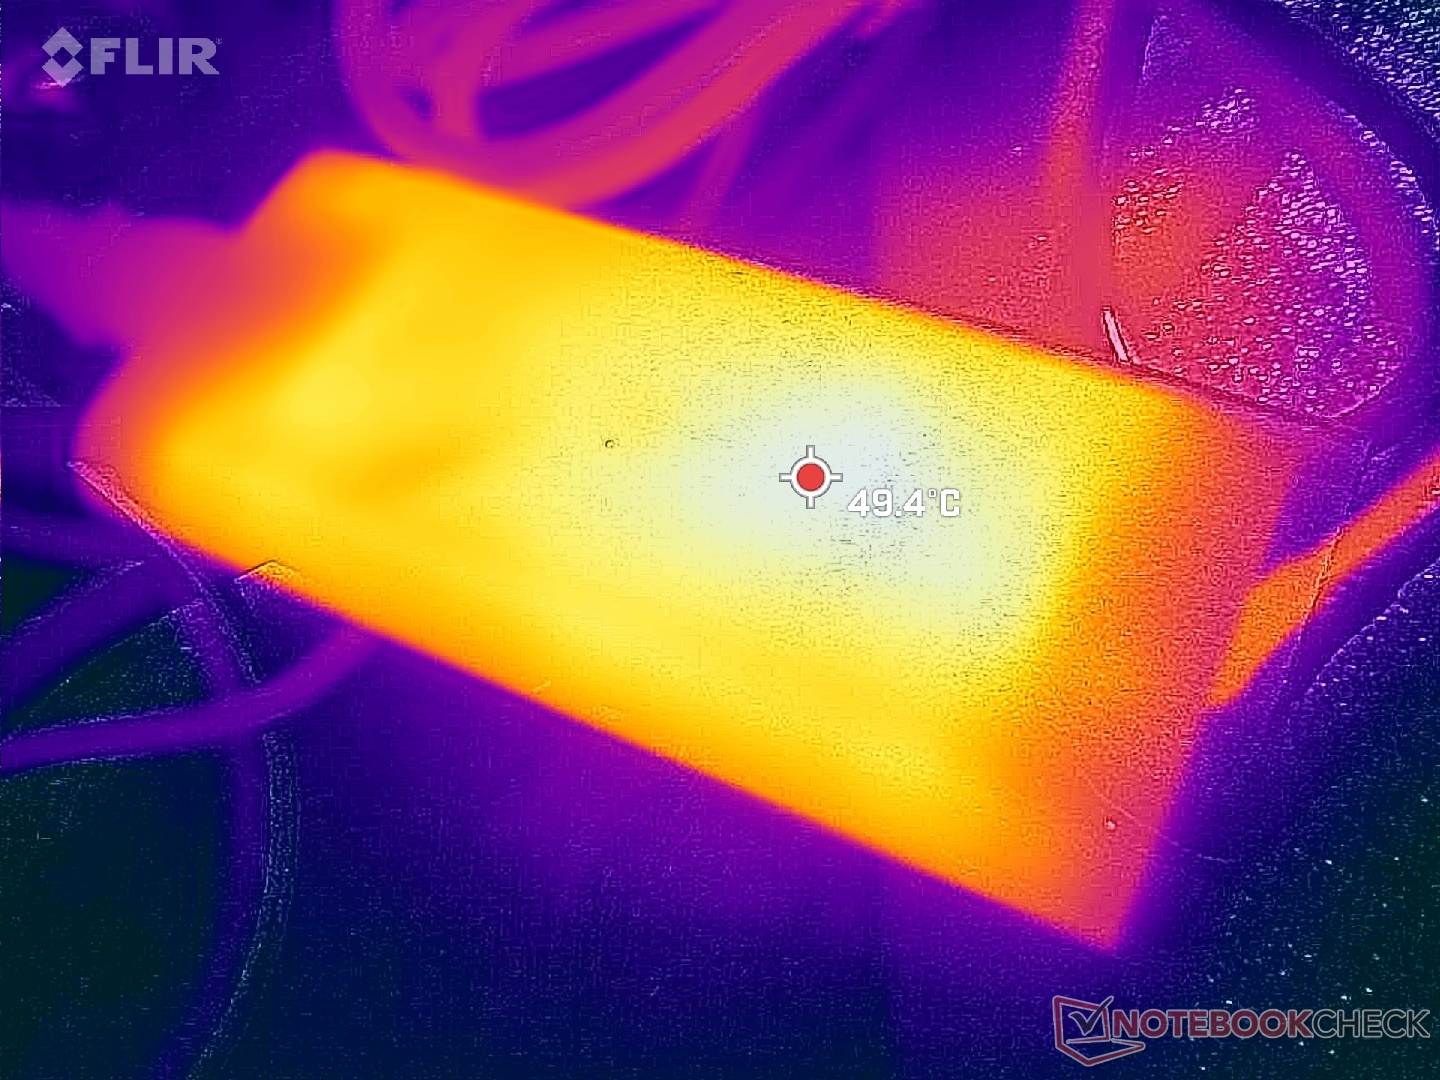
Strömförbrukning - räcker det med 130 W?
Strömförbrukningen har inte förändrats drastiskt från den äldre XPS 17 9720 eftersom alla XPS 17-modeller hittills levereras med samma 130 W USB-C AC-adapter. Jämfört med andra bärbara datorer med H-series-processorer och GeForce RTX GPU:er är Dell-adaptern på 130 W en av de minsta i både storlek och effekt. Den lilla adaptern ger avkall på högre prestanda och snabbare laddning till förmån för portabilitet.
Trots detta gör Ada Lovelaces högre prestanda per watt jämfört med Ampere att XPS 17 9730 fortfarande presterar bättre än förra årets modell när den använder samma strömkälla. Att köra Witcher 3förbrukar till exempel cirka 114 W på både XPS 17 9720 och 9730 trots att den senare erbjuder 30 procent snabbare grafikprestanda. CPU-förbrukningen skulle också vara jämnare med sin längre Turbo Boost-hållbarhet jämfört med Core i7-12700H som nämnts ovan. Dell har definitivt optimerat CPU och GPU så gott de kan för att passa in i den begränsande effektbudgeten.
| Av/Standby | |
| Låg belastning | |
| Hög belastning |
|
Förklaring:
min: | |
| Dell XPS 17 9730 RTX 4070 i7-13700H, GeForce RTX 4070 Laptop GPU, SK hynix PC801 HFS001TEJ9X101N, Sharp LQ170R1, 3840x2400, 17" | Dell XPS 17 9720 RTX 3060 i7-12700H, GeForce RTX 3060 Laptop GPU, Samsung PM9A1 MZVL21T0HCLR, IPS, 3840x2400, 17" | LG Gram 17 (2023) i7-1360P, Iris Xe G7 96EUs, Samsung PM9A1 MZVL21T0HCLR, IPS, 2560x1600, 17" | HP Envy 17-cr0079ng i7-1255U, GeForce RTX 2050 Mobile, Samsung PM991a MZVLQ1T0HBLB, IPS, 3840x2160, 17.3" | MSI Creator Z17 A12UGST-054 i9-12900H, GeForce RTX 3070 Ti Laptop GPU, Micron 3400 1TB MTFDKBA1T0TFH, IPS, 2560x1600, 17" | Apple MacBook Pro 16 2023 M2 Max M2 Max, M2 Max 38-Core GPU, Apple SSD AP2048Z, Mini-LED, 3456x2234, 16.2" | |
|---|---|---|---|---|---|---|
| Power Consumption | 6% | 59% | 34% | -79% | 16% | |
| Idle Minimum * (Watt) | 15 | 5.9 61% | 2.2 85% | 5.8 61% | 34.6 -131% | 5.2 65% |
| Idle Average * (Watt) | 23.6 | 15.8 33% | 8.9 62% | 14.3 39% | 43 -82% | 16.5 30% |
| Idle Maximum * (Watt) | 24.3 | 26.7 -10% | 11 55% | 18.4 24% | 44.9 -85% | 16.8 31% |
| Load Average * (Watt) | 80 | 117.4 -47% | 53 34% | 70 12% | 145 -81% | 113 -41% |
| Witcher 3 ultra * (Watt) | 113.7 | 114.8 -1% | 42.5 63% | 69.4 39% | 152.4 -34% | 92 19% |
| Load Maximum * (Watt) | 135.4 | 136.6 -1% | 64 53% | 93 31% | 220 -62% | 145 -7% |
* ... mindre är bättre
Power Consumption Witcher 3 / Stresstest
Power Consumption external Monitor
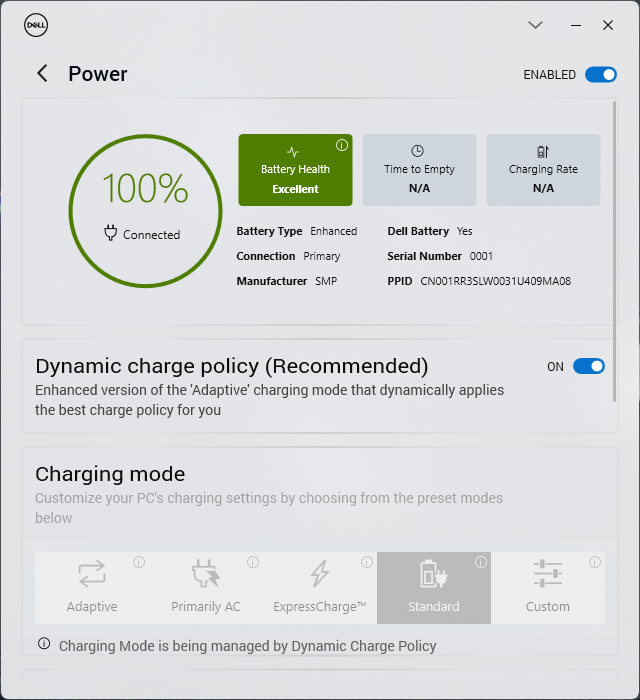
Batteritid - lång livslängd, långsam laddning
WLAN-körtiden är ungefär en timme längre än på förra årets XPS 17 9720 för totalt 10 timmars verklig surfanvändning. Det är bra att se att batteritiden inte har tagit skada trots de årliga ökningarna av den övergripande prestandan.
Laddning från tom till full kapacitet tar cirka 2 till 2,5 timmar jämfört med 1,5 timmar för de flesta andra bärbara datorer. Tänk på att laddningen skulle gå ännu långsammare om du kör krävande belastningar som spel på grund av den begränsade 130 W AC-adaptern.
Det är värt att notera att batteriet inte laddas ur långsamt när det är anslutet till elnätet och spel eller andra krävande belastningar körs. Detta problem var specifikt för den ursprungliga XPS 9700 och det löstes från och med XPS 17 9710.
| Dell XPS 17 9730 RTX 4070 i7-13700H, GeForce RTX 4070 Laptop GPU, 97 Wh | Dell XPS 17 9720 RTX 3060 i7-12700H, GeForce RTX 3060 Laptop GPU, 97 Wh | LG Gram 17 (2023) i7-1360P, Iris Xe G7 96EUs, 80 Wh | HP Envy 17-cr0079ng i7-1255U, GeForce RTX 2050 Mobile, 55 Wh | MSI Creator Z17 A12UGST-054 i9-12900H, GeForce RTX 3070 Ti Laptop GPU, 90 Wh | Apple MacBook Pro 16 2023 M2 Max M2 Max, M2 Max 38-Core GPU, 99.6 Wh | |
|---|---|---|---|---|---|---|
| Batteridrifttid | -11% | 63% | -4% | 28% | 24% | |
| Reader / Idle (h) | 19.1 | 25.7 35% | ||||
| WiFi v1.3 (h) | 10 | 8.7 -13% | 12.8 28% | 4.7 -53% | 5.5 -45% | 14.8 48% |
| Load (h) | 1.1 | 1 -9% | 2.5 127% | 1.6 45% | 2.2 100% | 1.1 0% |
| H.264 (h) | 14.5 | 5.5 | 5.5 | 18.7 |
För
Emot
Dom - Balanserad och optimerad
Det finns ett talesätt som säger att man inte ska hoppa på en första generationens produkt eller design på grund av potentiella problem eller knäckfrågor som måste lösas. Den ursprungliga XPS 17 9700hade till exempel problem med att batteriet tog slut, problem med bildfrekvensstabiliteten och svag CPU Turbo Boost-prestanda. Efter tre hela år av ständiga optimeringar har den senaste XPS 17 9730 direkt åtgärdat alla dessa brister för att bli en mycket enklare rekommendation. Strömförbrukningen är inte längre ett problem, bildfrekvenserna är stabila och Turbo Boost är mer långvarig och konsekvent.
XPS 17 9730 balanserar hög prestanda med en begränsad 130 W effektbudget mycket bättre än på XPS 15 9530. När den är utrustad med exakt samma Core i7-processor och GeForce RTX 4070 GPU, skulle vår XPS 17 överträffa sitt mindre syskon med 10 till 15 procent respektive 50 till 60 procent. GPU-boosten i synnerhet är enorm helt enkelt på grund av det högre TGP-målet för XPS 17. Om du står och väger mellan XPS 15 och XPS 17 och grafikprestanda är av yttersta vikt, då är XPS 17 den klara vinnaren.
XPS 17 9730 har prestanda, bärbarhet, bildskärm och spelpotential för att tillfredsställa de flesta hem- och kontorsanvändare. Vissa aspekter av den tre år gamla designen börjar dock bli föråldrade.
Nackdelarna med modellen kan inte ignoreras. För en bärbar dator på över 3000 USD är den ynka 1 MP-webbkameran utan sekretesslucka och utan stöd för Wi-Fi 6E pinsamt i den här prisklassen. IPS-skärmen på 60 Hz börjar också bli föråldrad när OLED och paneler med högre uppdateringsfrekvens nu är vanliga. Nätadaptern på 130 W känns mer som en tegelvägg som hindrar XPS 17-serien från att uppnå både snabbare laddningshastigheter och högre TGP-mål. Det finns utan tvekan mycket som kan förbättras, men prestandasidan är åtminstone på en bekväm nivå med tanke på den tunna designen.
Pris och tillgänglighet
XPS 17 9730 är ännu inte allmänt tillgänglig via återförsäljare. För de mest konfigurerbara alternativen och omedelbar leverans rekommenderar vi att du köper direkt från Dell. Priserna börjar på $2450 USD för den lägsta SKU upp till $4300 till $5100 om den är fullt konfigurerad.
Dell XPS 17 9730 RTX 4070
- 05/27/2023 v7 (old)
Allen Ngo
Genomskinlighet
Valet av enheter som ska granskas görs av vår redaktion. Testprovet gavs till författaren som ett lån av tillverkaren eller återförsäljaren för denna recension. Långivaren hade inget inflytande på denna recension och inte heller fick tillverkaren en kopia av denna recension innan publiceringen. Det fanns ingen skyldighet att publicera denna recension. Som ett oberoende medieföretag är Notebookcheck inte föremål för auktoritet från tillverkare, återförsäljare eller förlag.
This is how Notebookcheck is testingEvery year, Notebookcheck independently reviews hundreds of laptops and smartphones using standardized procedures to ensure that all results are comparable. We have continuously developed our test methods for around 20 years and set industry standards in the process. In our test labs, high-quality measuring equipment is utilized by experienced technicians and editors. These tests involve a multi-stage validation process. Our complex rating system is based on hundreds of well-founded measurements and benchmarks, which maintains objectivity.
Price comparison

