Test: Lenovo Legion Y730-15ICH (i5-8300H, GTX 1050 Ti) Laptop (Sammanfattning)
| Networking | |
| iperf3 transmit AX12 | |
| Lenovo Legion Y730-15ICH i5-8300H | |
| Razer Blade 15 Base Model | |
| Dell G7 15-7588 | |
| Lenovo Legion Y530-15ICH | |
| iperf3 receive AX12 | |
| Razer Blade 15 Base Model | |
| Dell G7 15-7588 | |
| Lenovo Legion Y730-15ICH i5-8300H | |
| Lenovo Legion Y530-15ICH | |
| |||||||||||||||||||||||||
Distribution av ljusstyrkan: 84 %
Mitt på batteriet: 286.5 cd/m²
Kontrast: 868:1 (Svärta: 0.33 cd/m²)
ΔE ColorChecker Calman: 6.3 | ∀{0.5-29.43 Ø4.72}
calibrated: 4.17
ΔE Greyscale Calman: 5.6 | ∀{0.09-98 Ø4.97}
85.1% sRGB (Argyll 1.6.3 3D)
55.7% AdobeRGB 1998 (Argyll 1.6.3 3D)
62.5% AdobeRGB 1998 (Argyll 3D)
85.5% sRGB (Argyll 3D)
65.9% Display P3 (Argyll 3D)
Gamma: 2.23
CCT: 6822 K
| Lenovo Legion Y730-15ICH i5-8300H BOE NV156FHM-N61, IPS, 15.6", 1920x1080 | Lenovo Legion Y530-15ICH LG Display LP156WFG-SPB2, IPS, 15.6", 1920x1080 | Dell G7 15-7588 LG Philips LGD053F, IPS, 15.6", 1920x1080 | Razer Blade 15 Base Model BOE NV156FHM-N61, IPS, 15.6", 1920x1080 | Asus FX504GD AU Optronics B156HTN03.8, TN LED, 15.6", 1920x1080 | MSI GF63 8RC AU Optronics B156HAN02.1, IPS, 15.6", 1920x1080 | |
|---|---|---|---|---|---|---|
| Display | 2% | -38% | 1% | -39% | -35% | |
| Display P3 Coverage (%) | 65.9 | 62.5 -5% | 37.82 -43% | 66.3 1% | 37.09 -44% | 39.43 -40% |
| sRGB Coverage (%) | 85.5 | 93 9% | 56.2 -34% | 86.6 1% | 55.8 -35% | 59.3 -31% |
| AdobeRGB 1998 Coverage (%) | 62.5 | 63.8 2% | 39.2 -37% | 63.3 1% | 38.34 -39% | 40.73 -35% |
| Response Times | 69% | 22% | 11% | 33% | 28% | |
| Response Time Grey 50% / Grey 80% * (ms) | 43.2 ? | 15 ? 65% | 38.8 ? 10% | 39.2 ? 9% | 41.6 ? 4% | 33.2 ? 23% |
| Response Time Black / White * (ms) | 40 ? | 11 ? 72% | 26.8 ? 33% | 35.2 ? 12% | 15.2 ? 62% | 27.2 ? 32% |
| PWM Frequency (Hz) | 21740 ? | 21190 ? | ||||
| Screen | 7% | -30% | 15% | -33% | -10% | |
| Brightness middle (cd/m²) | 286.5 | 305 6% | 250.9 -12% | 273.6 -5% | 260 -9% | 266.6 -7% |
| Brightness (cd/m²) | 269 | 284 6% | 246 -9% | 262 -3% | 241 -10% | 257 -4% |
| Brightness Distribution (%) | 84 | 83 -1% | 89 6% | 86 2% | 85 1% | 89 6% |
| Black Level * (cd/m²) | 0.33 | 0.52 -58% | 0.34 -3% | 0.3 9% | 0.55 -67% | 0.29 12% |
| Contrast (:1) | 868 | 587 -32% | 738 -15% | 912 5% | 473 -46% | 919 6% |
| Colorchecker dE 2000 * | 6.3 | 3.63 42% | 7.34 -17% | 3.22 49% | 7 -11% | 5.93 6% |
| Colorchecker dE 2000 max. * | 10.01 | 8.18 18% | 28.66 -186% | 7.61 24% | 22.52 -125% | 16.28 -63% |
| Colorchecker dE 2000 calibrated * | 4.17 | 1.31 69% | 4.42 -6% | 4.1 2% | 5.27 -26% | 3.6 14% |
| Greyscale dE 2000 * | 5.6 | 4.77 15% | 6.8 -21% | 1.4 75% | 6.1 -9% | 6.8 -21% |
| Gamma | 2.23 99% | 2.54 87% | 2.164 102% | 2.24 98% | 1.97 112% | 2.43 91% |
| CCT | 6822 95% | 7500 87% | 6780 96% | 6636 98% | 7894 82% | 7192 90% |
| Color Space (Percent of AdobeRGB 1998) (%) | 55.7 | 59 6% | 36 -35% | 56.4 1% | 35.5 -36% | 37.6 -32% |
| Color Space (Percent of sRGB) (%) | 85.1 | 93 9% | 56 -34% | 86.2 1% | 61 -28% | 59.3 -30% |
| Totalt genomsnitt (program/inställningar) | 26% /
14% | -15% /
-25% | 9% /
12% | -13% /
-26% | -6% /
-10% |
* ... mindre är bättre
Visa svarstider
| ↔ Svarstid svart till vitt | ||
|---|---|---|
| 40 ms ... stiga ↗ och falla ↘ kombinerat | ↗ 21.2 ms stiga | 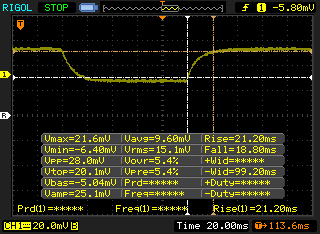 |
| ↘ 18.8 ms hösten | ||
| Skärmen visar långsamma svarsfrekvenser i våra tester och kommer att vara otillfredsställande för spelare. I jämförelse sträcker sig alla testade enheter från 0.1 (minst) till 240 (maximalt) ms. » 97 % av alla enheter är bättre. Detta innebär att den uppmätta svarstiden är sämre än genomsnittet av alla testade enheter (19.8 ms). | ||
| ↔ Svarstid 50 % grått till 80 % grått | ||
| 43.2 ms ... stiga ↗ och falla ↘ kombinerat | ↗ 25.2 ms stiga | 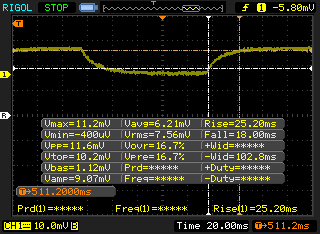 |
| ↘ 18 ms hösten | ||
| Skärmen visar långsamma svarsfrekvenser i våra tester och kommer att vara otillfredsställande för spelare. I jämförelse sträcker sig alla testade enheter från 0.165 (minst) till 636 (maximalt) ms. » 72 % av alla enheter är bättre. Detta innebär att den uppmätta svarstiden är sämre än genomsnittet av alla testade enheter (31 ms). | ||
Skärmflimmer / PWM (Puls-Width Modulation)
| Skärmflimmer / PWM upptäckt | 21740 Hz | ≤ 99 % ljusstyrka inställning | 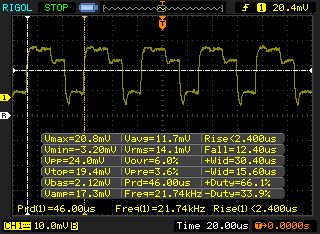 |
Displayens bakgrundsbelysning flimrar vid 21740 Hz (i värsta fall, t.ex. med PWM) Flimrande upptäckt vid en ljusstyrkeinställning på 99 % och lägre. Det ska inte finnas något flimmer eller PWM över denna ljusstyrkeinställning. Frekvensen för 21740 Hz är ganska hög, så de flesta användare som är känsliga för PWM bör inte märka något flimmer. Som jämförelse: 52 % av alla testade enheter använder inte PWM för att dämpa skärmen. Om PWM upptäcktes mättes ett medelvärde av 7763 (minst: 5 - maximum: 343500) Hz. | |||
| wPrime 2.10 - 1024m | |
| Genomsnitt Intel Core i5-8300H (206 - 286, n=4) | |
| Asus FX504GD | |
| HP Omen X 17-ap0xx | |
| Eurocom Sky X4C | |
* ... mindre är bättre
| PCMark 8 Home Score Accelerated v2 | 3931 poäng | |
| PCMark 8 Work Score Accelerated v2 | 5208 poäng | |
| PCMark 10 Score | 4527 poäng | |
Hjälp | ||
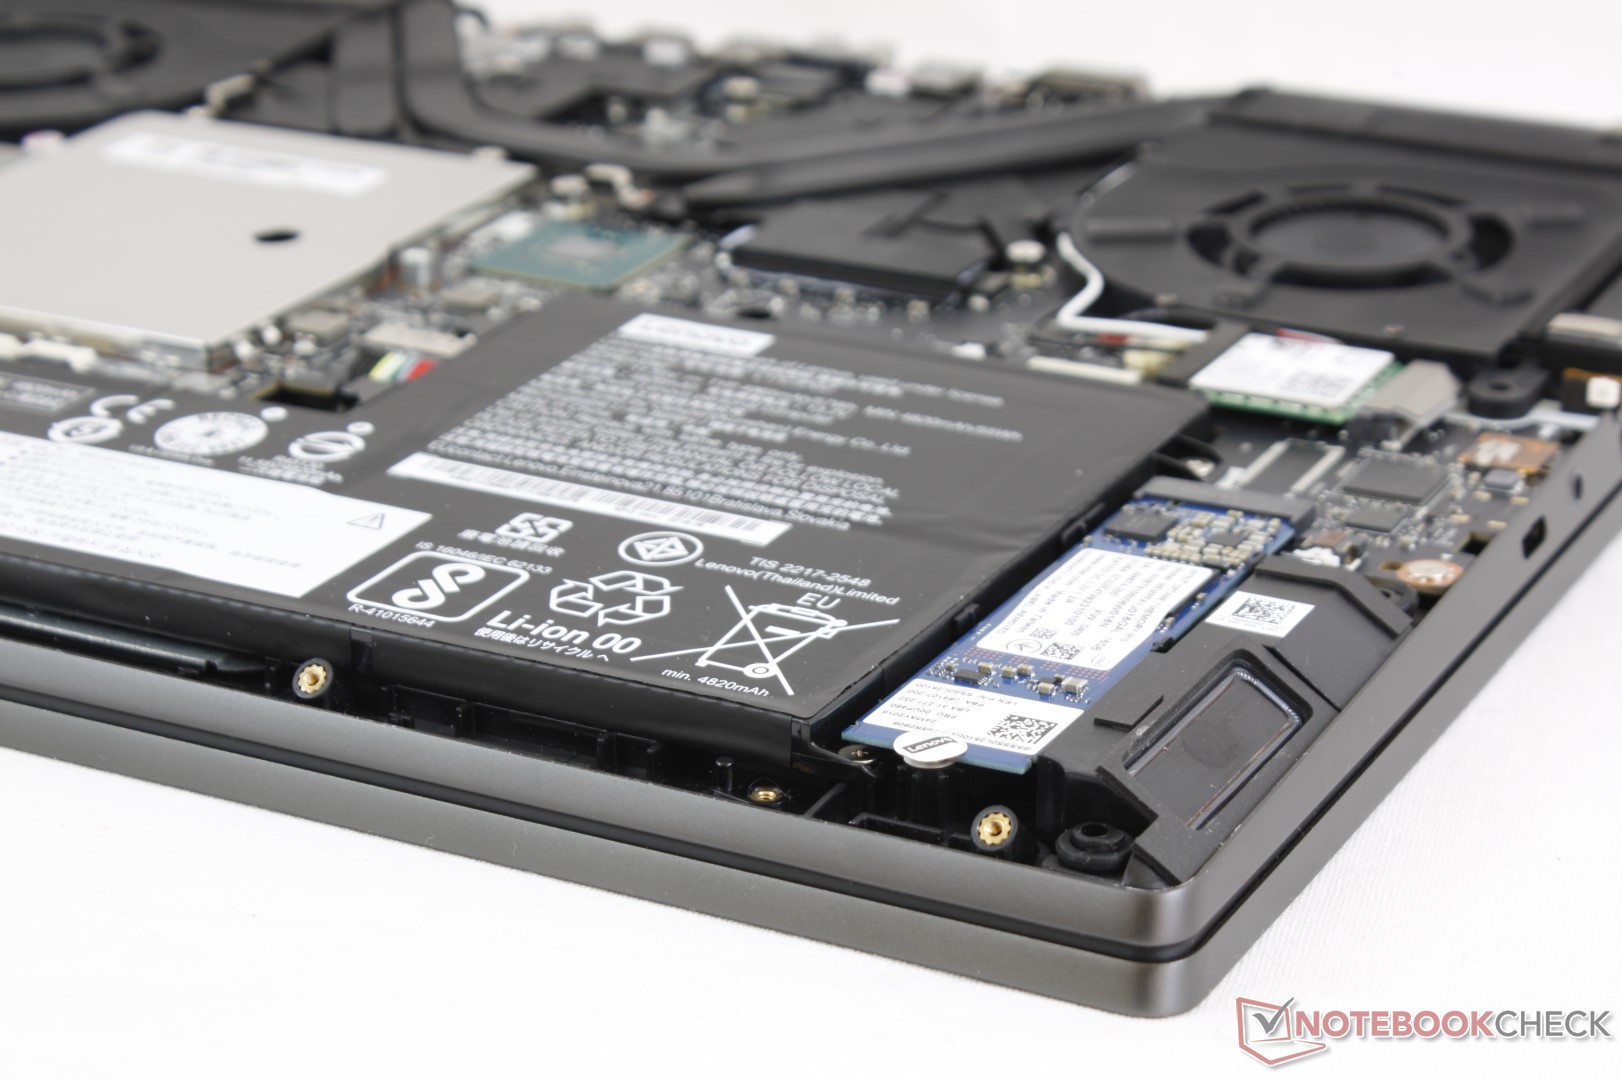
| Lenovo Legion Y730-15ICH i5-8300H Intel Optane 16 GB MEMPEK1J016GAL + HGST ST1000LM049 1 TB HDD | Lenovo Legion Y530-15ICH Samsung SSD PM981 MZVLB256HAHQ | Dell G7 15-7588 SK hynix SC311 SATA | Asus FX504GD Seagate Mobile HDD 1TB ST1000LX015-1U7172 | MSI GF63 8RC Seagate BarraCuda Pro Compute 1TB ST1000LM049 | Razer Blade 15 Base Model Samsung SSD PM981 MZVLB256HAHQ | |
|---|---|---|---|---|---|---|
| CrystalDiskMark 5.2 / 6 | 250% | -20% | -82% | -77% | 259% | |
| Write 4K (MB/s) | 66.9 | 108.9 63% | 61.3 -8% | 0.27 -100% | 1.244 -98% | 112.5 68% |
| Read 4K (MB/s) | 118.5 | 40.23 -66% | 22.45 -81% | 0.586 -100% | 0.544 -100% | 43.09 -64% |
| Write Seq (MB/s) | 157.7 | 1390 781% | 243.9 55% | 86.8 -45% | 97.1 -38% | 1450 819% |
| Read Seq (MB/s) | 886 | 964 9% | 506 -43% | 113.2 -87% | 162.1 -82% | 1392 57% |
| Write 4K Q32T1 (MB/s) | 162.4 | 314.2 93% | 145.1 -11% | 0.242 -100% | 1.674 -99% | 356.1 119% |
| Read 4K Q32T1 (MB/s) | 353 | 369.2 5% | 195.1 -45% | 0.963 -100% | 0.998 -100% | 406.9 15% |
| Write Seq Q32T1 (MB/s) | 159.8 | 1506 842% | 186 16% | 98.4 -38% | 134.8 -16% | 1451 808% |
| Read Seq Q32T1 (MB/s) | 926 | 3446 272% | 540 -42% | 110.2 -88% | 154.8 -83% | 3272 253% |

| 3DMark 11 Performance | 9335 poäng | |
| 3DMark Cloud Gate Standard Score | 23927 poäng | |
| 3DMark Fire Strike Score | 6989 poäng | |
Hjälp | ||
| låg | med. | hög | ultra | |
|---|---|---|---|---|
| BioShock Infinite (2013) | 233.1 | 198.8 | 176.7 | 74.8 |
| The Witcher 3 (2015) | 142.2 | 91.5 | 51.9 | 27.9 |
| Rise of the Tomb Raider (2016) | 125.3 | 95 | 51.3 | 40 |
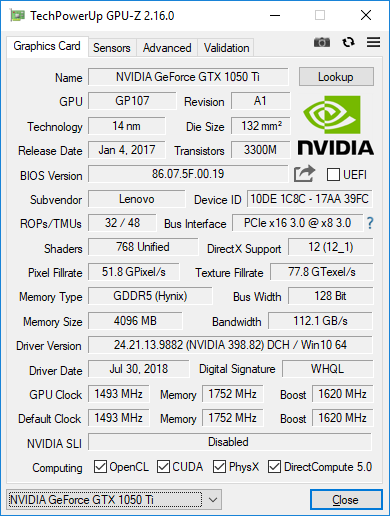
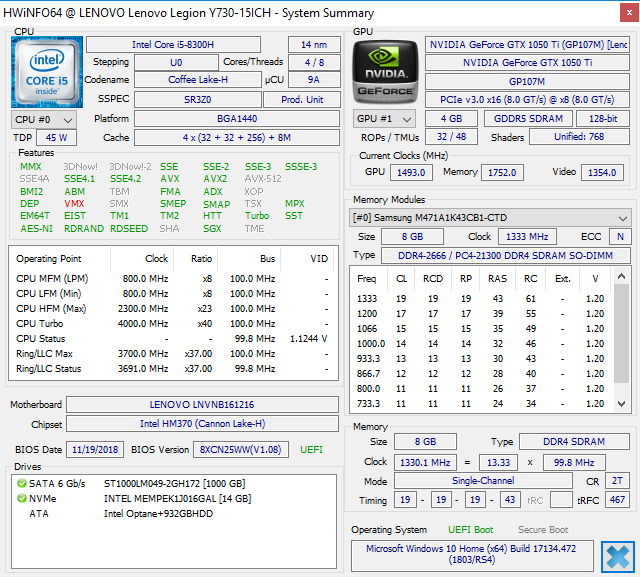
| Lenovo Legion Y730-15ICH i5-8300H GeForce GTX 1050 Ti Mobile, i5-8300H, Intel Optane 16 GB MEMPEK1J016GAL + HGST ST1000LM049 1 TB HDD | Lenovo Legion Y530-15ICH GeForce GTX 1060 Mobile, i7-8750H, Samsung SSD PM981 MZVLB256HAHQ | Dell G7 15-7588 GeForce GTX 1060 Max-Q, i7-8750H, SK hynix SC311 SATA | Asus FX504GD GeForce GTX 1050 Mobile, i5-8300H, Seagate Mobile HDD 1TB ST1000LX015-1U7172 | MSI GF63 8RC GeForce GTX 1050 Mobile, i5-8300H, Seagate BarraCuda Pro Compute 1TB ST1000LM049 | Razer Blade 15 Base Model GeForce GTX 1060 Max-Q, i7-8750H, Samsung SSD PM981 MZVLB256HAHQ | |
|---|---|---|---|---|---|---|
| Noise | -1% | -2% | -0% | -4% | -6% | |
| av / miljö * (dB) | 28.9 | 30.2 -4% | 28.1 3% | 28.1 3% | 28 3% | 27.8 4% |
| Idle Minimum * (dB) | 32.2 | 30.9 4% | 29 10% | 29 10% | 33.8 -5% | 31 4% |
| Idle Average * (dB) | 32.5 | 30.9 5% | 29 11% | 29.2 10% | 34 -5% | 31.2 4% |
| Idle Maximum * (dB) | 32.7 | 31.6 3% | 29.2 11% | 29.7 9% | 34.2 -5% | 31.3 4% |
| Load Average * (dB) | 33.2 | 42.3 -27% | 40.6 -22% | 44.3 -33% | 37.3 -12% | 47.2 -42% |
| Witcher 3 ultra * (dB) | 43.1 | 49.8 -16% | 40.7 6% | 43.4 -1% | 51.3 -19% | |
| Load Maximum * (dB) | 45 | 40 11% | 49.8 -11% | 47.7 -6% | 46 -2% | 44.3 2% |
* ... mindre är bättre
Ljudnivå
| Låg belastning |
| 32.2 / 32.5 / 32.7 dB(A) |
| Hög belastning |
| 33.2 / 45 dB(A) |
 | ||
30 dB tyst 40 dB(A) hörbar 50 dB(A) högt ljud |
||
min: | ||
(+) Den maximala temperaturen på ovansidan är 30 °C / 86 F, jämfört med genomsnittet av 40.4 °C / 105 F , allt från 21.2 till 68.8 °C för klassen Gaming.
(±) Botten värms upp till maximalt 40.8 °C / 105 F, jämfört med genomsnittet av 43.2 °C / 110 F
(+) Vid tomgångsbruk är medeltemperaturen för ovansidan 21.7 °C / 71 F, jämfört med enhetsgenomsnittet på 33.9 °C / ### class_avg_f### F.
(+) När du spelar The Witcher 3 är medeltemperaturen för ovansidan 25.6 °C / 78 F, jämfört med enhetsgenomsnittet på 33.9 °C / ## #class_avg_f### F.
(+) Handledsstöden och pekplattan är kallare än hudtemperaturen med maximalt 23.4 °C / 74.1 F och är därför svala att ta på.
(+) Medeltemperaturen för handledsstödsområdet på liknande enheter var 28.8 °C / 83.8 F (+5.4 °C / 9.7 F).
Lenovo Legion Y730-15ICH i5-8300H ljudanalys
(±) | högtalarljudstyrkan är genomsnittlig men bra (72.3 dB)
Bas 100 - 315 Hz
(±) | reducerad bas - i genomsnitt 11.3% lägre än medianen
(±) | linjäriteten för basen är genomsnittlig (14% delta till föregående frekvens)
Mellan 400 - 2000 Hz
(±) | högre mellan - i genomsnitt 7.1% högre än median
(+) | mids är linjära (5.9% delta till föregående frekvens)
Högsta 2 - 16 kHz
(+) | balanserade toppar - endast 1.7% från medianen
(+) | toppar är linjära (4.8% delta till föregående frekvens)
Totalt 100 - 16 000 Hz
(±) | linjäriteten för det totala ljudet är genomsnittlig (19.3% skillnad mot median)
Jämfört med samma klass
» 65% av alla testade enheter i den här klassen var bättre, 8% liknande, 27% sämre
» Den bästa hade ett delta på 6%, genomsnittet var 18%, sämst var 132%
Jämfört med alla testade enheter
» 47% av alla testade enheter var bättre, 8% liknande, 46% sämre
» Den bästa hade ett delta på 4%, genomsnittet var 23%, sämst var 134%
Apple MacBook 12 (Early 2016) 1.1 GHz ljudanalys
(+) | högtalare kan spela relativt högt (83.6 dB)
Bas 100 - 315 Hz
(±) | reducerad bas - i genomsnitt 11.3% lägre än medianen
(±) | linjäriteten för basen är genomsnittlig (14.2% delta till föregående frekvens)
Mellan 400 - 2000 Hz
(+) | balanserad mellan - endast 2.4% från medianen
(+) | mids är linjära (5.5% delta till föregående frekvens)
Högsta 2 - 16 kHz
(+) | balanserade toppar - endast 2% från medianen
(+) | toppar är linjära (4.5% delta till föregående frekvens)
Totalt 100 - 16 000 Hz
(+) | det totala ljudet är linjärt (10.2% skillnad mot median)
Jämfört med samma klass
» 7% av alla testade enheter i den här klassen var bättre, 2% liknande, 91% sämre
» Den bästa hade ett delta på 5%, genomsnittet var 18%, sämst var 53%
Jämfört med alla testade enheter
» 5% av alla testade enheter var bättre, 1% liknande, 94% sämre
» Den bästa hade ett delta på 4%, genomsnittet var 23%, sämst var 134%
| Av/Standby | |
| Låg belastning | |
| Hög belastning |
|
Förklaring:
min: | |
| Lenovo Legion Y730-15ICH i5-8300H i5-8300H, GeForce GTX 1050 Ti Mobile, Intel Optane 16 GB MEMPEK1J016GAL + HGST ST1000LM049 1 TB HDD, IPS, 1920x1080, 15.6" | Lenovo Legion Y530-15ICH i7-8750H, GeForce GTX 1060 Mobile, Samsung SSD PM981 MZVLB256HAHQ, IPS, 1920x1080, 15.6" | Dell G7 15-7588 i7-8750H, GeForce GTX 1060 Max-Q, SK hynix SC311 SATA, IPS, 1920x1080, 15.6" | Asus FX504GD i5-8300H, GeForce GTX 1050 Mobile, Seagate Mobile HDD 1TB ST1000LX015-1U7172, TN LED, 1920x1080, 15.6" | MSI GF63 8RC i5-8300H, GeForce GTX 1050 Mobile, Seagate BarraCuda Pro Compute 1TB ST1000LM049, IPS, 1920x1080, 15.6" | Razer Blade 15 Base Model i7-8750H, GeForce GTX 1060 Max-Q, Samsung SSD PM981 MZVLB256HAHQ, IPS, 1920x1080, 15.6" | |
|---|---|---|---|---|---|---|
| Power Consumption | -5% | 12% | 12% | 16% | -14% | |
| Idle Minimum * (Watt) | 8 | 7.3 9% | 5.5 31% | 7.2 10% | 5.4 32% | 10.2 -27% |
| Idle Average * (Watt) | 11.8 | 11.1 6% | 7.6 36% | 10.2 14% | 10.4 12% | 13.2 -12% |
| Idle Maximum * (Watt) | 13.1 | 12.6 4% | 9 31% | 10.9 17% | 10.5 20% | 17.6 -34% |
| Load Average * (Watt) | 90.2 | 109 -21% | 94 -4% | 93.3 -3% | 84.7 6% | 99.5 -10% |
| Witcher 3 ultra * (Watt) | 107.8 | 116.3 -8% | 95.8 11% | 92.7 14% | 113.6 -5% | |
| Load Maximum * (Watt) | 136.2 | 168 -23% | 154.4 -13% | 102.5 25% | 119.9 12% | 133.3 2% |
* ... mindre är bättre
| Lenovo Legion Y730-15ICH i5-8300H i5-8300H, GeForce GTX 1050 Ti Mobile, 57 Wh | Lenovo Legion Y530-15ICH i7-8750H, GeForce GTX 1060 Mobile, 52 Wh | Dell G7 15-7588 i7-8750H, GeForce GTX 1060 Max-Q, 56 Wh | Asus FX504GD i5-8300H, GeForce GTX 1050 Mobile, 48 Wh | MSI GF63 8RC i5-8300H, GeForce GTX 1050 Mobile, 51 Wh | Razer Blade 15 Base Model i7-8750H, GeForce GTX 1060 Max-Q, 65 Wh | |
|---|---|---|---|---|---|---|
| Batteridrifttid | -34% | 59% | -21% | -2% | 25% | |
| Reader / Idle (h) | 9.6 | 8.3 -14% | 10.9 14% | 7.5 -22% | 9.5 -1% | 11.5 20% |
| WiFi v1.3 (h) | 5.3 | 3.8 -28% | 7.5 42% | 3.7 -30% | 5.5 4% | 5.5 4% |
| Load (h) | 1 | 0.4 -60% | 2.2 120% | 0.9 -10% | 0.9 -10% | 1.5 50% |
För
Emot
Läs den fullständiga versionen av den här recensionen på engelska här.
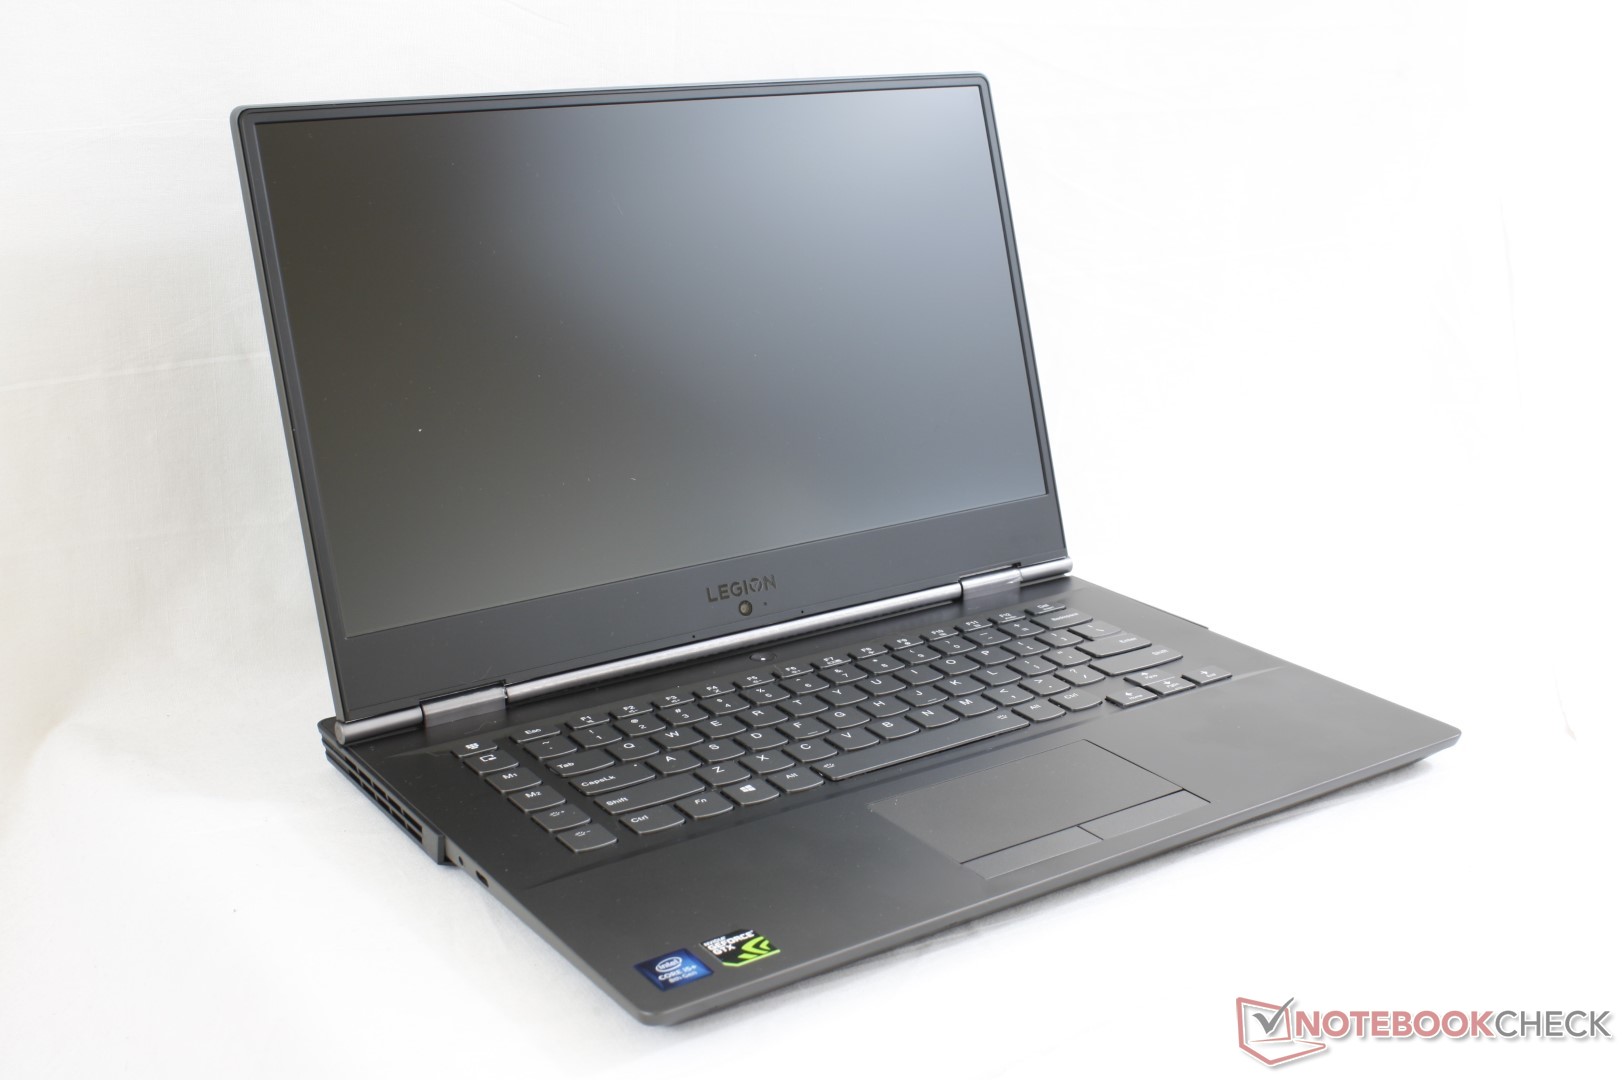
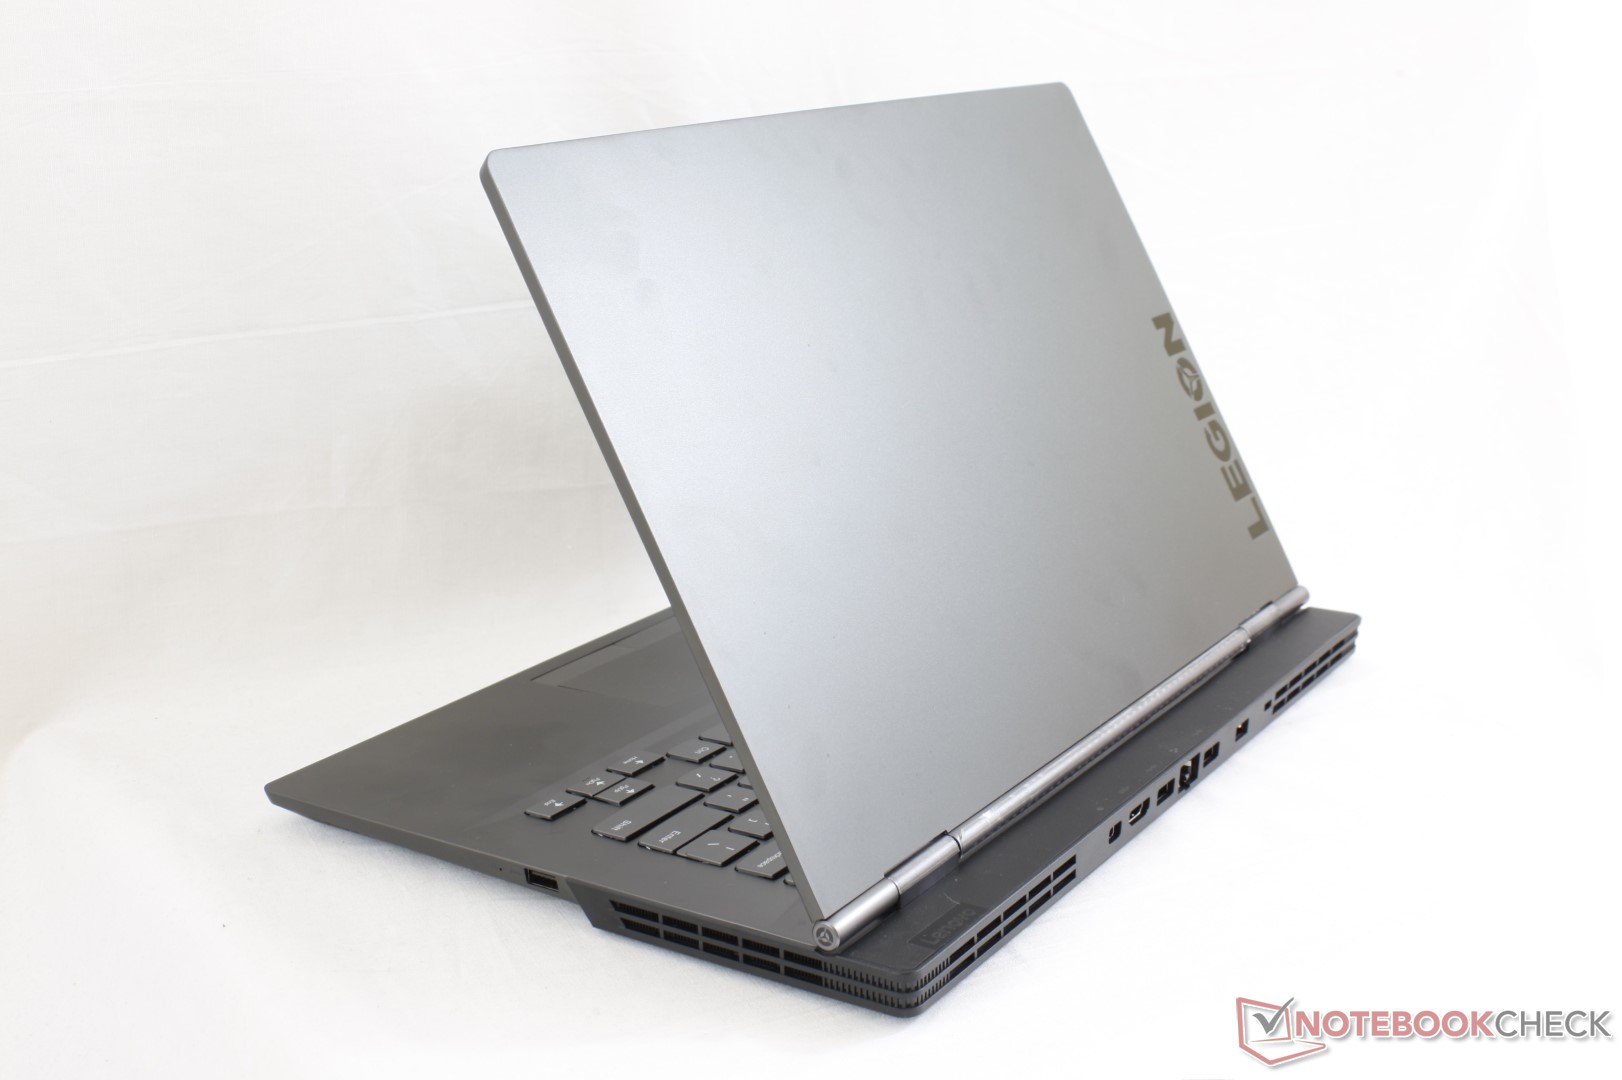
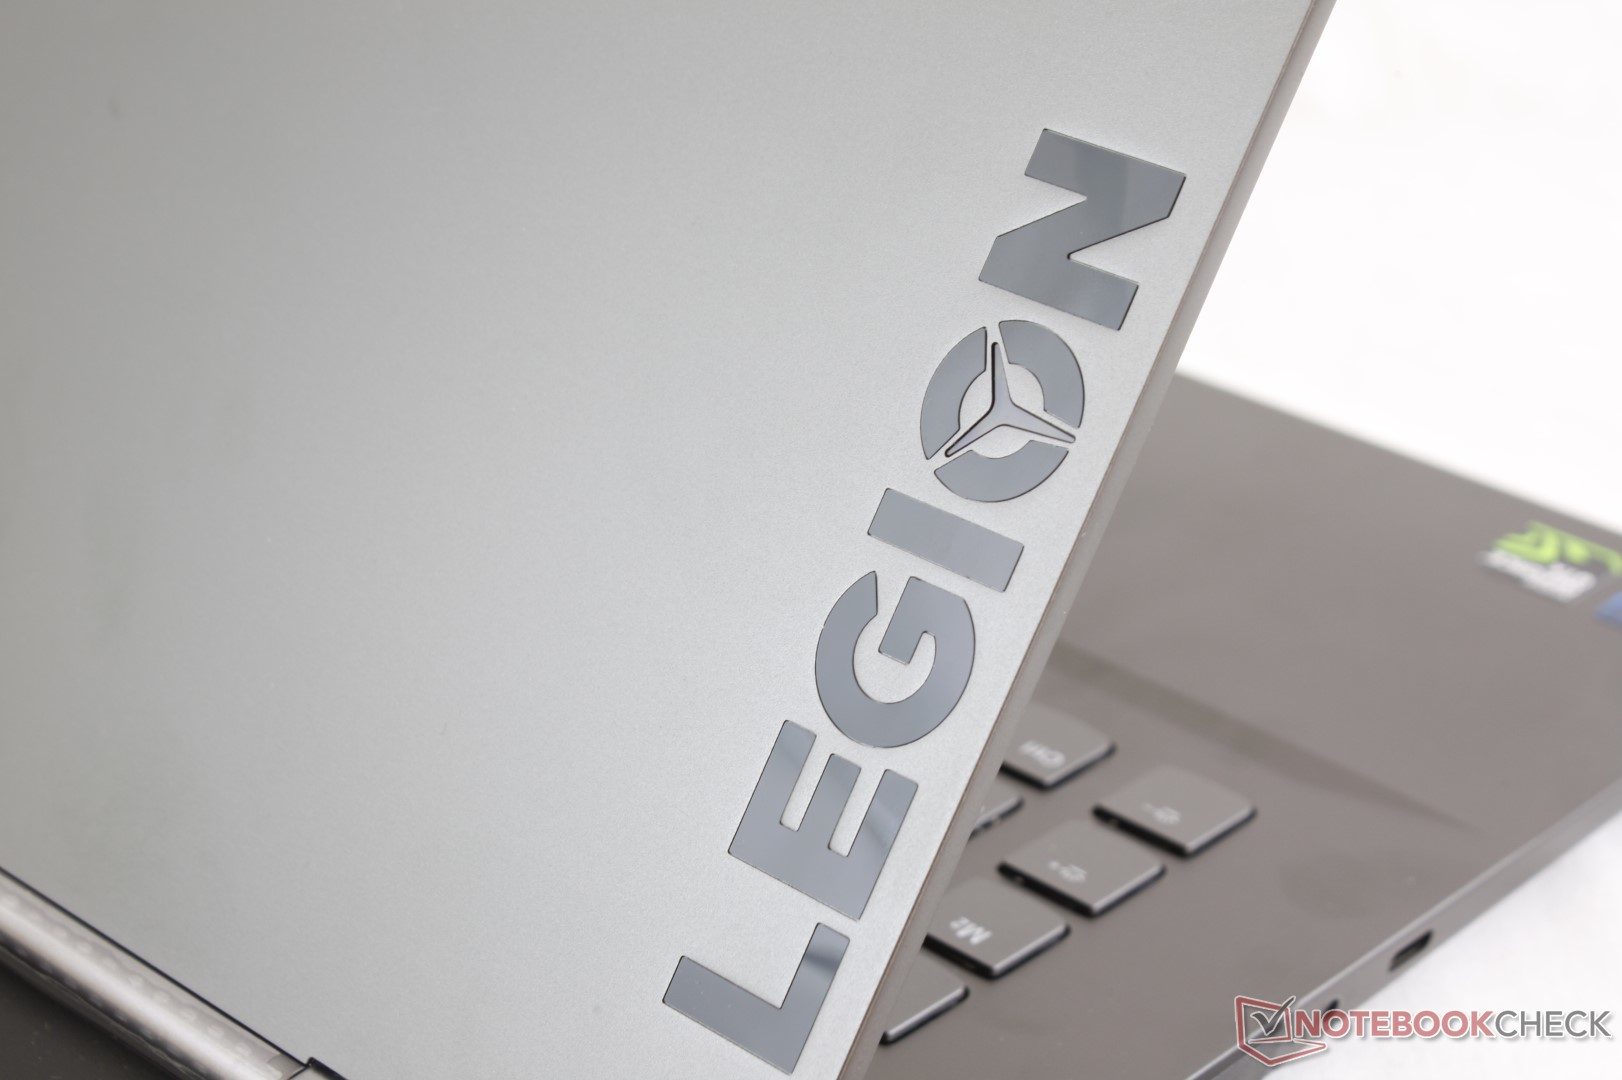
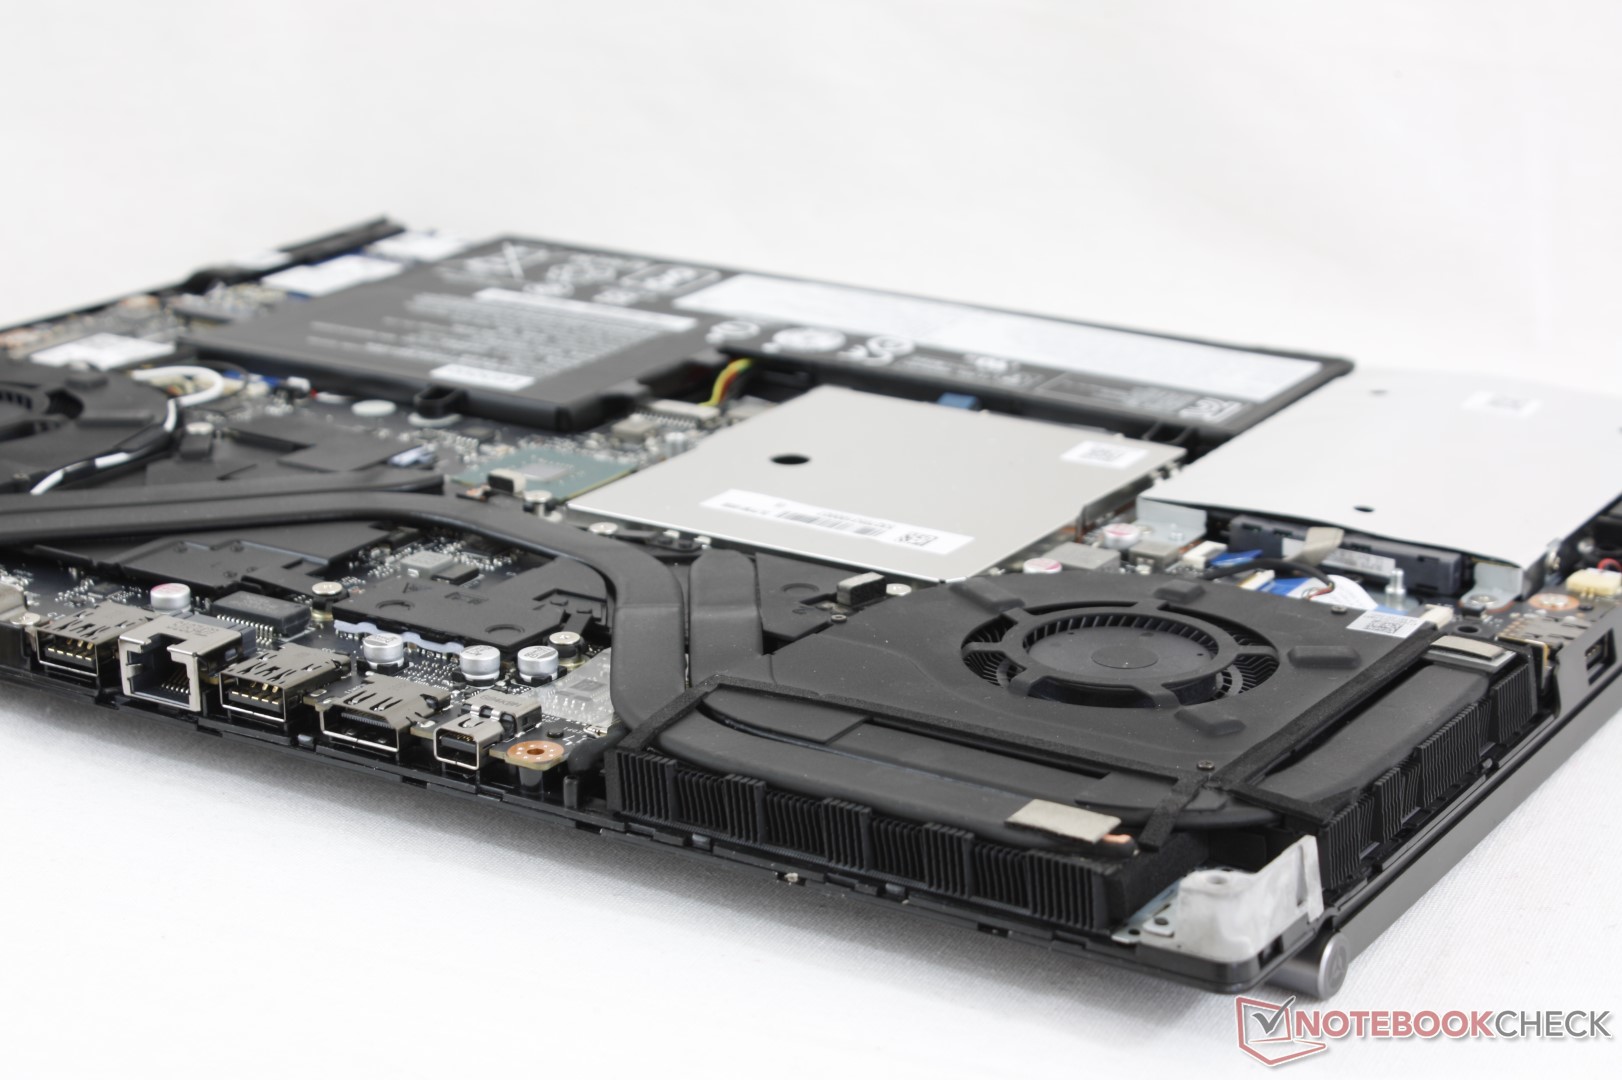
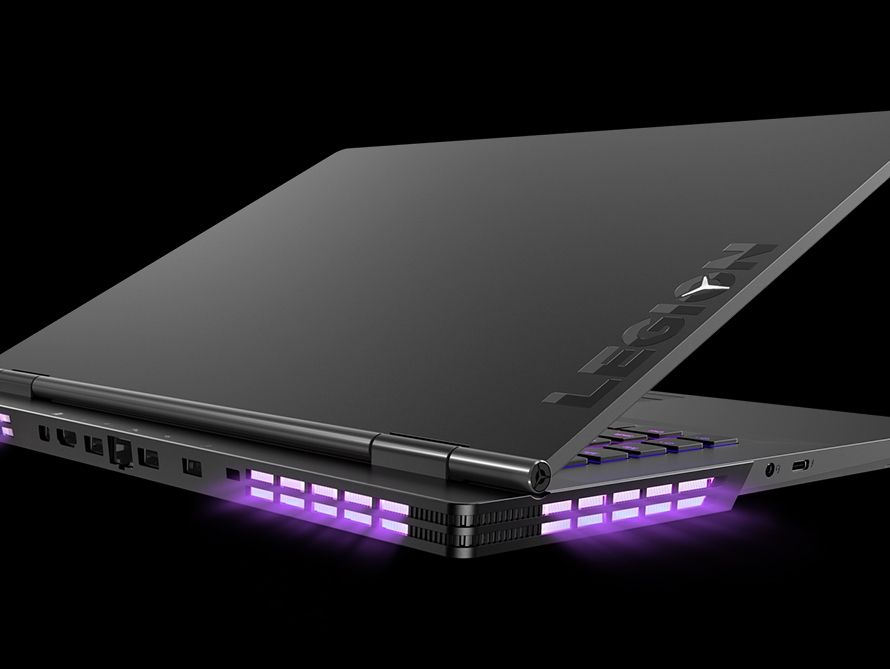
Legion Y730 befinner sig i en prekär situation. Den är en tunnare, lättare och lyxigare version av Legion Y530 med fler extrasaker som LED-belysning, aluminiumytor och Thunderbolt 3 men som saknar alternativet för en GeForce GTX 1060 GPU som finns för budgetalternativet. Varför Legion Y730 är begränsad till GTX 1050 Ti förstår vi inte, särskilt med tanke på att datorn håller sig relativt sval vid spelande och har utmärkt Turbo Boost-prestanda. Chassit är definitivt kapabelt att hantera snabbare GPU:er och vi misstänker att en uppdatering kommer ganska snart som har nästa generations Nvidia-grafik.
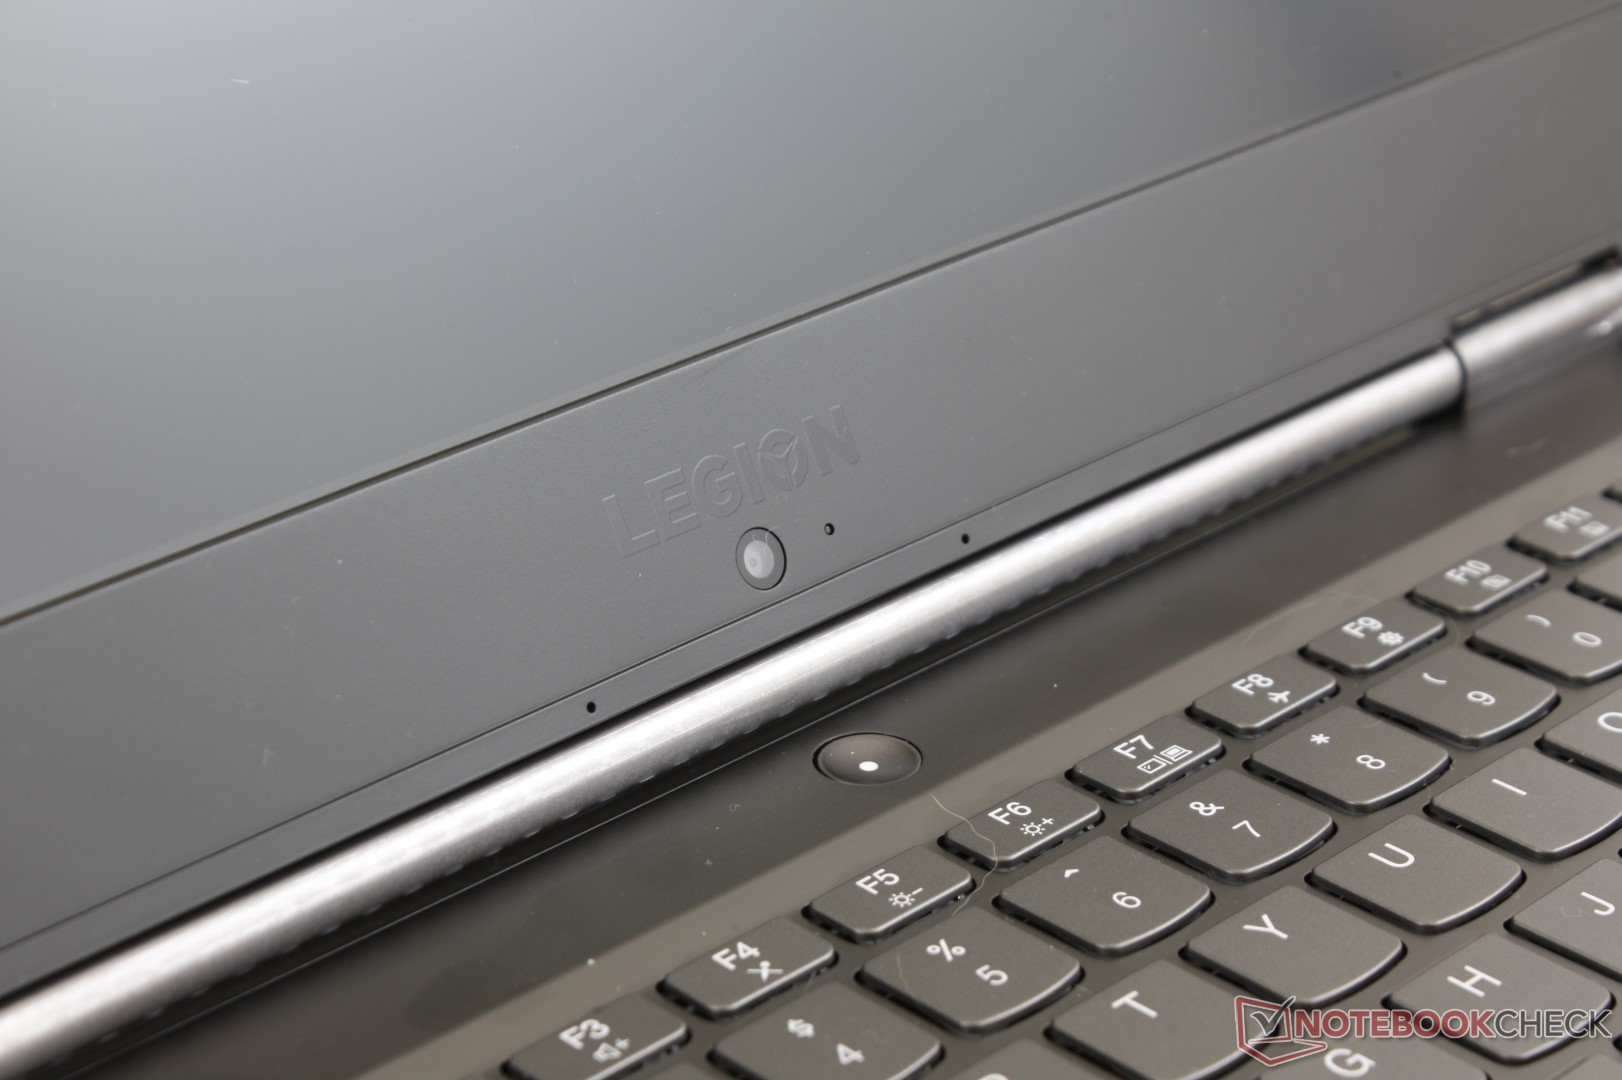
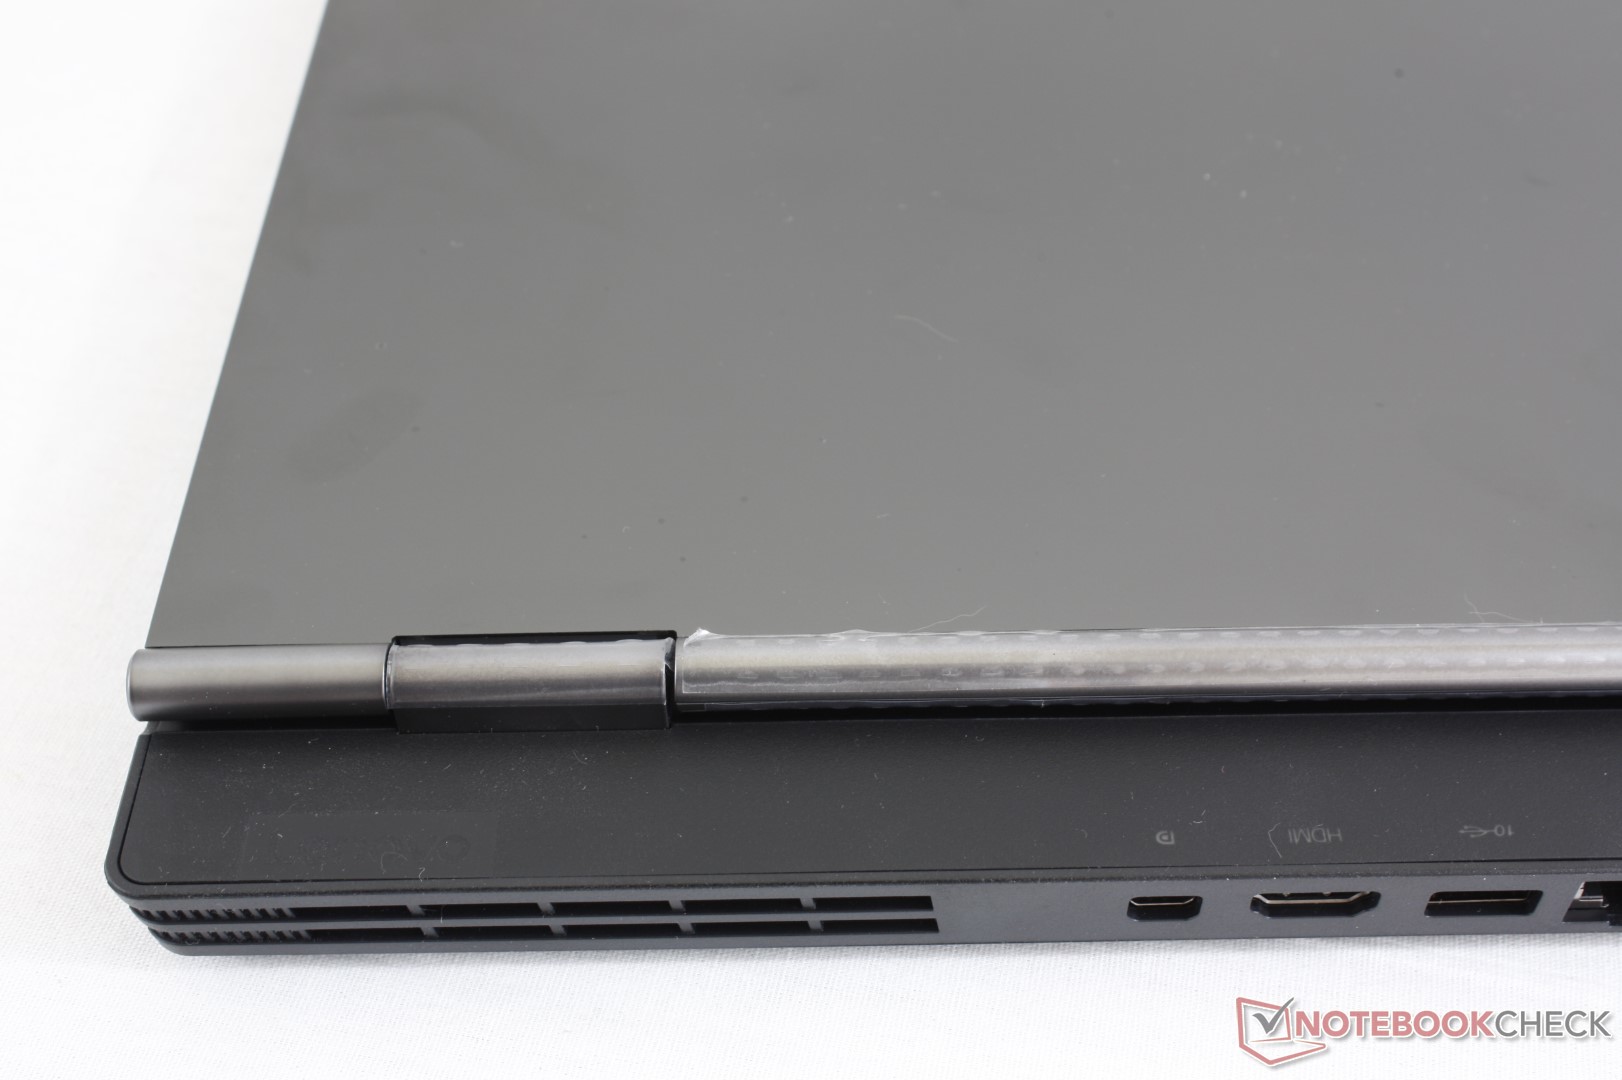
Det största säljargumentet för Y730 är tangentspecifik RGB-belysning och en Thunderbolt 3-port till ett pris som är så lågt som 10.000 kronor. Faktum är att de flesta konkurrenter som MSI GF63, Gigabyte Sabre 15 eller Asus TUF FX504 saknar en eller båda av dessa funktioner. Resten av datorn är dock bara genomsnittlig och har långsamma svart-vita responstider, svampiga tangentbordsknappar och ett skört lock. Gamers bör istället vänta på en uppdatering av Legion Y730 med snabbare GPU-alternativ eller välja en billigare Legion Y530 SKU med GTX 1060 istället.
En underlig blandning av toppskiktsfunktioner och utseende som hålls tillbaka av en GPU från mittenskiktet och ett svagt lock. Den aktuella versionen av Legion Y730 kunde behöva en uppdatering omedelbart för att åtgärda chassits stabilitet och GPU-alternativen.
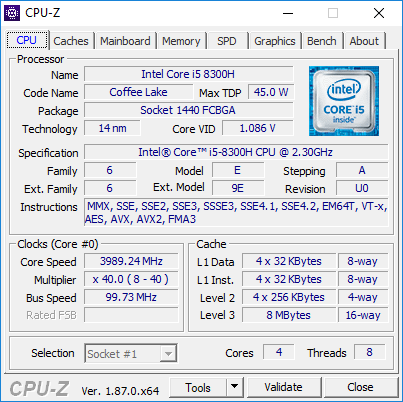
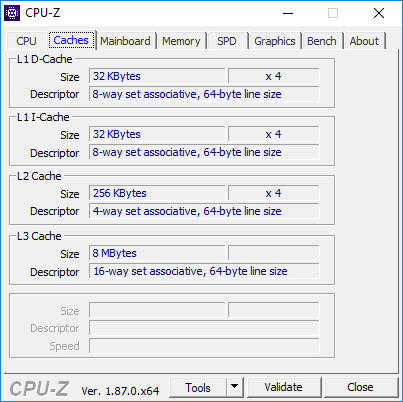
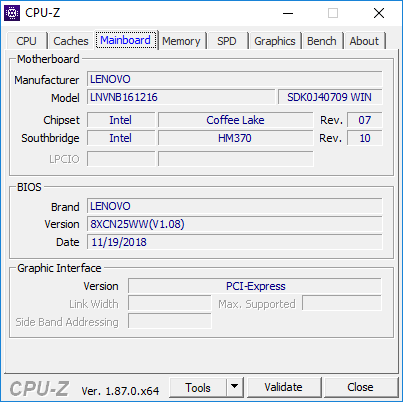
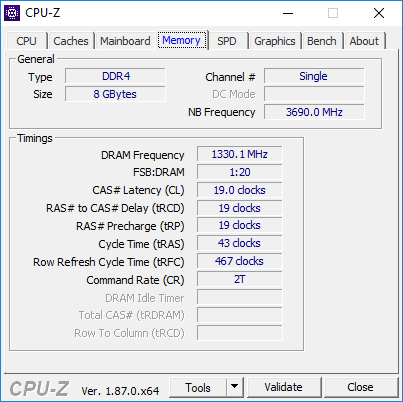
Lenovo Legion Y730-15ICH i5-8300H
- 01/04/2019 v6 (old)
Allen Ngo
Price comparison
