Test: Alienware Area-51m (i9-9900K, RTX 2080) Laptop (Sammanfattning)
| Networking | |
| iperf3 transmit AX12 | |
| Asus ROG G703GX | |
| MSI GT75 8RG-090 Titan | |
| Alienware Area-51m i9-9900K RTX 2080 | |
| Alienware 17 R5 | |
| iperf3 receive AX12 | |
| MSI GT75 8RG-090 Titan | |
| Asus ROG G703GX | |
| Alienware 17 R5 | |
| Alienware Area-51m i9-9900K RTX 2080 | |
| |||||||||||||||||||||||||
Distribution av ljusstyrkan: 82 %
Mitt på batteriet: 355.2 cd/m²
Kontrast: 508:1 (Svärta: 0.66 cd/m²)
ΔE ColorChecker Calman: 2.02 | ∀{0.5-29.43 Ø4.72}
calibrated: 1.17
ΔE Greyscale Calman: 3.2 | ∀{0.09-98 Ø4.97}
96.9% sRGB (Argyll 1.6.3 3D)
61.3% AdobeRGB 1998 (Argyll 1.6.3 3D)
66.5% AdobeRGB 1998 (Argyll 3D)
96.9% sRGB (Argyll 3D)
66.3% Display P3 (Argyll 3D)
Gamma: 2.16
CCT: 6746 K
| Alienware Area-51m i9-9900K RTX 2080 LG Philips 173WFG, IPS, 17.3", 1920x1080 | MSI GT75 8RG-090 Titan CMN N173HHE-G32 (CMN1747), TN, 17.3", 1920x1080 | Asus ROG G703GX AU Optronics B173HAN03.2 (AUO329D), IPS, 17.3", 1920x1080 | Eurocom Sky X7C i9-9900K AU Optronics B173HAN03.1, IPS, 17.3", 1920x1080 | Razer Blade Pro 2017 Sharp LQ173D1JW33 (SHP145A), IGZO, 17.3", 3840x2160 | Alienware 17 R5 JYWWF_B173QTN (AUO1496), TN, 17.3", 2560x1440 | |
|---|---|---|---|---|---|---|
| Display | 23% | -3% | -4% | 29% | -7% | |
| Display P3 Coverage (%) | 66.3 | 90.9 37% | 64.1 -3% | 64.7 -2% | 88.9 34% | 63.4 -4% |
| sRGB Coverage (%) | 96.9 | 100 3% | 93.3 -4% | 89.1 -8% | 100 3% | 86.1 -11% |
| AdobeRGB 1998 Coverage (%) | 66.5 | 86.2 30% | 65.6 -1% | 65.2 -2% | 99.7 50% | 62.9 -5% |
| Response Times | 44% | 28% | -18% | -309% | -7% | |
| Response Time Grey 50% / Grey 80% * (ms) | 13.2 ? | 8 ? 39% | 7.2 ? 45% | 18 ? -36% | 60.8 ? -361% | 20.8 ? -58% |
| Response Time Black / White * (ms) | 10.8 ? | 5.6 ? 48% | 9.6 ? 11% | 10.8 ? -0% | 38.4 ? -256% | 6 ? 44% |
| PWM Frequency (Hz) | 26000 ? | 204.9 ? | ||||
| Screen | 19% | -9% | -18% | -8% | -27% | |
| Brightness middle (cd/m²) | 335.2 | 240 -28% | 296 -12% | 276.1 -18% | 230 -31% | 398 19% |
| Brightness (cd/m²) | 297 | 248 -16% | 279 -6% | 260 -12% | 207 -30% | 367 24% |
| Brightness Distribution (%) | 82 | 83 1% | 85 4% | 85 4% | 83 1% | 86 5% |
| Black Level * (cd/m²) | 0.66 | 0.22 67% | 0.25 62% | 0.36 45% | 0.2 70% | 0.51 23% |
| Contrast (:1) | 508 | 1091 115% | 1184 133% | 767 51% | 1150 126% | 780 54% |
| Colorchecker dE 2000 * | 2.02 | 2.14 -6% | 4.77 -136% | 3.51 -74% | 5.62 -178% | 5.45 -170% |
| Colorchecker dE 2000 max. * | 7.23 | 5.04 30% | 9.08 -26% | 6.84 5% | 10.24 -42% | 10.36 -43% |
| Colorchecker dE 2000 calibrated * | 1.17 | 1.54 -32% | 1.46 -25% | 3.56 -204% | 2.56 -119% | |
| Greyscale dE 2000 * | 3.2 | 1.62 49% | 5.83 -82% | 2.7 16% | 4.54 -42% | 5.4 -69% |
| Gamma | 2.16 102% | 2.28 96% | 2.47 89% | 2.28 96% | 2.36 93% | 2.4 92% |
| CCT | 6746 96% | 6846 95% | 8076 80% | 6947 94% | 6625 98% | 7453 87% |
| Color Space (Percent of AdobeRGB 1998) (%) | 61.3 | 77 26% | 60 -2% | 57.8 -6% | 88 44% | 56 -9% |
| Color Space (Percent of sRGB) (%) | 96.9 | 100 3% | 93 -4% | 88.8 -8% | 100 3% | 86 -11% |
| Totalt genomsnitt (program/inställningar) | 29% /
23% | 5% /
-3% | -13% /
-16% | -96% /
-41% | -14% /
-21% |
* ... mindre är bättre
Visa svarstider
| ↔ Svarstid svart till vitt | ||
|---|---|---|
| 10.8 ms ... stiga ↗ och falla ↘ kombinerat | ↗ 6 ms stiga | 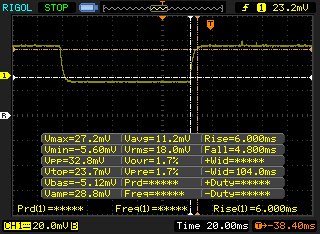 |
| ↘ 4.8 ms hösten | ||
| Skärmen visar bra svarsfrekvens i våra tester, men kan vara för långsam för konkurrenskraftiga spelare. I jämförelse sträcker sig alla testade enheter från 0.1 (minst) till 240 (maximalt) ms. » 29 % av alla enheter är bättre. Det betyder att den uppmätta svarstiden är bättre än genomsnittet av alla testade enheter (19.8 ms). | ||
| ↔ Svarstid 50 % grått till 80 % grått | ||
| 13.2 ms ... stiga ↗ och falla ↘ kombinerat | ↗ 8 ms stiga | 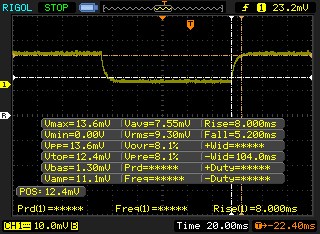 |
| ↘ 5.2 ms hösten | ||
| Skärmen visar bra svarsfrekvens i våra tester, men kan vara för långsam för konkurrenskraftiga spelare. I jämförelse sträcker sig alla testade enheter från 0.165 (minst) till 636 (maximalt) ms. » 27 % av alla enheter är bättre. Det betyder att den uppmätta svarstiden är bättre än genomsnittet av alla testade enheter (31 ms). | ||
Skärmflimmer / PWM (Puls-Width Modulation)
| Skärmflimmer / PWM upptäcktes inte | 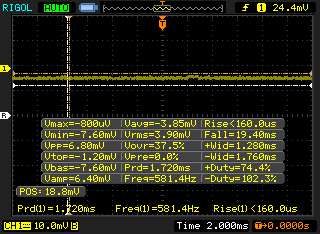 | ||
Som jämförelse: 52 % av alla testade enheter använder inte PWM för att dämpa skärmen. Om PWM upptäcktes mättes ett medelvärde av 7747 (minst: 5 - maximum: 343500) Hz. | |||
| Cinebench R10 | |
| Rendering Multiple CPUs 32Bit | |
| Genomsnitt Intel Core i9-9900K (36683 - 49142, n=4) | |
| Eurocom Sky X9C | |
| AMD Threadripper 2970WX, AMD Radeon RX Vega 64 | |
| Asus GL702ZC-GC104T | |
| Dell G3 17 3779 | |
| Rendering Single 32Bit | |
| Genomsnitt Intel Core i9-9900K (7786 - 8042, n=4) | |
| Eurocom Sky X9C | |
| Dell G3 17 3779 | |
| AMD Threadripper 2970WX, AMD Radeon RX Vega 64 | |
| Asus GL702ZC-GC104T | |
| wPrime 2.10 - 1024m | |
| Eurocom Sky X9C | |
| Genomsnitt Intel Core i9-9900K (85.6 - 98.7, n=3) | |
| AMD Threadripper 2970WX, AMD Radeon RX Vega 64 | |
* ... mindre är bättre
| PCMark 8 Home Score Accelerated v2 | 5607 poäng | |
| PCMark 8 Work Score Accelerated v2 | 6140 poäng | |
| PCMark 10 Score | 7006 poäng | |
Hjälp | ||
| Alienware Area-51m i9-9900K RTX 2080 2x SK Hynix PC400 512GB (RAID 0) | MSI GT75 8RG-090 Titan 2x Samsung PM961 MZVLW256HEHP (RAID 0) | Asus ROG G703GX Samsung SSD PM981 MZVLB512HAJQ | Eurocom Sky X7C i9-9900K 2x Samsung SSD 970 Pro 512GB (RAID 0) | Razer Blade Pro 2017 2x Samsung SSD PM951 MZVLV256HCHP (RAID 0) | |
|---|---|---|---|---|---|
| AS SSD | 11% | 4% | 20% | -11% | |
| Seq Read (MB/s) | 2082 | 3058 47% | 1632 -22% | 2323 12% | 2599 25% |
| Seq Write (MB/s) | 2335 | 2196 -6% | 1767 -24% | 2887 24% | 588 -75% |
| 4K Read (MB/s) | 24.14 | 38.37 59% | 50.4 109% | 30.51 26% | 37.57 56% |
| 4K Write (MB/s) | 91.8 | 97.7 6% | 101.9 11% | 131.8 44% | 104.4 14% |
| 4K-64 Read (MB/s) | 1561 | 1347 -14% | 1196 -23% | 1507 -3% | 1116 -29% |
| 4K-64 Write (MB/s) | 1350 | 1236 -8% | 1631 21% | 1483 10% | 513 -62% |
| Access Time Read * (ms) | 0.121 | 0.056 54% | 0.061 50% | 0.032 74% | 0.051 58% |
| Access Time Write * (ms) | 0.039 | 0.038 3% | 0.037 5% | 0.028 28% | 0.036 8% |
| Score Read (Points) | 1793 | 1691 -6% | 1410 -21% | 1770 -1% | 1414 -21% |
| Score Write (Points) | 1675 | 1553 -7% | 1910 14% | 1904 14% | 676 -60% |
| Score Total (Points) | 4390 | 4066 -7% | 4057 -8% | 4602 5% | 2715 -38% |
| Copy ISO MB/s (MB/s) | 2175 | 2048 -6% | 3044 40% | ||
| Copy Program MB/s (MB/s) | 582 | 428.5 -26% | 574 -1% | ||
| Copy Game MB/s (MB/s) | 1479 | 1173 -21% | 1489 1% |
* ... mindre är bättre

| 3DMark 11 Performance | 29759 poäng | |
| 3DMark Cloud Gate Standard Score | 59224 poäng | |
| 3DMark Fire Strike Score | 23195 poäng | |
| 3DMark Time Spy Score | 10704 poäng | |
Hjälp | ||
| Metro Exodus - 1920x1080 Ultra Quality AF:16x | |
| Alienware Area-51m i9-9900K RTX 2080 | |
| MSI RTX 2080 Gaming X Trio | |
| MSI GeForce GTX 1080 | |
| Schenker XMG Neo 17 | |
| MSI RTX 2060 Gaming Z 6G | |
| i7-7740X Asus X299 Prime | |
| Acer Predator Triton 700 | |
| Gigabyte Aero 15-Y9 | |
| Schenker XMG Neo 15 Turing | |
| The Witcher 3 - 1920x1080 Ultra Graphics & Postprocessing (HBAO+) | |
| MSI RTX 2080 Gaming X Trio | |
| Alienware Area-51m i9-9900K RTX 2080 | |
| Schenker XMG Neo 17 | |
| MSI RTX 2060 Gaming Z 6G | |
| Gigabyte Aero 15-Y9 | |
| Schenker XMG Neo 15 Turing | |
| låg | med. | hög | ultra | |
|---|---|---|---|---|
| BioShock Infinite (2013) | 447.6 | 380.6 | 348 | 213.4 |
| The Witcher 3 (2015) | 382.5 | 273.3 | 194.4 | 101.1 |
| Rise of the Tomb Raider (2016) | 317 | 224.3 | 188.8 | 158.8 |
| Shadow of the Tomb Raider (2018) | 171 | 140 | 134 | 123 |
| Metro Exodus (2019) | 165 | 120.1 | 91.5 | 76.1 |
| Alienware Area-51m i9-9900K RTX 2080 GeForce RTX 2080 Mobile, i9-9900K, 2x SK Hynix PC400 512GB (RAID 0) | MSI GT75 8RG-090 Titan GeForce GTX 1080 Mobile, i9-8950HK, 2x Samsung PM961 MZVLW256HEHP (RAID 0) | Asus ROG G703GX GeForce RTX 2080 Mobile, i7-8750H, Samsung SSD PM981 MZVLB512HAJQ | Eurocom Sky X7C i9-9900K GeForce RTX 2080 Mobile, i9-9900K, 2x Samsung SSD 970 Pro 512GB (RAID 0) | HP Omen X 17-ap002ng GeForce GTX 1080 Mobile, i7-7820HK | Razer Blade Pro 2017 GeForce GTX 1080 Mobile, i7-7820HK, 2x Samsung SSD PM951 MZVLV256HCHP (RAID 0) | |
|---|---|---|---|---|---|---|
| Noise | -4% | -1% | 7% | 7% | 1% | |
| av / miljö * (dB) | 28.1 | 30 -7% | 30 -7% | 28.9 -3% | 30 -7% | 30 -7% |
| Idle Minimum * (dB) | 28.1 | 32 -14% | 30 -7% | 29.7 -6% | 31.6 -12% | 30 -7% |
| Idle Average * (dB) | 28.6 | 34 -19% | 35 -22% | 29.7 -4% | 31.6 -10% | 31 -8% |
| Idle Maximum * (dB) | 51 | 37 27% | 41 20% | 30 41% | 31.7 38% | 33 35% |
| Load Average * (dB) | 51 | 43 16% | 44 14% | 36.5 28% | 38.4 25% | 43 16% |
| Witcher 3 ultra * (dB) | 51 | 57 -12% | 51 -0% | 49 4% | 47.2 7% | 55 -8% |
| Load Maximum * (dB) | 51 | 62 -22% | 52 -2% | 57 -12% | 48.1 6% | 58 -14% |
* ... mindre är bättre
Ljudnivå
| Låg belastning |
| 28.1 / 28.6 / 51 dB(A) |
| Hög belastning |
| 51 / 51 dB(A) |
 | ||
30 dB tyst 40 dB(A) hörbar 50 dB(A) högt ljud |
||
min: | ||
(-) Den maximala temperaturen på ovansidan är 47 °C / 117 F, jämfört med genomsnittet av 40.4 °C / 105 F , allt från 21.2 till 68.8 °C för klassen Gaming.
(-) Botten värms upp till maximalt 58.8 °C / 138 F, jämfört med genomsnittet av 43.2 °C / 110 F
(+) Vid tomgångsbruk är medeltemperaturen för ovansidan 27.8 °C / 82 F, jämfört med enhetsgenomsnittet på 33.9 °C / ### class_avg_f### F.
(±) När du spelar The Witcher 3 är medeltemperaturen för ovansidan 35.3 °C / 96 F, jämfört med enhetsgenomsnittet på 33.9 °C / ## #class_avg_f### F.
(+) Handledsstöden och pekplattan når maximal hudtemperatur (32 °C / 89.6 F) och är därför inte varma.
(-) Medeltemperaturen för handledsstödsområdet på liknande enheter var 28.8 °C / 83.8 F (-3.2 °C / -5.8 F).
Alienware Area-51m i9-9900K RTX 2080 ljudanalys
(+) | högtalare kan spela relativt högt (82.3 dB)
Bas 100 - 315 Hz
(±) | reducerad bas - i genomsnitt 11% lägre än medianen
(±) | linjäriteten för basen är genomsnittlig (14.5% delta till föregående frekvens)
Mellan 400 - 2000 Hz
(+) | balanserad mellan - endast 3.4% från medianen
(±) | linjäriteten för mids är genomsnittlig (7.8% delta till föregående frekvens)
Högsta 2 - 16 kHz
(+) | balanserade toppar - endast 2.8% från medianen
(±) | linjäriteten för toppar är genomsnittlig (9.4% delta till föregående frekvens)
Totalt 100 - 16 000 Hz
(+) | det totala ljudet är linjärt (11.9% skillnad mot median)
Jämfört med samma klass
» 12% av alla testade enheter i den här klassen var bättre, 4% liknande, 84% sämre
» Den bästa hade ett delta på 6%, genomsnittet var 18%, sämst var 132%
Jämfört med alla testade enheter
» 9% av alla testade enheter var bättre, 2% liknande, 89% sämre
» Den bästa hade ett delta på 4%, genomsnittet var 23%, sämst var 134%
Apple MacBook 12 (Early 2016) 1.1 GHz ljudanalys
(+) | högtalare kan spela relativt högt (83.6 dB)
Bas 100 - 315 Hz
(±) | reducerad bas - i genomsnitt 11.3% lägre än medianen
(±) | linjäriteten för basen är genomsnittlig (14.2% delta till föregående frekvens)
Mellan 400 - 2000 Hz
(+) | balanserad mellan - endast 2.4% från medianen
(+) | mids är linjära (5.5% delta till föregående frekvens)
Högsta 2 - 16 kHz
(+) | balanserade toppar - endast 2% från medianen
(+) | toppar är linjära (4.5% delta till föregående frekvens)
Totalt 100 - 16 000 Hz
(+) | det totala ljudet är linjärt (10.2% skillnad mot median)
Jämfört med samma klass
» 7% av alla testade enheter i den här klassen var bättre, 2% liknande, 90% sämre
» Den bästa hade ett delta på 5%, genomsnittet var 18%, sämst var 53%
Jämfört med alla testade enheter
» 5% av alla testade enheter var bättre, 1% liknande, 94% sämre
» Den bästa hade ett delta på 4%, genomsnittet var 23%, sämst var 134%
| Av/Standby | |
| Låg belastning | |
| Hög belastning |
|
Förklaring:
min: | |
| Alienware Area-51m i9-9900K RTX 2080 i9-9900K, GeForce RTX 2080 Mobile, 2x SK Hynix PC400 512GB (RAID 0), IPS, 1920x1080, 17.3" | MSI GT75 8RG-090 Titan i9-8950HK, GeForce GTX 1080 Mobile, 2x Samsung PM961 MZVLW256HEHP (RAID 0), TN, 1920x1080, 17.3" | Asus ROG G703GX i7-8750H, GeForce RTX 2080 Mobile, Samsung SSD PM981 MZVLB512HAJQ, IPS, 1920x1080, 17.3" | Eurocom Sky X7C i9-9900K i9-9900K, GeForce RTX 2080 Mobile, 2x Samsung SSD 970 Pro 512GB (RAID 0), IPS, 1920x1080, 17.3" | Razer Blade Pro 2017 i7-7820HK, GeForce GTX 1080 Mobile, 2x Samsung SSD PM951 MZVLV256HCHP (RAID 0), IGZO, 3840x2160, 17.3" | Alienware 17 R5 i7-8750H, GeForce GTX 1070 Mobile, SK hynix PC401 HFS256GD9TNG, TN, 2560x1440, 17.3" | |
|---|---|---|---|---|---|---|
| Power Consumption | -4% | 25% | -12% | 6% | 14% | |
| Idle Minimum * (Watt) | 23.3 | 31 -33% | 5 79% | 41.3 -77% | 31 -33% | 28 -20% |
| Idle Average * (Watt) | 33.5 | 35 -4% | 24 28% | 41.8 -25% | 36 -7% | 32 4% |
| Idle Maximum * (Watt) | 38.4 | 45 -17% | 42 -9% | 46.1 -20% | 44 -15% | 37 4% |
| Load Average * (Watt) | 114.1 | 130 -14% | 112 2% | 116.6 -2% | 107 6% | 112 2% |
| Witcher 3 ultra * (Watt) | 339.5 | 268 21% | 284 16% | 245.9 28% | 212 38% | 192 43% |
| Load Maximum * (Watt) | 485.1 | 374 23% | 320 34% | 352.6 27% | 258 47% | 231 52% |
* ... mindre är bättre
| Alienware Area-51m i9-9900K RTX 2080 i9-9900K, GeForce RTX 2080 Mobile, 90 Wh | MSI GT75 8RG-090 Titan i9-8950HK, GeForce GTX 1080 Mobile, 75 Wh | Asus ROG G703GX i7-8750H, GeForce RTX 2080 Mobile, 96 Wh | Eurocom Sky X7C i9-9900K i9-9900K, GeForce RTX 2080 Mobile, 82 Wh | Razer Blade Pro 2017 i7-7820HK, GeForce GTX 1080 Mobile, 99 Wh | Alienware 17 R5 i7-8750H, GeForce GTX 1070 Mobile, 99 Wh | |
|---|---|---|---|---|---|---|
| Batteridrifttid | 23% | 67% | -5% | 49% | 48% | |
| Reader / Idle (h) | 2.6 | 3.8 46% | 5 92% | 4.2 62% | 4.5 73% | |
| WiFi v1.3 (h) | 2.1 | 4 90% | 2 -5% | 3.3 57% | 3.6 71% | |
| Load (h) | 1.1 | 1.1 0% | 1.3 18% | 1.4 27% | 1.1 0% |
För
Emot
Läs den fullständiga versionen av den här recensionen på engelska här.
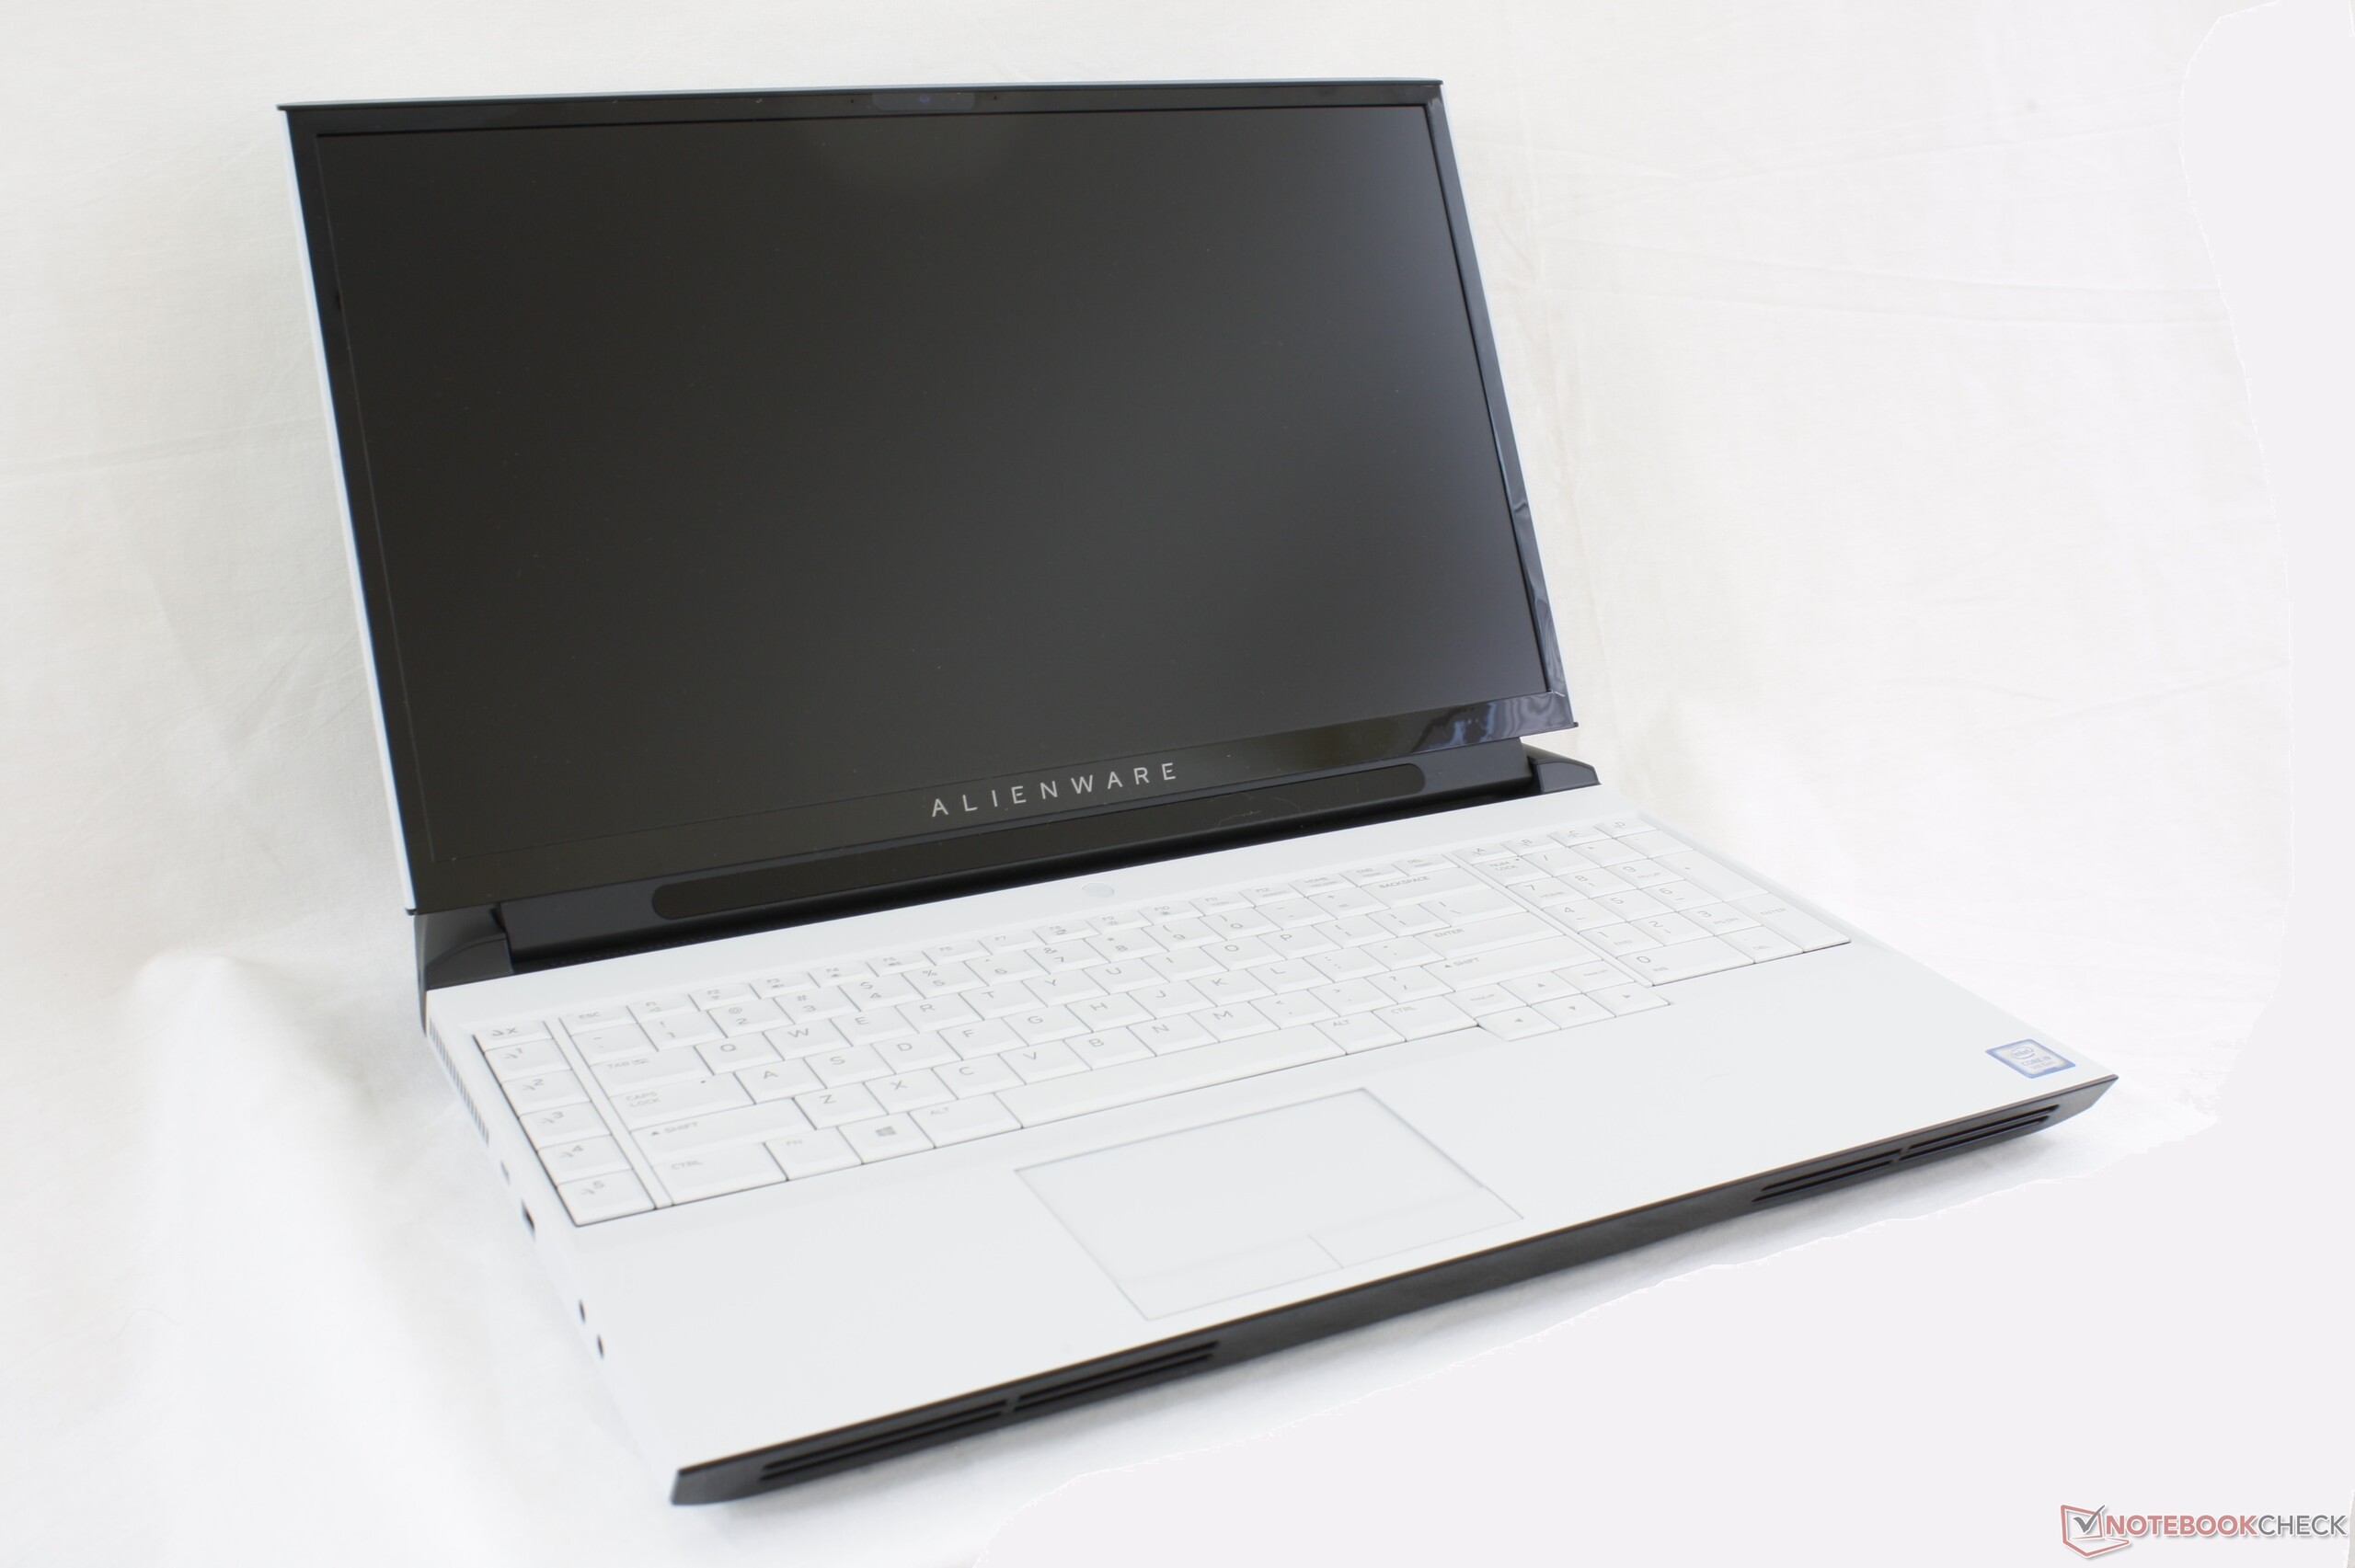
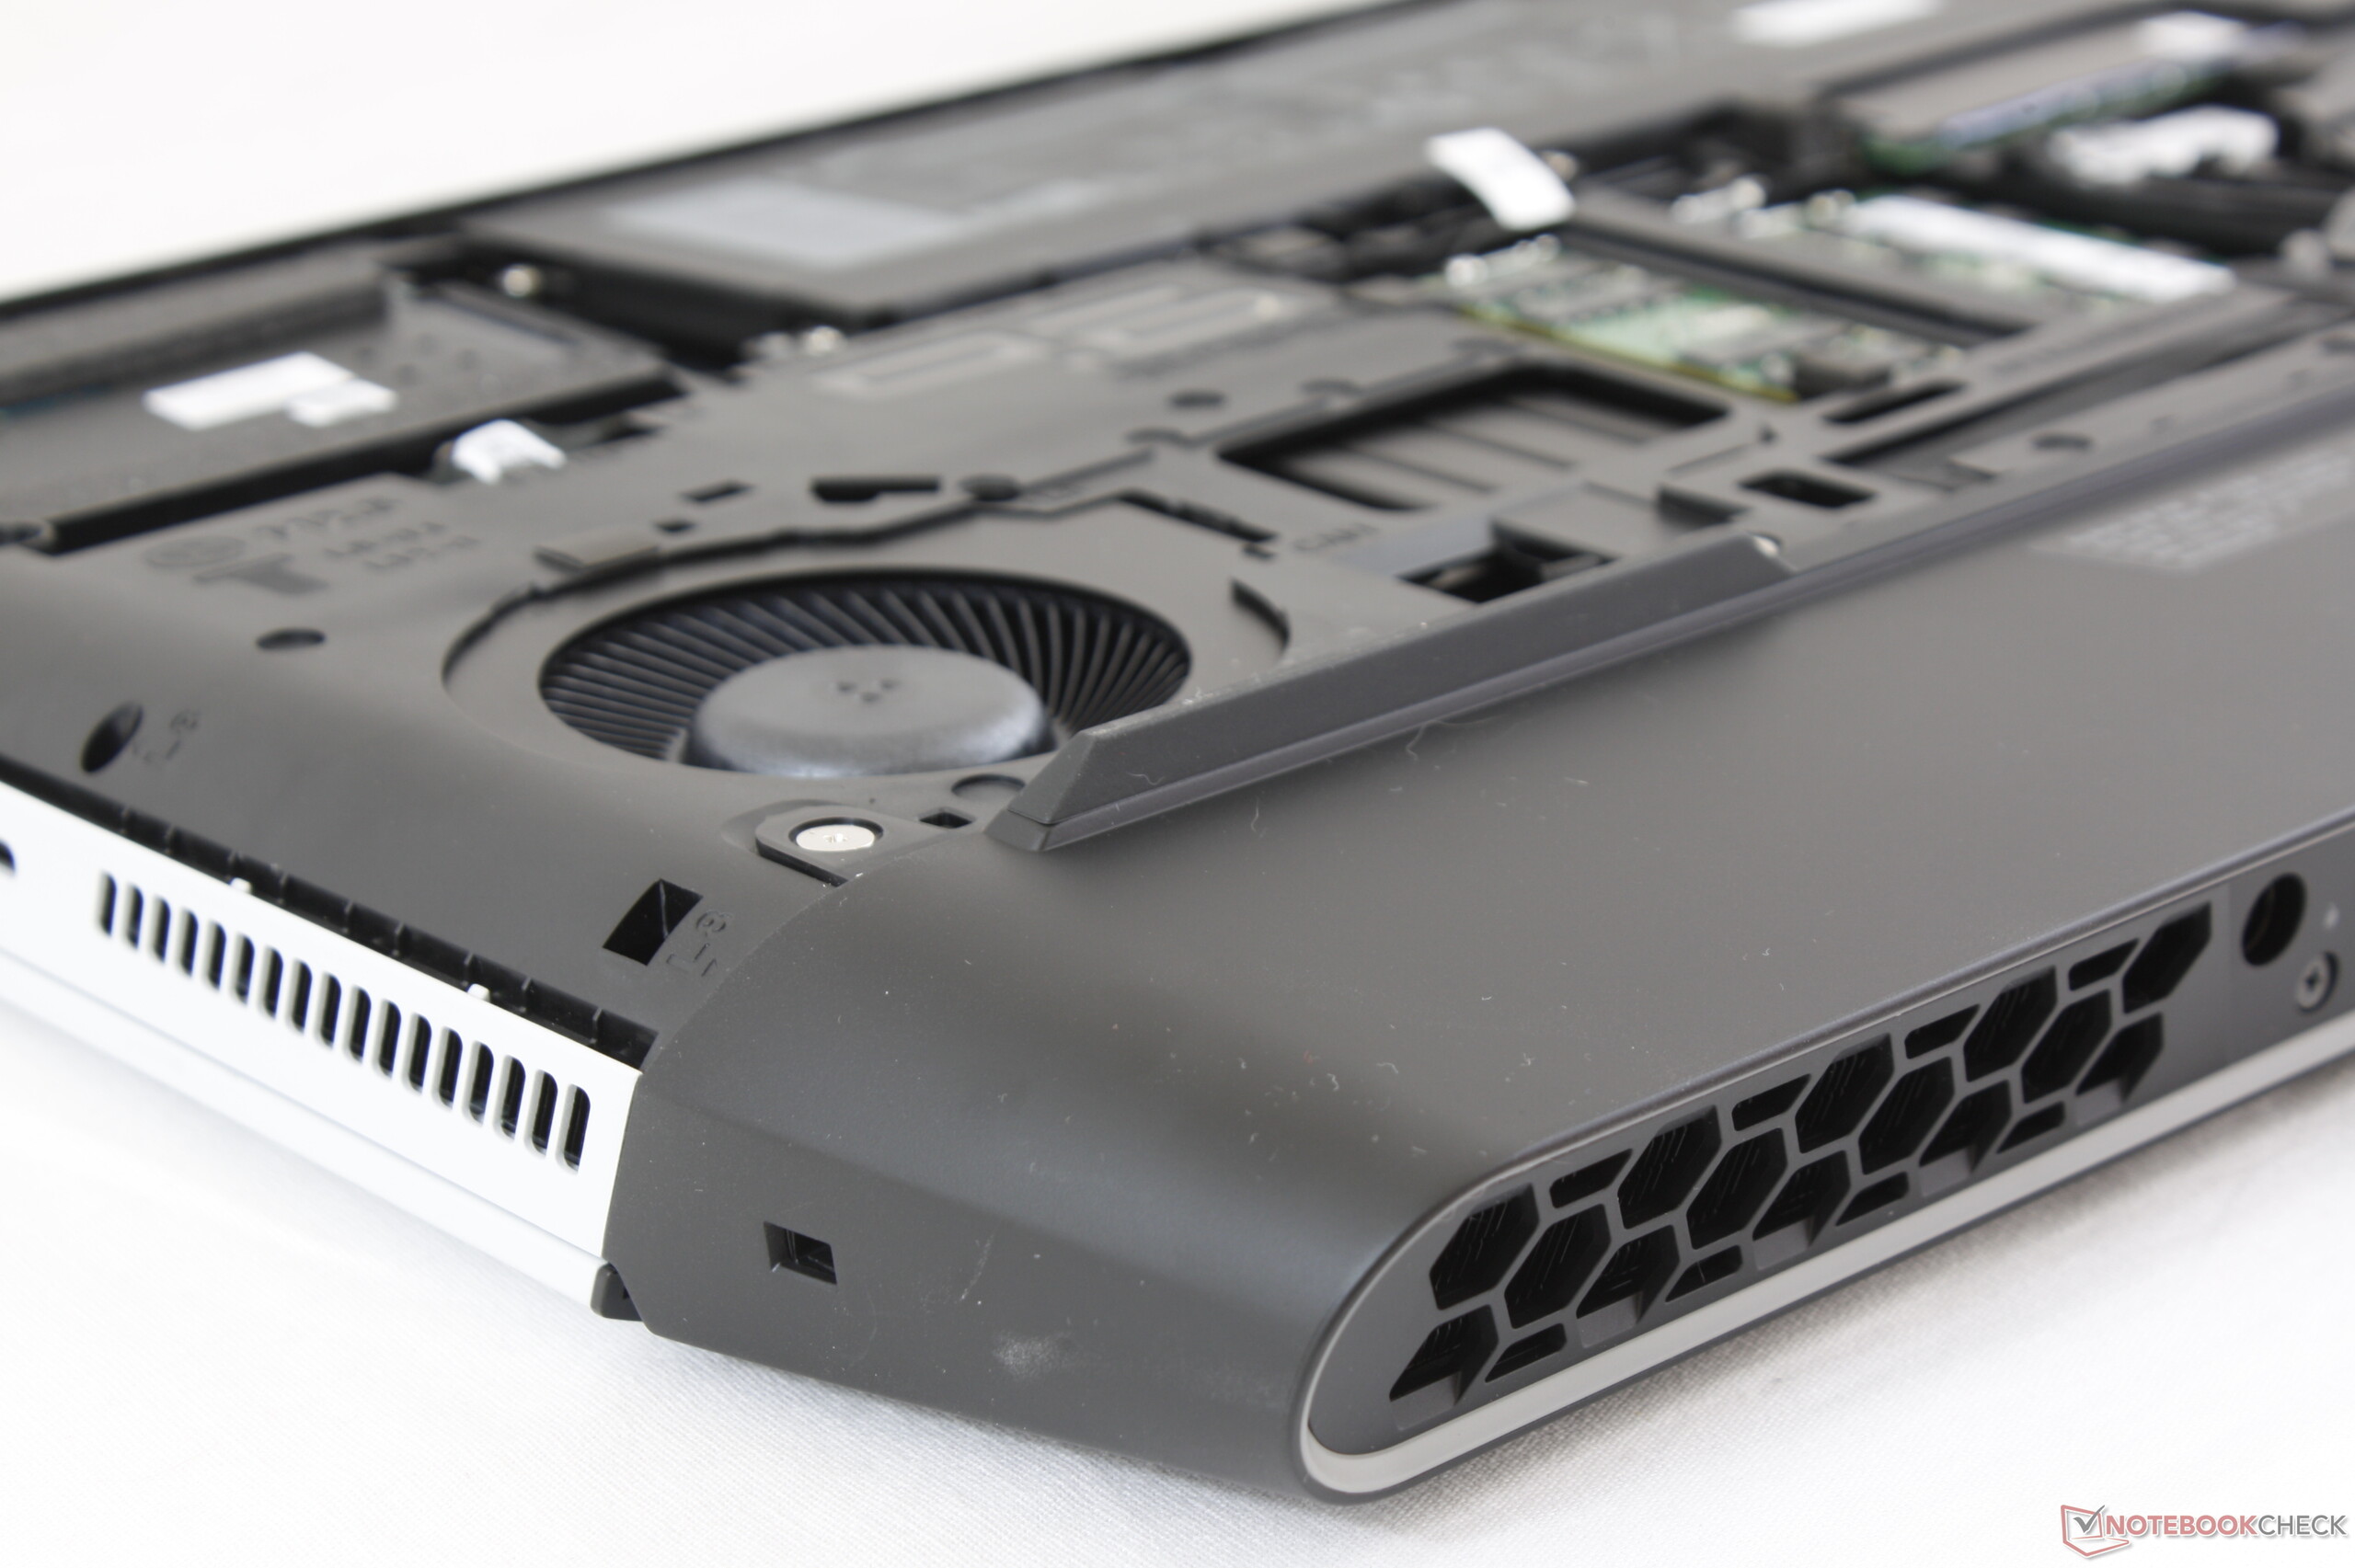
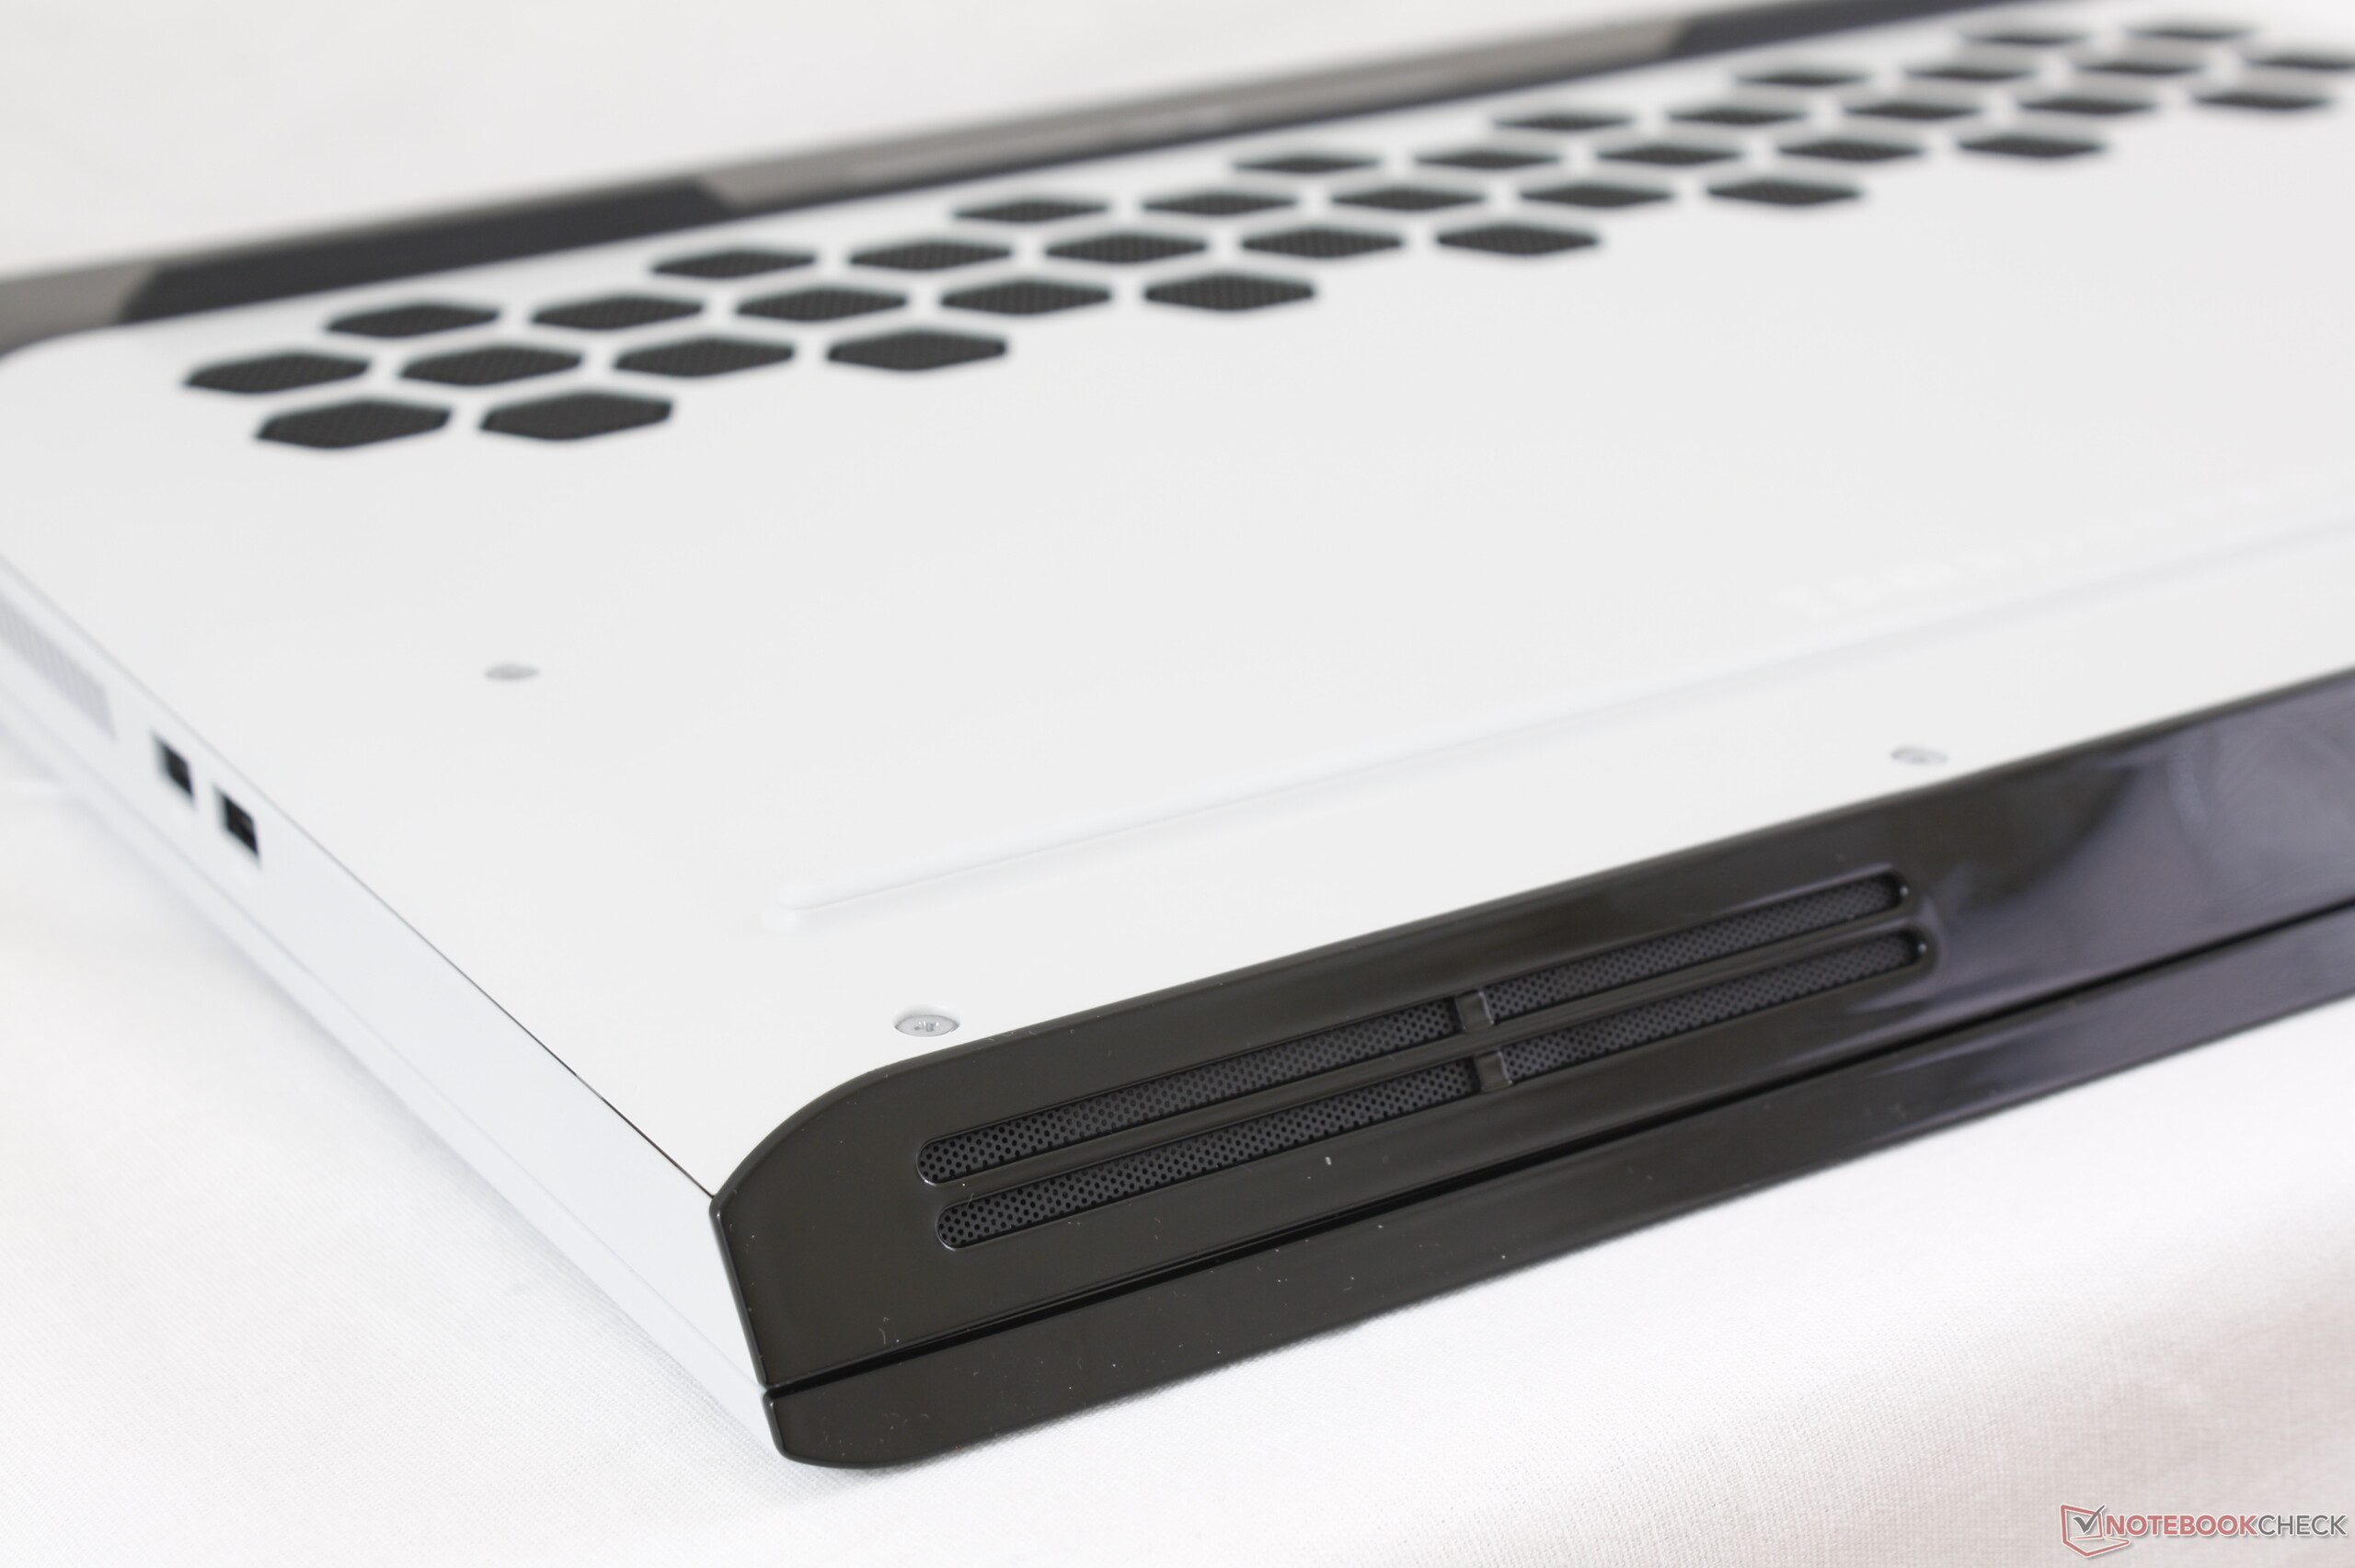
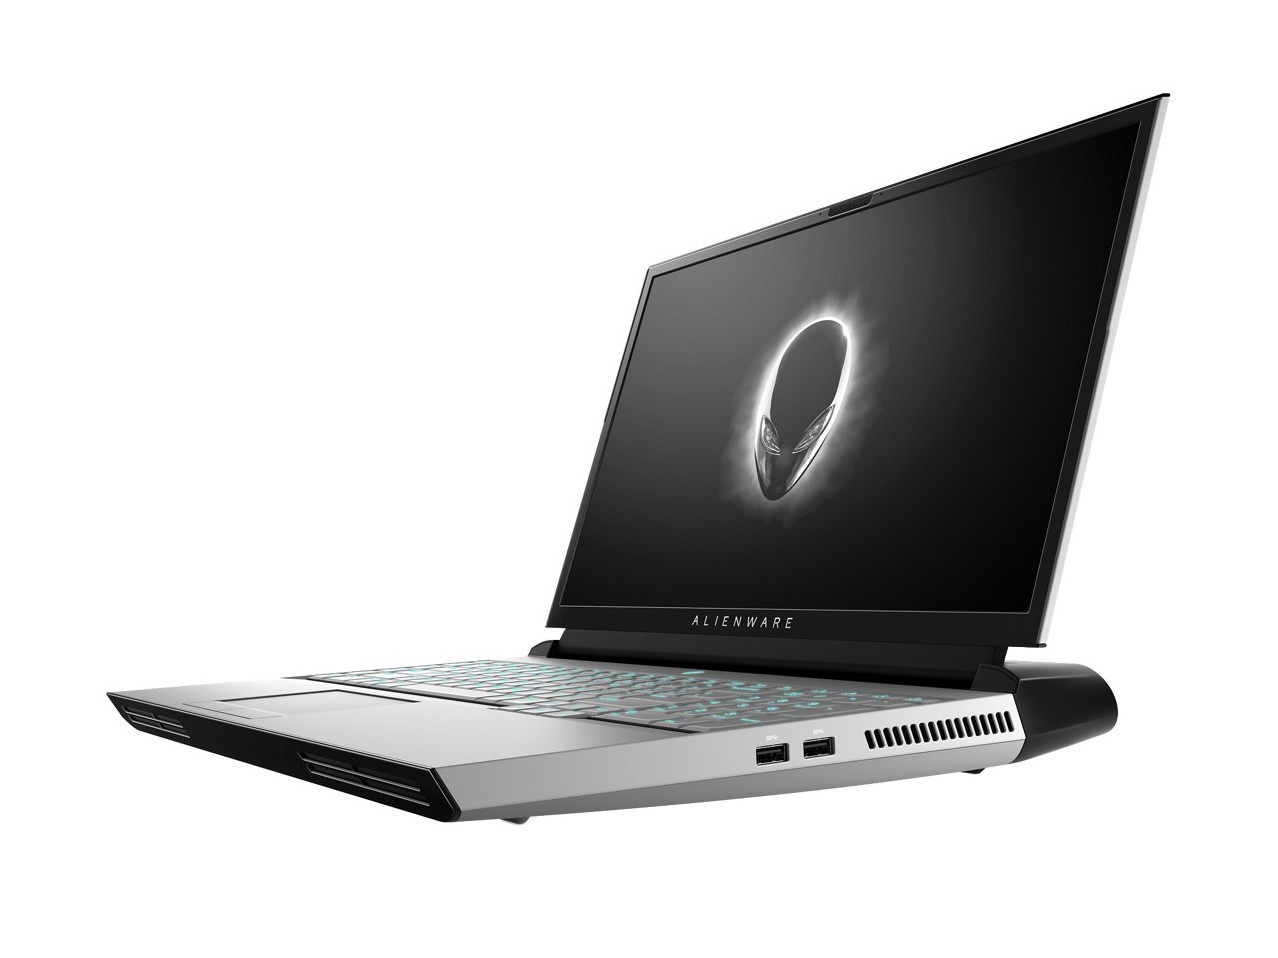
Sett från generationen till generation är Area-51m en respektabel efterföljare till Alienware 17 R5. Den behåller allt som vi gillade hos den äldre modellen (snedslipat tangentbord, robust design, lätt att underhålla) samtidigt som den uppdaterar många aspekter som vi kände behövde mer omsorg (starkare kylning, tunnare infattning, högre prestanda). Batteritiden är dålig, men är det verkligen prioriterat föreslår vi en titt på Alienware m17 istället.
Prestandan är, icke förvånande, den här datorns riktiga höjdpunkt. Bara faktum att maskinen endast hamnar några procent bakom den desktop-PC vi har som referens är imponerande. Fläktens ljudnivå när man spelar är i princip samma som hos Alienware 17 R5, vilket är bra med tanke på den massiva ökningen i prestanda, men det är också en besvikelse för alla som hoppades på en tystare maskin.
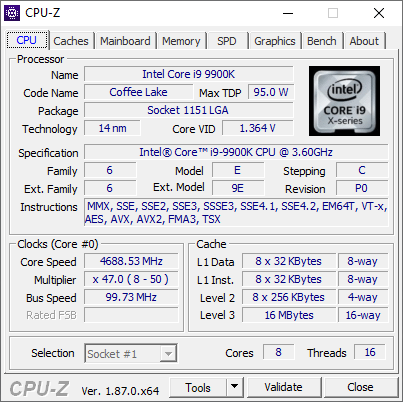
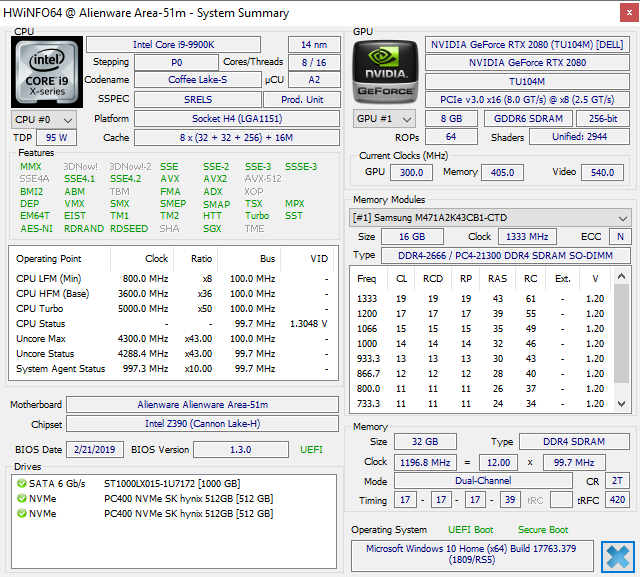
Det som gör Area-51m så speciell är också dess största brist. Det uppgraderingsbara och påstått framtidssäkra DGFF-grafikkortet, till exempel, är definitivt ett coolt koncept. Men innan det faktiskt finns en efterföljare till RTX 2080 känns det för tillfället mest som ett experiment. För det andra så ökar steget till en Core i9-9900K på över 95W förvisso definitivt CPU-prestandan jämfört med den traditionella Coffee Lake H-lösningen på 45W, men det gör ont att se kärntemperaturer på över 99 C när processorn används fullt ut.
Även om såpass höga kärntemperaturer inte i sig behöver vara osäkra så tycker vi inte det är ursäktat. Eurocom Sky X7C inrymmer en likadan Core i9 CPU men stannar ändå på 84 C när den utsätts för samma stresstest och den behöver inte strypa klockfrekvensen. Om Clevo klarar det finns det ingen anledning att Dell inte heller skulle kunna göra det.
Nästa nackdel är något vi inte förväntade oss. Kontrastförhållandet är inte lika djupt som på förra årets Alienware 17 R5 eller som på MSI GT75. Detta må vara en av de snabbaste bärbara speldatorerna som finns att tillgå, men den har inte riktigt den bästa skärmen på alla punkter.
Även om nackdelarna märks så förtar de inte faktum att Area-51m är ett stort steg upp från den åldrade Alienware 17-serien. Om Dell fortsätter på sin CPU- och DGFF-väg så hoppas vi på både tystare fläktar och svalare temperaturer till kommande revideringar.
Överdrift på bästa möjliga sätt. Det finns definitivt rum för förbättring när det kommer till kärntemperaturerna och fläktarnas ljudnivå jämfört med Eurocom Sky X7C. Men sett som en efterföljare till Alienware 17 så träffar den rätt på alla punkter den behöver för att vara en stark desktop-ersättning.
Alienware Area-51m i9-9900K RTX 2080
- 09/20/2019 v7 (old)
Allen Ngo
Price comparison
