Test: Dell G7 15 (i7-8750H, GTX 1060 Max-Q) Laptop (Sammanfattning)
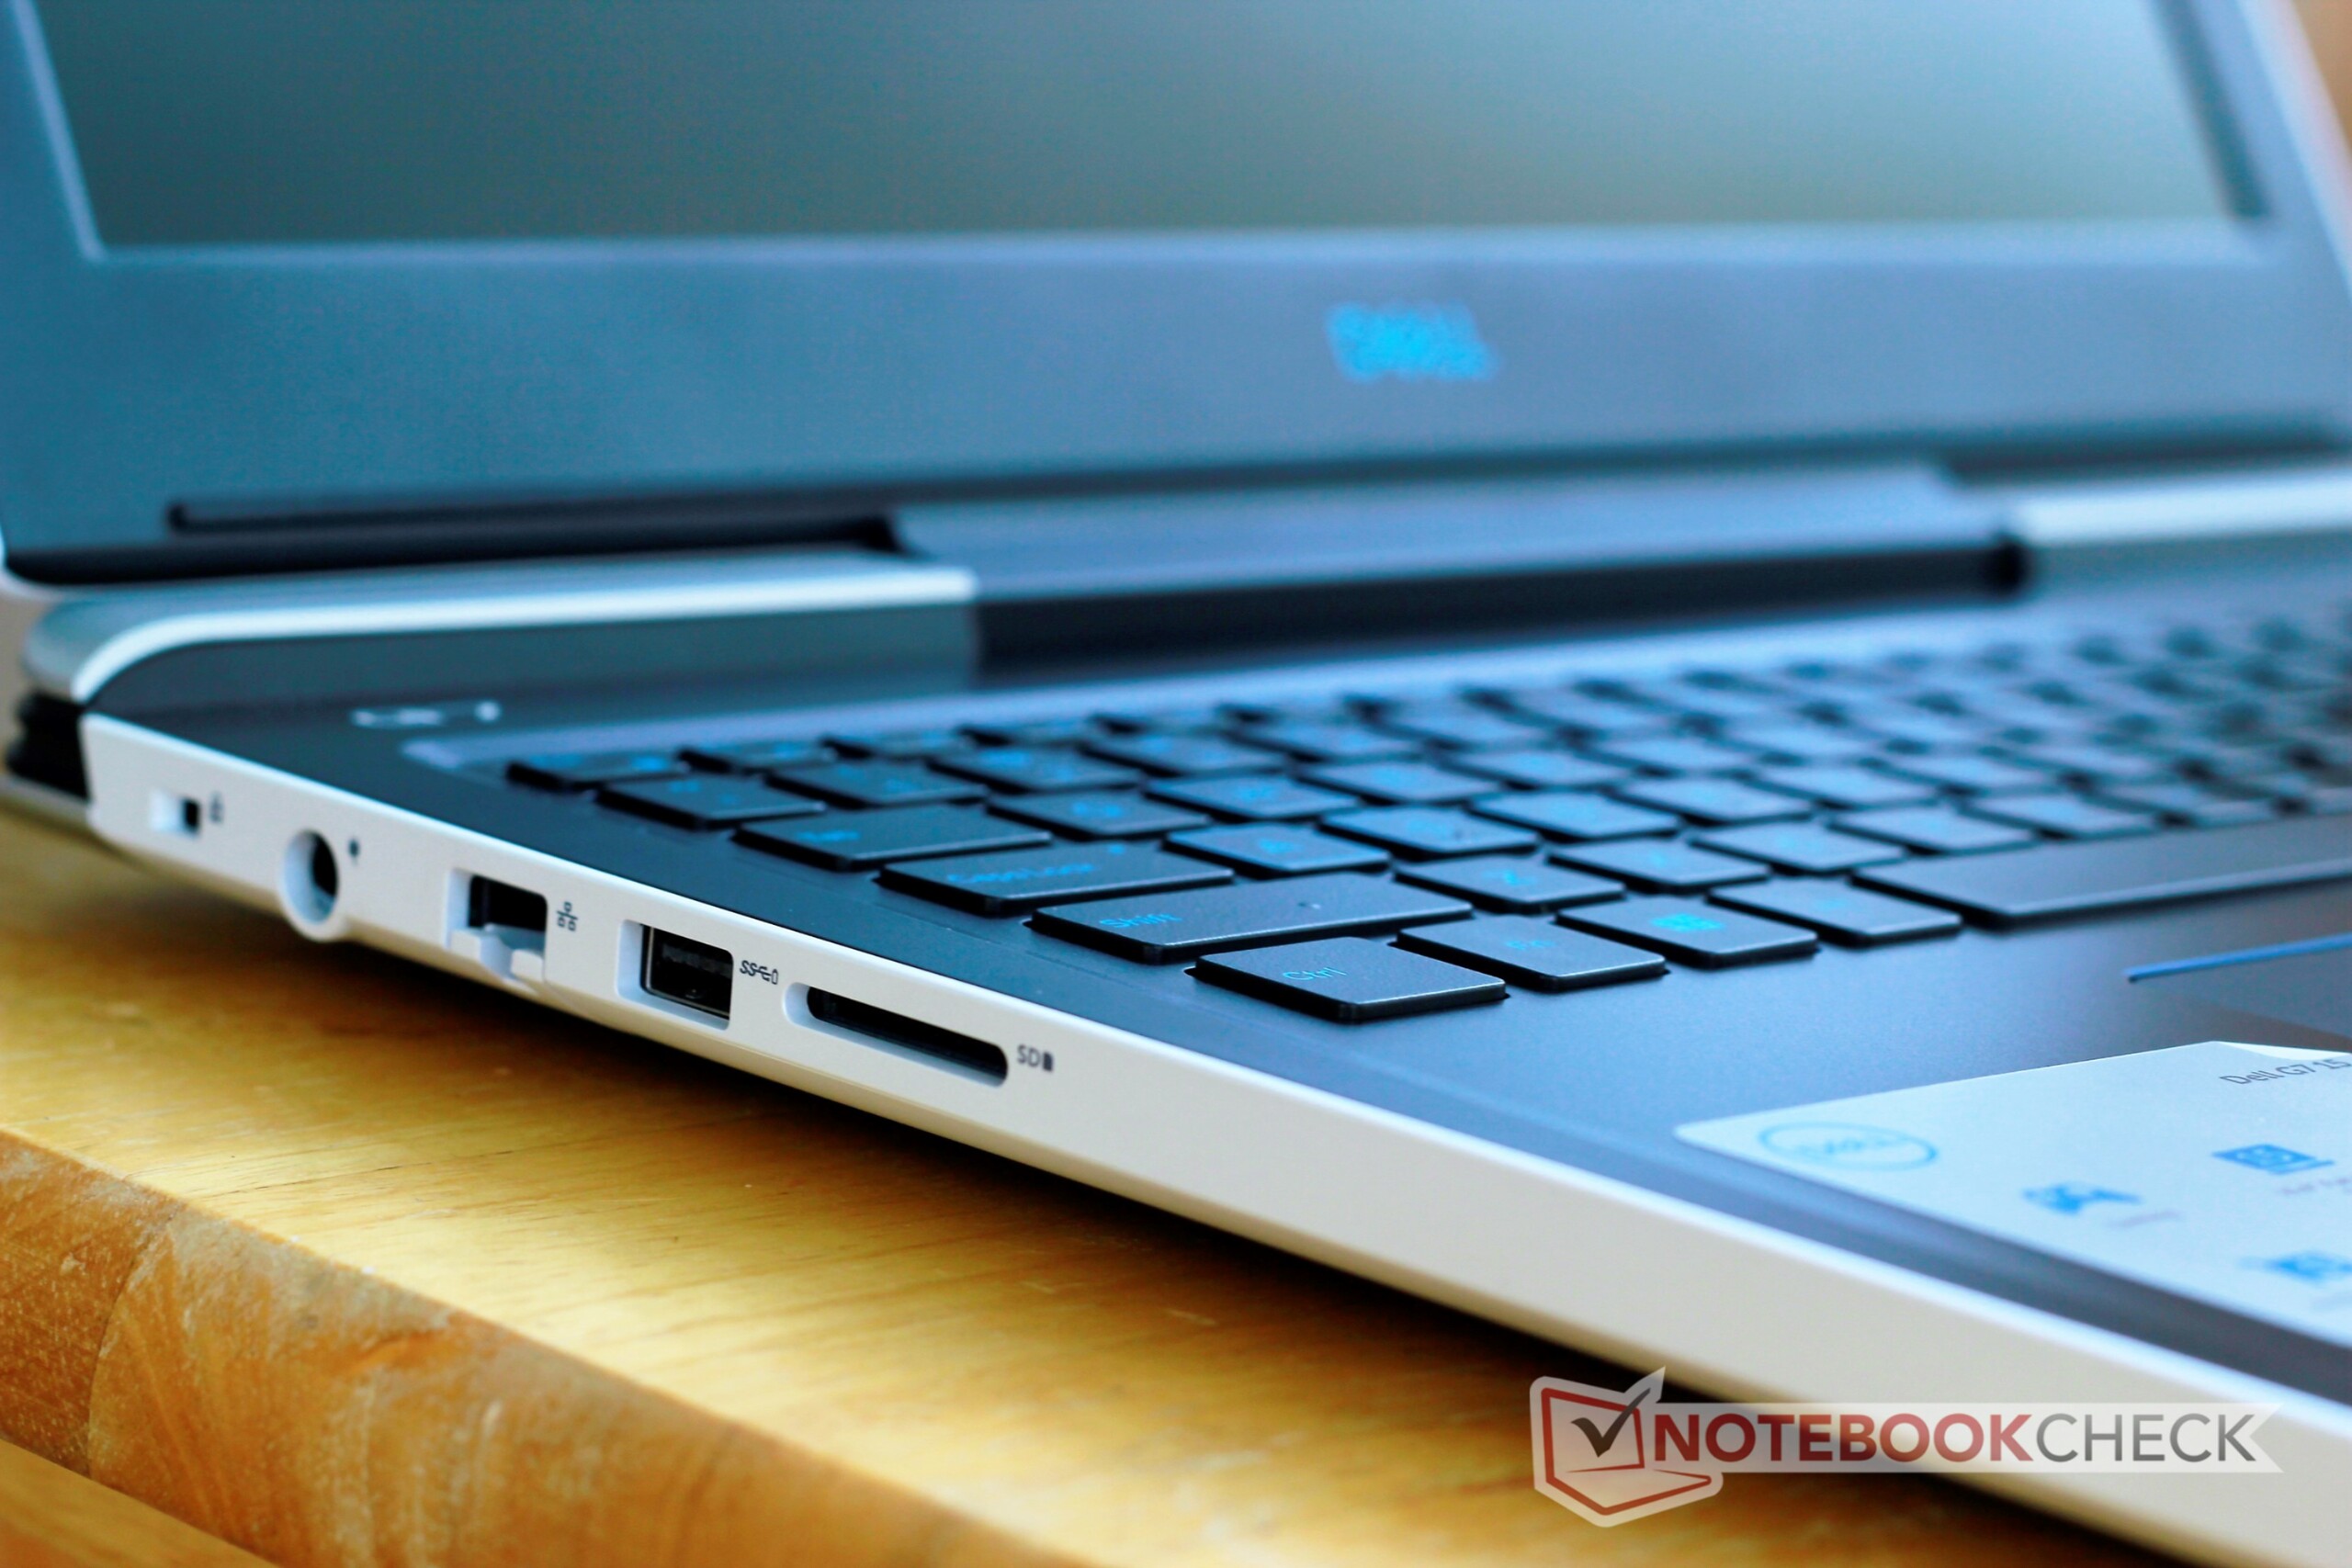


| SD Card Reader | |
| average JPG Copy Test (av. of 3 runs) | |
| Genomsnitt av klass Gaming (20.9 - 210, n=54, senaste 2 åren) | |
| Asus FX503VM-EH73 (Toshiba Exceria Pro SDXC 64 GB UHS-II) | |
| Acer Predator Helios 300 PH317-52-51M6 (Toshiba Exceria Pro SDXC 64 GB UHS-II) | |
| HP Omen 15t-ce000 (Toshiba Exceria Pro SDXC 64 GB UHS-II) | |
| Dell Inspiron 15 7000 7577 (Toshiba Exceria Pro SDXC 64 GB UHS-II) | |
| Dell G7 15-7588 (Toshiba Exceria Pro SDXC 64 GB UHS-II) | |
| maximum AS SSD Seq Read Test (1GB) | |
| Genomsnitt av klass Gaming (25.5 - 261, n=51, senaste 2 åren) | |
| HP Omen 15t-ce000 (Toshiba Exceria Pro SDXC 64 GB UHS-II) | |
| Asus FX503VM-EH73 (Toshiba Exceria Pro SDXC 64 GB UHS-II) | |
| Acer Predator Helios 300 PH317-52-51M6 (Toshiba Exceria Pro SDXC 64 GB UHS-II) | |
| Dell G7 15-7588 (Toshiba Exceria Pro SDXC 64 GB UHS-II) | |
| Dell Inspiron 15 7000 7577 (Toshiba Exceria Pro SDXC 64 GB UHS-II) | |
| |||||||||||||||||||||||||
Distribution av ljusstyrkan: 89 %
Mitt på batteriet: 250.9 cd/m²
Kontrast: 738:1 (Svärta: 0.34 cd/m²)
ΔE ColorChecker Calman: 7.34 | ∀{0.5-29.43 Ø4.71}
calibrated: 4.42
ΔE Greyscale Calman: 6.8 | ∀{0.09-98 Ø4.96}
56% sRGB (Argyll 1.6.3 3D)
36% AdobeRGB 1998 (Argyll 1.6.3 3D)
39.2% AdobeRGB 1998 (Argyll 3D)
56.2% sRGB (Argyll 3D)
37.82% Display P3 (Argyll 3D)
Gamma: 2.164
CCT: 6780 K
| Dell G7 15-7588 LG Philips LGD053F, IPS, 15.6", 1920x1080 | Dell Inspiron 15 7000 7577 ID: LG Philips LGD053F, Name: 156WF6, Dell P/N: 4XK13, IPS, 15.6", 1920x1080 | Acer Predator Helios 300 PH317-52-51M6 LG Philips LP173WF4-SPF5 (LGD056D), IPS, 17.3", 1920x1080 | Asus FX503VM-EH73 AU Optronics B156HAN06.1, IPS, 15.6", 1920x1080 | HP Omen 15t-ce000 AU Optronics AUO23EB, IPS, 15.6", 3840x2160 | Lenovo Legion Y530-15ICH B156HAN02.1, IPS, 15.6", 1920x1080 | |
|---|---|---|---|---|---|---|
| Display | -2% | 64% | -1% | 70% | 1% | |
| Display P3 Coverage (%) | 37.82 | 37.07 -2% | 67.1 77% | 37.48 -1% | 66.1 75% | 38.31 1% |
| sRGB Coverage (%) | 56.2 | 55.6 -1% | 86.1 53% | 56.3 0% | 91.8 63% | 57.3 2% |
| AdobeRGB 1998 Coverage (%) | 39.2 | 38.32 -2% | 63 61% | 38.72 -1% | 66.9 71% | 39.58 1% |
| Response Times | 3% | 13% | -7% | 5% | -17% | |
| Response Time Grey 50% / Grey 80% * (ms) | 38.8 ? | 35.6 ? 8% | 36 ? 7% | 36.8 ? 5% | 37.6 ? 3% | 43.6 ? -12% |
| Response Time Black / White * (ms) | 26.8 ? | 27.6 ? -3% | 22 ? 18% | 31.6 ? -18% | 24.8 ? 7% | 32.4 ? -21% |
| PWM Frequency (Hz) | 122000 ? | |||||
| Screen | 12% | 31% | 14% | 38% | 10% | |
| Brightness middle (cd/m²) | 250.9 | 235.4 -6% | 365 45% | 235.9 -6% | 358.5 43% | 282.8 13% |
| Brightness (cd/m²) | 246 | 223 -9% | 341 39% | 235 -4% | 350 42% | 264 7% |
| Brightness Distribution (%) | 89 | 91 2% | 89 0% | 91 2% | 95 7% | 88 -1% |
| Black Level * (cd/m²) | 0.34 | 0.28 18% | 0.32 6% | 0.27 21% | 0.39 -15% | 0.42 -24% |
| Contrast (:1) | 738 | 841 14% | 1141 55% | 874 18% | 919 25% | 673 -9% |
| Colorchecker dE 2000 * | 7.34 | 5.6 24% | 6.51 11% | 4.81 34% | 4.6 37% | 4.93 33% |
| Colorchecker dE 2000 max. * | 28.66 | 20.3 29% | 12.32 57% | 21.55 25% | 8.5 70% | 17.65 38% |
| Colorchecker dE 2000 calibrated * | 4.42 | 2.9 34% | 4.07 8% | |||
| Greyscale dE 2000 * | 6.8 | 3.6 47% | 7.65 -13% | 3.1 54% | 5.2 24% | 3.8 44% |
| Gamma | 2.164 102% | 2.23 99% | 2.64 83% | 2.31 95% | 2.28 96% | 2.449 90% |
| CCT | 6780 96% | 7214 90% | 8066 81% | 6984 93% | 6410 101% | 6112 106% |
| Color Space (Percent of AdobeRGB 1998) (%) | 36 | 35.2 -2% | 56 56% | 36 0% | 66.9 86% | 36 0% |
| Color Space (Percent of sRGB) (%) | 56 | 55.4 -1% | 86 54% | 56 0% | 91.8 64% | 57 2% |
| Totalt genomsnitt (program/inställningar) | 4% /
8% | 36% /
35% | 2% /
9% | 38% /
40% | -2% /
5% |
* ... mindre är bättre
Visa svarstider
| ↔ Svarstid svart till vitt | ||
|---|---|---|
| 26.8 ms ... stiga ↗ och falla ↘ kombinerat | ↗ 14.4 ms stiga | 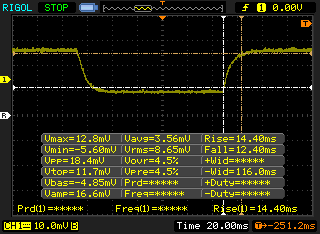 |
| ↘ 12.4 ms hösten | ||
| Skärmen visar relativt långsamma svarsfrekvenser i våra tester och kan vara för långsam för spelare. I jämförelse sträcker sig alla testade enheter från 0.1 (minst) till 240 (maximalt) ms. » 67 % av alla enheter är bättre. Detta innebär att den uppmätta svarstiden är sämre än genomsnittet av alla testade enheter (19.8 ms). | ||
| ↔ Svarstid 50 % grått till 80 % grått | ||
| 38.8 ms ... stiga ↗ och falla ↘ kombinerat | ↗ 16 ms stiga | 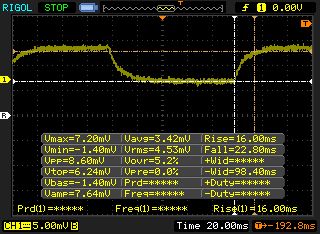 |
| ↘ 22.8 ms hösten | ||
| Skärmen visar långsamma svarsfrekvenser i våra tester och kommer att vara otillfredsställande för spelare. I jämförelse sträcker sig alla testade enheter från 0.165 (minst) till 636 (maximalt) ms. » 58 % av alla enheter är bättre. Detta innebär att den uppmätta svarstiden är sämre än genomsnittet av alla testade enheter (31 ms). | ||
Skärmflimmer / PWM (Puls-Width Modulation)
| Skärmflimmer / PWM upptäcktes inte | 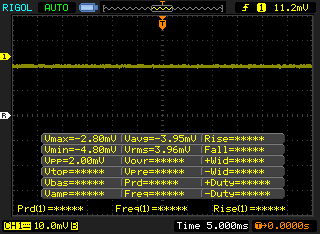 | ||
Som jämförelse: 52 % av alla testade enheter använder inte PWM för att dämpa skärmen. Om PWM upptäcktes mättes ett medelvärde av 7757 (minst: 5 - maximum: 343500) Hz. | |||
| wPrime 2.10 - 1024m | |
| Asus ROG Strix GL702ZC-GC204T | |
| Dell Inspiron 15 7000 7577 | |
| Acer Nitro 5 (AMD Ryzen & Polaris) | |
| Asus FX503VM-EH73 | |
| Genomsnitt Intel Core i7-8750H (125.5 - 180.5, n=6) | |
| Dell G7 15-7588 | |
| Genomsnitt av klass Gaming (33 - 210, n=6, senaste 2 åren) | |
* ... mindre är bättre
| PCMark 8 Home Score Accelerated v2 | 3968 poäng | |
| PCMark 8 Work Score Accelerated v2 | 5410 poäng | |
| PCMark 10 Score | 5285 poäng | |
Hjälp | ||
| Dell G7 15-7588 SK hynix SC311 SATA | Dell Inspiron 15 7000 7577 Samsung PM961 MZVLW256HEHP | Acer Predator Helios 300 PH317-52-51M6 Hynix HFS128G39TND | Asus FX503VM-EH73 SanDisk SD8SN8U128G1002 | HP Omen 15t-ce000 Samsung PM961 NVMe MZVLW128HEGR | Lenovo Legion Y530-15ICH Toshiba KBG30ZMT128G | |
|---|---|---|---|---|---|---|
| AS SSD | 227% | -3% | 19% | 146% | -23% | |
| Copy Game MB/s (MB/s) | 223.2 | 382.5 71% | 736 230% | |||
| Copy Program MB/s (MB/s) | 126.9 | 274.8 117% | 195.4 54% | |||
| Copy ISO MB/s (MB/s) | 460.8 | 814 77% | 1087 136% | |||
| Score Total (Points) | 528 | 2405 355% | 811 54% | 798 51% | 1515 187% | 838 59% |
| Score Write (Points) | 181 | 594 228% | 196 8% | 178 -2% | 361 99% | 128 -29% |
| Score Read (Points) | 233 | 1241 433% | 414 78% | 411 76% | 789 239% | 497 113% |
| Access Time Write * (ms) | 0.068 | 0.037 46% | 0.259 -281% | 0.09 -32% | 0.034 50% | 0.287 -322% |
| Access Time Read * (ms) | 0.161 | 0.058 64% | 0.17 -6% | 0.071 56% | 0.626 -289% | |
| 4K-64 Write (MB/s) | 99.6 | 375.8 277% | 120.1 21% | 95.5 -4% | 175.9 77% | 78.9 -21% |
| 4K-64 Read (MB/s) | 158.8 | 929 485% | 336.6 112% | 343.4 116% | 568 258% | 335.3 111% |
| 4K Write (MB/s) | 59.8 | 100.2 68% | 62.7 5% | 46.48 -22% | 111.2 86% | 35.74 -40% |
| 4K Read (MB/s) | 23.66 | 46.95 98% | 26.5 12% | 20.44 -14% | 43.09 82% | 38.71 64% |
| Seq Write (MB/s) | 220.3 | 1181 436% | 128.2 -42% | 328.4 49% | 743 237% | 131.6 -40% |
| Seq Read (MB/s) | 506 | 2652 424% | 513 1% | 476.3 -6% | 1774 251% | 1231 143% |
* ... mindre är bättre

| 3DMark 11 Performance | 13296 poäng | |
| 3DMark Cloud Gate Standard Score | 32658 poäng | |
| 3DMark Fire Strike Score | 9936 poäng | |
Hjälp | ||
| Rise of the Tomb Raider | |
| 1920x1080 Very High Preset AA:FX AF:16x (sortera efter värde) | |
| Dell G7 15-7588 | |
| Asus FX503VM-EH73 | |
| Apple MacBook Pro 15 2018 (2.6 GHz, 560X) | |
| Acer Swift 3 SF315-41G-R6BR | |
| Dell G3 15 3579 | |
| Genomsnitt NVIDIA GeForce GTX 1060 Max-Q (45.3 - 66.4, n=8) | |
| 1920x1080 High Preset AA:FX AF:4x (sortera efter värde) | |
| Dell G7 15-7588 | |
| Apple MacBook Pro 15 2018 (2.6 GHz, 560X) | |
| Acer Swift 3 SF315-41G-R6BR | |
| Dell G3 15 3579 | |
| Genomsnitt NVIDIA GeForce GTX 1060 Max-Q (63 - 73.3, n=7) | |
| 1366x768 Medium Preset AF:2x (sortera efter värde) | |
| Dell G7 15-7588 | |
| Acer Swift 3 SF315-41G-R6BR | |
| Dell G3 15 3579 | |
| Genomsnitt NVIDIA GeForce GTX 1060 Max-Q (111 - 133.3, n=6) | |
| 1024x768 Lowest Preset (sortera efter värde) | |
| Dell G7 15-7588 | |
| Acer Swift 3 SF315-41G-R6BR | |
| Dell G3 15 3579 | |
| Genomsnitt NVIDIA GeForce GTX 1060 Max-Q (148.1 - 203, n=5) | |
| låg | med. | hög | ultra | |
|---|---|---|---|---|
| The Witcher 3 (2015) | 189 | 125 | 62 | 37 |
| Rise of the Tomb Raider (2016) | 203 | 130 | 70 | 57 |
| Final Fantasy XV Benchmark (2018) | 109 | 59 | 43 | |
| Kingdom Come: Deliverance (2018) | 60 | 58 | 56 | 41 |
Ljudnivå
| Låg belastning |
| 29 / 29 / 29.2 dB(A) |
| Hög belastning |
| 40.6 / 49.8 dB(A) |
 | ||
30 dB tyst 40 dB(A) hörbar 50 dB(A) högt ljud |
||
min: | ||
| Dell G7 15-7588 GeForce GTX 1060 Max-Q, i7-8750H, SK hynix SC311 SATA | Dell Inspiron 15 7000 7577 GeForce GTX 1060 Max-Q, i5-7300HQ, Samsung PM961 MZVLW256HEHP | Acer Predator Helios 300 PH317-52-51M6 GeForce GTX 1050 Ti Mobile, i5-8300H, Hynix HFS128G39TND | Asus FX503VM-EH73 GeForce GTX 1060 Mobile, i7-7700HQ, SanDisk SD8SN8U128G1002 | HP Omen 15t-ce000 GeForce GTX 1060 Max-Q, i7-7700HQ, Samsung PM961 NVMe MZVLW128HEGR | Lenovo Legion Y530-15ICH GeForce GTX 1050 Ti Mobile, i5-8300H, Toshiba KBG30ZMT128G | |
|---|---|---|---|---|---|---|
| Noise | 9% | -4% | -1% | 2% | 6% | |
| av / miljö * (dB) | 28.1 | 28 -0% | 29 -3% | 27.8 1% | 28.2 -0% | 28 -0% |
| Idle Minimum * (dB) | 29 | 28 3% | 29 -0% | 29.6 -2% | 30.4 -5% | 28 3% |
| Idle Average * (dB) | 29 | 28 3% | 31 -7% | 29.6 -2% | 30.4 -5% | 28 3% |
| Idle Maximum * (dB) | 29.2 | 28 4% | 33 -13% | 29.6 -1% | 30.5 -4% | 28.5 2% |
| Load Average * (dB) | 40.6 | 30.3 25% | 45 -11% | 37.3 8% | 38.5 5% | 34.9 14% |
| Witcher 3 ultra * (dB) | 49.8 | 39.5 21% | 45 10% | 49.8 -0% | 37.6 24% | 40 20% |
| Load Maximum * (dB) | 49.8 | 46.5 7% | 51 -2% | 53.7 -8% | 49 2% | 49.6 -0% |
* ... mindre är bättre
(-) Den maximala temperaturen på ovansidan är 48.6 °C / 119 F, jämfört med genomsnittet av 40.4 °C / 105 F , allt från 21.2 till 68.8 °C för klassen Gaming.
(-) Botten värms upp till maximalt 51.4 °C / 125 F, jämfört med genomsnittet av 43.2 °C / 110 F
(+) Vid tomgångsbruk är medeltemperaturen för ovansidan 22.7 °C / 73 F, jämfört med enhetsgenomsnittet på 33.9 °C / ### class_avg_f### F.
(+) När du spelar The Witcher 3 är medeltemperaturen för ovansidan 30.7 °C / 87 F, jämfört med enhetsgenomsnittet på 33.9 °C / ## #class_avg_f### F.
(+) Handledsstöden och pekplattan är kallare än hudtemperaturen med maximalt 29.4 °C / 84.9 F och är därför svala att ta på.
(±) Medeltemperaturen för handledsstödsområdet på liknande enheter var 28.8 °C / 83.8 F (-0.6 °C / -1.1 F).
Dell G7 15-7588 ljudanalys
(±) | högtalarljudstyrkan är genomsnittlig men bra (74.8 dB)
Bas 100 - 315 Hz
(-) | nästan ingen bas - i genomsnitt 16.7% lägre än medianen
(±) | linjäriteten för basen är genomsnittlig (11.8% delta till föregående frekvens)
Mellan 400 - 2000 Hz
(+) | balanserad mellan - endast 4.6% från medianen
(±) | linjäriteten för mids är genomsnittlig (7.1% delta till föregående frekvens)
Högsta 2 - 16 kHz
(+) | balanserade toppar - endast 4.8% från medianen
(±) | linjäriteten för toppar är genomsnittlig (10.7% delta till föregående frekvens)
Totalt 100 - 16 000 Hz
(±) | linjäriteten för det totala ljudet är genomsnittlig (21.1% skillnad mot median)
Jämfört med samma klass
» 76% av alla testade enheter i den här klassen var bättre, 4% liknande, 20% sämre
» Den bästa hade ett delta på 6%, genomsnittet var 18%, sämst var 132%
Jämfört med alla testade enheter
» 58% av alla testade enheter var bättre, 7% liknande, 34% sämre
» Den bästa hade ett delta på 4%, genomsnittet var 23%, sämst var 134%
Lenovo Legion Y530-15ICH ljudanalys
(±) | högtalarljudstyrkan är genomsnittlig men bra (75.1 dB)
Bas 100 - 315 Hz
(±) | reducerad bas - i genomsnitt 14% lägre än medianen
(±) | linjäriteten för basen är genomsnittlig (14.1% delta till föregående frekvens)
Mellan 400 - 2000 Hz
(+) | balanserad mellan - endast 1.5% från medianen
(+) | mids är linjära (6.7% delta till föregående frekvens)
Högsta 2 - 16 kHz
(+) | balanserade toppar - endast 4.8% från medianen
(±) | linjäriteten för toppar är genomsnittlig (10% delta till föregående frekvens)
Totalt 100 - 16 000 Hz
(±) | linjäriteten för det totala ljudet är genomsnittlig (18.9% skillnad mot median)
Jämfört med samma klass
» 63% av alla testade enheter i den här klassen var bättre, 8% liknande, 29% sämre
» Den bästa hade ett delta på 6%, genomsnittet var 18%, sämst var 132%
Jämfört med alla testade enheter
» 44% av alla testade enheter var bättre, 8% liknande, 48% sämre
» Den bästa hade ett delta på 4%, genomsnittet var 23%, sämst var 134%
| Av/Standby | |
| Låg belastning | |
| Hög belastning |
|
Förklaring:
min: | |
| Dell G7 15-7588 i7-8750H, GeForce GTX 1060 Max-Q, SK hynix SC311 SATA, IPS, 1920x1080, 15.6" | Schenker XMG Neo 15 i7-8750H, GeForce GTX 1060 Mobile, Samsung SSD 970 Pro 1TB, IPS, 1920x1080, 15.6" | Asus Strix GL703GM-DS74 i7-8750H, GeForce GTX 1060 Mobile, Samsung PM961 MZVLW256HEHP, TN LED, 1920x1080, 17.3" | Dell Inspiron 15 7000 7577 i5-7300HQ, GeForce GTX 1060 Max-Q, Samsung PM961 MZVLW256HEHP, IPS, 1920x1080, 15.6" | Acer Predator Helios 300 PH317-52-51M6 i5-8300H, GeForce GTX 1050 Ti Mobile, Hynix HFS128G39TND, IPS, 1920x1080, 17.3" | Asus FX503VM-EH73 i7-7700HQ, GeForce GTX 1060 Mobile, SanDisk SD8SN8U128G1002, IPS, 1920x1080, 15.6" | HP Omen 15t-ce000 i7-7700HQ, GeForce GTX 1060 Max-Q, Samsung PM961 NVMe MZVLW128HEGR, IPS, 3840x2160, 15.6" | Lenovo Legion Y530-15ICH i5-8300H, GeForce GTX 1050 Ti Mobile, Toshiba KBG30ZMT128G, IPS, 1920x1080, 15.6" | |
|---|---|---|---|---|---|---|---|---|
| Power Consumption | -45% | -127% | 10% | -8% | -47% | -80% | -6% | |
| Idle Minimum * (Watt) | 5.5 | 10 -82% | 18.88 -243% | 7.1 -29% | 6 -9% | 12.8 -133% | 15.4 -180% | 4.5 18% |
| Idle Average * (Watt) | 7.6 | 13 -71% | 24.36 -221% | 7.6 -0% | 9 -18% | 15.4 -103% | 22.4 -195% | 10 -32% |
| Idle Maximum * (Watt) | 9 | 18 -100% | 32.27 -259% | 8.6 4% | 13 -44% | 15.9 -77% | 22.4 -149% | 13.8 -53% |
| Load Average * (Watt) | 94 | 95 -1% | 107.74 -15% | 59.5 37% | 95 -1% | 78 17% | 78.1 17% | 92.5 2% |
| Witcher 3 ultra * (Watt) | 116.3 | 114 2% | 142 -22% | 89 23% | 102 12% | 107.3 8% | 97.5 16% | 108.1 7% |
| Load Maximum * (Watt) | 154.4 | 179 -16% | 160.28 -4% | 112.8 27% | 134 13% | 143.4 7% | 133.52 14% | 123.2 20% |
* ... mindre är bättre
| Dell G7 15-7588 i7-8750H, GeForce GTX 1060 Max-Q, 56 Wh | Dell Inspiron 15 7000 7577 i5-7300HQ, GeForce GTX 1060 Max-Q, 56 Wh | Acer Predator Helios 300 PH317-52-51M6 i5-8300H, GeForce GTX 1050 Ti Mobile, 48 Wh | Asus FX503VM-EH73 i7-7700HQ, GeForce GTX 1060 Mobile, 64 Wh | HP Omen 15t-ce000 i7-7700HQ, GeForce GTX 1060 Max-Q, 70 Wh | Lenovo Legion Y530-15ICH i5-8300H, GeForce GTX 1050 Ti Mobile, 52.5 Wh | |
|---|---|---|---|---|---|---|
| Batteridrifttid | -11% | -12% | -46% | -48% | -45% | |
| Reader / Idle (h) | 10.9 | 11 1% | 11.8 8% | 5.7 -48% | 5 -54% | |
| WiFi v1.3 (h) | 7.5 | 6.9 -8% | 5.9 -21% | 4.6 -39% | 3.5 -53% | 4.1 -45% |
| Load (h) | 2.2 | 1.6 -27% | 1.7 -23% | 1.1 -50% | 1.4 -36% |
För
Emot
Läs den fullständiga versionen av den här recensionen på engelska här.
Dell vann en stor seger med sin ursprungliga spellaptop Inspiron 15 7000 för många år sedan och har fortsatt med framgångsrika släpp sedan dess. Förra årets Inspiron 15 7000 7577 var ett populärt budget-alternativ för spel och årets G7 förbättrar erbudandet en aning. Utöver ett nytt namn så erbjuder den uppdaterade processorn en ökning i prestanda på runt 40-50% i processortunga uppgifter och det nya färgschemat resulterar i ett unikt och (subjektivt) attraktivt hölje.
I övrigt är G7 helt enkelt en omdöpt Inspiron 15 7000 7577. Detta är inte dåligt, men den som köpte den utmärkta 7577 förra året har egentligen ingen anledning att uppgradera. Men andra som kör äldre kisel eller letar efter en ny spellaptop på instegsnivå borde sätta G7 överst på sin övervägningslista. Det finns andra modeller på den här sidan av marknaden som har aningen lägre priser och istället gör en del större uppoffringar i fråga om värmehantering, fläktljud och konstruktionskvalitet. G7 kan skryta med konstruktionskvalitet som vida överstiger prisnivån och den presterar enastående.
Dell G7 tar kraftfull hårdvara som vanligtvis används i betydligt dyrare enheter och placerar den i ett vackert och välbyggt hölje med mycket kraft per krona. För budgetmedvetna gamers är det svårt att slå Dell G7.
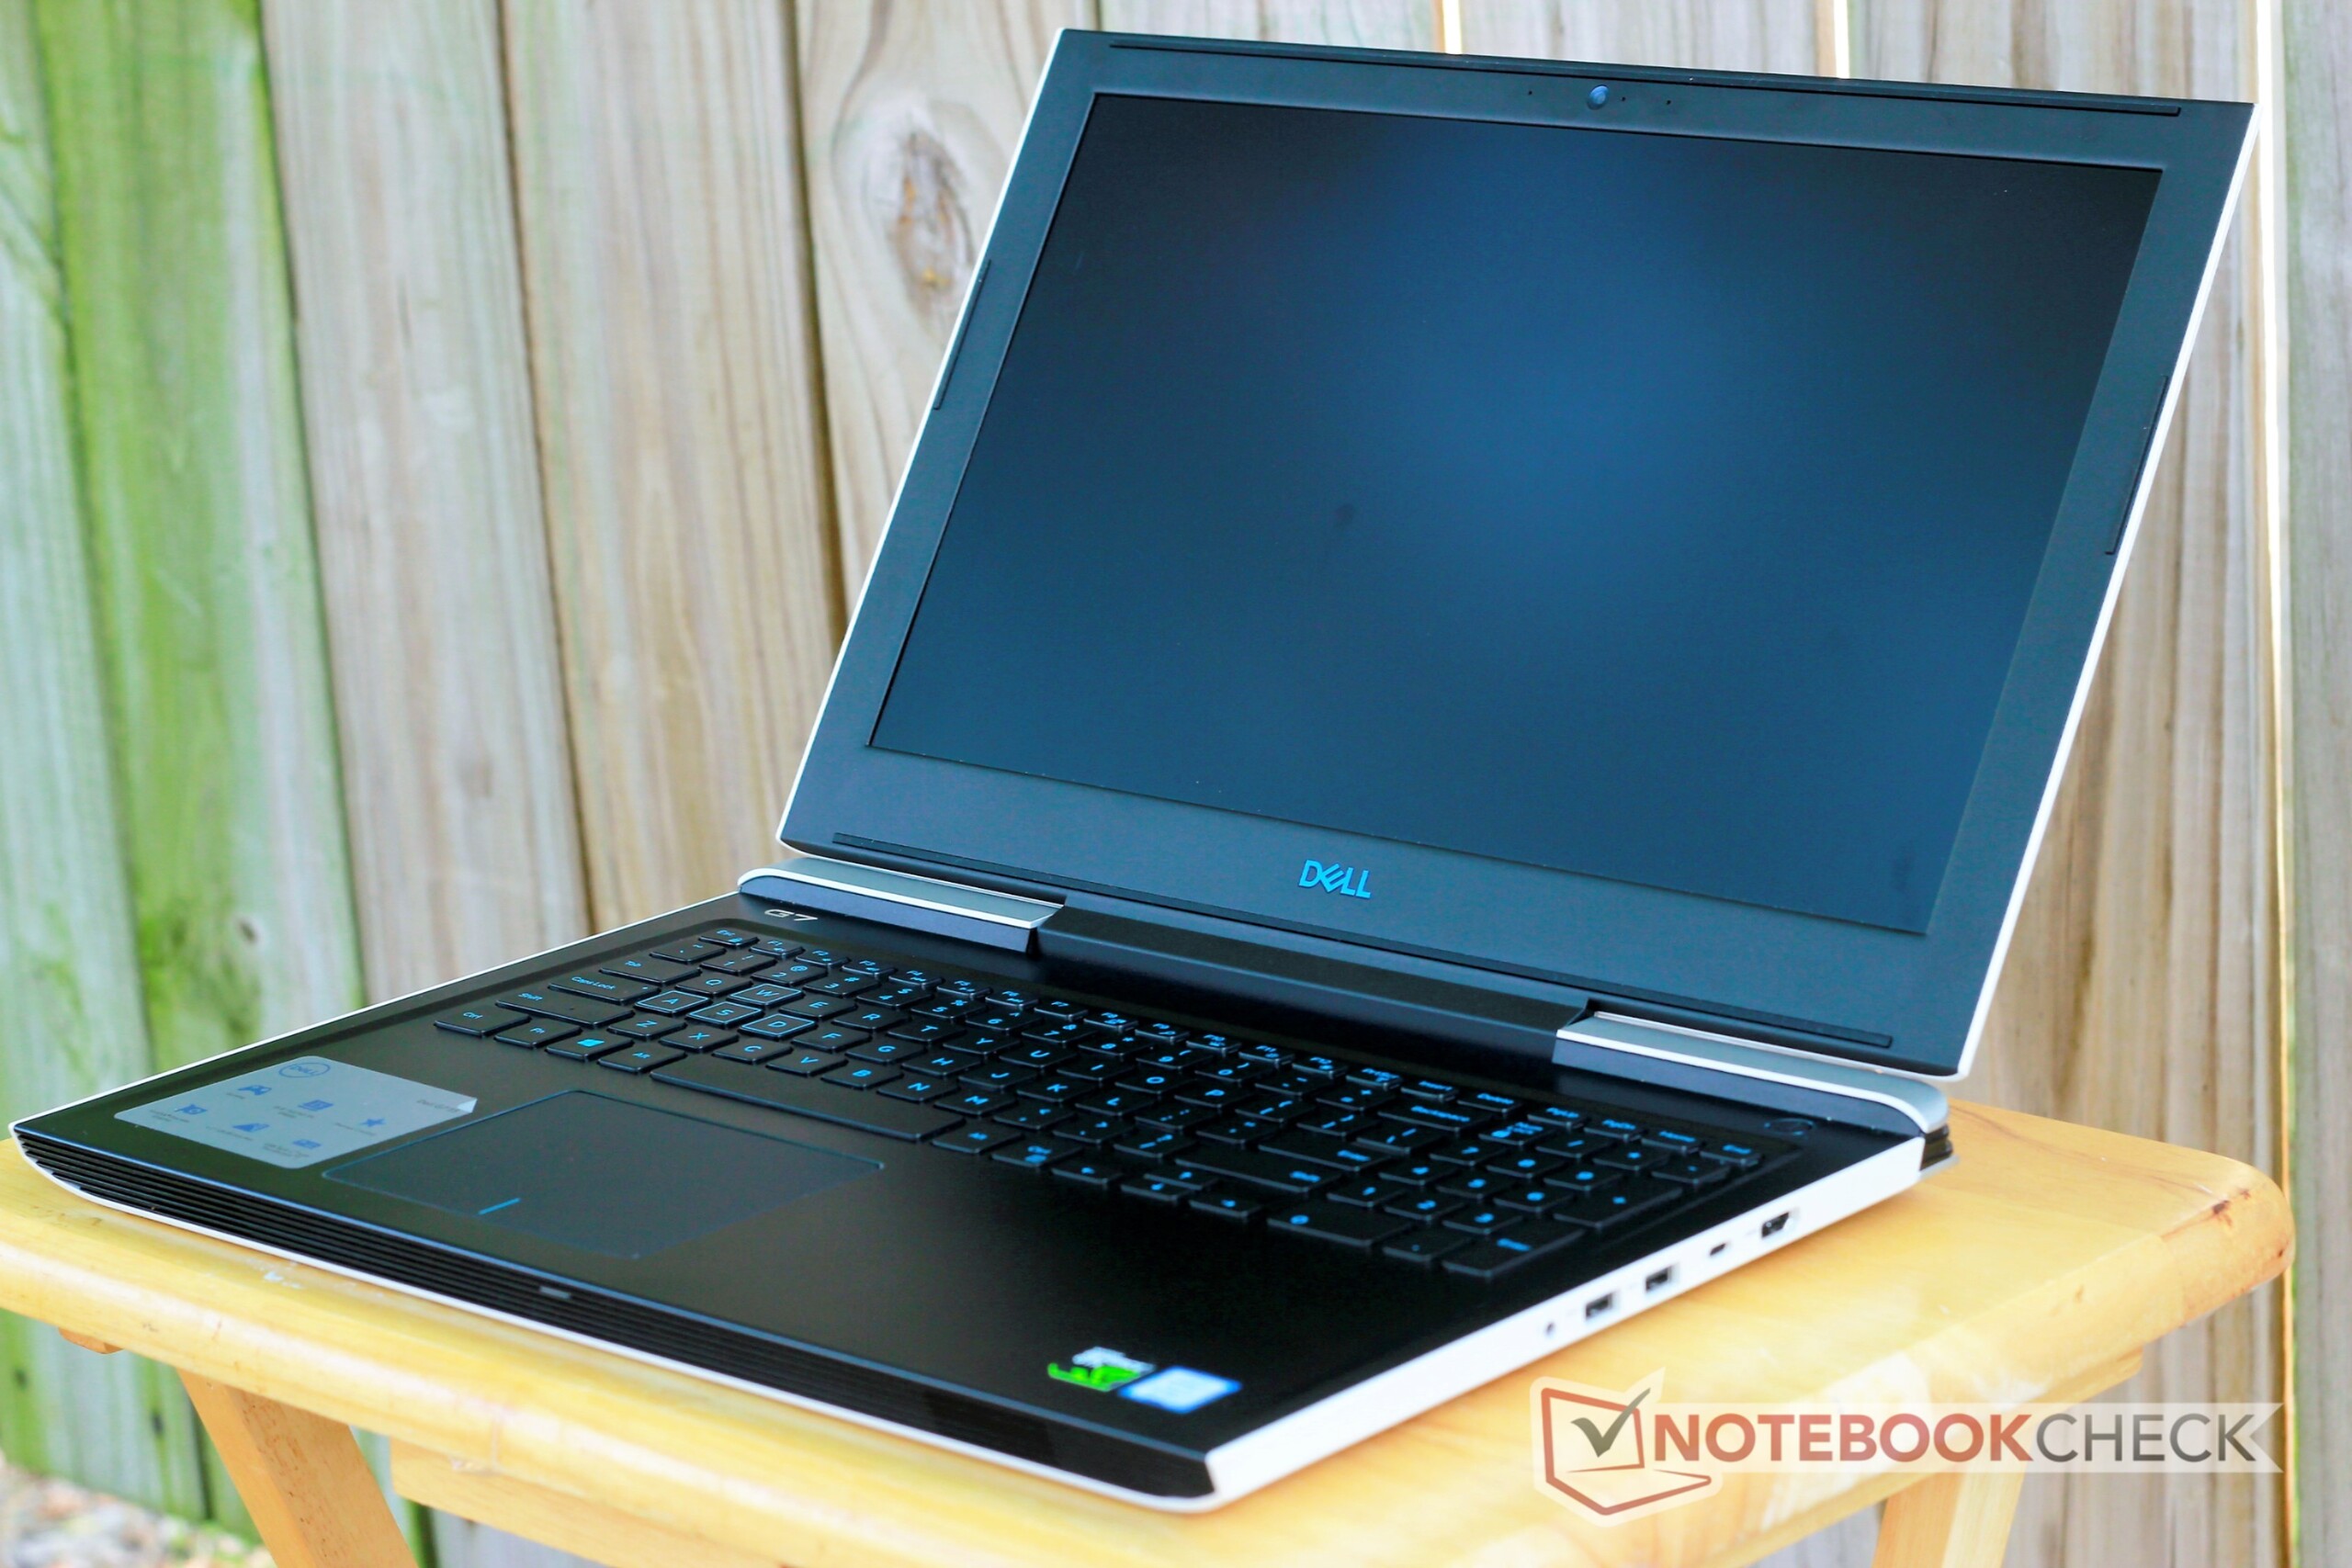
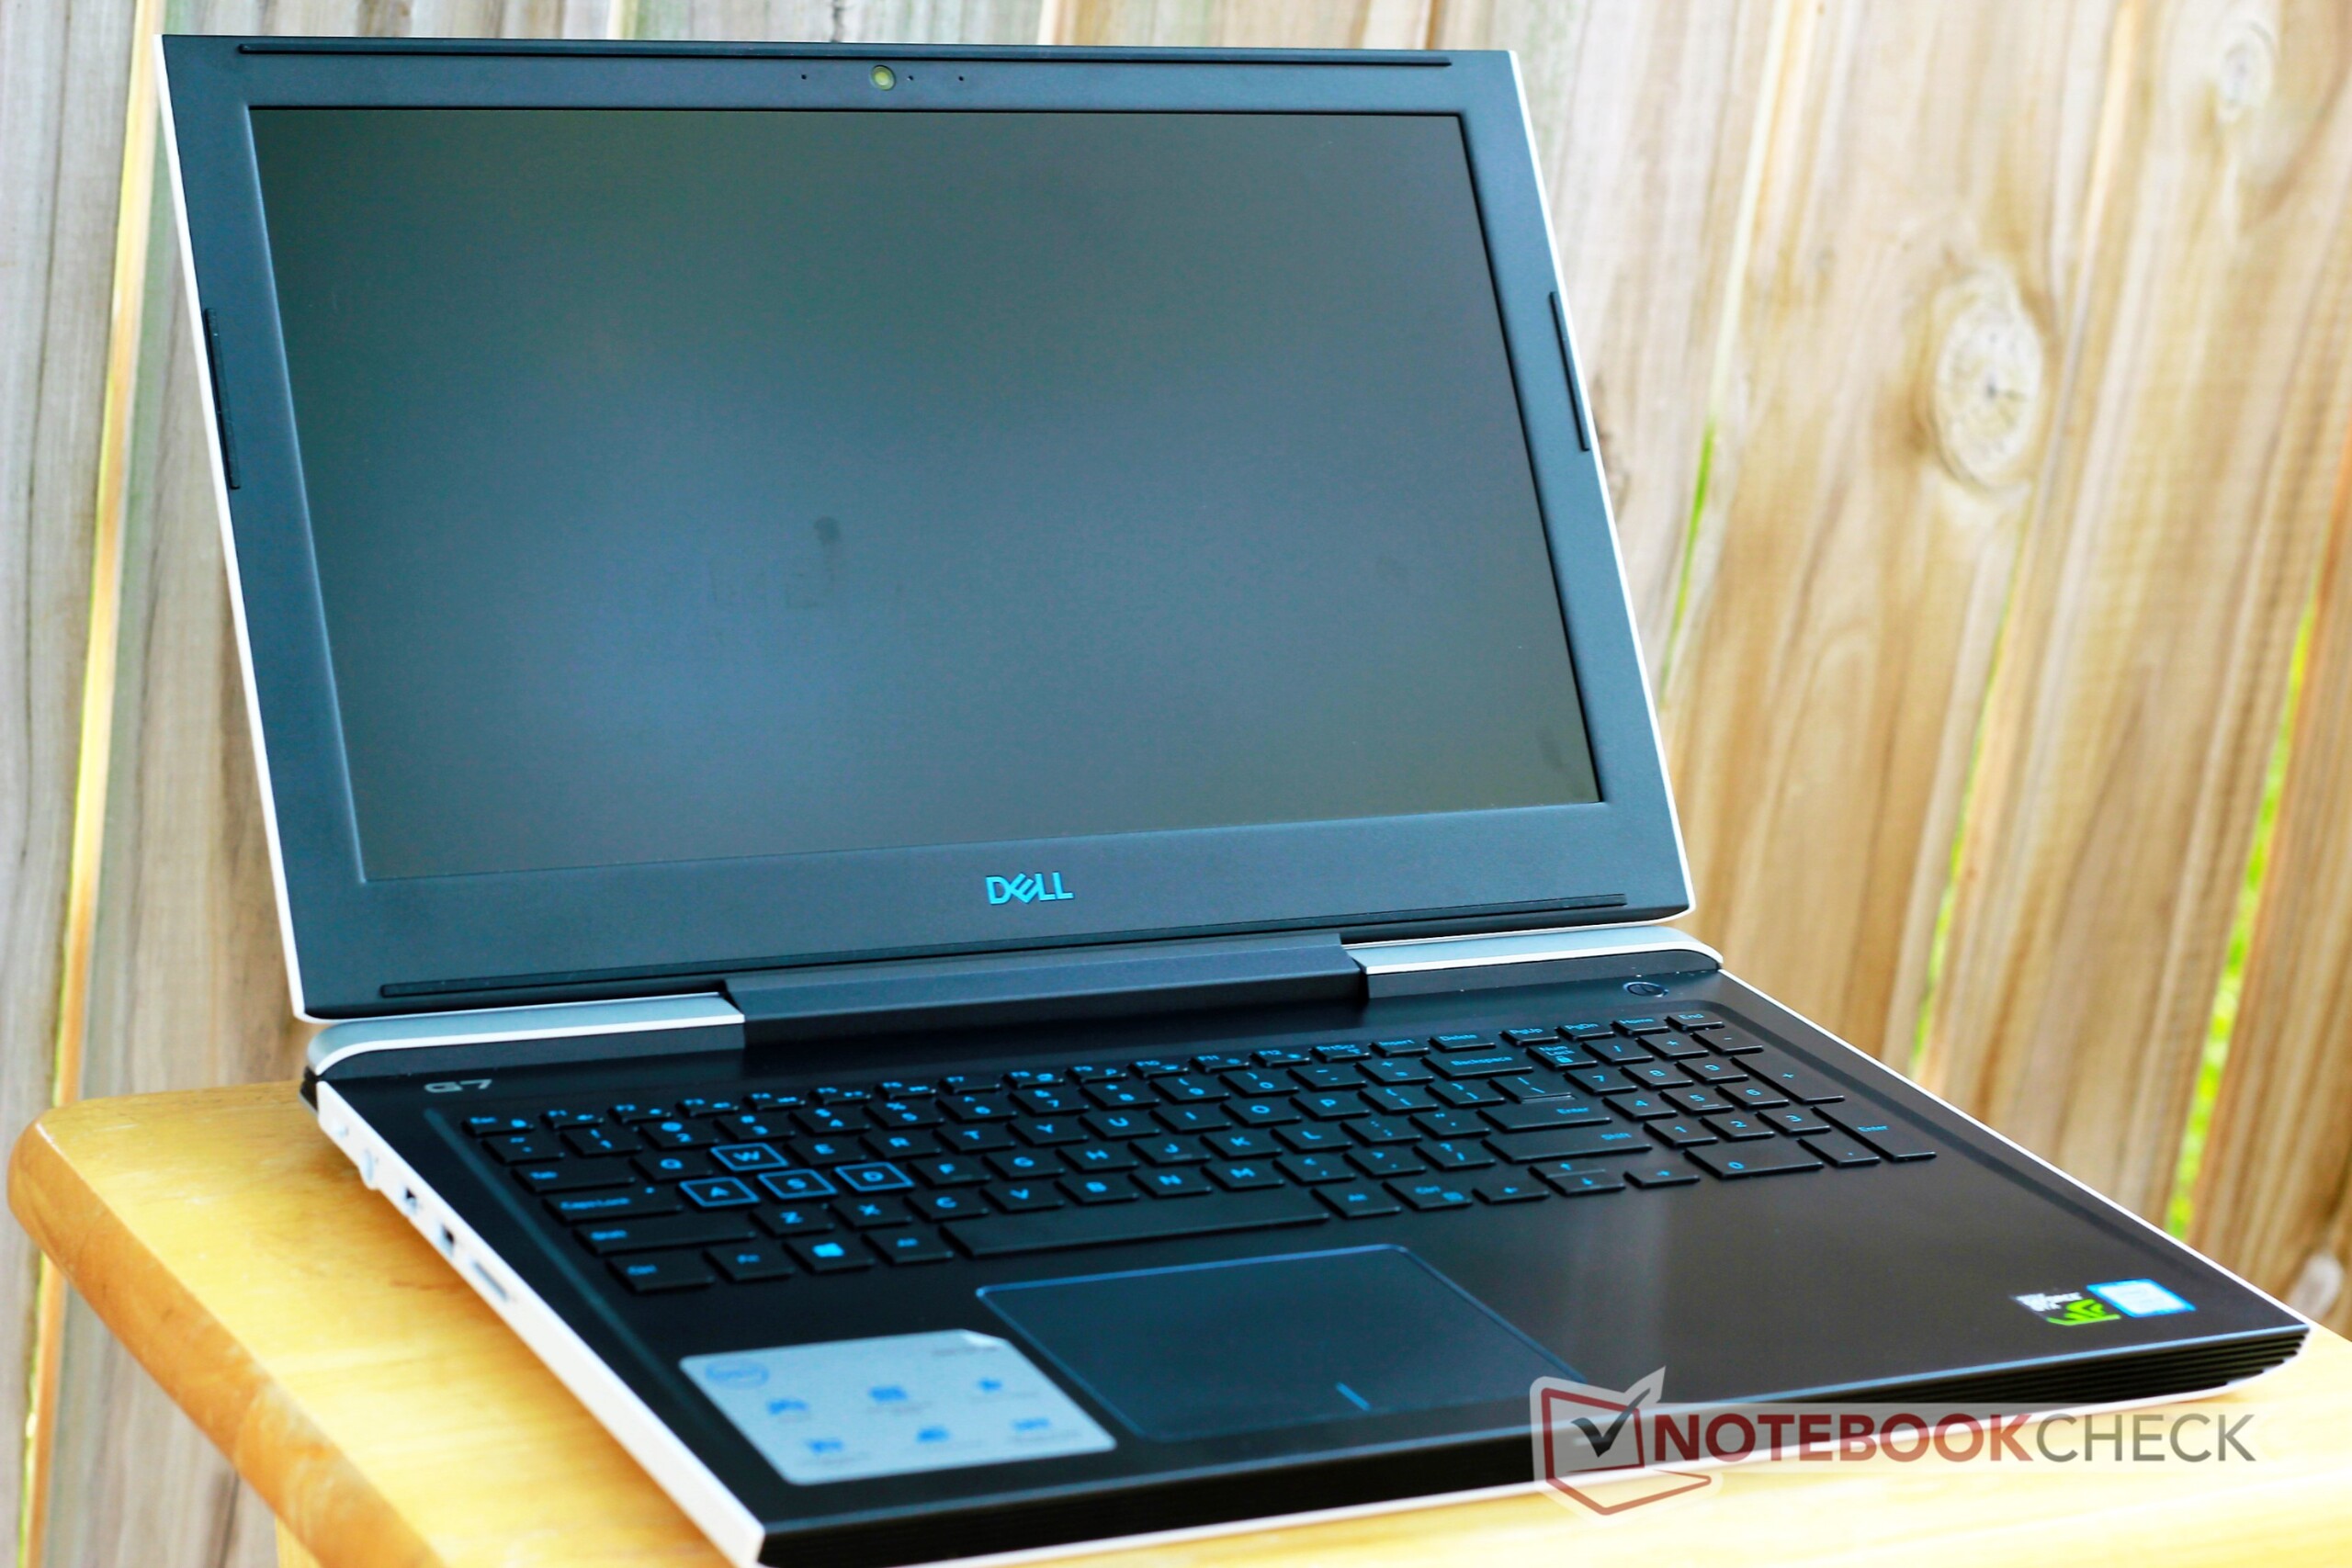
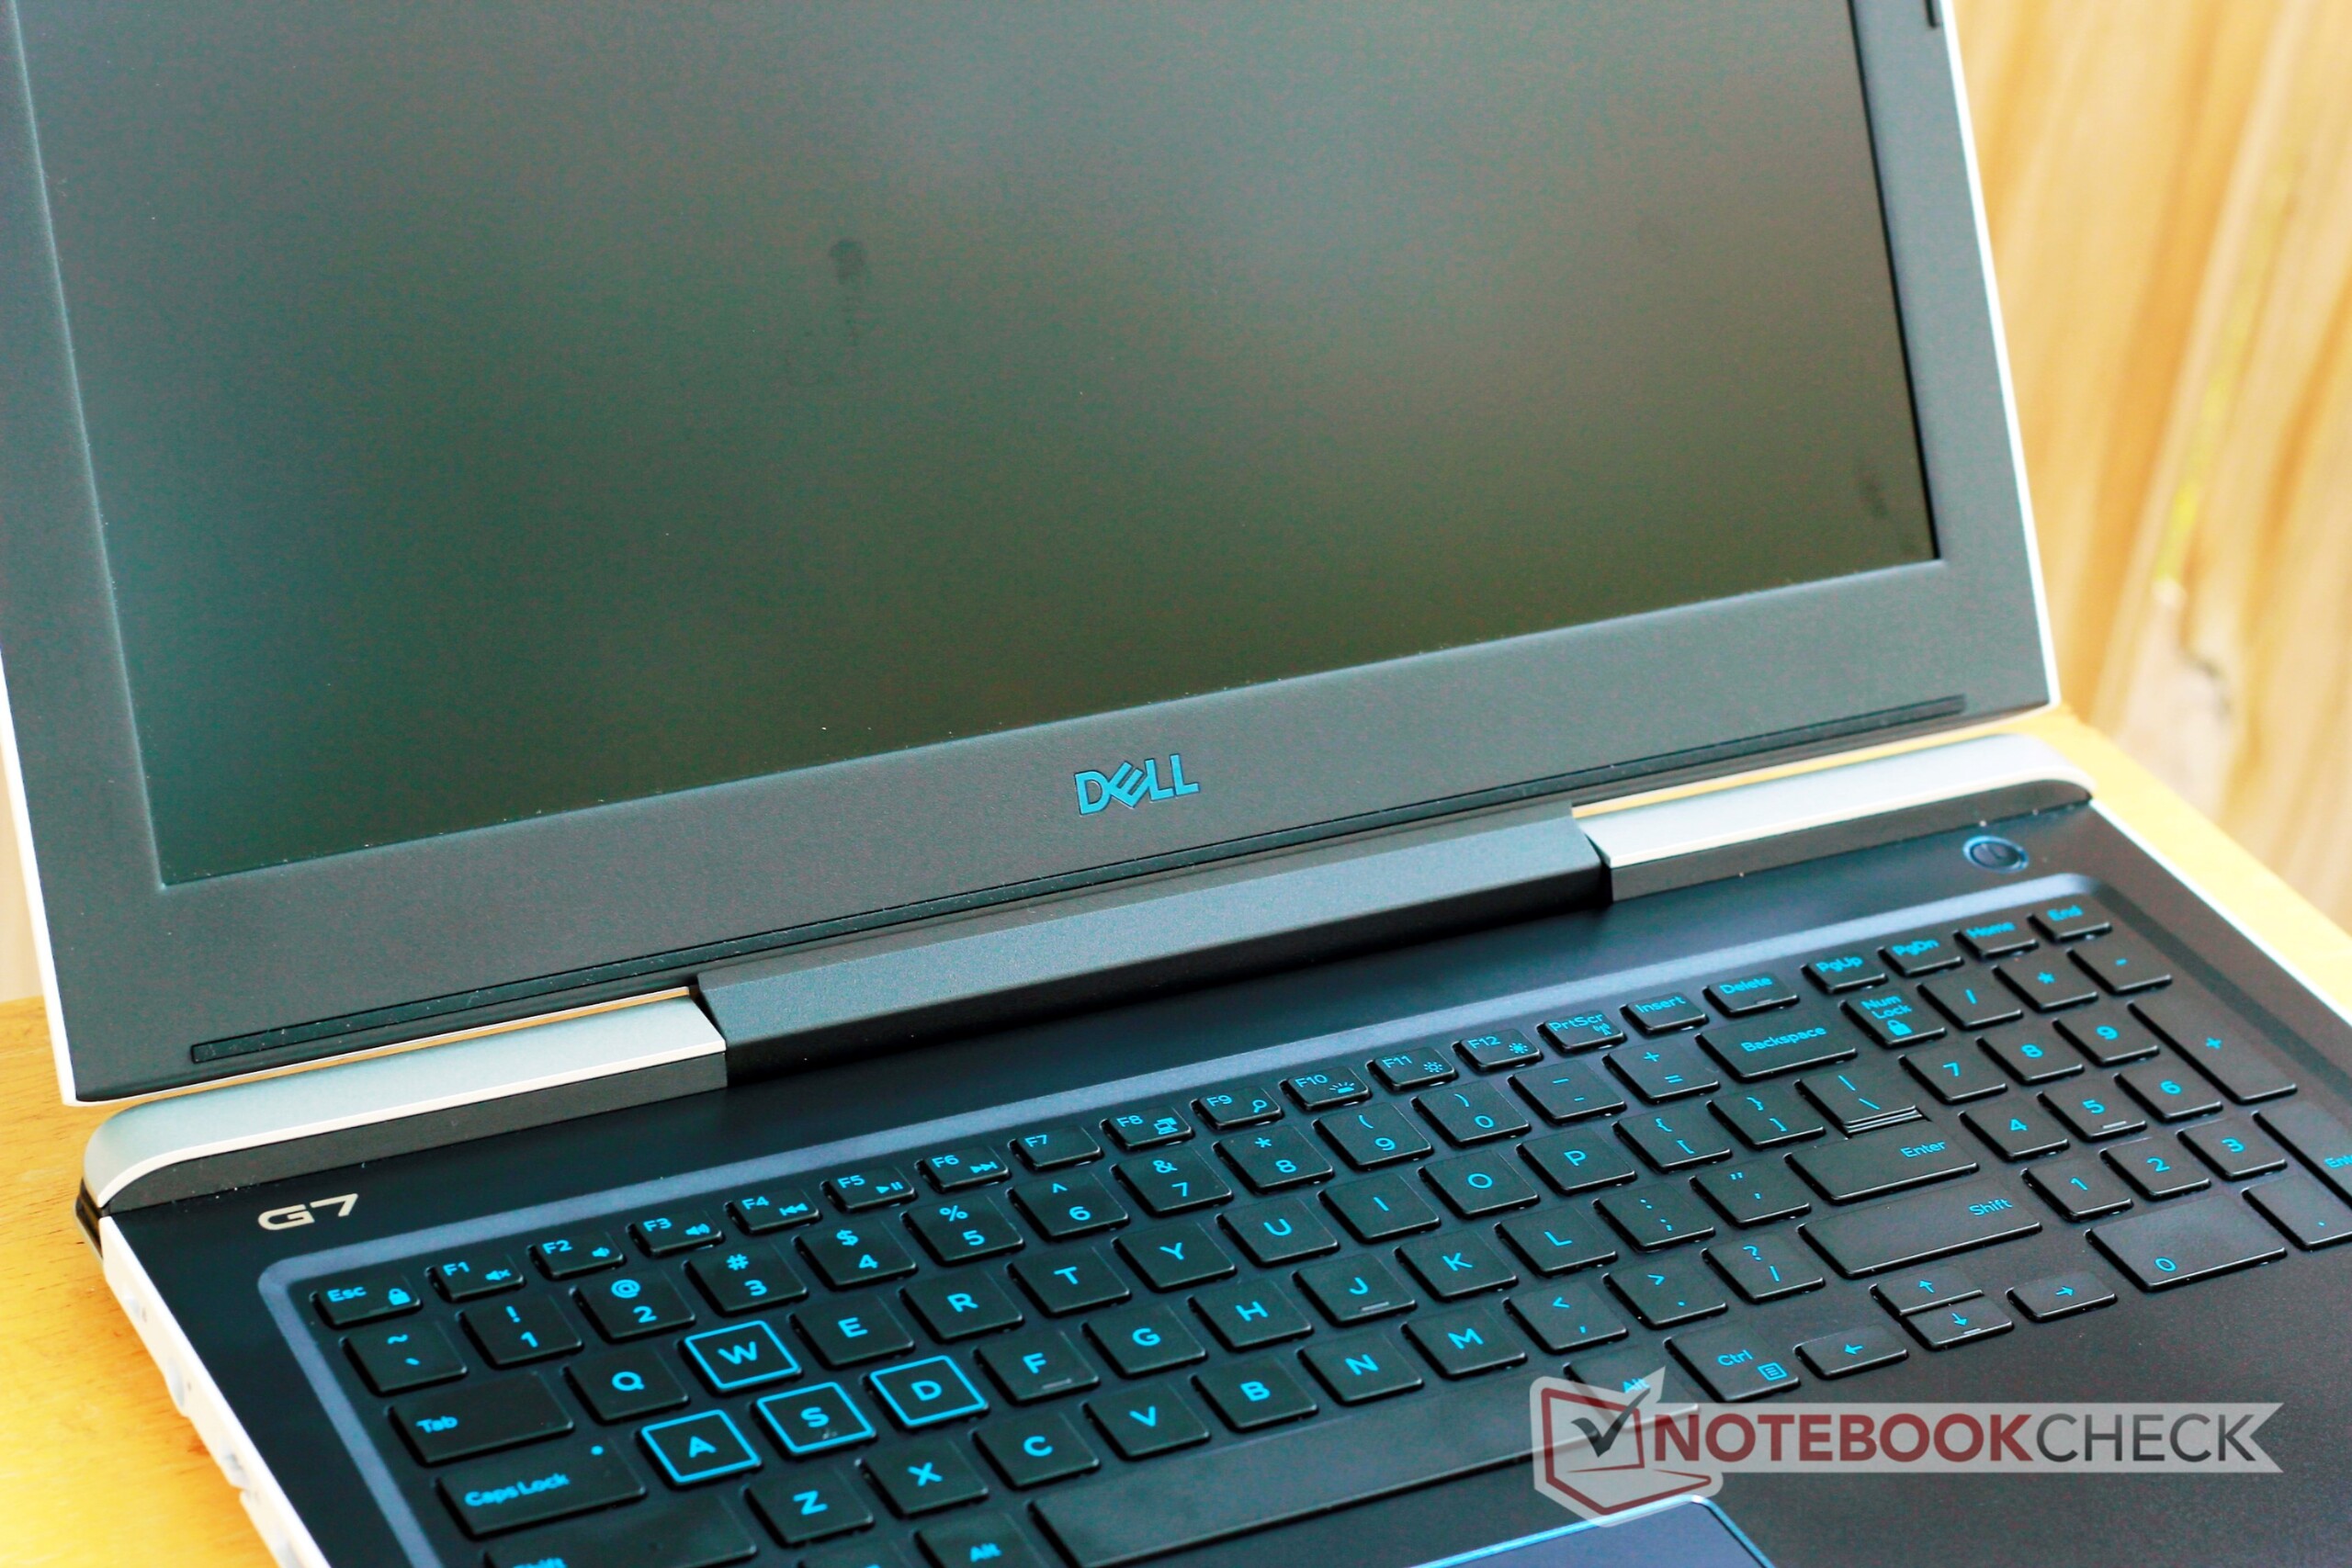
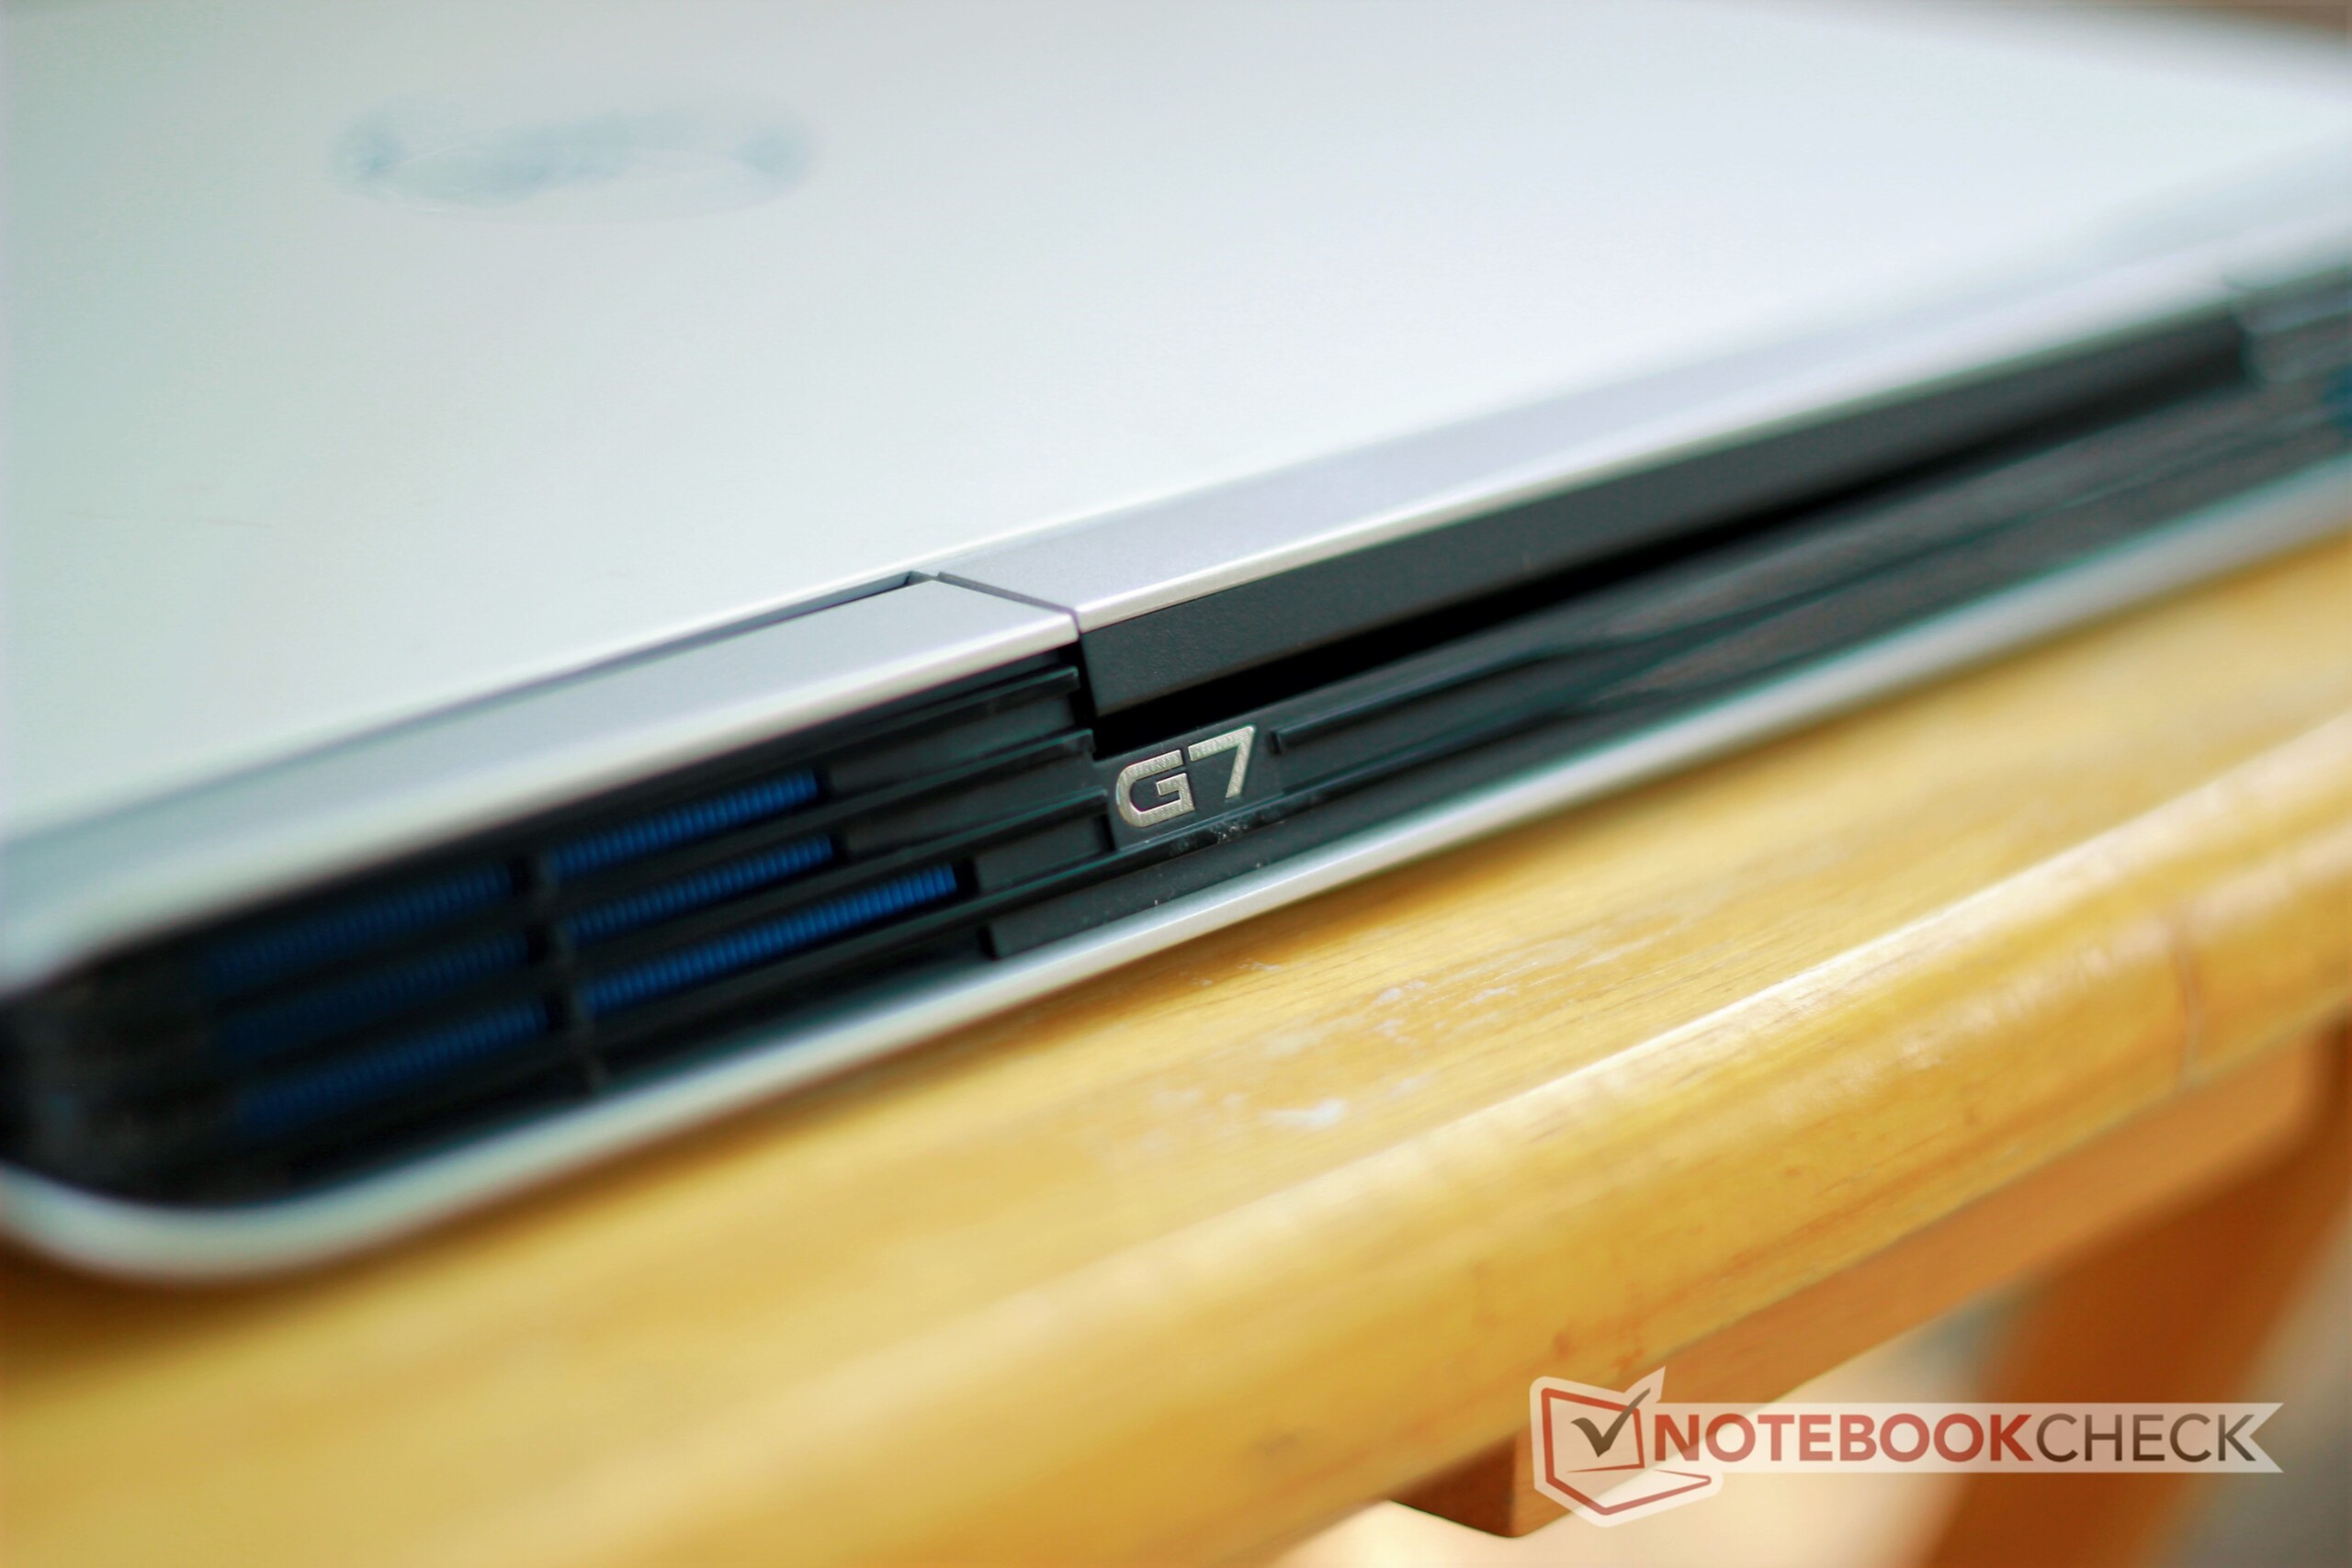
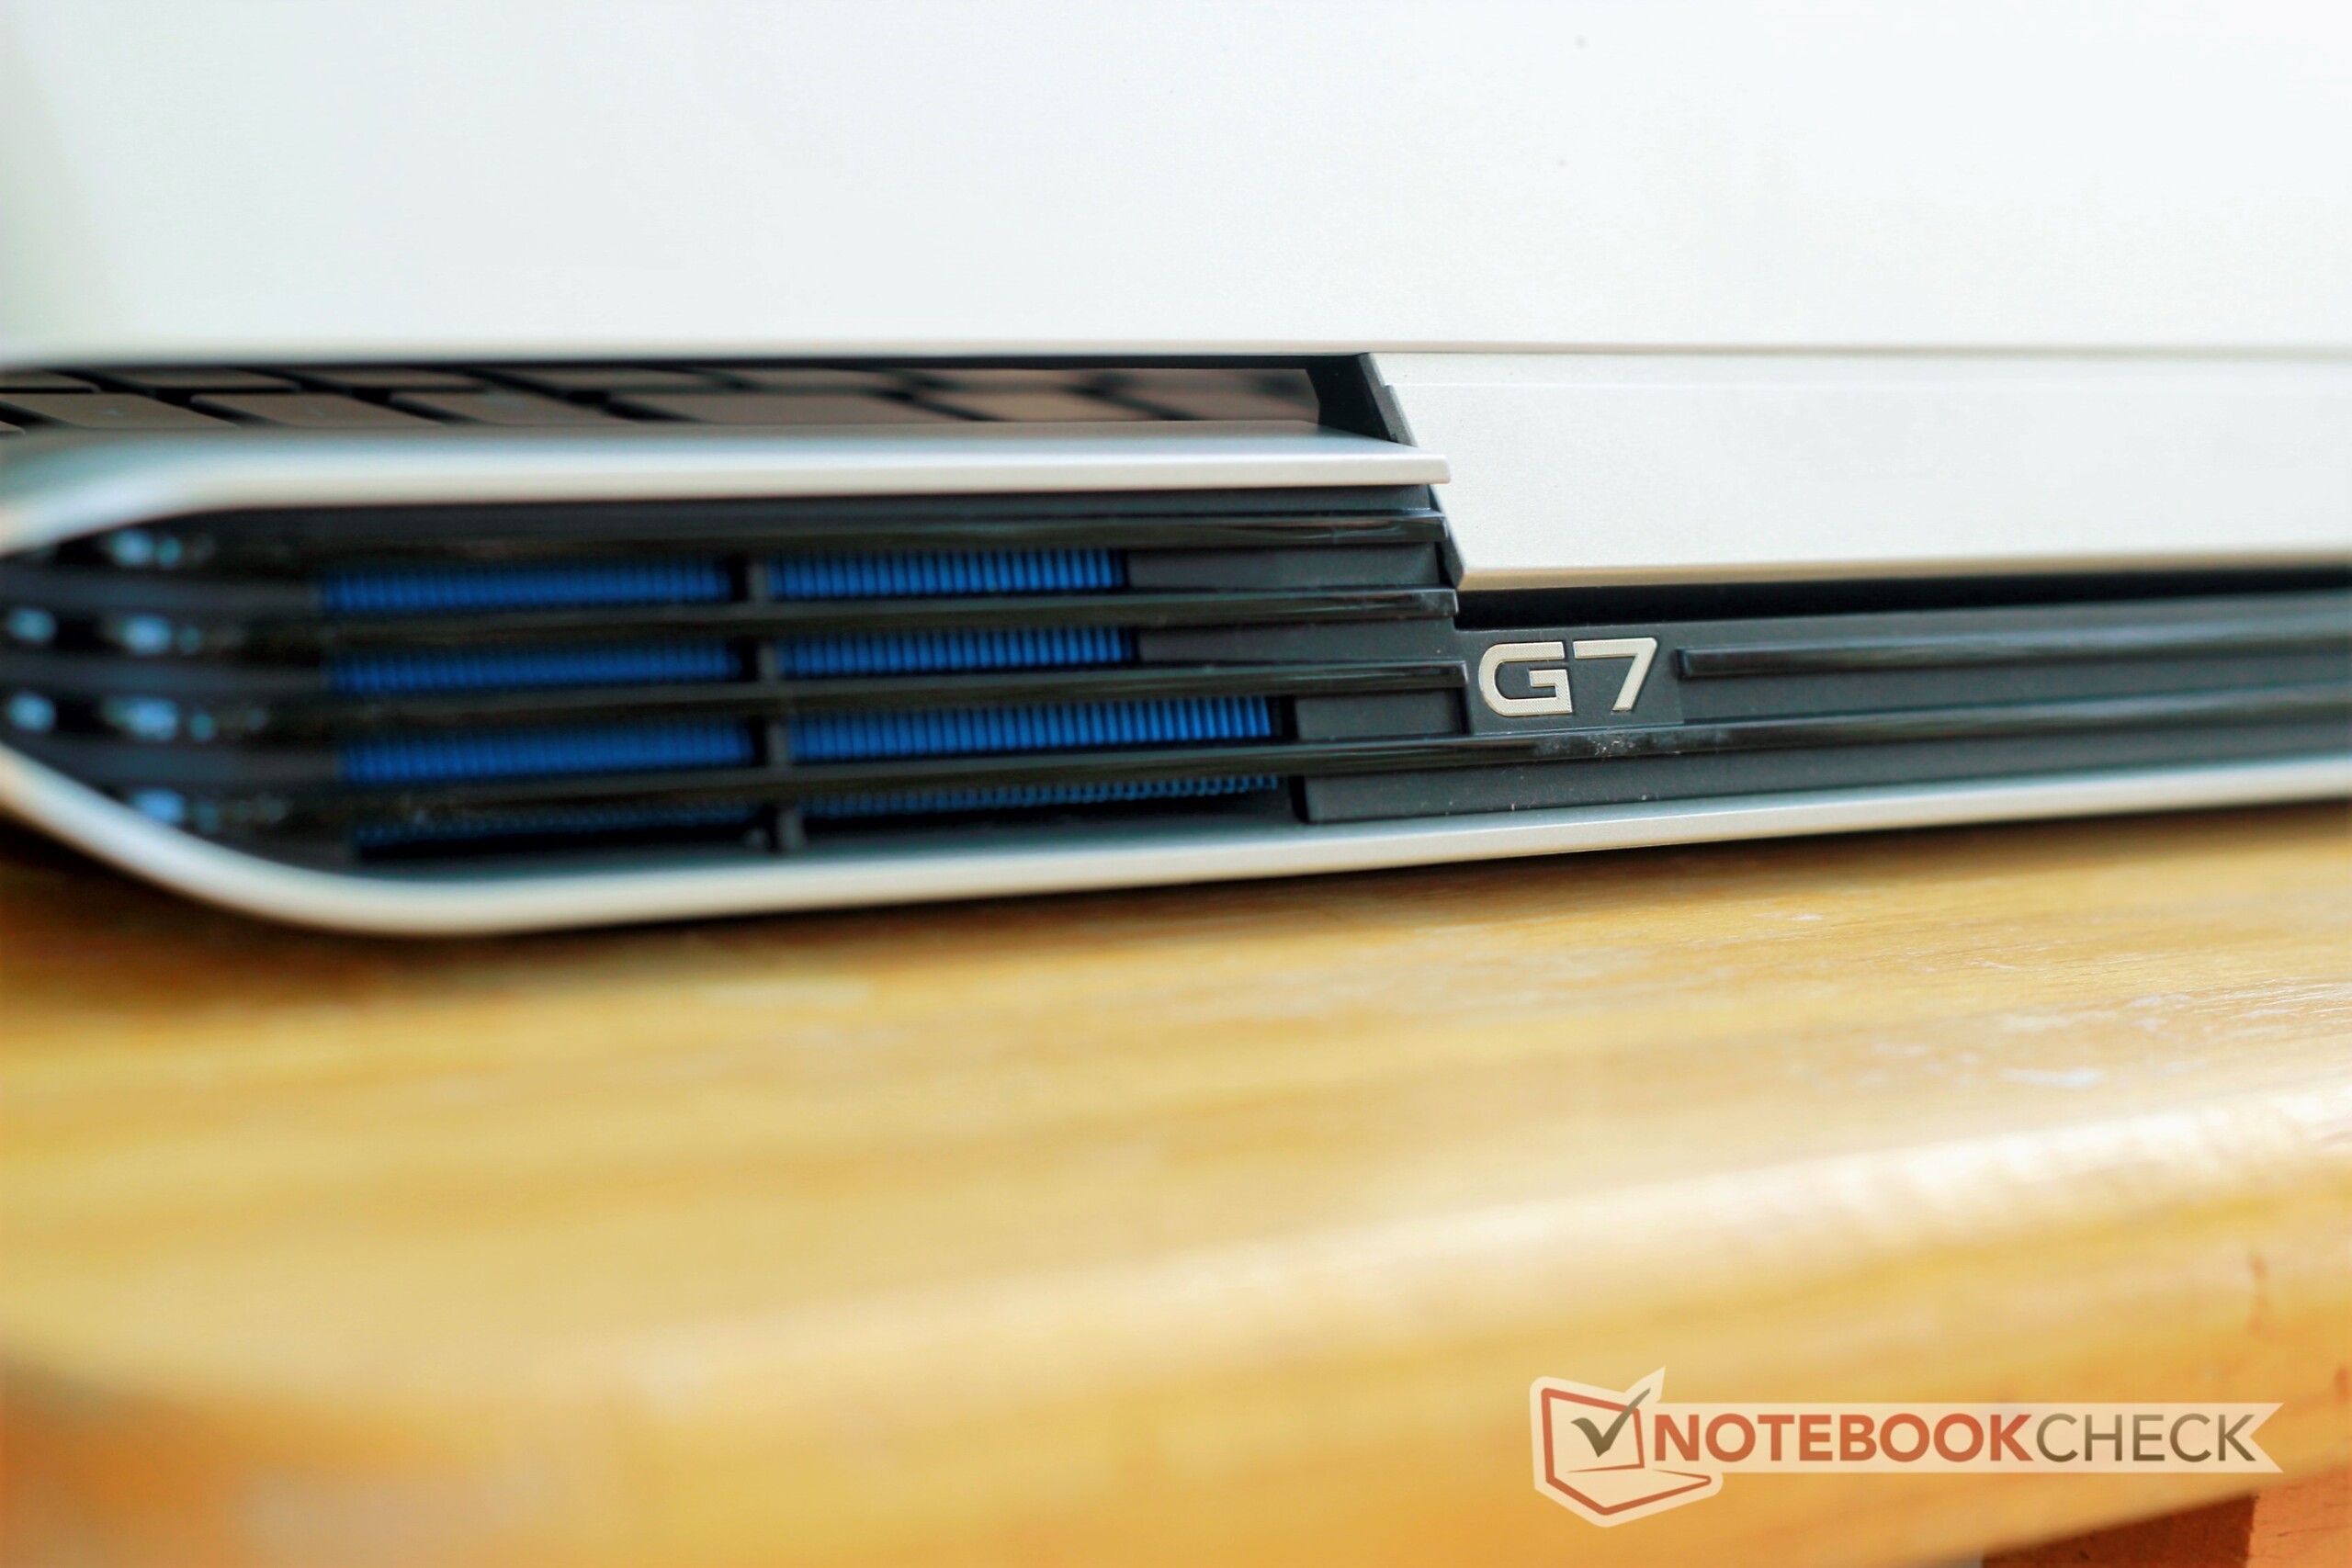
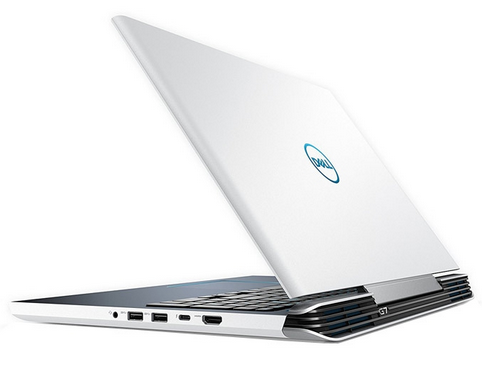
Dell G7 15-7588
- 07/31/2018 v6 (old)
Sam Medley
Price comparison
