Test: Lenovo Legion Y740-15ICH (i7-8750H, RTX 2070 Max-Q) Laptop (Sammanfattning)


| |||||||||||||||||||||||||
Distribution av ljusstyrkan: 85 %
Mitt på batteriet: 320.4 cd/m²
Kontrast: 763:1 (Svärta: 0.42 cd/m²)
ΔE ColorChecker Calman: 3.21 | ∀{0.5-29.43 Ø4.71}
calibrated: 2.36
ΔE Greyscale Calman: 3.6 | ∀{0.09-98 Ø4.96}
92% sRGB (Argyll 1.6.3 3D)
59% AdobeRGB 1998 (Argyll 1.6.3 3D)
64.7% AdobeRGB 1998 (Argyll 3D)
92.4% sRGB (Argyll 3D)
63.5% Display P3 (Argyll 3D)
Gamma: 2.27
CCT: 6503 K
| Lenovo Legion Y740-15ICHg LP156WFG-SPB2, IPS, 15.6", 1920x1080 | Gigabyte Aero 15-X9 LGD05C0, IPS, 15.6", 1920x1080 | Acer Predator Triton 500 AU Optronics B156HAN08.2 (AUO82ED), IPS, 15.6", 1920x1080 | Razer Blade 15 RTX 2070 Max-Q LG Philips LGD05C0, IPS, 15.6", 1920x1080 | Alienware m15 GTX 1070 Max-Q AU Optronics B156HAN, IPS, 15.6", 1920x1080 | |
|---|---|---|---|---|---|
| Display | 0% | 1% | 3% | -1% | |
| Display P3 Coverage (%) | 63.5 | 63.5 0% | 64.2 1% | 65.3 3% | 63.5 0% |
| sRGB Coverage (%) | 92.4 | 93.1 1% | 92.6 0% | 94.9 3% | 89.4 -3% |
| AdobeRGB 1998 Coverage (%) | 64.7 | 64.5 0% | 65.7 2% | 66.3 2% | 64.5 0% |
| Response Times | 5% | 36% | 12% | 7% | |
| Response Time Grey 50% / Grey 80% * (ms) | 18.8 ? | 16.4 ? 13% | 8 ? 57% | 16.8 ? 11% | 18 ? 4% |
| Response Time Black / White * (ms) | 13.2 ? | 13.6 ? -3% | 11.2 ? 15% | 11.6 ? 12% | 12 ? 9% |
| PWM Frequency (Hz) | |||||
| Screen | 18% | -5% | 9% | -3% | |
| Brightness middle (cd/m²) | 320.4 | 250 -22% | 304 -5% | 314.7 -2% | 353.6 10% |
| Brightness (cd/m²) | 298 | 235 -21% | 299 0% | 312 5% | 346 16% |
| Brightness Distribution (%) | 85 | 85 0% | 89 5% | 90 6% | 86 1% |
| Black Level * (cd/m²) | 0.42 | 0.29 31% | 0.27 36% | 0.38 10% | 0.3 29% |
| Contrast (:1) | 763 | 862 13% | 1126 48% | 828 9% | 1179 55% |
| Colorchecker dE 2000 * | 3.21 | 1.46 55% | 4.66 -45% | 2.56 20% | 4.55 -42% |
| Colorchecker dE 2000 max. * | 5.54 | 2.47 55% | 9.65 -74% | 4.89 12% | 7.91 -43% |
| Colorchecker dE 2000 calibrated * | 2.36 | 1.72 27% | 1.71 28% | 3.37 -43% | |
| Greyscale dE 2000 * | 3.6 | 1.27 65% | 5.53 -54% | 3.4 6% | 4.1 -14% |
| Gamma | 2.27 97% | 2.4 92% | 2.5 88% | 2.3 96% | 2.27 97% |
| CCT | 6503 100% | 6749 96% | 8028 81% | 6435 101% | 7434 87% |
| Color Space (Percent of AdobeRGB 1998) (%) | 59 | 60 2% | 60 2% | 60.7 3% | 57.9 -2% |
| Color Space (Percent of sRGB) (%) | 92 | 93 1% | 93 1% | 94.6 3% | 88.9 -3% |
| Totalt genomsnitt (program/inställningar) | 8% /
13% | 11% /
1% | 8% /
8% | 1% /
-2% |
* ... mindre är bättre
Visa svarstider
| ↔ Svarstid svart till vitt | ||
|---|---|---|
| 13.2 ms ... stiga ↗ och falla ↘ kombinerat | ↗ 8 ms stiga | 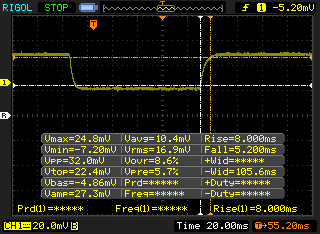 |
| ↘ 5.2 ms hösten | ||
| Skärmen visar bra svarsfrekvens i våra tester, men kan vara för långsam för konkurrenskraftiga spelare. I jämförelse sträcker sig alla testade enheter från 0.1 (minst) till 240 (maximalt) ms. » 34 % av alla enheter är bättre. Det betyder att den uppmätta svarstiden är bättre än genomsnittet av alla testade enheter (19.8 ms). | ||
| ↔ Svarstid 50 % grått till 80 % grått | ||
| 18.8 ms ... stiga ↗ och falla ↘ kombinerat | ↗ 11.6 ms stiga | 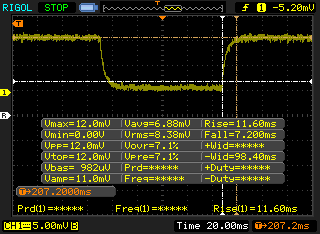 |
| ↘ 7.2 ms hösten | ||
| Skärmen visar bra svarsfrekvens i våra tester, men kan vara för långsam för konkurrenskraftiga spelare. I jämförelse sträcker sig alla testade enheter från 0.165 (minst) till 636 (maximalt) ms. » 32 % av alla enheter är bättre. Det betyder att den uppmätta svarstiden är bättre än genomsnittet av alla testade enheter (30.9 ms). | ||
Skärmflimmer / PWM (Puls-Width Modulation)
| Skärmflimmer / PWM upptäcktes inte |  | ||
Som jämförelse: 52 % av alla testade enheter använder inte PWM för att dämpa skärmen. Om PWM upptäcktes mättes ett medelvärde av 7748 (minst: 5 - maximum: 343500) Hz. | |||
| Cinebench R10 | |
| Rendering Multiple CPUs 32Bit | |
| Genomsnitt av klass Gaming (42932 - 102066, n=9, senaste 2 åren) | |
| Gigabyte Aero 15-X9 | |
| Genomsnitt Intel Core i7-8750H (29664 - 35307, n=25) | |
| HP Omen 15-dc0015ng | |
| Rendering Single 32Bit | |
| Genomsnitt av klass Gaming (7457 - 12575, n=9, senaste 2 åren) | |
| Genomsnitt Intel Core i7-8750H (6236 - 6645, n=25) | |
| HP Omen 15-dc0015ng | |
| Gigabyte Aero 15-X9 | |
| PCMark 8 Home Score Accelerated v2 | 5115 poäng | |
| PCMark 8 Work Score Accelerated v2 | 5852 poäng | |
| PCMark 10 Score | 5941 poäng | |
Hjälp | ||
| Lenovo Legion Y740-15ICHg Samsung SSD PM981 MZVLB256HAHQ | Gigabyte Aero 15-X9 Intel SSD 760p SSDPEKKW010T8 | Acer Predator Triton 500 2x WDC PC SN720 SDAPNTW-256G-1014 (RAID 0) | Razer Blade 15 RTX 2070 Max-Q Samsung SSD PM981 MZVLB512HAJQ | Alienware m15 GTX 1070 Max-Q Toshiba XG5 KXG50ZNV512G | |
|---|---|---|---|---|---|
| AS SSD | |||||
| Seq Read (MB/s) | 1953 | 2113 8% | 2913 49% | 1840 -6% | 1967 1% |
| Seq Write (MB/s) | 1629 | 1471 -10% | 2492 53% | 1822 12% | 1135 -30% |
| 4K Read (MB/s) | 33.2 | 55 66% | 38.7 17% | 52.3 58% | 29.17 -12% |
| 4K Write (MB/s) | 88.1 | 107.1 22% | 107.2 22% | 110.7 26% | 93.4 6% |
| 4K-64 Read (MB/s) | 757 | 914 21% | 1228 62% | 1126 49% | 995 31% |
| 4K-64 Write (MB/s) | 1501 | 703 -53% | 1079 -28% | 1717 14% | 656 -56% |
| Access Time Read * (ms) | 0.077 | 0.114 -48% | 0.047 39% | 0.116 -51% | |
| Access Time Write * (ms) | 0.043 | 0.034 21% | 0.035 19% | 0.033 23% | 0.063 -47% |
| Score Read (Points) | 985 | 1180 20% | 1558 58% | 1362 38% | 1221 24% |
| Score Write (Points) | 1752 | 957 -45% | 1435 -18% | 2010 15% | 862 -51% |
| Score Total (Points) | 3230 | 2722 -16% | 3770 17% | 4079 26% | 2667 -17% |
| Copy ISO MB/s (MB/s) | 1872 | 1864 0% | 1975 6% | 642 -66% | |
| Copy Program MB/s (MB/s) | 478.2 | 362.6 -24% | 526 10% | 431.5 -10% | |
| Copy Game MB/s (MB/s) | 1165 | 936 -20% | 1200 3% | 706 -39% | |
| CrystalDiskMark 5.2 / 6 | |||||
| Write 4K (MB/s) | 81 | 97.1 20% | 93.6 16% | 93.9 16% | 107.4 33% |
| Read 4K (MB/s) | 36.03 | 53.7 49% | 38.82 8% | 40.56 13% | 42.91 19% |
| Write Seq (MB/s) | 1687 | 1526 -10% | 2455 46% | 1468 -13% | 467.5 -72% |
| Read Seq (MB/s) | 1835 | 2020 10% | 2107 15% | 1540 -16% | 2335 27% |
| Write 4K Q32T1 (MB/s) | 205.3 | 285.6 39% | 298.7 45% | 293.5 43% | 289.7 41% |
| Read 4K Q32T1 (MB/s) | 229 | 321.8 41% | 338.7 48% | 346 51% | 354.4 55% |
| Write Seq Q32T1 (MB/s) | 1683 | 1533 -9% | 2902 72% | 1941 15% | 460.9 -73% |
| Read Seq Q32T1 (MB/s) | 3363 | 2351 -30% | 3536 5% | 3266 -3% | 3111 -7% |
* ... mindre är bättre

| 3DMark 06 Standard Score | 37344 poäng | |
| 3DMark 11 Performance | 18304 poäng | |
| 3DMark Ice Storm Standard Score | 162624 poäng | |
| 3DMark Cloud Gate Standard Score | 36817 poäng | |
| 3DMark Fire Strike Score | 15027 poäng | |
| 3DMark Fire Strike Extreme Score | 7614 poäng | |
| 3DMark Time Spy Score | 6540 poäng | |
Hjälp | ||
| Batman: Arkham Knight | |
| 1280x720 Low / Off AF:Trilinear | |
| Lenovo Legion Y740-15ICHg | |
| Genomsnitt NVIDIA GeForce RTX 2070 Max-Q (n=1) | |
| 1366x768 Normal / Off AF:4x | |
| Lenovo Legion Y740-15ICHg | |
| Genomsnitt NVIDIA GeForce RTX 2070 Max-Q (n=1) | |
| 1920x1080 High / On (Interactive Smoke & Paper Debris Off) AA:SM AF:8x | |
| Lenovo Legion Y740-15ICHg | |
| Genomsnitt NVIDIA GeForce RTX 2070 Max-Q (n=1) | |
| 1920x1080 High / On AA:SM AF:16x | |
| Lenovo Legion Y740-15ICHg | |
| Genomsnitt NVIDIA GeForce RTX 2070 Max-Q (n=1) | |
| låg | med. | hög | ultra | |
|---|---|---|---|---|
| BioShock Infinite (2013) | 302 | 282 | 261 | 211 |
| The Witcher 3 (2015) | 57 | |||
| Batman: Arkham Knight (2015) | 163 | 153 | 129 | 87 |
| Rise of the Tomb Raider (2016) | 231 | 184 | 116 | 100 |
Ljudnivå
| Låg belastning |
| 32.6 / 32.7 / 32.7 dB(A) |
| Hög belastning |
| 33.3 / 45.2 dB(A) |
 | ||
30 dB tyst 40 dB(A) hörbar 50 dB(A) högt ljud |
||
min: | ||
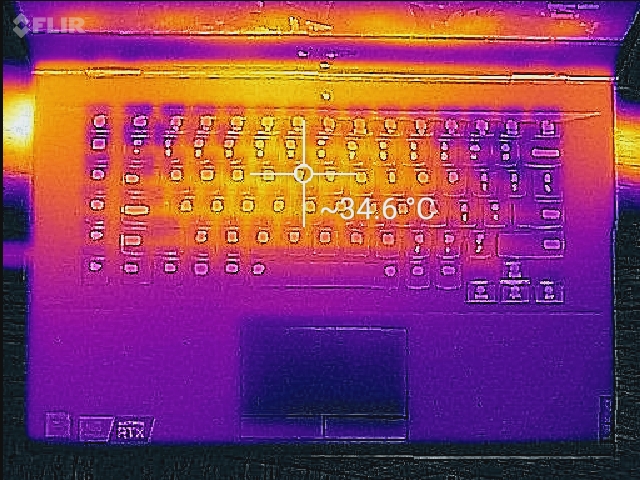
(+) Den maximala temperaturen på ovansidan är 37.6 °C / 100 F, jämfört med genomsnittet av 40.4 °C / 105 F , allt från 21.2 till 68.8 °C för klassen Gaming.
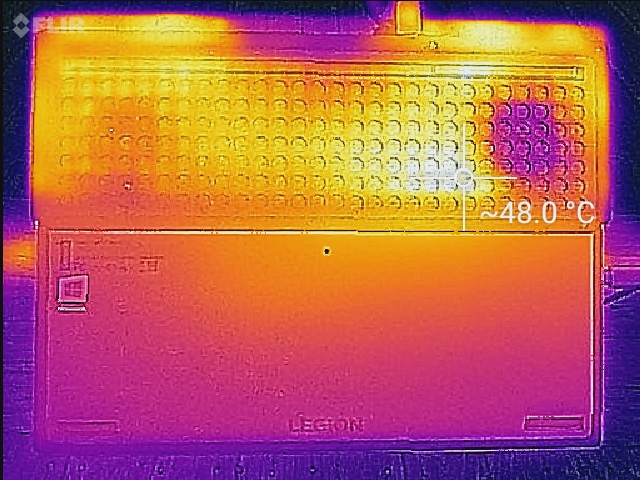
(-) Botten värms upp till maximalt 45.2 °C / 113 F, jämfört med genomsnittet av 43.2 °C / 110 F
(+) Vid tomgångsbruk är medeltemperaturen för ovansidan 28 °C / 82 F, jämfört med enhetsgenomsnittet på 33.9 °C / ### class_avg_f### F.
(+) När du spelar The Witcher 3 är medeltemperaturen för ovansidan 29.5 °C / 85 F, jämfört med enhetsgenomsnittet på 33.9 °C / ## #class_avg_f### F.
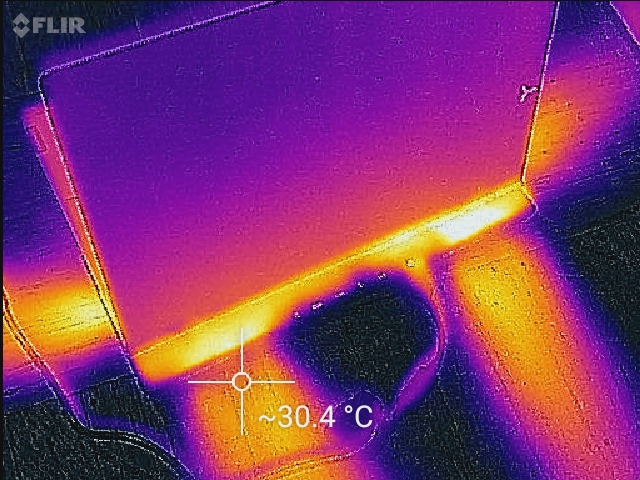
(+) Handledsstöden och pekplattan är kallare än hudtemperaturen med maximalt 29.2 °C / 84.6 F och är därför svala att ta på.
(±) Medeltemperaturen för handledsstödsområdet på liknande enheter var 28.8 °C / 83.8 F (-0.4 °C / -0.8 F).
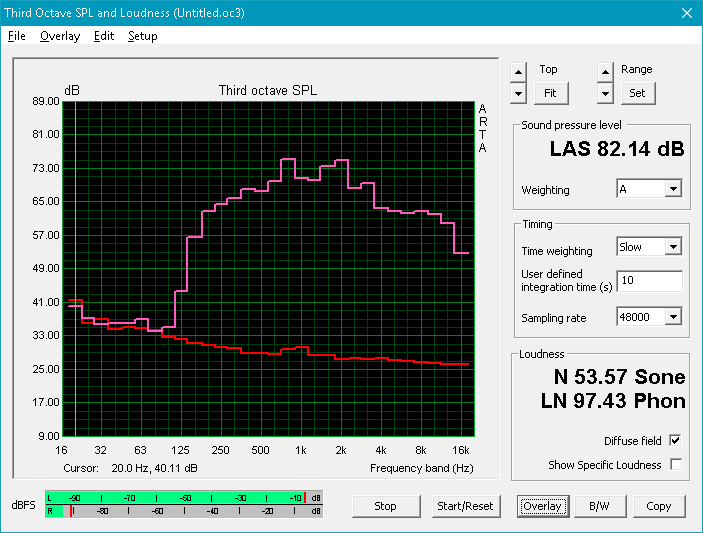
Lenovo Legion Y740-15ICHg ljudanalys
(+) | högtalare kan spela relativt högt (82.1 dB)
Bas 100 - 315 Hz
(±) | reducerad bas - i genomsnitt 10.2% lägre än medianen
(±) | linjäriteten för basen är genomsnittlig (14.7% delta till föregående frekvens)
Mellan 400 - 2000 Hz
(±) | högre mellan - i genomsnitt 6.7% högre än median
(±) | linjäriteten för mids är genomsnittlig (7% delta till föregående frekvens)
Högsta 2 - 16 kHz
(+) | balanserade toppar - endast 2.6% från medianen
(+) | toppar är linjära (6.5% delta till föregående frekvens)
Totalt 100 - 16 000 Hz
(±) | linjäriteten för det totala ljudet är genomsnittlig (19.8% skillnad mot median)
Jämfört med samma klass
» 70% av alla testade enheter i den här klassen var bättre, 6% liknande, 24% sämre
» Den bästa hade ett delta på 6%, genomsnittet var 18%, sämst var 132%
Jämfört med alla testade enheter
» 51% av alla testade enheter var bättre, 7% liknande, 42% sämre
» Den bästa hade ett delta på 4%, genomsnittet var 23%, sämst var 134%
Razer Blade 15 RTX 2070 Max-Q ljudanalys
(-) | inte särskilt höga högtalare (71.6 dB)
Bas 100 - 315 Hz
(±) | reducerad bas - i genomsnitt 7.7% lägre än medianen
(±) | linjäriteten för basen är genomsnittlig (11.1% delta till föregående frekvens)
Mellan 400 - 2000 Hz
(±) | högre mellan - i genomsnitt 7.8% högre än median
(±) | linjäriteten för mids är genomsnittlig (9.5% delta till föregående frekvens)
Högsta 2 - 16 kHz
(+) | balanserade toppar - endast 3% från medianen
(±) | linjäriteten för toppar är genomsnittlig (7.2% delta till föregående frekvens)
Totalt 100 - 16 000 Hz
(±) | linjäriteten för det totala ljudet är genomsnittlig (23.9% skillnad mot median)
Jämfört med samma klass
» 86% av alla testade enheter i den här klassen var bättre, 5% liknande, 9% sämre
» Den bästa hade ett delta på 6%, genomsnittet var 18%, sämst var 132%
Jämfört med alla testade enheter
» 72% av alla testade enheter var bättre, 6% liknande, 22% sämre
» Den bästa hade ett delta på 4%, genomsnittet var 23%, sämst var 134%
| Av/Standby | |
| Låg belastning | |
| Hög belastning |
|
Förklaring:
min: | |
| Lenovo Legion Y740-15ICHg i7-8750H, GeForce RTX 2070 Max-Q, Samsung SSD PM981 MZVLB256HAHQ, IPS, 1920x1080, 15.6" | MSI GE75 8SF i7-8750H, GeForce RTX 2070 Mobile, Kingston RBUSNS8154P3256GJ1, IPS, 1920x1080, 17.3" | Gigabyte Aero 15-X9 i7-8750H, GeForce RTX 2070 Max-Q, Intel SSD 760p SSDPEKKW010T8, IPS, 1920x1080, 15.6" | Acer Predator Triton 500 i7-8750H, GeForce RTX 2080 Max-Q, 2x WDC PC SN720 SDAPNTW-256G-1014 (RAID 0), IPS, 1920x1080, 15.6" | Razer Blade 15 RTX 2070 Max-Q i7-8750H, GeForce RTX 2070 Max-Q, Samsung SSD PM981 MZVLB512HAJQ, IPS, 1920x1080, 15.6" | Alienware m15 GTX 1070 Max-Q i7-8750H, GeForce GTX 1070 Max-Q, Toshiba XG5 KXG50ZNV512G, IPS, 1920x1080, 15.6" | HP Omen 15-dc0015ng i7-8750H, GeForce GTX 1070 Max-Q, Toshiba XG5 KXG50ZNV512G, IPS, 1920x1080, 15.6" | Lenovo Legion Y730-15ICH i5-8300H i5-8300H, GeForce GTX 1050 Ti Mobile, Intel Optane 16 GB MEMPEK1J016GAL + HGST ST1000LM049 1 TB HDD, IPS, 1920x1080, 15.6" | |
|---|---|---|---|---|---|---|---|---|
| Power Consumption | -6% | 14% | 3% | 19% | 23% | 1% | 34% | |
| Idle Minimum * (Watt) | 22.9 | 16.4 28% | 16 30% | 16 30% | 10.4 55% | 7.6 67% | 14 39% | 8 65% |
| Idle Average * (Watt) | 27.2 | 21.9 19% | 18 34% | 22 19% | 14.6 46% | 13.8 49% | 18.2 33% | 11.8 57% |
| Idle Maximum * (Watt) | 27.5 | 25.4 8% | 23 16% | 32 -16% | 16.3 41% | 14.6 47% | 24 13% | 13.1 52% |
| Load Average * (Watt) | 83.4 | 90.7 -9% | 88 -6% | 89 -7% | 88.5 -6% | 97.6 -17% | 143 -71% | 90.2 -8% |
| Witcher 3 ultra * (Watt) | 143.6 | 203.3 -42% | 120 16% | 147 -2% | 155.4 -8% | 145.8 -2% | 126 12% | 107.8 25% |
| Load Maximum * (Watt) | 160.5 | 222.9 -39% | 167 -4% | 173 -8% | 182.4 -14% | 172.5 -7% | 190 -18% | 136.2 15% |
* ... mindre är bättre
| Lenovo Legion Y740-15ICHg i7-8750H, GeForce RTX 2070 Max-Q, 57 Wh | MSI GE75 8SF i7-8750H, GeForce RTX 2070 Mobile, 65 Wh | Gigabyte Aero 15-X9 i7-8750H, GeForce RTX 2070 Max-Q, 94.24 Wh | Acer Predator Triton 500 i7-8750H, GeForce RTX 2080 Max-Q, 82 Wh | Razer Blade 15 RTX 2070 Max-Q i7-8750H, GeForce RTX 2070 Max-Q, 80 Wh | Alienware m15 GTX 1070 Max-Q i7-8750H, GeForce GTX 1070 Max-Q, 90 Wh | HP Omen 15-dc0015ng i7-8750H, GeForce GTX 1070 Max-Q, 70.07 Wh | Lenovo Legion Y730-15ICH i5-8300H i5-8300H, GeForce GTX 1050 Ti Mobile, 57 Wh | |
|---|---|---|---|---|---|---|---|---|
| Batteridrifttid | 25% | 176% | 44% | 137% | 152% | 104% | 87% | |
| Reader / Idle (h) | 3.9 | 9.2 136% | 5.6 44% | 11.4 192% | 10.5 169% | 7.7 97% | 9.6 146% | |
| WiFi v1.3 (h) | 2.8 | 3.5 25% | 6.4 129% | 3.2 14% | 6.5 132% | 7.7 175% | 4.6 64% | 5.3 89% |
| Load (h) | 0.8 | 2.9 262% | 1.4 75% | 1.5 88% | 1.7 113% | 2 150% | 1 25% |
För
Emot
Läs den fullständiga versionen av den här recensionen på engelska här.
Även om den har sin beskärda del av tillkortakommanden så eliminerar Y740-15ICHg runt hälften av de klagomål vi hade på dess föregångare Y730-15ICH. Den nya skärmpanelen förbättrar de svart-vita responstiderna och har en bilduppdatering på 144 Hz (för NVIDIA G-Sync). Dessutom har GPU-begränsningen tagits bort; RTX 2070 Max-Q är mer än dubbelt så snabb som den tidigare GTX 1050 Ti. Allt detta uppnås utan någon väsentlig ökning i ljudnivå, även om yttemperaturerna definitivt har ökat märkbart.
Andra betydande segrar för Legion Y740-15ICHg inkluderar riktigt stark CPU-prestanda, både kortvarig och ihållande, samt allmänt snabb systemprestanda tack vare att den kommer med en Samsung PM981 NVMe SSD. Maskinen får kämpa med att hantera kombinerad syntetisk systemstress, men fristående CPU- eller GPU-stress är inga problem och faktiska spel fungerar fint. Det stämmer förvisso att man knappast kommer att kunna uppnå stabil bilduppdatering i 144 fps eller mer utan att skruva tillbaka kvalitetsinställningarna till medium eller lägre i de flesta spel, men det är trevligt att ha alternativet.
Även om den inte riktigt når hela vägen fram när det kommer till mobilitet och inmatningsenheter så är Lenovo Legion Y740-15ICHg en betydande förbättring gentemot sin föregångare och kan lätt hantera de flesta spel med ett tyst lugn. Den tömmer heller inte ditt bankkonto.
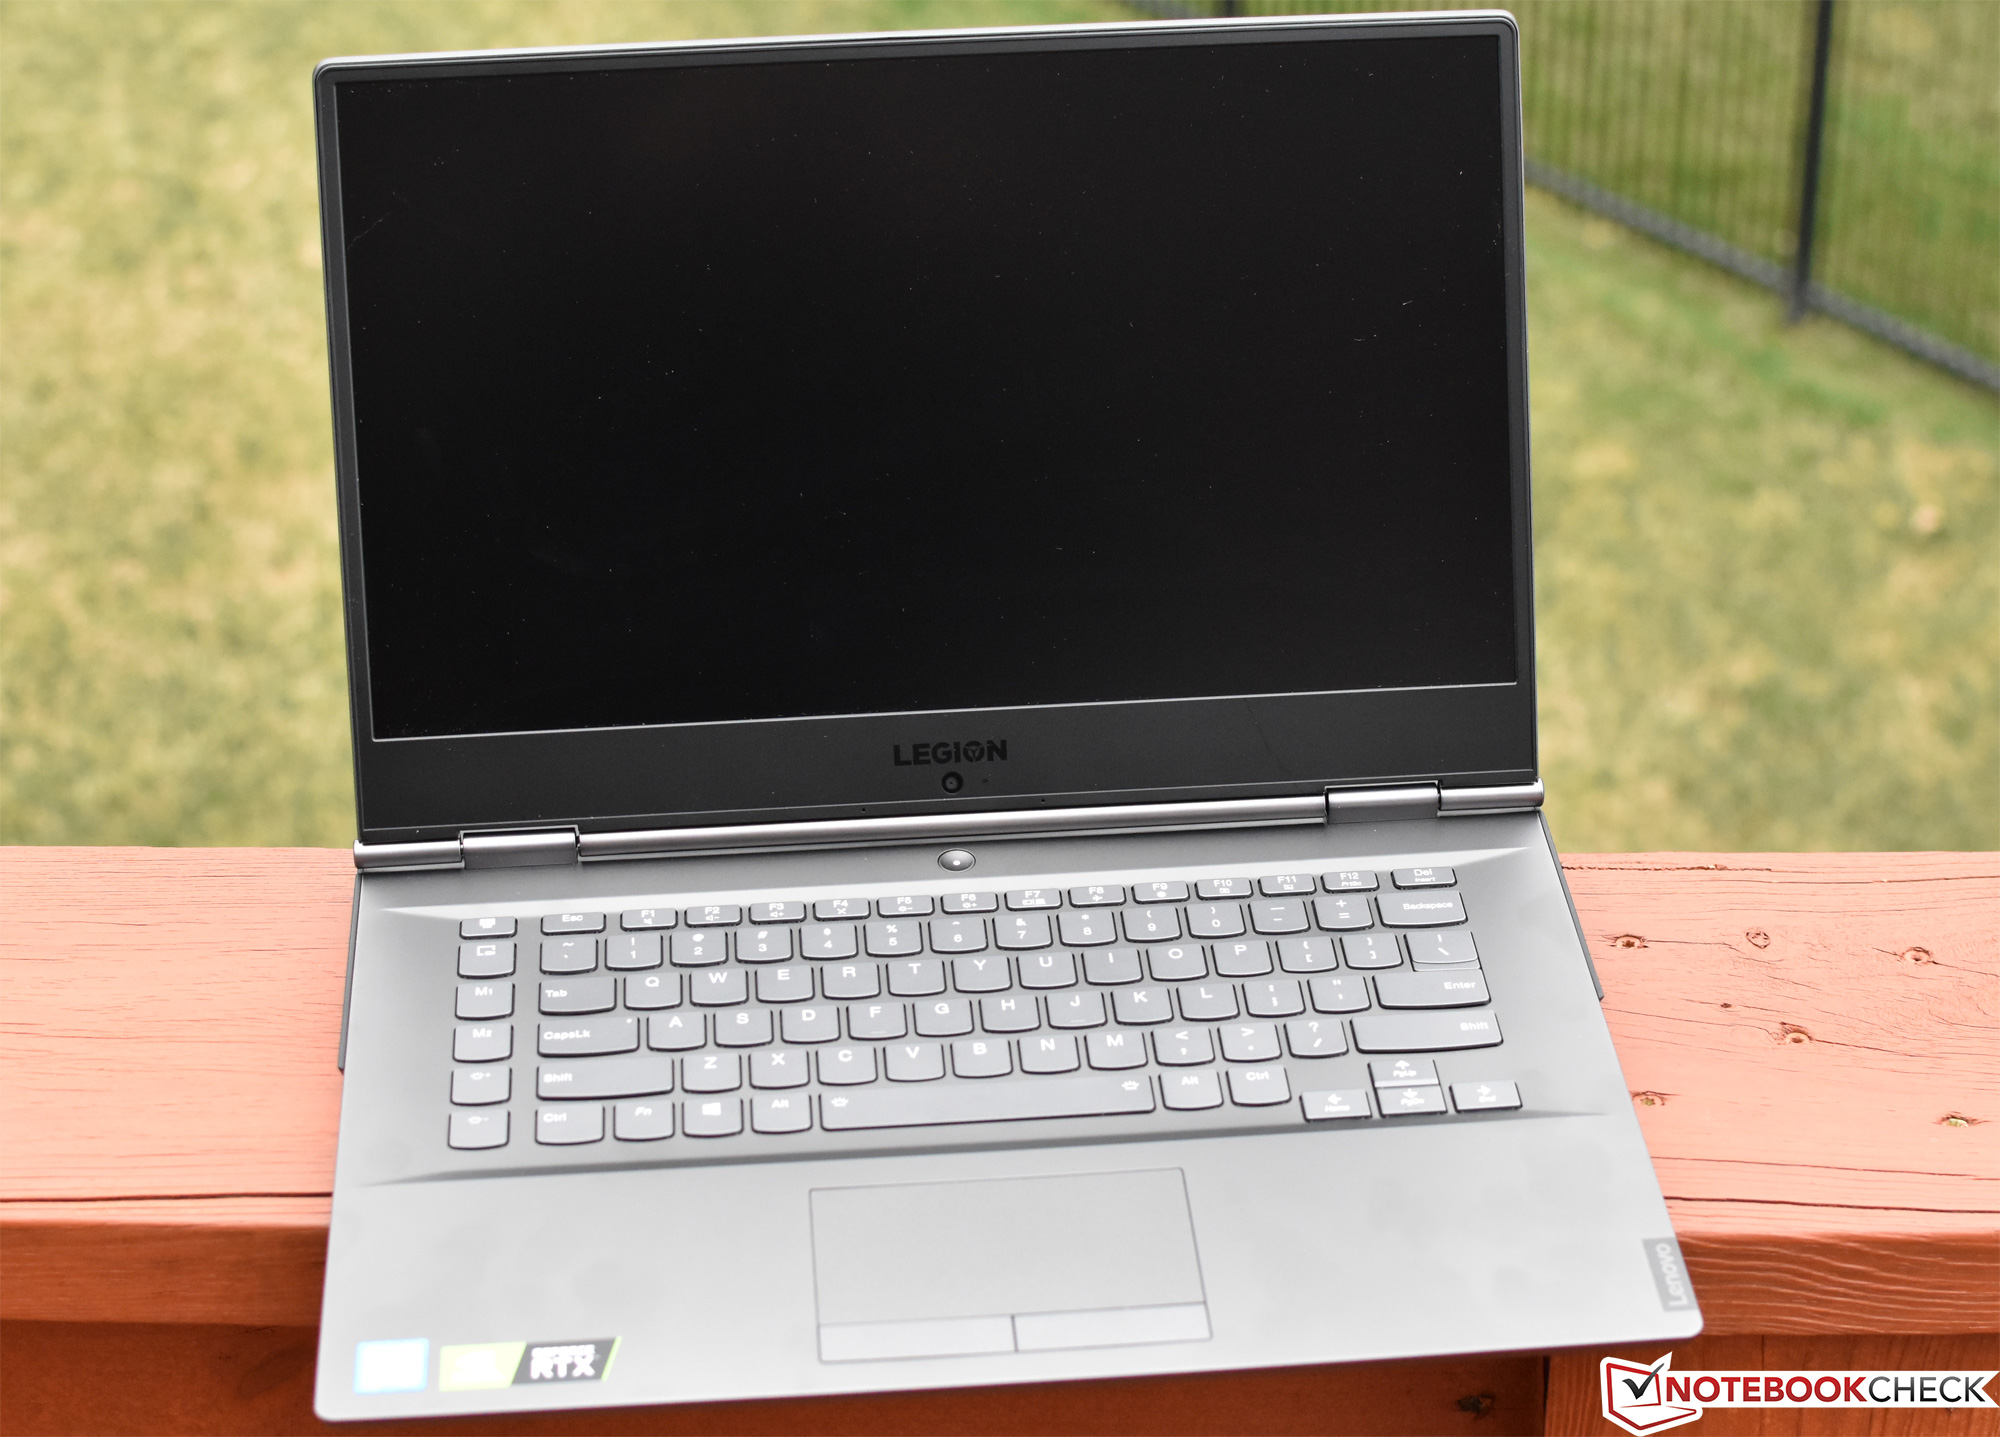
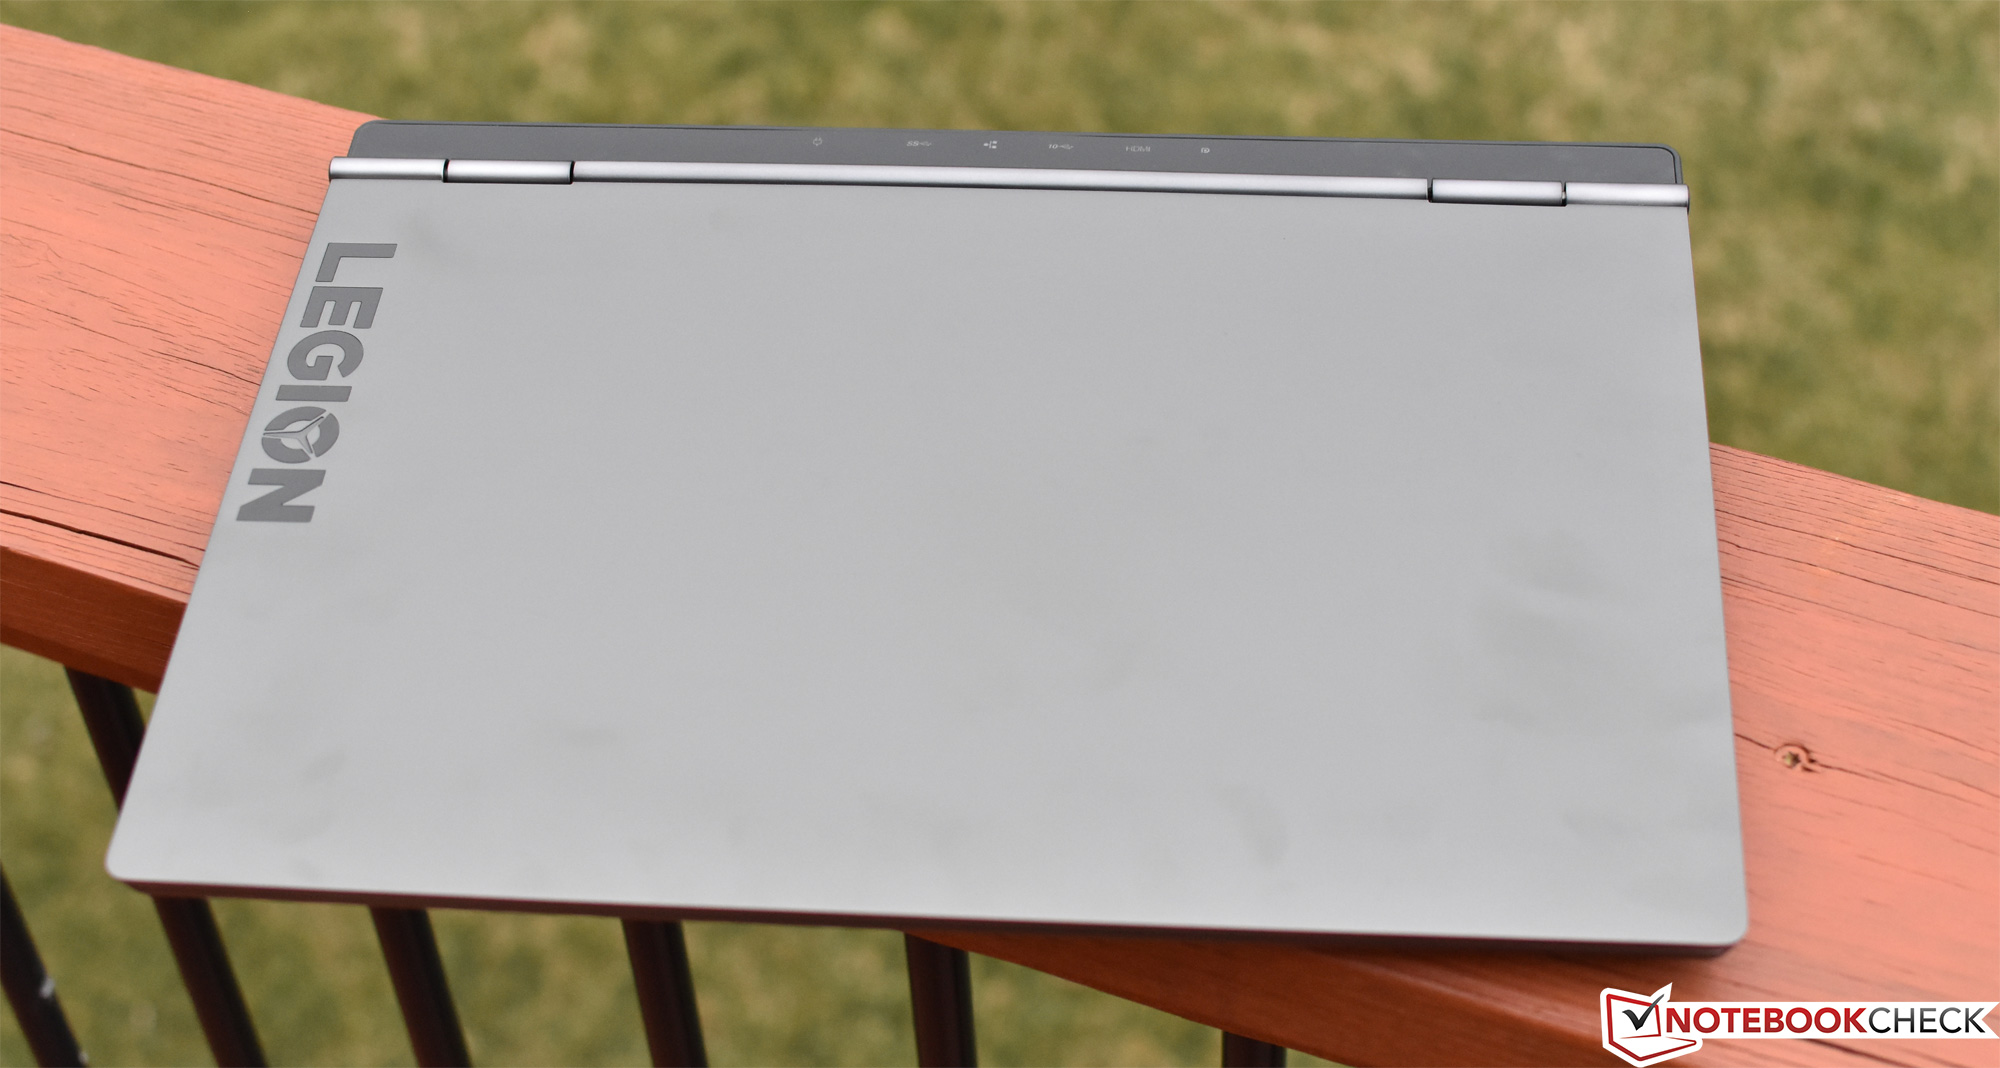
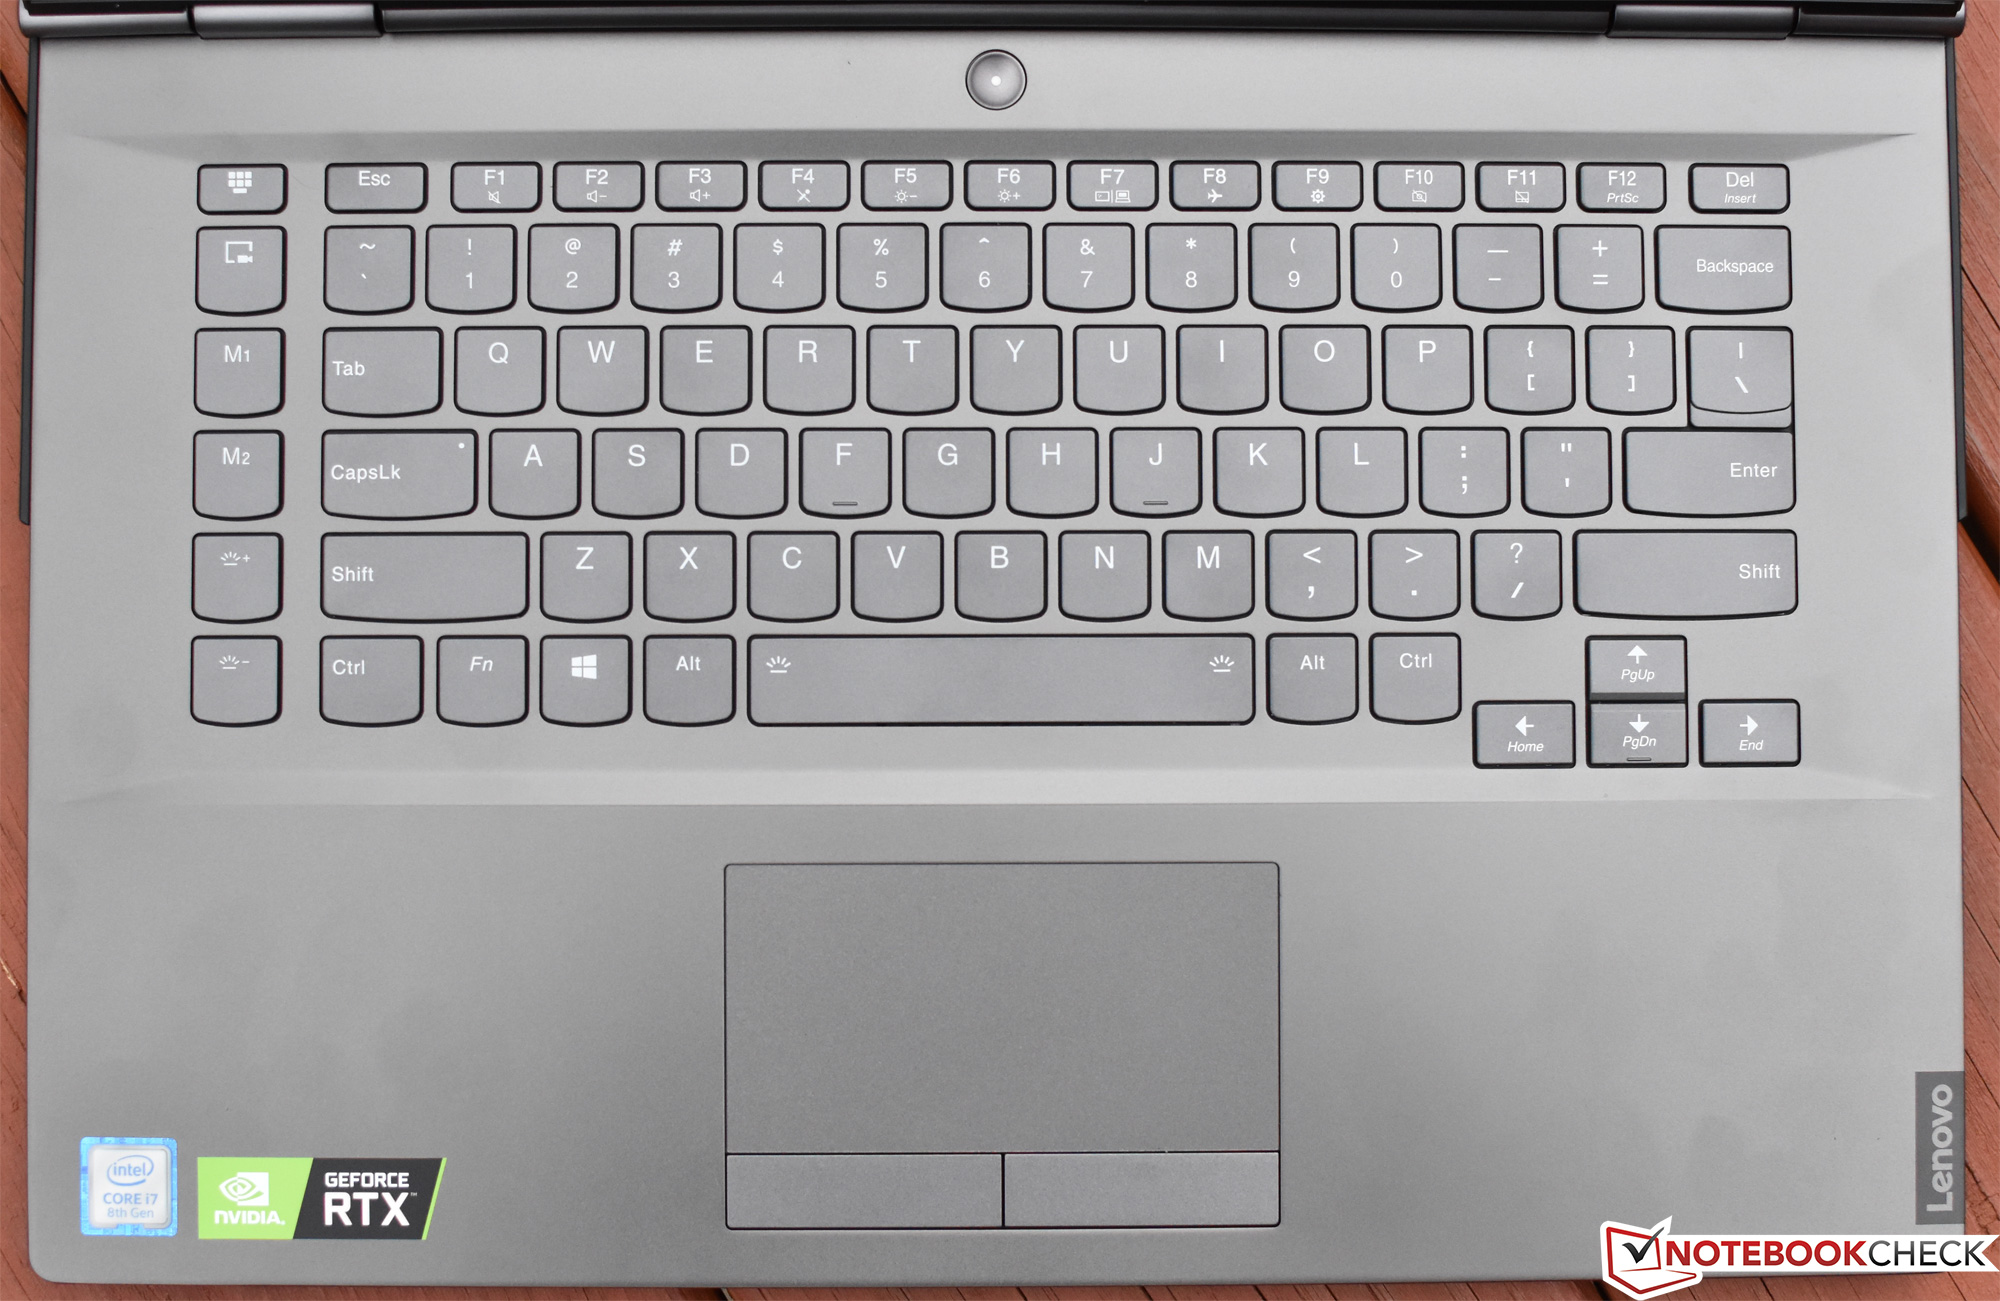
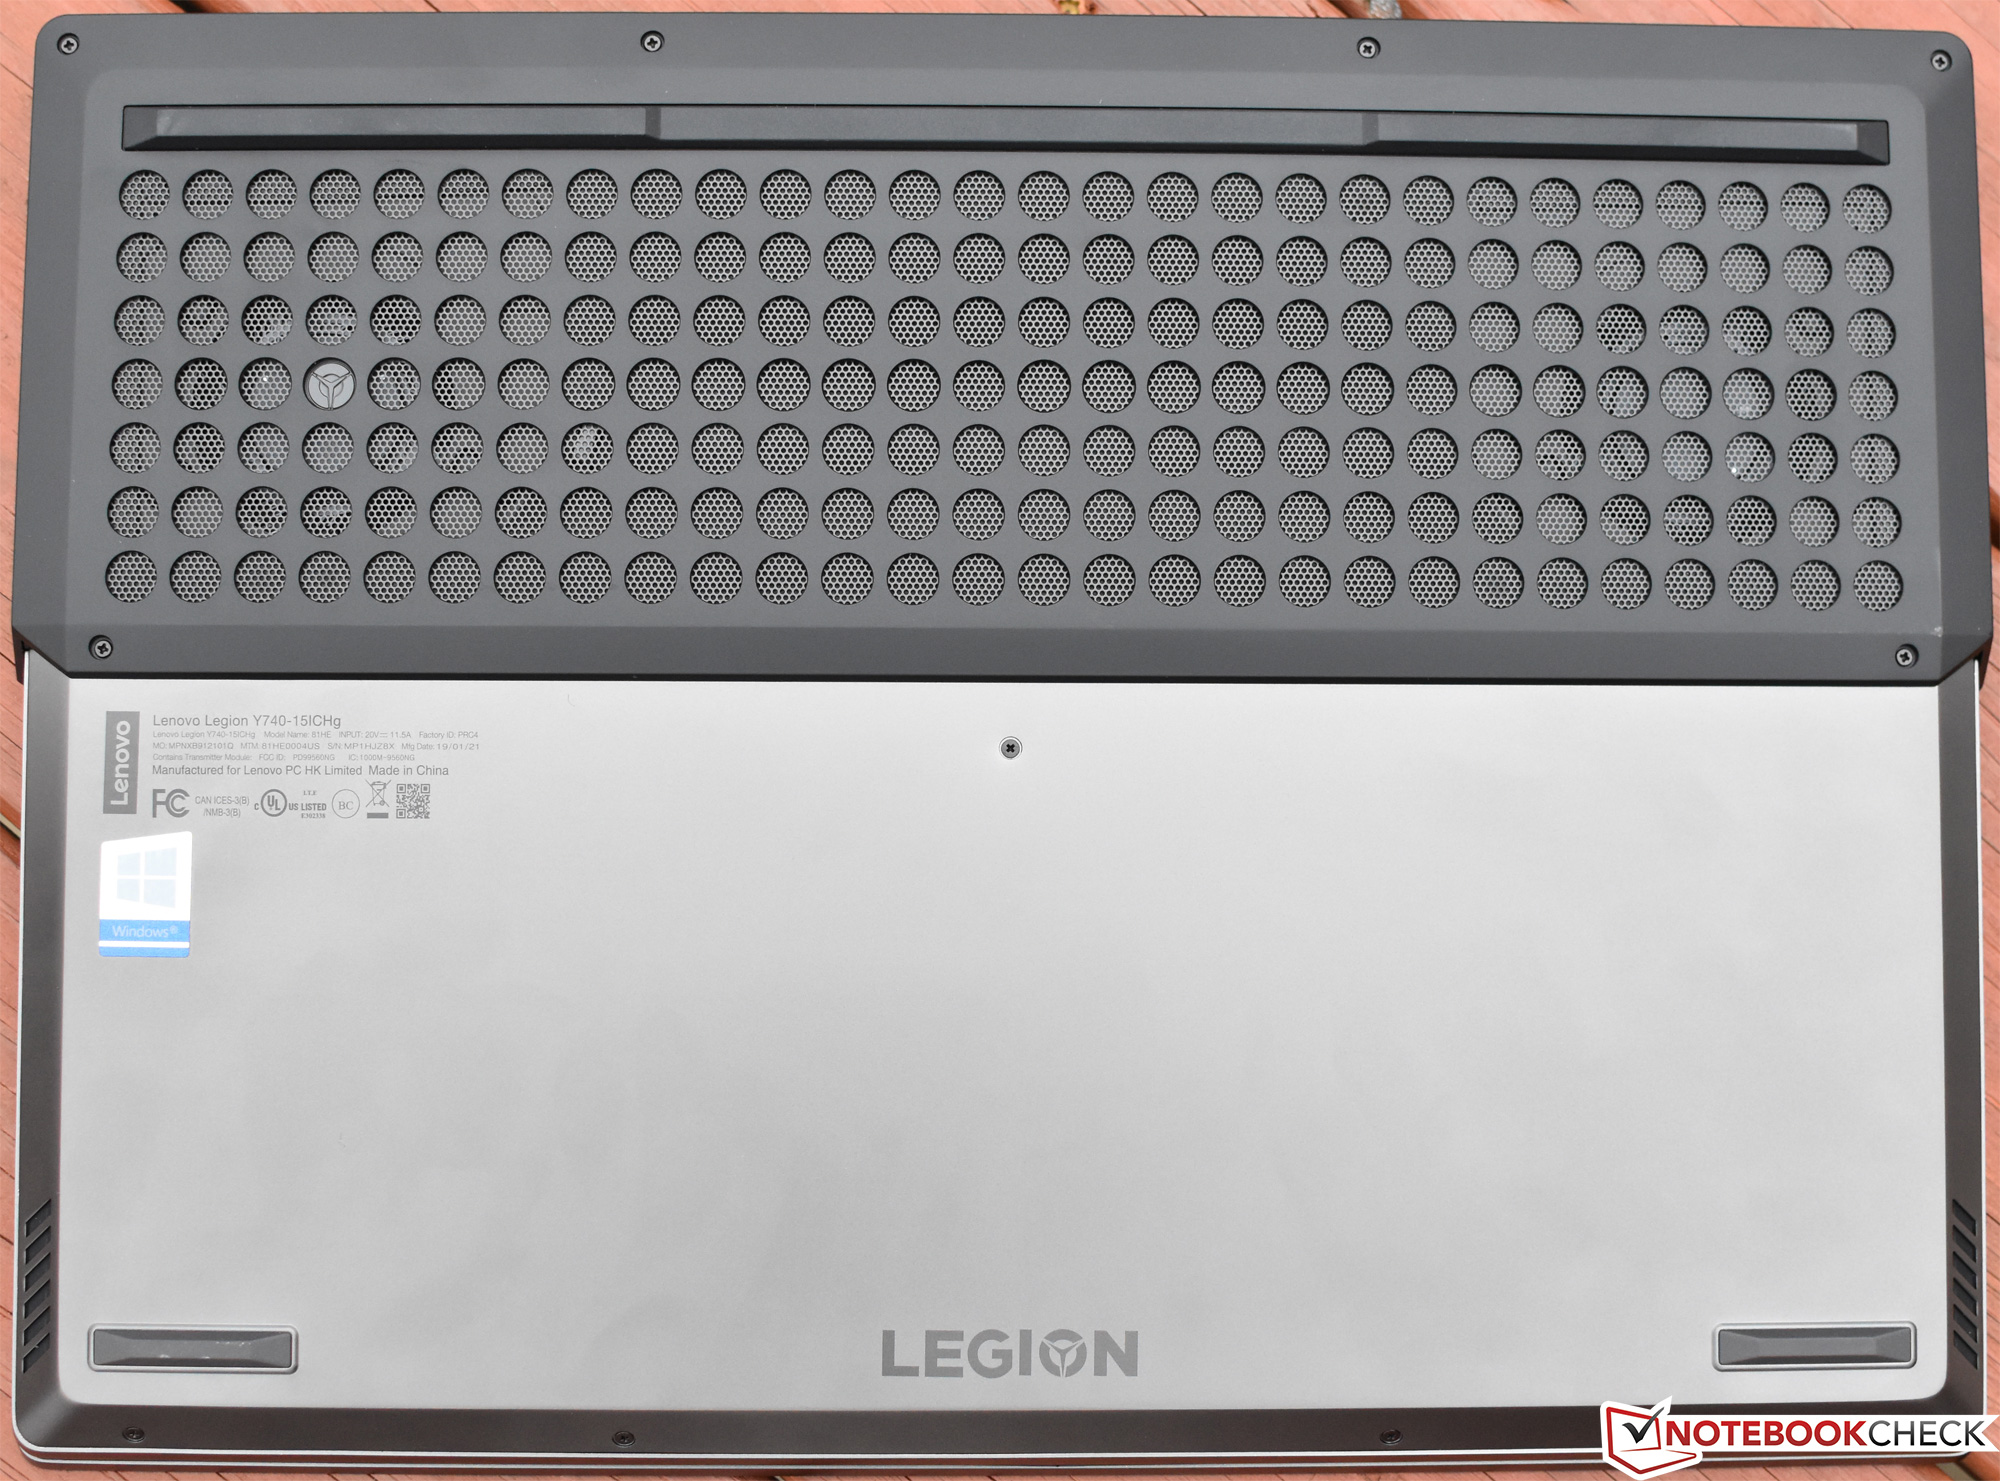
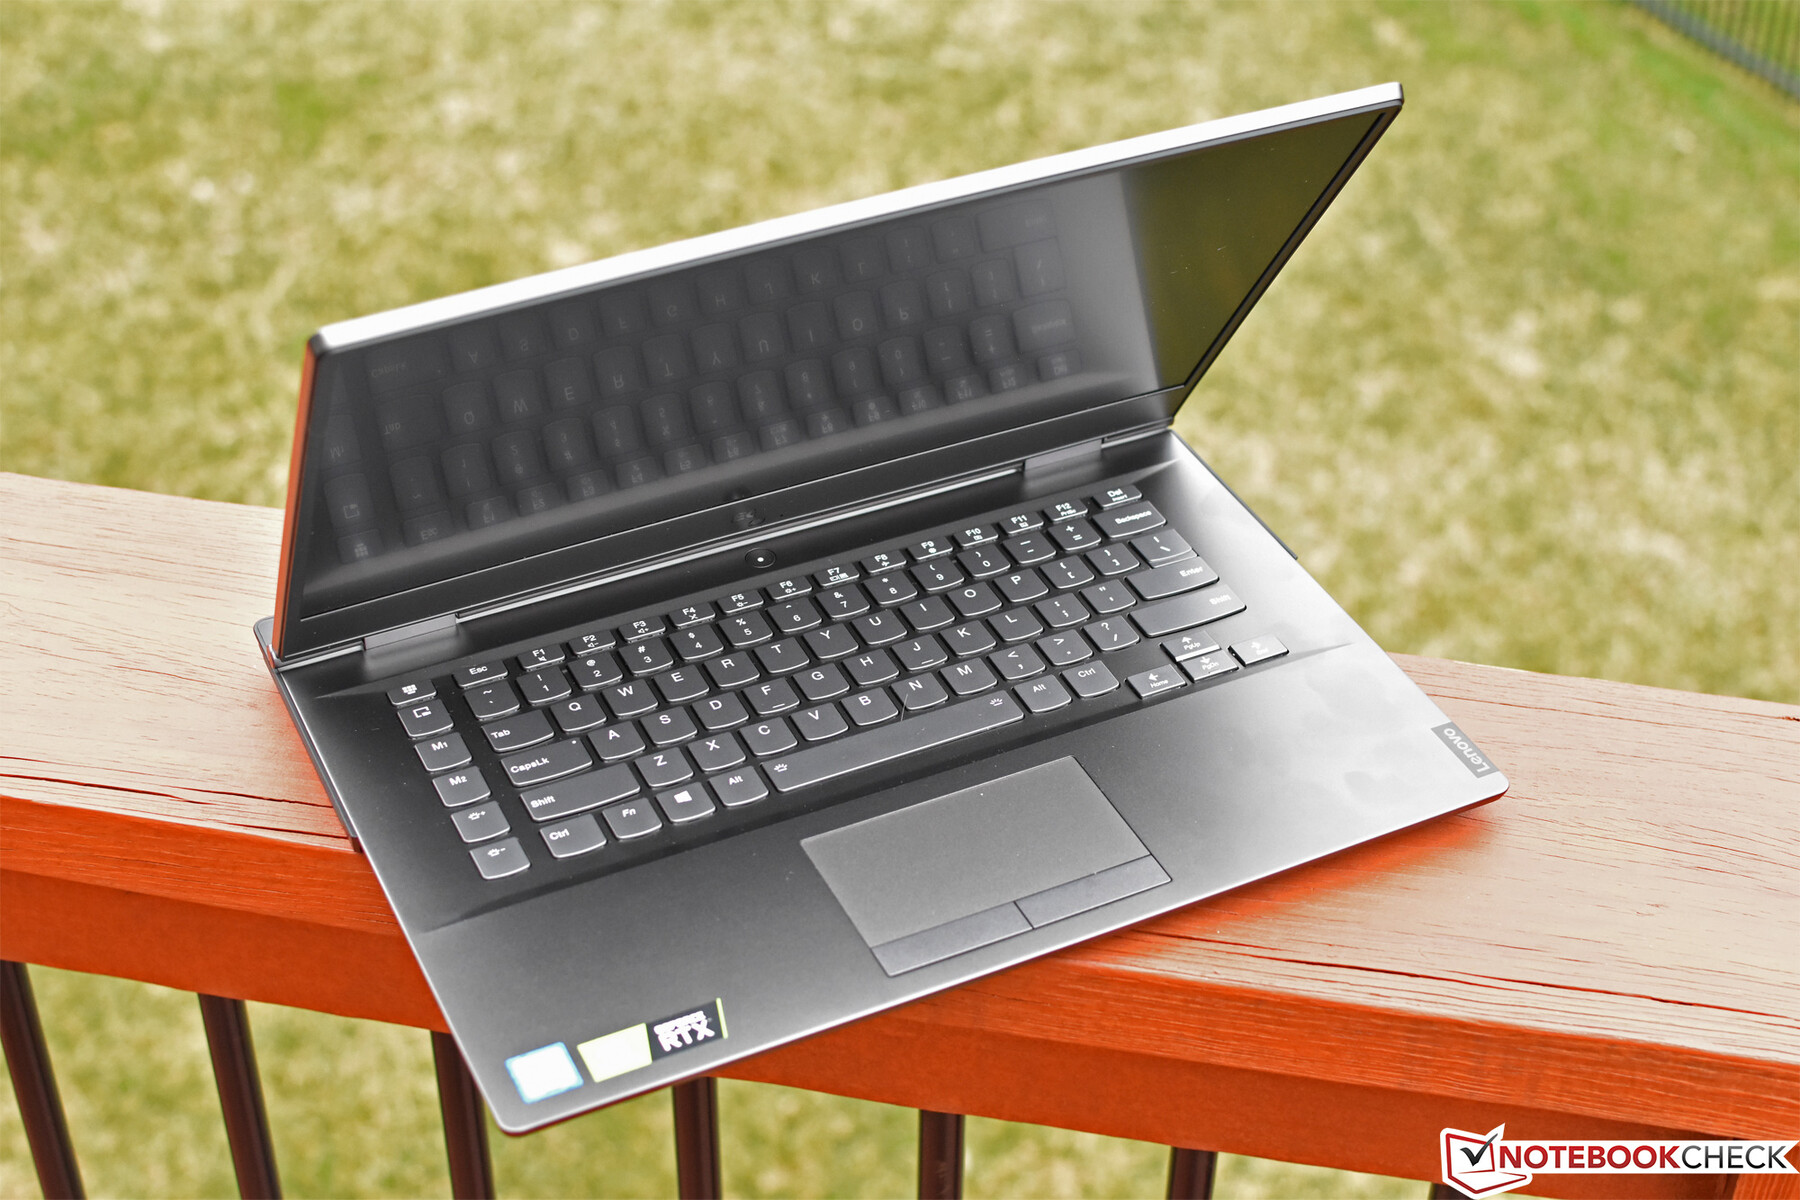
Designen, om än okonventionell, lyckas både estetiskt och haptiskt även om den lämnar en del att önska ur hållbarhetssynpunkt. Skärmlocket i synnerhet är lite mer böjligt än vi känner oss bekväma med och enheten ger efter vid måttligt tryck mot basens mitt. Inmatningsenheterna är bara skapliga; tangentbordets korta restid och svampiga återkoppling samt den uttröttande kraft som krävs för att aktivera styrplattans knappar överträffas lätt av ledande konkurrenter (som XPS 15 och MSI GS65). Underhåll är ganska enkelt att utföra.
Legion Y740-15ICHg har ett bra pris: 20.000 kronor för vår konfiguration (med rabatt på ca 1.750 kronor vid skrivande stund). Den är tillräckligt kraftfull för att kunna köra alla moderna spel med höga inställningar i dess egna FHD-upplösning i över 60 fps. Konkurrenterna inkluderar Alienware m15, Razer Blade 15, Acer Predator Triton 500 och MSI GE75 som alla har sina egna unika för- och nackdelar. Men totalt sett så utgör Y740 en betydande förbättring gentemot sin föregångare och är värd att överväga för den som söker en kapabel spellaptop som kan hantera de huvudsakliga utmaningarna utan att tömma bankkontot.
Lenovo Legion Y740-15ICHg
- 09/20/2019 v7 (old)
Steve Schardein
Price comparison
