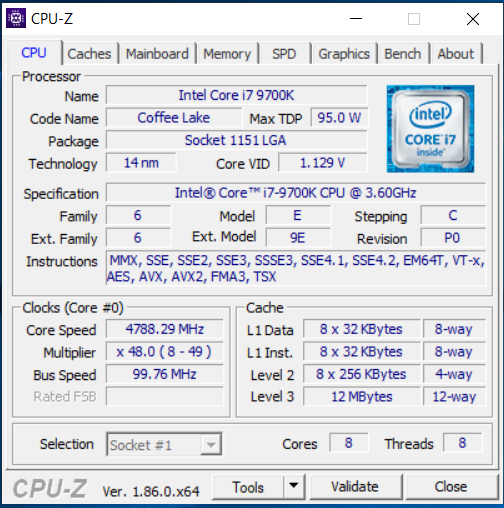
Test: Schenker XMG Ultra 15 (i7-9700K, RTX 2070) Clevo P751TM1-G Laptop (Sammanfattning)
| SD Card Reader | |
| average JPG Copy Test (av. of 3 runs) | |
| Gigabyte Aero 15-X9 (Toshiba Exceria Pro SDXC 64 GB UHS-II) | |
| Schenker XMG Ultra 15 Turing (Toshiba Exceria Pro SDXC 64 GB UHS-II) | |
| Schenker XMG Ultra 15 (Toshiba Exceria Pro SDXC 64 GB UHS-II) | |
| Genomsnitt av klass Gaming (20.9 - 210, n=54, senaste 2 åren) | |
| maximum AS SSD Seq Read Test (1GB) | |
| Gigabyte Aero 15-X9 (Toshiba Exceria Pro SDXC 64 GB UHS-II) | |
| Schenker XMG Ultra 15 Turing (Toshiba Exceria Pro SDXC 64 GB UHS-II) | |
| Schenker XMG Ultra 15 (Toshiba Exceria Pro SDXC 64 GB UHS-II) | |
| Genomsnitt av klass Gaming (25.5 - 261, n=51, senaste 2 åren) | |
| |||||||||||||||||||||||||
Distribution av ljusstyrkan: 89 %
Mitt på batteriet: 263 cd/m²
Kontrast: 1547:1 (Svärta: 0.17 cd/m²)
ΔE ColorChecker Calman: 4.45 | ∀{0.5-29.43 Ø4.73}
calibrated: 1.93
ΔE Greyscale Calman: 4.77 | ∀{0.09-98 Ø4.97}
93% sRGB (Argyll 1.6.3 3D)
60% AdobeRGB 1998 (Argyll 1.6.3 3D)
67.1% AdobeRGB 1998 (Argyll 3D)
92.6% sRGB (Argyll 3D)
66.1% Display P3 (Argyll 3D)
Gamma: 2.52
CCT: 7767 K
| Schenker XMG Ultra 15 Turing AU Optronics B156HAN07.0 (AUO70ED), IPS, 1920x1080 | Schenker XMG Ultra 15 AU Optronics B156HTN05.2 (AUO52ED), TN, 1920x1080 | Alienware 15 R4 LG Philips LP156WF6 (LGD0540), IPS, 1920x1080 | Gigabyte Aero 15-X9 LGD05C0, IPS, 1920x1080 | Razer Blade 15 RTX 2070 Max-Q LG Philips LGD05C0, IPS, 1920x1080 | Acer Predator Triton 500 AU Optronics B156HAN08.2 (AUO82ED), IPS, 1920x1080 | |
|---|---|---|---|---|---|---|
| Display | -1% | -5% | -2% | 0% | -2% | |
| Display P3 Coverage (%) | 66.1 | 66.8 1% | 65.7 -1% | 63.5 -4% | 65.3 -1% | 64.2 -3% |
| sRGB Coverage (%) | 92.6 | 90.7 -2% | 86.4 -7% | 93.1 1% | 94.9 2% | 92.6 0% |
| AdobeRGB 1998 Coverage (%) | 67.1 | 66.3 -1% | 63.1 -6% | 64.5 -4% | 66.3 -1% | 65.7 -2% |
| Response Times | 0% | -101% | 1% | 7% | 34% | |
| Response Time Grey 50% / Grey 80% * (ms) | 17.6 ? | 24.2 ? -37% | 37.6 ? -114% | 16.4 ? 7% | 16.8 ? 5% | 8 ? 55% |
| Response Time Black / White * (ms) | 12.8 ? | 8 ? 37% | 24 ? -88% | 13.6 ? -6% | 11.6 ? 9% | 11.2 ? 13% |
| PWM Frequency (Hz) | 20830 ? | |||||
| Screen | -47% | -14% | 8% | -0% | -8% | |
| Brightness middle (cd/m²) | 263 | 363 38% | 292 11% | 250 -5% | 314.7 20% | 304 16% |
| Brightness (cd/m²) | 264 | 365 38% | 278 5% | 235 -11% | 312 18% | 299 13% |
| Brightness Distribution (%) | 89 | 74 -17% | 88 -1% | 85 -4% | 90 1% | 89 0% |
| Black Level * (cd/m²) | 0.17 | 0.58 -241% | 0.29 -71% | 0.29 -71% | 0.38 -124% | 0.27 -59% |
| Contrast (:1) | 1547 | 626 -60% | 1007 -35% | 862 -44% | 828 -46% | 1126 -27% |
| Colorchecker dE 2000 * | 4.45 | 8.7 -96% | 4.9 -10% | 1.46 67% | 2.56 42% | 4.66 -5% |
| Colorchecker dE 2000 max. * | 8.33 | 12.91 -55% | 10.08 -21% | 2.47 70% | 4.89 41% | 9.65 -16% |
| Colorchecker dE 2000 calibrated * | 1.93 | 2.36 -22% | 2.27 -18% | 1.71 11% | 1.72 11% | |
| Greyscale dE 2000 * | 4.77 | 9.26 -94% | 4.89 -3% | 1.27 73% | 3.4 29% | 5.53 -16% |
| Gamma | 2.52 87% | 2.16 102% | 2.36 93% | 2.4 92% | 2.3 96% | 2.5 88% |
| CCT | 7767 84% | 9390 69% | 7598 86% | 6749 96% | 6435 101% | 8028 81% |
| Color Space (Percent of AdobeRGB 1998) (%) | 60 | 59 -2% | 56 -7% | 60 0% | 60.7 1% | 60 0% |
| Color Space (Percent of sRGB) (%) | 93 | 91 -2% | 86 -8% | 93 0% | 94.6 2% | 93 0% |
| Totalt genomsnitt (program/inställningar) | -16% /
-32% | -40% /
-23% | 2% /
5% | 2% /
1% | 8% /
-1% |
* ... mindre är bättre
Visa svarstider
| ↔ Svarstid svart till vitt | ||
|---|---|---|
| 12.8 ms ... stiga ↗ och falla ↘ kombinerat | ↗ 7.6 ms stiga | 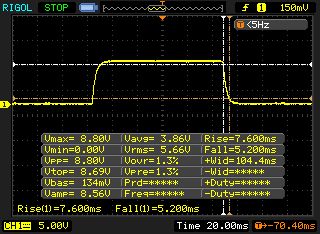 |
| ↘ 5.2 ms hösten | ||
| Skärmen visar bra svarsfrekvens i våra tester, men kan vara för långsam för konkurrenskraftiga spelare. I jämförelse sträcker sig alla testade enheter från 0.1 (minst) till 240 (maximalt) ms. » 33 % av alla enheter är bättre. Det betyder att den uppmätta svarstiden är bättre än genomsnittet av alla testade enheter (19.9 ms). | ||
| ↔ Svarstid 50 % grått till 80 % grått | ||
| 17.6 ms ... stiga ↗ och falla ↘ kombinerat | ↗ 9.2 ms stiga | 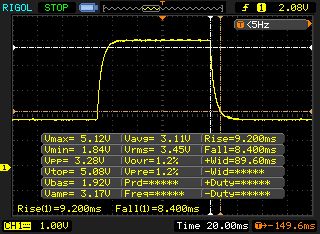 |
| ↘ 8.4 ms hösten | ||
| Skärmen visar bra svarsfrekvens i våra tester, men kan vara för långsam för konkurrenskraftiga spelare. I jämförelse sträcker sig alla testade enheter från 0.165 (minst) till 636 (maximalt) ms. » 31 % av alla enheter är bättre. Det betyder att den uppmätta svarstiden är bättre än genomsnittet av alla testade enheter (31.1 ms). | ||
Skärmflimmer / PWM (Puls-Width Modulation)
| Skärmflimmer / PWM upptäcktes inte | 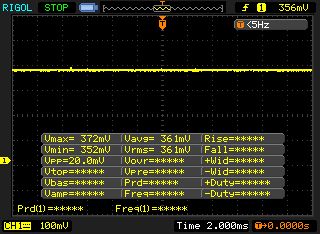 | ||
Som jämförelse: 52 % av alla testade enheter använder inte PWM för att dämpa skärmen. Om PWM upptäcktes mättes ett medelvärde av 7798 (minst: 5 - maximum: 343500) Hz. | |||
| Cinebench R10 | |
| Rendering Single 32Bit | |
| Genomsnitt av klass Gaming (7457 - 11779, n=8, senaste 2 åren) | |
| Schenker XMG Ultra 15 Turing | |
| Schenker XMG Ultra 15 | |
| Gigabyte Aero 15-X9 | |
| Rendering Multiple CPUs 32Bit | |
| Genomsnitt av klass Gaming (42932 - 81339, n=8, senaste 2 åren) | |
| Schenker XMG Ultra 15 Turing | |
| Gigabyte Aero 15-X9 | |
| Schenker XMG Ultra 15 | |
| Geekbench 3 | |
| 32 Bit Multi-Core Score | |
| Schenker XMG Ultra 15 Turing | |
| Gigabyte Aero 15-X9 | |
| Schenker XMG Ultra 15 | |
| 32 Bit Single-Core Score | |
| Schenker XMG Ultra 15 Turing | |
| Schenker XMG Ultra 15 | |
| Gigabyte Aero 15-X9 | |
| Geekbench 4.0 | |
| 64 Bit Multi-Core Score | |
| Genomsnitt av klass Gaming (40469 - 76142, n=4, senaste 2 åren) | |
| Schenker XMG Ultra 15 Turing | |
| Gigabyte Aero 15-X9 | |
| 64 Bit Single-Core Score | |
| Genomsnitt av klass Gaming (7589 - 9053, n=4, senaste 2 åren) | |
| Schenker XMG Ultra 15 Turing | |
| Gigabyte Aero 15-X9 | |
| Geekbench 4.4 | |
| 64 Bit Multi-Core Score | |
| Genomsnitt av klass Gaming (89200 - 97490, n=2, senaste 2 åren) | |
| Schenker XMG Ultra 15 Turing | |
| Gigabyte Aero 15-X9 | |
| 64 Bit Single-Core Score | |
| Genomsnitt av klass Gaming (9335 - 9492, n=2, senaste 2 åren) | |
| Schenker XMG Ultra 15 Turing | |
| Gigabyte Aero 15-X9 | |
| Mozilla Kraken 1.1 - Total | |
| Gigabyte Aero 15-X9 (Edge 44) | |
| Razer Blade 15 RTX 2070 Max-Q (Edge 44.17763.1.0) | |
| Schenker XMG Ultra 15 (Edge 41) | |
| Schenker XMG Ultra 15 Turing (Edge 44) | |
| Genomsnitt av klass Gaming (391 - 590, n=105, senaste 2 åren) | |
| Octane V2 - Total Score | |
| Genomsnitt av klass Gaming (87588 - 139447, n=30, senaste 2 åren) | |
| Schenker XMG Ultra 15 Turing (Edge 44) | |
| Gigabyte Aero 15-X9 (Edge 44) | |
| Razer Blade 15 RTX 2070 Max-Q (Edge 44.17763.1.0) | |
| JetStream 1.1 - 1.1 Total | |
| Genomsnitt av klass Gaming (518 - 647, n=5, senaste 2 åren) | |
| Schenker XMG Ultra 15 Turing (Edge 44) | |
| Razer Blade 15 RTX 2070 Max-Q (Edge 44.17763.1.0) | |
| Schenker XMG Ultra 15 (Edge 41) | |
| Gigabyte Aero 15-X9 (Edge 44) | |
* ... mindre är bättre
| PCMark 7 Score | 8114 poäng | |
| PCMark 8 Home Score Accelerated v2 | 5485 poäng | |
| PCMark 8 Creative Score Accelerated v2 | 6780 poäng | |
| PCMark 8 Work Score Accelerated v2 | 6258 poäng | |
| PCMark 10 Score | 6868 poäng | |
Hjälp | ||

| Schenker XMG Ultra 15 Turing Samsung SSD 970 EVO Plus 1TB | Schenker XMG Ultra 15 Samsung SSD 960 Evo 500GB m.2 NVMe | Alienware 15 R4 Toshiba XG5 KXG50ZNV256G | Gigabyte Aero 15-X9 Intel SSD 760p SSDPEKKW010T8 | Razer Blade 15 RTX 2070 Max-Q Samsung SSD PM981 MZVLB512HAJQ | Acer Predator Triton 500 2x WDC PC SN720 SDAPNTW-256G-1014 (RAID 0) | |
|---|---|---|---|---|---|---|
| CrystalDiskMark 5.2 / 6 | -5% | -27% | -15% | -16% | -2% | |
| Write 4K (MB/s) | 129.9 | 147.7 14% | 96.8 -25% | 97.1 -25% | 93.9 -28% | 93.6 -28% |
| Read 4K (MB/s) | 47.15 | 44.02 -7% | 35.73 -24% | 53.7 14% | 40.56 -14% | 38.82 -18% |
| Write Seq (MB/s) | 1840 | 1641 -11% | 362.3 -80% | 1526 -17% | 1468 -20% | 2455 33% |
| Read Seq (MB/s) | 1775 | 1830 3% | 2110 19% | 2020 14% | 1540 -13% | 2107 19% |
| Write 4K Q32T1 (MB/s) | 294.5 | 325.9 11% | 318.6 8% | 285.6 -3% | 293.5 0% | 298.7 1% |
| Read 4K Q32T1 (MB/s) | 373.6 | 369.1 -1% | 366.7 -2% | 321.8 -14% | 346 -7% | 338.7 -9% |
| Write Seq Q32T1 (MB/s) | 3295 | 1847 -44% | 351 -89% | 1533 -53% | 1941 -41% | 2902 -12% |
| Read Seq Q32T1 (MB/s) | 3535 | 3344 -5% | 2813 -20% | 2351 -33% | 3266 -8% | 3536 0% |
| 3DMark 06 Standard Score | 43781 poäng | |
| 3DMark 11 Performance | 22748 poäng | |
| 3DMark Ice Storm Standard Score | 227837 poäng | |
| 3DMark Cloud Gate Standard Score | 43983 poäng | |
| 3DMark Fire Strike Score | 18616 poäng | |
| 3DMark Time Spy Score | 7832 poäng | |
Hjälp | ||
| låg | med. | hög | ultra | |
|---|---|---|---|---|
| BioShock Infinite (2013) | 400.7 | 346 | 320.9 | 187.8 |
| The Witcher 3 (2015) | 331.2 | 223.1 | 128.4 | 73 |
| Batman: Arkham Knight (2015) | 214 | 202 | 159 | 108 |
| Ashes of the Singularity (2016) | 112.4 | 102 | 98.6 | |
| Civilization 6 (2016) | 224.1 | 163.6 | 129.8 | 121.1 |
| Destiny 2 (2017) | 206.1 | 181.2 | 169.5 | 144.5 |
| X-Plane 11.11 (2018) | 128.4 | 114.1 | 92.5 | |
| Far Cry 5 (2018) | 147 | 125 | 115 | 109 |
| The Witcher 3 - 1920x1080 Ultra Graphics & Postprocessing (HBAO+) | |
| Genomsnitt av klass Gaming (95 - 240, n=8, senaste 2 åren) | |
| Acer Predator Triton 500 | |
| Schenker XMG Ultra 15 Turing | |
| Razer Blade 15 RTX 2070 Max-Q | |
| Schenker XMG Ultra 15 | |
| Alienware 15 R4 | |
| Gigabyte Aero 15-X9 | |
| BioShock Infinite - 1920x1080 Ultra Preset, DX11 (DDOF) | |
| Schenker XMG Ultra 15 Turing | |
| Razer Blade 15 RTX 2070 Max-Q | |
| Gigabyte Aero 15-X9 | |
| Far Cry 5 - 1920x1080 Ultra Preset AA:T | |
| Genomsnitt av klass Gaming (70 - 151, n=10, senaste 2 åren) | |
| Schenker XMG Ultra 15 Turing | |
| Alienware 15 R4 | |
| Gigabyte Aero 15-X9 | |
Ljudnivå
| Låg belastning |
| 32 / 33 / 36 dB(A) |
| Hög belastning |
| 55 / 59 dB(A) |
 | ||
30 dB tyst 40 dB(A) hörbar 50 dB(A) högt ljud |
||
min: | ||
| Schenker XMG Ultra 15 Turing i7-9700K, GeForce RTX 2070 Mobile | Schenker XMG Ultra 15 i5-8600K, GeForce GTX 1070 Mobile | Alienware 15 R4 i9-8950HK, GeForce GTX 1070 Mobile | Acer Predator Triton 500 i7-8750H, GeForce RTX 2080 Max-Q | Gigabyte Aero 15-X9 i7-8750H, GeForce RTX 2070 Max-Q | Razer Blade 15 RTX 2070 Max-Q i7-8750H, GeForce RTX 2070 Max-Q | Genomsnitt av klass Gaming | |
|---|---|---|---|---|---|---|---|
| Noise | 3% | -0% | 11% | 9% | 18% | 17% | |
| av / miljö * (dB) | 30 | 30 -0% | 29 3% | 29 3% | 30 -0% | 28.8 4% | 24.1 ? 20% |
| Idle Minimum * (dB) | 32 | 32 -0% | 32 -0% | 30 6% | 32 -0% | 28.8 10% | 25.8 ? 19% |
| Idle Average * (dB) | 33 | 33 -0% | 33 -0% | 32 3% | 34 -3% | 28.8 13% | 27.4 ? 17% |
| Idle Maximum * (dB) | 36 | 35 3% | 50 -39% | 34 6% | 36 -0% | 29.4 18% | 30 ? 17% |
| Load Average * (dB) | 55 | 46 16% | 50 9% | 44 20% | 42 24% | 35.7 35% | 43 ? 22% |
| Witcher 3 ultra * (dB) | 57 | 54 5% | 51 11% | 46 19% | 44 23% | 42.5 25% | |
| Load Maximum * (dB) | 59 | 62 -5% | 51 14% | 47 20% | 48 19% | 45 24% | 54 ? 8% |
* ... mindre är bättre
(±) Den maximala temperaturen på ovansidan är 45 °C / 113 F, jämfört med genomsnittet av 40.4 °C / 105 F , allt från 21.2 till 68.8 °C för klassen Gaming.
(-) Botten värms upp till maximalt 48 °C / 118 F, jämfört med genomsnittet av 43.2 °C / 110 F
(+) Vid tomgångsbruk är medeltemperaturen för ovansidan 28.7 °C / 84 F, jämfört med enhetsgenomsnittet på 33.9 °C / ### class_avg_f### F.
(±) När du spelar The Witcher 3 är medeltemperaturen för ovansidan 32.3 °C / 90 F, jämfört med enhetsgenomsnittet på 33.9 °C / ## #class_avg_f### F.
(+) Handledsstöden och pekplattan når maximal hudtemperatur (34 °C / 93.2 F) och är därför inte varma.
(-) Medeltemperaturen för handledsstödsområdet på liknande enheter var 28.8 °C / 83.8 F (-5.2 °C / -9.4 F).
| Schenker XMG Ultra 15 Turing i7-9700K, GeForce RTX 2070 Mobile | Schenker XMG Ultra 15 i5-8600K, GeForce GTX 1070 Mobile | Alienware 15 R4 i9-8950HK, GeForce GTX 1070 Mobile | Acer Predator Triton 500 i7-8750H, GeForce RTX 2080 Max-Q | Gigabyte Aero 15-X9 i7-8750H, GeForce RTX 2070 Max-Q | Razer Blade 15 RTX 2070 Max-Q i7-8750H, GeForce RTX 2070 Max-Q | Genomsnitt av klass Gaming | |
|---|---|---|---|---|---|---|---|
| Heat | 2% | -30% | -13% | -11% | 3% | -5% | |
| Maximum Upper Side * (°C) | 45 | 42 7% | 53 -18% | 49 -9% | 56 -24% | 49 -9% | 45.2 ? -0% |
| Maximum Bottom * (°C) | 48 | 50 -4% | 68 -42% | 58 -21% | 66 -38% | 49 -2% | 48 ? -0% |
| Idle Upper Side * (°C) | 30 | 29 3% | 39 -30% | 33 -10% | 27 10% | 25.4 15% | 31.1 ? -4% |
| Idle Bottom * (°C) | 30 | 29 3% | 39 -30% | 33 -10% | 27 10% | 27.2 9% | 34.2 ? -14% |
* ... mindre är bättre
Schenker XMG Ultra 15 Turing ljudanalys
(±) | högtalarljudstyrkan är genomsnittlig men bra (77 dB)
Bas 100 - 315 Hz
(±) | reducerad bas - i genomsnitt 11.1% lägre än medianen
(±) | linjäriteten för basen är genomsnittlig (12.7% delta till föregående frekvens)
Mellan 400 - 2000 Hz
(+) | balanserad mellan - endast 1.9% från medianen
(+) | mids är linjära (4.3% delta till föregående frekvens)
Högsta 2 - 16 kHz
(+) | balanserade toppar - endast 3.6% från medianen
(+) | toppar är linjära (3.3% delta till föregående frekvens)
Totalt 100 - 16 000 Hz
(+) | det totala ljudet är linjärt (14.5% skillnad mot median)
Jämfört med samma klass
» 27% av alla testade enheter i den här klassen var bättre, 7% liknande, 66% sämre
» Den bästa hade ett delta på 6%, genomsnittet var 18%, sämst var 132%
Jämfört med alla testade enheter
» 18% av alla testade enheter var bättre, 4% liknande, 78% sämre
» Den bästa hade ett delta på 4%, genomsnittet var 24%, sämst var 134%
Schenker XMG Ultra 15 ljudanalys
(±) | högtalarljudstyrkan är genomsnittlig men bra (76 dB)
Bas 100 - 315 Hz
(±) | reducerad bas - i genomsnitt 10.7% lägre än medianen
(±) | linjäriteten för basen är genomsnittlig (12.1% delta till föregående frekvens)
Mellan 400 - 2000 Hz
(+) | balanserad mellan - endast 1.5% från medianen
(+) | mids är linjära (3.2% delta till föregående frekvens)
Högsta 2 - 16 kHz
(+) | balanserade toppar - endast 2.2% från medianen
(+) | toppar är linjära (3.1% delta till föregående frekvens)
Totalt 100 - 16 000 Hz
(+) | det totala ljudet är linjärt (13.3% skillnad mot median)
Jämfört med samma klass
» 19% av alla testade enheter i den här klassen var bättre, 5% liknande, 76% sämre
» Den bästa hade ett delta på 6%, genomsnittet var 18%, sämst var 132%
Jämfört med alla testade enheter
» 14% av alla testade enheter var bättre, 3% liknande, 83% sämre
» Den bästa hade ett delta på 4%, genomsnittet var 24%, sämst var 134%
Alienware 15 R4 ljudanalys
(+) | högtalare kan spela relativt högt (87 dB)
Bas 100 - 315 Hz
(-) | nästan ingen bas - i genomsnitt 21% lägre än medianen
(±) | linjäriteten för basen är genomsnittlig (9.8% delta till föregående frekvens)
Mellan 400 - 2000 Hz
(±) | högre mellan - i genomsnitt 6.1% högre än median
(+) | mids är linjära (5.8% delta till föregående frekvens)
Högsta 2 - 16 kHz
(+) | balanserade toppar - endast 2.2% från medianen
(+) | toppar är linjära (4.3% delta till föregående frekvens)
Totalt 100 - 16 000 Hz
(±) | linjäriteten för det totala ljudet är genomsnittlig (16.6% skillnad mot median)
Jämfört med samma klass
» 43% av alla testade enheter i den här klassen var bättre, 7% liknande, 50% sämre
» Den bästa hade ett delta på 6%, genomsnittet var 18%, sämst var 132%
Jämfört med alla testade enheter
» 29% av alla testade enheter var bättre, 6% liknande, 66% sämre
» Den bästa hade ett delta på 4%, genomsnittet var 24%, sämst var 134%
| Av/Standby | |
| Låg belastning | |
| Hög belastning |
|
Förklaring:
min: | |
| Schenker XMG Ultra 15 Turing i7-9700K, GeForce RTX 2070 Mobile | Schenker XMG Ultra 15 i5-8600K, GeForce GTX 1070 Mobile | Alienware 15 R4 i9-8950HK, GeForce GTX 1070 Mobile | Acer Predator Triton 500 i7-8750H, GeForce RTX 2080 Max-Q | Gigabyte Aero 15-X9 i7-8750H, GeForce RTX 2070 Max-Q | Razer Blade 15 RTX 2070 Max-Q i7-8750H, GeForce RTX 2070 Max-Q | Genomsnitt av klass Gaming | |
|---|---|---|---|---|---|---|---|
| Power Consumption | 11% | 24% | 37% | 45% | 47% | 37% | |
| Idle Minimum * (Watt) | 35 | 28 20% | 23 34% | 16 54% | 16 54% | 10.4 70% | 13.2 ? 62% |
| Idle Average * (Watt) | 39 | 31 21% | 26 33% | 22 44% | 18 54% | 14.6 63% | 18.9 ? 52% |
| Idle Maximum * (Watt) | 47 | 38 19% | 30 36% | 32 32% | 23 51% | 16.3 65% | 24.3 ? 48% |
| Load Average * (Watt) | 117 | 100 15% | 111 5% | 89 24% | 88 25% | 88.5 24% | 108 ? 8% |
| Witcher 3 ultra * (Watt) | 196 | 206 -5% | 182 7% | 147 25% | 120 39% | 155.4 21% | |
| Load Maximum * (Watt) | 299 | 309 -3% | 222 26% | 173 42% | 167 44% | 182.4 39% | 254 ? 15% |
* ... mindre är bättre
| Schenker XMG Ultra 15 Turing i7-9700K, GeForce RTX 2070 Mobile, 82 Wh | Schenker XMG Ultra 15 i5-8600K, GeForce GTX 1070 Mobile, 82 Wh | Alienware 15 R4 i9-8950HK, GeForce GTX 1070 Mobile, 99 Wh | Acer Predator Triton 500 i7-8750H, GeForce RTX 2080 Max-Q, 82 Wh | Gigabyte Aero 15-X9 i7-8750H, GeForce RTX 2070 Max-Q, 94.24 Wh | Razer Blade 15 RTX 2070 Max-Q i7-8750H, GeForce RTX 2070 Max-Q, 80 Wh | Genomsnitt av klass Gaming | |
|---|---|---|---|---|---|---|---|
| Batteridrifttid | 25% | 54% | 33% | 144% | 138% | 141% | |
| Reader / Idle (h) | 3.2 | 3.7 16% | 6.2 94% | 5.6 75% | 9.2 187% | 11.4 256% | 8.71 ? 172% |
| H.264 (h) | 2.6 | 3.1 19% | 6.1 135% | 8.26 ? 218% | |||
| WiFi v1.3 (h) | 2.6 | 3.2 23% | 5.1 96% | 3.2 23% | 6.4 146% | 6.5 150% | 7.02 ? 170% |
| Load (h) | 1.4 | 2 43% | 1 -29% | 1.4 0% | 2.9 107% | 1.5 7% | 1.47 ? 5% |
För
Emot
Läs den fullständiga versionen av den här recensionen på engelska här.
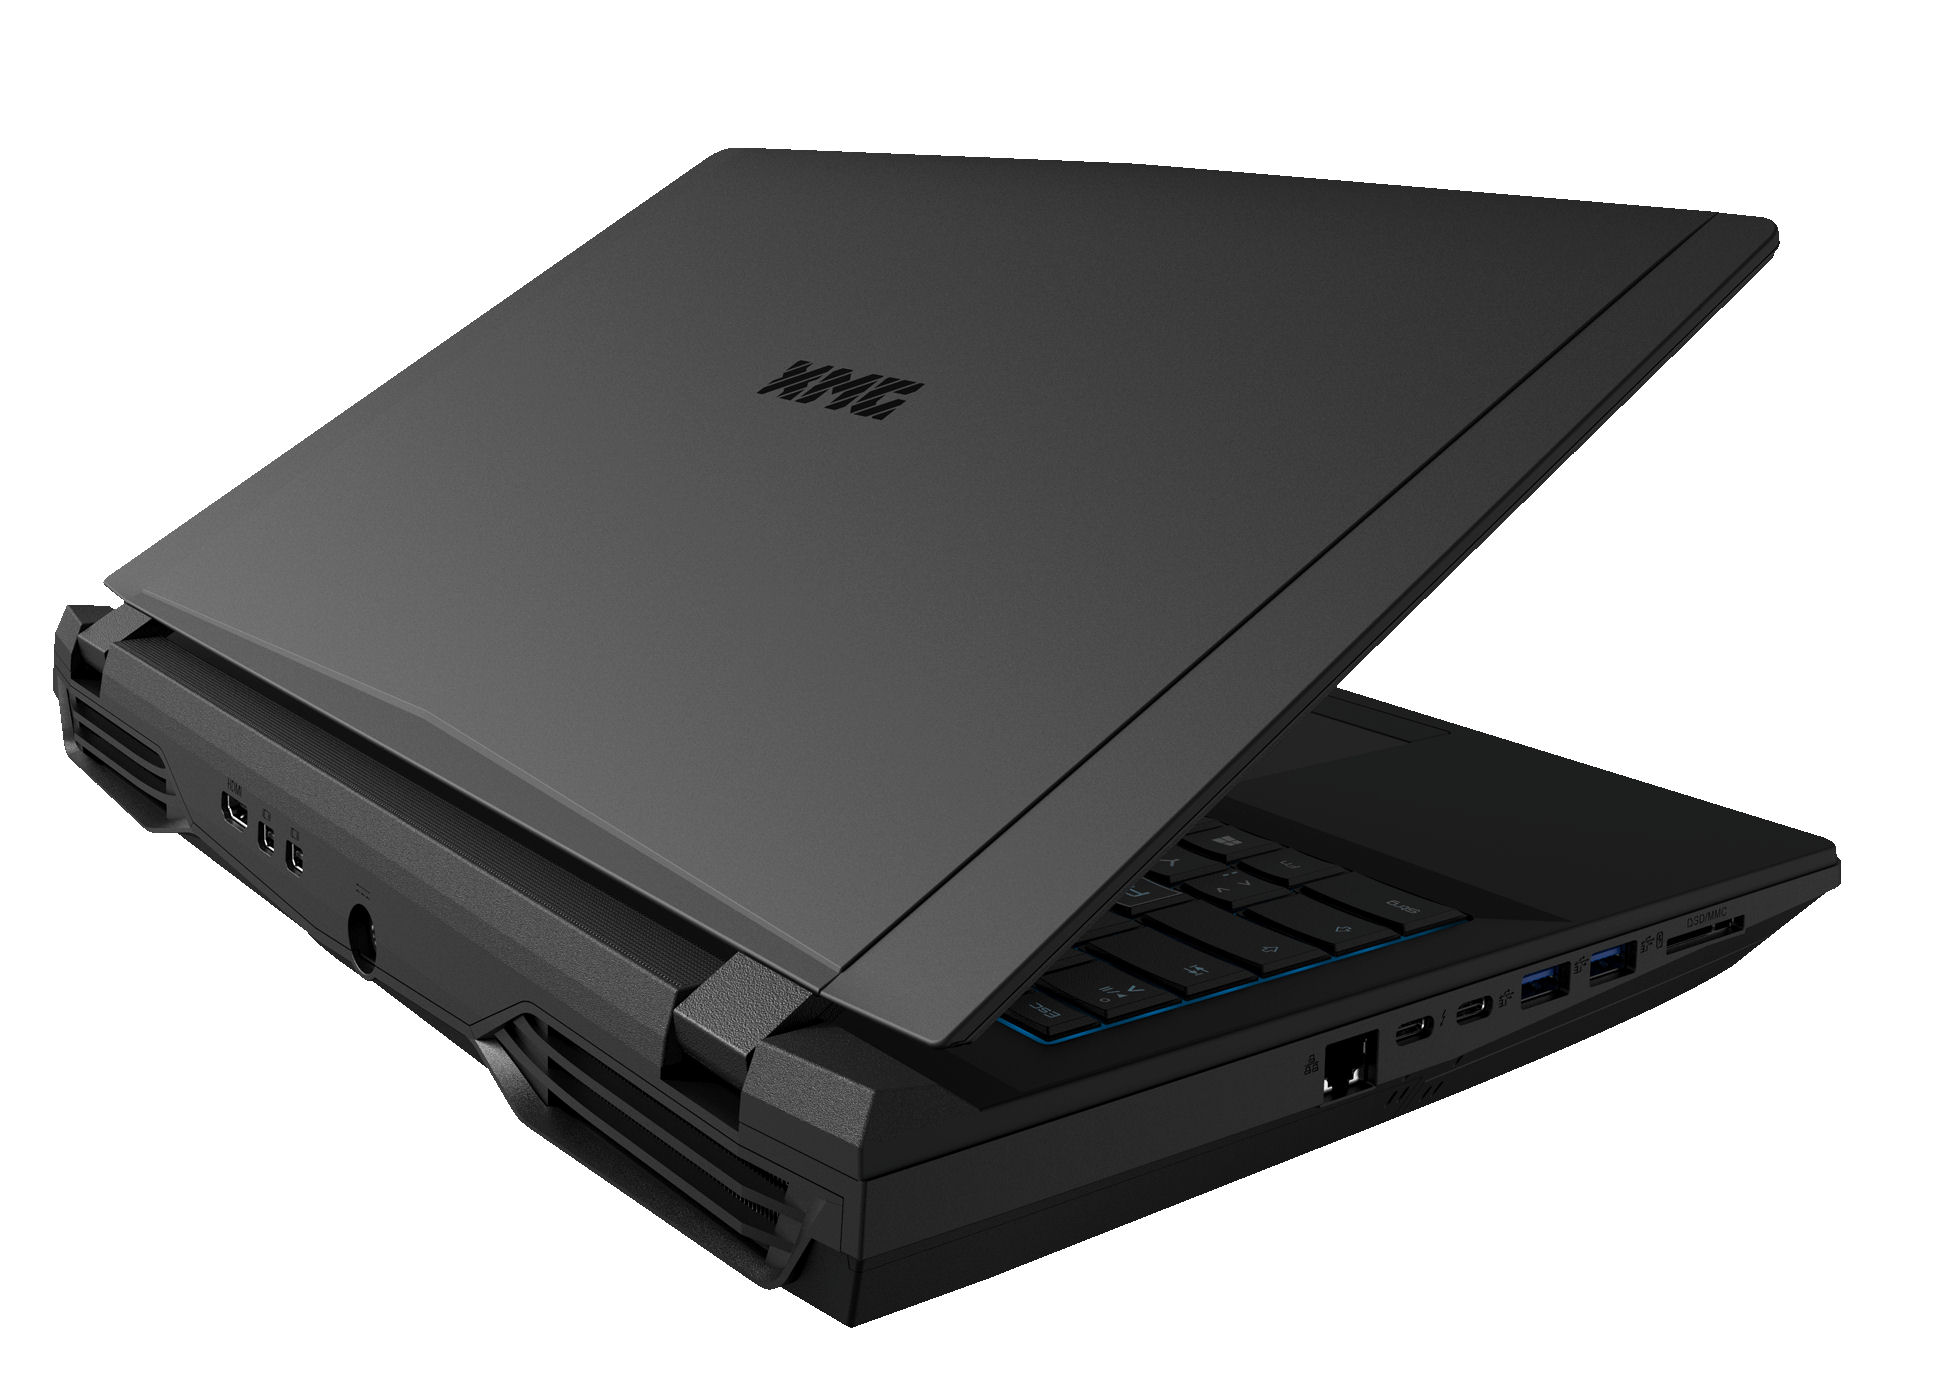
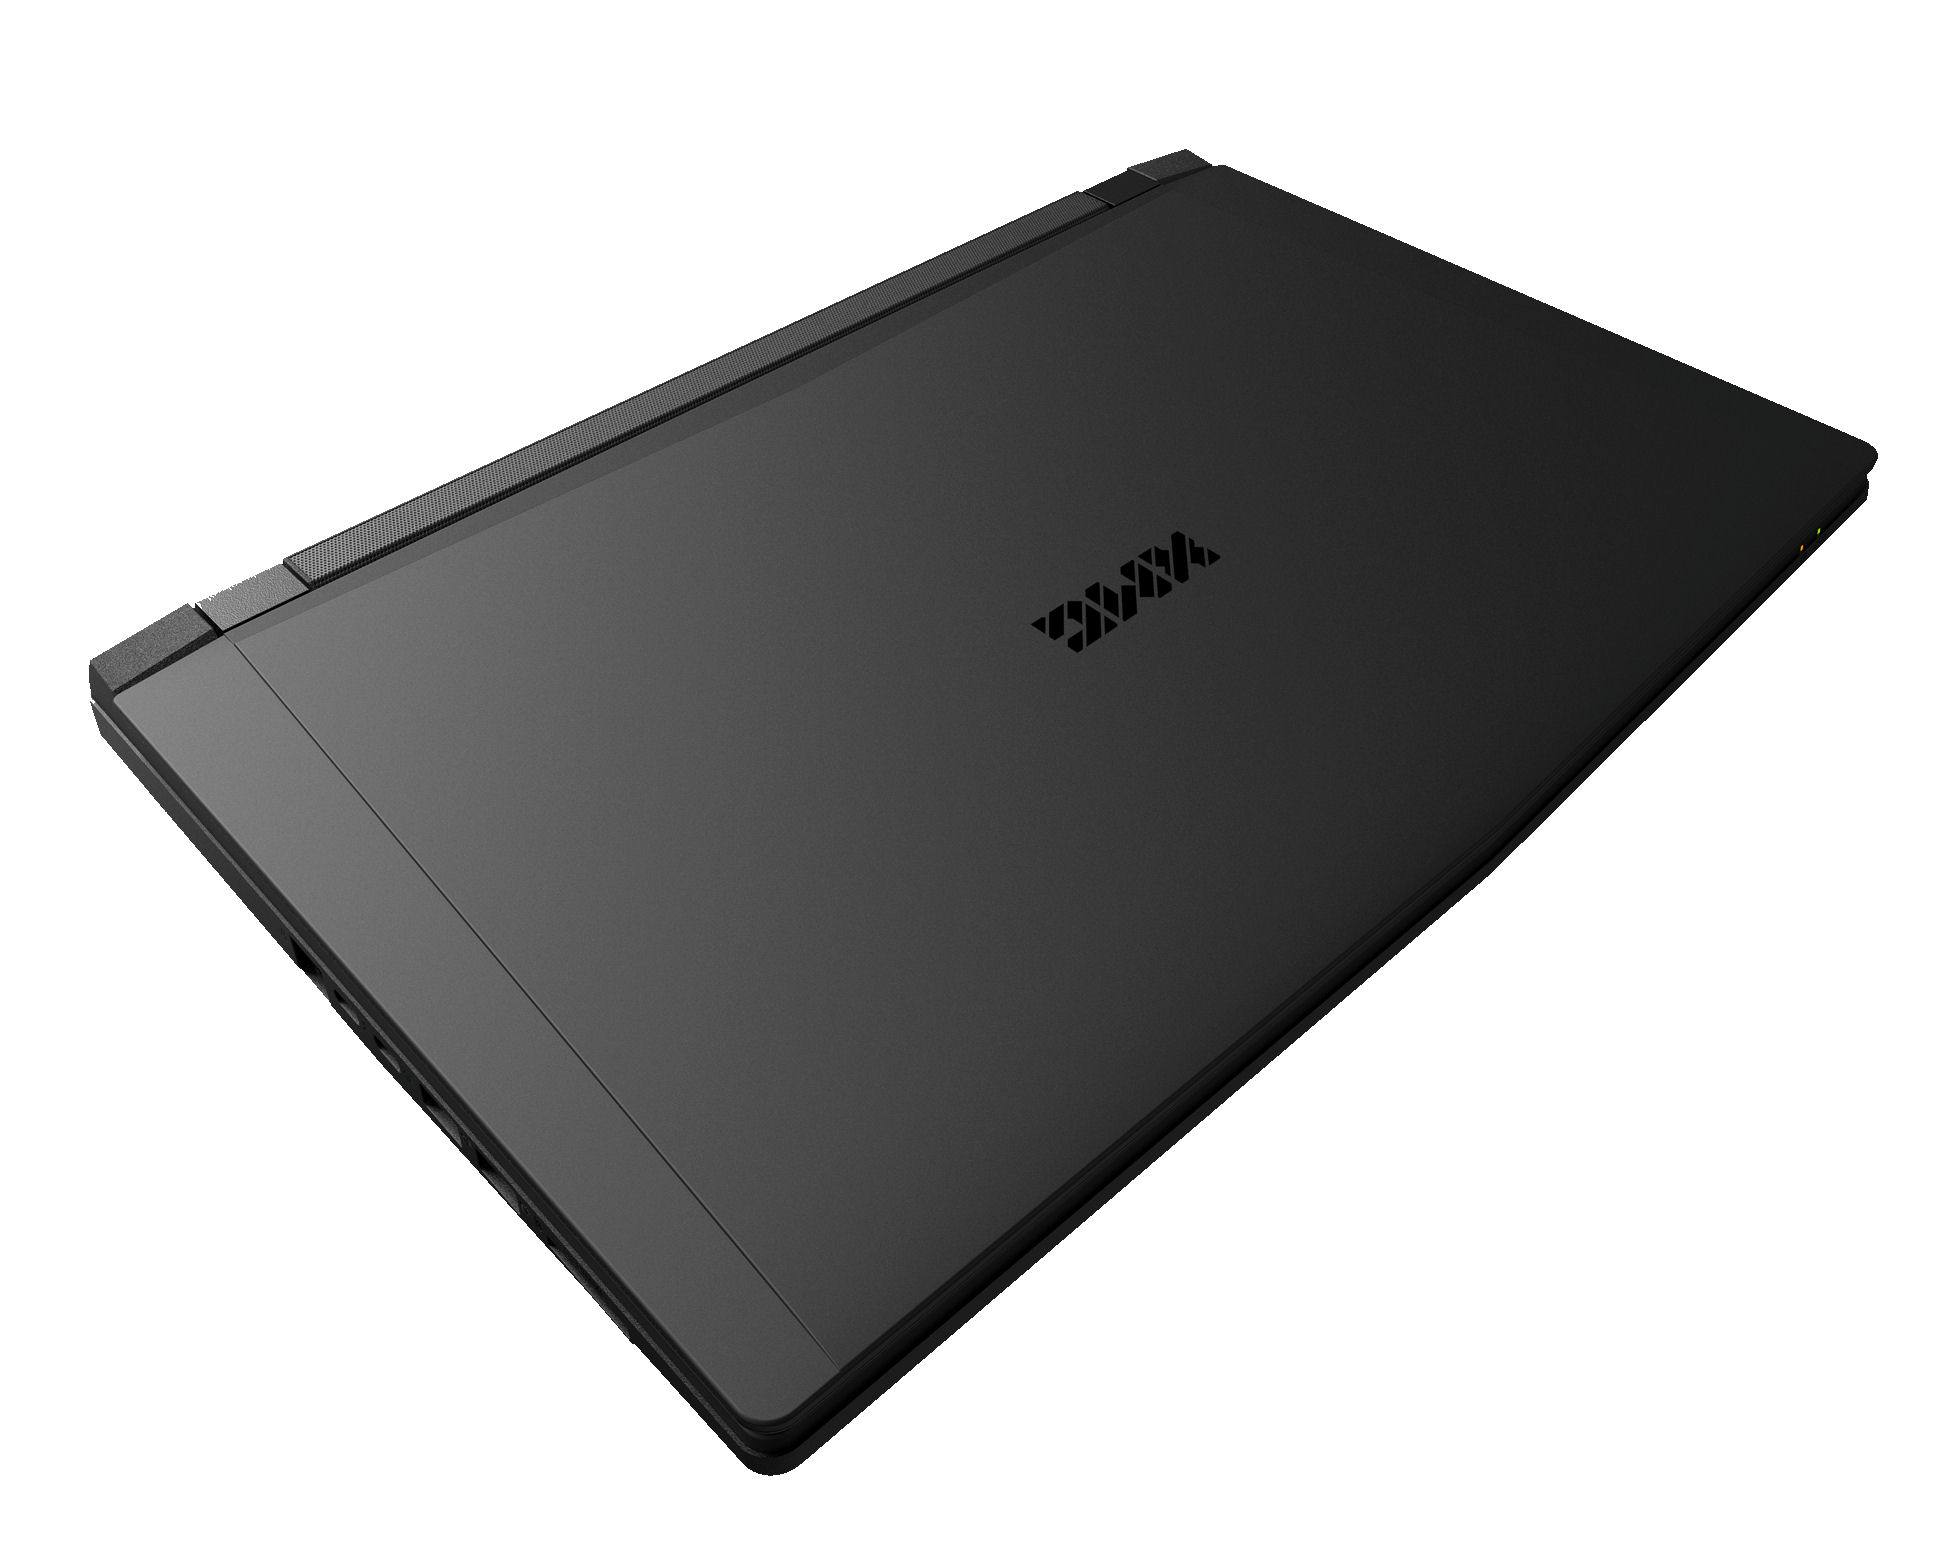
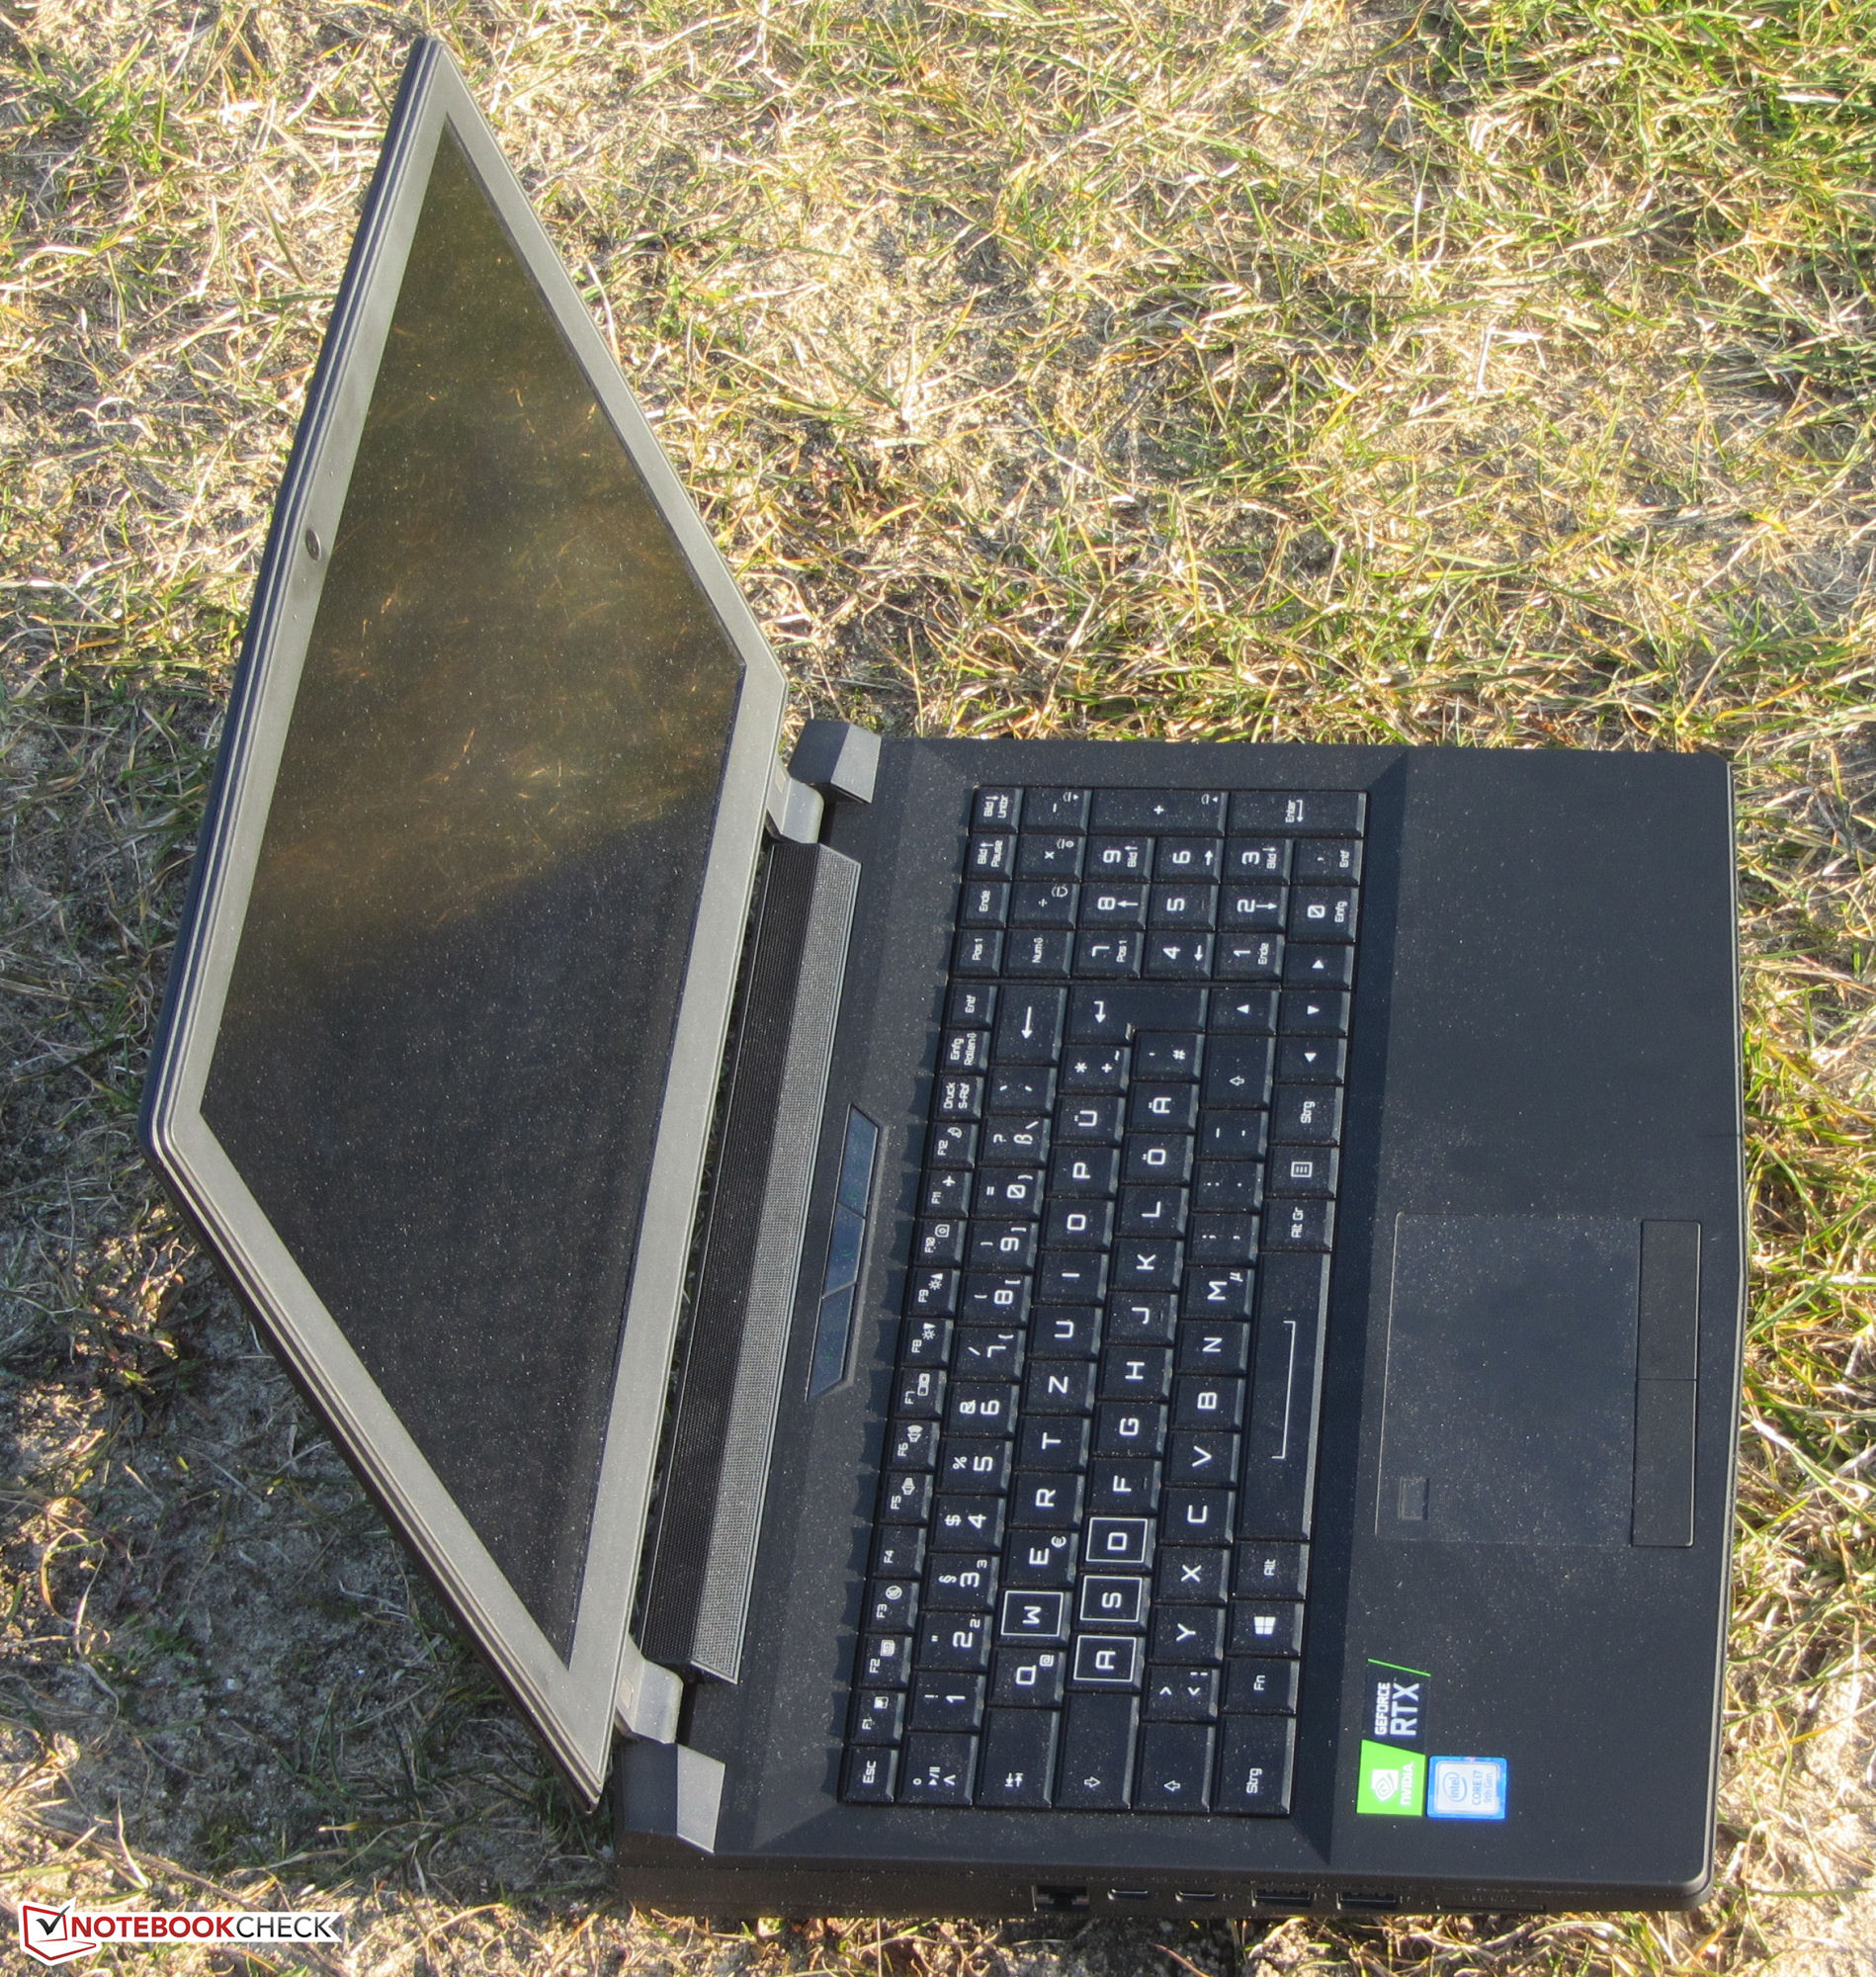
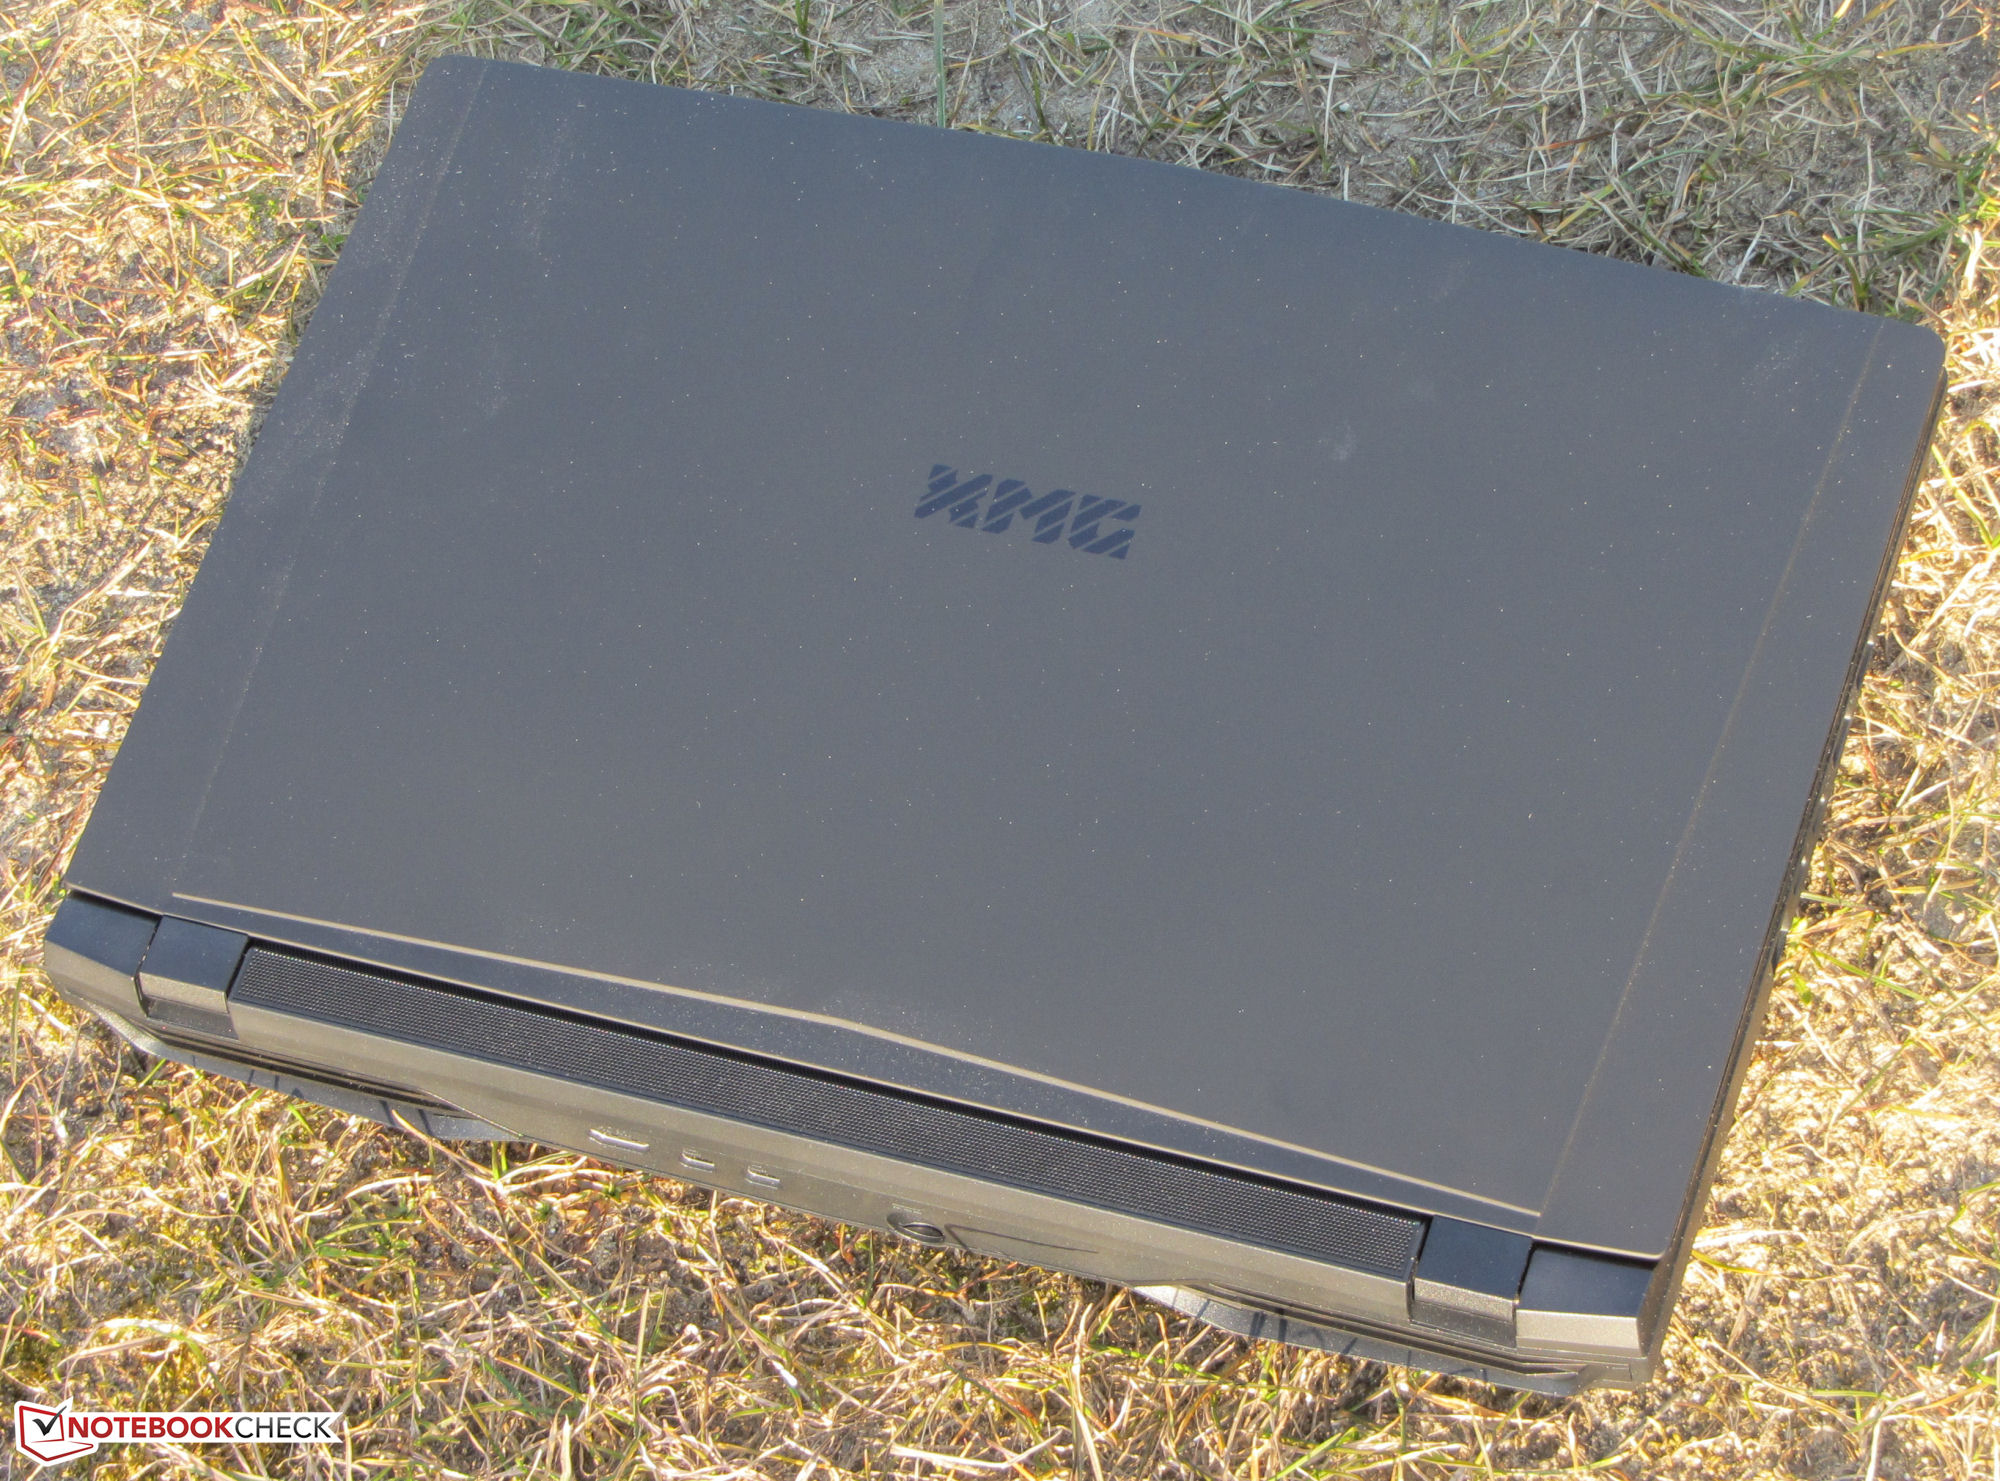
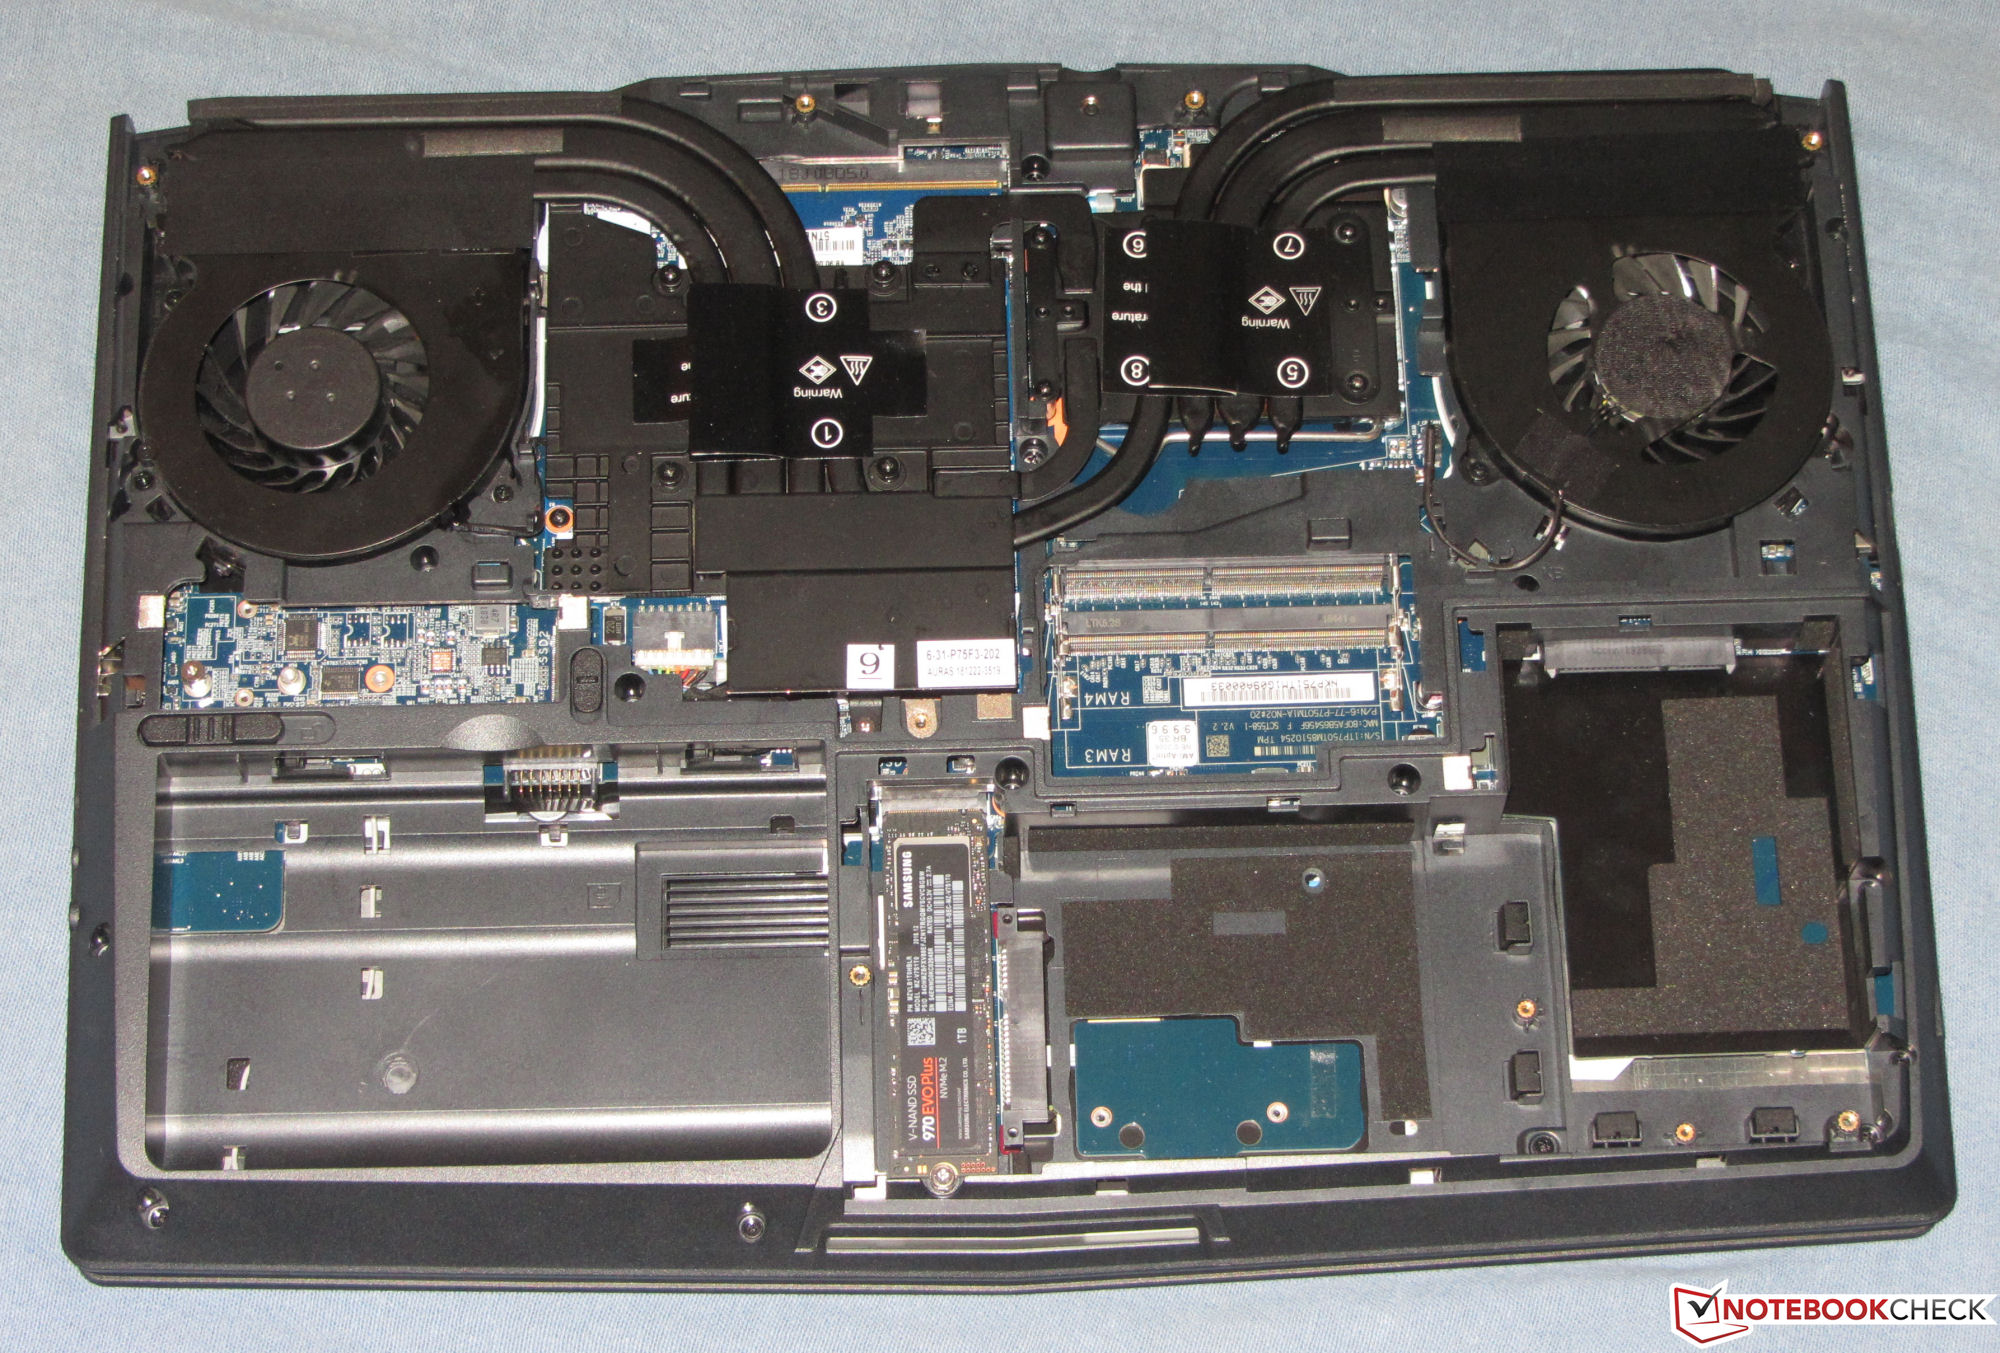
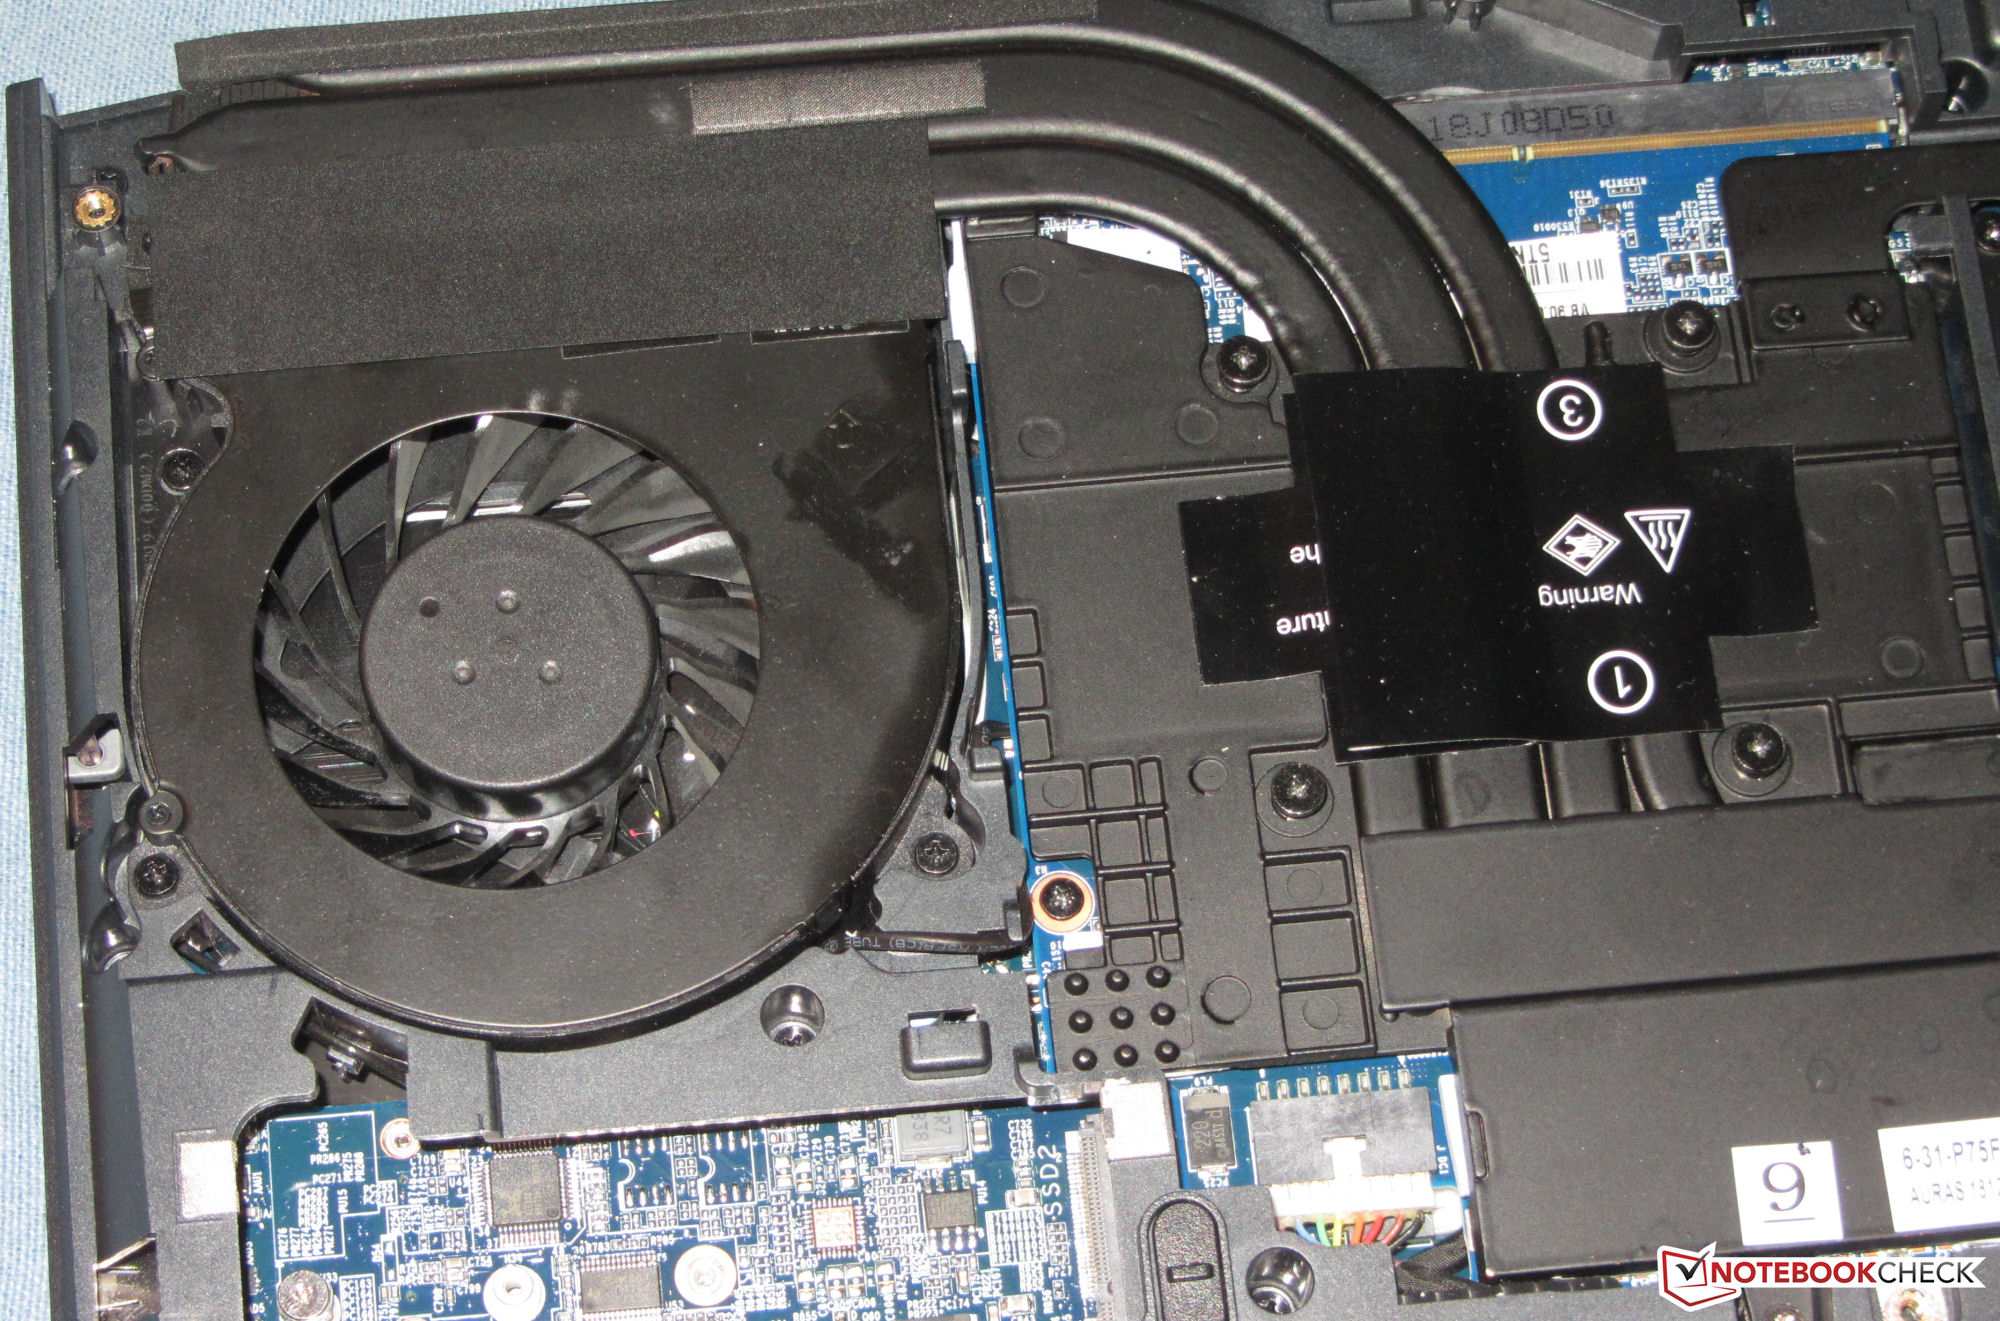
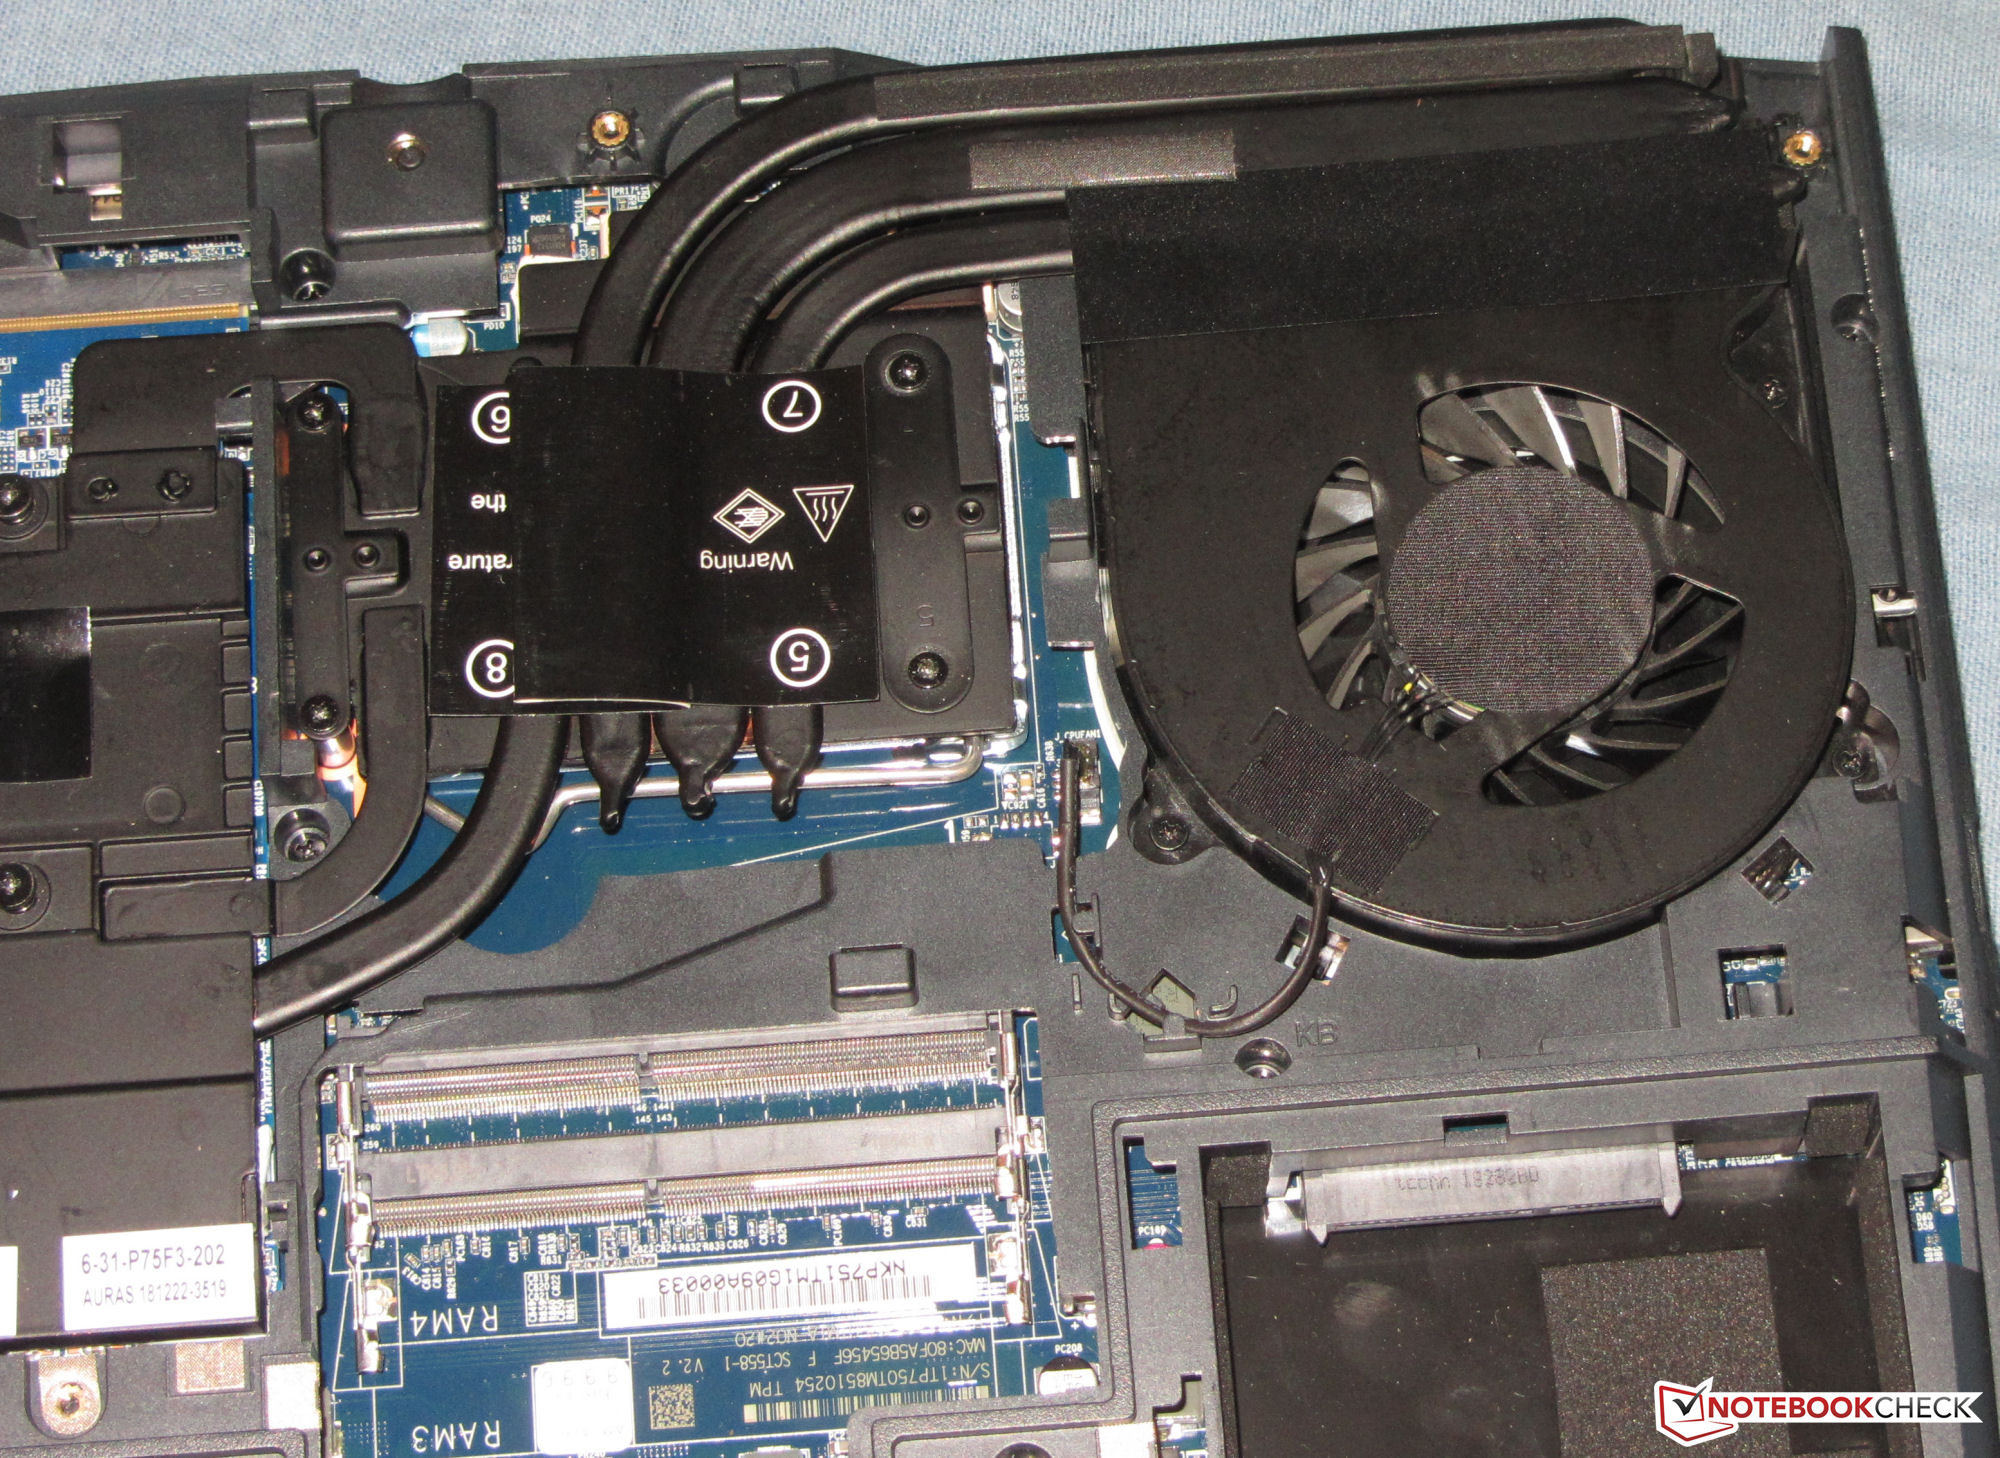
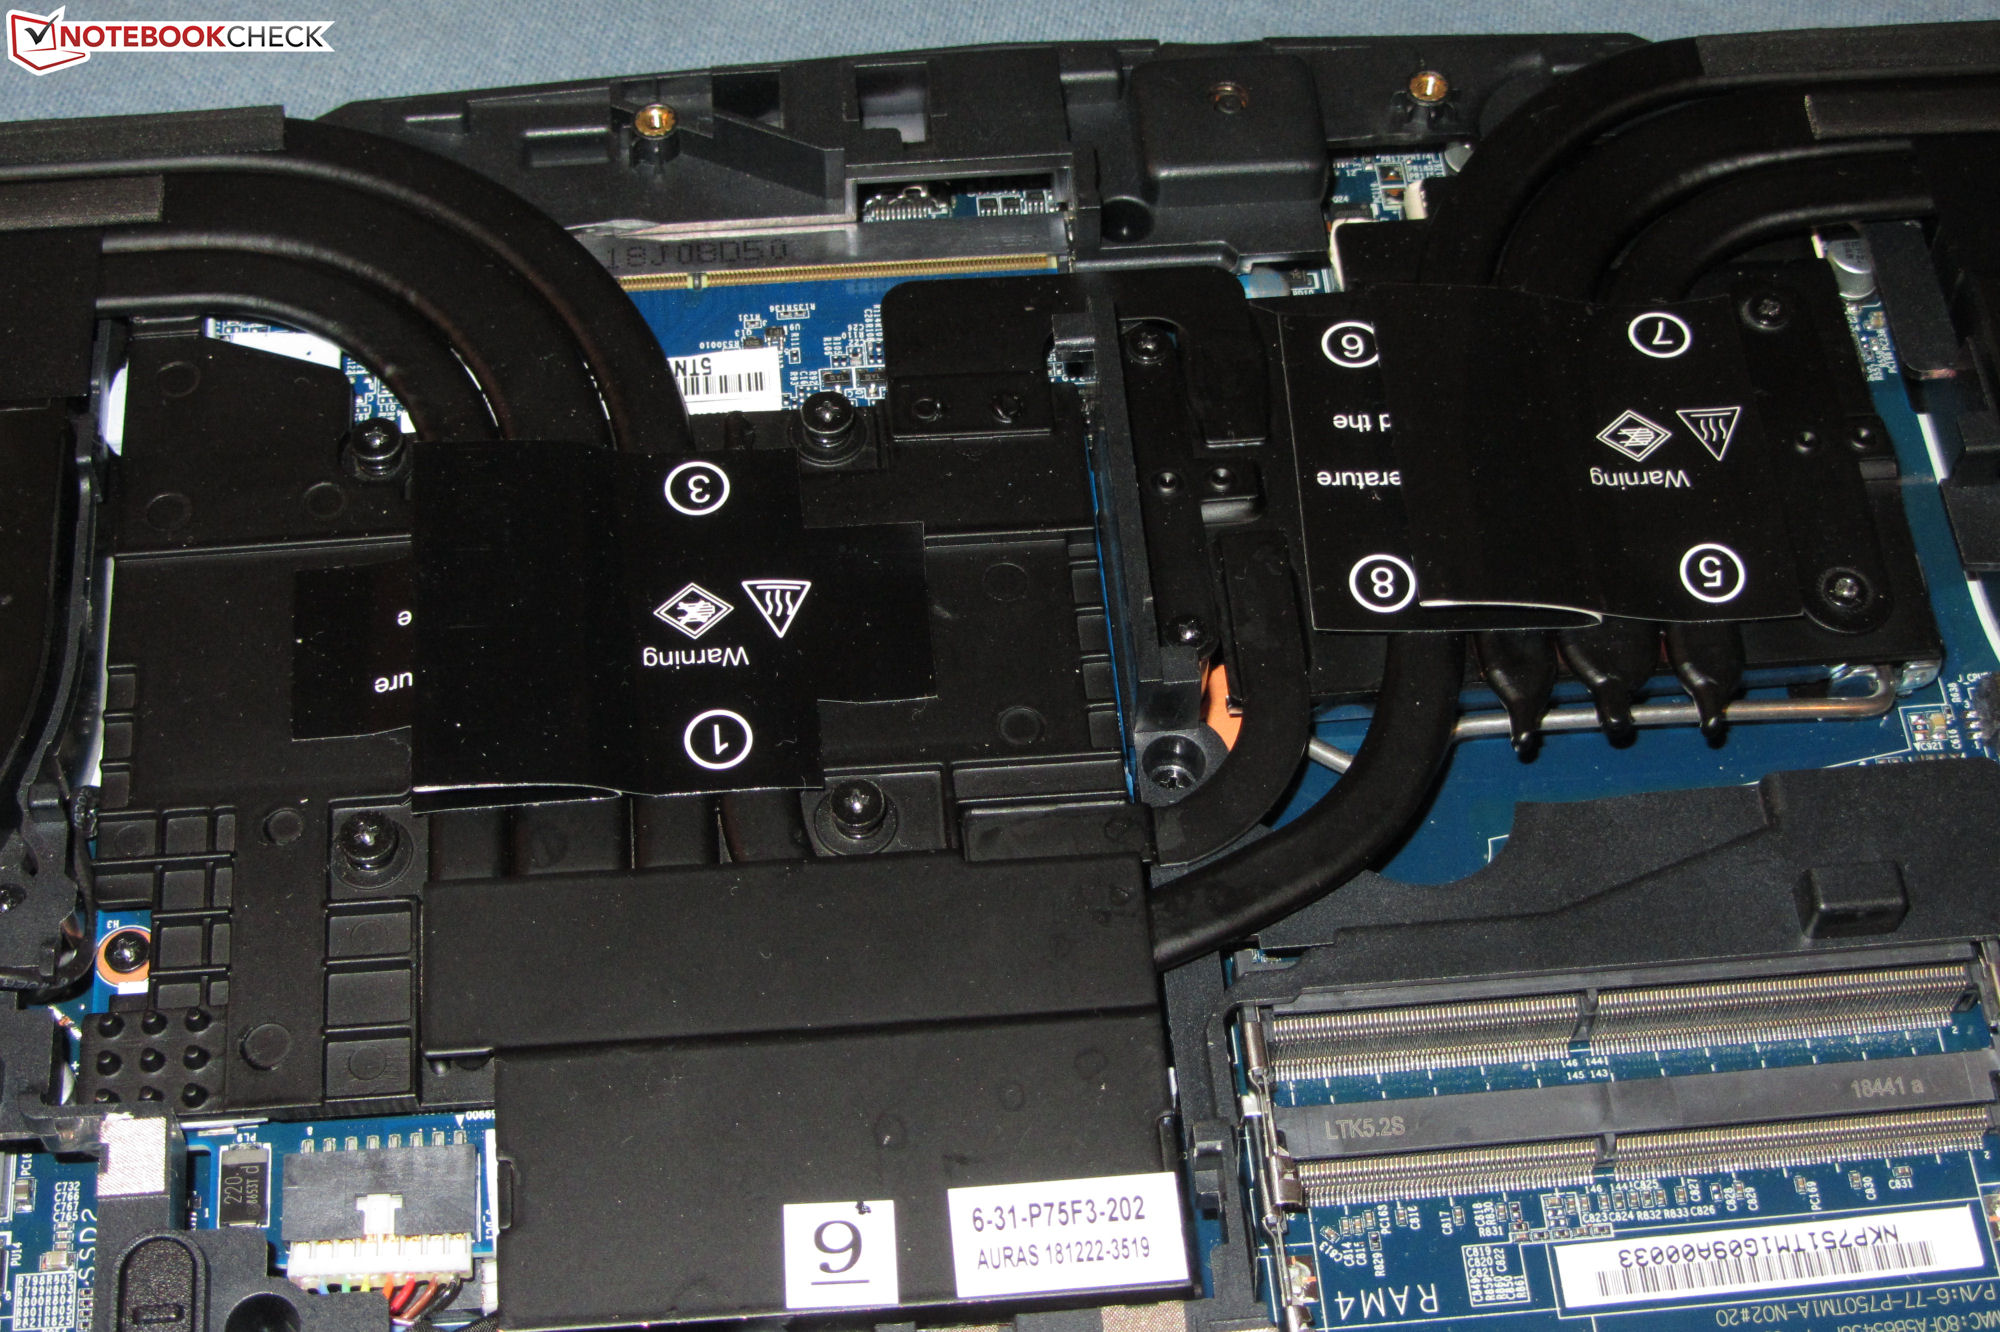
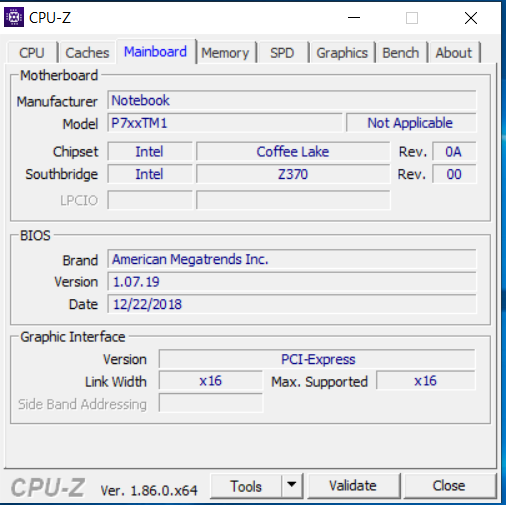
Schenkers XMG Ultra 15 är ett massivt stycke. Dess enorma storlek och vikt beror på en specialförmåga som sällan återfinns på moderna bärbara datorer: CPU och GPU placerade i socklar som därmed går att byta ut (den sistnämnda som en MXM-modul).
Schenkers senaste utgåva av XMG Ultra 15 är en välgjord toppskiktslaptop för spel som passar den som kan dra nytta av uppgraderingsmöjligheterna.
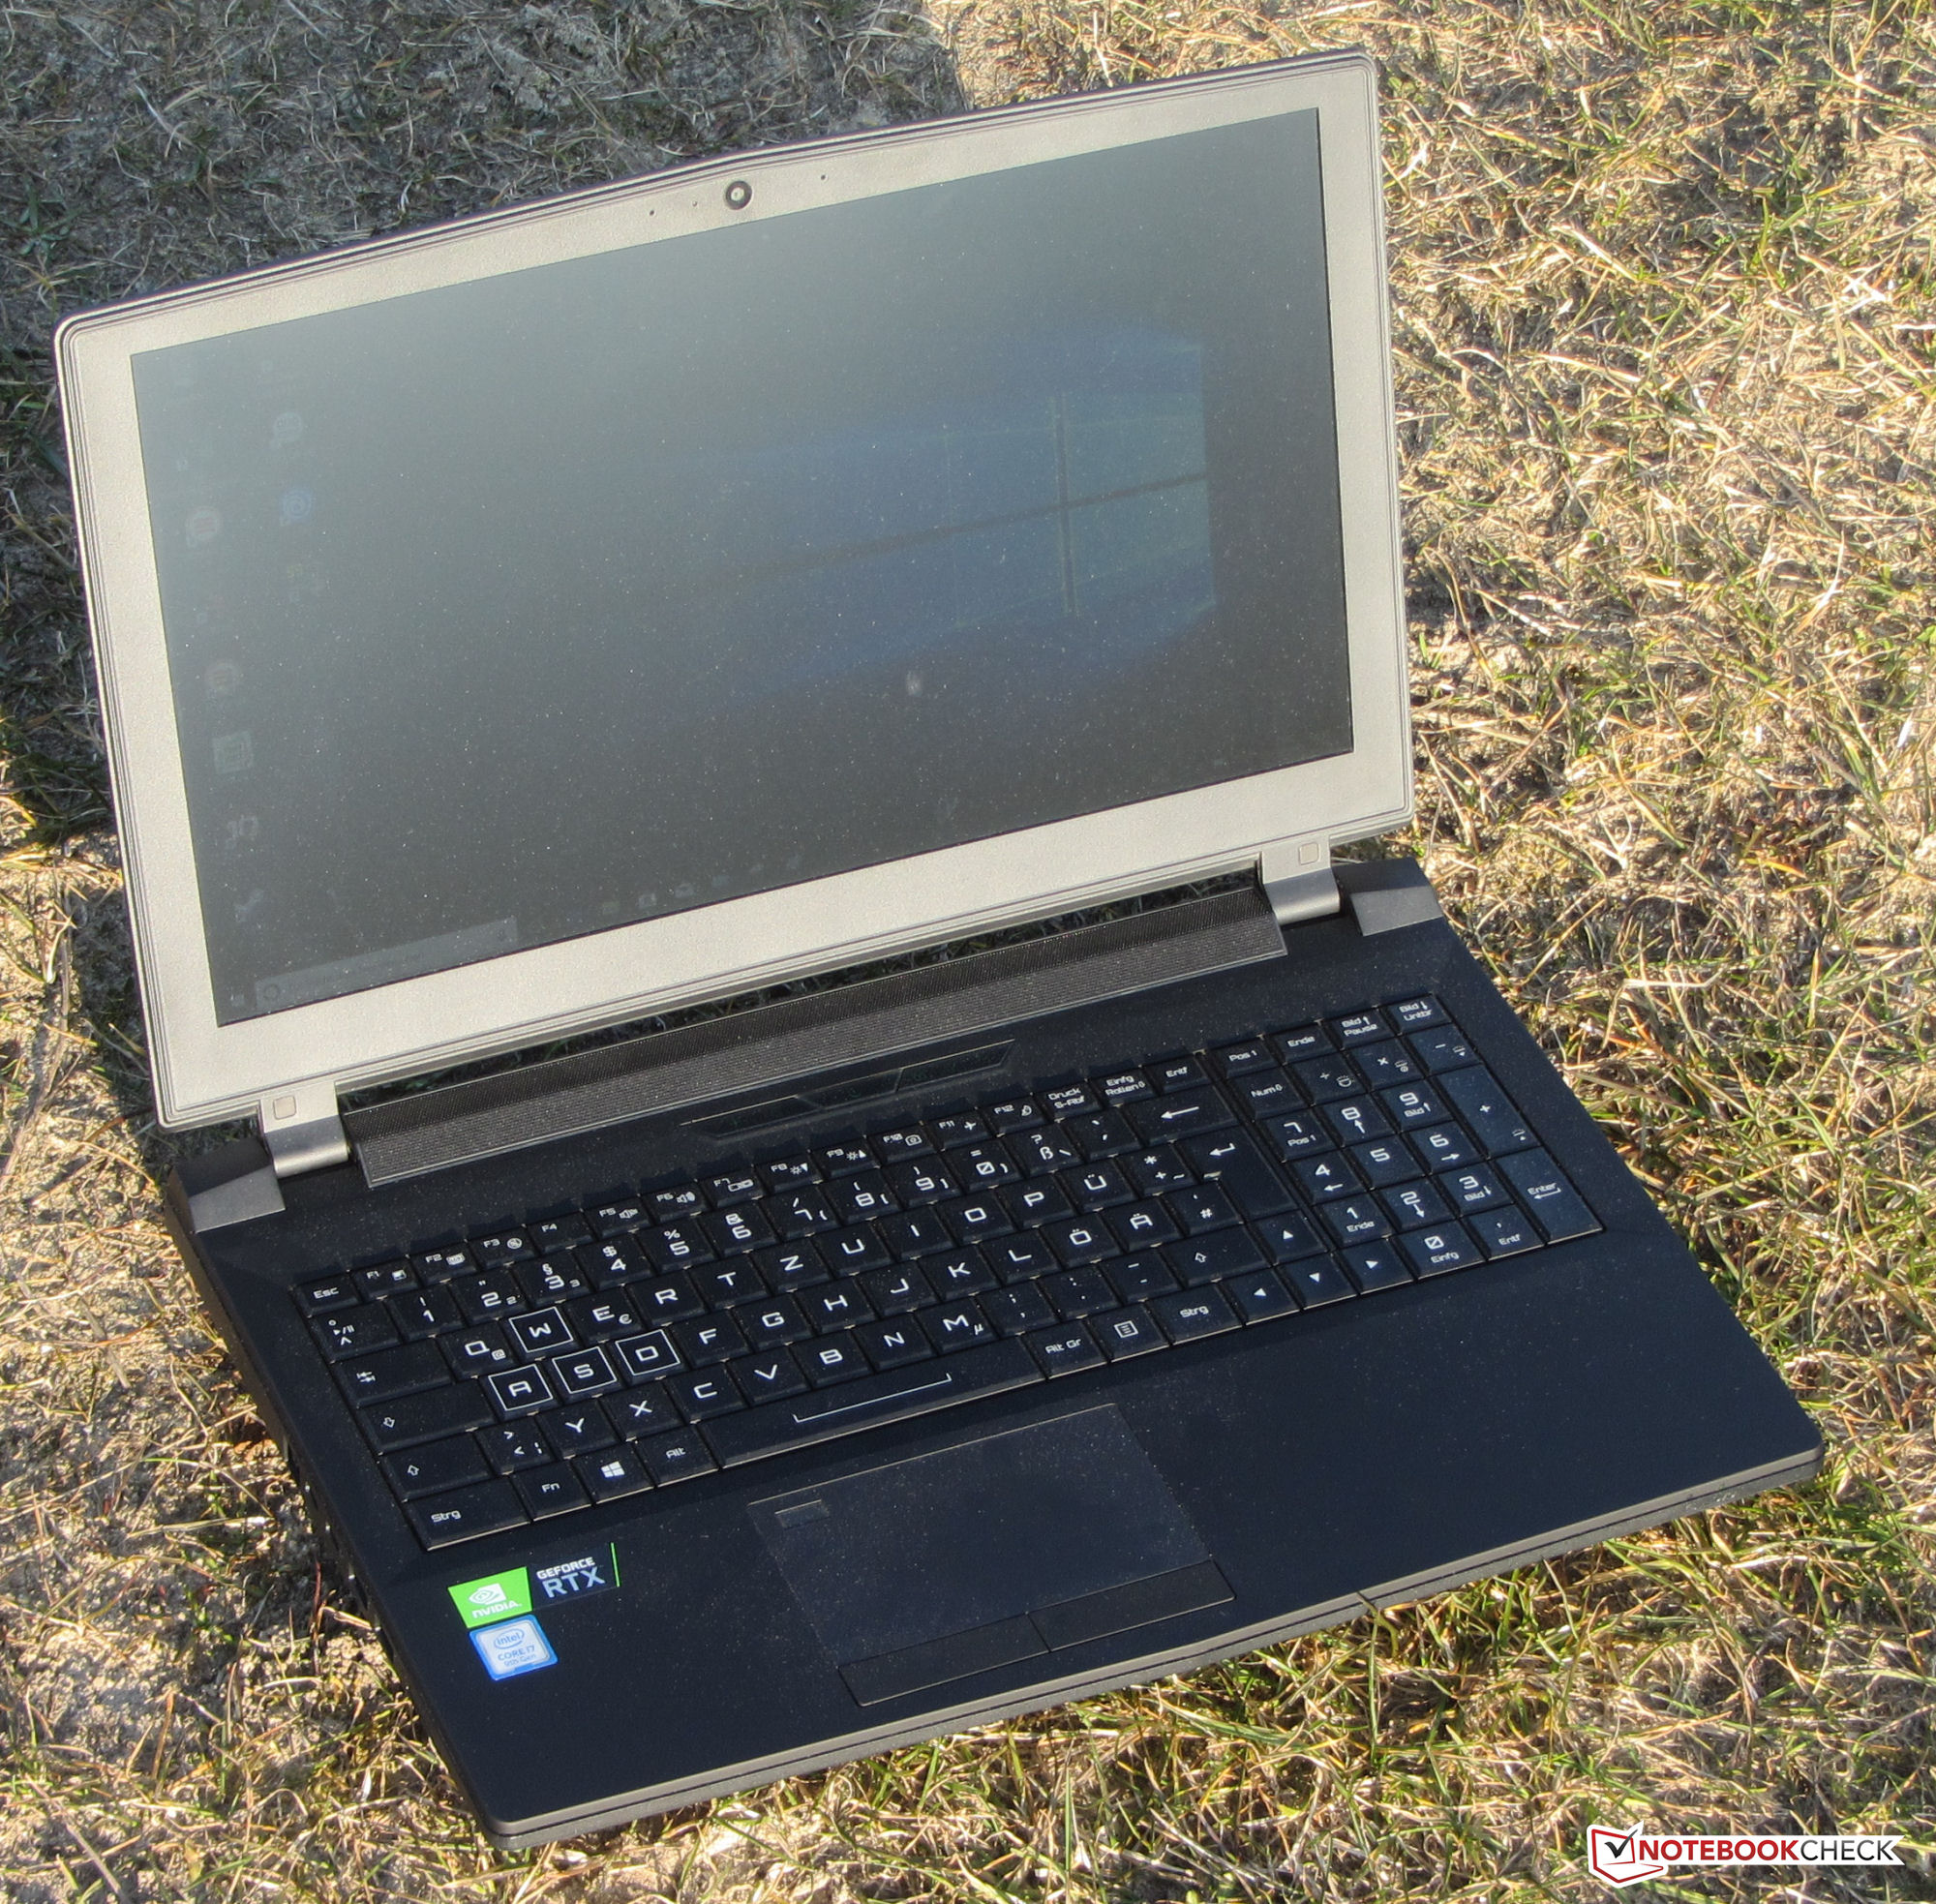
Kombinationen av en åttakärnig Core-i7 9700K CPU och en GeForce RTX 2070 GPU var mer än tillräckligt för att visa alla moderna spel smidigt på den matta FHD-skärmen med hög eller till och med maximal detalj. GPU:n var tydligt kapabel att klara av ännu högre upplösningar.
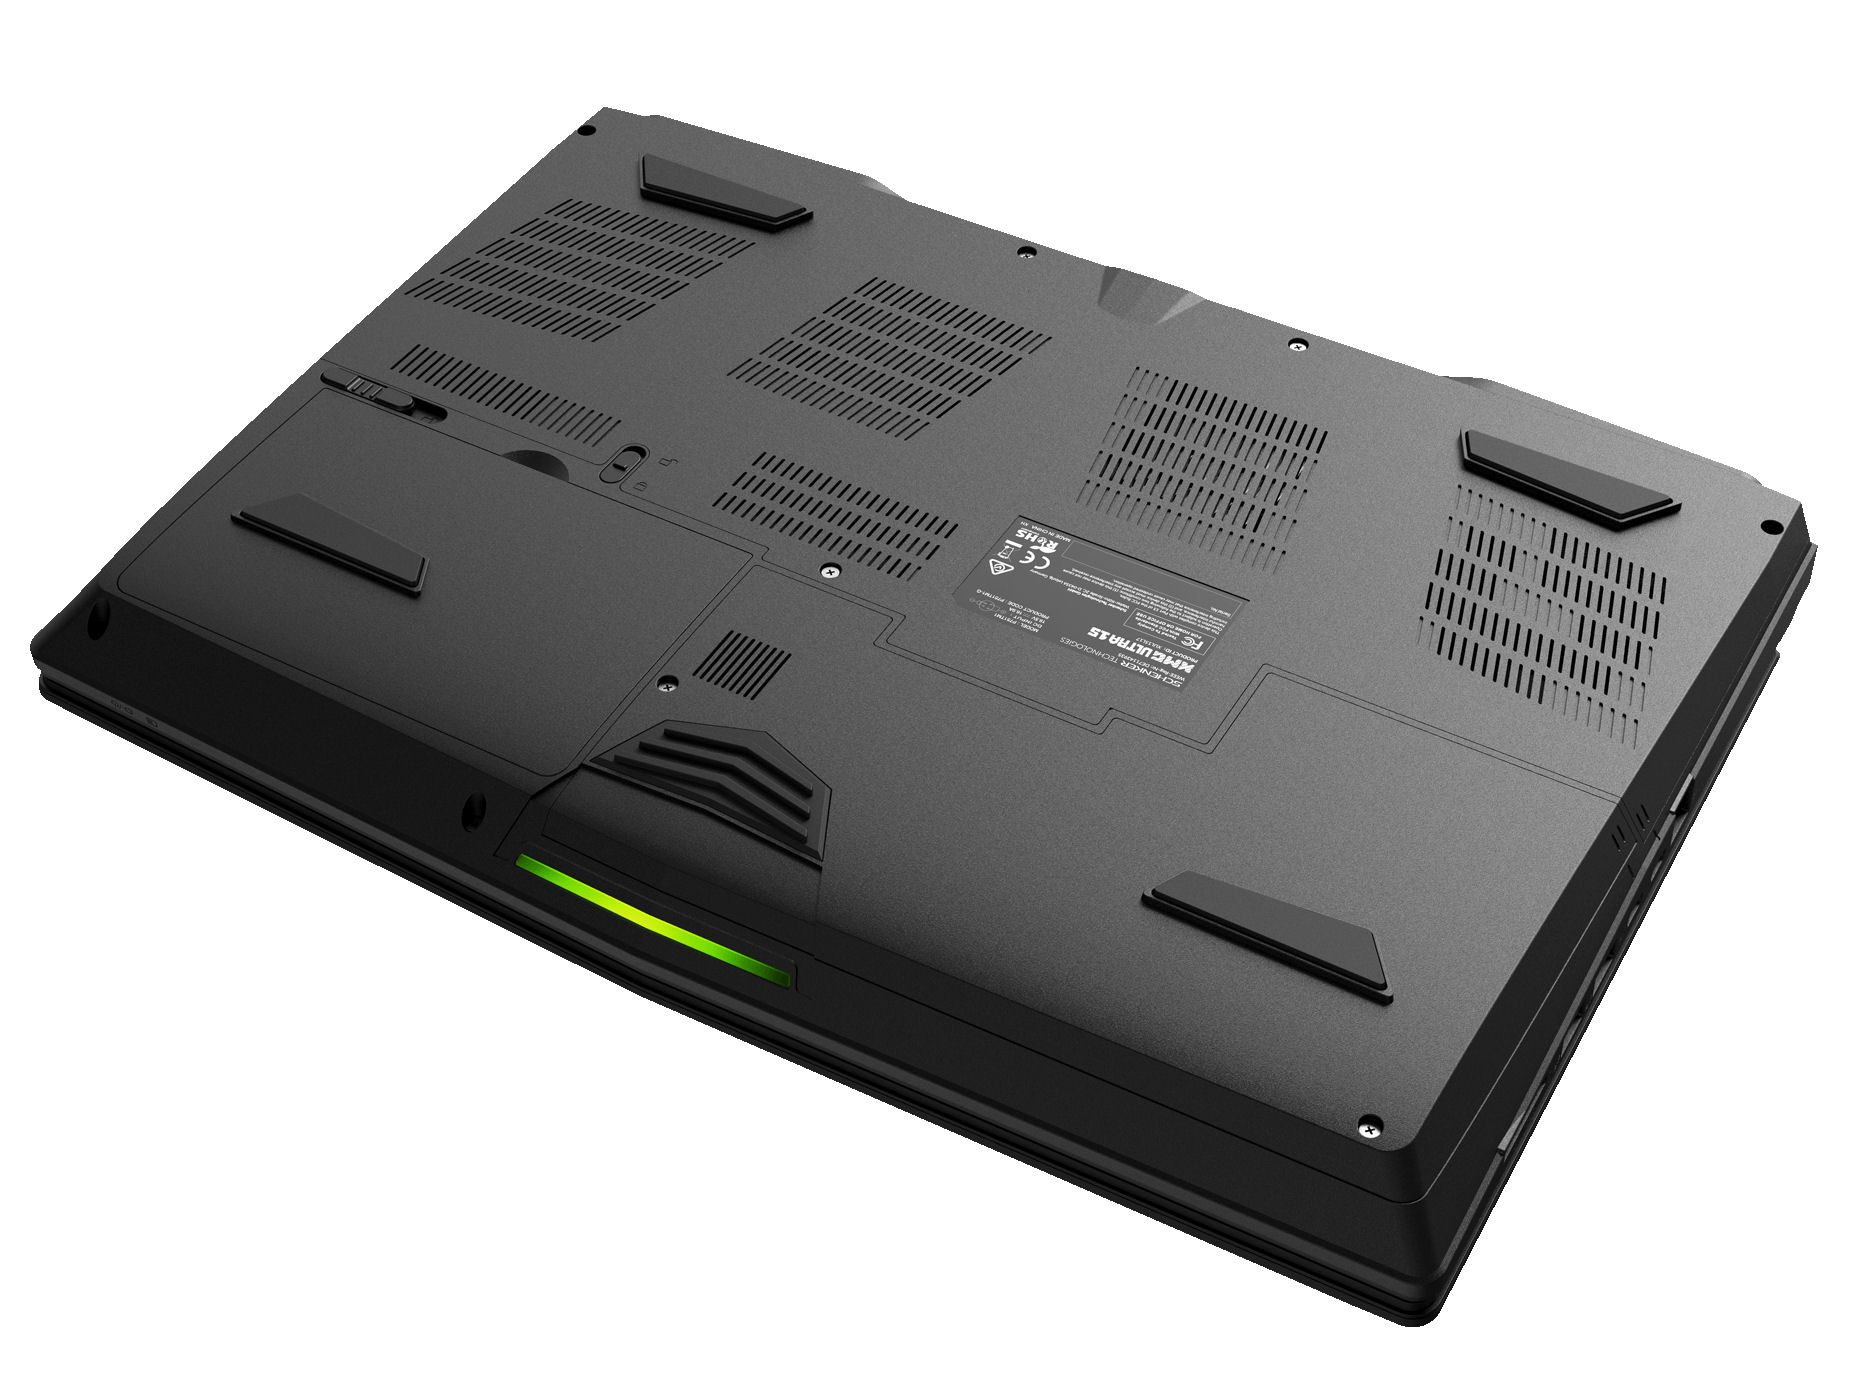
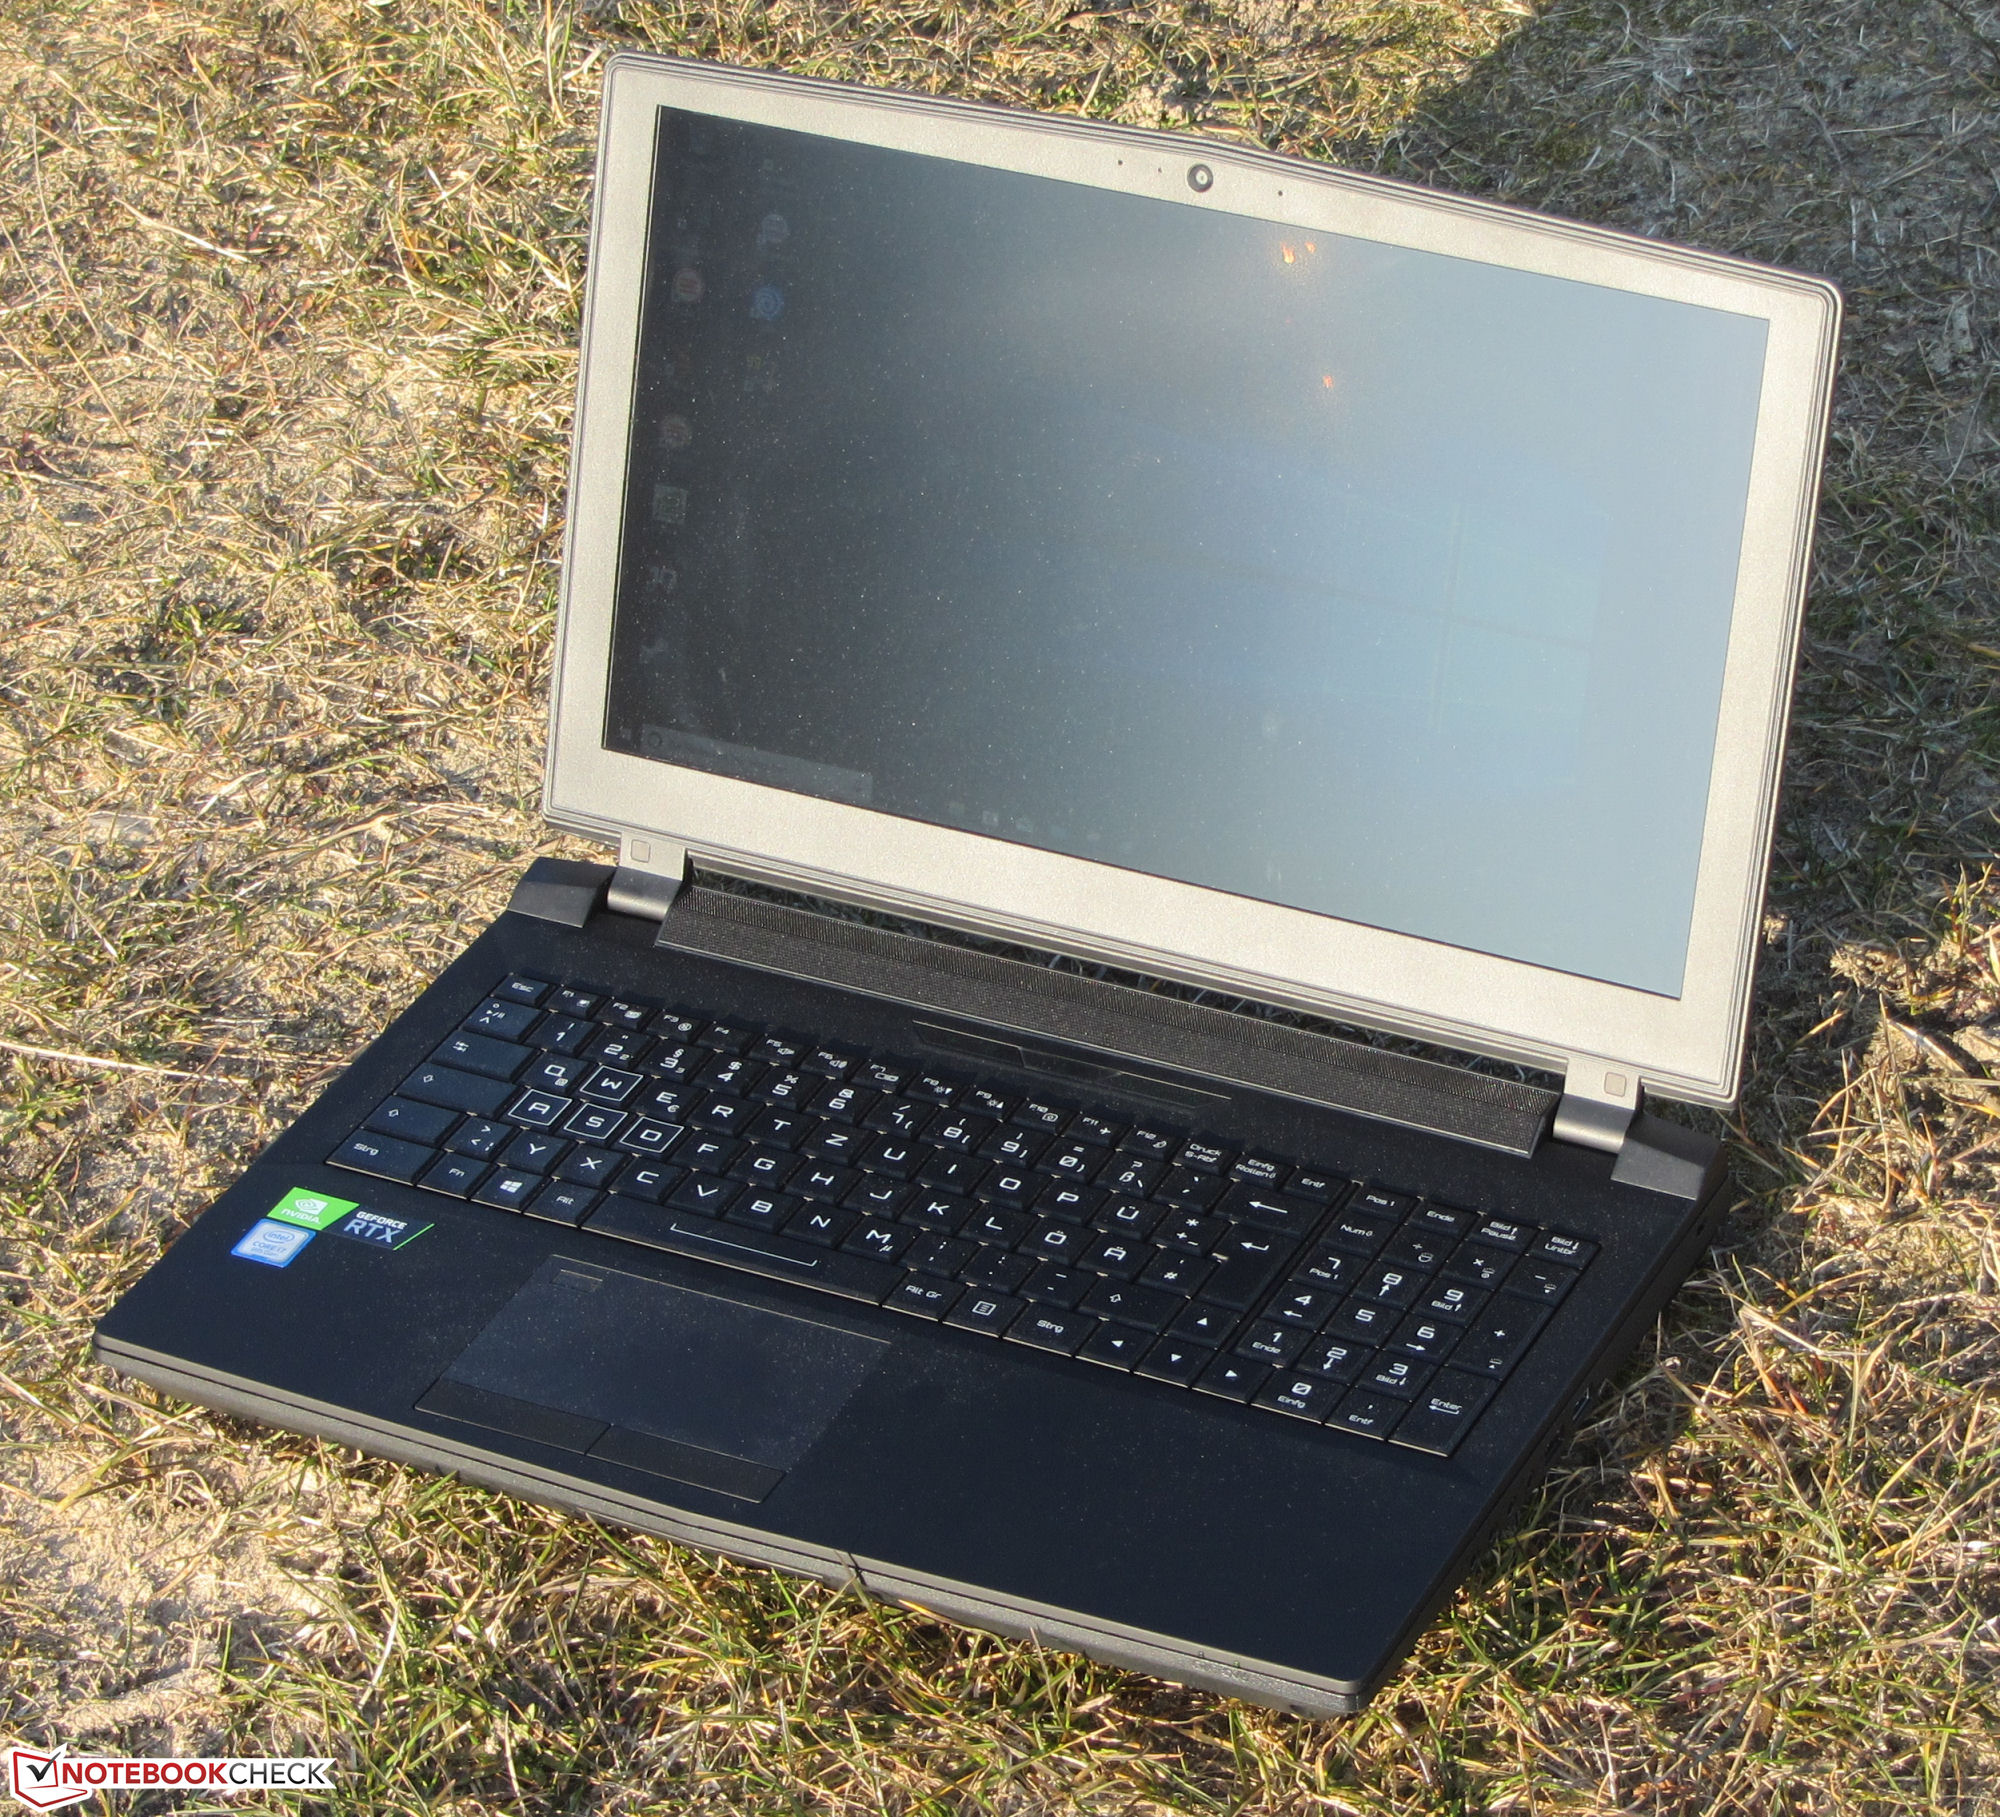
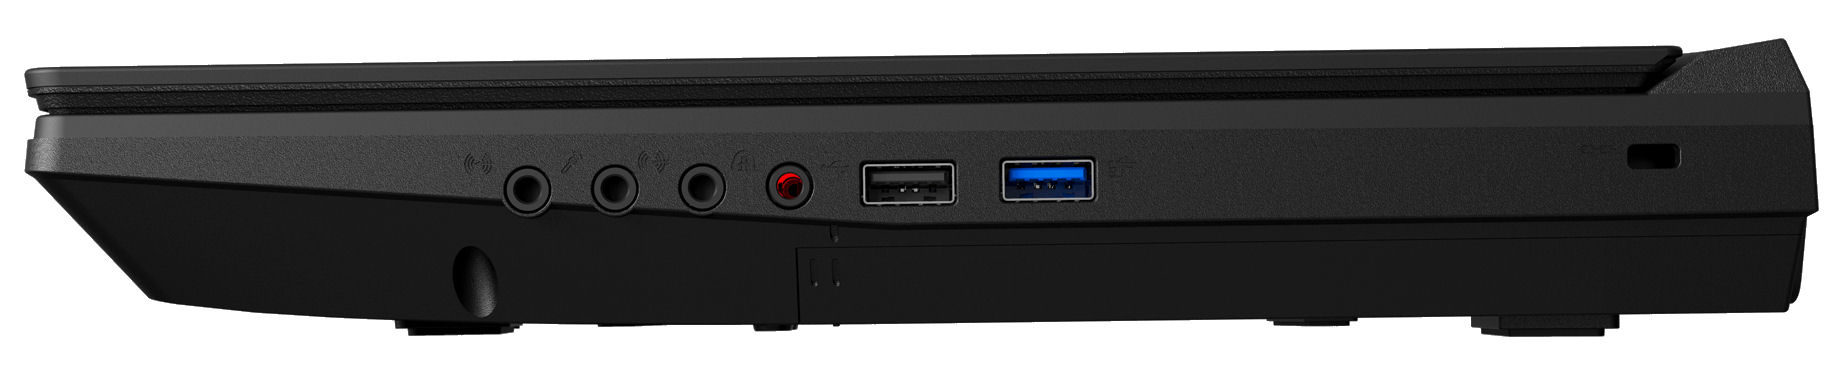
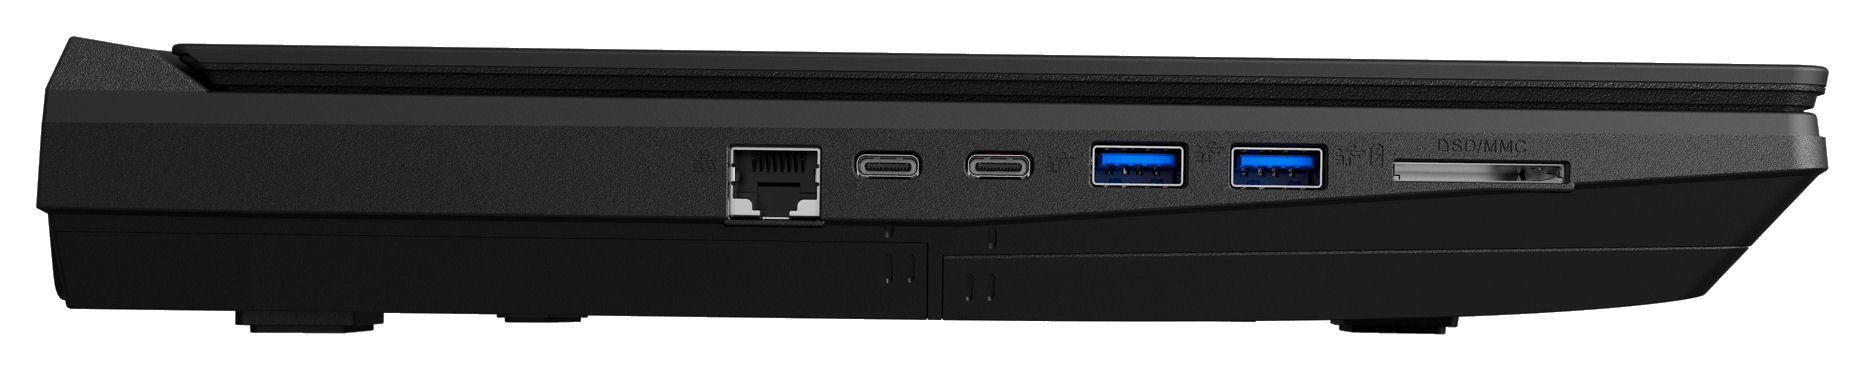
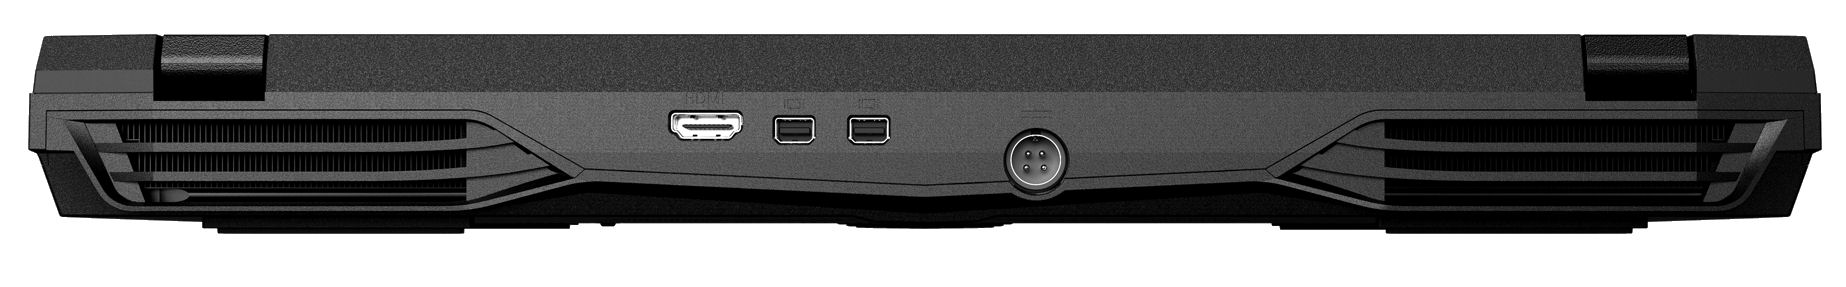
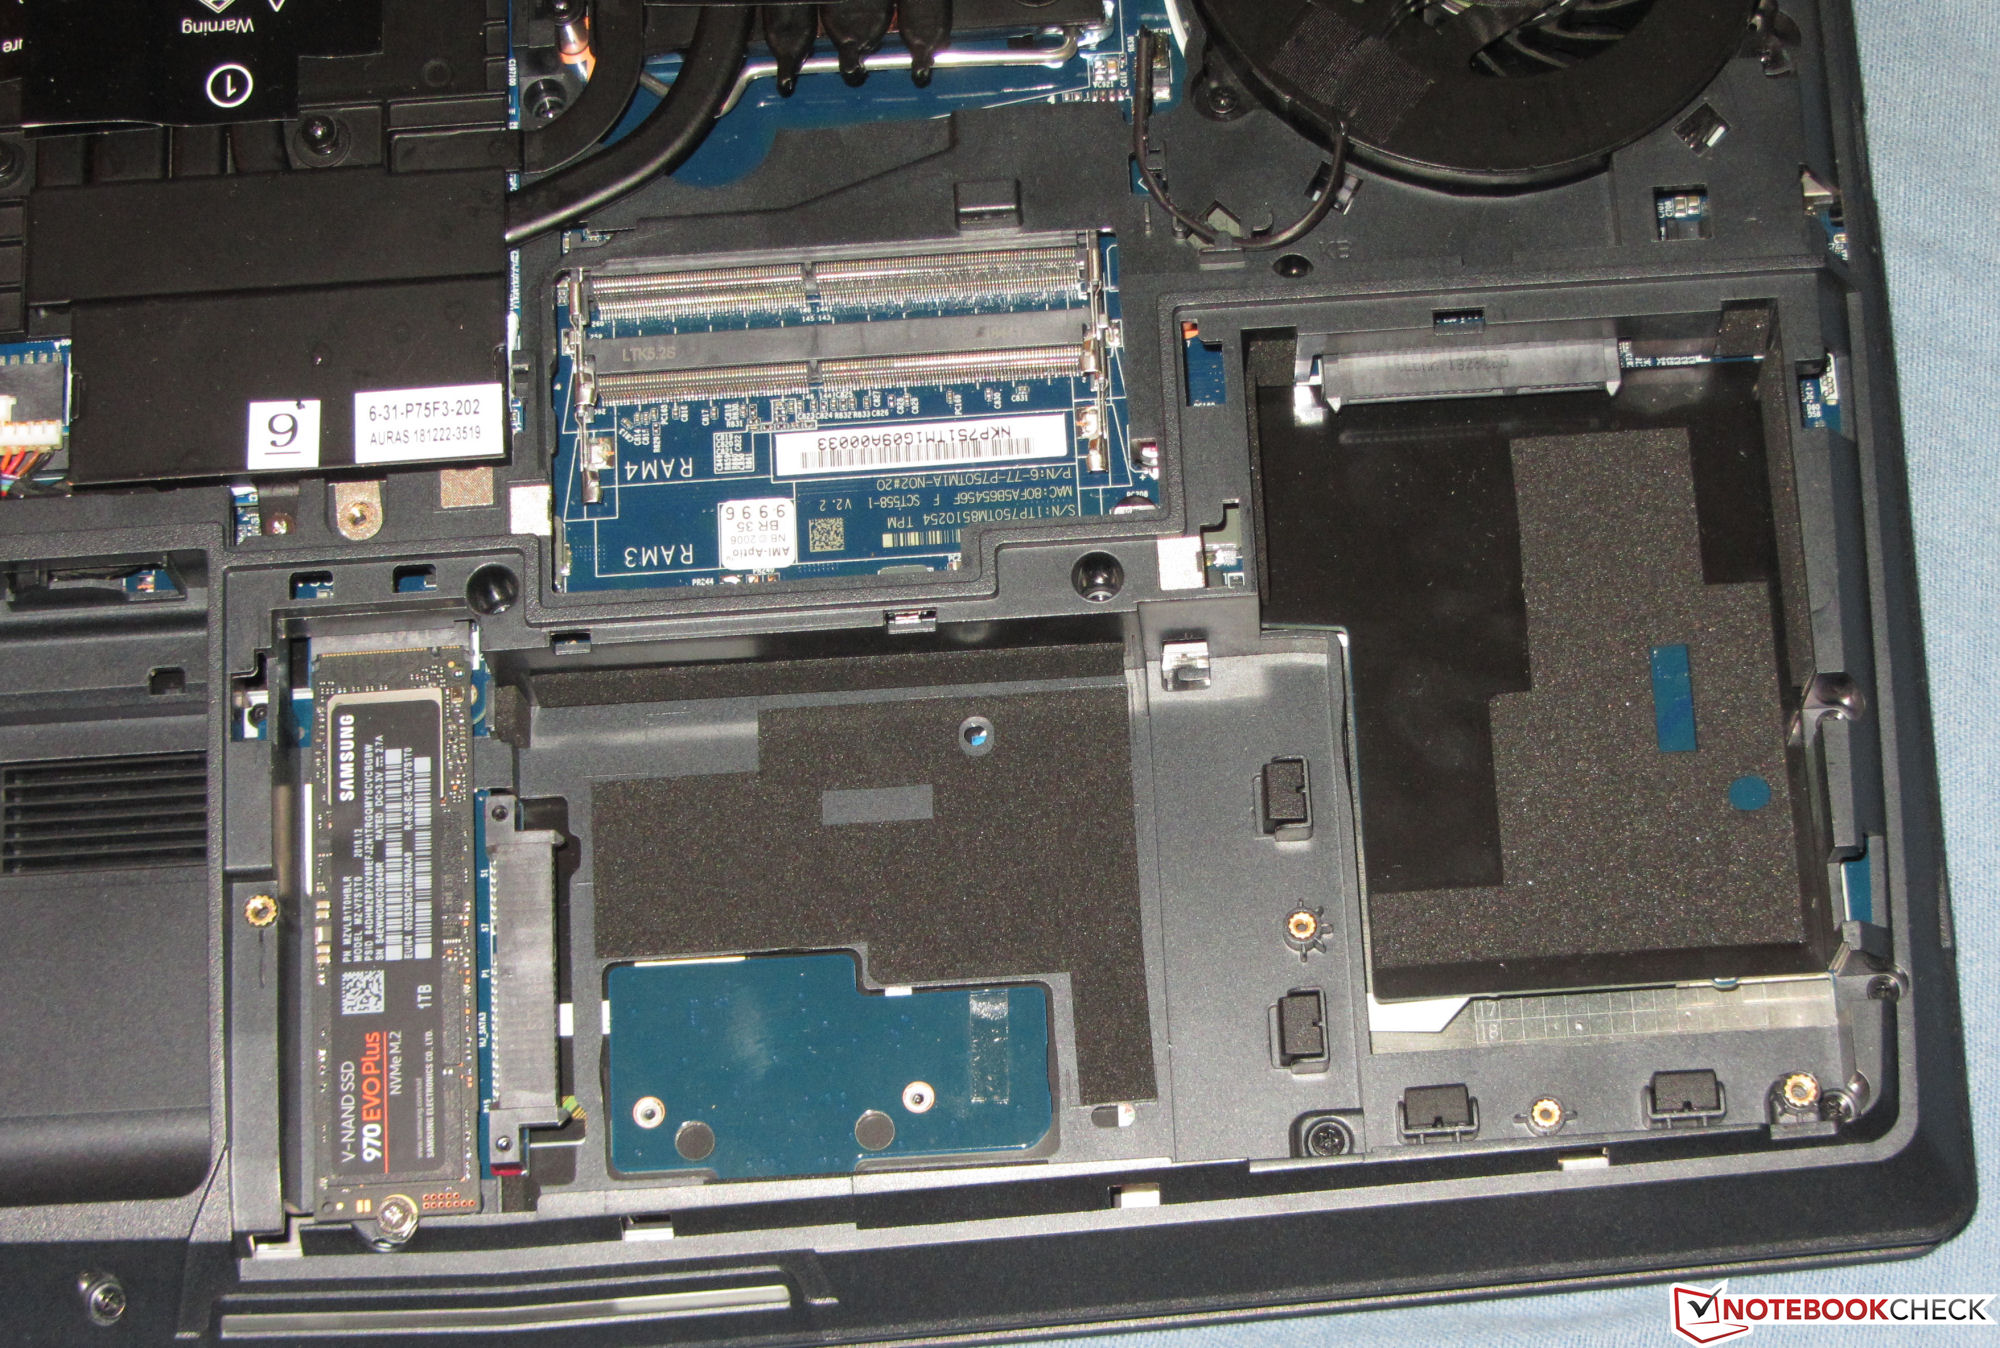
Tack vare Nvidias G-Sync och en 144 Hz IPS-skärm var resultatet otroligt smidigt. Skärmen hade ett utmärkt kontrastförhållande, korta responstider och breda betraktningsvinklar. Det enda vi har att klaga på är att ljusstyrkan var för låg. En blixtsnabb NVMe SSD säkrade smidig och kvick systemprestanda och höljet hade plats för ytterligare en M.2 SSD-enhet samt två HDD-enheter på 2.5 tum. Det RGB-belysta tangentbordet var förvånansvärt bra och anslutbarheten var riktigt skaplig. I gengäld var batteritiden så dålig att den knappt är värd att nämna.
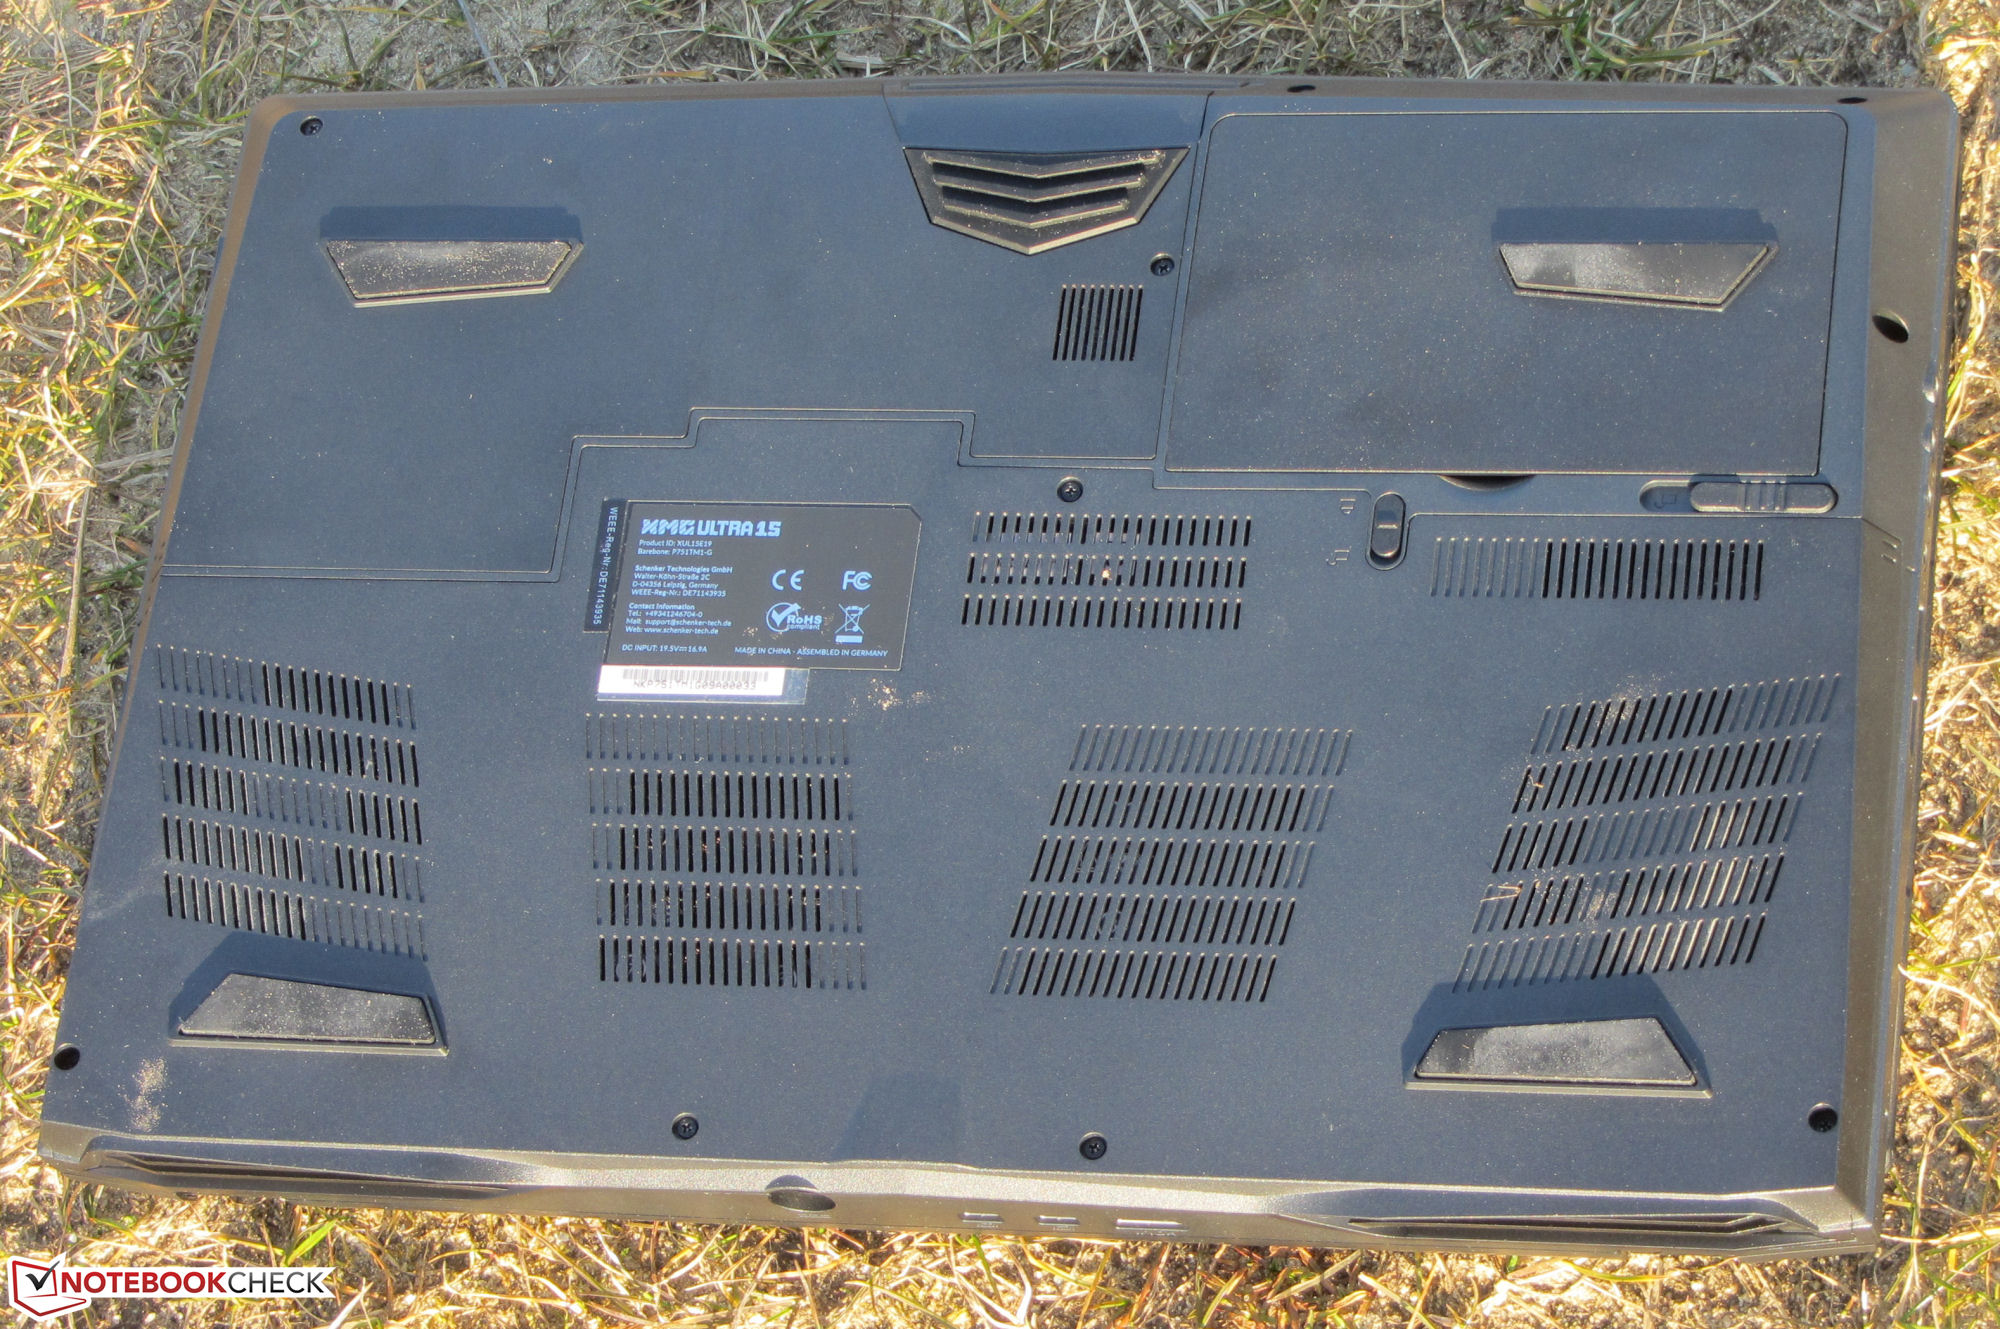
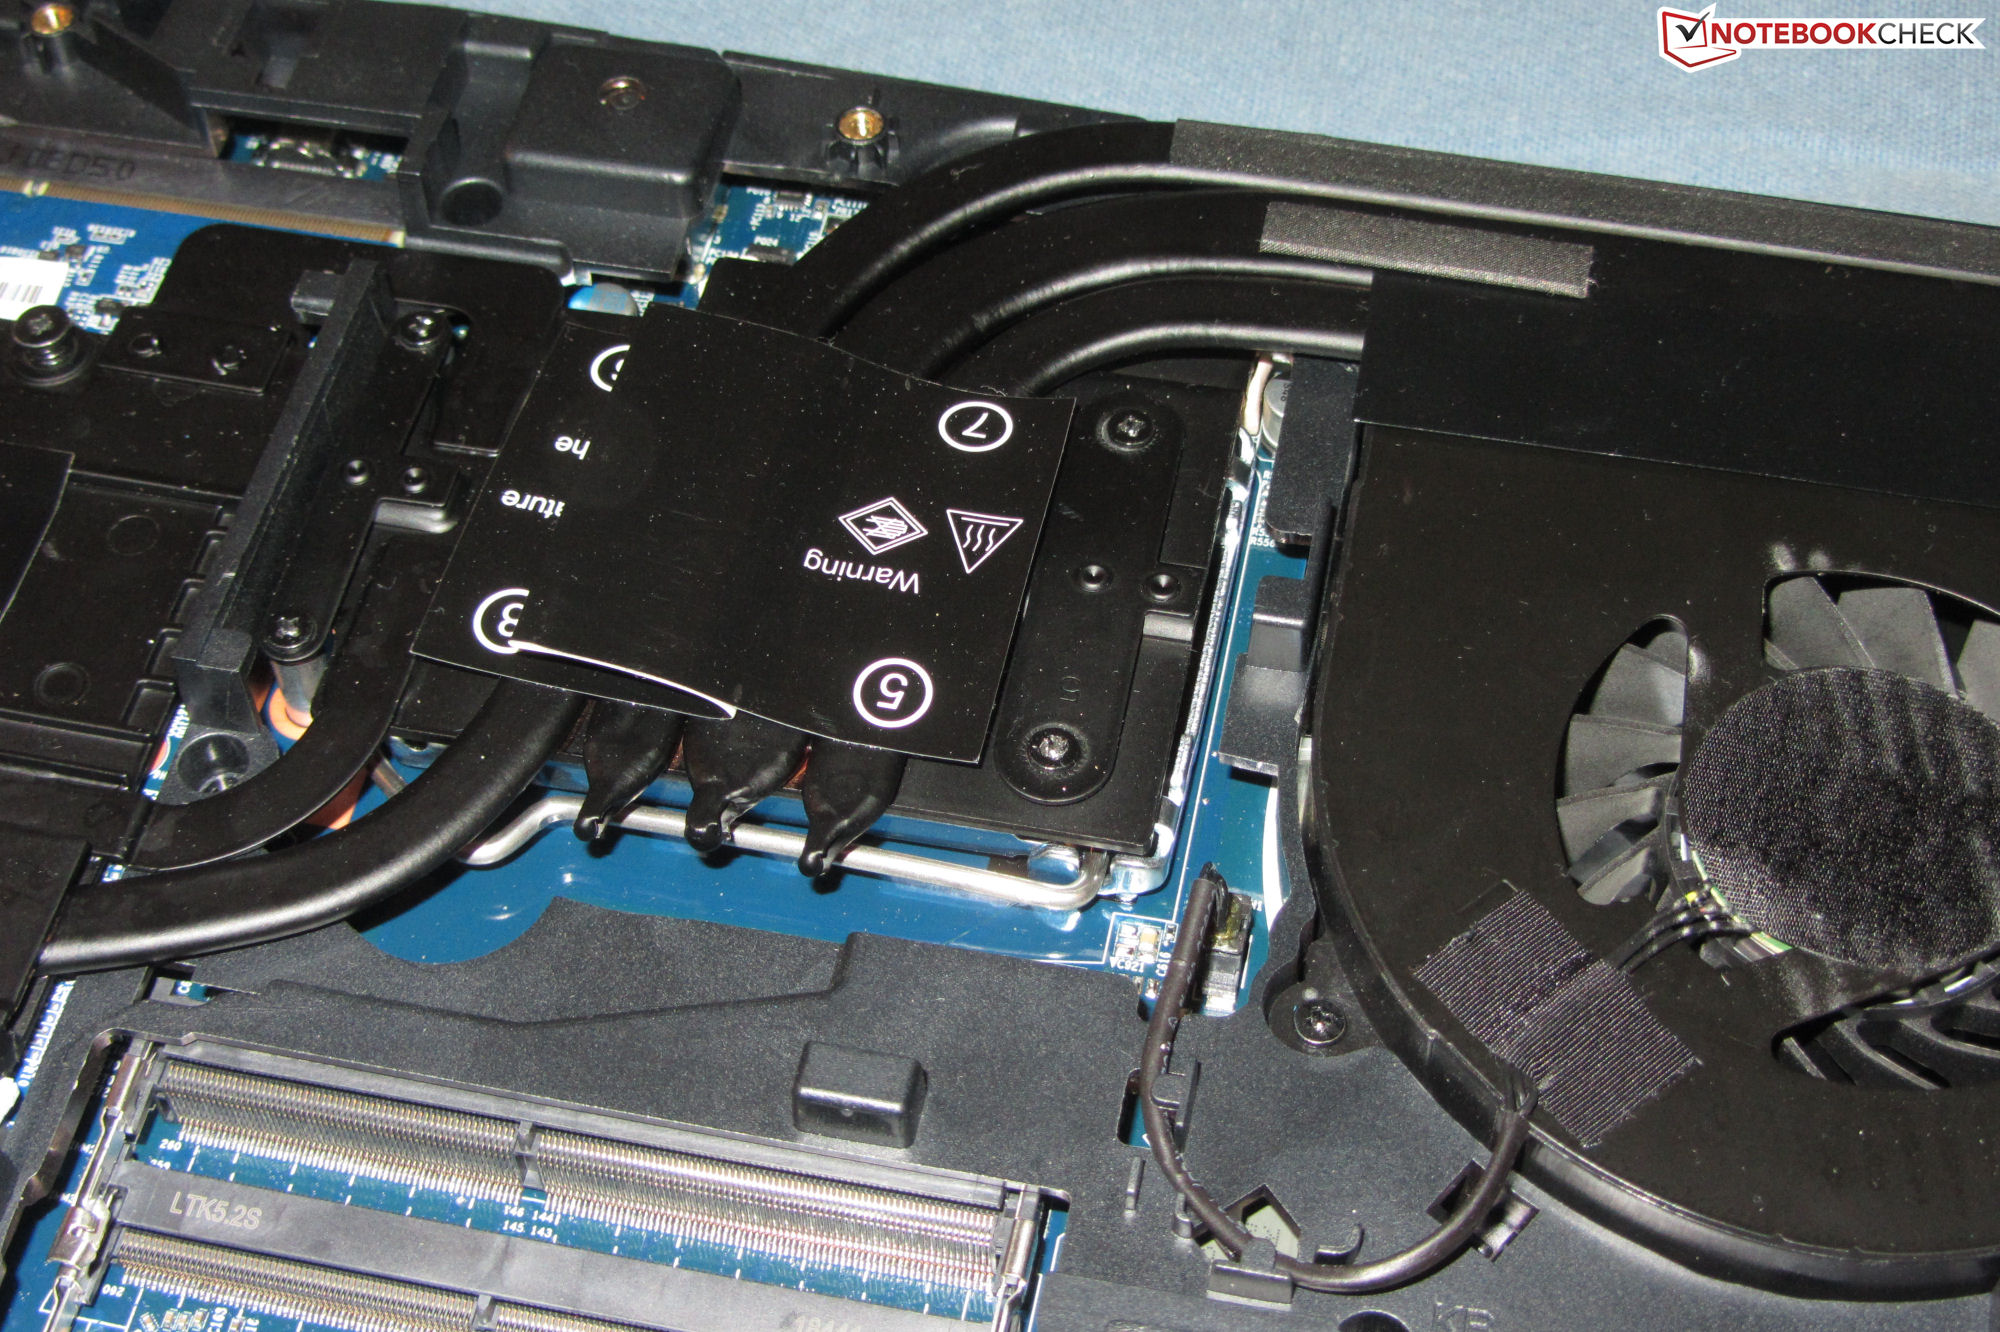
När det kommer till fläkthanteringen finns det definitivt rum för förbättring. Vid belastning körs fläktarna mycket snabbare än nödvändigt för att säkra tillräcklig kylning. Vi misstänker att kylsystemet var designat och utvecklat för en mycket kraftigare SKU (Core i9-9900K, GeForce RTX 2080).
Schenker XMG Ultra 15 Turing
- 03/04/2019 v6 (old)
Sascha Mölck
Price comparison
