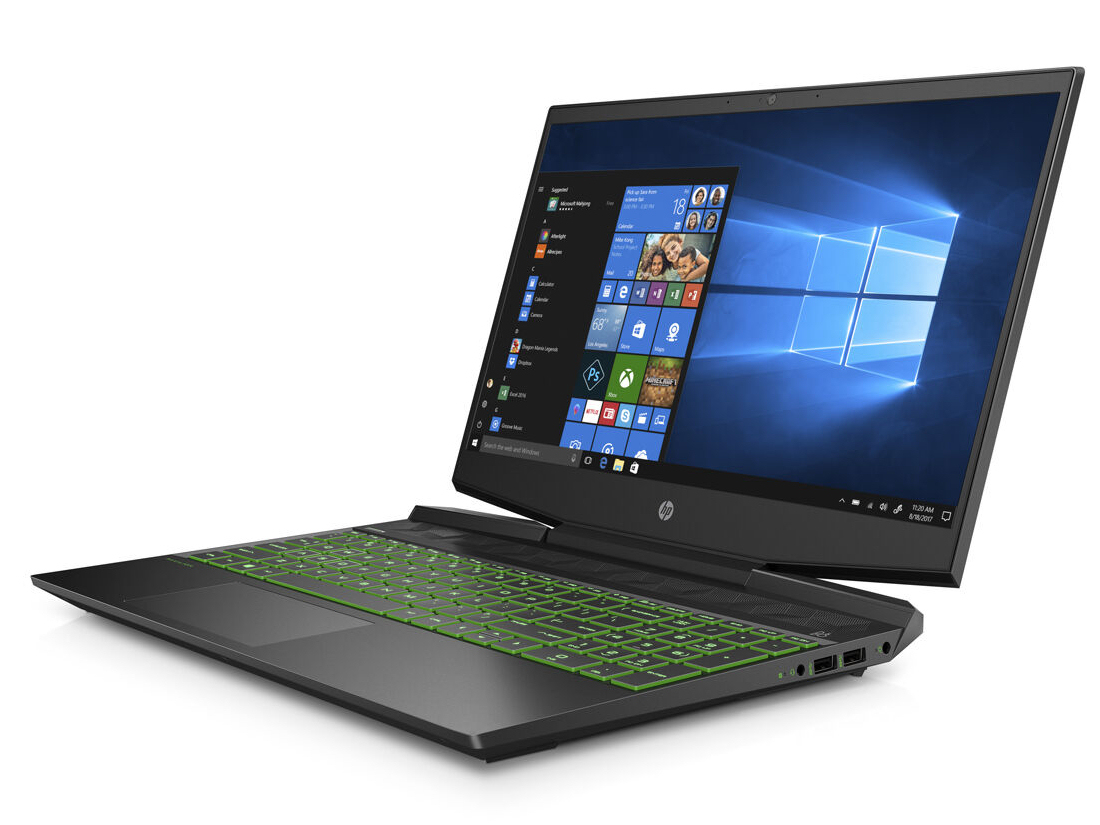
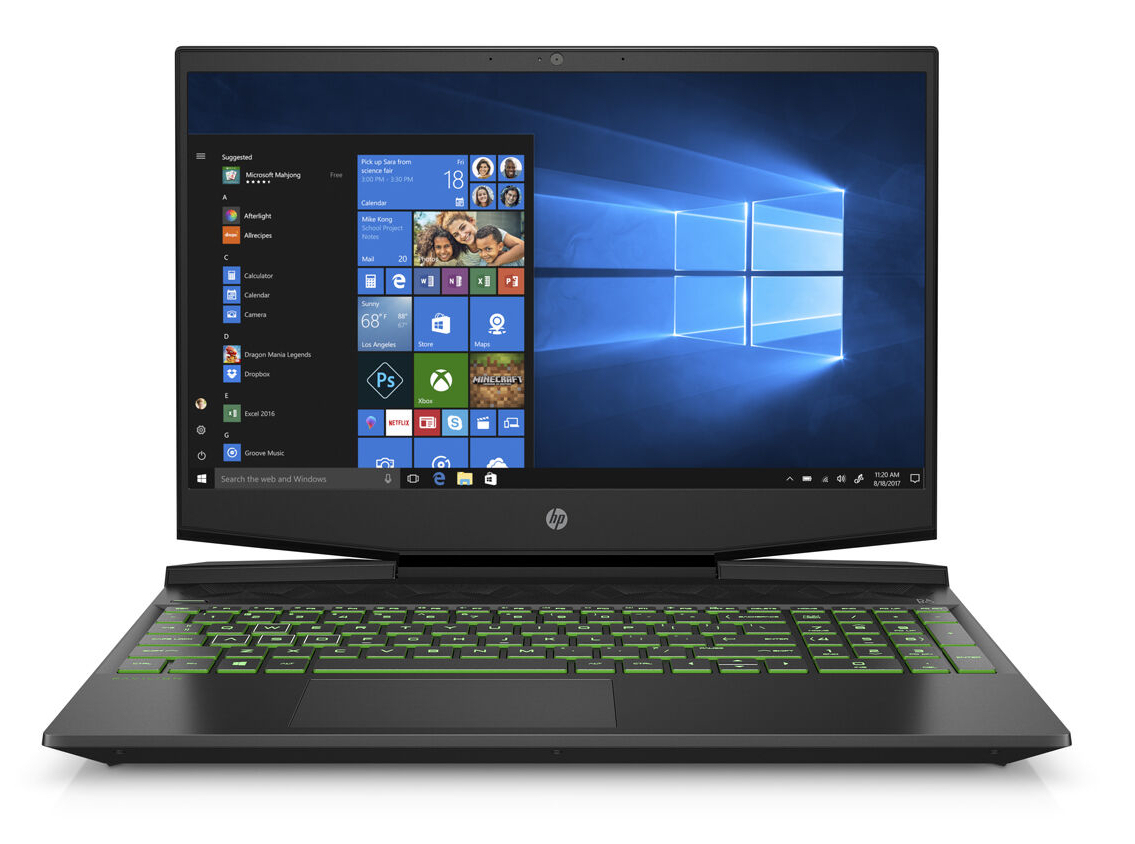
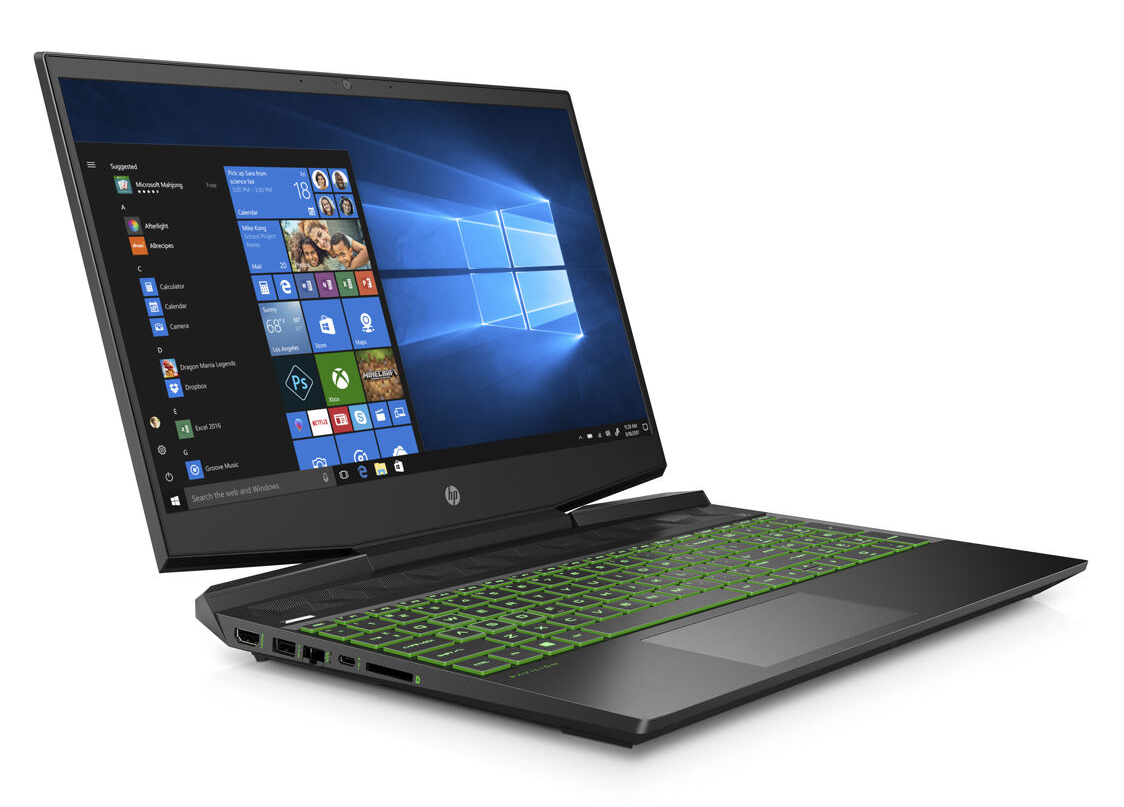
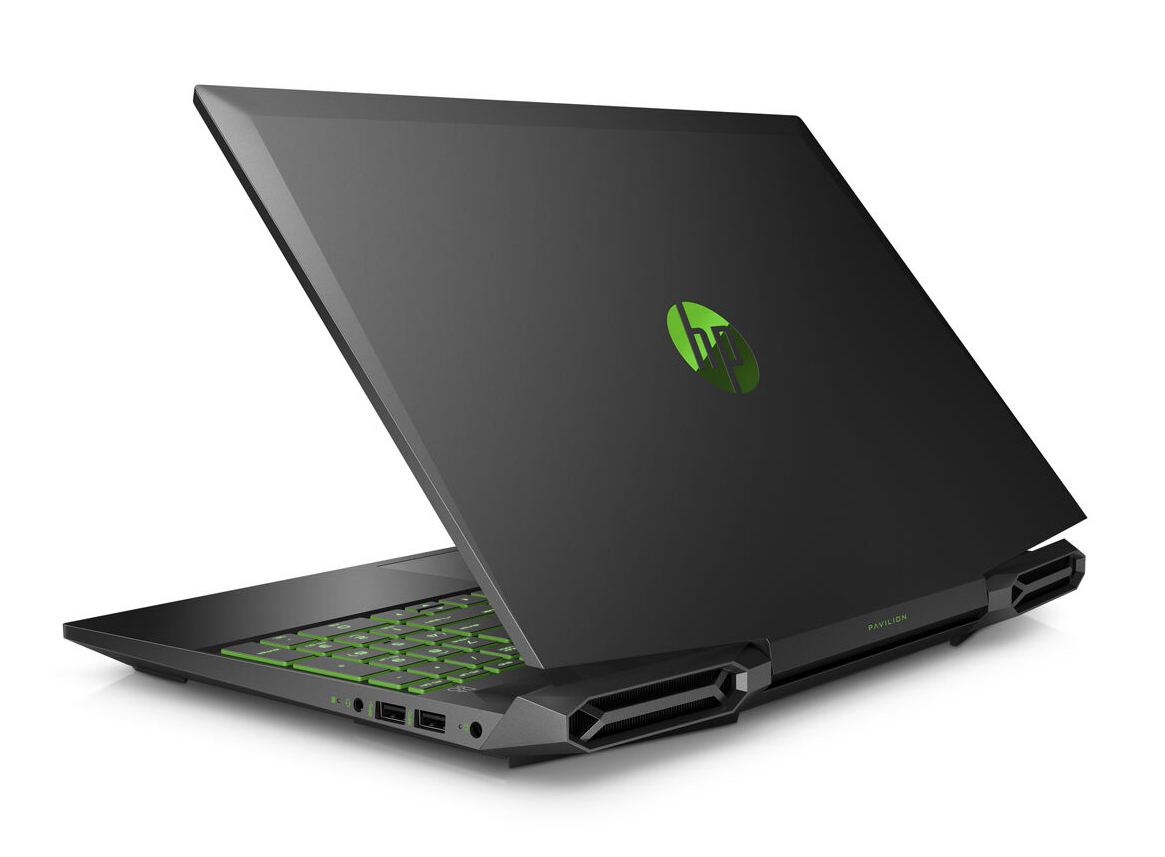
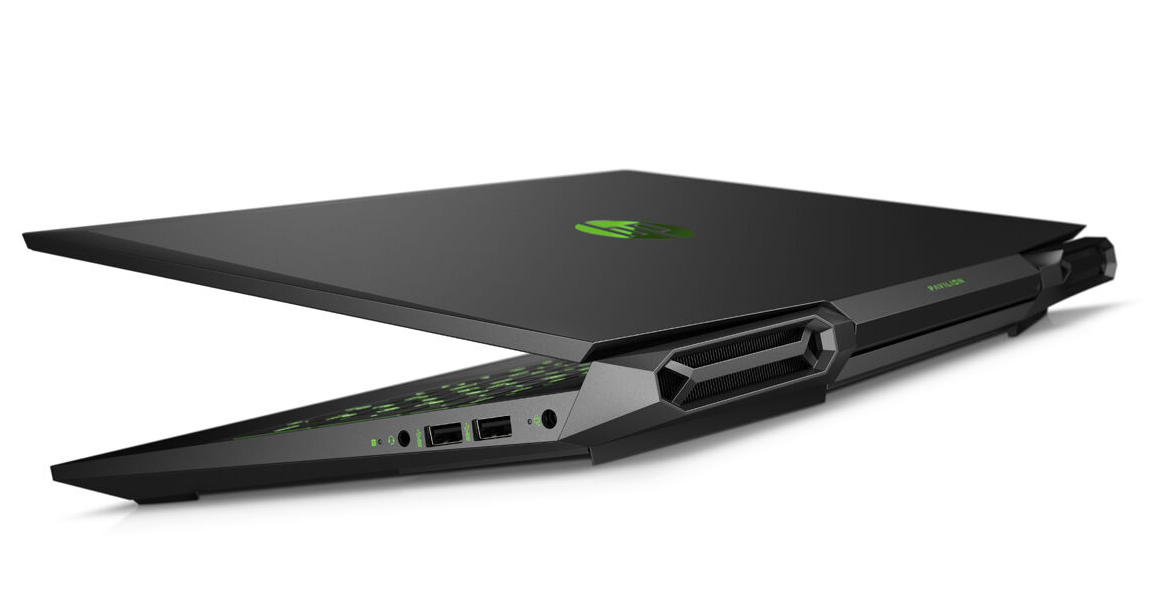
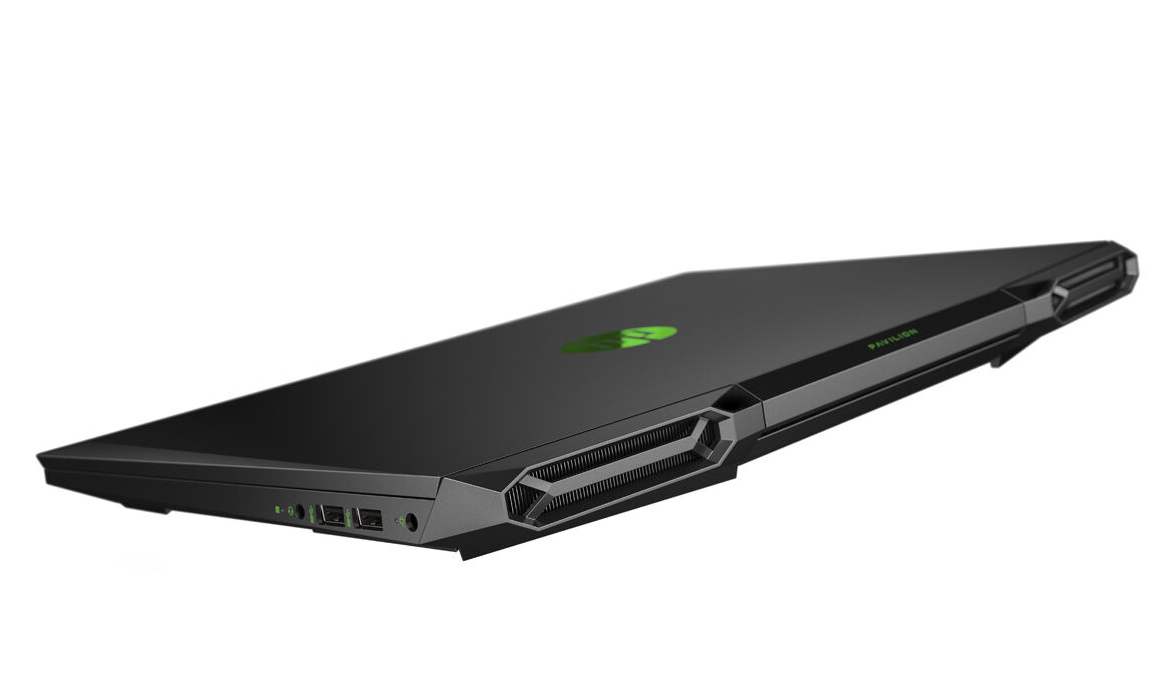
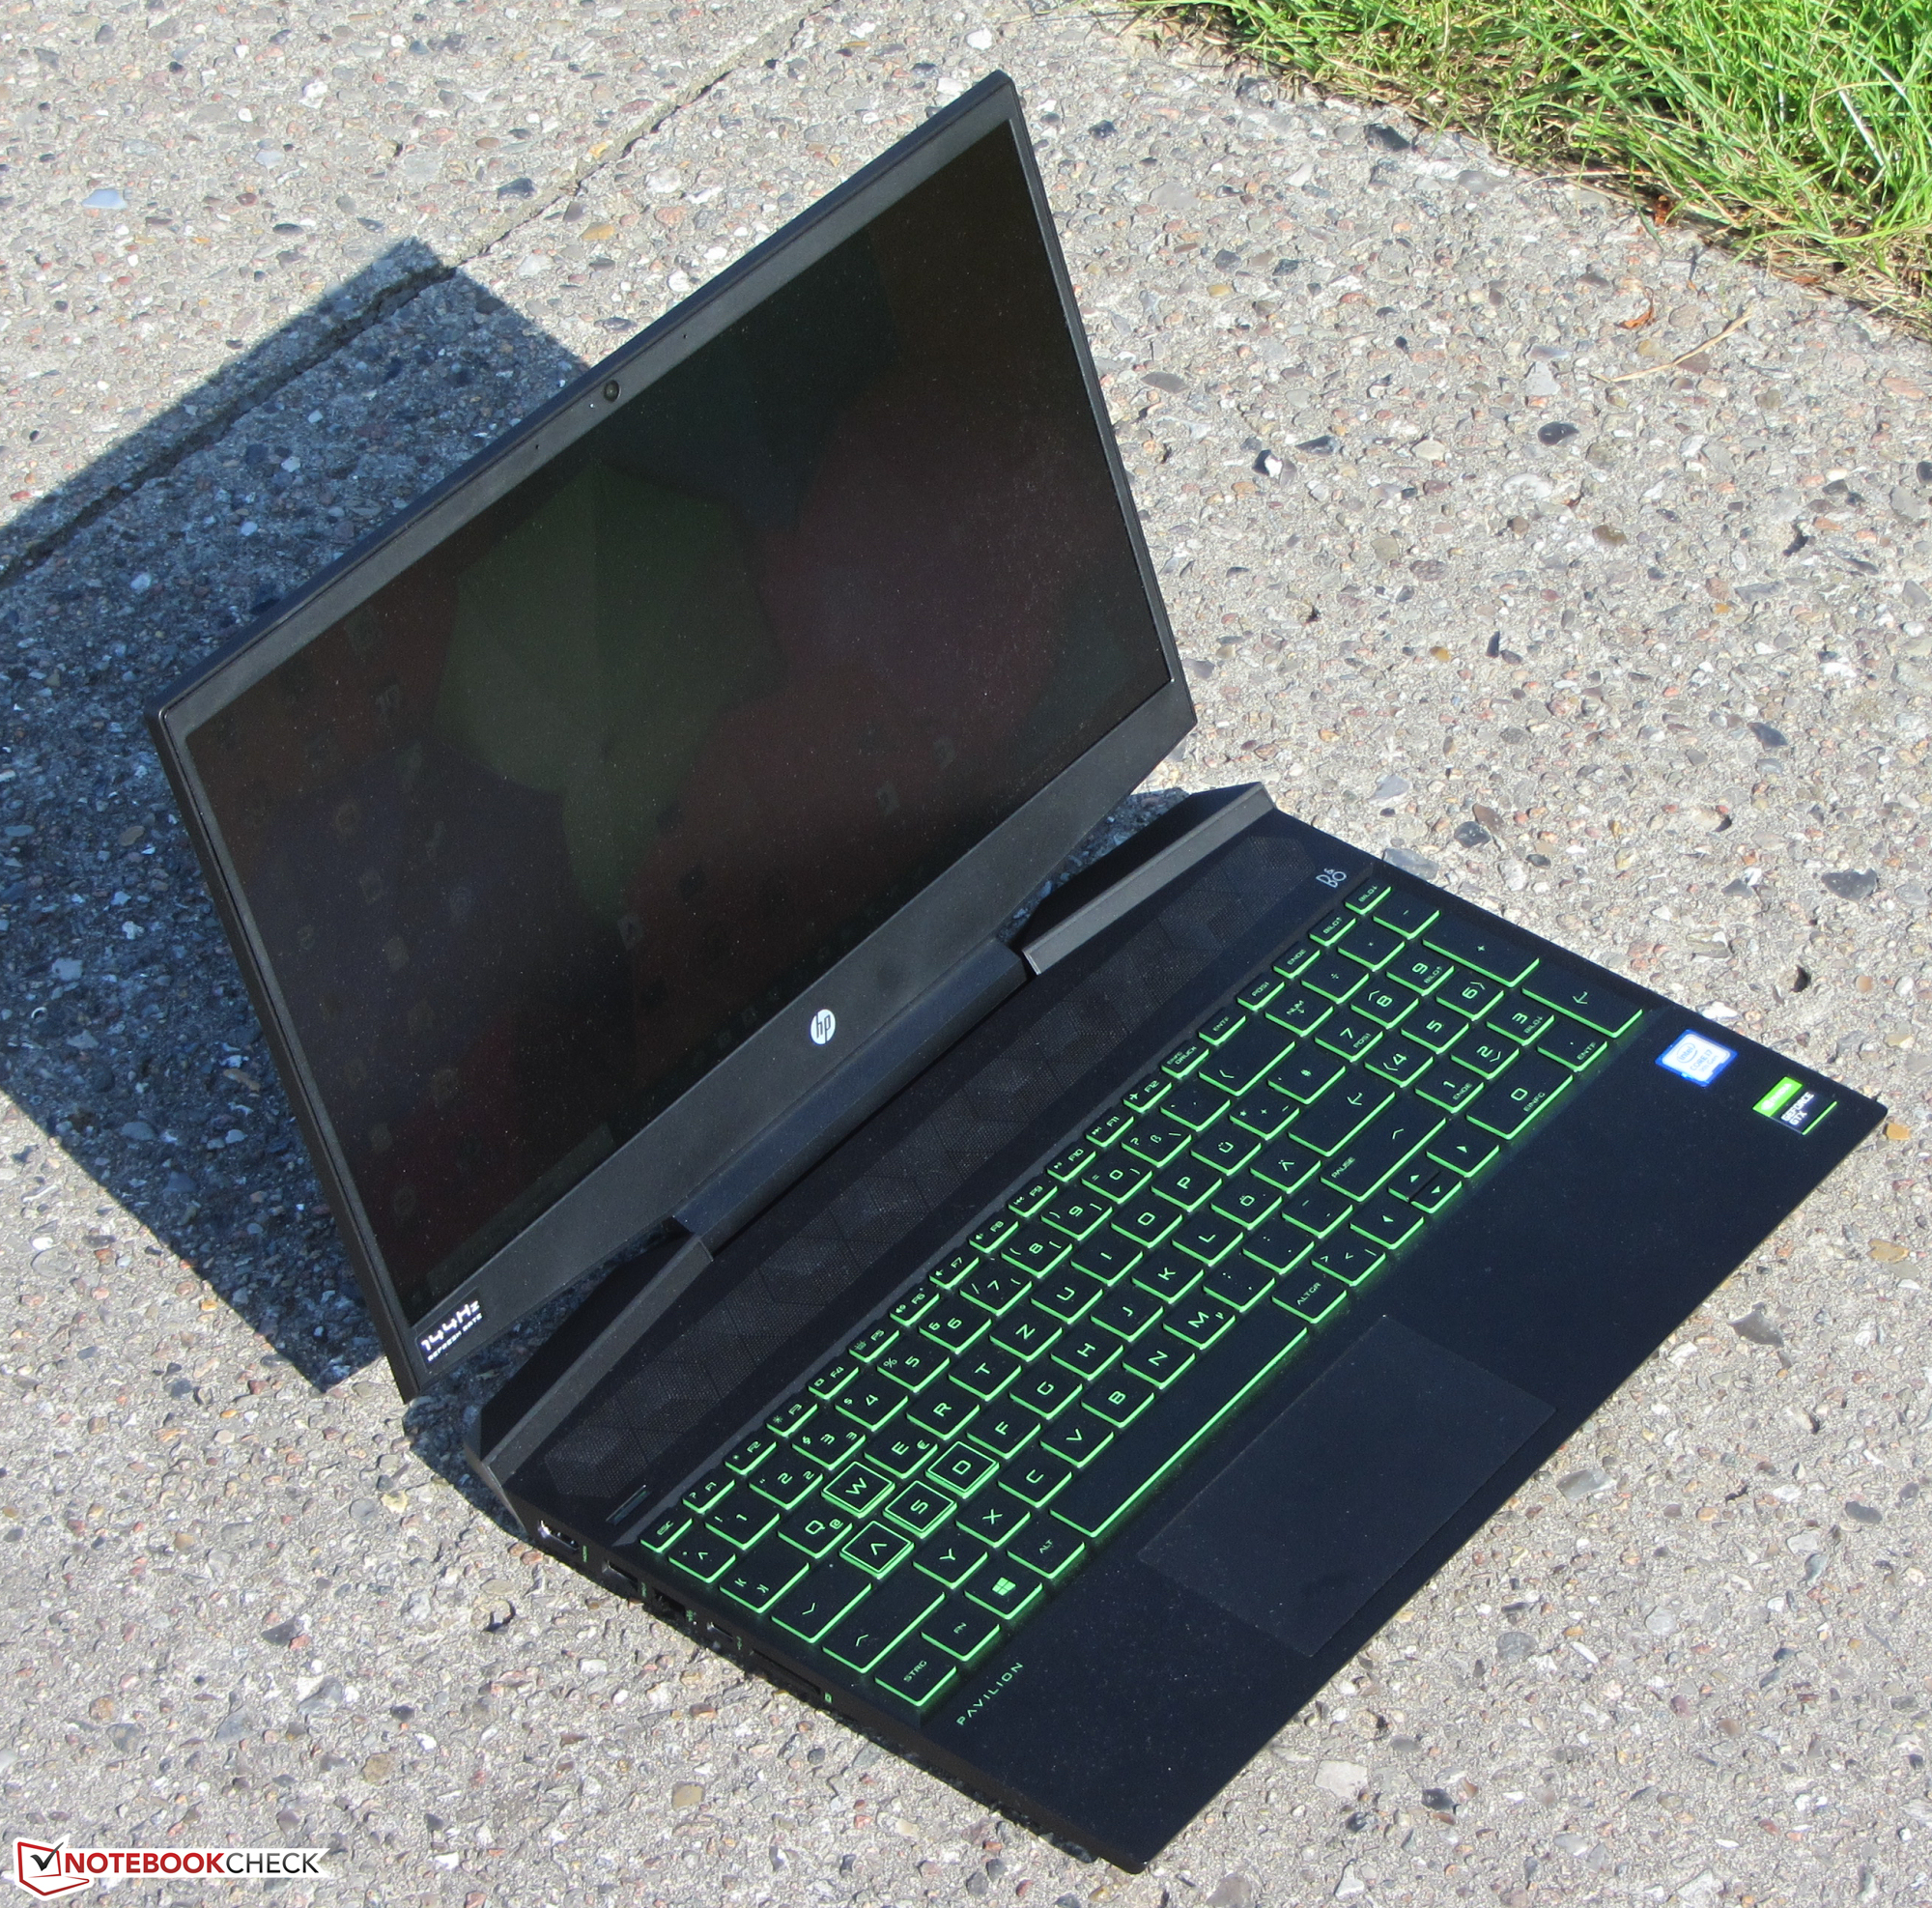
Test: HP Gaming Pavilion 15 - En kraftfull men ändå behagligt tyst spellaptop
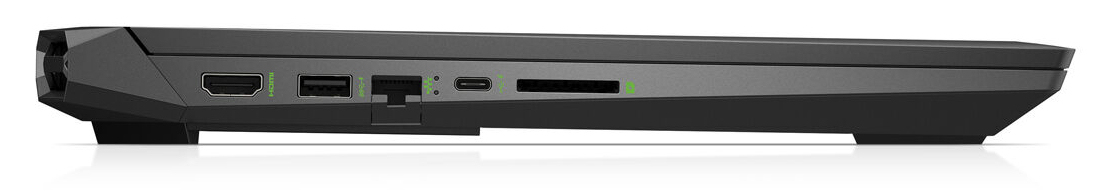
| SD Card Reader | |
| average JPG Copy Test (av. of 3 runs) | |
| Genomsnitt av klass Gaming (20.9 - 210, n=54, senaste 2 åren) | |
| CUK Model Z GK5CQ7Z (Toshiba Exceria Pro SDXC 64 GB UHS-II) | |
| HP Gaming Pavilion 15-dk0009ng (Toshiba Exceria Pro SDXC 64 GB UHS-II) | |
| Dell G5 15 5590 (Toshiba Exceria Pro SDXC 64 GB UHS-II) | |
| Medion Erazer X6805-MD61085 (Toshiba Exceria Pro SDXC 64 GB UHS-II) | |
| maximum AS SSD Seq Read Test (1GB) | |
| Genomsnitt av klass Gaming (25.5 - 261, n=51, senaste 2 åren) | |
| CUK Model Z GK5CQ7Z (Toshiba Exceria Pro SDXC 64 GB UHS-II) | |
| HP Gaming Pavilion 15-dk0009ng (Toshiba Exceria Pro SDXC 64 GB UHS-II) | |
| Medion Erazer X6805-MD61085 (Toshiba Exceria Pro SDXC 64 GB UHS-II) | |
| Dell G5 15 5590 (Toshiba Exceria Pro SDXC 64 GB UHS-II) | |
| Networking | |
| iperf3 transmit AX12 | |
| Medion Erazer X6805-MD61085 | |
| Dell G5 15 5590 | |
| HP Gaming Pavilion 15-dk0009ng | |
| CUK Model Z GK5CQ7Z | |
| Asus ROG Zephyrus G15 GA502DU | |
| Lenovo Legion Y530-15ICH | |
| iperf3 receive AX12 | |
| Medion Erazer X6805-MD61085 | |
| Dell G5 15 5590 | |
| CUK Model Z GK5CQ7Z | |
| HP Gaming Pavilion 15-dk0009ng | |
| Asus ROG Zephyrus G15 GA502DU | |
| Lenovo Legion Y530-15ICH | |
| |||||||||||||||||||||||||
Distribution av ljusstyrkan: 86 %
Mitt på batteriet: 346 cd/m²
Kontrast: 821:1 (Svärta: 0.42 cd/m²)
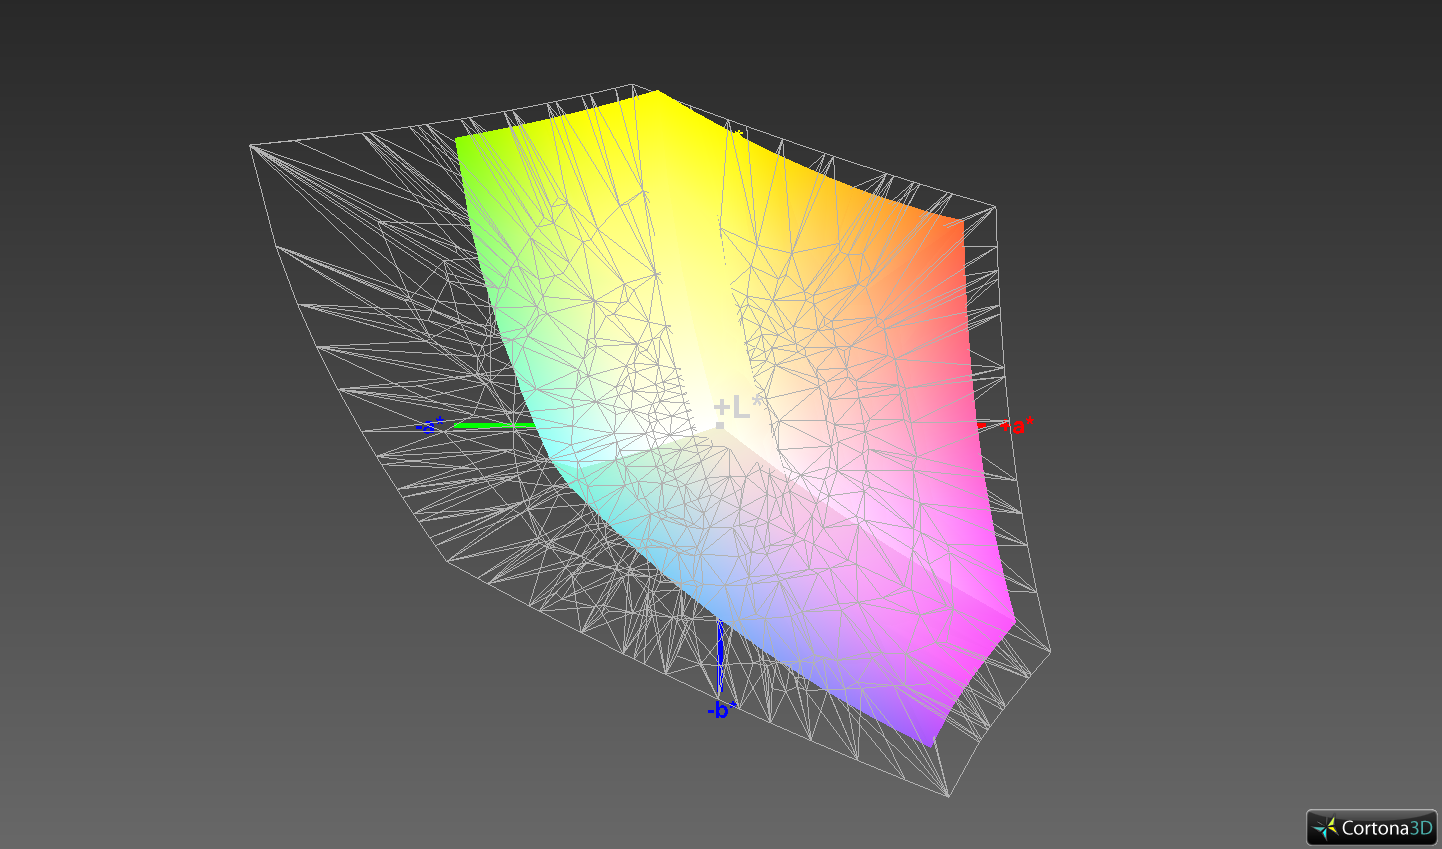
ΔE ColorChecker Calman: 1.3 | ∀{0.5-29.43 Ø4.73}
calibrated: 1.1
ΔE Greyscale Calman: 1.2 | ∀{0.09-98 Ø4.97}
94.9% sRGB (Argyll 1.6.3 3D)
60.5% AdobeRGB 1998 (Argyll 1.6.3 3D)
65.8% AdobeRGB 1998 (Argyll 3D)
95.1% sRGB (Argyll 3D)
64.2% Display P3 (Argyll 3D)
Gamma: 2.31
CCT: 6476 K
| HP Gaming Pavilion 15-dk0009ng IPS, 1920x1080, 15.6" | CUK Model Z GK5CQ7Z IPS, 1920x1080, 15.6" | Dell G5 15 5590 IPS, 1920x1080, 15.6" | Asus ROG Zephyrus G15 GA502DU IPS, 1920x1080, 15.6" | Lenovo Legion Y530-15ICH IPS, 1920x1080, 15.6" | Medion Erazer X6805-MD61085 IPS, 1920x1080, 15.6" | |
|---|---|---|---|---|---|---|
| Display | -1% | -38% | -37% | -3% | -7% | |
| Display P3 Coverage (%) | 64.2 | 64.5 0% | 39.26 -39% | 40.33 -37% | 62.5 -3% | 63.8 -1% |
| sRGB Coverage (%) | 95.1 | 93 -2% | 59.1 -38% | 60.6 -36% | 93 -2% | 82.4 -13% |
| AdobeRGB 1998 Coverage (%) | 65.8 | 65.7 0% | 40.56 -38% | 41.69 -37% | 63.8 -3% | 60.3 -8% |
| Response Times | 1% | -181% | -138% | 2% | -158% | |
| Response Time Grey 50% / Grey 80% * (ms) | 16.4 ? | 13.6 ? 17% | 45 ? -174% | 34 ? -107% | 15 ? 9% | 38.4 ? -134% |
| Response Time Black / White * (ms) | 10.4 ? | 12 ? -15% | 30 ? -188% | 28 ? -169% | 11 ? -6% | 29.2 ? -181% |
| PWM Frequency (Hz) | 21280 ? | 20490 ? | ||||
| Screen | -44% | -181% | -117% | -70% | -91% | |
| Brightness middle (cd/m²) | 345 | 306.8 -11% | 234 -32% | 240.1 -30% | 305 -12% | 270 -22% |
| Brightness (cd/m²) | 324 | 309 -5% | 219 -32% | 231 -29% | 284 -12% | 269 -17% |
| Brightness Distribution (%) | 86 | 87 1% | 82 -5% | 85 -1% | 83 -3% | 86 0% |
| Black Level * (cd/m²) | 0.42 | 0.38 10% | 0.17 60% | 0.34 19% | 0.52 -24% | 0.32 24% |
| Contrast (:1) | 821 | 807 -2% | 1376 68% | 706 -14% | 587 -29% | 844 3% |
| Colorchecker dE 2000 * | 1.3 | 3.16 -143% | 8.6 -562% | 4.2 -223% | 3.63 -179% | 5.1 -292% |
| Colorchecker dE 2000 max. * | 2.8 | 6.05 -116% | 17.49 -525% | 17.8 -536% | 8.18 -192% | 9.25 -230% |
| Colorchecker dE 2000 calibrated * | 1.1 | 2.4 -118% | 4.06 -269% | 4.09 -272% | 1.31 -19% | 3.25 -195% |
| Greyscale dE 2000 * | 1.2 | 2.3 -92% | 8.55 -613% | 2.8 -133% | 4.77 -297% | 4.16 -247% |
| Gamma | 2.31 95% | 2.17 101% | 3.02 73% | 2.2 100% | 2.54 87% | 2.53 87% |
| CCT | 6476 100% | 6557 99% | 7802 83% | 6925 94% | 7500 87% | 6860 95% |
| Color Space (Percent of AdobeRGB 1998) (%) | 60.5 | 60 -1% | 37 -39% | 38.4 -37% | 59 -2% | 54 -11% |
| Color Space (Percent of sRGB) (%) | 94.9 | 92.6 -2% | 59 -38% | 60.4 -36% | 93 -2% | 82 -14% |
| Totalt genomsnitt (program/inställningar) | -15% /
-30% | -133% /
-154% | -97% /
-105% | -24% /
-49% | -85% /
-84% |
* ... mindre är bättre
Visa svarstider
| ↔ Svarstid svart till vitt | ||
|---|---|---|
| 10.4 ms ... stiga ↗ och falla ↘ kombinerat | ↗ 5.2 ms stiga | 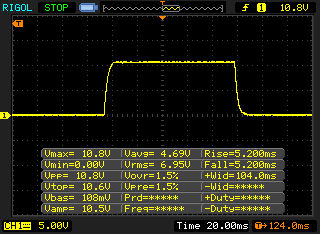 |
| ↘ 5.2 ms hösten | ||
| Skärmen visar bra svarsfrekvens i våra tester, men kan vara för långsam för konkurrenskraftiga spelare. I jämförelse sträcker sig alla testade enheter från 0.1 (minst) till 240 (maximalt) ms. » 28 % av alla enheter är bättre. Det betyder att den uppmätta svarstiden är bättre än genomsnittet av alla testade enheter (19.9 ms). | ||
| ↔ Svarstid 50 % grått till 80 % grått | ||
| 16.4 ms ... stiga ↗ och falla ↘ kombinerat | ↗ 8.4 ms stiga | 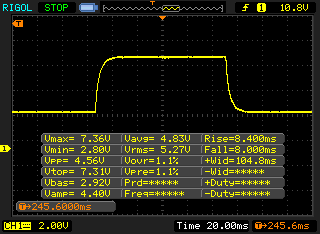 |
| ↘ 8 ms hösten | ||
| Skärmen visar bra svarsfrekvens i våra tester, men kan vara för långsam för konkurrenskraftiga spelare. I jämförelse sträcker sig alla testade enheter från 0.165 (minst) till 636 (maximalt) ms. » 30 % av alla enheter är bättre. Det betyder att den uppmätta svarstiden är bättre än genomsnittet av alla testade enheter (31.1 ms). | ||
Skärmflimmer / PWM (Puls-Width Modulation)
| Skärmflimmer / PWM upptäcktes inte | 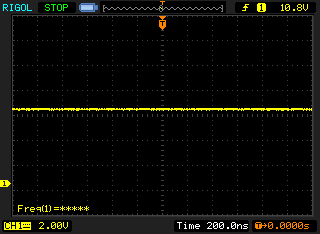 | ||
Som jämförelse: 52 % av alla testade enheter använder inte PWM för att dämpa skärmen. Om PWM upptäcktes mättes ett medelvärde av 7791 (minst: 5 - maximum: 343500) Hz. | |||
| Geekbench 3 | |
| 32 Bit Multi-Core Score | |
| HP Gaming Pavilion 15-dk0009ng | |
| Genomsnitt Intel Core i7-9750H (21185 - 23587, n=8) | |
| Dell G5 15 5590 | |
| 32 Bit Single-Core Score | |
| HP Gaming Pavilion 15-dk0009ng | |
| Genomsnitt Intel Core i7-9750H (4137 - 4428, n=8) | |
| Dell G5 15 5590 | |
| Mozilla Kraken 1.1 - Total | |
| Dell G5 15 5590 (Edge 44) | |
| HP Gaming Pavilion 15-dk0009ng (Edge 44) | |
| Genomsnitt Intel Core i7-9750H (845 - 1713, n=54) | |
| Lenovo Legion Y530-15ICH | |
| Genomsnitt av klass Gaming (391 - 590, n=104, senaste 2 åren) | |
| Octane V2 - Total Score | |
| Genomsnitt av klass Gaming (89353 - 139447, n=29, senaste 2 åren) | |
| Lenovo Legion Y530-15ICH | |
| HP Gaming Pavilion 15-dk0009ng (Edge 44) | |
| Genomsnitt Intel Core i7-9750H (22874 - 39708, n=47) | |
| Dell G5 15 5590 (Edge 44) | |
| Asus ROG Zephyrus G15 GA502DU (Edge 44.17763.1.0) | |
| JetStream 1.1 - 1.1 Total | |
| Genomsnitt av klass Gaming (533 - 647, n=4, senaste 2 åren) | |
| HP Gaming Pavilion 15-dk0009ng (Edge 44) | |
| Genomsnitt Intel Core i7-9750H (212 - 280, n=47) | |
| Dell G5 15 5590 (Edge 44) | |
| Asus ROG Zephyrus G15 GA502DU (Edge 44.17763.1.0) | |
| Lenovo Legion Y530-15ICH | |
* ... mindre är bättre
| PCMark 7 Score | 6847 poäng | |
| PCMark 8 Home Score Accelerated v2 | 4362 poäng | |
| PCMark 8 Creative Score Accelerated v2 | 4155 poäng | |
| PCMark 8 Work Score Accelerated v2 | 5608 poäng | |
| PCMark 10 Score | 5583 poäng | |
Hjälp | ||
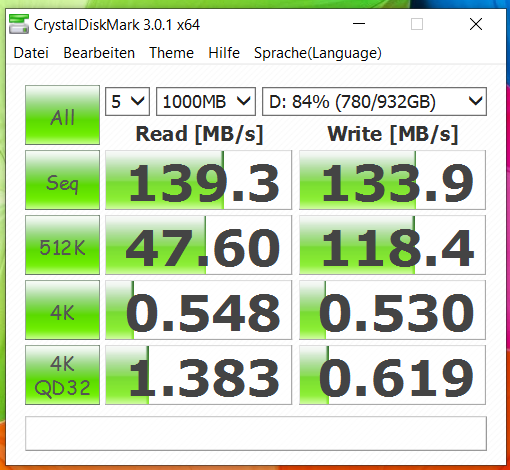

| HP Gaming Pavilion 15-dk0009ng Samsung SSD PM981 MZVLB256HAHQ | CUK Model Z GK5CQ7Z Intel SSD 660p 2TB SSDPEKNW020T8 | Dell G5 15 5590 KBG30ZMS128G | Asus ROG Zephyrus G15 GA502DU Intel SSD 660p SSDPEKNW512G8 | Lenovo Legion Y530-15ICH Samsung SSD PM981 MZVLB256HAHQ | Medion Erazer X6805-MD61085 Samsung PM961 MZVLW256HEHP | Genomsnitt Samsung SSD PM981 MZVLB256HAHQ | |
|---|---|---|---|---|---|---|---|
| CrystalDiskMark 5.2 / 6 | 37% | -56% | -6% | 2% | -9% | 72% | |
| Write 4K (MB/s) | 100 | 134.4 34% | 64.3 -36% | 132.2 32% | 108.9 9% | 90.3 -10% | 116.1 ? 16% |
| Read 4K (MB/s) | 31.39 | 56.8 81% | 29.3 -7% | 55.5 77% | 40.23 28% | 38.98 24% | 189.5 ? 504% |
| Write Seq (MB/s) | 1308 | 1742 33% | 131.1 -90% | 986 -25% | 1390 6% | 1095 -16% | 1409 ? 8% |
| Read Seq (MB/s) | 1083 | 1687 56% | 776 -28% | 1318 22% | 964 -11% | 777 -28% | 1624 ? 50% |
| Write 4K Q32T1 (MB/s) | 362.9 | 535 47% | 96.8 -73% | 220.3 -39% | 314.2 -13% | 302.7 -17% | 360 ? -1% |
| Read 4K Q32T1 (MB/s) | 425.7 | 639 50% | 198.6 -53% | 315.5 -26% | 369.2 -13% | 352.2 -17% | 396 ? -7% |
| Write Seq Q32T1 (MB/s) | 1411 | 1903 35% | 127.8 -91% | 987 -30% | 1506 7% | 1265 -10% | 1492 ? 6% |
| Read Seq Q32T1 (MB/s) | 3240 | 1849 -43% | 1044 -68% | 1416 -56% | 3446 6% | 3389 5% | 3313 ? 2% |
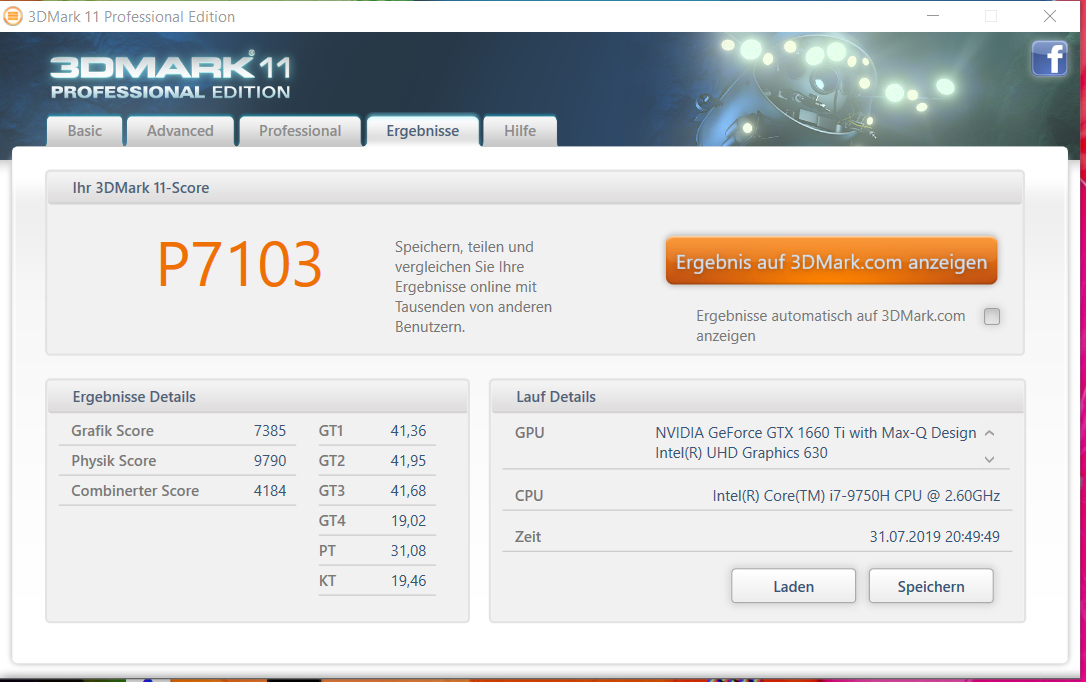
| 3DMark 06 Standard Score | 38536 poäng | |
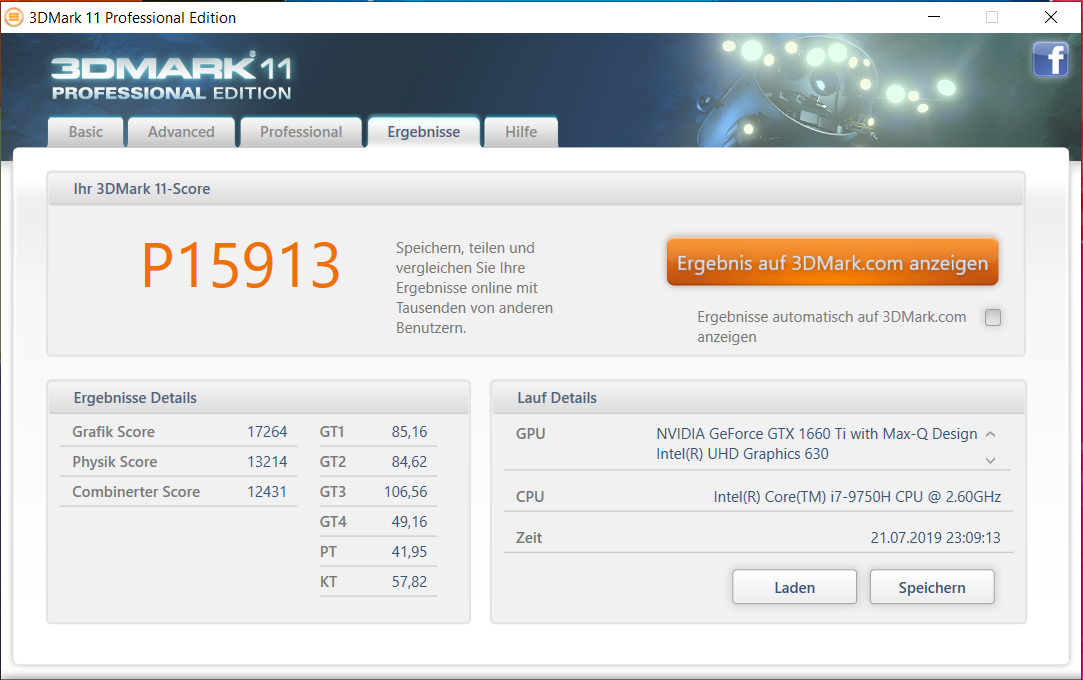
| 3DMark 11 Performance | 15913 poäng | |
| 3DMark Ice Storm Standard Score | 117976 poäng | |
| 3DMark Cloud Gate Standard Score | 33027 poäng | |
| 3DMark Fire Strike Score | 11615 poäng | |
| 3DMark Time Spy Score | 5072 poäng | |
Hjälp | ||
| 3DMark 11 - 1280x720 Performance GPU | |
| Genomsnitt av klass Gaming (21841 - 80022, n=106, senaste 2 åren) | |
| CUK Model Z GK5CQ7Z | |
| Dell G5 15 5590 | |
| Genomsnitt NVIDIA GeForce GTX 1660 Ti Max-Q (17010 - 18653, n=8) | |
| HP Gaming Pavilion 15-dk0009ng | |
| Asus ROG Zephyrus G15 GA502DU | |
| Lenovo Legion Y530-15ICH | |
| Medion Erazer X6805-MD61085 | |
| 3DMark | |
| 1280x720 Cloud Gate Standard Graphics | |
| Genomsnitt av klass Gaming (86886 - 223650, n=61, senaste 2 åren) | |
| CUK Model Z GK5CQ7Z | |
| Dell G5 15 5590 | |
| HP Gaming Pavilion 15-dk0009ng | |
| Lenovo Legion Y530-15ICH | |
| Medion Erazer X6805-MD61085 | |
| Genomsnitt NVIDIA GeForce GTX 1660 Ti Max-Q (38321 - 89505, n=7) | |
| Asus ROG Zephyrus G15 GA502DU | |
| 1920x1080 Fire Strike Graphics | |
| Genomsnitt av klass Gaming (12242 - 62849, n=118, senaste 2 åren) | |
| CUK Model Z GK5CQ7Z | |
| Dell G5 15 5590 | |
| Genomsnitt NVIDIA GeForce GTX 1660 Ti Max-Q (12903 - 13870, n=7) | |
| Asus ROG Zephyrus G15 GA502DU | |
| HP Gaming Pavilion 15-dk0009ng | |
| Medion Erazer X6805-MD61085 | |
| Lenovo Legion Y530-15ICH | |
| 2560x1440 Time Spy Graphics | |
| Genomsnitt av klass Gaming (5012 - 26212, n=117, senaste 2 åren) | |
| CUK Model Z GK5CQ7Z | |
| Dell G5 15 5590 | |
| Genomsnitt NVIDIA GeForce GTX 1660 Ti Max-Q (4867 - 5440, n=8) | |
| HP Gaming Pavilion 15-dk0009ng | |
| Asus ROG Zephyrus G15 GA502DU | |
| The Witcher 3 - 1920x1080 Ultra Graphics & Postprocessing (HBAO+) | |
| Genomsnitt av klass Gaming (95 - 240, n=8, senaste 2 åren) | |
| CUK Model Z GK5CQ7Z | |
| Dell G5 15 5590 | |
| HP Gaming Pavilion 15-dk0009ng | |
| Genomsnitt NVIDIA GeForce GTX 1660 Ti Max-Q (44.8 - 53.2, n=7) | |
| Asus ROG Zephyrus G15 GA502DU | |
| Lenovo Legion Y530-15ICH | |
| Medion Erazer X6805-MD61085 | |
| BioShock Infinite - 1920x1080 Ultra Preset, DX11 (DDOF) | |
| CUK Model Z GK5CQ7Z | |
| Dell G5 15 5590 | |
| HP Gaming Pavilion 15-dk0009ng | |
| Genomsnitt NVIDIA GeForce GTX 1660 Ti Max-Q (102.3 - 130, n=5) | |
| Lenovo Legion Y530-15ICH | |
| Asus ROG Zephyrus G15 GA502DU | |
| Far Cry 5 - 1920x1080 Ultra Preset AA:T | |
| Genomsnitt av klass Gaming (70 - 151, n=10, senaste 2 åren) | |
| Dell G5 15 5590 | |
| HP Gaming Pavilion 15-dk0009ng | |
| Genomsnitt NVIDIA GeForce GTX 1660 Ti Max-Q (50 - 74, n=2) | |
| låg | med. | hög | ultra | |
|---|---|---|---|---|
| BioShock Infinite (2013) | 294 | 271.9 | 246.8 | 126.3 |
| GTA V (2015) | 161.3 | 151.5 | 114.6 | 59.6 |
| The Witcher 3 (2015) | 243 | 162.6 | 95.2 | 53.1 |
| Rainbow Six Siege (2015) | 232.8 | 200.1 | 163.6 | 148.8 |
| Ghost Recon Wildlands (2017) | 130.4 | 78.1 | 72.4 | 41.5 |
| Final Fantasy XV Benchmark (2018) | 106.4 | 70.3 | 50 | |
| Kingdom Come: Deliverance (2018) | 125.6 | 91.7 | 77.3 | 53.7 |
| X-Plane 11.11 (2018) | 102.3 | 88.1 | 75.4 | |
| Far Cry 5 (2018) | 103 | 84 | 79 | 74 |
| Assassin´s Creed Odyssey (2018) | 90 | 71 | 60 | 44 |
| Battlefield V (2018) | 117.4 | 74.6 | 65.9 | 61 |
| Far Cry New Dawn (2019) | 97 | 81 | 78 | 71 |
| Dirt Rally 2.0 (2019) | 194.2 | 139.9 | 103.2 | 59.2 |
| The Division 2 (2019) | 142 | 87 | 69 | 50 |
| Anno 1800 (2019) | 87.9 | 83.2 | 64.1 | 33.2 |
| Rage 2 (2019) | 154.7 | 70.9 | 58.7 | 58.2 |
| Total War: Three Kingdoms (2019) | 209.4 | 93.1 | 57.1 | 41.6 |
| F1 2019 (2019) | 183 | 140 | 117 | 71 |
Ljudnivå
| Låg belastning |
| 29.3 / 29.3 / 29.3 dB(A) |
| Hårddisk |
| 29.7 dB(A) |
| Hög belastning |
| 32.3 / 41.2 dB(A) |
 | ||
30 dB tyst 40 dB(A) hörbar 50 dB(A) högt ljud |
||
min: | ||
| HP Gaming Pavilion 15-dk0009ng i7-9750H, GeForce GTX 1660 Ti Max-Q | CUK Model Z GK5CQ7Z i7-9750H, GeForce RTX 2070 Max-Q | Dell G5 15 5590 i7-8750H, GeForce RTX 2060 Mobile | Asus ROG Zephyrus G15 GA502DU R7 3750H, GeForce GTX 1660 Ti Max-Q | Lenovo Legion Y530-15ICH i7-8750H, GeForce GTX 1060 Mobile | Medion Erazer X6805-MD61085 i7-8750H, GeForce GTX 1060 Mobile | Genomsnitt NVIDIA GeForce GTX 1660 Ti Max-Q | Genomsnitt av klass Gaming | |
|---|---|---|---|---|---|---|---|---|
| Noise | -23% | -13% | -20% | -9% | -20% | -5% | -6% | |
| av / miljö * (dB) | 28.2 | 28.6 -1% | 30.4 -8% | 28 1% | 30.2 -7% | 29 -3% | 28.3 ? -0% | 24.1 ? 15% |
| Idle Minimum * (dB) | 29.3 | 30.8 -5% | 30.4 -4% | 29.4 -0% | 30.9 -5% | 29 1% | 29.2 ? -0% | 25.8 ? 12% |
| Idle Average * (dB) | 29.3 | 30.8 -5% | 30.4 -4% | 31.9 -9% | 30.9 -5% | 32 -9% | 29.5 ? -1% | 27.4 ? 6% |
| Idle Maximum * (dB) | 29.3 | 35 -19% | 33.4 -14% | 33 -13% | 31.6 -8% | 35 -19% | 30.4 ? -4% | 29.9 ? -2% |
| Load Average * (dB) | 32.3 | 45 -39% | 42 -30% | 41.2 -28% | 42.3 -31% | 45 -39% | 37.3 ? -15% | 43 ? -33% |
| Witcher 3 ultra * (dB) | 34 | 51.6 -52% | 53.8 -58% | 47 -38% | ||||
| Load Maximum * (dB) | 41.2 | 57.8 -40% | 48.7 -18% | 55.7 -35% | 40 3% | 56 -36% | 46.1 ? -12% | 54 ? -31% |
* ... mindre är bättre
(-) Den maximala temperaturen på ovansidan är 46.7 °C / 116 F, jämfört med genomsnittet av 40.4 °C / 105 F , allt från 21.2 till 68.8 °C för klassen Gaming.
(-) Botten värms upp till maximalt 53.7 °C / 129 F, jämfört med genomsnittet av 43.2 °C / 110 F
(+) Vid tomgångsbruk är medeltemperaturen för ovansidan 23.4 °C / 74 F, jämfört med enhetsgenomsnittet på 33.9 °C / ### class_avg_f### F.
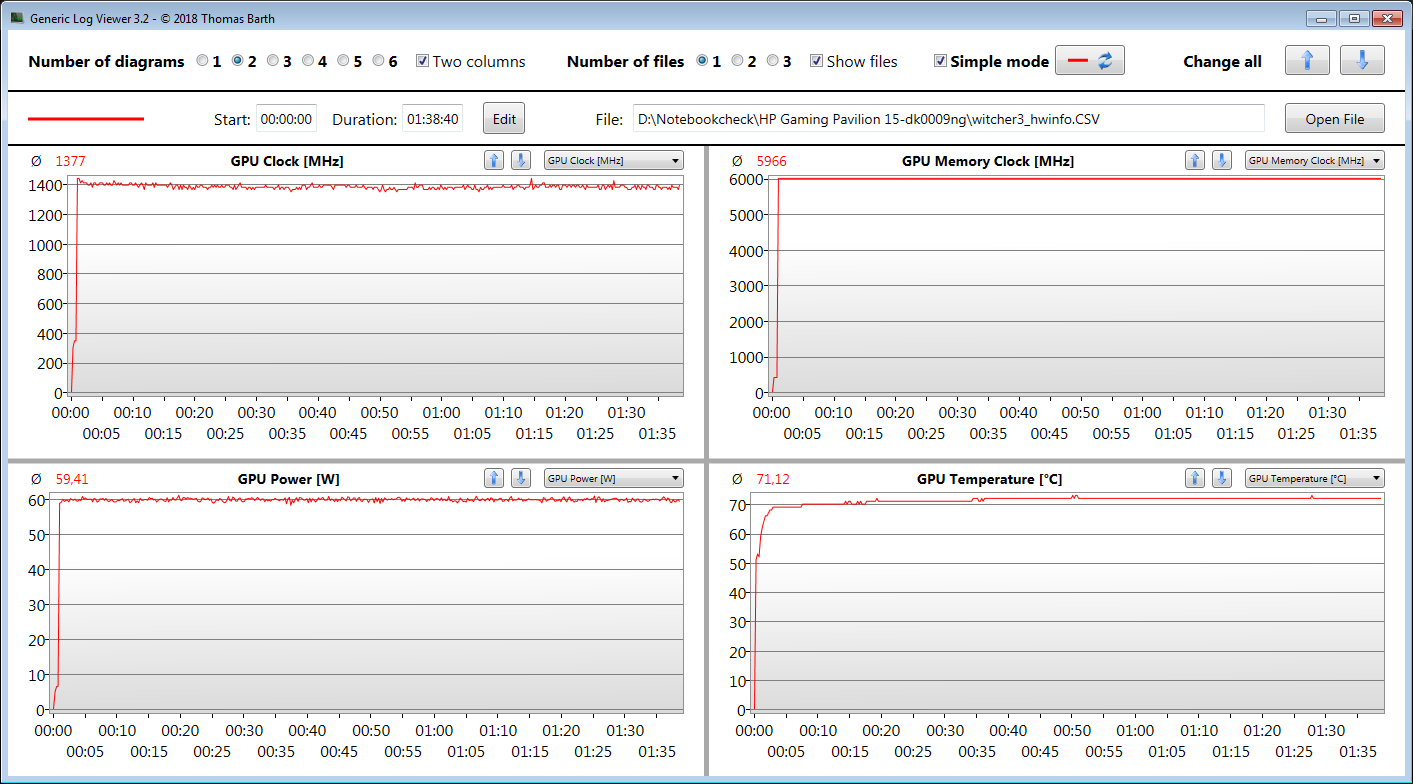
(-) När du spelar The Witcher 3 är medeltemperaturen för ovansidan 38.8 °C / 102 F, jämfört med enhetsgenomsnittet på 33.9 °C / ## #class_avg_f### F.
(+) Handledsstöden och pekplattan når maximal hudtemperatur (33.3 °C / 91.9 F) och är därför inte varma.
(-) Medeltemperaturen för handledsstödsområdet på liknande enheter var 28.8 °C / 83.8 F (-4.5 °C / -8.1 F).
| HP Gaming Pavilion 15-dk0009ng i7-9750H, GeForce GTX 1660 Ti Max-Q | CUK Model Z GK5CQ7Z i7-9750H, GeForce RTX 2070 Max-Q | Dell G5 15 5590 i7-8750H, GeForce RTX 2060 Mobile | Asus ROG Zephyrus G15 GA502DU R7 3750H, GeForce GTX 1660 Ti Max-Q | Lenovo Legion Y530-15ICH i7-8750H, GeForce GTX 1060 Mobile | Medion Erazer X6805-MD61085 i7-8750H, GeForce GTX 1060 Mobile | Genomsnitt NVIDIA GeForce GTX 1660 Ti Max-Q | Genomsnitt av klass Gaming | |
|---|---|---|---|---|---|---|---|---|
| Heat | -38% | -8% | -27% | -5% | -10% | -12% | -15% | |
| Maximum Upper Side * (°C) | 46.7 | 47.2 -1% | 51.5 -10% | 55.8 -19% | 48.4 -4% | 43 8% | 46.6 ? -0% | 45.2 ? 3% |
| Maximum Bottom * (°C) | 53.7 | 65.8 -23% | 48.3 10% | 58.2 -8% | 48 11% | 55 -2% | 49.4 ? 8% | 47.9 ? 11% |
| Idle Upper Side * (°C) | 23.8 | 35.2 -48% | 27.2 -14% | 33.4 -40% | 26.7 -12% | 28 -18% | 30.1 ? -26% | 31.1 ? -31% |
| Idle Bottom * (°C) | 23.7 | 43 -81% | 27.4 -16% | 33.6 -42% | 26.9 -14% | 30 -27% | 31 ? -31% | 34.2 ? -44% |
* ... mindre är bättre
HP Gaming Pavilion 15-dk0009ng ljudanalys
(±) | högtalarljudstyrkan är genomsnittlig men bra (75.8 dB)
Bas 100 - 315 Hz
(-) | nästan ingen bas - i genomsnitt 23.1% lägre än medianen
(±) | linjäriteten för basen är genomsnittlig (11.6% delta till föregående frekvens)
Mellan 400 - 2000 Hz
(+) | balanserad mellan - endast 2.4% från medianen
(+) | mids är linjära (5.4% delta till föregående frekvens)
Högsta 2 - 16 kHz
(+) | balanserade toppar - endast 1.5% från medianen
(+) | toppar är linjära (3.4% delta till föregående frekvens)
Totalt 100 - 16 000 Hz
(±) | linjäriteten för det totala ljudet är genomsnittlig (19% skillnad mot median)
Jämfört med samma klass
» 63% av alla testade enheter i den här klassen var bättre, 8% liknande, 29% sämre
» Den bästa hade ett delta på 6%, genomsnittet var 18%, sämst var 132%
Jämfört med alla testade enheter
» 45% av alla testade enheter var bättre, 7% liknande, 48% sämre
» Den bästa hade ett delta på 4%, genomsnittet var 24%, sämst var 134%
| Av/Standby | |
| Låg belastning | |
| Hög belastning |
|
Förklaring:
min: | |
| HP Gaming Pavilion 15-dk0009ng i7-9750H, GeForce GTX 1660 Ti Max-Q | CUK Model Z GK5CQ7Z i7-9750H, GeForce RTX 2070 Max-Q | Dell G5 15 5590 i7-8750H, GeForce RTX 2060 Mobile | Asus ROG Zephyrus G15 GA502DU R7 3750H, GeForce GTX 1660 Ti Max-Q | Lenovo Legion Y530-15ICH i7-8750H, GeForce GTX 1060 Mobile | Medion Erazer X6805-MD61085 i7-8750H, GeForce GTX 1060 Mobile | Genomsnitt NVIDIA GeForce GTX 1660 Ti Max-Q | Genomsnitt av klass Gaming | |
|---|---|---|---|---|---|---|---|---|
| Power Consumption | -101% | 15% | -23% | -5% | -25% | 12% | -64% | |
| Idle Minimum * (Watt) | 6.8 | 23.5 -246% | 3.5 49% | 7.4 -9% | 7.3 -7% | 10 -47% | 5.16 ? 24% | 13.2 ? -94% |
| Idle Average * (Watt) | 10.7 | 28 -162% | 6.9 36% | 8.6 20% | 11.1 -4% | 13 -21% | 8.51 ? 20% | 18.9 ? -77% |
| Idle Maximum * (Watt) | 12.5 | 32 -156% | 8.5 32% | 39.1 -213% | 12.6 -1% | 21 -68% | 14.6 ? -17% | 24.3 ? -94% |
| Load Average * (Watt) | 87.2 | 102.4 -17% | 127 -46% | 65.9 24% | 109 -25% | 101 -16% | 76.4 ? 12% | 108.3 ? -24% |
| Witcher 3 ultra * (Watt) | 121 | 142.8 -18% | 106.9 12% | 126 -4% | ||||
| Load Maximum * (Watt) | 191.4 | 209 -9% | 179 6% | 141.3 26% | 168 12% | 176 8% | 151.4 ? 21% | 254 ? -33% |
* ... mindre är bättre
| HP Gaming Pavilion 15-dk0009ng i7-9750H, GeForce GTX 1660 Ti Max-Q, 52.5 Wh | CUK Model Z GK5CQ7Z i7-9750H, GeForce RTX 2070 Max-Q, 46.74 Wh | Dell G5 15 5590 i7-8750H, GeForce RTX 2060 Mobile, 60 Wh | Asus ROG Zephyrus G15 GA502DU R7 3750H, GeForce GTX 1660 Ti Max-Q, 76 Wh | Lenovo Legion Y530-15ICH i7-8750H, GeForce GTX 1060 Mobile, 52 Wh | Medion Erazer X6805-MD61085 i7-8750H, GeForce GTX 1060 Mobile, 46.7 Wh | Genomsnitt av klass Gaming | |
|---|---|---|---|---|---|---|---|
| Batteridrifttid | -37% | 76% | 68% | -32% | 5% | 29% | |
| Reader / Idle (h) | 8.7 | 14.8 70% | 15.3 76% | 8.3 -5% | 8.4 -3% | 8.71 ? 0% | |
| H.264 (h) | 5.3 | 8.4 58% | 8.26 ? 56% | ||||
| WiFi v1.3 (h) | 4.8 | 3 -37% | 7.7 60% | 8 67% | 3.8 -21% | 4.5 -6% | 7.04 ? 47% |
| Witcher 3 ultra (h) | 1 | ||||||
| Load (h) | 1.3 | 2.8 115% | 2.1 62% | 0.4 -69% | 1.6 23% | 1.47 ? 13% |
För
Emot
Läs den fullständiga versionen av den här recensionen på engelska här.
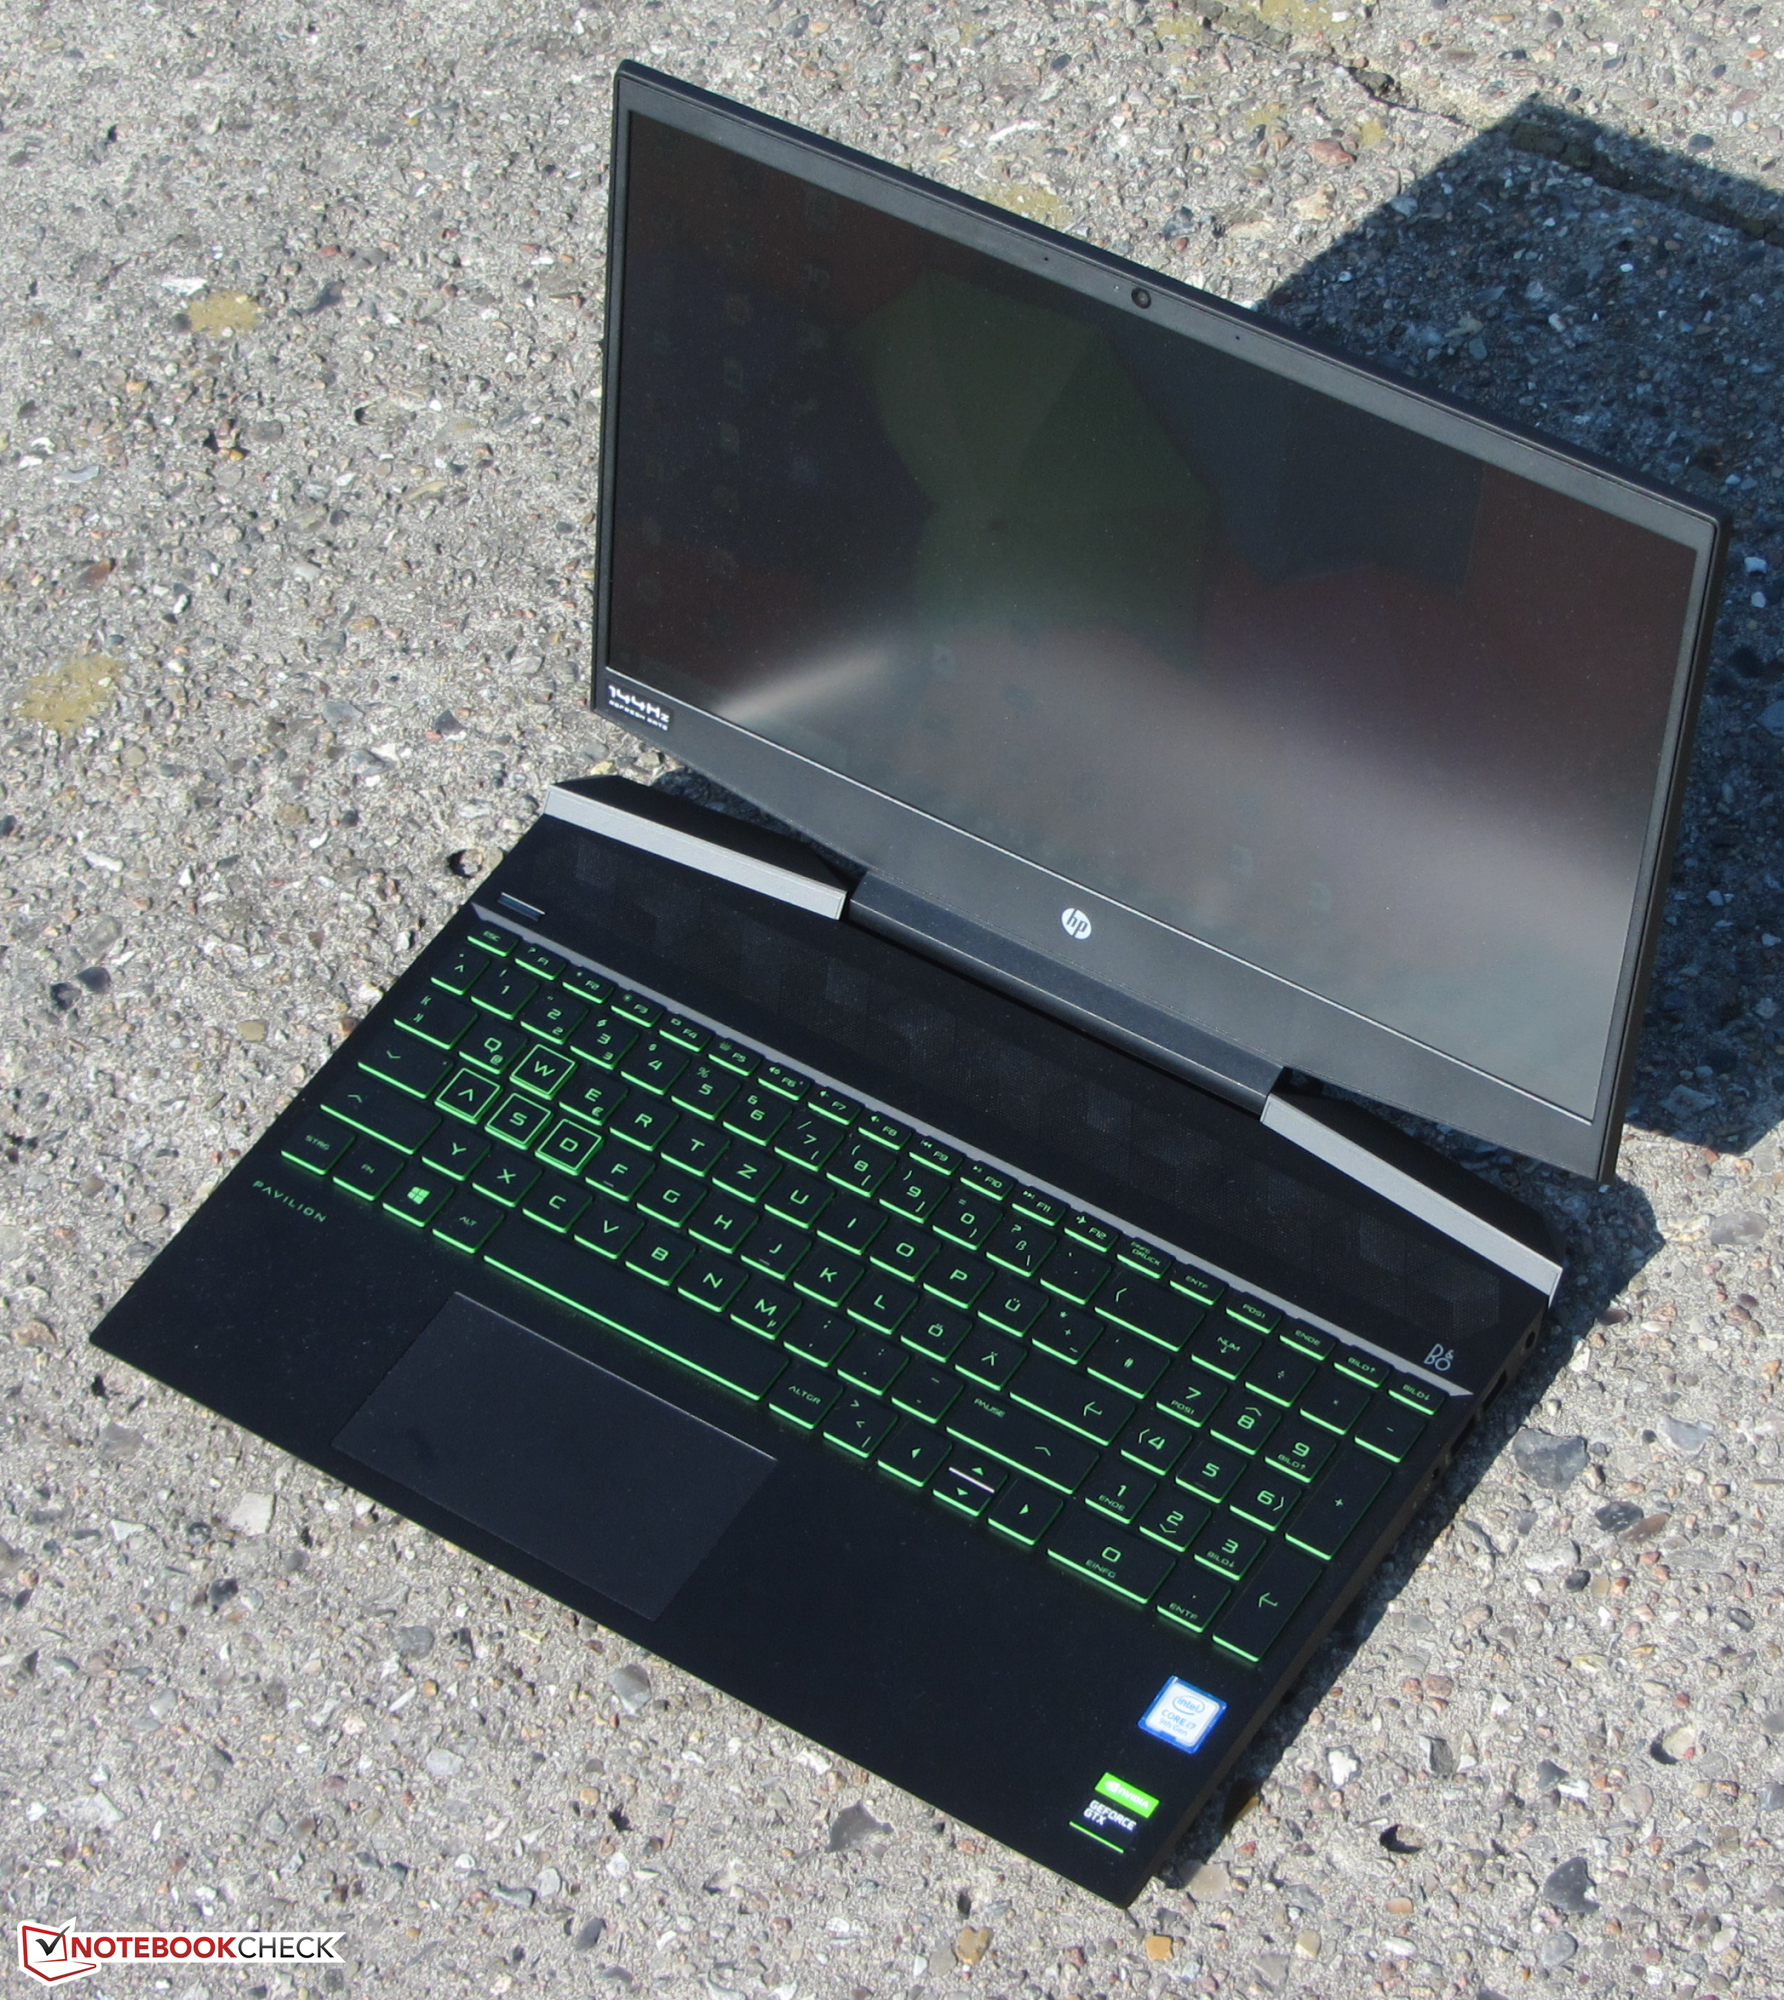
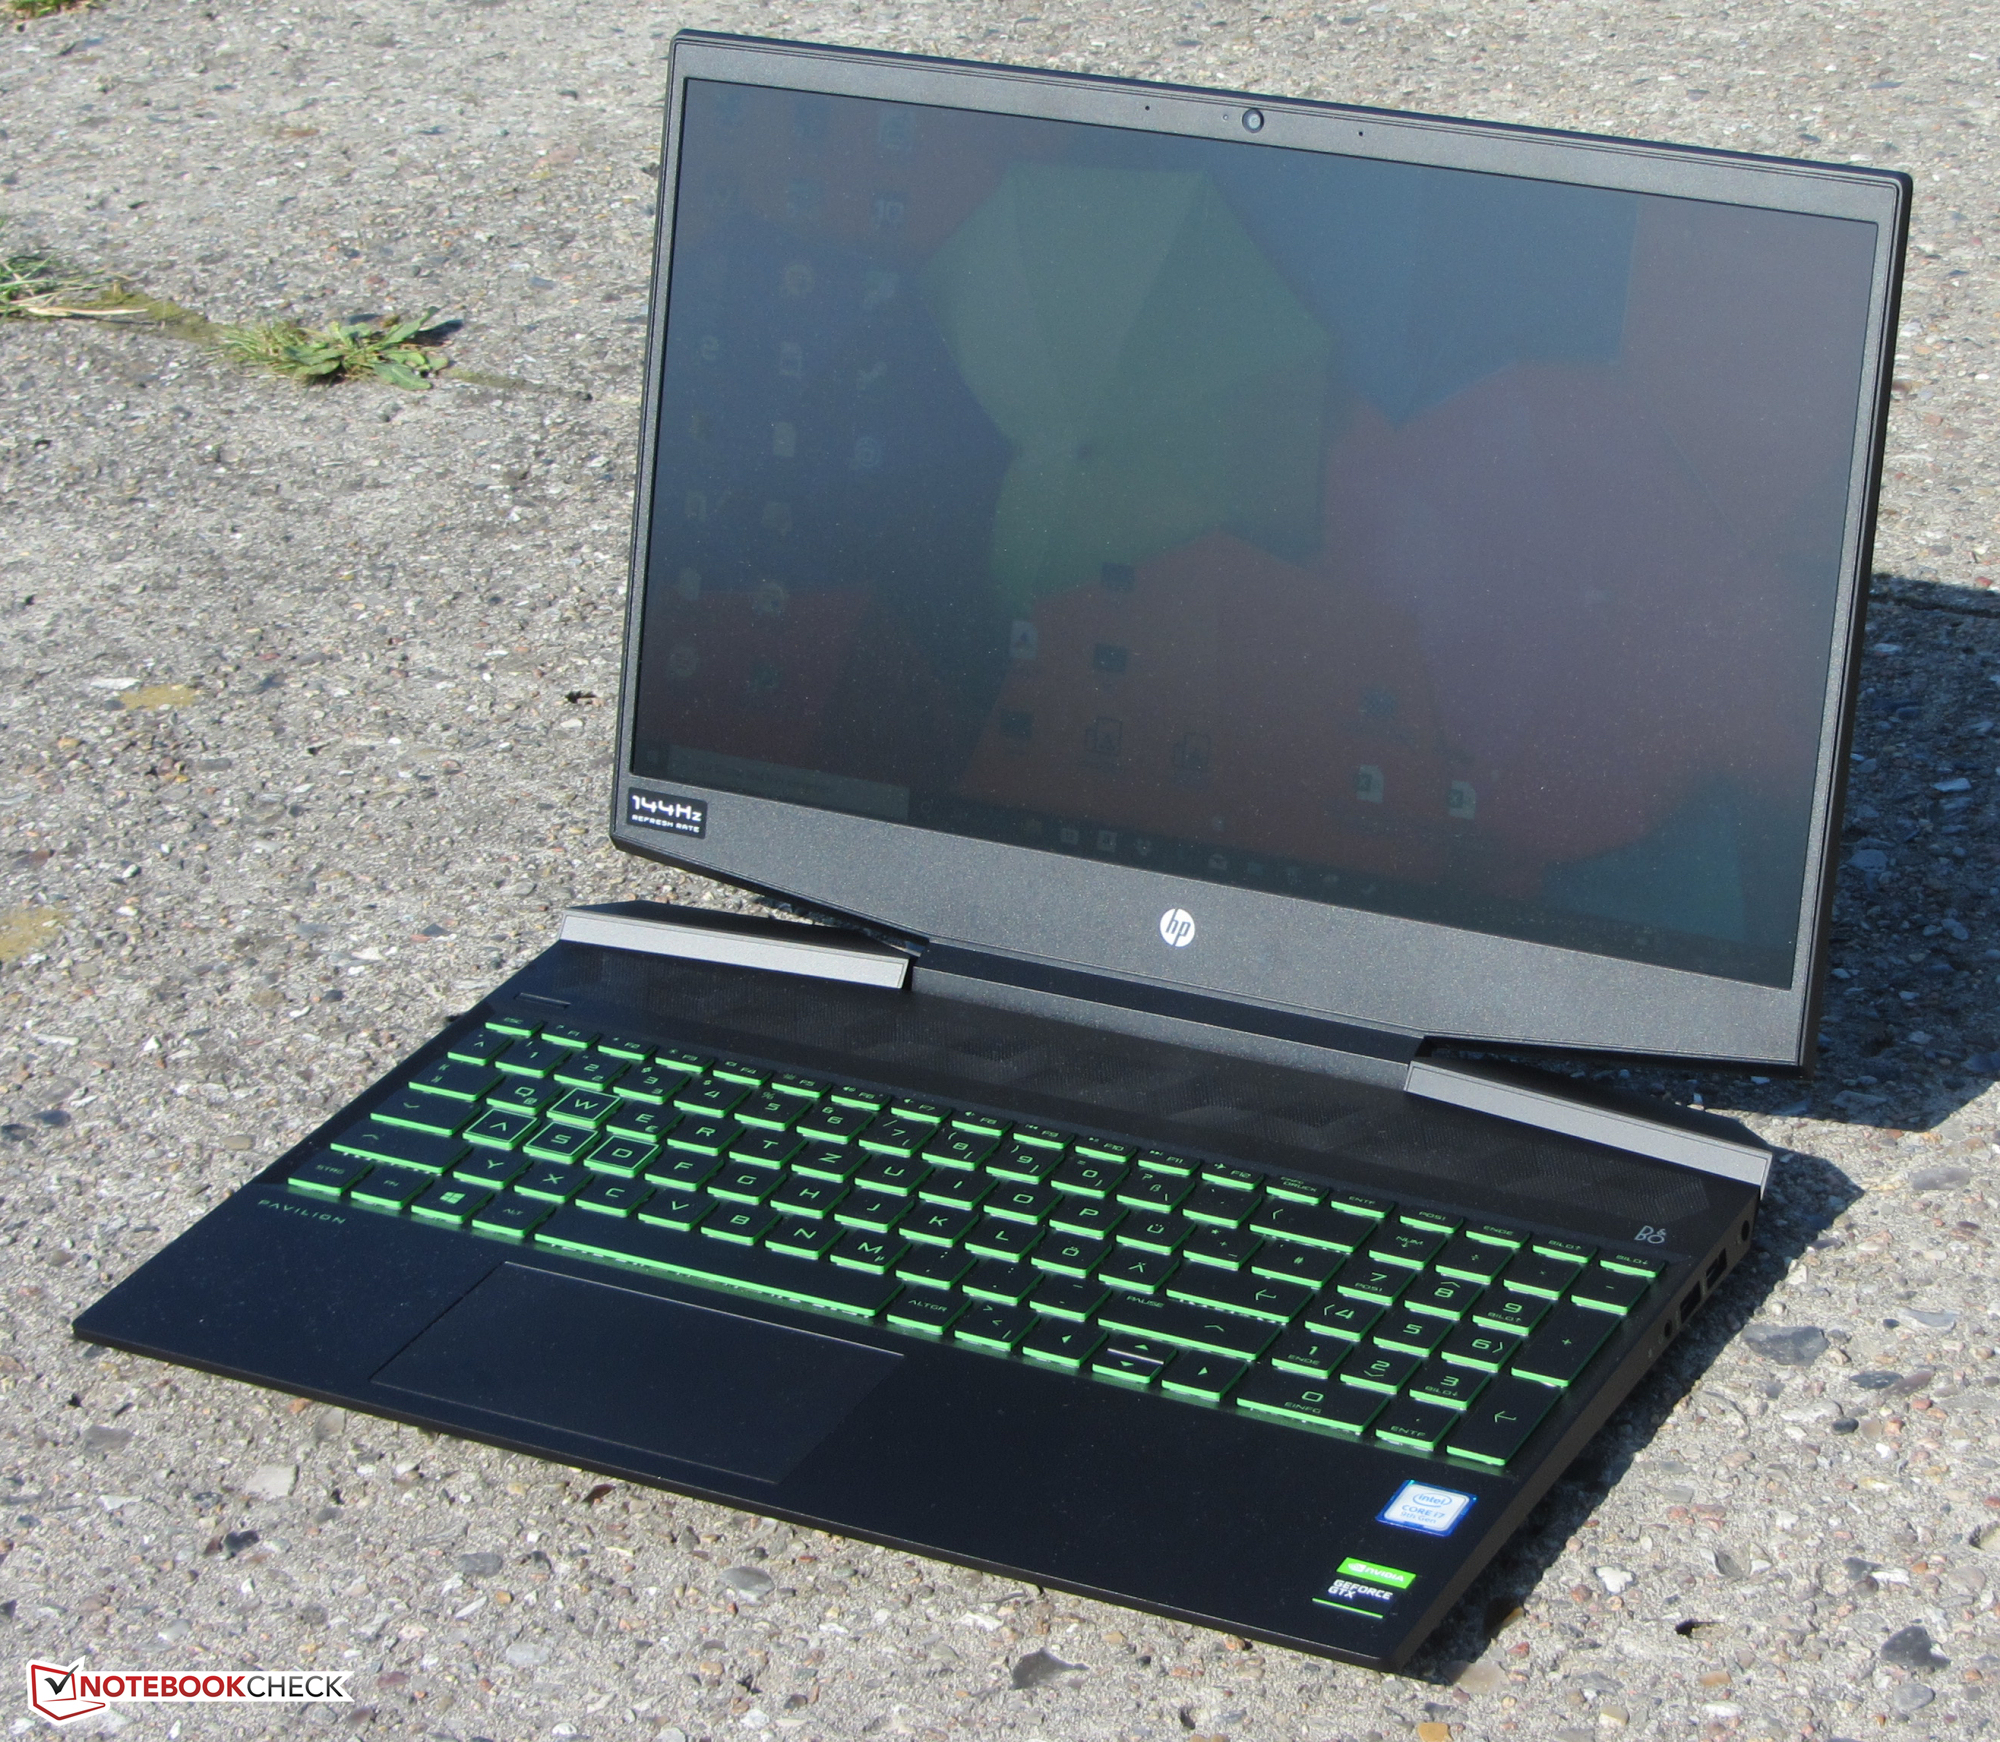
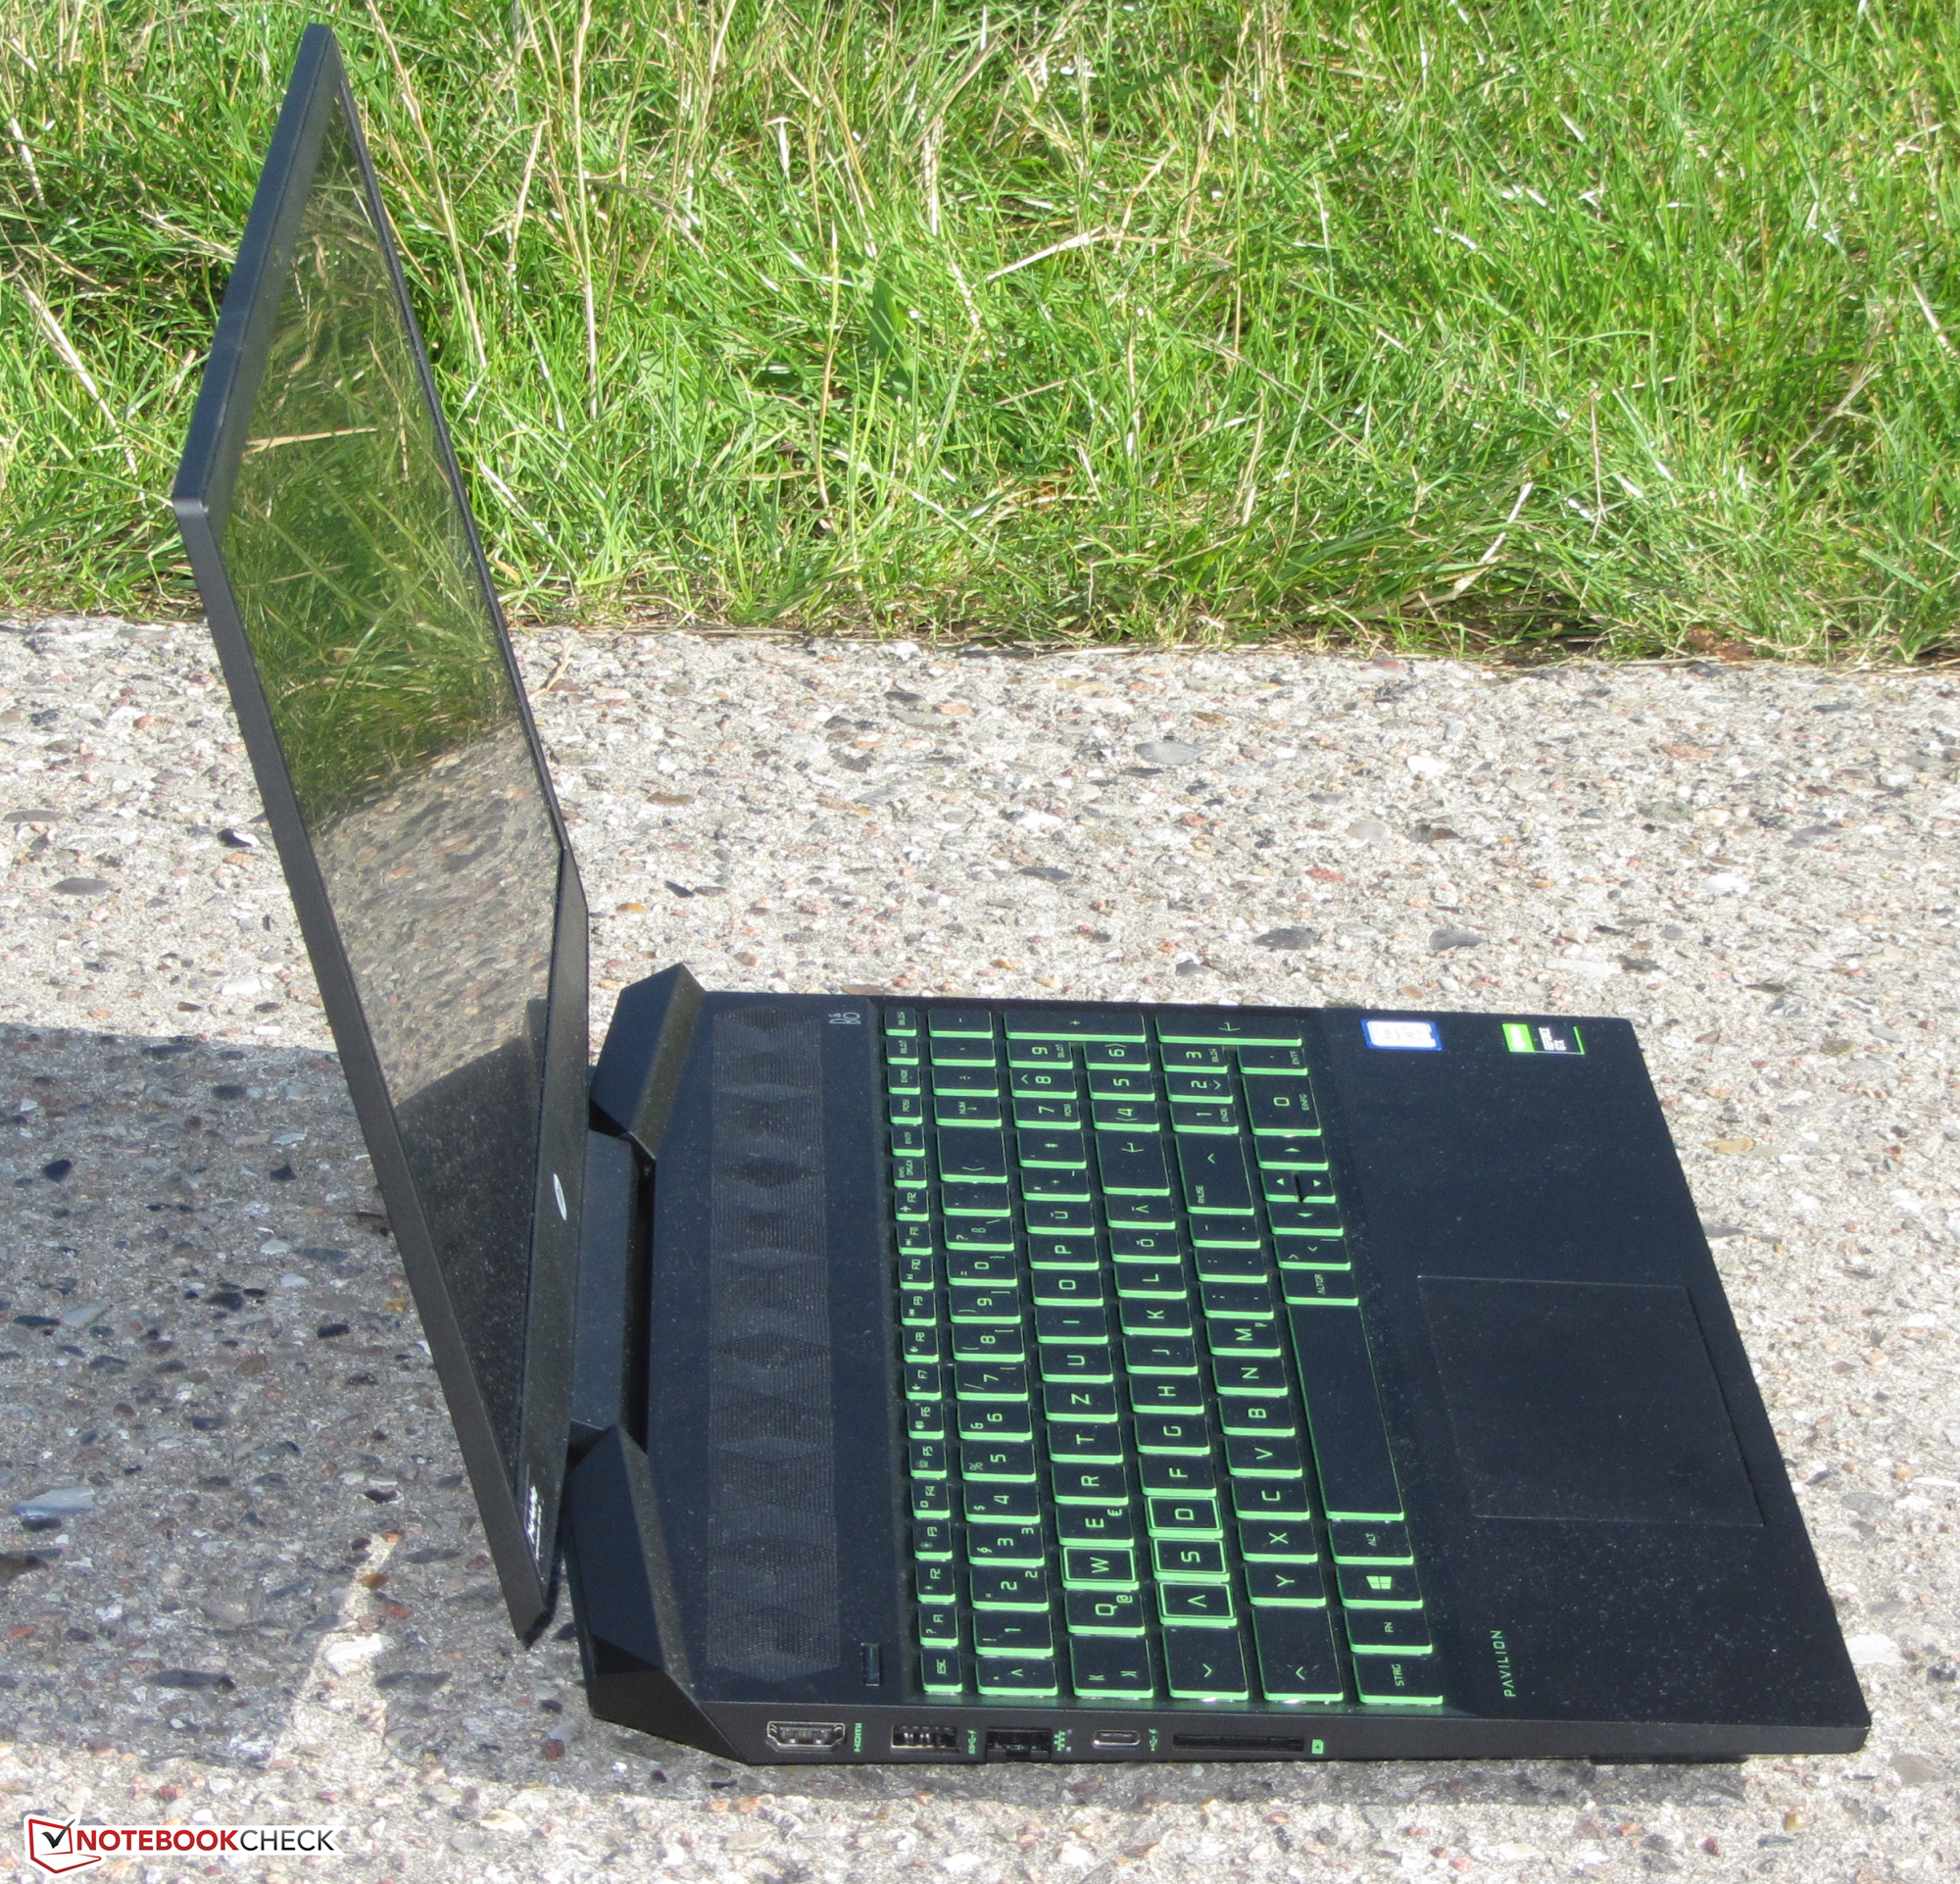
HP Gaming Pavilion 15 gör vad den ska och visar alla moderna AAA-spel smidigt på sin 1080p-skärm på 15.6 tum. Core i7-9750H och GeForce GTX 1660 Ti Max-Q visade sig vara en kraftfull kombination i våra tester och klarar i en del spel av att utnyttja 144 Hz-skärmen även vid maximala grafikinställningar. Gaming Pavilion 15 håller sig jämförelsevis tyst och fläktarna överröstar inte högtalarna när man spelar.
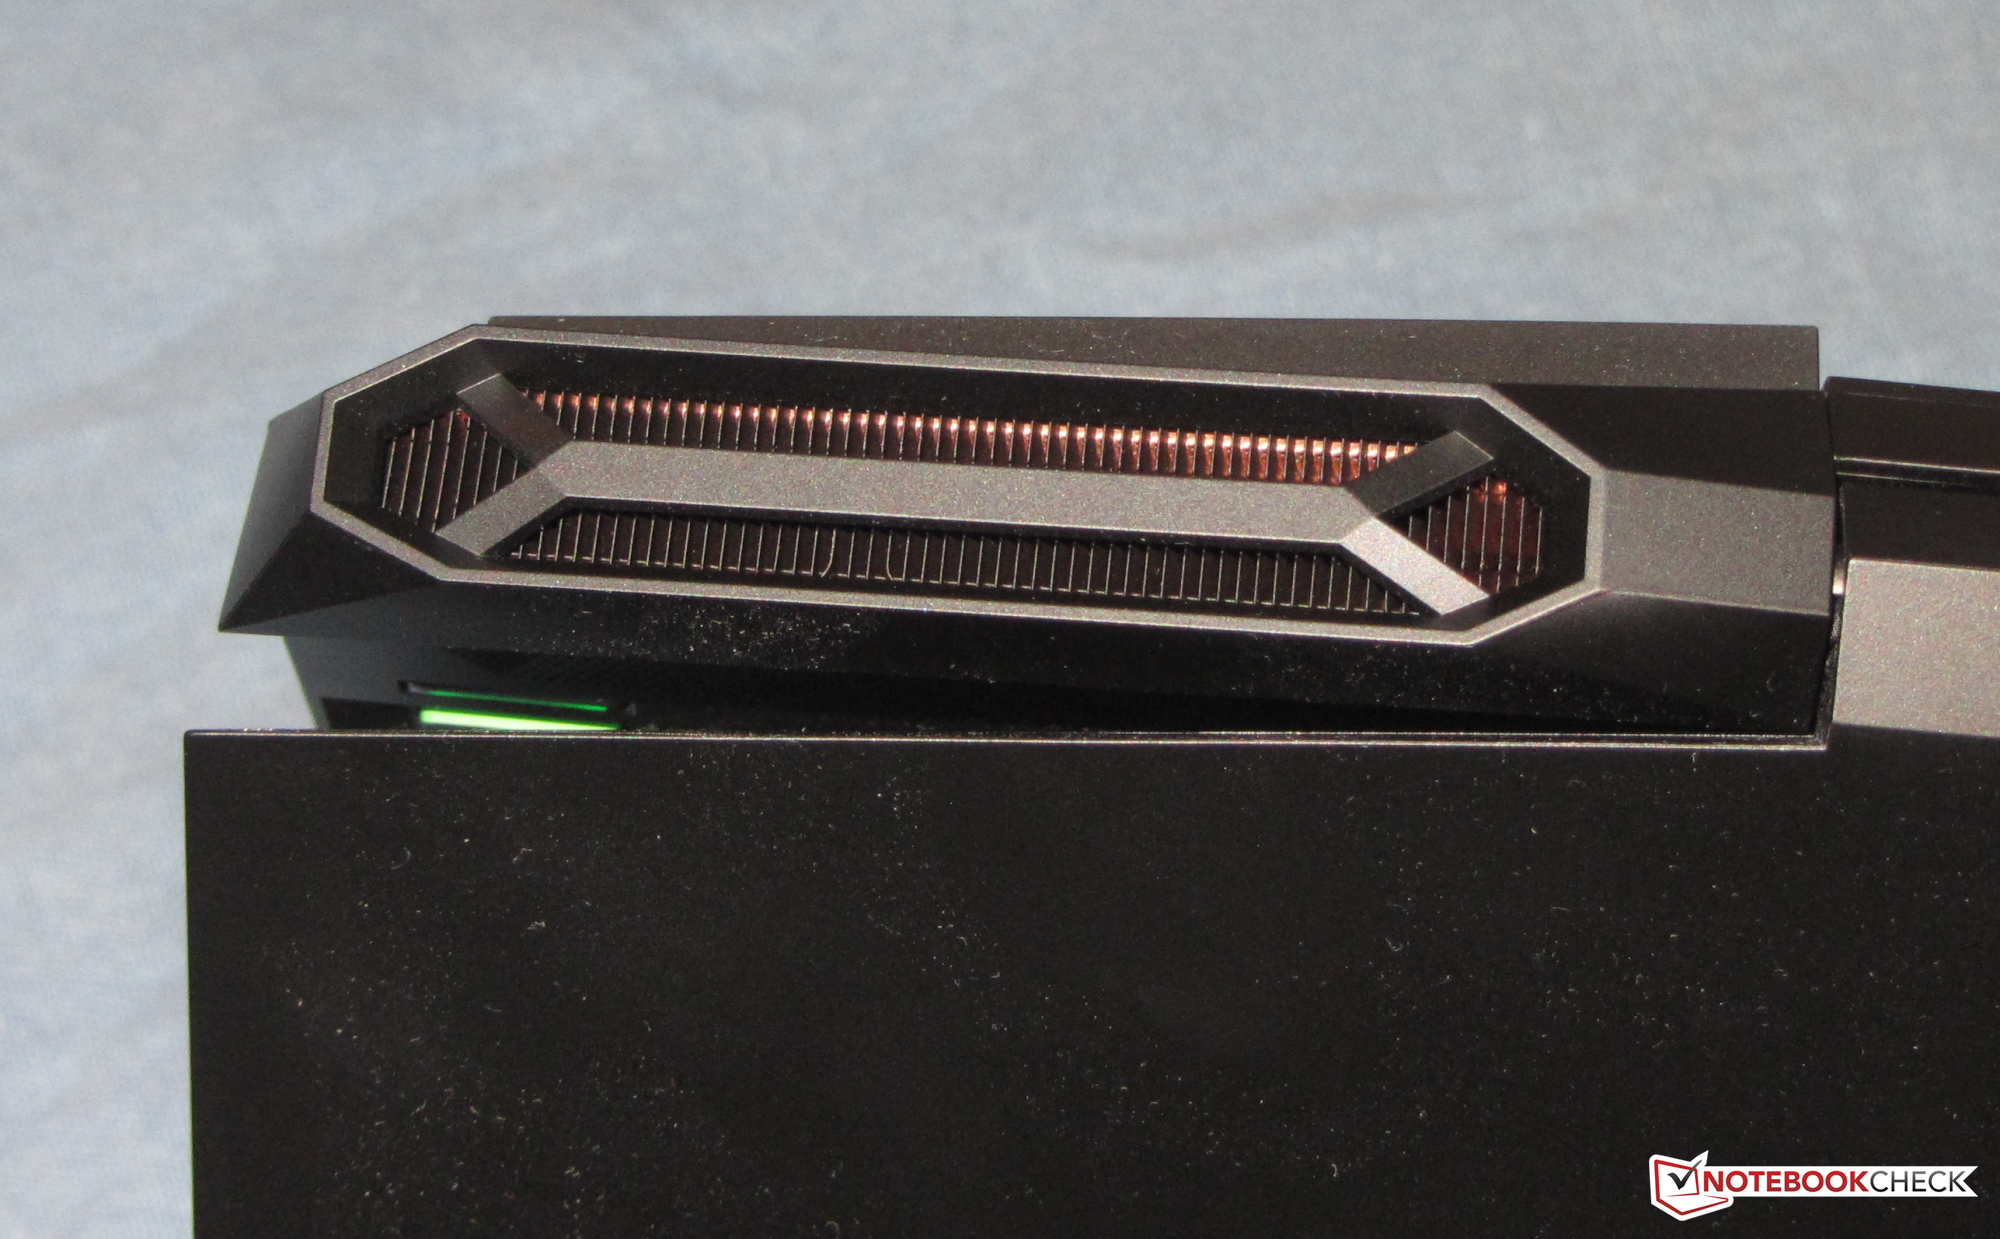
En snabb NVMe SSD-enhet håller dessutom systemet snabbt och smidigt samtidigt som du inte löper risk att bli av med lagringsutrymme tack vare att en HDD på 1 TB ingår. Ännu bättre är att båda enheterna går att byta ut om du vill variera dig, men då behöver du ta bort bottenpanelen.
HP Gaming Pavilion 15 är en skaplig allt-i-allo som inte har särskilt mycket att klaga på.
IPS-skärmen får inte bara poäng för sin bilduppdatering på 144 Hz utan också för korta responstider, stabila betraktningsvinklar, bra maximal ljusstyrka och utmärkt färgprecision. Allt är dock inte positivt då de jämförelsevis höga nivåerna av svärta gör kontrastförhållandet till en besvikelse. Vi förväntar oss mer av en laptop i det här prisskiktet oavsett kategori.
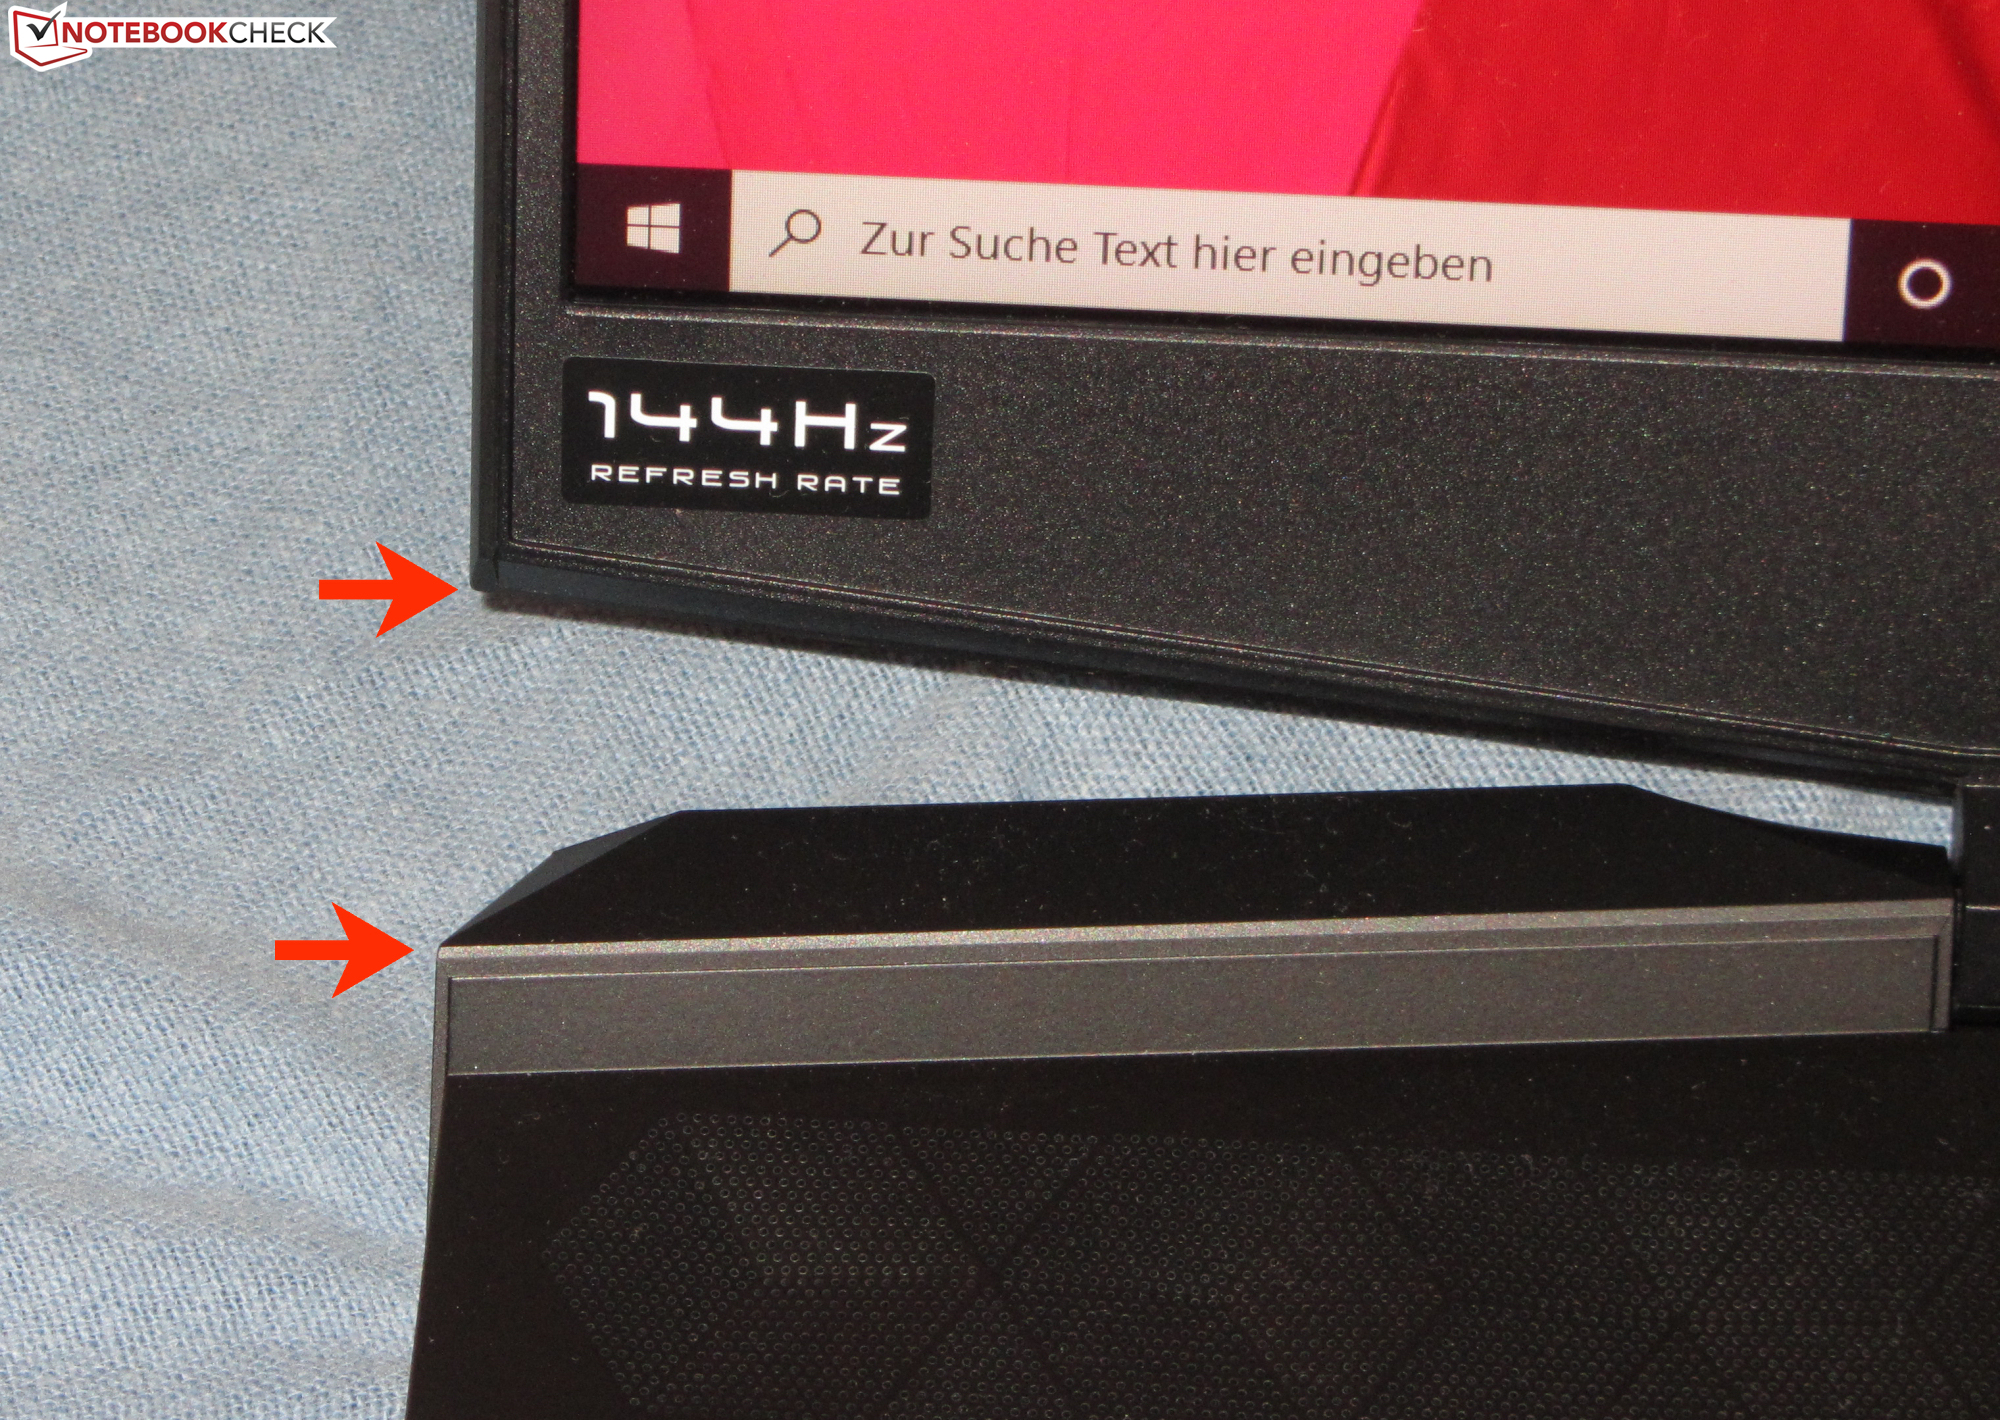
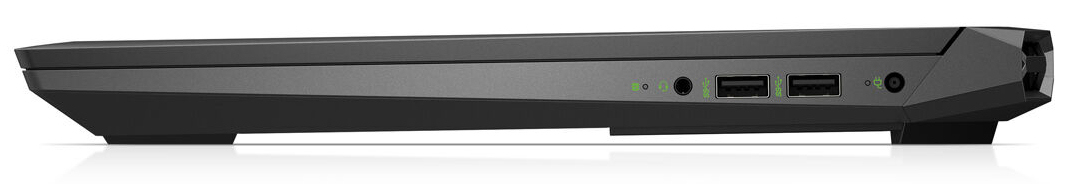
Gaming Pavilion 15 kommer heller inte imponera med sin batteritid utan den står sig bara 4:50 timmar i vårt realistiska WiFi-test. Det är inte särskilt förvånande då batteriet bara har en kapacitet på 52.6 Wh. Andra klagomål är att den saknar Thunderbolt 3, har en instabil skärmram och att garantin bara är på ett år. Men tangentbordet är trevligt att skriva på och det är bra att det är bakgrundsbelyst. HP har också inkluderat massor av portar du kan använda. Totalt sett är Gaming Pavilion 15 prisvärd för 15.000 kronor och det som får den att stå ut mest är de tysta fläktarna.
HP Gaming Pavilion 15-dk0009ng
- 09/20/2019 v7 (old)
Sascha Mölck
Price comparison
