Test: Dell G5 15 5587 (i5-8300H, GTX 1060 Max-Q, SSD, IPS) Laptop (Sammanfattning)

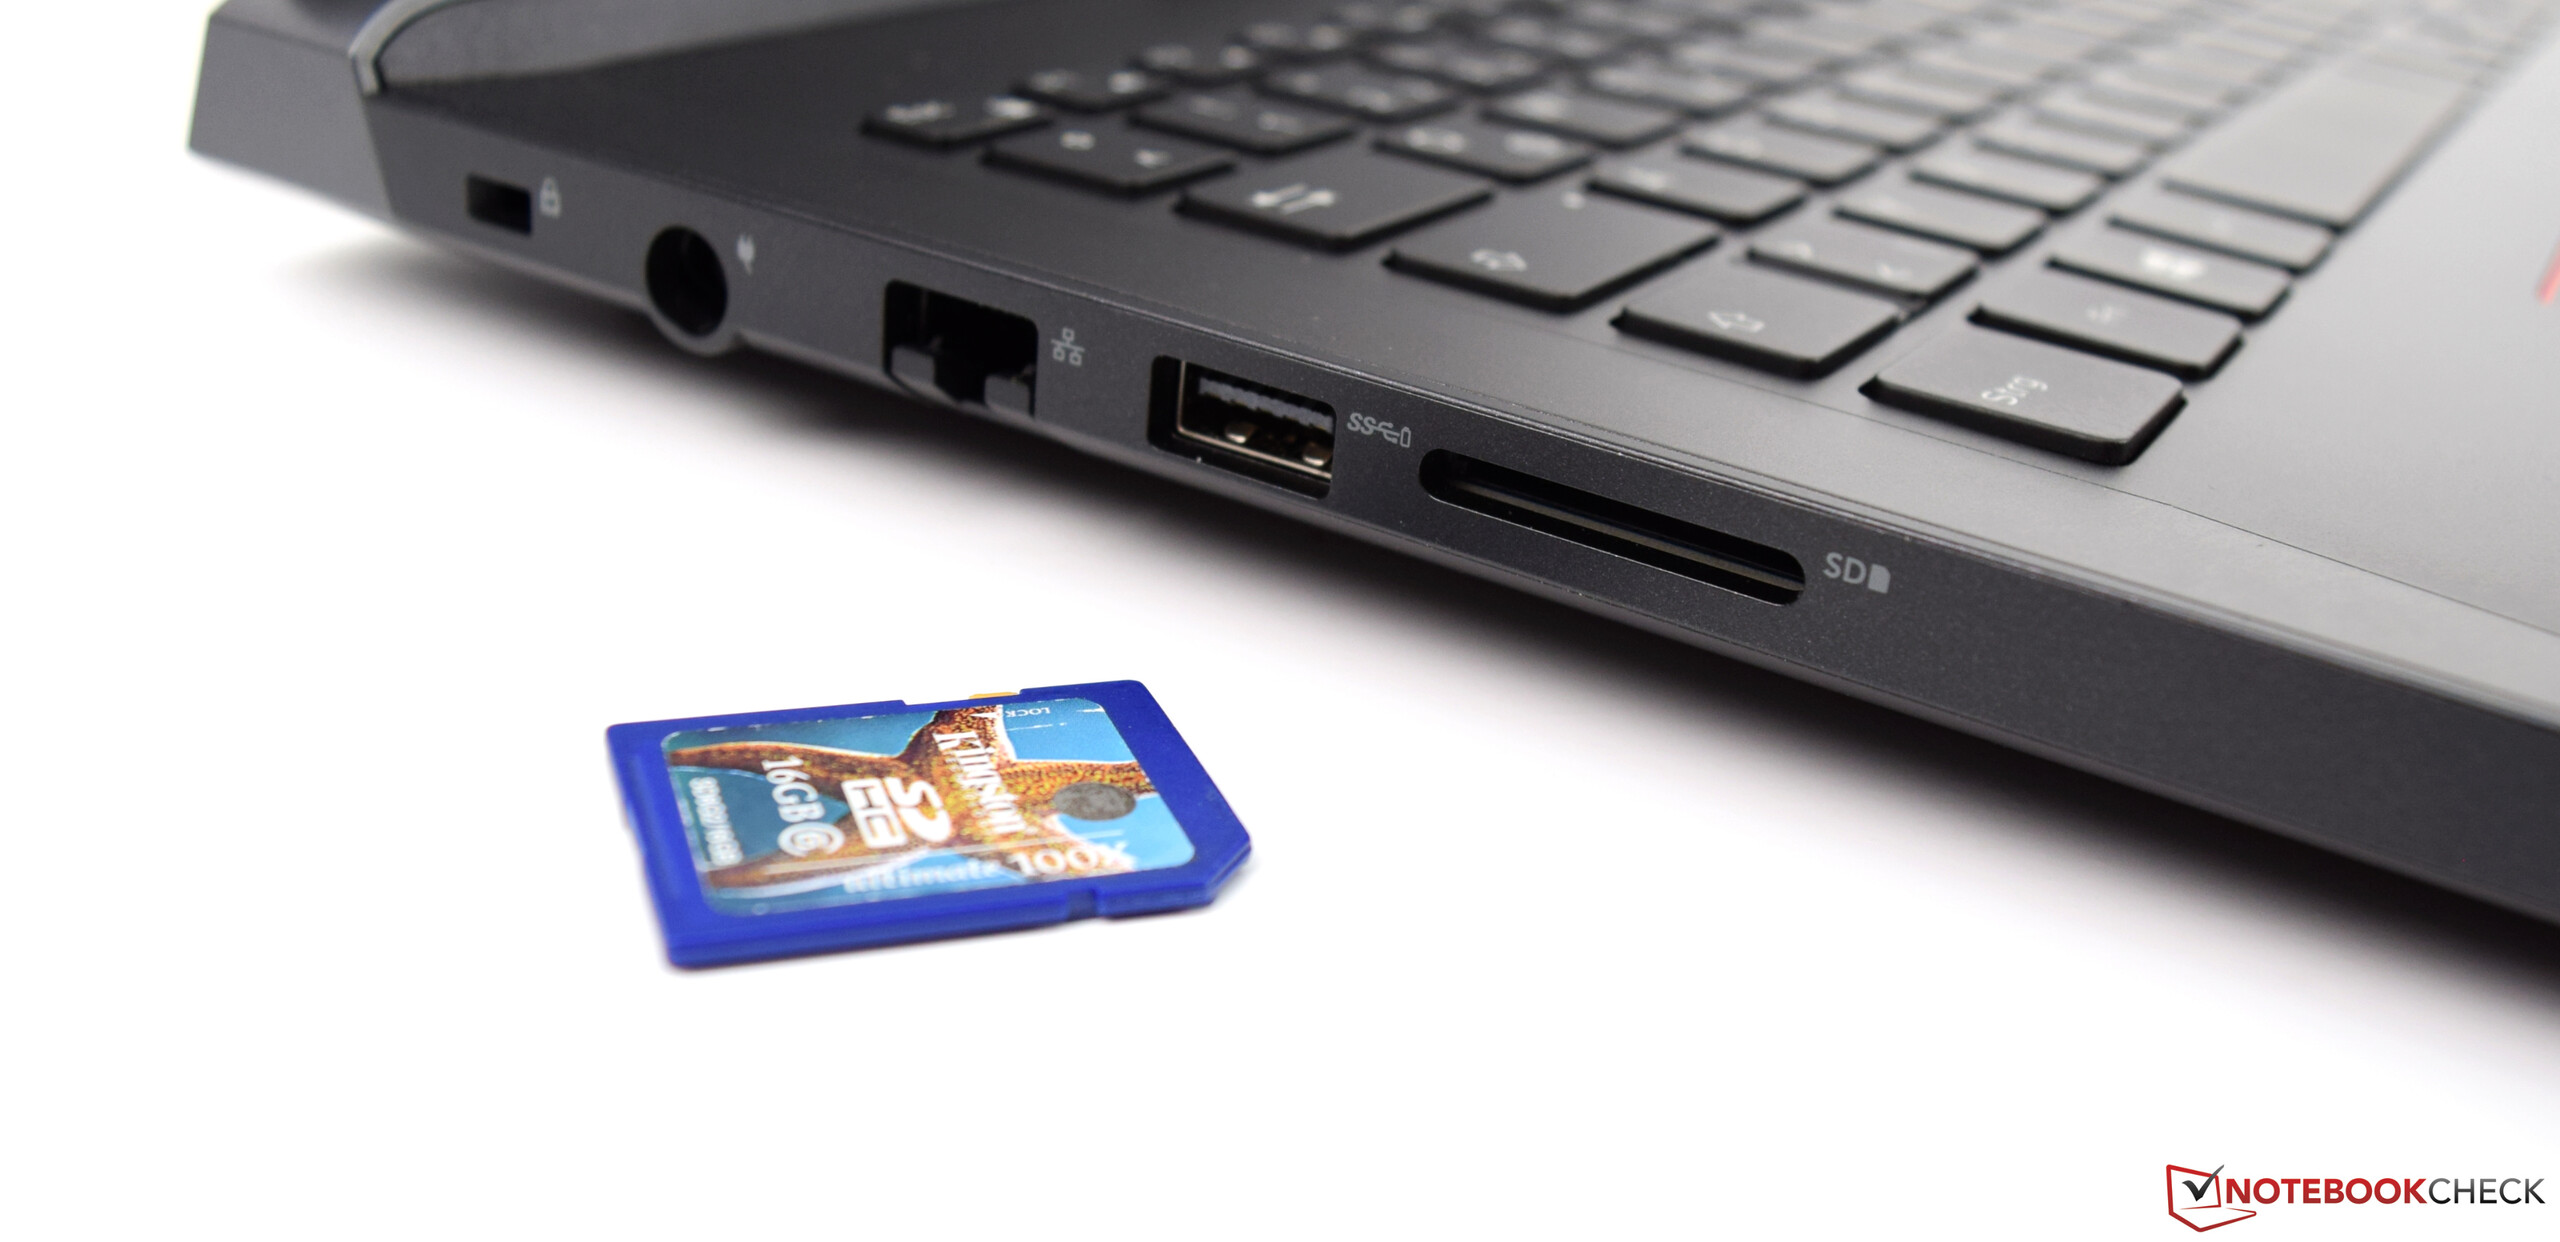
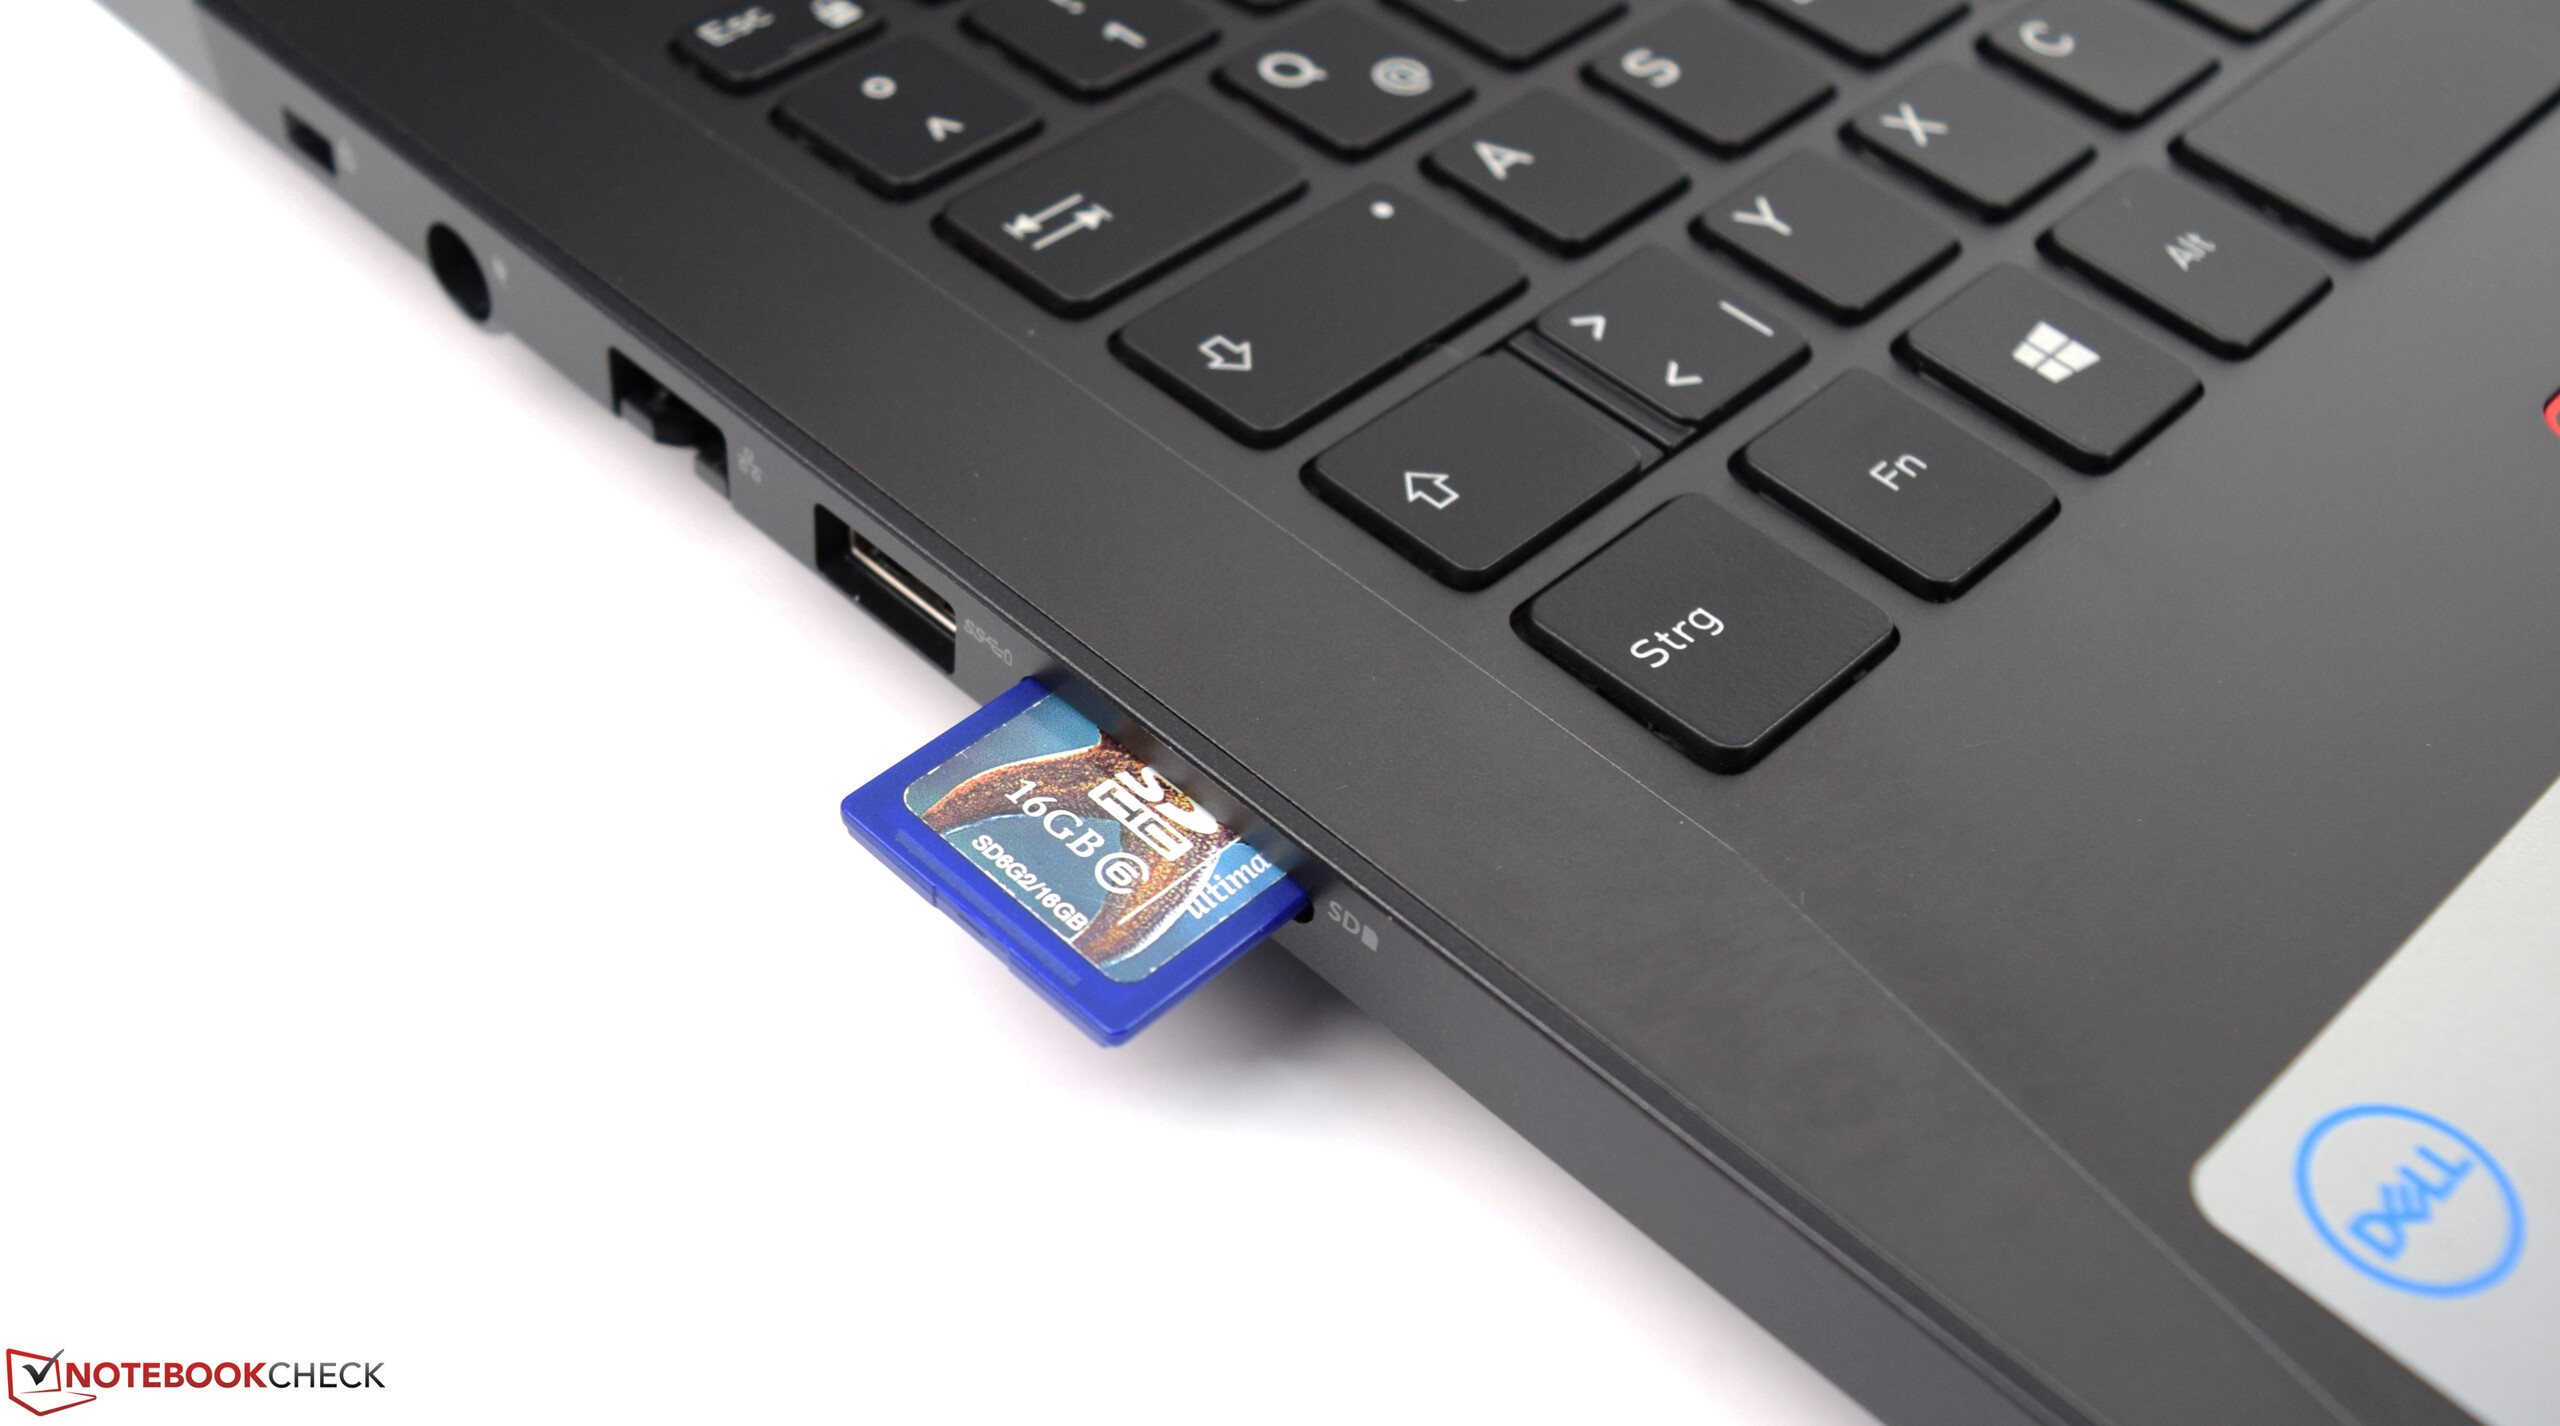
| SD Card Reader | |
| average JPG Copy Test (av. of 3 runs) | |
| Genomsnitt av klass Gaming (20.9 - 210, n=54, senaste 2 åren) | |
| PC Zentrum Proteus V (Toshiba Exceria Pro SDXC 64 GB UHS-II) | |
| Asus FX503VM-EH73 (Toshiba Exceria Pro SDXC 64 GB UHS-II) | |
| Acer Predator Helios 300 PH317-52-51M6 (Toshiba Exceria Pro SDXC 64 GB UHS-II) | |
| Dell Inspiron 15 7000 7577 (Toshiba Exceria Pro SDXC 64 GB UHS-II) | |
| Acer Nitro 5 Spin NP515-51-86CX (Toshiba Exceria Pro SDXC 64 GB UHS-II) | |
| Dell G5 15 5587 (Toshiba Exceria Pro SDXC 64 GB UHS-II) | |
| Dell Inspiron 15 7000 7577 (Toshiba Exceria Pro SDXC 64 GB UHS-II) | |
| maximum AS SSD Seq Read Test (1GB) | |
| Genomsnitt av klass Gaming (25.5 - 261, n=51, senaste 2 åren) | |
| PC Zentrum Proteus V (Toshiba Exceria Pro SDXC 64 GB UHS-II) | |
| Asus FX503VM-EH73 (Toshiba Exceria Pro SDXC 64 GB UHS-II) | |
| Acer Predator Helios 300 PH317-52-51M6 (Toshiba Exceria Pro SDXC 64 GB UHS-II) | |
| Dell G5 15 5587 (Toshiba Exceria Pro SDXC 64 GB UHS-II) | |
| Dell Inspiron 15 7000 7577 (Toshiba Exceria Pro SDXC 64 GB UHS-II) | |
| Dell Inspiron 15 7000 7577 (Toshiba Exceria Pro SDXC 64 GB UHS-II) | |
| Acer Nitro 5 Spin NP515-51-86CX (Toshiba Exceria Pro SDXC 64 GB UHS-II) | |
| |||||||||||||||||||||||||
Distribution av ljusstyrkan: 87 %
Mitt på batteriet: 229 cd/m²
Kontrast: 818:1 (Svärta: 0.28 cd/m²)
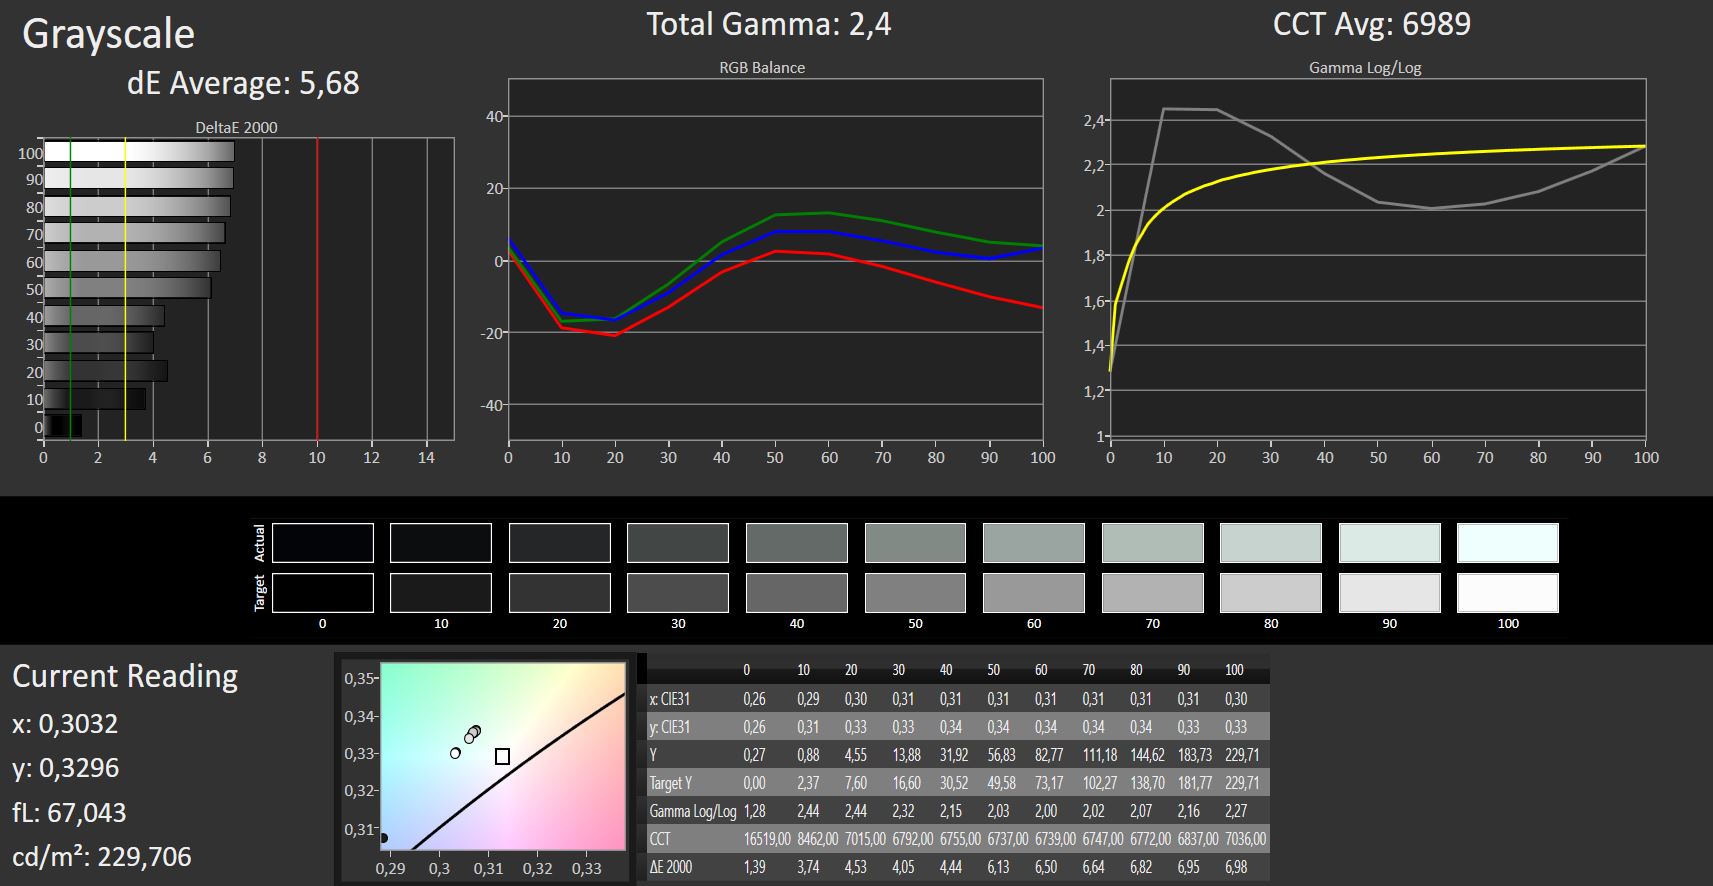
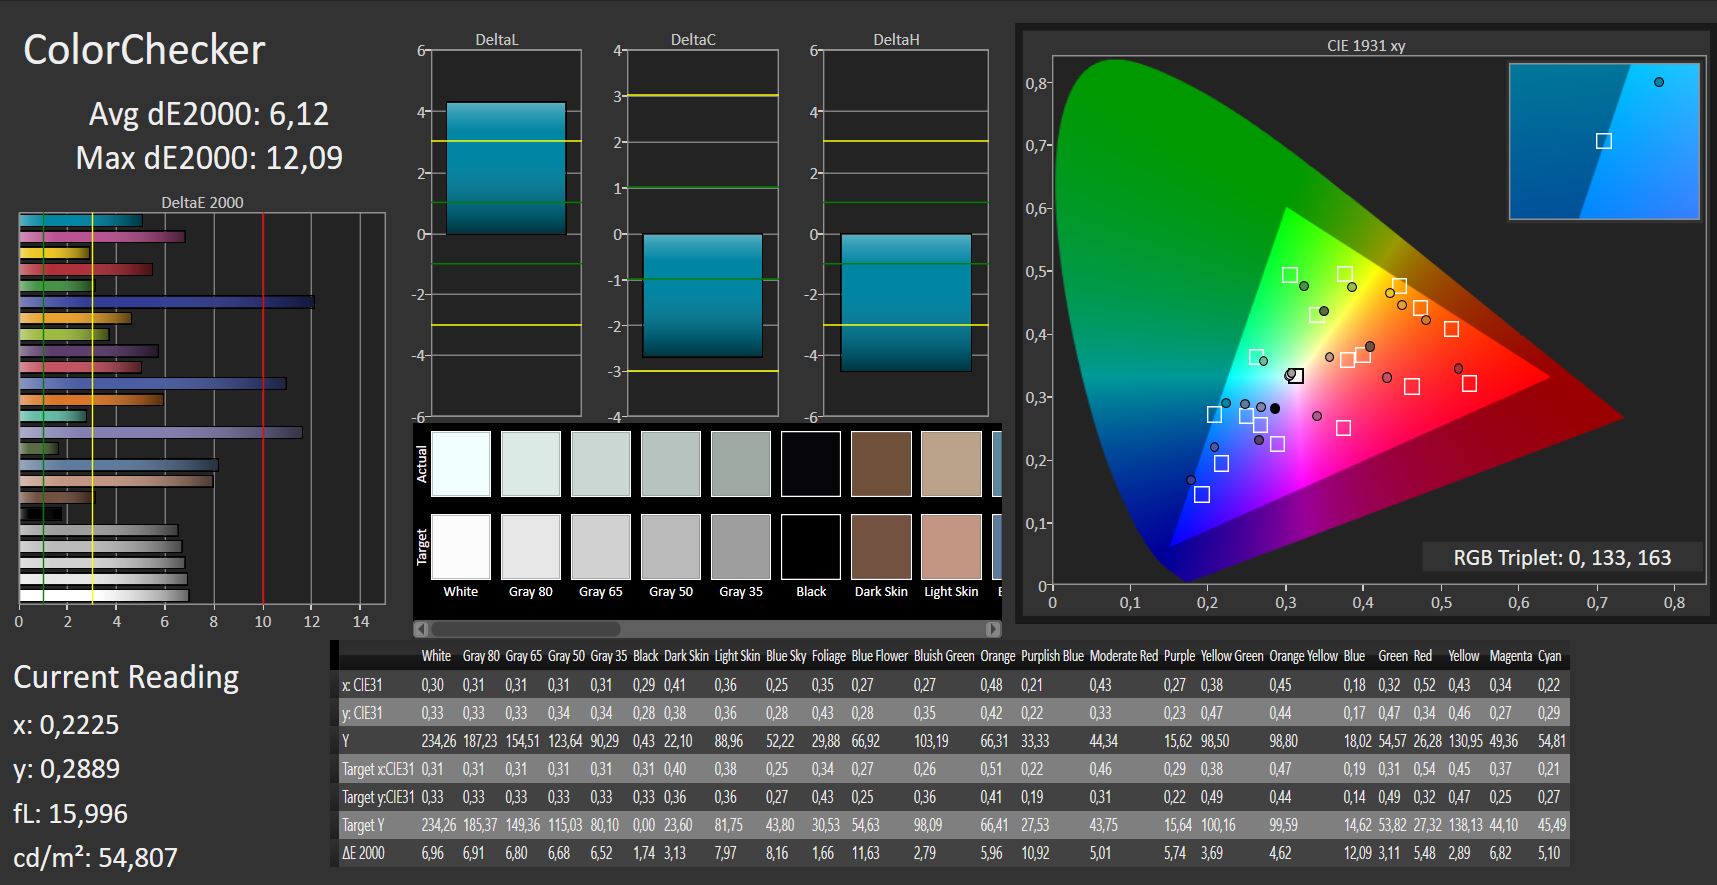
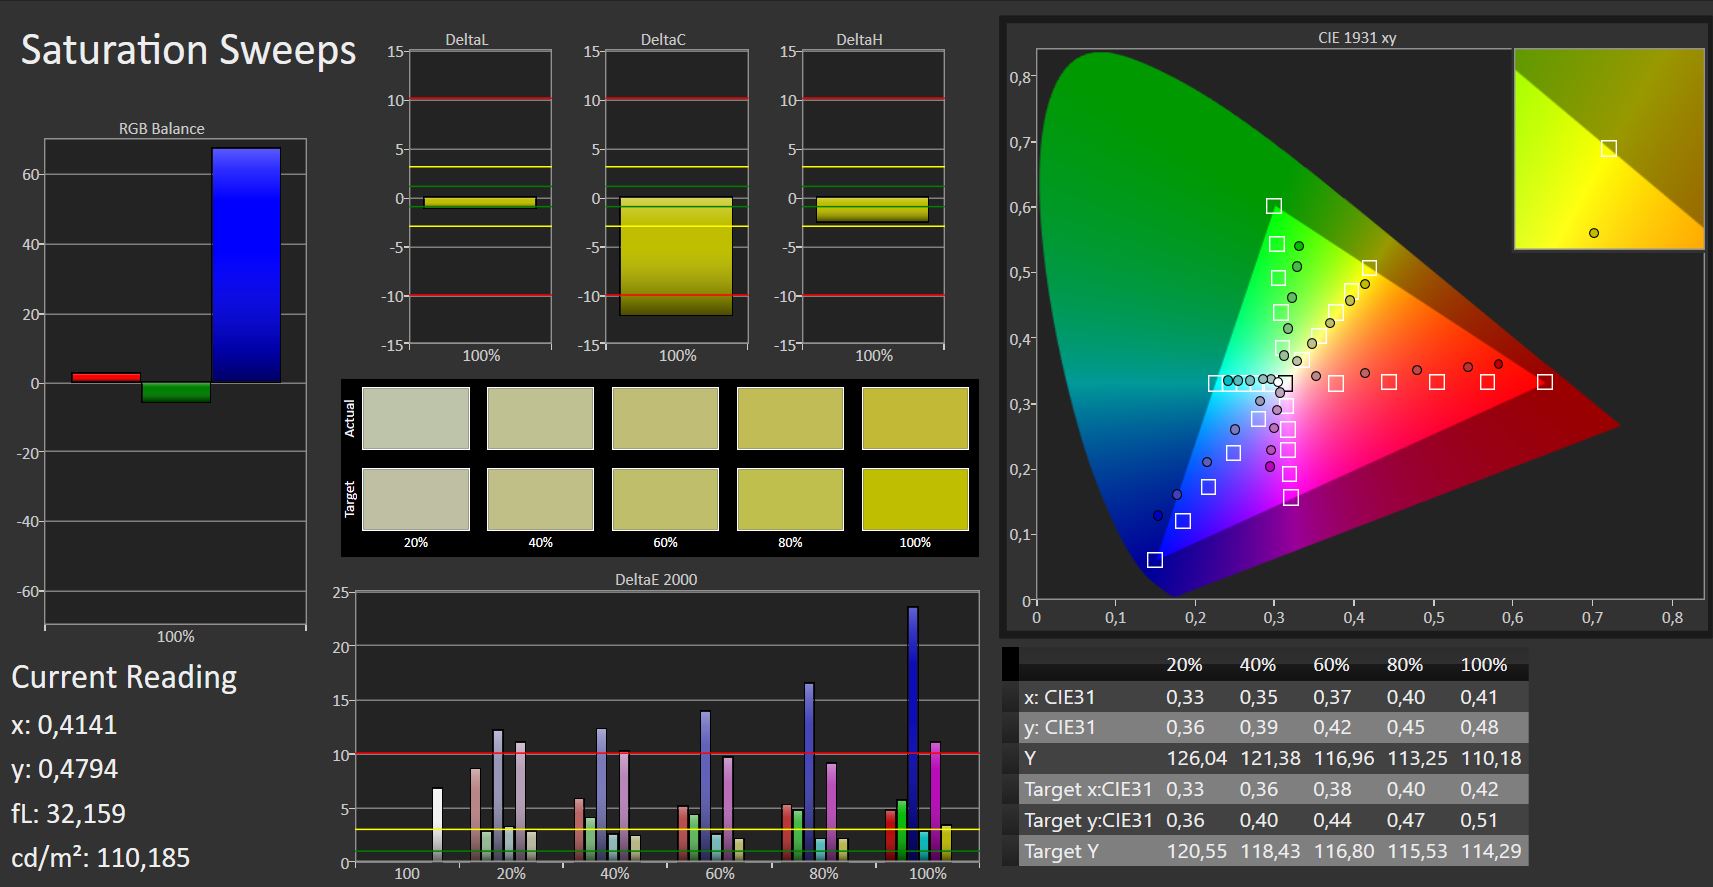
ΔE ColorChecker Calman: 6.1 | ∀{0.5-29.43 Ø4.71}
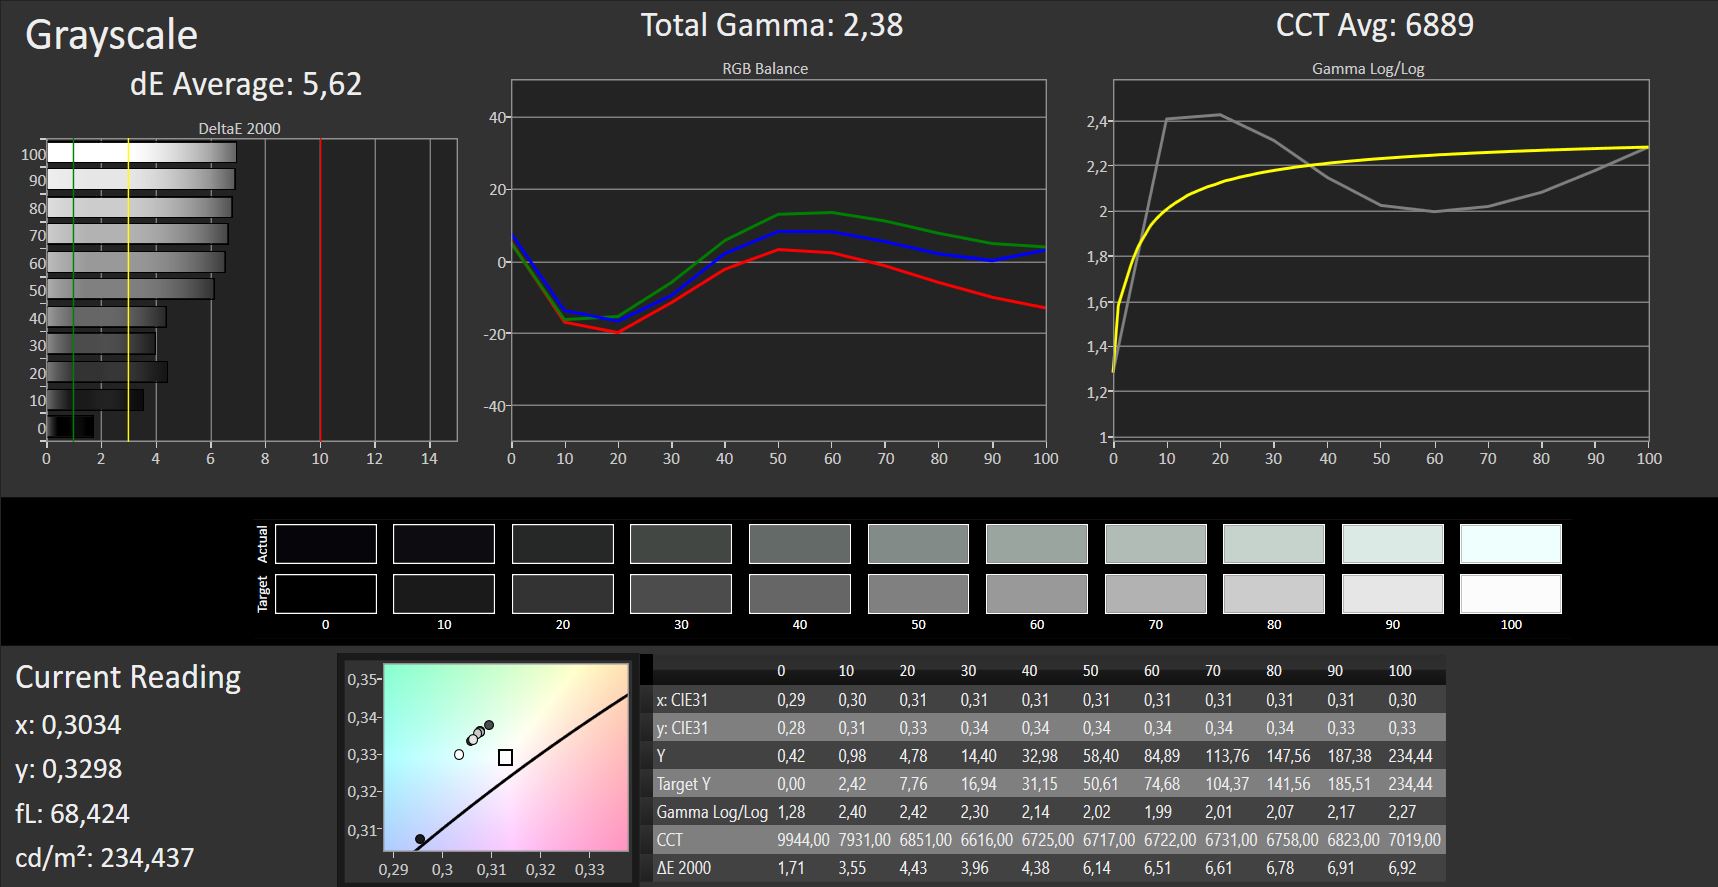
calibrated: 6.12
ΔE Greyscale Calman: 5.68 | ∀{0.09-98 Ø4.96}
57% sRGB (Argyll 1.6.3 3D)
36% AdobeRGB 1998 (Argyll 1.6.3 3D)
39.47% AdobeRGB 1998 (Argyll 3D)
56.8% sRGB (Argyll 3D)
38.13% Display P3 (Argyll 3D)
Gamma: 2.4
CCT: 6989 K
| Dell G5 15 5587 LGD053F, 156WF6, 1920x1080, 15.6" | Dell Inspiron 15 7000 7577 ID: LG Philips LGD053F, Name: 156WF6, Dell P/N: 4XK13, 1920x1080, 15.6" | Dell Inspiron 15 7000 7577 ID: LG Philips LGD053F, Name: 156WF6, Dell P/N: 4XK13, 1920x1080, 15.6" | PC Zentrum Proteus V BOEhydis NV156FHM-N42 (BOE06C6), 1920x1080, 15.6" | Asus FX503VM-EH73 AU Optronics B156HAN06.1, 1920x1080, 15.6" | Acer Nitro 5 Spin NP515-51-86CX Chi Mei CMN15D7, 1920x1080, 15.6" | Acer Predator Helios 300 PH317-52-51M6 LG Philips LP173WF4-SPF5 (LGD056D), 1920x1080, 17.3" | |
|---|---|---|---|---|---|---|---|
| Display | 6% | -3% | 2% | -2% | 67% | 63% | |
| Display P3 Coverage (%) | 38.13 | 40.4 6% | 37.07 -3% | 39.13 3% | 37.48 -2% | 64.9 70% | 67.1 76% |
| sRGB Coverage (%) | 56.8 | 60.5 7% | 55.6 -2% | 58 2% | 56.3 -1% | 92.6 63% | 86.1 52% |
| AdobeRGB 1998 Coverage (%) | 39.47 | 41.77 6% | 38.32 -3% | 40.42 2% | 38.72 -2% | 66.3 68% | 63 60% |
| Response Times | -21% | -12% | -63% | -22% | -9% | -1% | |
| Response Time Grey 50% / Grey 80% * (ms) | 33 ? | 41 ? -24% | 35.6 ? -8% | 52.8 ? -60% | 36.8 ? -12% | 36 ? -9% | 36 ? -9% |
| Response Time Black / White * (ms) | 24 ? | 28 ? -17% | 27.6 ? -15% | 39.6 ? -65% | 31.6 ? -32% | 26 ? -8% | 22 ? 8% |
| PWM Frequency (Hz) | 21930 ? | 122000 ? | |||||
| Screen | 19% | -2% | 21% | 1% | 25% | 23% | |
| Brightness middle (cd/m²) | 229 | 257 12% | 235.4 3% | 242 6% | 235.9 3% | 345 51% | 365 59% |
| Brightness (cd/m²) | 224 | 229 2% | 223 0% | 235 5% | 235 5% | 332 48% | 341 52% |
| Brightness Distribution (%) | 87 | 84 -3% | 91 5% | 85 -2% | 91 5% | 92 6% | 89 2% |
| Black Level * (cd/m²) | 0.28 | 0.17 39% | 0.28 -0% | 0.21 25% | 0.27 4% | 0.28 -0% | 0.32 -14% |
| Contrast (:1) | 818 | 1512 85% | 841 3% | 1152 41% | 874 7% | 1232 51% | 1141 39% |
| Colorchecker dE 2000 * | 6.1 | 5.34 12% | 5.6 8% | 4.27 30% | 4.81 21% | 5.85 4% | 6.51 -7% |
| Colorchecker dE 2000 max. * | 12.2 | 9.99 18% | 20.3 -66% | 7.09 42% | 21.55 -77% | 11.87 3% | 12.32 -1% |
| Colorchecker dE 2000 calibrated * | 6.12 | 2.9 53% | |||||
| Greyscale dE 2000 * | 5.68 | 4.82 15% | 3.6 37% | 2.17 62% | 3.1 45% | 8.11 -43% | 7.65 -35% |
| Gamma | 2.4 92% | 2.46 89% | 2.23 99% | 2.38 92% | 2.31 95% | 2.48 89% | 2.64 83% |
| CCT | 6989 93% | 6587 99% | 7214 90% | 6912 94% | 6984 93% | 6741 96% | 8066 81% |
| Color Space (Percent of AdobeRGB 1998) (%) | 36 | 38 6% | 35.2 -2% | 37 3% | 36 0% | 60 67% | 56 56% |
| Color Space (Percent of sRGB) (%) | 57 | 60 5% | 55.4 -3% | 58 2% | 56 -2% | 93 63% | 86 51% |
| Totalt genomsnitt (program/inställningar) | 1% /
11% | -6% /
-3% | -13% /
6% | -8% /
-3% | 28% /
29% | 28% /
28% |
* ... mindre är bättre


Visa svarstider
| ↔ Svarstid svart till vitt | ||
|---|---|---|
| 24 ms ... stiga ↗ och falla ↘ kombinerat | ↗ 14 ms stiga | 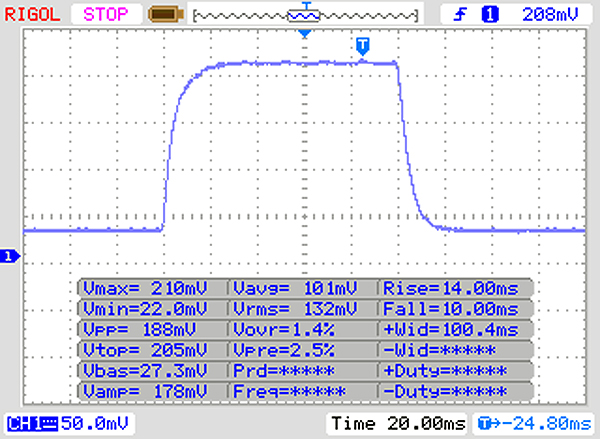 |
| ↘ 10 ms hösten | ||
| Skärmen visar bra svarsfrekvens i våra tester, men kan vara för långsam för konkurrenskraftiga spelare. I jämförelse sträcker sig alla testade enheter från 0.1 (minst) till 240 (maximalt) ms. » 54 % av alla enheter är bättre. Detta innebär att den uppmätta svarstiden är sämre än genomsnittet av alla testade enheter (19.8 ms). | ||
| ↔ Svarstid 50 % grått till 80 % grått | ||
| 33 ms ... stiga ↗ och falla ↘ kombinerat | ↗ 16 ms stiga | 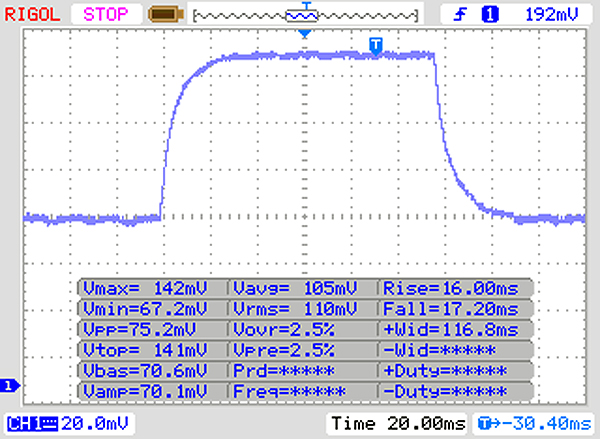 |
| ↘ 17 ms hösten | ||
| Skärmen visar långsamma svarsfrekvenser i våra tester och kommer att vara otillfredsställande för spelare. I jämförelse sträcker sig alla testade enheter från 0.165 (minst) till 636 (maximalt) ms. » 45 % av alla enheter är bättre. Det betyder att den uppmätta svarstiden liknar genomsnittet av alla testade enheter (31 ms). | ||
Skärmflimmer / PWM (Puls-Width Modulation)
| Skärmflimmer / PWM upptäcktes inte | 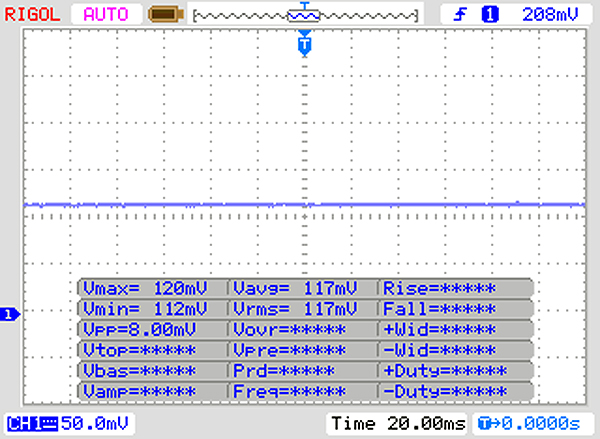 | ||
Som jämförelse: 52 % av alla testade enheter använder inte PWM för att dämpa skärmen. Om PWM upptäcktes mättes ett medelvärde av 7754 (minst: 5 - maximum: 343500) Hz. | |||
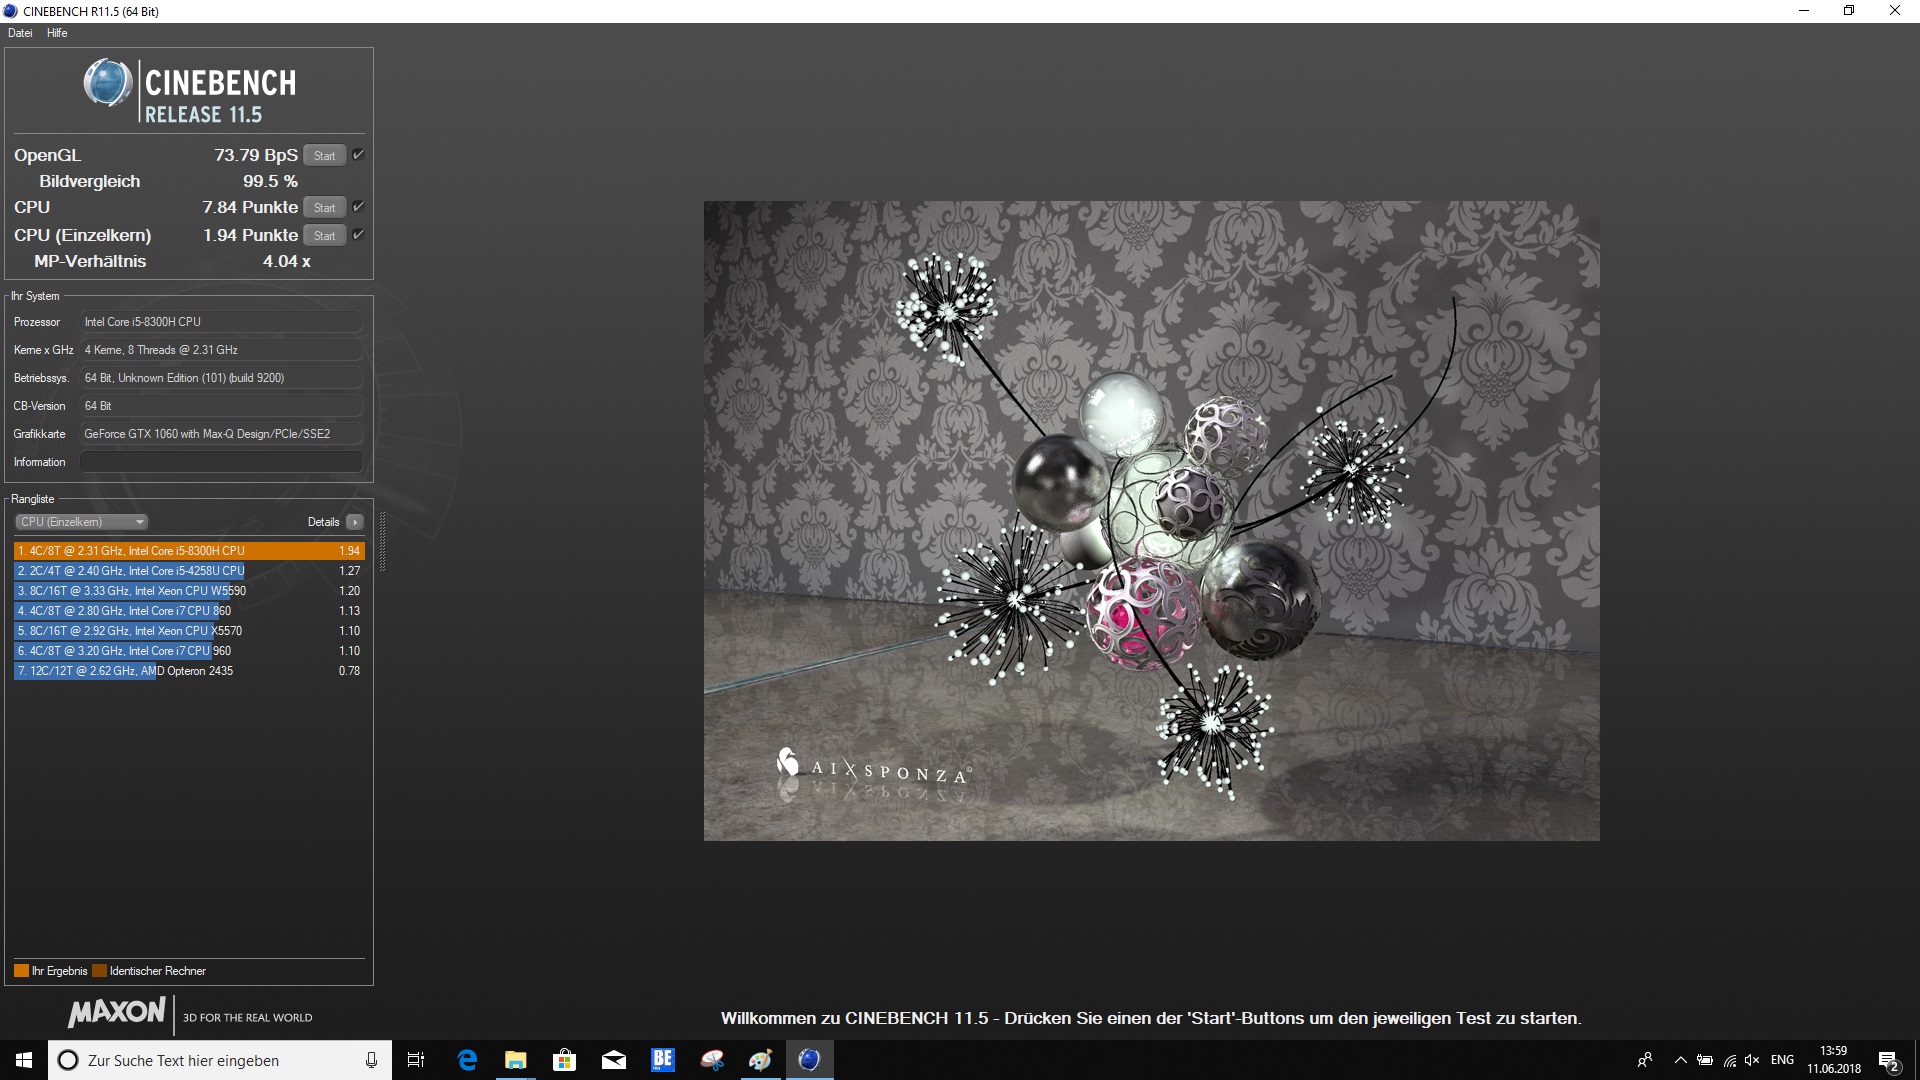
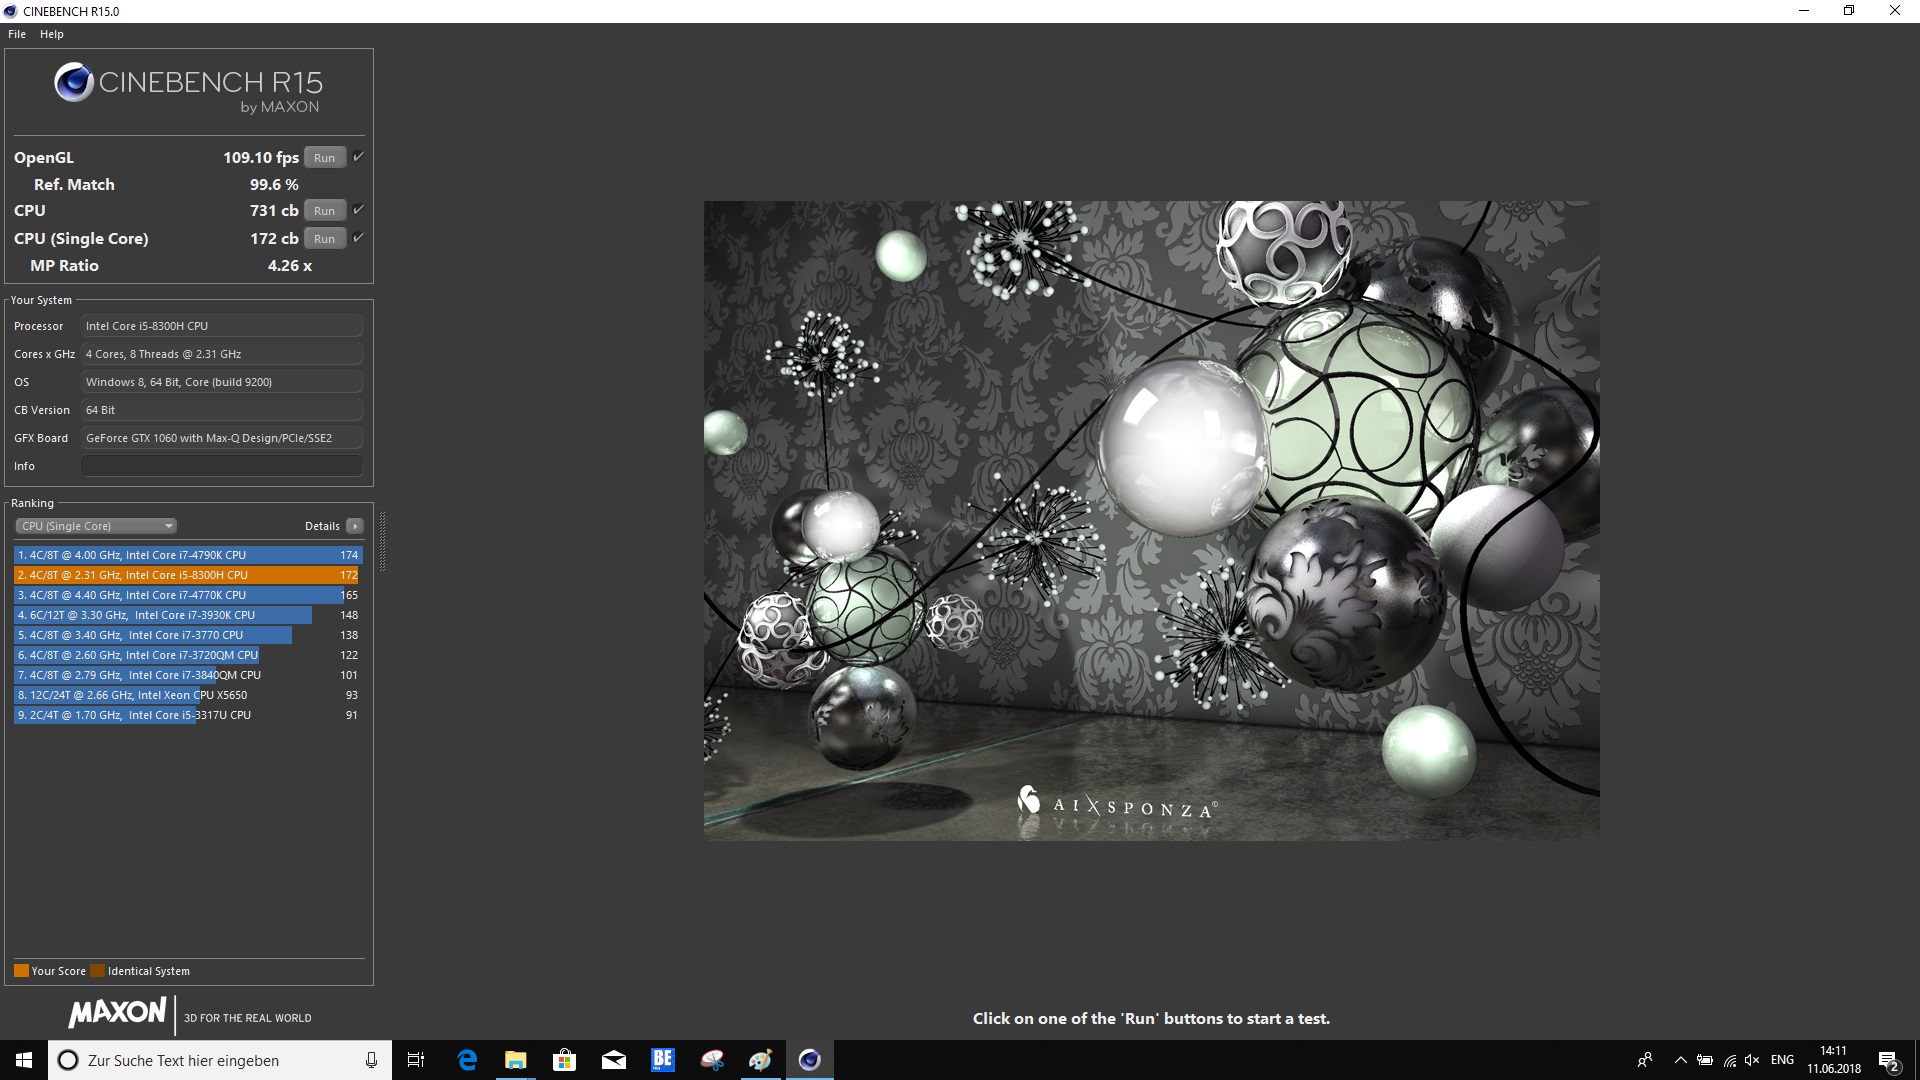
| Cinebench R10 | |
| Rendering Single CPUs 64Bit | |
| Genomsnitt av klass Gaming (17067 - 19487, n=3, senaste 2 åren) | |
| Dell G5 15 5587 | |
| Genomsnitt Intel Core i5-8300H (8277 - 8506, n=2) | |
| Dell Inspiron 15 7000 7577 | |
| Rendering Multiple CPUs 64Bit | |
| Genomsnitt av klass Gaming (14159 - 165835, n=3, senaste 2 åren) | |
| Genomsnitt Intel Core i5-8300H (28616 - 32021, n=2) | |
| Dell G5 15 5587 | |
| Dell Inspiron 15 7000 7577 | |
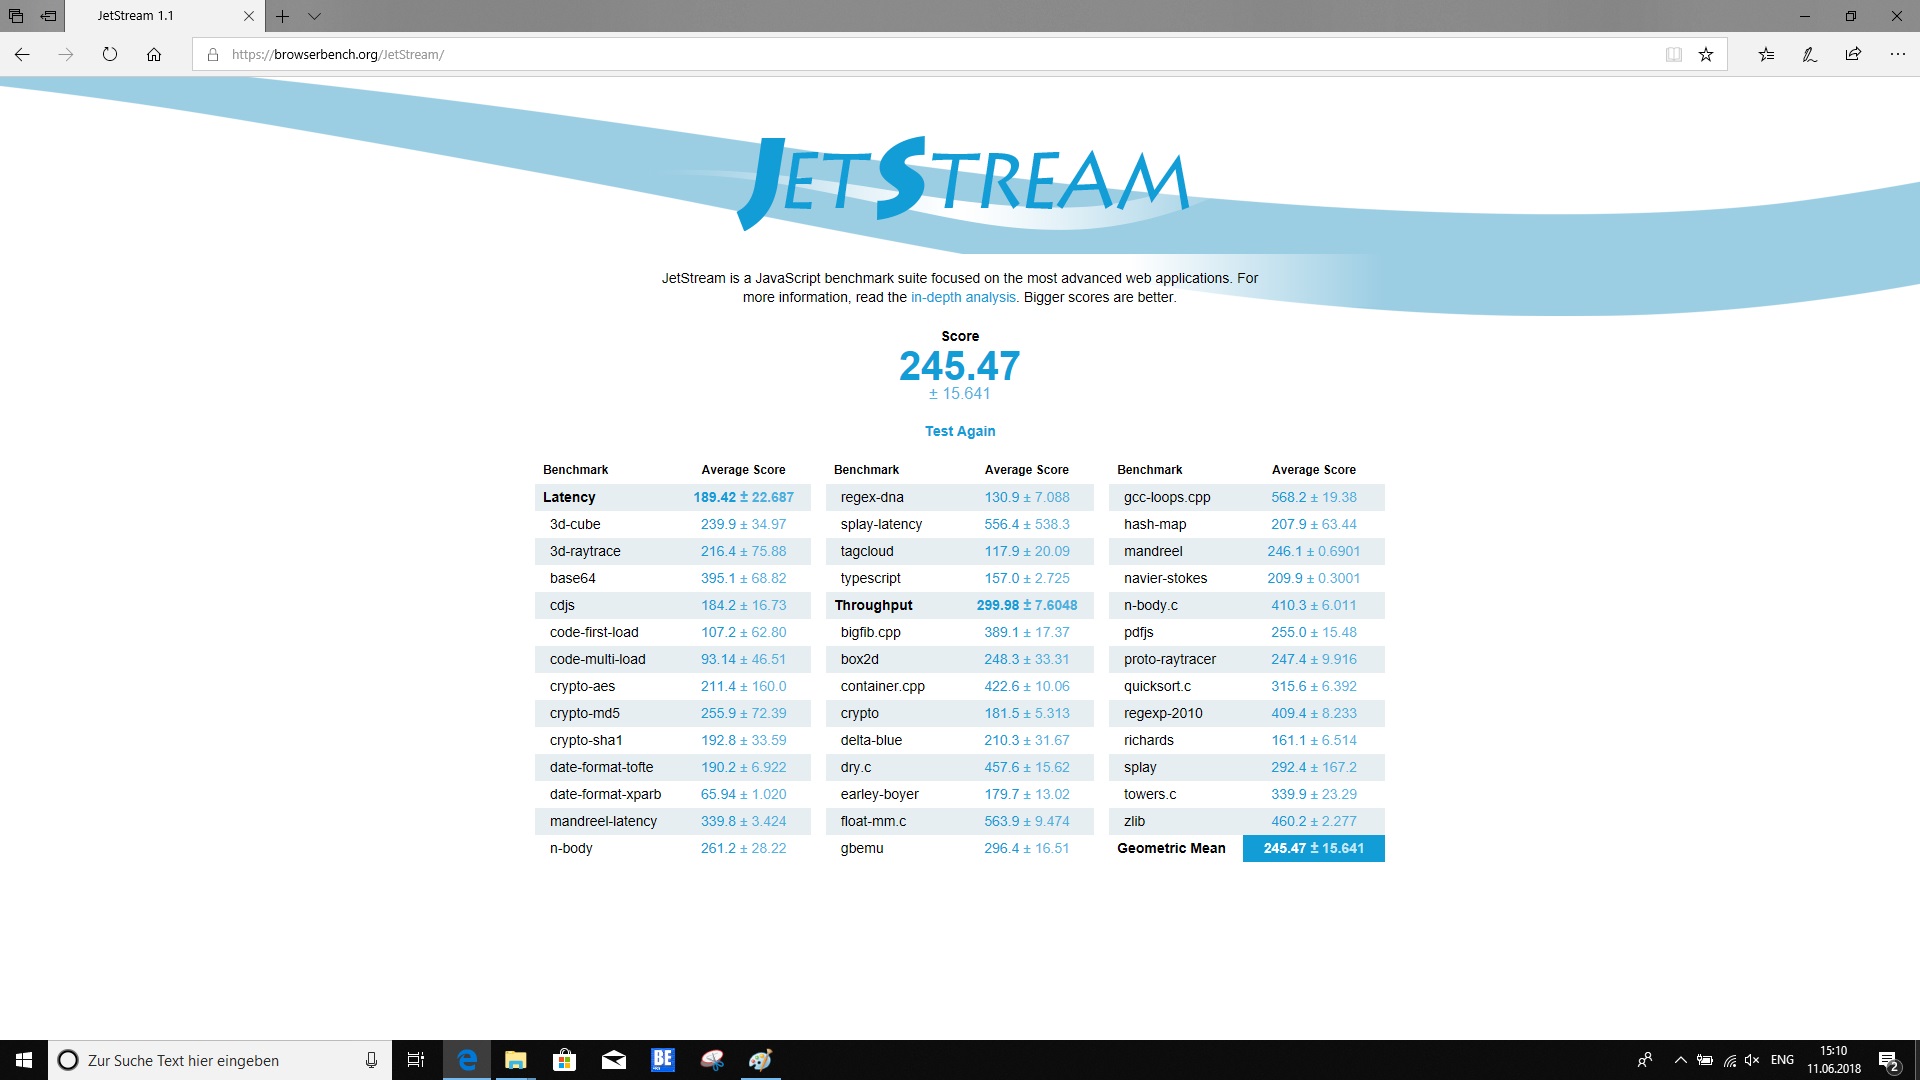
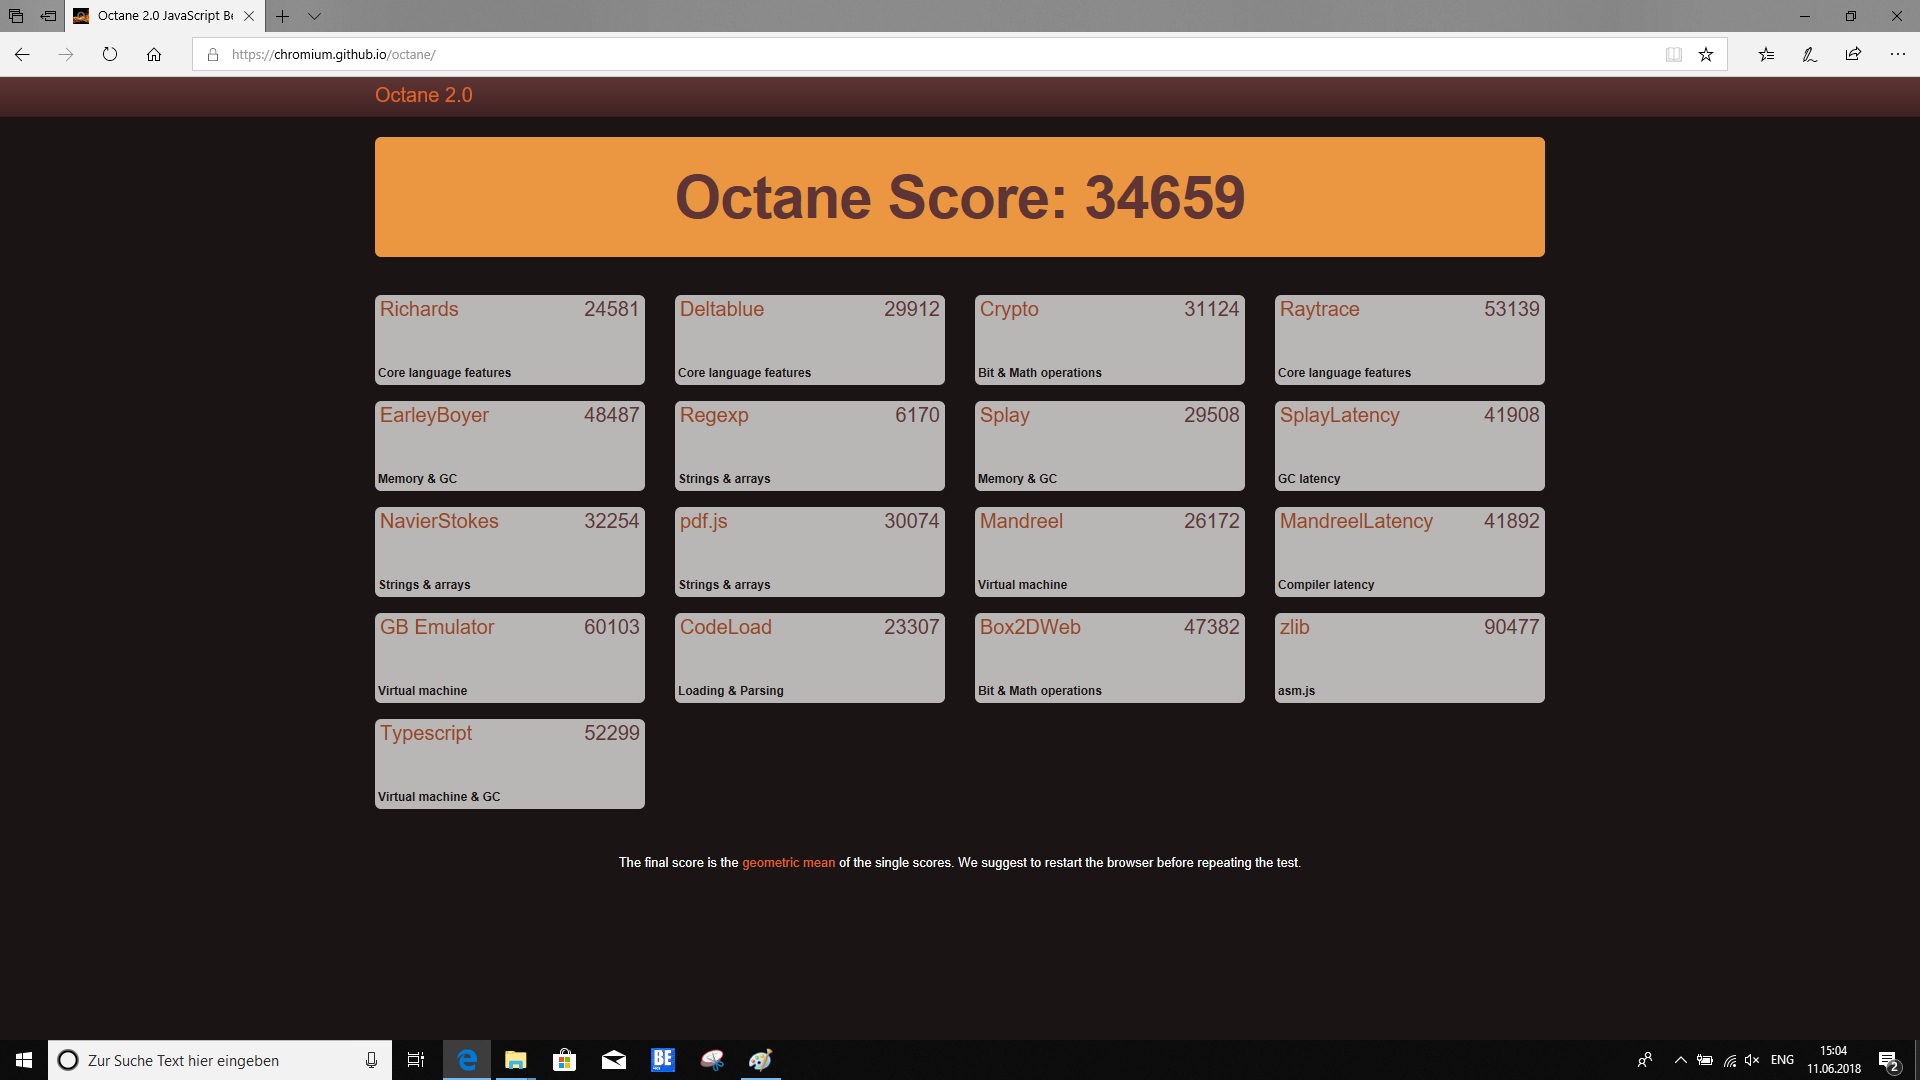
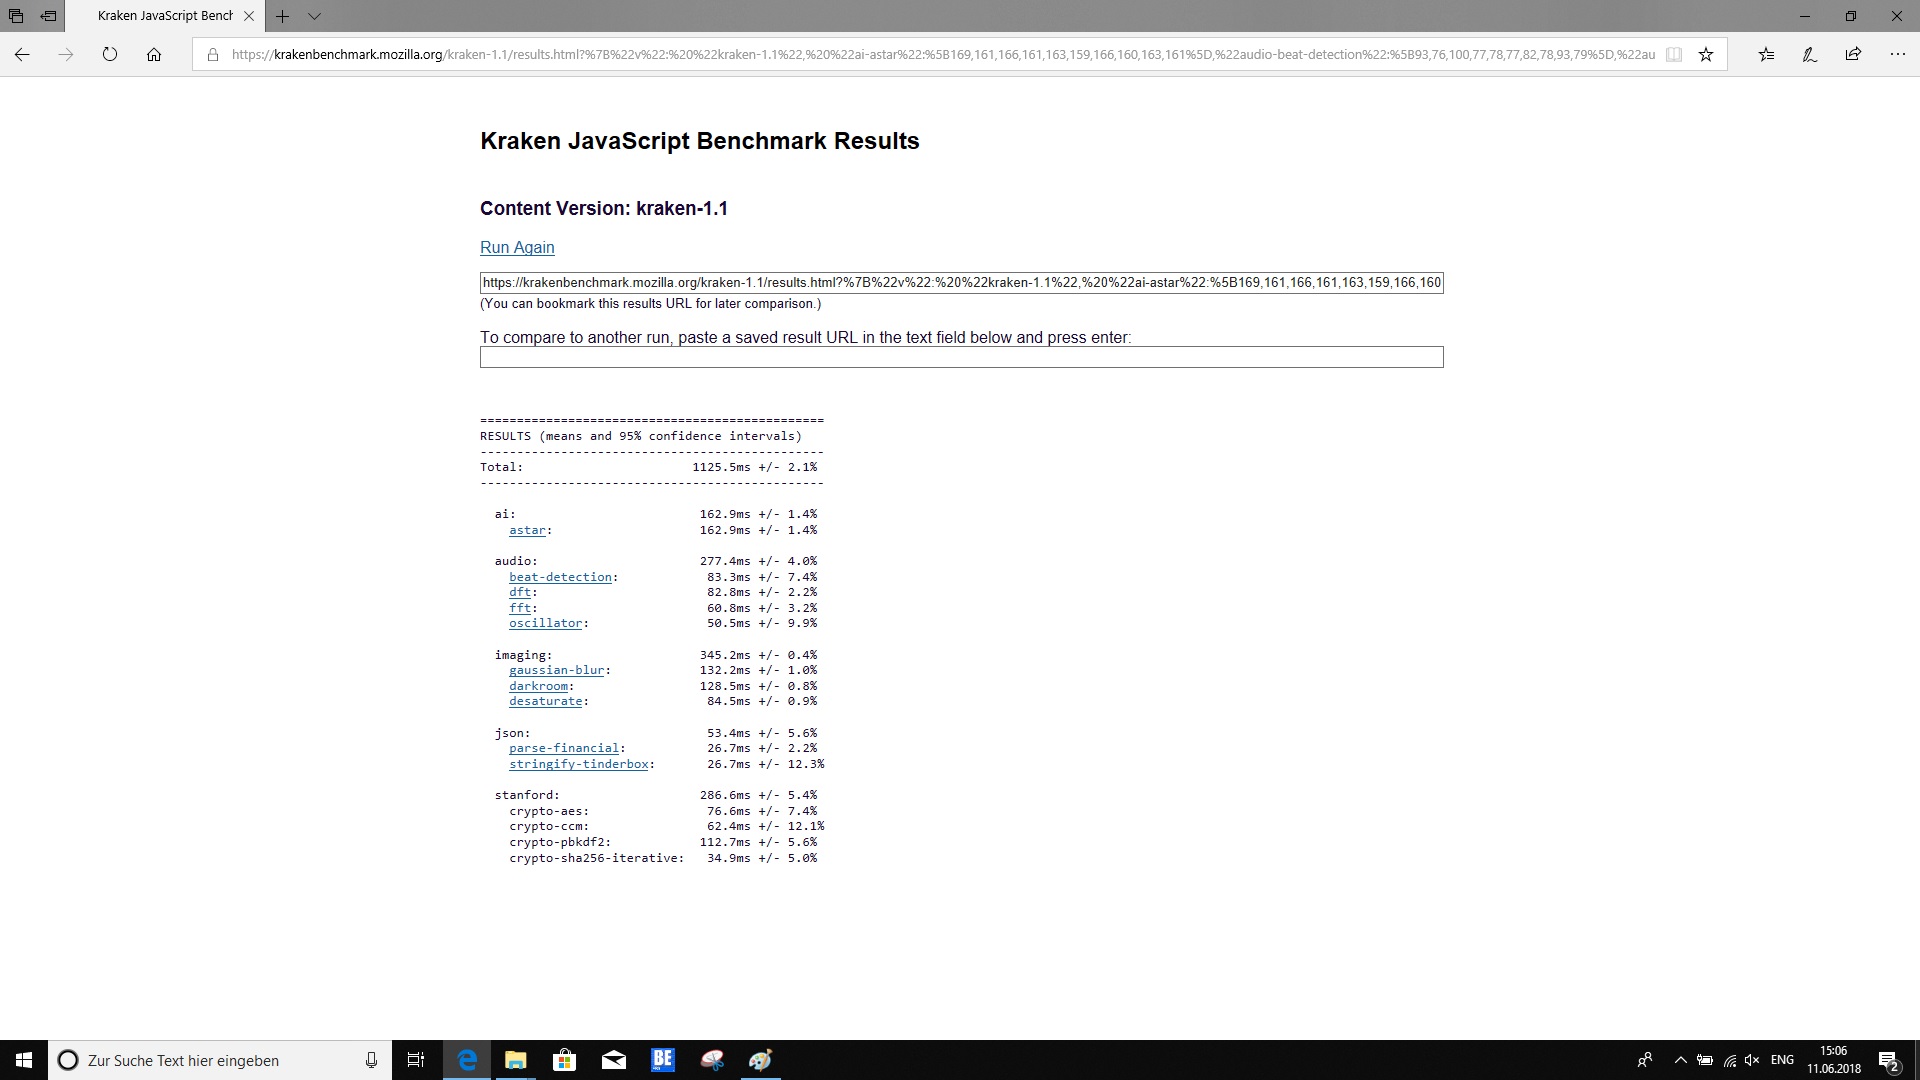
| Octane V2 - Total Score | |
| Genomsnitt av klass Gaming (93292 - 139447, n=27, senaste 2 åren) | |
| Dell G5 15 5587 | |
| Genomsnitt Intel Core i5-8300H (30806 - 34659, n=10) | |
| Dell Inspiron 15 7000 7577 | |
| Asus FX503VM-EH73 | |
* ... mindre är bättre
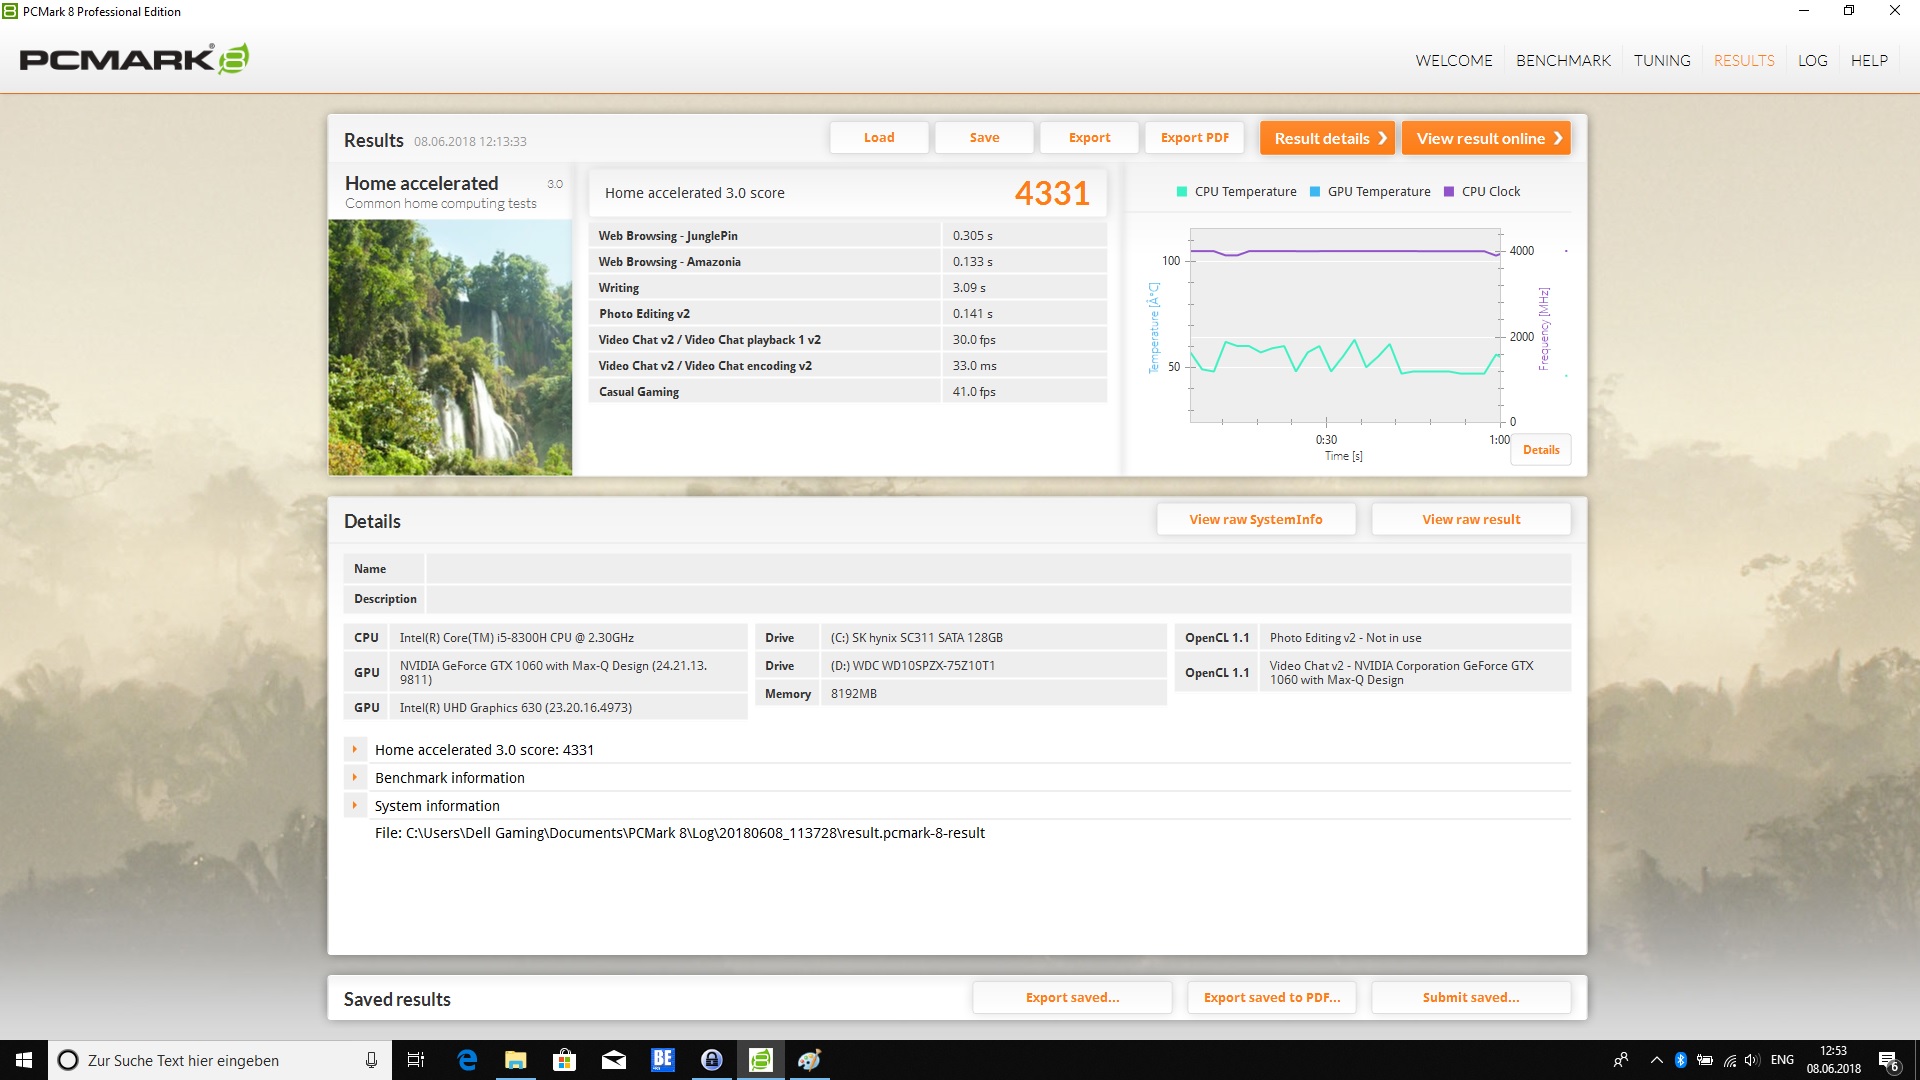
| PCMark 8 Home Score Accelerated v2 | 4331 poäng | |
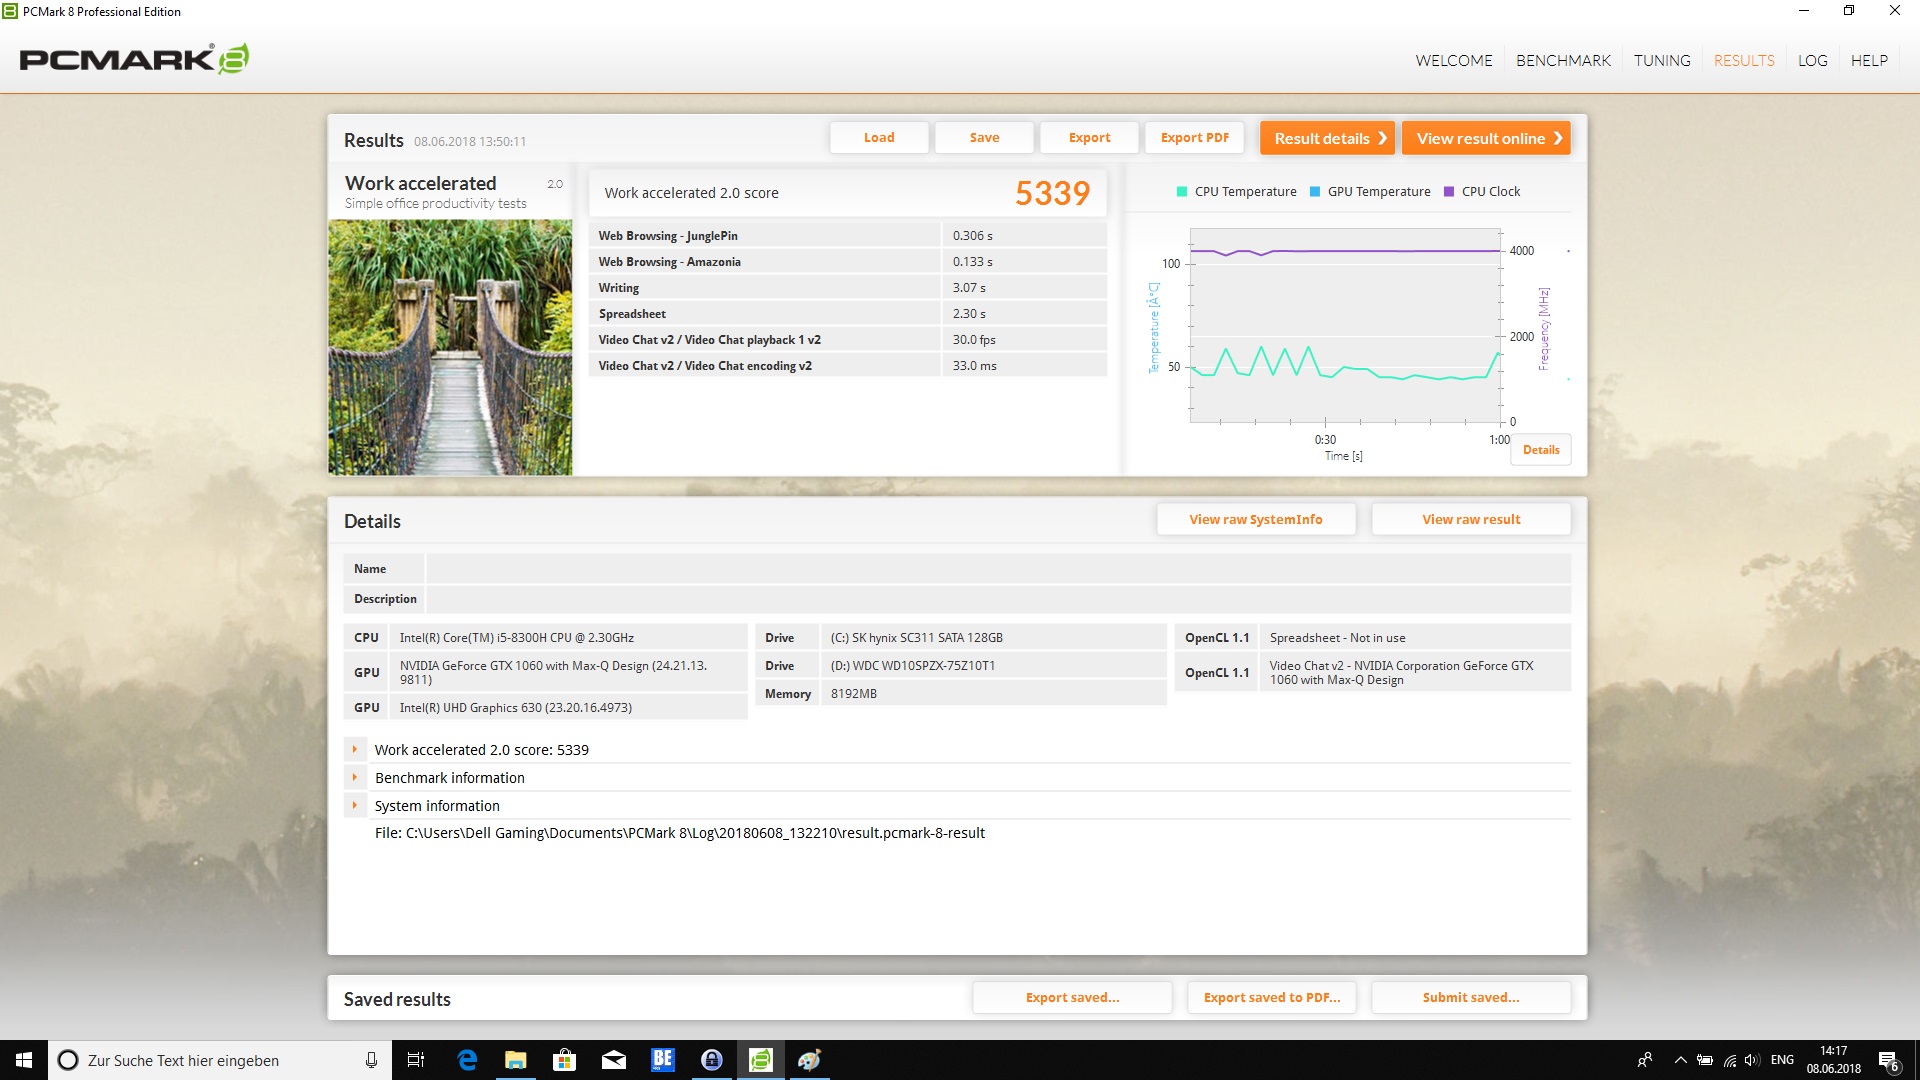
| PCMark 8 Work Score Accelerated v2 | 5339 poäng | |
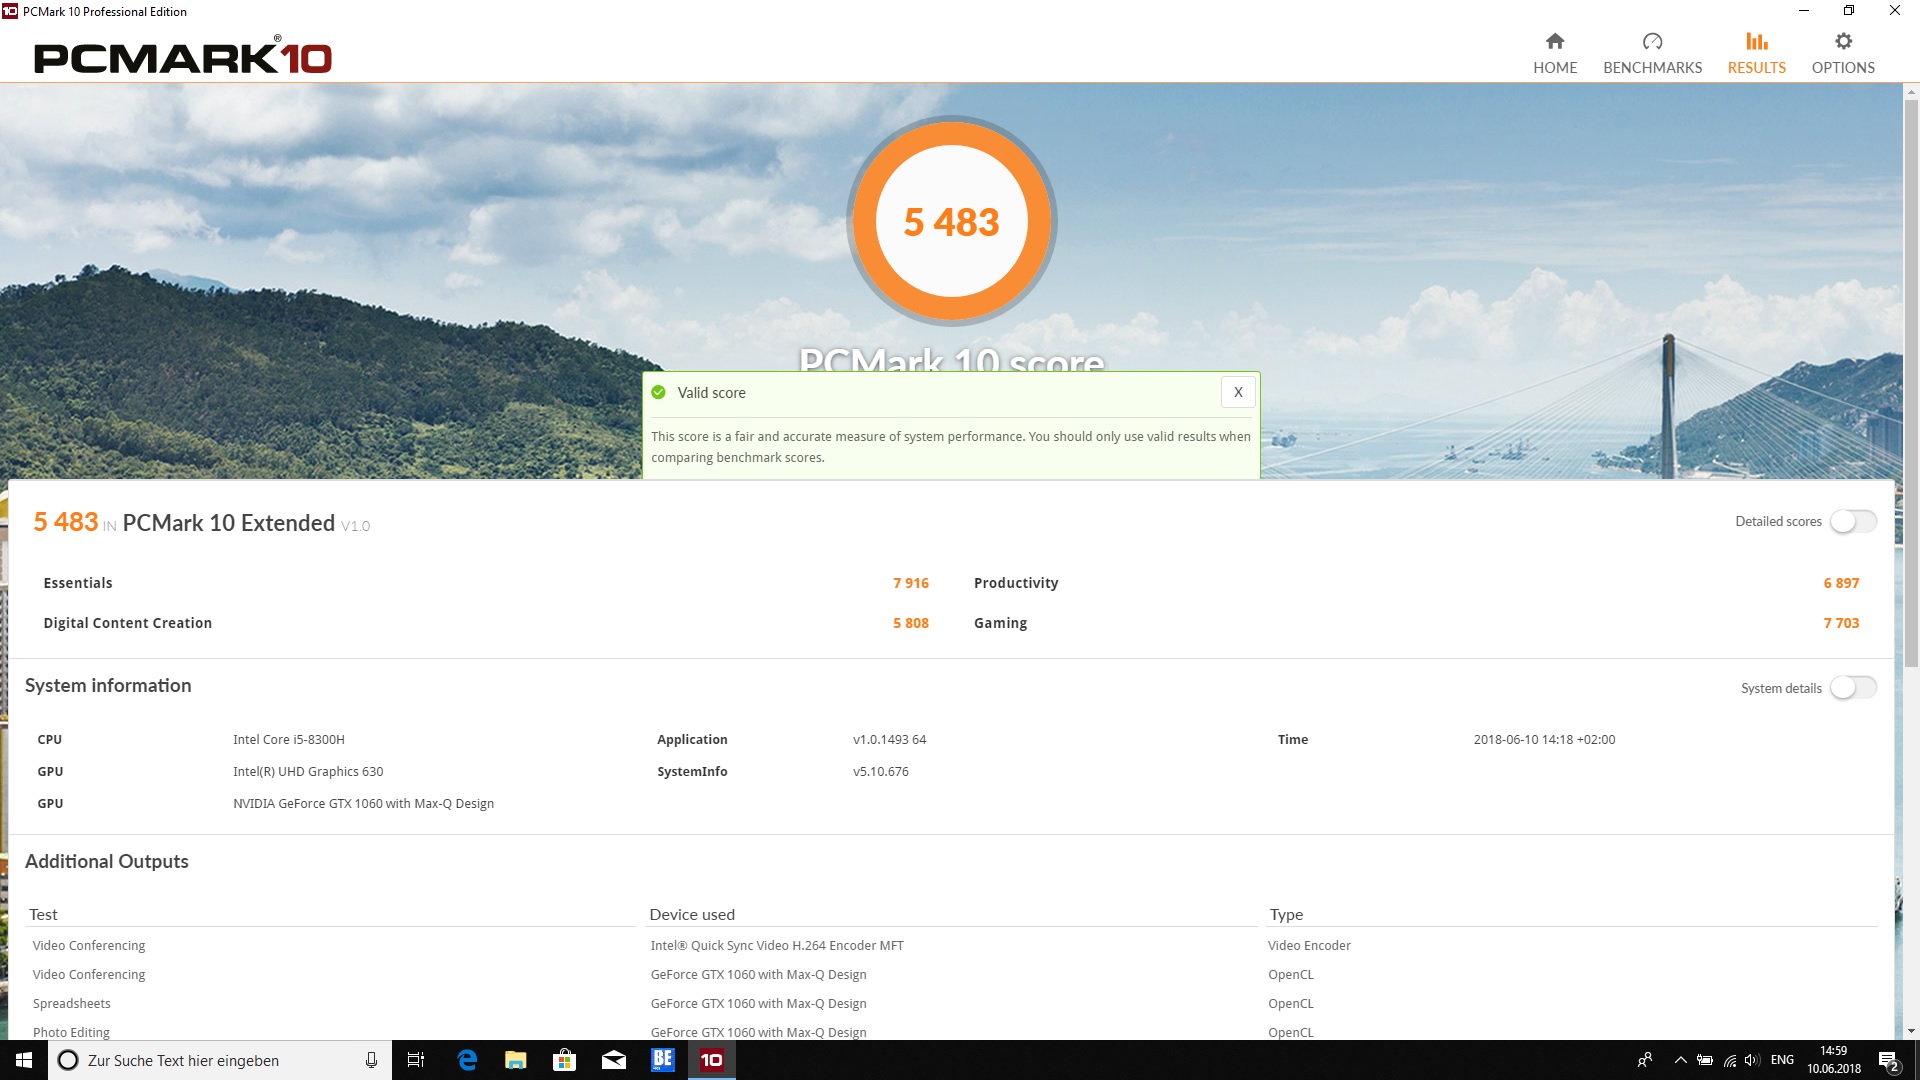
| PCMark 10 Score | 5483 poäng | |
Hjälp | ||
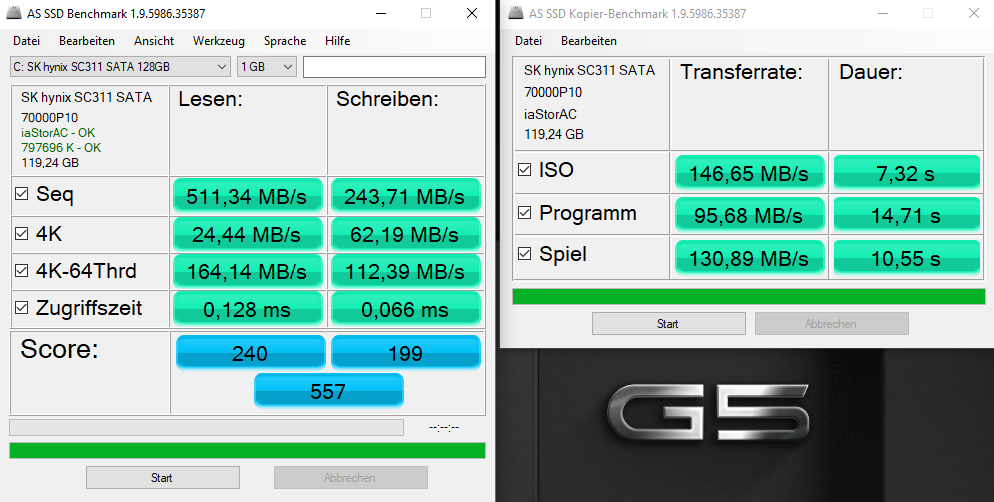
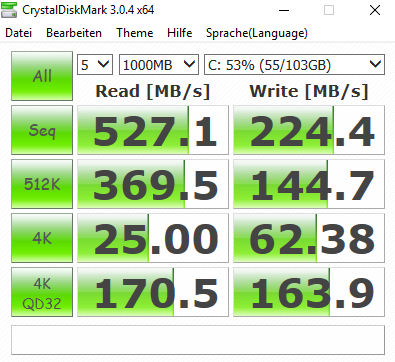
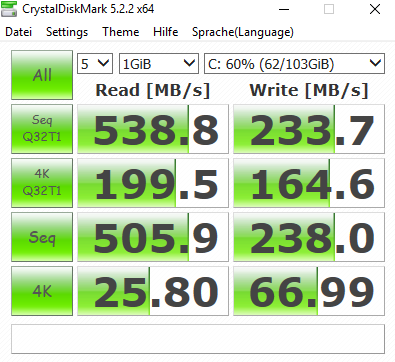
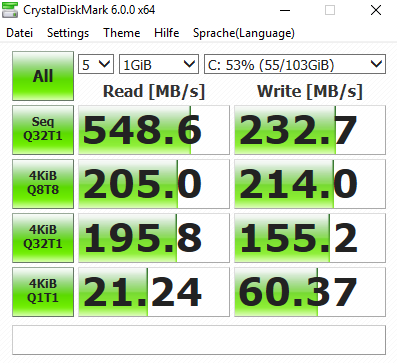
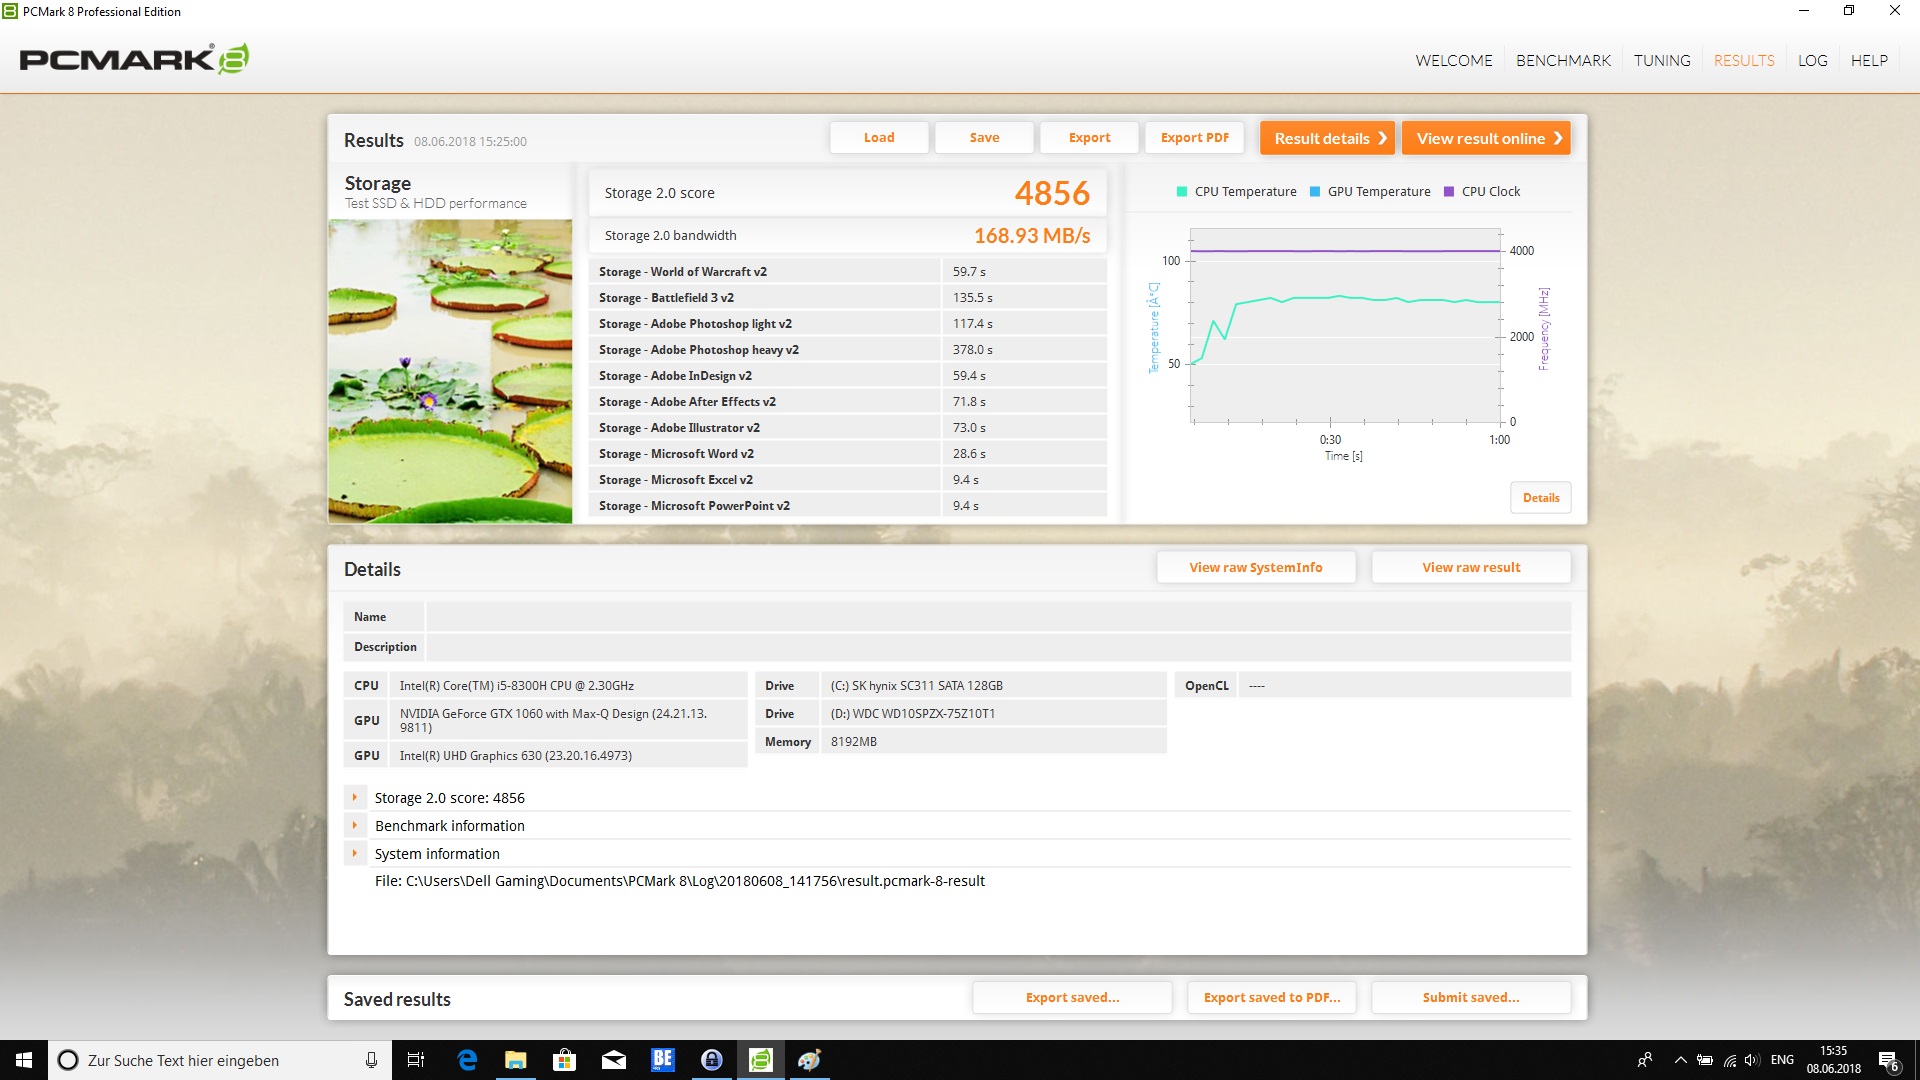
| Dell G5 15 5587 SK hynix SC311 M.2 | Dell Inspiron 15 7000 7577 Samsung PM961 MZVLW256HEHP | PC Zentrum Proteus V Samsung PM961 MZVLW256HEHP | Asus FX503VM-EH73 SanDisk SD8SN8U128G1002 | Acer Nitro 5 Spin NP515-51-86CX Micron 1100 MTFDDAV256TBN | Acer Predator Helios 300 PH317-52-51M6 Hynix HFS128G39TND | |
|---|---|---|---|---|---|---|
| AS SSD | 198% | 220% | -6% | 22% | -47% | |
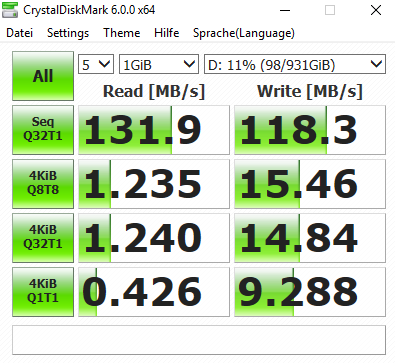
| Seq Read (MB/s) | 511 | 2652 419% | 2541 397% | 476.3 -7% | 490.1 -4% | 513 0% |
| Seq Write (MB/s) | 243.7 | 1181 385% | 1180 384% | 328.4 35% | 335.2 38% | 128.2 -47% |
| 4K Read (MB/s) | 24.44 | 46.95 92% | 51 109% | 20.44 -16% | 25.86 6% | 26.5 8% |
| 4K Write (MB/s) | 62.2 | 100.2 61% | 136.4 119% | 46.48 -25% | 78.1 26% | 62.7 1% |
| Access Time Read * (ms) | 0.128 | 0.058 55% | 0.045 65% | 0.17 -33% | 0.085 34% | |
| Access Time Write * (ms) | 0.066 | 0.037 44% | 0.028 58% | 0.09 -36% | 0.065 2% | 0.259 -292% |
| Score Total (Points) | 557 | 2405 332% | 2842 410% | 798 43% | 835 50% | 811 46% |
* ... mindre är bättre

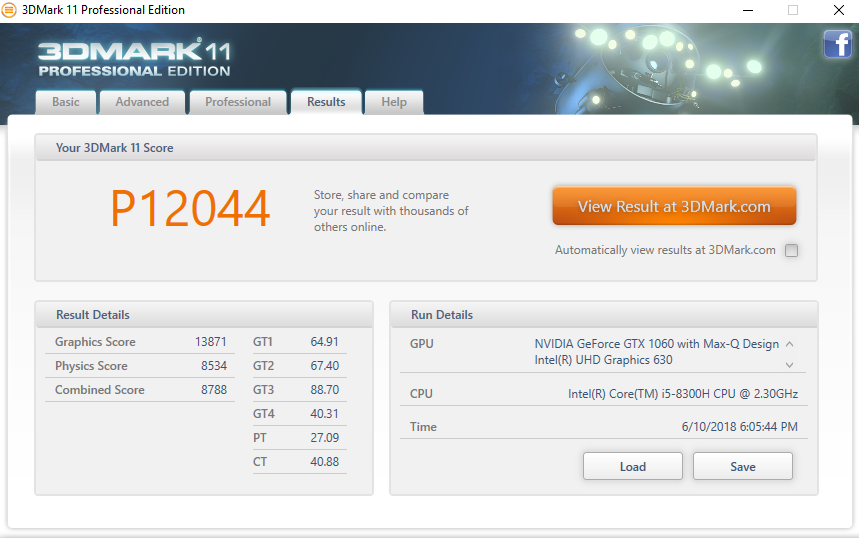
| 3DMark 11 Performance | 12044 poäng | |
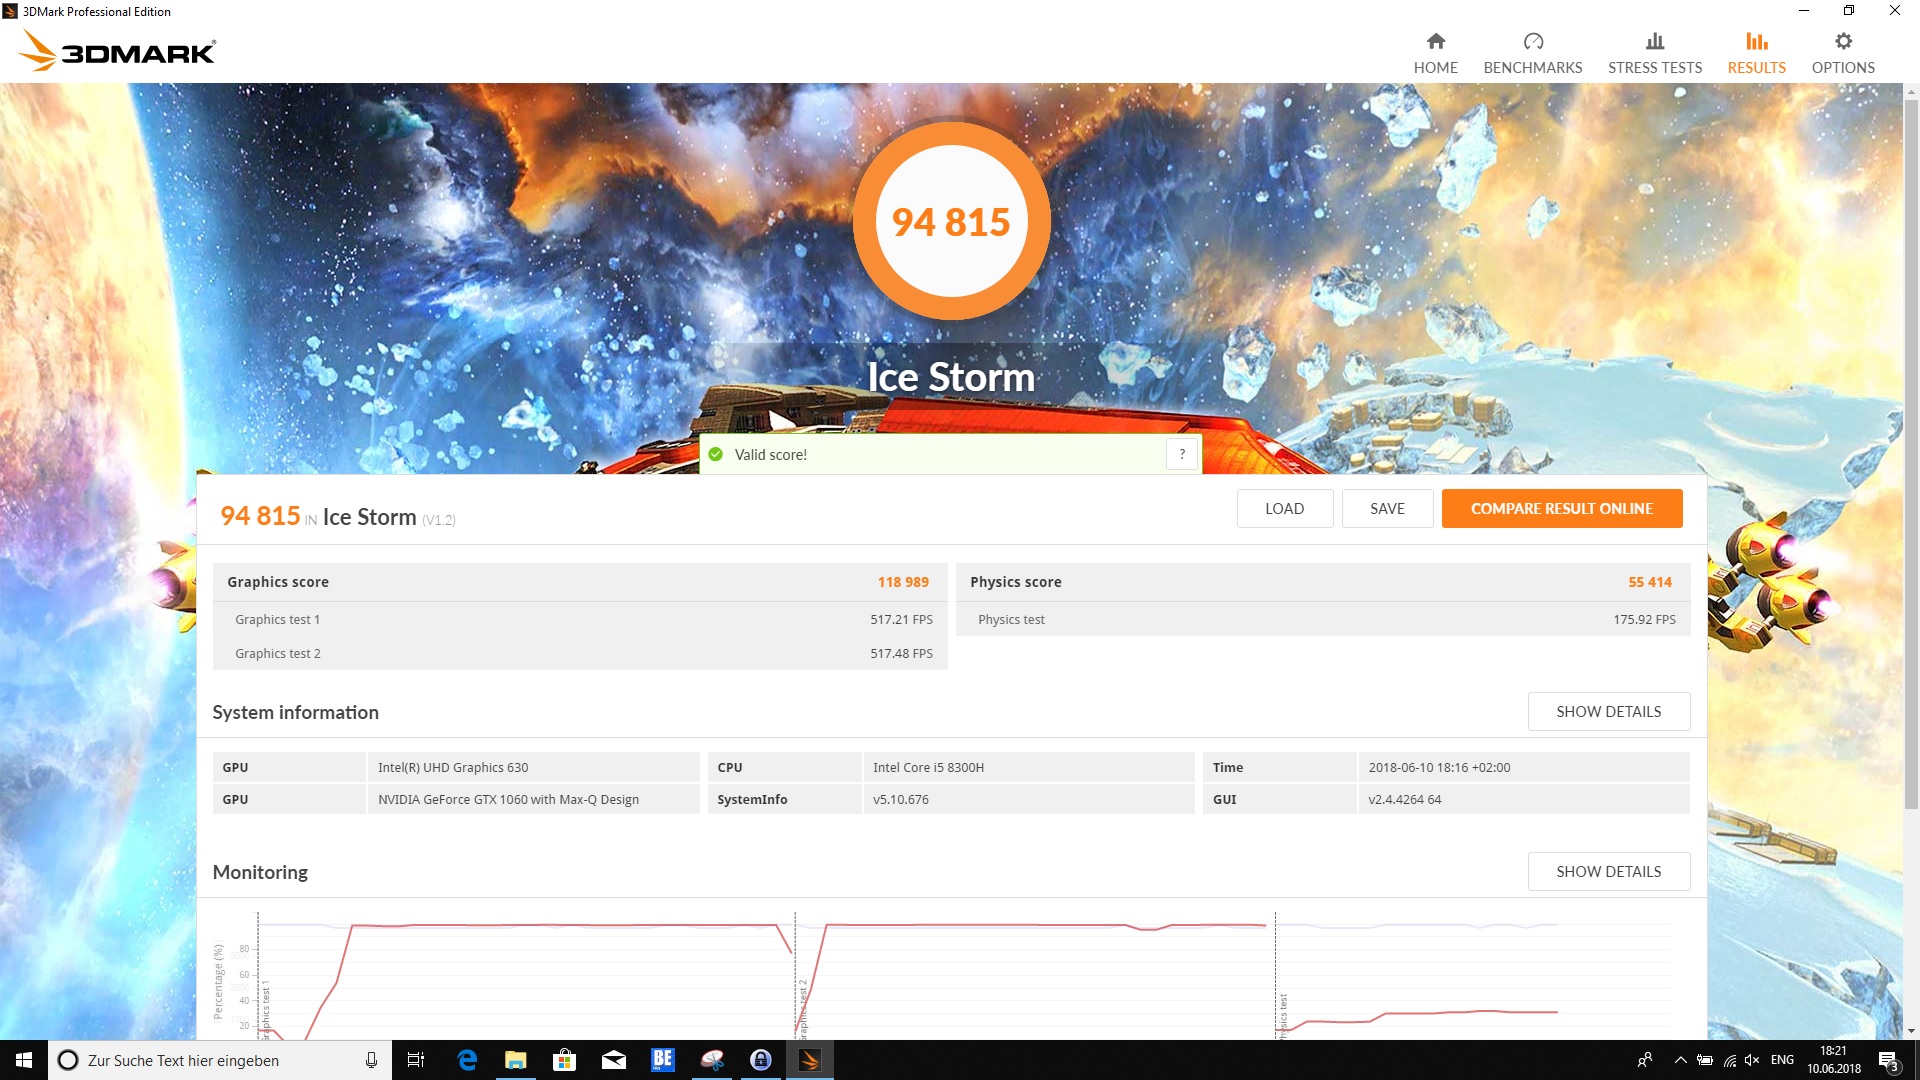
| 3DMark Ice Storm Standard Score | 94815 poäng | |
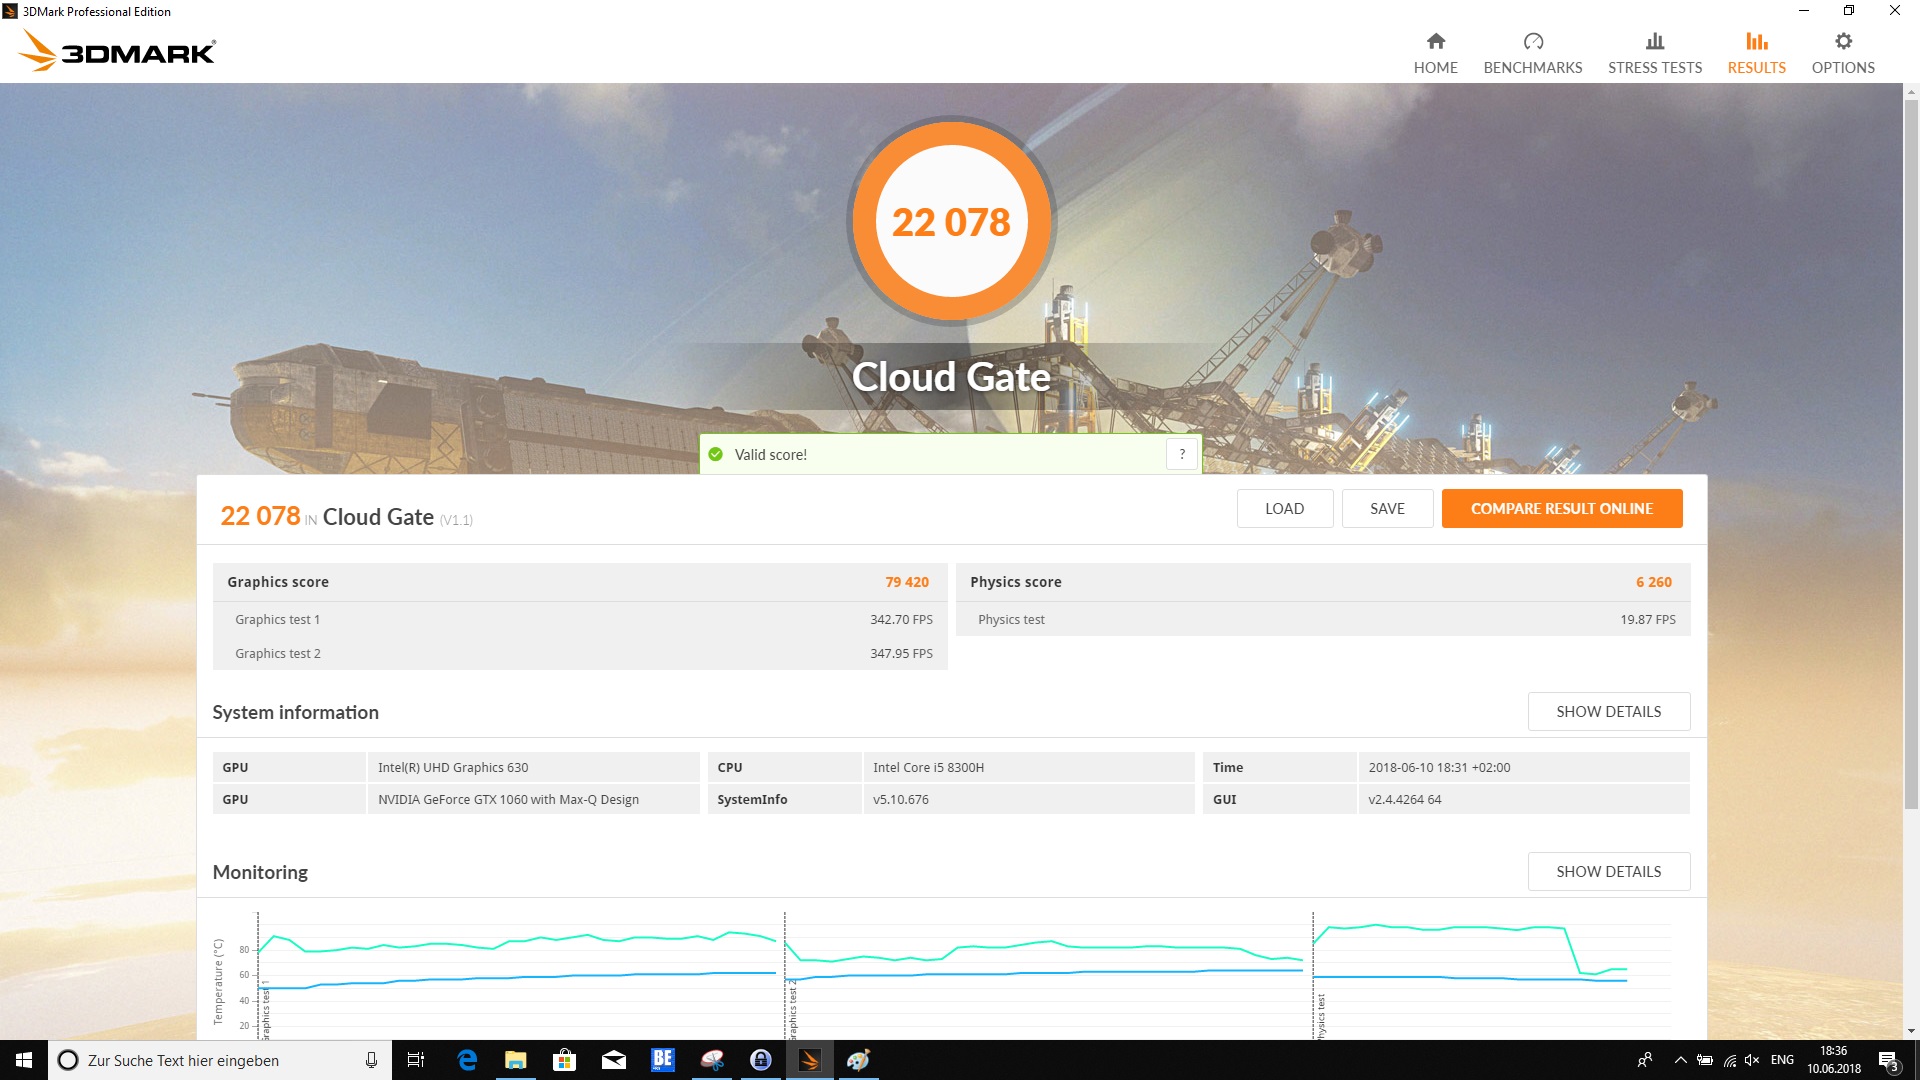
| 3DMark Cloud Gate Standard Score | 22078 poäng | |
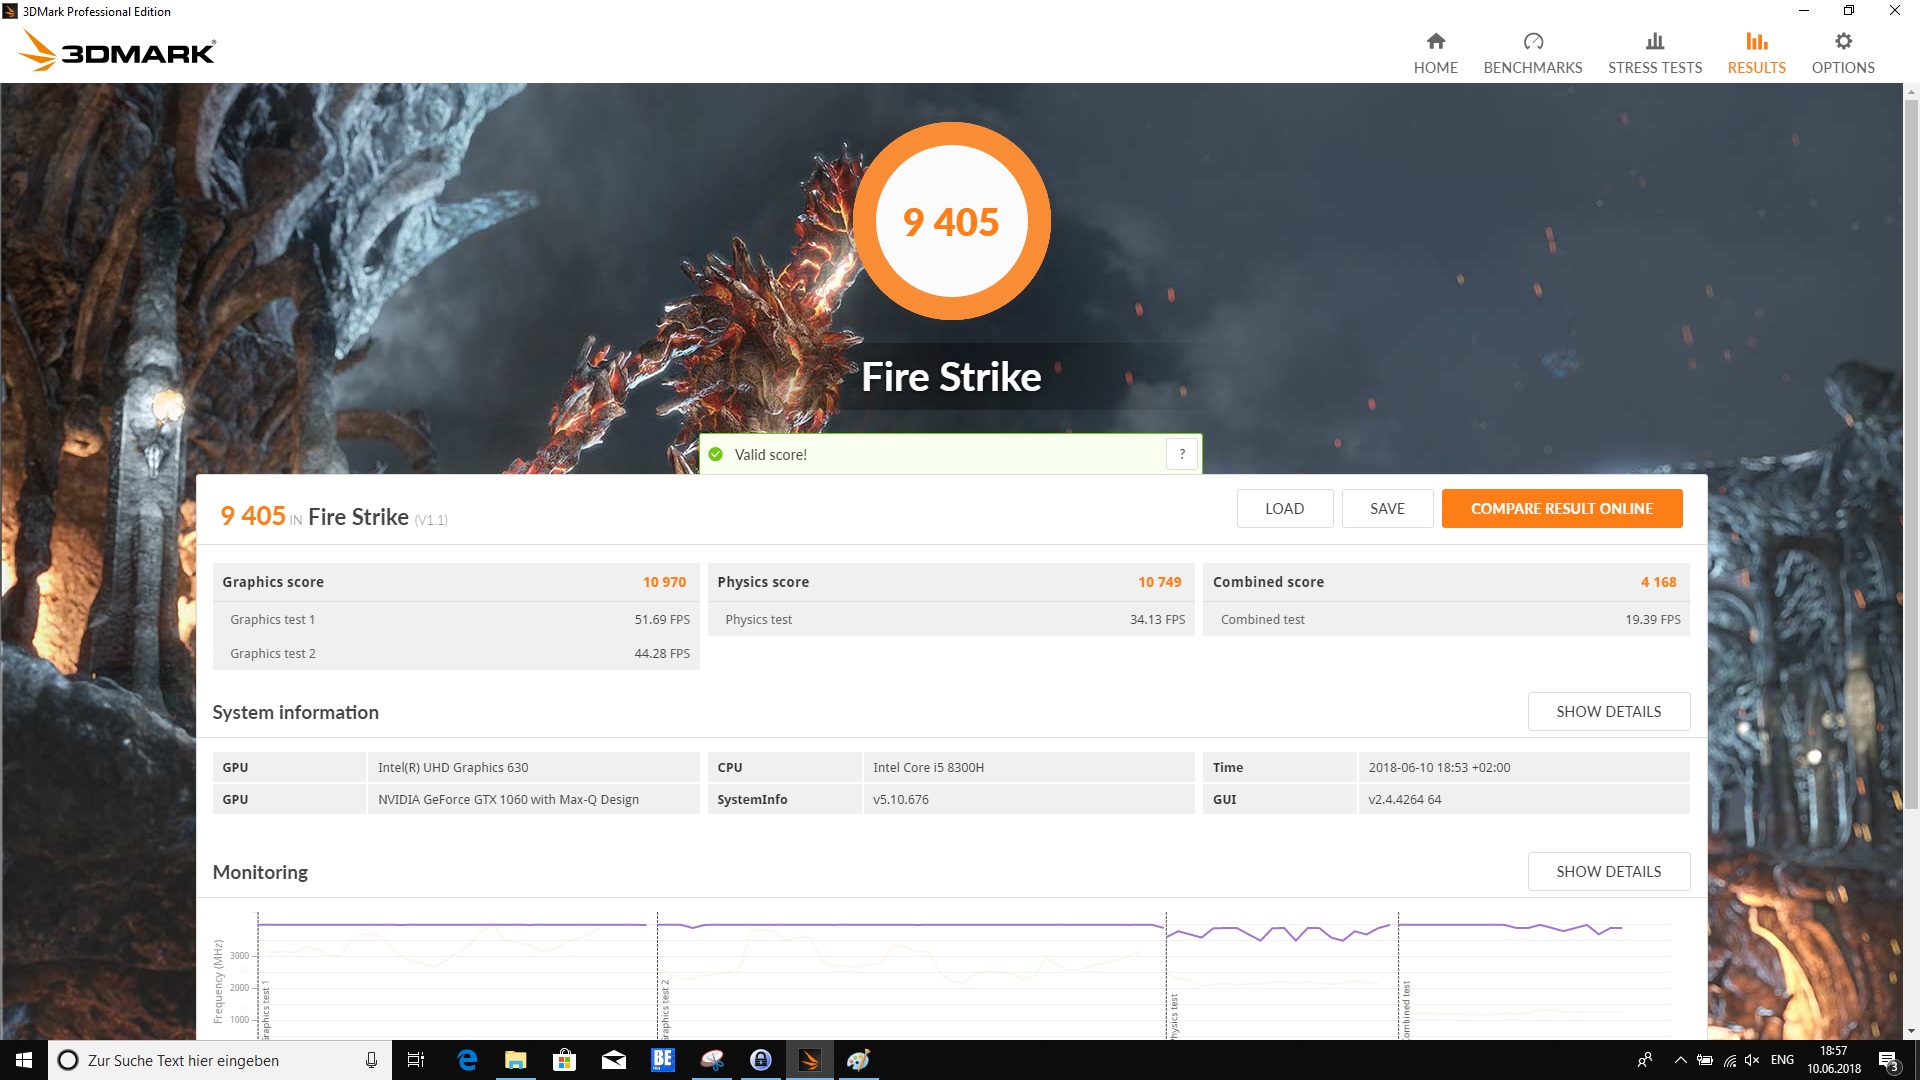
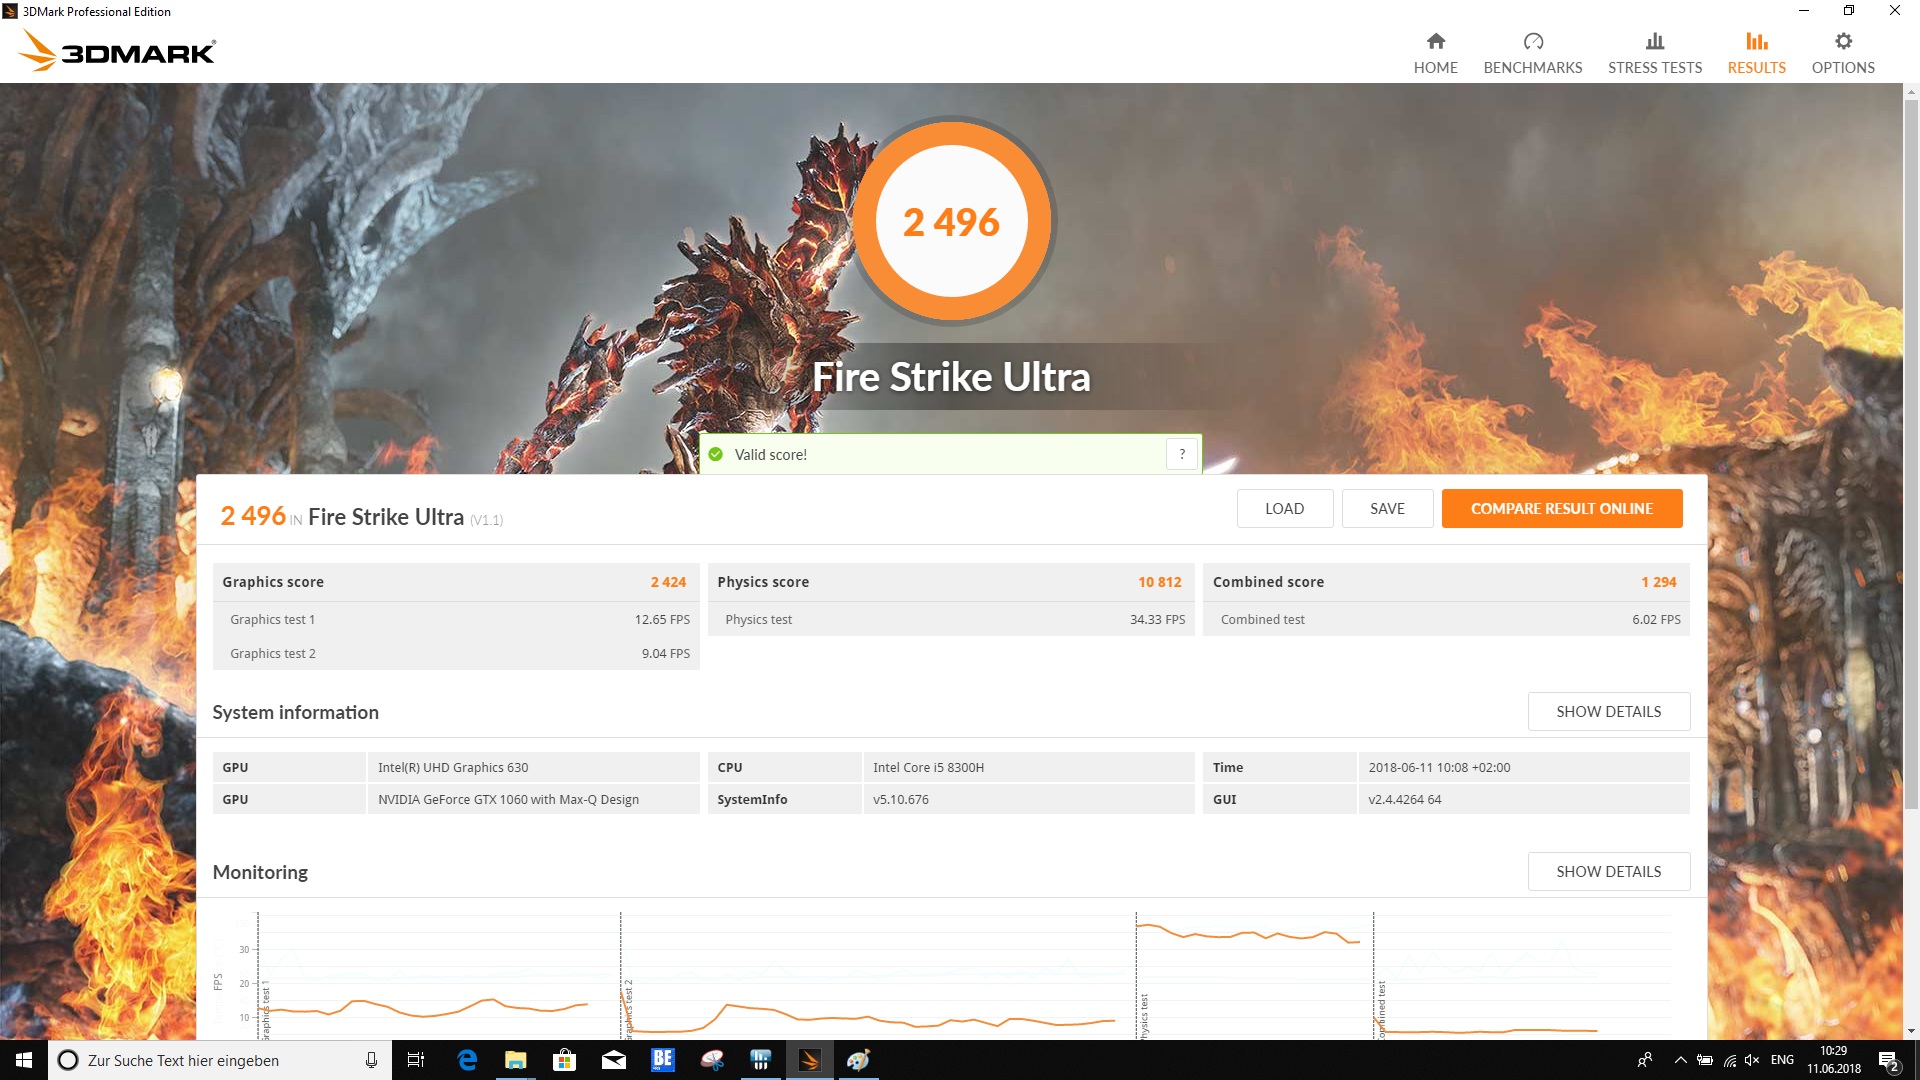
| 3DMark Fire Strike Score | 9405 poäng | |
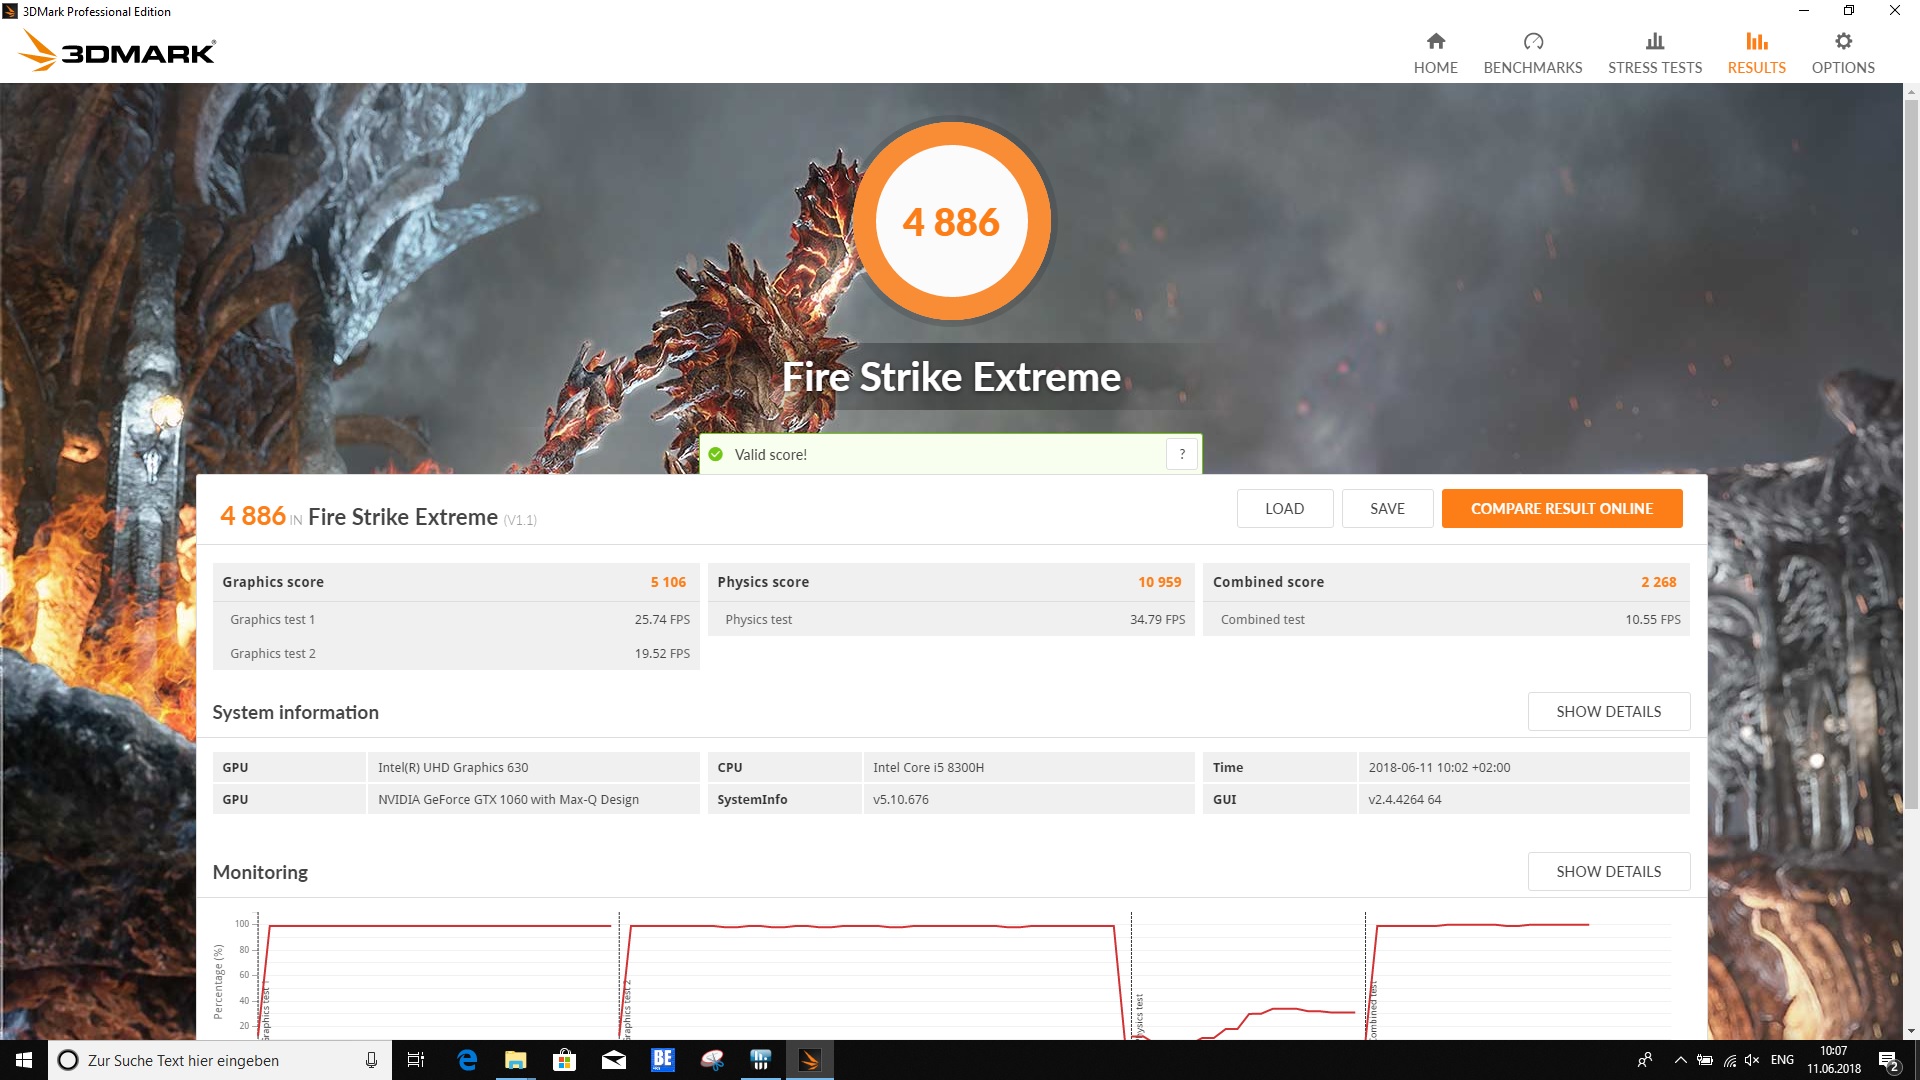
| 3DMark Fire Strike Extreme Score | 4886 poäng | |
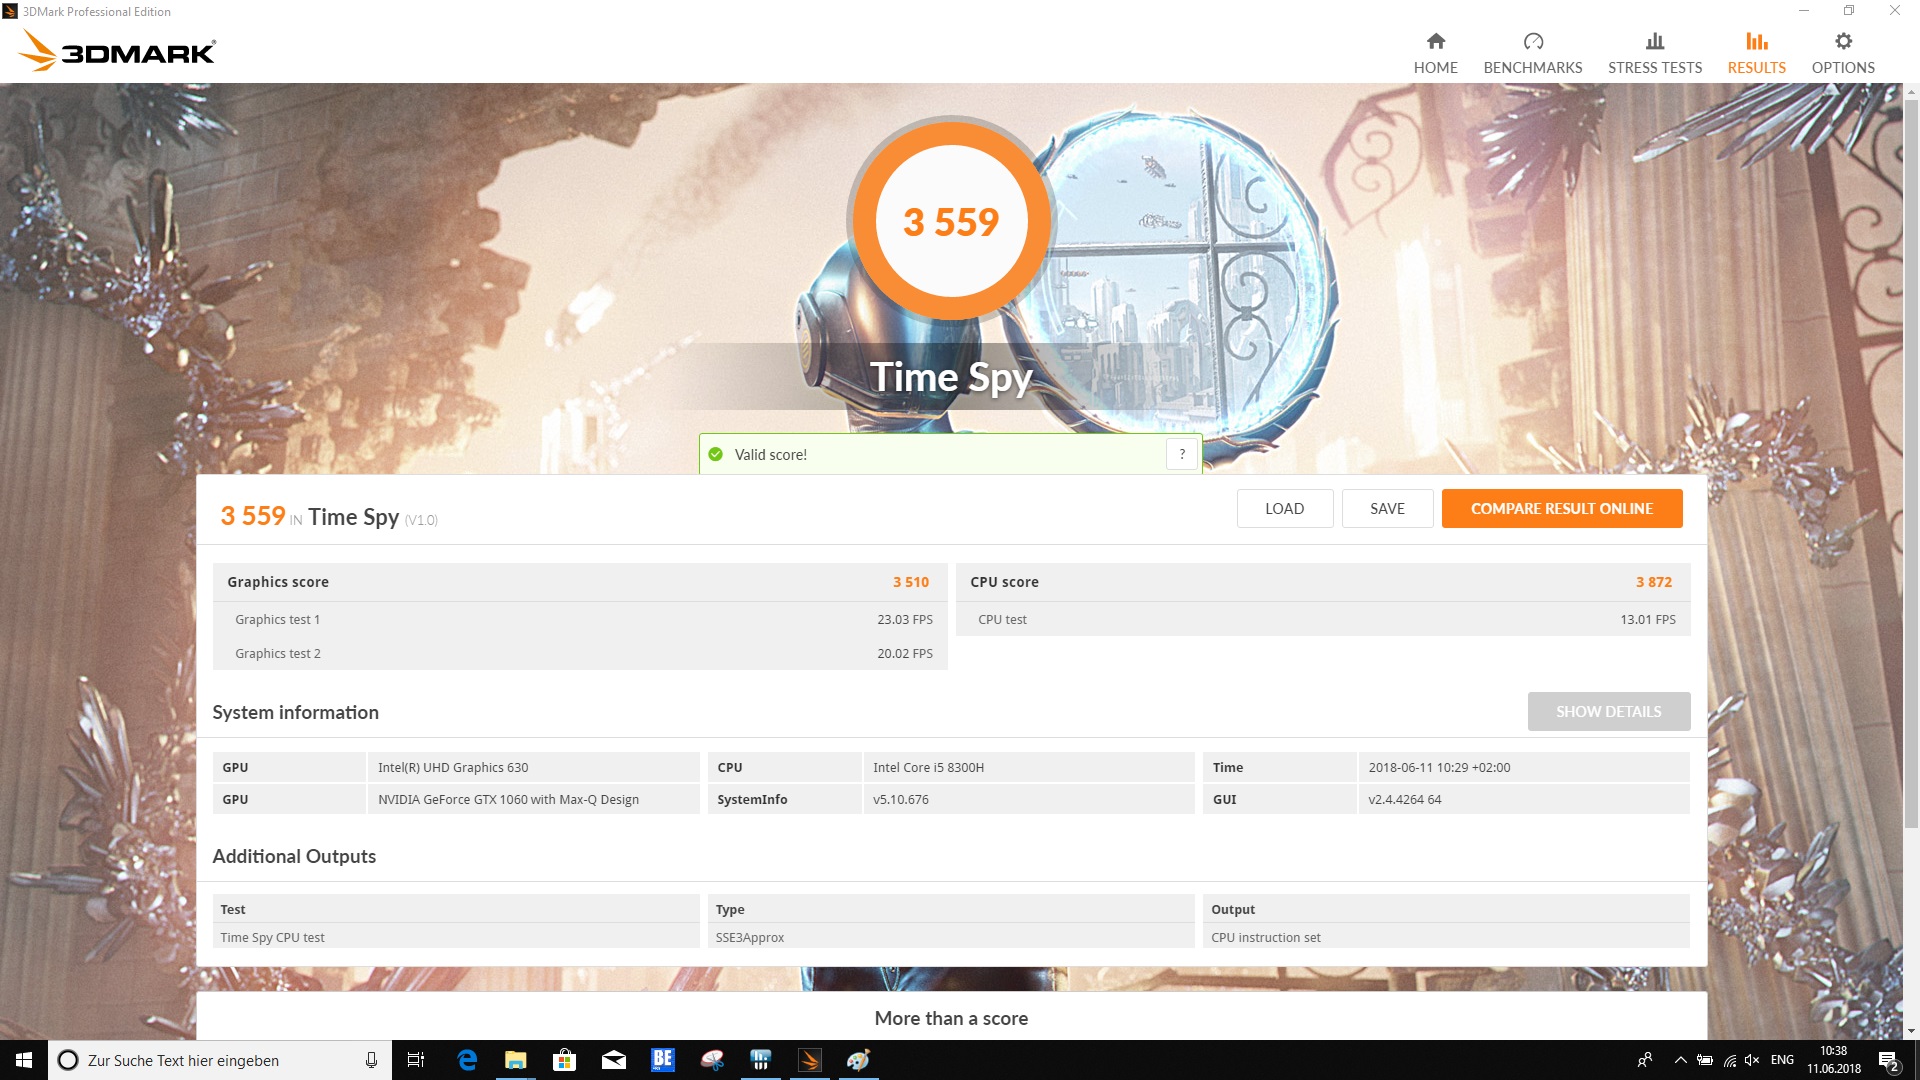
| 3DMark Time Spy Score | 3559 poäng | |
Hjälp | ||
| BioShock Infinite - 1920x1080 Ultra Preset, DX11 (DDOF) | |
| Dell G5 15 5587 | |
| Genomsnitt NVIDIA GeForce GTX 1060 Max-Q (87.2 - 112, n=8) | |
| Dell Inspiron 15 7000 7577 | |
| Dell Inspiron 15 7000 7577 | |
| Rise of the Tomb Raider - 1920x1080 Very High Preset AA:FX AF:16x | |
| Dell G5 15 5587 | |
| Asus FX503VM-EH73 | |
| Genomsnitt NVIDIA GeForce GTX 1060 Max-Q (45.3 - 66.4, n=8) | |
| Dell Inspiron 15 7000 7577 | |
| Dell Inspiron 15 7000 7577 | |
| Acer Nitro 5 Spin NP515-51-86CX | |
| The Witcher 3 - 1920x1080 Ultra Graphics & Postprocessing (HBAO+) | |
| Genomsnitt av klass Gaming (104.7 - 240, n=7, senaste 2 åren) | |
| PC Zentrum Proteus V | |
| Asus FX503VM-EH73 | |
| Genomsnitt NVIDIA GeForce GTX 1060 Max-Q (34.6 - 38.5, n=9) | |
| Dell Inspiron 15 7000 7577 | |
| Dell G5 15 5587 | |
| Acer Predator Helios 300 PH317-52-51M6 | |
| Dell Inspiron 15 7000 7577 | |
| låg | med. | hög | ultra | 4K | |
|---|---|---|---|---|---|
| BioShock Infinite (2013) | 264 | 233.1 | 213.3 | 107.5 | |
| GTA V (2015) | 156.8 | 151.6 | 106.5 | 61.8 | 53.7 |
| The Witcher 3 (2015) | 172.2 | 122.3 | 58.3 | 34.9 | 23.3 |
| Rise of the Tomb Raider (2016) | 160.9 | 128.1 | 72.7 | 60.5 | 24.6 |
| Playerunknown's Battlegrounds (PUBG) (2017) | 141.9 | 92.5 | 85.6 | 63.3 | 12.9 |
| FIFA 18 (2017) | 290.6 | 277.9 | 252.3 | 245.7 | 130 |
| Assassin´s Creed Origins (2017) | 77 | 67 | 62 | 52 | 21 |
| Call of Duty WWII (2017) | 174.9 | 163.3 | 91.9 | 70.9 | 31.3 |
| Need for Speed Payback (2017) | 117.9 | 89.1 | 78.5 | 66.6 | 23.8 |
| Star Wars Battlefront 2 (2017) | 135.5 | 93.4 | 81.5 | 62.2 | |
| Fortnite (2018) | 178 | 132.6 | 115.7 | 72.8 | |
| Kingdom Come: Deliverance (2018) | 110 | 66.8 | 52.7 | 38 | 12 |
| Far Cry 5 (2018) | 110 | 70 | 65 | 48 | 20 |
Ljudnivå
| Låg belastning |
| 31.1 / 31.1 / 34.2 dB(A) |
| Hög belastning |
| 34.9 / 44 dB(A) |
 | ||
30 dB tyst 40 dB(A) hörbar 50 dB(A) högt ljud |
||
min: | ||
| Dell G5 15 5587 GeForce GTX 1060 Max-Q, i5-8300H, SK hynix SC311 M.2 | Dell Inspiron 15 7000 7577 GeForce GTX 1050 Mobile, i5-7300HQ, Seagate Mobile HDD 1TB ST1000LX015-1U7172 | Dell Inspiron 15 7000 7577 GeForce GTX 1060 Max-Q, i5-7300HQ, Samsung PM961 MZVLW256HEHP | PC Zentrum Proteus V GeForce GTX 1060 Mobile, i7-7700HQ, Samsung PM961 MZVLW256HEHP | Asus FX503VM-EH73 GeForce GTX 1060 Mobile, i7-7700HQ, SanDisk SD8SN8U128G1002 | Acer Nitro 5 Spin NP515-51-86CX GeForce GTX 1050 Mobile, i5-8550U, Micron 1100 MTFDDAV256TBN | Acer Predator Helios 300 PH317-52-51M6 GeForce GTX 1050 Ti Mobile, i5-8300H, Hynix HFS128G39TND | |
|---|---|---|---|---|---|---|---|
| Noise | -2% | 9% | -16% | -2% | -2% | -5% | |
| av / miljö * (dB) | 30.3 | 31 -2% | 28 8% | 31 -2% | 27.8 8% | 30.4 -0% | 29 4% |
| Idle Minimum * (dB) | 31.1 | 32.7 -5% | 28 10% | 37 -19% | 29.6 5% | 30.9 1% | 29 7% |
| Idle Average * (dB) | 31.1 | 32.7 -5% | 28 10% | 38 -22% | 29.6 5% | 30.9 1% | 31 -0% |
| Idle Maximum * (dB) | 34.2 | 32.7 4% | 28 18% | 39 -14% | 29.6 13% | 30.9 10% | 33 4% |
| Load Average * (dB) | 34.9 | 38.7 -11% | 30.3 13% | 47 -35% | 37.3 -7% | 42.6 -22% | 45 -29% |
| Witcher 3 ultra * (dB) | 42.7 | 39 9% | 39.5 7% | 43 -1% | 49.8 -17% | 45 -5% | |
| Load Maximum * (dB) | 44 | 44.6 -1% | 46.5 -6% | 52 -18% | 53.7 -22% | 45 -2% | 51 -16% |
* ... mindre är bättre
(-) Den maximala temperaturen på ovansidan är 50.2 °C / 122 F, jämfört med genomsnittet av 40.4 °C / 105 F , allt från 21.2 till 68.8 °C för klassen Gaming.
(-) Botten värms upp till maximalt 57 °C / 135 F, jämfört med genomsnittet av 43.2 °C / 110 F
(+) Vid tomgångsbruk är medeltemperaturen för ovansidan 27.3 °C / 81 F, jämfört med enhetsgenomsnittet på 33.9 °C / ### class_avg_f### F.
(-) När du spelar The Witcher 3 är medeltemperaturen för ovansidan 38.5 °C / 101 F, jämfört med enhetsgenomsnittet på 33.9 °C / ## #class_avg_f### F.
(+) Handledsstöden och pekplattan når maximal hudtemperatur (33.7 °C / 92.7 F) och är därför inte varma.
(-) Medeltemperaturen för handledsstödsområdet på liknande enheter var 28.8 °C / 83.8 F (-4.9 °C / -8.9 F).
| Dell G5 15 5587 GeForce GTX 1060 Max-Q, i5-8300H, SK hynix SC311 M.2 | Dell Inspiron 15 7000 7577 GeForce GTX 1050 Mobile, i5-7300HQ, Seagate Mobile HDD 1TB ST1000LX015-1U7172 | Dell Inspiron 15 7000 7577 GeForce GTX 1060 Max-Q, i5-7300HQ, Samsung PM961 MZVLW256HEHP | PC Zentrum Proteus V GeForce GTX 1060 Mobile, i7-7700HQ, Samsung PM961 MZVLW256HEHP | Asus FX503VM-EH73 GeForce GTX 1060 Mobile, i7-7700HQ, SanDisk SD8SN8U128G1002 | Acer Nitro 5 Spin NP515-51-86CX GeForce GTX 1050 Mobile, i5-8550U, Micron 1100 MTFDDAV256TBN | Acer Predator Helios 300 PH317-52-51M6 GeForce GTX 1050 Ti Mobile, i5-8300H, Hynix HFS128G39TND | |
|---|---|---|---|---|---|---|---|
| Heat | 13% | 12% | 5% | -20% | 10% | -3% | |
| Maximum Upper Side * (°C) | 50.2 | 35.9 28% | 44 12% | 44 12% | 59.6 -19% | 46 8% | 50 -0% |
| Maximum Bottom * (°C) | 57 | 41.6 27% | 43.8 23% | 53 7% | 56 2% | 47 18% | 52 9% |
| Idle Upper Side * (°C) | 28.6 | 27.9 2% | 26 9% | 29 -1% | 37 -29% | 29.6 -3% | 33 -15% |
| Idle Bottom * (°C) | 28.9 | 30.5 -6% | 28 3% | 29 -0% | 38.6 -34% | 24.6 15% | 30 -4% |
* ... mindre är bättre
Dell G5 15 5587 ljudanalys
(-) | inte särskilt höga högtalare (68.5 dB)
Bas 100 - 315 Hz
(±) | reducerad bas - i genomsnitt 12.5% lägre än medianen
(+) | basen är linjär (5.9% delta till föregående frekvens)
Mellan 400 - 2000 Hz
(+) | balanserad mellan - endast 4.6% från medianen
(+) | mids är linjära (5.1% delta till föregående frekvens)
Högsta 2 - 16 kHz
(+) | balanserade toppar - endast 1.1% från medianen
(+) | toppar är linjära (3.6% delta till föregående frekvens)
Totalt 100 - 16 000 Hz
(+) | det totala ljudet är linjärt (14.9% skillnad mot median)
Jämfört med samma klass
» 30% av alla testade enheter i den här klassen var bättre, 7% liknande, 63% sämre
» Den bästa hade ett delta på 6%, genomsnittet var 18%, sämst var 132%
Jämfört med alla testade enheter
» 20% av alla testade enheter var bättre, 4% liknande, 76% sämre
» Den bästa hade ett delta på 4%, genomsnittet var 23%, sämst var 134%
Asus FX503VM-EH73 ljudanalys
(-) | inte särskilt höga högtalare (68.2 dB)
Bas 100 - 315 Hz
(±) | reducerad bas - i genomsnitt 11.5% lägre än medianen
(±) | linjäriteten för basen är genomsnittlig (14.8% delta till föregående frekvens)
Mellan 400 - 2000 Hz
(+) | balanserad mellan - endast 1.9% från medianen
(+) | mids är linjära (6.7% delta till föregående frekvens)
Högsta 2 - 16 kHz
(+) | balanserade toppar - endast 4.2% från medianen
(±) | linjäriteten för toppar är genomsnittlig (7.6% delta till föregående frekvens)
Totalt 100 - 16 000 Hz
(±) | linjäriteten för det totala ljudet är genomsnittlig (19.4% skillnad mot median)
Jämfört med samma klass
» 67% av alla testade enheter i den här klassen var bättre, 7% liknande, 26% sämre
» Den bästa hade ett delta på 6%, genomsnittet var 18%, sämst var 132%
Jämfört med alla testade enheter
» 48% av alla testade enheter var bättre, 7% liknande, 45% sämre
» Den bästa hade ett delta på 4%, genomsnittet var 23%, sämst var 134%
| Av/Standby | |
| Låg belastning | |
| Hög belastning |
|
Förklaring:
min: | |
| Dell G5 15 5587 i5-8300H, GeForce GTX 1060 Max-Q, SK hynix SC311 M.2, IPS, 1920x1080, 15.6" | Dell Inspiron 15 7000 7577 i5-7300HQ, GeForce GTX 1050 Mobile, Seagate Mobile HDD 1TB ST1000LX015-1U7172, IPS, 1920x1080, 15.6" | Dell Inspiron 15 7000 7577 i5-7300HQ, GeForce GTX 1060 Max-Q, Samsung PM961 MZVLW256HEHP, IPS, 1920x1080, 15.6" | PC Zentrum Proteus V i7-7700HQ, GeForce GTX 1060 Mobile, Samsung PM961 MZVLW256HEHP, IPS, 1920x1080, 15.6" | Asus FX503VM-EH73 i7-7700HQ, GeForce GTX 1060 Mobile, SanDisk SD8SN8U128G1002, IPS, 1920x1080, 15.6" | Acer Nitro 5 Spin NP515-51-86CX i5-8550U, GeForce GTX 1050 Mobile, Micron 1100 MTFDDAV256TBN, IPS, 1920x1080, 15.6" | Acer Predator Helios 300 PH317-52-51M6 i5-8300H, GeForce GTX 1050 Ti Mobile, Hynix HFS128G39TND, IPS, 1920x1080, 17.3" | Genomsnitt NVIDIA GeForce GTX 1060 Max-Q | Genomsnitt av klass Gaming | |
|---|---|---|---|---|---|---|---|---|---|
| Power Consumption | 3% | 8% | -181% | -50% | 20% | -10% | -40% | -112% | |
| Idle Minimum * (Watt) | 4.9 | 5.3 -8% | 7.1 -45% | 28 -471% | 12.8 -161% | 4.1 16% | 6 -22% | 9.14 ? -87% | 13 ? -165% |
| Idle Average * (Watt) | 8.5 | 8.8 -4% | 7.6 11% | 32 -276% | 15.4 -81% | 7.4 13% | 9 -6% | 13.2 ? -55% | 19 ? -124% |
| Idle Maximum * (Watt) | 9.1 | 9.7 -7% | 8.6 5% | 38 -318% | 15.9 -75% | 8.6 5% | 13 -43% | 15.1 ? -66% | 24.6 ? -170% |
| Load Average * (Watt) | 90.7 | 100 -10% | 59.5 34% | 91 -0% | 78 14% | 66 27% | 95 -5% | 88.3 ? 3% | 110.7 ? -22% |
| Witcher 3 ultra * (Watt) | 110 | 87 21% | 89 19% | 124 -13% | 107.3 2% | 102 7% | |||
| Load Maximum * (Watt) | 144 | 109 24% | 112.8 22% | 152 -6% | 143.4 -0% | 87 40% | 134 7% | 134.9 ? 6% | 259 ? -80% |
* ... mindre är bättre
| Dell G5 15 5587 i5-8300H, GeForce GTX 1060 Max-Q, 56 Wh | Dell Inspiron 15 7000 7577 i5-7300HQ, GeForce GTX 1050 Mobile, 56 Wh | Dell Inspiron 15 7000 7577 i5-7300HQ, GeForce GTX 1060 Max-Q, 56 Wh | PC Zentrum Proteus V i7-7700HQ, GeForce GTX 1060 Mobile, Wh | Asus FX503VM-EH73 i7-7700HQ, GeForce GTX 1060 Mobile, 64 Wh | Acer Nitro 5 Spin NP515-51-86CX i5-8550U, GeForce GTX 1050 Mobile, 48 Wh | Acer Predator Helios 300 PH317-52-51M6 i5-8300H, GeForce GTX 1050 Ti Mobile, 48 Wh | Genomsnitt av klass Gaming | |
|---|---|---|---|---|---|---|---|---|
| Batteridrifttid | -6% | -9% | -47% | -44% | 2% | -11% | 0% | |
| Reader / Idle (h) | 11.8 | 11.1 -6% | 11 -7% | 3.7 -69% | 5.7 -52% | 12.5 6% | 11.8 0% | 8.27 ? -30% |
| H.264 (h) | 5.4 | 5.2 -4% | 3.3 -39% | 6.2 15% | 8.32 ? 54% | |||
| WiFi v1.3 (h) | 6.5 | 6.8 5% | 6.9 6% | 3.3 -49% | 4.6 -29% | 6.6 2% | 5.9 -9% | 7.11 ? 9% |
| Load (h) | 2.2 | 1.8 -18% | 1.6 -27% | 1.5 -32% | 1.1 -50% | 1.9 -14% | 1.7 -23% | 1.502 ? -32% |
För
Emot
Läs den fullständiga versionen av den här recensionen på engelska här.
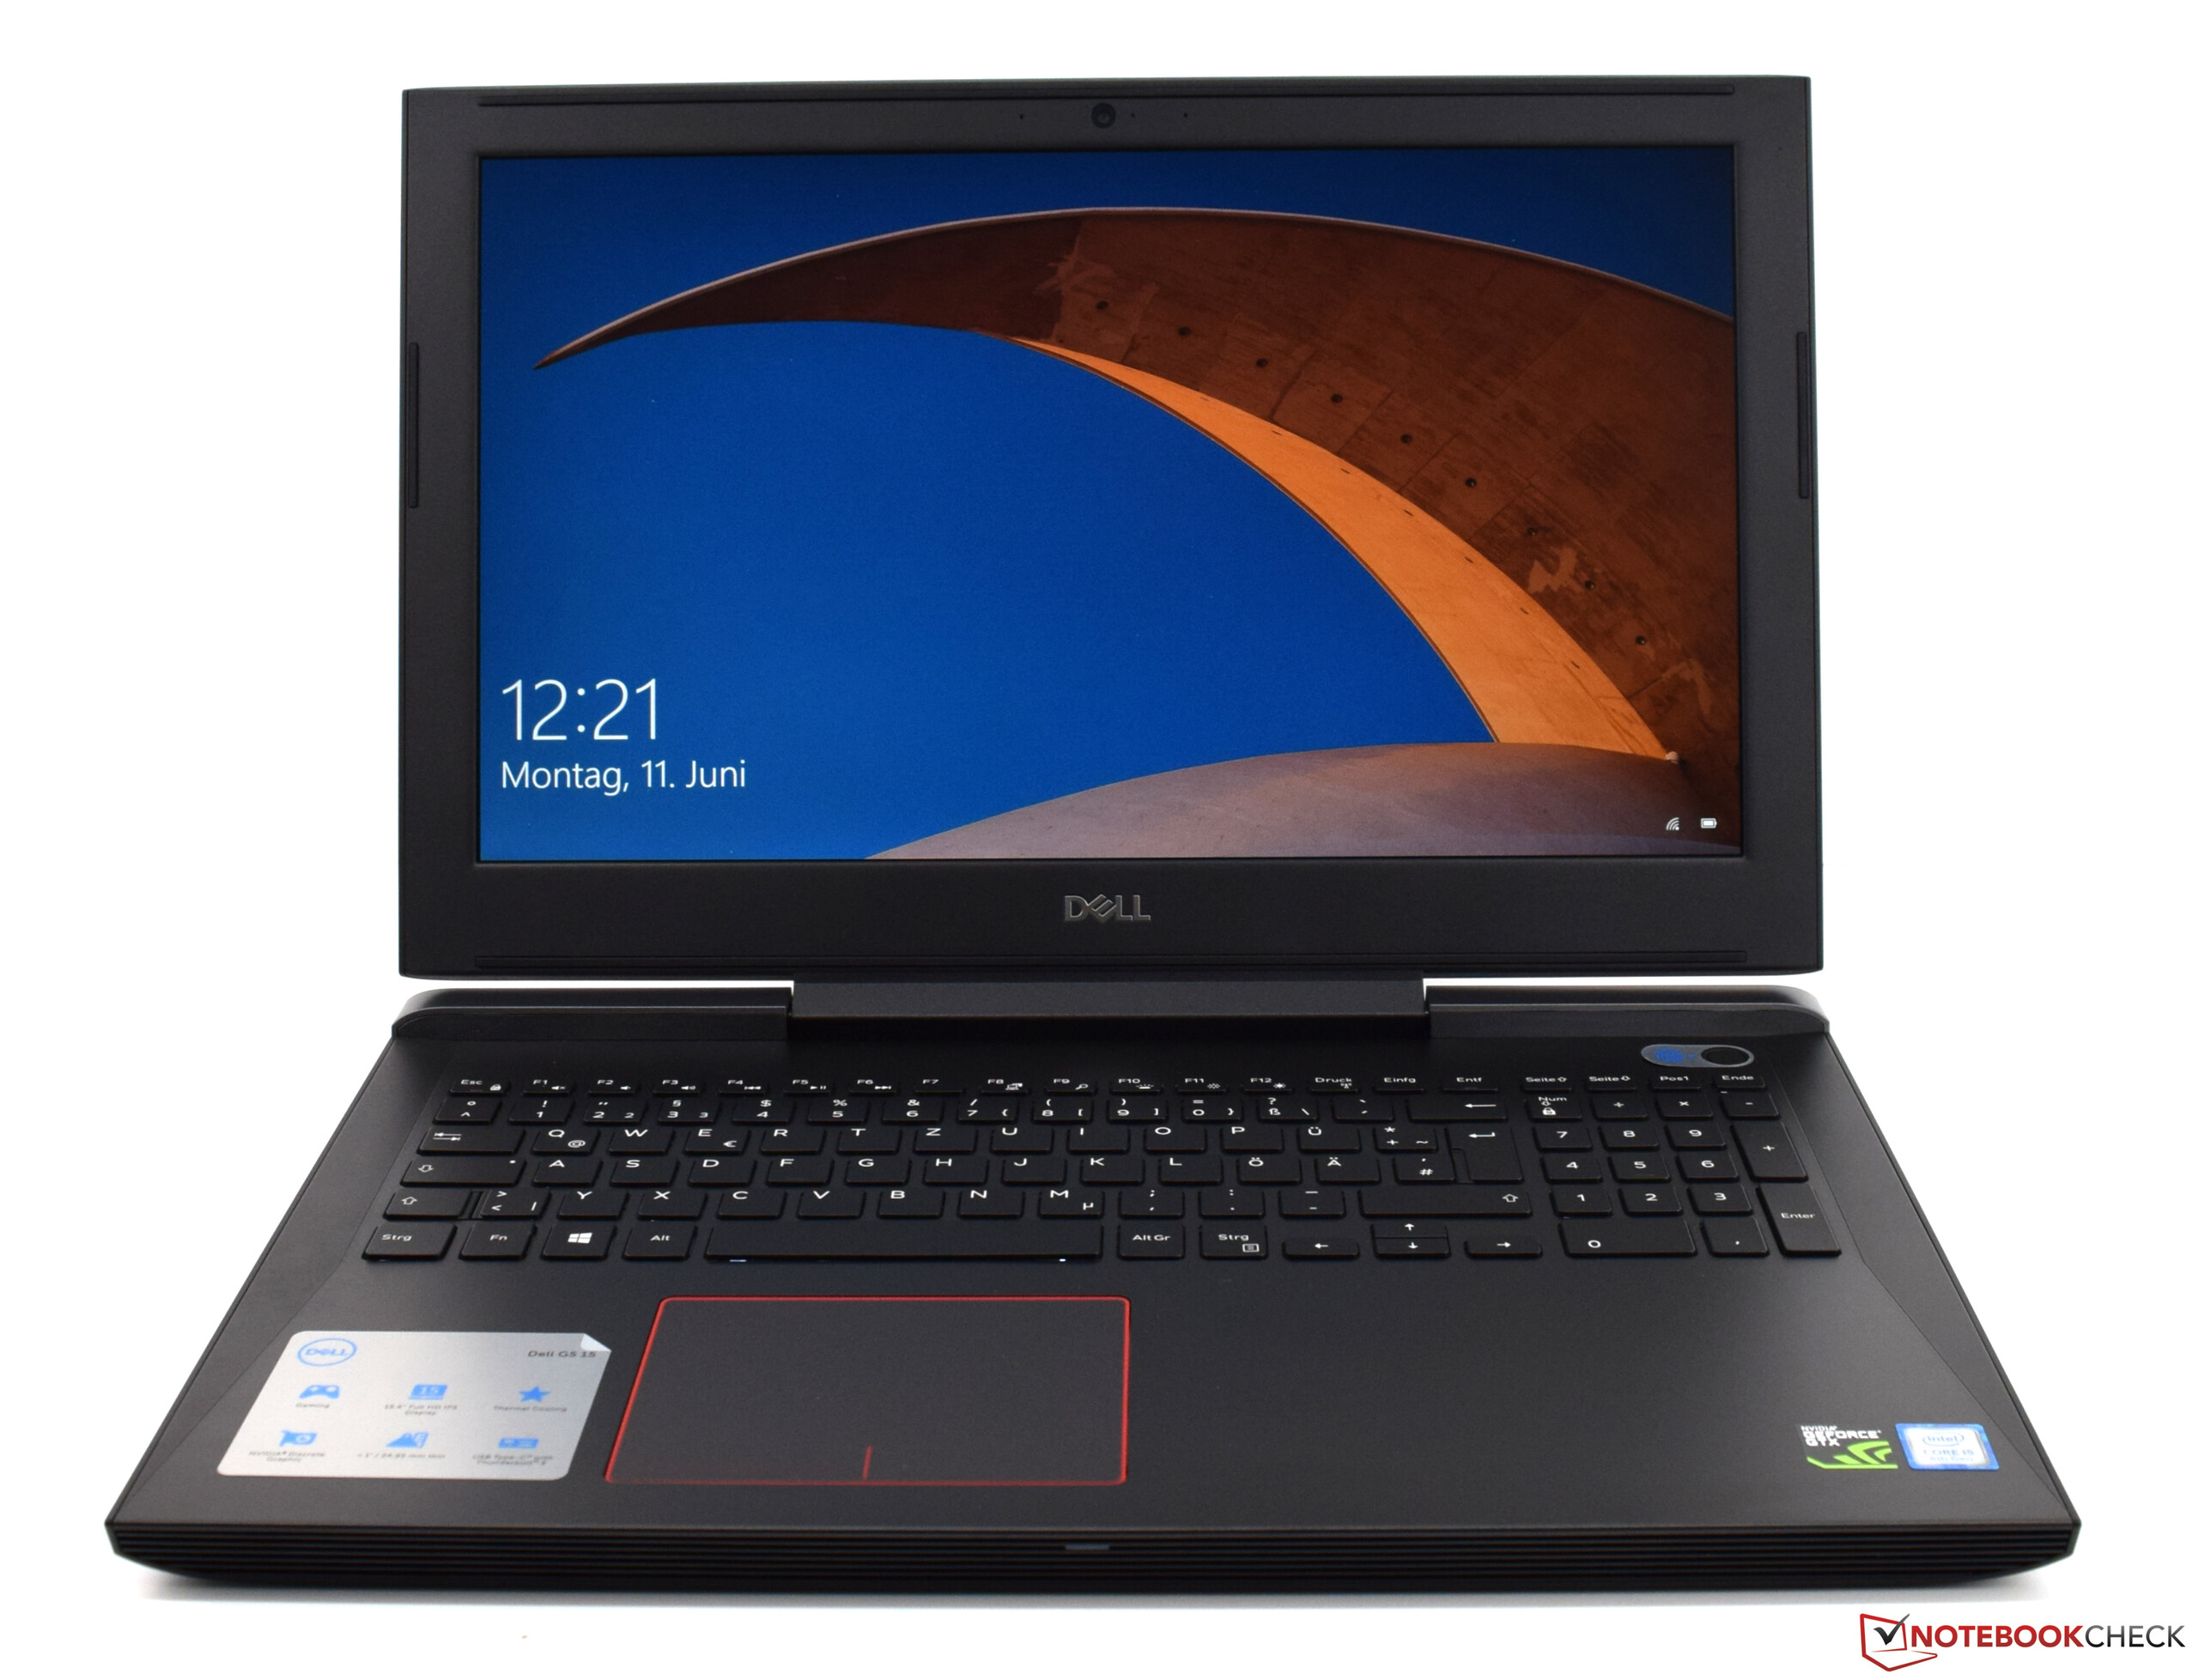
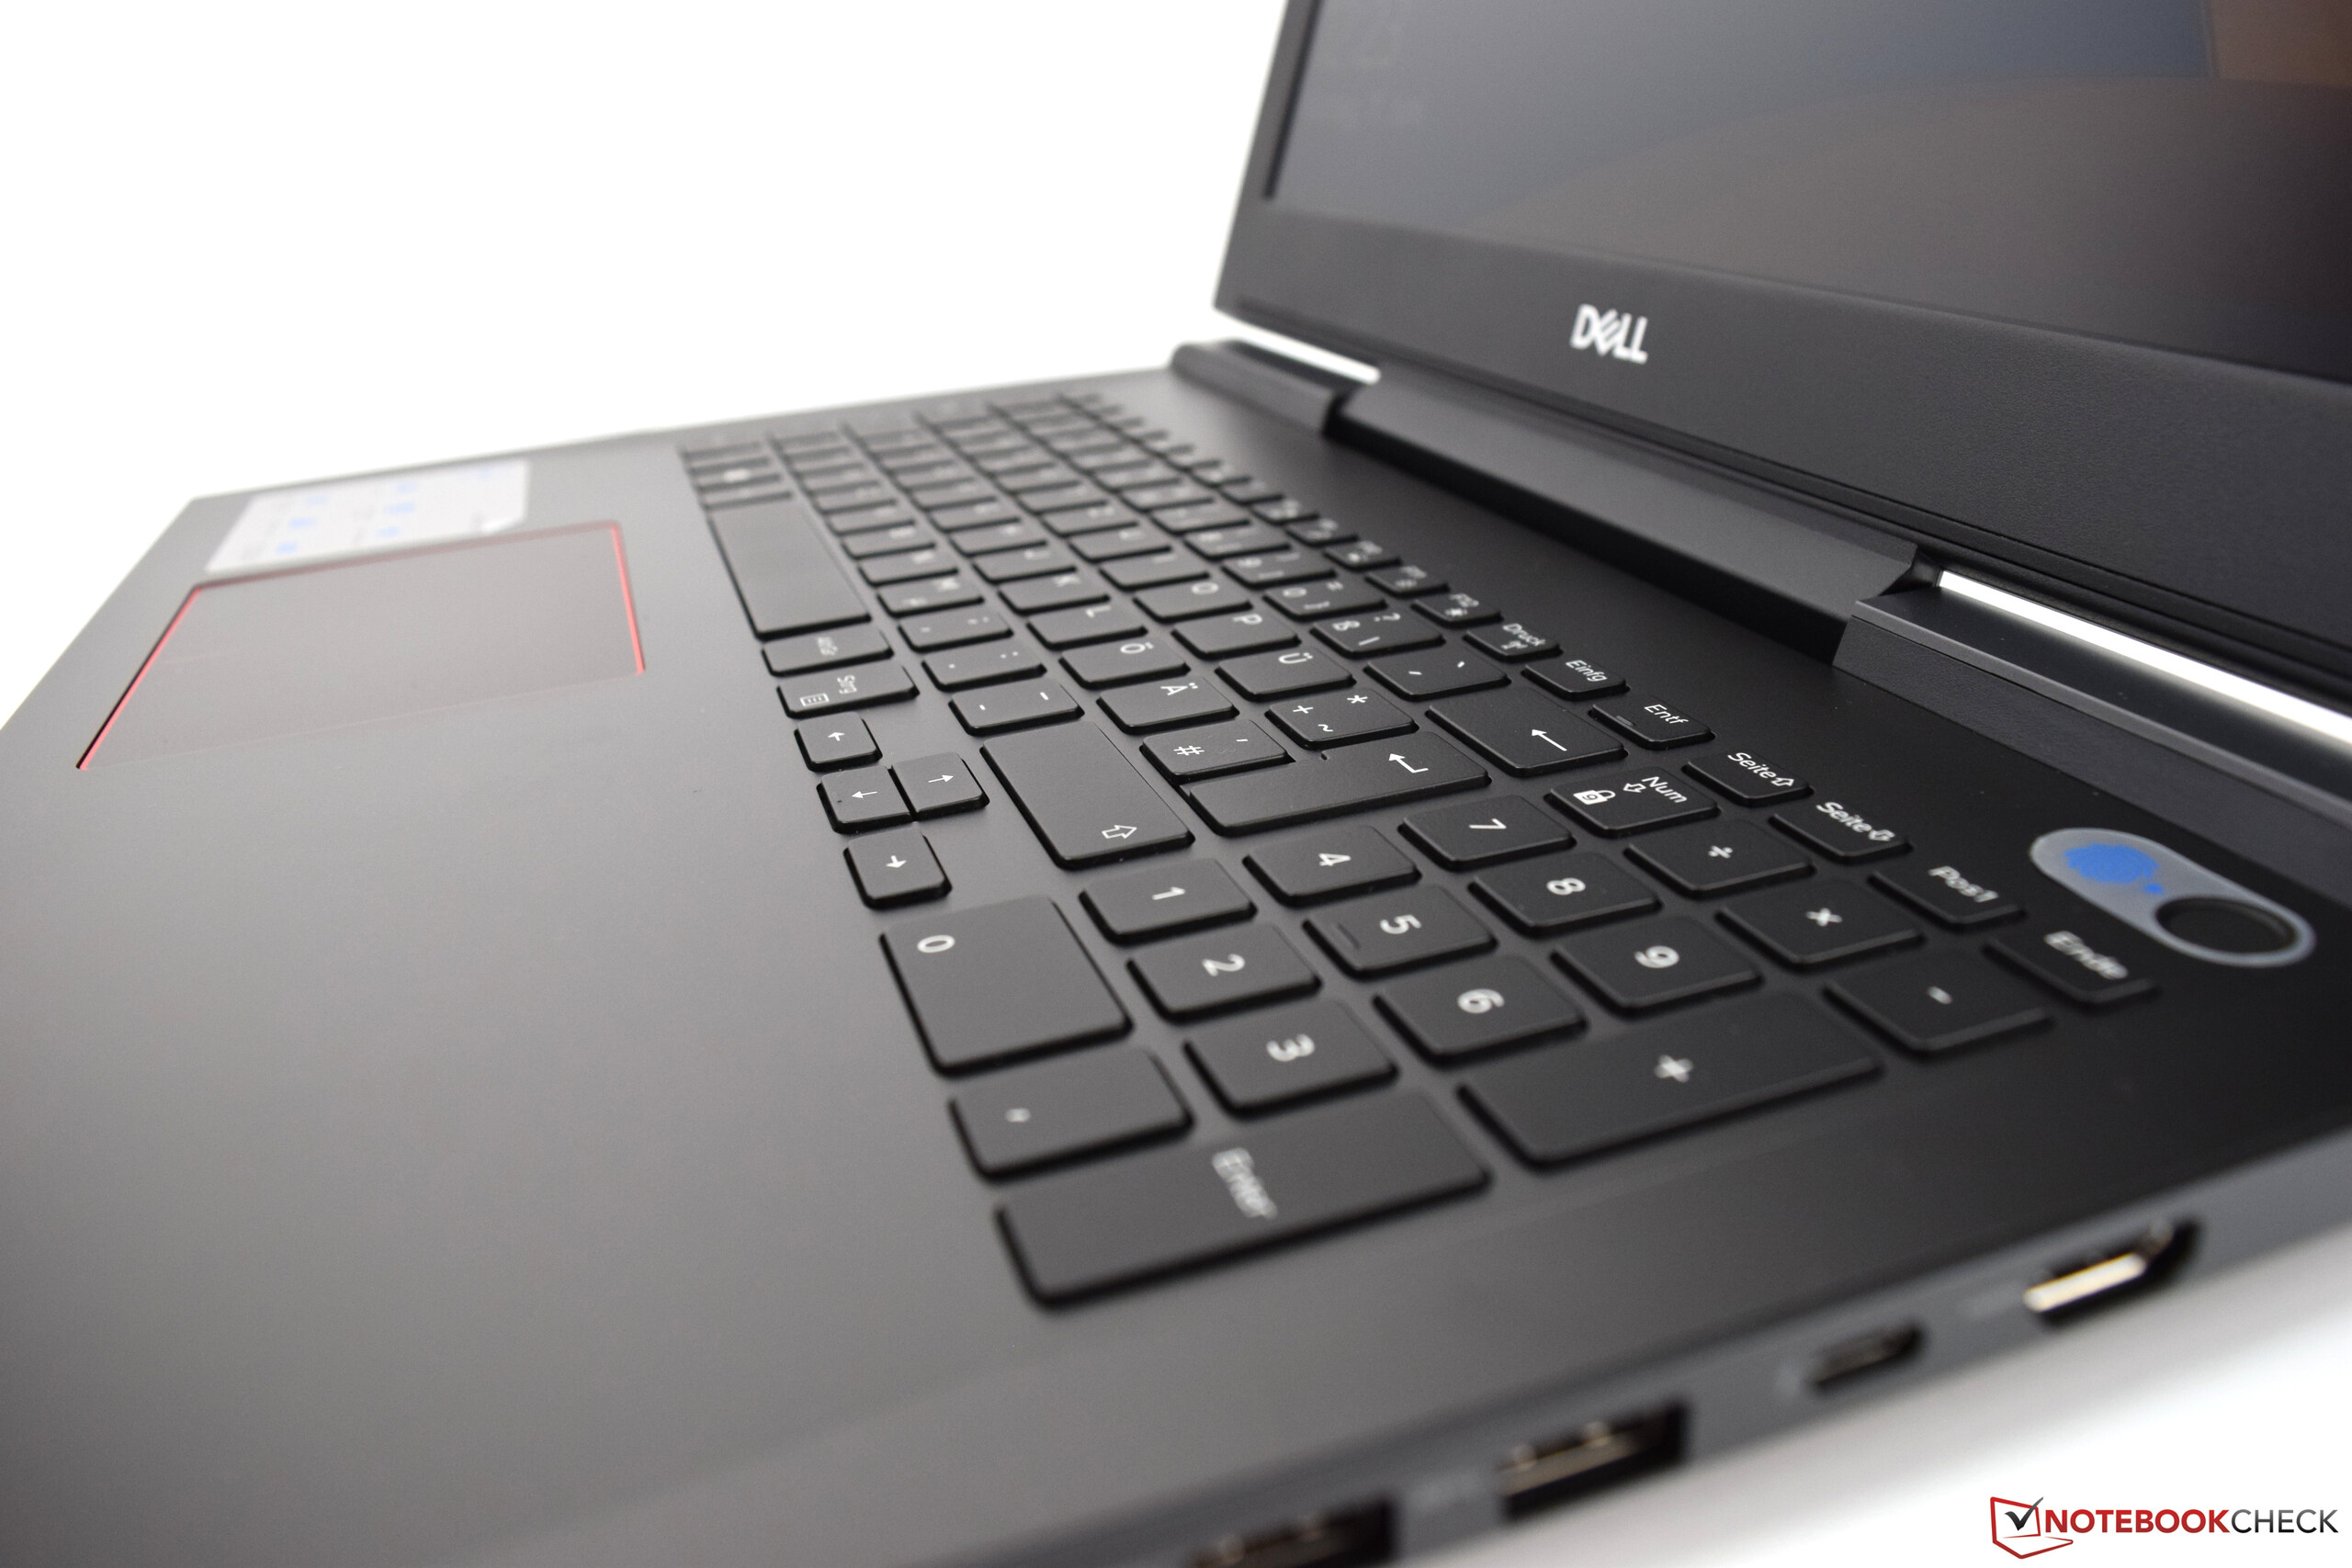
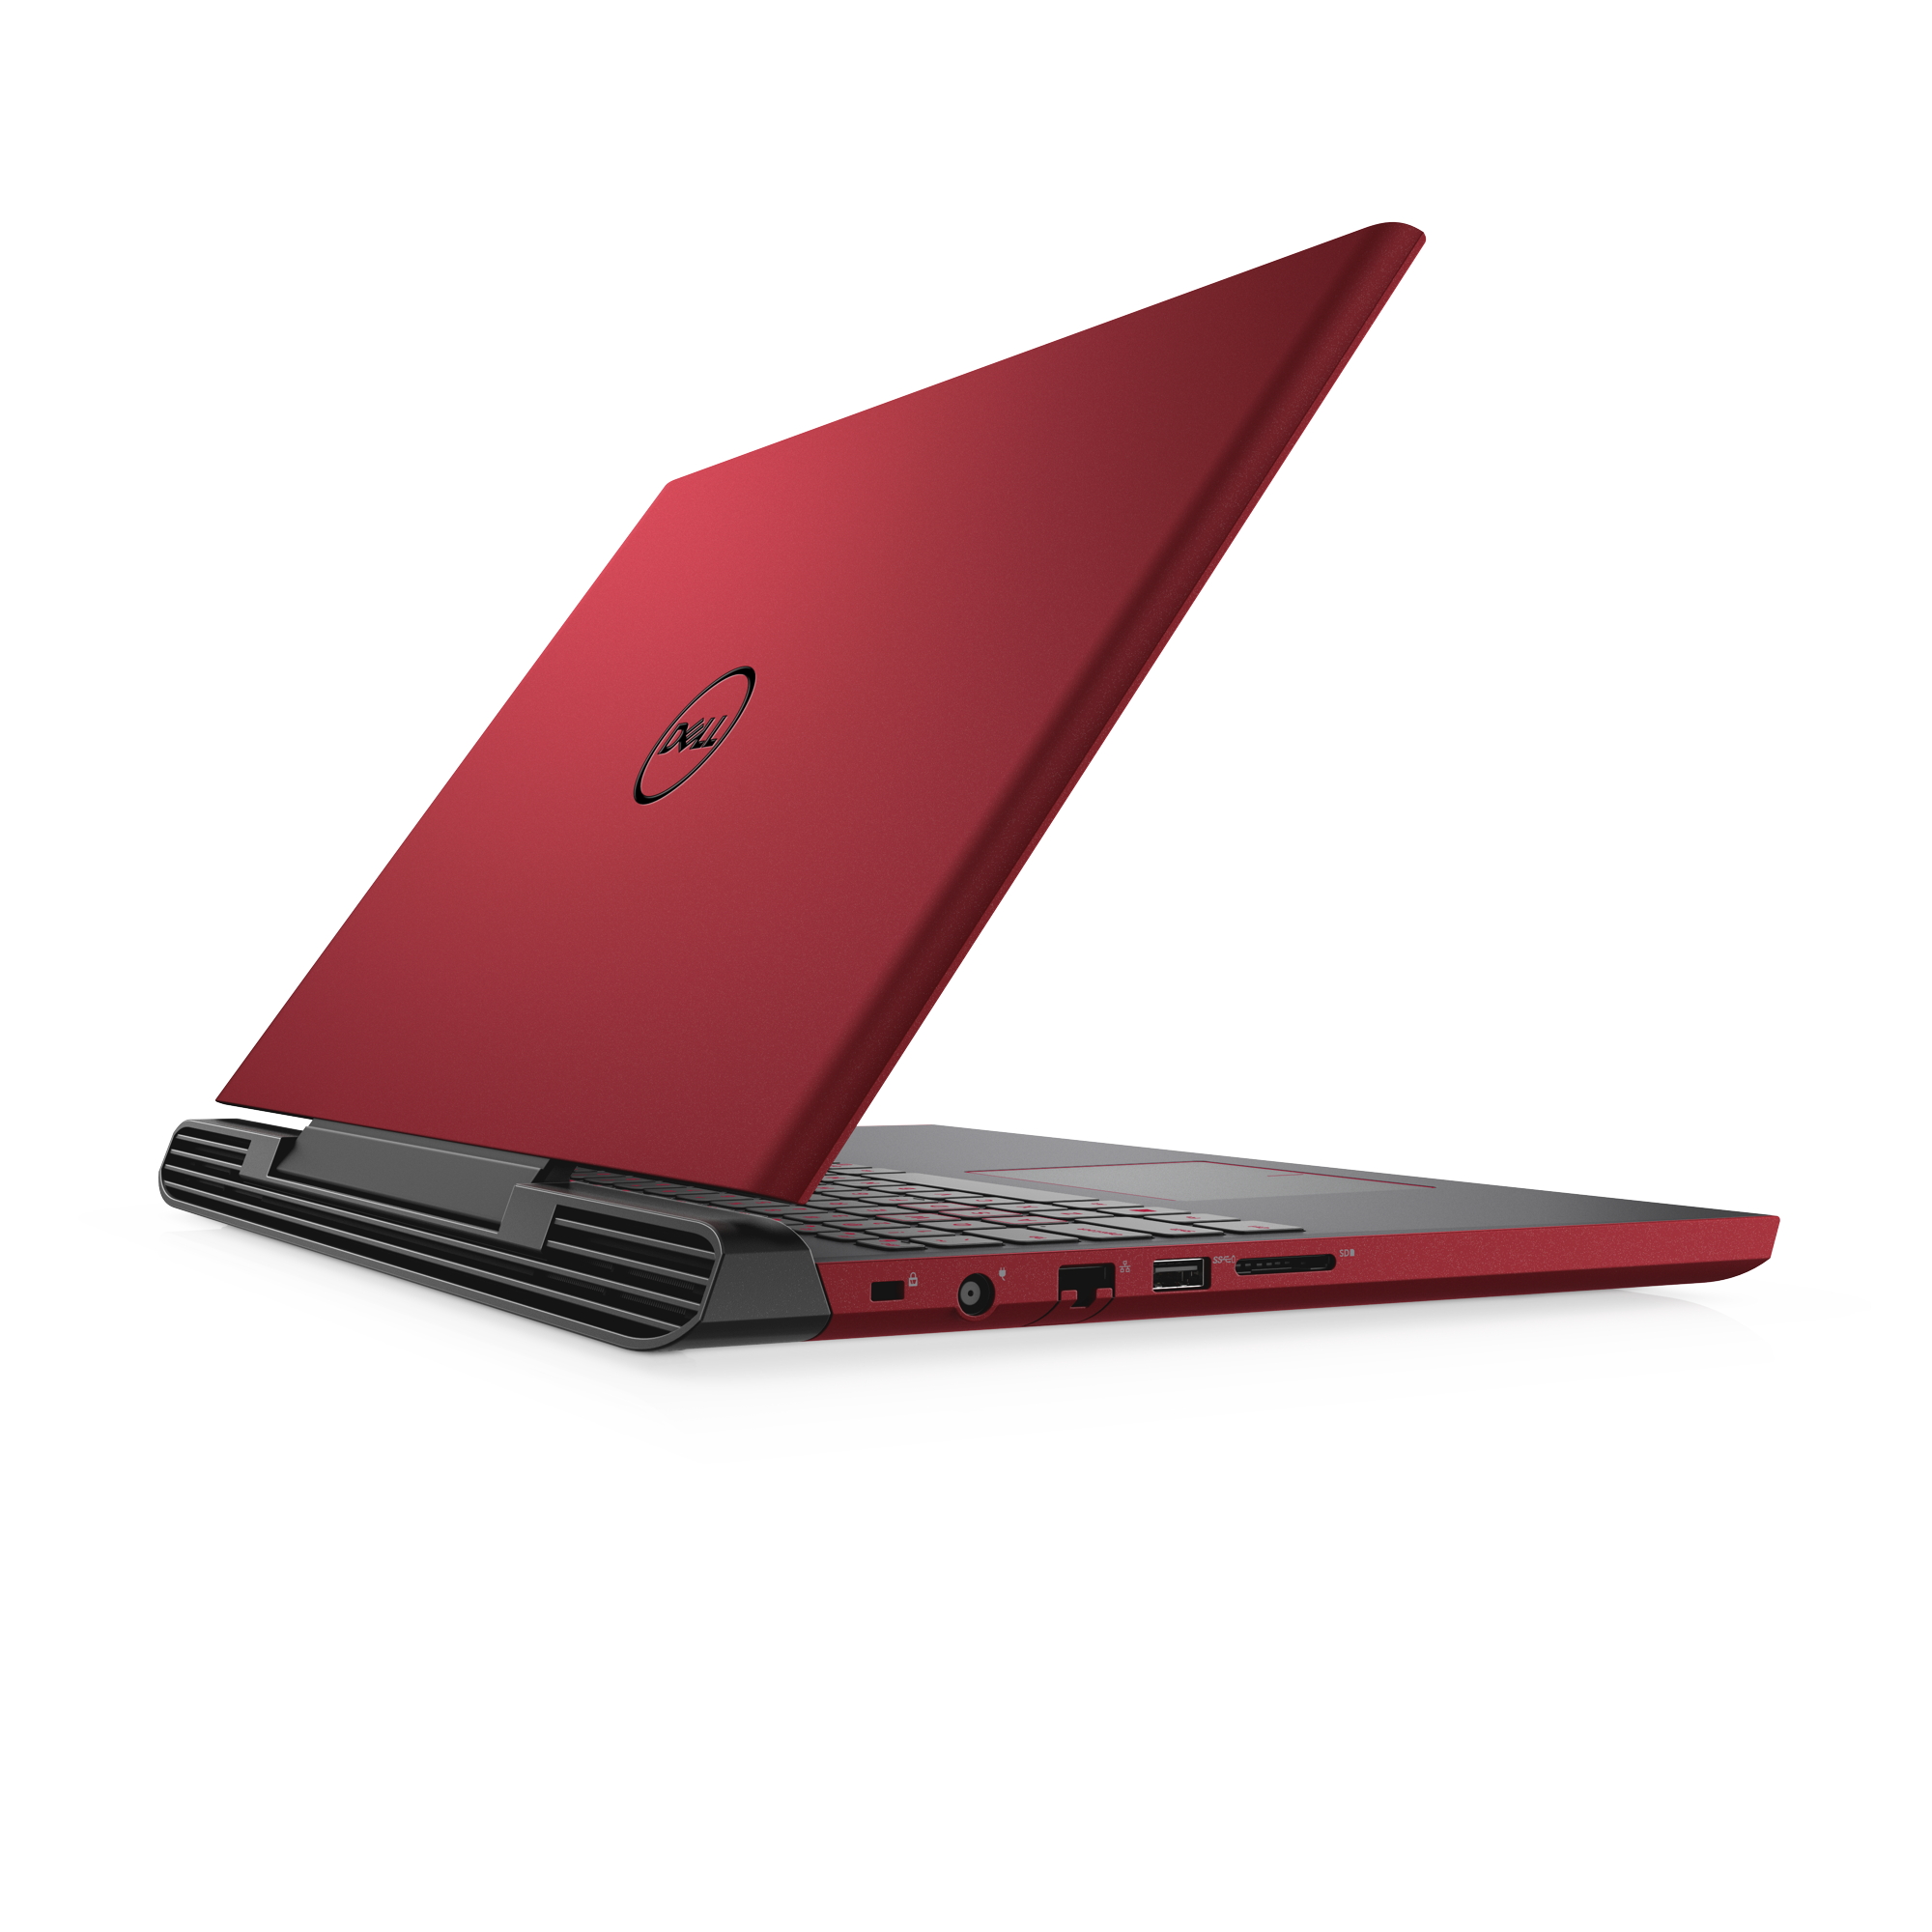
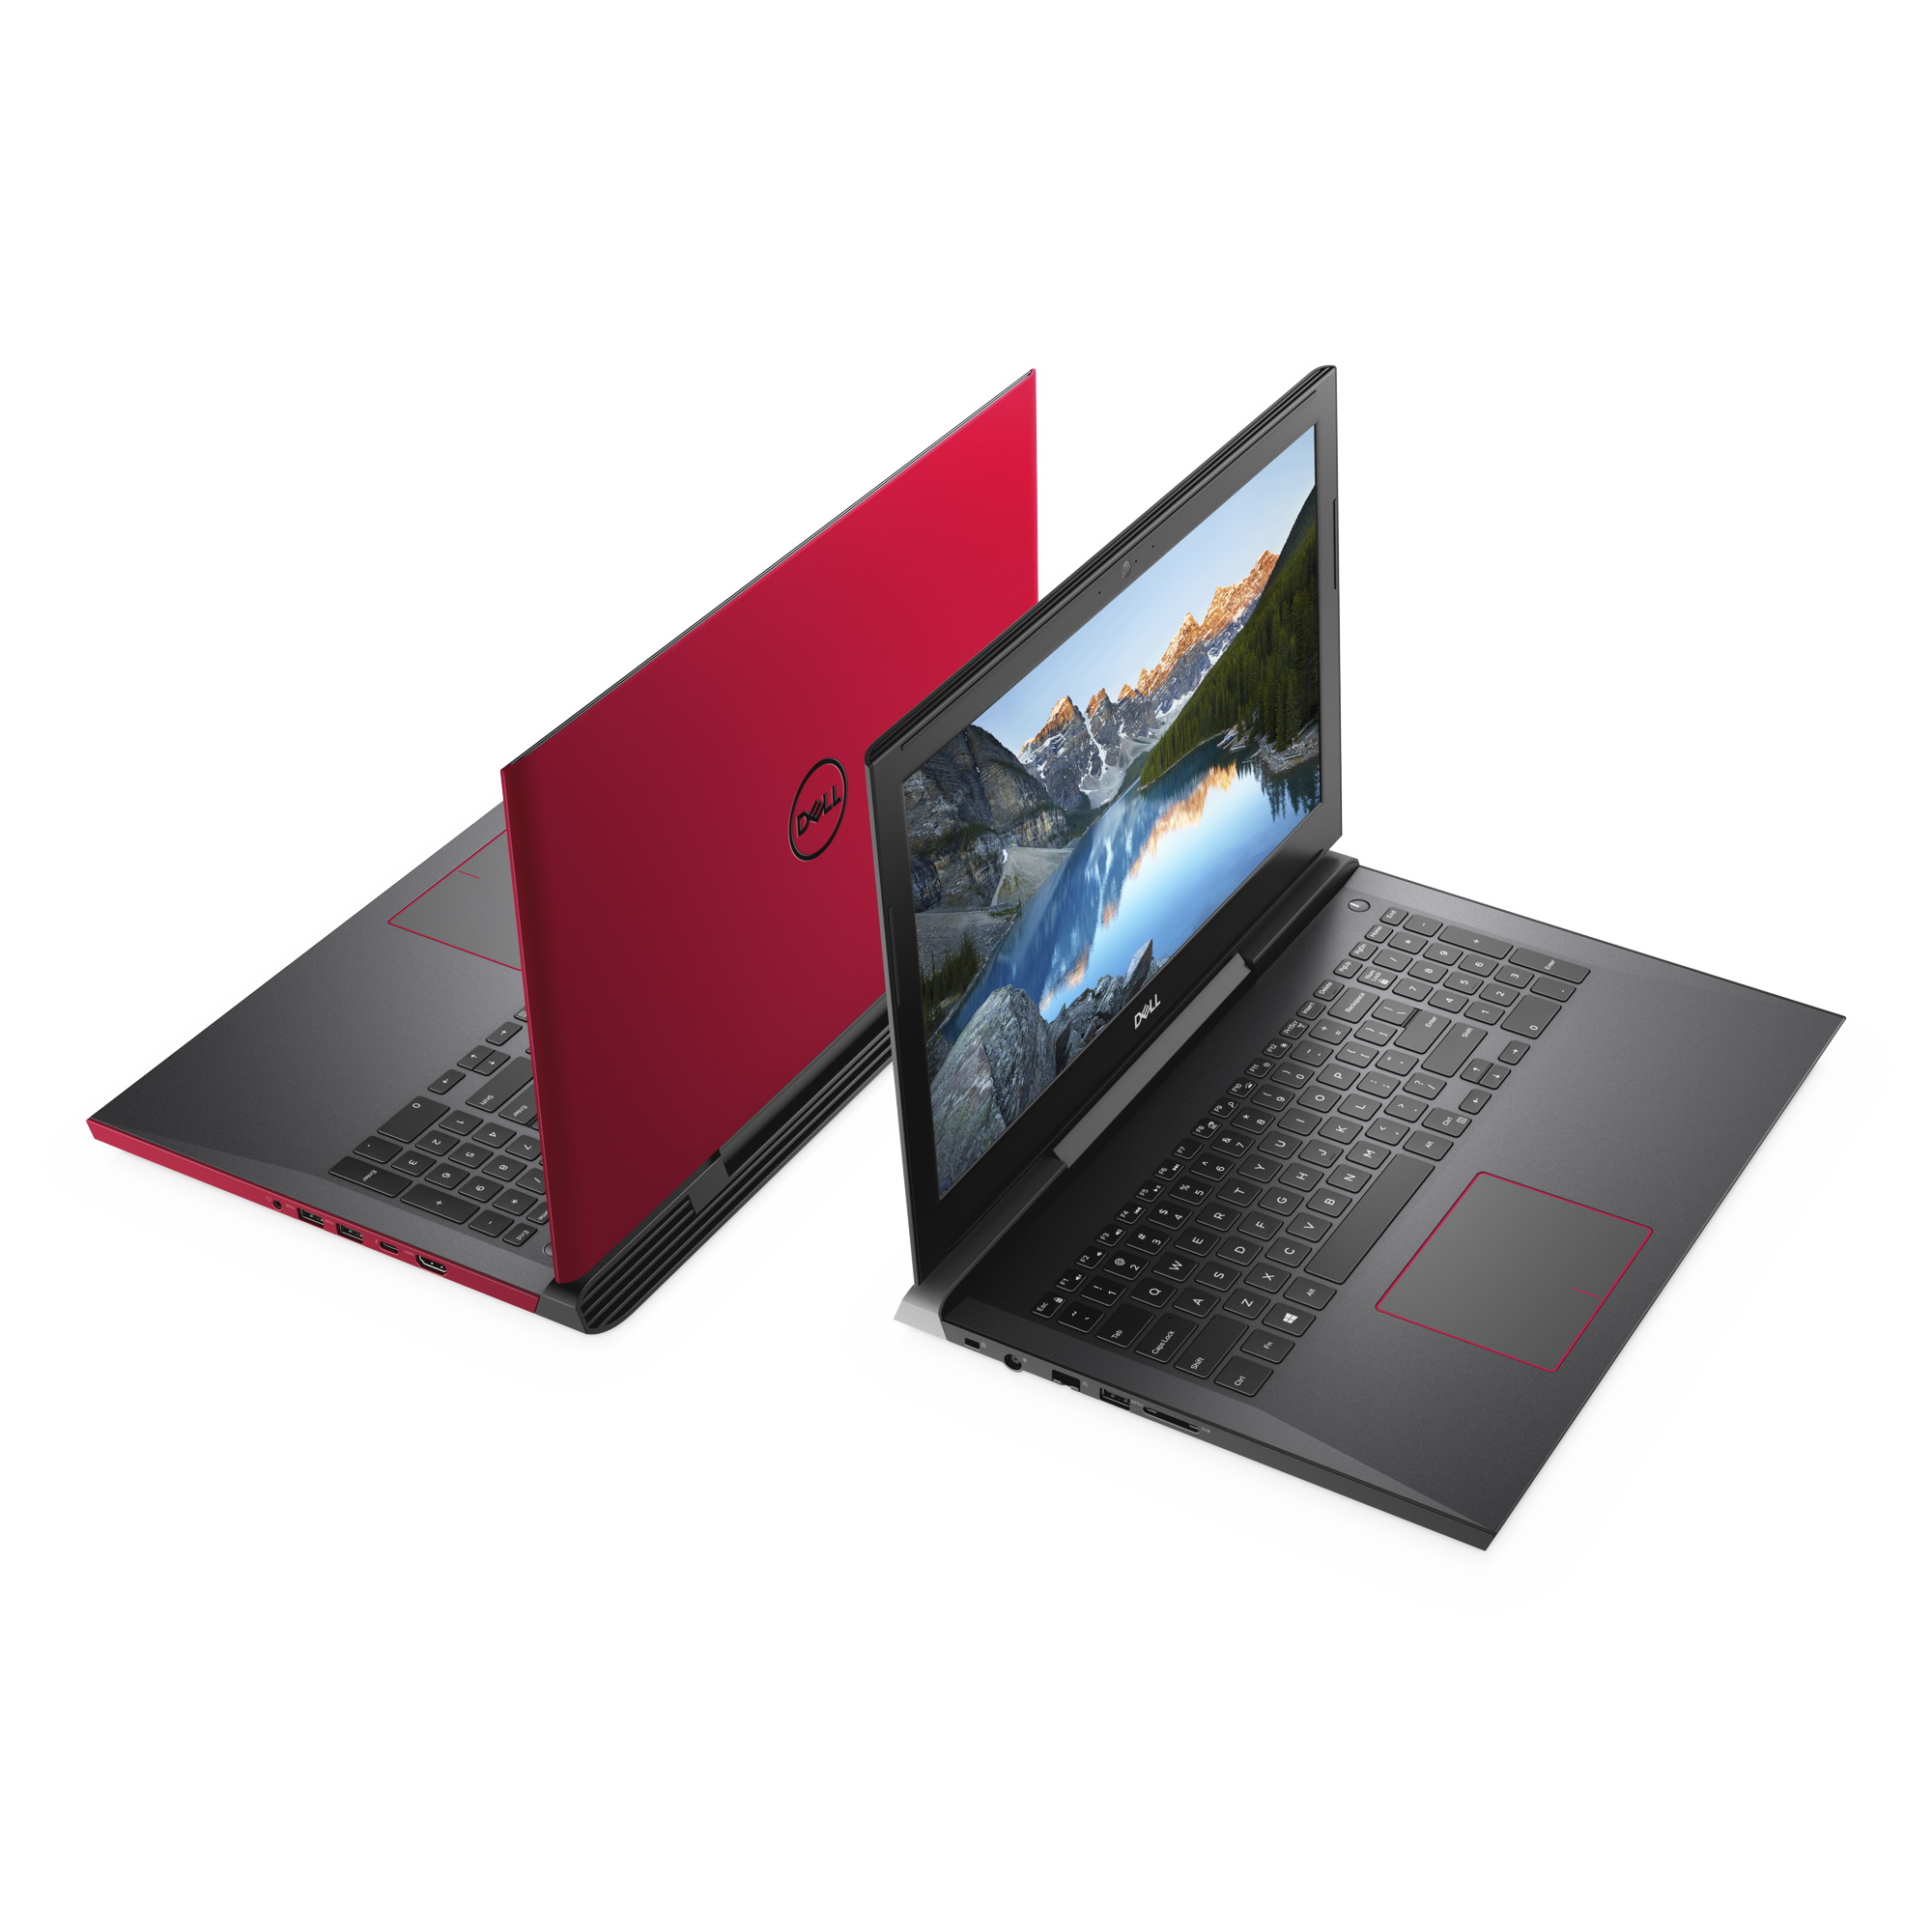
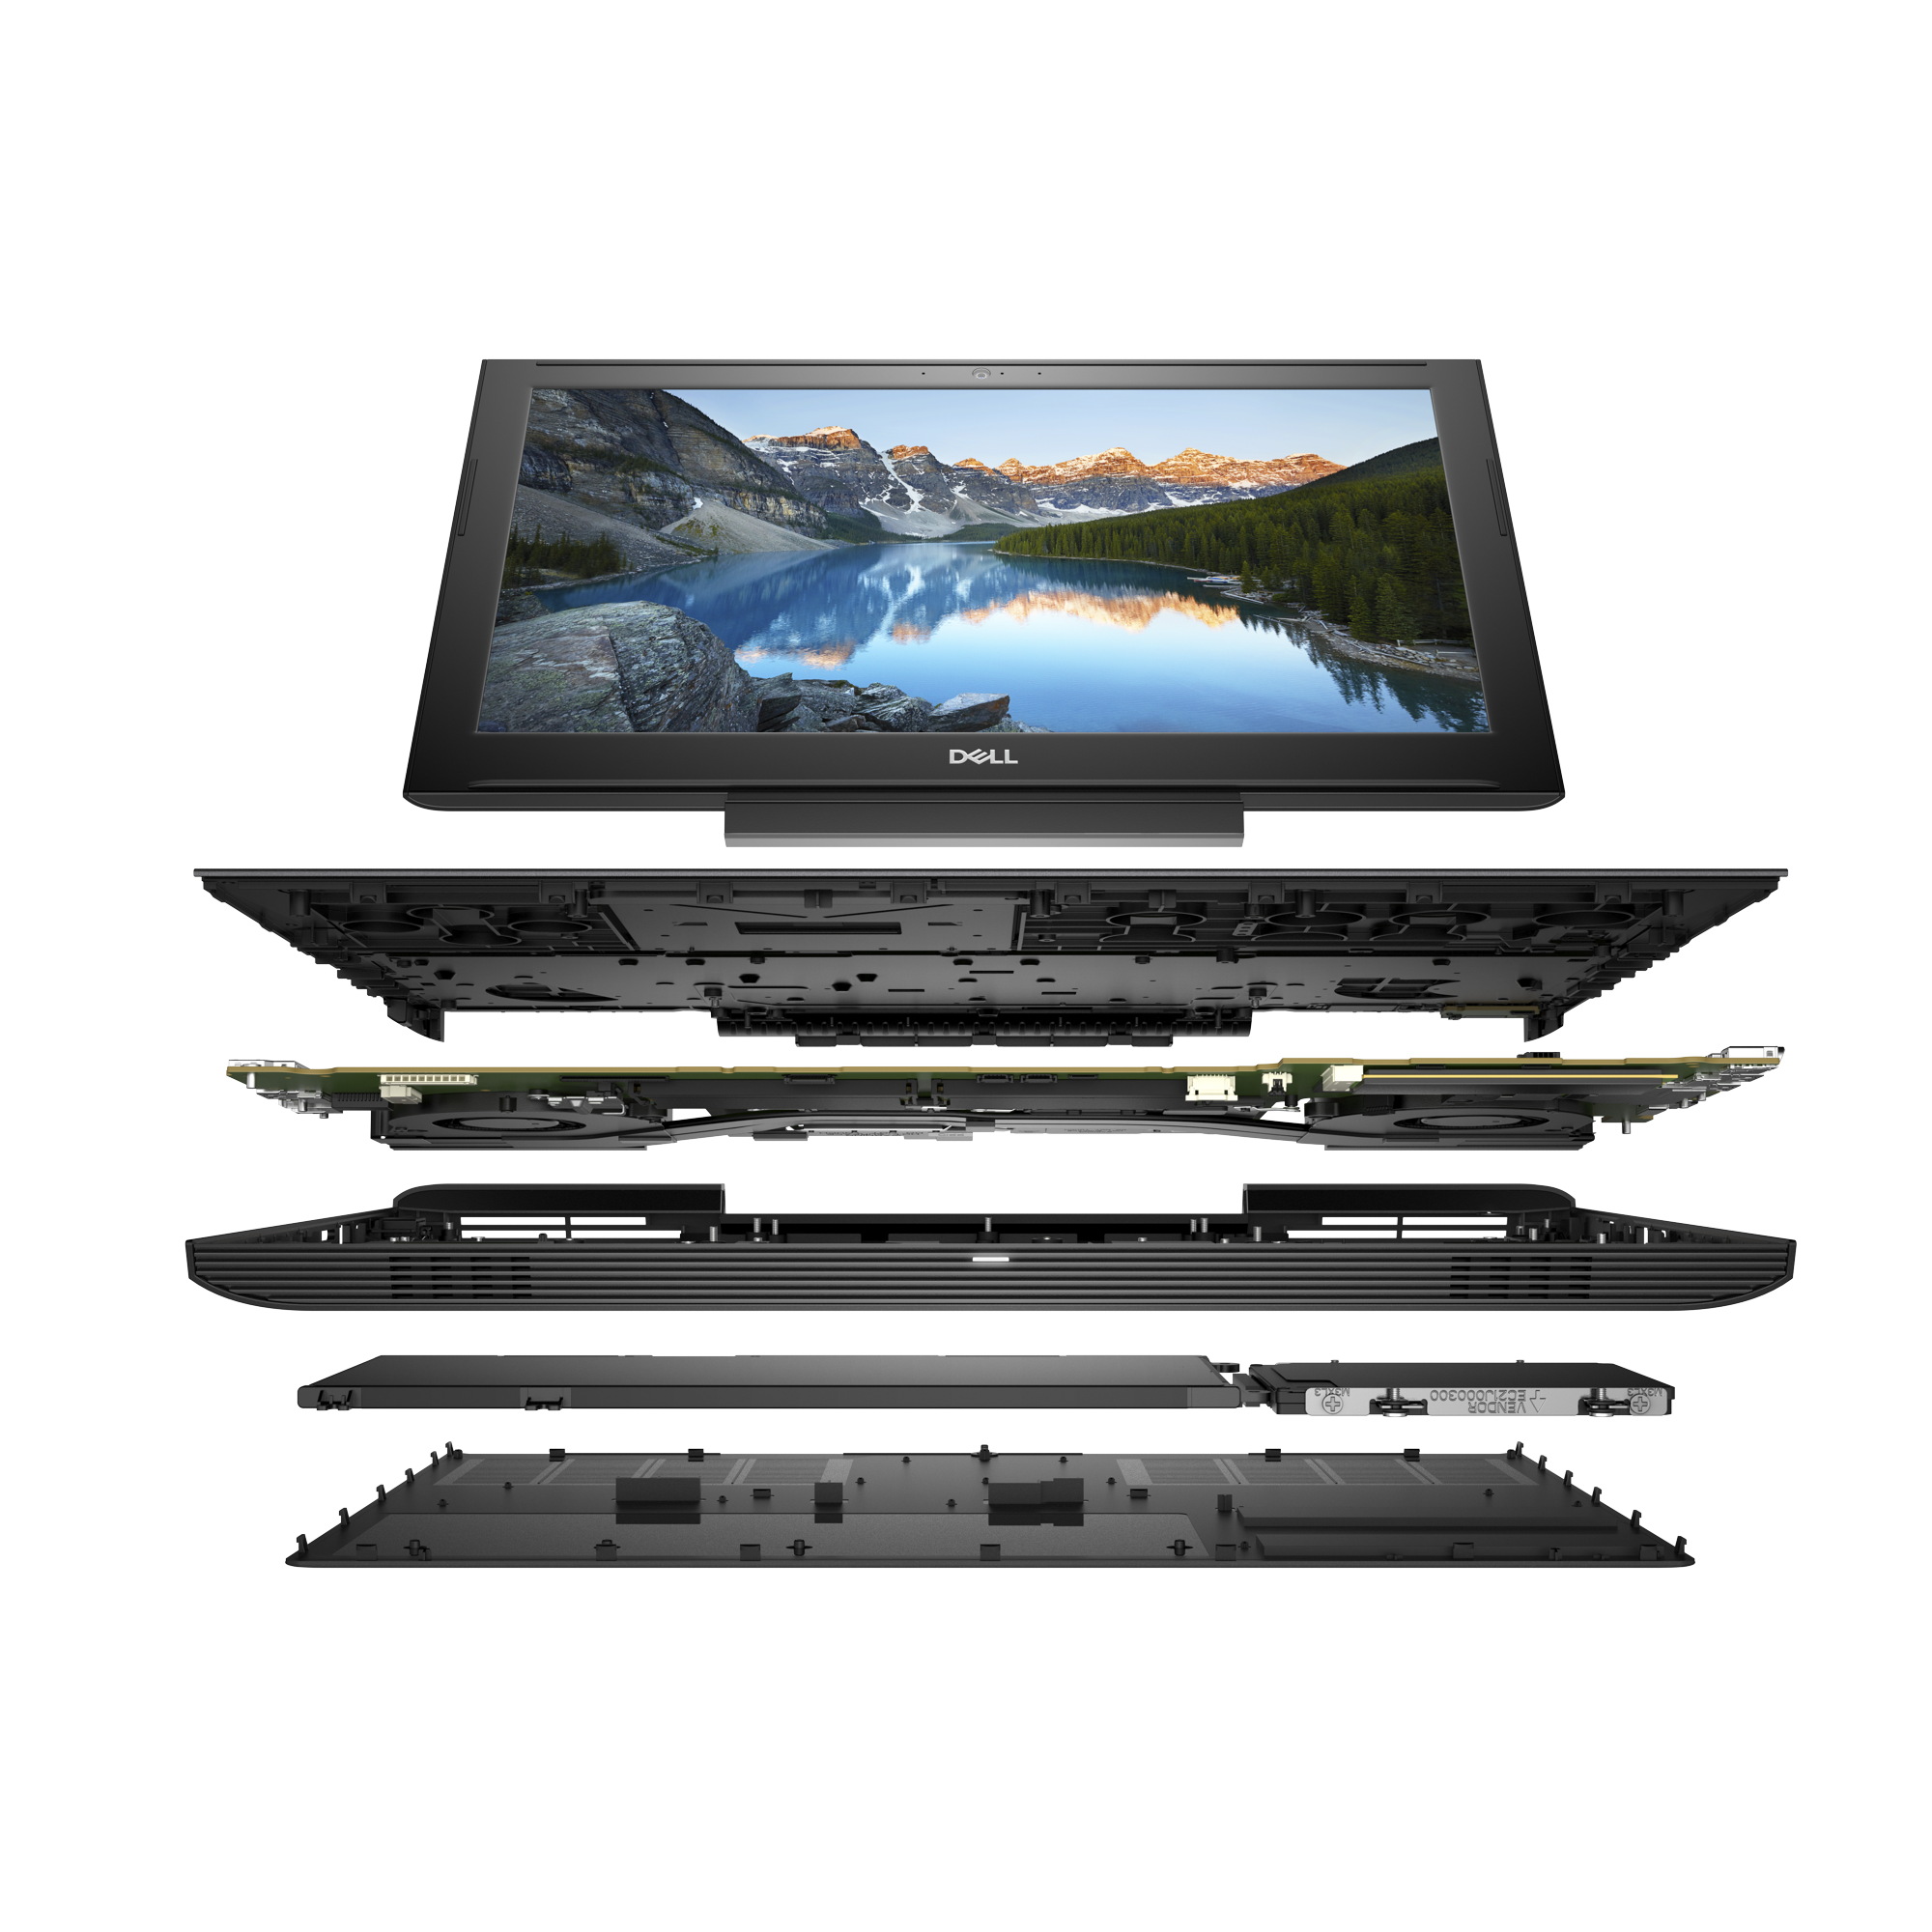
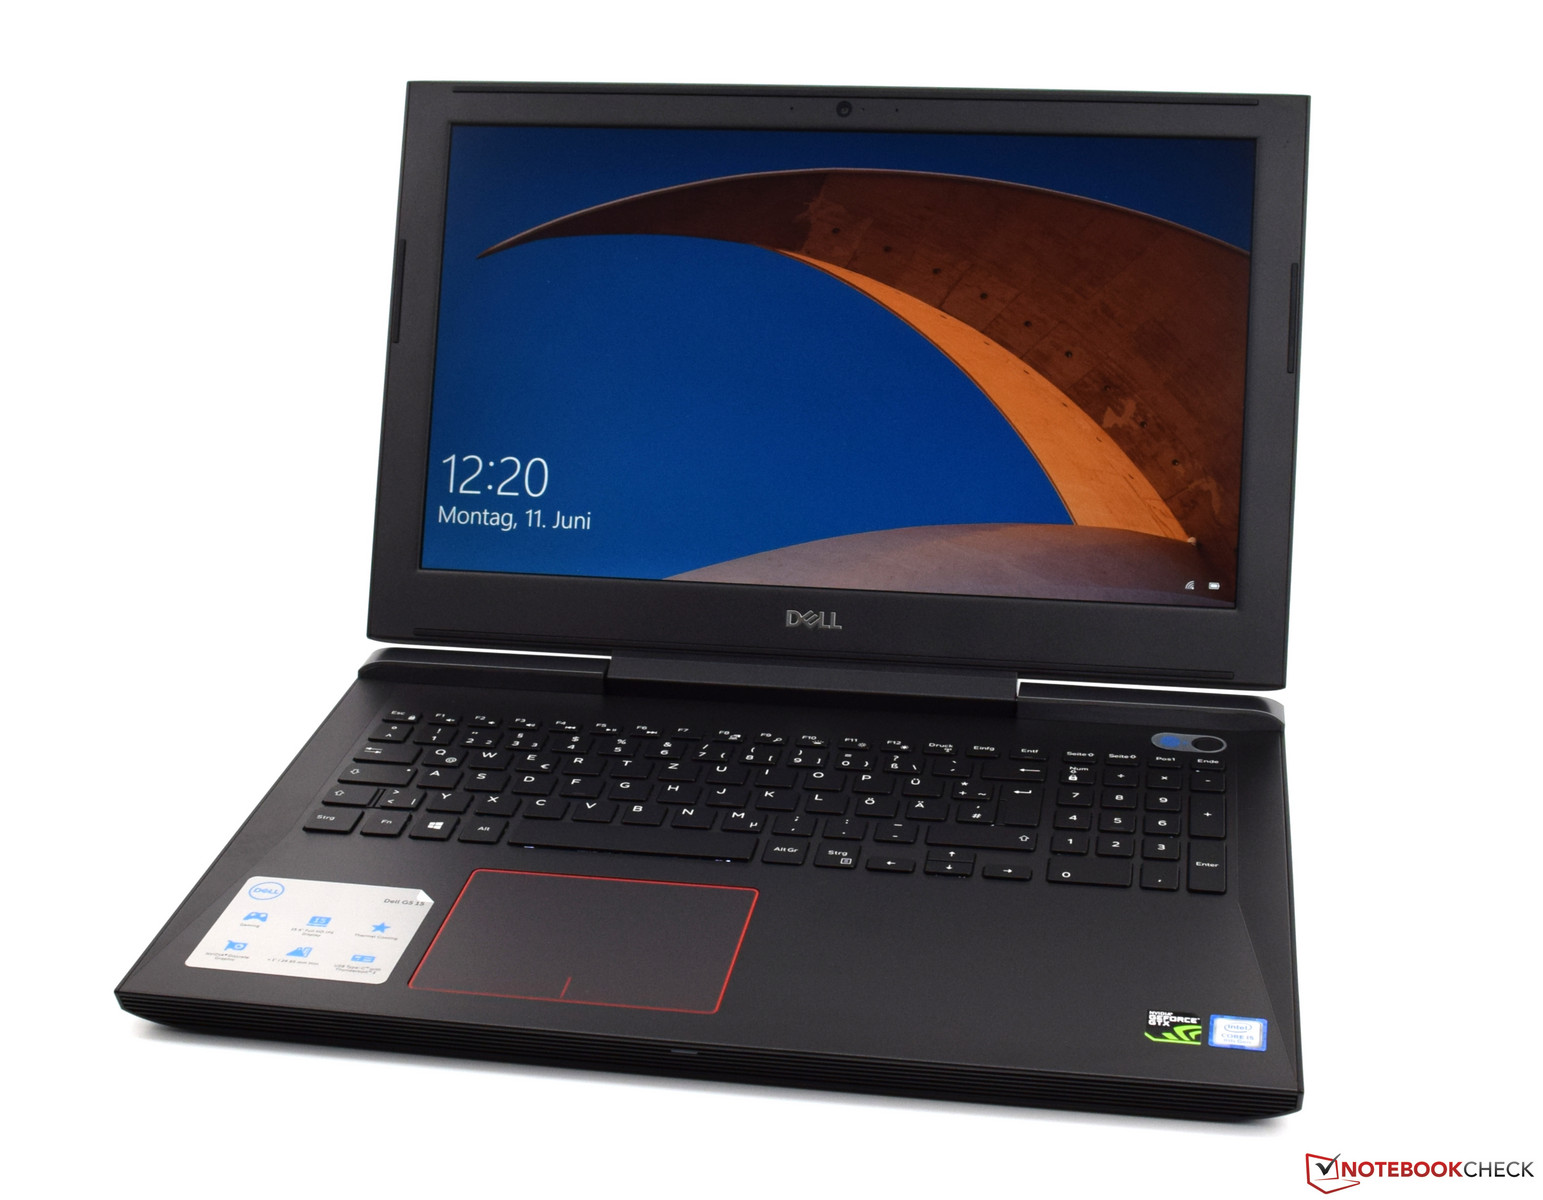
Dell G5 5587 fortsätter att vara en bra spellaptop som i synnerhet attraherar köpare med sitt tilltalande pris. Vi övertygades av det rejäla och robusta höljet med gångjärn i mitten som bidrog till ett riktigt stabilt lock. Tack vare en splitter ny CPU är enheten aningen snabbare än sin föregångare, som fortfarande hade den extra Inspiron-etiketten. Den som inte tycker att Intel Core i5-8300H är tillräcklig kan istället välja Intel Core i7-8750H, som med sina sex kärnor förbättrar den redan utmärkta multitrådade prestandan ännu mer. Men det rimliga valet bör vara den mindre i5-modellen, som klarade sig bra i vårt test.
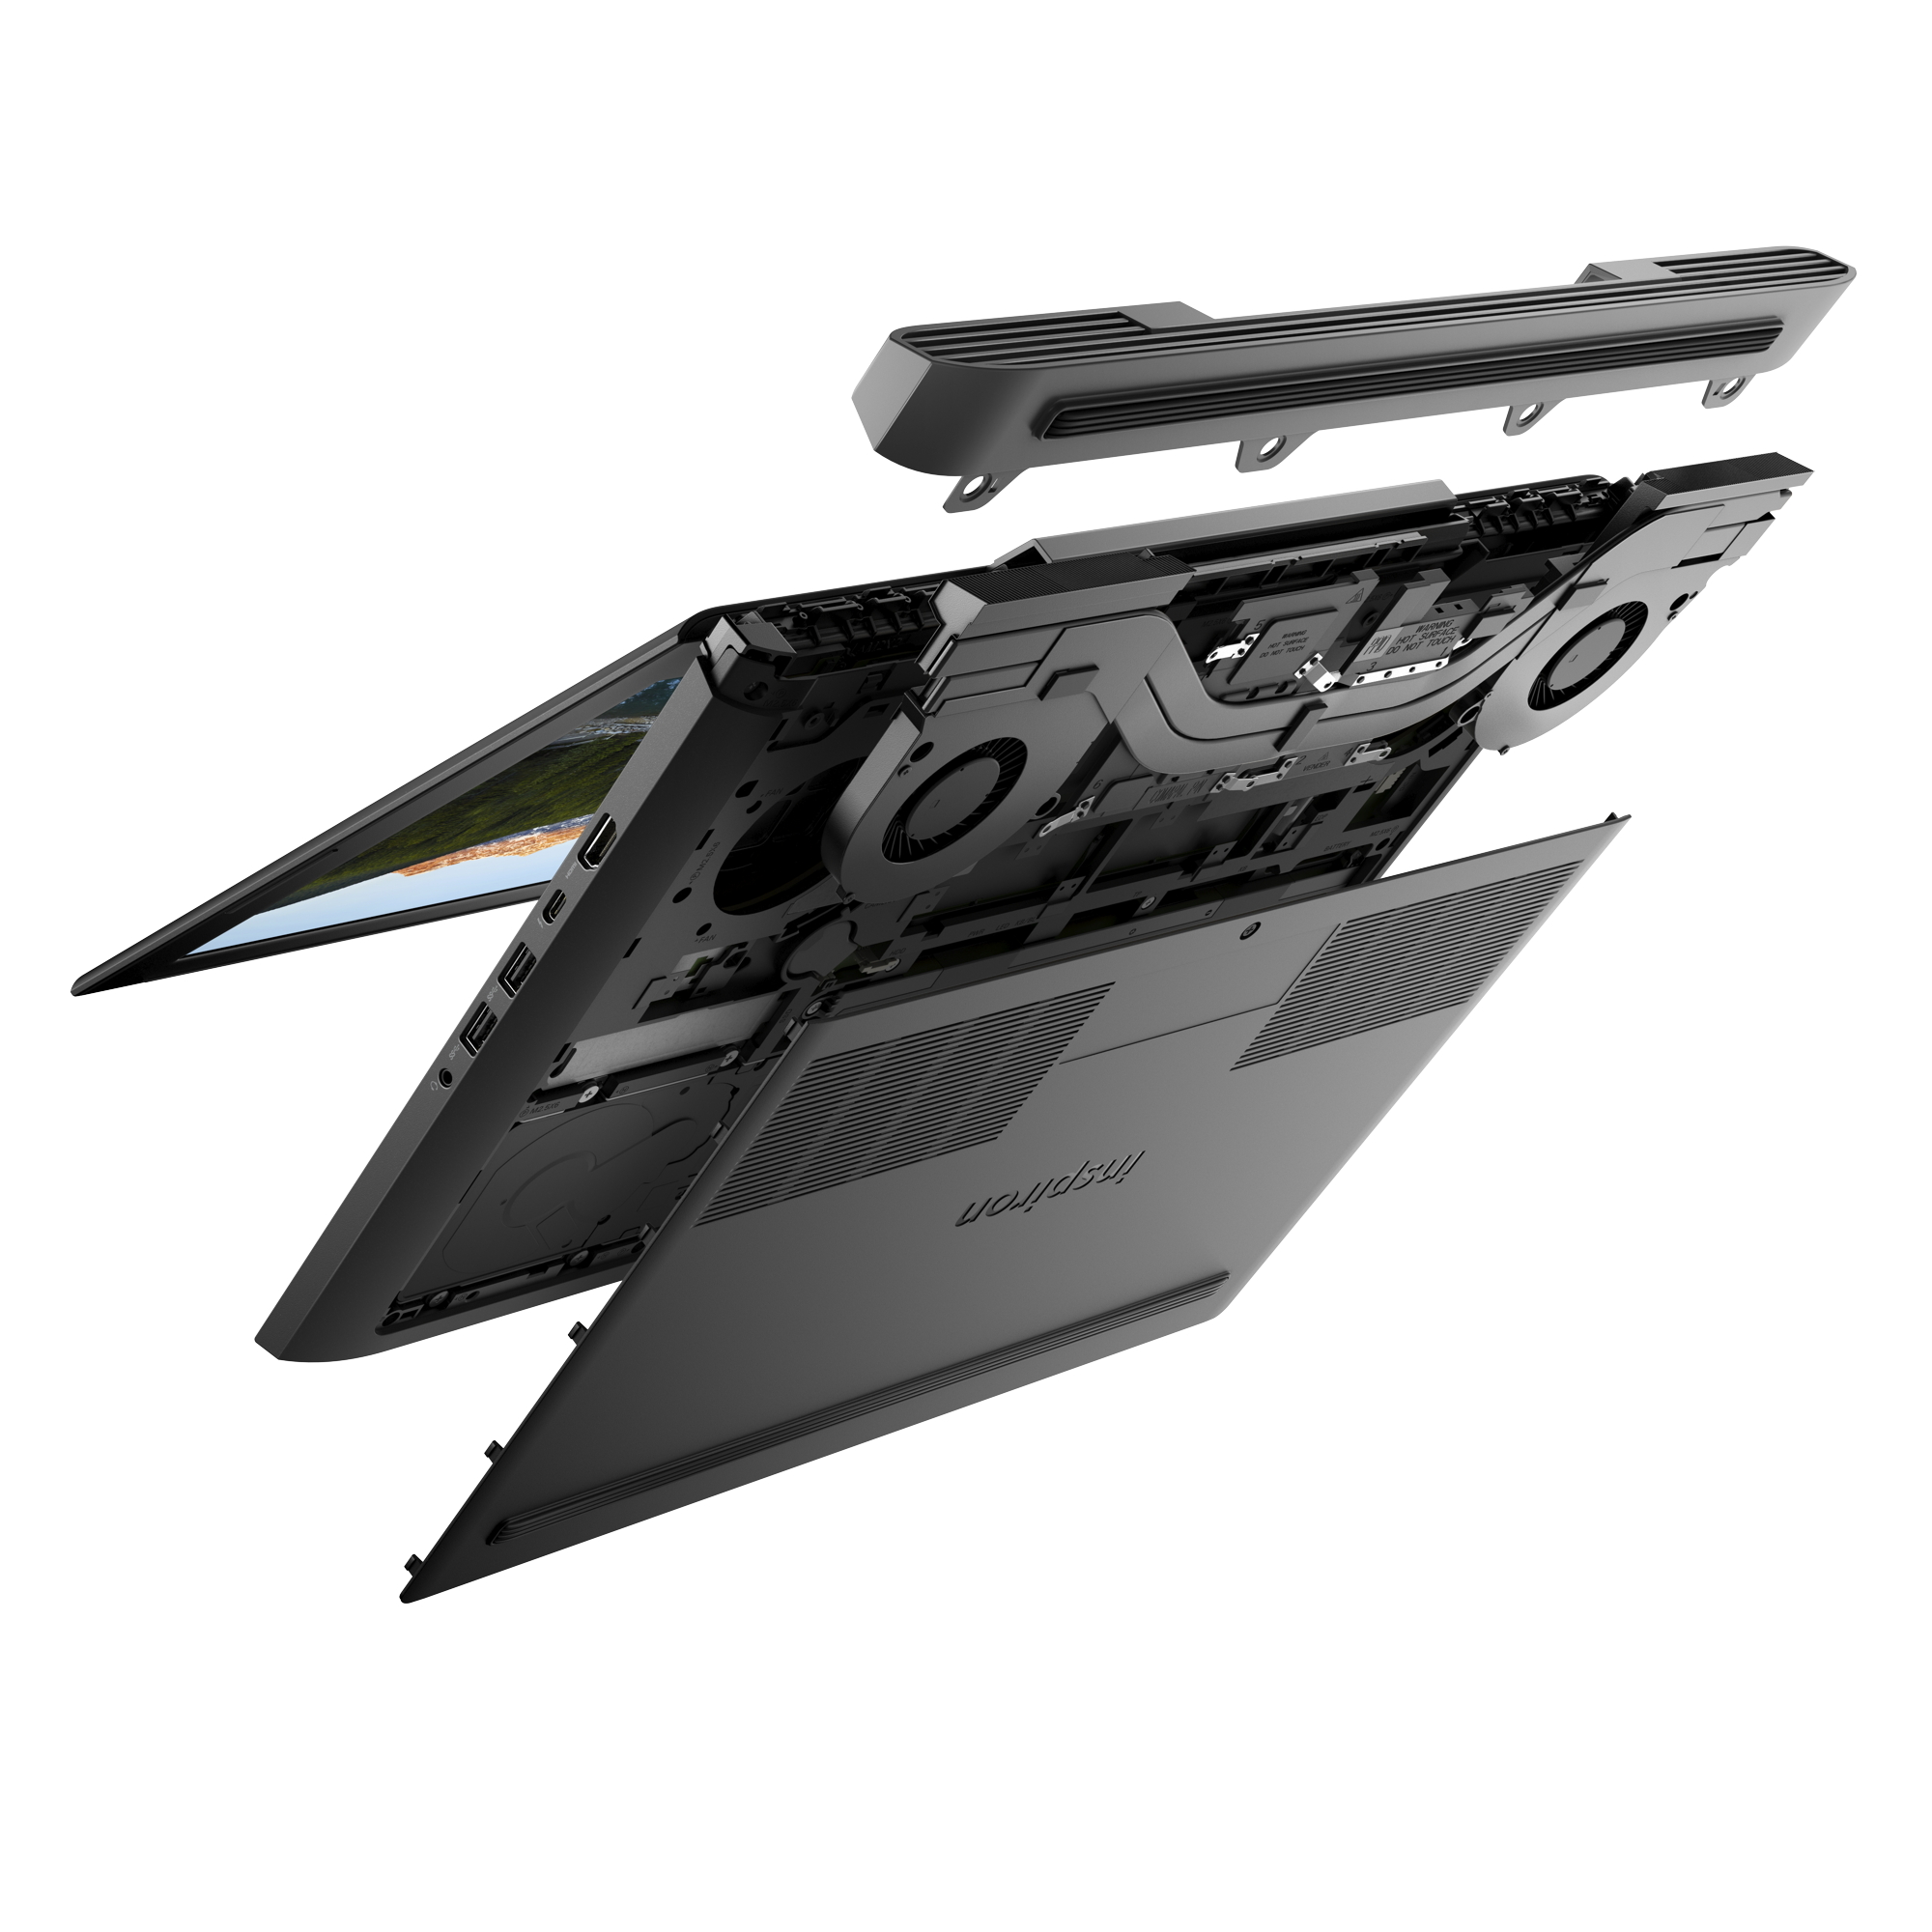
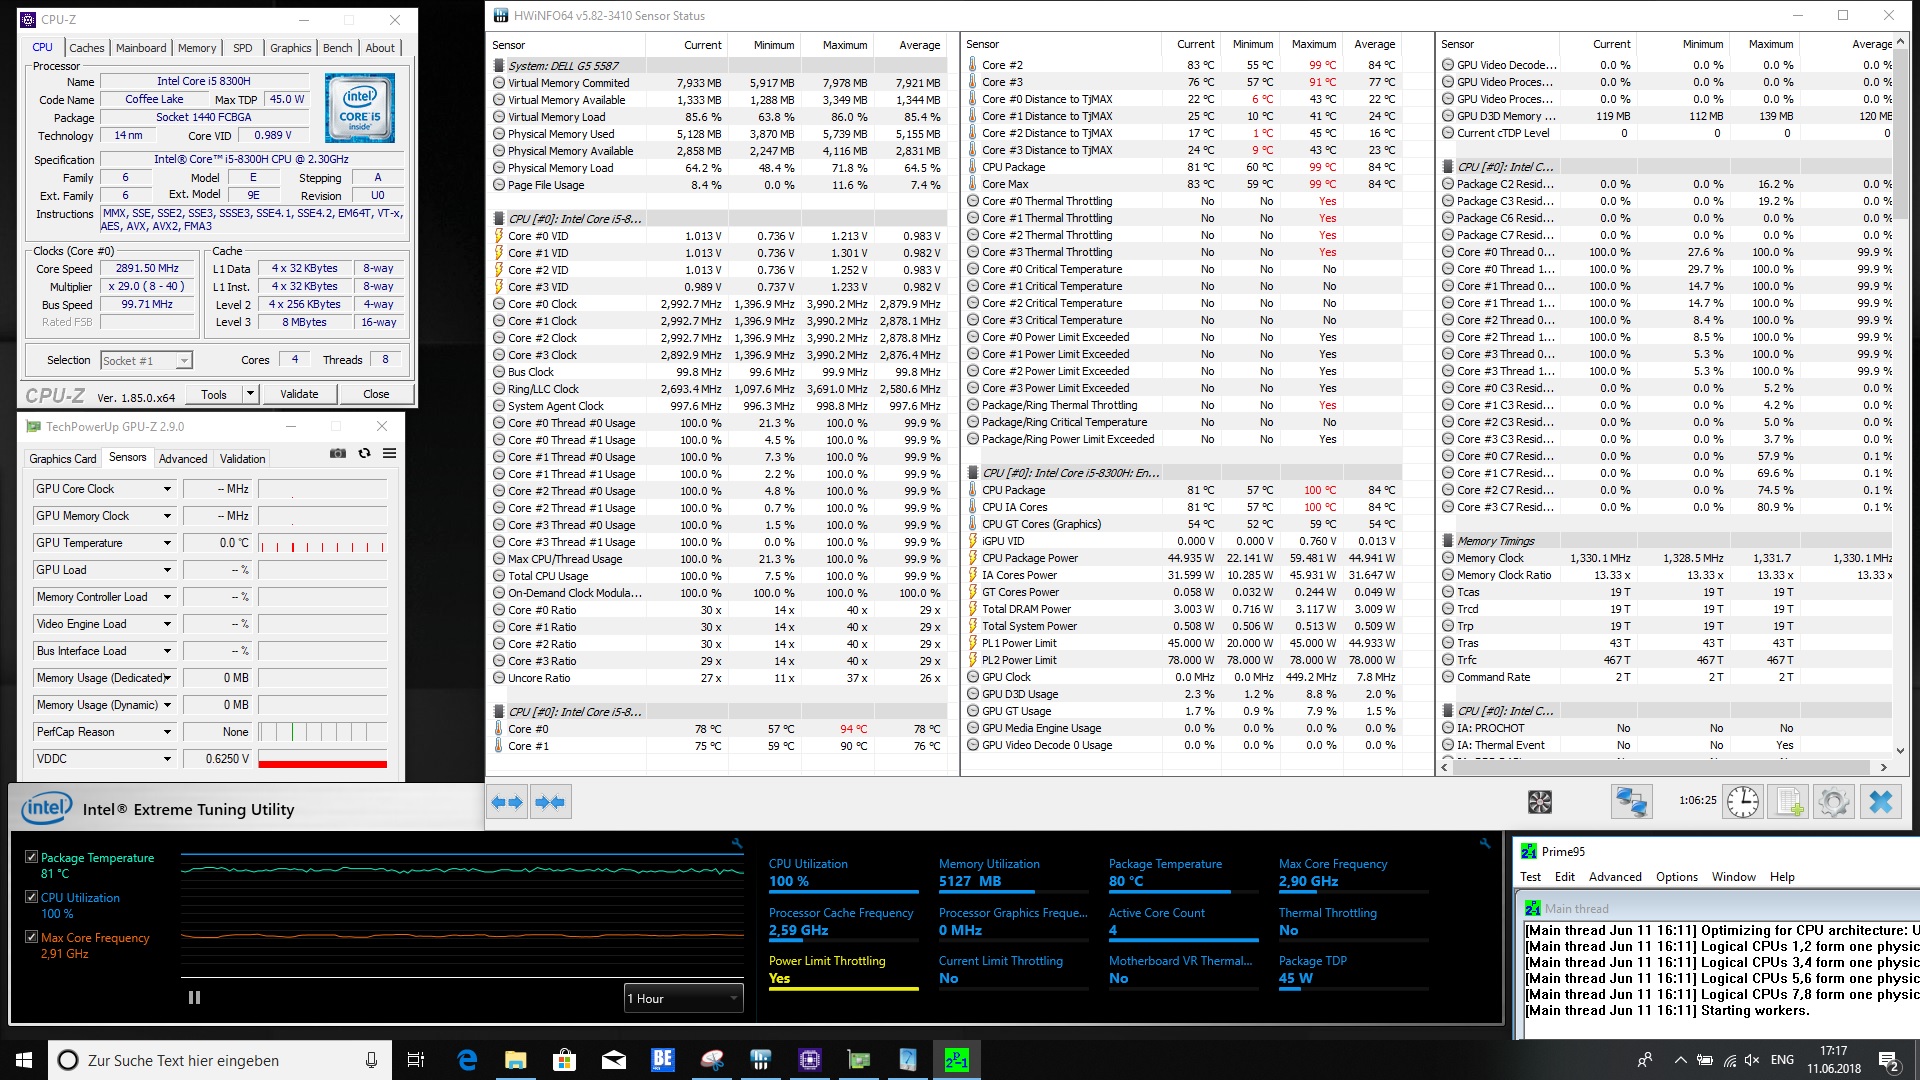
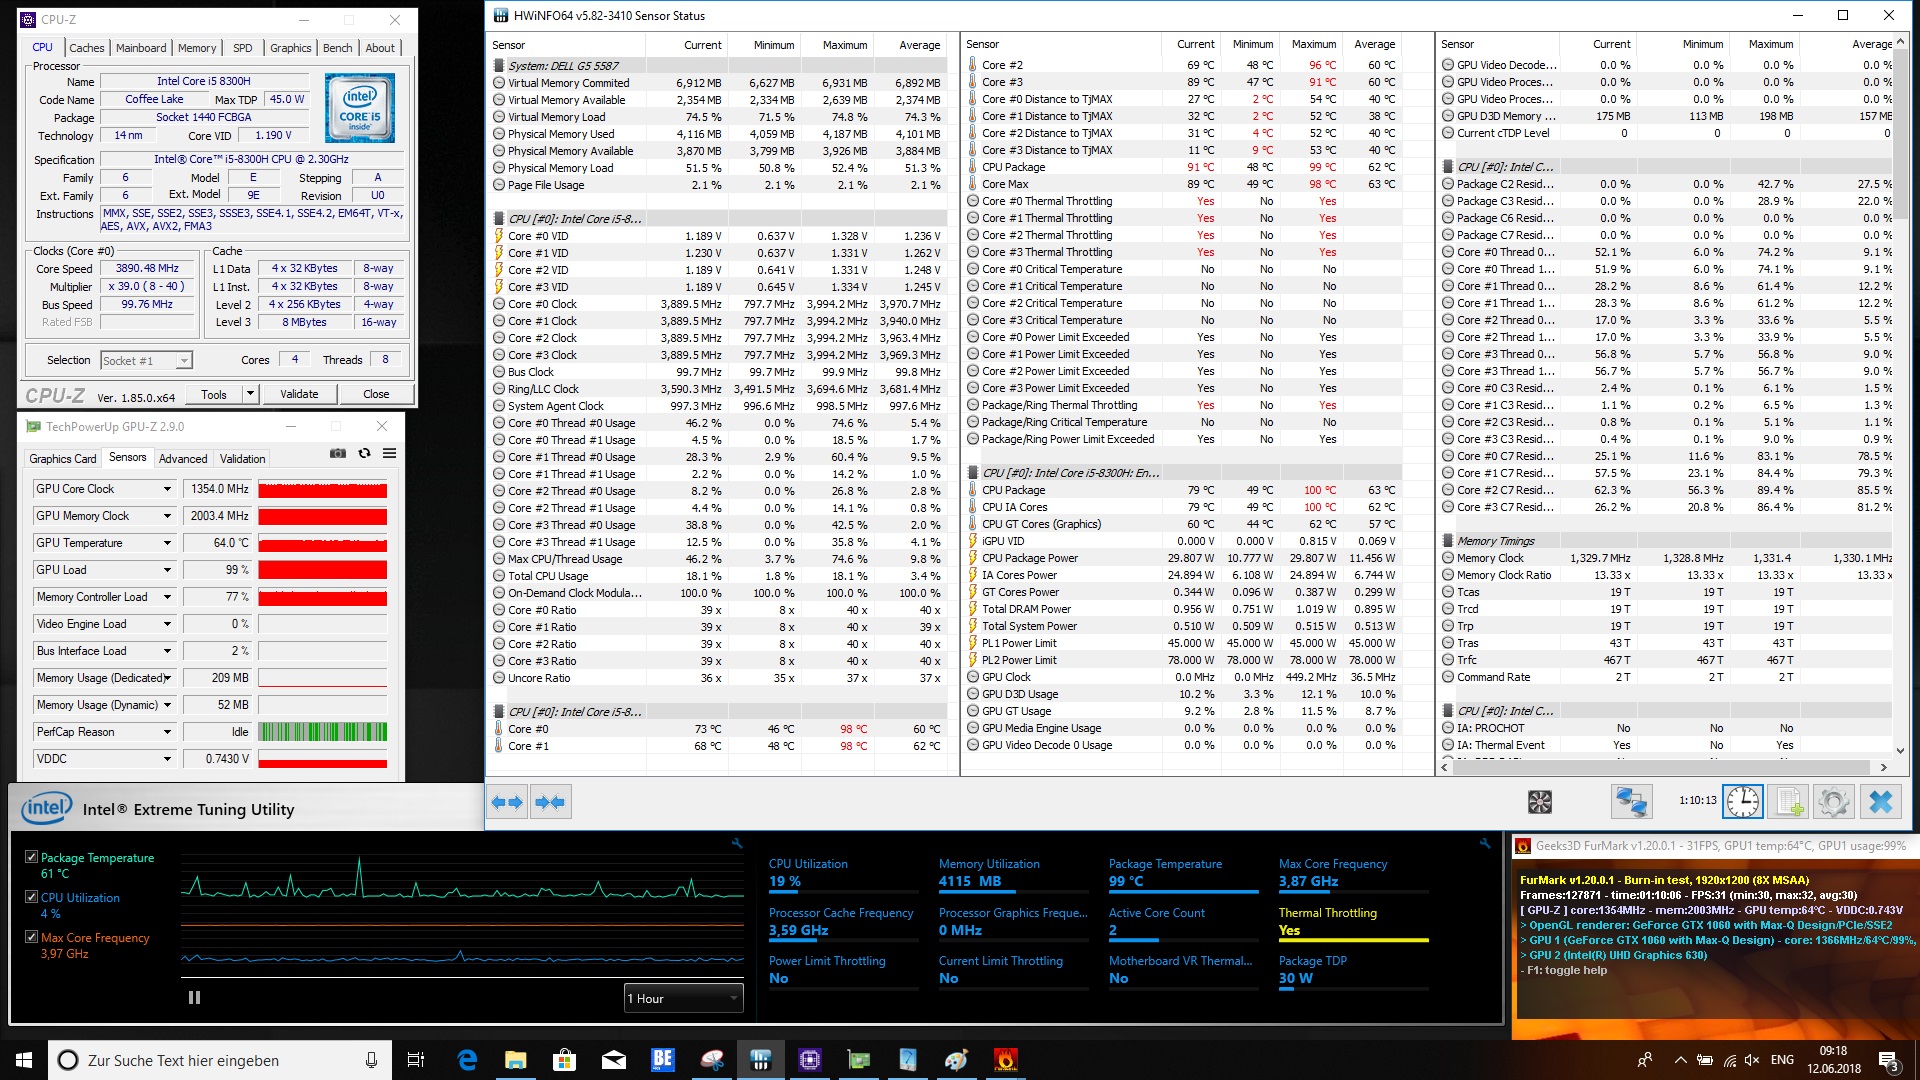
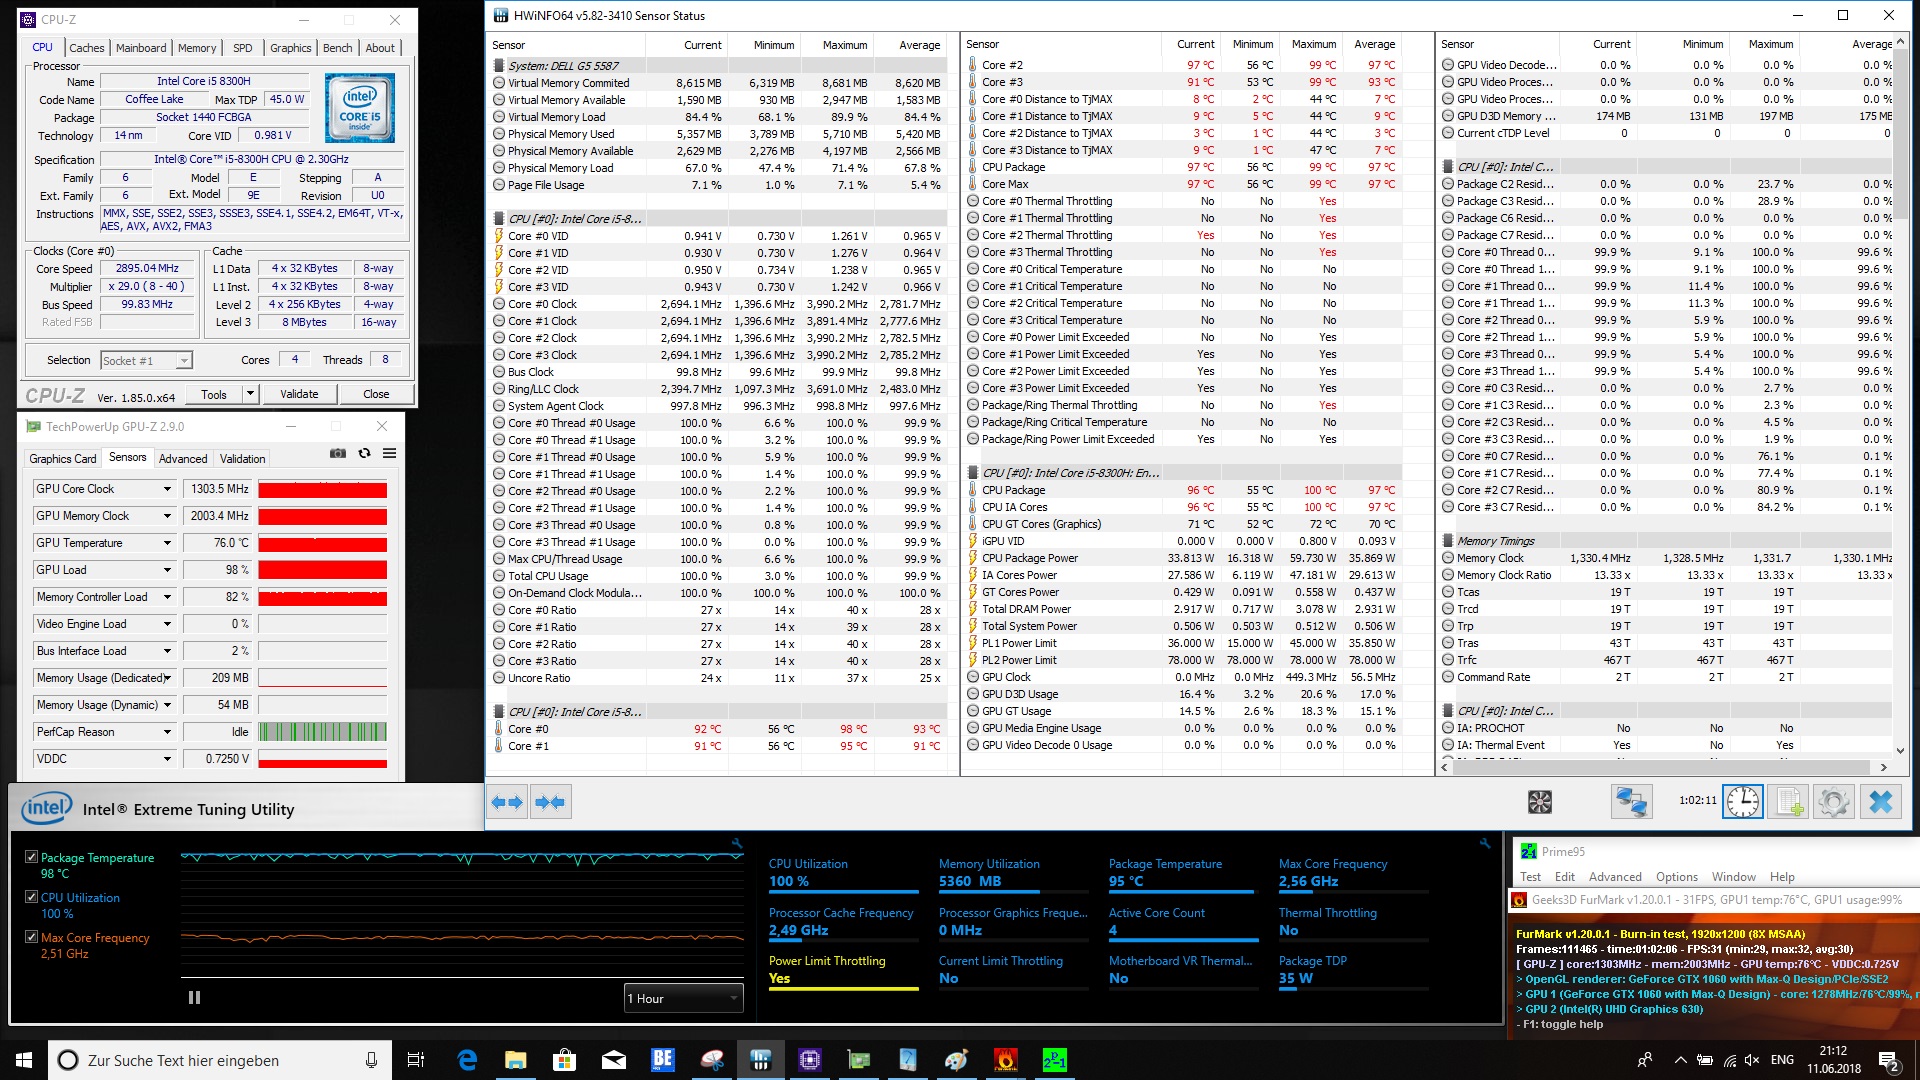
Om du tittar på temperaturutvecklingen så når vår konfiguration definitivt gränsen för hur mycket värme den kan hantera. Men CPU-strypningen håller sig inom gränserna och påverkar inte poängen särskilt mycket.
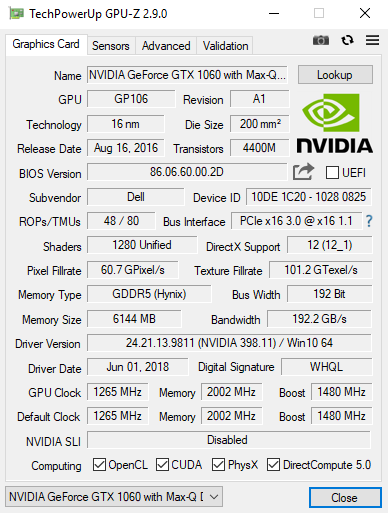
Nvidia GeForce GTX 1060 Max-Q är den kraftigaste GPU:n som Dell har byggt in i G5 15 5000. Prestandan är bra och tillräcklig för att kunna spela alla moderna spel i datorns egna upplösning.
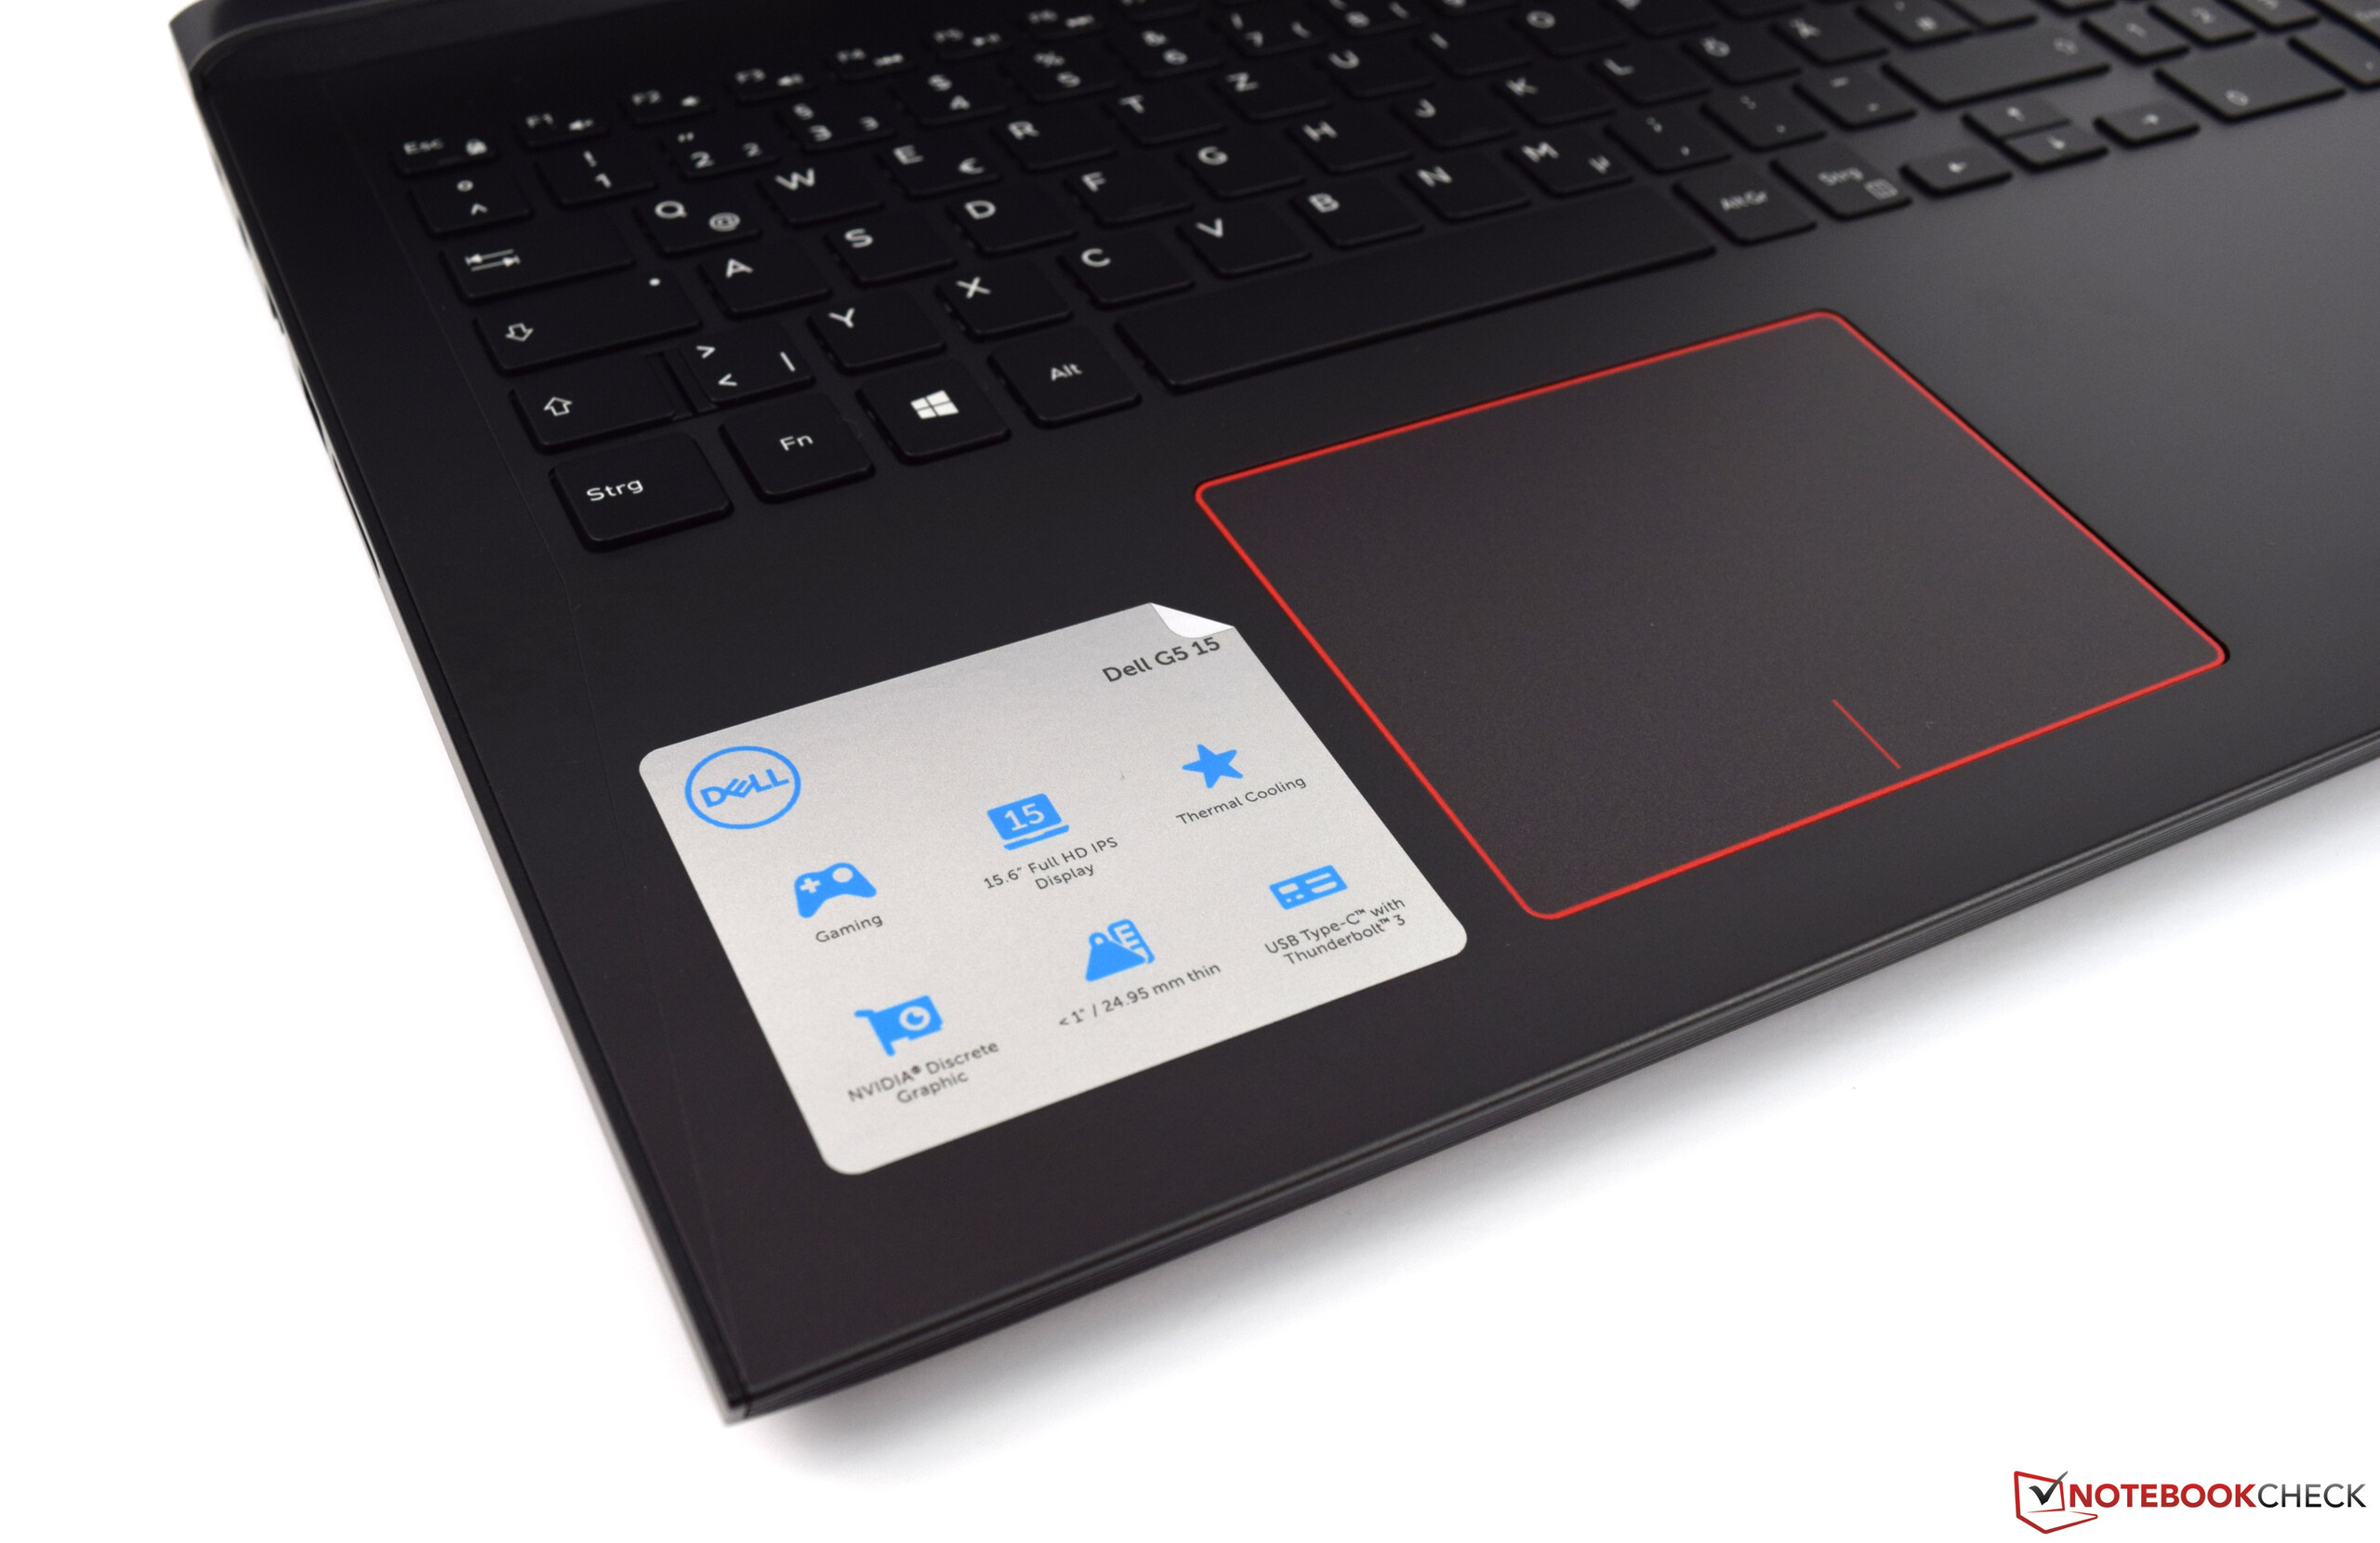
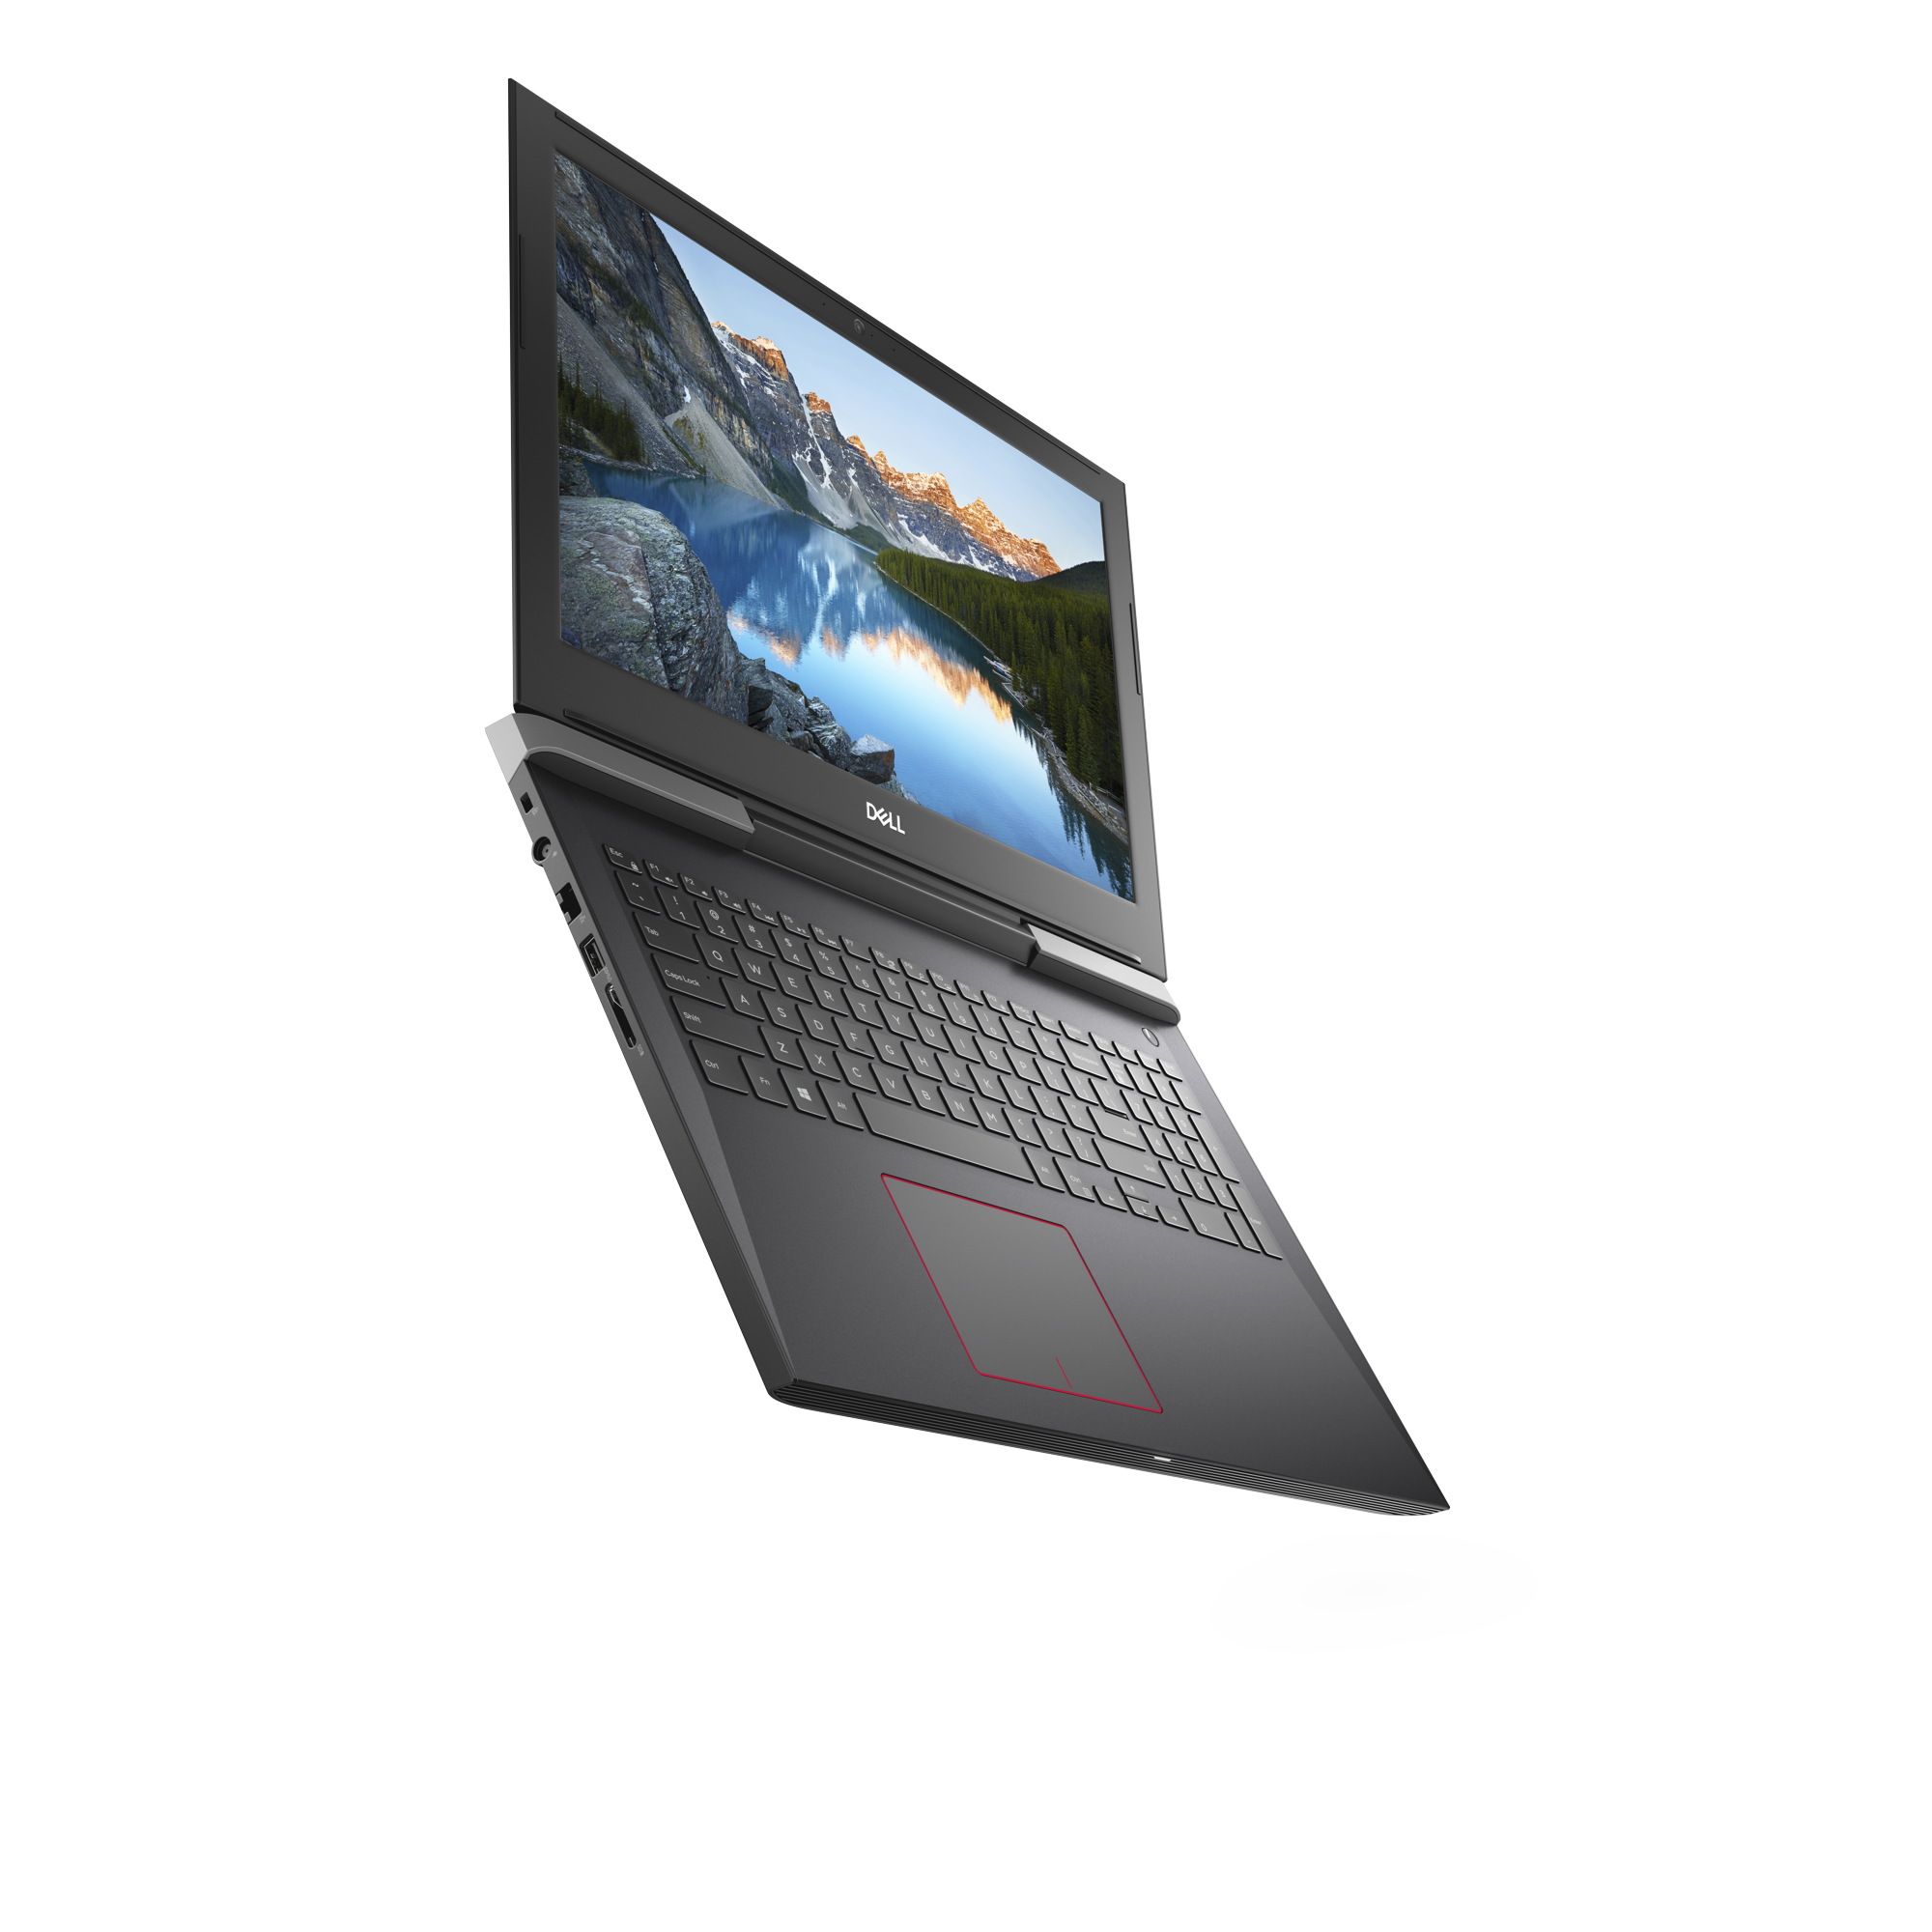
Dell G5 15 5587 är en välutrustad spellaptop med en modern CPU, ett snabbt grafikkort och ett attraktivt pris.
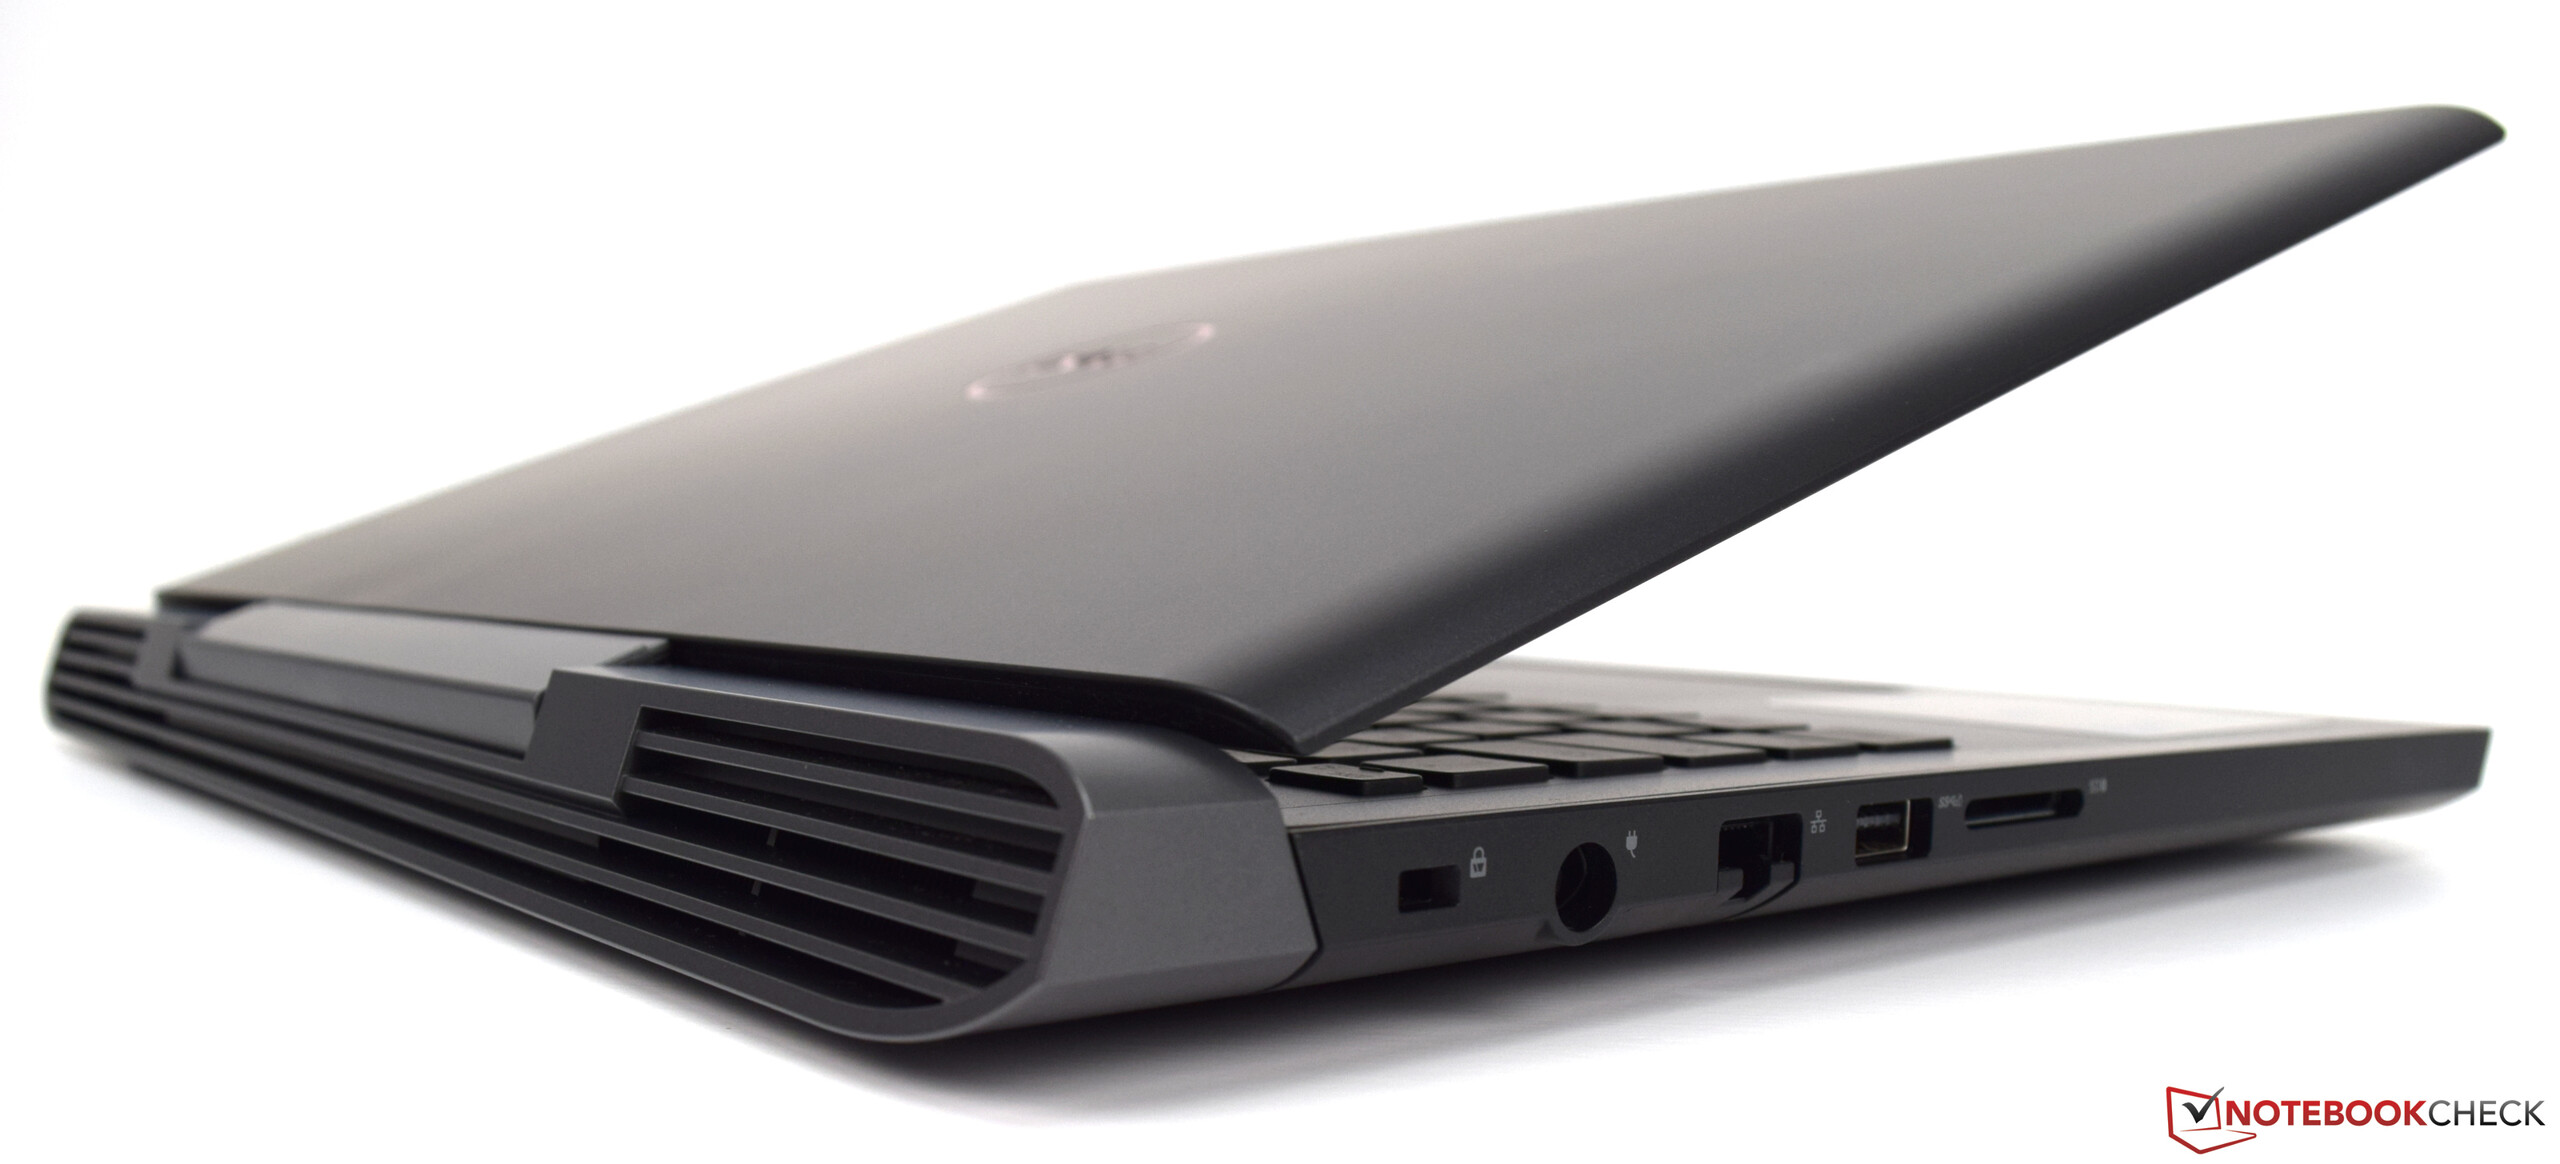
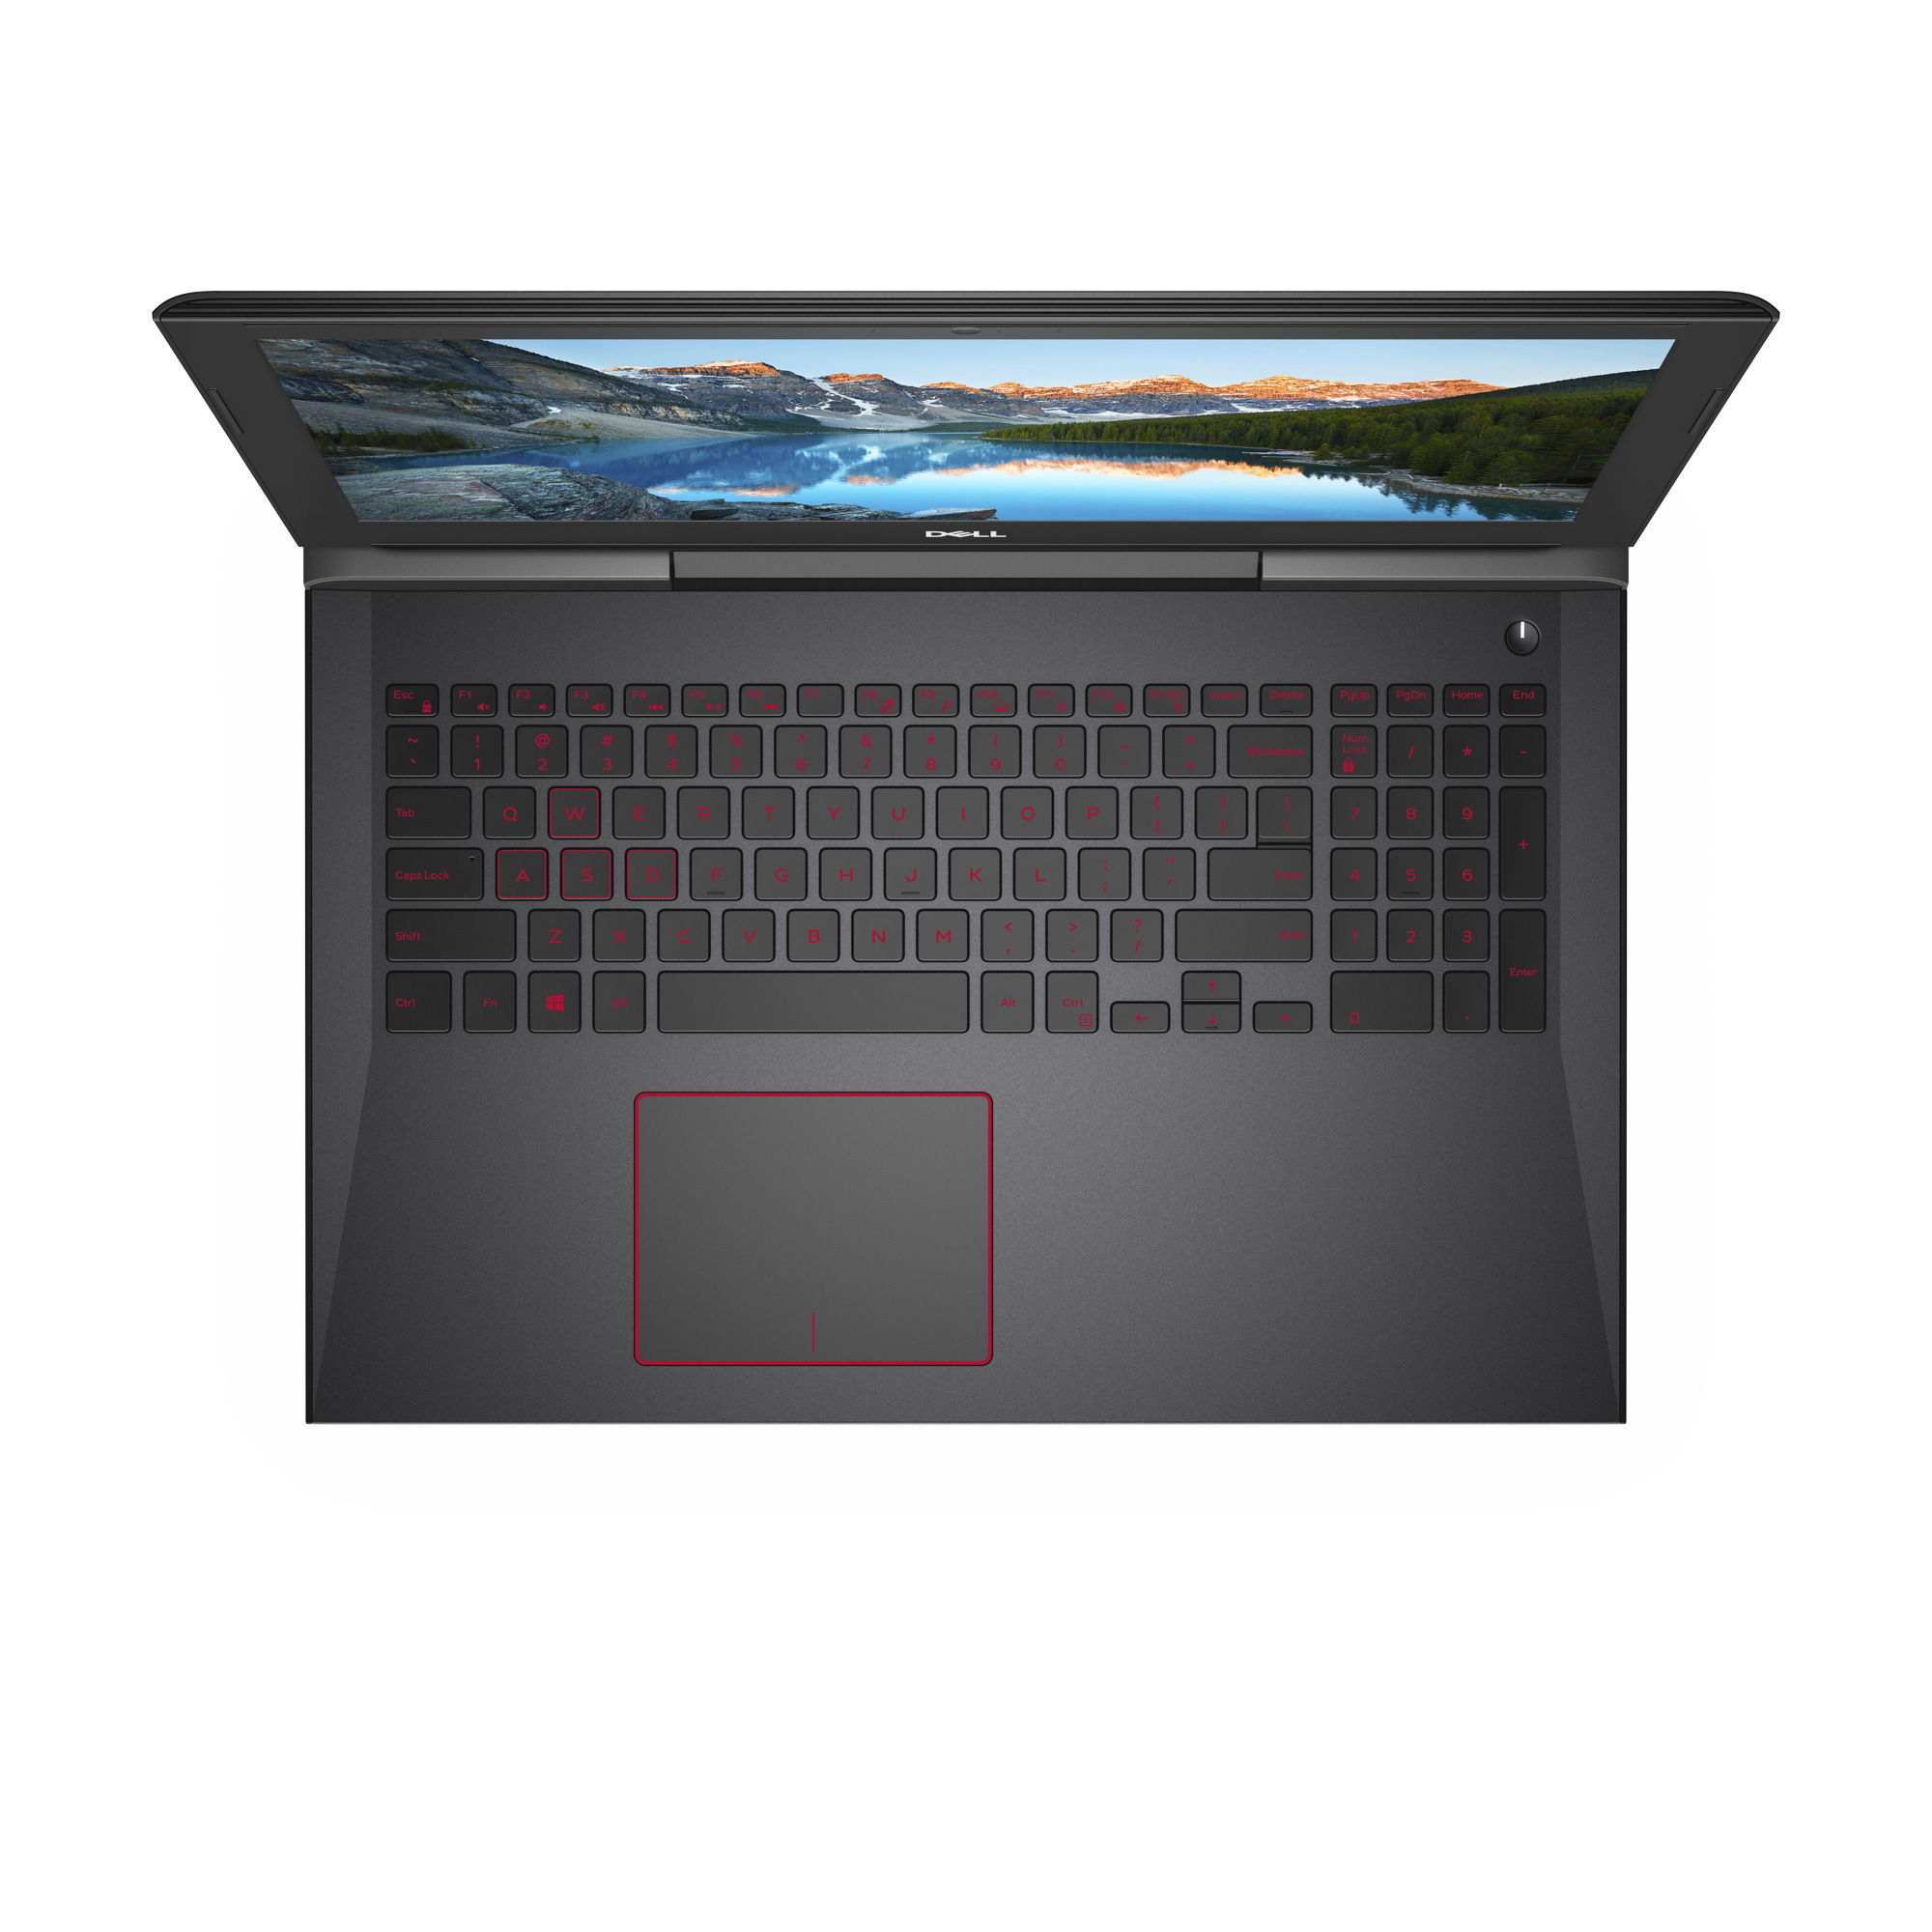
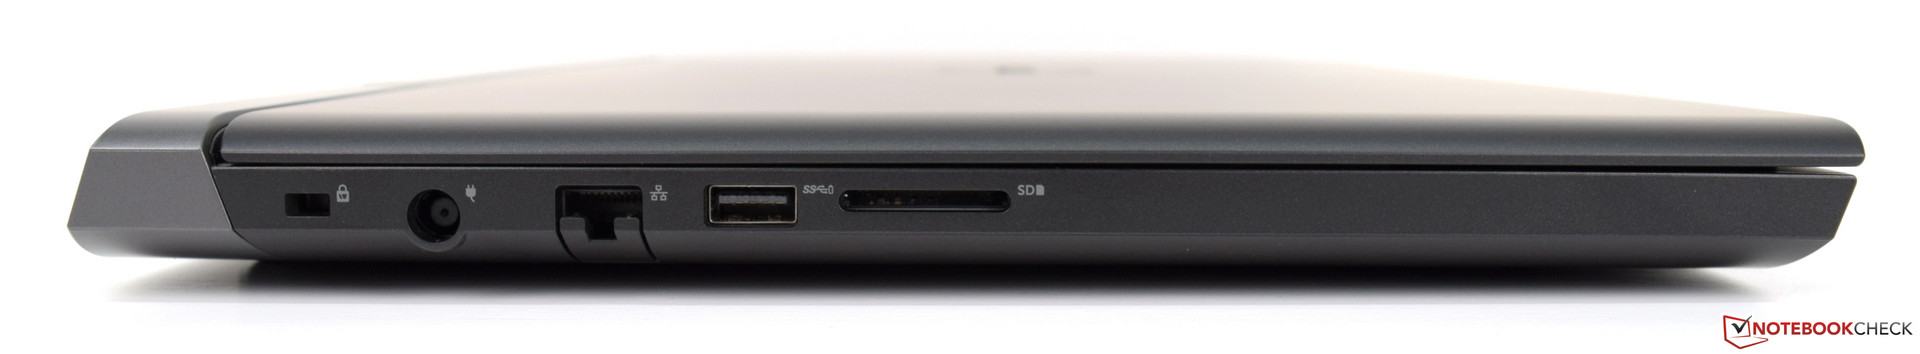
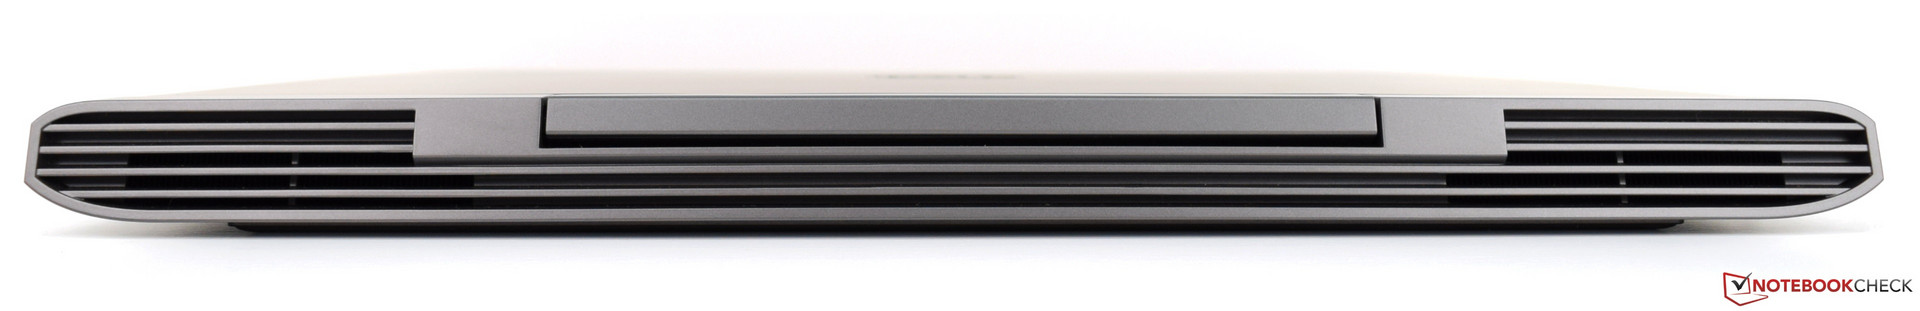
Skärmen kunde inte övertyga oss, även om den också hade en del positiva sidor. Men en matt yta och avsaknad av PWM är inte alltid tillräckligt. Vår modell saknar helt enkelt en del kontrast och ljusstyrka. I fråga om kortläsare borde Dell fundera över huruvida USB 2.0-hastighet verkligen är modernt. Som tur är erbjuder Dell G5 15 även en kortläsare till en av sina lagringsplatser.
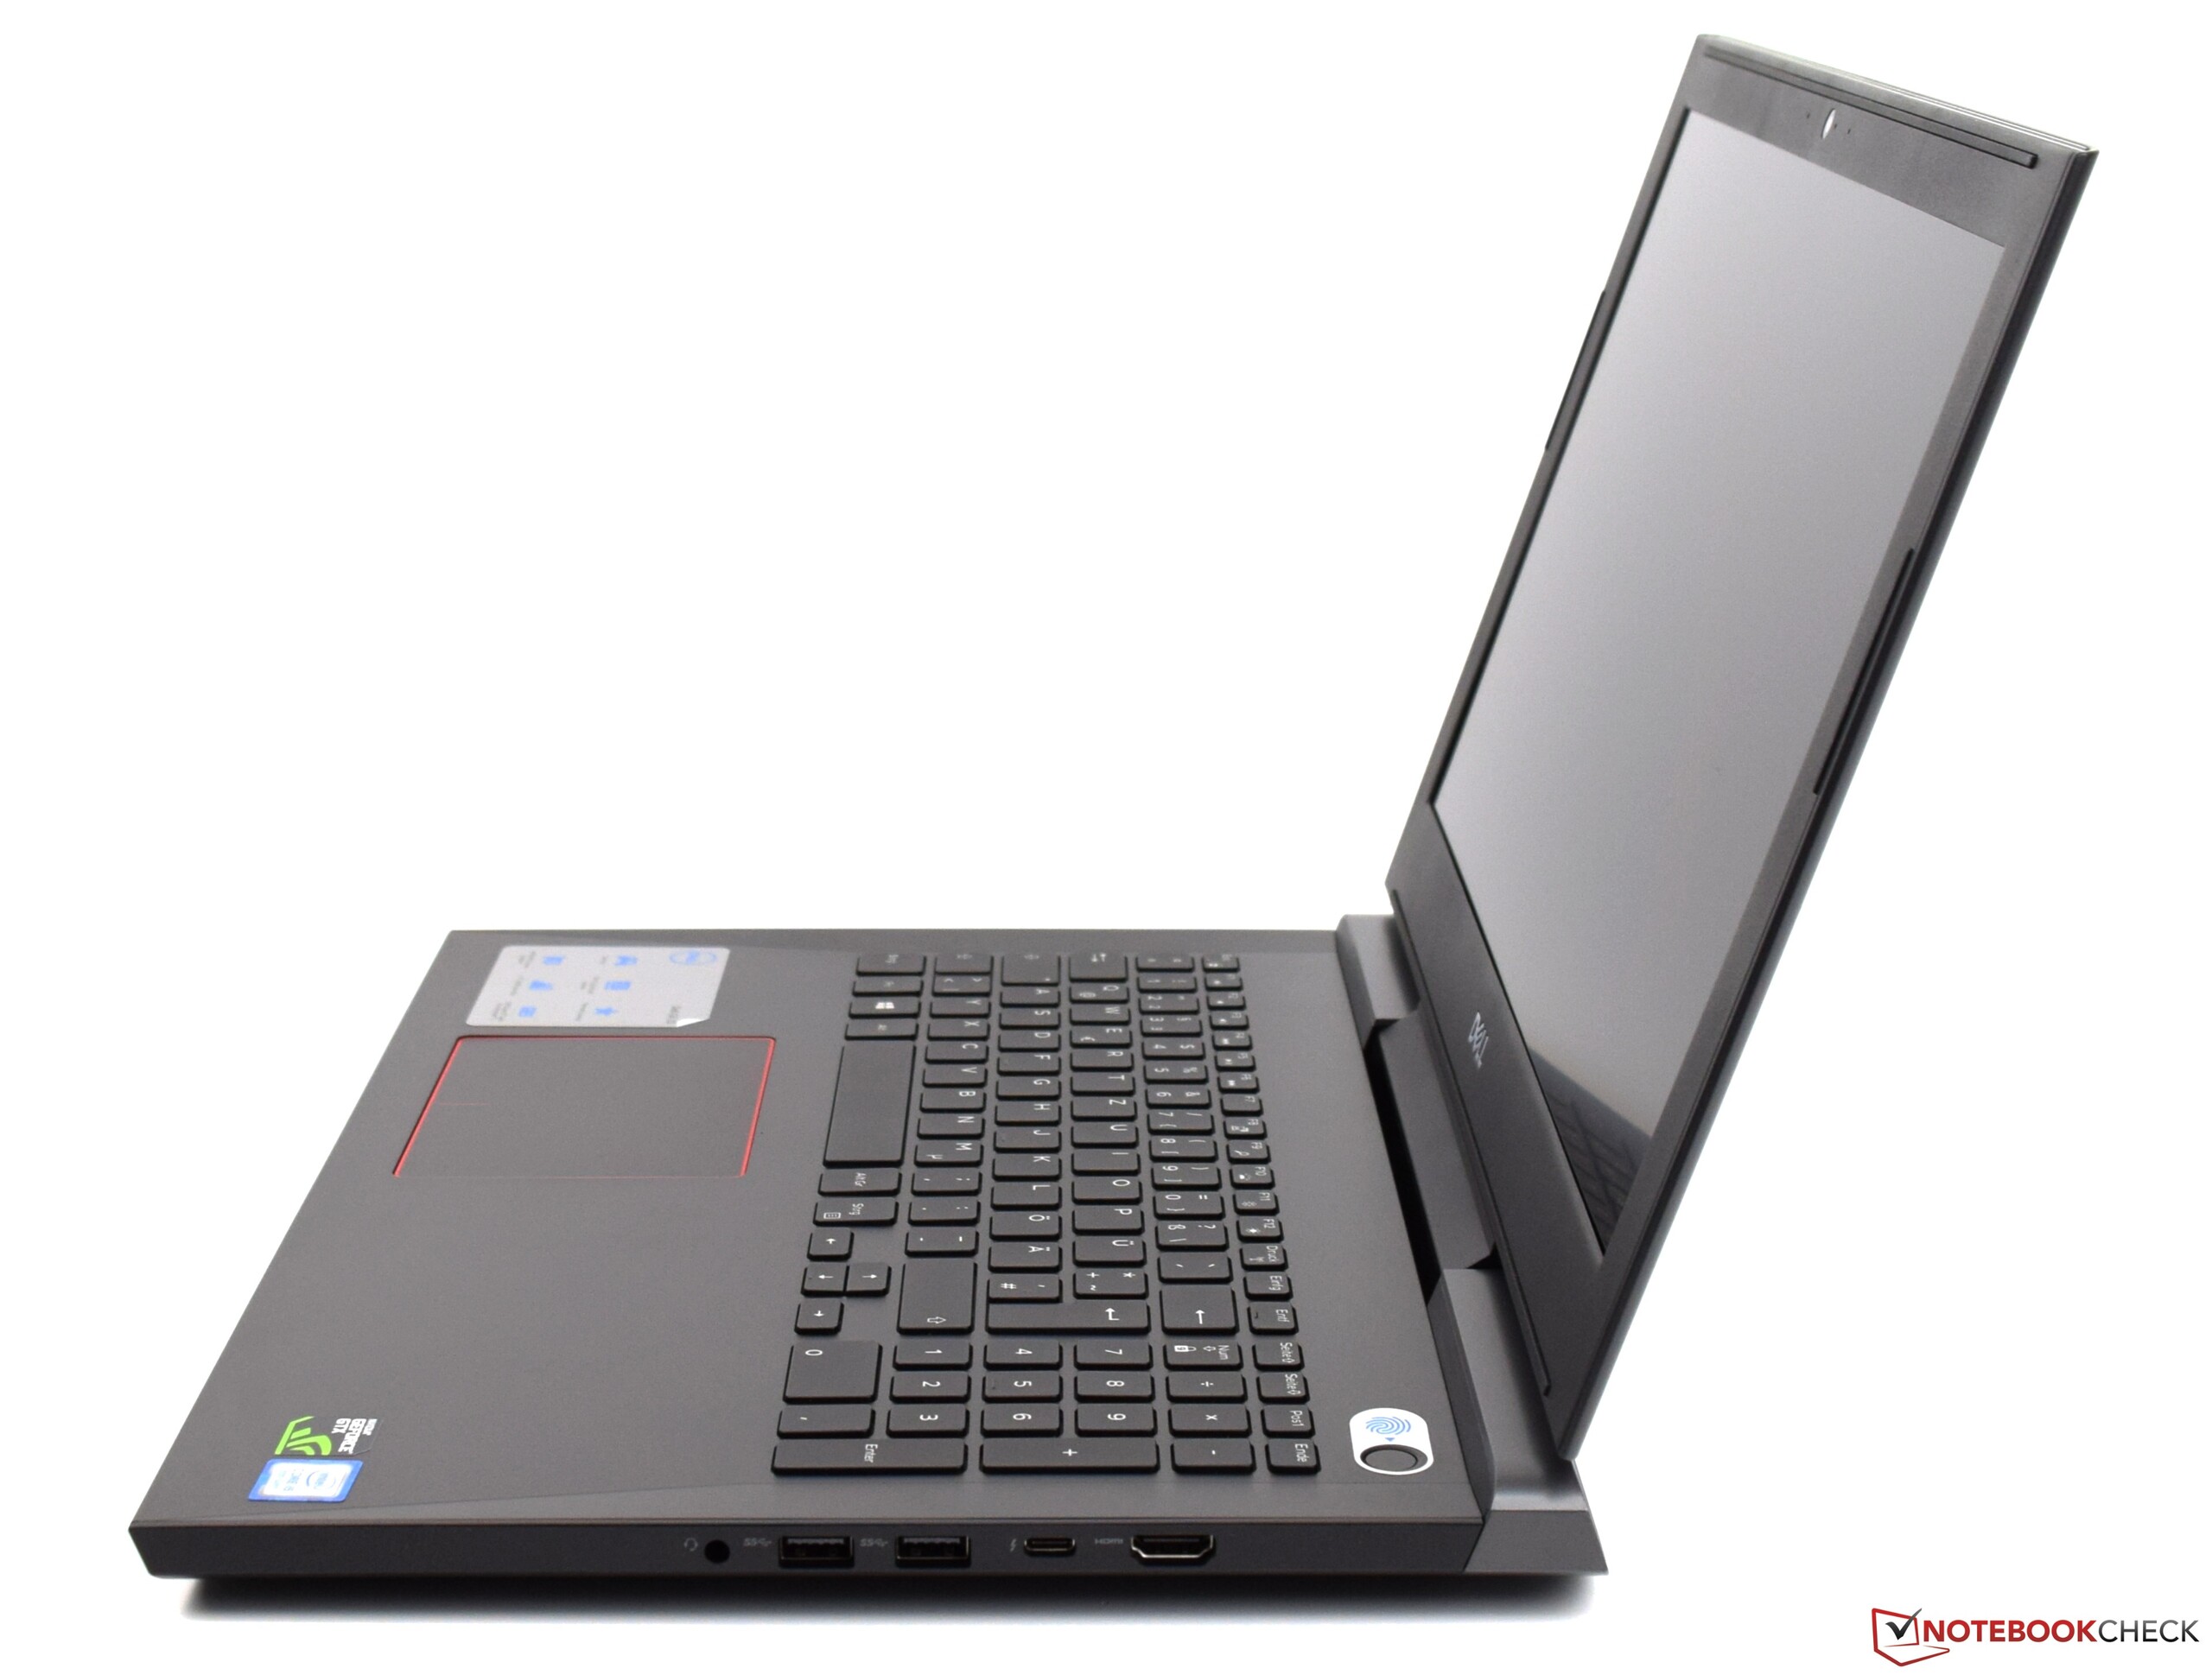
I fråga om ljud hade vi förväntat oss en aning mer, för det som Dell G5 15 5587 levererar på den punkten är inte lämpligt för en ren spelenhet. En dedikerad subwoofer hade varit att föredra. Ytterligare ett klagmål rör vikten: nästan 3 kg för en enhet på 15.6 tum kan inte bara ignoreras.
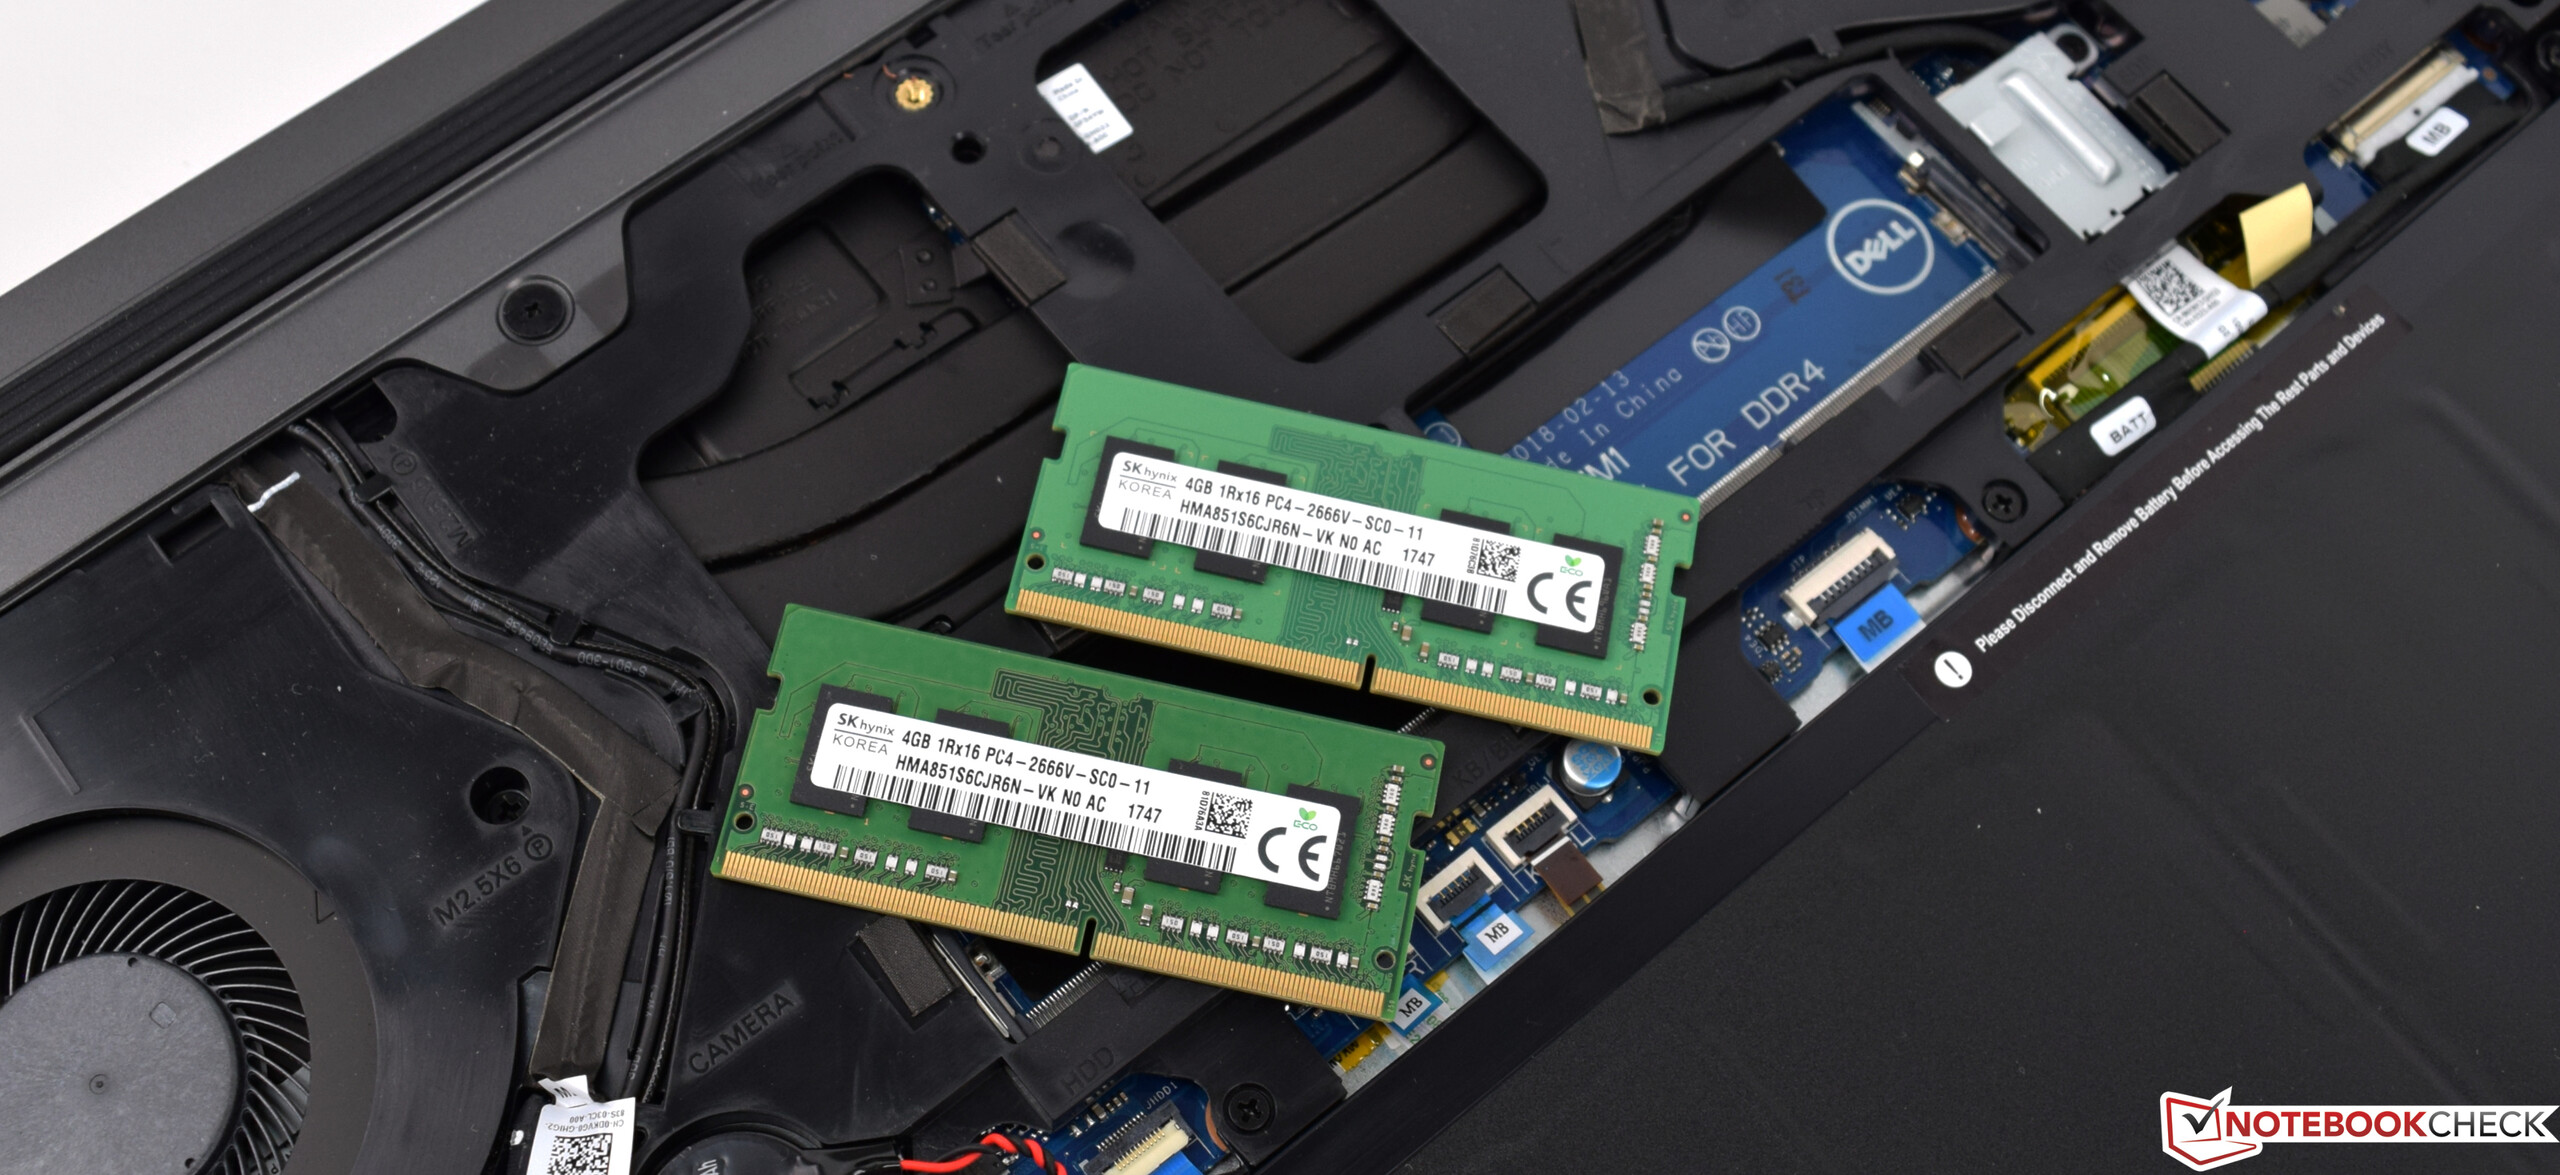
Även om lagringen till en början kan vara tillräcklig så rekommenderar vi större SSD-lagring för att bättre kunna utnyttja hastighetsfördelarna.
Dell G5 15 5587
- 06/21/2018 v6 (old)
Sebastian Bade