Test: Aorus 15 (i7-8750H, RTX 2070) Laptop (Sammanfattning)

| SD Card Reader | |
| average JPG Copy Test (av. of 3 runs) | |
| Gigabyte Aero 15-X9 (Toshiba Exceria Pro SDXC 64 GB UHS-II) | |
| Aorus X5 v8 (Toshiba Exceria Pro SDXC 64 GB UHS-II) | |
| Dell XPS 13 9380 2019 (Toshiba Exceria Pro SDXC 64 GB UHS-II) | |
| Aorus 15 X9 (Toshiba Exceria Pro M501 64 GB UHS-II) | |
| maximum AS SSD Seq Read Test (1GB) | |
| Gigabyte Aero 15-X9 (Toshiba Exceria Pro SDXC 64 GB UHS-II) | |
| Aorus X5 v8 (Toshiba Exceria Pro SDXC 64 GB UHS-II) | |
| Dell XPS 13 9380 2019 (Toshiba Exceria Pro SDXC 64 GB UHS-II) | |
| Aorus 15 X9 (Toshiba Exceria Pro M501 64 GB UHS-II) | |
| Networking | |
| iperf3 transmit AX12 | |
| Gigabyte Aero 15-X9 | |
| Razer Blade 15 RTX 2070 Max-Q | |
| Aorus 15 X9 | |
| Aorus X5 v8 | |
| iperf3 receive AX12 | |
| Razer Blade 15 RTX 2070 Max-Q | |
| Gigabyte Aero 15-X9 | |
| Aorus X5 v8 | |
| Aorus 15 X9 | |
| |||||||||||||||||||||||||
Distribution av ljusstyrkan: 78 %
Mitt på batteriet: 305.1 cd/m²
Kontrast: 925:1 (Svärta: 0.33 cd/m²)
ΔE ColorChecker Calman: 2.58 | ∀{0.5-29.43 Ø4.71}
calibrated: 1.33
ΔE Greyscale Calman: 3.4 | ∀{0.09-98 Ø4.96}
95.2% sRGB (Argyll 1.6.3 3D)
60.7% AdobeRGB 1998 (Argyll 1.6.3 3D)
66.3% AdobeRGB 1998 (Argyll 3D)
95.6% sRGB (Argyll 3D)
64.9% Display P3 (Argyll 3D)
Gamma: 2.28
CCT: 6374 K
| Aorus 15 X9 LG Philips LP156WFG-SPB2, IPS, 15.6", 1920x1080 | Razer Blade 15 RTX 2070 Max-Q LG Philips LGD05C0, IPS, 15.6", 1920x1080 | Aorus X5 v8 AU Optronics B156HAN07.0 (AUO70ED), IPS, 15.6", 1920x1080 | Gigabyte Aero 15-X9 LGD05C0, IPS, 15.6", 1920x1080 | MSI GS65 Stealth Thin 8RE-051US AUO80ED, IPS, 15.6", 1920x1080 | Alienware m15 GTX 1070 Max-Q AU Optronics B156HAN, IPS, 15.6", 1920x1080 | |
|---|---|---|---|---|---|---|
| Display | 0% | 1% | -3% | -1% | -4% | |
| Display P3 Coverage (%) | 64.9 | 65.3 1% | 67.1 3% | 63.5 -2% | 65.8 1% | 63.5 -2% |
| sRGB Coverage (%) | 95.6 | 94.9 -1% | 93.4 -2% | 93.1 -3% | 92.1 -4% | 89.4 -6% |
| AdobeRGB 1998 Coverage (%) | 66.3 | 66.3 0% | 68.1 3% | 64.5 -3% | 67 1% | 64.5 -3% |
| Response Times | -3% | -11% | -9% | -15% | -8% | |
| Response Time Grey 50% / Grey 80% * (ms) | 15.2 ? | 16.8 ? -11% | 18.8 ? -24% | 16.4 ? -8% | 20 ? -32% | 18 ? -18% |
| Response Time Black / White * (ms) | 12.4 ? | 11.6 ? 6% | 12 ? 3% | 13.6 ? -10% | 12 ? 3% | 12 ? 3% |
| PWM Frequency (Hz) | ||||||
| Screen | -4% | 14% | 12% | -17% | -24% | |
| Brightness middle (cd/m²) | 305.1 | 314.7 3% | 271 -11% | 250 -18% | 250.9 -18% | 353.6 16% |
| Brightness (cd/m²) | 295 | 312 6% | 259 -12% | 235 -20% | 257 -13% | 346 17% |
| Brightness Distribution (%) | 78 | 90 15% | 87 12% | 85 9% | 83 6% | 86 10% |
| Black Level * (cd/m²) | 0.33 | 0.38 -15% | 0.27 18% | 0.29 12% | 0.32 3% | 0.3 9% |
| Contrast (:1) | 925 | 828 -10% | 1004 9% | 862 -7% | 784 -15% | 1179 27% |
| Colorchecker dE 2000 * | 2.58 | 2.56 1% | 1.81 30% | 1.46 43% | 2.77 -7% | 4.55 -76% |
| Colorchecker dE 2000 max. * | 4.32 | 4.89 -13% | 3.33 23% | 2.47 43% | 5.89 -36% | 7.91 -83% |
| Colorchecker dE 2000 calibrated * | 1.33 | 1.71 -29% | 2.5 -88% | 3.37 -153% | ||
| Greyscale dE 2000 * | 3.4 | 3.4 -0% | 1.09 68% | 1.27 63% | 4 -18% | 4.1 -21% |
| Gamma | 2.28 96% | 2.3 96% | 2.45 90% | 2.4 92% | 2.27 97% | 2.27 97% |
| CCT | 6374 102% | 6435 101% | 6435 101% | 6749 96% | 6901 94% | 7434 87% |
| Color Space (Percent of AdobeRGB 1998) (%) | 60.7 | 60.7 0% | 61 0% | 60 -1% | 60 -1% | 57.9 -5% |
| Color Space (Percent of sRGB) (%) | 95.2 | 94.6 -1% | 93 -2% | 93 -2% | 92 -3% | 88.9 -7% |
| Totalt genomsnitt (program/inställningar) | -2% /
-3% | 1% /
8% | 0% /
6% | -11% /
-14% | -12% /
-18% |
* ... mindre är bättre
Visa svarstider
| ↔ Svarstid svart till vitt | ||
|---|---|---|
| 12.4 ms ... stiga ↗ och falla ↘ kombinerat | ↗ 7.6 ms stiga | 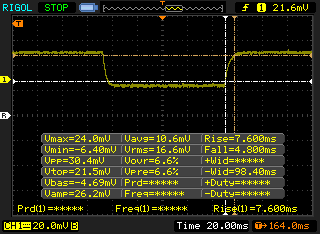 |
| ↘ 4.8 ms hösten | ||
| Skärmen visar bra svarsfrekvens i våra tester, men kan vara för långsam för konkurrenskraftiga spelare. I jämförelse sträcker sig alla testade enheter från 0.1 (minst) till 240 (maximalt) ms. » 33 % av alla enheter är bättre. Det betyder att den uppmätta svarstiden är bättre än genomsnittet av alla testade enheter (19.8 ms). | ||
| ↔ Svarstid 50 % grått till 80 % grått | ||
| 15.2 ms ... stiga ↗ och falla ↘ kombinerat | ↗ 8.4 ms stiga | 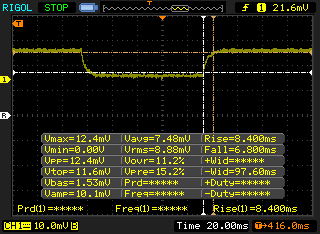 |
| ↘ 6.8 ms hösten | ||
| Skärmen visar bra svarsfrekvens i våra tester, men kan vara för långsam för konkurrenskraftiga spelare. I jämförelse sträcker sig alla testade enheter från 0.165 (minst) till 636 (maximalt) ms. » 29 % av alla enheter är bättre. Det betyder att den uppmätta svarstiden är bättre än genomsnittet av alla testade enheter (30.9 ms). | ||
Skärmflimmer / PWM (Puls-Width Modulation)
| Skärmflimmer / PWM upptäcktes inte | 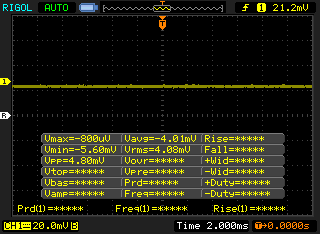 | ||
Som jämförelse: 52 % av alla testade enheter använder inte PWM för att dämpa skärmen. Om PWM upptäcktes mättes ett medelvärde av 7748 (minst: 5 - maximum: 343500) Hz. | |||
| wPrime 2.10 - 1024m | |
| Asus Strix GL703VM-DB74 | |
| MSI GV62 8RE-016US | |
| Genomsnitt Intel Core i7-8750H (125.5 - 180.5, n=6) | |
* ... mindre är bättre
| PCMark 8 Home Score Accelerated v2 | 4843 poäng | |
| PCMark 8 Work Score Accelerated v2 | 5828 poäng | |
| PCMark 10 Score | 5870 poäng | |
Hjälp | ||
| Aorus 15 X9 Intel SSD 760p SSDPEKKW512G8 | Razer Blade 15 RTX 2070 Max-Q Samsung SSD PM981 MZVLB512HAJQ | Aorus X5 v8 Toshiba NVMe THNSN5512GPU7 | Gigabyte Aero 15-X9 Intel SSD 760p SSDPEKKW010T8 | MSI GS65 Stealth Thin 8RE-051US Samsung SSD PM981 MZVLB256HAHQ | Alienware m15 GTX 1070 Max-Q Toshiba XG5 KXG50ZNV512G | |
|---|---|---|---|---|---|---|
| AS SSD | 38% | -34% | -6% | -23% | -27% | |
| Seq Read (MB/s) | 1912 | 1840 -4% | 1813 -5% | 2113 11% | 1612 -16% | 1967 3% |
| Seq Write (MB/s) | 1553 | 1822 17% | 966 -38% | 1471 -5% | 1475 -5% | 1135 -27% |
| 4K Read (MB/s) | 56.5 | 52.3 -7% | 23.21 -59% | 55 -3% | 43.09 -24% | 29.17 -48% |
| 4K Write (MB/s) | 119.6 | 110.7 -7% | 84.5 -29% | 107.1 -10% | 83.8 -30% | 93.4 -22% |
| 4K-64 Read (MB/s) | 869 | 1126 30% | 856 -1% | 914 5% | 611 -30% | 995 14% |
| 4K-64 Write (MB/s) | 584 | 1717 194% | 773 32% | 703 20% | 570 -2% | 656 12% |
| Access Time Read * (ms) | 0.049 | 0.047 4% | 0.166 -239% | 0.114 -133% | 0.071 -45% | 0.116 -137% |
| Access Time Write * (ms) | 0.031 | 0.033 -6% | 0.044 -42% | 0.034 -10% | 0.045 -45% | 0.063 -103% |
| Score Read (Points) | 1116 | 1362 22% | 1061 -5% | 1180 6% | 815 -27% | 1221 9% |
| Score Write (Points) | 859 | 2010 134% | 954 11% | 957 11% | 802 -7% | 862 0% |
| Score Total (Points) | 2544 | 4079 60% | 2515 -1% | 2722 7% | 2039 -20% | 2667 5% |
| Copy ISO MB/s (MB/s) | 1329 | 1975 49% | 1864 40% | 642 -52% | ||
| Copy Program MB/s (MB/s) | 404.3 | 526 30% | 362.6 -10% | 431.5 7% | ||
| Copy Game MB/s (MB/s) | 1071 | 1200 12% | 936 -13% | 706 -34% |
* ... mindre är bättre

| 3DMark 11 Performance | 19143 poäng | |
| 3DMark Cloud Gate Standard Score | 31987 poäng | |
| 3DMark Fire Strike Score | 16211 poäng | |
| 3DMark Time Spy Score | 7490 poäng | |
Hjälp | ||
| The Witcher 3 - 1920x1080 Ultra Graphics & Postprocessing (HBAO+) | |
| Alienware Area-51m i9-9900K RTX 2080 | |
| Asus ROG Strix RTX 2070 OC | |
| Asus Zephyrus S GX701GX | |
| Genomsnitt NVIDIA GeForce RTX 2070 Mobile (64 - 82.1, n=21) | |
| Aorus 15 X9 | |
| Razer Blade 15 RTX 2070 Max-Q | |
| Gigabyte Aero 15-Y9 | |
| MSI GL73 8SE-010US | |
| MSI GS65 Stealth Thin 8RE-051US | |
| Huawei MateBook 13 i7 | |
| låg | med. | hög | ultra | |
|---|---|---|---|---|
| BioShock Infinite (2013) | 304.5 | 249.3 | 229.8 | 154.3 |
| The Witcher 3 (2015) | 236.1 | 197 | 131.3 | 71.8 |
| Rise of the Tomb Raider (2016) | 211.8 | 145.3 | 132.8 | 115.2 |
| Aorus 15 X9 GeForce RTX 2070 Mobile, i7-8750H, Intel SSD 760p SSDPEKKW512G8 | Razer Blade 15 RTX 2070 Max-Q GeForce RTX 2070 Max-Q, i7-8750H, Samsung SSD PM981 MZVLB512HAJQ | Aorus X5 v8 GeForce GTX 1070 Mobile, i7-8850H, Toshiba NVMe THNSN5512GPU7 | Gigabyte Aero 15-X9 GeForce RTX 2070 Max-Q, i7-8750H, Intel SSD 760p SSDPEKKW010T8 | MSI GS65 Stealth Thin 8RE-051US GeForce GTX 1060 Mobile, i7-8750H, Samsung SSD PM981 MZVLB256HAHQ | Alienware m15 GTX 1070 Max-Q GeForce GTX 1070 Max-Q, i7-8750H, Toshiba XG5 KXG50ZNV512G | |
|---|---|---|---|---|---|---|
| Noise | 13% | -5% | 2% | 9% | 8% | |
| av / miljö * (dB) | 28.2 | 28.8 -2% | 30 -6% | 30 -6% | 28.4 -1% | 28.6 -1% |
| Idle Minimum * (dB) | 32.6 | 28.8 12% | 33 -1% | 32 2% | 28.4 13% | 28.6 12% |
| Idle Average * (dB) | 32.7 | 28.8 12% | 35 -7% | 34 -4% | 28.4 13% | 28.6 13% |
| Idle Maximum * (dB) | 32.7 | 29.4 10% | 40 -22% | 36 -10% | 29.6 9% | 28.6 13% |
| Load Average * (dB) | 38.9 | 35.7 8% | 45 -16% | 42 -8% | 43.5 -12% | 40.8 -5% |
| Witcher 3 ultra * (dB) | 51.8 | 42.5 18% | 50 3% | 44 15% | 45.7 12% | 49.6 4% |
| Load Maximum * (dB) | 64.1 | 45 30% | 55 14% | 48 25% | 45.7 29% | 49.6 23% |
* ... mindre är bättre
Ljudnivå
| Låg belastning |
| 32.6 / 32.7 / 32.7 dB(A) |
| Hög belastning |
| 38.9 / 64.1 dB(A) |
 | ||
30 dB tyst 40 dB(A) hörbar 50 dB(A) högt ljud |
||
min: | ||
(+) Den maximala temperaturen på ovansidan är 36.6 °C / 98 F, jämfört med genomsnittet av 40.4 °C / 105 F , allt från 21.2 till 68.8 °C för klassen Gaming.
(-) Botten värms upp till maximalt 56.8 °C / 134 F, jämfört med genomsnittet av 43.2 °C / 110 F
(+) Vid tomgångsbruk är medeltemperaturen för ovansidan 26.6 °C / 80 F, jämfört med enhetsgenomsnittet på 33.9 °C / ### class_avg_f### F.
(±) När du spelar The Witcher 3 är medeltemperaturen för ovansidan 32.5 °C / 91 F, jämfört med enhetsgenomsnittet på 33.9 °C / ## #class_avg_f### F.
(+) Handledsstöden och pekplattan är kallare än hudtemperaturen med maximalt 29.4 °C / 84.9 F och är därför svala att ta på.
(±) Medeltemperaturen för handledsstödsområdet på liknande enheter var 28.8 °C / 83.8 F (-0.6 °C / -1.1 F).
Aorus 15 X9 ljudanalys
(-) | inte särskilt höga högtalare (69.3 dB)
Bas 100 - 315 Hz
(-) | nästan ingen bas - i genomsnitt 19% lägre än medianen
(-) | basen är inte linjär (15.9% delta till föregående frekvens)
Mellan 400 - 2000 Hz
(+) | balanserad mellan - endast 2.4% från medianen
(+) | mids är linjära (6.6% delta till föregående frekvens)
Högsta 2 - 16 kHz
(+) | balanserade toppar - endast 3.3% från medianen
(±) | linjäriteten för toppar är genomsnittlig (8.7% delta till föregående frekvens)
Totalt 100 - 16 000 Hz
(±) | linjäriteten för det totala ljudet är genomsnittlig (22.6% skillnad mot median)
Jämfört med samma klass
» 81% av alla testade enheter i den här klassen var bättre, 5% liknande, 14% sämre
» Den bästa hade ett delta på 6%, genomsnittet var 18%, sämst var 132%
Jämfört med alla testade enheter
» 67% av alla testade enheter var bättre, 6% liknande, 28% sämre
» Den bästa hade ett delta på 4%, genomsnittet var 23%, sämst var 134%
Apple MacBook 12 (Early 2016) 1.1 GHz ljudanalys
(+) | högtalare kan spela relativt högt (83.6 dB)
Bas 100 - 315 Hz
(±) | reducerad bas - i genomsnitt 11.3% lägre än medianen
(±) | linjäriteten för basen är genomsnittlig (14.2% delta till föregående frekvens)
Mellan 400 - 2000 Hz
(+) | balanserad mellan - endast 2.4% från medianen
(+) | mids är linjära (5.5% delta till föregående frekvens)
Högsta 2 - 16 kHz
(+) | balanserade toppar - endast 2% från medianen
(+) | toppar är linjära (4.5% delta till föregående frekvens)
Totalt 100 - 16 000 Hz
(+) | det totala ljudet är linjärt (10.2% skillnad mot median)
Jämfört med samma klass
» 7% av alla testade enheter i den här klassen var bättre, 2% liknande, 90% sämre
» Den bästa hade ett delta på 5%, genomsnittet var 18%, sämst var 53%
Jämfört med alla testade enheter
» 5% av alla testade enheter var bättre, 1% liknande, 94% sämre
» Den bästa hade ett delta på 4%, genomsnittet var 23%, sämst var 134%
| Av/Standby | |
| Låg belastning | |
| Hög belastning |
|
Förklaring:
min: | |
| Aorus 15 X9 i7-8750H, GeForce RTX 2070 Mobile, Intel SSD 760p SSDPEKKW512G8, IPS, 1920x1080, 15.6" | Razer Blade 15 RTX 2070 Max-Q i7-8750H, GeForce RTX 2070 Max-Q, Samsung SSD PM981 MZVLB512HAJQ, IPS, 1920x1080, 15.6" | Aorus X5 v8 i7-8850H, GeForce GTX 1070 Mobile, Toshiba NVMe THNSN5512GPU7, IPS, 1920x1080, 15.6" | Gigabyte Aero 15-X9 i7-8750H, GeForce RTX 2070 Max-Q, Intel SSD 760p SSDPEKKW010T8, IPS, 1920x1080, 15.6" | MSI GS65 Stealth Thin 8RE-051US i7-8750H, GeForce GTX 1060 Mobile, Samsung SSD PM981 MZVLB256HAHQ, IPS, 1920x1080, 15.6" | Alienware m15 GTX 1070 Max-Q i7-8750H, GeForce GTX 1070 Max-Q, Toshiba XG5 KXG50ZNV512G, IPS, 1920x1080, 15.6" | |
|---|---|---|---|---|---|---|
| Power Consumption | 34% | -2% | 30% | 38% | 37% | |
| Idle Minimum * (Watt) | 26 | 10.4 60% | 25 4% | 16 38% | 8.7 67% | 7.6 71% |
| Idle Average * (Watt) | 30.8 | 14.6 53% | 31 -1% | 18 42% | 13 58% | 13.8 55% |
| Idle Maximum * (Watt) | 34.9 | 16.3 53% | 33 5% | 23 34% | 14.3 59% | 14.6 58% |
| Load Average * (Watt) | 90.7 | 88.5 2% | 102 -12% | 88 3% | 107.4 -18% | 97.6 -8% |
| Witcher 3 ultra * (Watt) | 175 | 155.4 11% | 194 -11% | 120 31% | 129 26% | 145.8 17% |
| Load Maximum * (Watt) | 241.2 | 182.4 24% | 239 1% | 167 31% | 151.5 37% | 172.5 28% |
* ... mindre är bättre
| Aorus 15 X9 i7-8750H, GeForce RTX 2070 Mobile, 62 Wh | Aorus X5 v7 i7-7820HK, GeForce GTX 1070 Mobile, 94 Wh | Razer Blade 15 RTX 2070 Max-Q i7-8750H, GeForce RTX 2070 Max-Q, 80 Wh | Gigabyte Aero 15-X9 i7-8750H, GeForce RTX 2070 Max-Q, 94.24 Wh | MSI GS65 Stealth Thin 8RE-051US i7-8750H, GeForce GTX 1060 Mobile, 82 Wh | Alienware m15 GTX 1070 Max-Q i7-8750H, GeForce GTX 1070 Max-Q, 90 Wh | |
|---|---|---|---|---|---|---|
| Batteridrifttid | 63% | 296% | 300% | 154% | 311% | |
| Reader / Idle (h) | 1.8 | 3.5 94% | 11.4 533% | 9.2 411% | 10.5 483% | |
| WiFi v1.3 (h) | 1.6 | 2.5 56% | 6.5 306% | 6.4 300% | 6.2 288% | 7.7 381% |
| Load (h) | 1 | 1.4 40% | 1.5 50% | 2.9 190% | 1.2 20% | 1.7 70% |
För
Emot

Läs den fullständiga versionen av den här recensionen på engelska här.
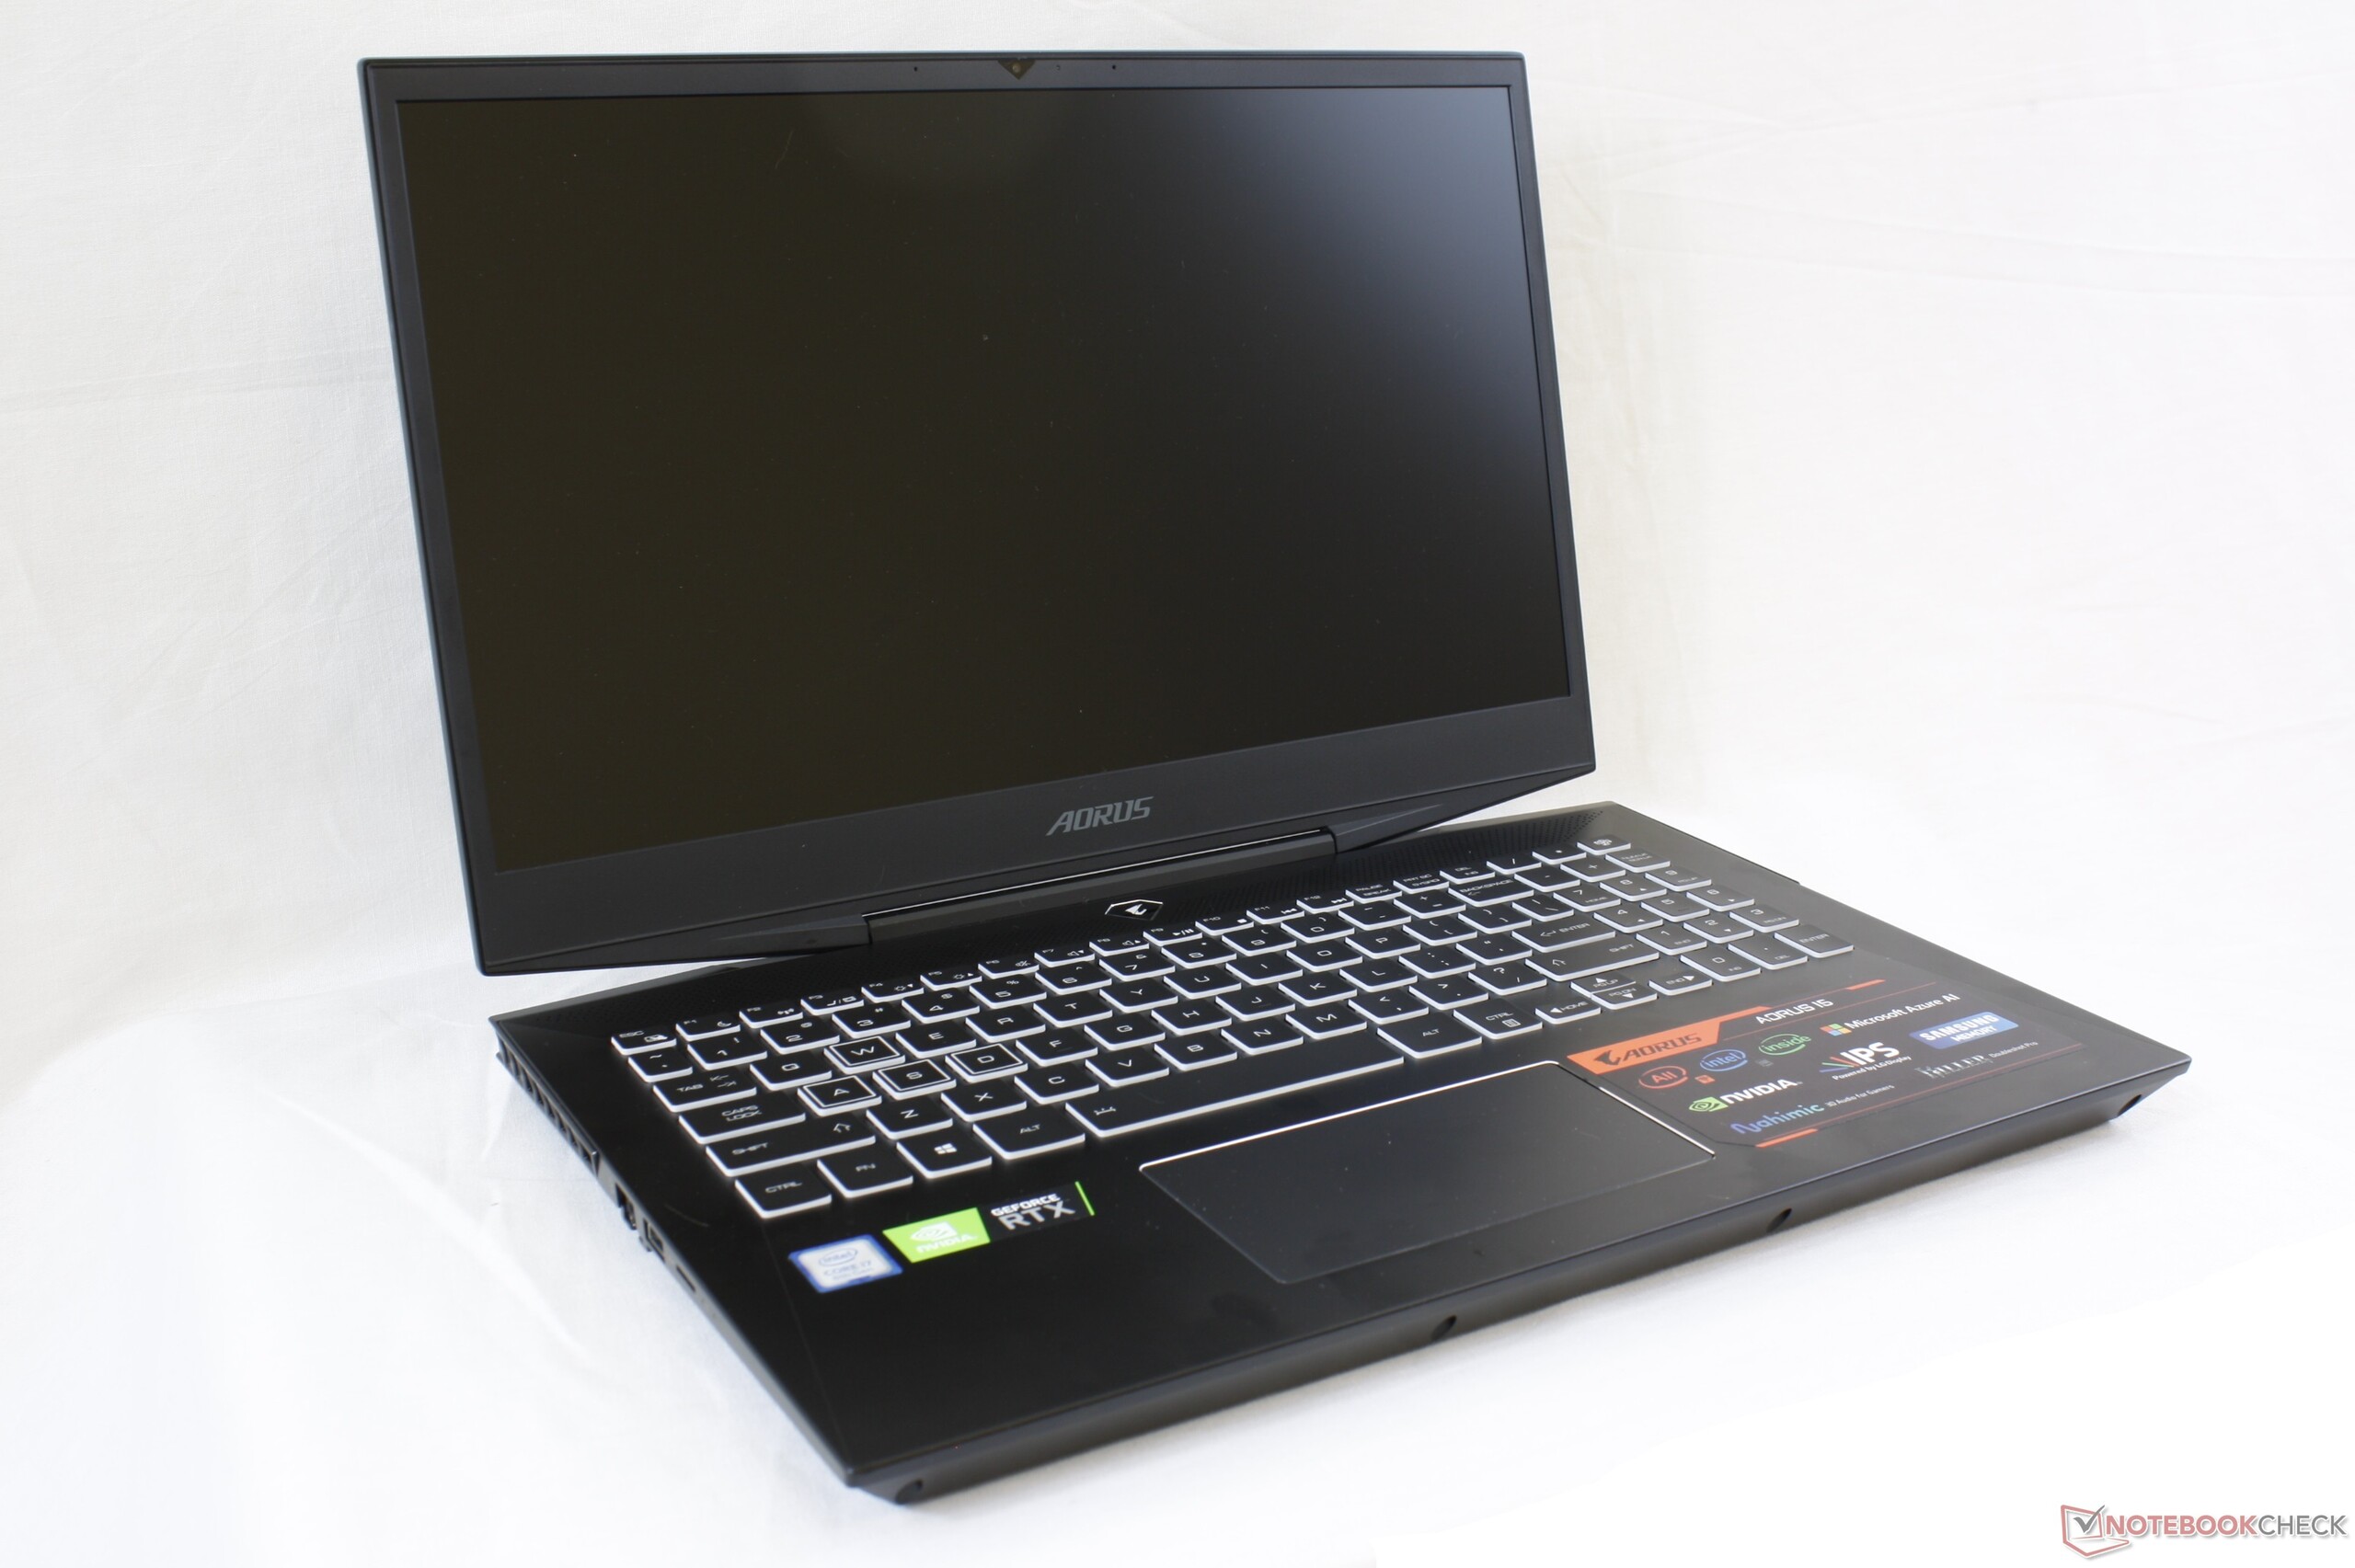
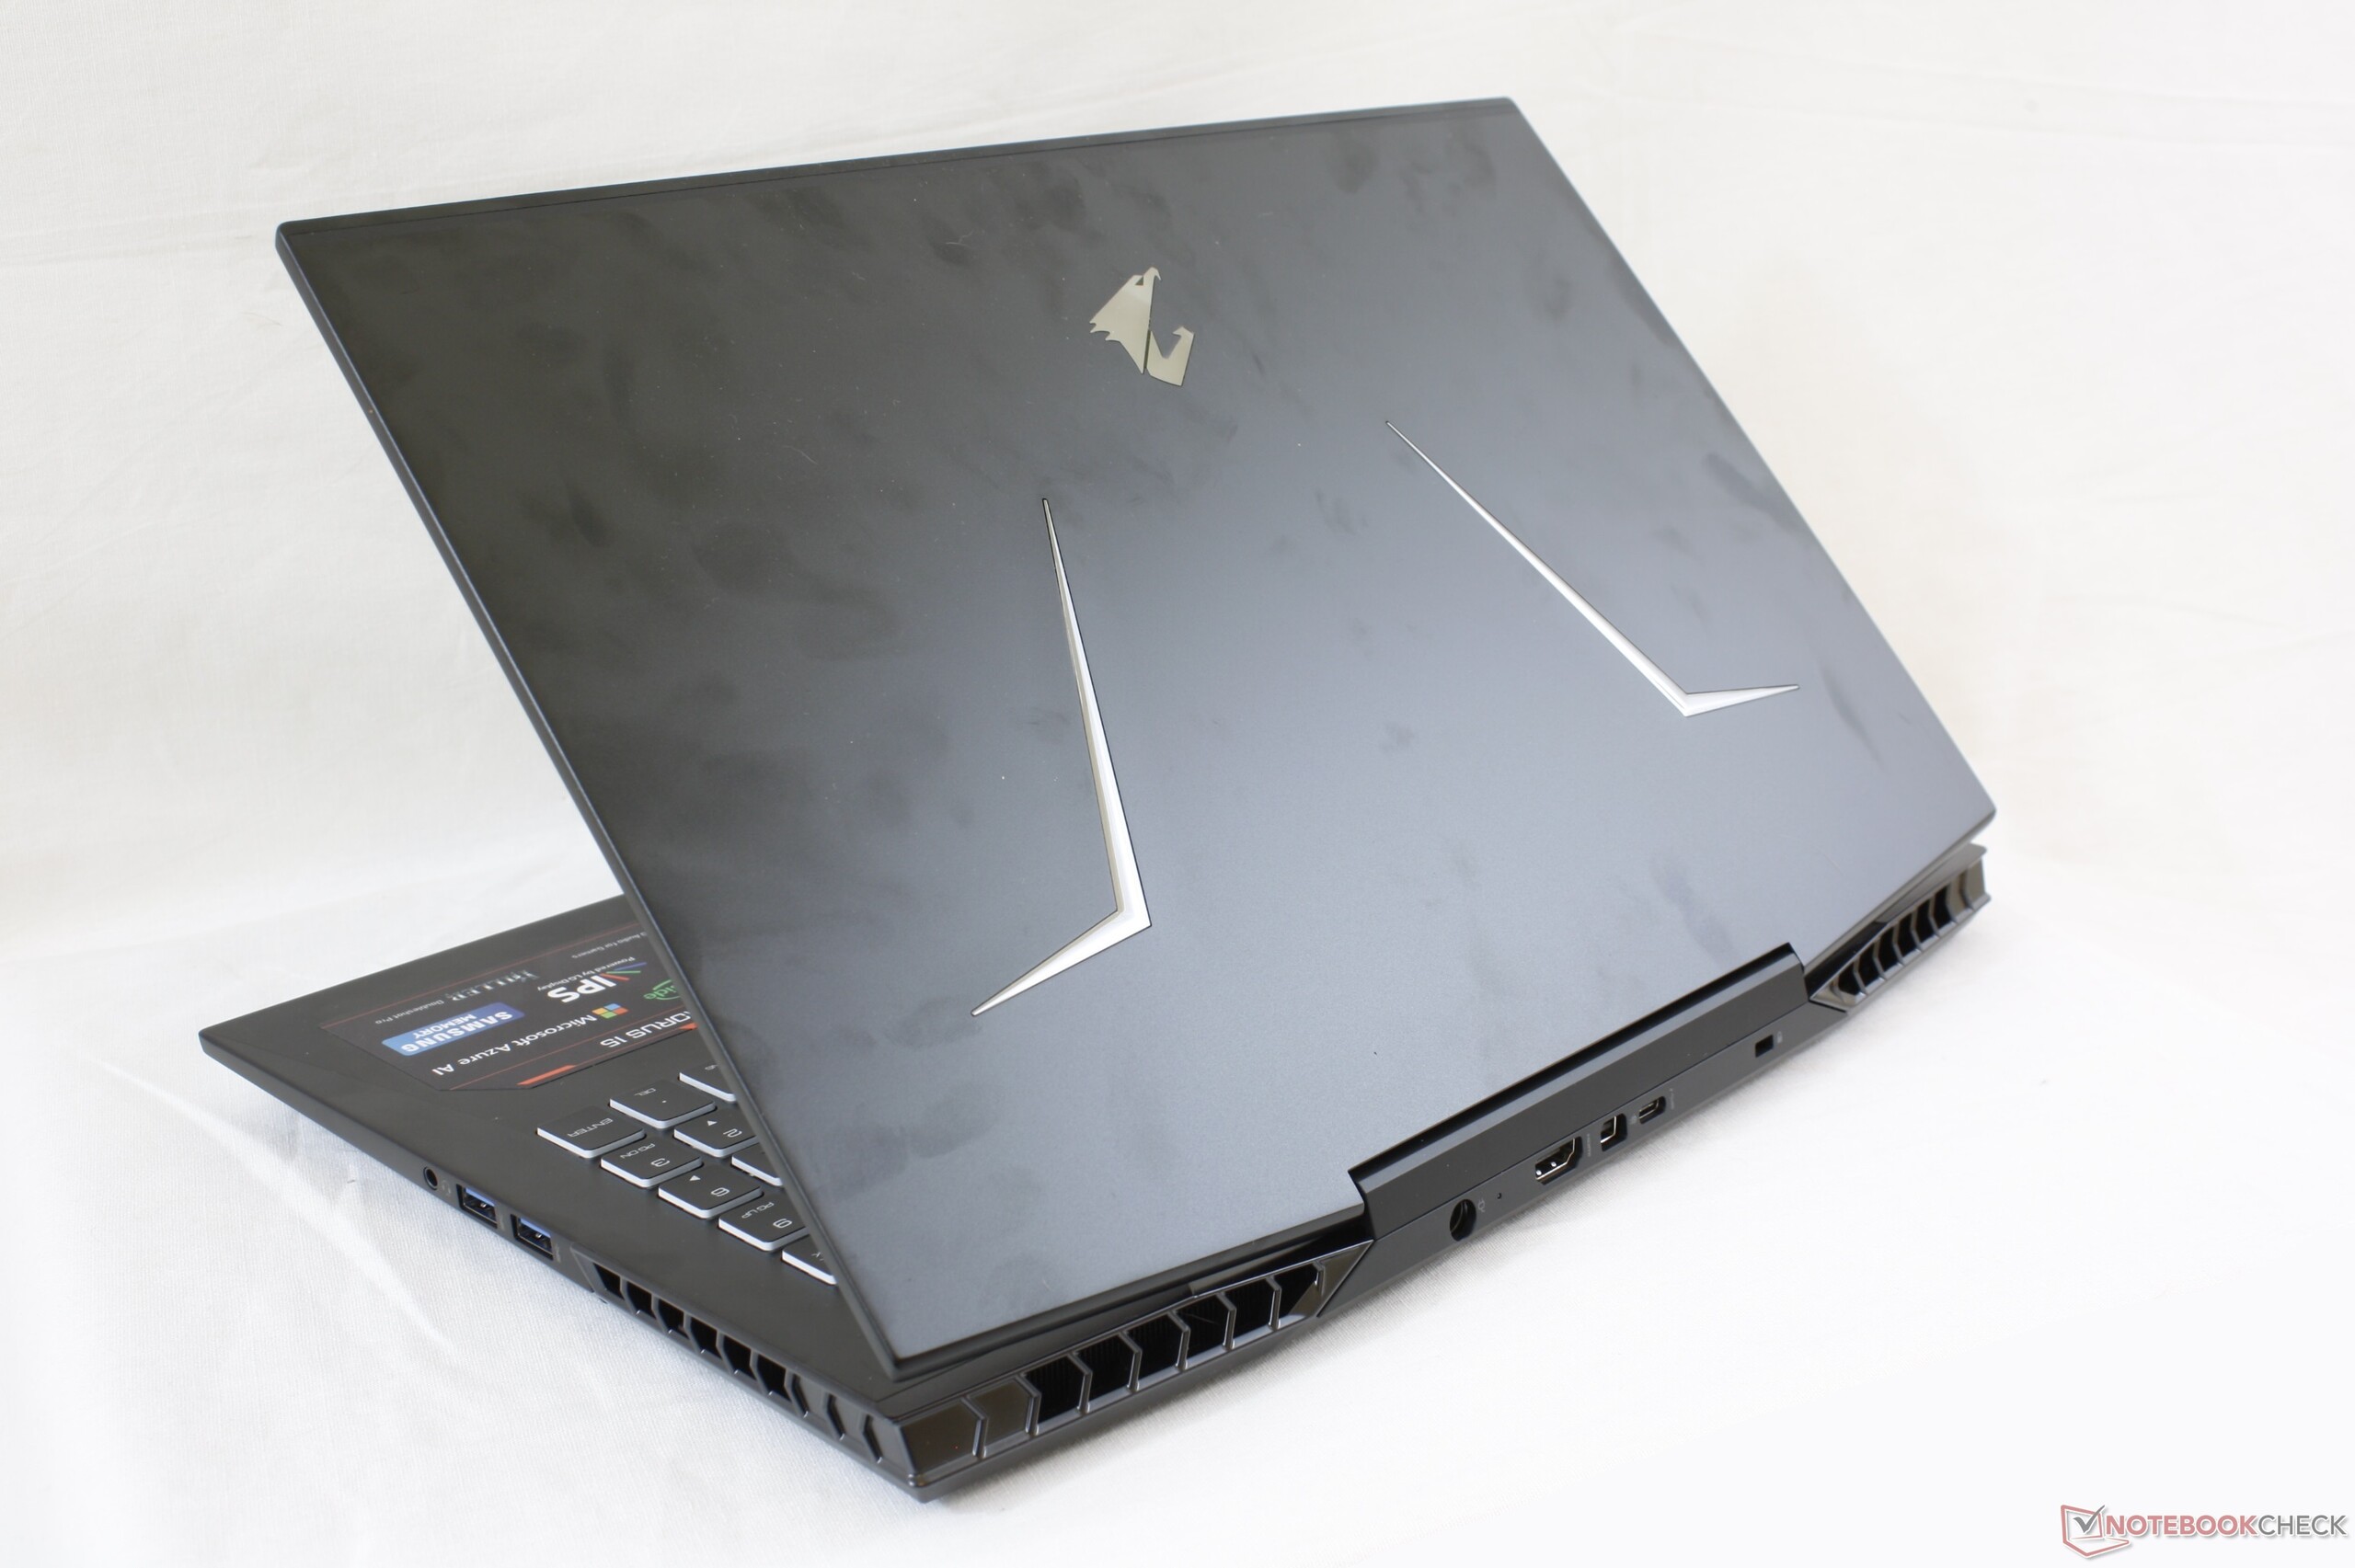
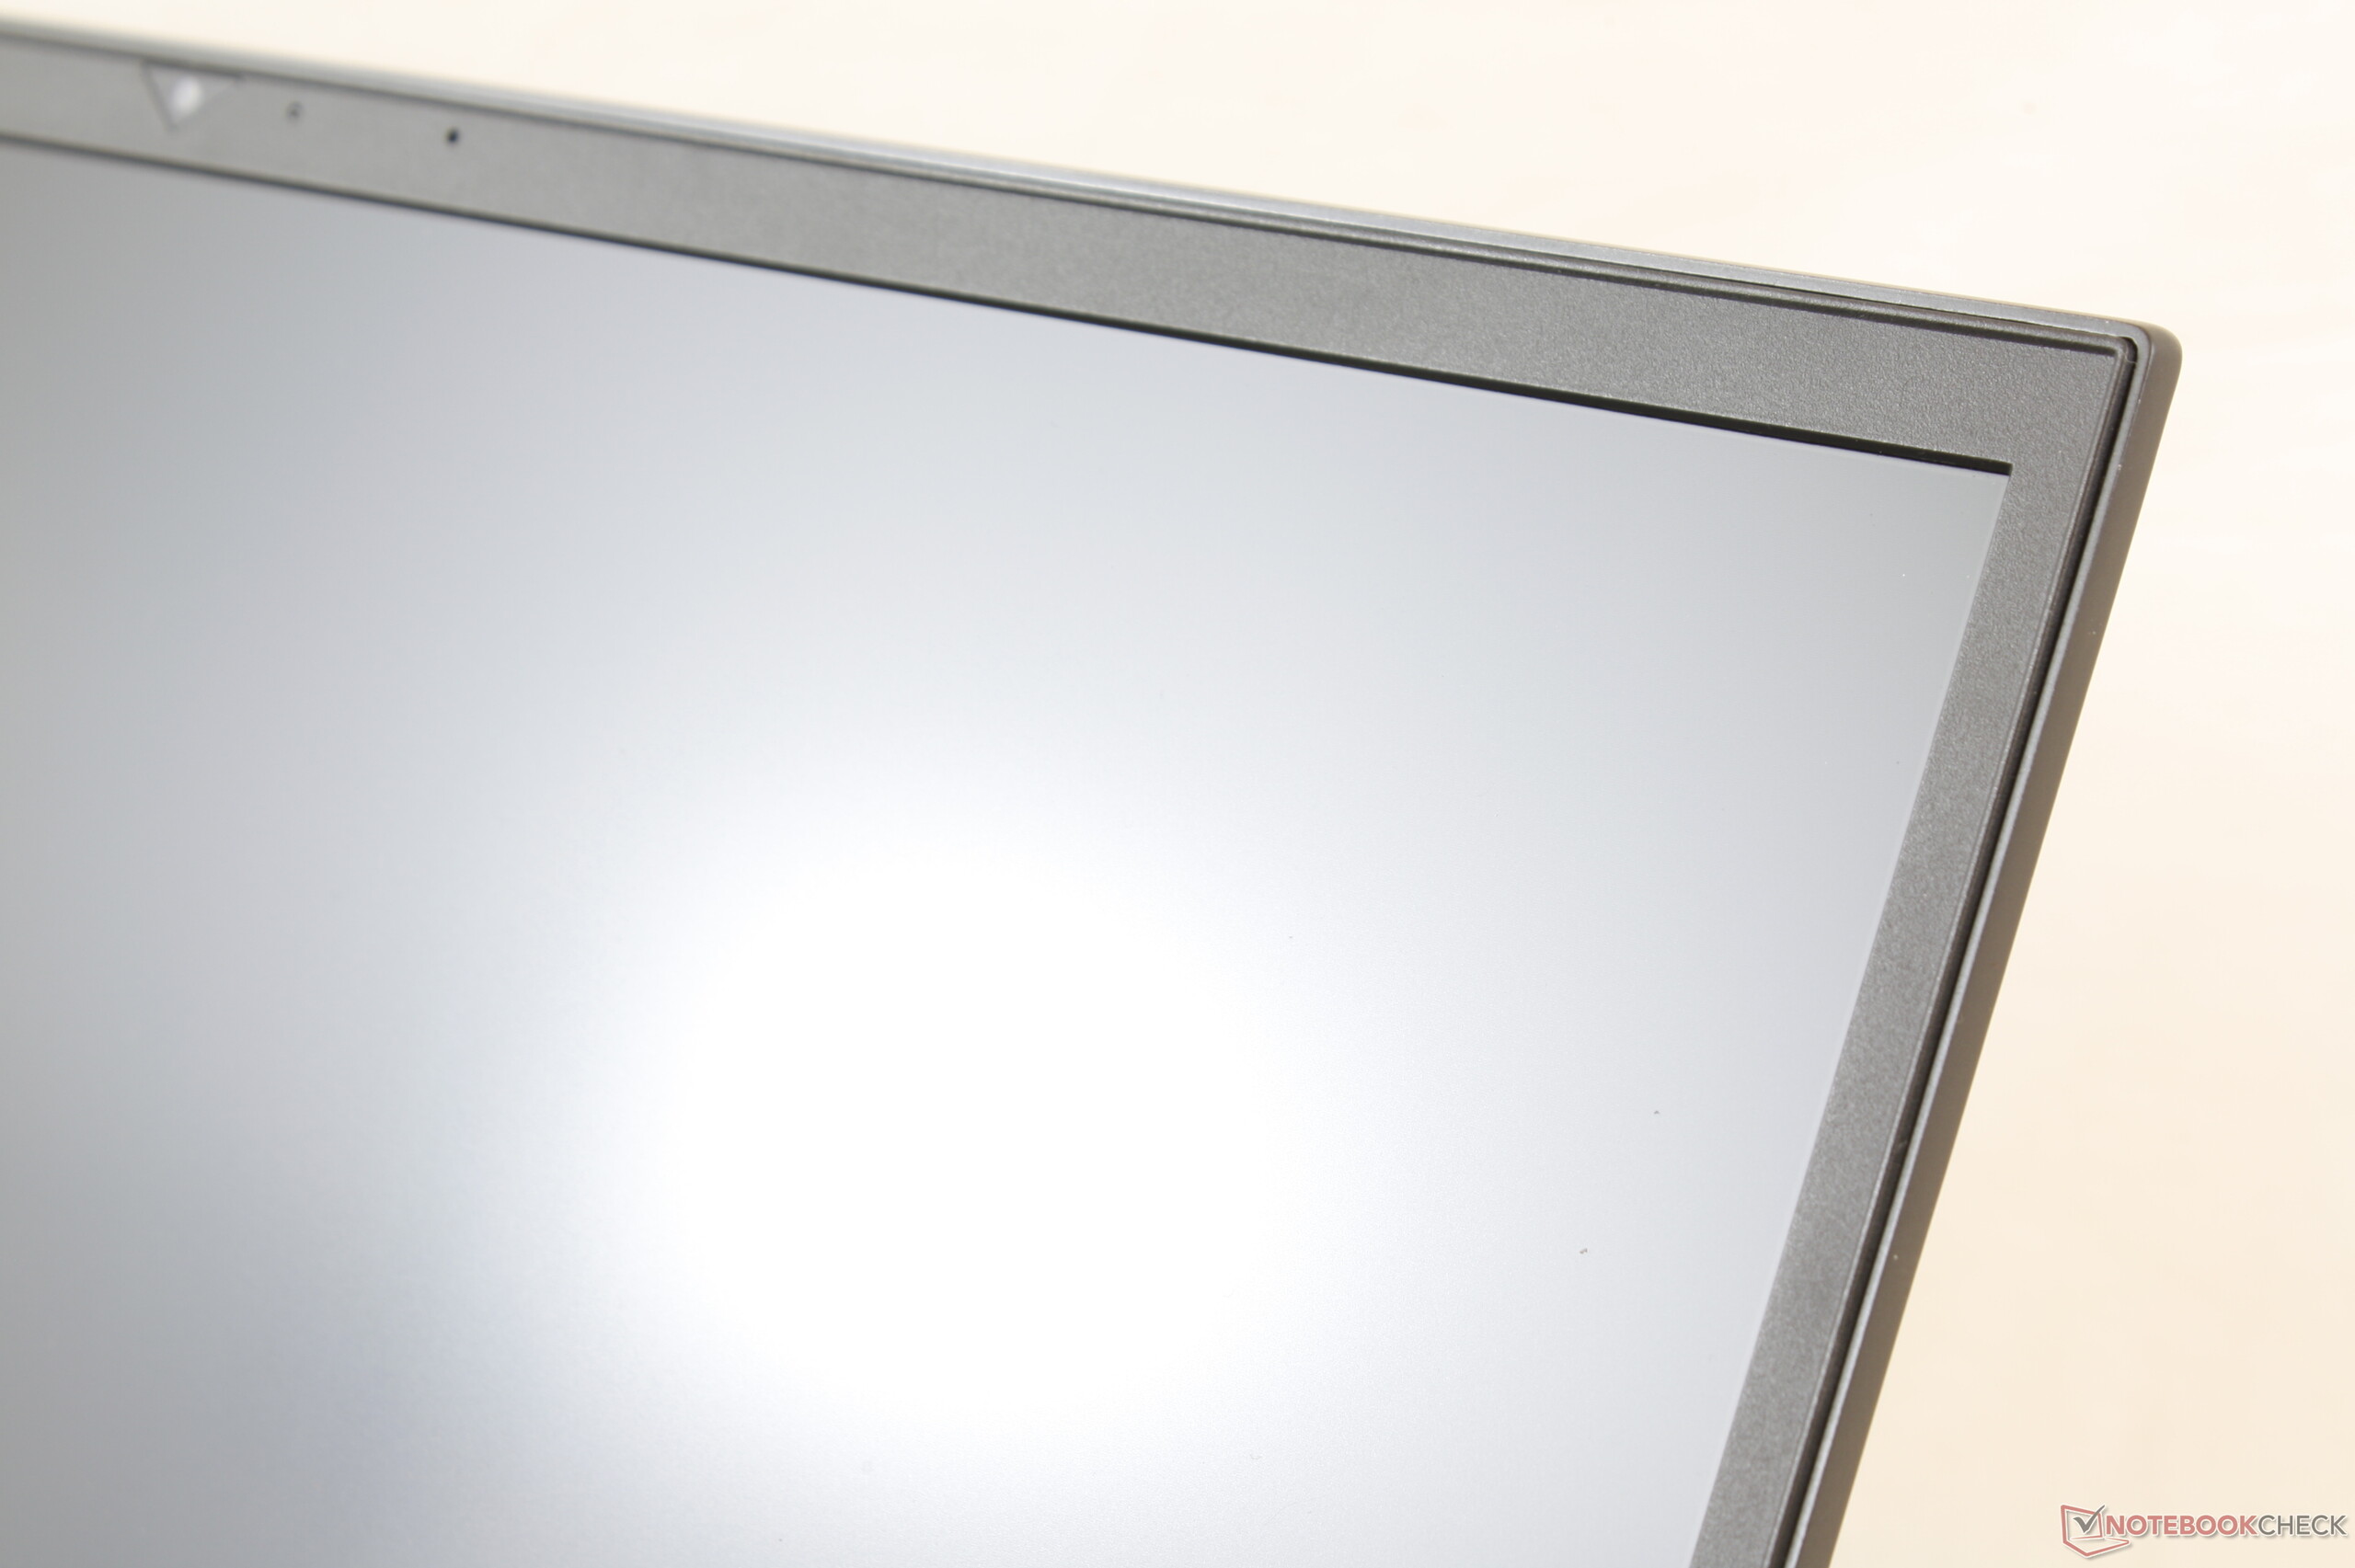
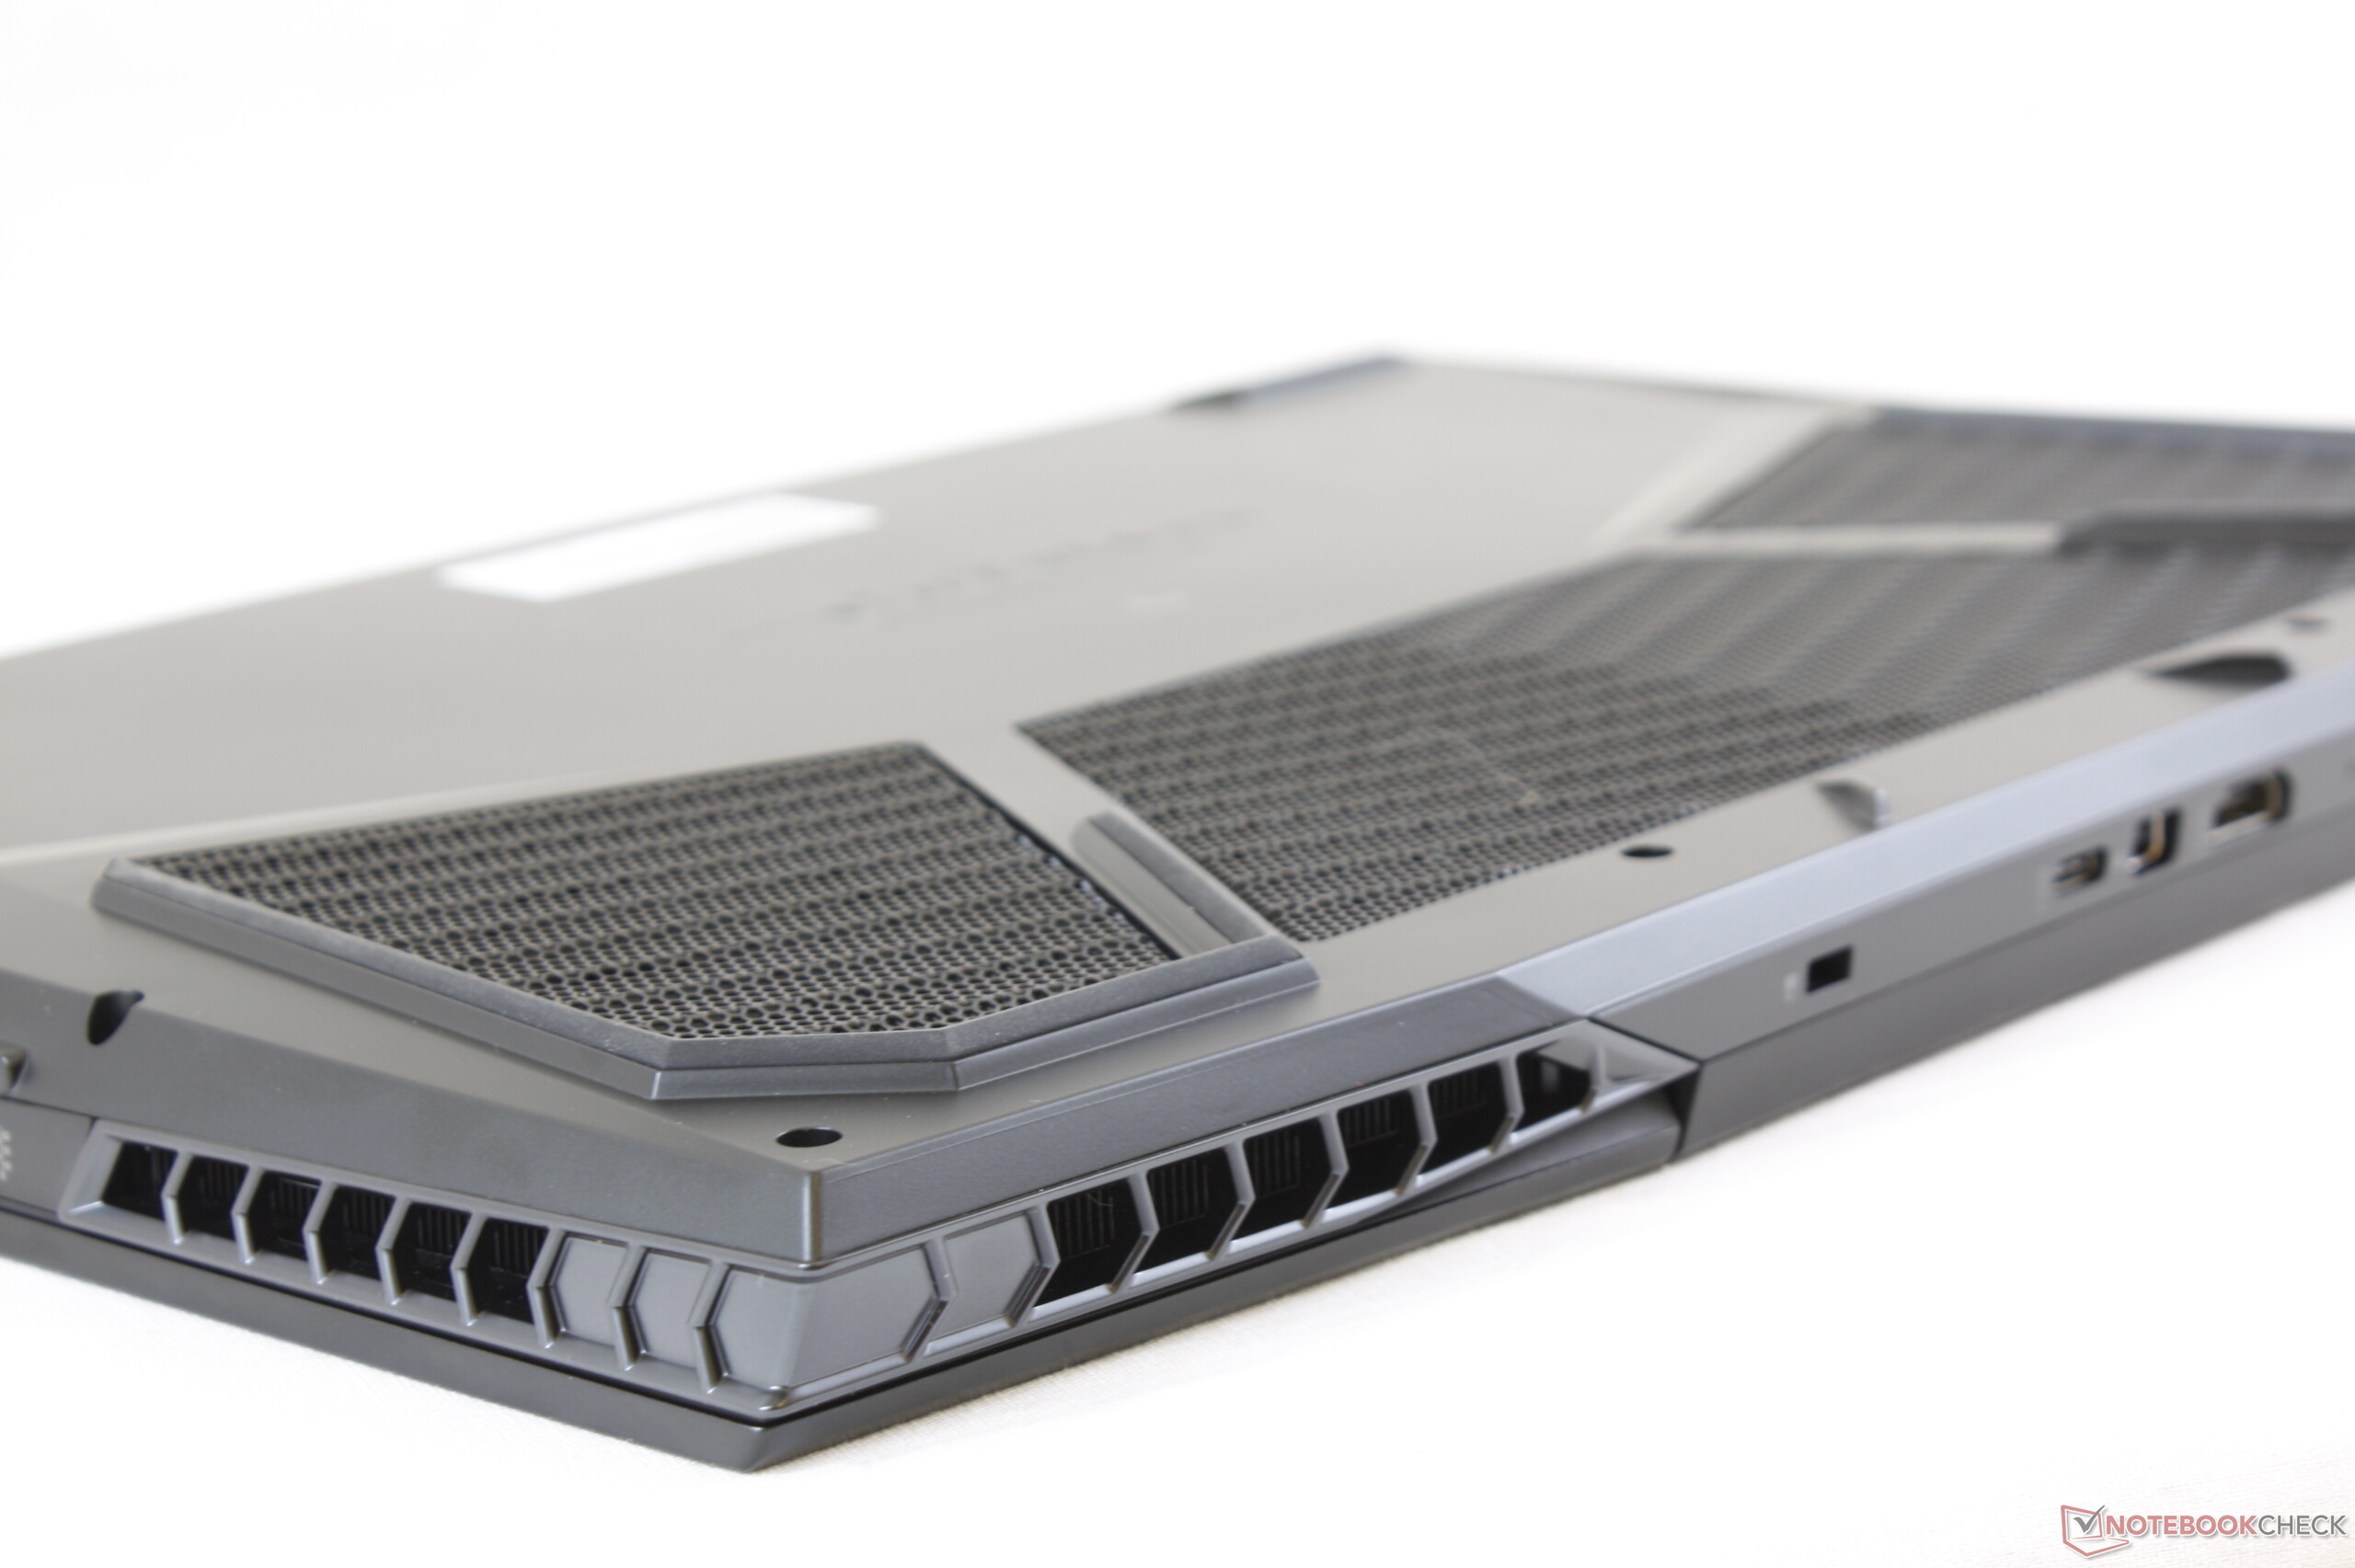
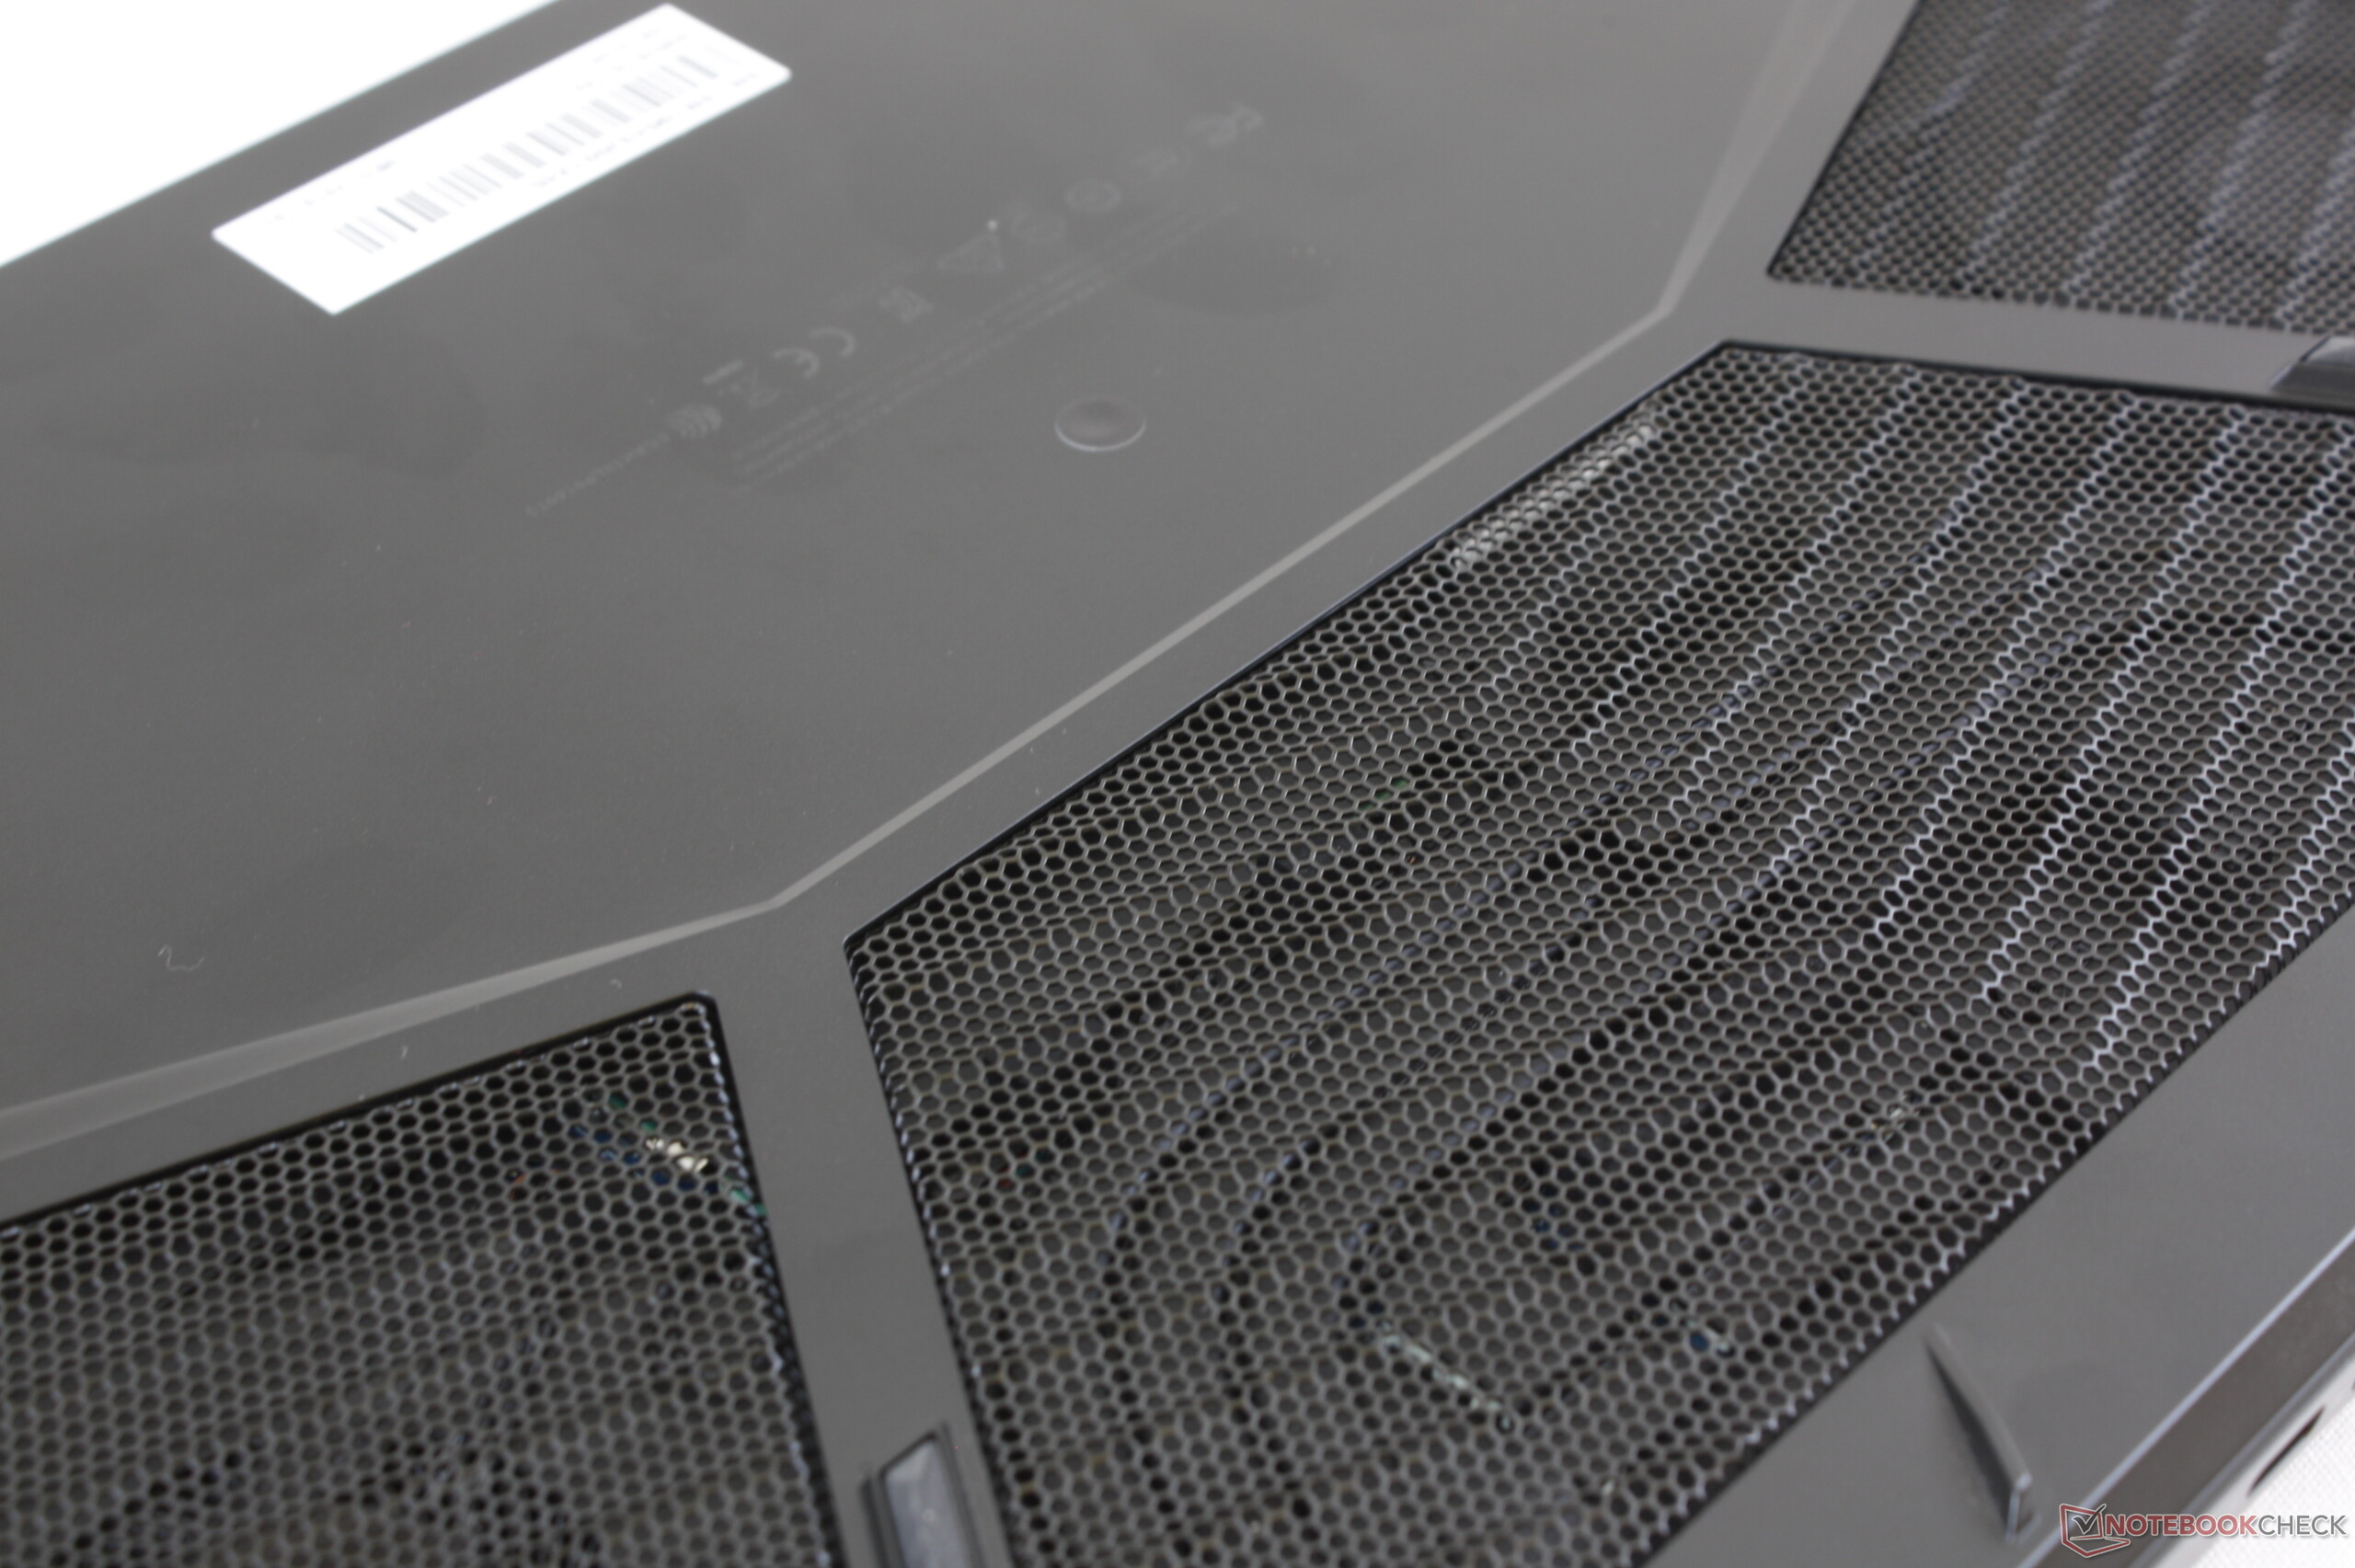
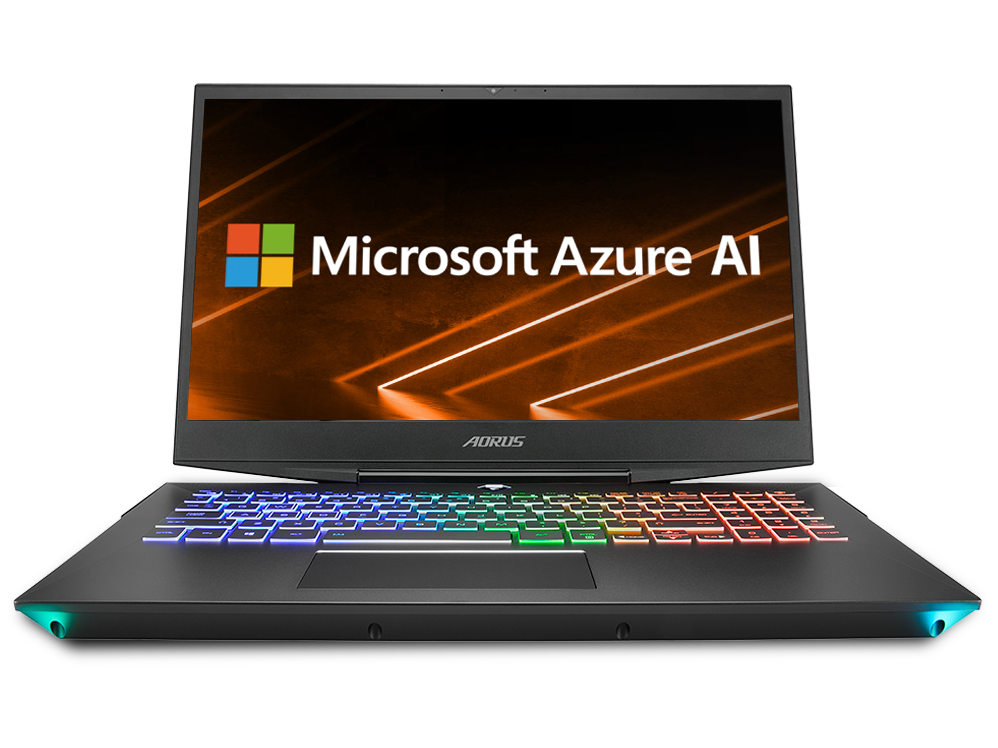
Aorus 15 tar flera steg framåt och ett par steg bakåt jämfört med den äldre Aorus X5. Den är mindre, lättare, mer kraftfull och håller sig svalare än förra generationens modell och den har dessutom ett starkare chassi. I synnerhet har styrplattan och locket blivit bättre och är nu lättare att använda respektive fastare. Ventilationen har också förbättrats.
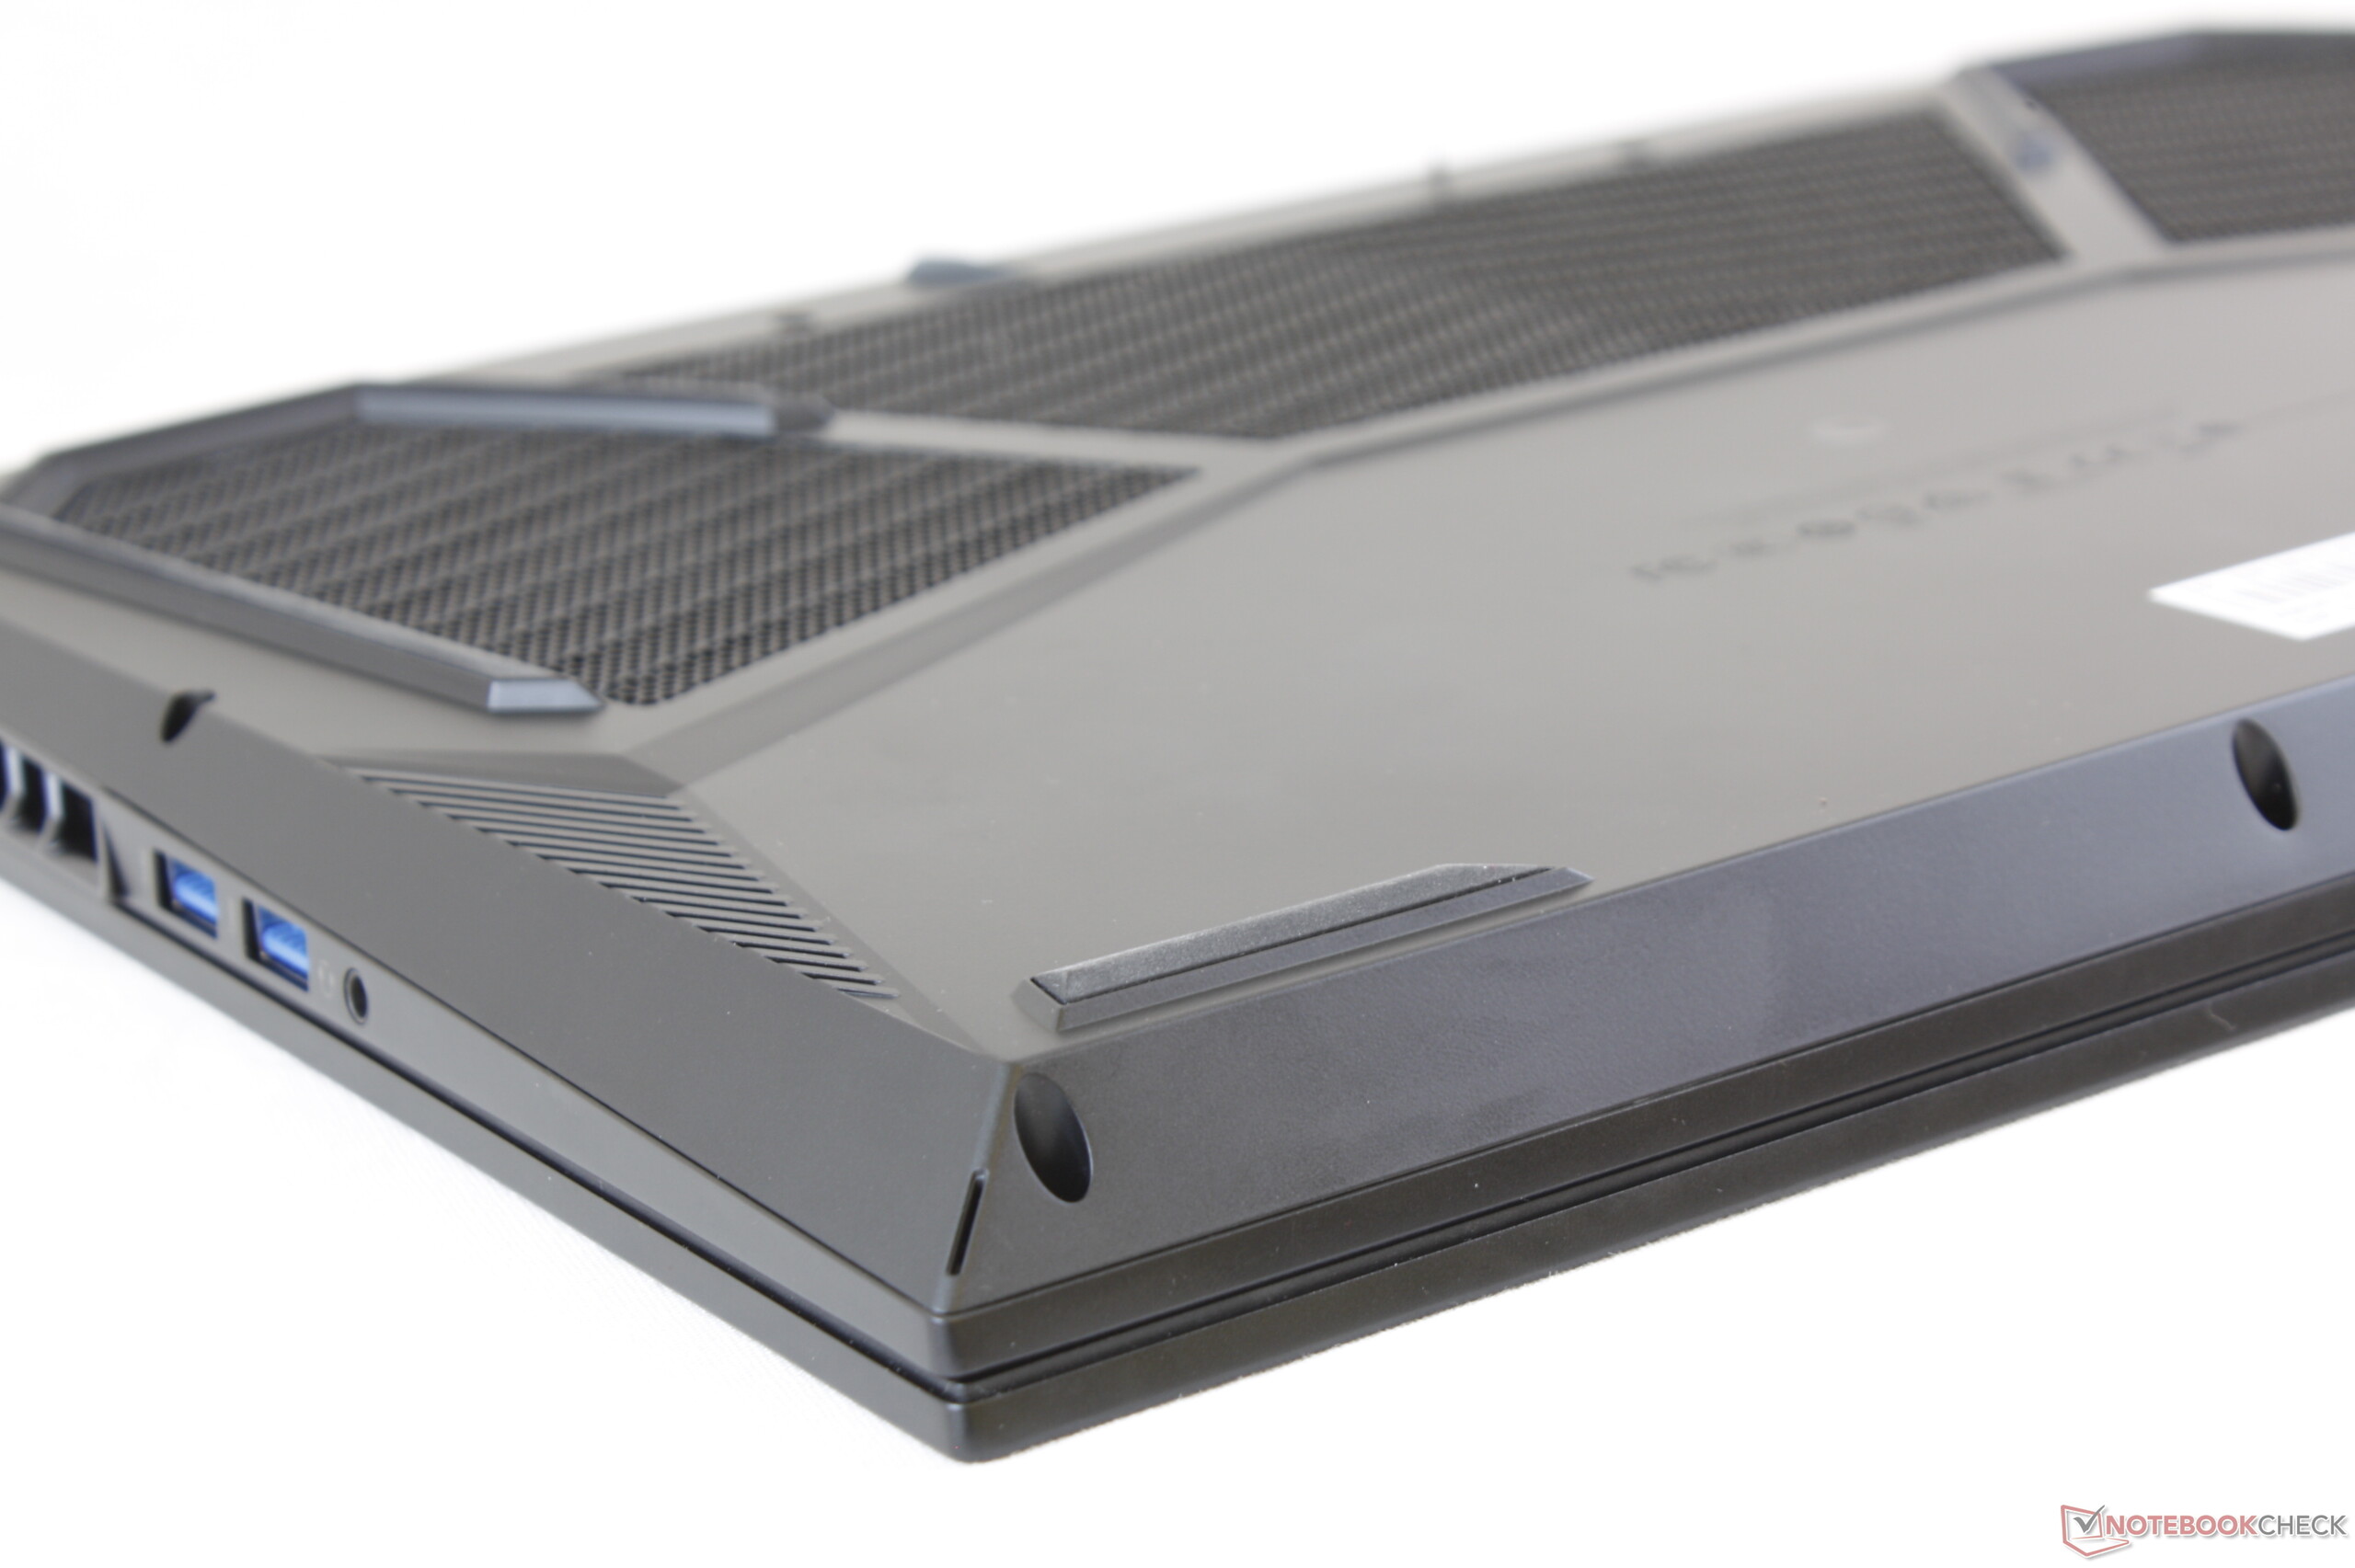
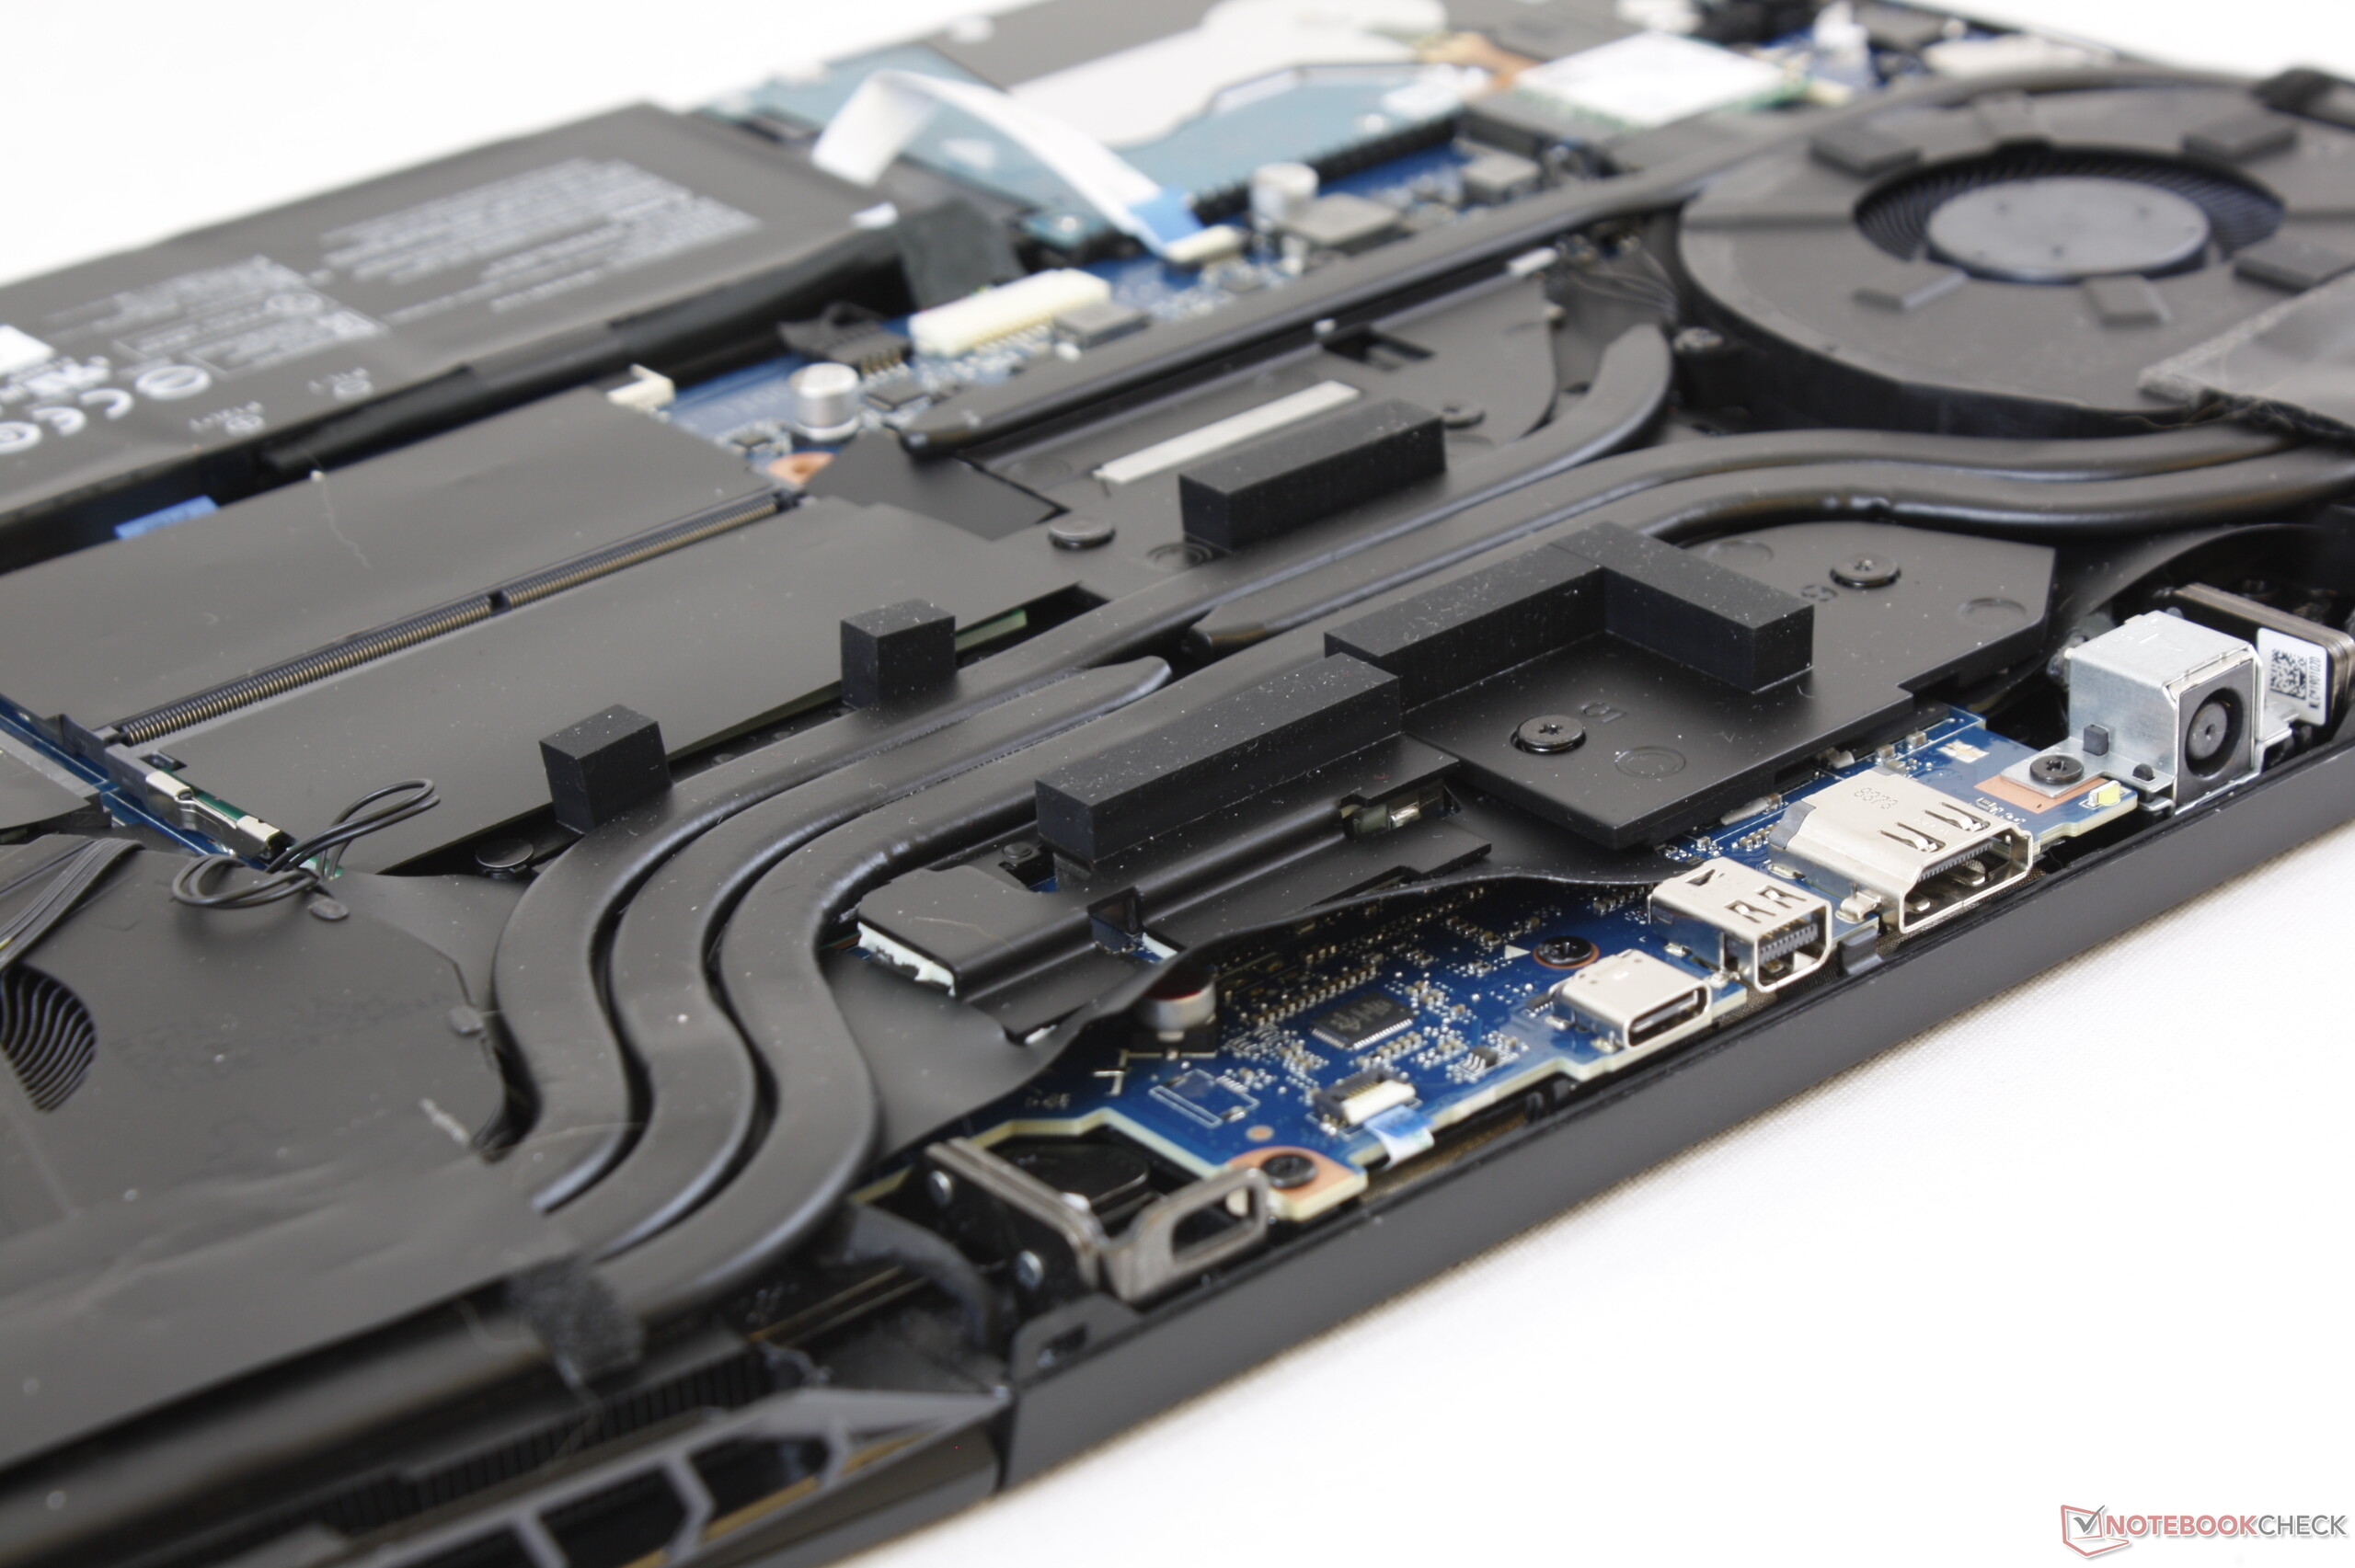
Men den har ett antal nackdelar. Förra årets Aorus X5 hade en SD-kortläsare i full storlek, fler lagringsplatser, tangentspecifik RGB-belysning, G-Sync, ett större batteri, en större styrplatta och dedikerade Macro-knappar. Att se att alla de funktionerna saknas på Aorus 15 är lite av en besvikelse eftersom vi är vana vid att Aorus produkter är entusiastmodeller med alla de extrasaker som brukar associeras med bärbara speldatorer från toppskiktet. Arous 15 hamnar i det hänseendet någonstans mellan mittenskiktet och toppskiktet.
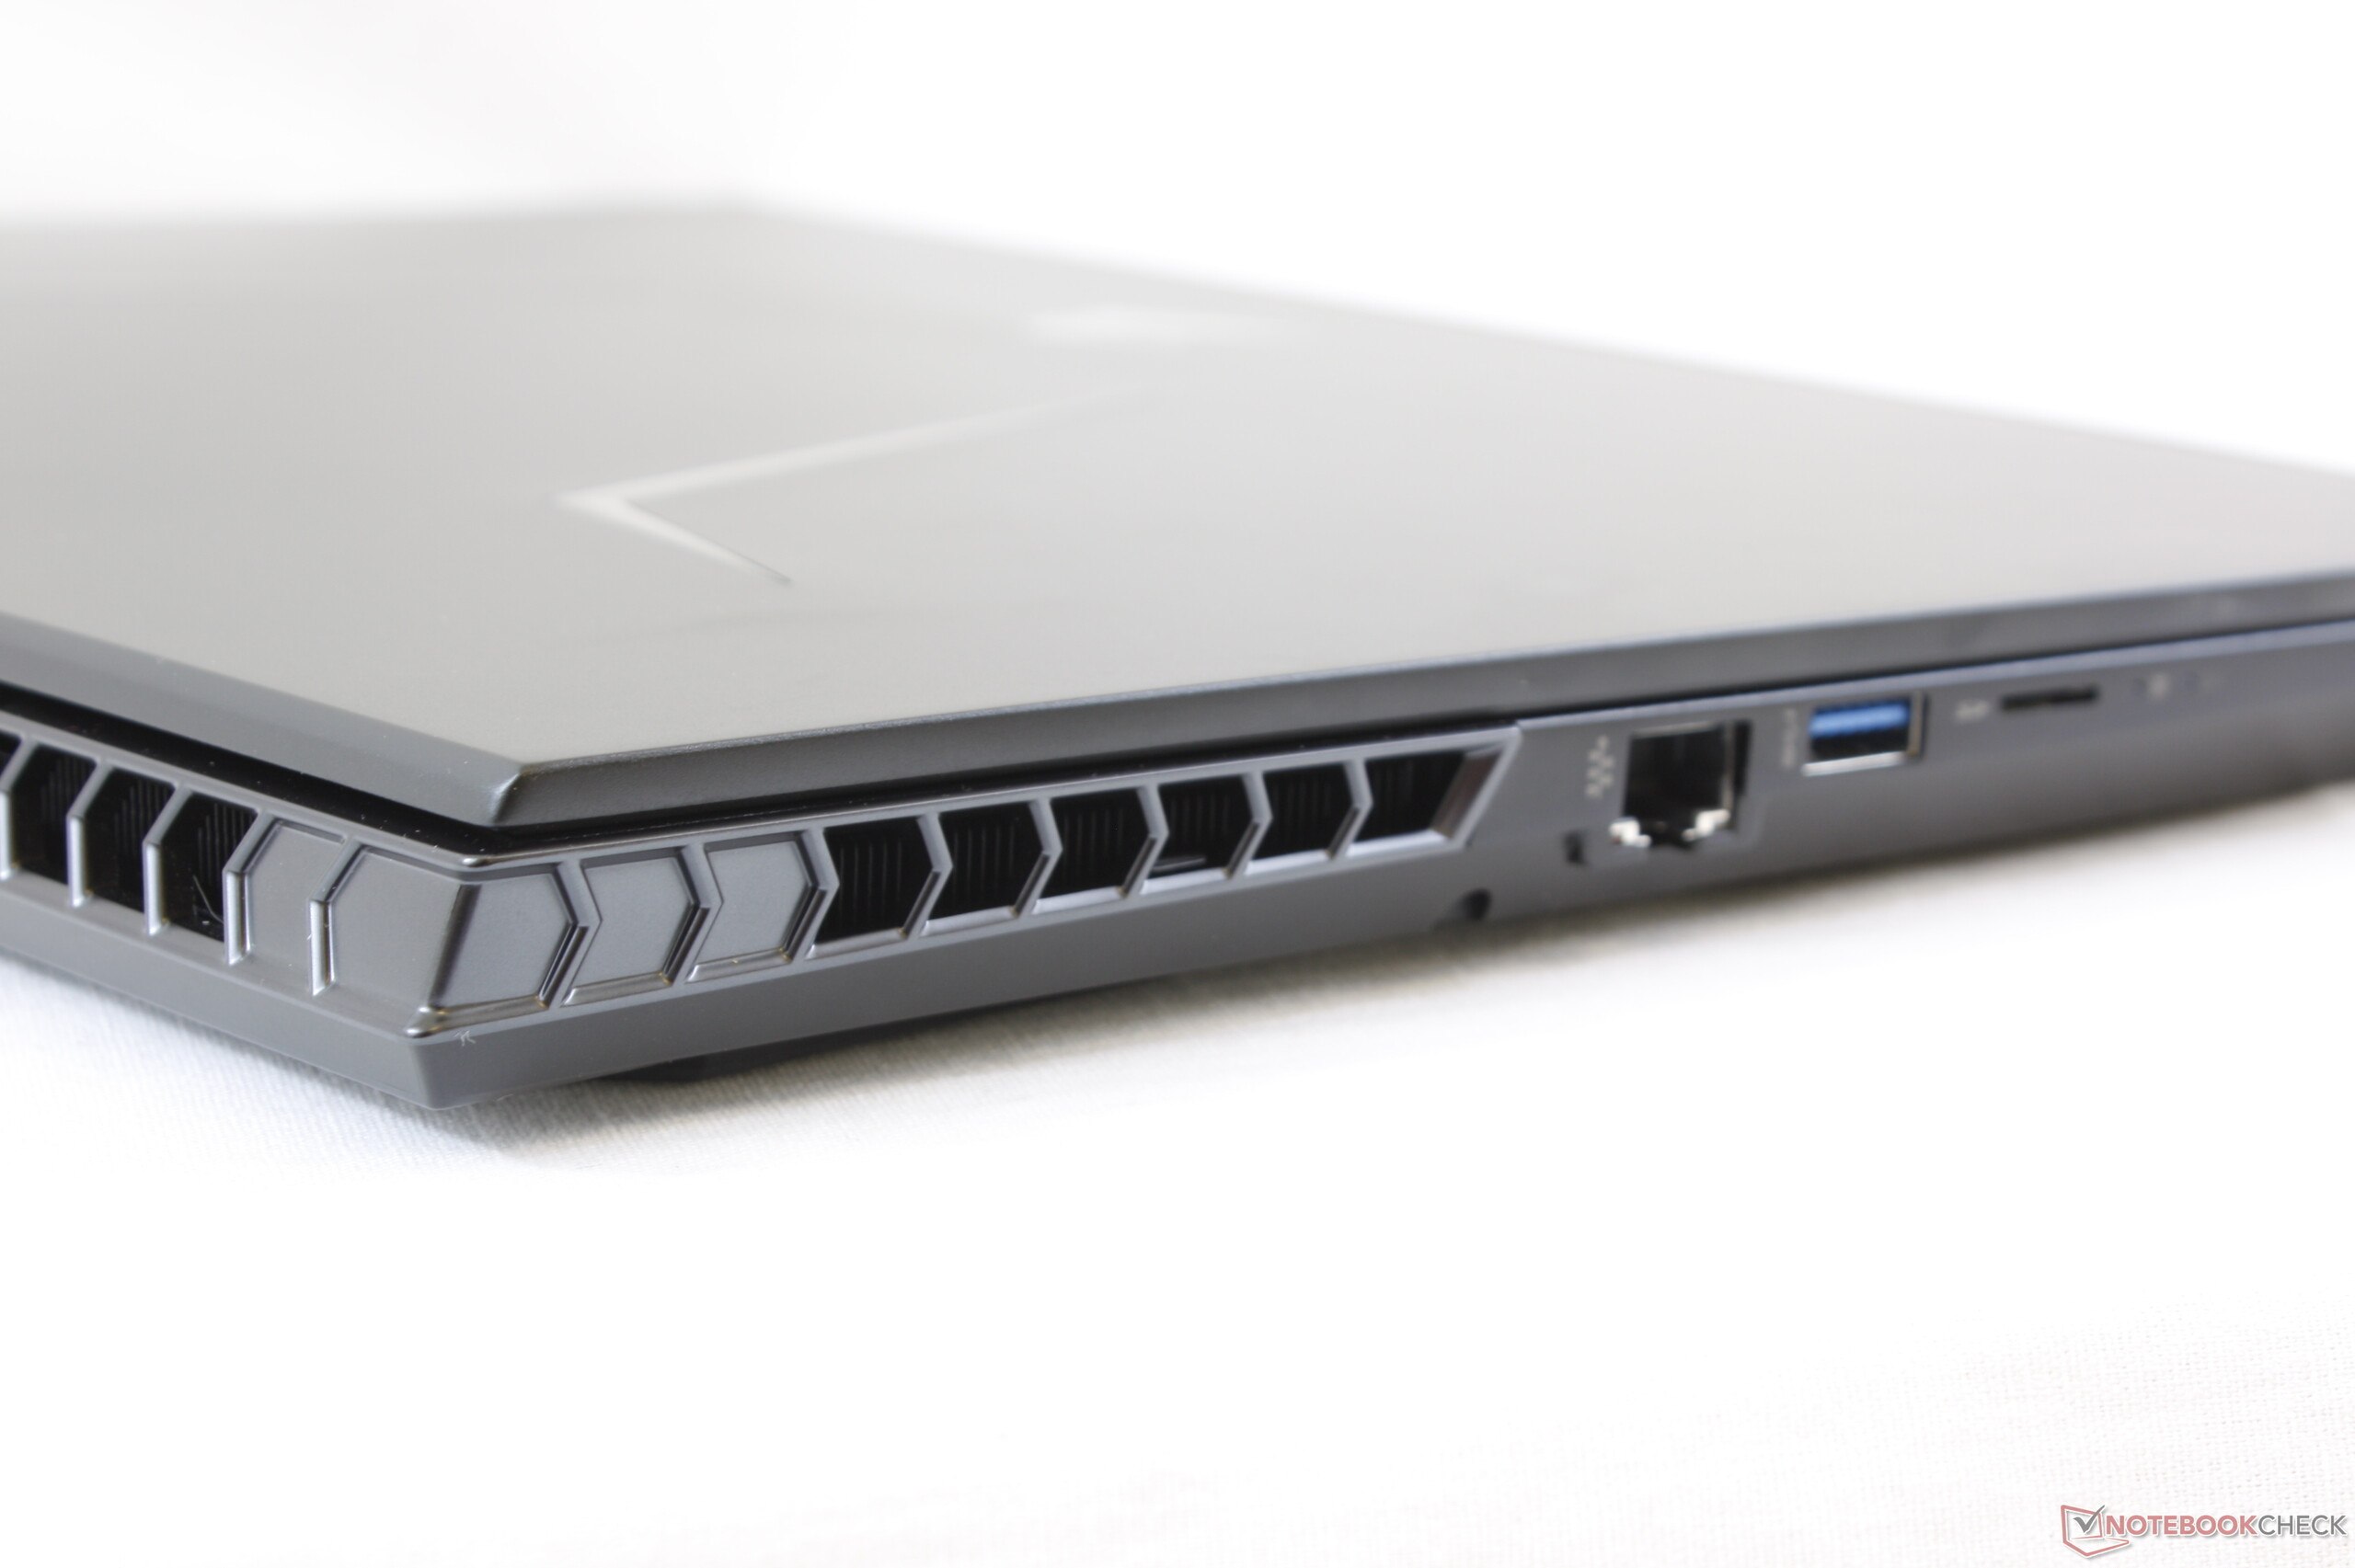
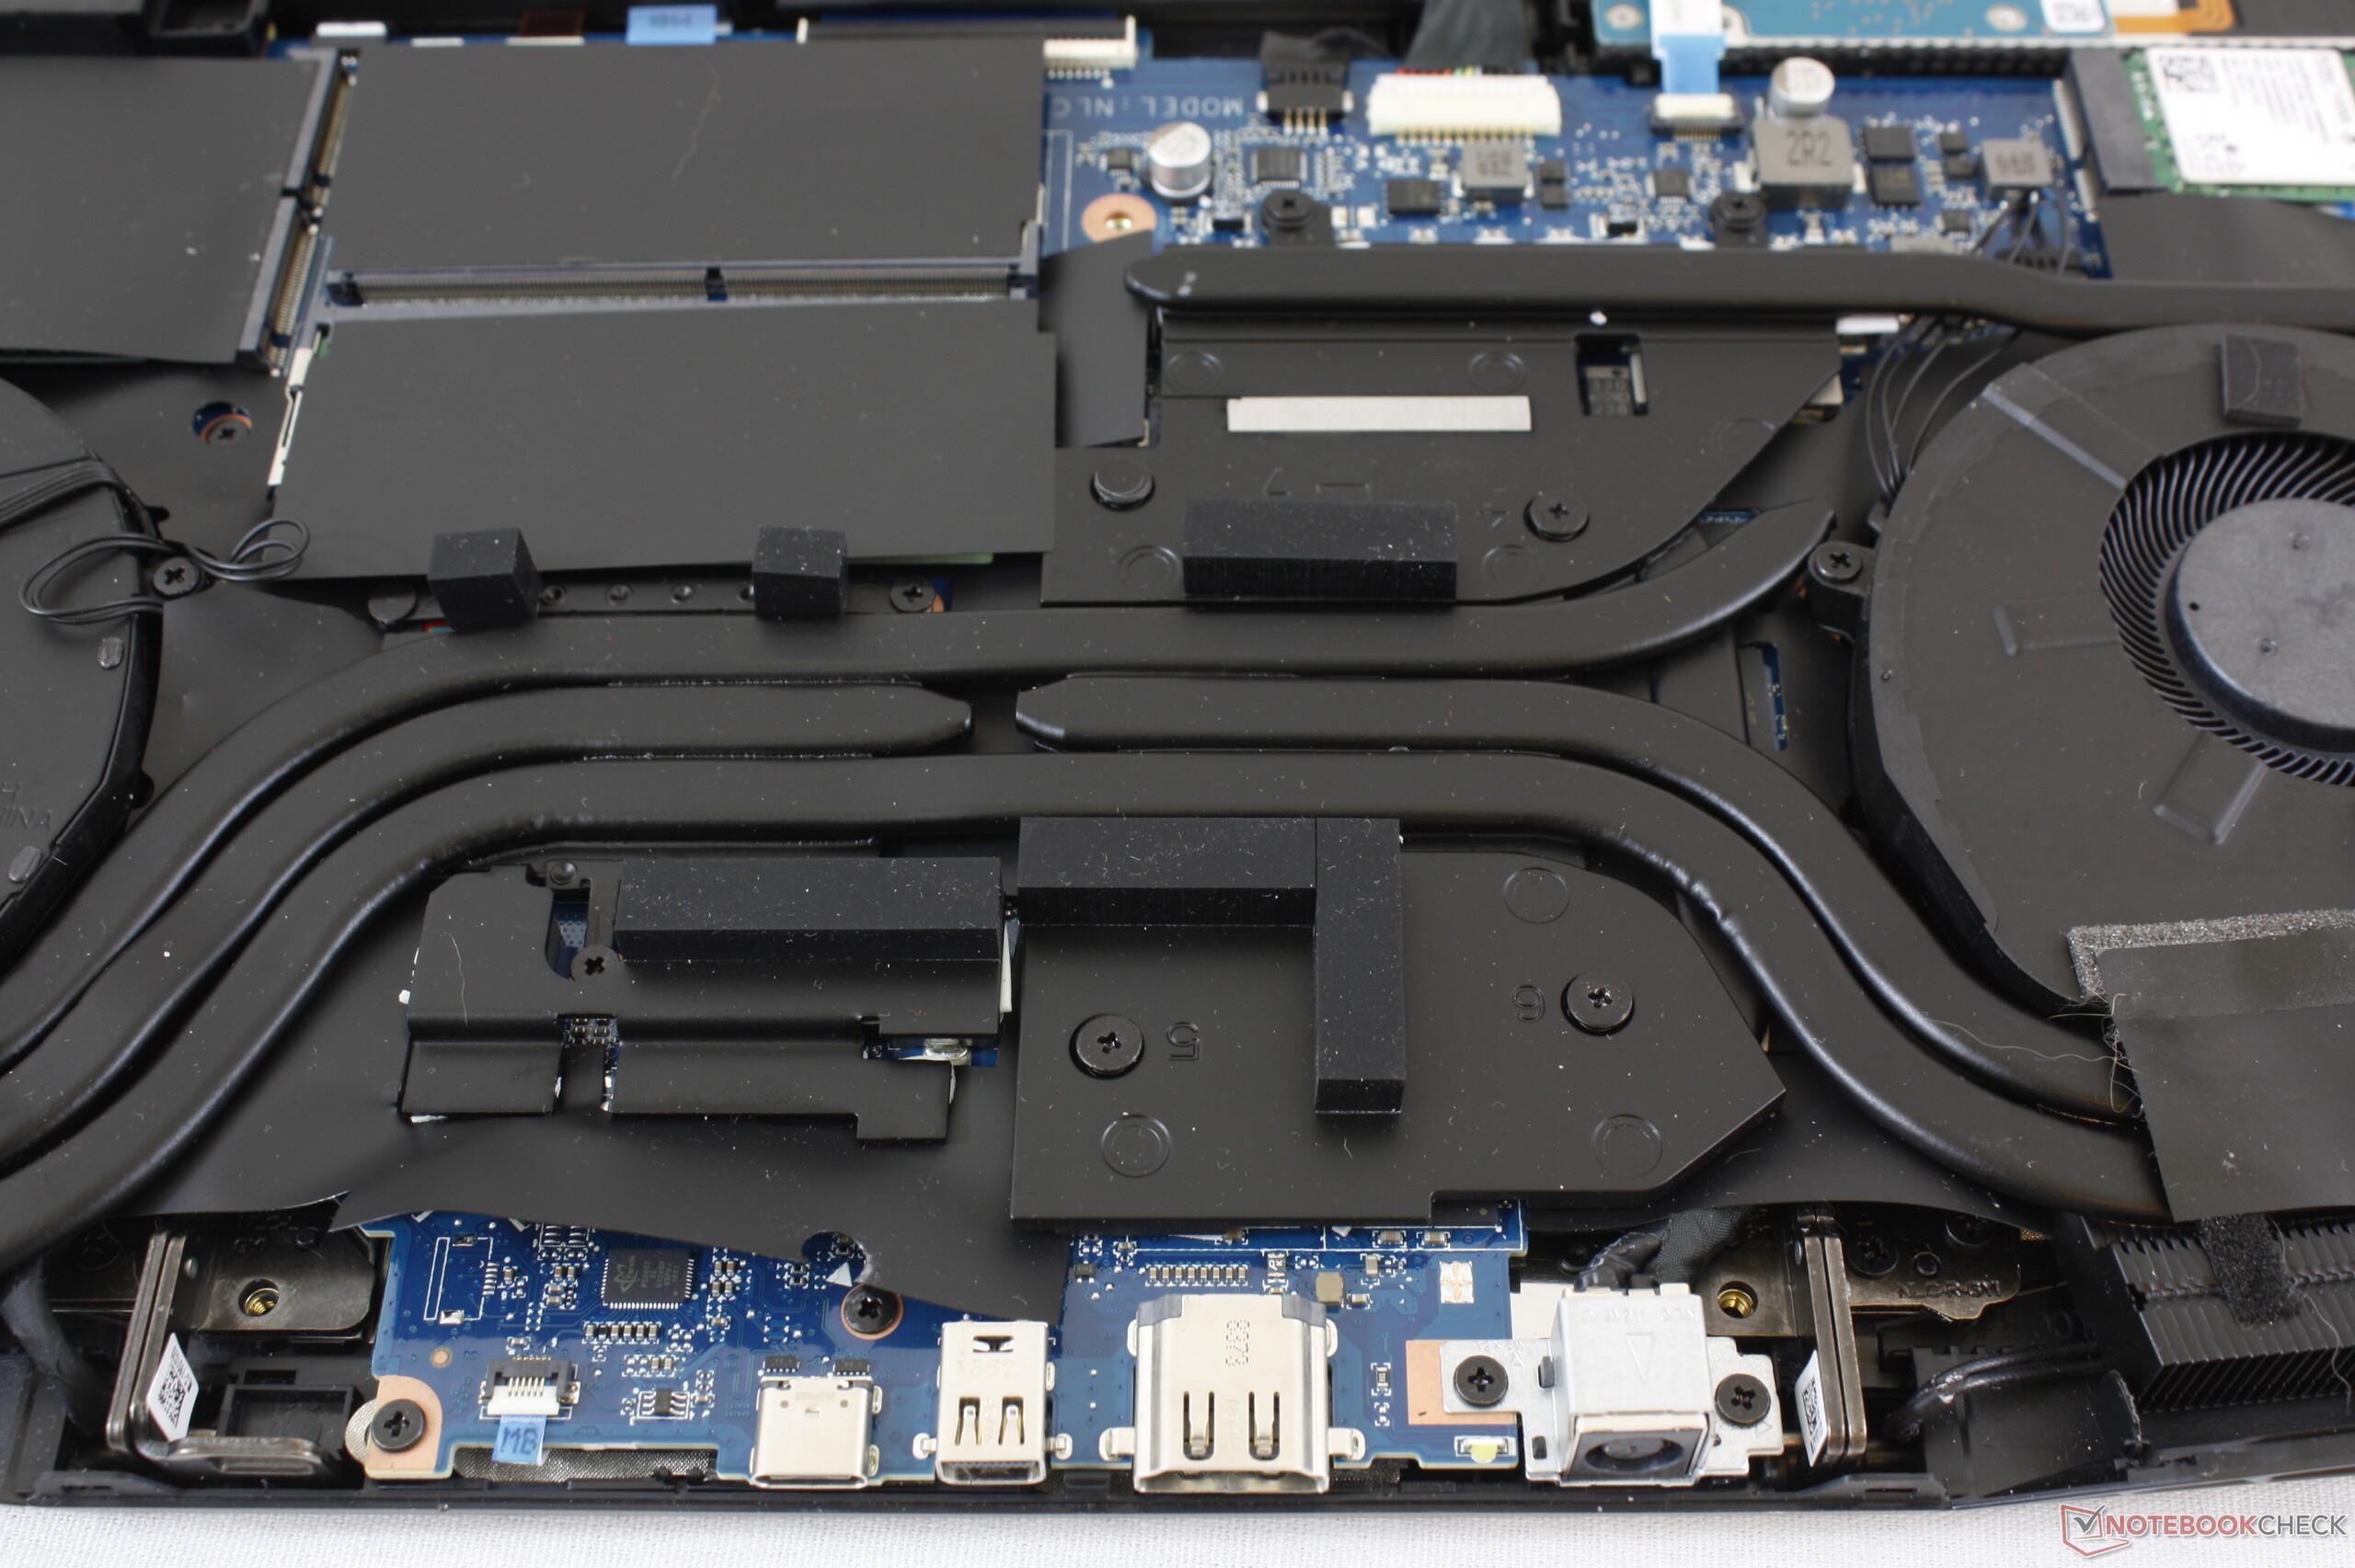
Andra aspekter från Aorus X5 har inte förbättrats alls på Aorus 15. Fläktljudet, batteritiden och bristen på Thunderbolt 3 är fortfarande samma eller till och med sämre på den senaste versionen. Skillnaden i ren grafikprestanda jämfört med GTX 1070 och RTX 2070 Max-Q ligger på runt 15 - 25 procent för varje, beroende på titel och upplösning.
En stor fördel med Aorus 15 är priset. I synnerhet vår RTX 2070 SKU, som kostar 20.000 kronor hos Xotic PC jämfört med 21.000 kronor för MSI GS65 och 24.000 kronor för Razer Blade 15, som har långsammare grafik i form av RTX 2060 eller RTX 2070 Max-Q. Asus ROG Scar GL504GW är ännu billigare än Aorus 15 och kostar 19.000 kronor med samma CPU och GPU, vilket gör den till ett riktigt lockande alternativ.
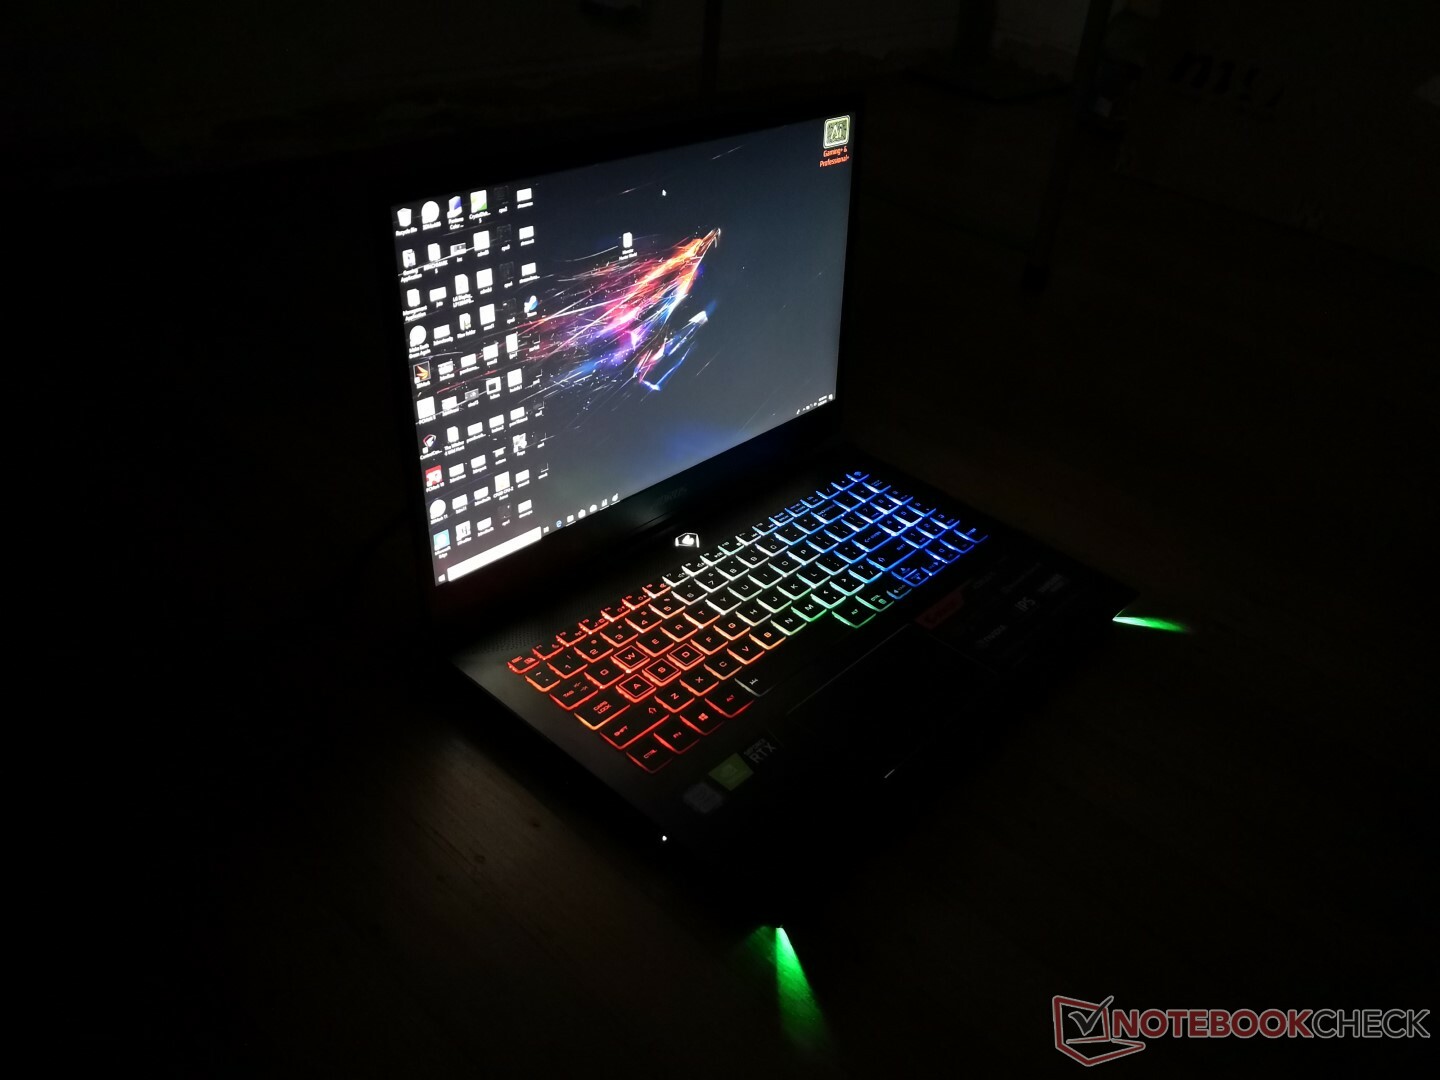
Det är den mest balanserade Aorus-modellen hittills på både insidan och utsidan. Det finns dock en lista över saknade funktioner som vi hade gillat att se på kommande versioner såsom tangentspecifik RGB-belysning, G-Sync och Thunderbolt, vilket hade gjort Aorus 15 mer värd på entusiastmarknaden.
Aorus 15 X9
- 03/26/2019 v6 (old)
Allen Ngo
Price comparison
