Test: Dell XPS 13 9380 2019 (i5-8265U, 256GB, UHD) Subnotebook (Sammanfattning)
| SD Card Reader | |
| average JPG Copy Test (av. of 3 runs) | |
| Dell XPS 13 9380 2019 (Toshiba Exceria Pro SDXC 64 GB UHS-II) | |
| Dell XPS 13 9370 FHD i5 (Toshiba Exceria Pro M501 64 GB UHS-II) | |
| Dell XPS 13 9370 i7 UHD (Toshiba Exceria Pro UHS-II) | |
| Fujitsu Lifebook U938 (Toshiba Exceria Pro SDXC 64 GB UHS-II) | |
| HP Envy 13-ah0003ng (Toshiba Exceria Pro M501 microSDXC 64GB) | |
| Lenovo ThinkPad X280-20KES01S00 (Toshiba Excerie Pro M501) | |
| Genomsnitt av klass Subnotebook (23.7 - 188, n=9, senaste 2 åren) | |
| maximum AS SSD Seq Read Test (1GB) | |
| Dell XPS 13 9370 i7 UHD (Toshiba Exceria Pro UHS-II) | |
| Dell XPS 13 9370 FHD i5 (Toshiba Exceria Pro M501 64 GB UHS-II) | |
| Dell XPS 13 9380 2019 (Toshiba Exceria Pro SDXC 64 GB UHS-II) | |
| Fujitsu Lifebook U938 (Toshiba Exceria Pro SDXC 64 GB UHS-II) | |
| Genomsnitt av klass Subnotebook (24.9 - 195, n=8, senaste 2 åren) | |
| Lenovo ThinkPad X280-20KES01S00 (Toshiba Excerie Pro M501) | |
| HP Envy 13-ah0003ng (Toshiba Exceria Pro M501 microSDXC 64GB) | |
| |||||||||||||||||||||||||
Distribution av ljusstyrkan: 85 %
Mitt på batteriet: 404 cd/m²
Kontrast: 1092:1 (Svärta: 0.37 cd/m²)
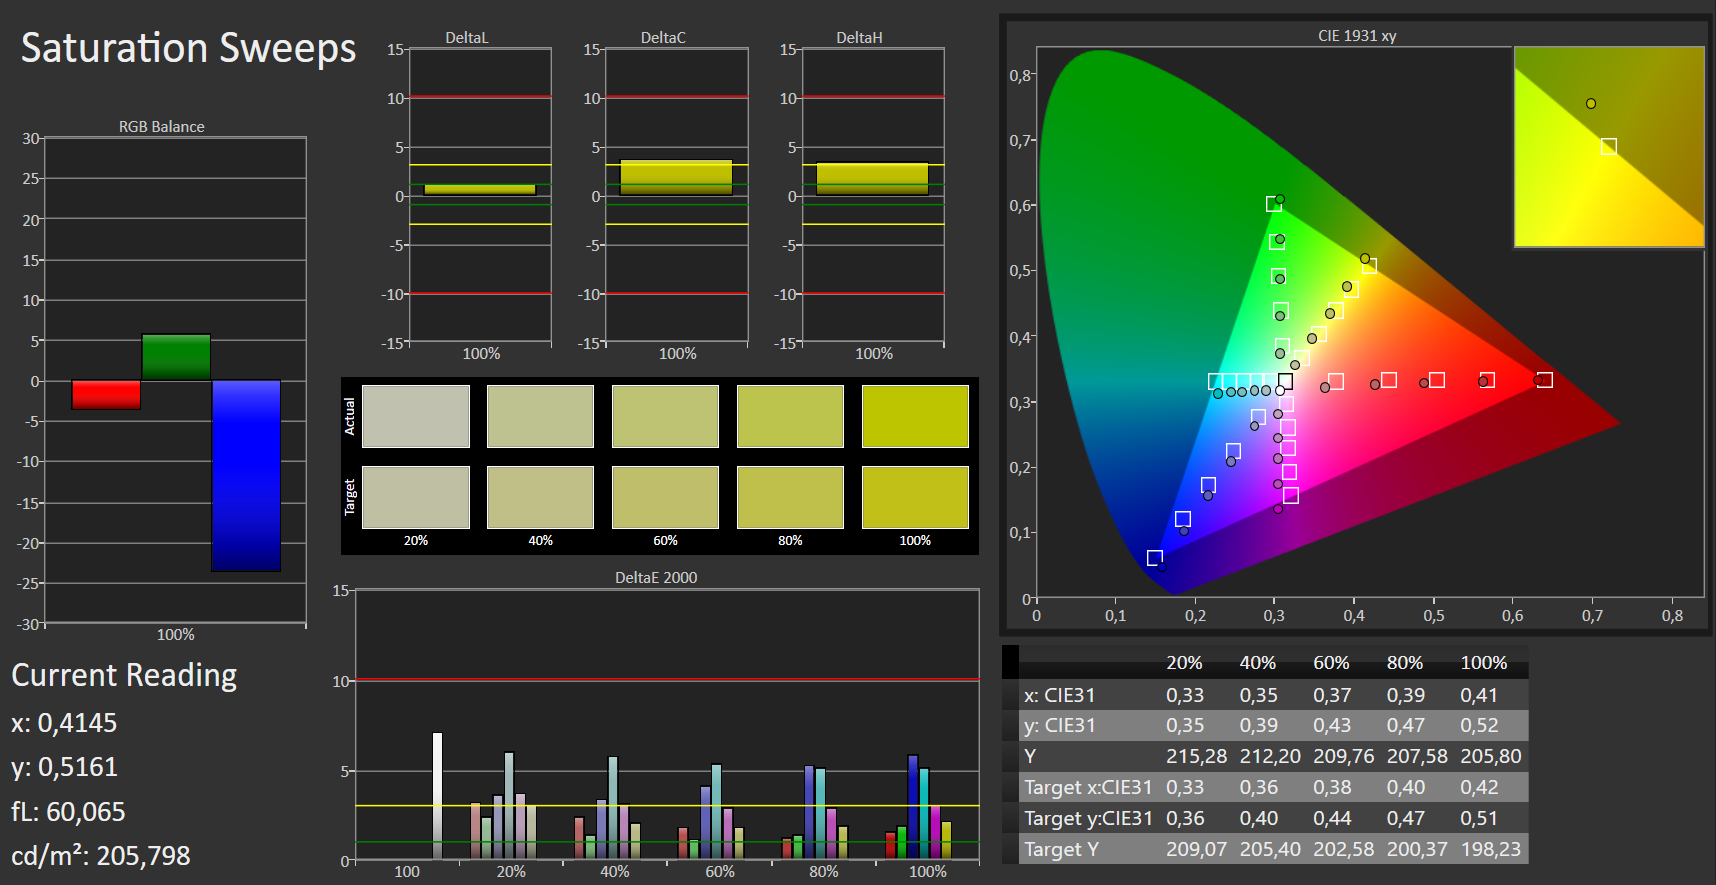
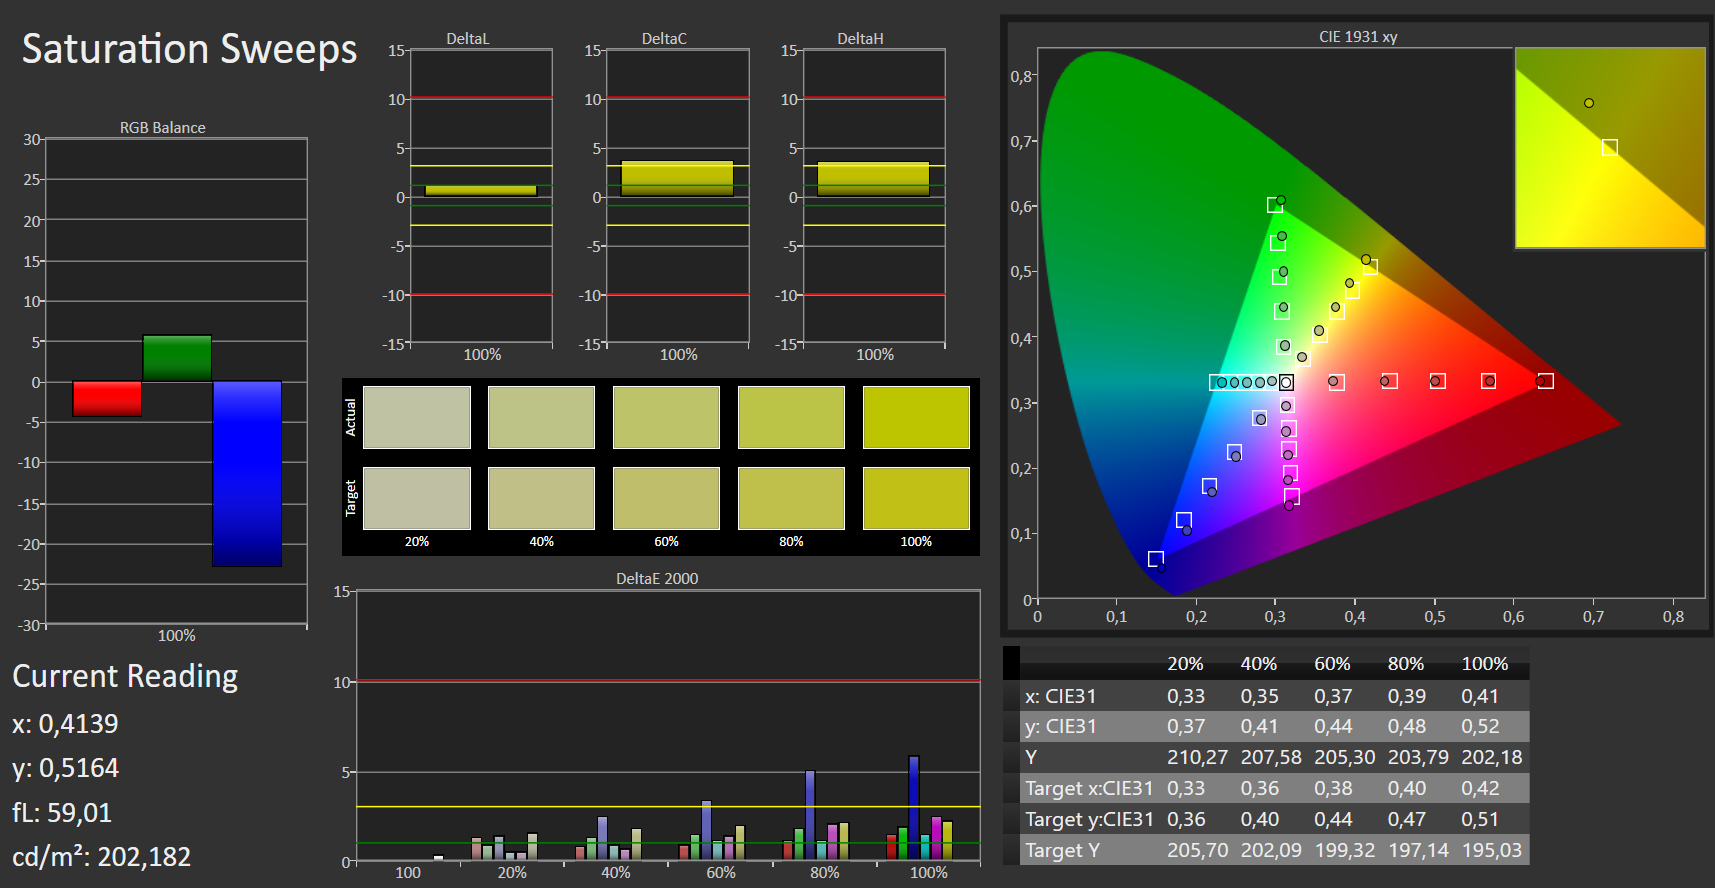
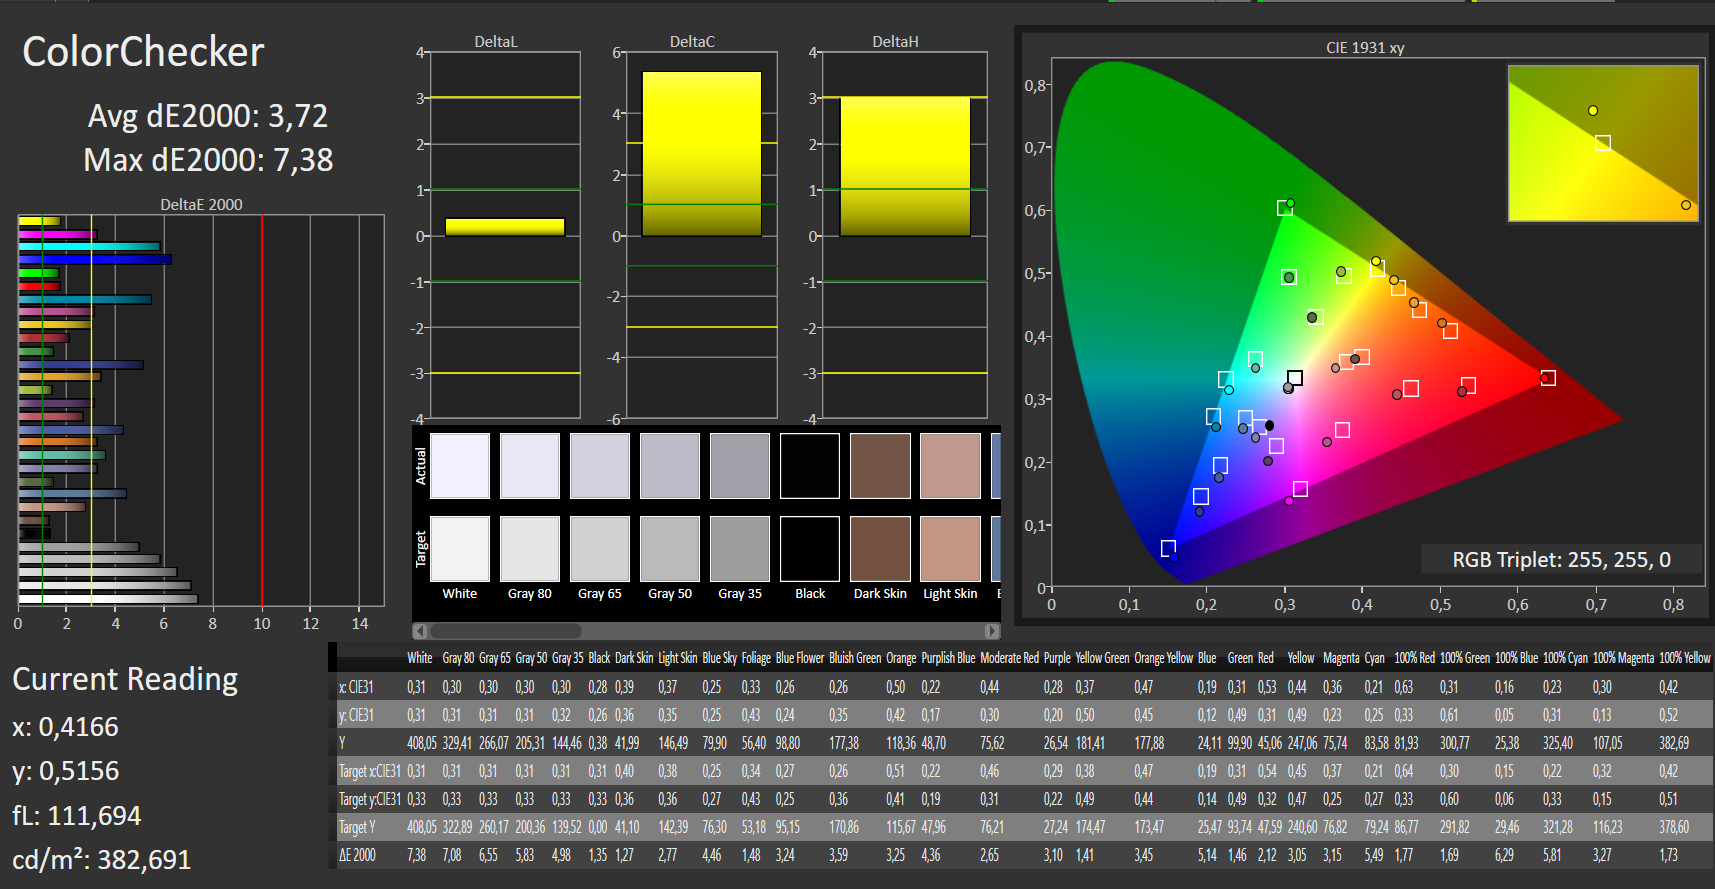
ΔE ColorChecker Calman: 3.72 | ∀{0.5-29.43 Ø4.72}
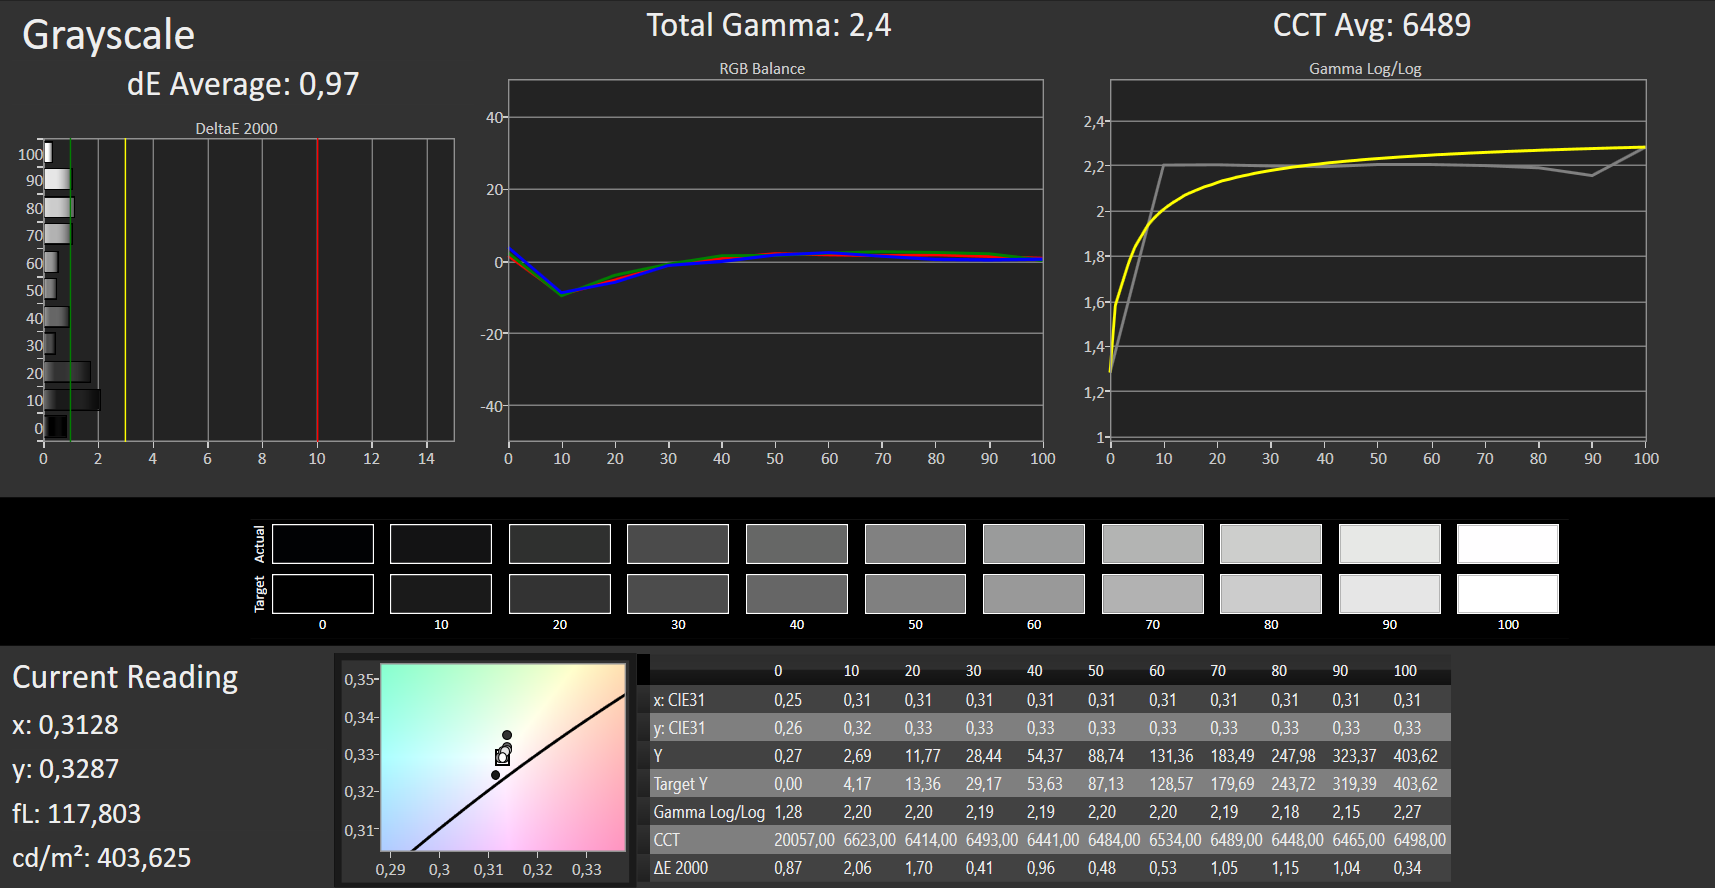
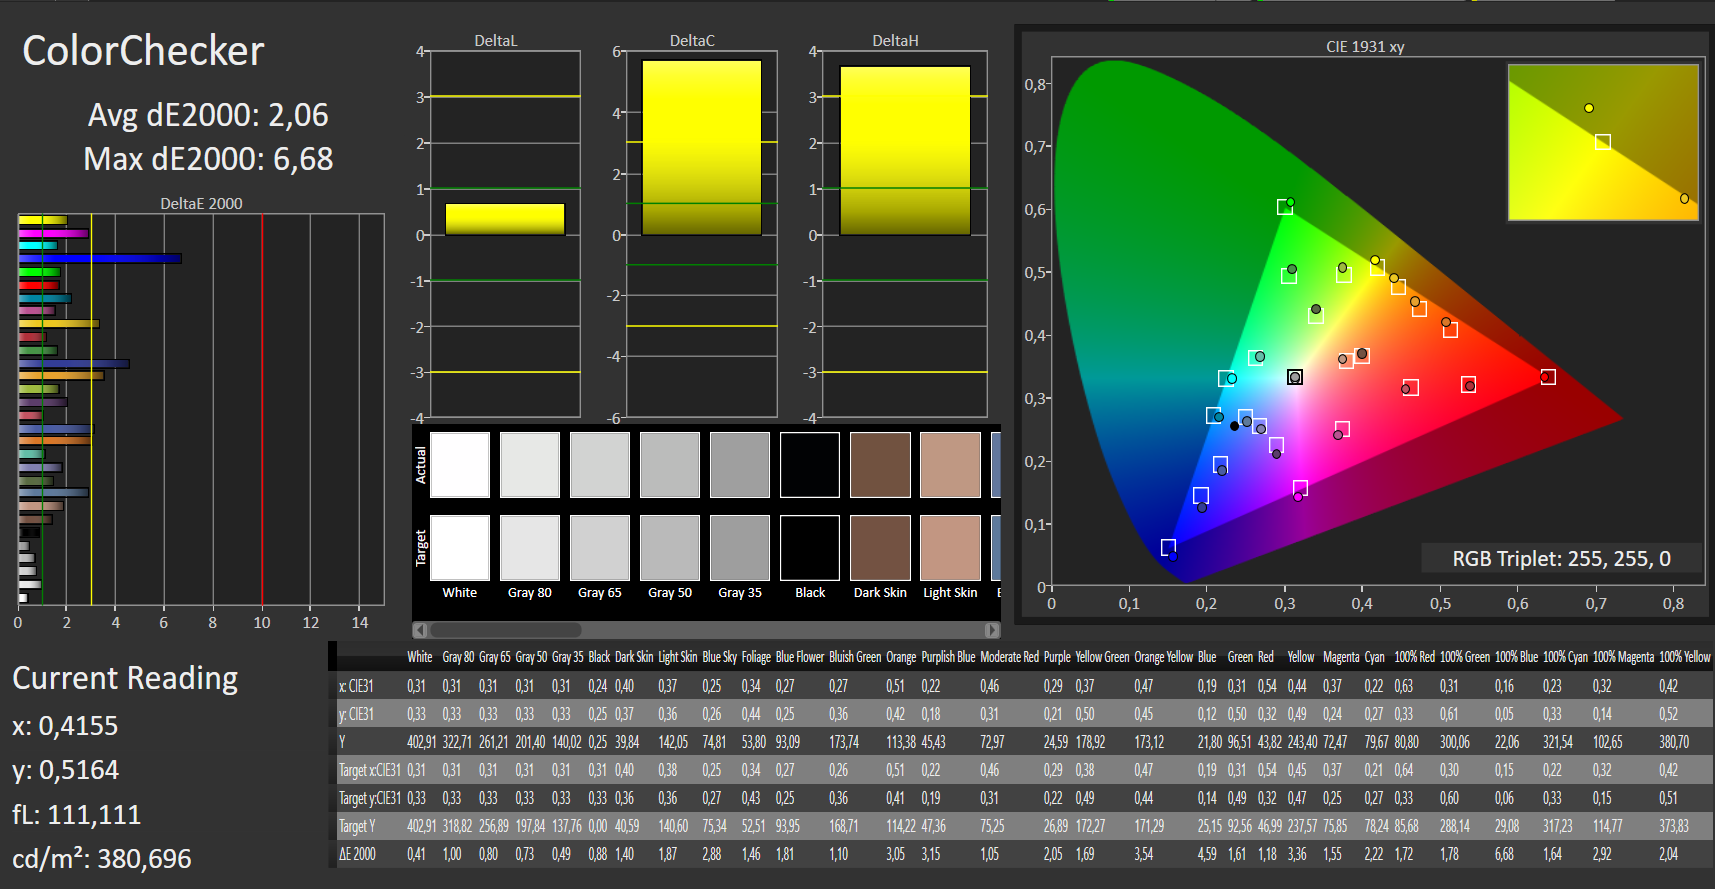
calibrated: 2.06
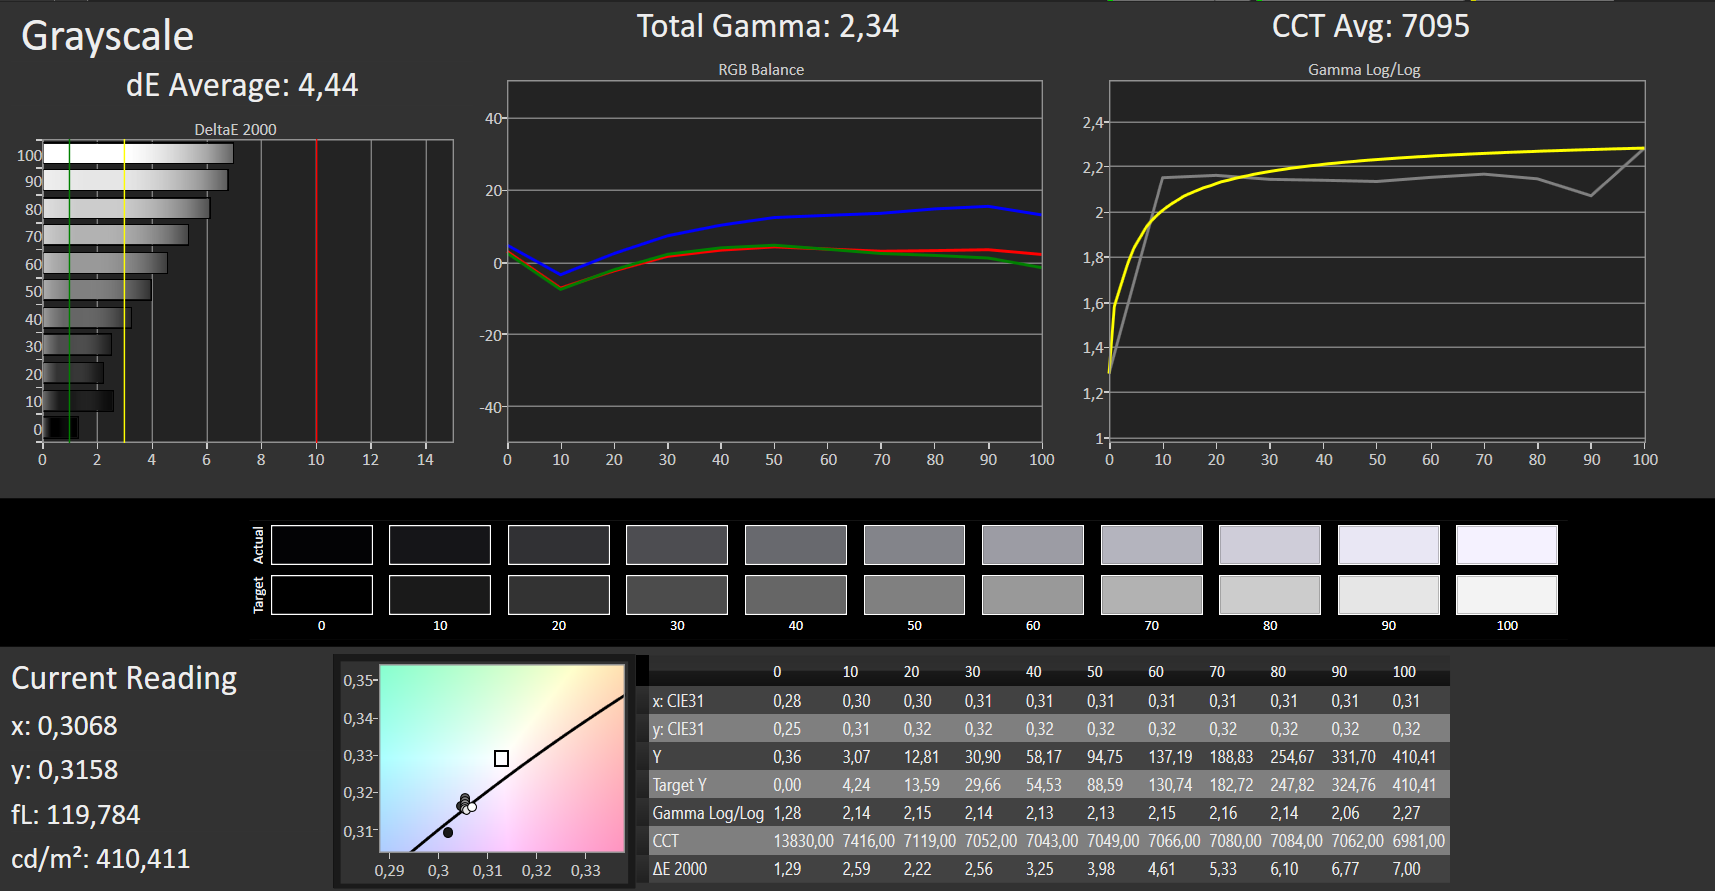
ΔE Greyscale Calman: 4.44 | ∀{0.09-98 Ø4.97}
93% sRGB (Argyll 1.6.3 3D)
60% AdobeRGB 1998 (Argyll 1.6.3 3D)
65.3% AdobeRGB 1998 (Argyll 3D)
93.1% sRGB (Argyll 3D)
64.7% Display P3 (Argyll 3D)
Gamma: 2.34
CCT: 7095 K
| Dell XPS 13 9380 2019 ID: AUO 282B B133ZAN Dell: 90NTH, , 3840x2160, 13.3" | Dell XPS 13 9370 i7 UHD ID: Sharp SHP148B, Name: LQ133D1, Dell P/N: 8XDHY, , 3840x2160, 13.3" | Dell XPS 13 9370 FHD i5 SHP1484, , 1920x1080, 13.3" | Apple MacBook Pro 13 2018 Touchbar i5 APPA03E, , 2560x1600, 13.3" | Lenovo ThinkPad X280-20KES01S00 B125HAN02.2, , 1920x1080, 12.5" | Fujitsu Lifebook U938 Sharp LQ133M1JW28, , 1920x1080, 13.3" | HP EliteBook 830 G5-3JX74EA IVO M133NVF3-R0, , 1920x1080, 13.3" | HP Envy 13-ah0003ng M133NVF3 R0, , 1920x1080, 13.3" | Huawei MateBook 13 i7 Chi Mei CMN8201, , 2160x1440, 13" | |
|---|---|---|---|---|---|---|---|---|---|
| Display | 6% | 6% | 31% | -31% | 4% | -2% | -13% | 5% | |
| Display P3 Coverage (%) | 64.7 | 68.9 6% | 68.9 6% | 98.5 52% | 44 -32% | 67.5 4% | 64.2 -1% | 54.8 -15% | 68.1 5% |
| sRGB Coverage (%) | 93.1 | 98.4 6% | 96.6 4% | 99.9 7% | 64.5 -31% | 94.5 2% | 89.2 -4% | 82.5 -11% | 97.7 5% |
| AdobeRGB 1998 Coverage (%) | 65.3 | 69.5 6% | 69.6 7% | 87.3 34% | 45.45 -30% | 68.7 5% | 65.2 0% | 56.6 -13% | 69.2 6% |
| Response Times | -21% | -18% | 16% | 25% | 23% | 35% | 40% | 19% | |
| Response Time Grey 50% / Grey 80% * (ms) | 58 ? | 69.6 ? -20% | 62.4 ? -8% | 46 ? 21% | 40 ? 31% | 43 ? 26% | 36 ? 38% | 31 ? 47% | 43.2 ? 26% |
| Response Time Black / White * (ms) | 36 ? | 44 ? -22% | 45.6 ? -27% | 32 ? 11% | 29.6 ? 18% | 29 ? 19% | 24.8 ? 31% | 24 ? 33% | 32 ? 11% |
| PWM Frequency (Hz) | 3759 ? | 1008 ? | 118000 ? | 217 ? | 1020 ? | 1000 ? | |||
| Screen | 12% | 10% | 34% | -18% | 6% | -8% | 19% | 5% | |
| Brightness middle (cd/m²) | 404 | 478.5 18% | 428 6% | 519 28% | 344 -15% | 344 -15% | 316 -22% | 289 -28% | 366.6 -9% |
| Brightness (cd/m²) | 389 | 466 20% | 405 4% | 504 30% | 313 -20% | 320 -18% | 326 -16% | 310 -20% | 360 -7% |
| Brightness Distribution (%) | 85 | 86 1% | 87 2% | 95 12% | 82 -4% | 77 -9% | 85 0% | 85 0% | 93 9% |
| Black Level * (cd/m²) | 0.37 | 0.43 -16% | 0.26 30% | 0.33 11% | 0.25 32% | 0.31 16% | 0.19 49% | 0.23 38% | 0.39 -5% |
| Contrast (:1) | 1092 | 1113 2% | 1646 51% | 1573 44% | 1376 26% | 1110 2% | 1663 52% | 1257 15% | 940 -14% |
| Colorchecker dE 2000 * | 3.72 | 3.09 17% | 3.8 -2% | 1.4 62% | 4.7 -26% | 2.72 27% | 4.5 -21% | 1.64 56% | 2.76 26% |
| Colorchecker dE 2000 max. * | 7.38 | 5.94 20% | 7.2 2% | 2.8 62% | 19.4 -163% | 5.92 20% | 12.1 -64% | 3.31 55% | 6.19 16% |
| Colorchecker dE 2000 calibrated * | 2.06 | 2.06 -0% | 2.9 -41% | 0.99 52% | 1.53 26% | ||||
| Greyscale dE 2000 * | 4.44 | 2.4 46% | 4.4 1% | 2.2 50% | 2.2 50% | 2.74 38% | 5 -13% | 1.71 61% | 4.2 5% |
| Gamma | 2.34 94% | 2.063 107% | 2.21 100% | 2.22 99% | 2.16 102% | 2.38 92% | 2.22 99% | 2.32 95% | 2.22 99% |
| CCT | 7095 92% | 6883 94% | 7067 92% | 6908 94% | 6252 104% | 6794 96% | 6018 108% | 6291 103% | 6271 104% |
| Color Space (Percent of AdobeRGB 1998) (%) | 60 | 69.47 16% | 62.8 5% | 77.3 29% | 41.2 -31% | 61 2% | 57.9 -3% | 52 -13% | 63.2 5% |
| Color Space (Percent of sRGB) (%) | 93 | 98.36 6% | 96.4 4% | 99.99 8% | 64.1 -31% | 94 1% | 87.3 -6% | 82 -12% | 97.6 5% |
| Totalt genomsnitt (program/inställningar) | -1% /
7% | -1% /
6% | 27% /
31% | -8% /
-15% | 11% /
8% | 8% /
-1% | 15% /
15% | 10% /
7% |
* ... mindre är bättre
Visa svarstider
| ↔ Svarstid svart till vitt | ||
|---|---|---|
| 36 ms ... stiga ↗ och falla ↘ kombinerat | ↗ 20 ms stiga | 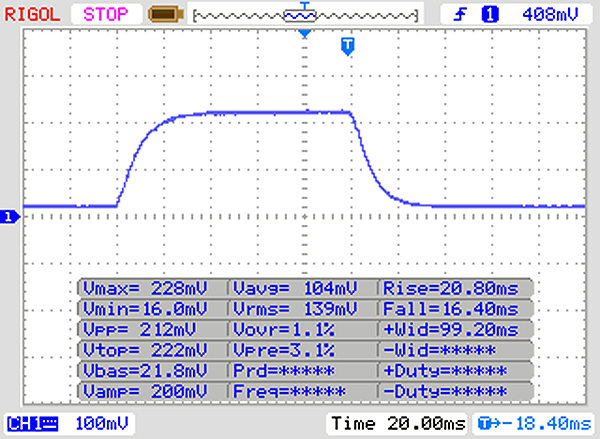 |
| ↘ 16 ms hösten | ||
| Skärmen visar långsamma svarsfrekvenser i våra tester och kommer att vara otillfredsställande för spelare. I jämförelse sträcker sig alla testade enheter från 0.1 (minst) till 240 (maximalt) ms. » 94 % av alla enheter är bättre. Detta innebär att den uppmätta svarstiden är sämre än genomsnittet av alla testade enheter (19.8 ms). | ||
| ↔ Svarstid 50 % grått till 80 % grått | ||
| 58 ms ... stiga ↗ och falla ↘ kombinerat | ↗ 26 ms stiga | 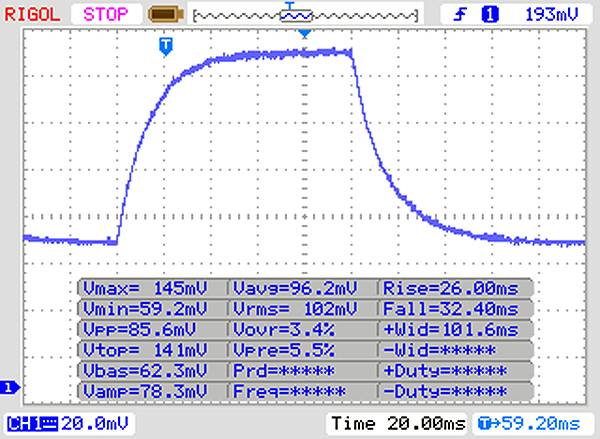 |
| ↘ 32 ms hösten | ||
| Skärmen visar långsamma svarsfrekvenser i våra tester och kommer att vara otillfredsställande för spelare. I jämförelse sträcker sig alla testade enheter från 0.165 (minst) till 636 (maximalt) ms. » 94 % av alla enheter är bättre. Detta innebär att den uppmätta svarstiden är sämre än genomsnittet av alla testade enheter (31 ms). | ||
Skärmflimmer / PWM (Puls-Width Modulation)
| Skärmflimmer / PWM upptäcktes inte | 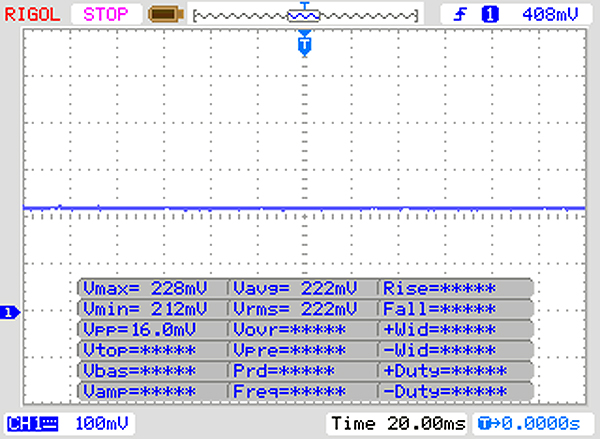 | ||
Som jämförelse: 52 % av alla testade enheter använder inte PWM för att dämpa skärmen. Om PWM upptäcktes mättes ett medelvärde av 7781 (minst: 5 - maximum: 343500) Hz. | |||
| PCMark 8 Home Score Accelerated v2 | 3519 poäng | |
| PCMark 8 Work Score Accelerated v2 | 4302 poäng | |
| PCMark 10 Score | 3835 poäng | |
Hjälp | ||
| Dell XPS 13 9380 2019 SK hynix PC401 HFS256GD9TNG | Dell XPS 13 9370 FHD i5 Toshiba XG5 KXG50ZNV256G | Apple MacBook Pro 13 2018 Touchbar i5 | Lenovo ThinkPad X280-20KES01S00 Samsung SSD PM981 MZVLB512HAJQ | Fujitsu Lifebook U938 Micron 1100 MTFDDAV256TBN | HP EliteBook 830 G5-3JX74EA Samsung SSD PM961 1TB M.2 PCIe 3.0 x4 NVMe (MZVLW1T0) | HP Envy 13-ah0003ng SK Hynix BC501 HFM512GDJTNG | Huawei MateBook 13 i7 Samsung SSD PM981 MZVLB512HAJQ | Genomsnitt SK hynix PC401 HFS256GD9TNG | |
|---|---|---|---|---|---|---|---|---|---|
| CrystalDiskMark 5.2 / 6 | 47% | 3% | 58% | -32% | 56% | 6% | 100% | 12% | |
| Write 4K (MB/s) | 84.6 | 128.2 52% | 43.24 -49% | 125.3 48% | 80.5 -5% | 108.5 28% | 112.9 33% | 159.4 88% | 101.8 ? 20% |
| Read 4K (MB/s) | 38.52 | 48.09 25% | 14.07 -63% | 43.5 13% | 26.14 -32% | 40.53 5% | 38.69 0% | 47.31 23% | 40.9 ? 6% |
| Write Seq (MB/s) | 557 | 1088 95% | 887 59% | 112 -80% | 396.8 -29% | 1026 84% | 654 17% | 1899 241% | 673 ? 21% |
| Read Seq (MB/s) | 1393 | 1877 35% | 1515 9% | 2273 63% | 473.1 -66% | 2080 49% | 642 -54% | 2173 56% | 1464 ? 5% |
| Write 4K Q32T1 (MB/s) | 339.5 | 367.1 8% | 225.3 -34% | 641 89% | 264.2 -22% | 451 33% | 305.9 -10% | 368.1 8% | 294 ? -13% |
| Read 4K Q32T1 (MB/s) | 255.4 | 411.9 61% | 346.5 36% | 392 53% | 244 -4% | 269.7 6% | 351.6 38% | 526 106% | 302 ? 18% |
| Write Seq Q32T1 (MB/s) | 558 | 1078 93% | 859 54% | 1903 241% | 464.6 -17% | 1770 217% | 869 56% | 1914 243% | 760 ? 36% |
| Read Seq Q32T1 (MB/s) | 2541 | 2771 9% | 2915 15% | 3398 34% | 525 -79% | 3214 26% | 1683 -34% | 3487 37% | 2561 ? 1% |
| AS SSD | 6% | 90% | -41% | 114% | 12% | 119% | -19% | ||
| Seq Read (MB/s) | 2035 | 1442 -29% | 2316 14% | 455.5 -78% | 2423 19% | 494.3 -76% | 1889 -7% | 1882 ? -8% | |
| Seq Write (MB/s) | 658 | 1694 157% | 1385 110% | 364.5 -45% | 1141 73% | 720 9% | 1812 175% | 593 ? -10% | |
| 4K Read (MB/s) | 39.74 | 9.7 -76% | 47.2 19% | 24.41 -39% | 47.17 19% | 38.35 -3% | 55.5 40% | 38.9 ? -2% | |
| 4K Write (MB/s) | 105.7 | 20 -81% | 105.3 0% | 73.8 -30% | 115.6 9% | 98.4 -7% | 118.4 12% | 100.2 ? -5% | |
| 4K-64 Read (MB/s) | 461 | 957 108% | 1218 164% | 235.7 -49% | 1144 148% | 611 33% | 1257 173% | 452 ? -2% | |
| 4K-64 Write (MB/s) | 300.1 | 162 -46% | 1309 336% | 308.8 3% | 1571 423% | 712 137% | 1571 423% | 290 ? -3% | |
| Access Time Read * (ms) | 0.061 | 0.041 33% | 0.099 -62% | 0.04 34% | 0.061 -0% | 0.041 33% | 0.1118 ? -83% | ||
| Access Time Write * (ms) | 0.051 | 0.036 29% | 0.057 -12% | 0.031 39% | 0.037 27% | 0.032 37% | 0.1111 ? -118% | ||
| Score Read (Points) | 704 | 1497 113% | 306 -57% | 1433 104% | 698 -1% | 1502 113% | 679 ? -4% | ||
| Score Write (Points) | 471 | 1553 230% | 419 -11% | 1801 282% | 883 87% | 1871 297% | 450 ? -4% | ||
| Score Total (Points) | 1479 | 3774 155% | 885 -40% | 3910 164% | 1961 33% | 4147 180% | 1423 ? -4% | ||
| Copy ISO MB/s (MB/s) | 893 | 1068 20% | 442.4 -50% | 2452 175% | 860 -4% | 1800 102% | 748 ? -16% | ||
| Copy Program MB/s (MB/s) | 287.9 | 327.5 14% | 163.9 -43% | 421.9 47% | 244 -15% | 385.6 34% | 358 ? 24% | ||
| Copy Game MB/s (MB/s) | 618 | 717 16% | 275.8 -55% | 991 60% | 282 -54% | 982 59% | 423 ? -32% | ||
| Totalt genomsnitt (program/inställningar) | 47% /
47% | 5% /
4% | 74% /
78% | -37% /
-37% | 85% /
93% | 9% /
10% | 110% /
112% | -4% /
-8% |
* ... mindre är bättre

| 3DMark 11 Performance | 2053 poäng | |
| 3DMark Cloud Gate Standard Score | 9514 poäng | |
Hjälp | ||
| Thief - 1024x768 Very Low Preset | |
| Genomsnitt Intel UHD Graphics 620 (16.3 - 34.3, n=10) | |
| Dell XPS 13 9380 2019 | |
| F1 2018 - 1280x720 Ultra Low Preset | |
| HP Envy 13-ah0003ng | |
| Apple MacBook Pro 13 2018 Touchbar i5 | |
| Dell XPS 13 9380 2019 | |
| Genomsnitt Intel UHD Graphics 620 (31 - 35.8, n=5) | |
| Shadow of the Tomb Raider - 1280x720 Lowest Preset | |
| Genomsnitt av klass Subnotebook (41 - 109, n=7, senaste 2 åren) | |
| HP Envy 13-ah0003ng | |
| Apple MacBook Pro 13 2018 Touchbar i5 | |
| Dell XPS 13 9380 2019 | |
| Genomsnitt Intel UHD Graphics 620 (12 - 21.7, n=13) | |
| FIFA 19 - 1920x1080 High Preset AA:2x MS | |
| Dell XPS 13 9380 2019 | |
| HP Envy 13-ah0003ng | |
| Genomsnitt Intel UHD Graphics 620 (20.7 - 51, n=2) | |
| Darksiders III - 1280x720 Low | |
| Dell XPS 13 9380 2019 | |
| Genomsnitt Intel UHD Graphics 620 (16.5 - 30.4, n=4) | |
| låg | med. | hög | ultra | |
|---|---|---|---|---|
| BioShock Infinite (2013) | 71.3 | 37.4 | 31.2 | 9.8 |
| Thief (2014) | 23.9 | 12.8 | ||
| Rise of the Tomb Raider (2016) | 20.5 | 17.4 | 6.9 | |
| F1 2018 (2018) | 33 | 15 | 14 | |
| Shadow of the Tomb Raider (2018) | 15 | 10 | ||
| FIFA 19 (2018) | 48 | 53.4 | 51 | |
| Darksiders III (2018) | 26.3 | 7.3 |
Ljudnivå
| Låg belastning |
| 30.4 / 30.4 / 30.4 dB(A) |
| Hög belastning |
| 31.7 / 38.1 dB(A) |
 | ||
30 dB tyst 40 dB(A) hörbar 50 dB(A) högt ljud |
||
min: | ||
(-) Den maximala temperaturen på ovansidan är 47.2 °C / 117 F, jämfört med genomsnittet av 35.9 °C / 97 F , allt från 21.4 till 59 °C för klassen Subnotebook.
(±) Botten värms upp till maximalt 43.3 °C / 110 F, jämfört med genomsnittet av 39.2 °C / 103 F
(+) Vid tomgångsbruk är medeltemperaturen för ovansidan 26.4 °C / 80 F, jämfört med enhetsgenomsnittet på 30.8 °C / ### class_avg_f### F.
(+) Handledsstöden och pekplattan når maximal hudtemperatur (32.4 °C / 90.3 F) och är därför inte varma.
(-) Medeltemperaturen för handledsstödsområdet på liknande enheter var 28.2 °C / 82.8 F (-4.2 °C / -7.5 F).
Dell XPS 13 9380 2019 ljudanalys
(-) | inte särskilt höga högtalare (70 dB)
Bas 100 - 315 Hz
(-) | nästan ingen bas - i genomsnitt 20.4% lägre än medianen
(±) | linjäriteten för basen är genomsnittlig (9.4% delta till föregående frekvens)
Mellan 400 - 2000 Hz
(±) | högre mellan - i genomsnitt 6.9% högre än median
(±) | linjäriteten för mids är genomsnittlig (10.2% delta till föregående frekvens)
Högsta 2 - 16 kHz
(+) | balanserade toppar - endast 3.6% från medianen
(+) | toppar är linjära (5% delta till föregående frekvens)
Totalt 100 - 16 000 Hz
(±) | linjäriteten för det totala ljudet är genomsnittlig (26.6% skillnad mot median)
Jämfört med samma klass
» 88% av alla testade enheter i den här klassen var bättre, 1% liknande, 10% sämre
» Den bästa hade ett delta på 5%, genomsnittet var 18%, sämst var 53%
Jämfört med alla testade enheter
» 82% av alla testade enheter var bättre, 3% liknande, 15% sämre
» Den bästa hade ett delta på 4%, genomsnittet var 24%, sämst var 134%
Apple MacBook Pro 13 2018 Touchbar i5 ljudanalys
(+) | högtalare kan spela relativt högt (83.4 dB)
Bas 100 - 315 Hz
(±) | reducerad bas - i genomsnitt 6.9% lägre än medianen
(+) | basen är linjär (6.7% delta till föregående frekvens)
Mellan 400 - 2000 Hz
(+) | balanserad mellan - endast 1.9% från medianen
(+) | mids är linjära (3.8% delta till föregående frekvens)
Högsta 2 - 16 kHz
(+) | balanserade toppar - endast 3.6% från medianen
(+) | toppar är linjära (6.3% delta till föregående frekvens)
Totalt 100 - 16 000 Hz
(+) | det totala ljudet är linjärt (9.5% skillnad mot median)
Jämfört med samma klass
» 5% av alla testade enheter i den här klassen var bättre, 2% liknande, 93% sämre
» Den bästa hade ett delta på 5%, genomsnittet var 18%, sämst var 53%
Jämfört med alla testade enheter
» 4% av alla testade enheter var bättre, 1% liknande, 95% sämre
» Den bästa hade ett delta på 4%, genomsnittet var 24%, sämst var 134%
HP Envy 13-ah0003ng ljudanalys
(-) | inte särskilt höga högtalare (71.9 dB)
Bas 100 - 315 Hz
(-) | nästan ingen bas - i genomsnitt 23.3% lägre än medianen
(±) | linjäriteten för basen är genomsnittlig (12.4% delta till föregående frekvens)
Mellan 400 - 2000 Hz
(+) | balanserad mellan - endast 2.2% från medianen
(+) | mids är linjära (4.8% delta till föregående frekvens)
Högsta 2 - 16 kHz
(+) | balanserade toppar - endast 1.3% från medianen
(+) | toppar är linjära (4.4% delta till föregående frekvens)
Totalt 100 - 16 000 Hz
(±) | linjäriteten för det totala ljudet är genomsnittlig (16.8% skillnad mot median)
Jämfört med samma klass
» 43% av alla testade enheter i den här klassen var bättre, 7% liknande, 49% sämre
» Den bästa hade ett delta på 5%, genomsnittet var 18%, sämst var 53%
Jämfört med alla testade enheter
» 29% av alla testade enheter var bättre, 8% liknande, 63% sämre
» Den bästa hade ett delta på 4%, genomsnittet var 24%, sämst var 134%
| Av/Standby | |
| Låg belastning | |
| Hög belastning |
|
Förklaring:
min: | |
| Dell XPS 13 9380 2019 i5-8265U, UHD Graphics 620, SK hynix PC401 HFS256GD9TNG, IPS, 3840x2160, 13.3" | Dell XPS 13 9370 FHD i5 i5-8250U, UHD Graphics 620, Toshiba XG5 KXG50ZNV256G, IPS, 1920x1080, 13.3" | Dell XPS 13 9370 i7 UHD i5-8550U, UHD Graphics 620, Toshiba XG5 KXG50ZNV512G, IPS, 3840x2160, 13.3" | Apple MacBook Pro 13 2018 Touchbar i5 i5-8259U, Iris Plus Graphics 655, , IPS, 2560x1600, 13.3" | Lenovo ThinkPad X280-20KES01S00 i5-8250U, UHD Graphics 620, Samsung SSD PM981 MZVLB512HAJQ, IPS LED, 1920x1080, 12.5" | Fujitsu Lifebook U938 i5-8250U, UHD Graphics 620, Micron 1100 MTFDDAV256TBN, IPS, 1920x1080, 13.3" | HP EliteBook 830 G5-3JX74EA i5-8550U, UHD Graphics 620, Samsung SSD PM961 1TB M.2 PCIe 3.0 x4 NVMe (MZVLW1T0), IPS LED, 1920x1080, 13.3" | HP Envy 13-ah0003ng i5-8550U, GeForce MX150, SK Hynix BC501 HFM512GDJTNG, IPS, 1920x1080, 13.3" | Huawei MateBook 13 i7 i7-8565U, GeForce MX150, Samsung SSD PM981 MZVLB512HAJQ, IPS, 2160x1440, 13" | Genomsnitt Intel UHD Graphics 620 | Genomsnitt av klass Subnotebook | |
|---|---|---|---|---|---|---|---|---|---|---|---|
| Power Consumption | 22% | -2% | -8% | 15% | 36% | 3% | 4% | -17% | 13% | 4% | |
| Idle Minimum * (Watt) | 4.8 | 3.14 35% | 5 -4% | 2.3 52% | 3.11 35% | 2.4 50% | 4.5 6% | 5.3 -10% | 3.5 27% | 3.81 ? 21% | 3.86 ? 20% |
| Idle Average * (Watt) | 8.6 | 5.22 39% | 8.3 3% | 8.7 -1% | 5.01 42% | 5.5 36% | 6.4 26% | 7.3 15% | 7.5 13% | 6.94 ? 19% | 6.61 ? 23% |
| Idle Maximum * (Watt) | 10.4 | 6 42% | 8.8 15% | 12.2 -17% | 8.11 22% | 6 42% | 9.2 12% | 9.3 11% | 12.4 -19% | 8.75 ? 16% | 8 ? 23% |
| Load Average * (Watt) | 37.9 | 38.5 -2% | 46.4 -22% | 53.3 -41% | 44.6 -18% | 31 18% | 35.7 6% | 39 -3% | 64.2 -69% | 35 ? 8% | 42.2 ? -11% |
| Load Maximum * (Watt) | 48.5 | 50.4 -4% | 48.6 -0% | 64 -32% | 51.7 -7% | 32.6 33% | 65.4 -35% | 46 5% | 65.7 -35% | 47.5 ? 2% | 64.5 ? -33% |
| Witcher 3 ultra * (Watt) | 52.5 |
* ... mindre är bättre
| Dell XPS 13 9380 2019 i5-8265U, UHD Graphics 620, 52 Wh | Dell XPS 13 9370 FHD i5 i5-8250U, UHD Graphics 620, 52 Wh | Apple MacBook Pro 13 2018 Touchbar i5 i5-8259U, Iris Plus Graphics 655, 58 Wh | Lenovo ThinkPad X280-20KES01S00 i5-8250U, UHD Graphics 620, 50 Wh | Fujitsu Lifebook U938 i5-8250U, UHD Graphics 620, 50 Wh | HP EliteBook 830 G5-3JX74EA i5-8550U, UHD Graphics 620, 49 Wh | HP Envy 13-ah0003ng i5-8550U, GeForce MX150, 53.2 Wh | Huawei MateBook 13 i7 i7-8565U, GeForce MX150, 41.7 Wh | Genomsnitt av klass Subnotebook | |
|---|---|---|---|---|---|---|---|---|---|
| Batteridrifttid | 16% | 17% | 2% | 1% | -15% | -12% | -27% | 39% | |
| Reader / Idle (h) | 17.2 | 23.6 37% | 20.2 17% | 19.5 13% | 12.8 -26% | 15.5 -10% | 15.4 -10% | 28.6 ? 66% | |
| WiFi v1.3 (h) | 8.3 | 10.7 29% | 9.7 17% | 8.9 7% | 8.4 1% | 7.1 -14% | 8 -4% | 7.6 -8% | 14 ? 69% |
| Load (h) | 2.4 | 2 -17% | 2 -17% | 2.1 -12% | 2.3 -4% | 1.9 -21% | 0.9 -62% | 1.969 ? -18% | |
| H.264 (h) | 13.9 | 10.9 | 9.5 | 7.2 | 8 | 6.3 | 15.4 ? | ||
| Witcher 3 ultra (h) | 1.6 |
För
Emot
Läs den fullständiga versionen av den här recensionen på engelska här.
Dell släpper nästa uppdatering av XPS 13, men förändringarna är små och rättfärdigar inte en uppgradering från föregångaren XPS 13 9370 (2018), men rättfärdigar definitivt en uppgradering från 9360 (2016). Den dualkärnade Kaby Lake-processorn är märkbart långsammare än de senaste fyrkärniga modellerna.
Dell har uppenbarligen arbetat om temperaturkontrollen. Jämfört med den fyrkärniga processorn från 2018 så har prestandan ökat, men bara vid ihållande belastning. Många ultrabook-modeller behöver reducera processorns hastighet vid ihållande belastning för att minska temperaturen; XPS fortsätter att köra på i hög hastighet. 2019 års version av XPS 13 minskar bara processorns klockfrekvens med 8% i genomsnitt (jämfört med den maximala Turbo-klockfrekvensen!) och är snabbare än XPS 13 9370 från 2018 som var utrustad med en fyrkärnig Kaby Lake R.
2019 års version av XPS 13 minskar endast processorns klockfrekvens med 8% vid ihållande belastning och är snabbare än 2018 års XPS 13 som var utrustad med en fyrkärnig Kaby Lake R-processor.
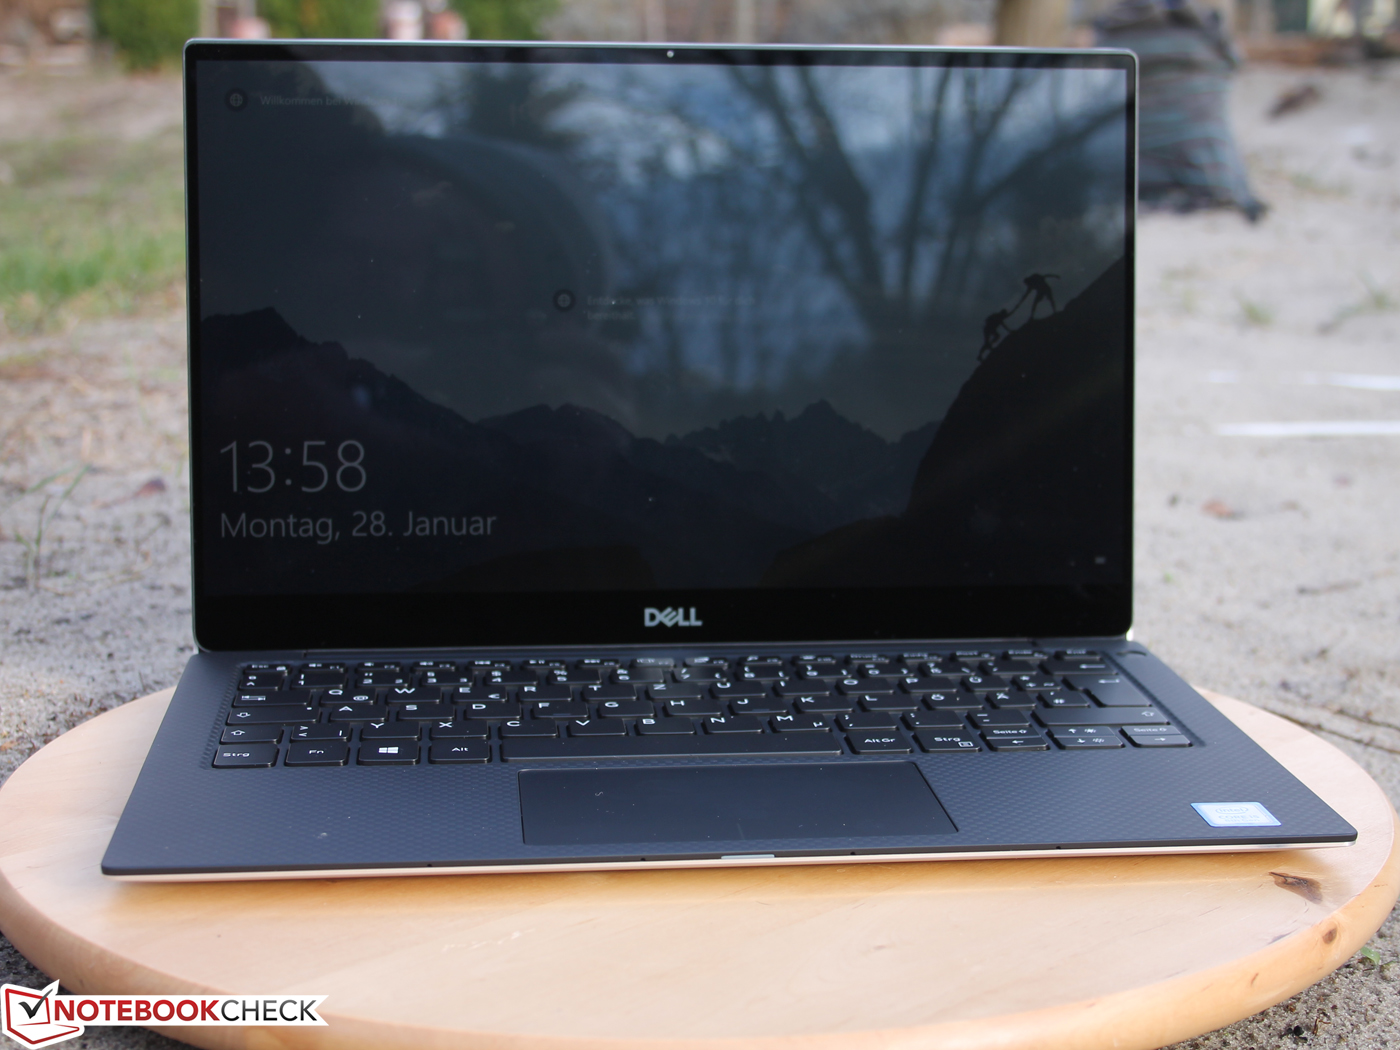
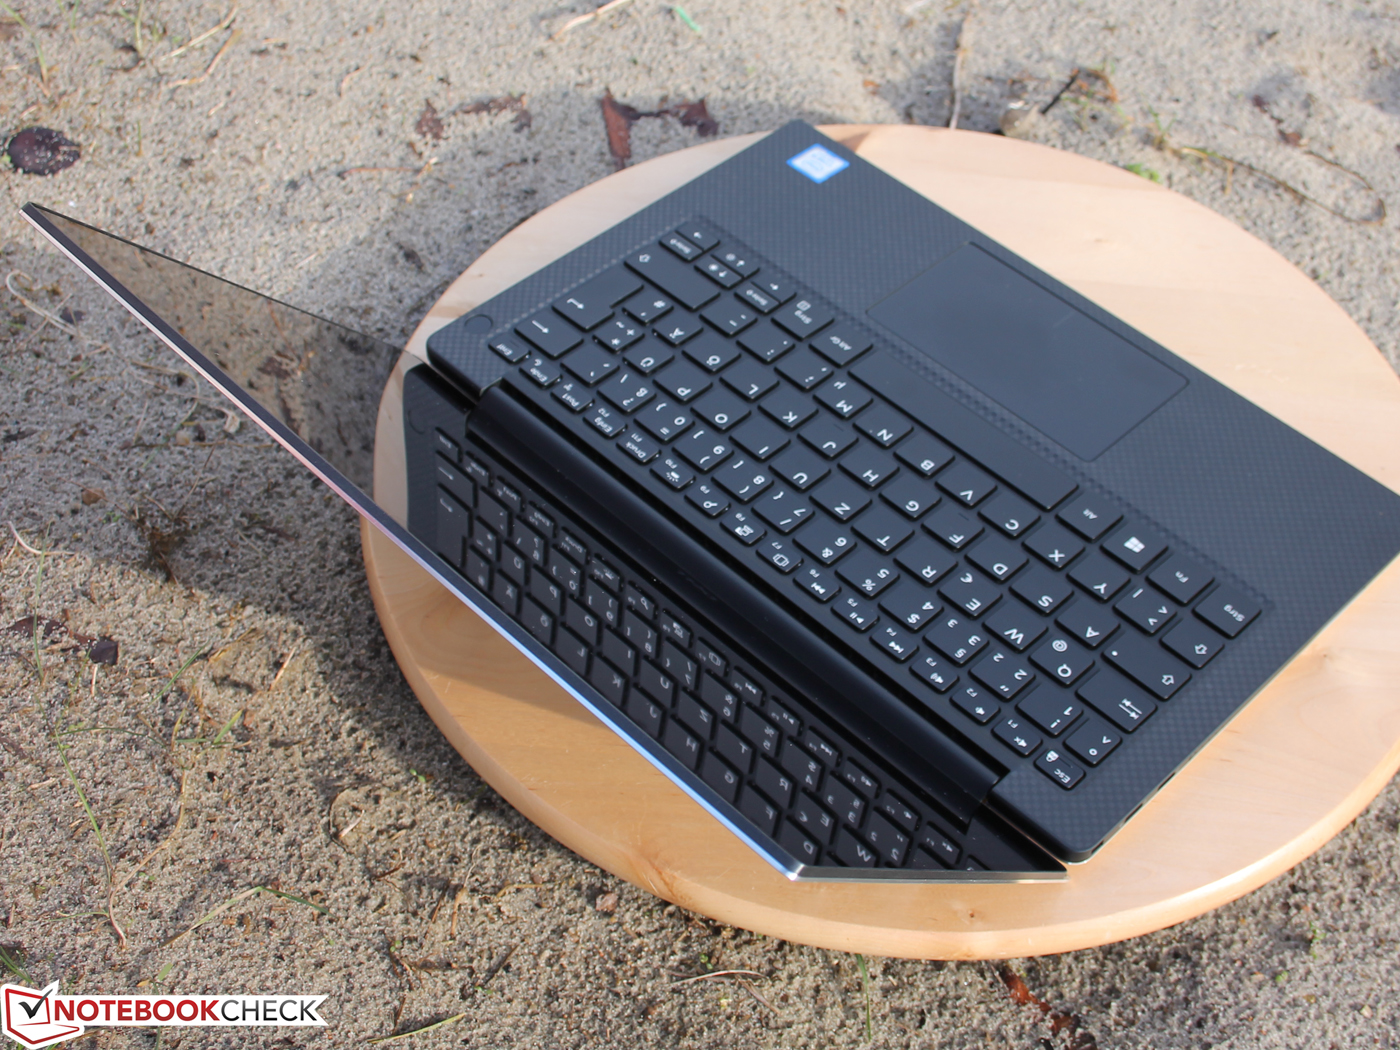
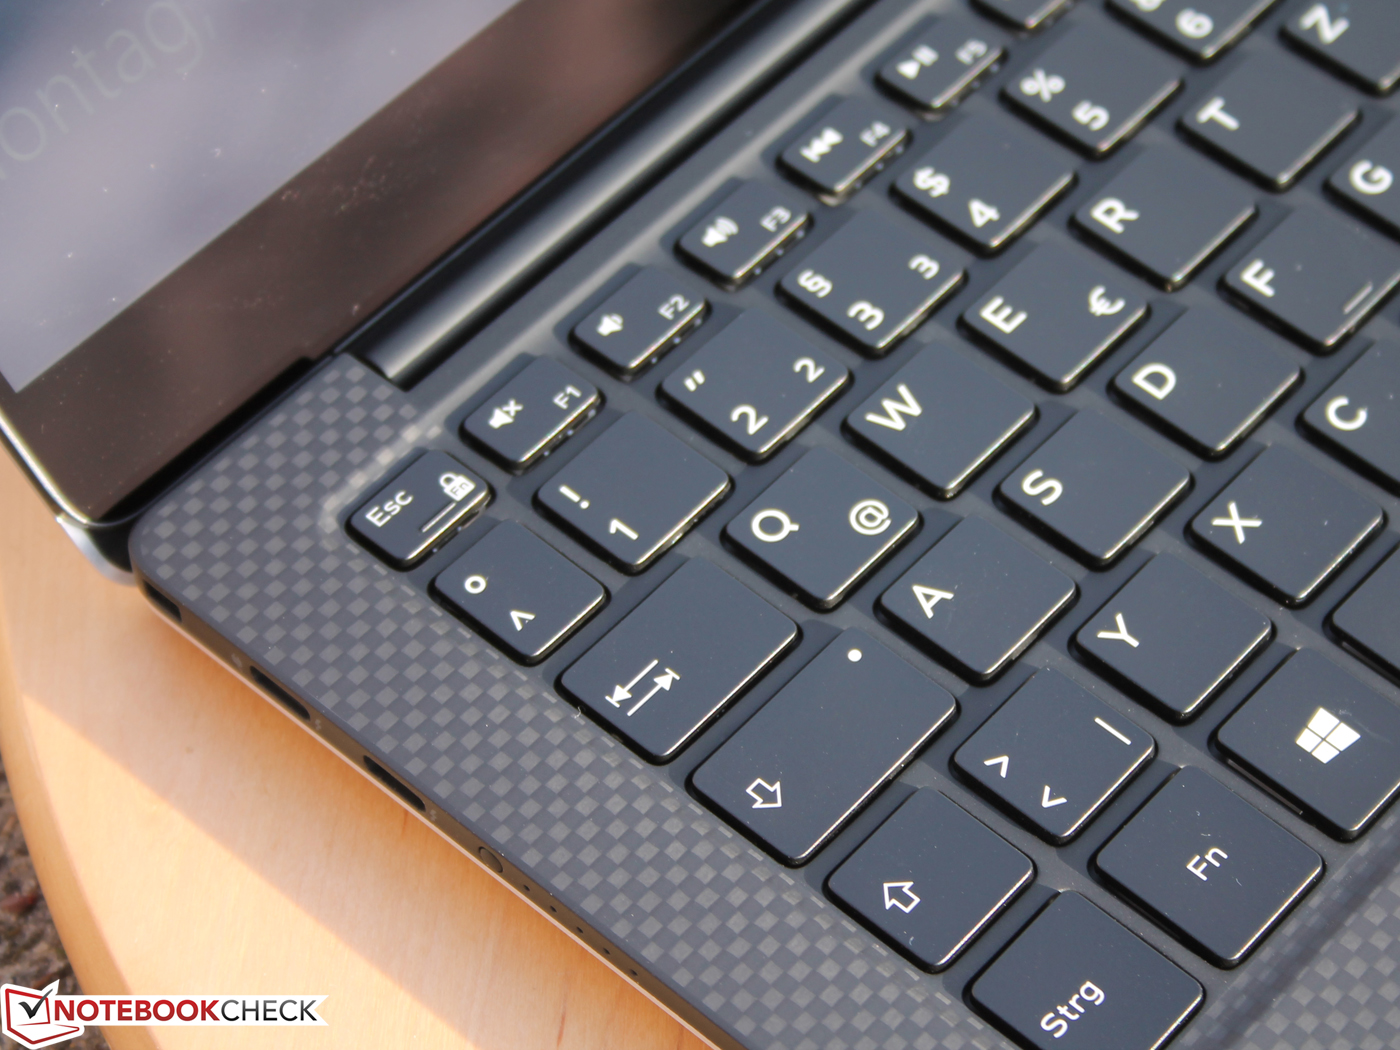
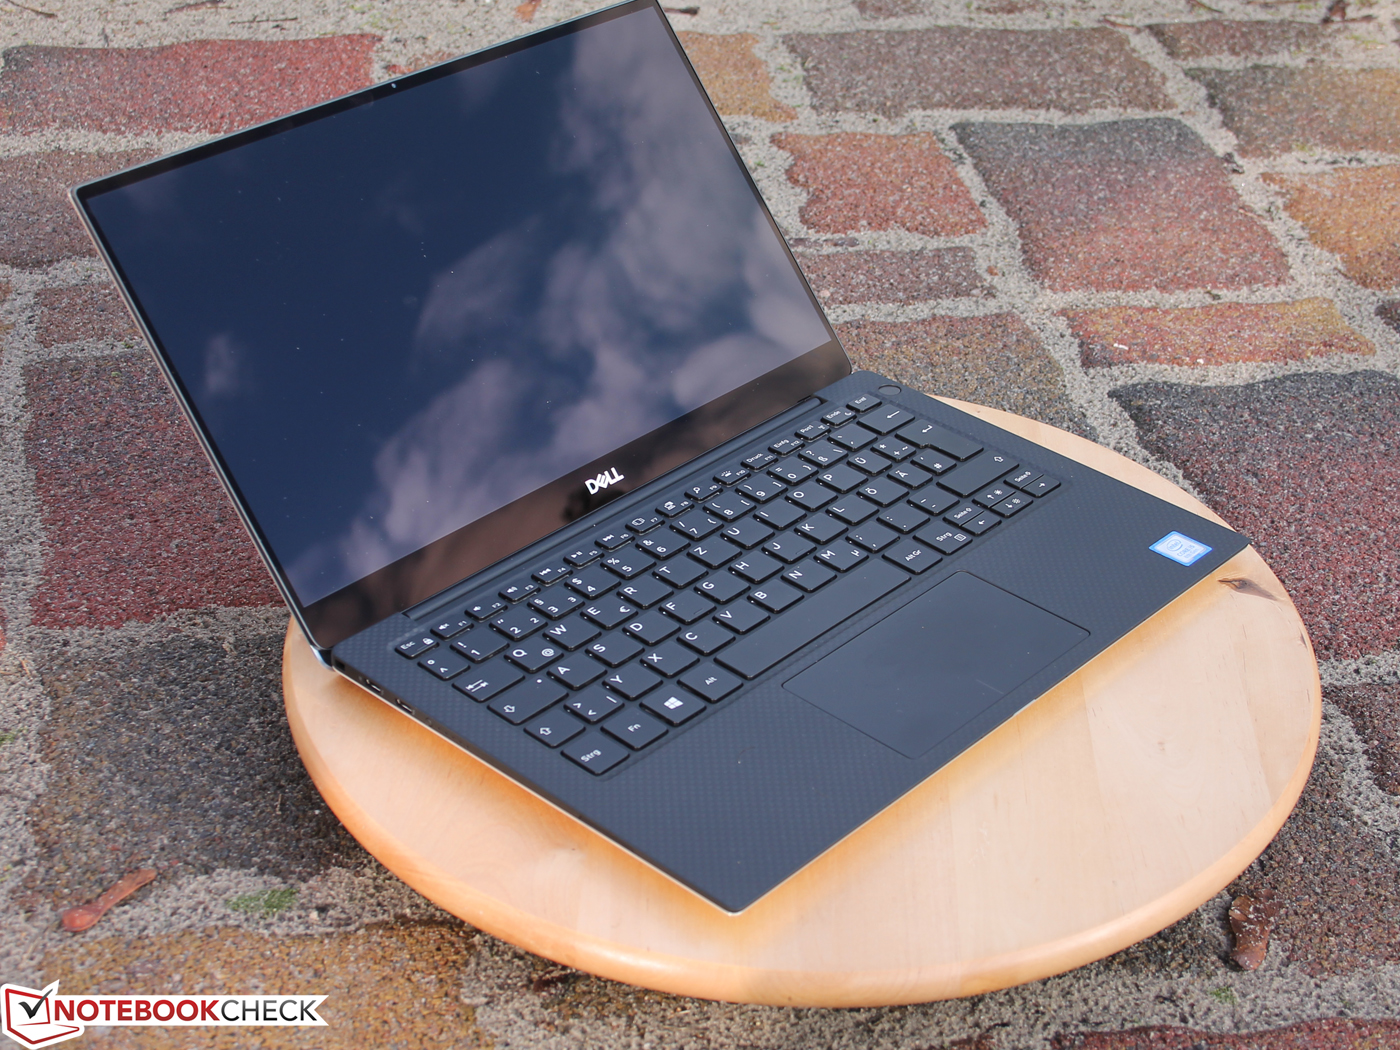
Höljet är fortfarande riktigt attraktivt med sin tunna infattning. Webbkamerans ändrade placering (tillbaka på ovansidan) är definitivt en välkommen förändring. Dell använder nu 4K-paneler från AUO istället för Sharp. Vi uppmätte liknande nivåer av ljusstyrka men också lägre kontrast och mindre sRGB-täckning.
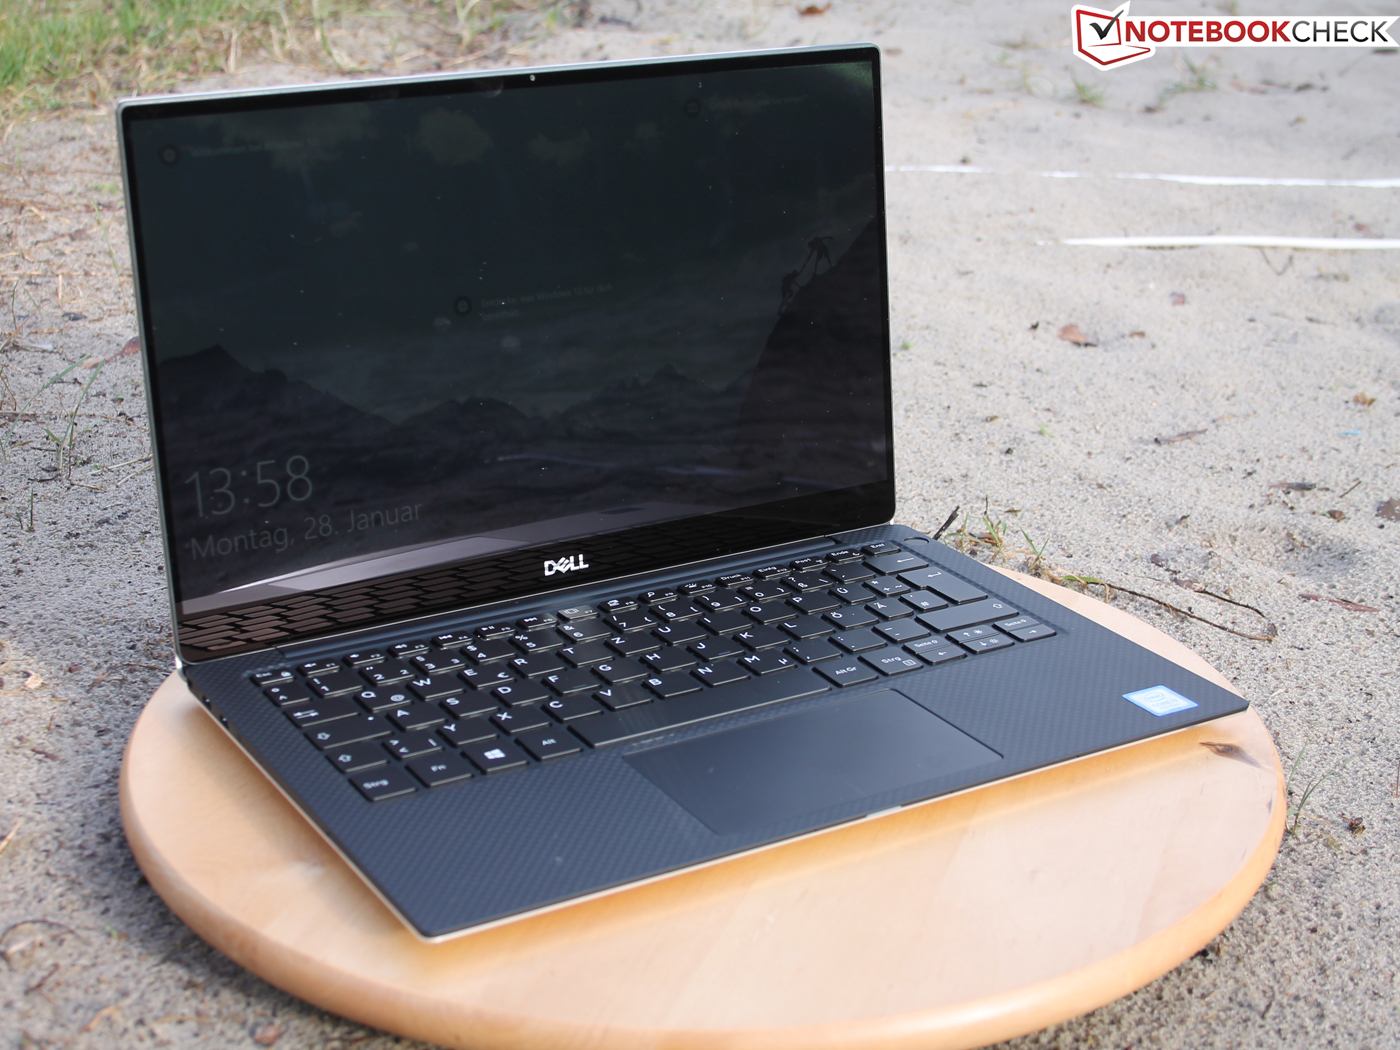
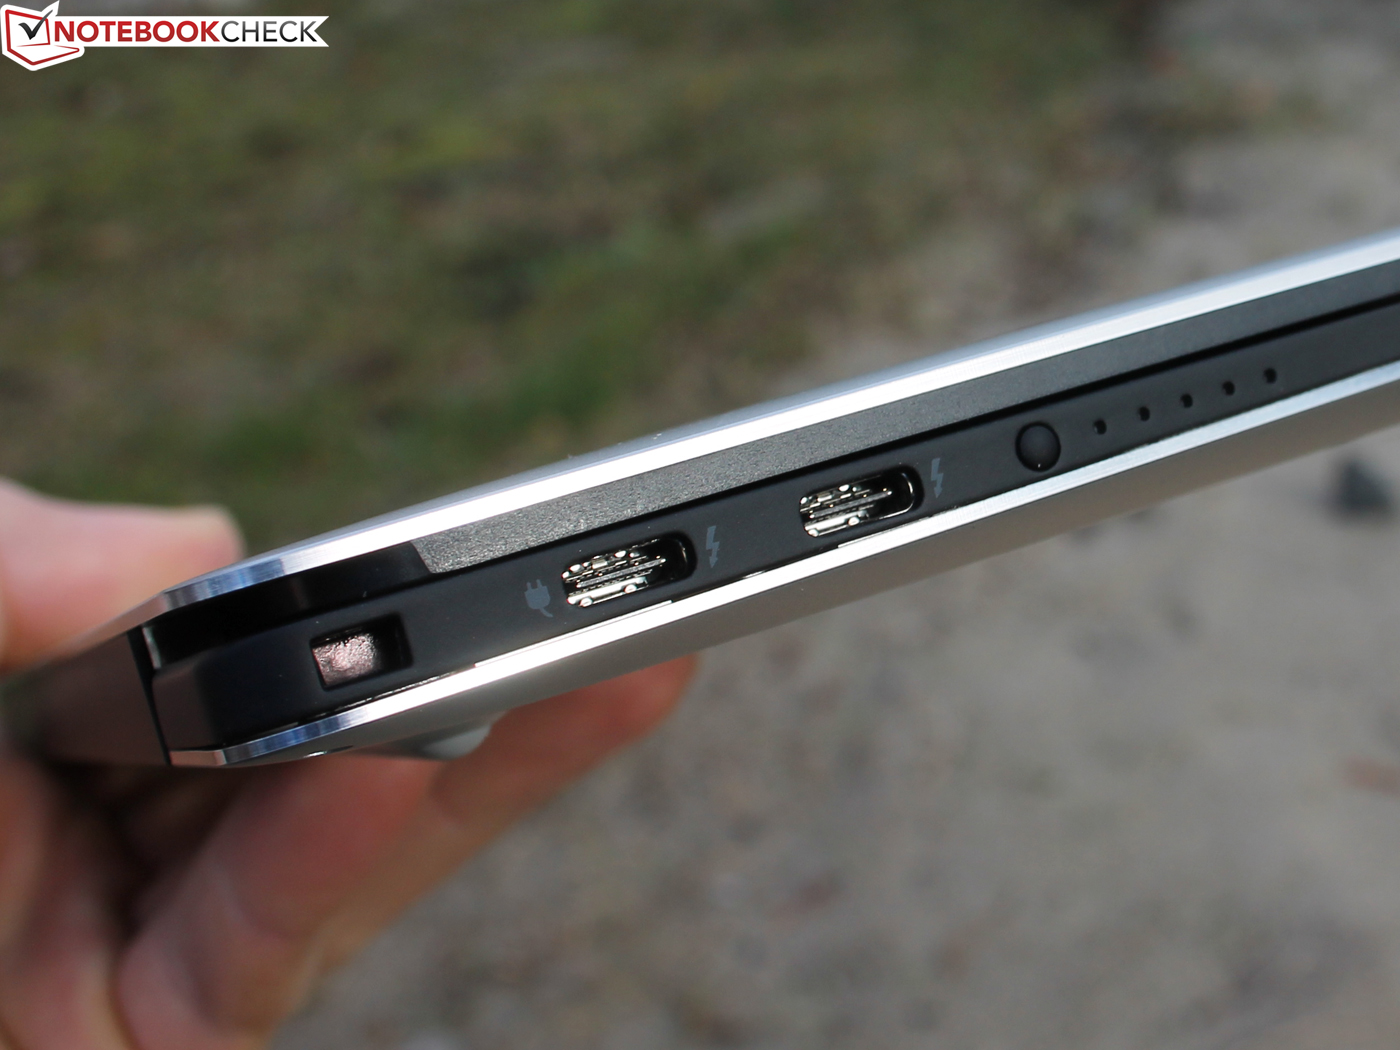
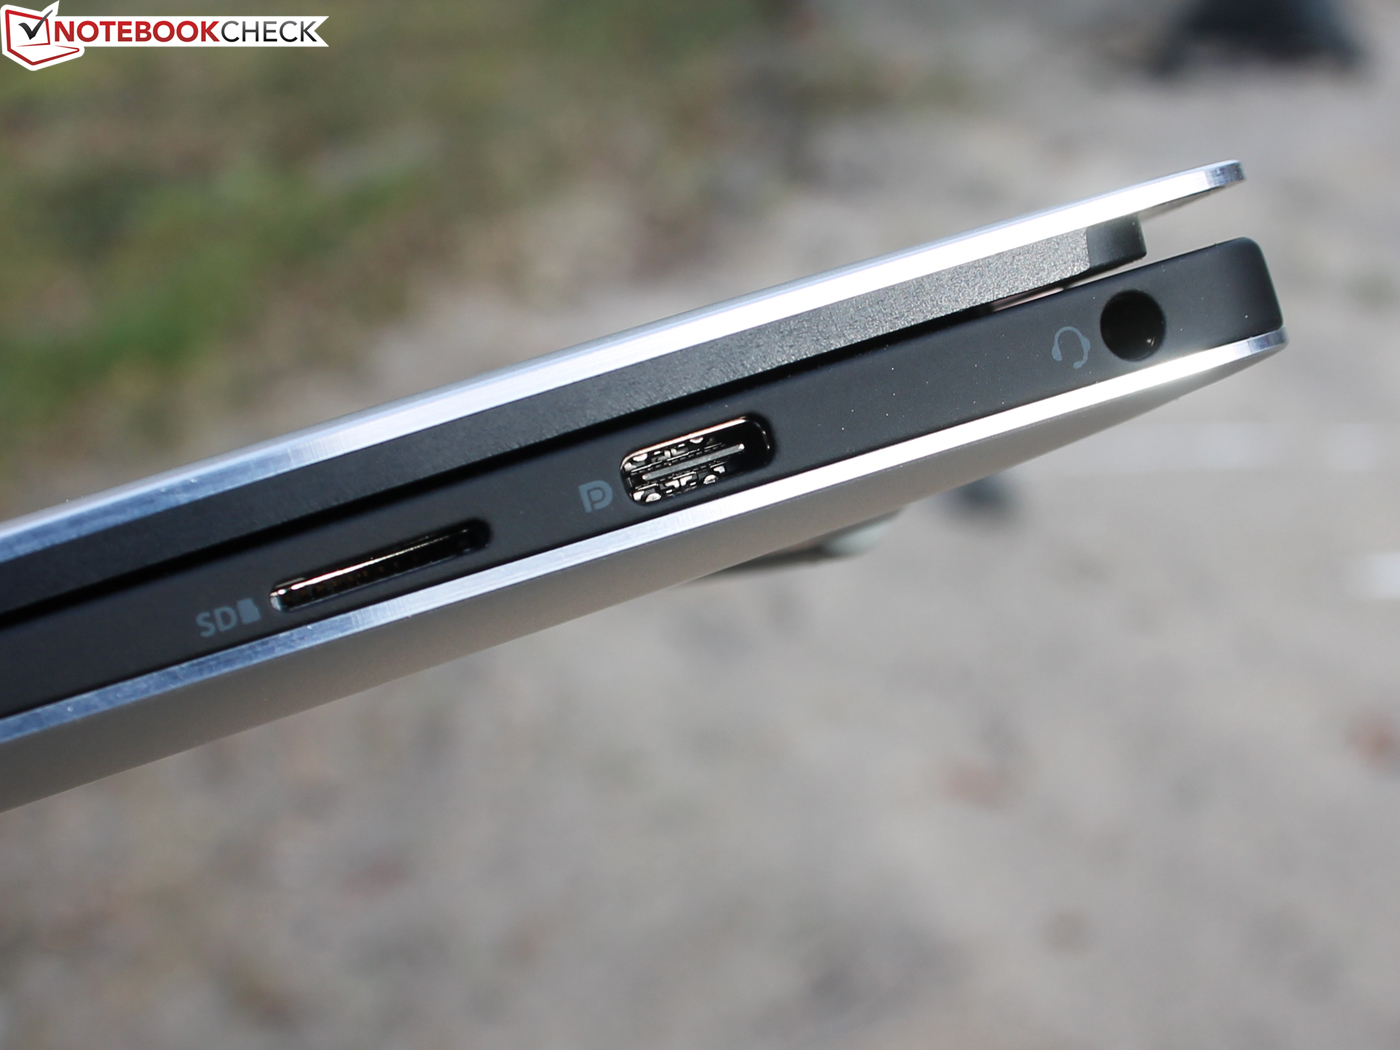
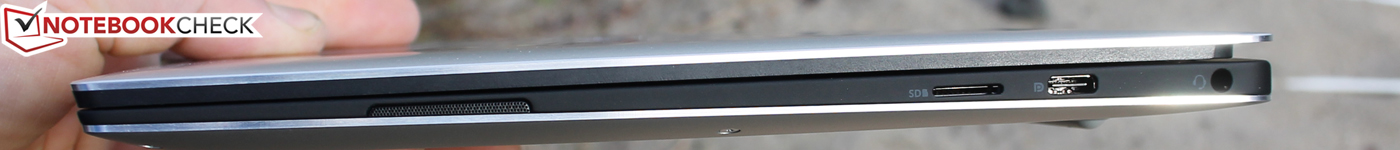
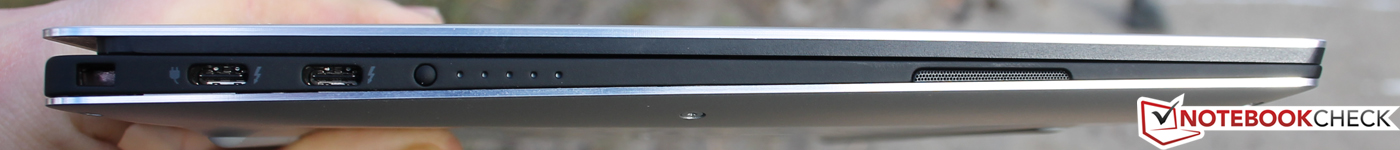
Portarna är oförändrade: Två Thunderbolt 3-portar och en USB C-port (med DisplayPort) är bra för professionella tillbehör.
Vi var nöjda med batteritiden: 8 timmar liknar 2018 års XPS 13 9370 UHD. Vi är redan ivriga att undersöka huruvida 1080p-versionen av XPS 13 9380 kommer hålla längre. 9370 FHD klarade av 11 timmar istället för 8 timmar (WiFi-test, +29%).
Den som är besviken över den låga GPU-prestandan hos XPS 13 – och även andra populära ultrabook-modeller på 13 tum såsom Spectre 13, Gram 13 eller ZenBook 13 bör ta en titt på Huawei MateBook 13 i7 och HP Envy 13-ah0003ng som har ett GeForce MX150, vilket är mycket kraftigare än inbyggda UHD Graphics 620 och klarar dessutom av spel.
Detta innebär att XPS 13 är för användare som inte behöver en kraftfull GPU och som föredrar perfekta inmatningsenheter och ett stort antal portar. Den tryckkänsliga UHD-versionen som vi testade led av kortare batteritid och lägre kontrast. Om du vill ha så mycket mobilitet som möjligt rekommenderar vi 1080p-versionen. Vi kommer att recensera den inom en snar framtid.
Dell XPS 13 9380 2019
- 02/02/2019 v6 (old)
Sebastian Jentsch
Price comparison
