Aorus 15 XE5 recension: Kompakt bärbar dator med QHD-spel och Thunderbolt 4
Den 15,6-tums Aorus 15 XE5 är en av de kompakta bärbara datorerna för spel och drivs av en Core i7-12700H och en GeForce Bärbar dator med RTX 3070 Ti. Maskinen konkurrerar med enheter som t.ex Acer Nitro 5 AN515-46, den MSI Katana GF66 12UGS, den Schenker XMG Fusion 15 (Mid 22) och Asus TUF DASH F15 FX517ZR.
Potentiella konkurrenter i jämförelse
Gradering | Datum | Modell | Vikt | Höjd | Storlek | Upplösning | Pris |
|---|---|---|---|---|---|---|---|
| 85.5 % v7 (old) | 12/2022 | Aorus 15 XE5 i7-12700H, GeForce RTX 3070 Ti Laptop GPU | 2.3 kg | 24 mm | 15.60" | 2560x1440 | |
| 83.9 % v7 (old) | 11/2022 | Acer Nitro 5 AN515-46-R1A1 R7 6800H, GeForce RTX 3070 Ti Laptop GPU | 2.5 kg | 26.8 mm | 15.60" | 1920x1080 | |
| 87.4 % v7 (old) | 08/2022 | Schenker XMG Fusion 15 (Mid 22) i7-11800H, GeForce RTX 3070 Laptop GPU | 1.9 kg | 21.65 mm | 15.60" | 2560x1440 | |
| 85.8 % v7 (old) | 07/2022 | Asus TUF Dash F15 FX517ZR i7-12650H, GeForce RTX 3070 Laptop GPU | 2 kg | 20.7 mm | 15.60" | 2560x1440 | |
| 80.3 % v7 (old) | 06/2022 | MSI Katana GF66 12UGS i7-12700H, GeForce RTX 3070 Ti Laptop GPU | 2.3 kg | 27.5 mm | 15.60" | 1920x1080 |
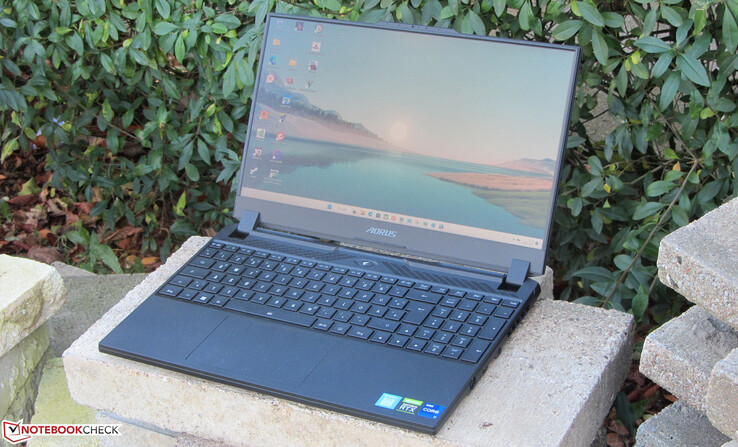
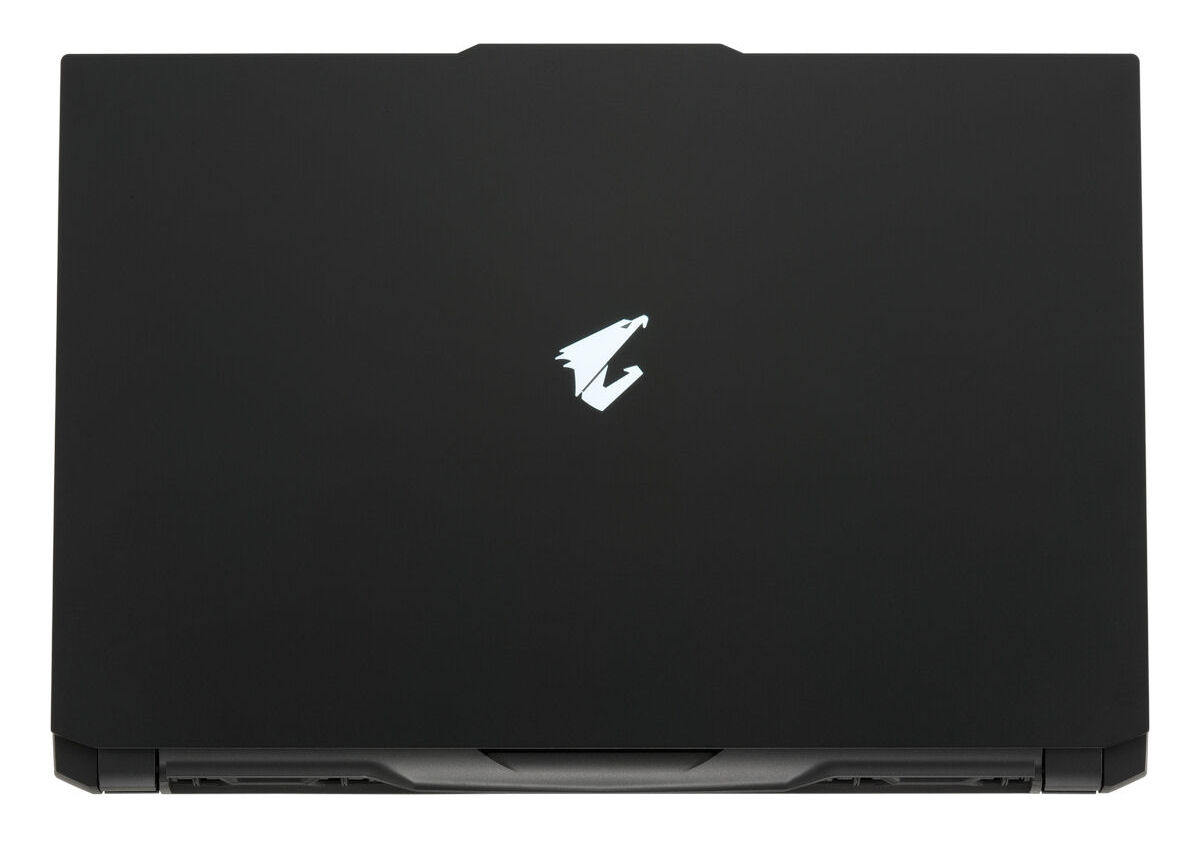
Väska - Aorus är imponerande kompakt
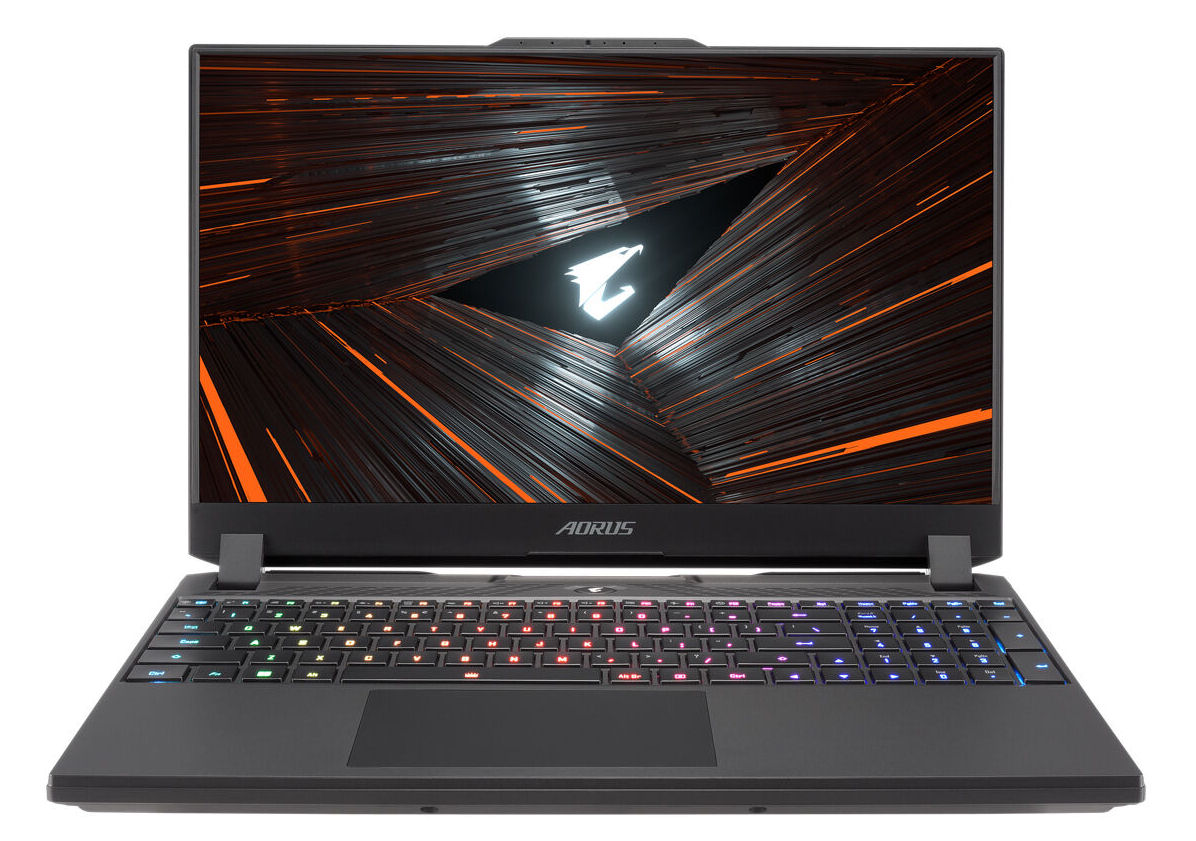
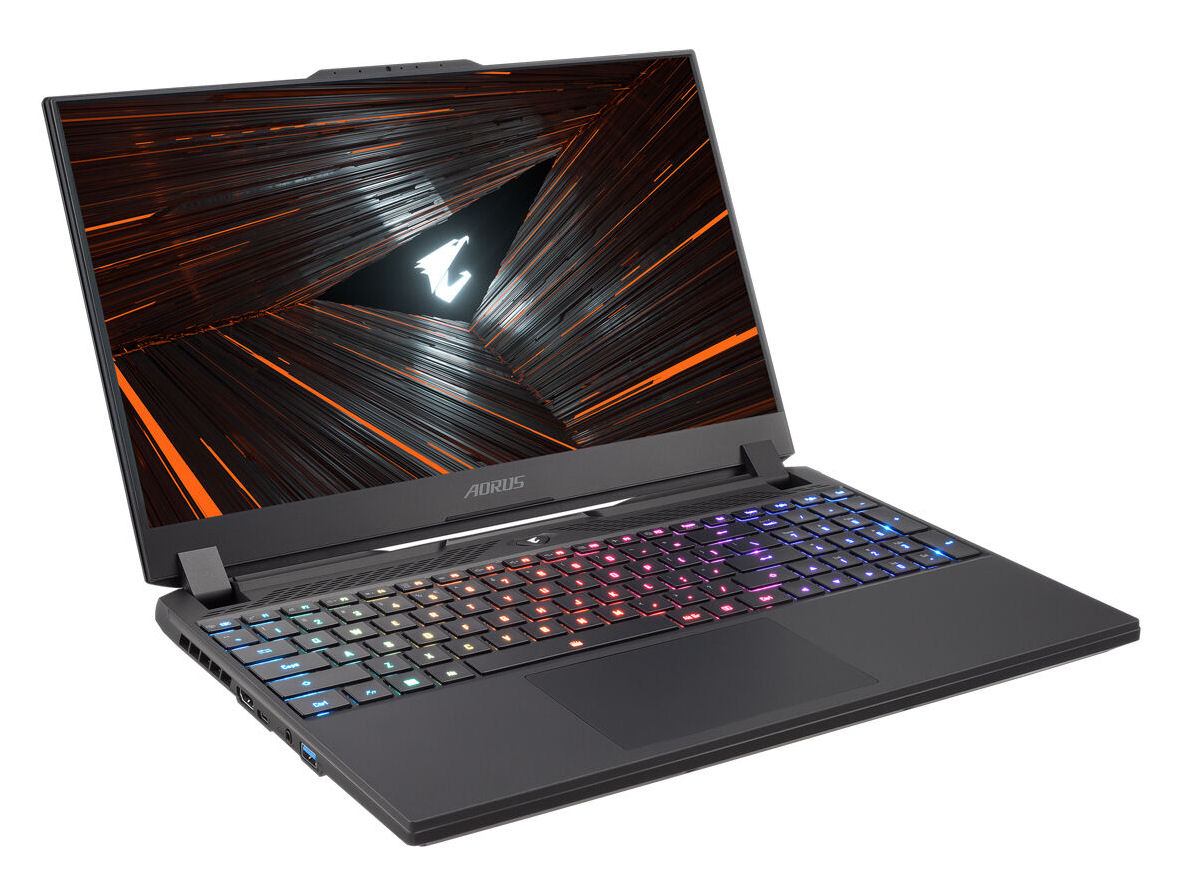
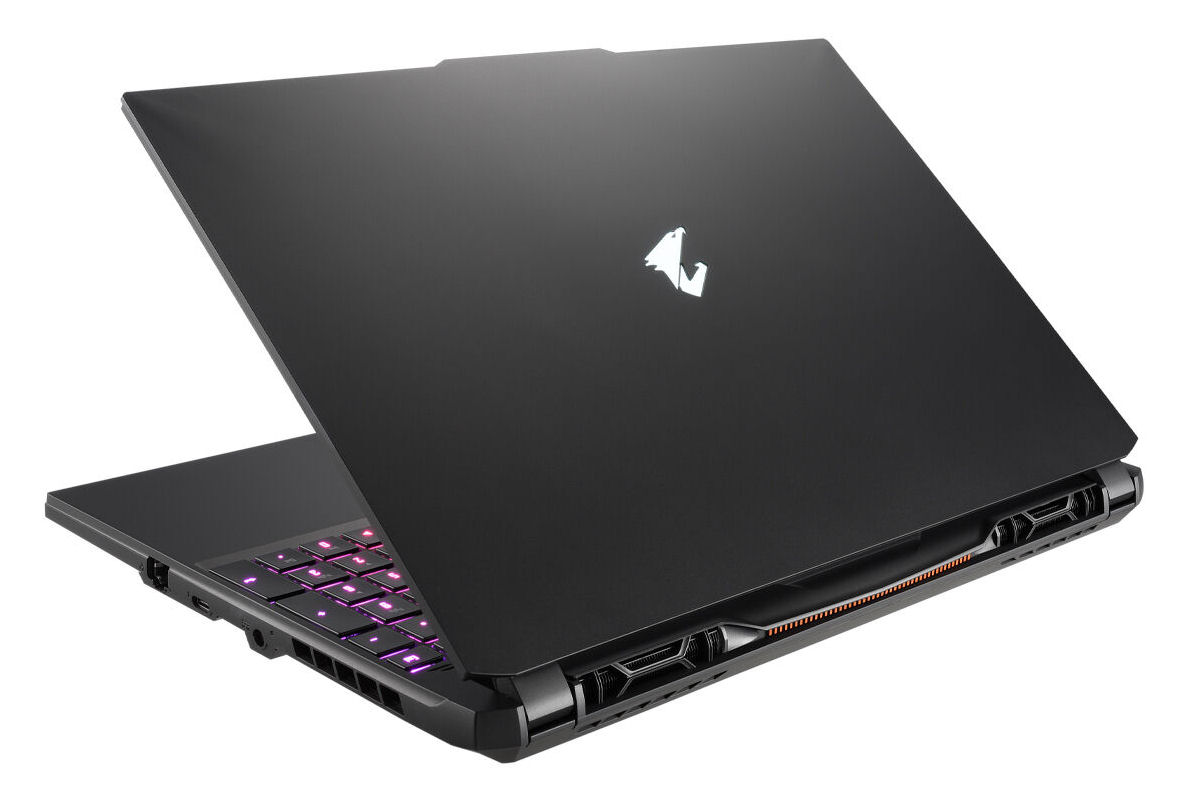
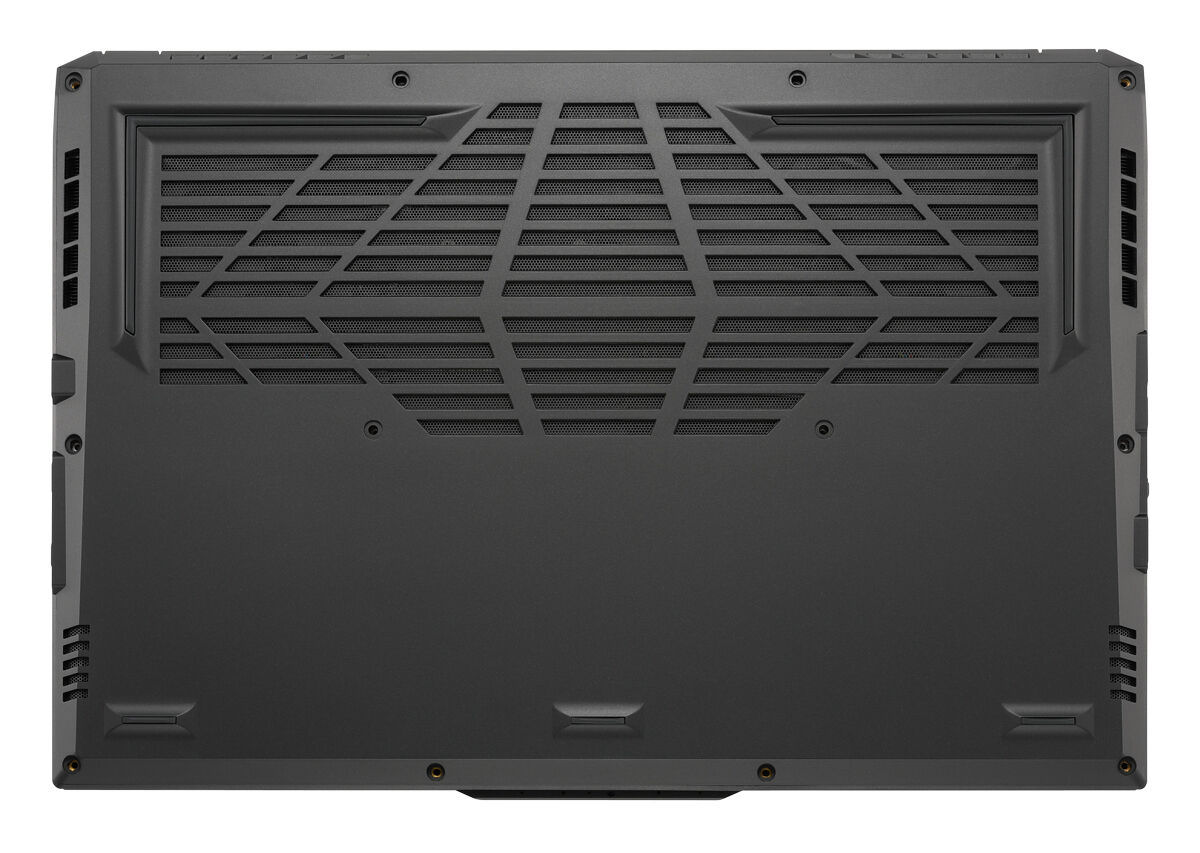
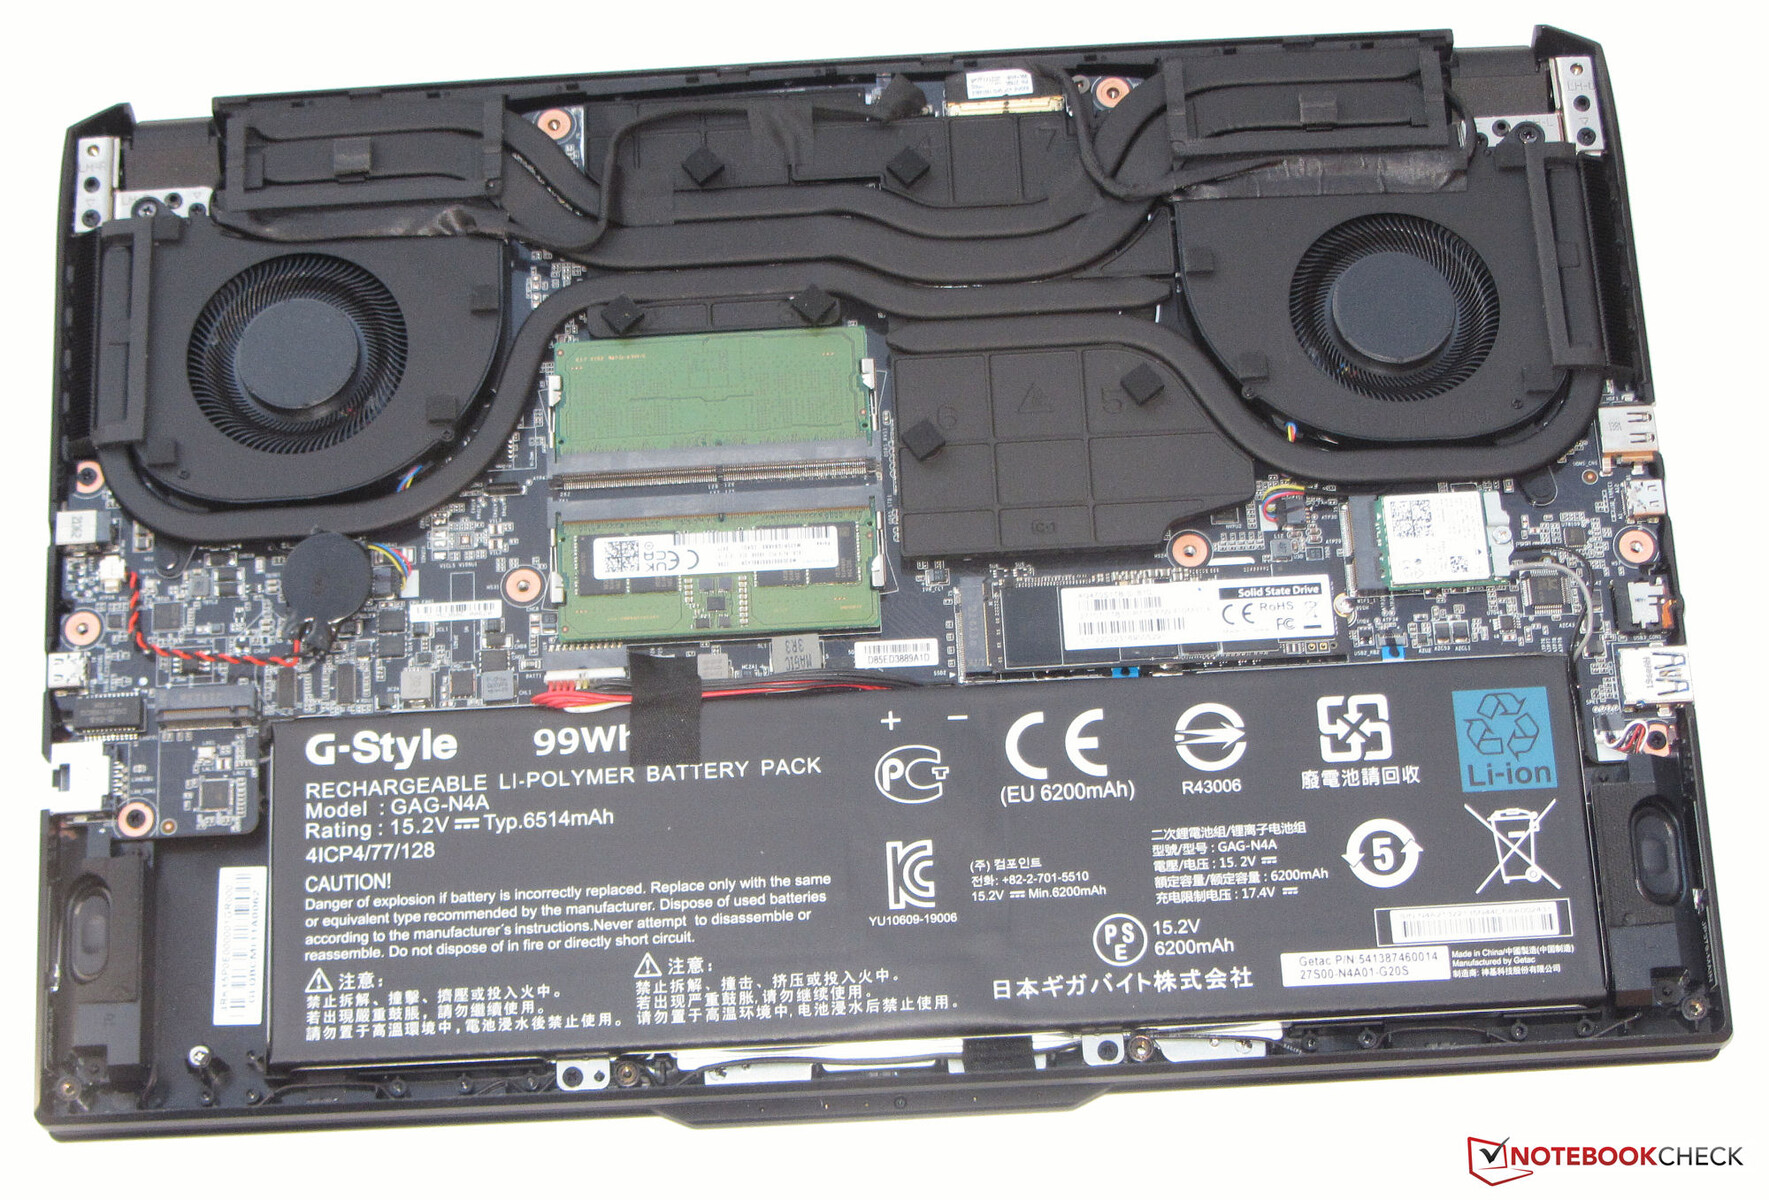
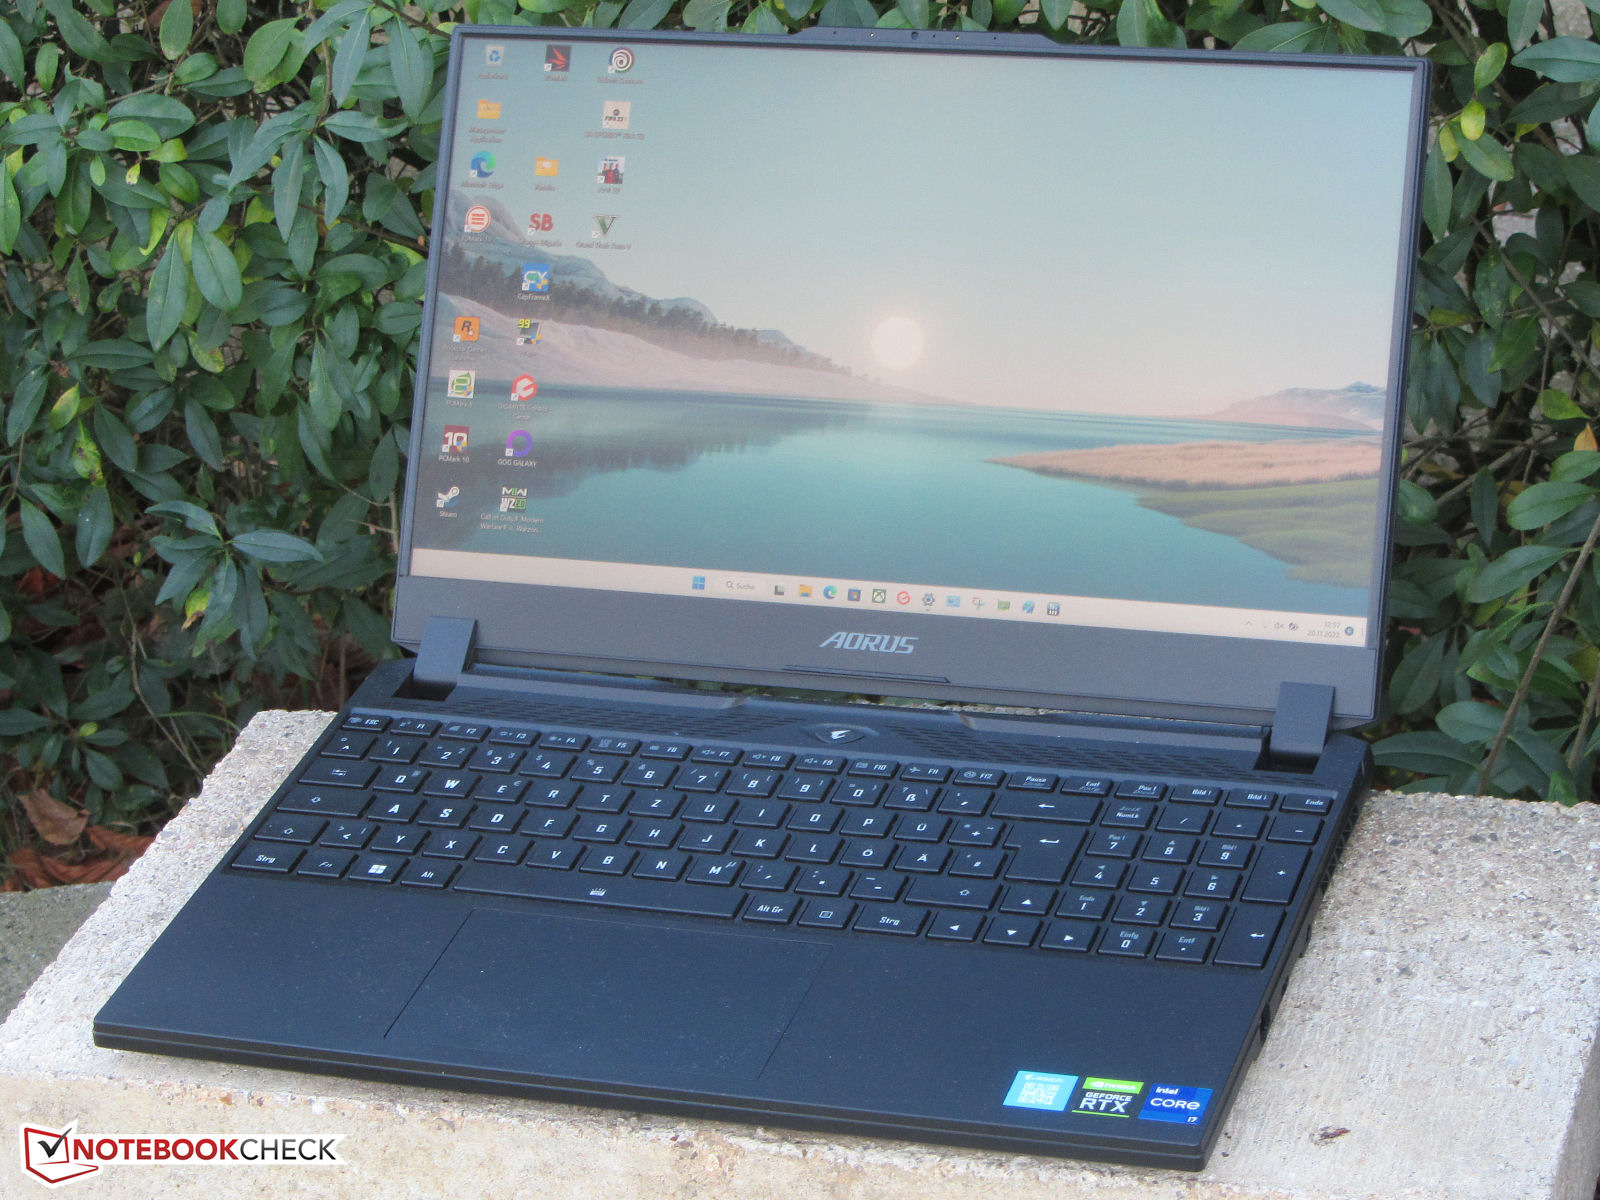
Gigabyte Aorus 15 XE5 har ett svart plastchassi med släta, matta ytor. Enheten har inga extravaganta designelement. Den tunna ramen runt skärmen ger den bärbara datorn en viss elegans. Den bärbara datorns design accentueras av den upplysta Aorus-logotypen på baksidan av locket. När den nedre panelen är borttagen har du tillgång till batteriet (fastskruvat, inte fastlimmat) och resten av de inre delarna.
Vår recensionsenhet verkar inte ha några problem med tillverkningen. Luckorna i chassit är täta och det finns inga överflödiga material som sticker ut från den bärbara datorn. Basdelen rör sig knappt när den vrids, men locket uppvisar betydligt mer böjlighet. Locket hålls på plats av två gångjärn som gör att skärmen kan fällas tillbaka cirka 150 grader. Den bärbara datorn kan öppnas med bara en hand.

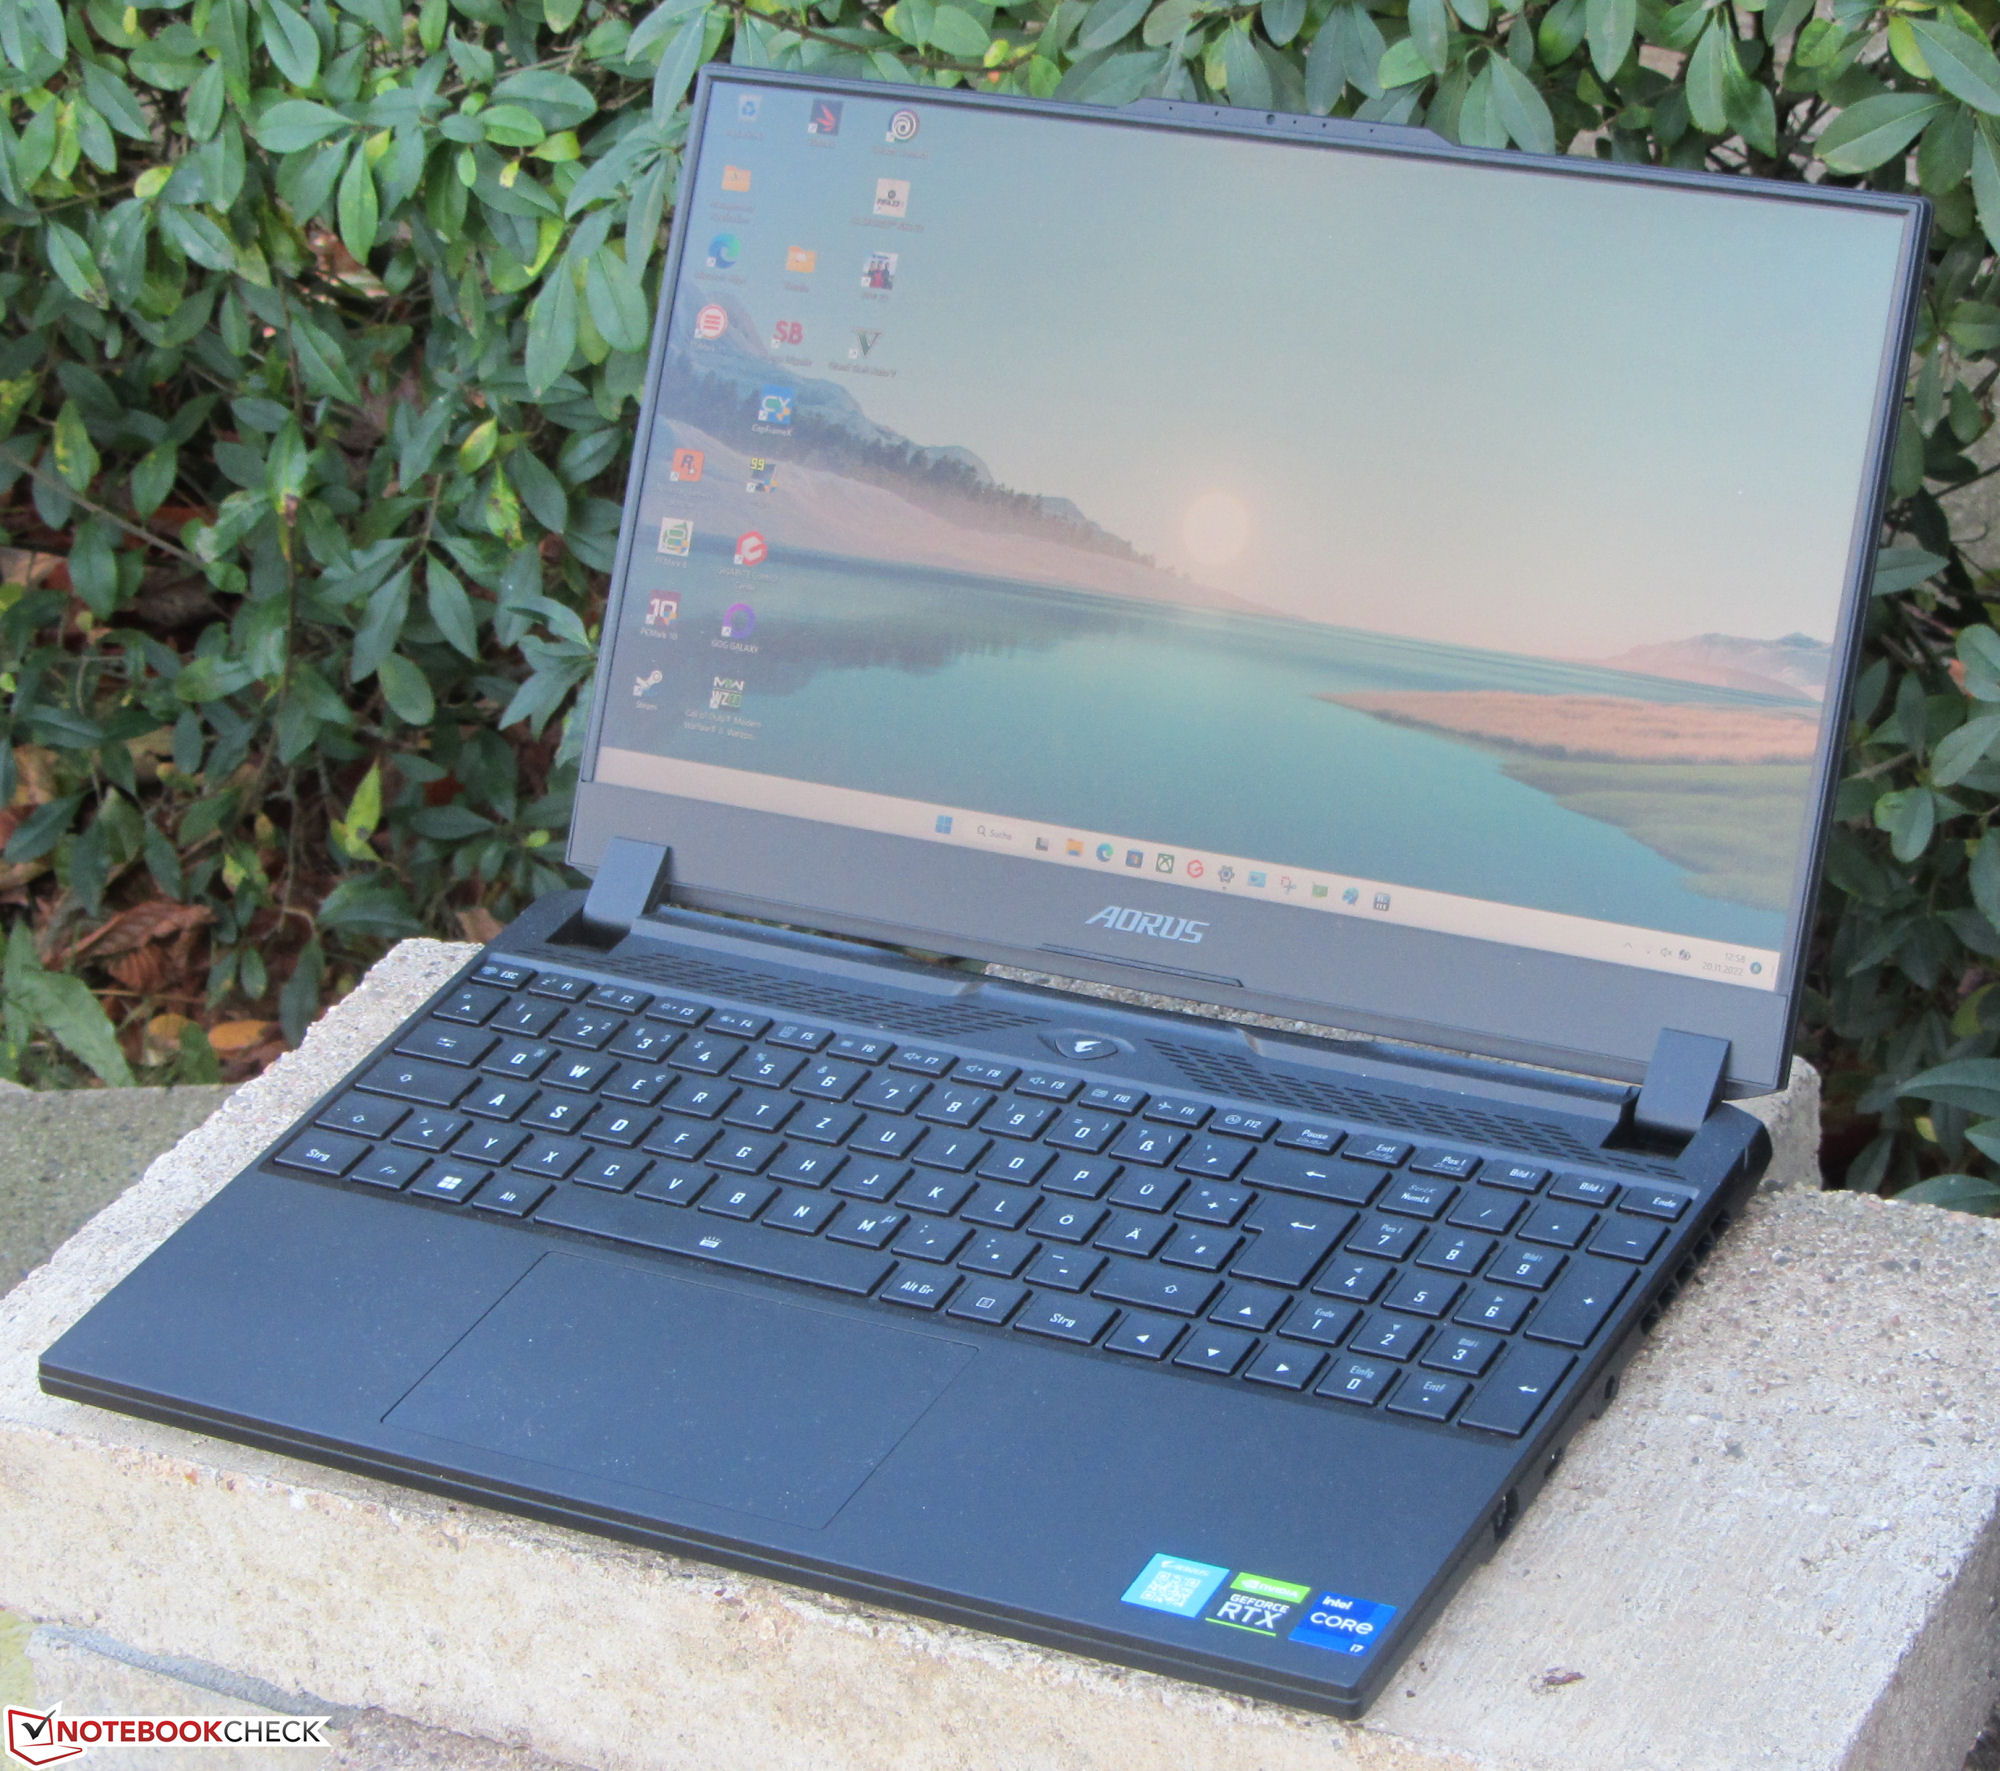
15 XE5 är en av de mer kompakta bärbara datorerna i vår jämförelse. Med sina cirka 2,3 kg är den dock tyngre än konkurrerande enheter som t.ex XMG Fusion 15 och TUF Dash F15.
Specifikationer - Stöd för Thunderbolt 4
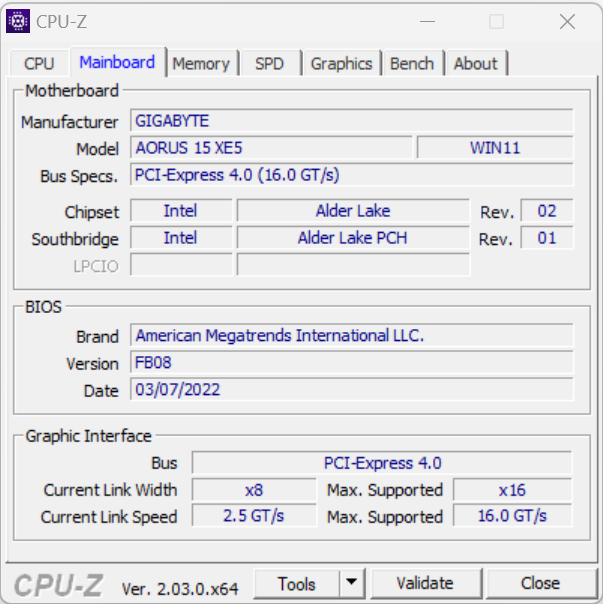
De två USB-C-portarna (1x Thunderbolt 4, 1x USB 3.2 Gen 1) har stöd för DisplayPort över USB-C, och Thunderbolt 4-anslutningen erbjuder även Power Delivery. Synd att det bara finns en USB-A-port (USB 3.2 Gen 1) på enheten. De som behöver fler externa anslutningsmöjligheter skulle behöva använda en adapter eller en dockningsstation. Du kan ansluta upp till tre skärmar till den bärbara datorn (2x DP, 1x HDMI). Som avrundning av portvalet finns ett kombinerat ljuduttag och en Gigabit Ethernet-port. Aorus 15 XE5 har ingen inbyggd kortläsare.
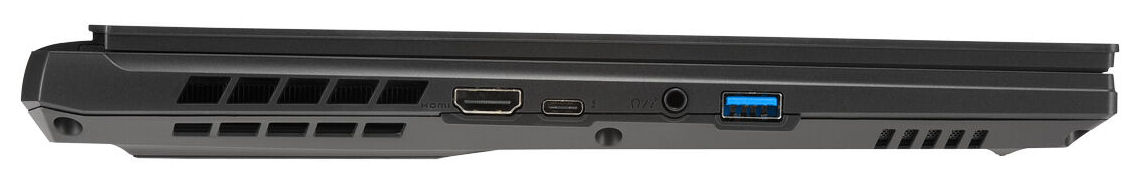
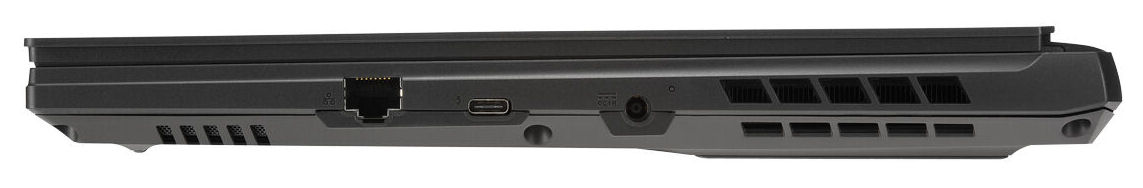
Anslutningsmöjligheter
Under optimala förhållanden (inga andra Wi-Fi-enheter i närheten, kort avstånd mellan den bärbara datorn och serverdatorn) uppmätte vi utmärkta Wi-Fi-överföringshastigheter som motsvarar vad Wi-Fi-modulen inuti (Intel AX210, 802.11ax) klarar av. Trådbundna nätverksanslutningar hanteras av ett Gigabit Ethernet-chip från Realtek (RTL8125, 2,5 Gbit).
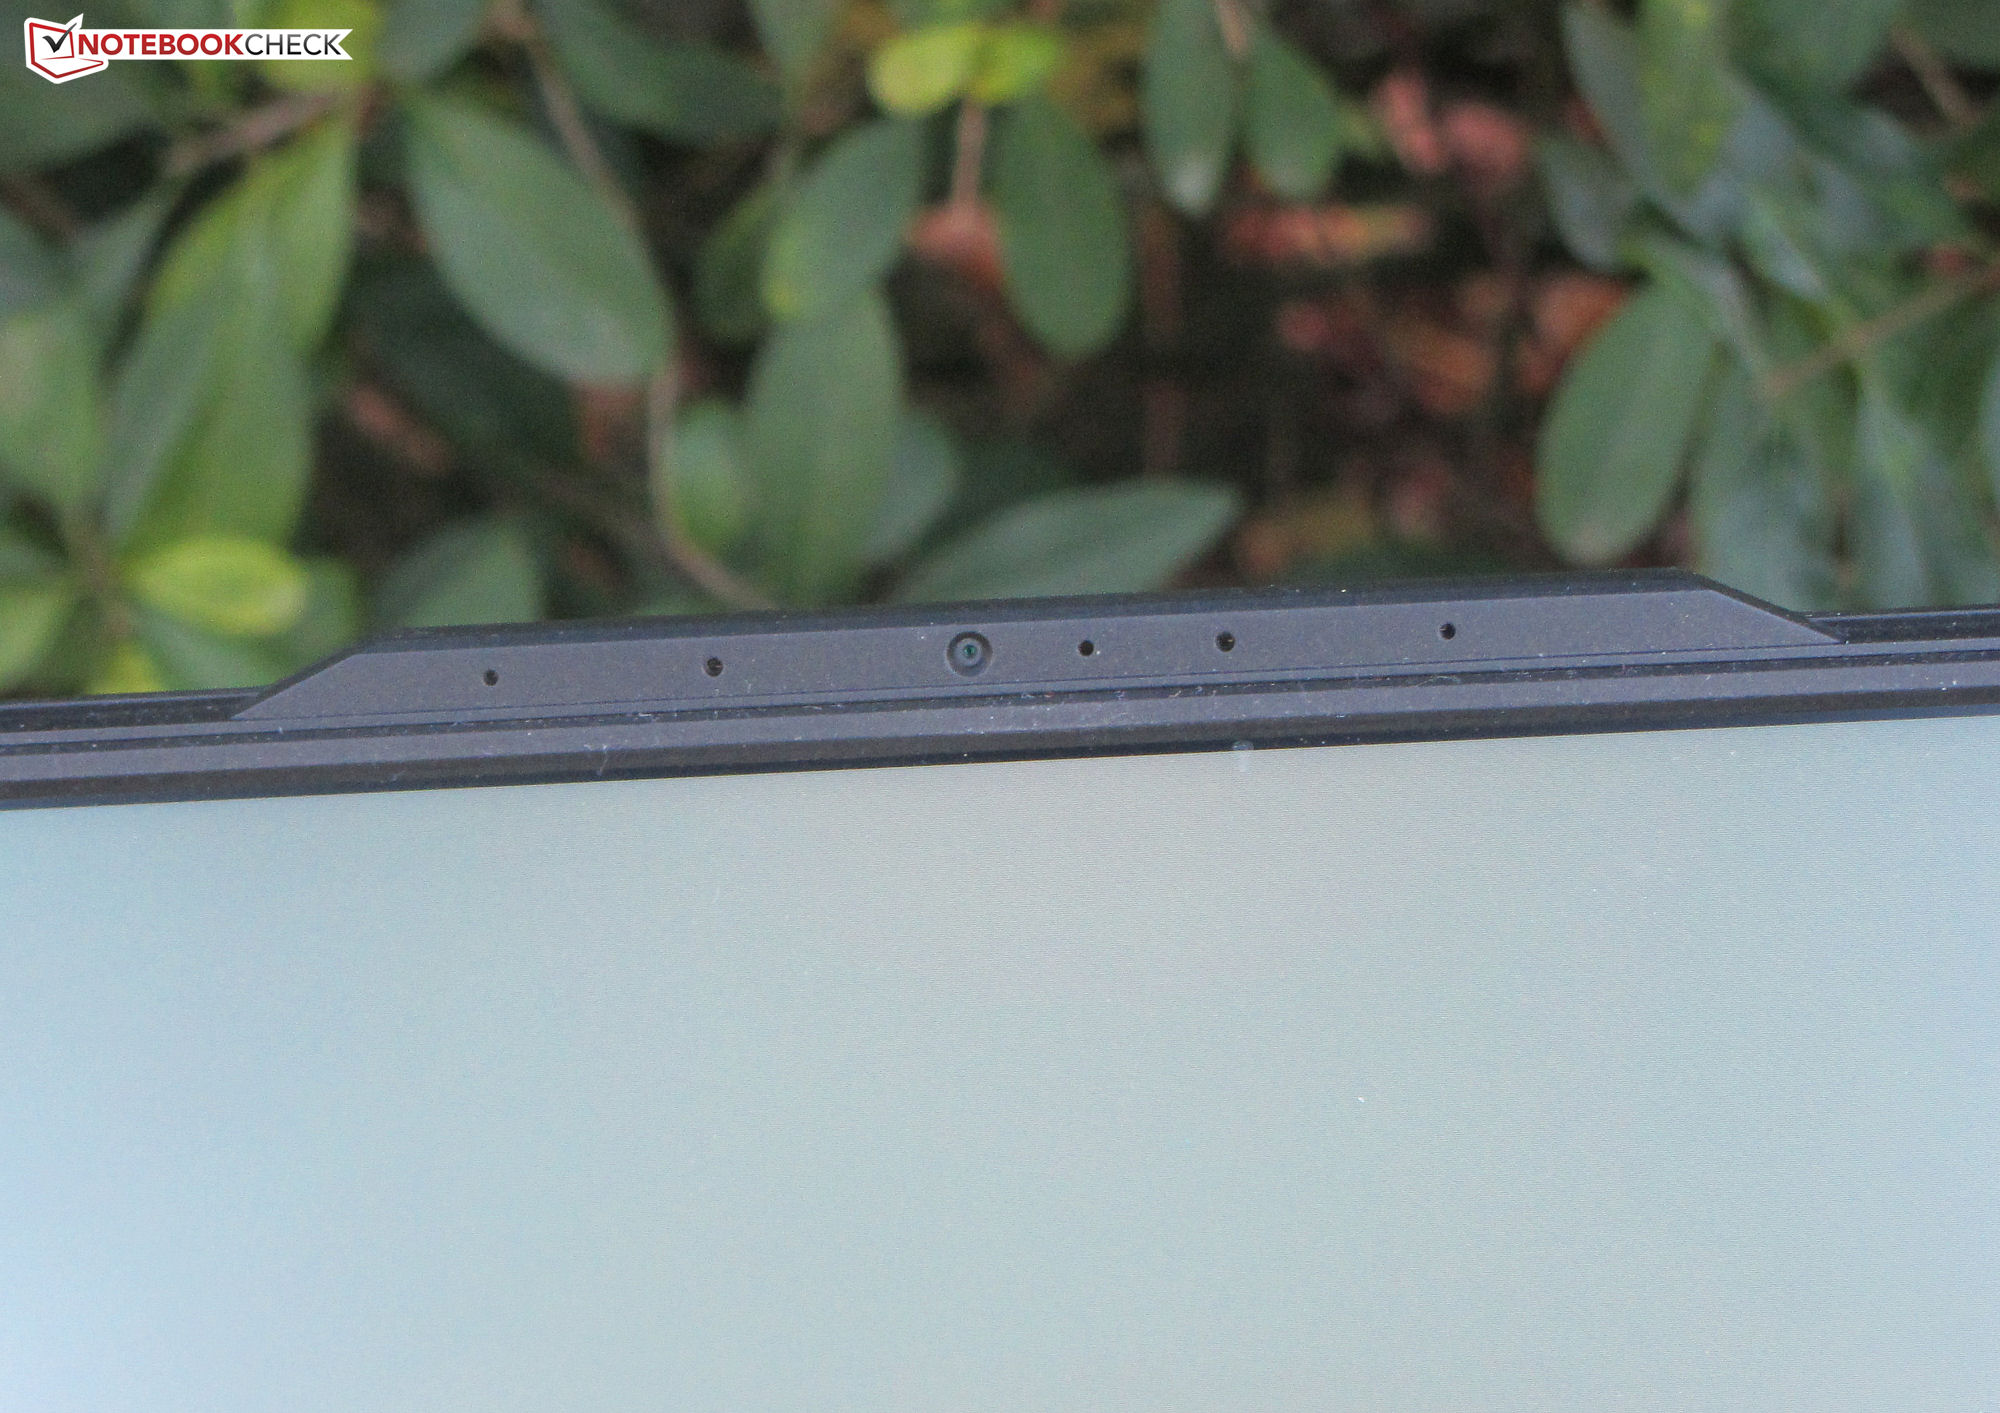
Webbkamera
Webbkameran (0,9 MP) kan ta bilder med en upplösning på upp till 1 280 x 720 pixlar. Den saknar färgprecision och ger färger som avviker avsevärt från referensvärdena. Det finns inte heller någon mekanisk sekretessbrytare på webbkameran.


Tillbehör
Aorus 15 XE5 levereras inte med några andra tillbehör än en laddare och de vanliga dokumenten (snabbstartguide och garantiinformation).
Underhåll
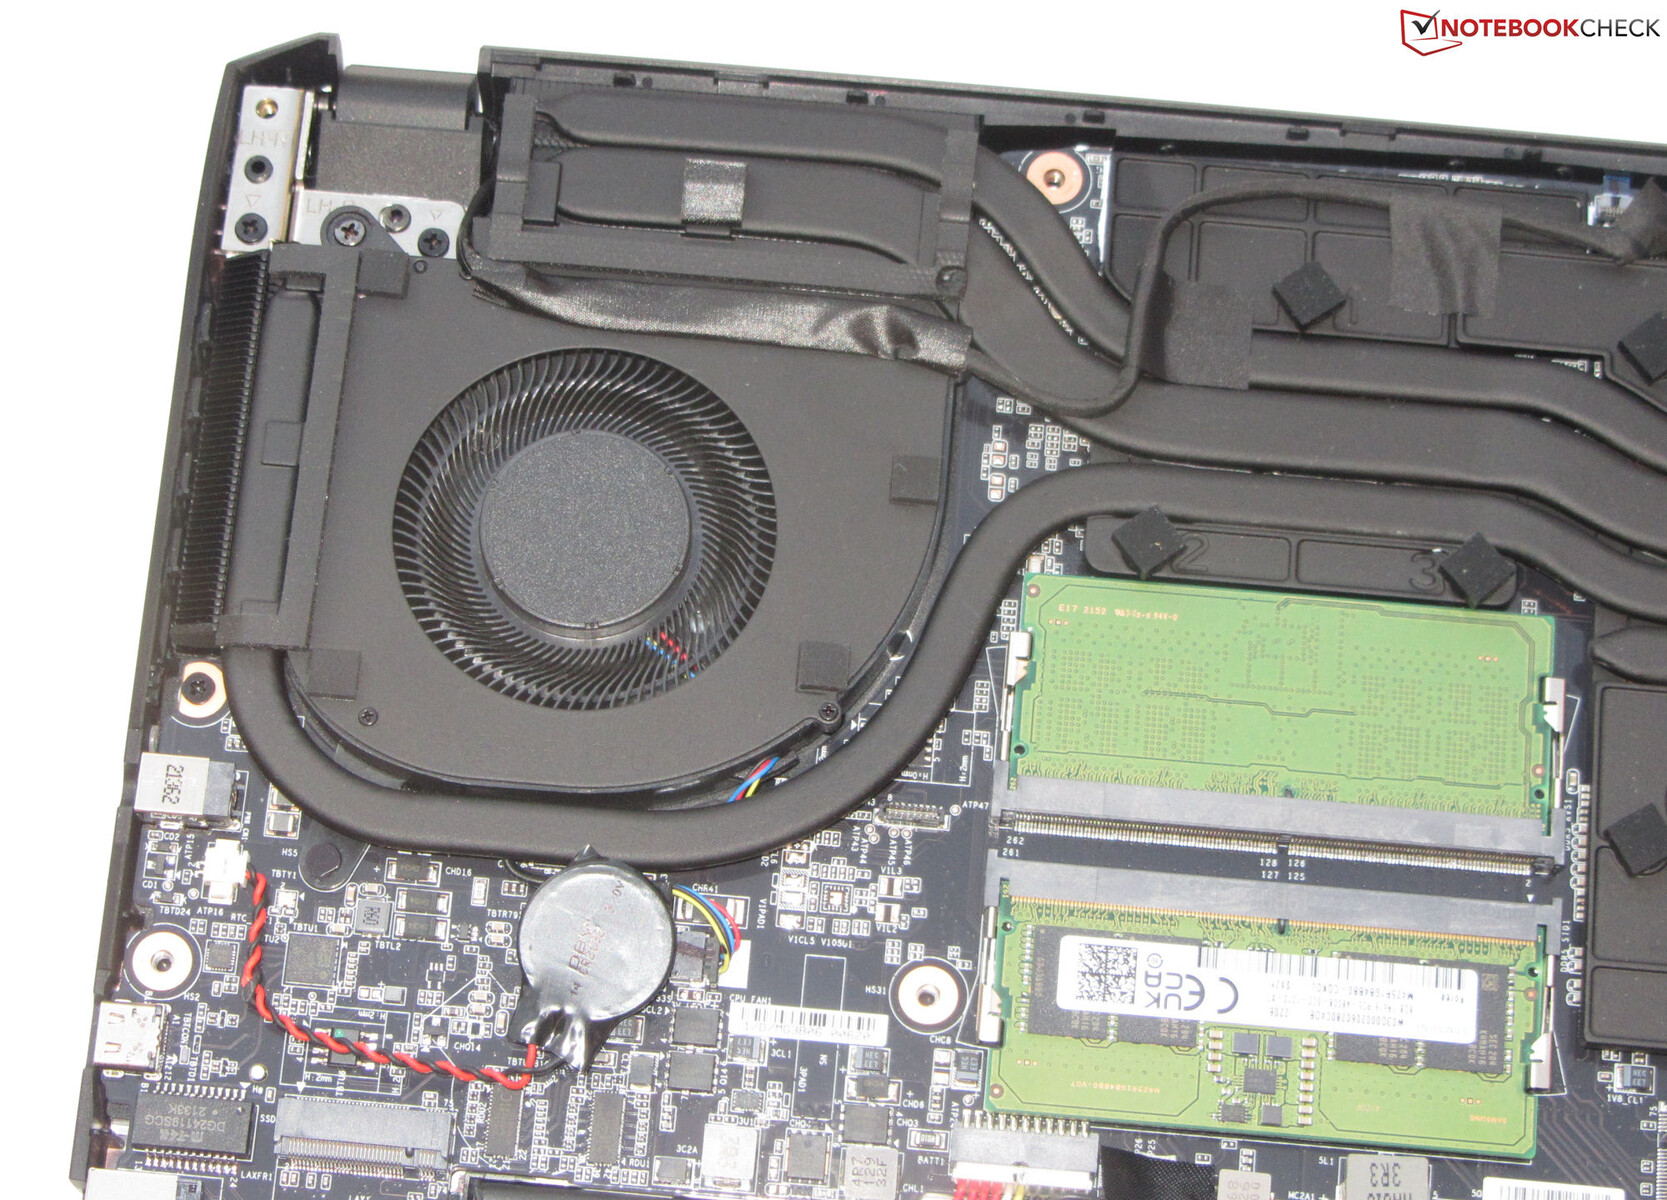
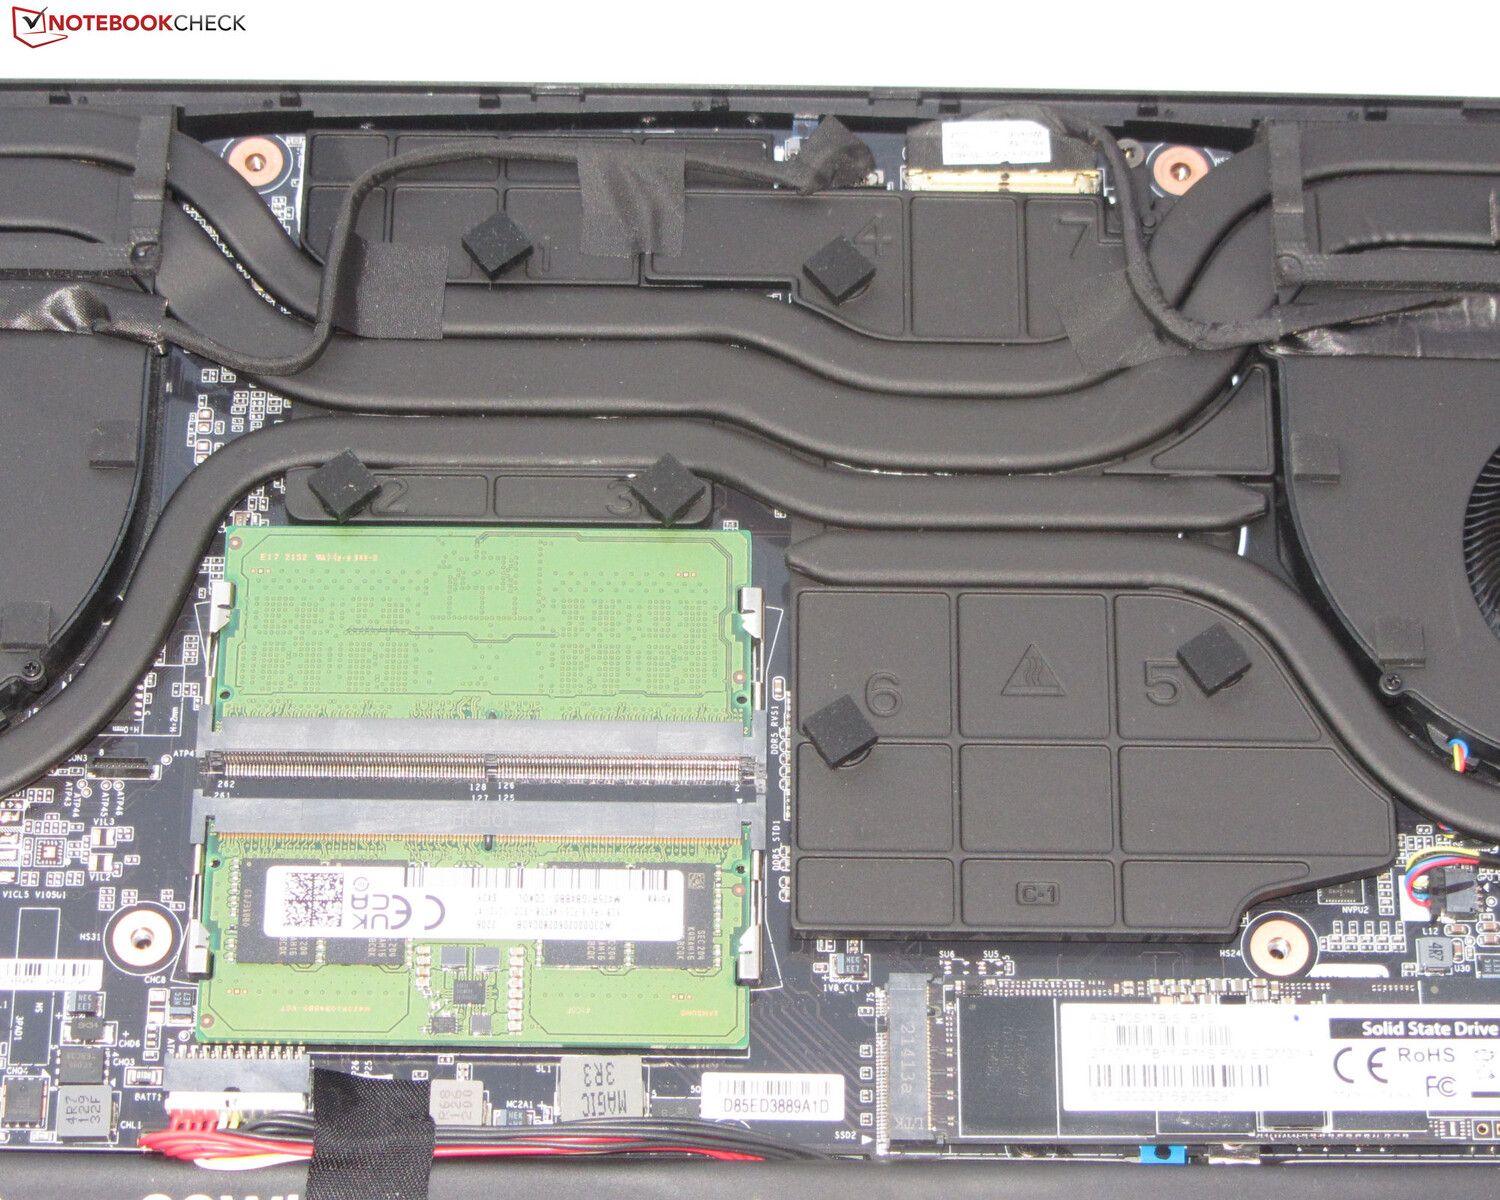
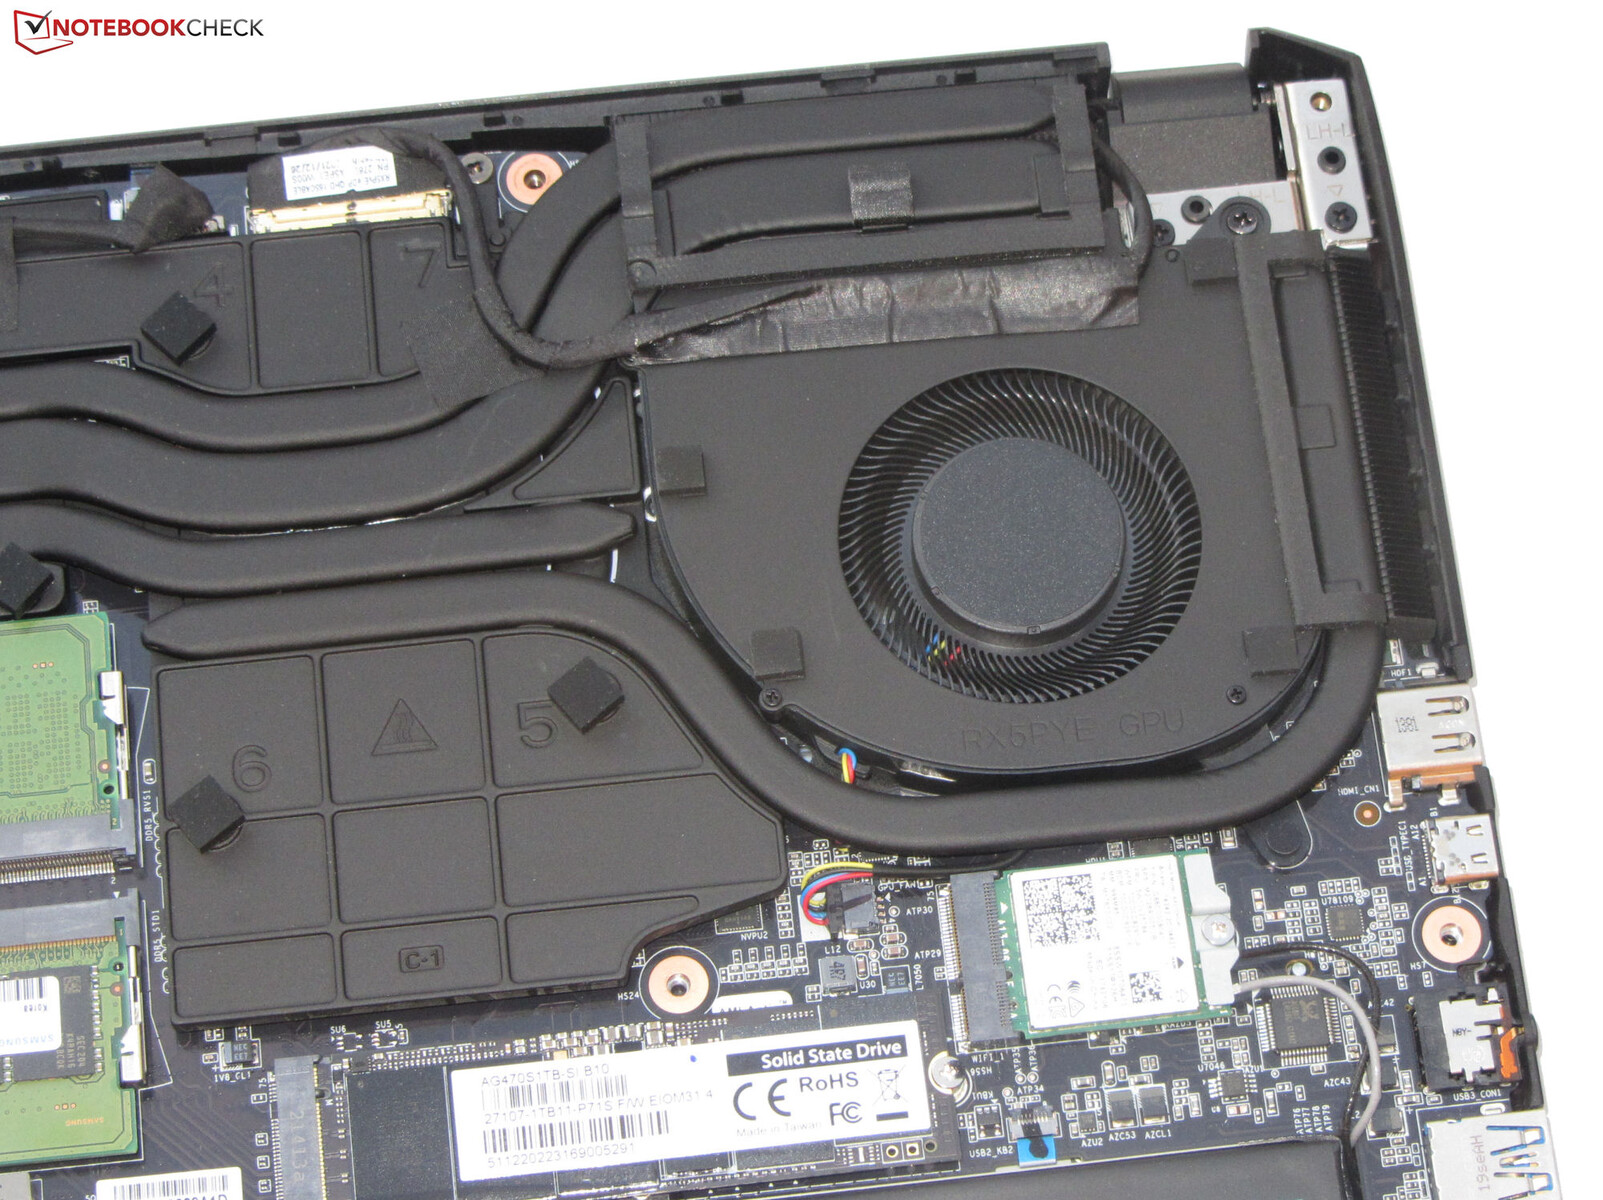
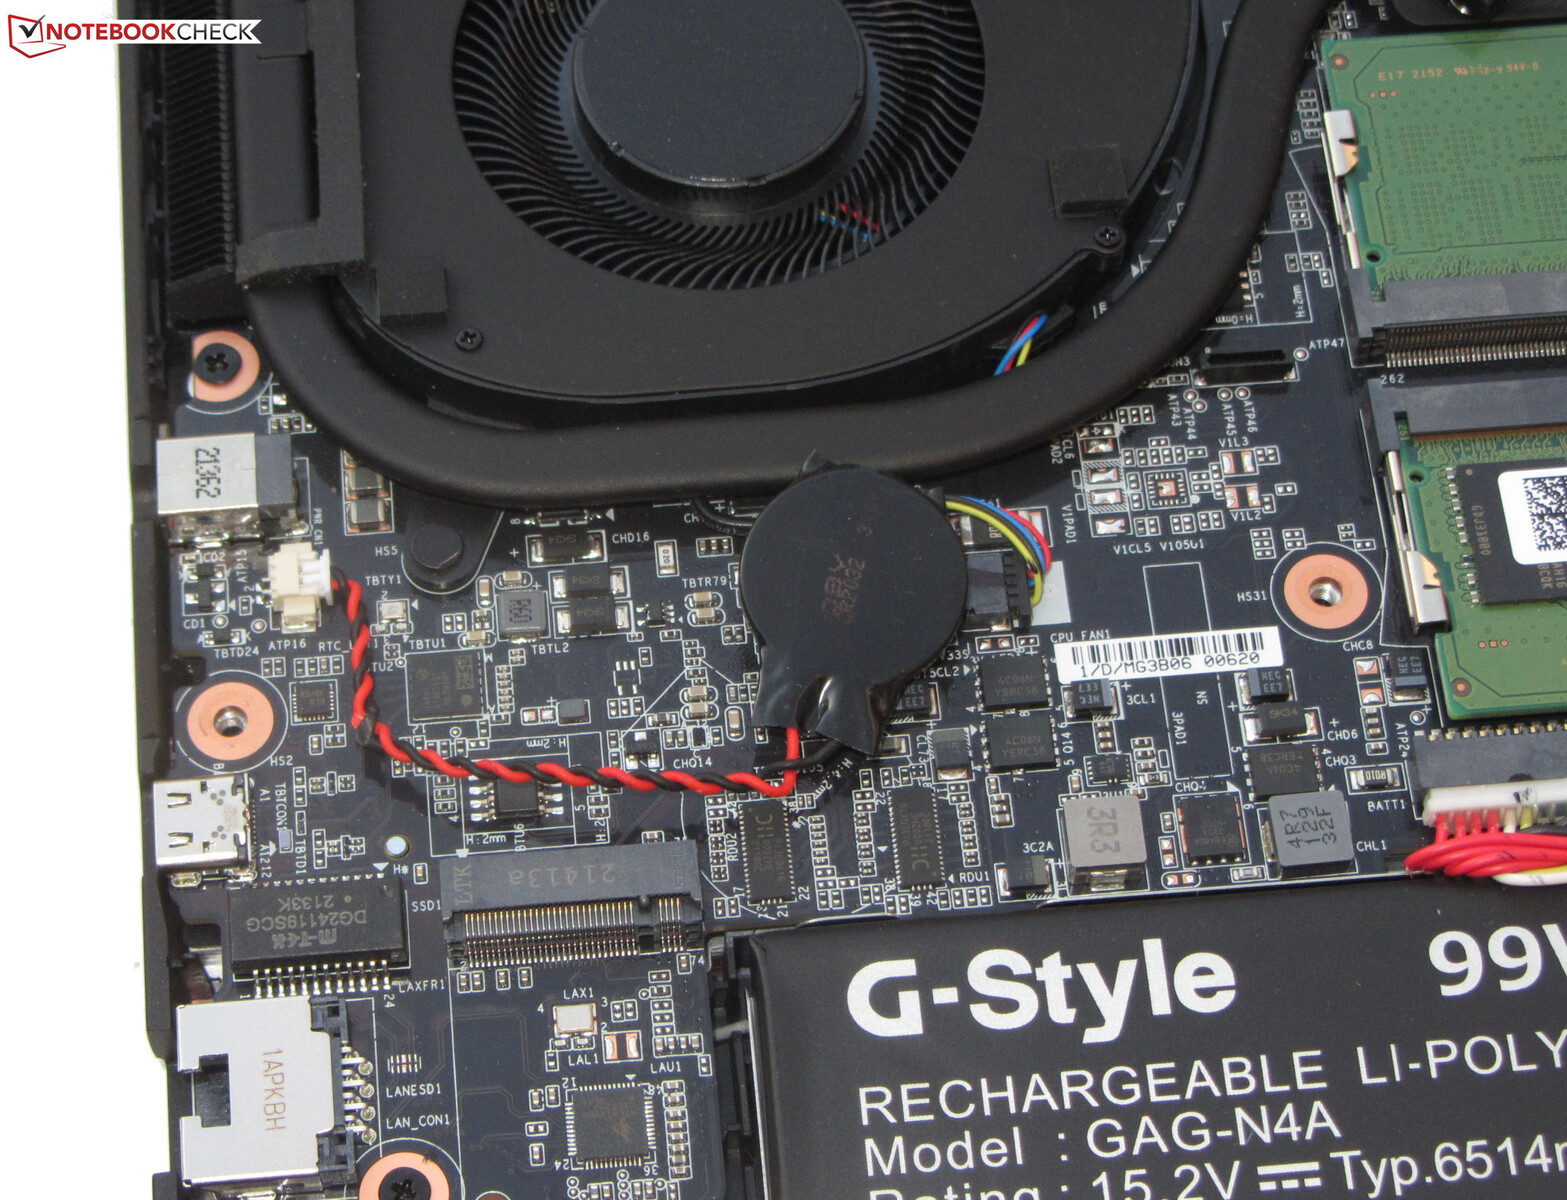
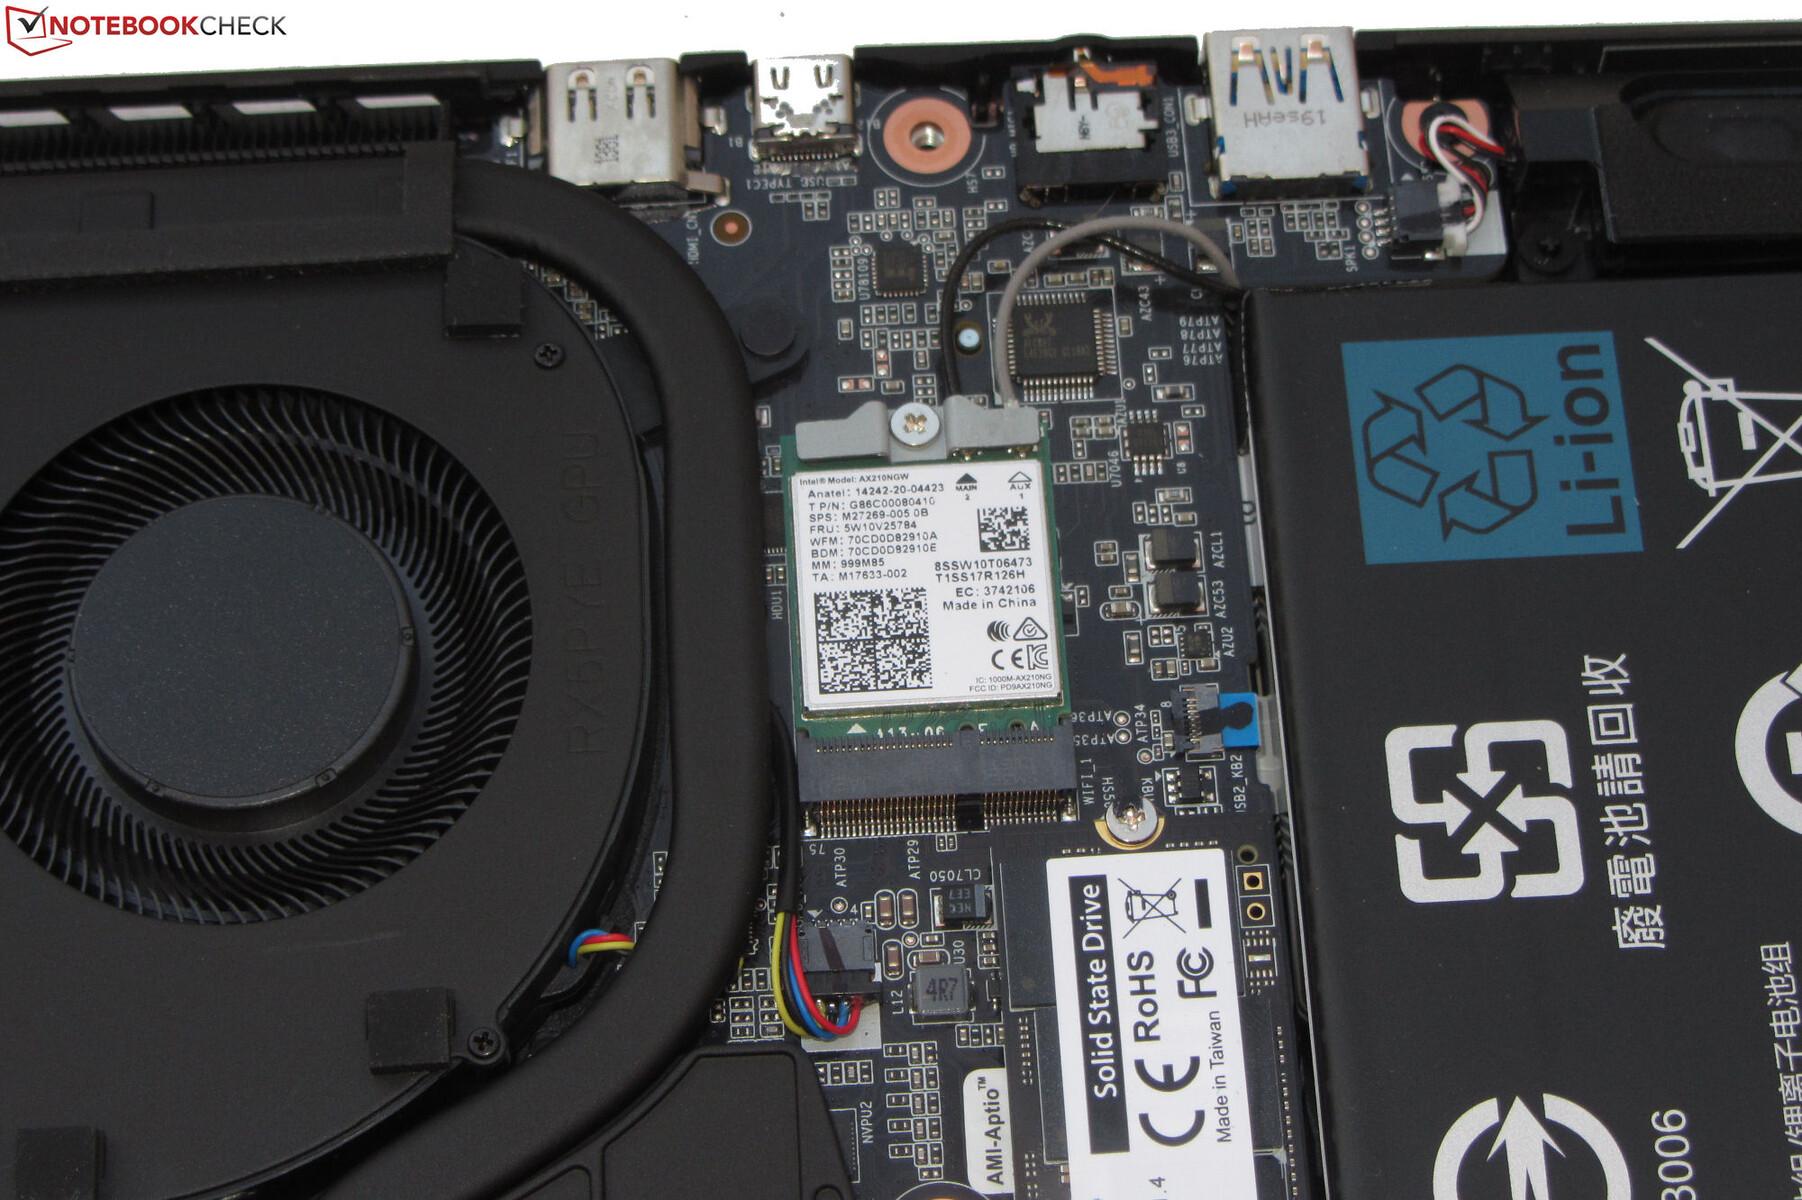
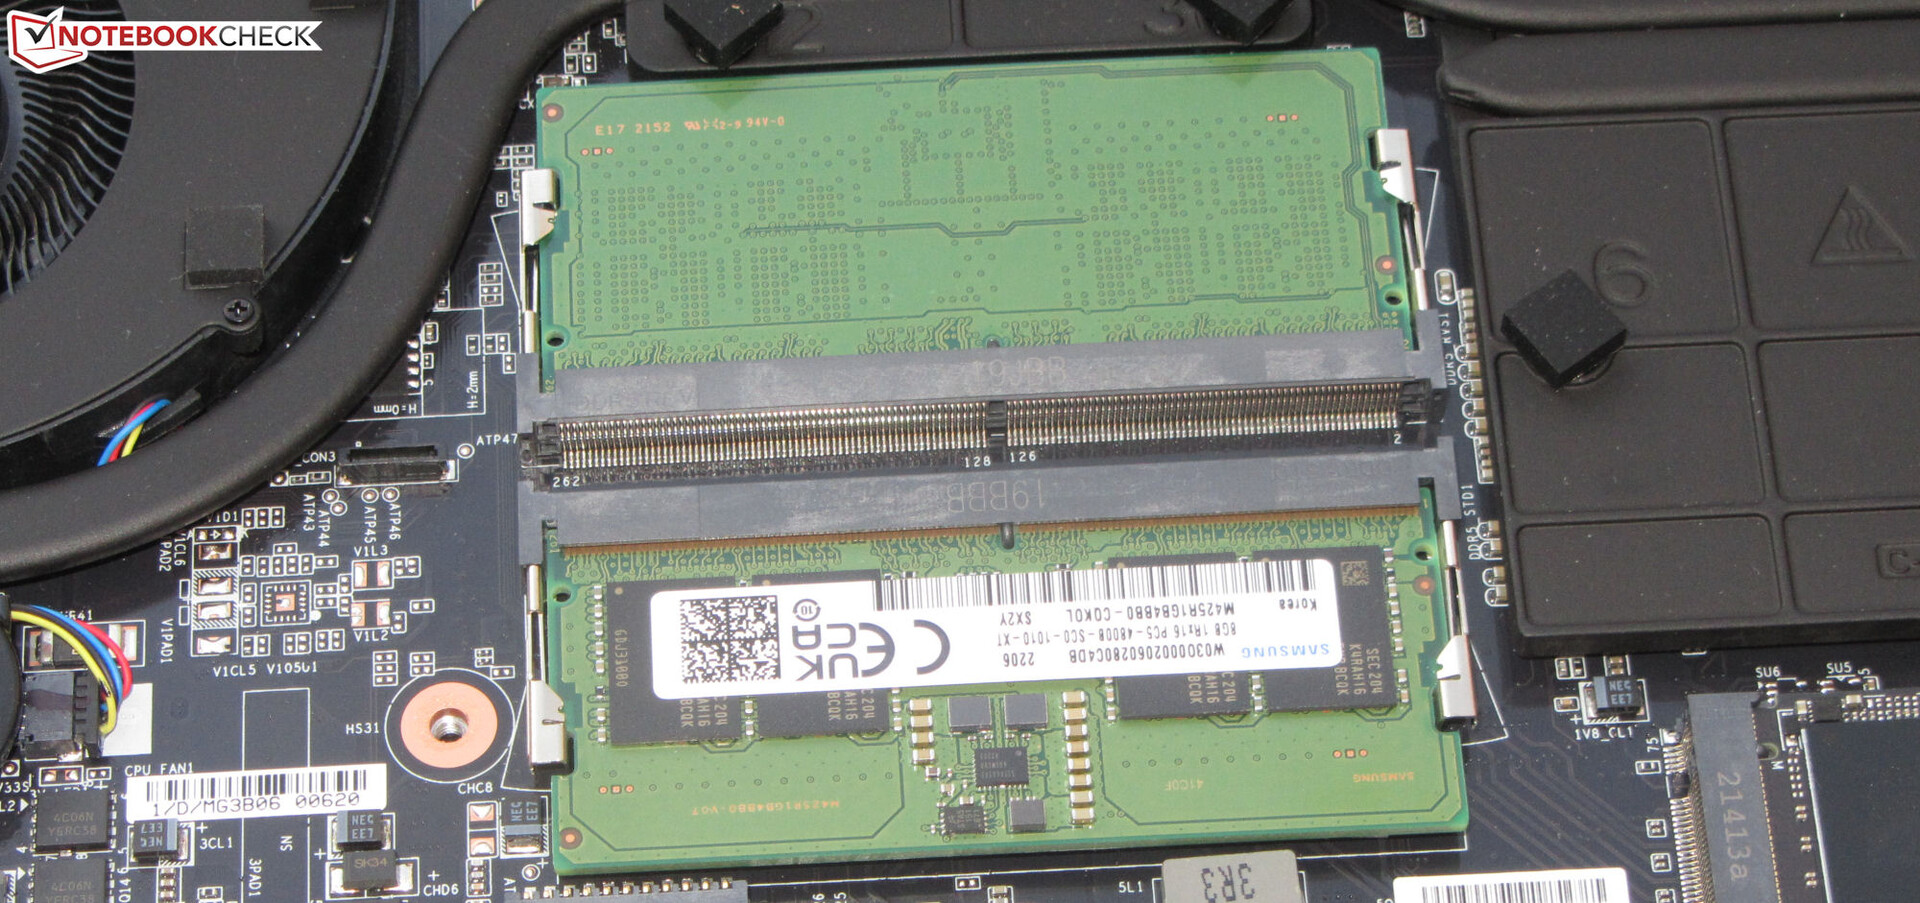
När alla skruvar på undersidan har tagits bort kan bottenpanelen öppnas med hjälp av en platt spottare eller en fogskrapa. När panelen är av har du tillgång till de två RAM-platserna (båda upptagna), PCIe 4.0 SSD, den andra M.2 2280-platsen (PCIe 4.0), BIOS-batteriet, Wi-Fi-modulen, två fläktar, högtalarna och batteriet.
Garanti
I Tyskland ger Gigabyte en tvåårig garanti på den bärbara 15,6-tumsdatorn utan några förlängningsalternativ. Garantiens omfattning och period kan variera beroende på region.
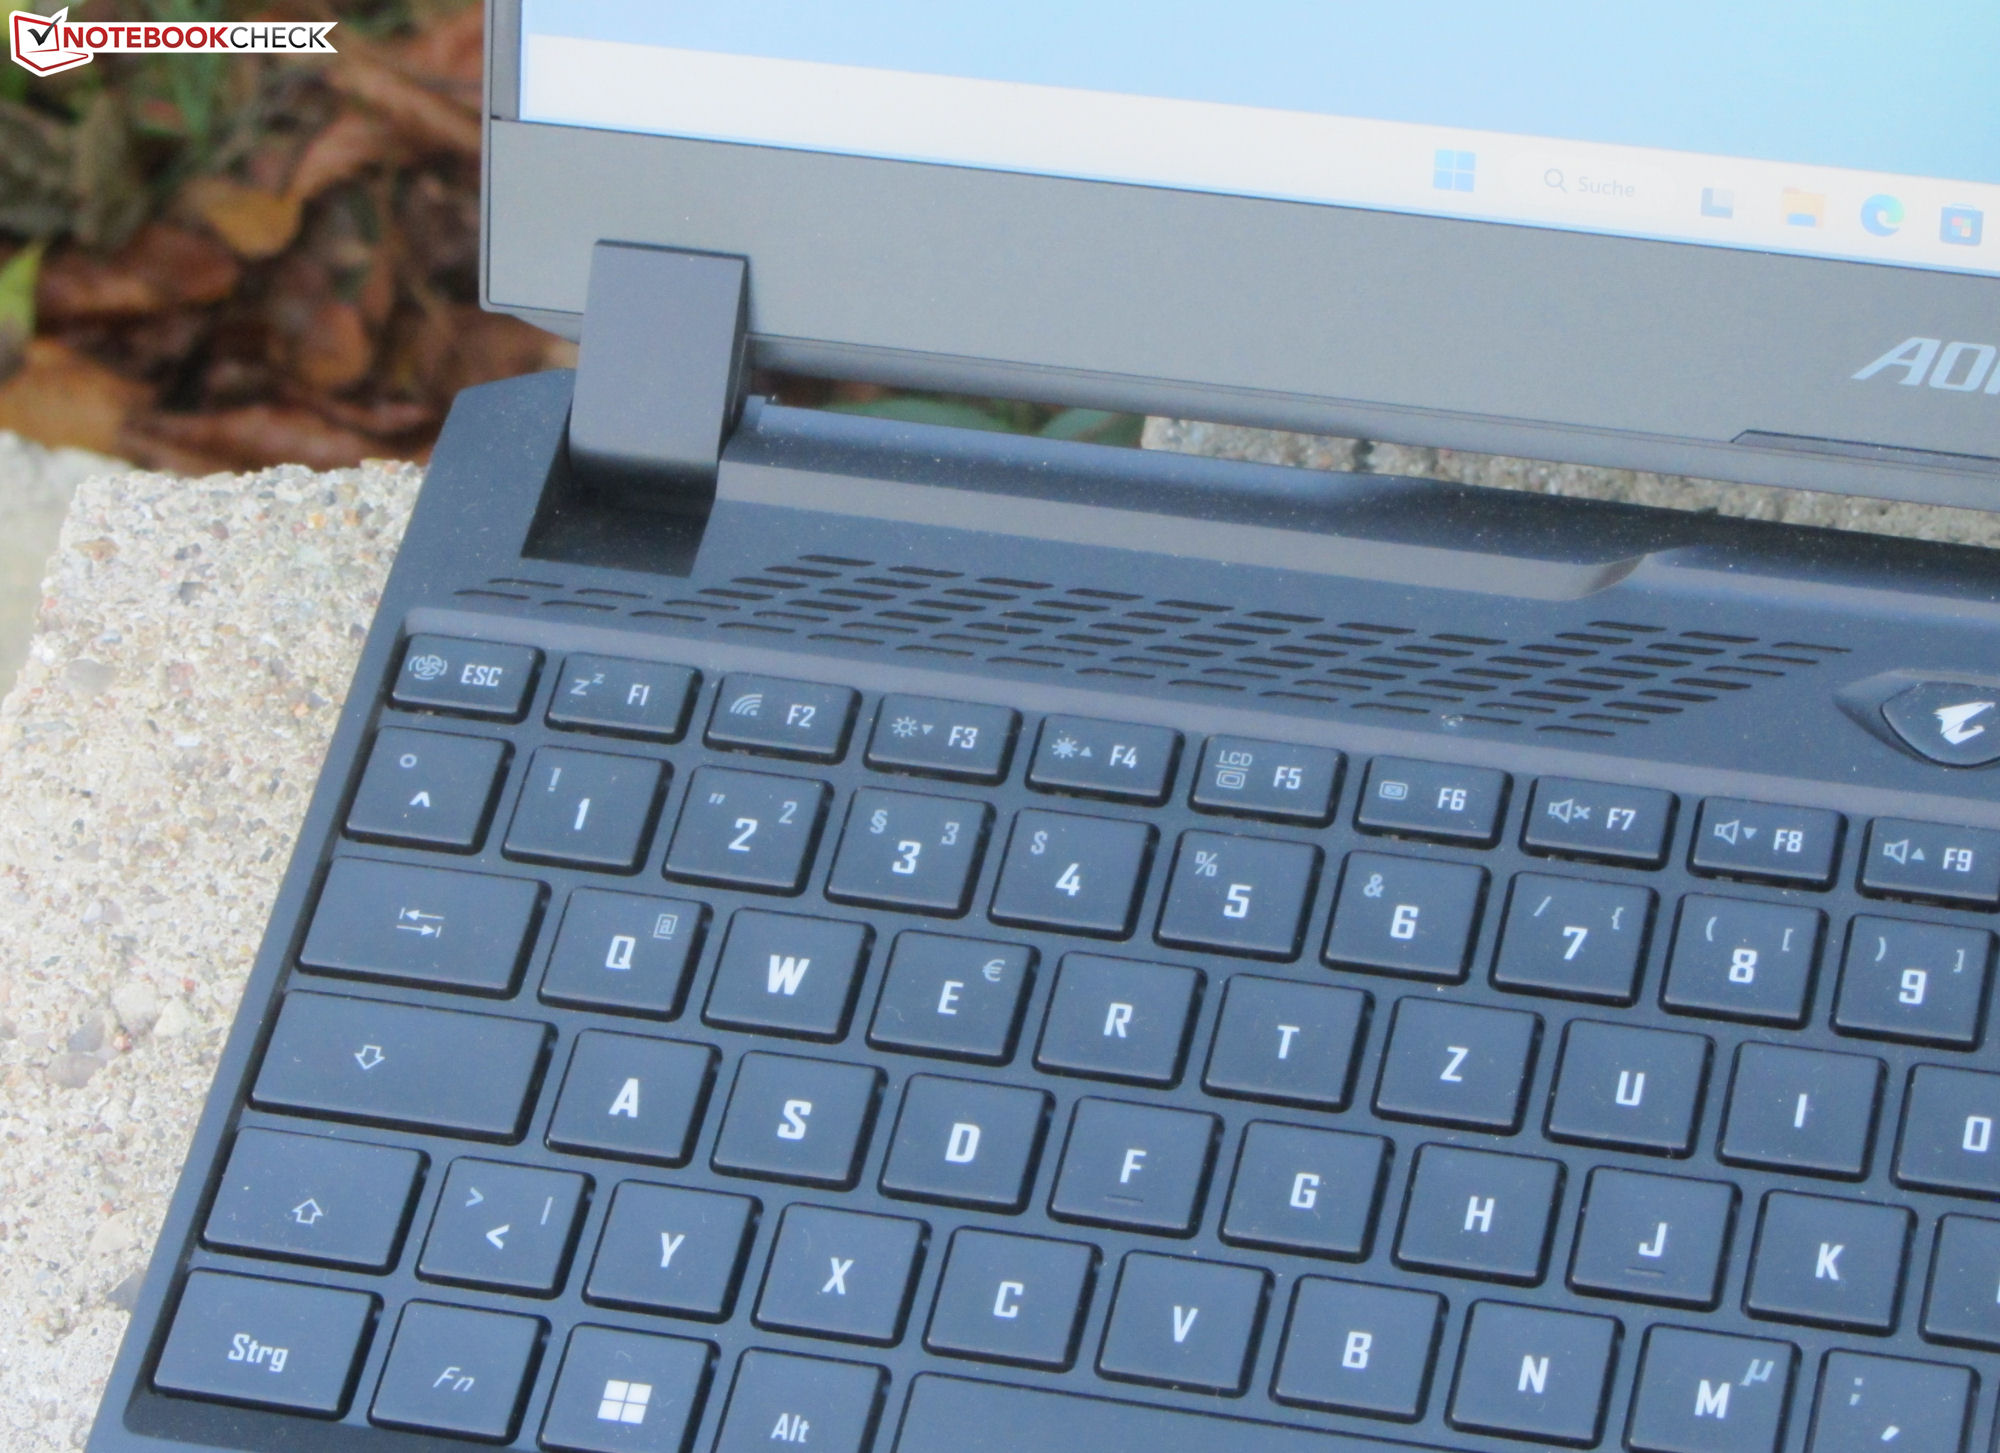
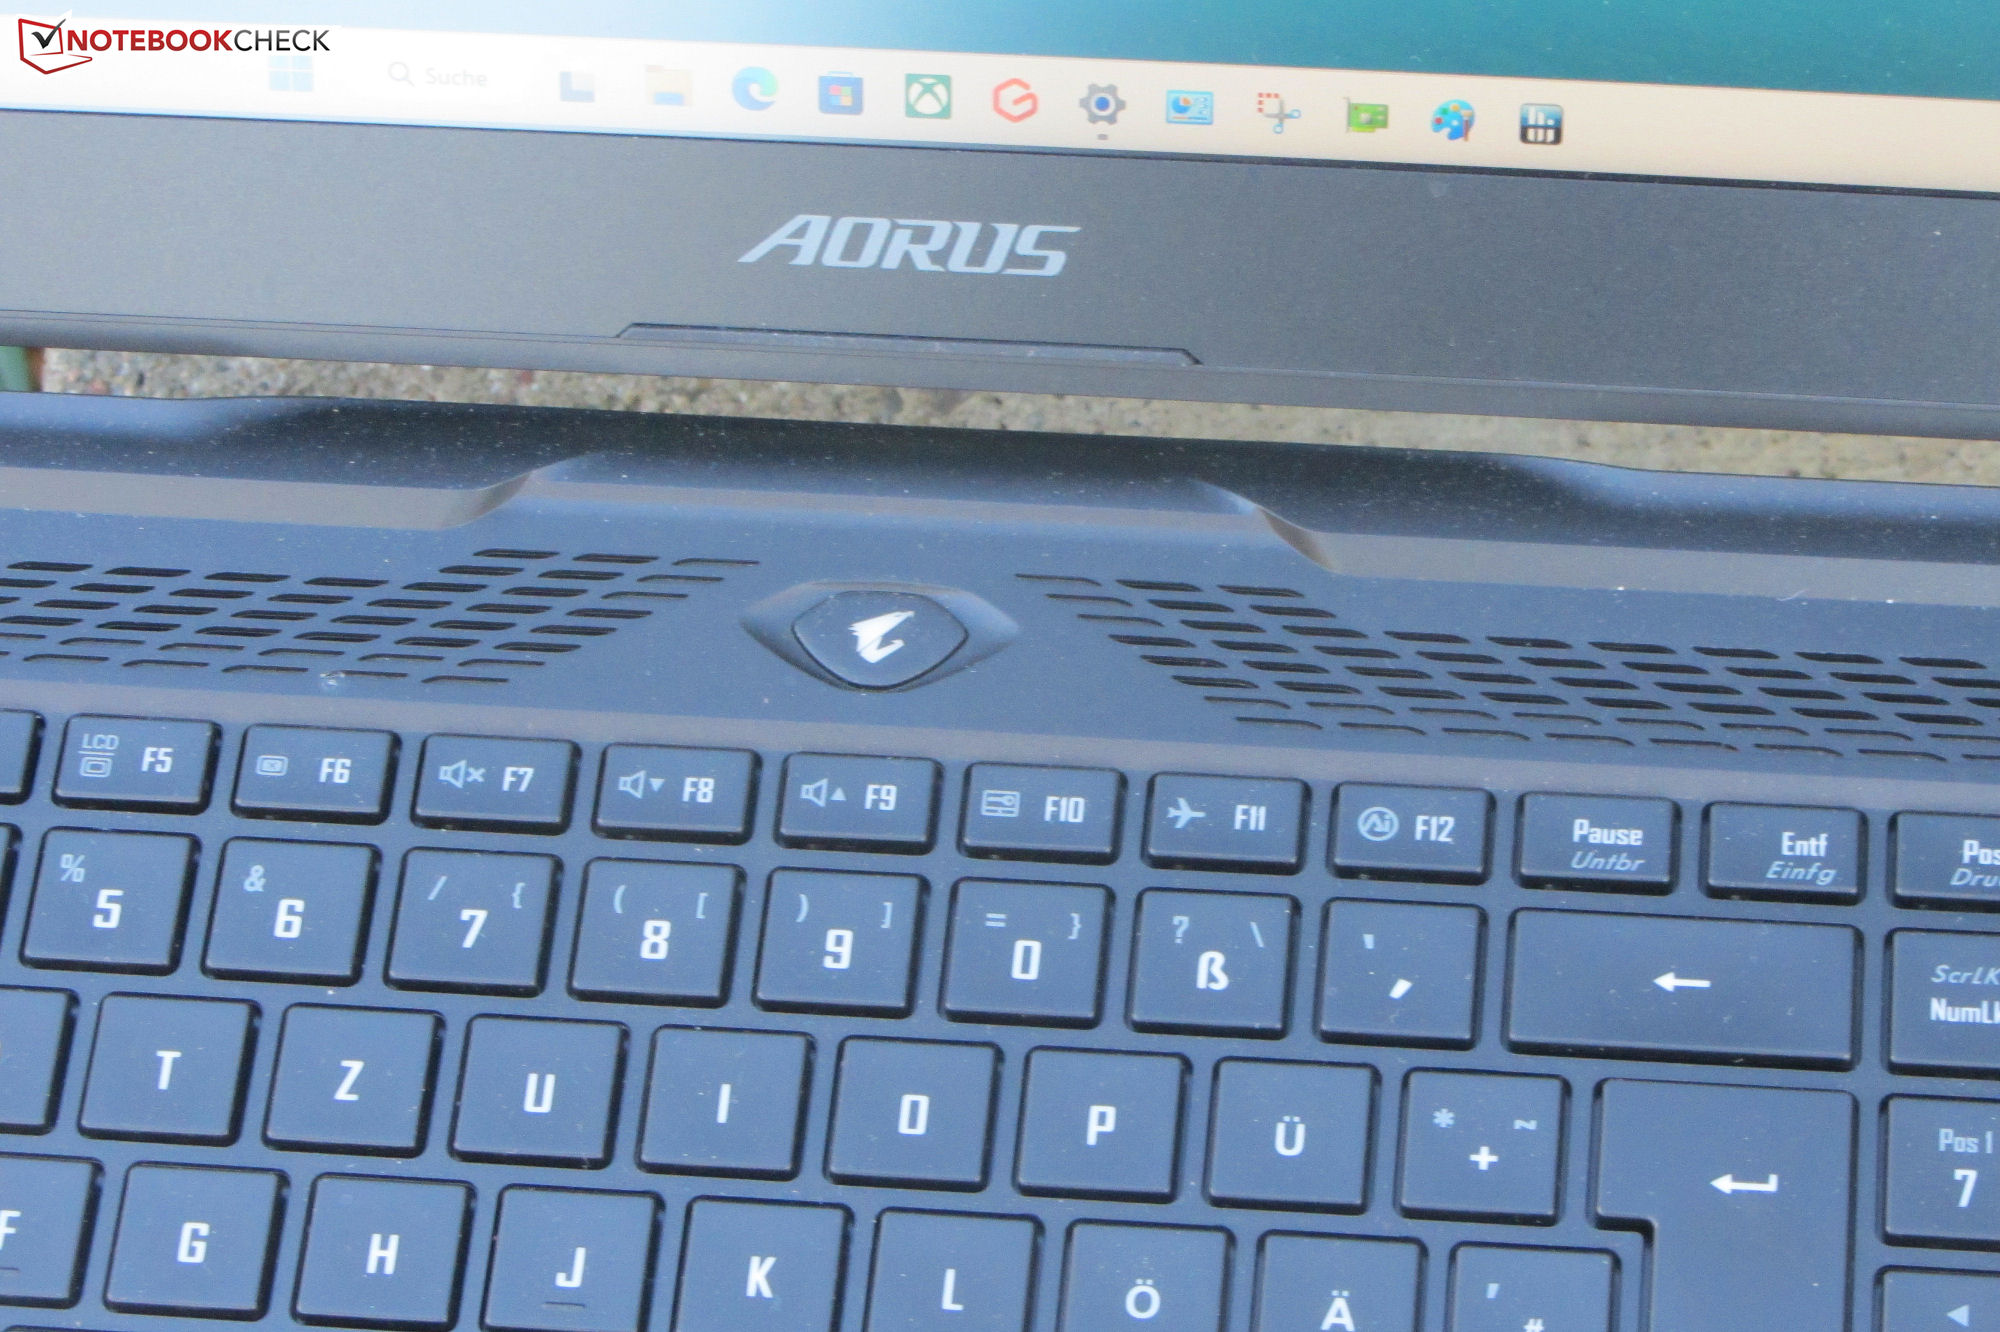
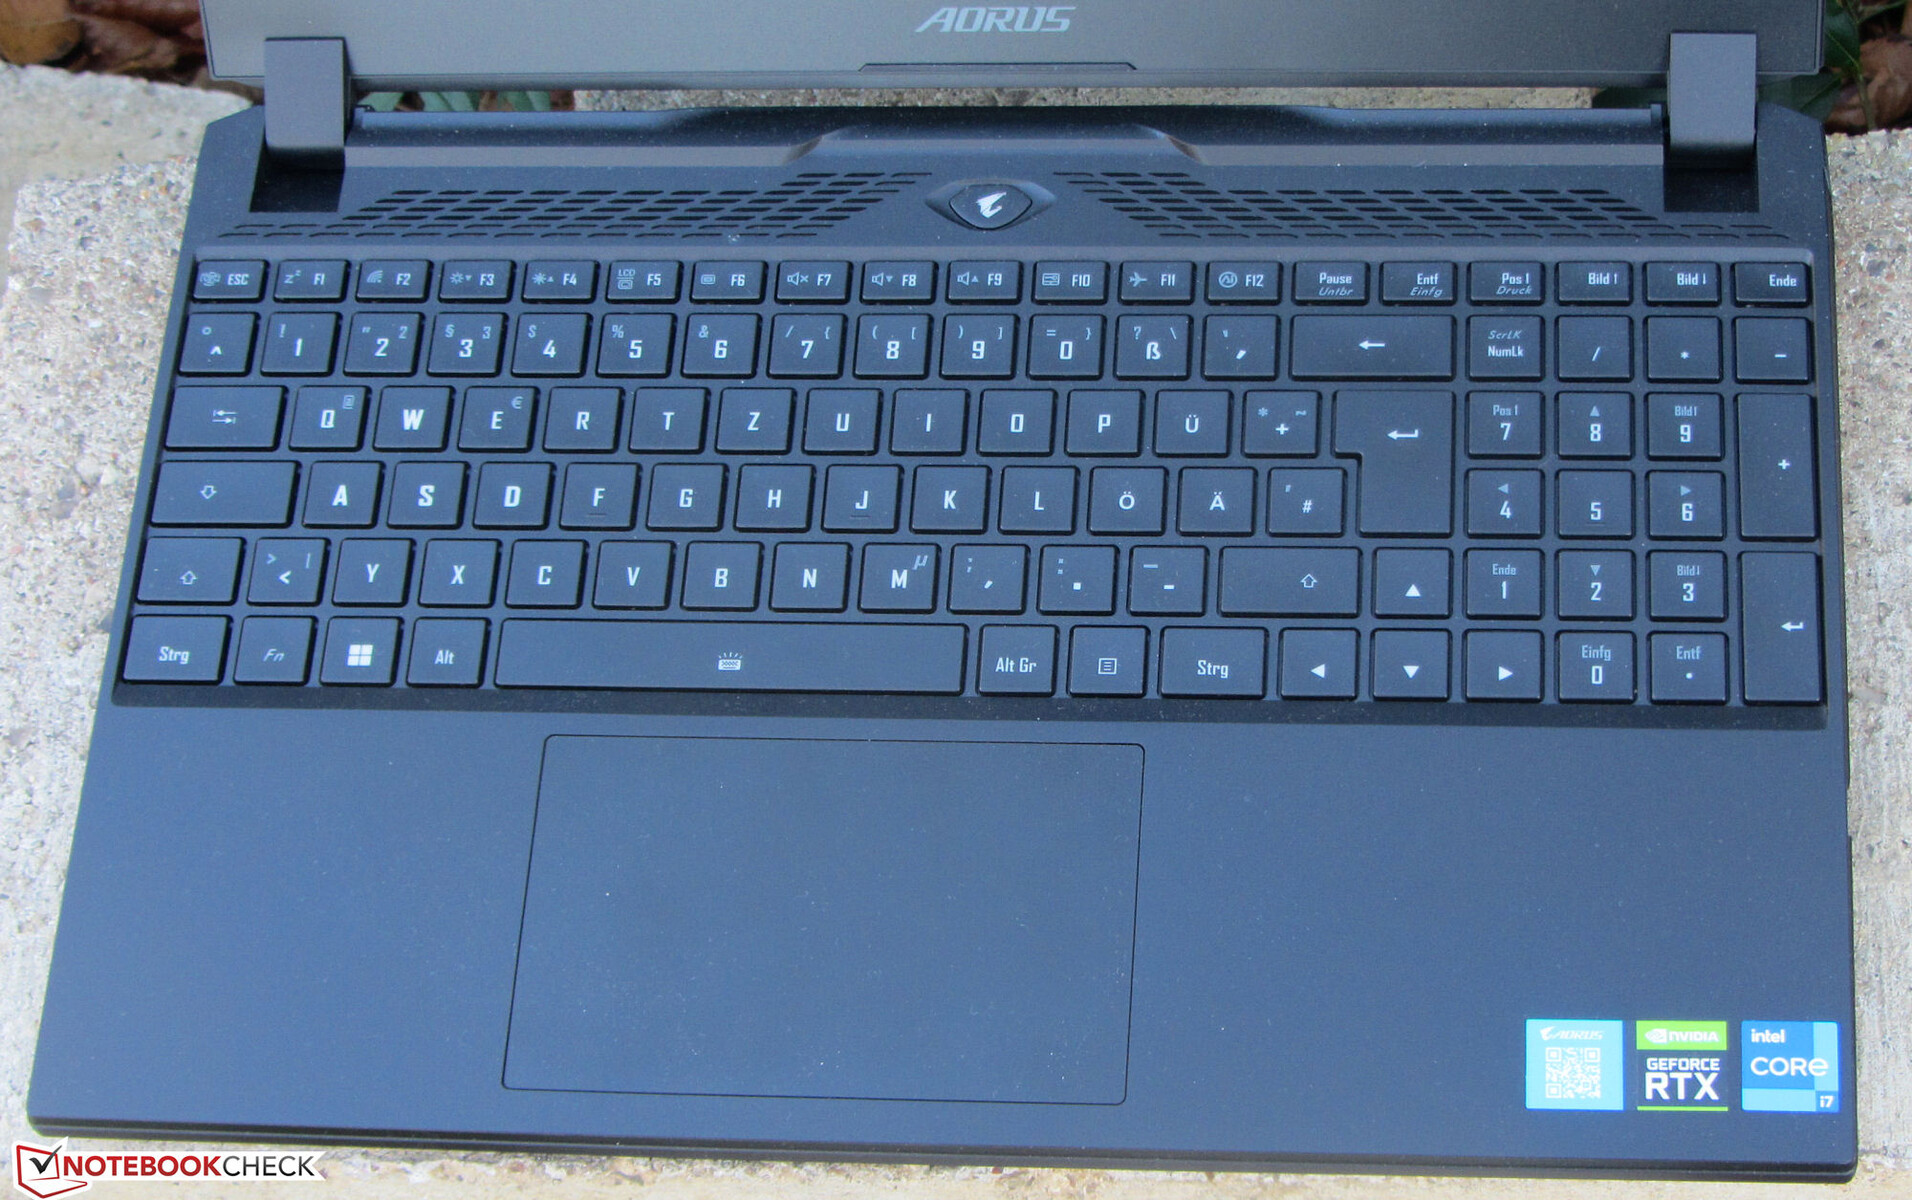
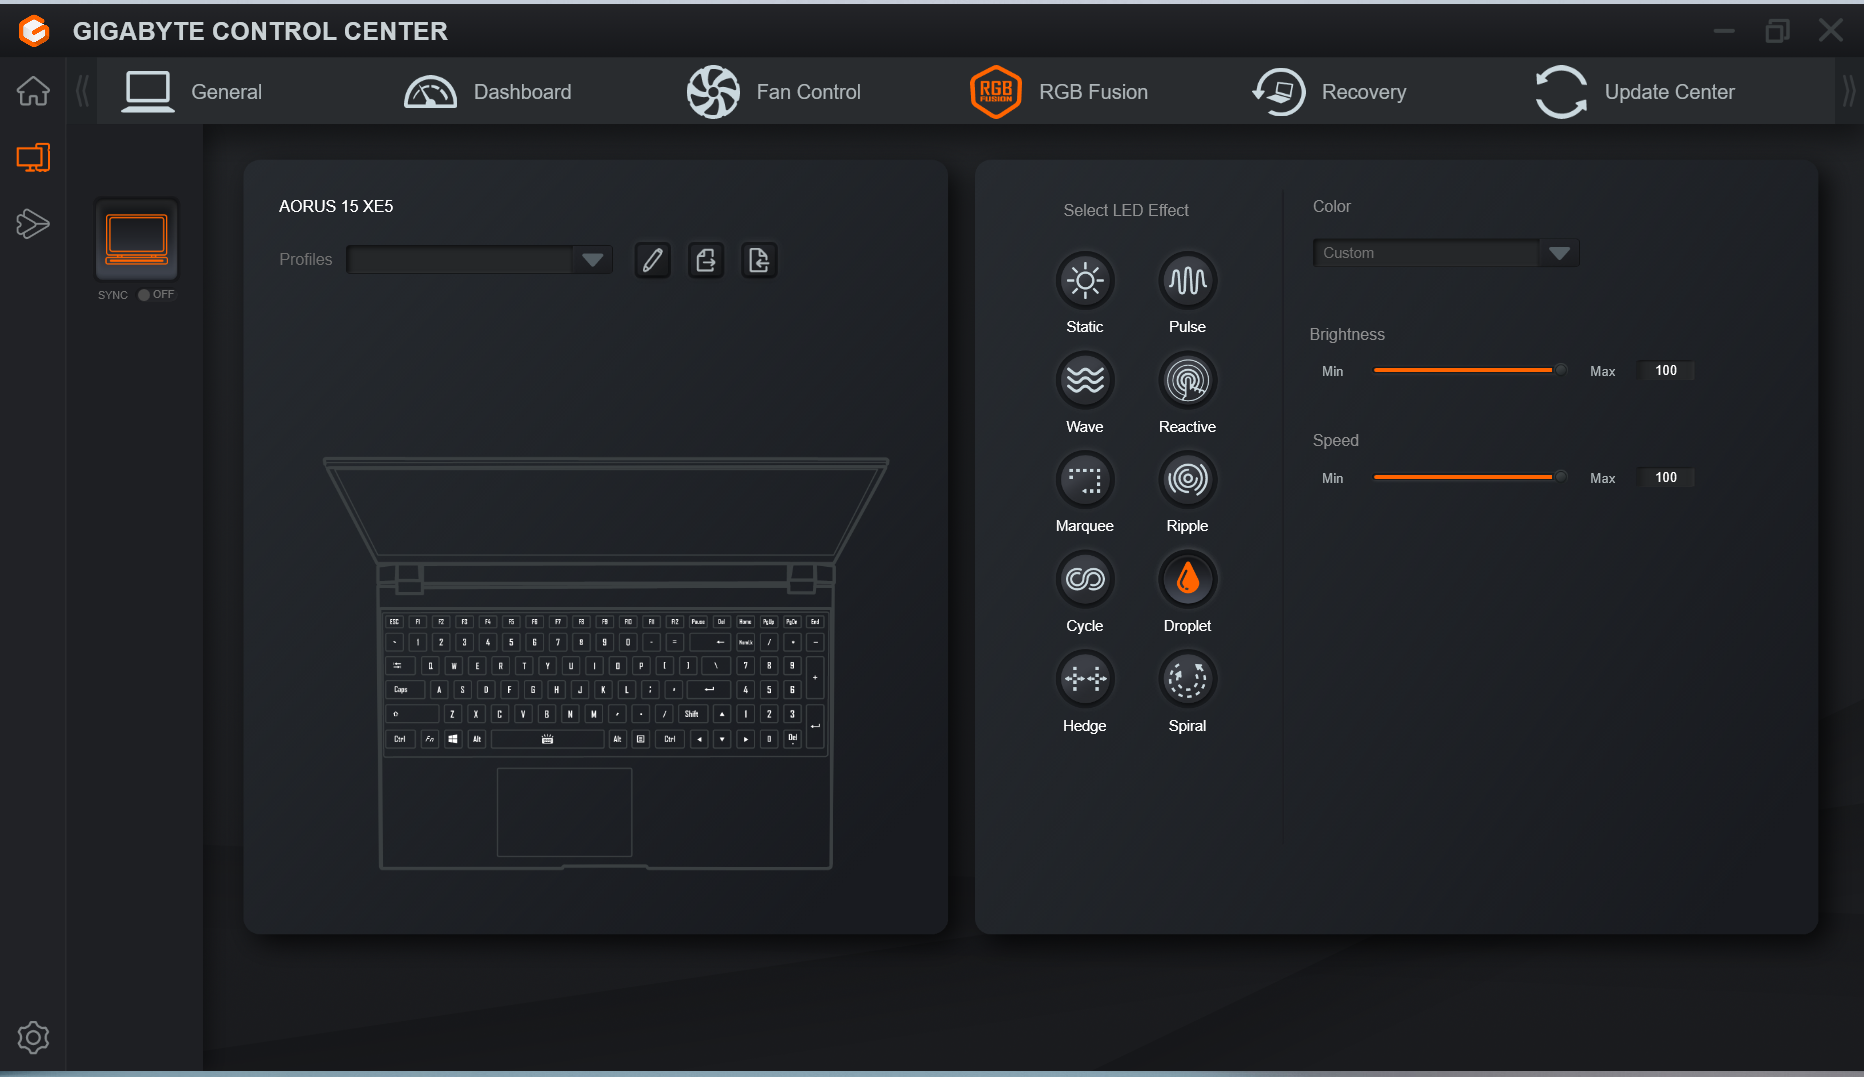
Inmatningsenheter - Individuellt belysta RGB-tangenter
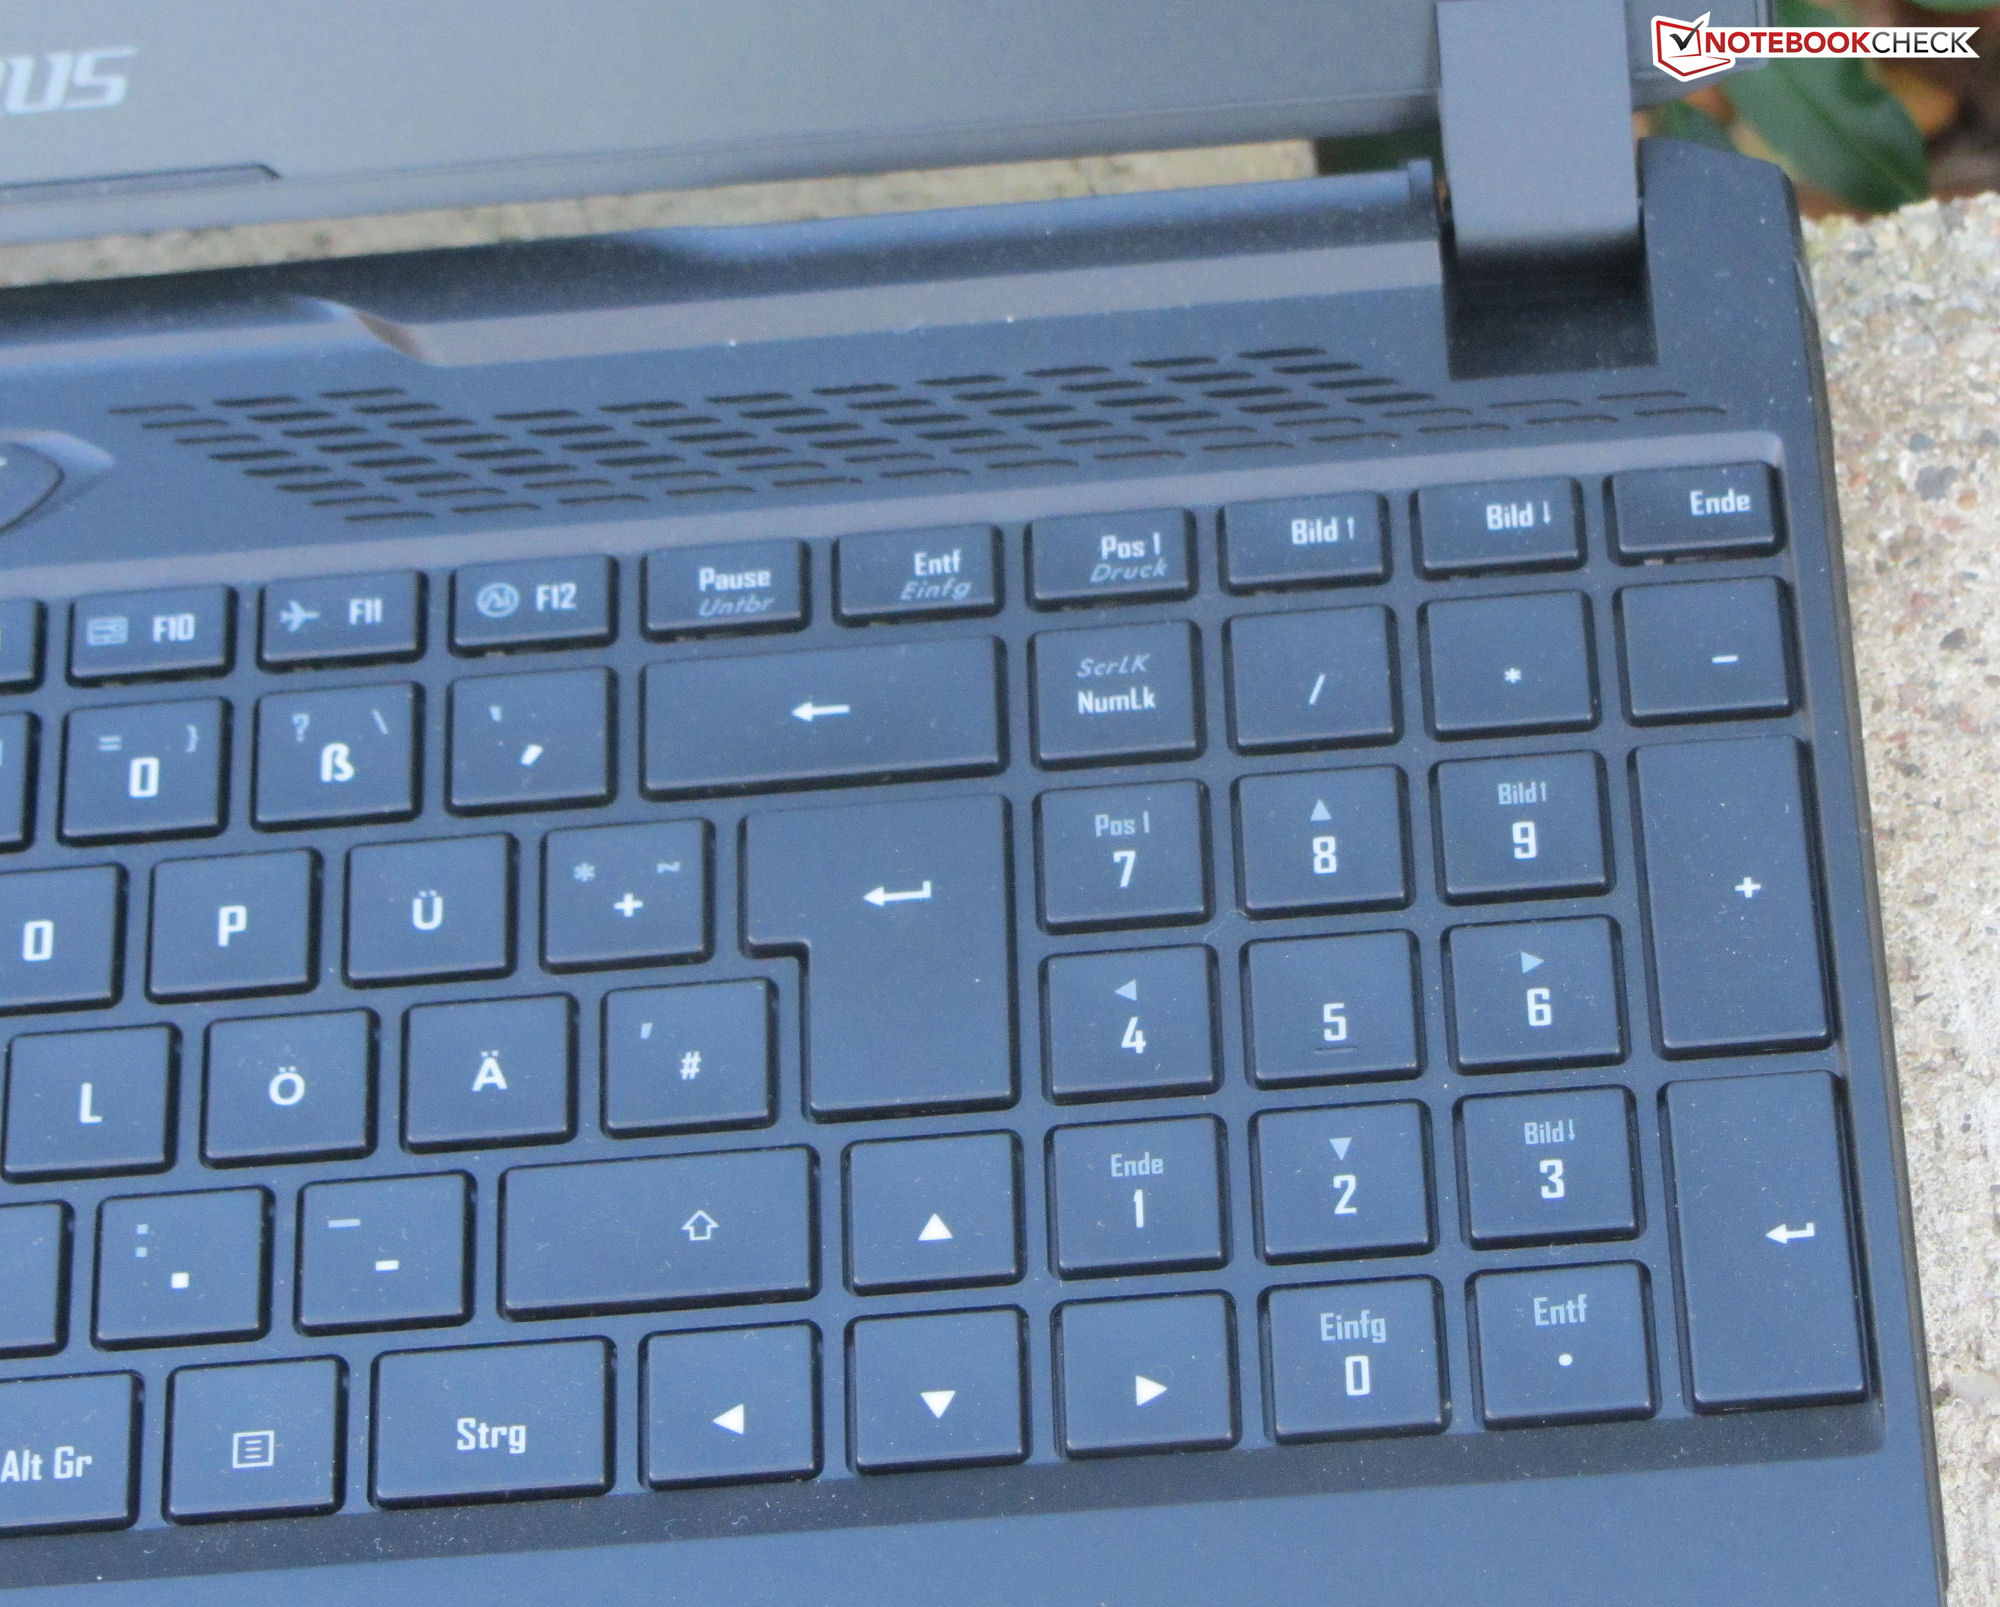
Tangentbord
Den bärbara speldatorn har ett chiclet-tangentbord med en sifferplatta. De mjuka tangenterna har ett måttligt avstånd och en tydlig aktiveringspunkt. Tangentbordet böjs inte när du skriver. Varje tangent är individuellt belyst och har två ljusstyrkor. På det hela taget har Gigabyte levererat ett tangentbord som passar för vardagligt bruk.
Pekplatta
Den bärbara datorns multitouch-klickplatta (ca 12,1 x 7,6 cm) har en slät yta som gör det lätt att föra fingrarna över. Den är känslig för inmatningar även i hörnen och har ett grunt klick och en tydlig aktiveringspunkt.
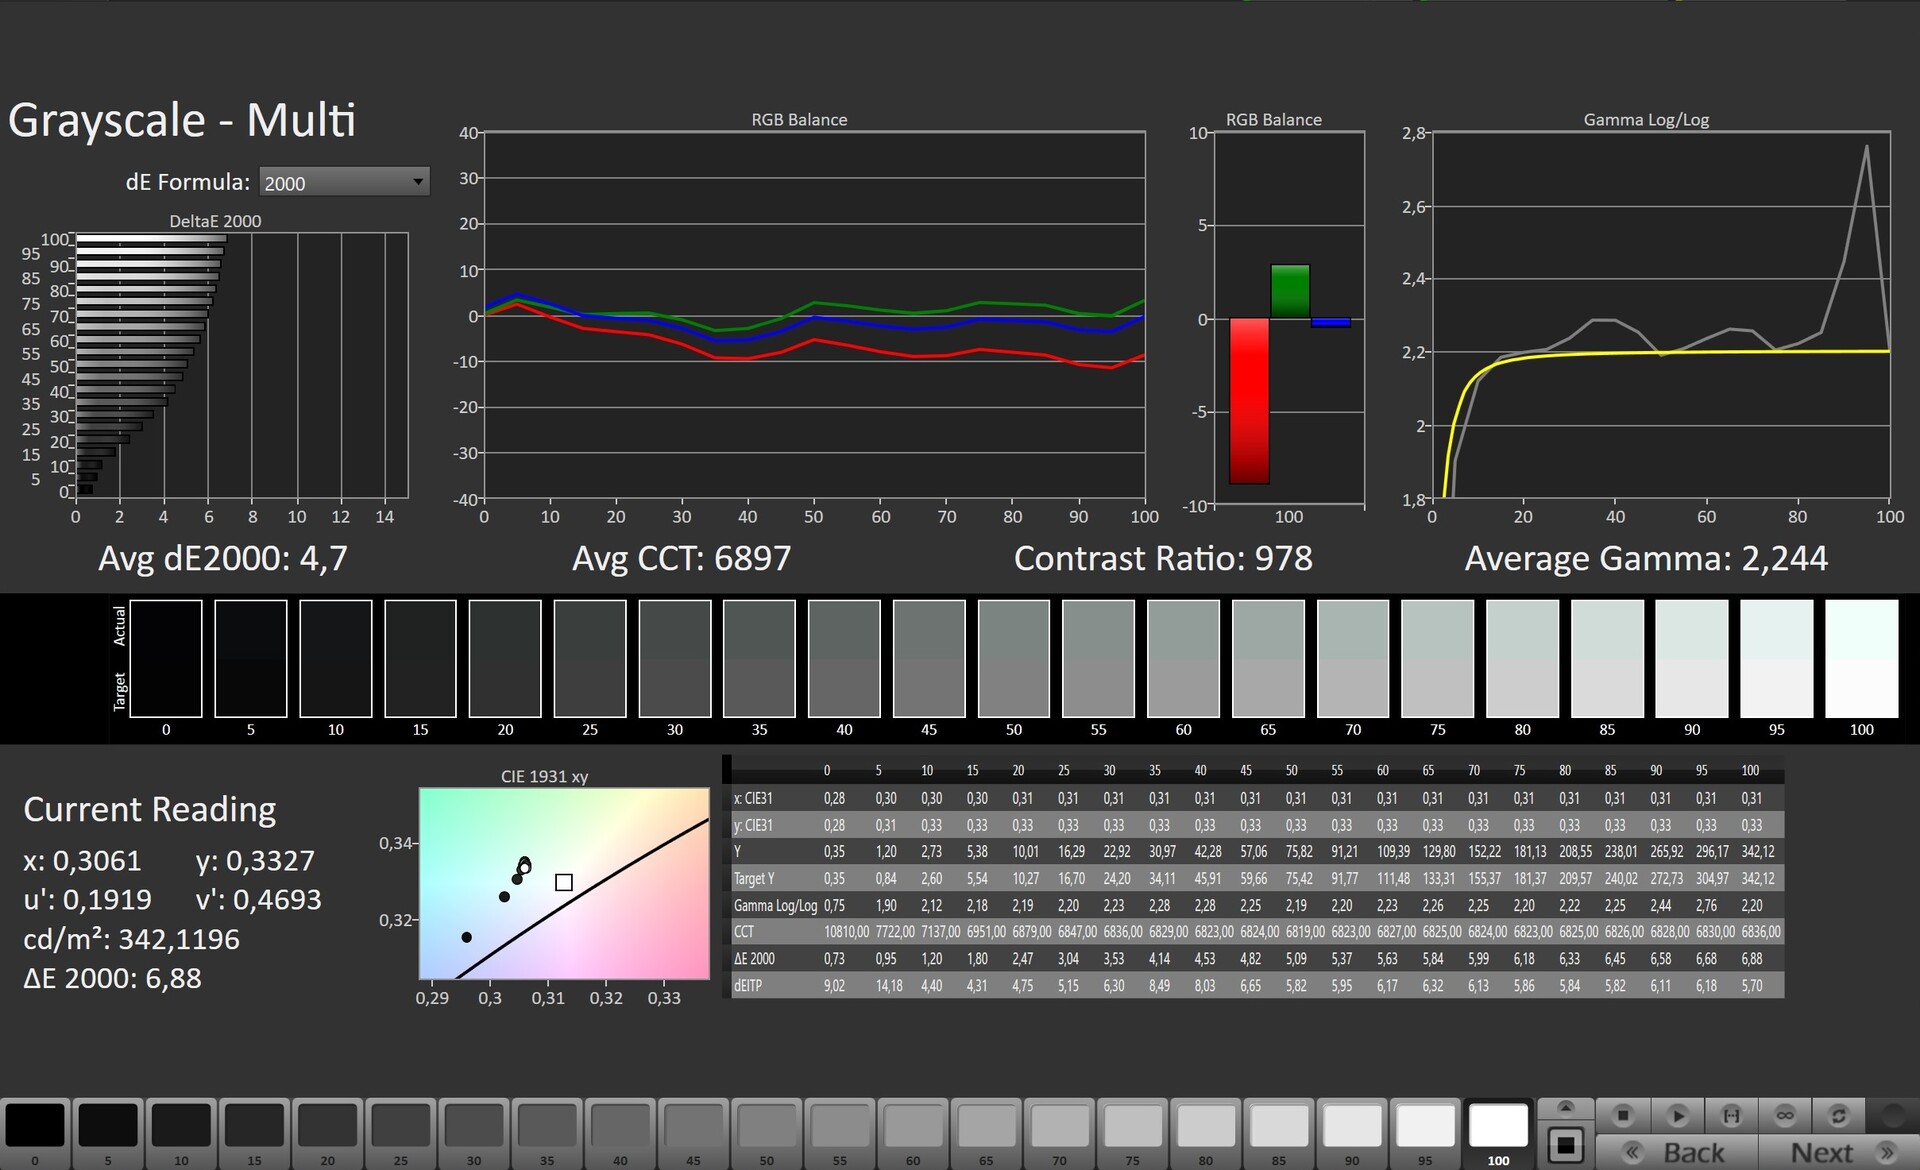
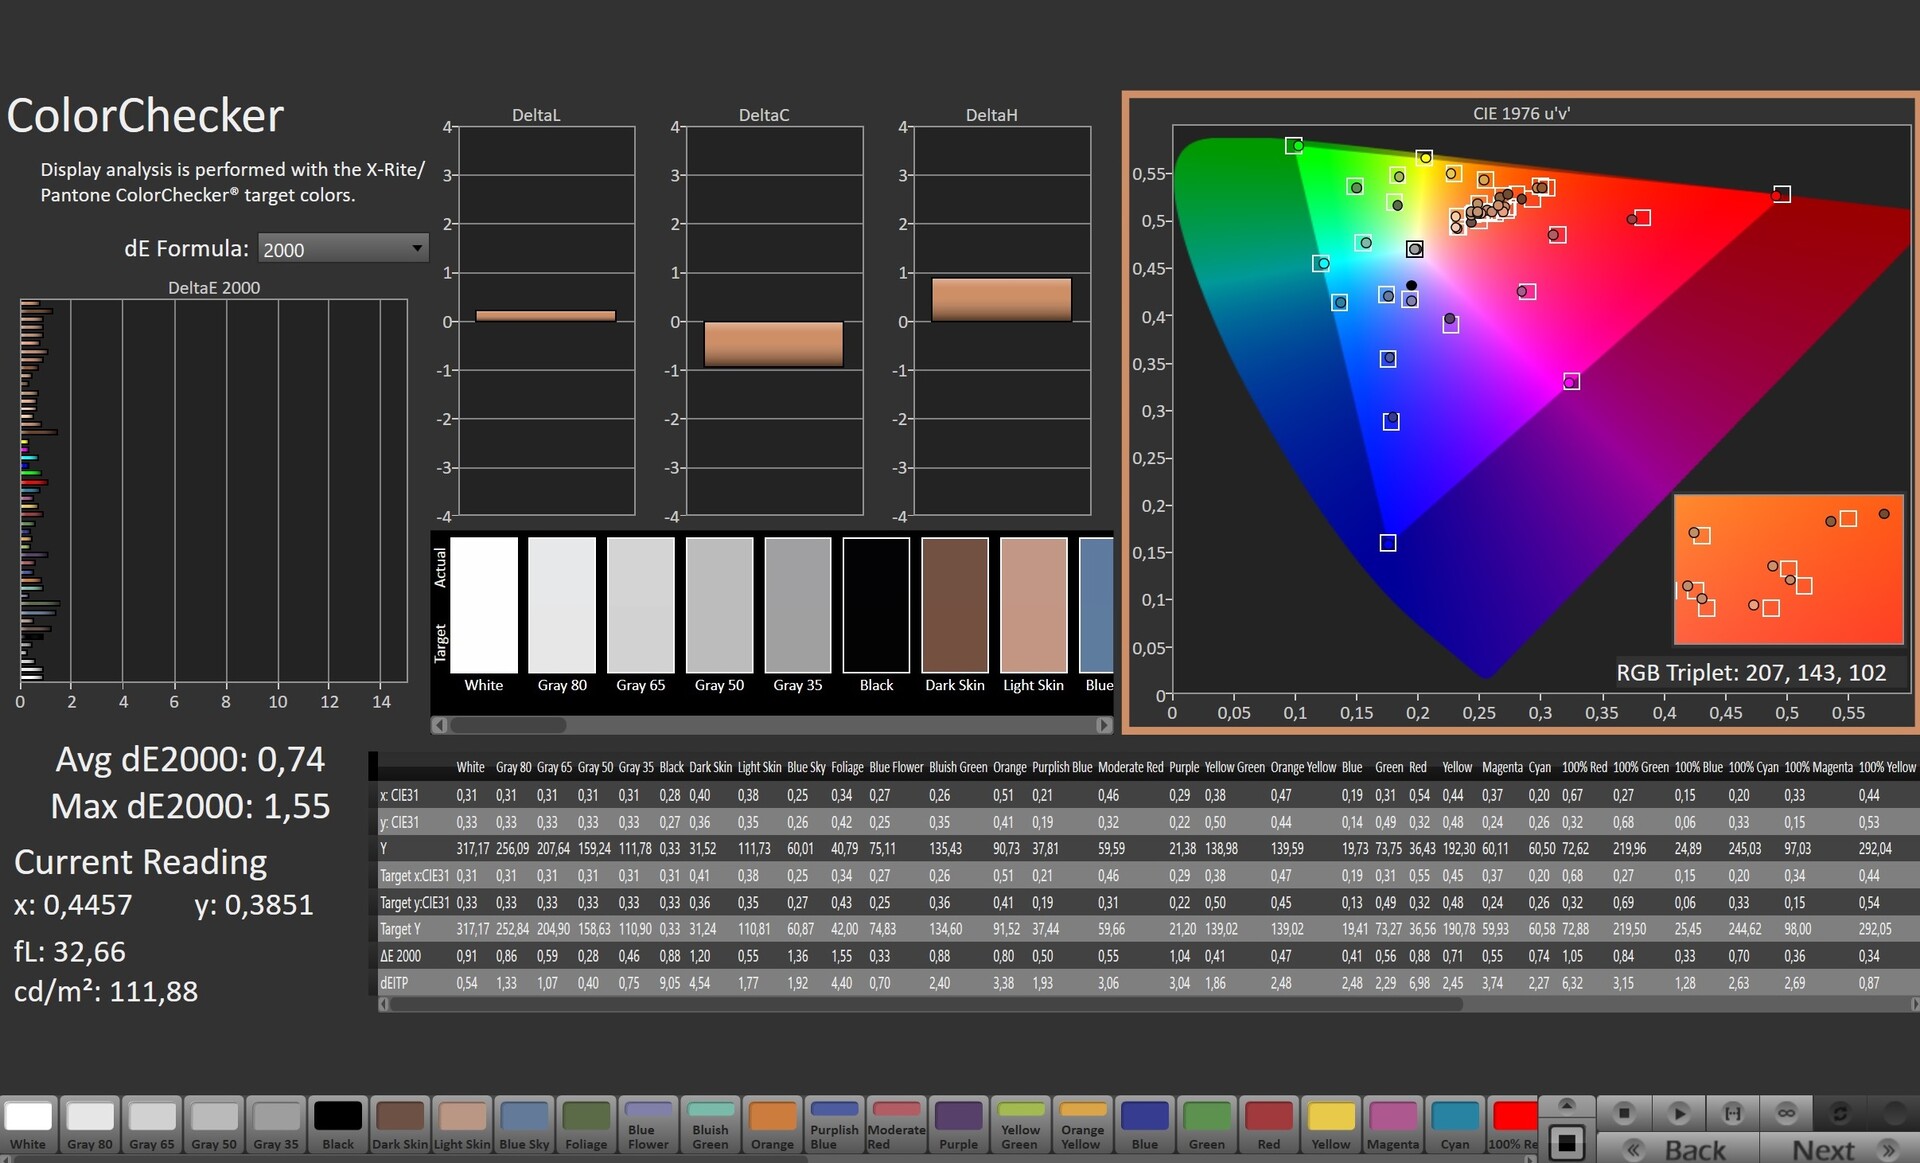
Display - Bra färgtäckning
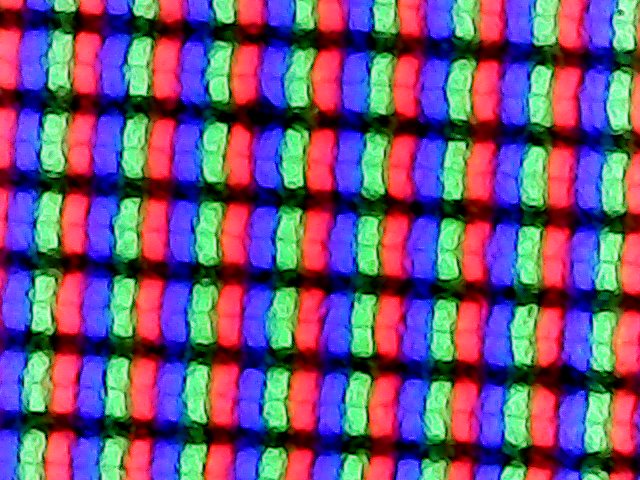
Den bärbara datorn är utrustad med en 165 Hz-panel med hög respons som inte uppvisar något PWM-flimmer. Den 15,6-tums matta skärmen (2 560 x 1 440 pixlar) kan bli acceptabelt ljusstark (>300 cd/m²), men kontrasten (988:1) ligger under vad som anses vara bra (>1 000:1). Situationen är den omvända med några av konkurrenterna. Endast Nitro har en skärm som klarar sig bra på båda avdelningarna.
| |||||||||||||||||||||||||
Distribution av ljusstyrkan: 89 %
Mitt på batteriet: 336 cd/m²
Kontrast: 988:1 (Svärta: 0.34 cd/m²)
ΔE ColorChecker Calman: 3.36 | ∀{0.5-29.43 Ø4.71}
calibrated: 0.74
ΔE Greyscale Calman: 4.7 | ∀{0.09-98 Ø4.96}
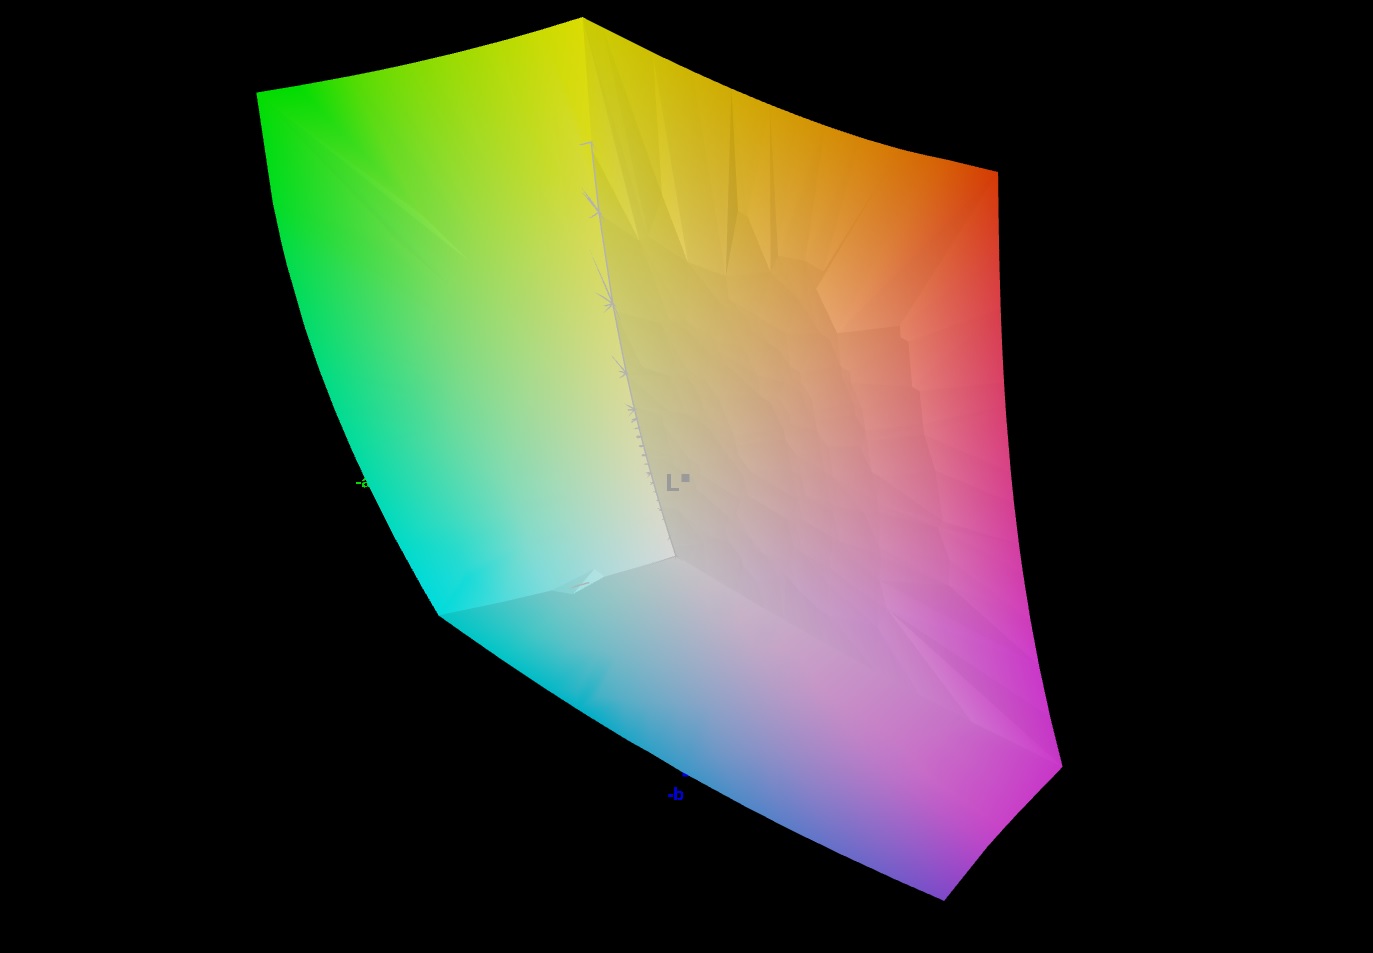
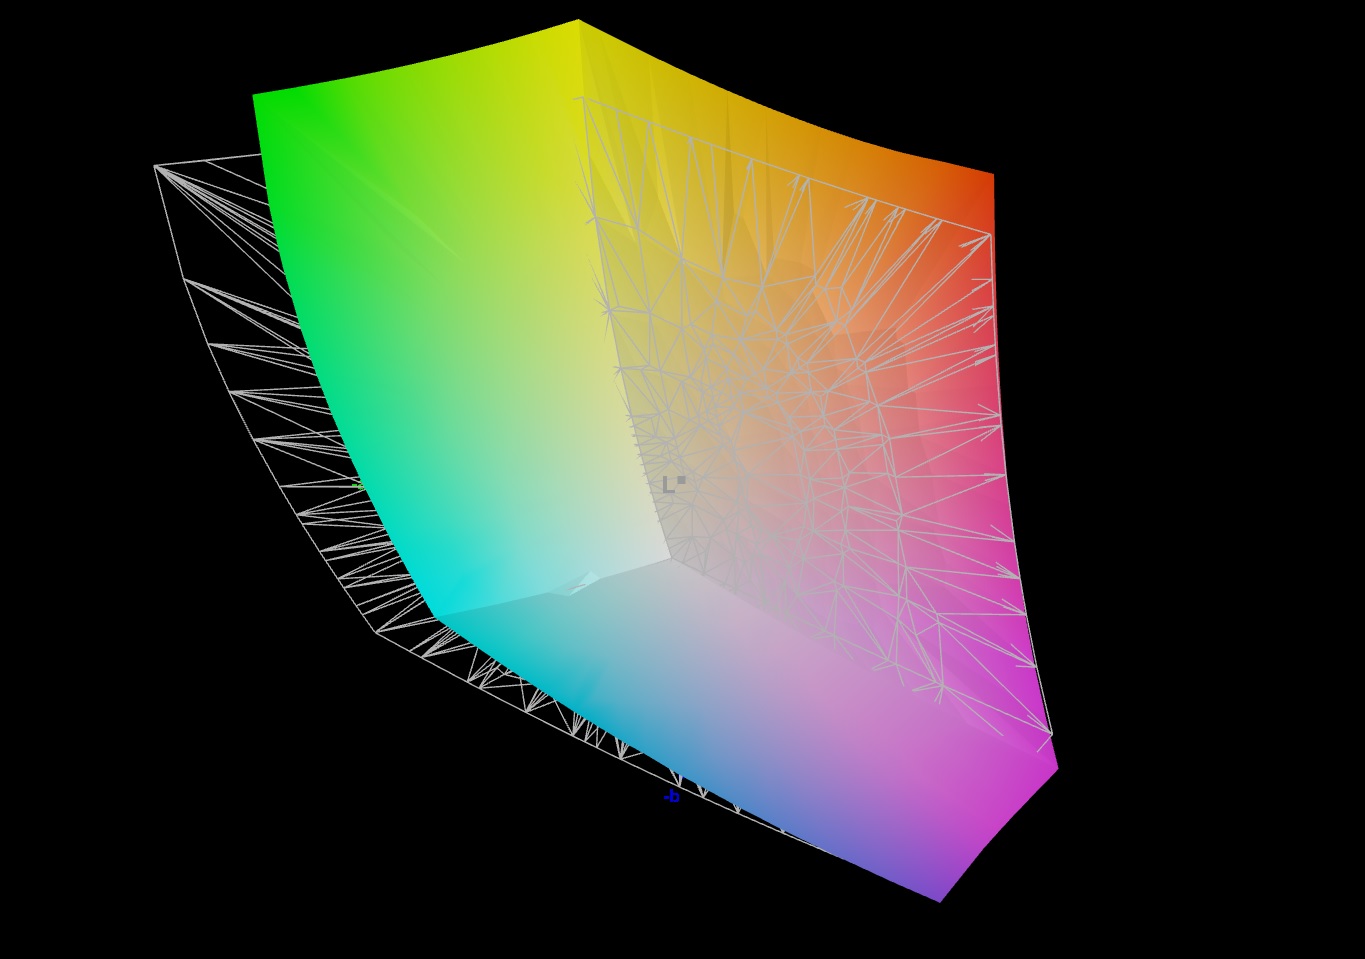
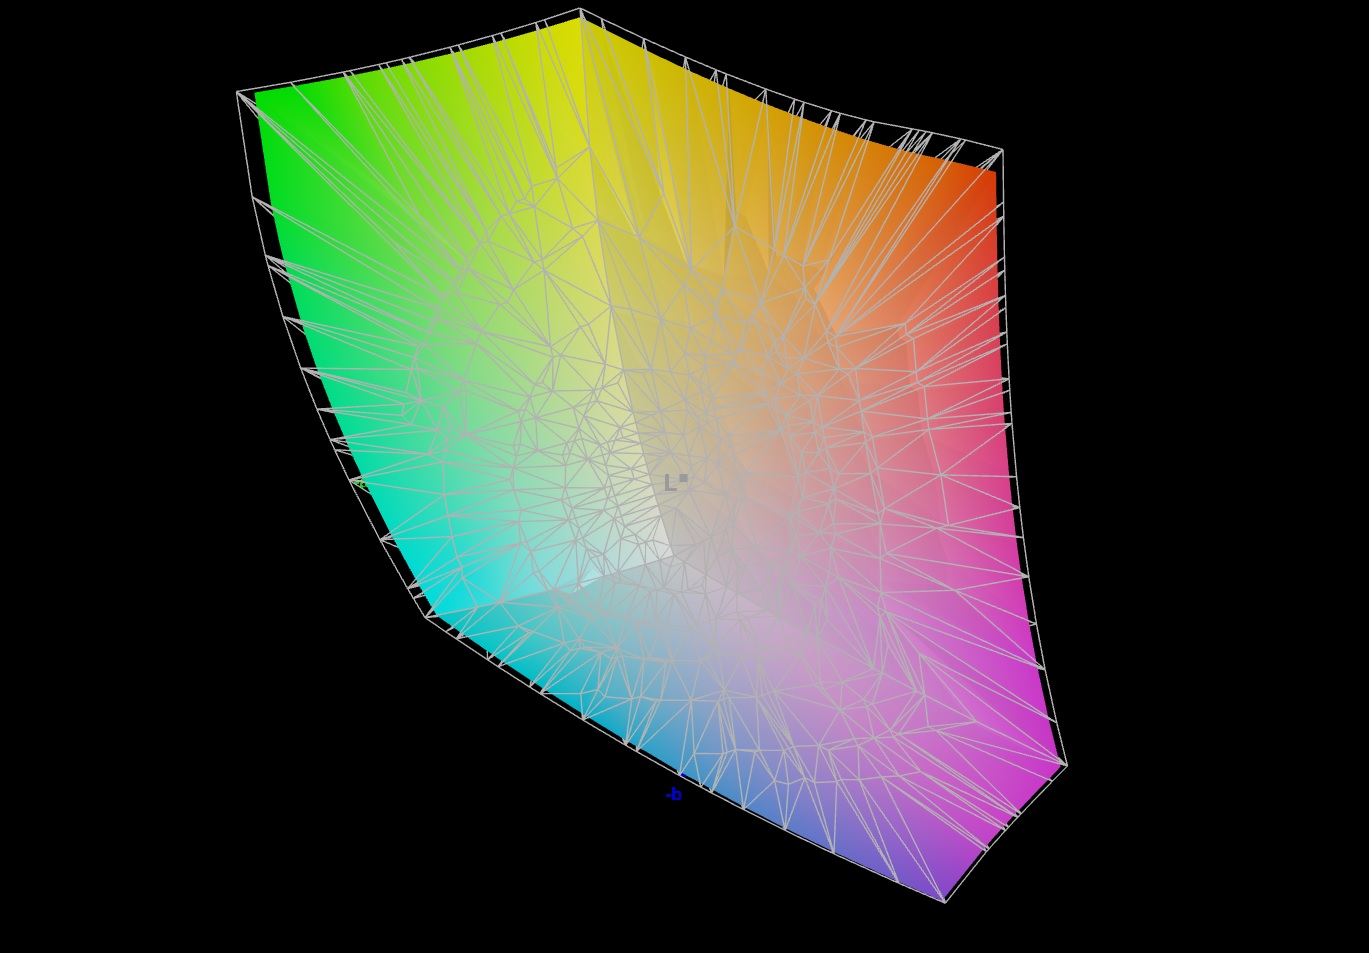
84.5% AdobeRGB 1998 (Argyll 3D)
99.9% sRGB (Argyll 3D)
95.2% Display P3 (Argyll 3D)
Gamma: 2.244
CCT: 6897 K
| Aorus 15 XE5 Chi Mei N156KME-GNA, IPS, 2560x1440, 15.6" | Acer Nitro 5 AN515-46-R1A1 AU Optronics B156HAN12.H, IPS, 1920x1080, 15.6" | Schenker XMG Fusion 15 (Mid 22) BOE CQ NE156QHM-NY2, IPS, 2560x1440, 15.6" | Asus TUF Dash F15 FX517ZR BOE CQ NE156QHM-NY1, IPS, 2560x1440, 15.6" | MSI Katana GF66 12UGS AU Optronics AUOAF90, IPS, 1920x1080, 15.6" | |
|---|---|---|---|---|---|
| Display | -16% | -17% | 2% | -51% | |
| Display P3 Coverage (%) | 95.2 | 68.8 -28% | 67.3 -29% | 98.4 3% | 39.1 -59% |
| sRGB Coverage (%) | 99.9 | 98.1 -2% | 96.7 -3% | 99.9 0% | 58.3 -42% |
| AdobeRGB 1998 Coverage (%) | 84.5 | 69.7 -18% | 68.2 -19% | 85.9 2% | 40.4 -52% |
| Response Times | 9% | 19% | 26% | -204% | |
| Response Time Grey 50% / Grey 80% * (ms) | 14.4 ? | 13 ? 10% | 11.6 ? 19% | 5.6 ? 61% | 40 ? -178% |
| Response Time Black / White * (ms) | 8.6 ? | 8 ? 7% | 7 ? 19% | 9.4 ? -9% | 28.4 ? -230% |
| PWM Frequency (Hz) | |||||
| Screen | 2% | -14% | 13% | -64% | |
| Brightness middle (cd/m²) | 336 | 327 -3% | 326 -3% | 286 -15% | 227 -32% |
| Brightness (cd/m²) | 316 | 320 1% | 303 -4% | 266 -16% | 225 -29% |
| Brightness Distribution (%) | 89 | 93 4% | 89 0% | 87 -2% | 90 1% |
| Black Level * (cd/m²) | 0.34 | 0.24 29% | 0.33 3% | 0.25 26% | 0.21 38% |
| Contrast (:1) | 988 | 1363 38% | 988 0% | 1144 16% | 1081 9% |
| Colorchecker dE 2000 * | 3.36 | 3.26 3% | 2.73 19% | 2.14 36% | 4.19 -25% |
| Colorchecker dE 2000 max. * | 6.67 | 8.73 -31% | 9.54 -43% | 5.22 22% | 17.45 -162% |
| Colorchecker dE 2000 calibrated * | 0.74 | 0.87 -18% | 1.36 -84% | 0.67 9% | 3.81 -415% |
| Greyscale dE 2000 * | 4.7 | 4.87 -4% | 5.2 -11% | 2.8 40% | 2.7 43% |
| Gamma | 2.244 98% | 2.3 96% | 2.074 106% | 2.23 99% | 2.208 100% |
| CCT | 6897 94% | 7070 92% | 6911 94% | 7092 92% | 6176 105% |
| Totalt genomsnitt (program/inställningar) | -2% /
-1% | -4% /
-10% | 14% /
12% | -106% /
-81% |
* ... mindre är bättre
Skärmen har en hyfsad färgåtergivning direkt från start. Färgskillnaden på 3,36 ligger bara en aning utanför det ideala området (DeltaE <3). Kalibrering av skärmen minskade färgskillnaden till 0,74 och fick gråtoner att se jämnare ut. Skärmen täcker sRGB-färgrymden helt och hållet (100 %) och klarar nästan av att återge hela DCI-P3-skalan (95 %). Den har också en AdobeRGB-täckning på 85 %.
Färgprofilen som vi har skapat kan laddas ner och användas gratis. Du hittar en nedladdningslänk i infoboxen för skärmen.
Visa svarstider
| ↔ Svarstid svart till vitt | ||
|---|---|---|
| 8.6 ms ... stiga ↗ och falla ↘ kombinerat | ↗ 5.1 ms stiga | 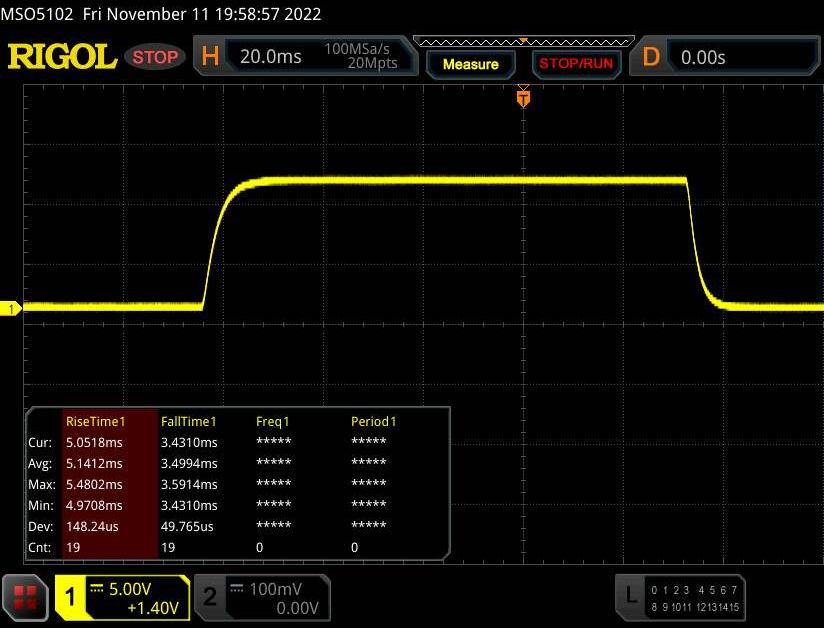 |
| ↘ 3.5 ms hösten | ||
| Skärmen visar snabba svarsfrekvenser i våra tester och bör passa för spel. I jämförelse sträcker sig alla testade enheter från 0.1 (minst) till 240 (maximalt) ms. » 24 % av alla enheter är bättre. Det betyder att den uppmätta svarstiden är bättre än genomsnittet av alla testade enheter (19.8 ms). | ||
| ↔ Svarstid 50 % grått till 80 % grått | ||
| 14.4 ms ... stiga ↗ och falla ↘ kombinerat | ↗ 6.9 ms stiga | 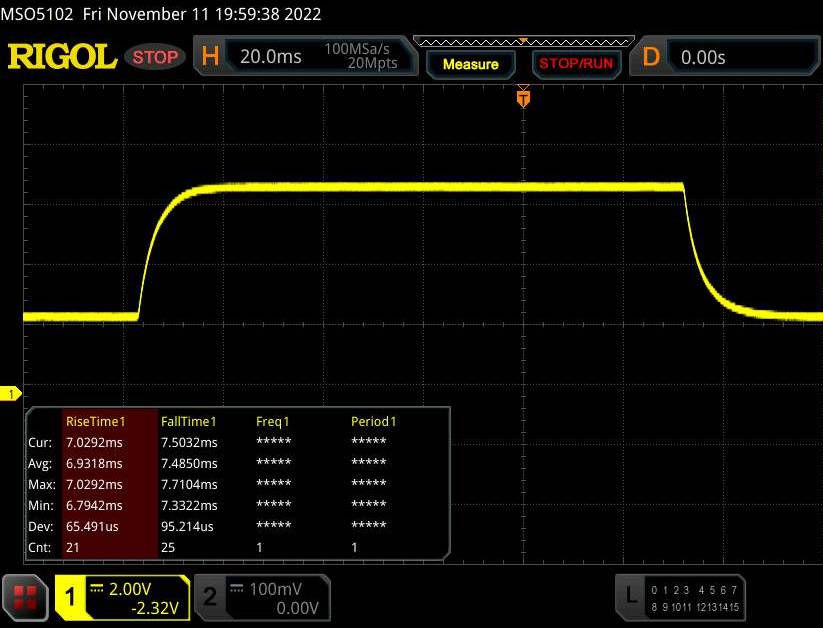 |
| ↘ 7.5 ms hösten | ||
| Skärmen visar bra svarsfrekvens i våra tester, men kan vara för långsam för konkurrenskraftiga spelare. I jämförelse sträcker sig alla testade enheter från 0.165 (minst) till 636 (maximalt) ms. » 28 % av alla enheter är bättre. Det betyder att den uppmätta svarstiden är bättre än genomsnittet av alla testade enheter (31 ms). | ||
Skärmflimmer / PWM (Puls-Width Modulation)
| Skärmflimmer / PWM upptäcktes inte | 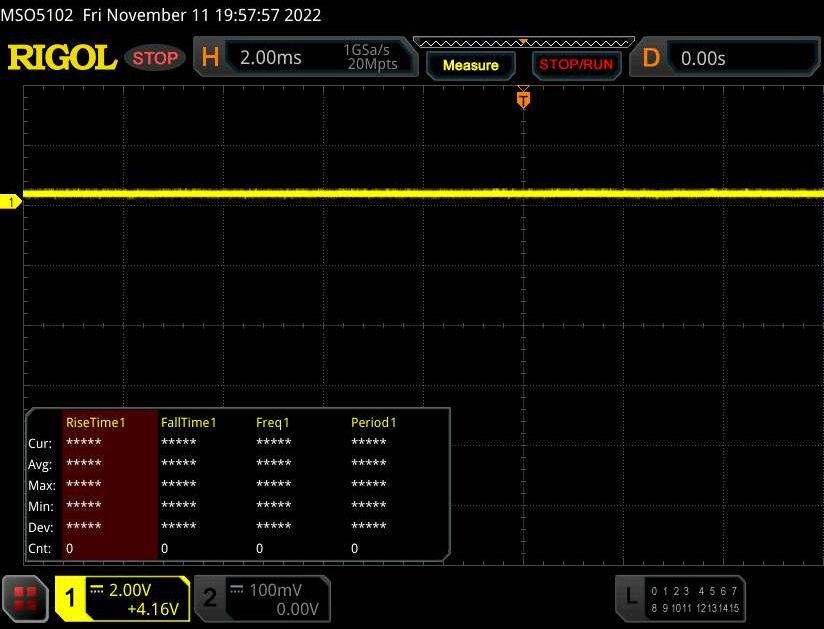 | ||
Som jämförelse: 52 % av alla testade enheter använder inte PWM för att dämpa skärmen. Om PWM upptäcktes mättes ett medelvärde av 7754 (minst: 5 - maximum: 343500) Hz. | |||
IPS-displayen har en bred betraktningsvinkel och kan läsas från alla håll. Det är också möjligt att använda skärmen utomhus, förutsatt att solen inte är för stark.

Prestanda - Mycket kraft tack vare Alder Lake och Ampere
Gigabyte Aorus 15 XE5 är en kraftfull bärbar dator på 15,6 tum som klarar sig bra i alla typer av krävande användningssituationer. Förutom den recenserade konfigurationen erbjuder Gigabyte även två andra modeller: en med en RTX 3080 Ti bärbar dator (Aorus 15 YE5) och en annan med en RTX 3060 bärbar dator (Aorus 15 KE5).
Provningsvillkor
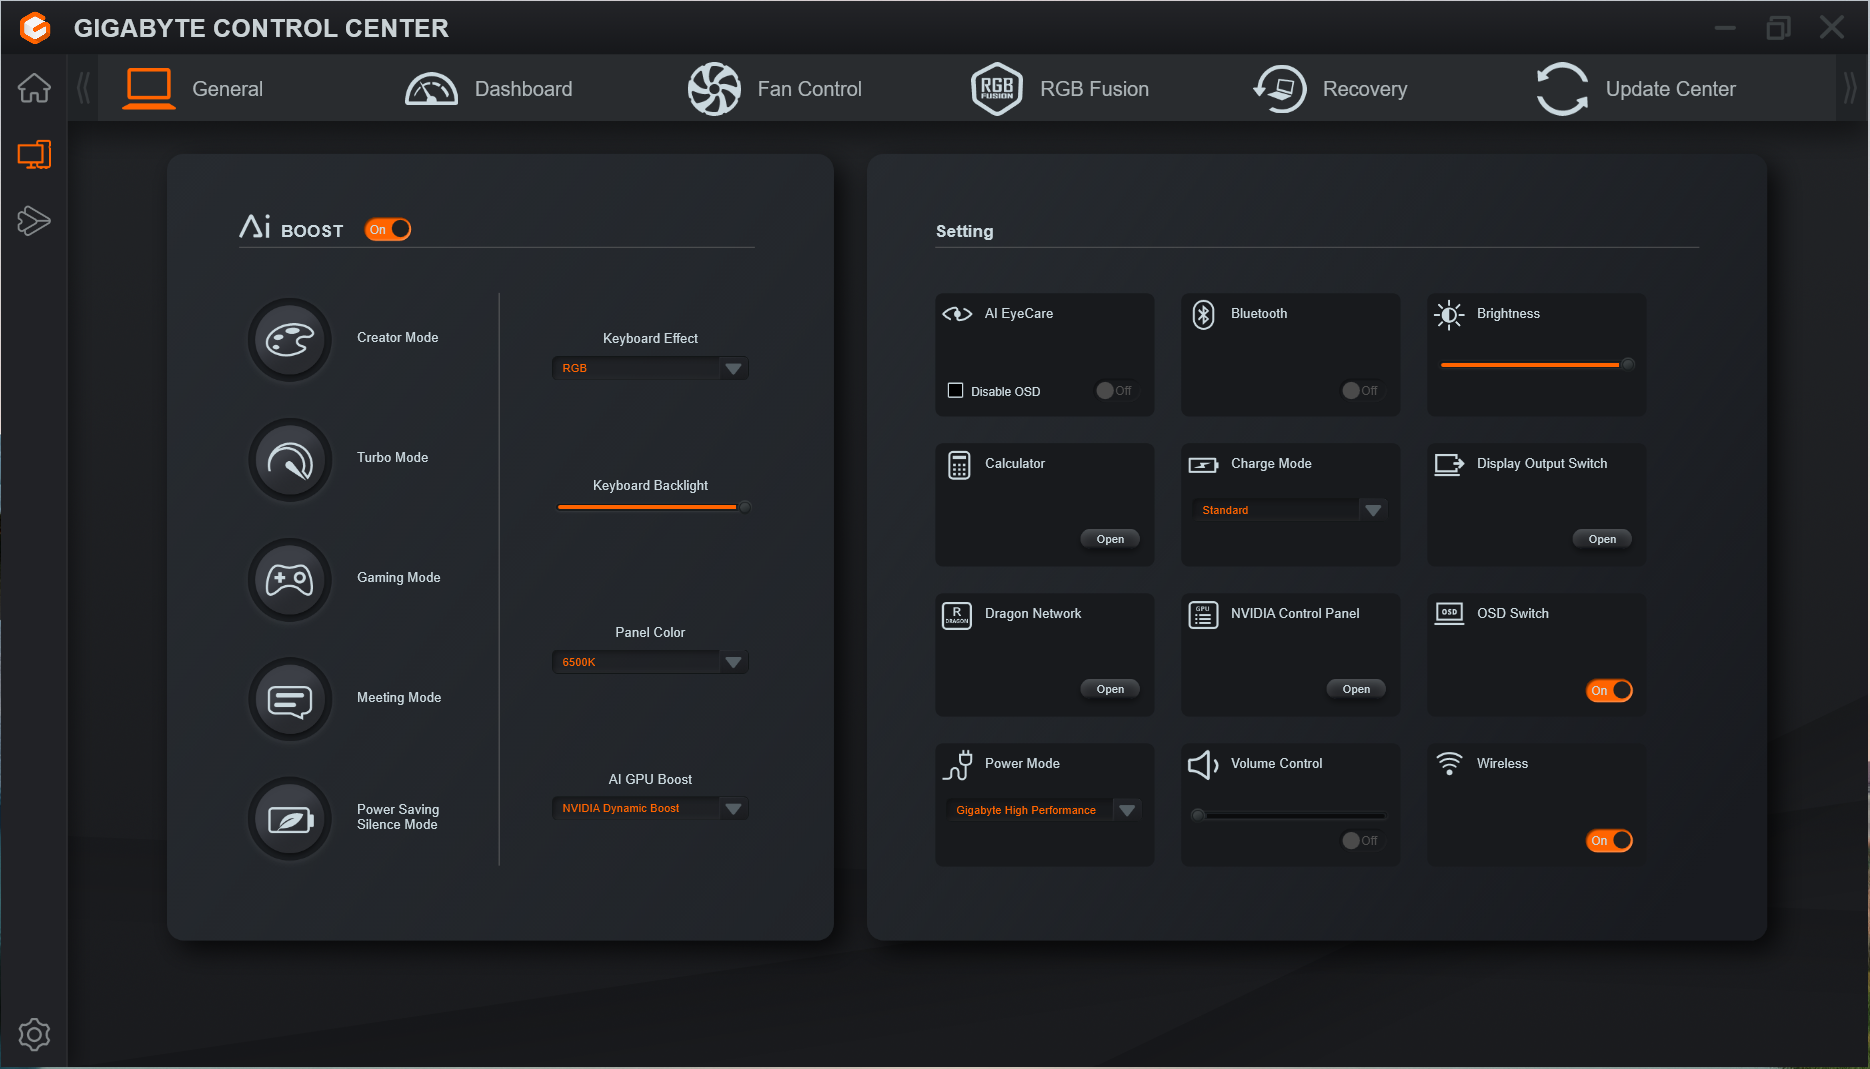
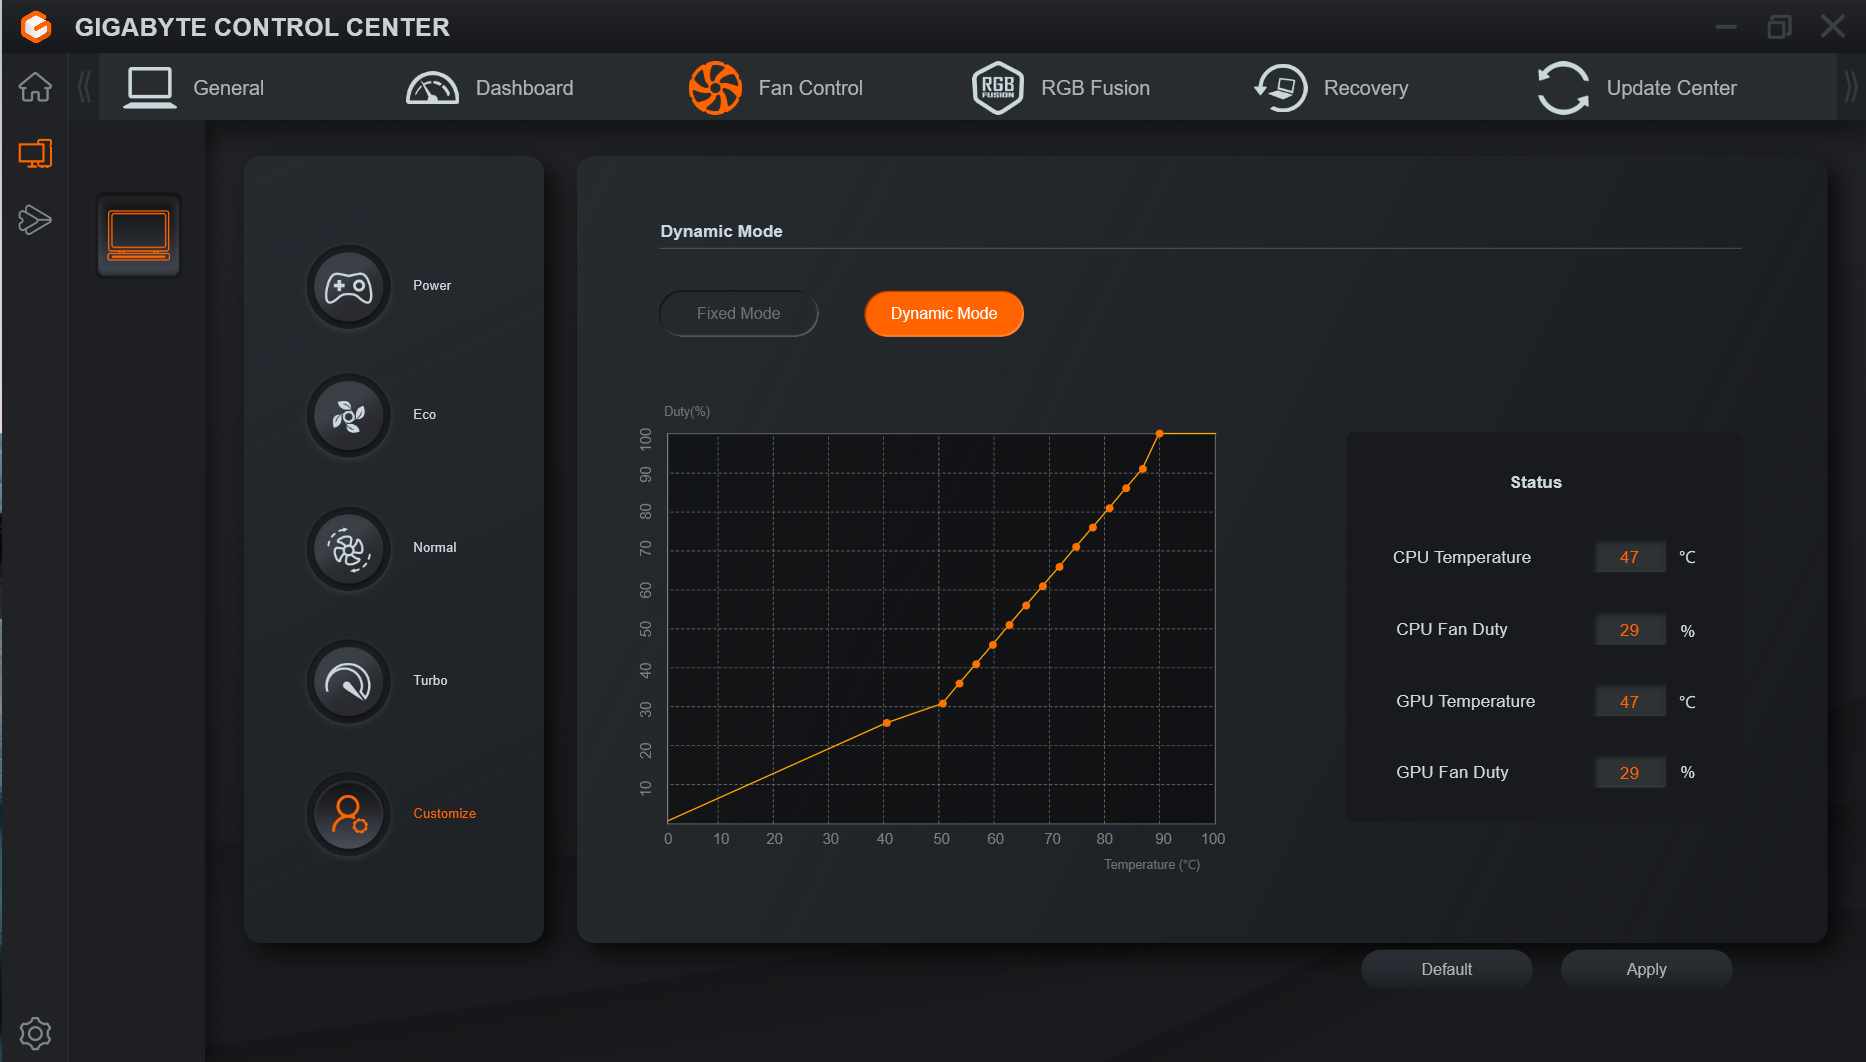
Det förinstallerade Gigabyte Control Center har olika prestandaprofiler som låter dig konfigurera CPU- och GPU-prestanda, fläktaktivitet, skärmens ljusstyrka och färgtemperatur och så vidare. För våra tester använde vi AI Boost-funktionen, som åsidosätter alla manuella prestandainställningar och låter Control Center välja lämplig profil.
Användningen av "Turbo Mode" förbättrade knappast topprestandan, men resulterade i högre uthållig prestanda under konstant belastning (se resultaten från CB15-slingan). Icke desto mindre har denna vinst ett pris - fläktarna körde kontinuerligt på full hastighet.
| Creator Mode | Turbo Mode | Gaming Mode | Meeting Mode | Power Saving Silence Mode | |
|---|---|---|---|---|---|
| Effektbegränsning 1 | 70 watt | 70 watt | 55 watt | 15 watt | 15 watt |
| Effektgräns 2 | 115 watt | 115 watt | 115 watt | 30 watt | 30 watt |
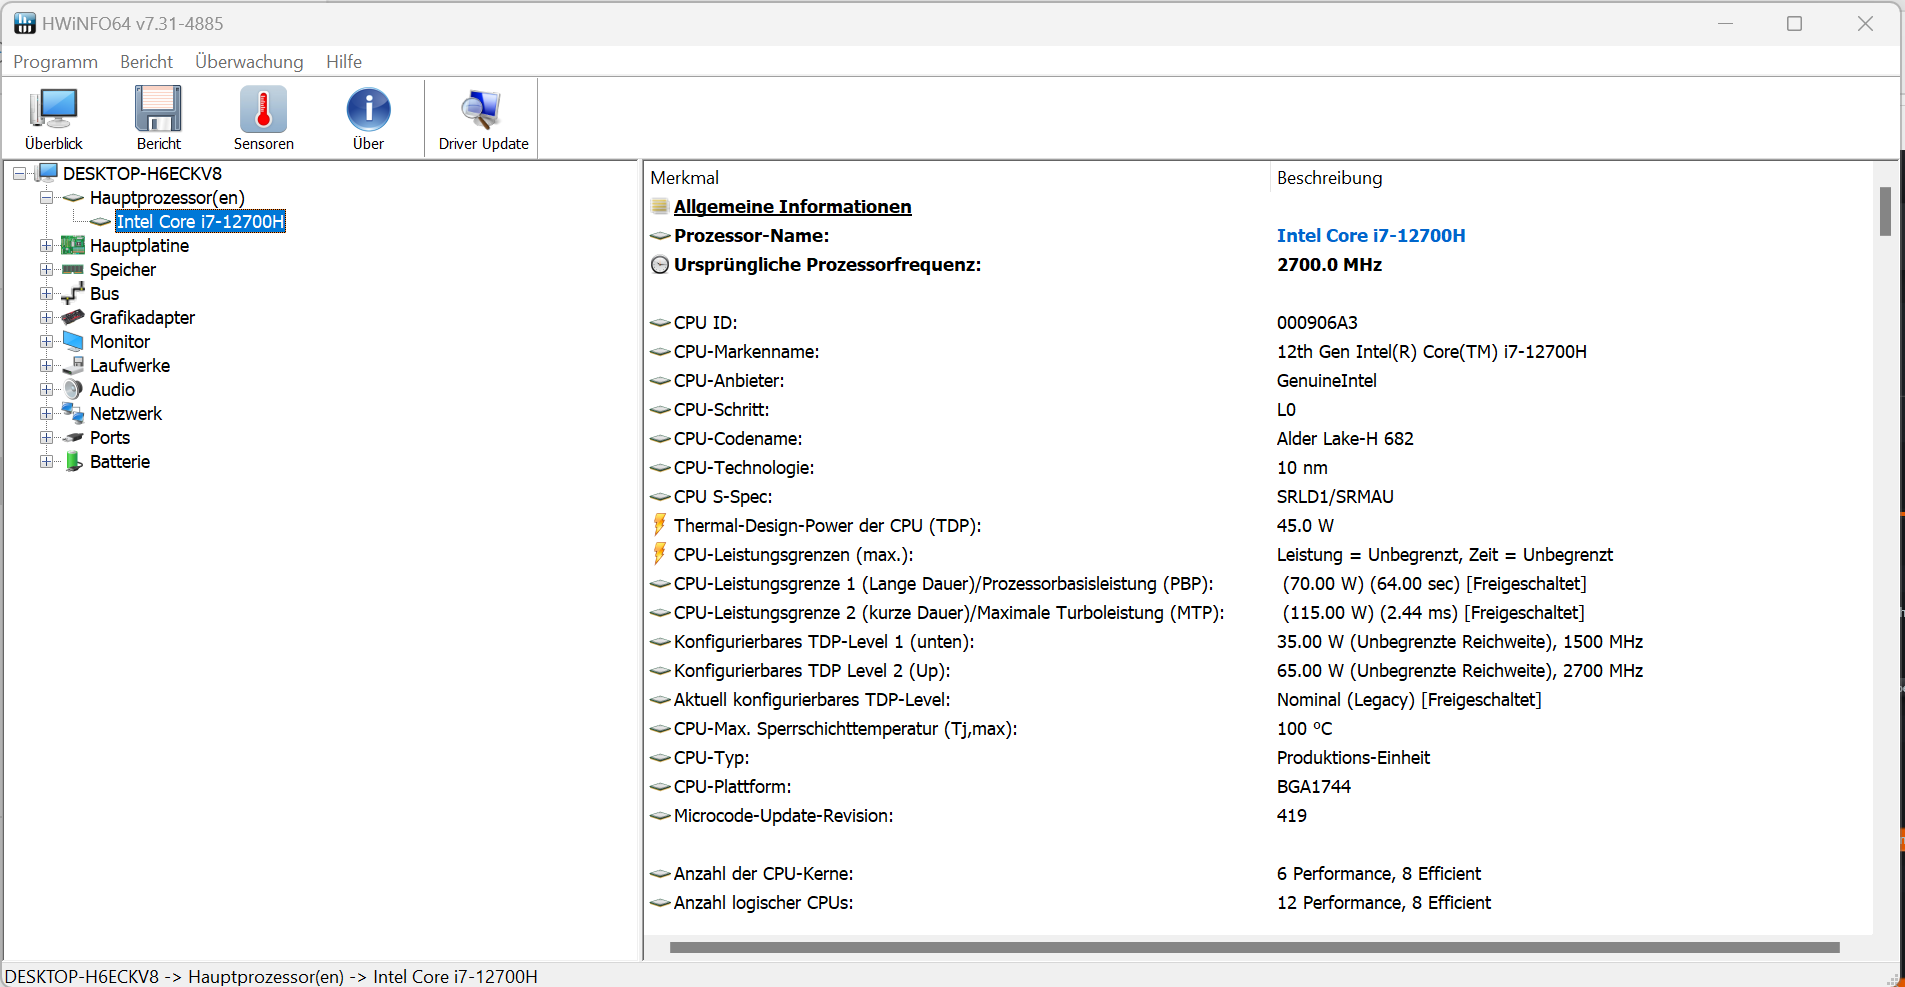
Processor
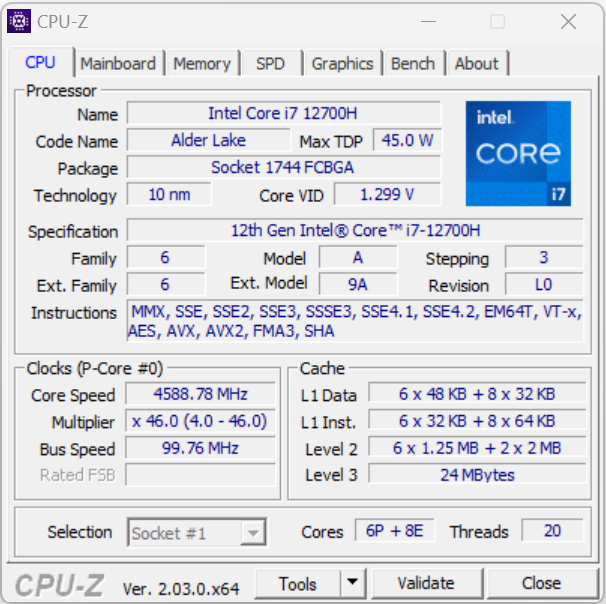
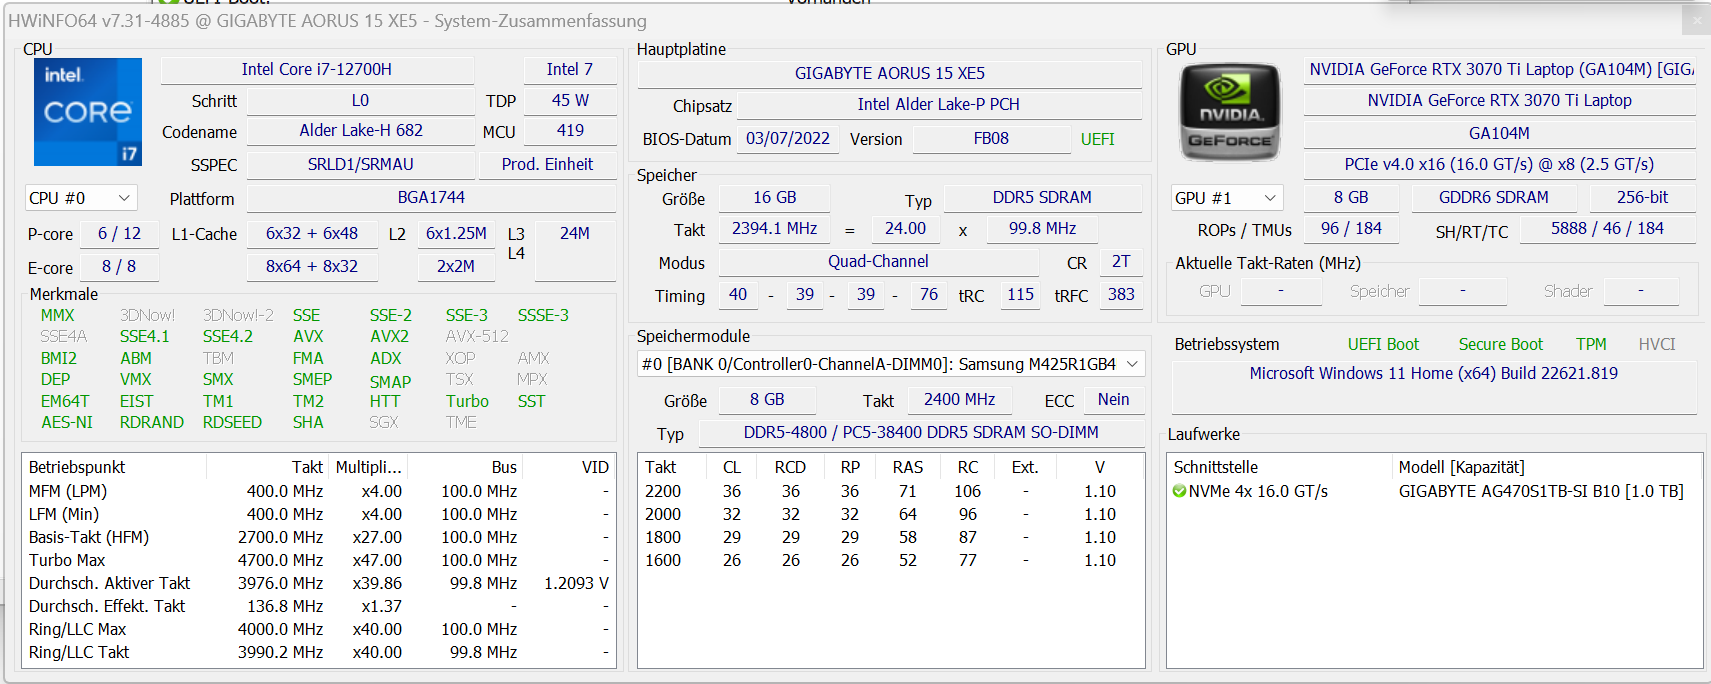
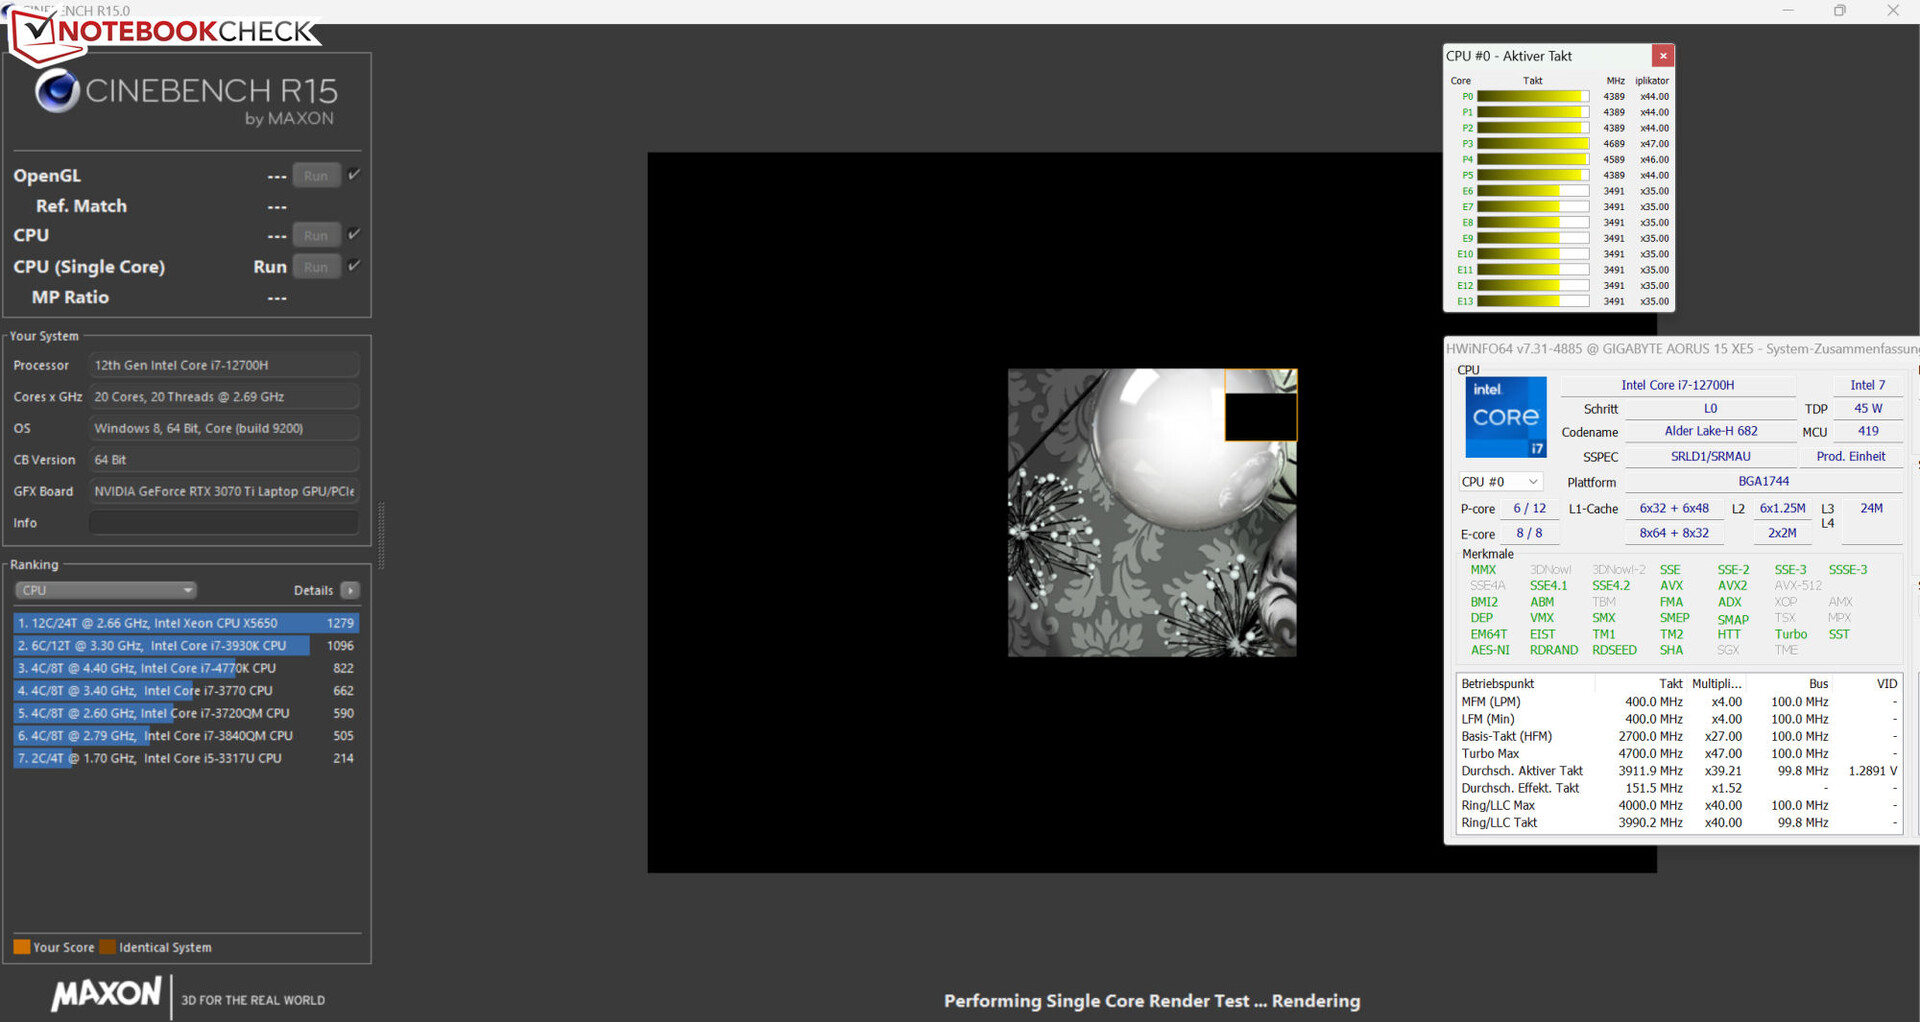
Core i7-12700H processorn (Alder Lake) innehåller sex prestandakärnor (hypertrådning, 2,4 till 4,7 GHz) och åtta effektivitetskärnor (ingen hypertrådning, 1,8 till 3,5 GHz), vilket ger totalt 20 logiska CPU-kärnor.
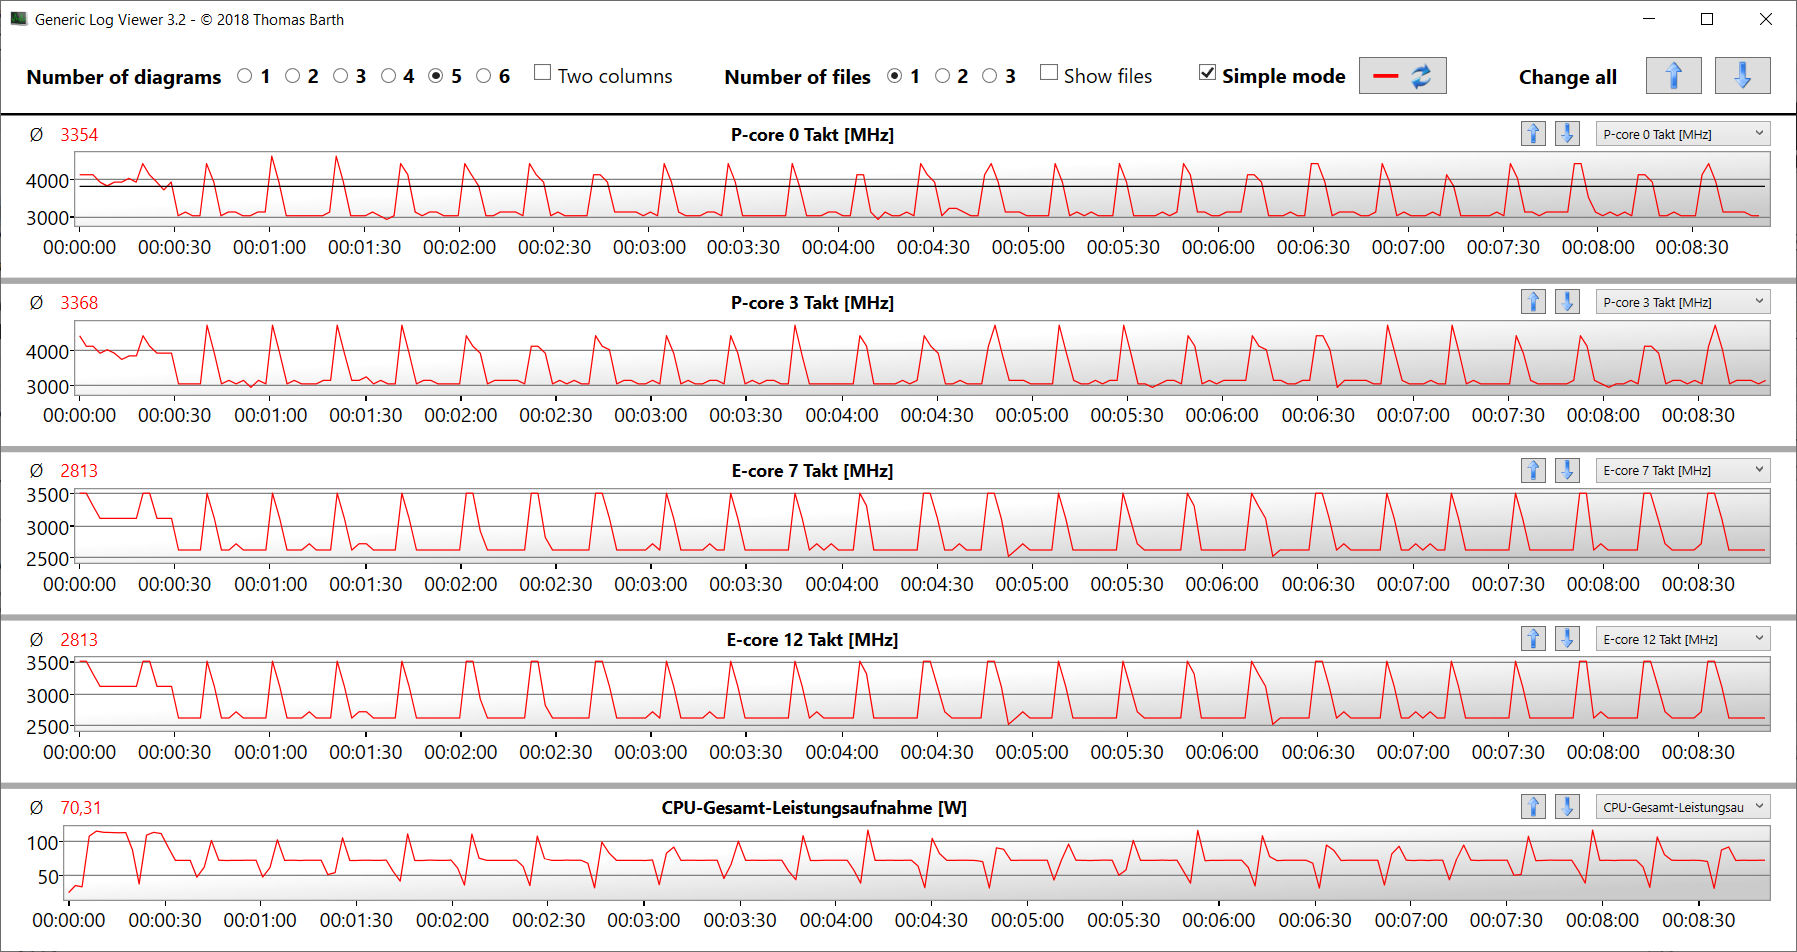
Processorn körde kortvarigt med höga klockfrekvenser (P-cores: 4,4 GHz, E-cores: 3,5 GHz) under Cinebench R15 multitrådstestet innan den stabiliserades vid något lägre frekvenser (P-cores: 3,5-3,8 GHz, E-cores: 3-3,2 GHz). Under testet med en enda tråd körde P-kärnorna på 4,4 till 4,7 GHz och E-kärnorna på 3,5 GHz. Klockfrekvenserna var betydligt lägre när den bärbara datorn var på batteri. Sammantaget levererade Core i7 i Aorus 15 XE5 något över genomsnittet i jämförelseprotokollet.
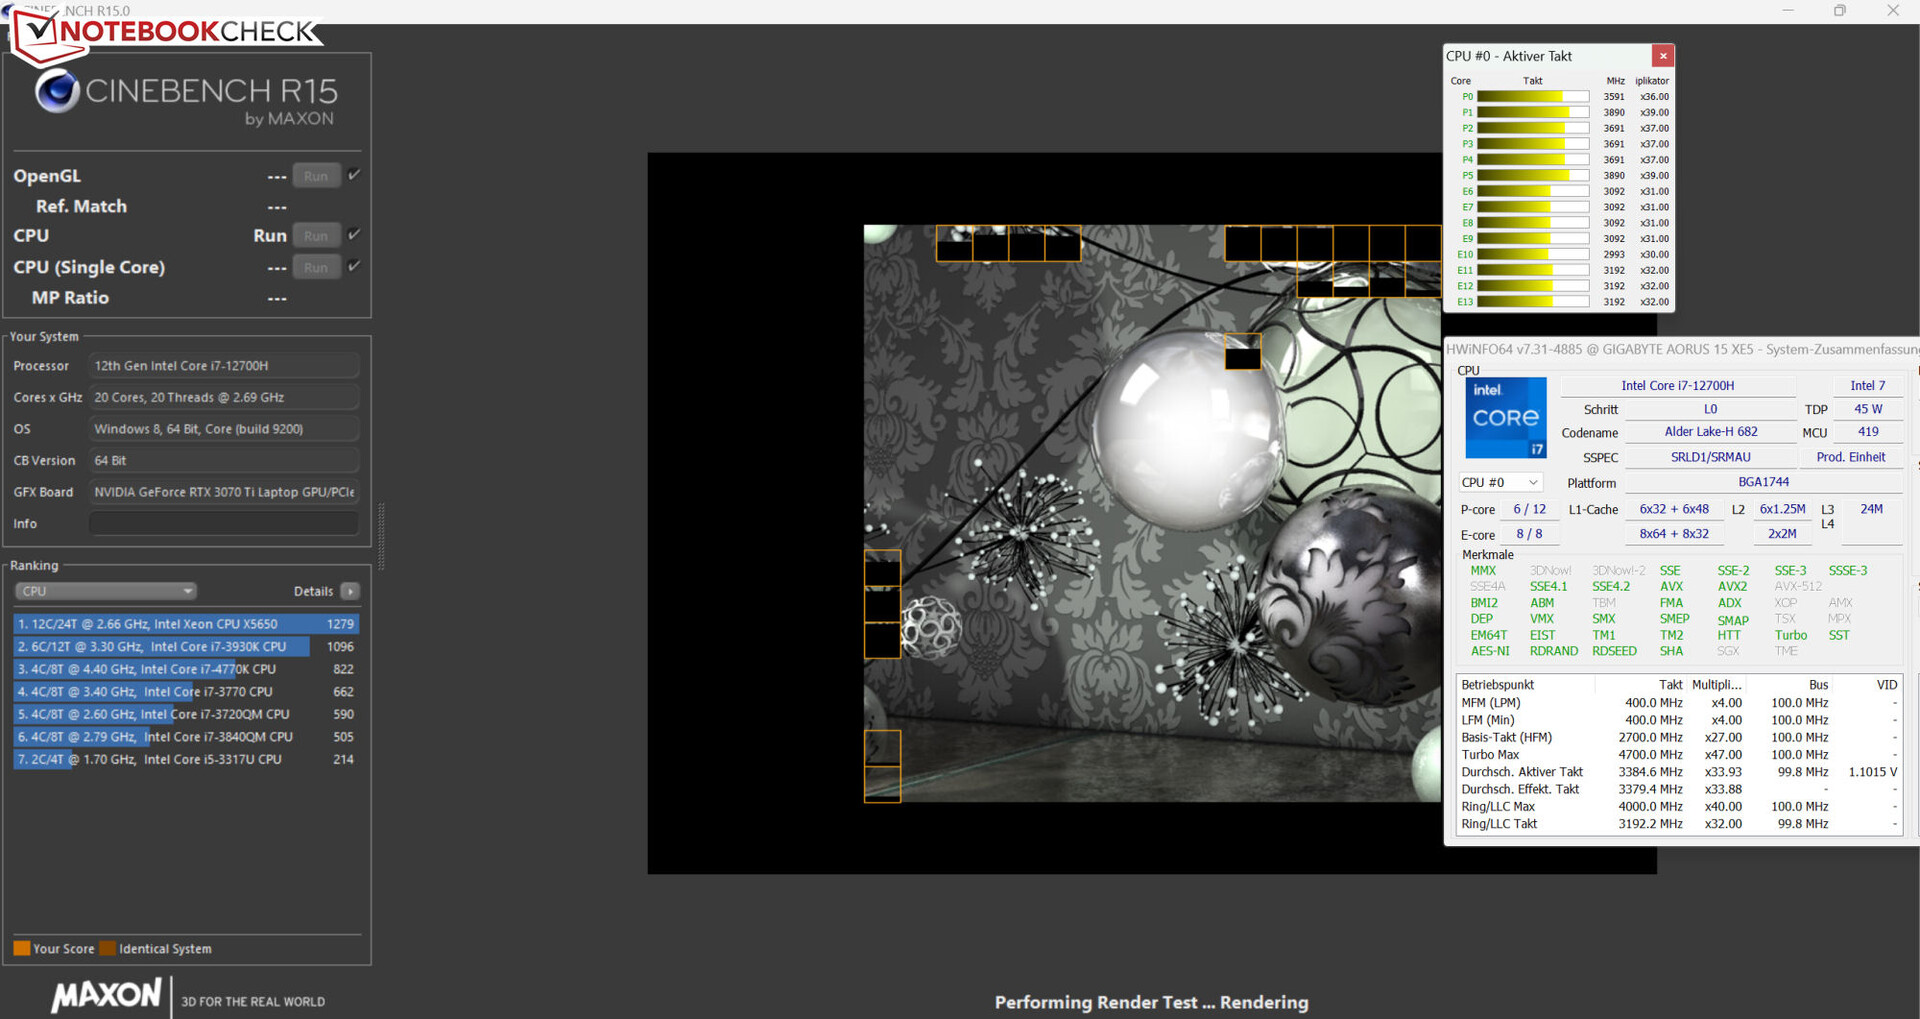
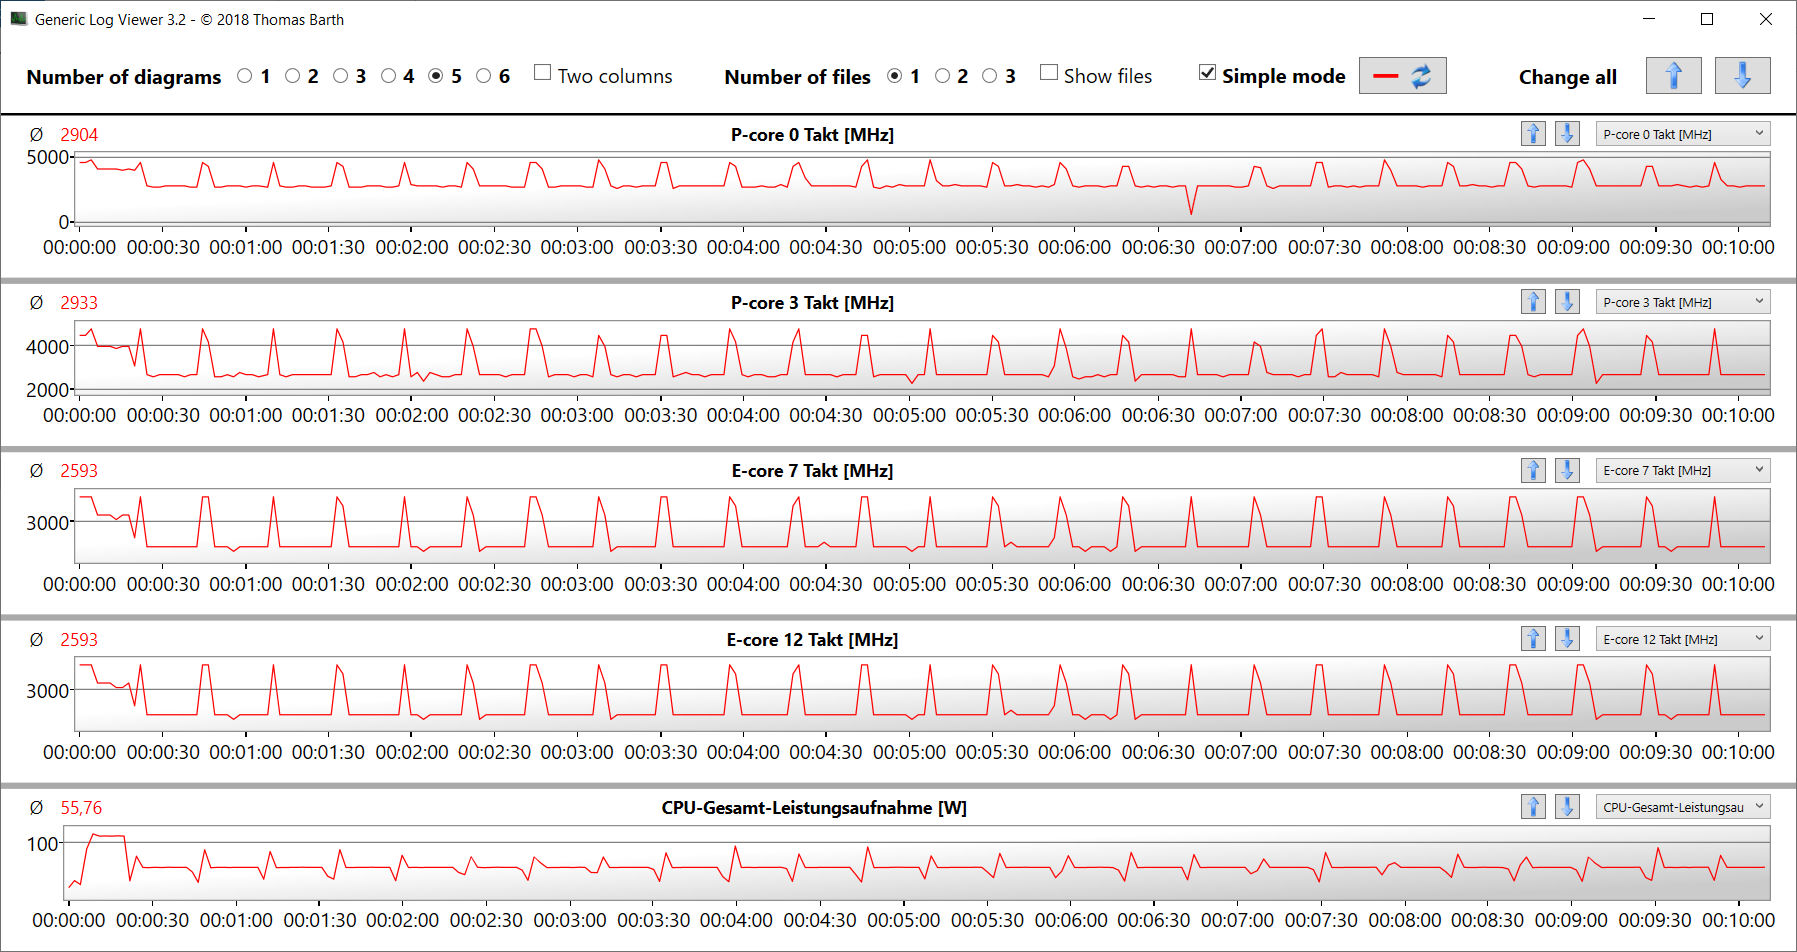
Vi kör också multitrådstestet i Cinebench R15 i en slinga för att avgöra om processorn kan behålla sin turbohastighet under en längre tid. CPU:n kunde bara hålla de höga klockfrekvenserna under en kortare tid. Därefter var det främst P-kärnorna som arbetade i mitten av turboområdet. Att aktivera "Turbo Mode" resulterade i en mindre ökning av CPU-prestandan - inte på topp, utan snarare i genomsnitt.
Cinebench R15 Multi Sustained Load
| CPU Performance rating - Percent | |
| Genomsnitt av klass Gaming | |
| Aorus 15 XE5 | |
| Aorus 15 XE5 | |
| MSI Katana GF66 12UGS | |
| Genomsnitt Intel Core i7-12700H | |
| Asus TUF Dash F15 FX517ZR | |
| Acer Nitro 5 AN515-46-R1A1 | |
| Schenker XMG Fusion 15 (Mid 22) | |
| Blender - v2.79 BMW27 CPU | |
| Schenker XMG Fusion 15 (Mid 22) | |
| MSI Katana GF66 12UGS | |
| Aorus 15 XE5 | |
| Acer Nitro 5 AN515-46-R1A1 | |
| Asus TUF Dash F15 FX517ZR | |
| Genomsnitt Intel Core i7-12700H (168 - 732, n=63) | |
| Aorus 15 XE5 (Turbo Mode) | |
| Genomsnitt av klass Gaming (79 - 330, n=104, senaste 2 åren) | |
| HWBOT x265 Benchmark v2.2 - 4k Preset | |
| Genomsnitt av klass Gaming (11.5 - 44.4, n=105, senaste 2 åren) | |
| Aorus 15 XE5 (Turbo Mode) | |
| Acer Nitro 5 AN515-46-R1A1 | |
| Asus TUF Dash F15 FX517ZR | |
| Genomsnitt Intel Core i7-12700H (4.67 - 21.8, n=64) | |
| Aorus 15 XE5 | |
| MSI Katana GF66 12UGS | |
| Schenker XMG Fusion 15 (Mid 22) | |
| LibreOffice - 20 Documents To PDF | |
| Acer Nitro 5 AN515-46-R1A1 | |
| Genomsnitt av klass Gaming (33.2 - 88.8, n=105, senaste 2 åren) | |
| Schenker XMG Fusion 15 (Mid 22) | |
| Genomsnitt Intel Core i7-12700H (34.2 - 95.3, n=63) | |
| Asus TUF Dash F15 FX517ZR | |
| Aorus 15 XE5 (Turbo Mode) | |
| Aorus 15 XE5 | |
| MSI Katana GF66 12UGS | |
| R Benchmark 2.5 - Overall mean | |
| Schenker XMG Fusion 15 (Mid 22) | |
| Acer Nitro 5 AN515-46-R1A1 | |
| Aorus 15 XE5 (Turbo Mode) | |
| Genomsnitt Intel Core i7-12700H (0.4441 - 1.052, n=63) | |
| Aorus 15 XE5 | |
| Asus TUF Dash F15 FX517ZR | |
| MSI Katana GF66 12UGS | |
| Genomsnitt av klass Gaming (0.3439 - 0.759, n=106, senaste 2 åren) | |
* ... mindre är bättre
AIDA64: FP32 Ray-Trace | FPU Julia | CPU SHA3 | CPU Queen | FPU SinJulia | FPU Mandel | CPU AES | CPU ZLib | FP64 Ray-Trace | CPU PhotoWorxx
| Performance rating | |
| Genomsnitt av klass Gaming | |
| Acer Nitro 5 AN515-46-R1A1 | |
| Aorus 15 XE5 | |
| Aorus 15 XE5 | |
| Schenker XMG Fusion 15 (Mid 22) | |
| Asus TUF Dash F15 FX517ZR | |
| Genomsnitt Intel Core i7-12700H | |
| MSI Katana GF66 12UGS | |
| AIDA64 / FP32 Ray-Trace | |
| Genomsnitt av klass Gaming (10227 - 85542, n=105, senaste 2 åren) | |
| Acer Nitro 5 AN515-46-R1A1 (v6.75.6100) | |
| Aorus 15 XE5 (v6.75.6100, Turbo Mode) | |
| Asus TUF Dash F15 FX517ZR (v6.70.6000) | |
| Aorus 15 XE5 (v6.75.6100) | |
| Schenker XMG Fusion 15 (Mid 22) (v6.70.6000) | |
| Genomsnitt Intel Core i7-12700H (2585 - 17957, n=64) | |
| MSI Katana GF66 12UGS (v6.50.5800) | |
| AIDA64 / FPU Julia | |
| Genomsnitt av klass Gaming (51376 - 238426, n=105, senaste 2 åren) | |
| Acer Nitro 5 AN515-46-R1A1 (v6.75.6100) | |
| Aorus 15 XE5 (v6.75.6100, Turbo Mode) | |
| Asus TUF Dash F15 FX517ZR (v6.70.6000) | |
| Aorus 15 XE5 (v6.75.6100) | |
| Schenker XMG Fusion 15 (Mid 22) (v6.70.6000) | |
| Genomsnitt Intel Core i7-12700H (12439 - 90760, n=64) | |
| MSI Katana GF66 12UGS (v6.50.5800) | |
| AIDA64 / CPU SHA3 | |
| Genomsnitt av klass Gaming (2180 - 10115, n=105, senaste 2 åren) | |
| Schenker XMG Fusion 15 (Mid 22) (v6.70.6000) | |
| Aorus 15 XE5 (v6.75.6100, Turbo Mode) | |
| Acer Nitro 5 AN515-46-R1A1 (v6.75.6100) | |
| Genomsnitt Intel Core i7-12700H (833 - 4242, n=64) | |
| MSI Katana GF66 12UGS (v6.50.5800) | |
| Aorus 15 XE5 (v6.75.6100) | |
| Asus TUF Dash F15 FX517ZR (v6.70.6000) | |
| AIDA64 / CPU Queen | |
| Genomsnitt av klass Gaming (49785 - 173351, n=90, senaste 2 åren) | |
| Acer Nitro 5 AN515-46-R1A1 (v6.75.6100) | |
| Aorus 15 XE5 (v6.75.6100) | |
| Aorus 15 XE5 (v6.75.6100, Turbo Mode) | |
| MSI Katana GF66 12UGS (v6.50.5800) | |
| Genomsnitt Intel Core i7-12700H (57923 - 103202, n=63) | |
| Asus TUF Dash F15 FX517ZR (v6.70.6000) | |
| Schenker XMG Fusion 15 (Mid 22) | |
| AIDA64 / FPU SinJulia | |
| Genomsnitt av klass Gaming (4424 - 33636, n=105, senaste 2 åren) | |
| Acer Nitro 5 AN515-46-R1A1 (v6.75.6100) | |
| MSI Katana GF66 12UGS (v6.50.5800) | |
| Aorus 15 XE5 (v6.75.6100, Turbo Mode) | |
| Genomsnitt Intel Core i7-12700H (3249 - 9939, n=64) | |
| Schenker XMG Fusion 15 (Mid 22) (v6.70.6000) | |
| Asus TUF Dash F15 FX517ZR (v6.70.6000) | |
| Aorus 15 XE5 (v6.75.6100) | |
| AIDA64 / FPU Mandel | |
| Genomsnitt av klass Gaming (25115 - 128721, n=105, senaste 2 åren) | |
| Acer Nitro 5 AN515-46-R1A1 (v6.75.6100) | |
| Schenker XMG Fusion 15 (Mid 22) (v6.70.6000) | |
| Aorus 15 XE5 (v6.75.6100, Turbo Mode) | |
| Asus TUF Dash F15 FX517ZR (v6.70.6000) | |
| Aorus 15 XE5 (v6.75.6100) | |
| Genomsnitt Intel Core i7-12700H (7135 - 44760, n=64) | |
| MSI Katana GF66 12UGS (v6.50.5800) | |
| AIDA64 / CPU AES | |
| Schenker XMG Fusion 15 (Mid 22) (v6.70.6000) | |
| Acer Nitro 5 AN515-46-R1A1 | |
| Aorus 15 XE5 (v6.75.6100, Turbo Mode) | |
| Aorus 15 XE5 (v6.75.6100) | |
| Genomsnitt av klass Gaming (39258 - 247074, n=105, senaste 2 åren) | |
| MSI Katana GF66 12UGS (v6.50.5800) | |
| Genomsnitt Intel Core i7-12700H (31839 - 144360, n=64) | |
| Asus TUF Dash F15 FX517ZR (v6.70.6000) | |
| AIDA64 / CPU ZLib | |
| Genomsnitt av klass Gaming (574 - 2531, n=105, senaste 2 åren) | |
| MSI Katana GF66 12UGS (v6.50.5800) | |
| Aorus 15 XE5 (v6.75.6100, Turbo Mode) | |
| Genomsnitt Intel Core i7-12700H (305 - 1171, n=64) | |
| Asus TUF Dash F15 FX517ZR (v6.70.6000) | |
| Acer Nitro 5 AN515-46-R1A1 (v6.75.6100) | |
| Aorus 15 XE5 (v6.75.6100) | |
| Schenker XMG Fusion 15 (Mid 22) (v6.70.6000) | |
| AIDA64 / FP64 Ray-Trace | |
| Genomsnitt av klass Gaming (5509 - 45446, n=105, senaste 2 åren) | |
| Acer Nitro 5 AN515-46-R1A1 (v6.75.6100) | |
| Aorus 15 XE5 (v6.75.6100, Turbo Mode) | |
| Asus TUF Dash F15 FX517ZR (v6.70.6000) | |
| Schenker XMG Fusion 15 (Mid 22) (v6.70.6000) | |
| Aorus 15 XE5 (v6.75.6100) | |
| Genomsnitt Intel Core i7-12700H (1437 - 9692, n=64) | |
| MSI Katana GF66 12UGS (v6.50.5800) | |
| AIDA64 / CPU PhotoWorxx | |
| Genomsnitt av klass Gaming (12271 - 89891, n=105, senaste 2 åren) | |
| Aorus 15 XE5 (v6.75.6100, Turbo Mode) | |
| Aorus 15 XE5 (v6.75.6100) | |
| Asus TUF Dash F15 FX517ZR (v6.70.6000) | |
| Genomsnitt Intel Core i7-12700H (12863 - 52207, n=64) | |
| Acer Nitro 5 AN515-46-R1A1 | |
| MSI Katana GF66 12UGS (v6.50.5800) | |
| Schenker XMG Fusion 15 (Mid 22) (v6.70.6000) | |
Systemprestanda
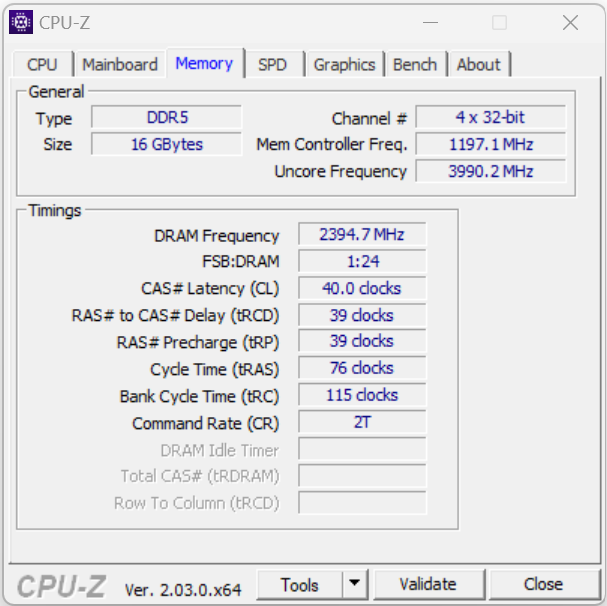
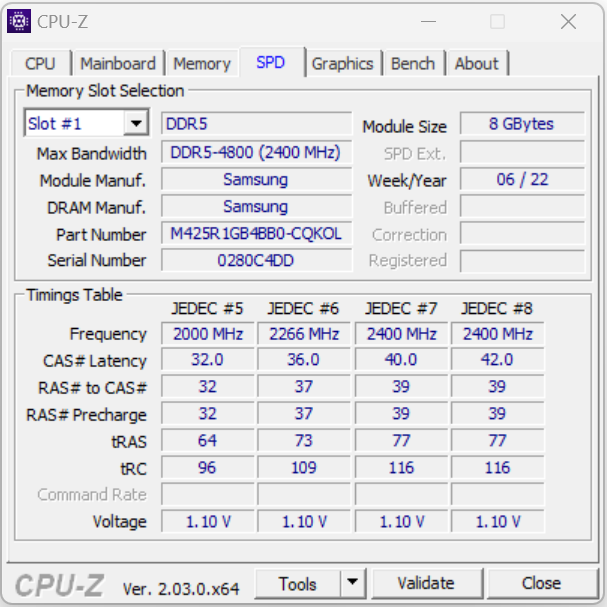
Systemet fungerar smidigt och har tillräckligt med datorkraft för krävande tillämpningar som rendering, videoredigering och spel. Den bärbara datorn lyckades leverera bra PCMark-resultat. Dataöverföringshastigheterna för RAM-minnet är ganska typiska för DDR5-4800-minne.
CrossMark: Overall | Productivity | Creativity | Responsiveness
| PCMark 10 / Score | |
| Genomsnitt av klass Gaming (5828 - 12414, n=93, senaste 2 åren) | |
| Aorus 15 XE5 | |
| Genomsnitt Intel Core i7-12700H, NVIDIA GeForce RTX 3070 Ti Laptop GPU (6941 - 7947, n=11) | |
| MSI Katana GF66 12UGS | |
| Asus TUF Dash F15 FX517ZR | |
| Acer Nitro 5 AN515-46-R1A1 | |
| Schenker XMG Fusion 15 (Mid 22) | |
| PCMark 10 / Essentials | |
| Aorus 15 XE5 | |
| Genomsnitt av klass Gaming (8810 - 11935, n=97, senaste 2 åren) | |
| Genomsnitt Intel Core i7-12700H, NVIDIA GeForce RTX 3070 Ti Laptop GPU (9892 - 10935, n=11) | |
| MSI Katana GF66 12UGS | |
| Acer Nitro 5 AN515-46-R1A1 | |
| Asus TUF Dash F15 FX517ZR | |
| Schenker XMG Fusion 15 (Mid 22) | |
| PCMark 10 / Productivity | |
| Genomsnitt av klass Gaming (6845 - 25323, n=95, senaste 2 åren) | |
| Aorus 15 XE5 | |
| MSI Katana GF66 12UGS | |
| Genomsnitt Intel Core i7-12700H, NVIDIA GeForce RTX 3070 Ti Laptop GPU (9024 - 10638, n=11) | |
| Asus TUF Dash F15 FX517ZR | |
| Acer Nitro 5 AN515-46-R1A1 | |
| Schenker XMG Fusion 15 (Mid 22) | |
| PCMark 10 / Digital Content Creation | |
| Genomsnitt av klass Gaming (7602 - 19954, n=95, senaste 2 åren) | |
| Genomsnitt Intel Core i7-12700H, NVIDIA GeForce RTX 3070 Ti Laptop GPU (10165 - 12546, n=11) | |
| Aorus 15 XE5 | |
| MSI Katana GF66 12UGS | |
| Asus TUF Dash F15 FX517ZR | |
| Acer Nitro 5 AN515-46-R1A1 | |
| Schenker XMG Fusion 15 (Mid 22) | |
| CrossMark / Overall | |
| Genomsnitt av klass Gaming (1366 - 2409, n=94, senaste 2 åren) | |
| Aorus 15 XE5 | |
| MSI Katana GF66 12UGS | |
| Genomsnitt Intel Core i7-12700H, NVIDIA GeForce RTX 3070 Ti Laptop GPU (974 - 2000, n=12) | |
| Asus TUF Dash F15 FX517ZR | |
| Schenker XMG Fusion 15 (Mid 22) | |
| Acer Nitro 5 AN515-46-R1A1 | |
| CrossMark / Productivity | |
| MSI Katana GF66 12UGS | |
| Aorus 15 XE5 | |
| Genomsnitt av klass Gaming (1386 - 2254, n=94, senaste 2 åren) | |
| Genomsnitt Intel Core i7-12700H, NVIDIA GeForce RTX 3070 Ti Laptop GPU (907 - 1962, n=12) | |
| Asus TUF Dash F15 FX517ZR | |
| Schenker XMG Fusion 15 (Mid 22) | |
| Acer Nitro 5 AN515-46-R1A1 | |
| CrossMark / Creativity | |
| Genomsnitt av klass Gaming (1343 - 2786, n=94, senaste 2 åren) | |
| Asus TUF Dash F15 FX517ZR | |
| Aorus 15 XE5 | |
| MSI Katana GF66 12UGS | |
| Genomsnitt Intel Core i7-12700H, NVIDIA GeForce RTX 3070 Ti Laptop GPU (1027 - 2057, n=12) | |
| Schenker XMG Fusion 15 (Mid 22) | |
| Acer Nitro 5 AN515-46-R1A1 | |
| CrossMark / Responsiveness | |
| MSI Katana GF66 12UGS | |
| Aorus 15 XE5 | |
| Genomsnitt Intel Core i7-12700H, NVIDIA GeForce RTX 3070 Ti Laptop GPU (1029 - 2142, n=12) | |
| Genomsnitt av klass Gaming (1226 - 2334, n=94, senaste 2 åren) | |
| Schenker XMG Fusion 15 (Mid 22) | |
| Asus TUF Dash F15 FX517ZR | |
| Acer Nitro 5 AN515-46-R1A1 | |
| PCMark 8 Home Score Accelerated v2 | 5280 poäng | |
| PCMark 8 Work Score Accelerated v2 | 6287 poäng | |
| PCMark 10 Score | 7695 poäng | |
Hjälp | ||
| AIDA64 / Memory Copy | |
| Genomsnitt av klass Gaming (21750 - 129946, n=105, senaste 2 åren) | |
| Genomsnitt Intel Core i7-12700H (25615 - 80511, n=64) | |
| Asus TUF Dash F15 FX517ZR | |
| Aorus 15 XE5 | |
| Acer Nitro 5 AN515-46-R1A1 | |
| Schenker XMG Fusion 15 (Mid 22) | |
| MSI Katana GF66 12UGS | |
| AIDA64 / Memory Read | |
| Genomsnitt av klass Gaming (22956 - 118858, n=105, senaste 2 åren) | |
| Asus TUF Dash F15 FX517ZR | |
| Aorus 15 XE5 | |
| Genomsnitt Intel Core i7-12700H (25586 - 79442, n=64) | |
| Acer Nitro 5 AN515-46-R1A1 | |
| Schenker XMG Fusion 15 (Mid 22) | |
| MSI Katana GF66 12UGS | |
| AIDA64 / Memory Write | |
| Genomsnitt av klass Gaming (22297 - 135096, n=105, senaste 2 åren) | |
| Asus TUF Dash F15 FX517ZR | |
| Aorus 15 XE5 | |
| Acer Nitro 5 AN515-46-R1A1 | |
| Genomsnitt Intel Core i7-12700H (23679 - 88660, n=64) | |
| MSI Katana GF66 12UGS | |
| Schenker XMG Fusion 15 (Mid 22) | |
| AIDA64 / Memory Latency | |
| Genomsnitt av klass Gaming (75.3 - 259, n=105, senaste 2 åren) | |
| MSI Katana GF66 12UGS | |
| Asus TUF Dash F15 FX517ZR | |
| Aorus 15 XE5 | |
| Schenker XMG Fusion 15 (Mid 22) | |
| Acer Nitro 5 AN515-46-R1A1 | |
| Genomsnitt Intel Core i7-12700H (76.2 - 133.9, n=62) | |
* ... mindre är bättre
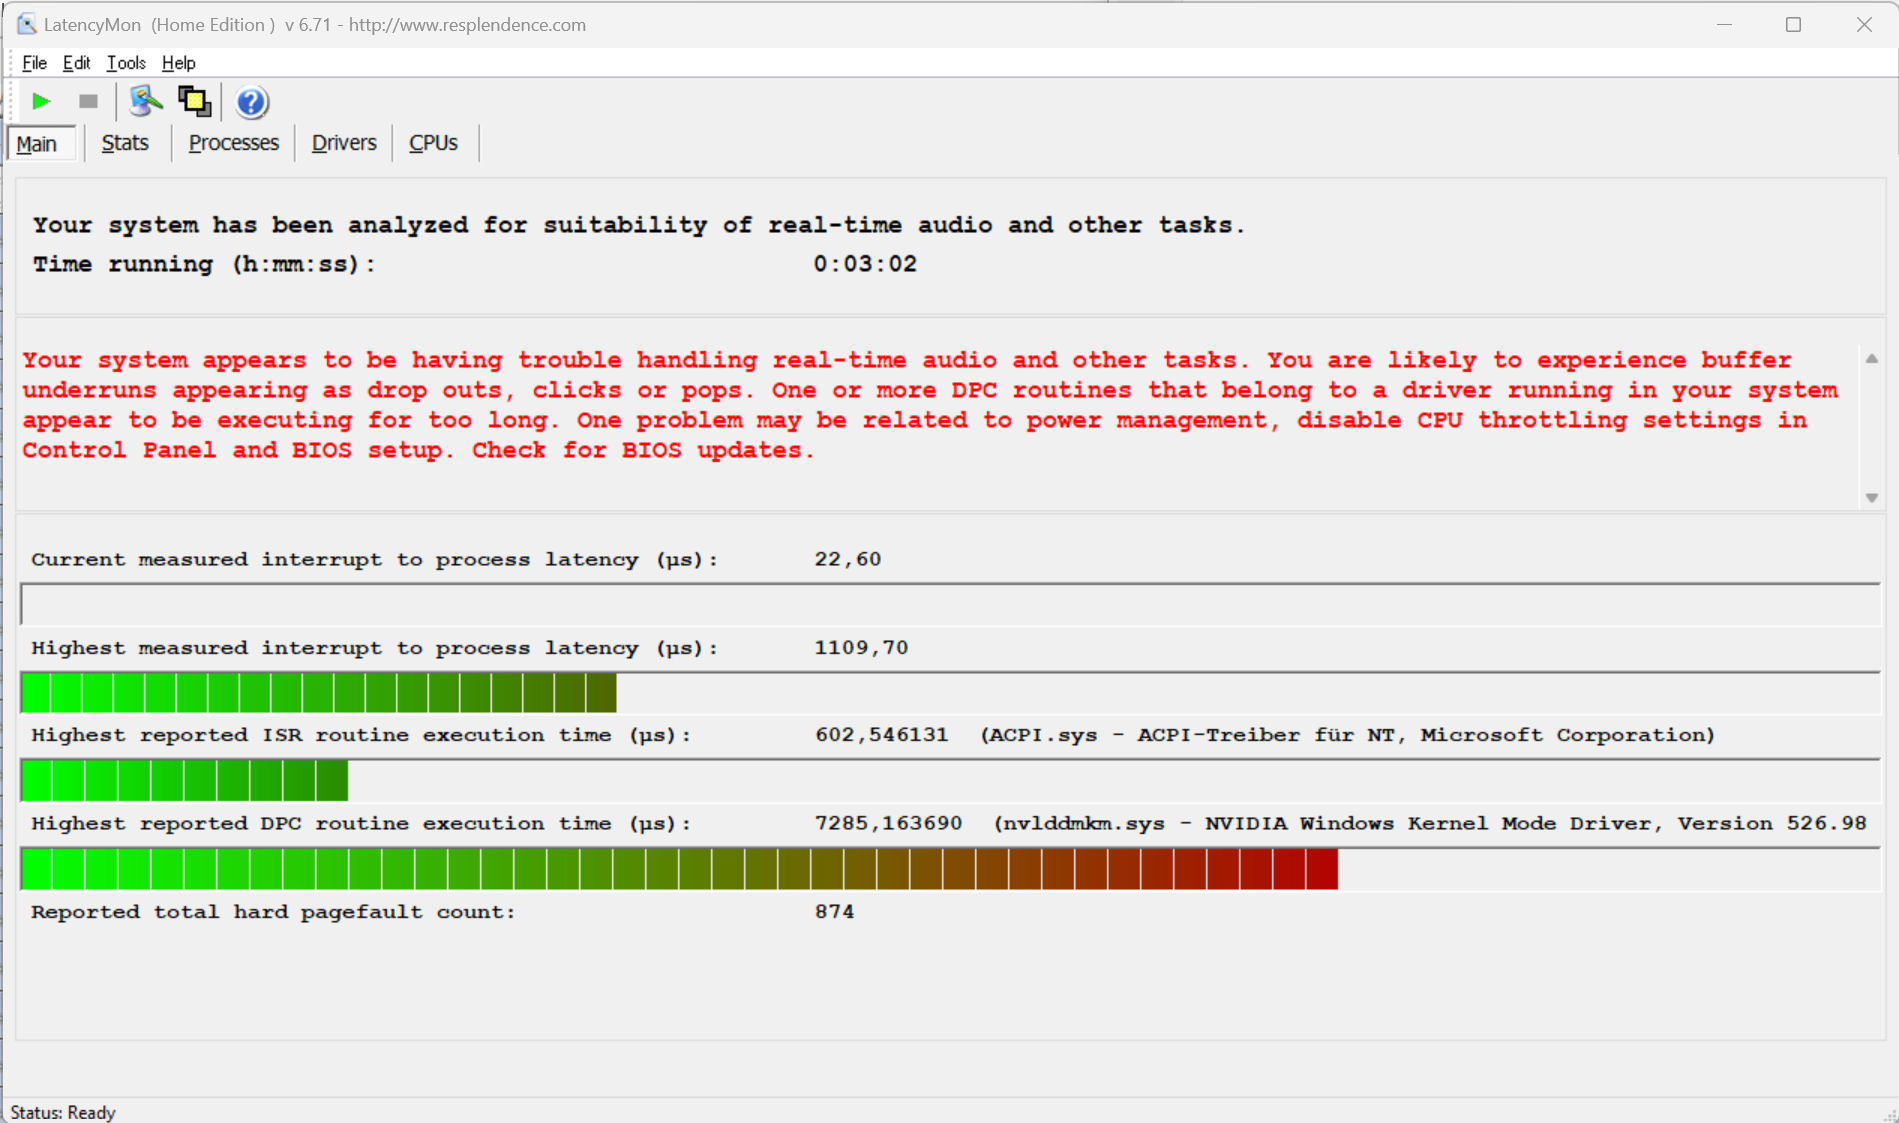
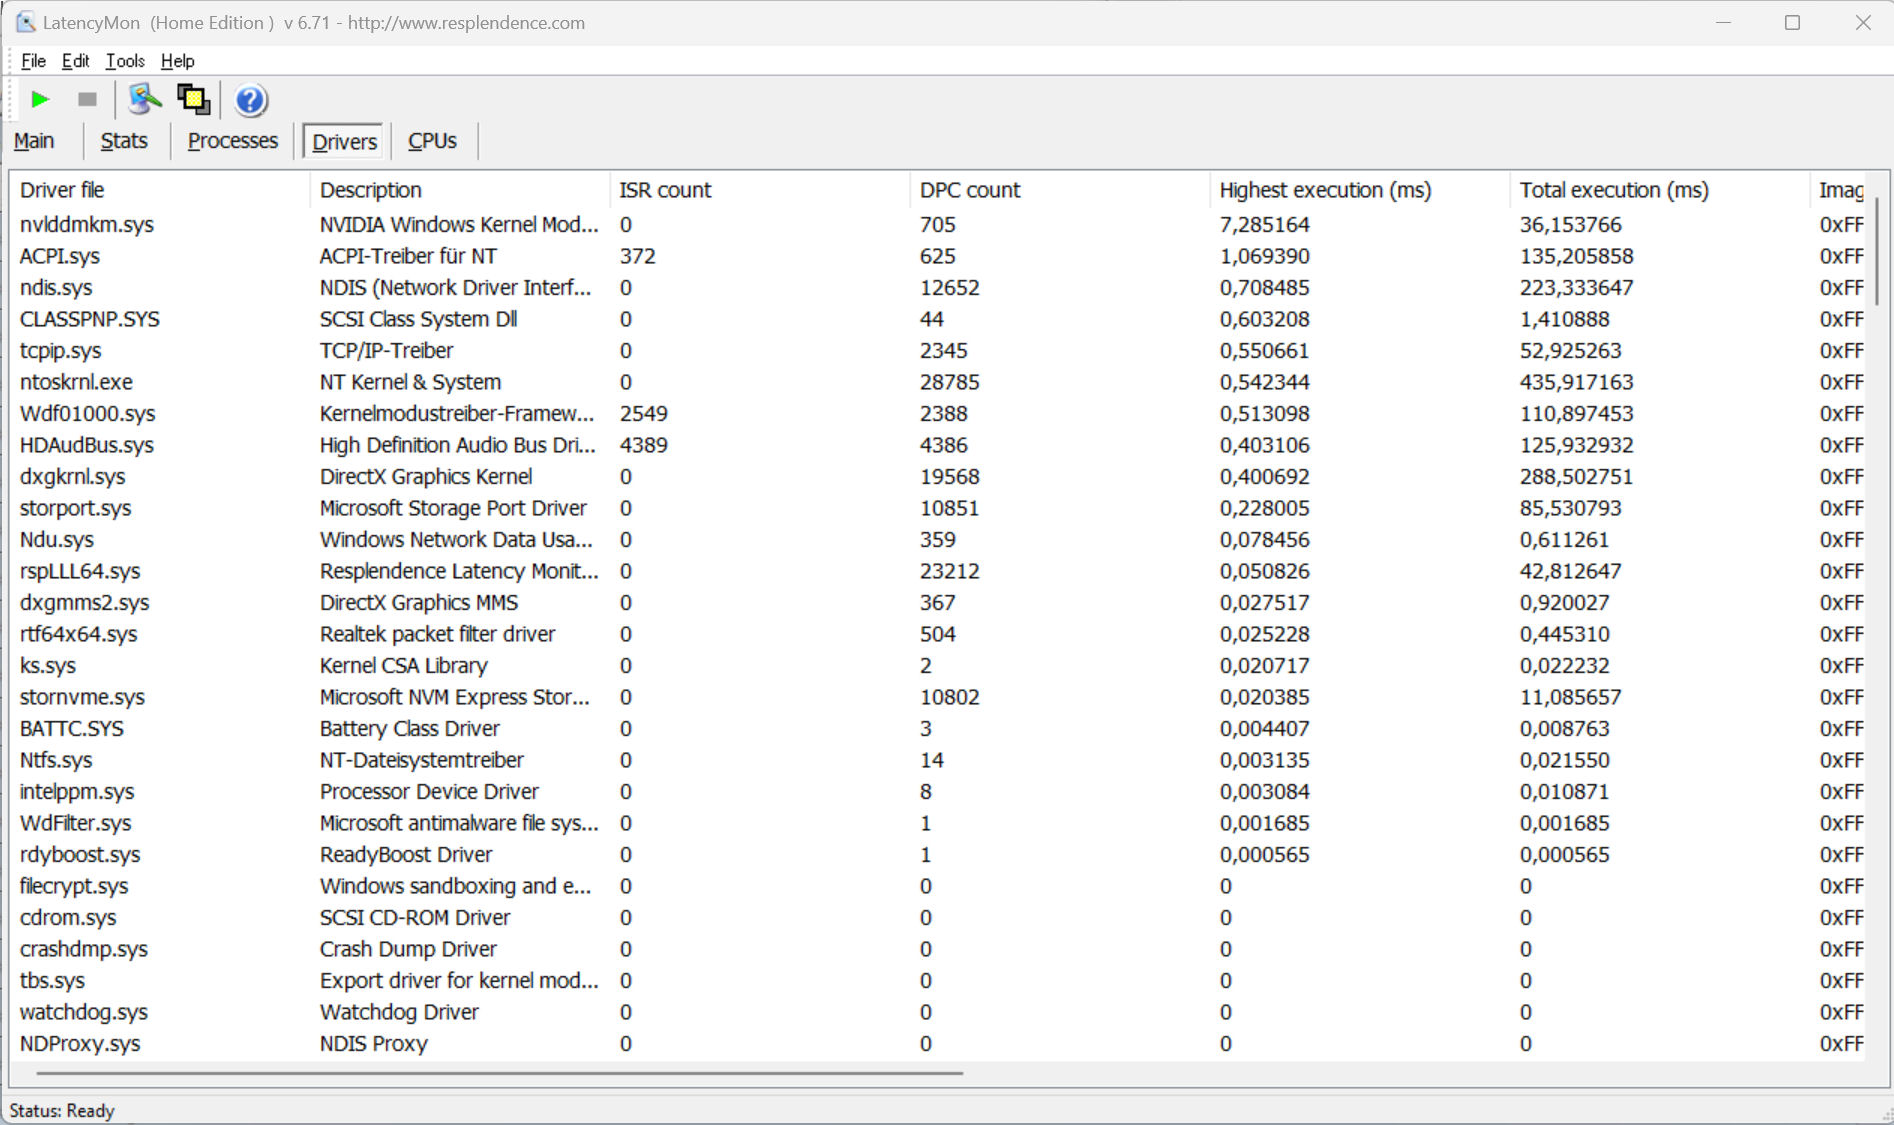
DPC-fördröjning
Vårt standardiserade latensmonitortest (webbsurfning, uppspelning av 4K-video, Prime95 hög belastning) avslöjade vissa problem med systemet. Även om den bärbara datorn inte har en alltför hög latenstid verkar den ha ett drivrutinsproblem. Förhoppningsvis kan framtida mjukvaruuppdateringar jämna ut problemet.
| DPC Latencies / LatencyMon - interrupt to process latency (max), Web, Youtube, Prime95 | |
| Acer Nitro 5 AN515-46-R1A1 | |
| Schenker XMG Fusion 15 (Mid 22) | |
| Aorus 15 XE5 | |
| MSI Katana GF66 12UGS | |
| Asus TUF Dash F15 FX517ZR | |
* ... mindre är bättre
Masslagring
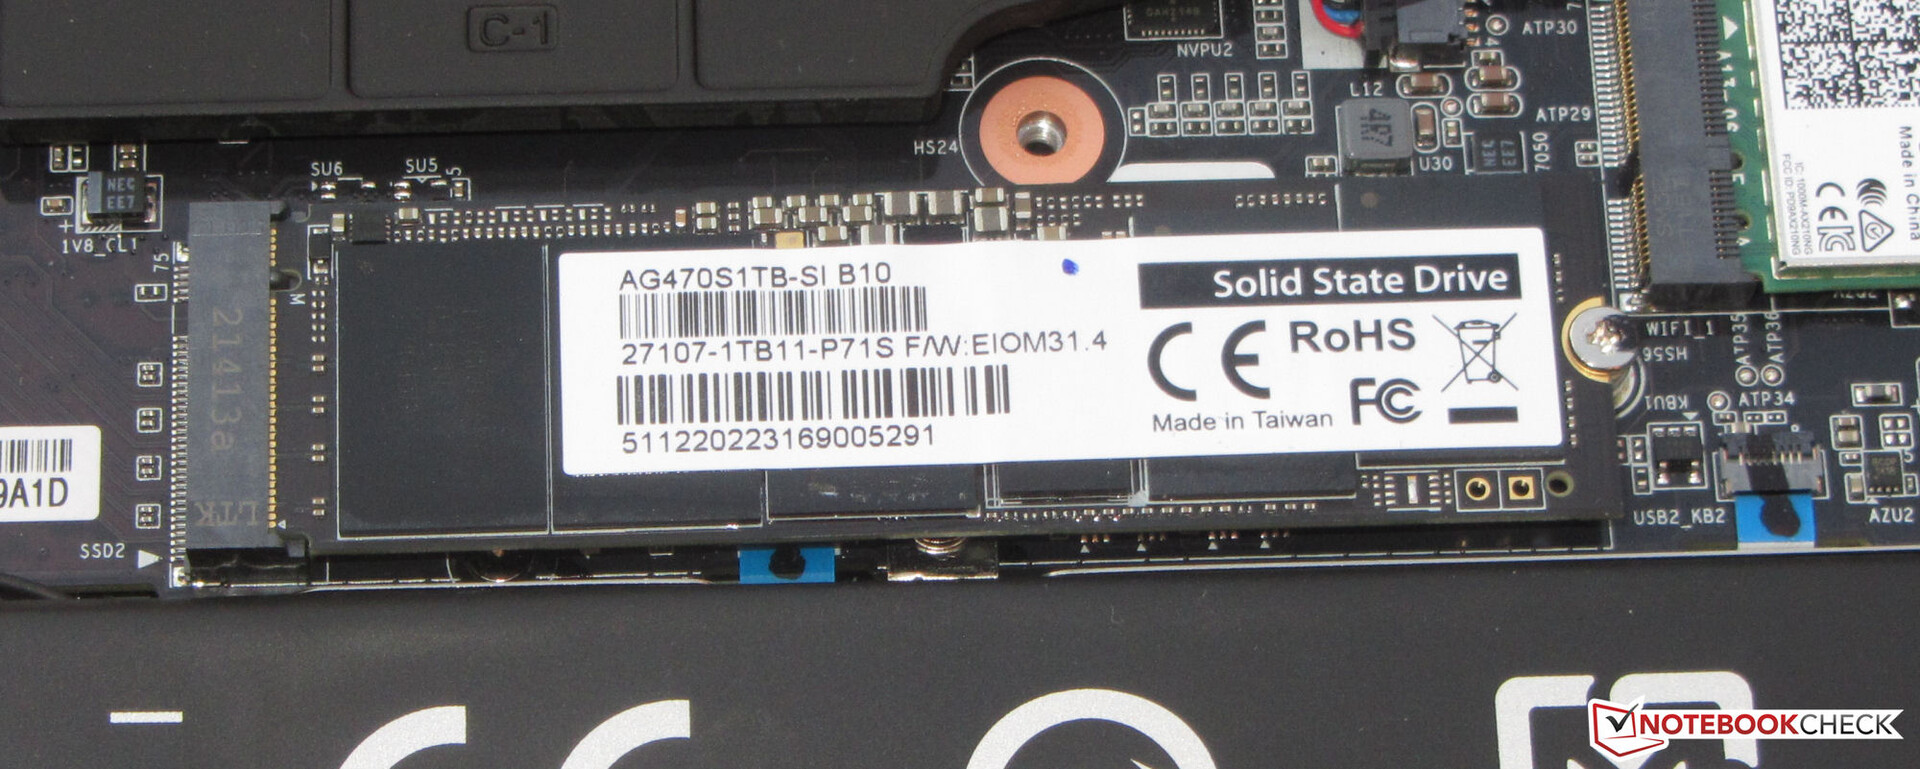
Gigabyte utrustade Aorus 15 XE5 med en PCIe 4.0 SSD (1 TB, M.2 2280) som företaget självt tillverkat. Den här lagringsenheten ger utmärkta överföringshastigheter. Den bärbara datorn har också en ledig M.2 2280-plats för att lägga till en andra PCIe 4.0 SSD.

* ... mindre är bättre
Sustained Read: DiskSpd Read Loop, Queue Depth 8
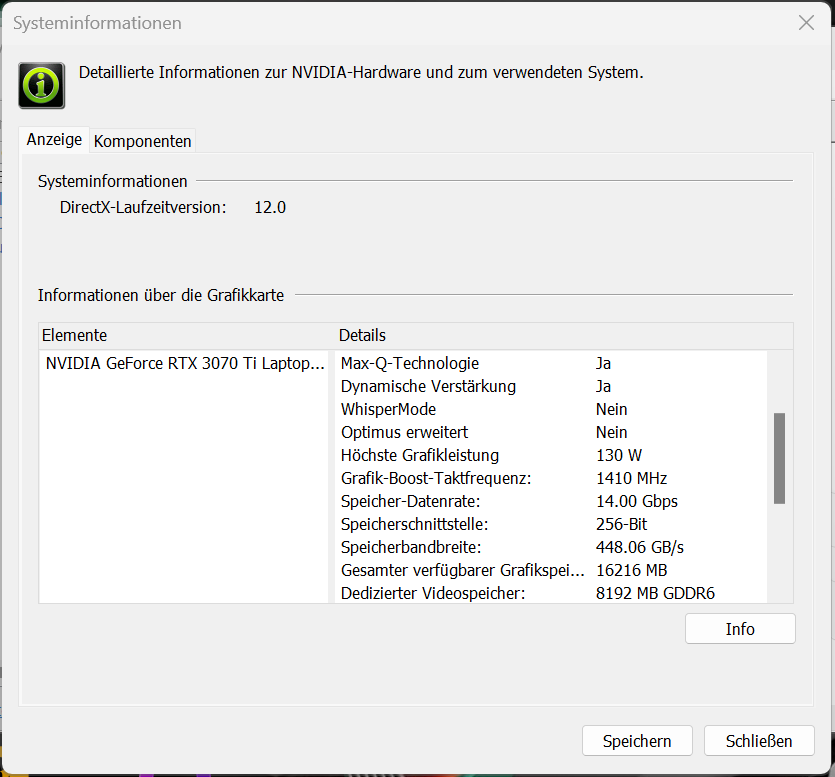
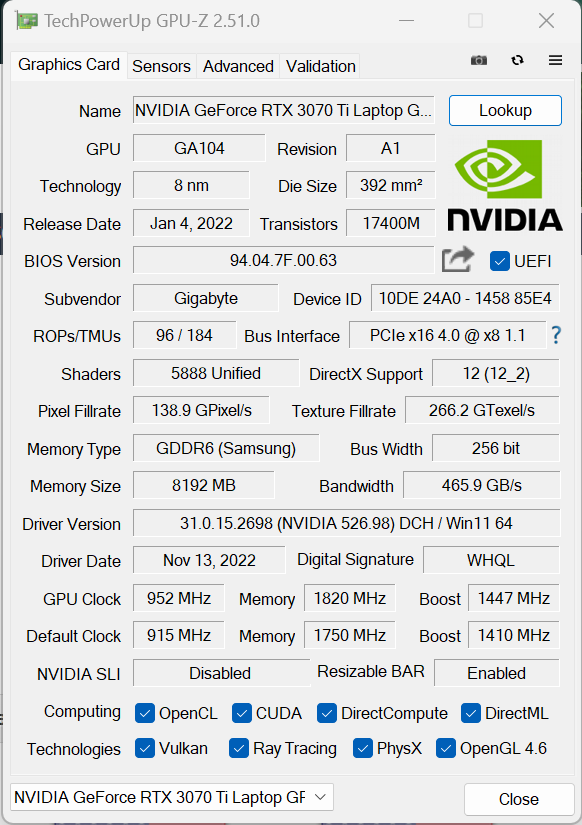
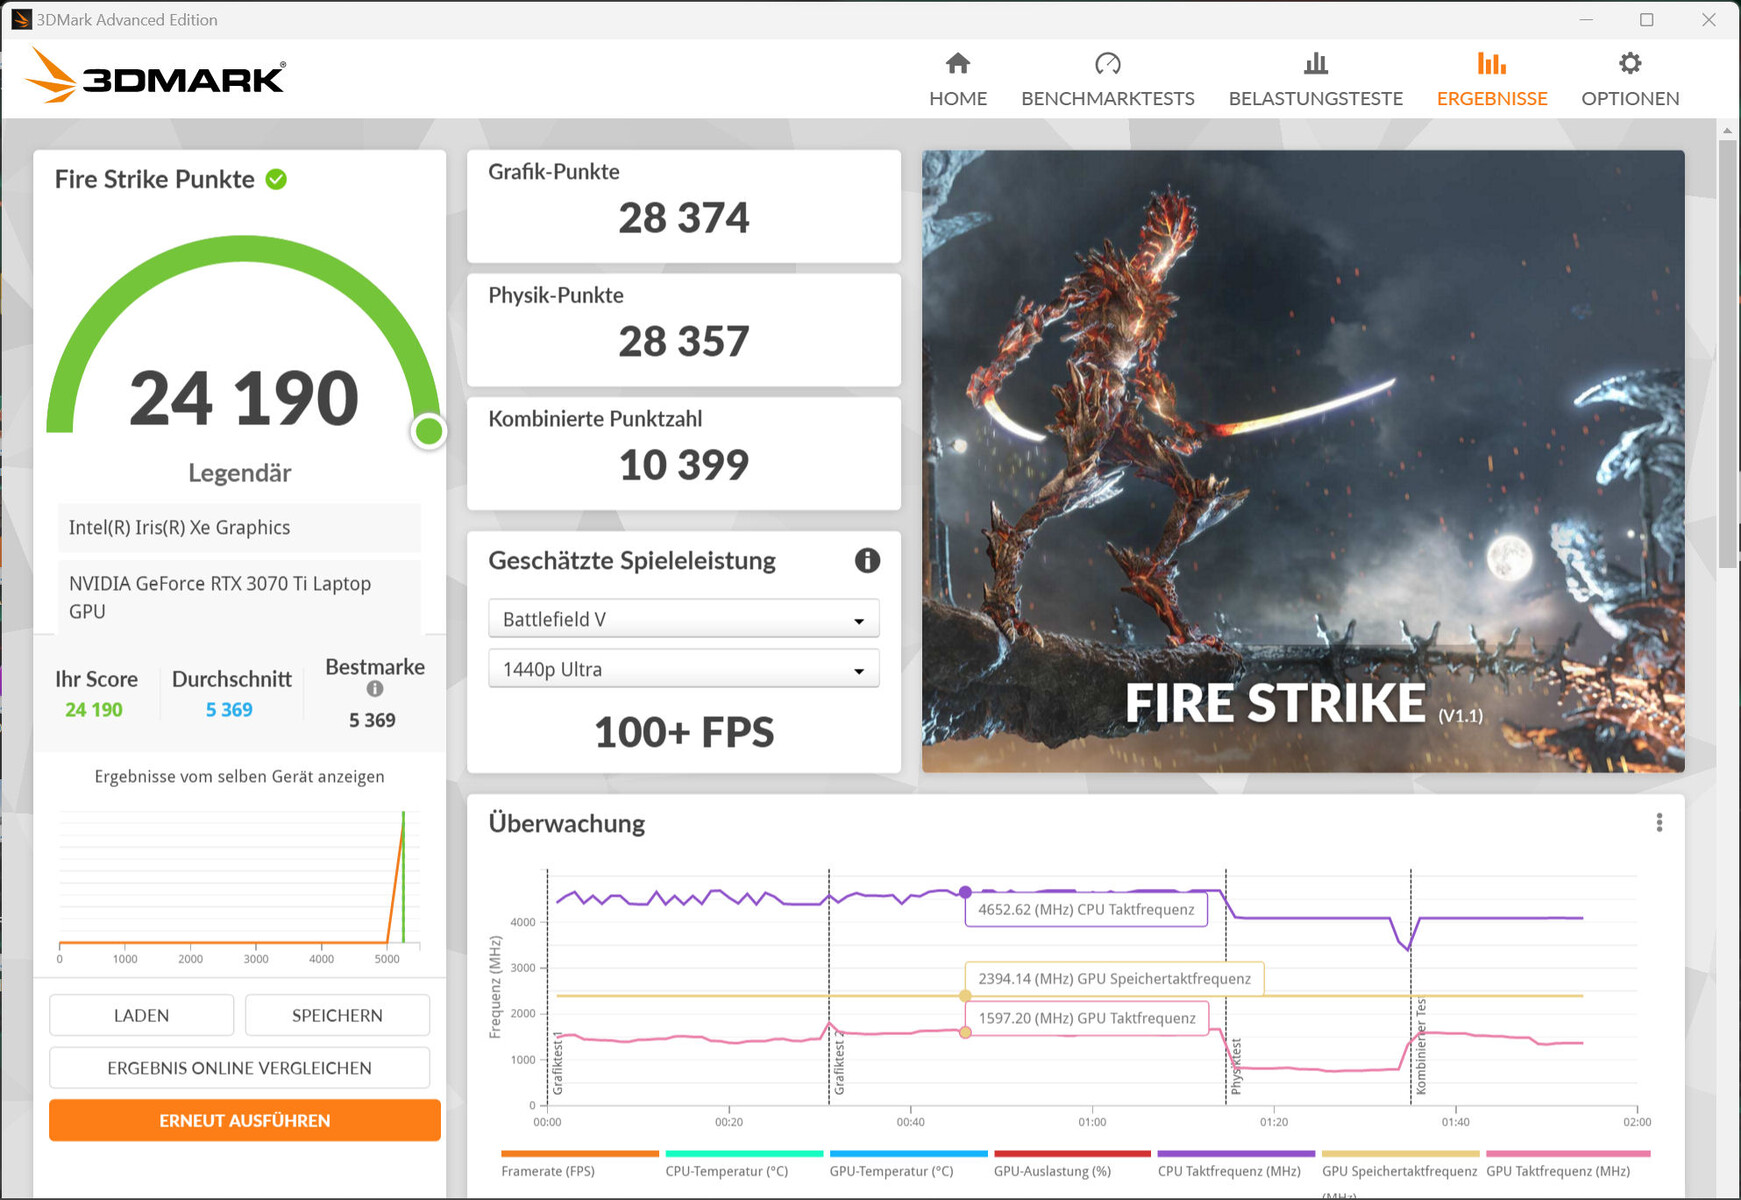
Grafikkort
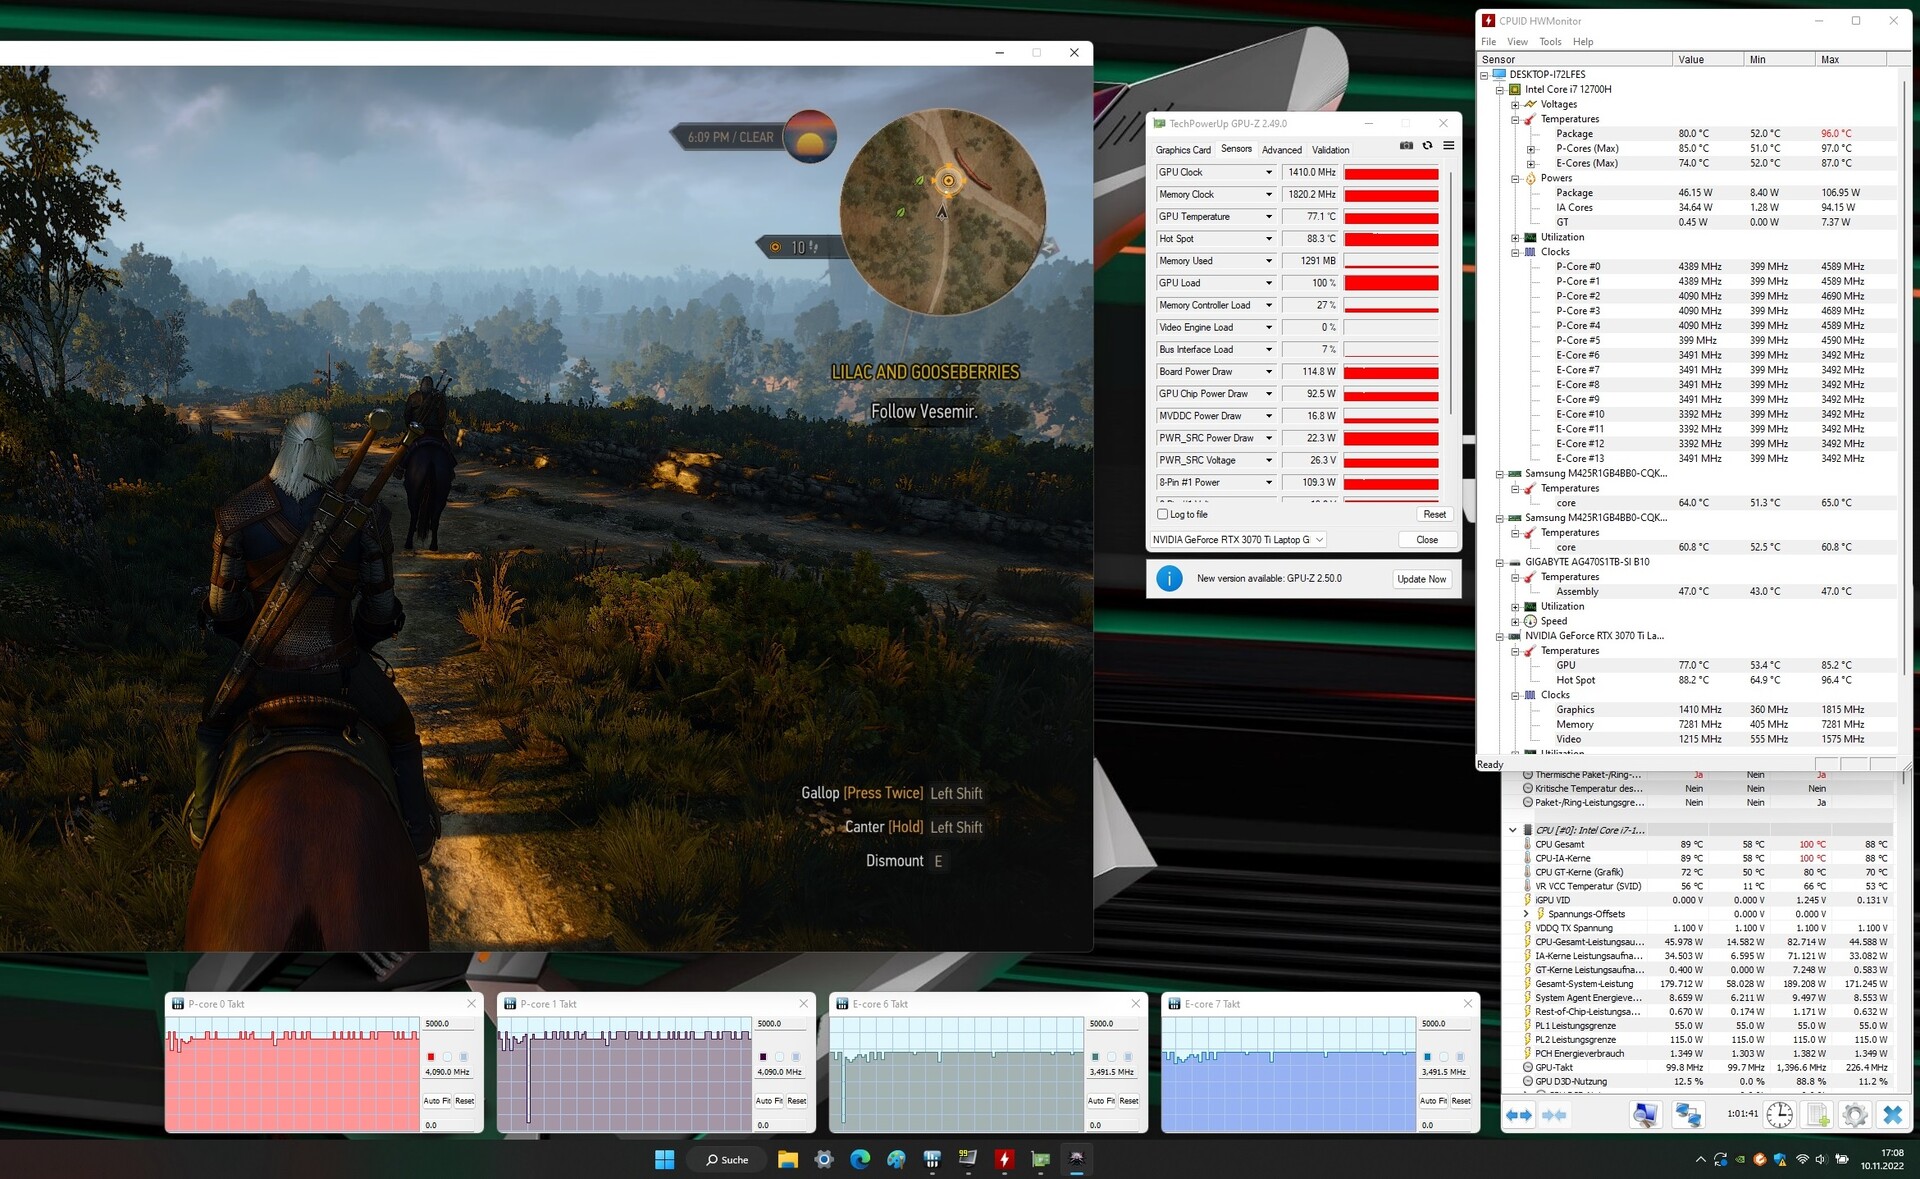
Den faktiska prestandan hos en grafikprocessor i RTX 30-serien beror på några faktorer: kylning, RAM-konfiguration och den TGP som anges av tillverkaren av en bärbar dator (inom de gränser som definieras av Nvidia). Gigabyte valde att ge RTX 3070 Ti Bärbar dator en TGP på 130 watt. Vårt test på Witcher 3 visar dock att systemet inte utnyttjar denna TGP fullt ut.
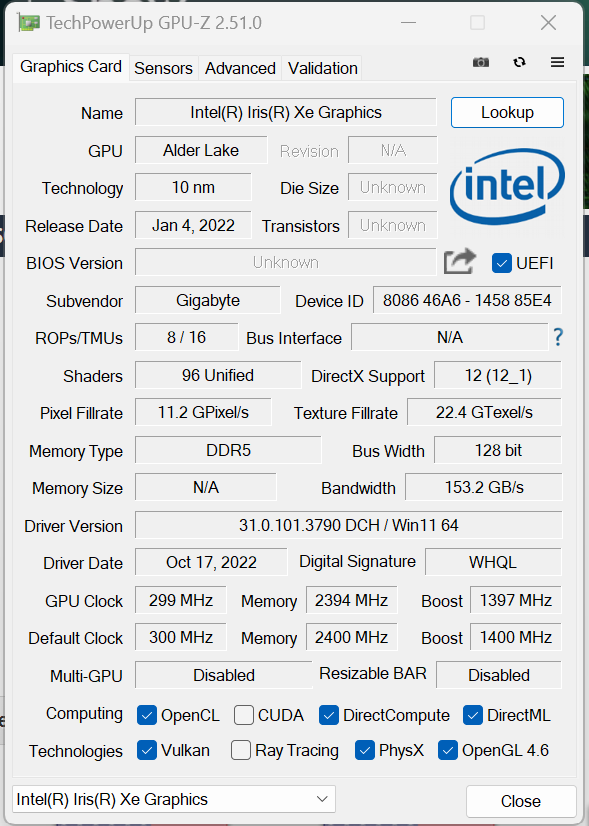
GPU:n i Aorus har tillgång till 8 192 MB snabbt GDDR6 VRAM och levererade något bättre 3DMark-resultat än vad vi i genomsnitt sett från RTX 3070 Ti. Den integrerade Iris Xe Graphics G7 96EU är aktiv; den bärbara datorn använder Nvidias Optimus grafikomkopplingsteknik och erbjuder inget dGPU-läge.
| 3DMark Performance rating - Percent | |
| Genomsnitt av klass Gaming | |
| Acer Nitro 5 AN515-46-R1A1 | |
| Aorus 15 XE5 | |
| Aorus 15 XE5 | |
| Genomsnitt NVIDIA GeForce RTX 3070 Ti Laptop GPU | |
| MSI Katana GF66 12UGS | |
| Schenker XMG Fusion 15 (Mid 22) | |
| Asus TUF Dash F15 FX517ZR | |
| 3DMark 11 - 1280x720 Performance GPU | |
| Genomsnitt av klass Gaming (21841 - 80022, n=104, senaste 2 åren) | |
| Aorus 15 XE5 (Turbo Mode) | |
| Aorus 15 XE5 | |
| Acer Nitro 5 AN515-46-R1A1 | |
| Genomsnitt NVIDIA GeForce RTX 3070 Ti Laptop GPU (13799 - 42569, n=36) | |
| MSI Katana GF66 12UGS | |
| Schenker XMG Fusion 15 (Mid 22) | |
| Asus TUF Dash F15 FX517ZR | |
| 3DMark | |
| 1920x1080 Fire Strike Graphics | |
| Genomsnitt av klass Gaming (12242 - 62849, n=115, senaste 2 åren) | |
| Acer Nitro 5 AN515-46-R1A1 | |
| Aorus 15 XE5 (Turbo Mode) | |
| Aorus 15 XE5 | |
| Genomsnitt NVIDIA GeForce RTX 3070 Ti Laptop GPU (22612 - 32550, n=37) | |
| MSI Katana GF66 12UGS | |
| Schenker XMG Fusion 15 (Mid 22) | |
| Asus TUF Dash F15 FX517ZR | |
| 2560x1440 Time Spy Graphics | |
| Genomsnitt av klass Gaming (5012 - 26212, n=115, senaste 2 åren) | |
| Acer Nitro 5 AN515-46-R1A1 | |
| Aorus 15 XE5 | |
| Aorus 15 XE5 (Turbo Mode) | |
| Genomsnitt NVIDIA GeForce RTX 3070 Ti Laptop GPU (8142 - 12324, n=37) | |
| MSI Katana GF66 12UGS | |
| Schenker XMG Fusion 15 (Mid 22) | |
| Asus TUF Dash F15 FX517ZR | |
| 2560x1440 Port Royal Graphics | |
| Genomsnitt av klass Gaming (4395 - 17286, n=71, senaste 2 åren) | |
| Acer Nitro 5 AN515-46-R1A1 | |
| Aorus 15 XE5 (Turbo Mode) | |
| Aorus 15 XE5 | |
| Genomsnitt NVIDIA GeForce RTX 3070 Ti Laptop GPU (5091 - 7510, n=23) | |
| MSI Katana GF66 12UGS | |
| Schenker XMG Fusion 15 (Mid 22) | |
| Asus TUF Dash F15 FX517ZR | |
| 3DMark 06 Standard Score | 51253 poäng | |
| 3DMark 11 Performance | 32155 poäng | |
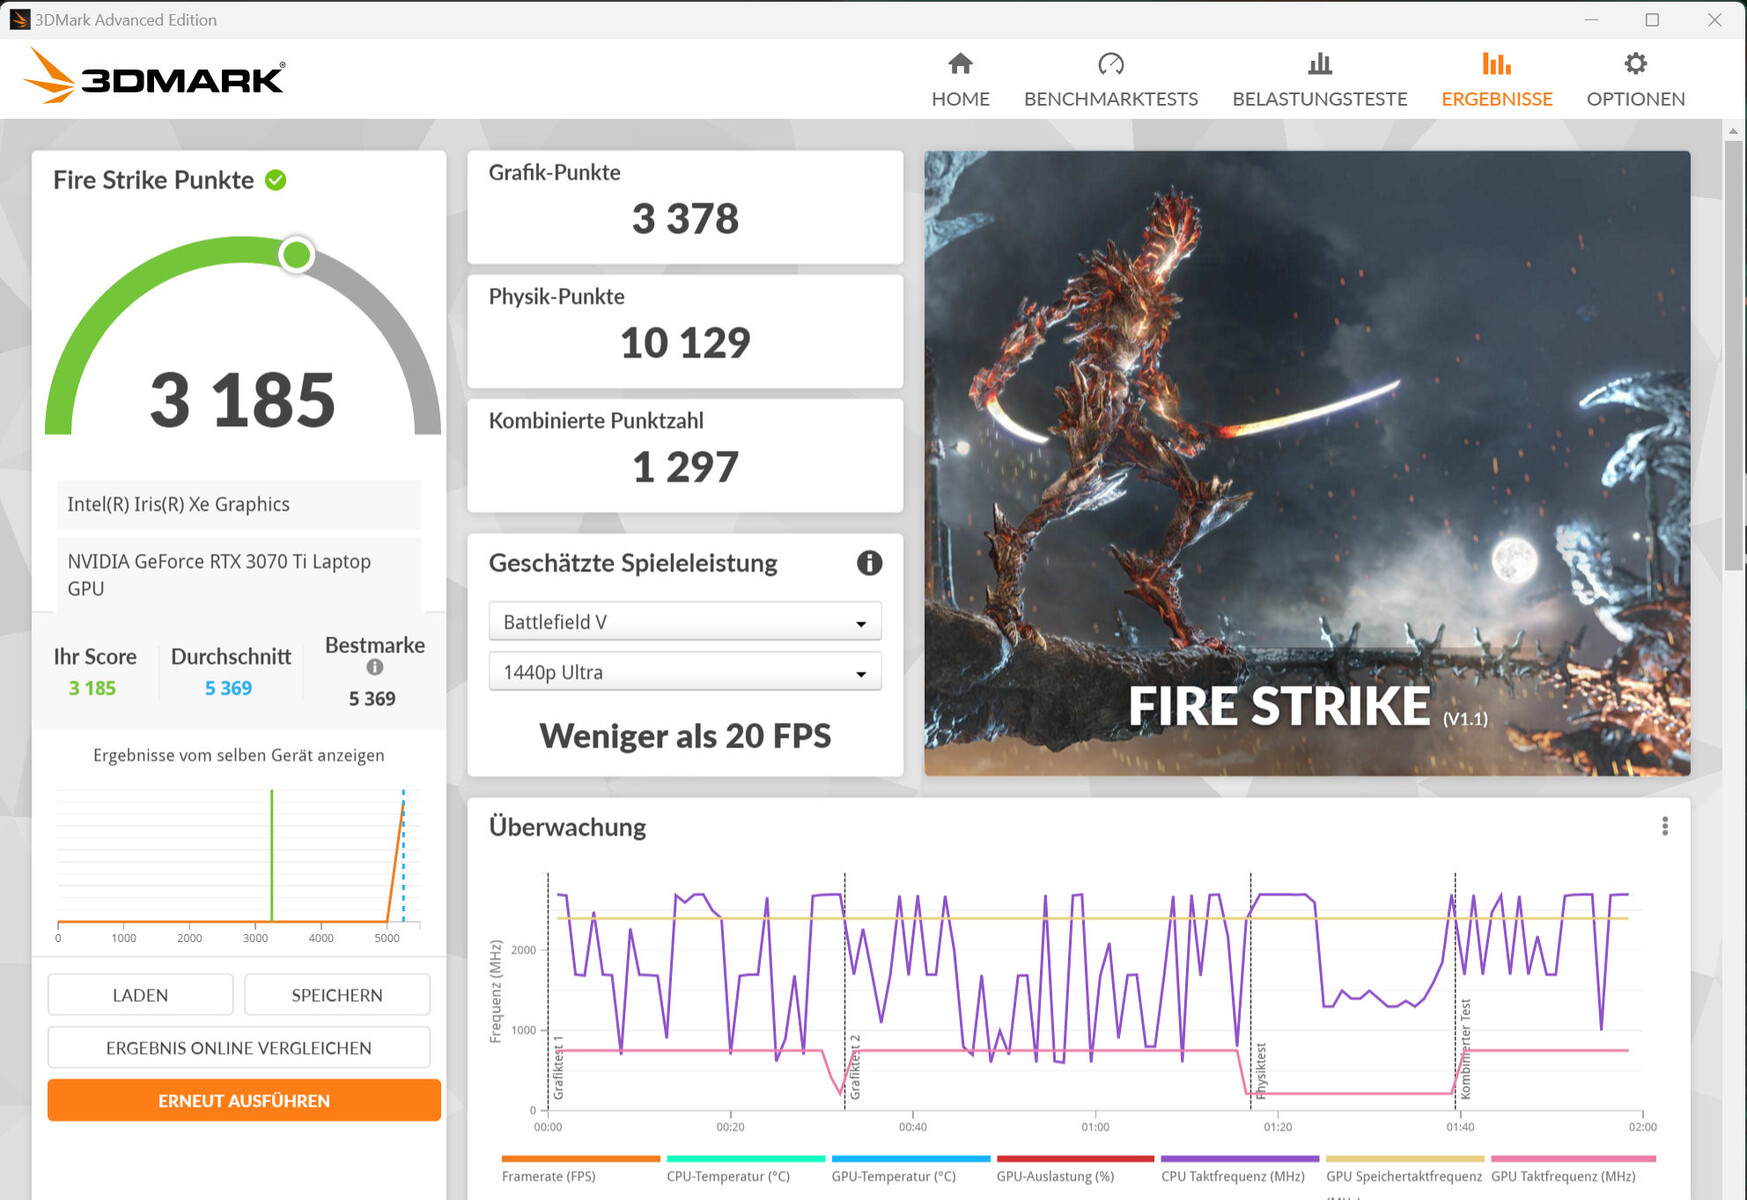
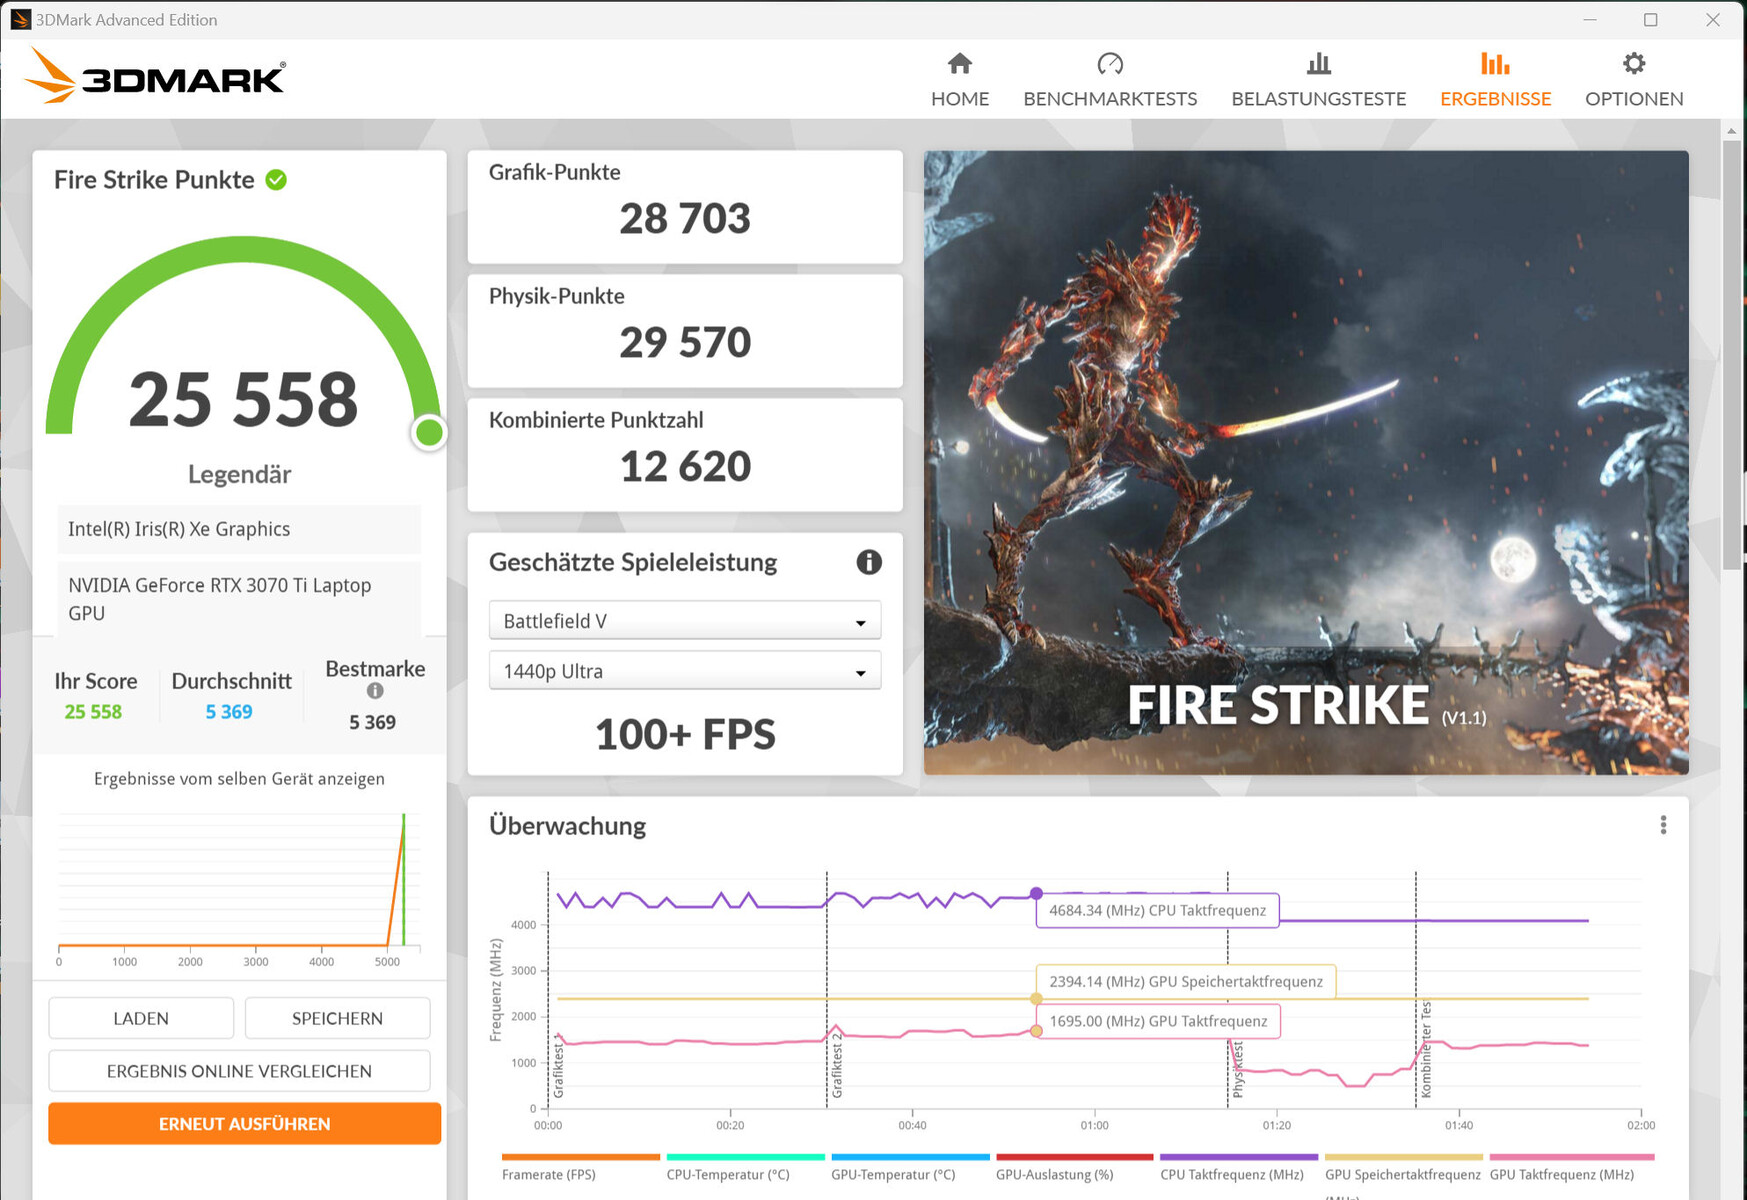
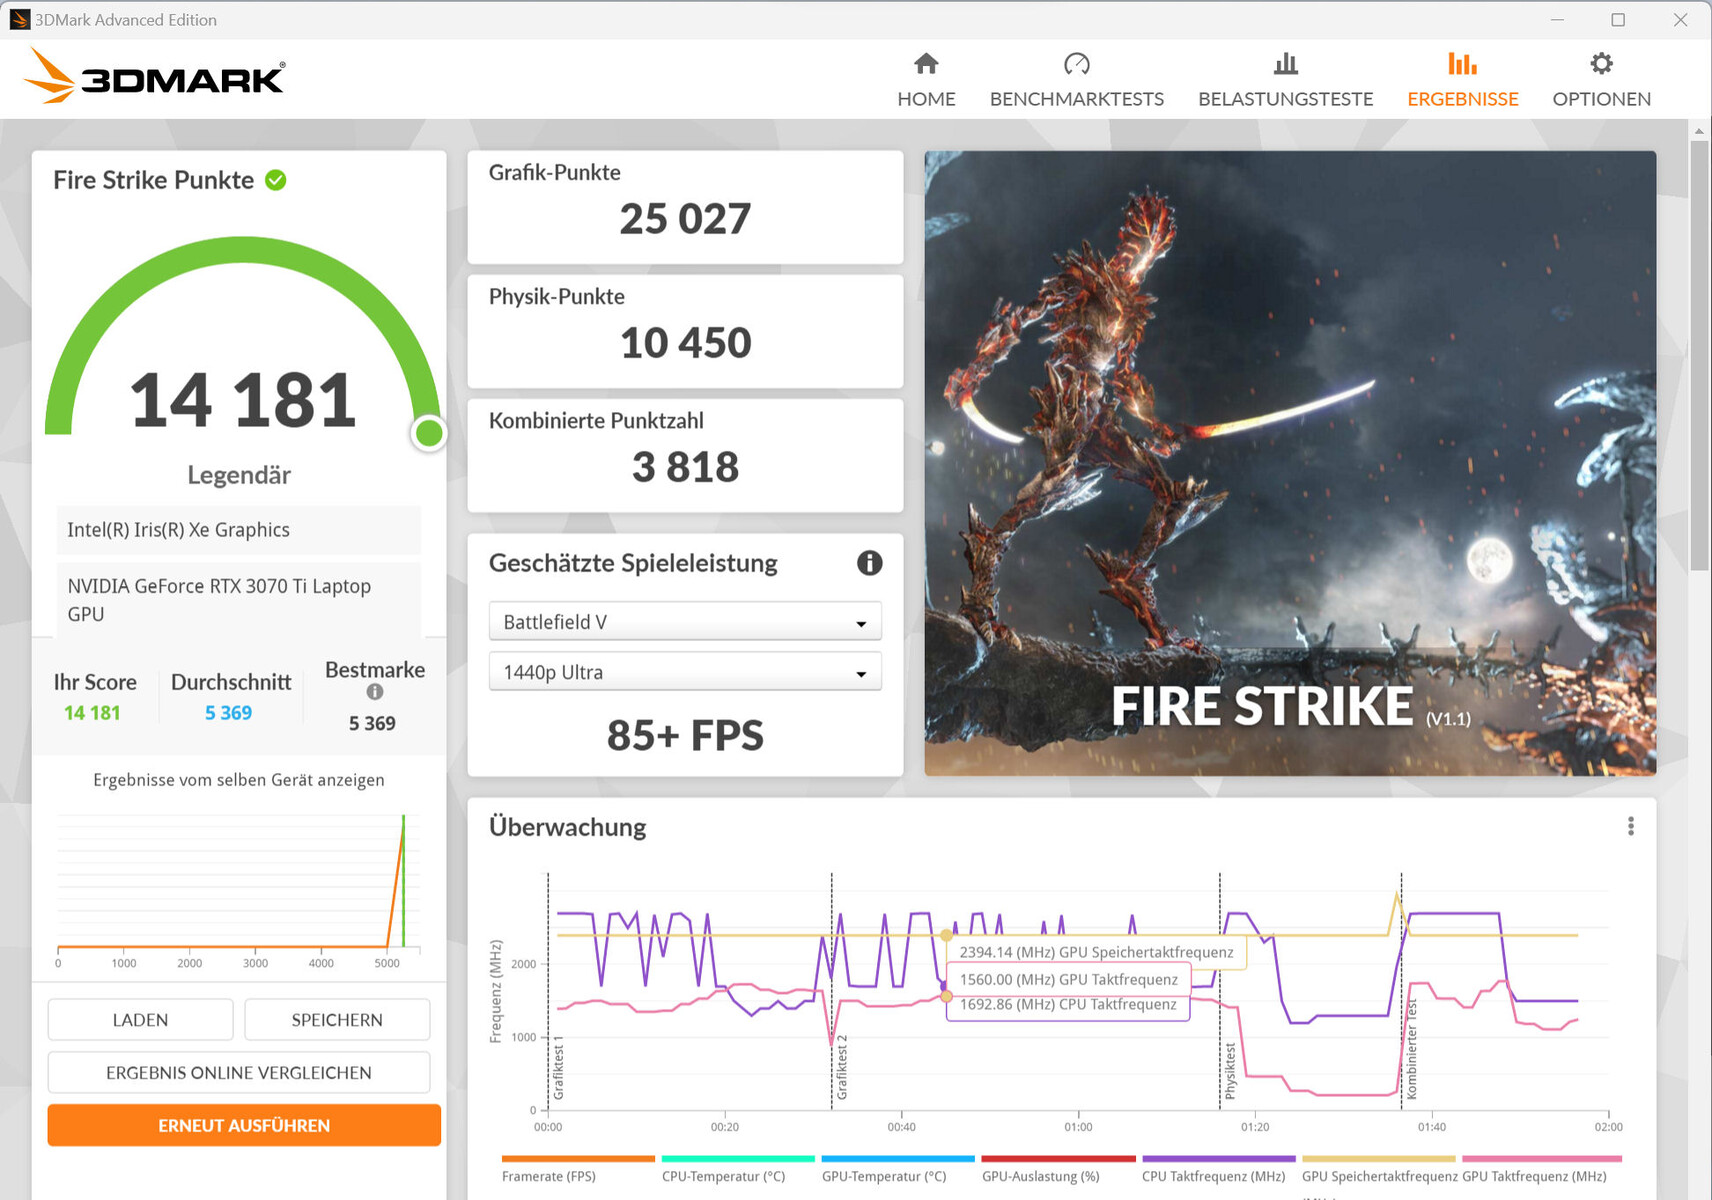
| 3DMark Fire Strike Score | 24190 poäng | |
| 3DMark Time Spy Score | 10840 poäng | |
Hjälp | ||
| Blender | |
| v3.3 Classroom OPTIX/RTX | |
| Asus TUF Dash F15 FX517ZR | |
| Genomsnitt NVIDIA GeForce RTX 3070 Ti Laptop GPU (22 - 30, n=15) | |
| Acer Nitro 5 AN515-46-R1A1 (3.3.0) | |
| Aorus 15 XE5 (3.3.0) | |
| Aorus 15 XE5 (3.3.0, Turbo Mode) | |
| Genomsnitt av klass Gaming (9 - 32, n=106, senaste 2 åren) | |
| v3.3 Classroom CUDA | |
| Asus TUF Dash F15 FX517ZR | |
| Genomsnitt NVIDIA GeForce RTX 3070 Ti Laptop GPU (36 - 46, n=16) | |
| Acer Nitro 5 AN515-46-R1A1 (3.3.0) | |
| Aorus 15 XE5 (3.3.0) | |
| Aorus 15 XE5 (3.3.0, Turbo Mode) | |
| Genomsnitt av klass Gaming (15 - 228, n=106, senaste 2 åren) | |
| v3.3 Classroom CPU | |
| Schenker XMG Fusion 15 (Mid 22) | |
| Asus TUF Dash F15 FX517ZR | |
| Aorus 15 XE5 (3.3.0) | |
| Acer Nitro 5 AN515-46-R1A1 (3.3.0) | |
| Genomsnitt NVIDIA GeForce RTX 3070 Ti Laptop GPU (285 - 459, n=16) | |
| Aorus 15 XE5 (3.3.0, Turbo Mode) | |
| Genomsnitt av klass Gaming (122 - 565, n=102, senaste 2 åren) | |
* ... mindre är bättre
Spelprestanda
Hårdvaran i den bärbara datorn klarar av att köra spel i QHD och med höga till maximala inställningar. Du kan också spela spel i högre upplösningar om du ansluter enheten till en lämplig skärm - även om detta ibland kan kräva att du sänker inställningarna. På Aorus 15 XE5 körde de spel vi använde för testning vanligtvis med högre bildfrekvenser än vad RTX 3070 Ti kan producera i genomsnitt. I vissa fall ledde aktivering av "Turbo Mode" till en liten ökning av bildfrekvensen.
| Performance rating - Percent | |
| Genomsnitt av klass Gaming | |
| Aorus 15 XE5 | |
| MSI Katana GF66 12UGS | |
| Schenker XMG Fusion 15 (Mid 22) | |
| Asus TUF Dash F15 FX517ZR | |
| Acer Nitro 5 AN515-46-R1A1 | |
| The Witcher 3 - 1920x1080 Ultra Graphics & Postprocessing (HBAO+) | |
| Genomsnitt av klass Gaming (104.7 - 240, n=7, senaste 2 åren) | |
| Acer Nitro 5 AN515-46-R1A1 | |
| Aorus 15 XE5 | |
| MSI Katana GF66 12UGS | |
| Schenker XMG Fusion 15 (Mid 22) | |
| Asus TUF Dash F15 FX517ZR | |
| GTA V - 1920x1080 Highest AA:4xMSAA + FX AF:16x | |
| Genomsnitt av klass Gaming (48.3 - 186.9, n=94, senaste 2 åren) | |
| Aorus 15 XE5 | |
| Asus TUF Dash F15 FX517ZR | |
| MSI Katana GF66 12UGS | |
| Schenker XMG Fusion 15 (Mid 22) | |
| Acer Nitro 5 AN515-46-R1A1 | |
| Final Fantasy XV Benchmark - 1920x1080 High Quality | |
| Genomsnitt av klass Gaming (41 - 215, n=95, senaste 2 åren) | |
| Acer Nitro 5 AN515-46-R1A1 | |
| Aorus 15 XE5 | |
| Schenker XMG Fusion 15 (Mid 22) | |
| MSI Katana GF66 12UGS | |
| Asus TUF Dash F15 FX517ZR | |
| Strange Brigade - 1920x1080 ultra AA:ultra AF:16 | |
| Genomsnitt av klass Gaming (76.3 - 458, n=87, senaste 2 åren) | |
| Aorus 15 XE5 | |
| Acer Nitro 5 AN515-46-R1A1 | |
| MSI Katana GF66 12UGS | |
| Schenker XMG Fusion 15 (Mid 22) | |
| Asus TUF Dash F15 FX517ZR | |
| Dota 2 Reborn - 1920x1080 ultra (3/3) best looking | |
| Genomsnitt av klass Gaming (84.8 - 248, n=107, senaste 2 åren) | |
| Aorus 15 XE5 | |
| MSI Katana GF66 12UGS | |
| Schenker XMG Fusion 15 (Mid 22) | |
| Asus TUF Dash F15 FX517ZR | |
| Acer Nitro 5 AN515-46-R1A1 | |
| X-Plane 11.11 - 1920x1080 high (fps_test=3) | |
| Aorus 15 XE5 | |
| MSI Katana GF66 12UGS | |
| Asus TUF Dash F15 FX517ZR | |
| Genomsnitt av klass Gaming (55.5 - 143.5, n=109, senaste 2 åren) | |
| Schenker XMG Fusion 15 (Mid 22) | |
| Acer Nitro 5 AN515-46-R1A1 | |
| Performance rating - Percent | |
| Genomsnitt av klass Gaming -5! | |
| Aorus 15 XE5 | |
| Genomsnitt NVIDIA GeForce RTX 3070 Ti Laptop GPU | |
| Aorus 15 XE5 -6! | |
| Acer Nitro 5 AN515-46-R1A1 -4! | |
| MSI Katana GF66 12UGS -6! | |
| Schenker XMG Fusion 15 (Mid 22) -6! | |
| Asus TUF Dash F15 FX517ZR -6! | |
| The Witcher 3 - 1920x1080 Ultra Graphics & Postprocessing (HBAO+) | |
| Genomsnitt av klass Gaming (104.7 - 240, n=7, senaste 2 åren) | |
| Acer Nitro 5 AN515-46-R1A1 | |
| Aorus 15 XE5 (Turbo Mode) | |
| Genomsnitt NVIDIA GeForce RTX 3070 Ti Laptop GPU (76.8 - 124.1, n=39) | |
| Aorus 15 XE5 | |
| MSI Katana GF66 12UGS | |
| Schenker XMG Fusion 15 (Mid 22) | |
| Asus TUF Dash F15 FX517ZR | |
| GTA V - 1920x1080 Highest AA:4xMSAA + FX AF:16x | |
| Genomsnitt av klass Gaming (48.3 - 186.9, n=94, senaste 2 åren) | |
| Aorus 15 XE5 (Turbo Mode) | |
| Aorus 15 XE5 | |
| Genomsnitt NVIDIA GeForce RTX 3070 Ti Laptop GPU (44 - 123.9, n=36) | |
| Asus TUF Dash F15 FX517ZR | |
| MSI Katana GF66 12UGS | |
| Schenker XMG Fusion 15 (Mid 22) | |
| Acer Nitro 5 AN515-46-R1A1 | |
| Final Fantasy XV Benchmark - 1920x1080 High Quality | |
| Genomsnitt av klass Gaming (41 - 215, n=95, senaste 2 åren) | |
| Acer Nitro 5 AN515-46-R1A1 (1.3) | |
| Aorus 15 XE5 (1.3, Turbo Mode) | |
| Aorus 15 XE5 (1.3) | |
| Genomsnitt NVIDIA GeForce RTX 3070 Ti Laptop GPU (49.5 - 122.4, n=35) | |
| Schenker XMG Fusion 15 (Mid 22) (1.3) | |
| MSI Katana GF66 12UGS (1.3) | |
| Asus TUF Dash F15 FX517ZR (1.3) | |
| Strange Brigade - 1920x1080 ultra AA:ultra AF:16 | |
| Genomsnitt av klass Gaming (76.3 - 458, n=87, senaste 2 åren) | |
| Aorus 15 XE5 (1.47.22.14 D3D12, Turbo Mode) | |
| Aorus 15 XE5 (1.47.22.14 D3D12) | |
| Genomsnitt NVIDIA GeForce RTX 3070 Ti Laptop GPU (109 - 221, n=37) | |
| Acer Nitro 5 AN515-46-R1A1 (1.47.22.14 D3D12) | |
| MSI Katana GF66 12UGS (1.47.22.14 D3D12) | |
| Schenker XMG Fusion 15 (Mid 22) (1.47.22.14 D3D12) | |
| Asus TUF Dash F15 FX517ZR (1.47.22.14 D3D12) | |
| Dota 2 Reborn - 1920x1080 ultra (3/3) best looking | |
| Genomsnitt av klass Gaming (84.8 - 248, n=107, senaste 2 åren) | |
| Aorus 15 XE5 | |
| Aorus 15 XE5 (Turbo Mode) | |
| MSI Katana GF66 12UGS | |
| Genomsnitt NVIDIA GeForce RTX 3070 Ti Laptop GPU (68.7 - 160.5, n=38) | |
| Schenker XMG Fusion 15 (Mid 22) | |
| Asus TUF Dash F15 FX517ZR | |
| Acer Nitro 5 AN515-46-R1A1 | |
| X-Plane 11.11 - 1920x1080 high (fps_test=3) | |
| Aorus 15 XE5 | |
| Aorus 15 XE5 (Turbo Mode) | |
| MSI Katana GF66 12UGS | |
| Asus TUF Dash F15 FX517ZR | |
| Genomsnitt av klass Gaming (55.5 - 143.5, n=109, senaste 2 åren) | |
| Genomsnitt NVIDIA GeForce RTX 3070 Ti Laptop GPU (51.6 - 116.9, n=37) | |
| Schenker XMG Fusion 15 (Mid 22) | |
| Acer Nitro 5 AN515-46-R1A1 | |
| F1 22 - 1920x1080 Ultra High Preset AA:T AF:16x | |
| Genomsnitt av klass Gaming (40.1 - 121.2, n=4, senaste 2 åren) | |
| Acer Nitro 5 AN515-46-R1A1 (923662) | |
| Genomsnitt NVIDIA GeForce RTX 3070 Ti Laptop GPU (58.1 - 80, n=8) | |
| Aorus 15 XE5 (928484, Turbo Mode) | |
| Aorus 15 XE5 (928484) | |
| The Quarry - 1920x1080 Ultra Preset | |
| Acer Nitro 5 AN515-46-R1A1 | |
| Genomsnitt NVIDIA GeForce RTX 3070 Ti Laptop GPU (80 - 81.5, n=2) | |
| Aorus 15 XE5 | |
| A Plague Tale Requiem - 1920x1080 Ultra Preset | |
| Genomsnitt NVIDIA GeForce RTX 3070 Ti Laptop GPU (61.9 - 62.9, n=2) | |
| Aorus 15 XE5 | |
| Uncharted Legacy of Thieves Collection - 1920x1080 Ultra Preset | |
| Aorus 15 XE5 | |
| Genomsnitt NVIDIA GeForce RTX 3070 Ti Laptop GPU (69.3 - 72.4, n=2) | |
| Call of Duty Modern Warfare 2 2022 - 1920x1080 Extreme Quality Preset AA:T2X Filmic SM | |
| Aorus 15 XE5 | |
| Genomsnitt NVIDIA GeForce RTX 3070 Ti Laptop GPU (84 - 86, n=3) | |
| Spider-Man Miles Morales - 1920x1080 Very High Preset AA:T | |
| Genomsnitt NVIDIA GeForce RTX 3070 Ti Laptop GPU (91 - 93.2, n=2) | |
| Aorus 15 XE5 | |
För att ta reda på om den bärbara datorn kan köra spel med konstant bildfrekvens under en längre tid körde vi "The Witcher 3" i ungefär 60 minuter i Full HD-upplösning och med högsta kvalitetsinställningar, utan att flytta spelarens karaktär. Resultatet: det fanns inga nedgångar i bildfrekvensen.
Witcher 3 FPS chart
| låg | med. | hög | ultra | QHD | |
|---|---|---|---|---|---|
| GTA V (2015) | 186.4 | 182.3 | 176.4 | 115.6 | 99.9 |
| The Witcher 3 (2015) | 357 | 300 | 183.2 | 100.1 | |
| Dota 2 Reborn (2015) | 168.4 | 158 | 148.4 | 140.8 | |
| Final Fantasy XV Benchmark (2018) | 196.3 | 138.8 | 104.6 | 79.2 | |
| X-Plane 11.11 (2018) | 142 | 130.7 | 105.3 | ||
| Far Cry 5 (2018) | 166 | 144 | 137 | 129 | 103 |
| Strange Brigade (2018) | 445 | 255 | 212 | 188.5 | 140.9 |
| F1 22 (2022) | 220 | 215 | 181.3 | 64.2 | 42.7 |
| The Quarry (2022) | 156.2 | 119.1 | 98.4 | 80 | 56.1 |
| A Plague Tale Requiem (2022) | 93.8 | 81.8 | 71.1 | 61.9 | 48.6 |
| Uncharted Legacy of Thieves Collection (2022) | 81 | 80.2 | 75.4 | 72.4 | 55.5 |
| Call of Duty Modern Warfare 2 2022 (2022) | 127 | 111 | 87 | 86 | 61 |
| Spider-Man Miles Morales (2022) | 108.2 | 103.8 | 93 | 91 | 73.5 |
Utsläpp - Viss förbättring krävs
Bullerutsläpp
Vid vardaglig användning (t.ex. kontorsprogram, webbsurfning) och vid tomgång är de två fläktarna i den bärbara datorn relativt tysta och ibland snurrar de inte ens alls. Vid medelhög till hög belastning blev systemet ganska högljutt, med ljudnivåer som nådde upp till 52 dB(A) under stresstestet och Witcher 3 -testet. I Gigabyte Control Center kan användaren justera fläkthastigheterna och konfigurera fläktkurvor.
Ljudnivå
| Låg belastning |
| 26 / 28 / 30 dB(A) |
| Hög belastning |
| 48 / 52 dB(A) |
 | ||
30 dB tyst 40 dB(A) hörbar 50 dB(A) högt ljud |
||
min: | ||
| Aorus 15 XE5 i7-12700H, GeForce RTX 3070 Ti Laptop GPU | Acer Nitro 5 AN515-46-R1A1 R7 6800H, GeForce RTX 3070 Ti Laptop GPU | Schenker XMG Fusion 15 (Mid 22) i7-11800H, GeForce RTX 3070 Laptop GPU | Asus TUF Dash F15 FX517ZR i7-12650H, GeForce RTX 3070 Laptop GPU | MSI Katana GF66 12UGS i7-12700H, GeForce RTX 3070 Ti Laptop GPU | |
|---|---|---|---|---|---|
| Noise | -9% | 2% | -2% | 3% | |
| av / miljö * (dB) | 24 | 25 -4% | 26 -8% | 26 -8% | 26 -8% |
| Idle Minimum * (dB) | 26 | 25 4% | 26 -0% | 26 -0% | 27 -4% |
| Idle Average * (dB) | 28 | 28.6 -2% | 28 -0% | 32 -14% | 28 -0% |
| Idle Maximum * (dB) | 30 | 44.3 -48% | 31 -3% | 33 -10% | 31 -3% |
| Load Average * (dB) | 48 | 47.6 1% | 45 6% | 48 -0% | 44 8% |
| Witcher 3 ultra * (dB) | 52 | 46 12% | 47 10% | 44 15% | |
| Load Maximum * (dB) | 52 | 53.6 -3% | 48 8% | 49 6% | 45 13% |
* ... mindre är bättre
Temperaturer
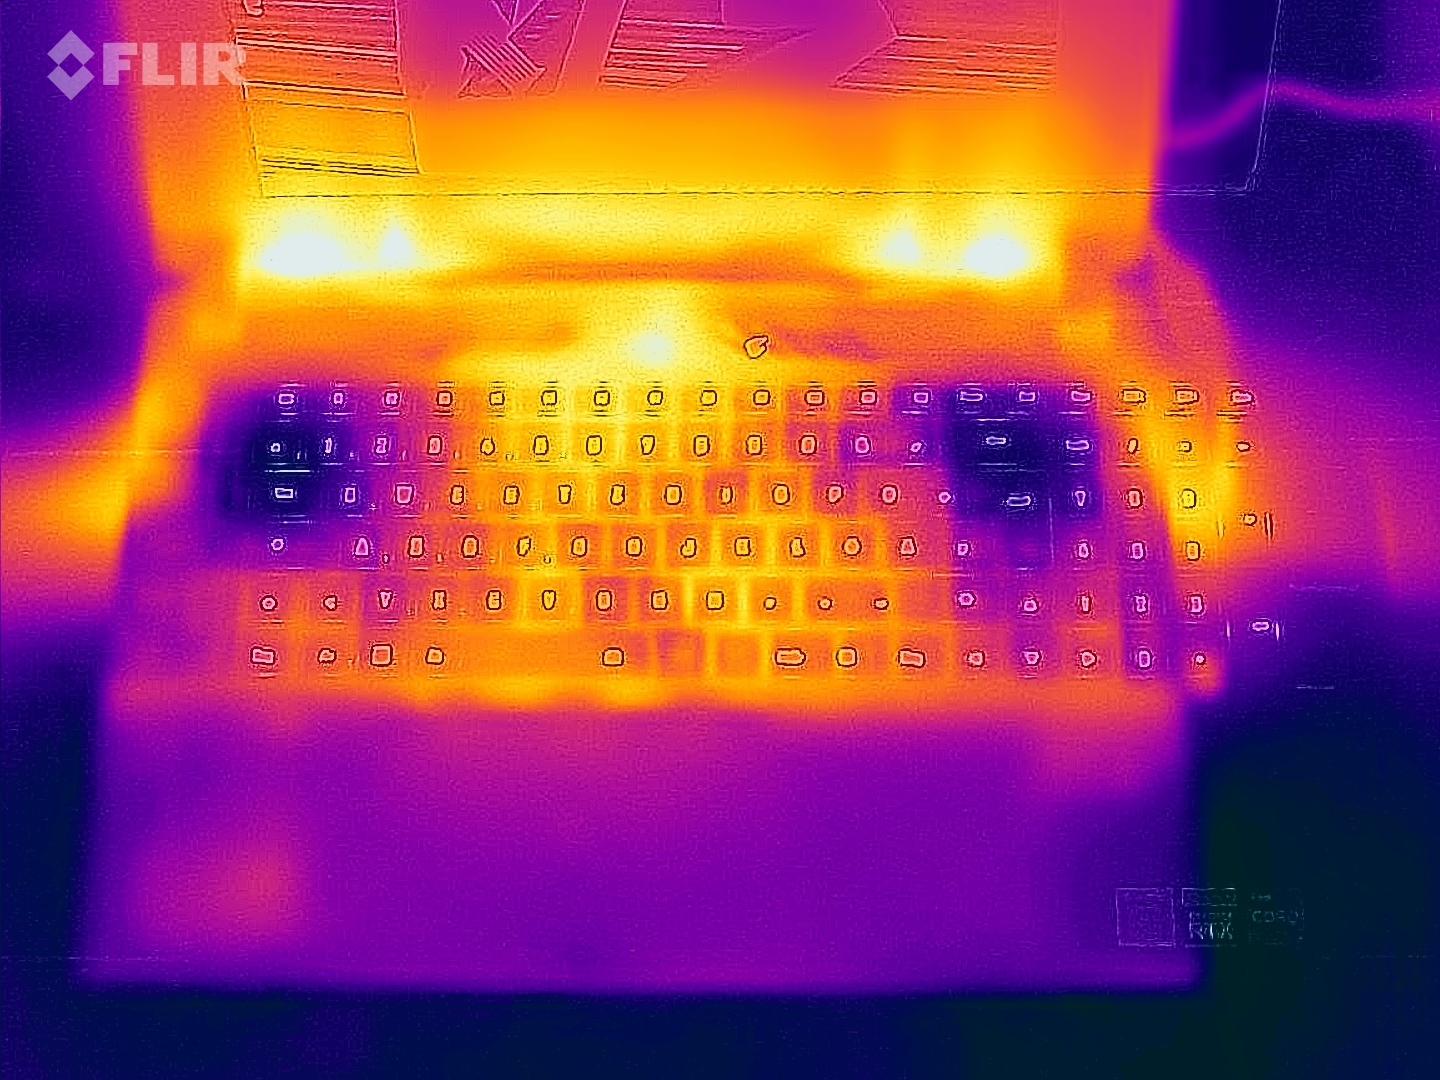
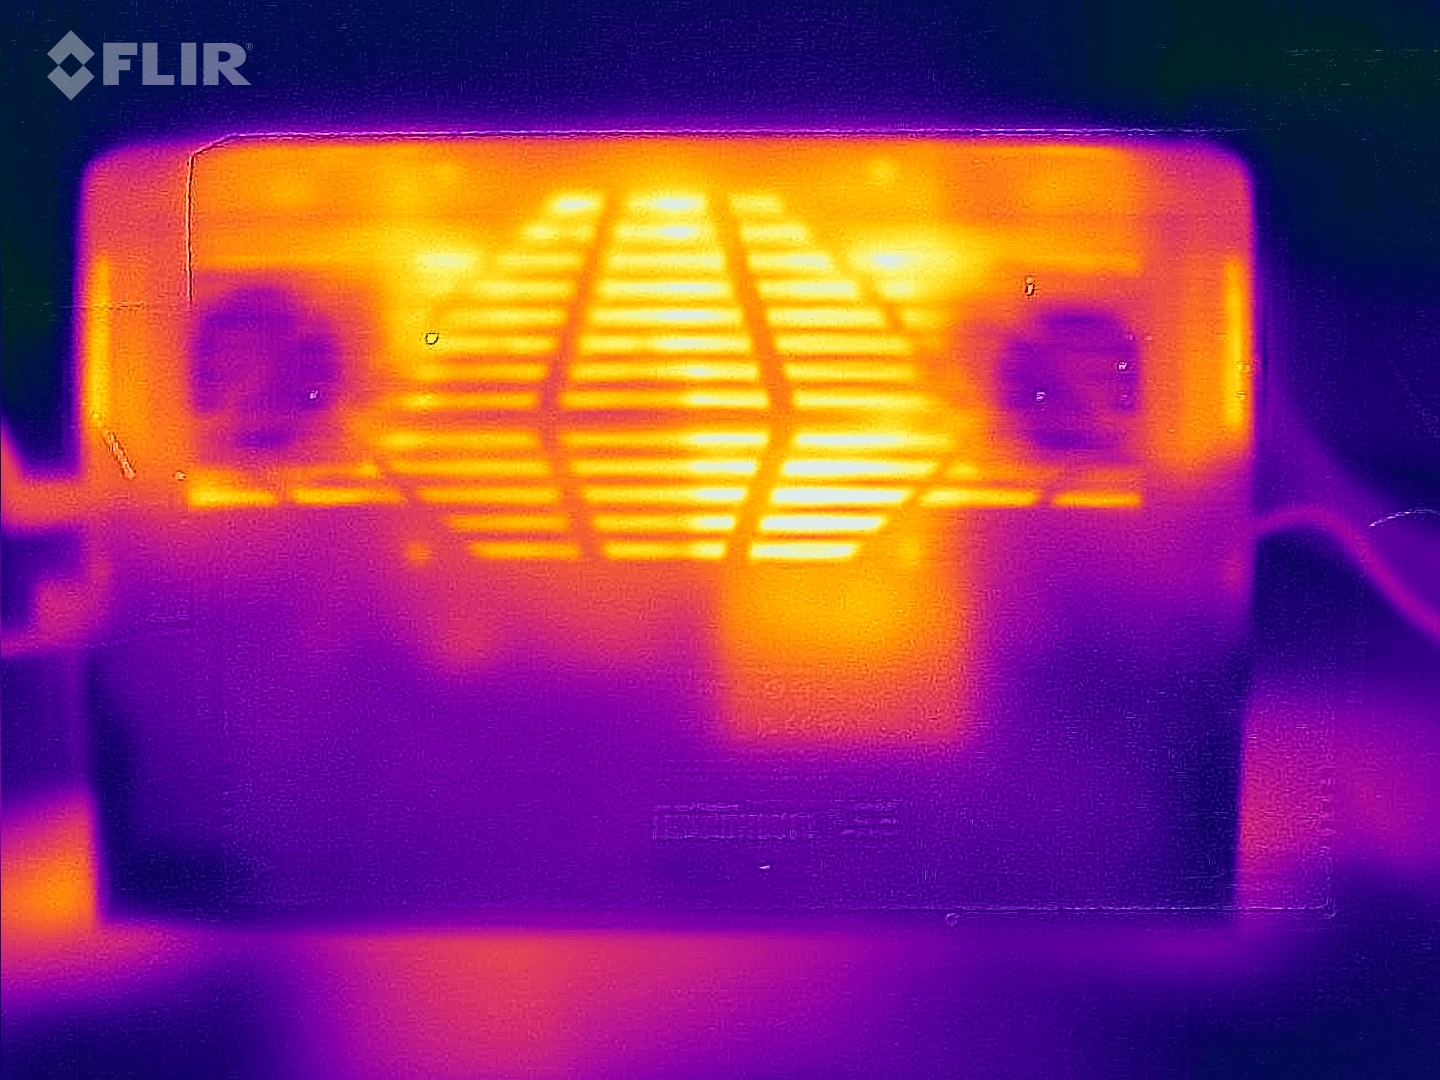
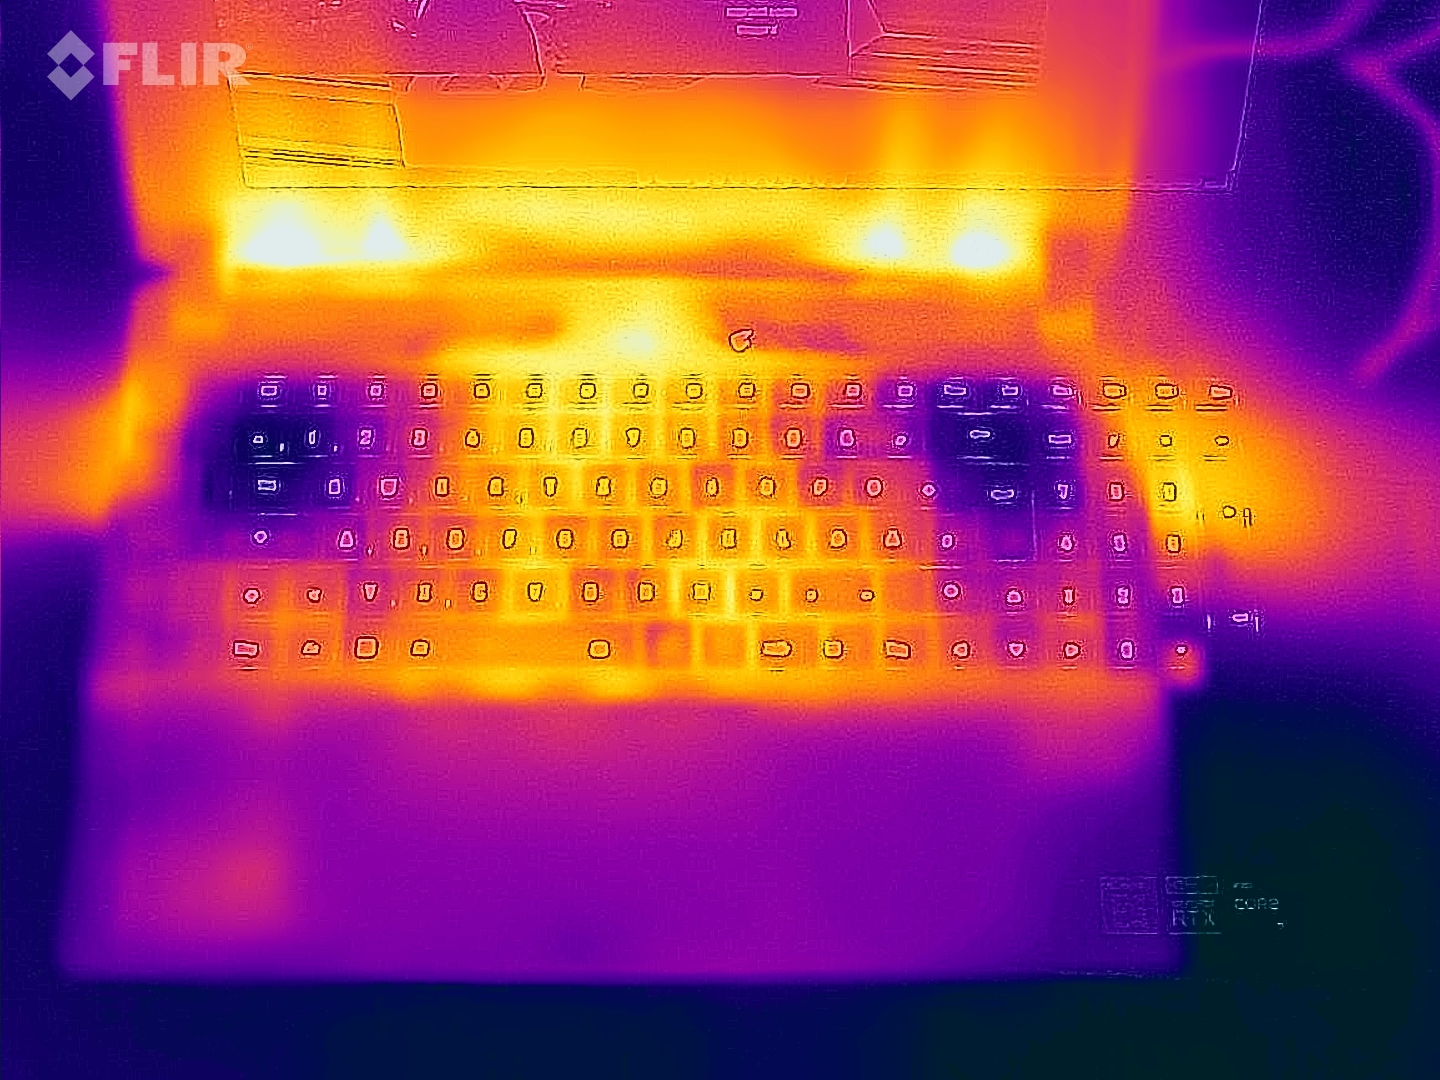
När den bärbara datorn hanterar vardagliga uppgifter kan chassit bli relativt varmt, men temperaturen ligger fortfarande inom ett acceptabelt intervall. Under belastning (stresstest, Witcher 3) blir den bärbara datorn i genomsnitt måttligt varm i hela enheten, men det finns några mycket märkbara hotspots. Med det sagt ger inte CPU-temperaturerna någon anledning till oro.
(-) Den maximala temperaturen på ovansidan är 46 °C / 115 F, jämfört med genomsnittet av 40.4 °C / 105 F , allt från 21.2 till 68.8 °C för klassen Gaming.
(-) Botten värms upp till maximalt 57 °C / 135 F, jämfört med genomsnittet av 43.2 °C / 110 F
(±) Vid tomgångsbruk är medeltemperaturen för ovansidan 32.4 °C / 90 F, jämfört med enhetsgenomsnittet på 33.9 °C / ### class_avg_f### F.
(±) När du spelar The Witcher 3 är medeltemperaturen för ovansidan 37.6 °C / 100 F, jämfört med enhetsgenomsnittet på 33.9 °C / ## #class_avg_f### F.
(+) Handledsstöden och pekplattan når maximal hudtemperatur (35 °C / 95 F) och är därför inte varma.
(-) Medeltemperaturen för handledsstödsområdet på liknande enheter var 28.8 °C / 83.8 F (-6.2 °C / -11.2 F).
| Aorus 15 XE5 Intel Core i7-12700H, NVIDIA GeForce RTX 3070 Ti Laptop GPU | Acer Nitro 5 AN515-46-R1A1 AMD Ryzen 7 6800H, NVIDIA GeForce RTX 3070 Ti Laptop GPU | Schenker XMG Fusion 15 (Mid 22) Intel Core i7-11800H, NVIDIA GeForce RTX 3070 Laptop GPU | Asus TUF Dash F15 FX517ZR Intel Core i7-12650H, NVIDIA GeForce RTX 3070 Laptop GPU | MSI Katana GF66 12UGS Intel Core i7-12700H, NVIDIA GeForce RTX 3070 Ti Laptop GPU | |
|---|---|---|---|---|---|
| Heat | 14% | -3% | 6% | -8% | |
| Maximum Upper Side * (°C) | 46 | 48.1 -5% | 52 -13% | 52 -13% | 61 -33% |
| Maximum Bottom * (°C) | 57 | 49.7 13% | 63 -11% | 52 9% | 55 4% |
| Idle Upper Side * (°C) | 38 | 30 21% | 37 3% | 33 13% | 43 -13% |
| Idle Bottom * (°C) | 42 | 31.7 25% | 38 10% | 36 14% | 38 10% |
* ... mindre är bättre
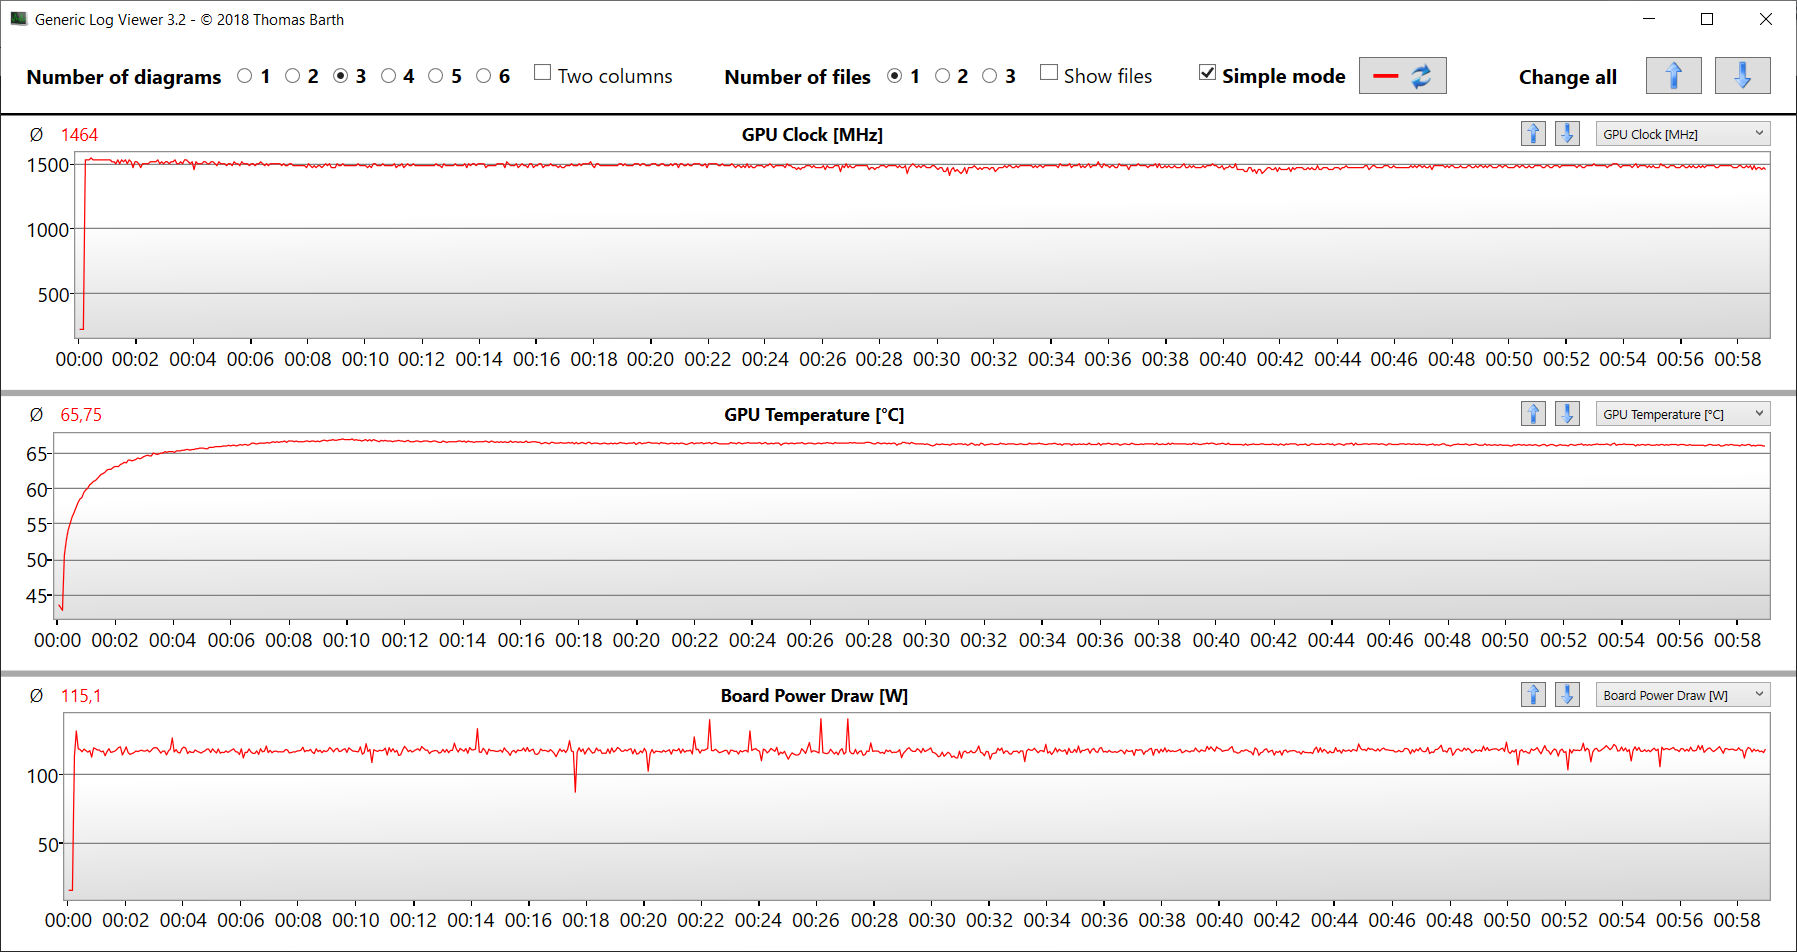
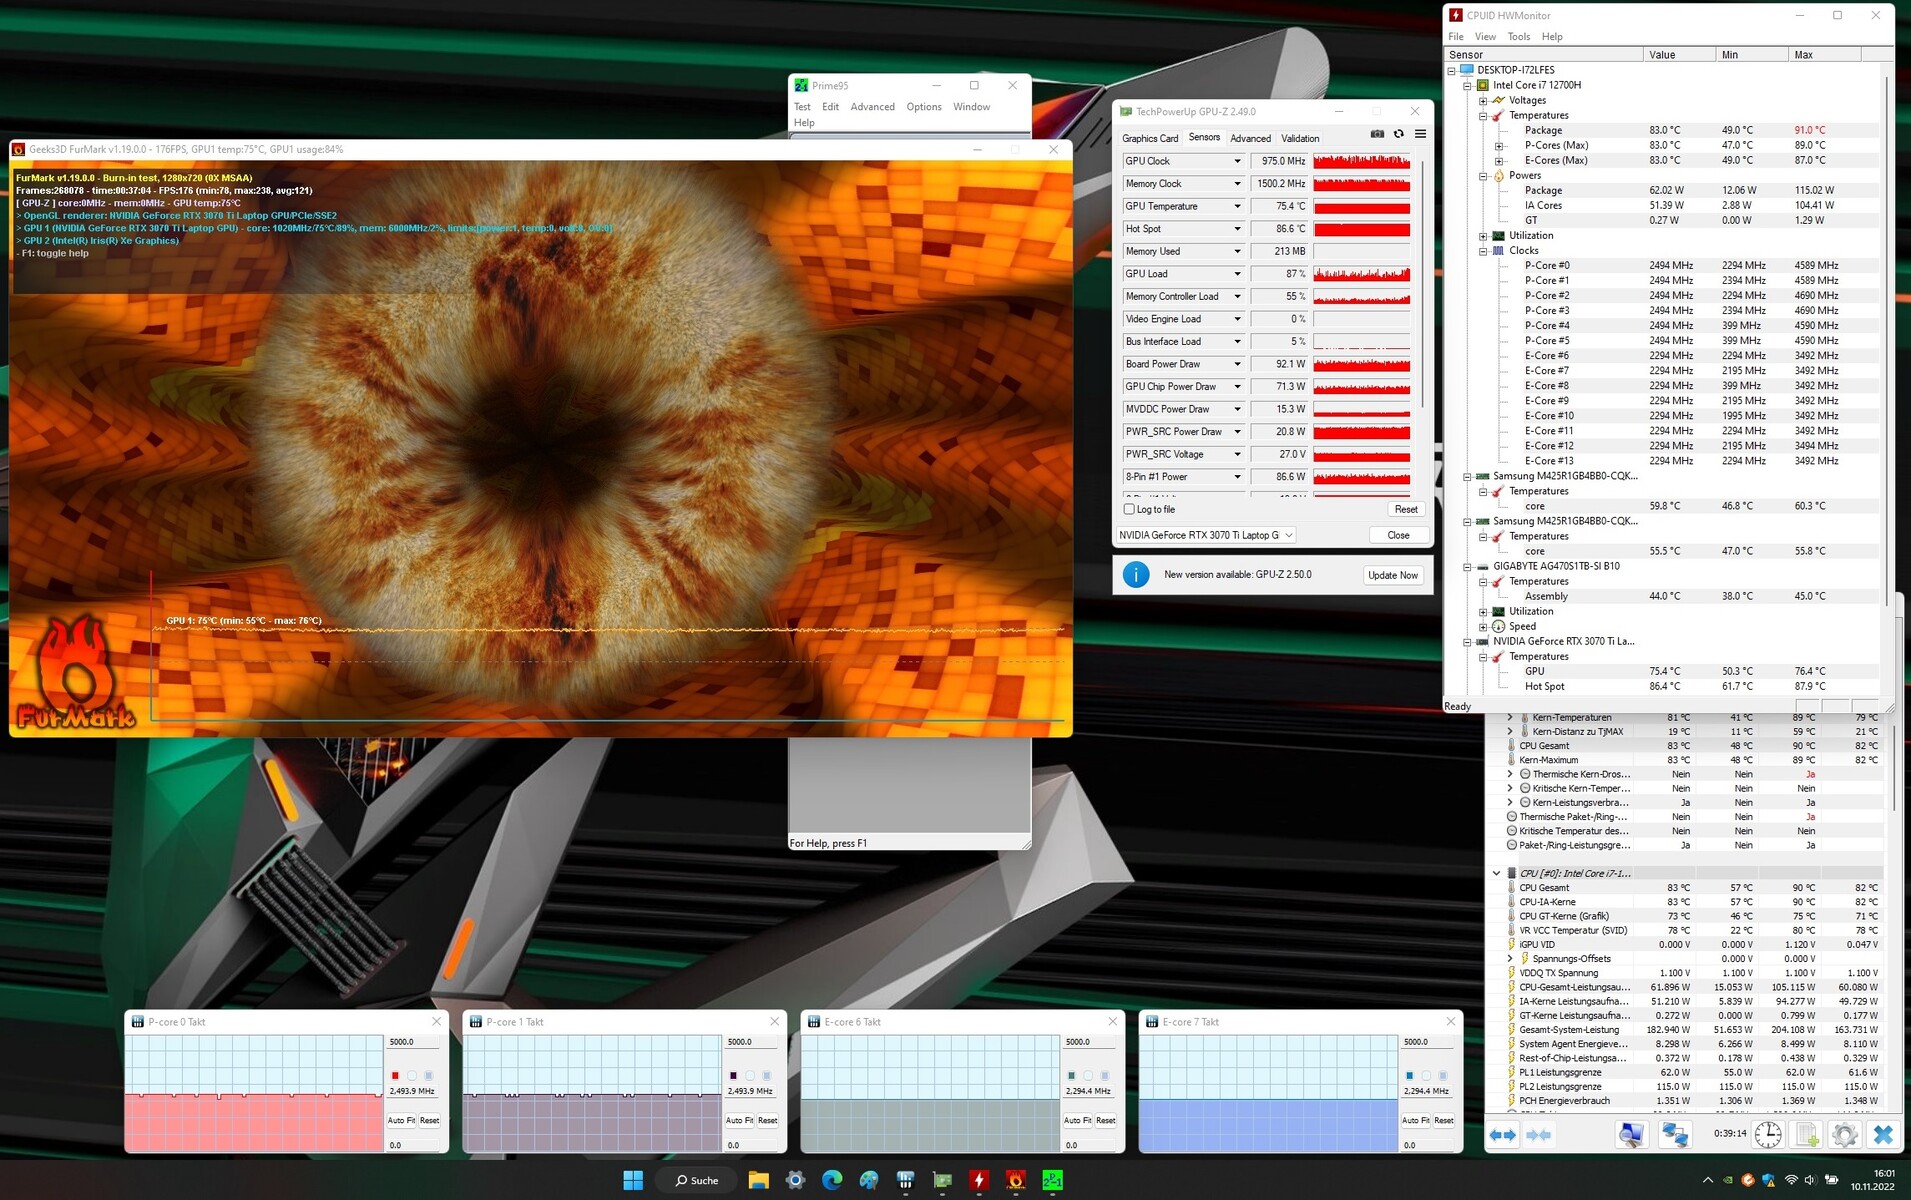
Stresstest
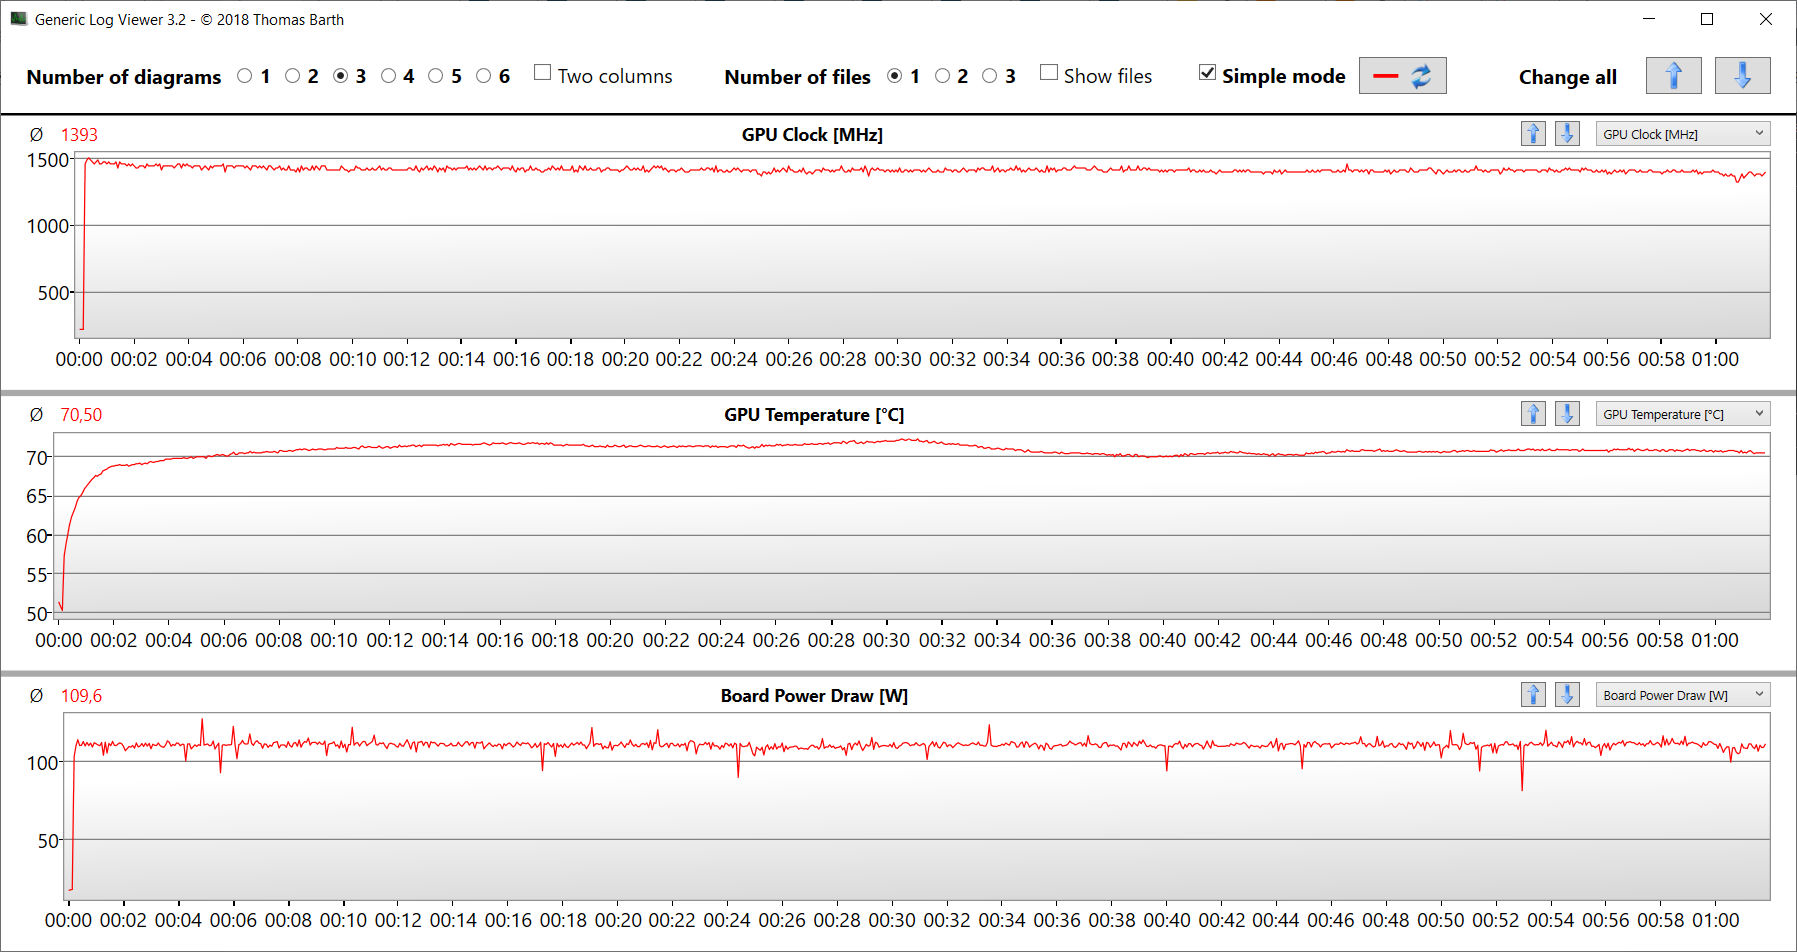
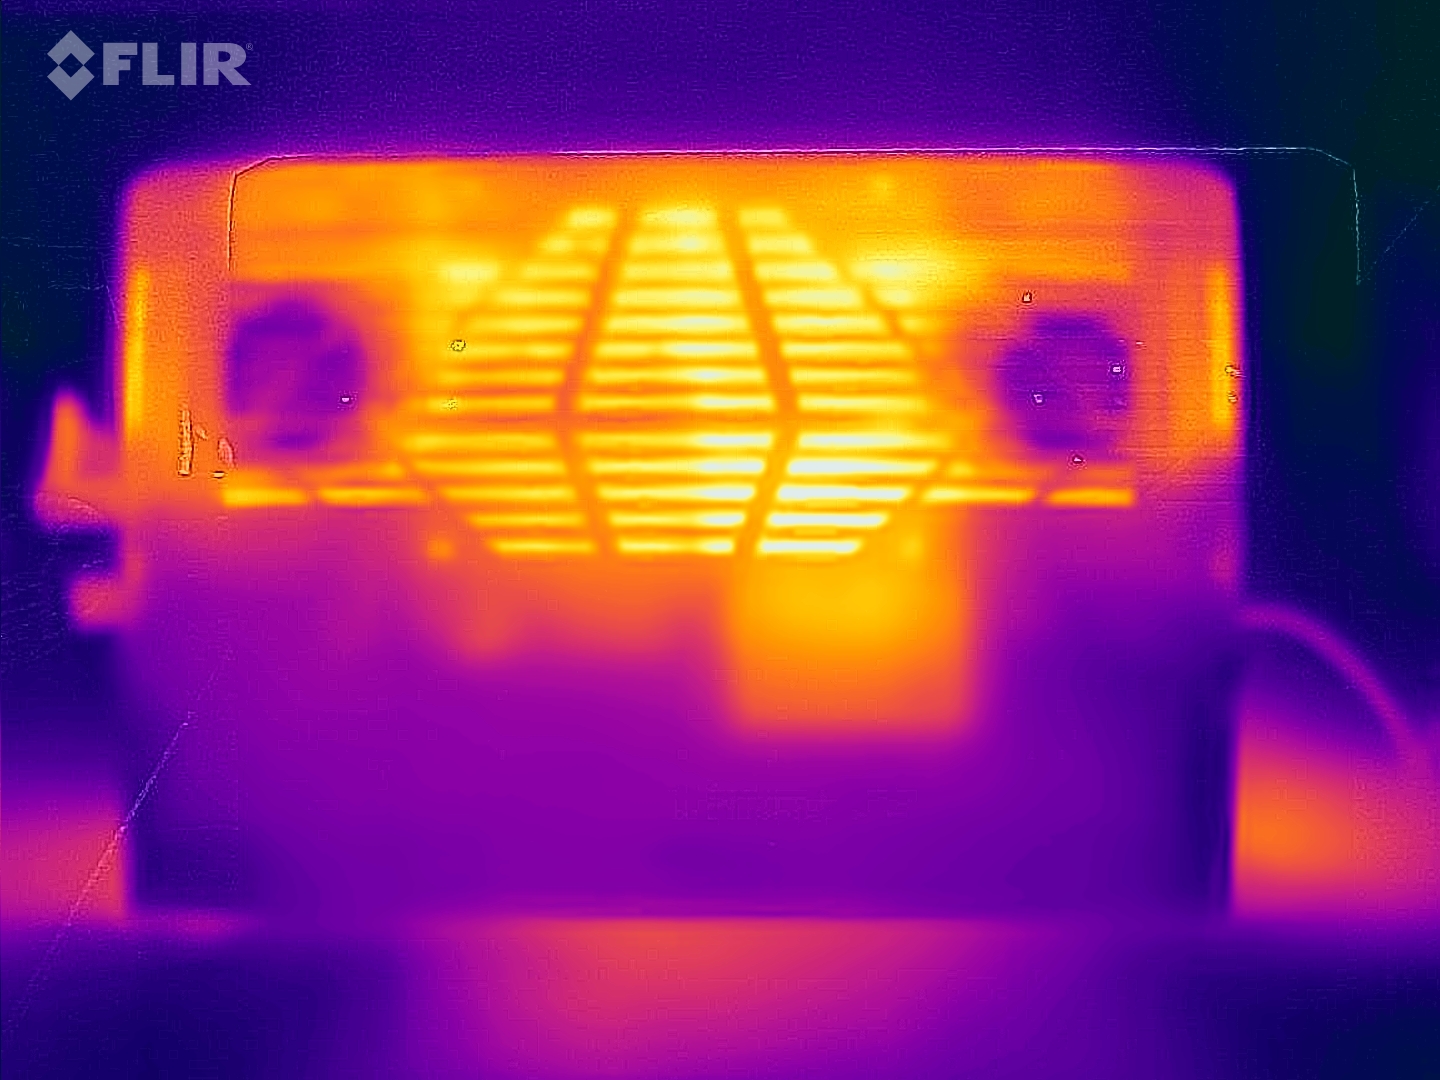
Vårt stresstest, som innebär att Prime95 och FurMark körs samtidigt och kontinuerligt, är ett extremt scenario som är utformat för att bedöma systemets stabilitet under full belastning. Under testet (som varade minst en timme) kördes CPU:n med måttliga klockfrekvenser (P-kärnor: ca 2,5 GHz; E-kärnor: ca 2,3 GHz), medan GPU:n fluktuerade mellan 1 000 och 1 500 MHz.
Högtalare
Stereohögtalarna låter hyfsat men har knappt någon bas. Vi rekommenderar att du använder hörlurar eller externa högtalare för en bättre lyssningsupplevelse.
Aorus 15 XE5 ljudanalys
(+) | högtalare kan spela relativt högt (85 dB)
Bas 100 - 315 Hz
(-) | nästan ingen bas - i genomsnitt 27.9% lägre än medianen
(±) | linjäriteten för basen är genomsnittlig (11.4% delta till föregående frekvens)
Mellan 400 - 2000 Hz
(+) | balanserad mellan - endast 4.9% från medianen
(+) | mids är linjära (4.4% delta till föregående frekvens)
Högsta 2 - 16 kHz
(+) | balanserade toppar - endast 3.5% från medianen
(+) | toppar är linjära (2.9% delta till föregående frekvens)
Totalt 100 - 16 000 Hz
(±) | linjäriteten för det totala ljudet är genomsnittlig (19.4% skillnad mot median)
Jämfört med samma klass
» 67% av alla testade enheter i den här klassen var bättre, 7% liknande, 26% sämre
» Den bästa hade ett delta på 6%, genomsnittet var 18%, sämst var 132%
Jämfört med alla testade enheter
» 48% av alla testade enheter var bättre, 7% liknande, 45% sämre
» Den bästa hade ett delta på 4%, genomsnittet var 23%, sämst var 134%
Asus TUF Dash F15 FX517ZR ljudanalys
(±) | högtalarljudstyrkan är genomsnittlig men bra (79 dB)
Bas 100 - 315 Hz
(-) | nästan ingen bas - i genomsnitt 19.2% lägre än medianen
(±) | linjäriteten för basen är genomsnittlig (9.6% delta till föregående frekvens)
Mellan 400 - 2000 Hz
(+) | balanserad mellan - endast 2.7% från medianen
(+) | mids är linjära (5% delta till föregående frekvens)
Högsta 2 - 16 kHz
(+) | balanserade toppar - endast 2.2% från medianen
(±) | linjäriteten för toppar är genomsnittlig (7.7% delta till föregående frekvens)
Totalt 100 - 16 000 Hz
(±) | linjäriteten för det totala ljudet är genomsnittlig (15.3% skillnad mot median)
Jämfört med samma klass
» 34% av alla testade enheter i den här klassen var bättre, 6% liknande, 60% sämre
» Den bästa hade ett delta på 6%, genomsnittet var 18%, sämst var 132%
Jämfört med alla testade enheter
» 22% av alla testade enheter var bättre, 4% liknande, 74% sämre
» Den bästa hade ett delta på 4%, genomsnittet var 23%, sämst var 134%
Strömhantering - XE5 kräver för mycket ström
Effektförbrukning
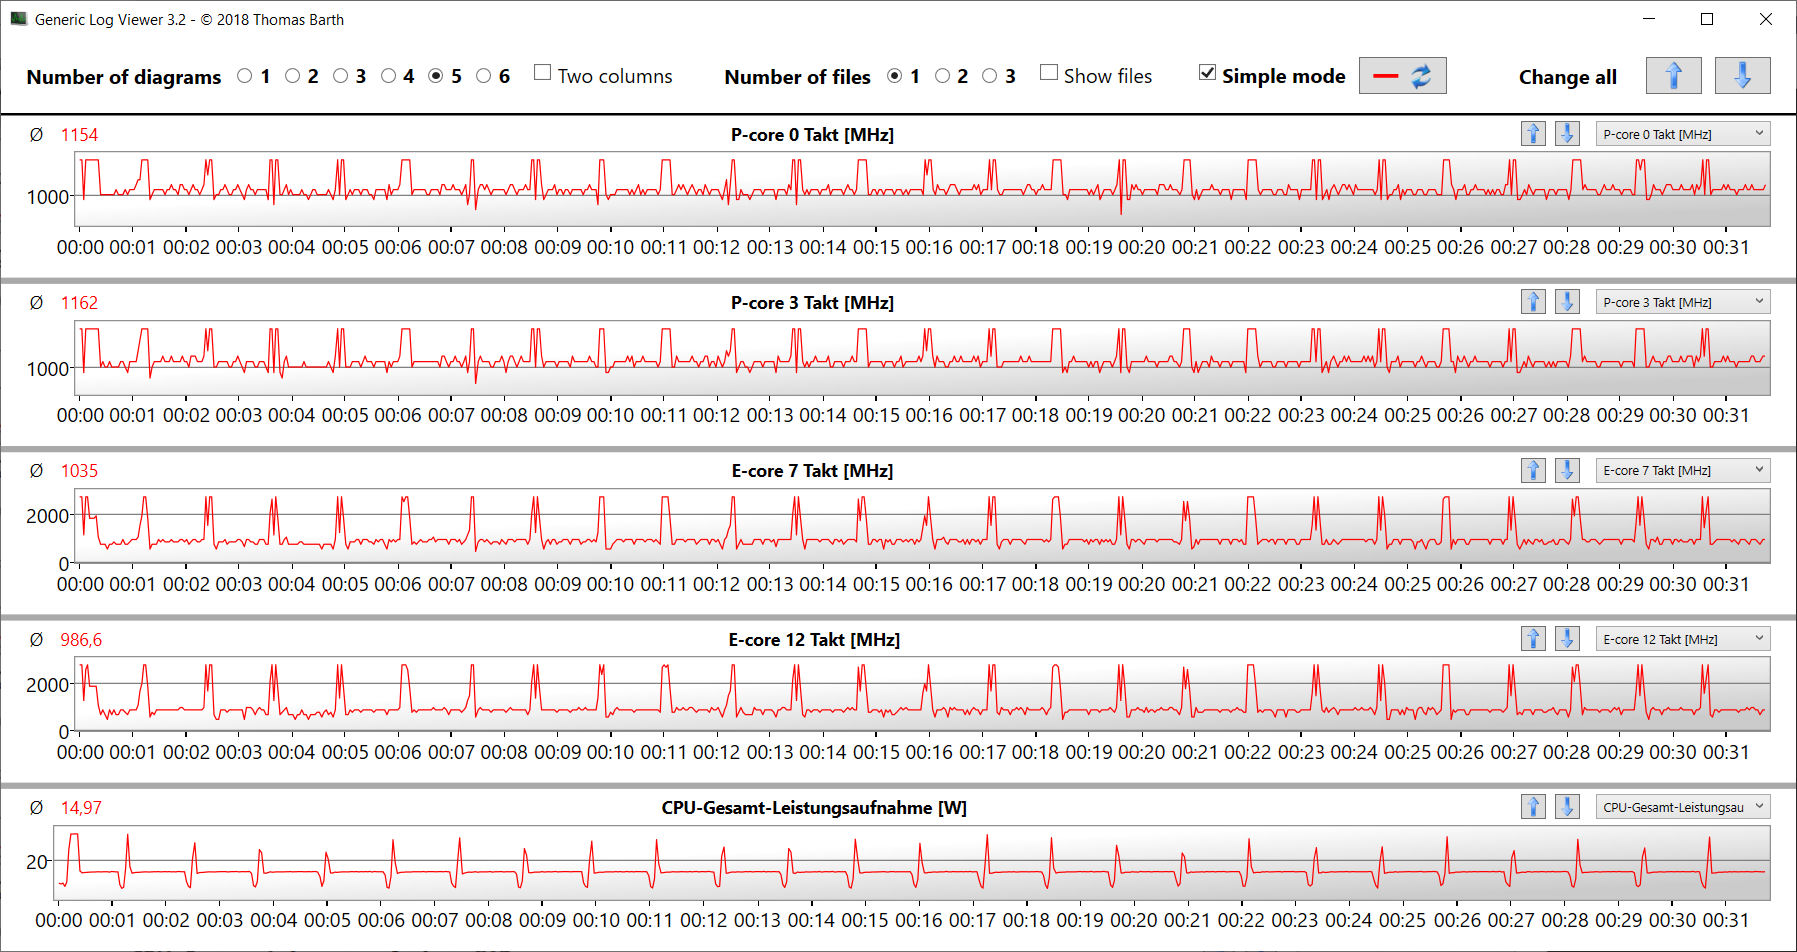
Aorus 15 XE5 är alltför strömkrävande vid tomgång, och drar mellan 31 och 46 watt och ibland upp till 80 watt i värsta fall. En jämförelse mellan XE5 och konkurrenterna avslöjar ungefär hur mycket ström en bärbar dator med Optimus-aktivering bör dra vid tomgång. Den höga strömförbrukningen beror troligen på en bugg. Problemet kvarstår även när AI Boost-funktionen är inaktiverad. Så vi får vänta och se om Gigabyte kan åtgärda problemet genom mjukvaru- eller BIOS-uppdateringar.
Under hela stresstestet och Witcher 3 -testet förblev den bärbara datorns strömförbrukning stabil på en nivå som är normal för hårdvaran. Den medföljande laddaren har tillräcklig kapacitet för att driva den bärbara datorn och klarar även av tillfälliga toppar över dess utgångsvärde (240 watt).
| Av/Standby | |
| Låg belastning | |
| Hög belastning |
|
Förklaring:
min: | |
| Aorus 15 XE5 i7-12700H, GeForce RTX 3070 Ti Laptop GPU | Acer Nitro 5 AN515-46-R1A1 R7 6800H, GeForce RTX 3070 Ti Laptop GPU | Schenker XMG Fusion 15 (Mid 22) i7-11800H, GeForce RTX 3070 Laptop GPU | Asus TUF Dash F15 FX517ZR i7-12650H, GeForce RTX 3070 Laptop GPU | MSI Katana GF66 12UGS i7-12700H, GeForce RTX 3070 Ti Laptop GPU | Genomsnitt NVIDIA GeForce RTX 3070 Ti Laptop GPU | Genomsnitt av klass Gaming | |
|---|---|---|---|---|---|---|---|
| Power Consumption | 28% | 36% | 41% | 43% | 28% | 32% | |
| Idle Minimum * (Watt) | 31 | 7 77% | 12 61% | 10 68% | 9 71% | 14.2 ? 54% | 13 ? 58% |
| Idle Average * (Watt) | 35 | 8.9 75% | 17 51% | 14 60% | 13 63% | 19.9 ? 43% | 19 ? 46% |
| Idle Maximum * (Watt) | 46 | 14.4 69% | 24 48% | 20 57% | 20 57% | 26.2 ? 43% | 24.6 ? 47% |
| Load Average * (Watt) | 120 | 202 -68% | 106 12% | 122 -2% | 100 17% | 125.8 ? -5% | 110.7 ? 8% |
| Witcher 3 ultra * (Watt) | 202 | 203 -0% | 159.9 21% | 138.6 31% | 149 26% | ||
| Load Maximum * (Watt) | 268 | 230 14% | 208 22% | 189 29% | 212 21% | 248 ? 7% | 259 ? 3% |
* ... mindre är bättre
Power consumption Witcher 3 / Stress test
Power consumption with external monitor
Batteriets livslängd
Enheten på 15,6 tum klarade 6 timmar och 50 minuter respektive 6 timmar och 11 minuter i vårt Wi-Fi-test (åtkomst till webbplatser med hjälp av ett skript) och vårt videotest (uppspelning av kortfilmen "Big Buck Bunny" i en slinga i FHD, kodad i H.264). Under båda testerna var alla energisparfunktioner på den bärbara datorn inaktiverade och skärmens ljusstyrka justerades till ungefär 150 cd/m². Dessutom var den trådlösa modulen också avaktiverad för videotestet.
På det hela taget levererar XE5 definitivt en bra batteritid för en bärbar QHD-speldator. Trots detta är det inte förvånande att Aorus inte ligger massivt långt före en konkurrent som t.ex Nitro 5när det gäller batteritid trots att den har nästan dubbelt så stor batterikapacitet (99 Wh mot 57,5 Wh). Detta beror på att den bärbara datorn från Acer är utrustad med en mer strömsnål processor och en FHD-skärm.
| Aorus 15 XE5 i7-12700H, GeForce RTX 3070 Ti Laptop GPU, 99 Wh | Acer Nitro 5 AN515-46-R1A1 R7 6800H, GeForce RTX 3070 Ti Laptop GPU, 57.5 Wh | Schenker XMG Fusion 15 (Mid 22) i7-11800H, GeForce RTX 3070 Laptop GPU, 93.48 Wh | Asus TUF Dash F15 FX517ZR i7-12650H, GeForce RTX 3070 Laptop GPU, 76 Wh | MSI Katana GF66 12UGS i7-12700H, GeForce RTX 3070 Ti Laptop GPU, 52 Wh | Genomsnitt av klass Gaming | |
|---|---|---|---|---|---|---|
| Batteridrifttid | -13% | 20% | 7% | -46% | 0% | |
| Reader / Idle (h) | 10 | 10.5 5% | 15.5 55% | 10.8 8% | 8.27 ? -17% | |
| H.264 (h) | 6.2 | 5.7 -8% | 7.5 21% | 5.8 -6% | 8.32 ? 34% | |
| WiFi v1.3 (h) | 6.8 | 5.8 -15% | 7.4 9% | 7 3% | 2.4 -65% | 7.11 ? 5% |
| Load (h) | 1.9 | 1.3 -32% | 1.8 -5% | 2.3 21% | 1.4 -26% | 1.502 ? -21% |
För
Emot
Bedömning - Ett kraftfullt spelmonster
Aorus 15 XE5 är utformad för att köra spel i QHD och höga till maximala inställningar. Men den gör också bra ifrån sig i andra krävande tillämpningar som videoredigering och rendering. Detta möjliggörs av Core i7 12700H och GeForce Bärbar dator med RTX 3070 Ti inuti maskinen. En blixtsnabb PCIe 4.0 SSD (1 TB) möjliggör korta laddningstider.
Aorus 15 XE5 gör det den ska: kör spel smidigt på sin flytande skärm. Dess strömförbrukning är dock för hög.
Den bärbara datorns CPU och GPU kan köras med konstant höga klockfrekvenser. Även om mängden ljud som Aorus 15 XE5 producerar är typisk för en bärbar dator för spel, genererar den för mycket värme vid tomgång. Det gäller även dess strömförbrukning vid tomgång och låg belastning - man kan bara hoppas att Gigabyte släpper en uppdatering för att lösa det här problemet. Den bärbara datorn har dock inte det här problemet när den körs på batteri, den klarar ungefär 6 till 7 timmar vid daglig användning - vilket är ganska respektabelt
Den matta QHD-skärmen (15,6 tum, IPS, 165 Hz uppdateringsfrekvens) lämnar mestadels ett positivt intryck, även om den säkert skulle kunna behöva lite mer kontrast. Thunderbolt 4-porten gör att du kan ansluta olika expansionsmöjligheter, till exempel en dockningslösning eller en extern GPU. Den stöder även Power Delivery, vilket innebär att den bärbara datorn kan laddas via porten (USB-C-adapter, minst 65 watt, 20 V).
Schenker XMG Fusion 15 (Mid 22) och Asus TUF Dash F15är två alternativ till Aorus 15 XE5. Även om dessa två bärbara datorer har sämre prestanda och blir riktigt varma under belastning är de lättare och har längre batteritid i vissa fall.
Pris och tillgänglighet
vid tidpunkten för denna recension är Gigabyte Aorus 15 XE5 tillgänglig på Amazon för cirka US$1,500i USA eller 2 200 euro i Tyskland.
Aorus 15 XE5
- 12/06/2022 v7 (old)
Sascha Mölck
Price comparison

