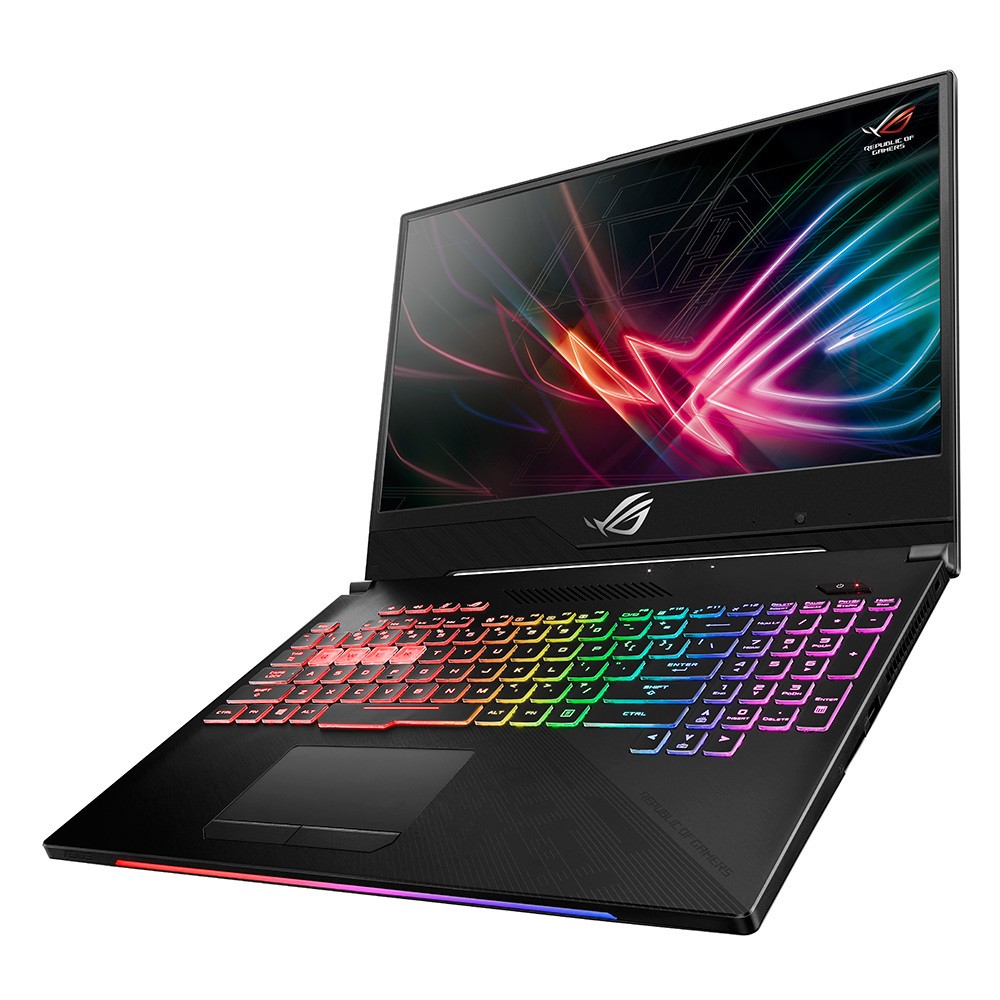
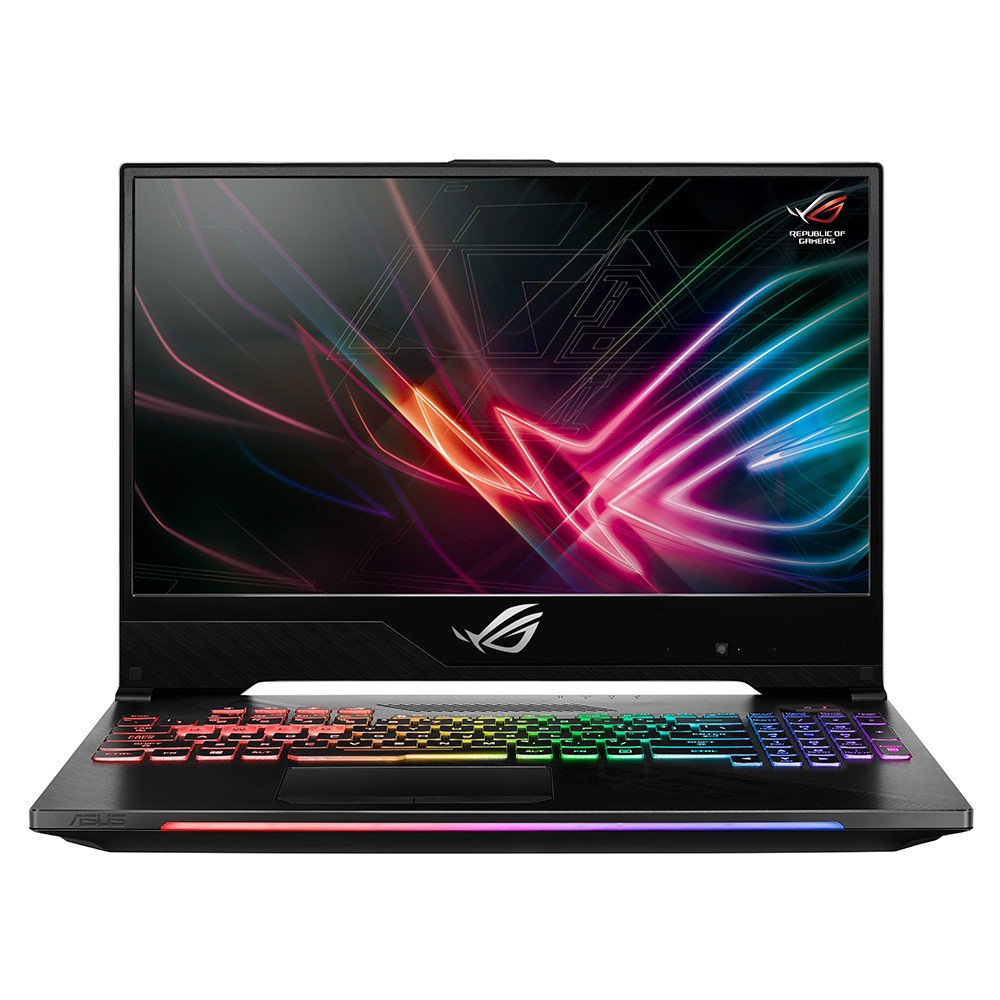
Test: Asus ROG Strix GL504GM Hero II (i7-8750H, GTX 1060, FHD) Laptop (Sammanfattning)
| SD Card Reader | |
| average JPG Copy Test (av. of 3 runs) | |
| Eurocom Sky X4C (Toshiba Exceria Pro SDXC 64 GB UHS-II) | |
| Gigabyte Aero 15X v8 (Toshiba Exceria Pro SDXC 64 GB UHS-II) | |
| Asus Strix GL504GM (Toshiba Exceria Pro SDXC 64 GB UHS-II) | |
| Asus Strix GL502VM-FY039T (Toshiba Exceria Pro SDXC 64 GB UHS-II) | |
| maximum AS SSD Seq Read Test (1GB) | |
| Gigabyte Aero 15X v8 (Toshiba Exceria Pro SDXC 64 GB UHS-II) | |
| Eurocom Sky X4C (Toshiba Exceria Pro SDXC 64 GB UHS-II) | |
| Asus Strix GL502VM-FY039T (Toshiba Exceria Pro SDXC 64 GB UHS-II) | |
| Asus Strix GL504GM (Toshiba Exceria Pro SDXC 64 GB UHS-II) | |
| Networking | |
| iperf3 transmit AX12 | |
| Asus Strix GL504GM | |
| Razer Blade 15 GTX 1060 | |
| Asus Zephyrus M GM501 | |
| Asus Strix GL502VM-FY039T | |
| iperf3 receive AX12 | |
| Asus Zephyrus M GM501 | |
| Razer Blade 15 GTX 1060 | |
| Asus Strix GL502VM-FY039T | |
| Asus Strix GL504GM | |
| |||||||||||||||||||||||||
Distribution av ljusstyrkan: 90 %
Mitt på batteriet: 350 cd/m²
Kontrast: 1061:1 (Svärta: 0.33 cd/m²)
ΔE ColorChecker Calman: 4.3 | ∀{0.5-29.43 Ø4.71}
calibrated: 2.83
ΔE Greyscale Calman: 4.4 | ∀{0.09-98 Ø4.96}
92.5% sRGB (Argyll 1.6.3 3D)
60% AdobeRGB 1998 (Argyll 1.6.3 3D)
66.7% AdobeRGB 1998 (Argyll 3D)
92.8% sRGB (Argyll 3D)
65.3% Display P3 (Argyll 3D)
Gamma: 2.26
CCT: 7517 K
| Asus Strix GL504GM AU Optronics B156HAN08.2 (AUO82ED), IPS, 15.6", 1920x1080 | Asus GL504GS AU Optronics B156HAN08.2 (AUO82ED), IPS, 15.6", 1920x1080 | MSI GS65 8RF-019DE Stealth Thin AU Optronics B156HAN08.0 (AUO80ED), IPS, 15.6", 1920x1080 | Razer Blade 15 GTX 1060 LGD05C0, IPS, 15.6", 1920x1080 | Asus Zephyrus M GM501 AUO B156HAN07.1 (AUO71ED), IPS, 15.6", 1920x1080 | Asus GL503VD-DB74 LG Philips LP156WF6, IPS, 15.6", 1920x1080 | |
|---|---|---|---|---|---|---|
| Display | -1% | 0% | -1% | 1% | -6% | |
| Display P3 Coverage (%) | 65.3 | 66.4 2% | 66.2 1% | 64.4 -1% | 66.1 1% | 64.3 -2% |
| sRGB Coverage (%) | 92.8 | 90.2 -3% | 92.1 -1% | 93.4 1% | 92.7 0% | 84.4 -9% |
| AdobeRGB 1998 Coverage (%) | 66.7 | 66 -1% | 67.2 1% | 65.5 -2% | 67.2 1% | 61.7 -7% |
| Response Times | 12% | -75% | -45% | 8% | -260% | |
| Response Time Grey 50% / Grey 80% * (ms) | 7.8 ? | 7.2 ? 8% | 17.6 ? -126% | 13.6 ? -74% | 6.6 ? 15% | 36.4 ? -367% |
| Response Time Black / White * (ms) | 10.4 ? | 8.8 ? 15% | 12.8 ? -23% | 12 ? -15% | 10.4 ? -0% | 26.2 ? -152% |
| PWM Frequency (Hz) | 21010 ? | |||||
| Screen | 7% | 16% | 11% | -7% | -10% | |
| Brightness middle (cd/m²) | 350 | 271 -23% | 254 -27% | 304.3 -13% | 307 -12% | 315.9 -10% |
| Brightness (cd/m²) | 338 | 261 -23% | 262 -22% | 293 -13% | 296 -12% | 304 -10% |
| Brightness Distribution (%) | 90 | 86 -4% | 89 -1% | 80 -11% | 89 -1% | 88 -2% |
| Black Level * (cd/m²) | 0.33 | 0.32 3% | 0.22 33% | 0.38 -15% | 0.25 24% | 0.37 -12% |
| Contrast (:1) | 1061 | 847 -20% | 1155 9% | 801 -25% | 1228 16% | 854 -20% |
| Colorchecker dE 2000 * | 4.3 | 2.61 39% | 2.37 45% | 1.79 58% | 5.74 -33% | 4.9 -14% |
| Colorchecker dE 2000 max. * | 7.78 | 4.93 37% | 4.71 39% | 3.69 53% | 11.32 -46% | 9.7 -25% |
| Colorchecker dE 2000 calibrated * | 2.83 | 2.33 18% | 1.84 35% | 1.94 31% | ||
| Greyscale dE 2000 * | 4.4 | 1.97 55% | 1.58 64% | 1.1 75% | 6.44 -46% | 3.8 14% |
| Gamma | 2.26 97% | 2.4 92% | 2.48 89% | 2.27 97% | 2.48 89% | 2.24 98% |
| CCT | 7517 86% | 6398 102% | 6785 96% | 6665 98% | 8395 77% | 6847 95% |
| Color Space (Percent of AdobeRGB 1998) (%) | 60 | 59 -2% | 60 0% | 59.8 0% | 60 0% | 55 -8% |
| Color Space (Percent of sRGB) (%) | 92.5 | 90 -3% | 92 -1% | 92.8 0% | 93 1% | 84 -9% |
| Totalt genomsnitt (program/inställningar) | 6% /
6% | -20% /
2% | -12% /
1% | 1% /
-4% | -92% /
-42% |
* ... mindre är bättre
Visa svarstider
| ↔ Svarstid svart till vitt | ||
|---|---|---|
| 10.4 ms ... stiga ↗ och falla ↘ kombinerat | ↗ 5.2 ms stiga | 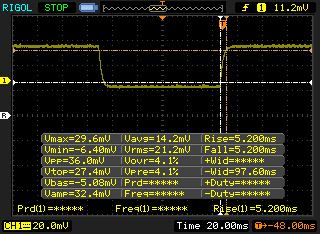 |
| ↘ 5.2 ms hösten | ||
| Skärmen visar bra svarsfrekvens i våra tester, men kan vara för långsam för konkurrenskraftiga spelare. I jämförelse sträcker sig alla testade enheter från 0.1 (minst) till 240 (maximalt) ms. » 28 % av alla enheter är bättre. Det betyder att den uppmätta svarstiden är bättre än genomsnittet av alla testade enheter (19.8 ms). | ||
| ↔ Svarstid 50 % grått till 80 % grått | ||
| 7.8 ms ... stiga ↗ och falla ↘ kombinerat | ↗ 4.4 ms stiga | 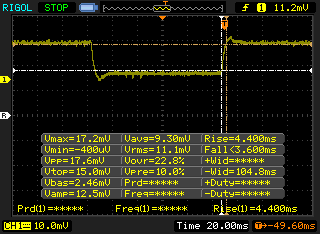 |
| ↘ 3.4 ms hösten | ||
| Skärmen visar väldigt snabba svarsfrekvenser i våra tester och borde vara mycket väl lämpad för fartfyllt spel. I jämförelse sträcker sig alla testade enheter från 0.165 (minst) till 636 (maximalt) ms. » 21 % av alla enheter är bättre. Det betyder att den uppmätta svarstiden är bättre än genomsnittet av alla testade enheter (31 ms). | ||
Skärmflimmer / PWM (Puls-Width Modulation)
| Skärmflimmer / PWM upptäcktes inte |  | ||
Som jämförelse: 52 % av alla testade enheter använder inte PWM för att dämpa skärmen. Om PWM upptäcktes mättes ett medelvärde av 7757 (minst: 5 - maximum: 343500) Hz. | |||
| Cinebench R10 | |
| Rendering Multiple CPUs 32Bit | |
| Eurocom Sky X4C | |
| Genomsnitt Intel Core i7-8750H (29664 - 35307, n=25) | |
| Asus GL702ZC-GC104T | |
| Asus Strix GL502VM-FY039T | |
| Asus FX504GD | |
| Asus Strix GL703VM-DB74 | |
| Rendering Single 32Bit | |
| Eurocom Sky X4C | |
| Asus FX504GD | |
| Genomsnitt Intel Core i7-8750H (6236 - 6645, n=25) | |
| Asus Strix GL502VM-FY039T | |
| Asus Strix GL703VM-DB74 | |
| Asus GL702ZC-GC104T | |
| wPrime 2.10 - 1024m | |
| Asus FX504GD | |
| Asus Strix GL703VM-DB74 | |
| Genomsnitt Intel Core i7-8750H (125.5 - 180.5, n=6) | |
| Eurocom Sky X4C | |
* ... mindre är bättre
| PCMark 8 Home Score Accelerated v2 | 4362 poäng | |
| PCMark 8 Work Score Accelerated v2 | 5474 poäng | |
| PCMark 10 Score | 5463 poäng | |
Hjälp | ||
| Asus Strix GL504GM Toshiba NVMe THNSN5256GPU7 | Asus GL504GS Samsung SSD PM981 MZVLB512HAJQ | MSI GS65 8RF-019DE Stealth Thin Samsung SSD PM981 MZVLB512HAJQ | Razer Blade 15 GTX 1060 Samsung SSD PM981 MZVLB512HAJQ | Asus Zephyrus M GM501 Samsung SM961 MZVKW512HMJP m.2 PCI-e | |
|---|---|---|---|---|---|
| AS SSD | 75% | 66% | 53% | 50% | |
| Copy Game MB/s (MB/s) | 1088 | 882 -19% | |||
| Copy Program MB/s (MB/s) | 752 | 370.7 -51% | |||
| Copy ISO MB/s (MB/s) | 1006 | 1452 44% | |||
| Score Total (Points) | 2233 | 4318 93% | 4122 85% | 4095 83% | 3649 63% |
| Score Write (Points) | 724 | 1983 174% | 2051 183% | 1955 170% | 1446 100% |
| Score Read (Points) | 1007 | 1542 53% | 1346 34% | 1407 40% | 1471 46% |
| Access Time Write * (ms) | 0.045 | 0.035 22% | 0.035 22% | 0.037 18% | 0.041 9% |
| Access Time Read * (ms) | 0.072 | 0.049 32% | 0.073 -1% | 0.05 31% | 0.046 36% |
| 4K-64 Write (MB/s) | 520 | 1704 228% | 1760 238% | 1664 220% | 1198 130% |
| 4K-64 Read (MB/s) | 832 | 1305 57% | 1170 41% | 1177 41% | 1218 46% |
| 4K Write (MB/s) | 96.5 | 105.7 10% | 107.2 11% | 99.2 3% | 90.2 -7% |
| 4K Read (MB/s) | 32 | 53.3 67% | 48.94 53% | 48.56 52% | 43.42 36% |
| Seq Write (MB/s) | 1071 | 1730 62% | 1834 71% | 1917 79% | 1580 48% |
| Seq Read (MB/s) | 1433 | 1837 28% | 1266 -12% | 1820 27% | 2091 46% |
* ... mindre är bättre

| 3DMark 11 | |
| 1280x720 Performance GPU | |
| Eurocom Sky X7C | |
| Asus GL504GS | |
| MSI GS65 8RF-019DE Stealth Thin | |
| Nvidia GeForce GTX 1060 Founders Edition 6 GB | |
| Genomsnitt NVIDIA GeForce GTX 1060 Mobile (12620 - 15607, n=77) | |
| Asus Strix GL504GM | |
| Razer Blade 15 GTX 1060 | |
| Asus Strix GL502VY-DS71 | |
| Asus Zenbook UX510UW-CN044T | |
| Asus Zenbook UX3430UN-GV174T | |
| 1280x720 Performance Combined | |
| Eurocom Sky X7C | |
| Asus GL504GS | |
| Nvidia GeForce GTX 1060 Founders Edition 6 GB | |
| MSI GS65 8RF-019DE Stealth Thin | |
| Asus Strix GL504GM | |
| Razer Blade 15 GTX 1060 | |
| Genomsnitt NVIDIA GeForce GTX 1060 Mobile (5655 - 12930, n=76) | |
| Asus Strix GL502VY-DS71 | |
| Asus Zenbook UX510UW-CN044T | |
| Asus Zenbook UX3430UN-GV174T | |
| 3DMark | |
| 1920x1080 Fire Strike Graphics | |
| Asus GL504GS | |
| MSI GS65 8RF-019DE Stealth Thin | |
| Nvidia GeForce GTX 1060 Founders Edition 6 GB | |
| Asus Strix GL504GM | |
| Genomsnitt NVIDIA GeForce GTX 1060 Mobile (10708 - 12298, n=77) | |
| Razer Blade 15 GTX 1060 | |
| Asus Strix GL502VY-DS71 | |
| Asus Zenbook UX510UW-CN044T | |
| Asus Zenbook UX3430UN-GV174T | |
| 1920x1080 Fire Strike Combined | |
| Asus GL504GS | |
| MSI GS65 8RF-019DE Stealth Thin | |
| Nvidia GeForce GTX 1060 Founders Edition 6 GB | |
| Asus Strix GL504GM | |
| Genomsnitt NVIDIA GeForce GTX 1060 Mobile (4098 - 4602, n=69) | |
| Razer Blade 15 GTX 1060 | |
| Asus Strix GL502VY-DS71 | |
| Asus Zenbook UX510UW-CN044T | |
| 1920x1080 Fire Strike Physics | |
| Asus GL504GS | |
| Asus Strix GL504GM | |
| MSI GS65 8RF-019DE Stealth Thin | |
| Razer Blade 15 GTX 1060 | |
| Nvidia GeForce GTX 1060 Founders Edition 6 GB | |
| Genomsnitt NVIDIA GeForce GTX 1060 Mobile (5822 - 17458, n=77) | |
| Asus Zenbook UX3430UN-GV174T | |
| Asus Strix GL502VY-DS71 | |
| Asus Zenbook UX510UW-CN044T | |
| 3DMark 11 Performance | 12841 poäng | |
| 3DMark Cloud Gate Standard Score | 30707 poäng | |
| 3DMark Fire Strike Score | 10475 poäng | |
Hjälp | ||
| låg | med. | hög | ultra | |
|---|---|---|---|---|
| BioShock Infinite (2013) | 242.2 | 211 | 198 | 104.7 |
| The Witcher 3 (2015) | 192 | 133.4 | 80.6 | 37.5 |
| Rise of the Tomb Raider (2016) | 145.9 | 121.6 | 82 | 66.9 |
Ljudnivå
| Låg belastning |
| 30 / 30 / 30 dB(A) |
| Hög belastning |
| 41.8 / 50 dB(A) |
 | ||
30 dB tyst 40 dB(A) hörbar 50 dB(A) högt ljud |
||
min: | ||
| Asus Strix GL504GM GeForce GTX 1060 Mobile, i7-8750H, Toshiba NVMe THNSN5256GPU7 | Asus GL504GS GeForce GTX 1070 Mobile, i7-8750H, Samsung SSD PM981 MZVLB512HAJQ | MSI GS65 8RF-019DE Stealth Thin GeForce GTX 1070 Max-Q, i7-8750H, Samsung SSD PM981 MZVLB512HAJQ | Razer Blade 15 GTX 1060 GeForce GTX 1060 Max-Q, i7-8750H, Samsung SSD PM981 MZVLB512HAJQ | Asus Zephyrus M GM501 GeForce GTX 1070 Mobile, i7-8750H, Samsung SM961 MZVKW512HMJP m.2 PCI-e | Aorus X5 v8 GeForce GTX 1070 Mobile, i7-8850H, Toshiba NVMe THNSN5512GPU7 | |
|---|---|---|---|---|---|---|
| Noise | -12% | 0% | -0% | -6% | -13% | |
| av / miljö * (dB) | 28.5 | 29 -2% | 30 -5% | 28.1 1% | 29 -2% | 30 -5% |
| Idle Minimum * (dB) | 30 | 32 -7% | 30 -0% | 28.1 6% | 30 -0% | 33 -10% |
| Idle Average * (dB) | 30 | 33 -10% | 31 -3% | 33 -10% | 31 -3% | 35 -17% |
| Idle Maximum * (dB) | 30 | 40 -33% | 34 -13% | 33.5 -12% | 33 -10% | 40 -33% |
| Load Average * (dB) | 41.8 | 49 -17% | 43 -3% | 42.2 -1% | 49 -17% | 45 -8% |
| Witcher 3 ultra * (dB) | 47.6 | 51 -7% | 42 12% | 45.3 5% | 50 -5% | 50 -5% |
| Load Maximum * (dB) | 50 | 53 -6% | 44 12% | 45.7 9% | 52 -4% | 55 -10% |
* ... mindre är bättre
(±) Den maximala temperaturen på ovansidan är 41.4 °C / 107 F, jämfört med genomsnittet av 40.4 °C / 105 F , allt från 21.2 till 68.8 °C för klassen Gaming.
(-) Botten värms upp till maximalt 51.2 °C / 124 F, jämfört med genomsnittet av 43.2 °C / 110 F
(+) Vid tomgångsbruk är medeltemperaturen för ovansidan 29 °C / 84 F, jämfört med enhetsgenomsnittet på 33.9 °C / ### class_avg_f### F.
(+) När du spelar The Witcher 3 är medeltemperaturen för ovansidan 31.1 °C / 88 F, jämfört med enhetsgenomsnittet på 33.9 °C / ## #class_avg_f### F.
(+) Handledsstöden och pekplattan är kallare än hudtemperaturen med maximalt 29.2 °C / 84.6 F och är därför svala att ta på.
(±) Medeltemperaturen för handledsstödsområdet på liknande enheter var 28.8 °C / 83.8 F (-0.4 °C / -0.8 F).
Asus Strix GL504GM ljudanalys
(-) | inte särskilt höga högtalare (65.4 dB)
Bas 100 - 315 Hz
(+) | bra bas - bara 4.3% från medianen
(±) | linjäriteten för basen är genomsnittlig (8.9% delta till föregående frekvens)
Mellan 400 - 2000 Hz
(+) | balanserad mellan - endast 2.6% från medianen
(+) | mids är linjära (5.1% delta till föregående frekvens)
Högsta 2 - 16 kHz
(±) | reducerade toppar - i genomsnitt 5.5% lägre än medianen
(+) | toppar är linjära (5.1% delta till föregående frekvens)
Totalt 100 - 16 000 Hz
(±) | linjäriteten för det totala ljudet är genomsnittlig (17.5% skillnad mot median)
Jämfört med samma klass
» 49% av alla testade enheter i den här klassen var bättre, 12% liknande, 39% sämre
» Den bästa hade ett delta på 6%, genomsnittet var 18%, sämst var 132%
Jämfört med alla testade enheter
» 34% av alla testade enheter var bättre, 8% liknande, 58% sämre
» Den bästa hade ett delta på 4%, genomsnittet var 23%, sämst var 134%
Apple MacBook 12 (Early 2016) 1.1 GHz ljudanalys
(+) | högtalare kan spela relativt högt (83.6 dB)
Bas 100 - 315 Hz
(±) | reducerad bas - i genomsnitt 11.3% lägre än medianen
(±) | linjäriteten för basen är genomsnittlig (14.2% delta till föregående frekvens)
Mellan 400 - 2000 Hz
(+) | balanserad mellan - endast 2.4% från medianen
(+) | mids är linjära (5.5% delta till föregående frekvens)
Högsta 2 - 16 kHz
(+) | balanserade toppar - endast 2% från medianen
(+) | toppar är linjära (4.5% delta till föregående frekvens)
Totalt 100 - 16 000 Hz
(+) | det totala ljudet är linjärt (10.2% skillnad mot median)
Jämfört med samma klass
» 7% av alla testade enheter i den här klassen var bättre, 2% liknande, 90% sämre
» Den bästa hade ett delta på 5%, genomsnittet var 18%, sämst var 53%
Jämfört med alla testade enheter
» 5% av alla testade enheter var bättre, 1% liknande, 94% sämre
» Den bästa hade ett delta på 4%, genomsnittet var 23%, sämst var 134%
| Av/Standby | |
| Låg belastning | |
| Hög belastning |
|
Förklaring:
min: | |
| Asus Strix GL504GM i7-8750H, GeForce GTX 1060 Mobile, Toshiba NVMe THNSN5256GPU7, IPS, 1920x1080, 15.6" | Asus GL504GS i7-8750H, GeForce GTX 1070 Mobile, Samsung SSD PM981 MZVLB512HAJQ, IPS, 1920x1080, 15.6" | MSI GS65 8RF-019DE Stealth Thin i7-8750H, GeForce GTX 1070 Max-Q, Samsung SSD PM981 MZVLB512HAJQ, IPS, 1920x1080, 15.6" | Razer Blade 15 GTX 1060 i7-8750H, GeForce GTX 1060 Max-Q, Samsung SSD PM981 MZVLB512HAJQ, IPS, 1920x1080, 15.6" | Asus Zephyrus M GM501 i7-8750H, GeForce GTX 1070 Mobile, Samsung SM961 MZVKW512HMJP m.2 PCI-e, IPS, 1920x1080, 15.6" | Asus ROG GU501GM-BI7N8 i7-8750H, GeForce GTX 1060 Mobile, Kingston RBUSNS8154P3128GJ, IPS, 1920x1080, 15.6" | |
|---|---|---|---|---|---|---|
| Power Consumption | -69% | 12% | -2% | -25% | -6% | |
| Idle Minimum * (Watt) | 10 | 29 -190% | 7 30% | 14.9 -49% | 16 -60% | 12.35 -23% |
| Idle Average * (Watt) | 16.9 | 32 -89% | 11 35% | 17.5 -4% | 19 -12% | 19.98 -18% |
| Idle Maximum * (Watt) | 21.1 | 38 -80% | 20 5% | 19.2 9% | 26 -23% | 25.44 -21% |
| Load Average * (Watt) | 112.4 | 100 11% | 98 13% | 103.2 8% | 103 8% | 94.28 16% |
| Witcher 3 ultra * (Watt) | 135.5 | 170 -25% | 132 3% | 123.1 9% | 164 -21% | 132.9 2% |
| Load Maximum * (Watt) | 157.3 | 217 -38% | 182 -16% | 132.7 16% | 223 -42% | 140.63 11% |
* ... mindre är bättre
| Asus Strix GL504GM i7-8750H, GeForce GTX 1060 Mobile, 66 Wh | Asus GL504GS i7-8750H, GeForce GTX 1070 Mobile, 66 Wh | MSI GS65 8RF-019DE Stealth Thin i7-8750H, GeForce GTX 1070 Max-Q, 82 Wh | Razer Blade 15 GTX 1060 i7-8750H, GeForce GTX 1060 Max-Q, 80 Wh | Asus Zephyrus M GM501 i7-8750H, GeForce GTX 1070 Mobile, 55 Wh | Aorus X5 v8 i7-8850H, GeForce GTX 1070 Mobile, 92.24 Wh | |
|---|---|---|---|---|---|---|
| Batteridrifttid | -59% | 2% | 14% | -54% | ||
| WiFi v1.3 (h) | 5.9 | 2.4 -59% | 6 2% | 6.7 14% | 2.7 -54% | |
| Reader / Idle (h) | 2.9 | 8.5 | 4 | 4.9 | ||
| Load (h) | 1.2 | 1.4 | 1.2 | 1.5 |
För
Emot


Läs den fullständiga versionen av den här recensionen på engelska här.
I likhet med hur Razer Blade 15 GTX 1060 är tystare, uthålligare och svalare än Blade 15 GTX 1070 så är GL503GM även den svalare, uthålligare och tystare än GL504GS. Det finns således många anledningar att välja den billigare GL503GM framför GL504GS, även utöver det lägre priset, då GL504GS kunde ha tjänat på en starkare kyllösning. Det finns trots allt en anledning att andra spellaptops på 15 tum med samma GTX 1070 GPU, såsom MSI GT63, har dubbelt så många värmerör.
Det bästa med GL504-serien är fortfarande den matta 144 Hz-skärmen. Den smalare infattningen tillsammans med kraftigt förbättrad skärmuppdateringsfrekvens och responstid gör att förra generationens GL503-modeller ser väldigt föråldrade ut i jämförelse. För att kunna dra full nytta av den höga bilduppdateringsfrekvensen är dock GL504GS det bästa alternativet då ett GTX 1070 behövs för att kunna rita upp de extra bildrutorna i de flesta titlar. Med tanke på skärmen och designen är det en uppgradering som är värd att överväga för den som fortfarande spelar på en Maxwell-GPU.
Avsaknaden av G-Sync är synd, men GL504GM kompenserar för det med Optimus som ger längre batteritid och tystare fläktar än GL504GS. Den har ett av de bästa höljena på 15 tum med smal infattning som finns tillgängligt för tillfället och är definitivt mer robust än MSI GS65.
Asus Strix GL504GM
- 08/31/2018 v6 (old)
Allen Ngo
Price comparison
