Test: Xiaomi Mi Gaming Laptop (i5-7300HQ, GTX 1060, Full HD) (Sammanfattning)
| SD Card Reader | |
| average JPG Copy Test (av. of 3 runs) | |
| Genomsnitt av klass Gaming (20.9 - 210, n=54, senaste 2 åren) | |
| HP Omen 15-ce002ng (Toshiba Exceria Pro SDXC 64 GB UHS-II) | |
| Medion Erazer X6603 (oshiba Exceria Pro SDXC 64 GB UHS-II) | |
| Xiaomi Mi Gaming Laptop 7300HQ 1060 (Toshiba Exceria Pro SDXC 64 GB UHS-II) | |
| Dell Inspiron 15 7000 7577 (Toshiba Exceria Pro SDXC 64 GB UHS-II) | |
| maximum AS SSD Seq Read Test (1GB) | |
| Genomsnitt av klass Gaming (25.5 - 261, n=51, senaste 2 åren) | |
| HP Omen 15-ce002ng (Toshiba Exceria Pro SDXC 64 GB UHS-II) | |
| Medion Erazer X6603 (oshiba Exceria Pro SDXC 64 GB UHS-II) | |
| Dell Inspiron 15 7000 7577 (Toshiba Exceria Pro SDXC 64 GB UHS-II) | |
| Xiaomi Mi Gaming Laptop 7300HQ 1060 (Toshiba Exceria Pro SDXC 64 GB UHS-II) | |
| |||||||||||||||||||||||||
Distribution av ljusstyrkan: 87 %
Mitt på batteriet: 250 cd/m²
Kontrast: 1230:1 (Svärta: 0.23 cd/m²)
ΔE ColorChecker Calman: 4.68 | ∀{0.5-29.43 Ø4.71}
calibrated: 2.5
ΔE Greyscale Calman: 4.32 | ∀{0.09-98 Ø4.96}
87% sRGB (Argyll 1.6.3 3D)
57% AdobeRGB 1998 (Argyll 1.6.3 3D)
63.8% AdobeRGB 1998 (Argyll 3D)
87.3% sRGB (Argyll 3D)
66.6% Display P3 (Argyll 3D)
Gamma: 2.36
CCT: 7612 K
| Xiaomi Mi Gaming Laptop 7300HQ 1060 BOEhydis NV156FHM-N61 (BOE0747), IPS, 1920x1080 | Dell Inspiron 15 7000 7577 ID: LG Philips LGD053F, Name: 156WF6, Dell P/N: 4XK13, IPS, 1920x1080 | HP Omen 15-ce002ng AUO42ED, IPS, 1920x1080 | Acer Nitro 5 AN515-51-788E LG Philips LP156WF6-SPK6, IPS, 1920x1080 | Medion Erazer X6603 LP156WF6-SPK3, AH-IPS, LED, 1920x1080 | |
|---|---|---|---|---|---|
| Display | -40% | 2% | -33% | -41% | |
| Display P3 Coverage (%) | 66.6 | 37.07 -44% | 65.8 -1% | 41.7 -37% | 36.82 -45% |
| sRGB Coverage (%) | 87.3 | 55.6 -36% | 90.9 4% | 62.2 -29% | 54.9 -37% |
| AdobeRGB 1998 Coverage (%) | 63.8 | 38.32 -40% | 66.5 4% | 43.17 -32% | 38.09 -40% |
| Response Times | 34% | 22% | 41% | 22% | |
| Response Time Grey 50% / Grey 80% * (ms) | 53.2 ? | 35.6 ? 33% | 43.2 ? 19% | 35 ? 34% | 46 ? 14% |
| Response Time Black / White * (ms) | 41.6 ? | 27.6 ? 34% | 31.2 ? 25% | 22 ? 47% | 29 ? 30% |
| PWM Frequency (Hz) | 21550 ? | 2174 ? | |||
| Screen | -31% | 8% | -16% | -33% | |
| Brightness middle (cd/m²) | 283 | 235.4 -17% | 304 7% | 276 -2% | 252 -11% |
| Brightness (cd/m²) | 269 | 223 -17% | 289 7% | 265 -1% | 246 -9% |
| Brightness Distribution (%) | 87 | 91 5% | 86 -1% | 91 5% | 94 8% |
| Black Level * (cd/m²) | 0.23 | 0.28 -22% | 0.26 -13% | 0.25 -9% | 0.23 -0% |
| Contrast (:1) | 1230 | 841 -32% | 1169 -5% | 1104 -10% | 1096 -11% |
| Colorchecker dE 2000 * | 4.68 | 5.6 -20% | 3.46 26% | 5.06 -8% | 7.83 -67% |
| Colorchecker dE 2000 max. * | 8 | 20.3 -154% | 7.72 3% | 10.13 -27% | 15.5 -94% |
| Colorchecker dE 2000 calibrated * | 2.5 | ||||
| Greyscale dE 2000 * | 4.32 | 3.6 17% | 2.46 43% | 6.25 -45% | 7.11 -65% |
| Gamma | 2.36 93% | 2.23 99% | 2.38 92% | 1.76 125% | 2.19 100% |
| CCT | 7612 85% | 7214 90% | 6915 94% | 6873 95% | 7930 82% |
| Color Space (Percent of AdobeRGB 1998) (%) | 57 | 35.2 -38% | 59 4% | 40 -30% | 35 -39% |
| Color Space (Percent of sRGB) (%) | 87 | 55.4 -36% | 91 5% | 62 -29% | 55 -37% |
| Totalt genomsnitt (program/inställningar) | -12% /
-24% | 11% /
8% | -3% /
-12% | -17% /
-27% |
* ... mindre är bättre
Visa svarstider
| ↔ Svarstid svart till vitt | ||
|---|---|---|
| 41.6 ms ... stiga ↗ och falla ↘ kombinerat | ↗ 23.6 ms stiga | 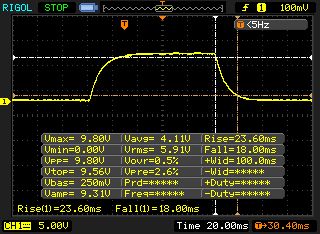 |
| ↘ 18 ms hösten | ||
| Skärmen visar långsamma svarsfrekvenser i våra tester och kommer att vara otillfredsställande för spelare. I jämförelse sträcker sig alla testade enheter från 0.1 (minst) till 240 (maximalt) ms. » 98 % av alla enheter är bättre. Detta innebär att den uppmätta svarstiden är sämre än genomsnittet av alla testade enheter (19.8 ms). | ||
| ↔ Svarstid 50 % grått till 80 % grått | ||
| 53.2 ms ... stiga ↗ och falla ↘ kombinerat | ↗ 26.4 ms stiga | 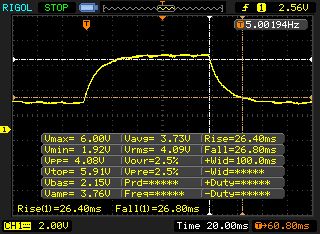 |
| ↘ 26.8 ms hösten | ||
| Skärmen visar långsamma svarsfrekvenser i våra tester och kommer att vara otillfredsställande för spelare. I jämförelse sträcker sig alla testade enheter från 0.165 (minst) till 636 (maximalt) ms. » 90 % av alla enheter är bättre. Detta innebär att den uppmätta svarstiden är sämre än genomsnittet av alla testade enheter (31 ms). | ||
Skärmflimmer / PWM (Puls-Width Modulation)
| Skärmflimmer / PWM upptäckt | 21550 Hz | ≤ 99 % ljusstyrka inställning | 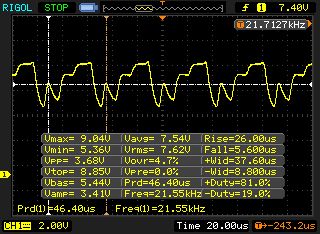 |
Displayens bakgrundsbelysning flimrar vid 21550 Hz (i värsta fall, t.ex. med PWM) Flimrande upptäckt vid en ljusstyrkeinställning på 99 % och lägre. Det ska inte finnas något flimmer eller PWM över denna ljusstyrkeinställning. Frekvensen för 21550 Hz är ganska hög, så de flesta användare som är känsliga för PWM bör inte märka något flimmer. Som jämförelse: 52 % av alla testade enheter använder inte PWM för att dämpa skärmen. Om PWM upptäcktes mättes ett medelvärde av 7754 (minst: 5 - maximum: 343500) Hz. | |||
| PCMark 8 Home Score Accelerated v2 | 3910 poäng | |
| PCMark 8 Work Score Accelerated v2 | 4912 poäng | |
| PCMark 10 Score | 4197 poäng | |
Hjälp | ||
| Xiaomi Mi Gaming Laptop 7300HQ 1060 Samsung PM871b MZNLN128HAHQ | Dell Inspiron 15 7000 7577 Samsung PM961 MZVLW256HEHP | HP Omen 15-ce002ng Samsung PM961 MZVLW256HEHP | Acer Nitro 5 AN515-51-788E Intel SSD 600p SSDPEKKW256G7 | Medion Erazer X6603 Samsung PM961 MZVLW256HEHP | |
|---|---|---|---|---|---|
| AS SSD | 165% | 29% | 175% | ||
| Seq Read (MB/s) | 502 | 2652 428% | 1404 180% | 2805 459% | |
| Seq Write (MB/s) | 450.1 | 1181 162% | 521 16% | 1081 140% | |
| 4K Read (MB/s) | 38.11 | 46.95 23% | 27.86 -27% | 46.58 22% | |
| 4K Write (MB/s) | 104.1 | 100.2 -4% | 75 -28% | 129.3 24% | |
| Score Read (Points) | 343 | 1241 262% | 446 30% | 1162 239% | |
| Score Write (Points) | 302 | 594 97% | 344 14% | 750 148% | |
| Score Total (Points) | 834 | 2405 188% | 984 18% | 2431 191% |

| 3DMark 11 Performance | 11106 poäng | |
| 3DMark Cloud Gate Standard Score | 16619 poäng | |
| 3DMark Fire Strike Score | 9249 poäng | |
Hjälp | ||
| The Witcher 3 - 1920x1080 Ultra Graphics & Postprocessing (HBAO+) | |
| Genomsnitt av klass Gaming (104.7 - 240, n=7, senaste 2 åren) | |
| Xiaomi Mi Gaming Laptop 7300HQ 1060 | |
| Dell Inspiron 15 7000 7577 | |
| HP Omen 15-ce002ng | |
| Acer Nitro 5 AN515-51-788E | |
| låg | med. | hög | ultra | |
|---|---|---|---|---|
| The Witcher 3 (2015) | 72.8 | 40.3 | ||
| The Evil Within 2 (2017) | 36.5 | 35.1 | ||
| ELEX (2017) | 70.9 | 54 | ||
| Fortnite (2018) | 91.5 | 81.4 | ||
| Final Fantasy XV Benchmark (2018) | 39.8 | |||
| Kingdom Come: Deliverance (2018) | 43.6 | 36 | ||
| Far Cry 5 (2018) | 62 | 59 |
Ljudnivå
| Låg belastning |
| 30 / 34 / 38 dB(A) |
| Hårddisk |
| 32 dB(A) |
| Hög belastning |
| 44 / 55 dB(A) |
 | ||
30 dB tyst 40 dB(A) hörbar 50 dB(A) högt ljud |
||
min: | ||
| Xiaomi Mi Gaming Laptop 7300HQ 1060 GeForce GTX 1060 Mobile, i5-7300HQ | Dell Inspiron 15 7000 7577 GeForce GTX 1060 Max-Q, i5-7300HQ | HP Omen 15-ce002ng GeForce GTX 1060 Max-Q, i7-7700HQ | Acer Nitro 5 AN515-51-788E GeForce GTX 1050 Ti Mobile, i7-7700HQ | Medion Erazer X6603 GeForce GTX 1050 Ti Mobile, i7-7700HQ | Genomsnitt av klass Gaming | |
|---|---|---|---|---|---|---|
| Noise | 18% | 5% | 9% | 10% | 13% | |
| av / miljö * (dB) | 30 | 28 7% | 30 -0% | 30.6 -2% | 30.9 -3% | 24.1 ? 20% |
| Idle Minimum * (dB) | 30 | 28 7% | 30 -0% | 30.6 -2% | 30.9 -3% | 26 ? 13% |
| Idle Average * (dB) | 34 | 28 18% | 33 3% | 30.7 10% | 30.9 9% | 27.4 ? 19% |
| Idle Maximum * (dB) | 38 | 28 26% | 37 3% | 30.7 19% | 31.6 17% | 30.1 ? 21% |
| Load Average * (dB) | 44 | 30.3 31% | 41 7% | 43 2% | 38.5 12% | 43.6 ? 1% |
| Witcher 3 ultra * (dB) | 50 | 39.5 21% | 42 16% | 39.7 21% | ||
| Load Maximum * (dB) | 55 | 46.5 15% | 50 9% | 45.8 17% | 40.8 26% | 54.2 ? 1% |
* ... mindre är bättre
(-) Den maximala temperaturen på ovansidan är 46 °C / 115 F, jämfört med genomsnittet av 40.4 °C / 105 F , allt från 21.2 till 68.8 °C för klassen Gaming.
(-) Botten värms upp till maximalt 52 °C / 126 F, jämfört med genomsnittet av 43.2 °C / 110 F
(+) Vid tomgångsbruk är medeltemperaturen för ovansidan 27.2 °C / 81 F, jämfört med enhetsgenomsnittet på 33.9 °C / ### class_avg_f### F.
(±) När du spelar The Witcher 3 är medeltemperaturen för ovansidan 37.1 °C / 99 F, jämfört med enhetsgenomsnittet på 33.9 °C / ## #class_avg_f### F.
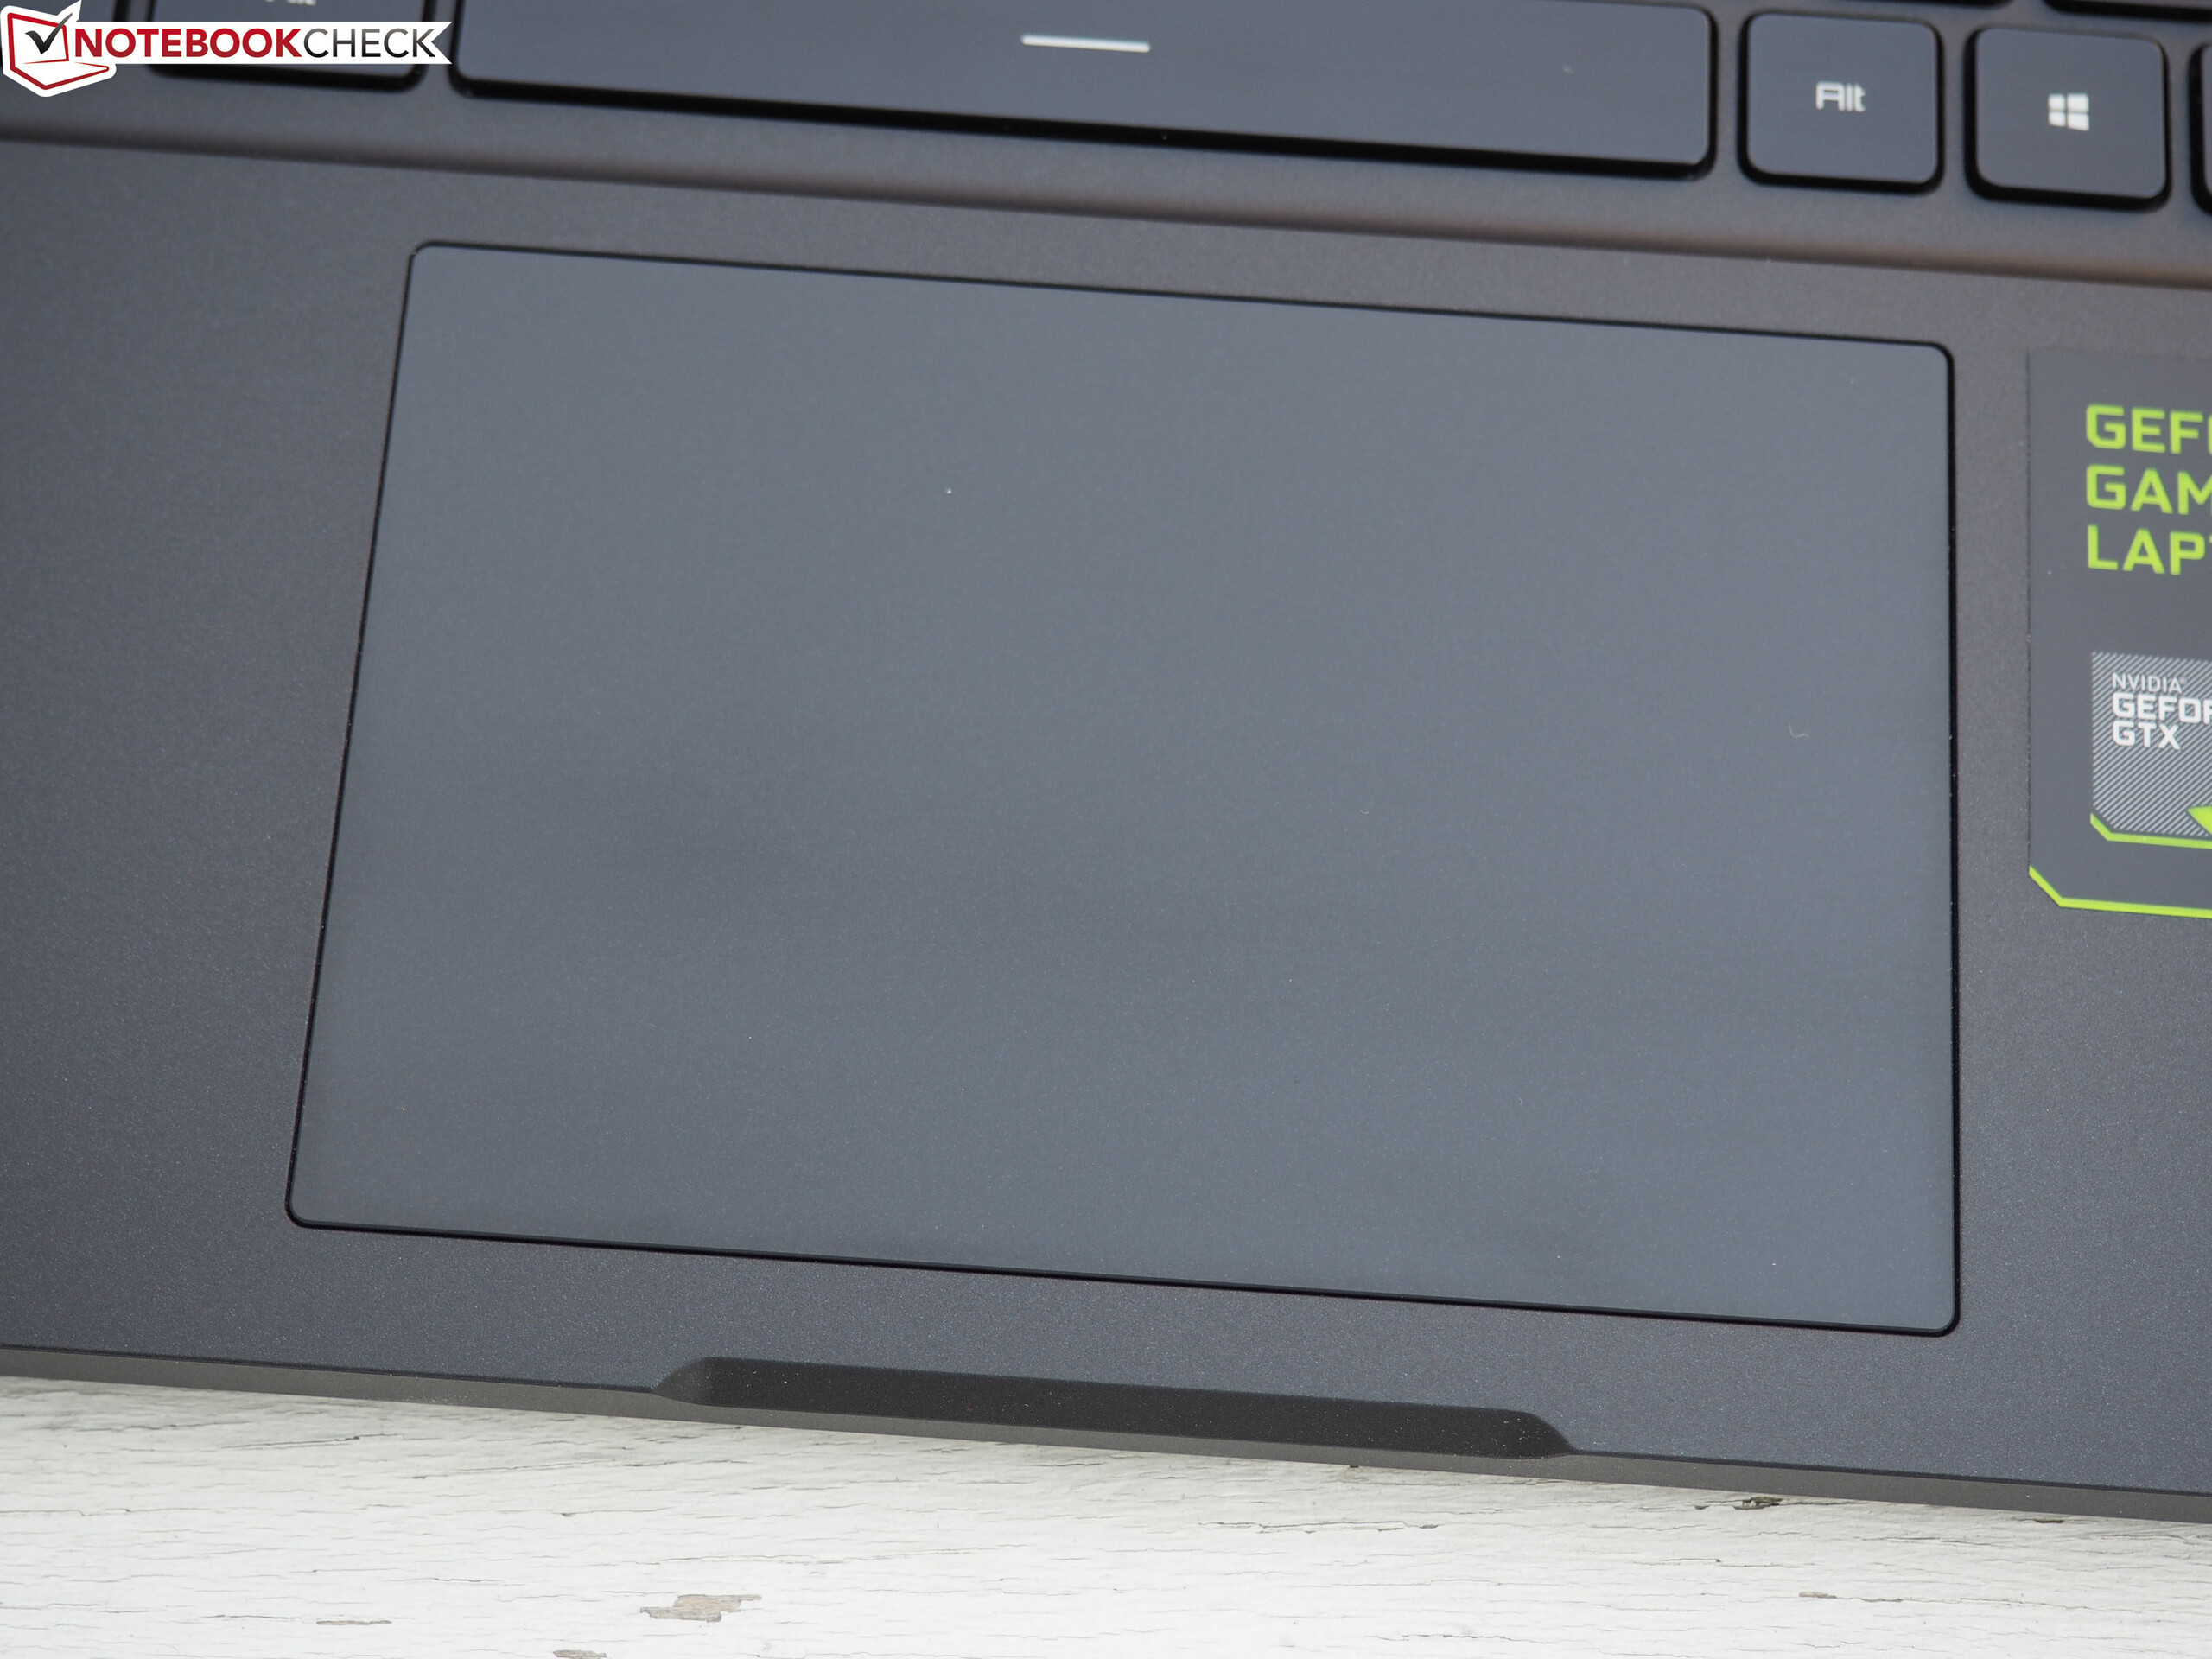
(+) Handledsstöden och pekplattan är kallare än hudtemperaturen med maximalt 28 °C / 82.4 F och är därför svala att ta på.
(±) Medeltemperaturen för handledsstödsområdet på liknande enheter var 28.8 °C / 83.8 F (+0.8 °C / 1.4 F).
| Xiaomi Mi Gaming Laptop 7300HQ 1060 GeForce GTX 1060 Mobile, i5-7300HQ | Dell Inspiron 15 7000 7577 GeForce GTX 1060 Max-Q, i5-7300HQ | HP Omen 15-ce002ng GeForce GTX 1060 Max-Q, i7-7700HQ | Acer Nitro 5 AN515-51-788E GeForce GTX 1050 Ti Mobile, i7-7700HQ | Medion Erazer X6603 GeForce GTX 1050 Ti Mobile, i7-7700HQ | Genomsnitt av klass Gaming | |
|---|---|---|---|---|---|---|
| Heat | 13% | -11% | 16% | 18% | 1% | |
| Maximum Upper Side * (°C) | 46 | 44 4% | 47 -2% | 41.1 11% | 44.3 4% | 45.2 ? 2% |
| Maximum Bottom * (°C) | 52 | 43.8 16% | 54 -4% | 38.8 25% | 39.5 24% | 48.1 ? 7% |
| Idle Upper Side * (°C) | 32 | 26 19% | 36 -13% | 28.7 10% | 24.8 22% | 31 ? 3% |
| Idle Bottom * (°C) | 32 | 28 12% | 40 -25% | 26.9 16% | 24.6 23% | 34.2 ? -7% |
* ... mindre är bättre
Xiaomi Mi Gaming Laptop 7300HQ 1060 ljudanalys
(+) | högtalare kan spela relativt högt (88 dB)
Bas 100 - 315 Hz
(±) | reducerad bas - i genomsnitt 13.5% lägre än medianen
(±) | linjäriteten för basen är genomsnittlig (8.5% delta till föregående frekvens)
Mellan 400 - 2000 Hz
(+) | balanserad mellan - endast 4.6% från medianen
(+) | mids är linjära (5% delta till föregående frekvens)
Högsta 2 - 16 kHz
(+) | balanserade toppar - endast 2.6% från medianen
(+) | toppar är linjära (4.4% delta till föregående frekvens)
Totalt 100 - 16 000 Hz
(+) | det totala ljudet är linjärt (13.2% skillnad mot median)
Jämfört med samma klass
» 19% av alla testade enheter i den här klassen var bättre, 4% liknande, 77% sämre
» Den bästa hade ett delta på 6%, genomsnittet var 18%, sämst var 132%
Jämfört med alla testade enheter
» 14% av alla testade enheter var bättre, 3% liknande, 84% sämre
» Den bästa hade ett delta på 4%, genomsnittet var 23%, sämst var 134%
Dell Inspiron 15 7000 7577 ljudanalys
(±) | högtalarljudstyrkan är genomsnittlig men bra (80.9 dB)
Bas 100 - 315 Hz
(±) | reducerad bas - i genomsnitt 13% lägre än medianen
(+) | basen är linjär (6.8% delta till föregående frekvens)
Mellan 400 - 2000 Hz
(+) | balanserad mellan - endast 2.7% från medianen
(+) | mids är linjära (5.3% delta till föregående frekvens)
Högsta 2 - 16 kHz
(±) | högre toppar - i genomsnitt 8% högre än medianen
(±) | linjäriteten för toppar är genomsnittlig (10.6% delta till föregående frekvens)
Totalt 100 - 16 000 Hz
(±) | linjäriteten för det totala ljudet är genomsnittlig (18.9% skillnad mot median)
Jämfört med samma klass
» 63% av alla testade enheter i den här klassen var bättre, 8% liknande, 29% sämre
» Den bästa hade ett delta på 6%, genomsnittet var 18%, sämst var 132%
Jämfört med alla testade enheter
» 44% av alla testade enheter var bättre, 8% liknande, 48% sämre
» Den bästa hade ett delta på 4%, genomsnittet var 23%, sämst var 134%
| Av/Standby | |
| Låg belastning | |
| Hög belastning |
|
Förklaring:
min: | |
| Xiaomi Mi Gaming Laptop 7300HQ 1060 GeForce GTX 1060 Mobile, i5-7300HQ | Dell Inspiron 15 7000 7577 GeForce GTX 1060 Max-Q, i5-7300HQ | HP Omen 15-ce002ng GeForce GTX 1060 Max-Q, i7-7700HQ | Acer Nitro 5 AN515-51-788E GeForce GTX 1050 Ti Mobile, i7-7700HQ | Medion Erazer X6603 GeForce GTX 1050 Ti Mobile, i7-7700HQ | Genomsnitt av klass Gaming | |
|---|---|---|---|---|---|---|
| Power Consumption | 29% | -41% | 24% | 29% | -52% | |
| Idle Minimum * (Watt) | 10 | 7.1 29% | 18 -80% | 4.1 59% | 4.7 53% | 13 ? -30% |
| Idle Average * (Watt) | 13 | 7.6 42% | 23 -77% | 6.9 47% | 7.6 42% | 19 ? -46% |
| Idle Maximum * (Watt) | 19 | 8.6 55% | 30 -58% | 9.5 50% | 9.2 52% | 24.6 ? -29% |
| Load Average * (Watt) | 68 | 59.5 12% | 85 -25% | 83 -22% | 81 -19% | 110.7 ? -63% |
| Witcher 3 ultra * (Watt) | 110 | 89 19% | 96 13% | 108 2% | ||
| Load Maximum * (Watt) | 136 | 112.8 17% | 158 -16% | 126 7% | 112 18% | 259 ? -90% |
* ... mindre är bättre
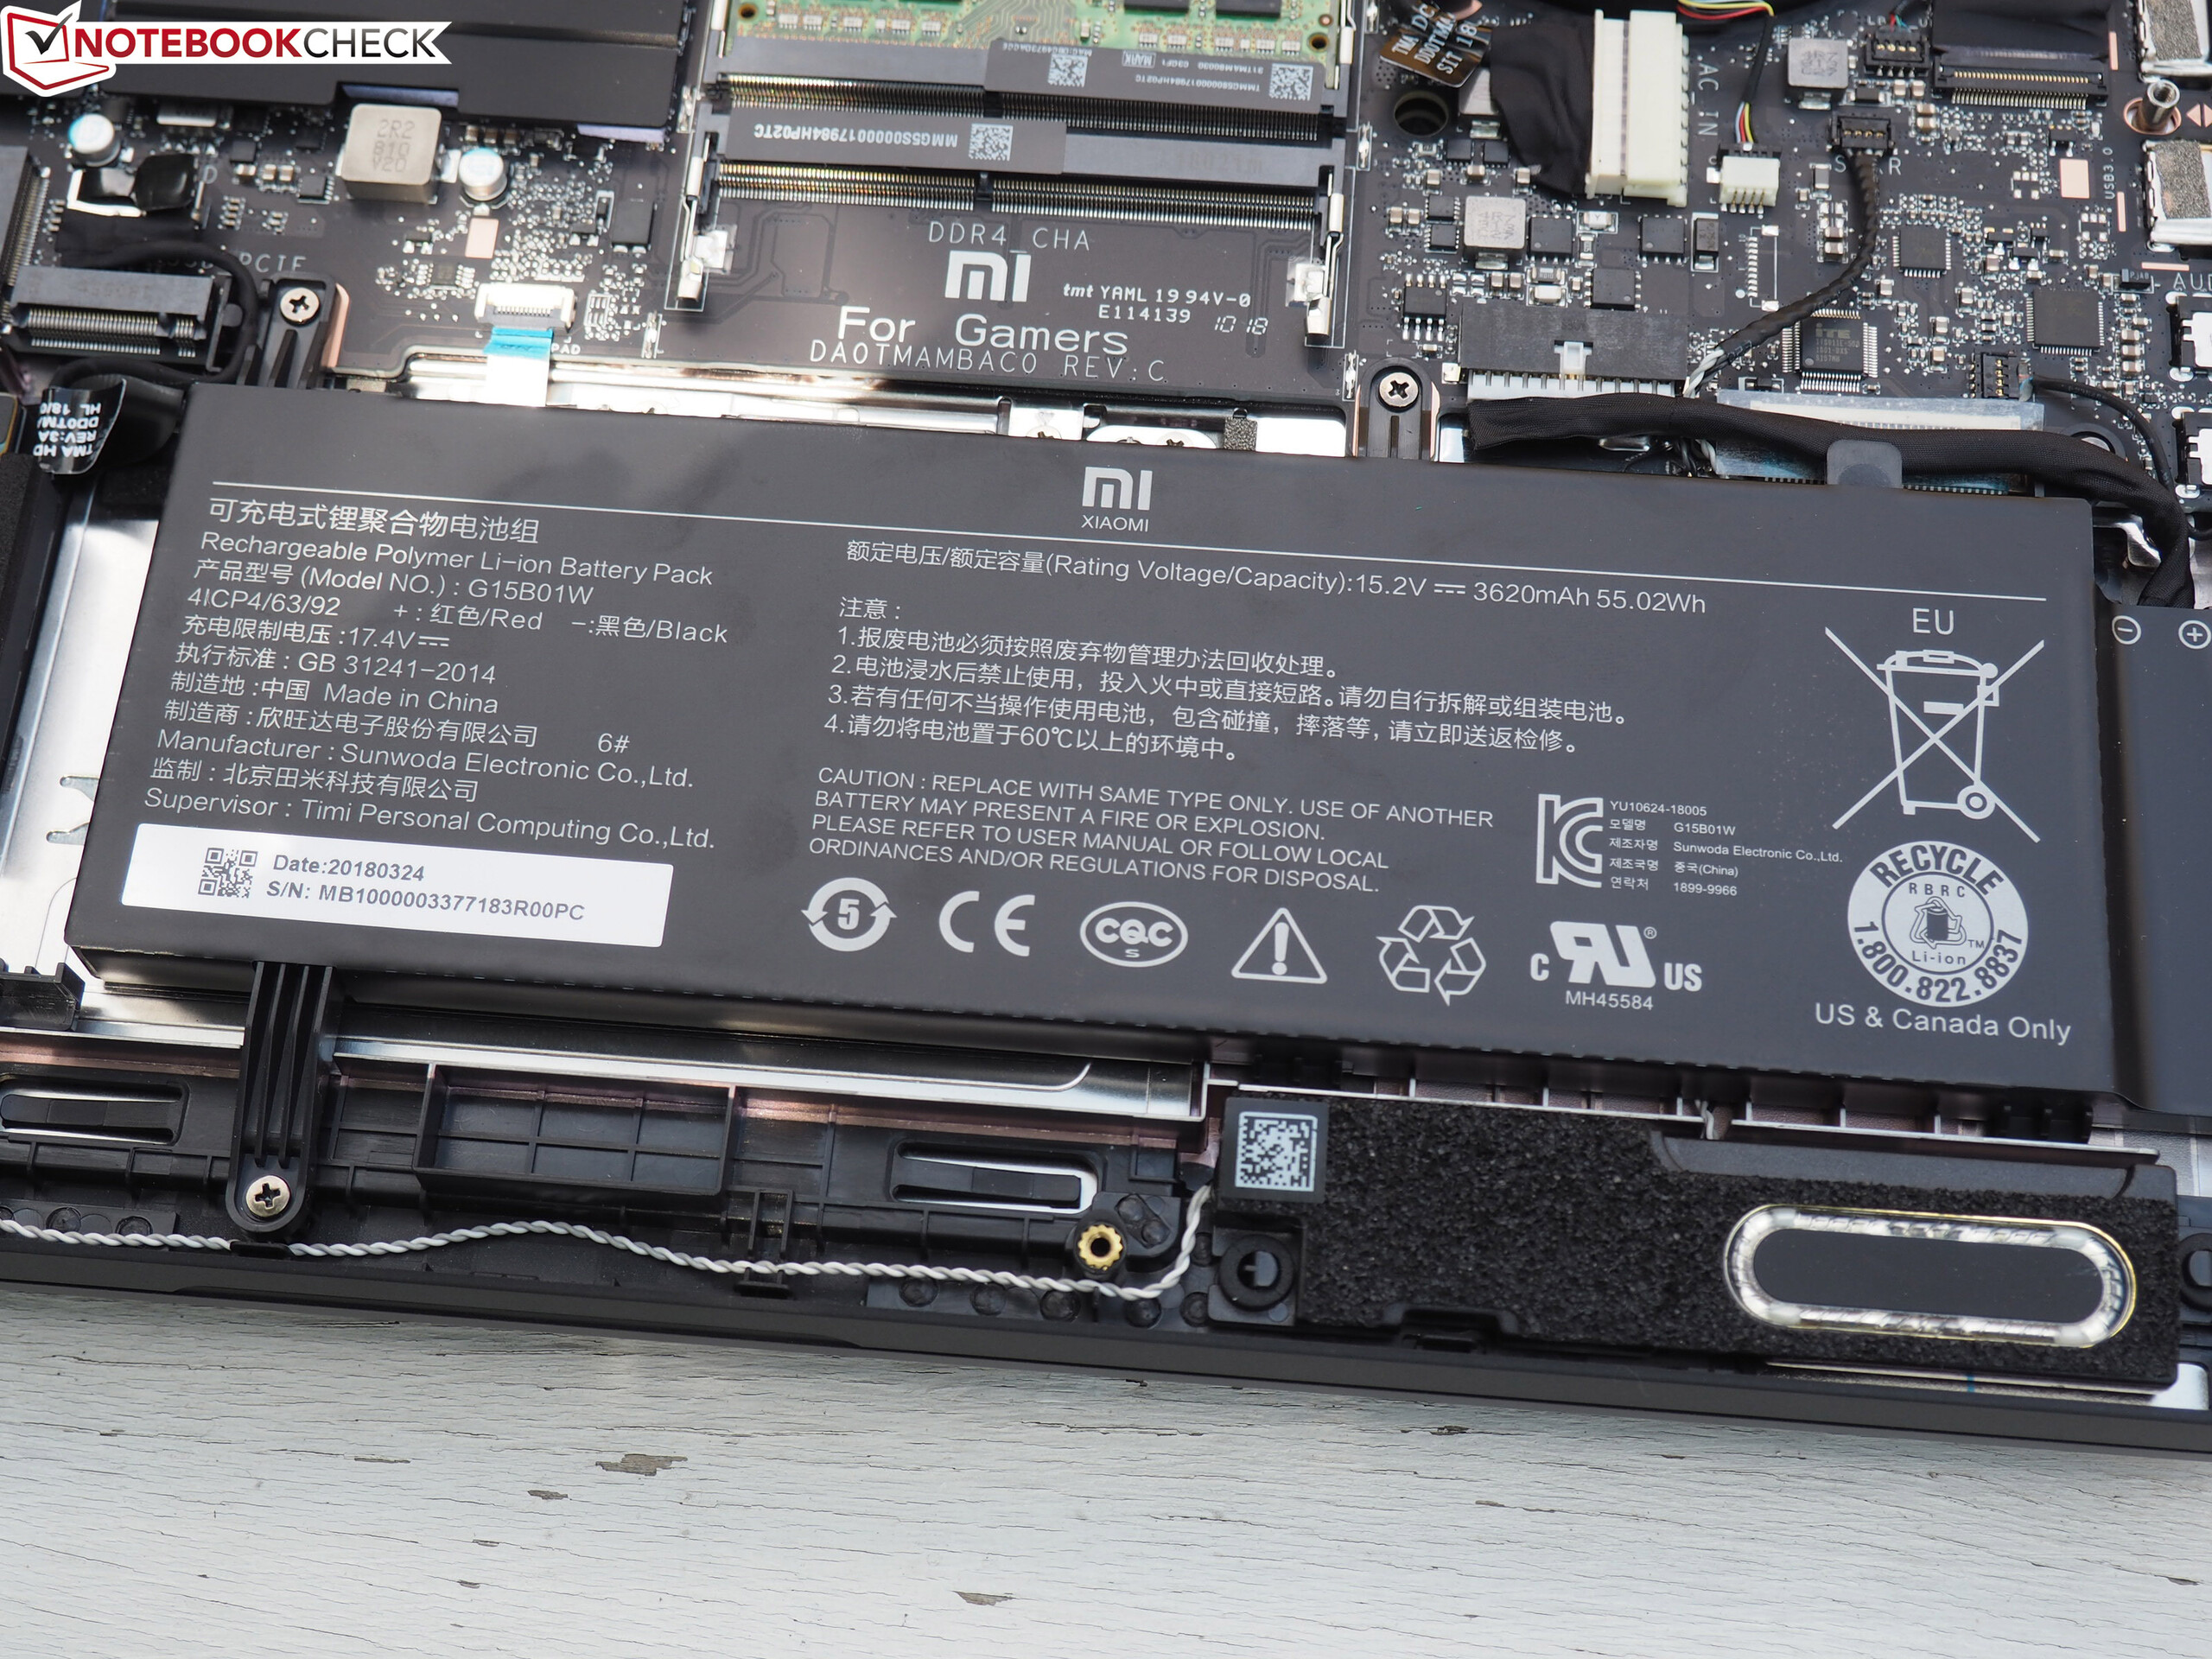
| Xiaomi Mi Gaming Laptop 7300HQ 1060 GeForce GTX 1060 Mobile, i5-7300HQ, 55 Wh | Dell Inspiron 15 7000 7577 GeForce GTX 1060 Max-Q, i5-7300HQ, 56 Wh | HP Omen 15-ce002ng GeForce GTX 1060 Max-Q, i7-7700HQ, 70 Wh | Acer Nitro 5 AN515-51-788E GeForce GTX 1050 Ti Mobile, i7-7700HQ, 48 Wh | Medion Erazer X6603 GeForce GTX 1050 Ti Mobile, i7-7700HQ, 45 Wh | Genomsnitt av klass Gaming | |
|---|---|---|---|---|---|---|
| Batteridrifttid | 48% | -19% | 46% | -18% | 47% | |
| Reader / Idle (h) | 6.4 | 11 72% | 4.3 -33% | 14.9 133% | 5.7 -11% | 8.27 ? 29% |
| H.264 (h) | 4.4 | 3.7 -16% | 5.2 18% | 3.8 -14% | 8.32 ? 89% | |
| WiFi v1.3 (h) | 4.6 | 6.9 50% | 3.3 -28% | 6.7 46% | 4.3 -7% | 7.11 ? 55% |
| Load (h) | 1.3 | 1.6 23% | 1.3 0% | 1.1 -15% | 0.8 -38% | 1.502 ? 16% |
För
Emot
Läs den fullständiga versionen av den här recensionen på engelska här.
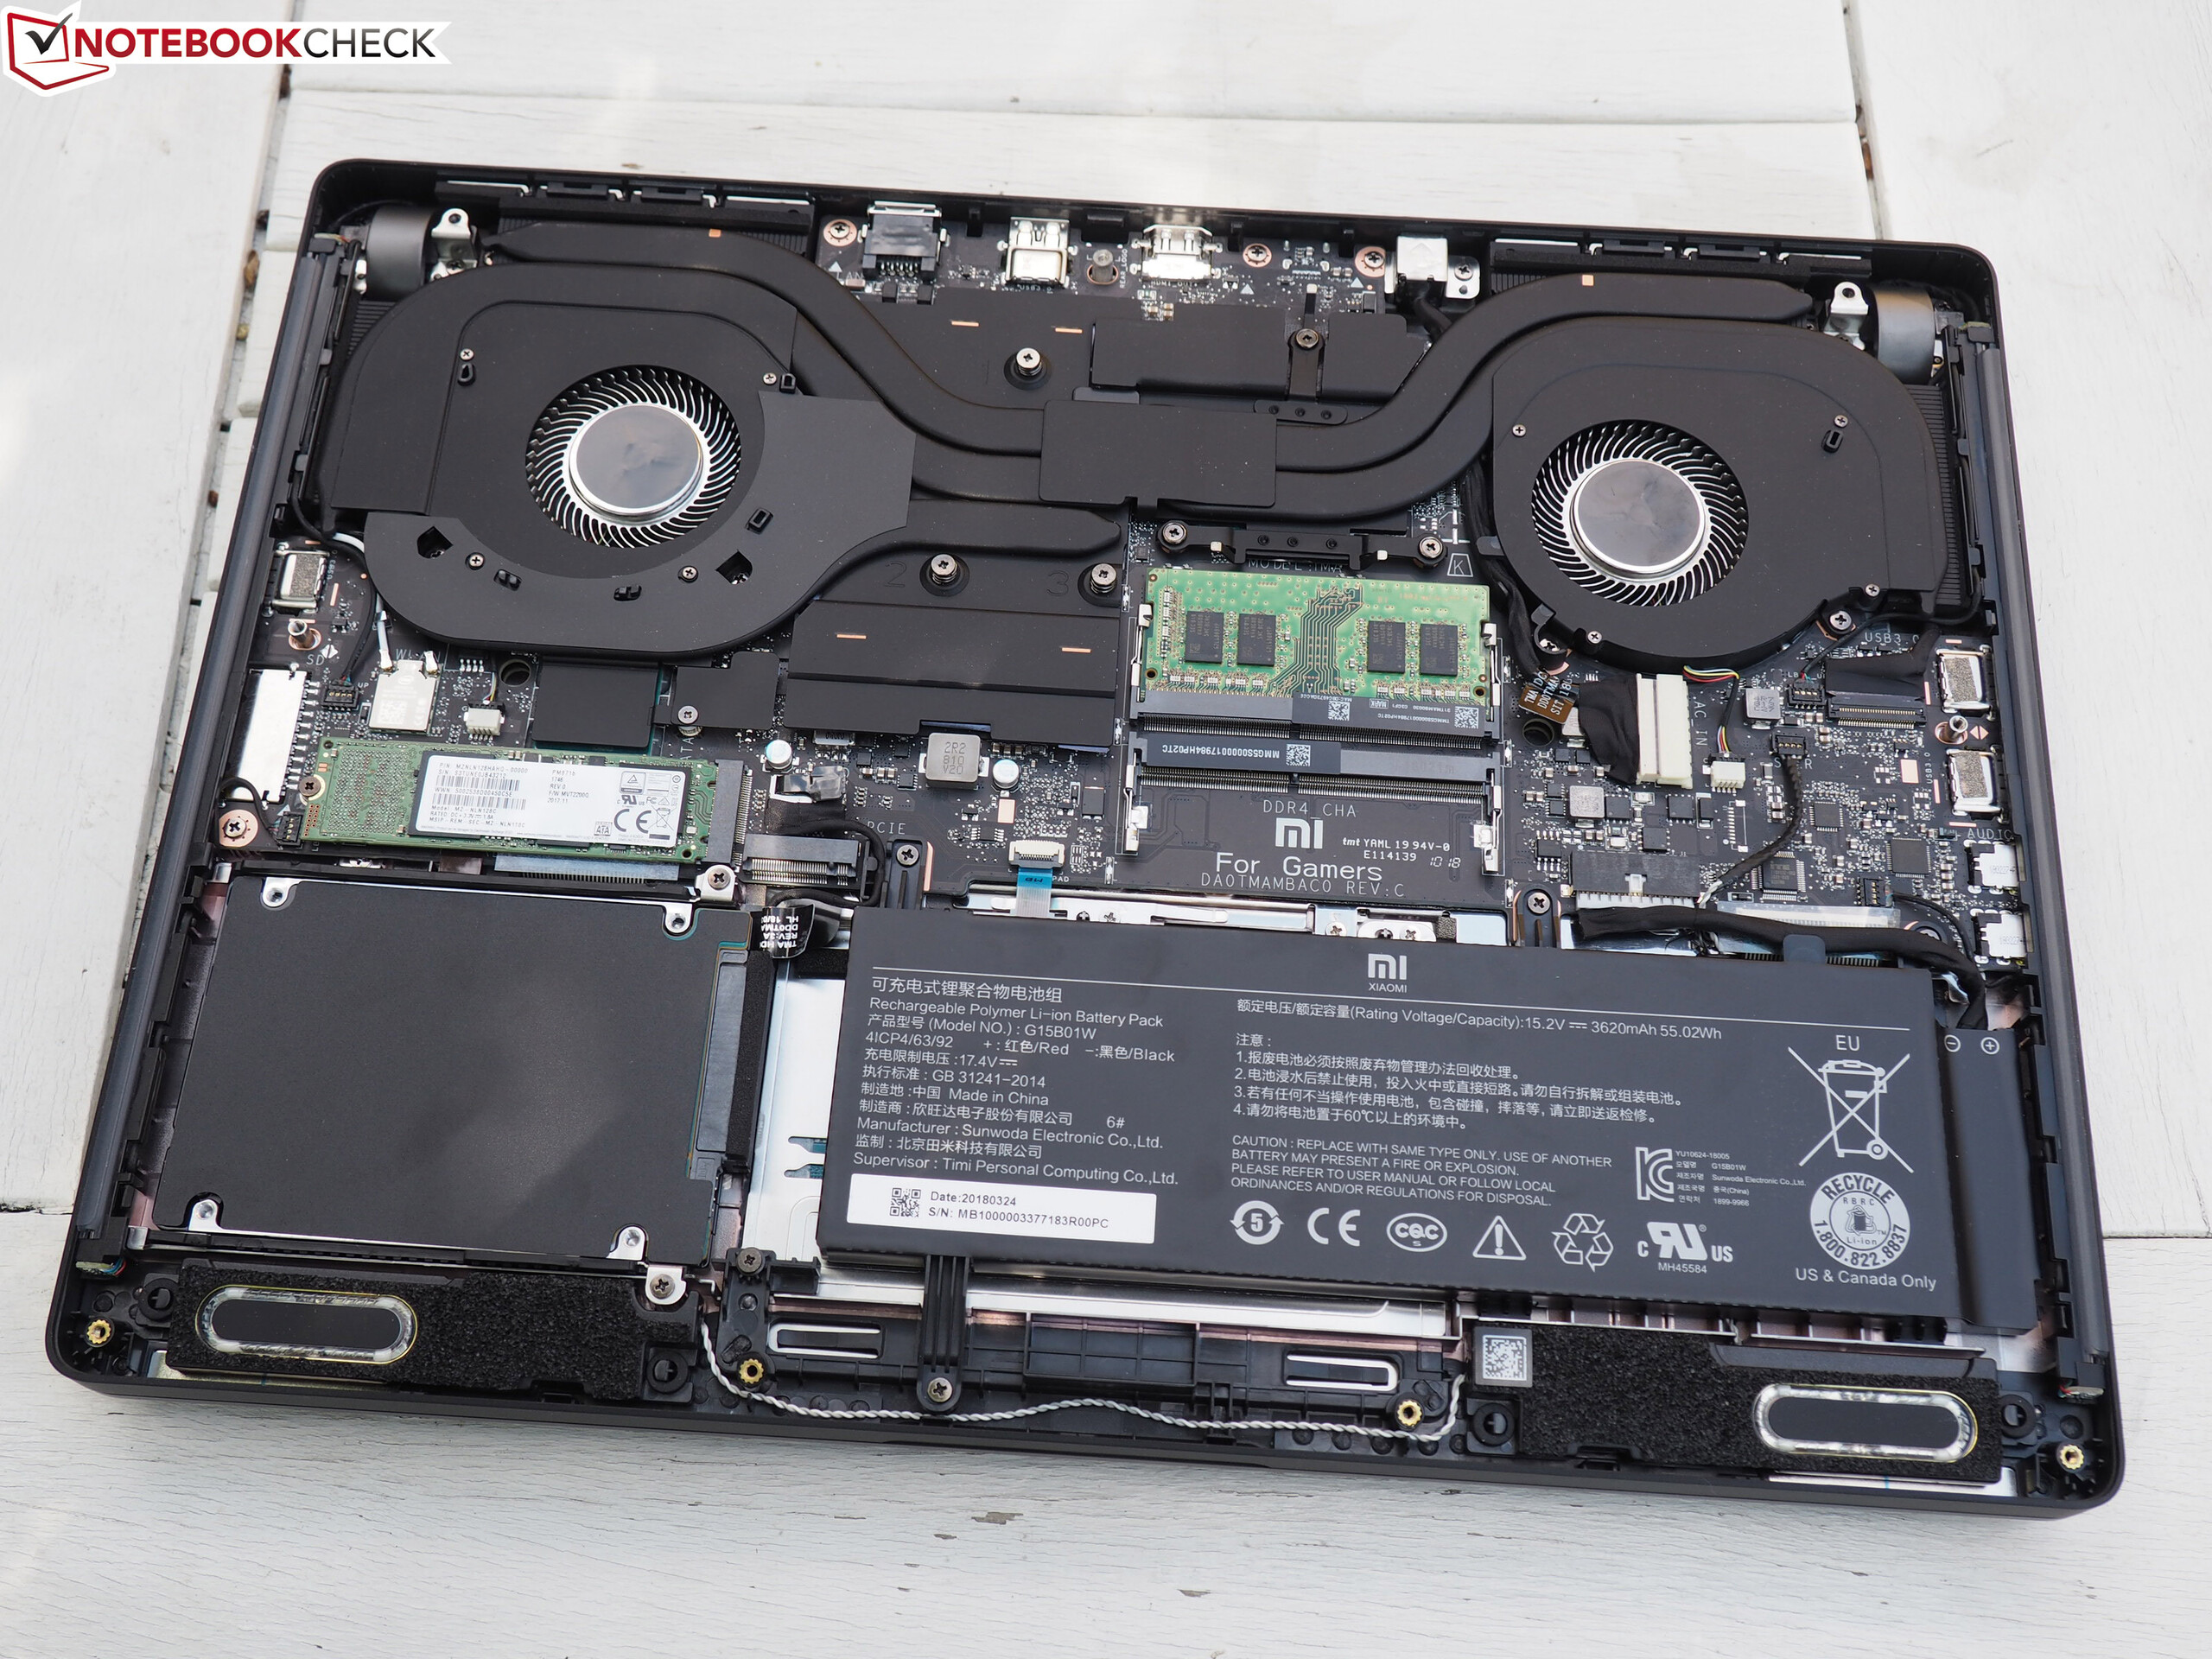
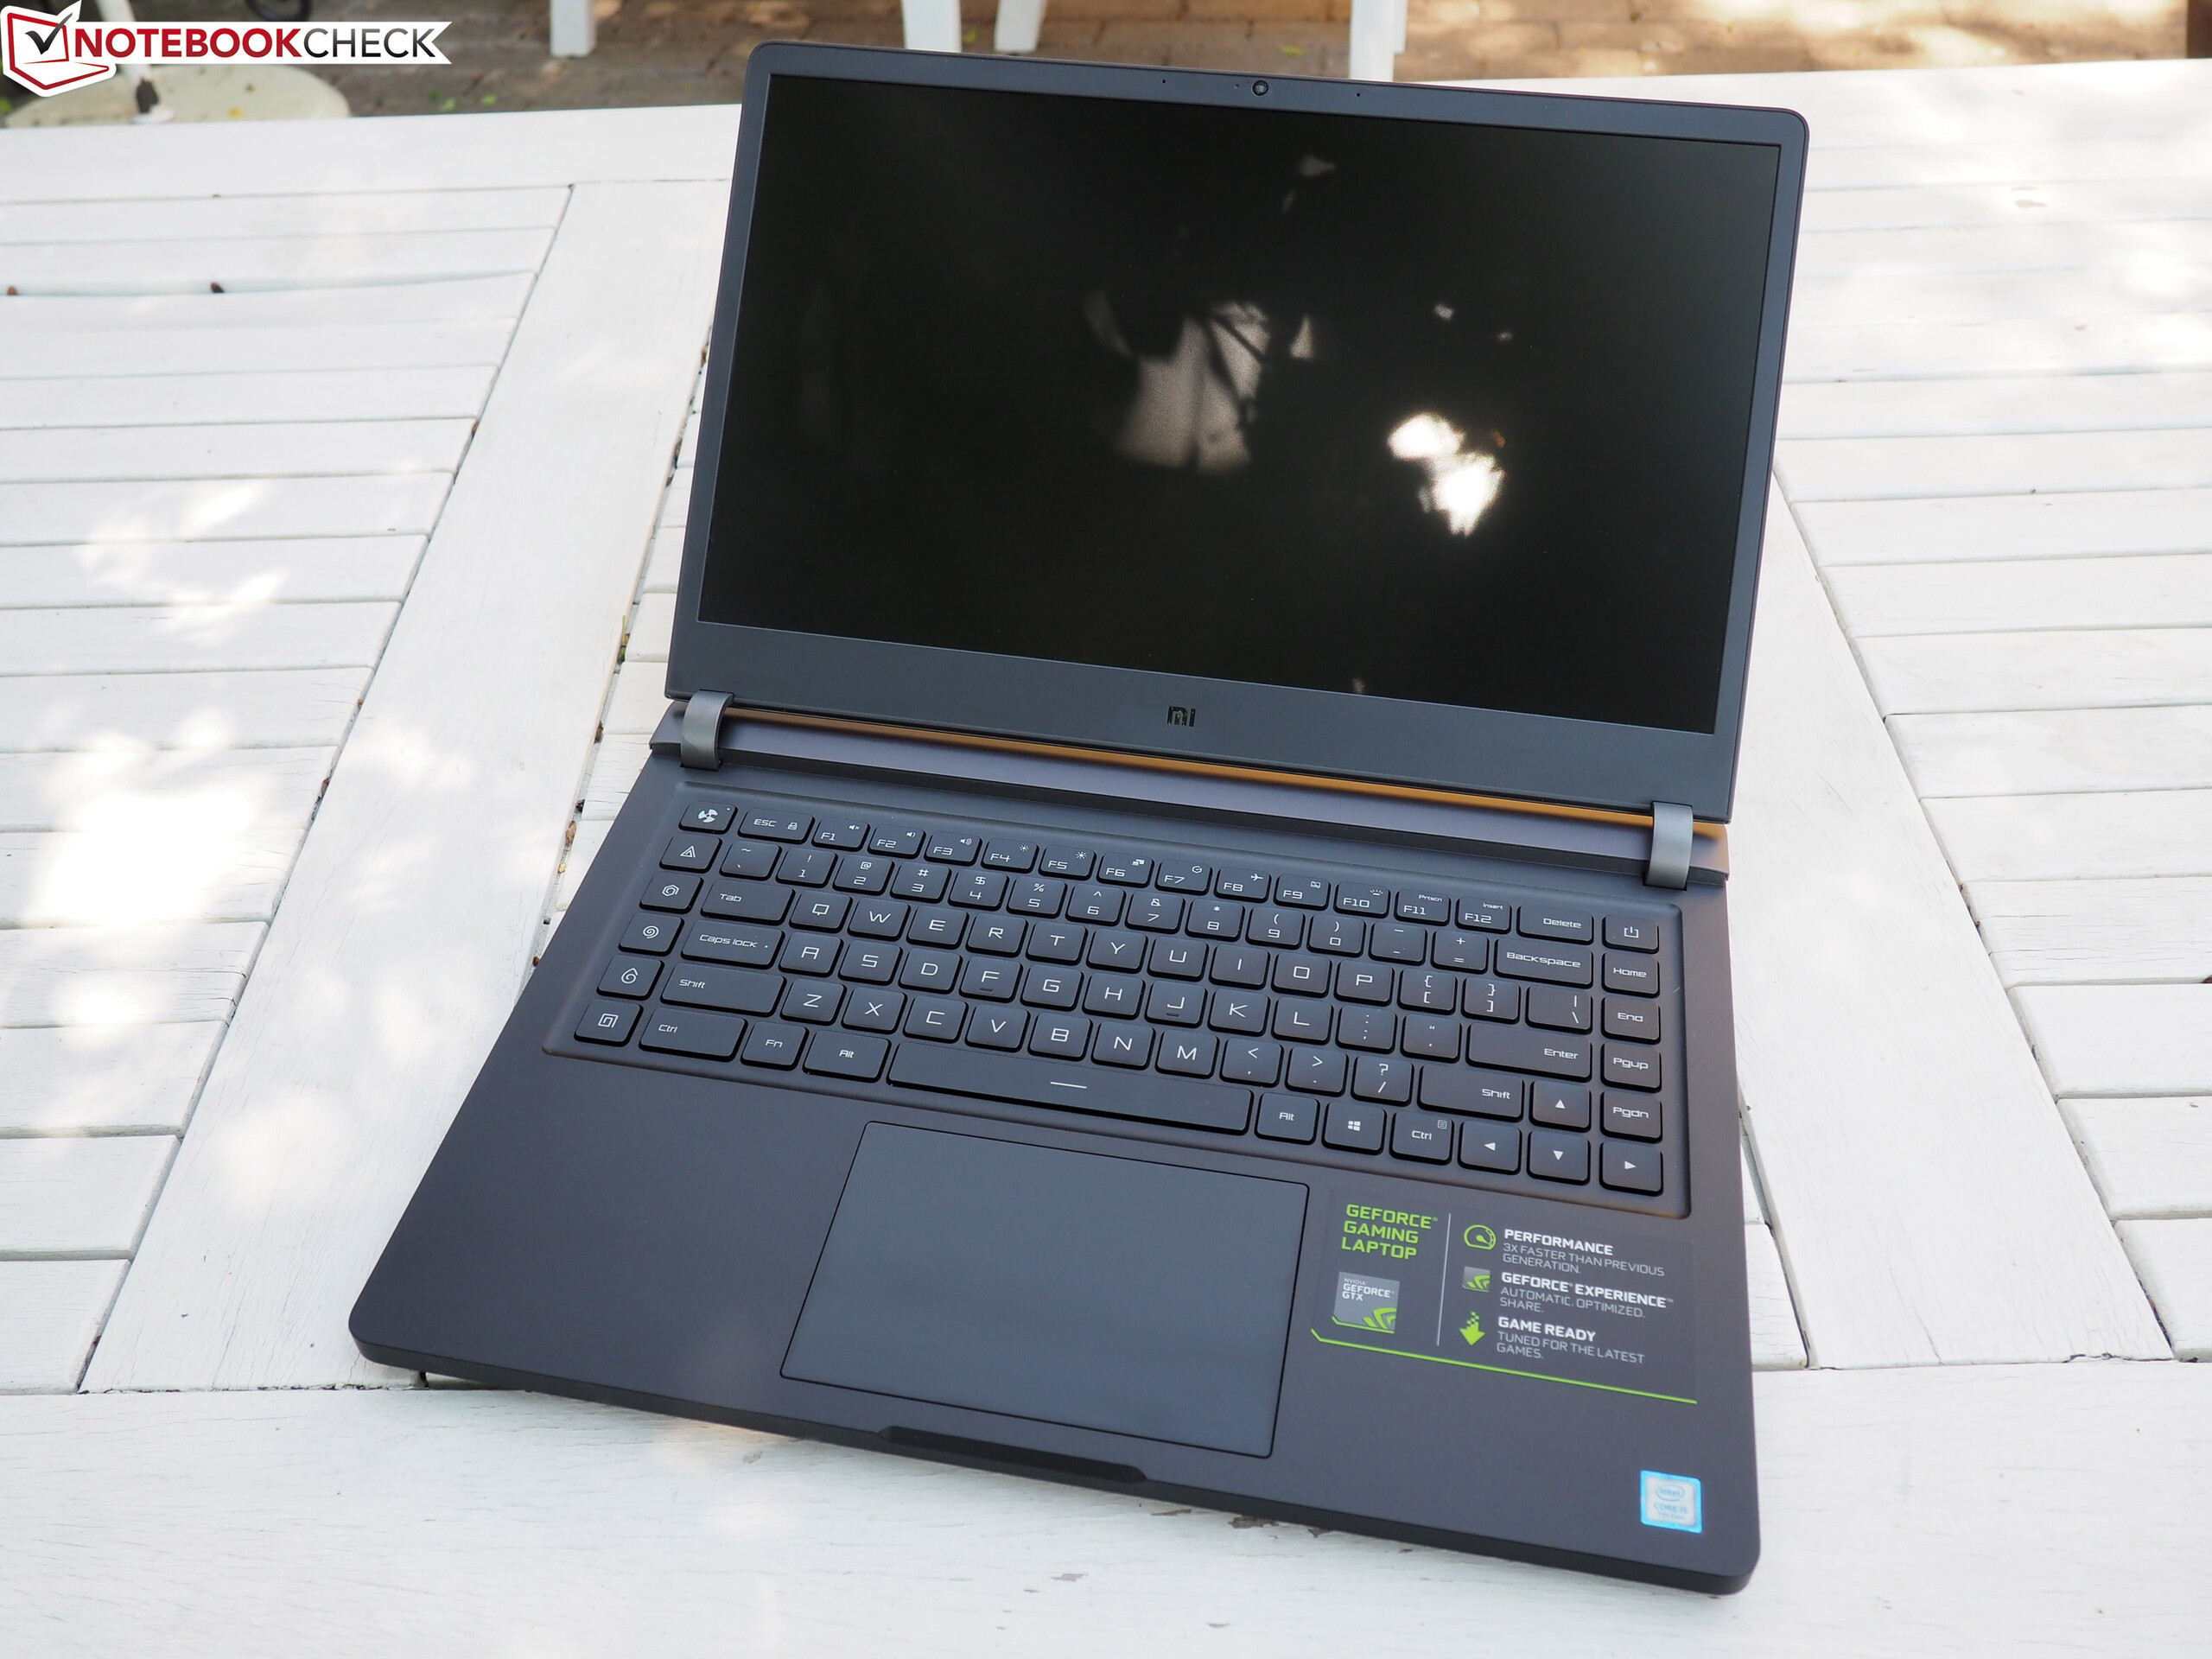
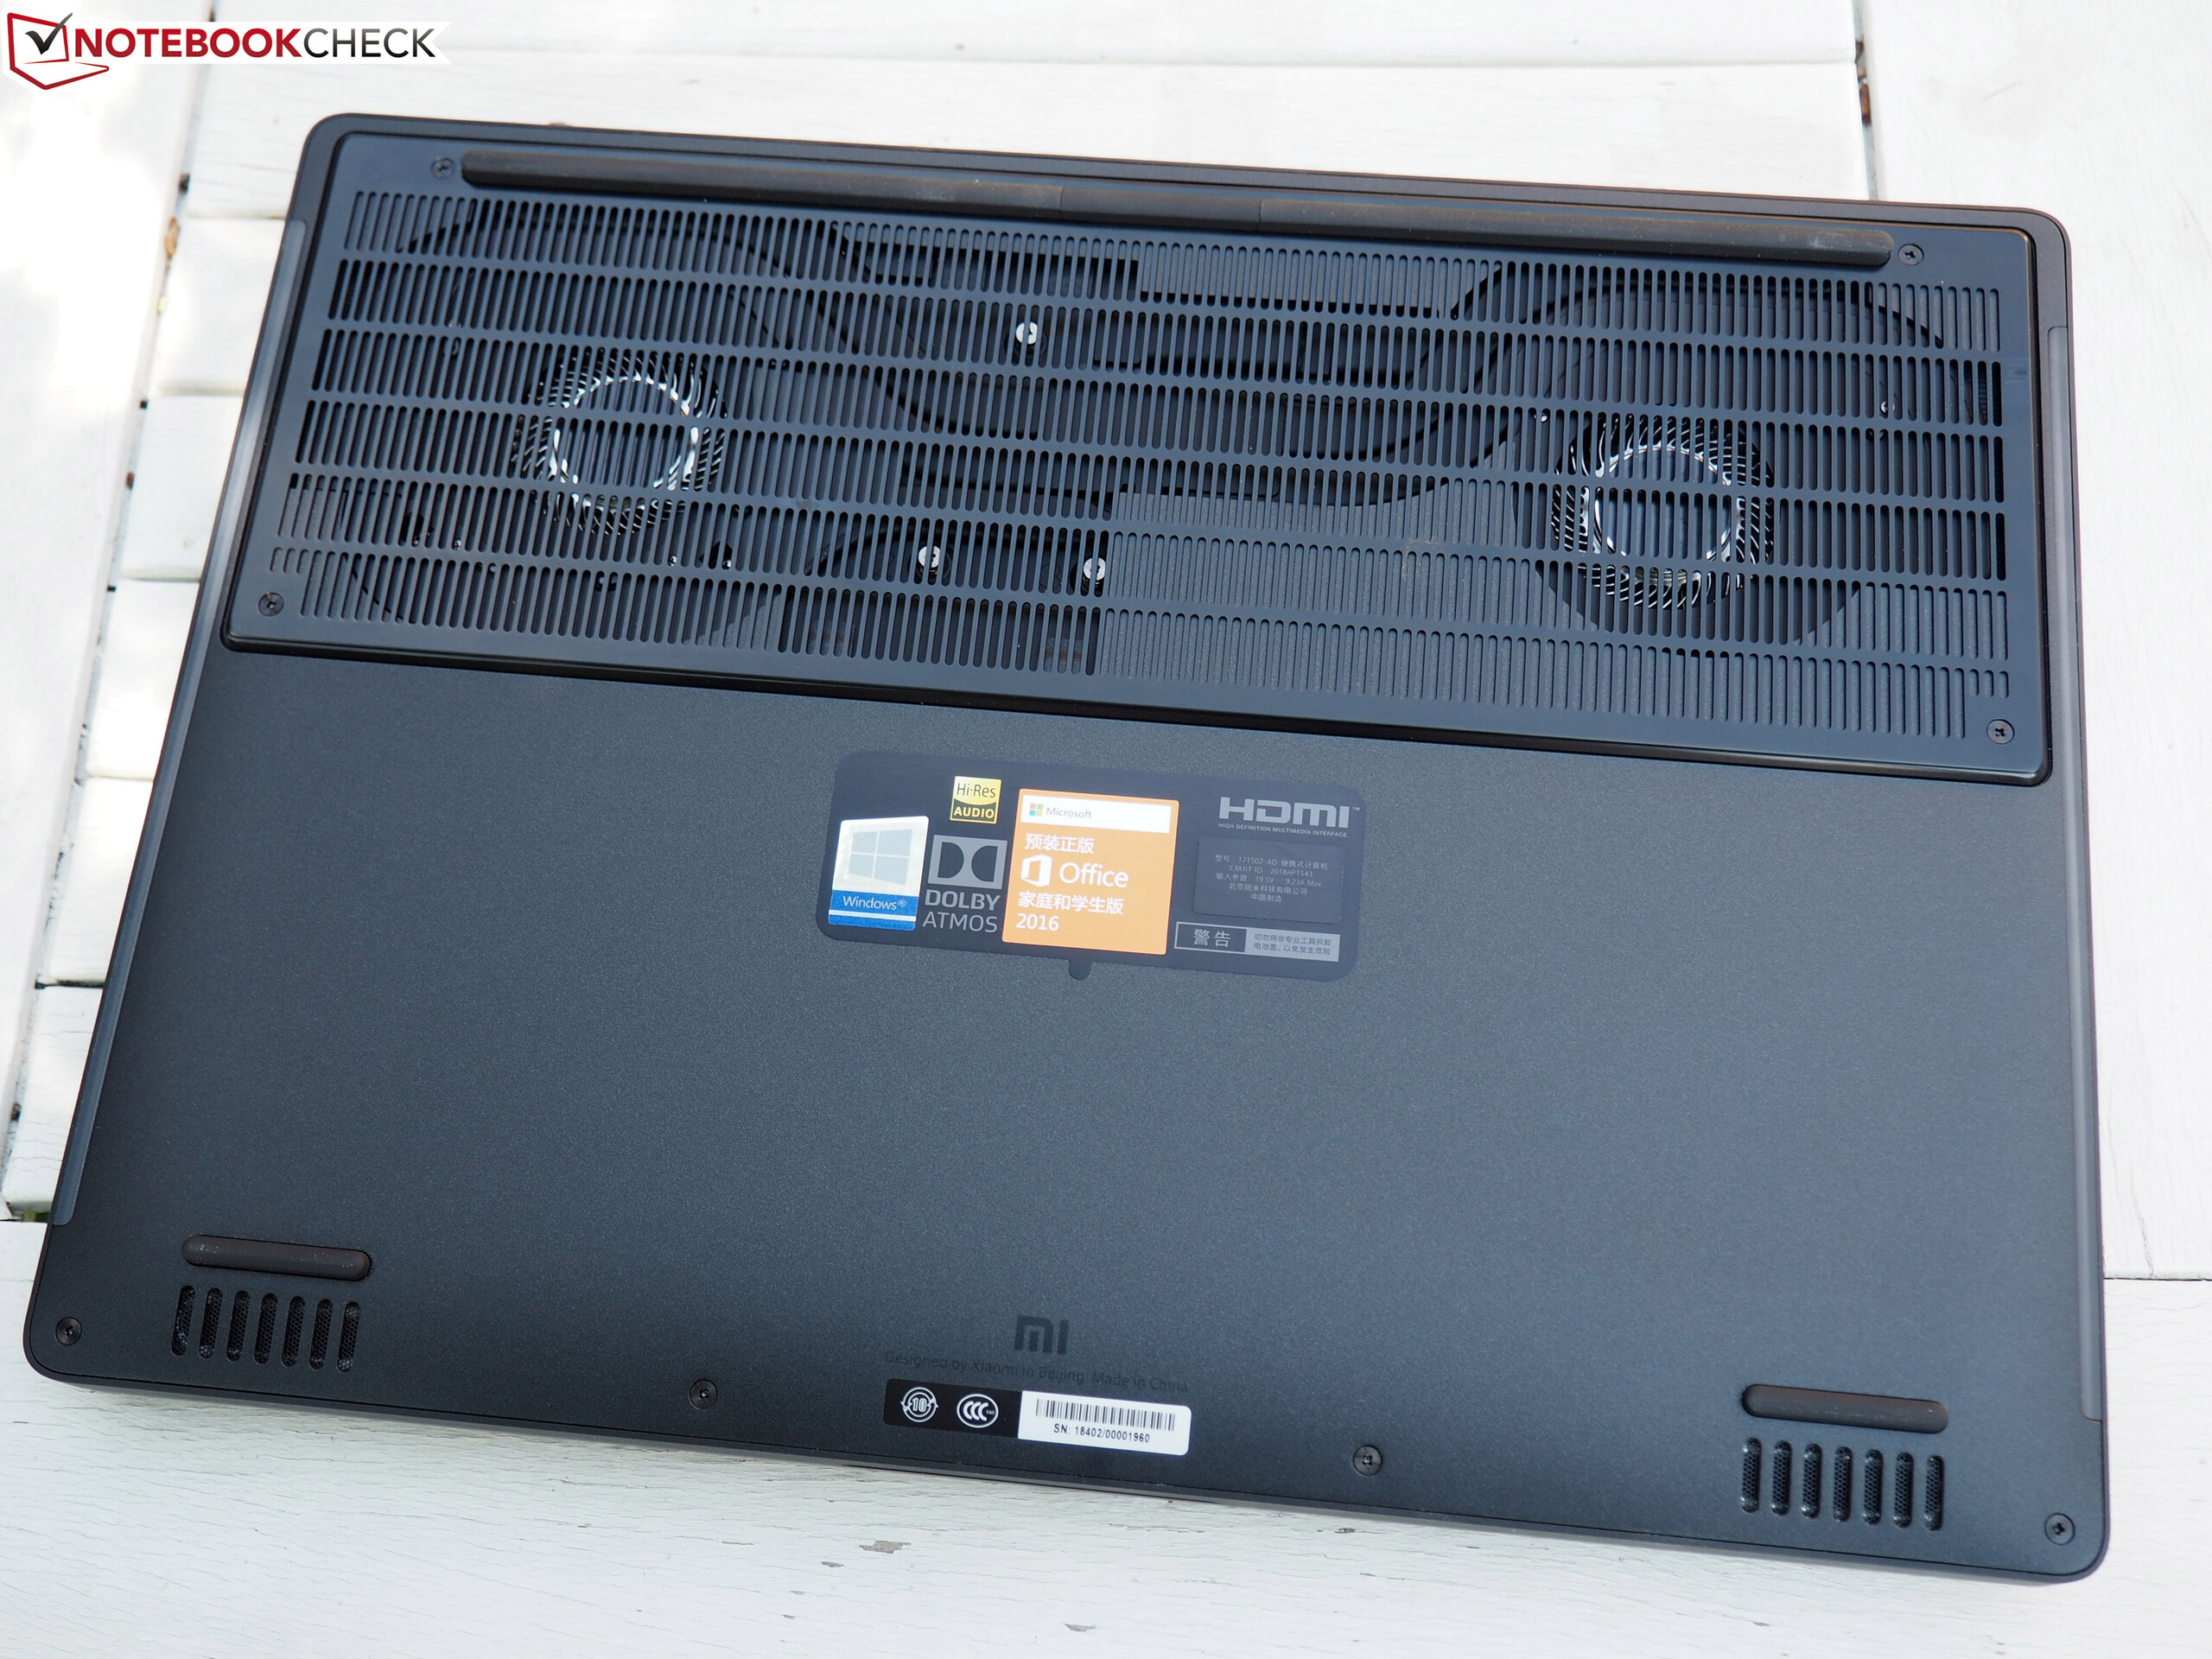
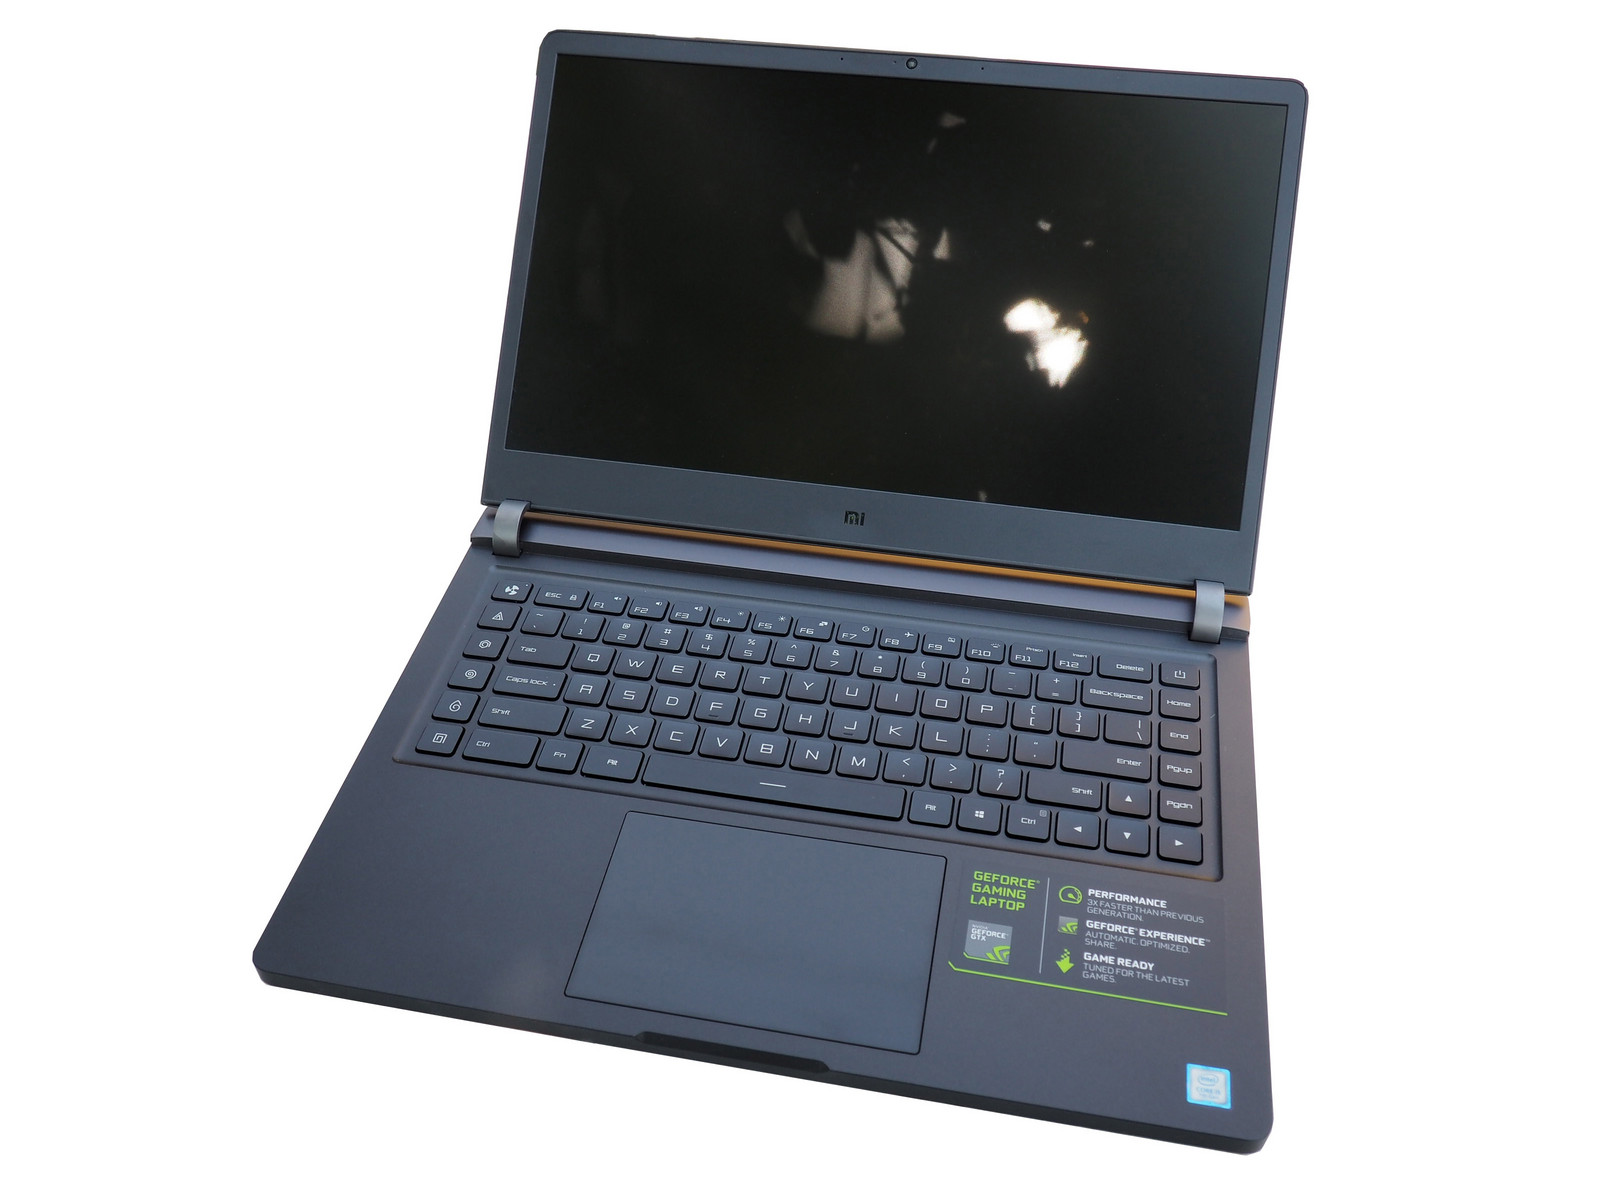
Billiga varor från fjärran östern? Även om denna fördom kan gälla för många produkter så passar den inte Mi Gaming Laptop. I dom flesta fall kan denna laptop på 15 tum lätt hålla jämna steg med konkurrensen, eller till och med gå om den.
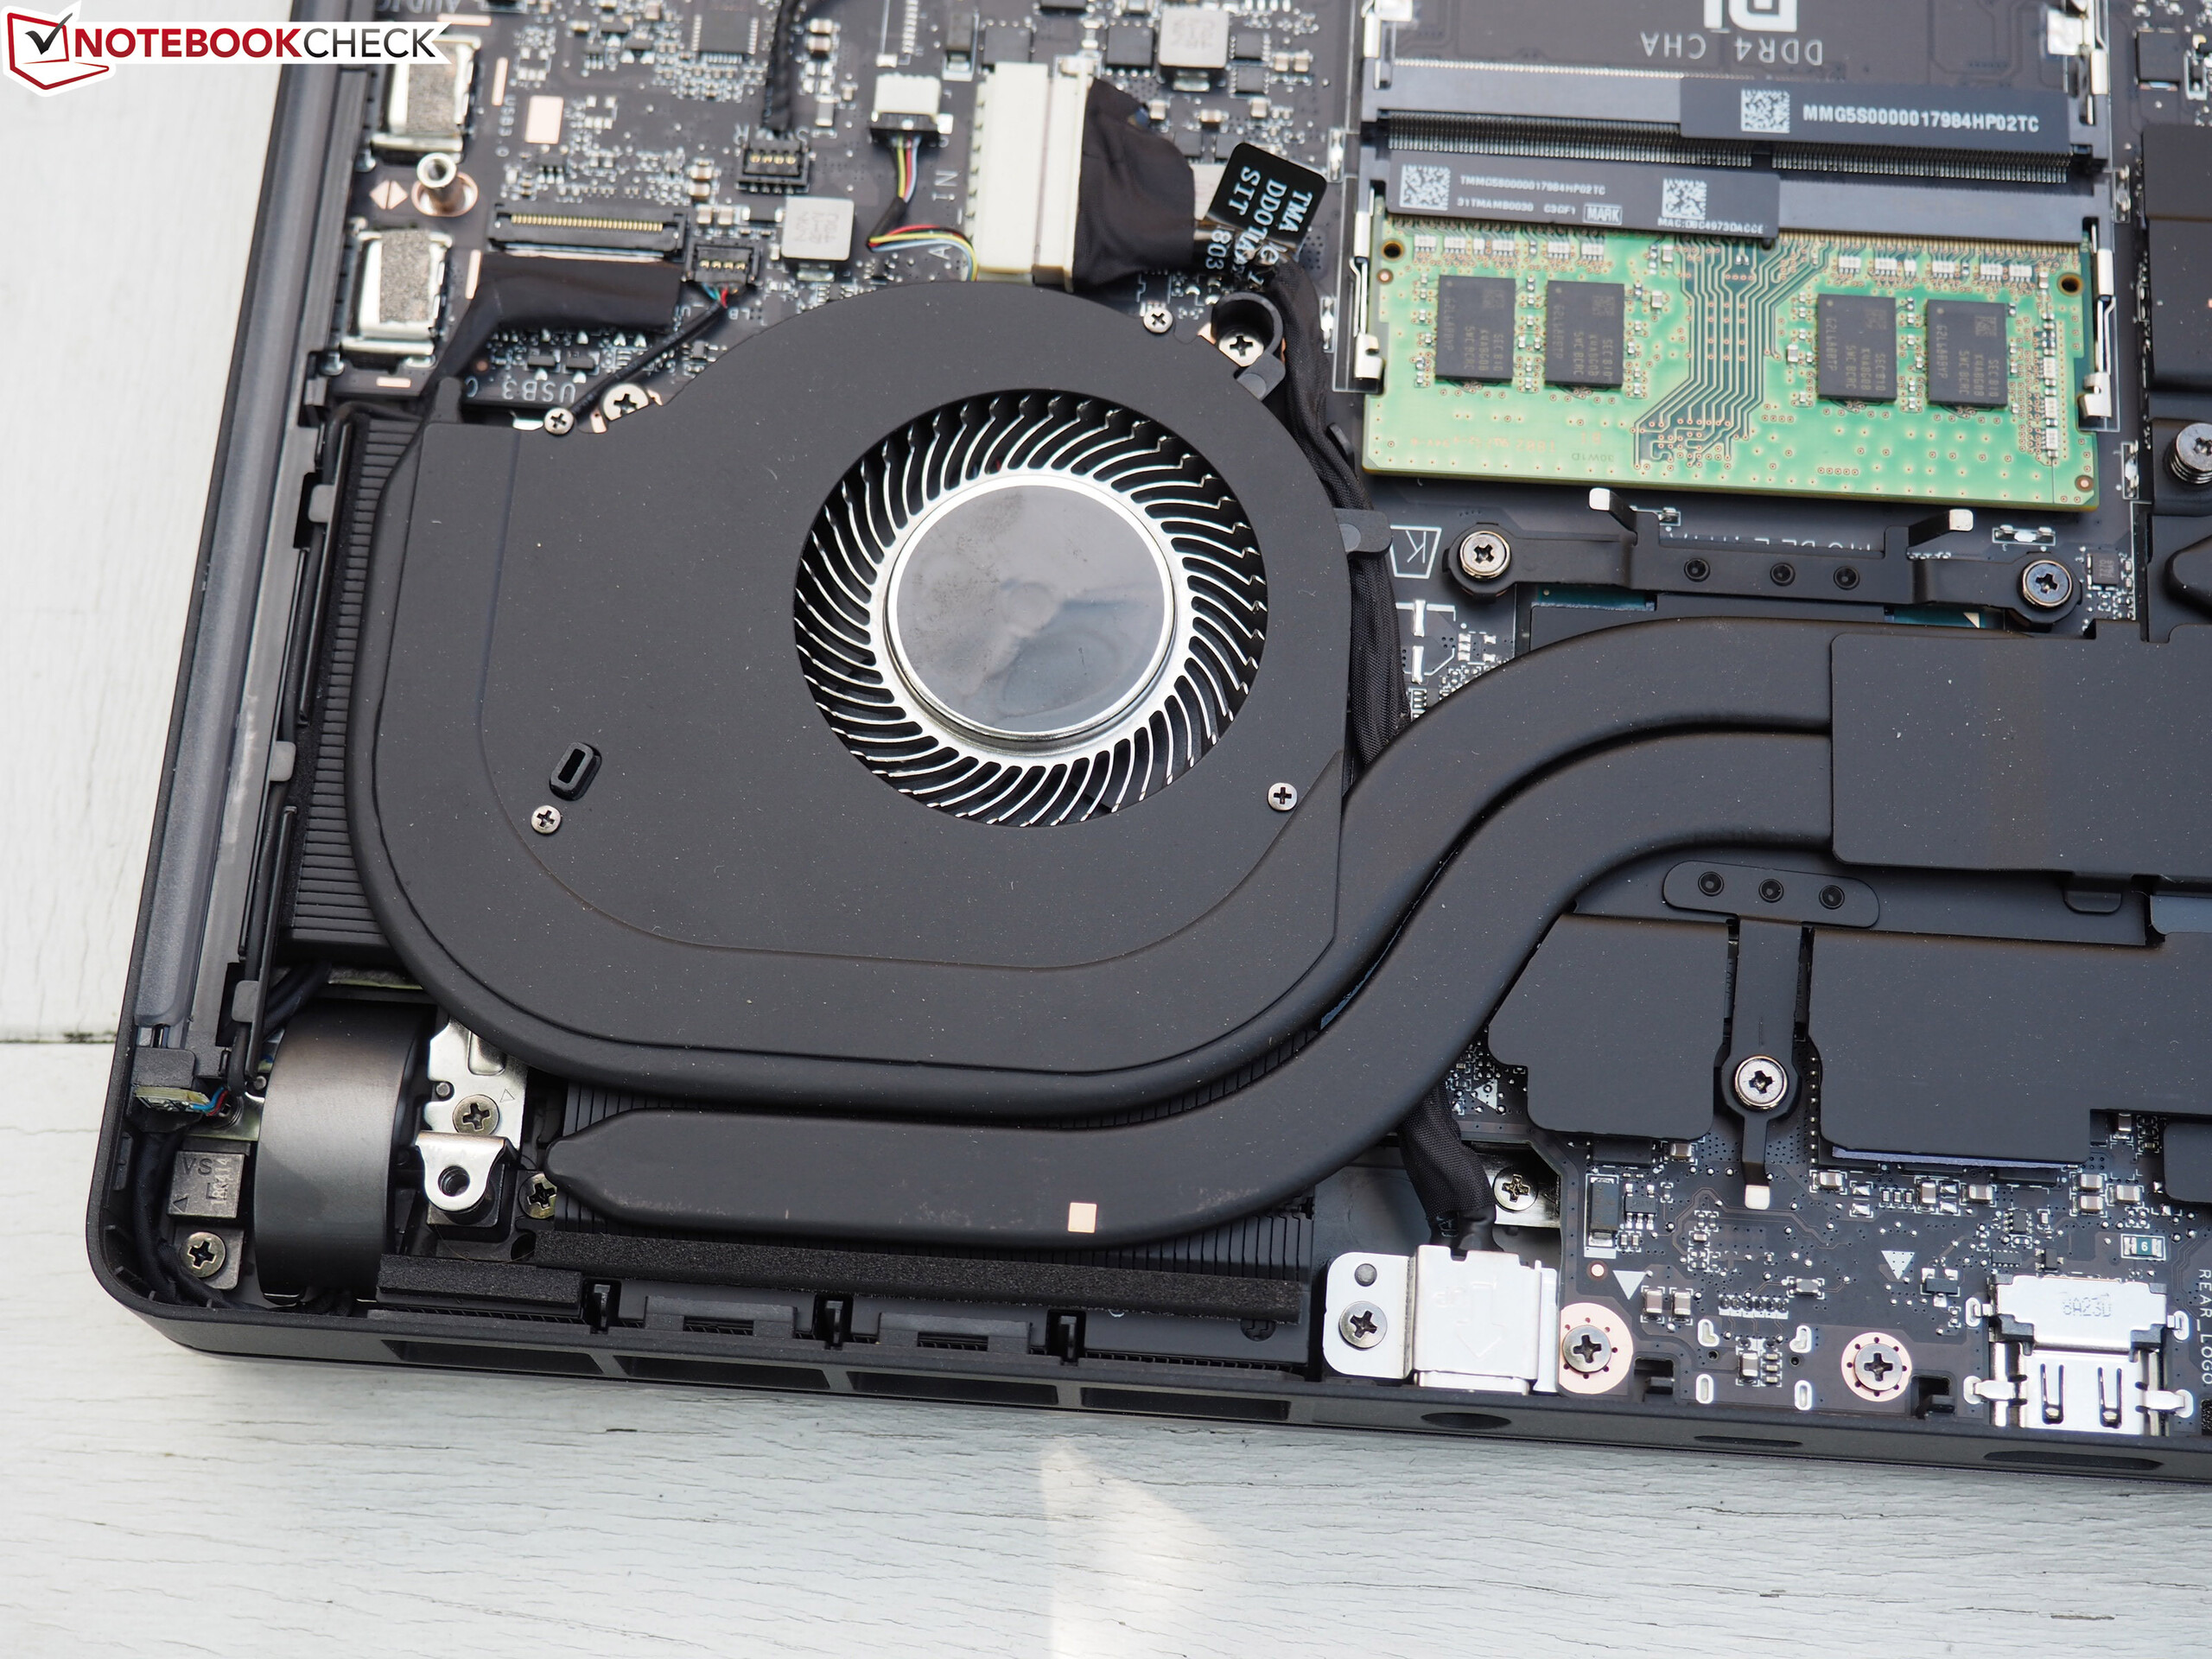
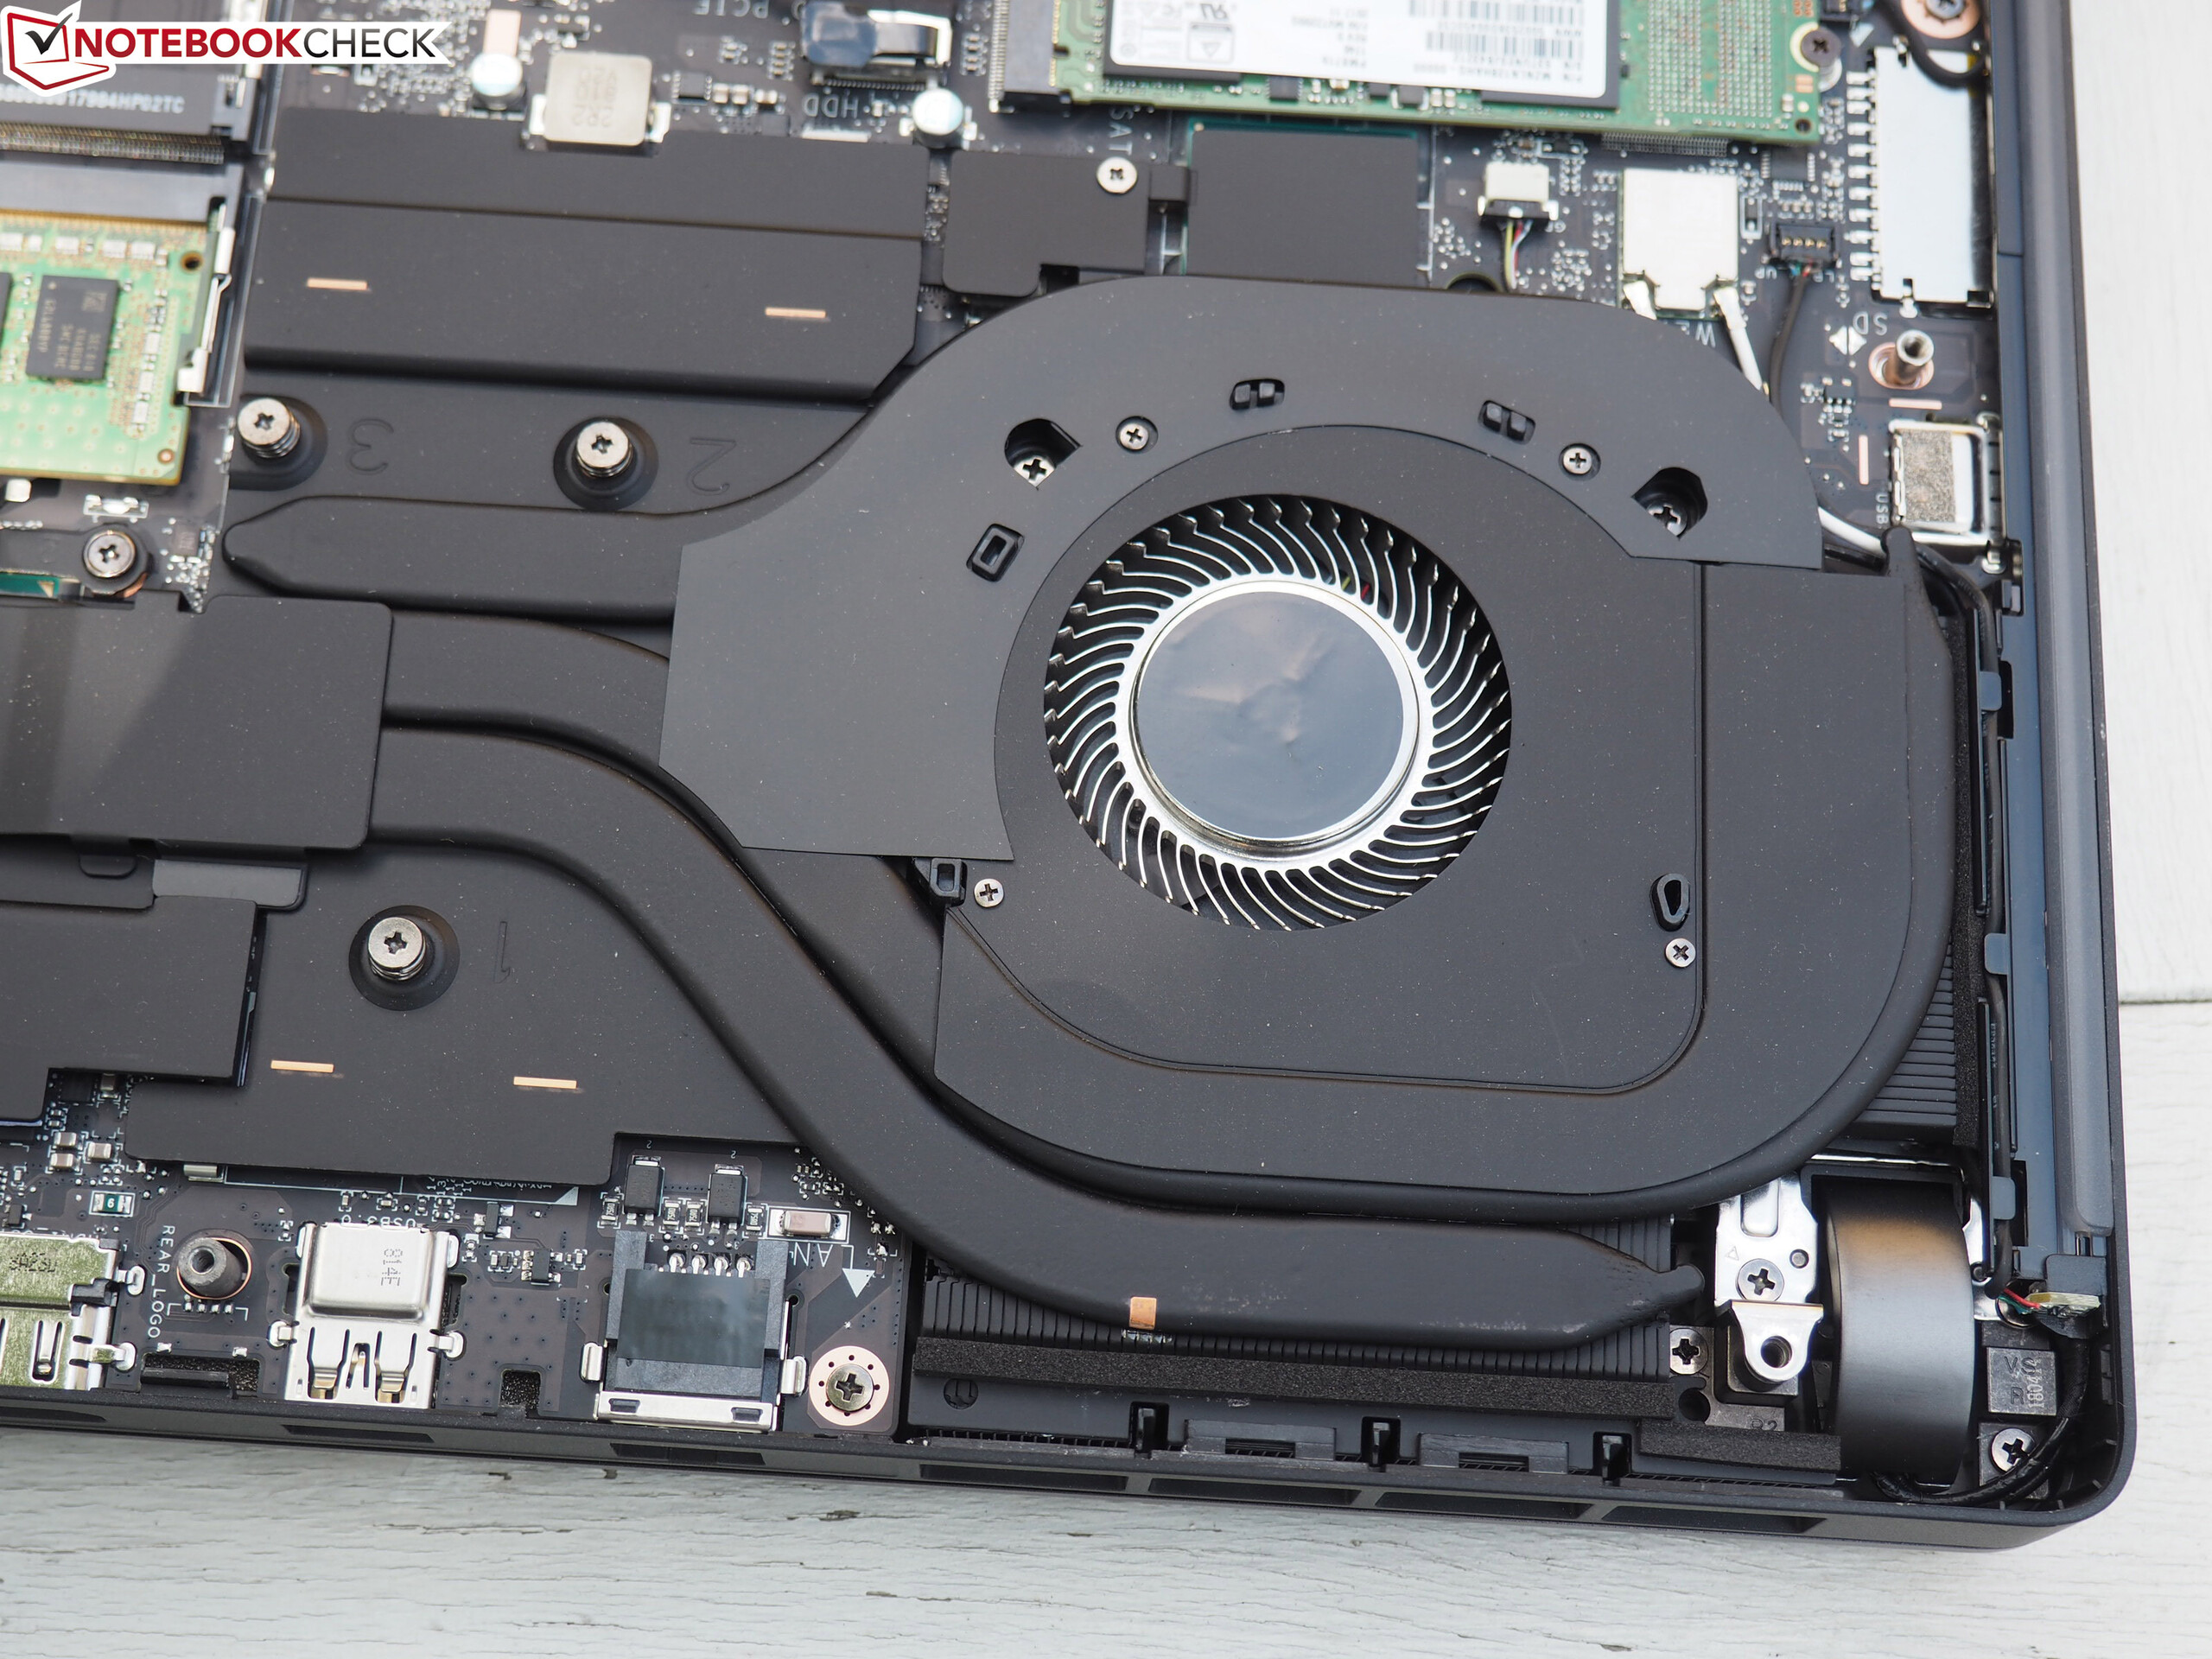
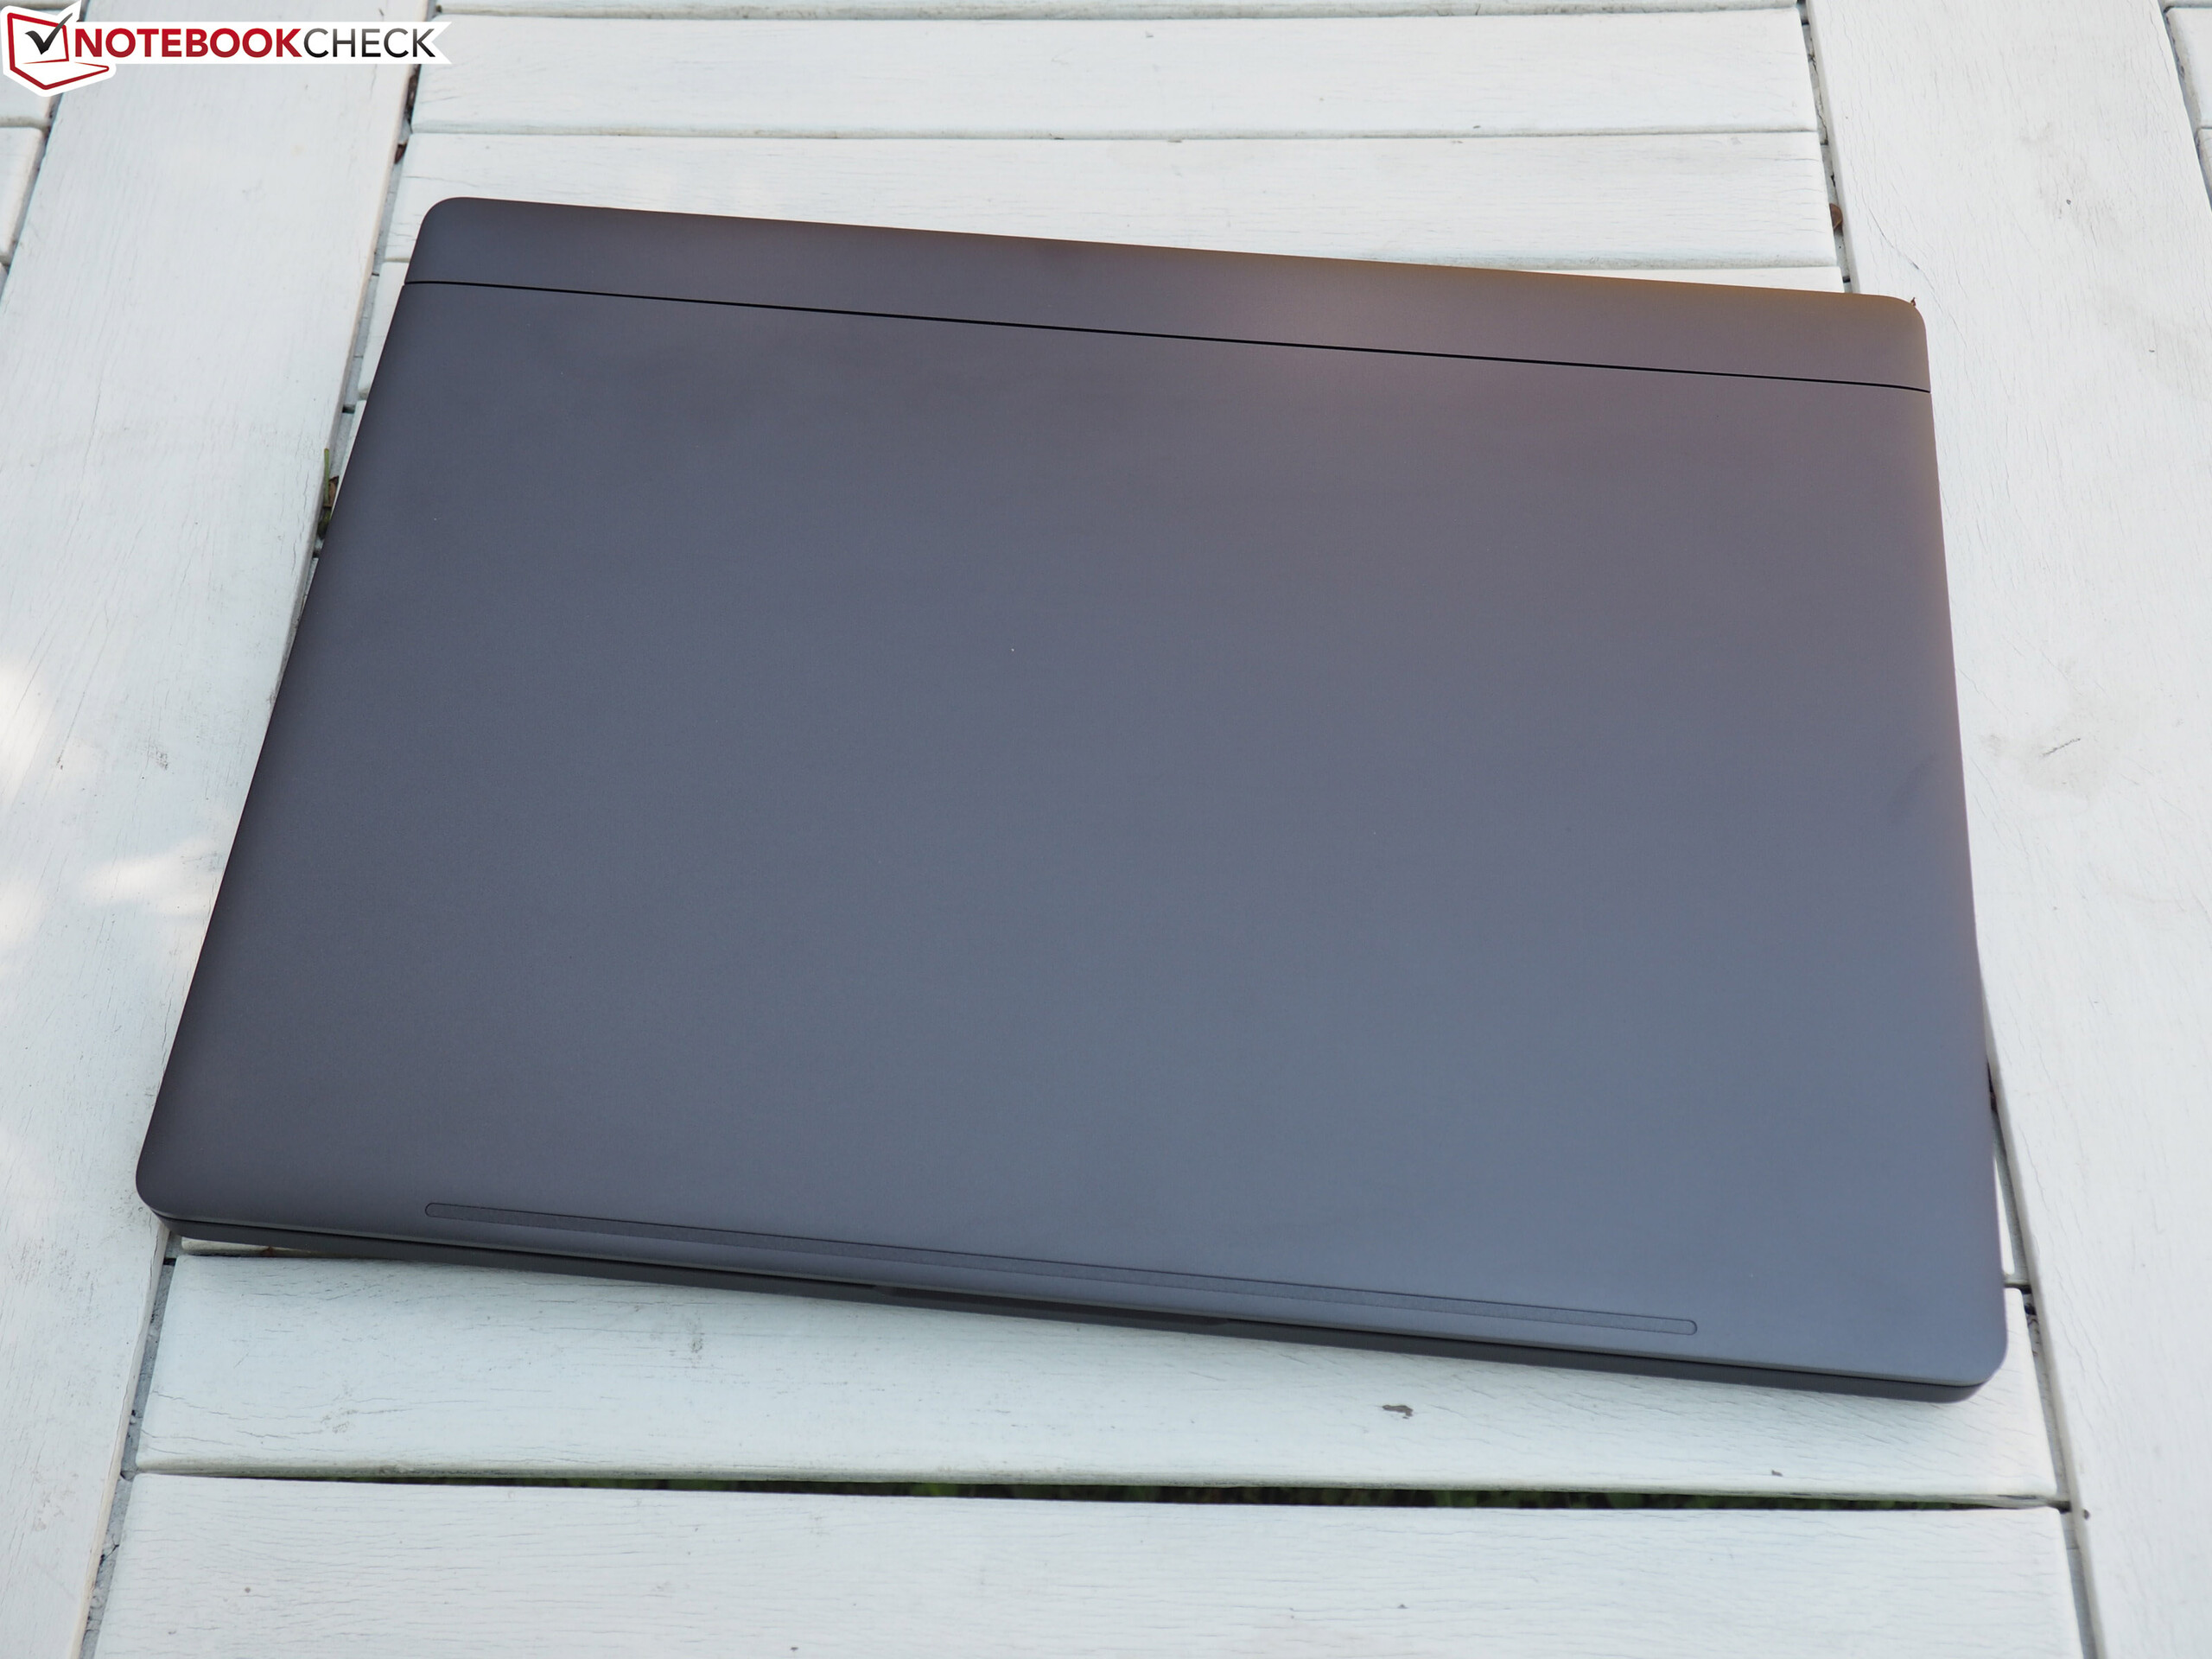
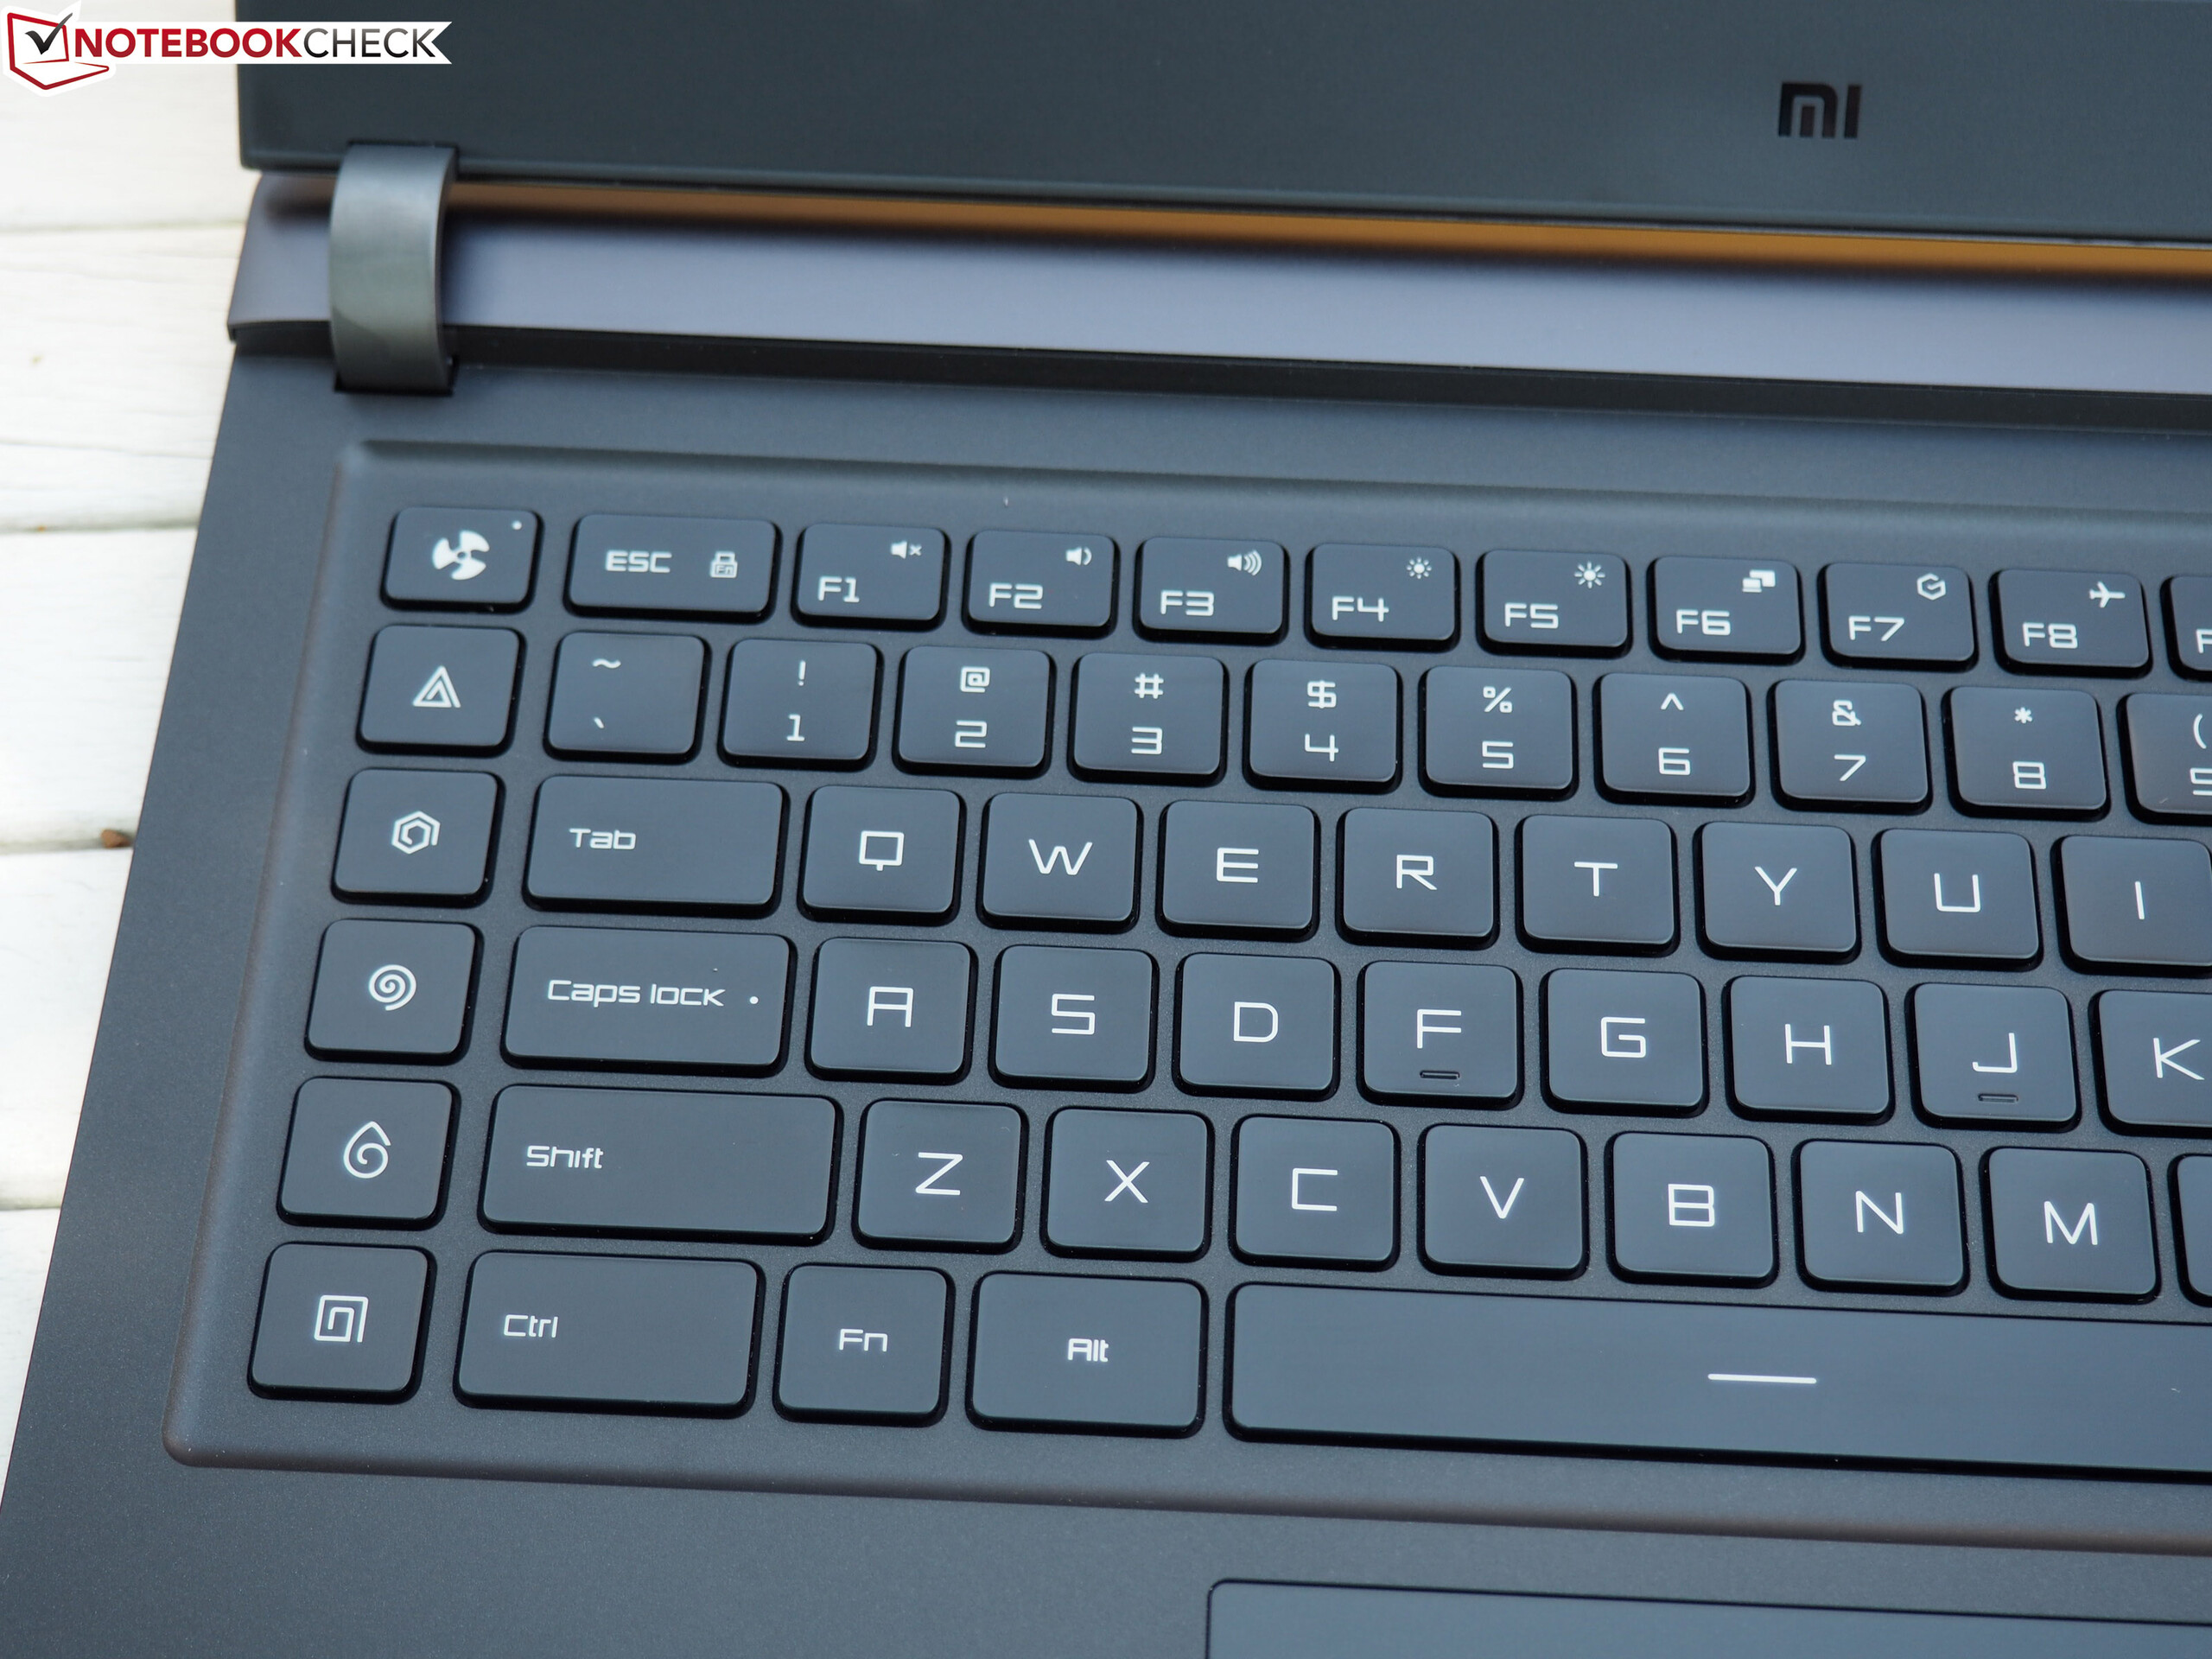
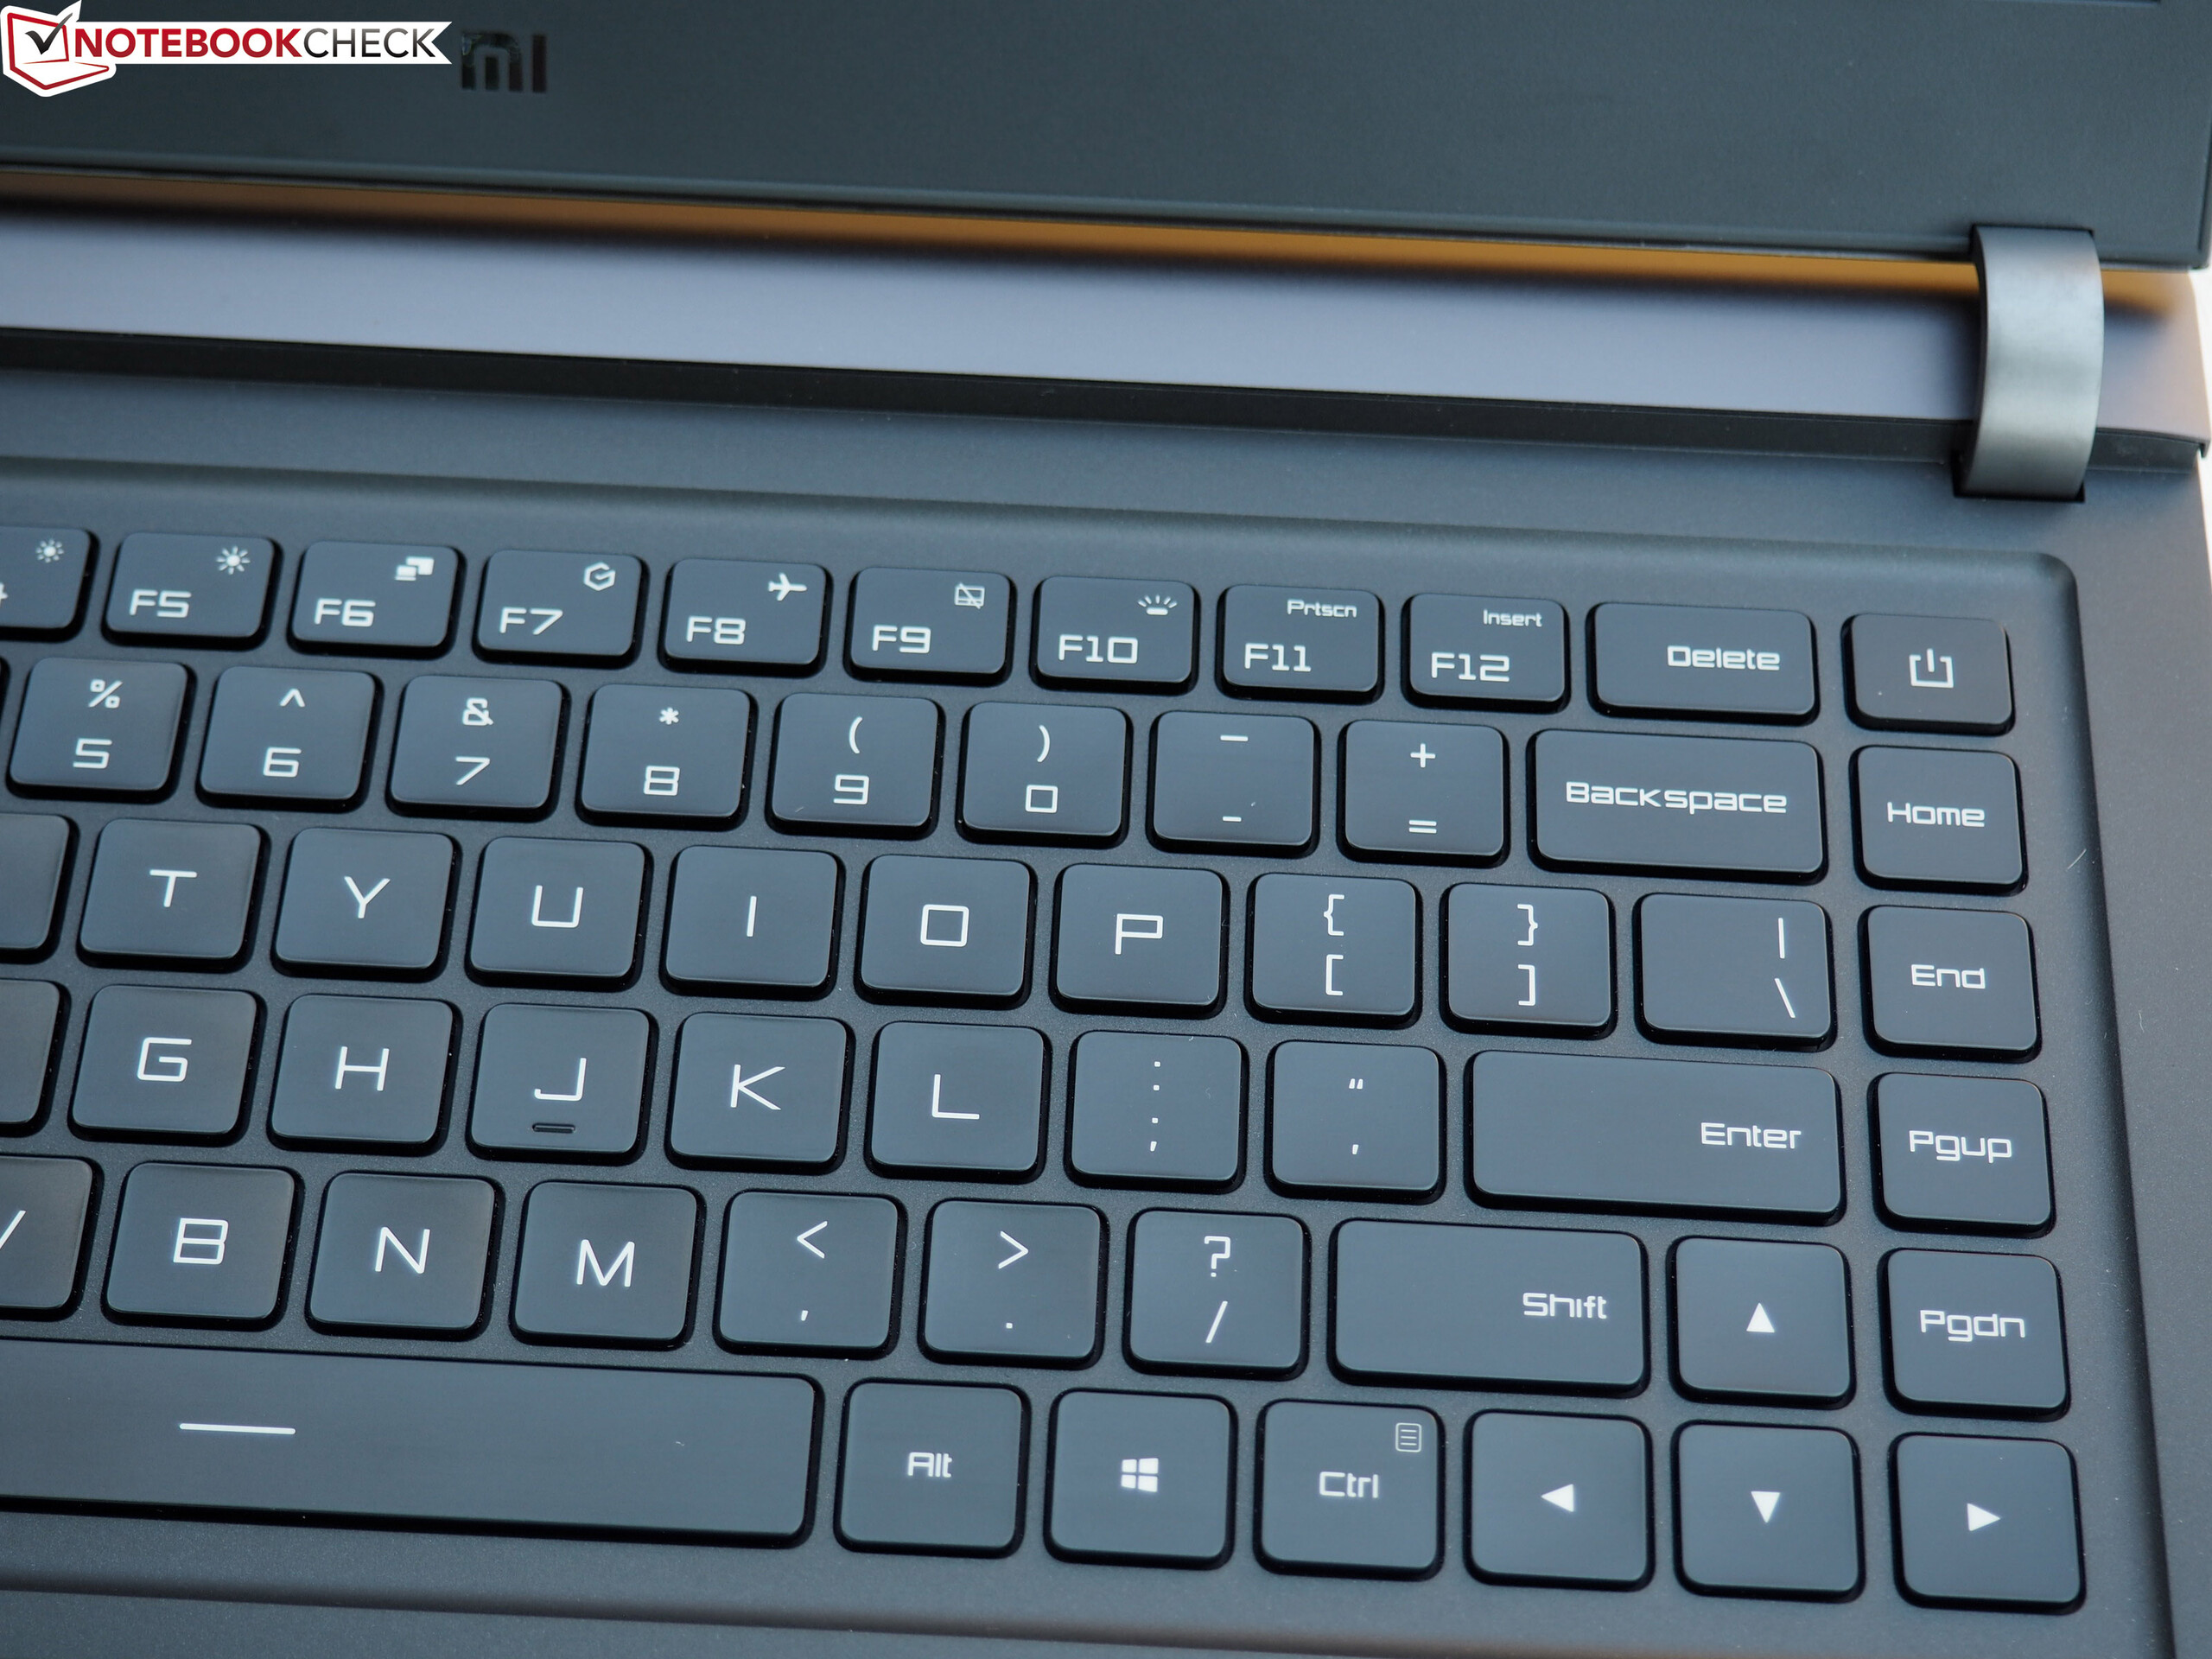
Även om höljet inte är särskilt lätt och även om det finns ännu tunnare toppskikts-modeller så var vi ganska entusiastiska över höljet. Hantverk, materialkvalitet och design går inte att klandra. Inmatningsenheterna och ljudet känns också bättre än hos en del modeller för 20 000 - 30 000 kronor.
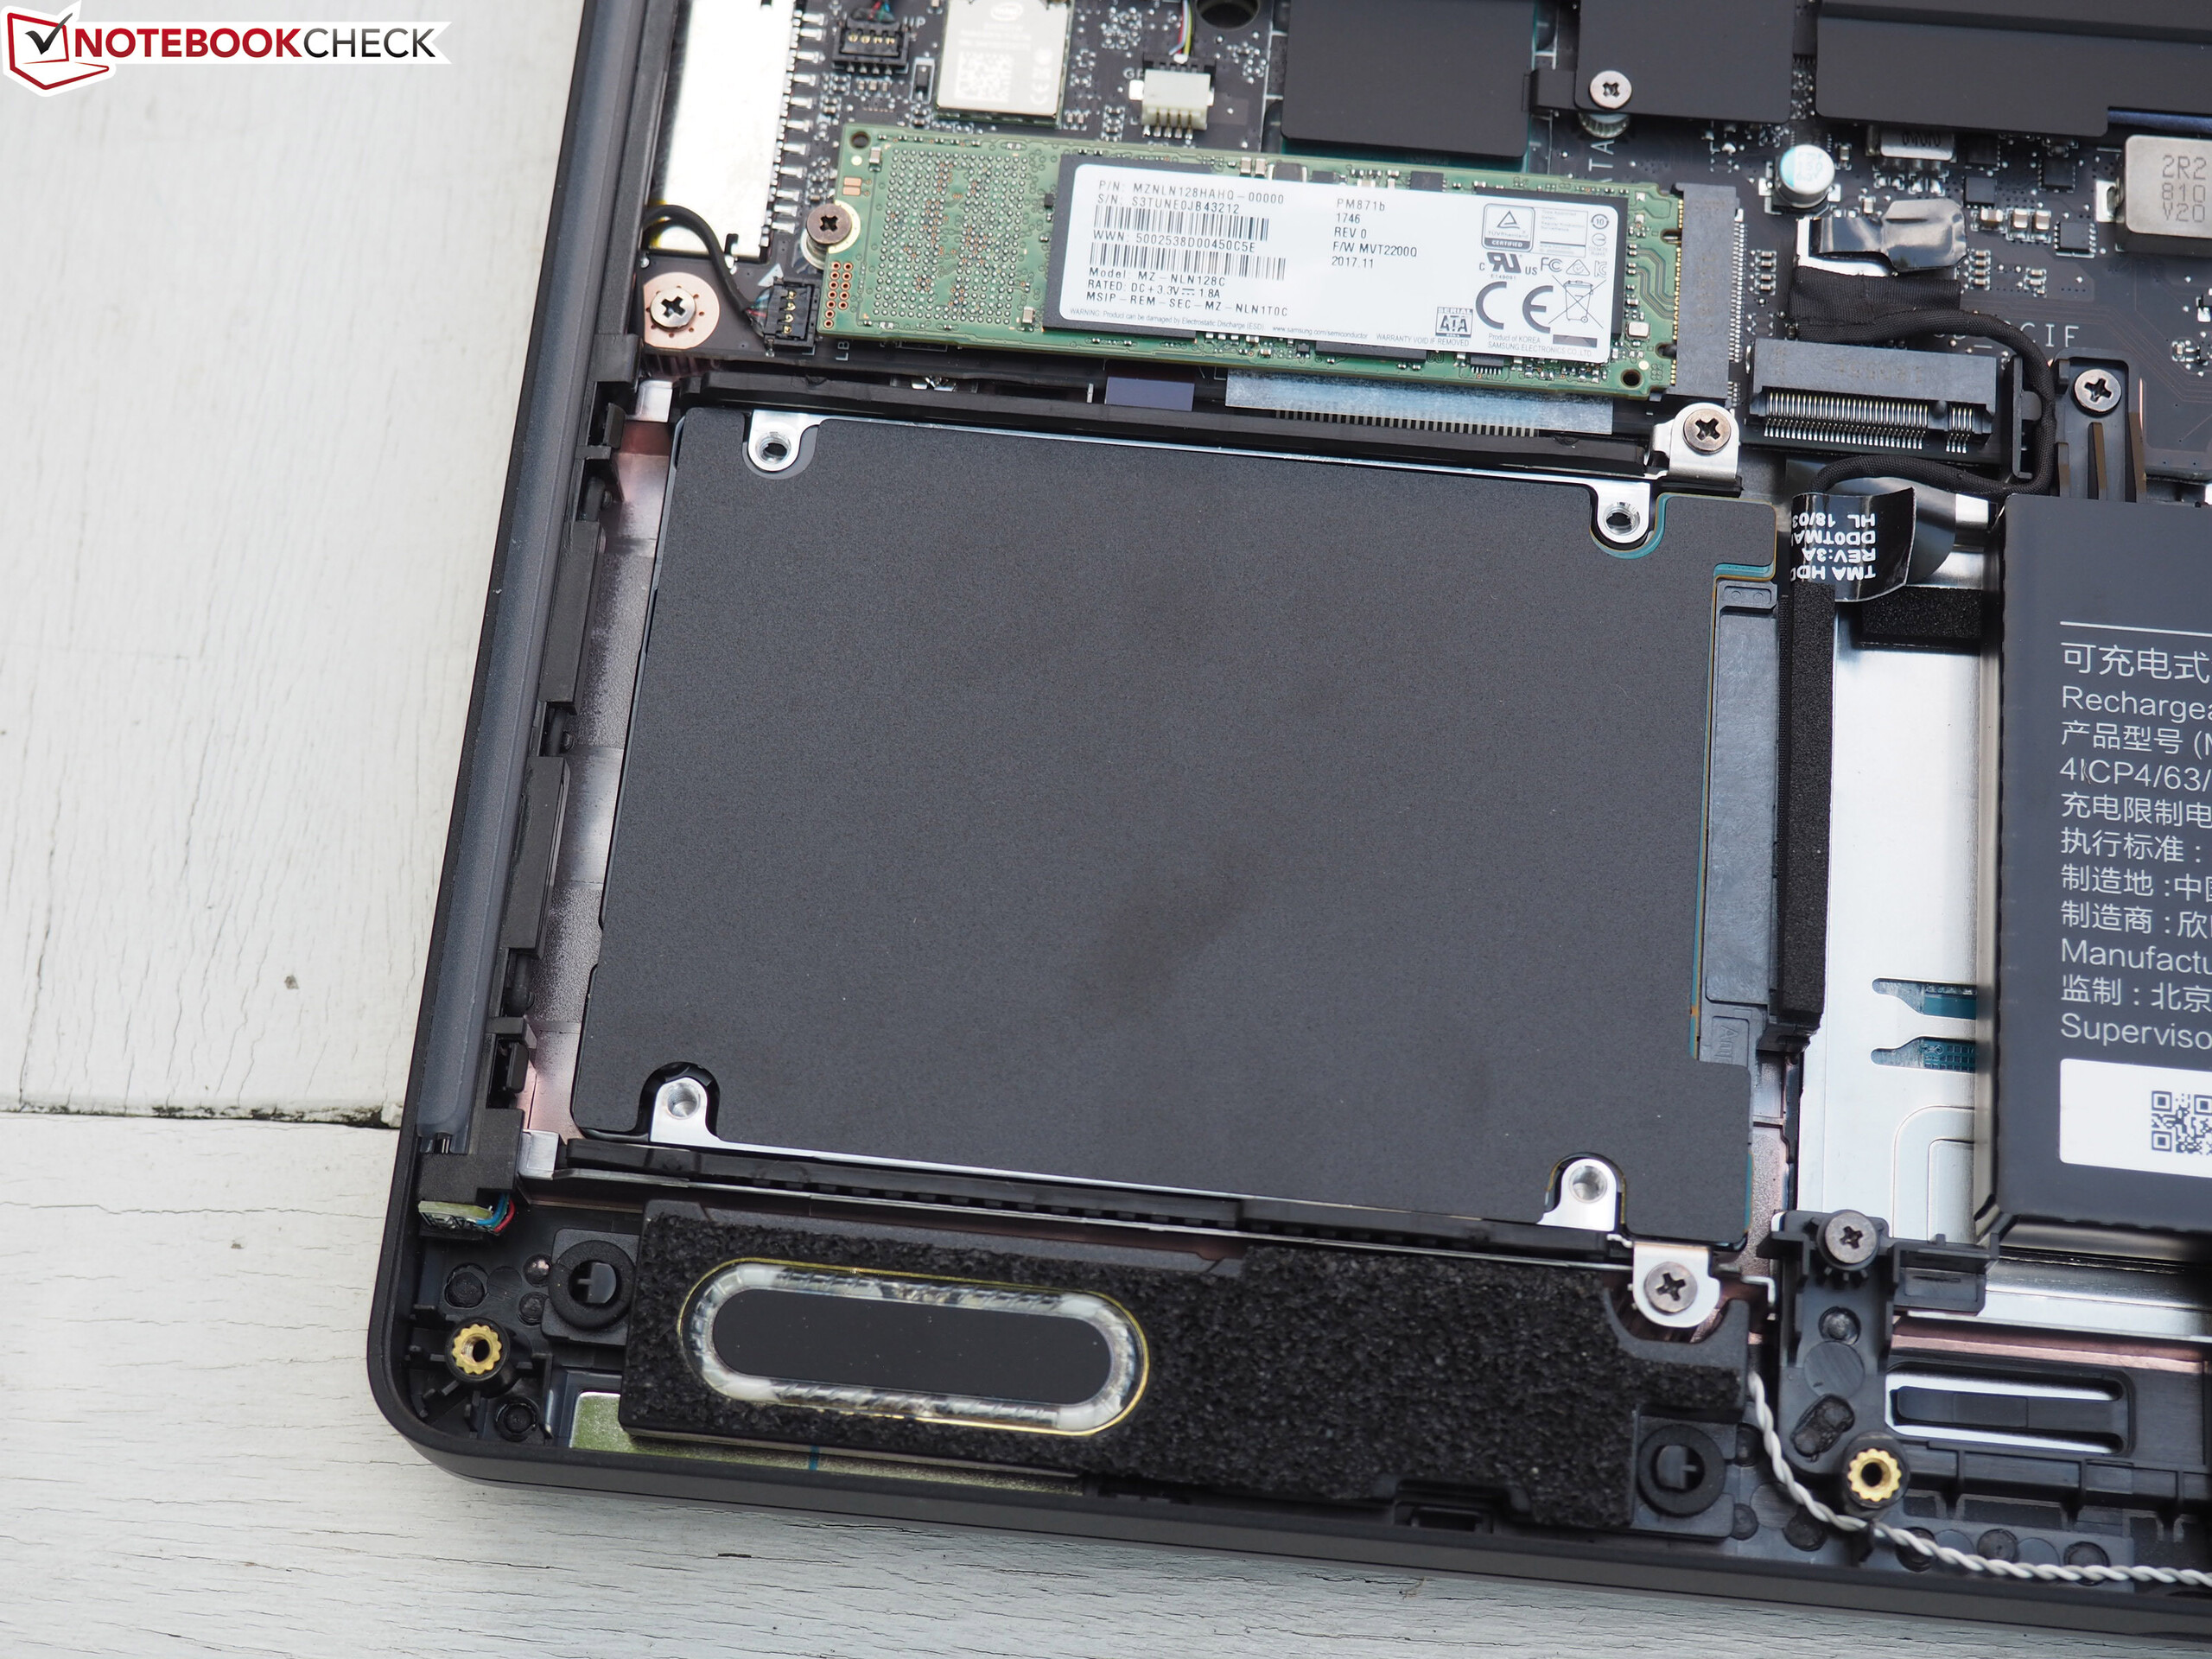
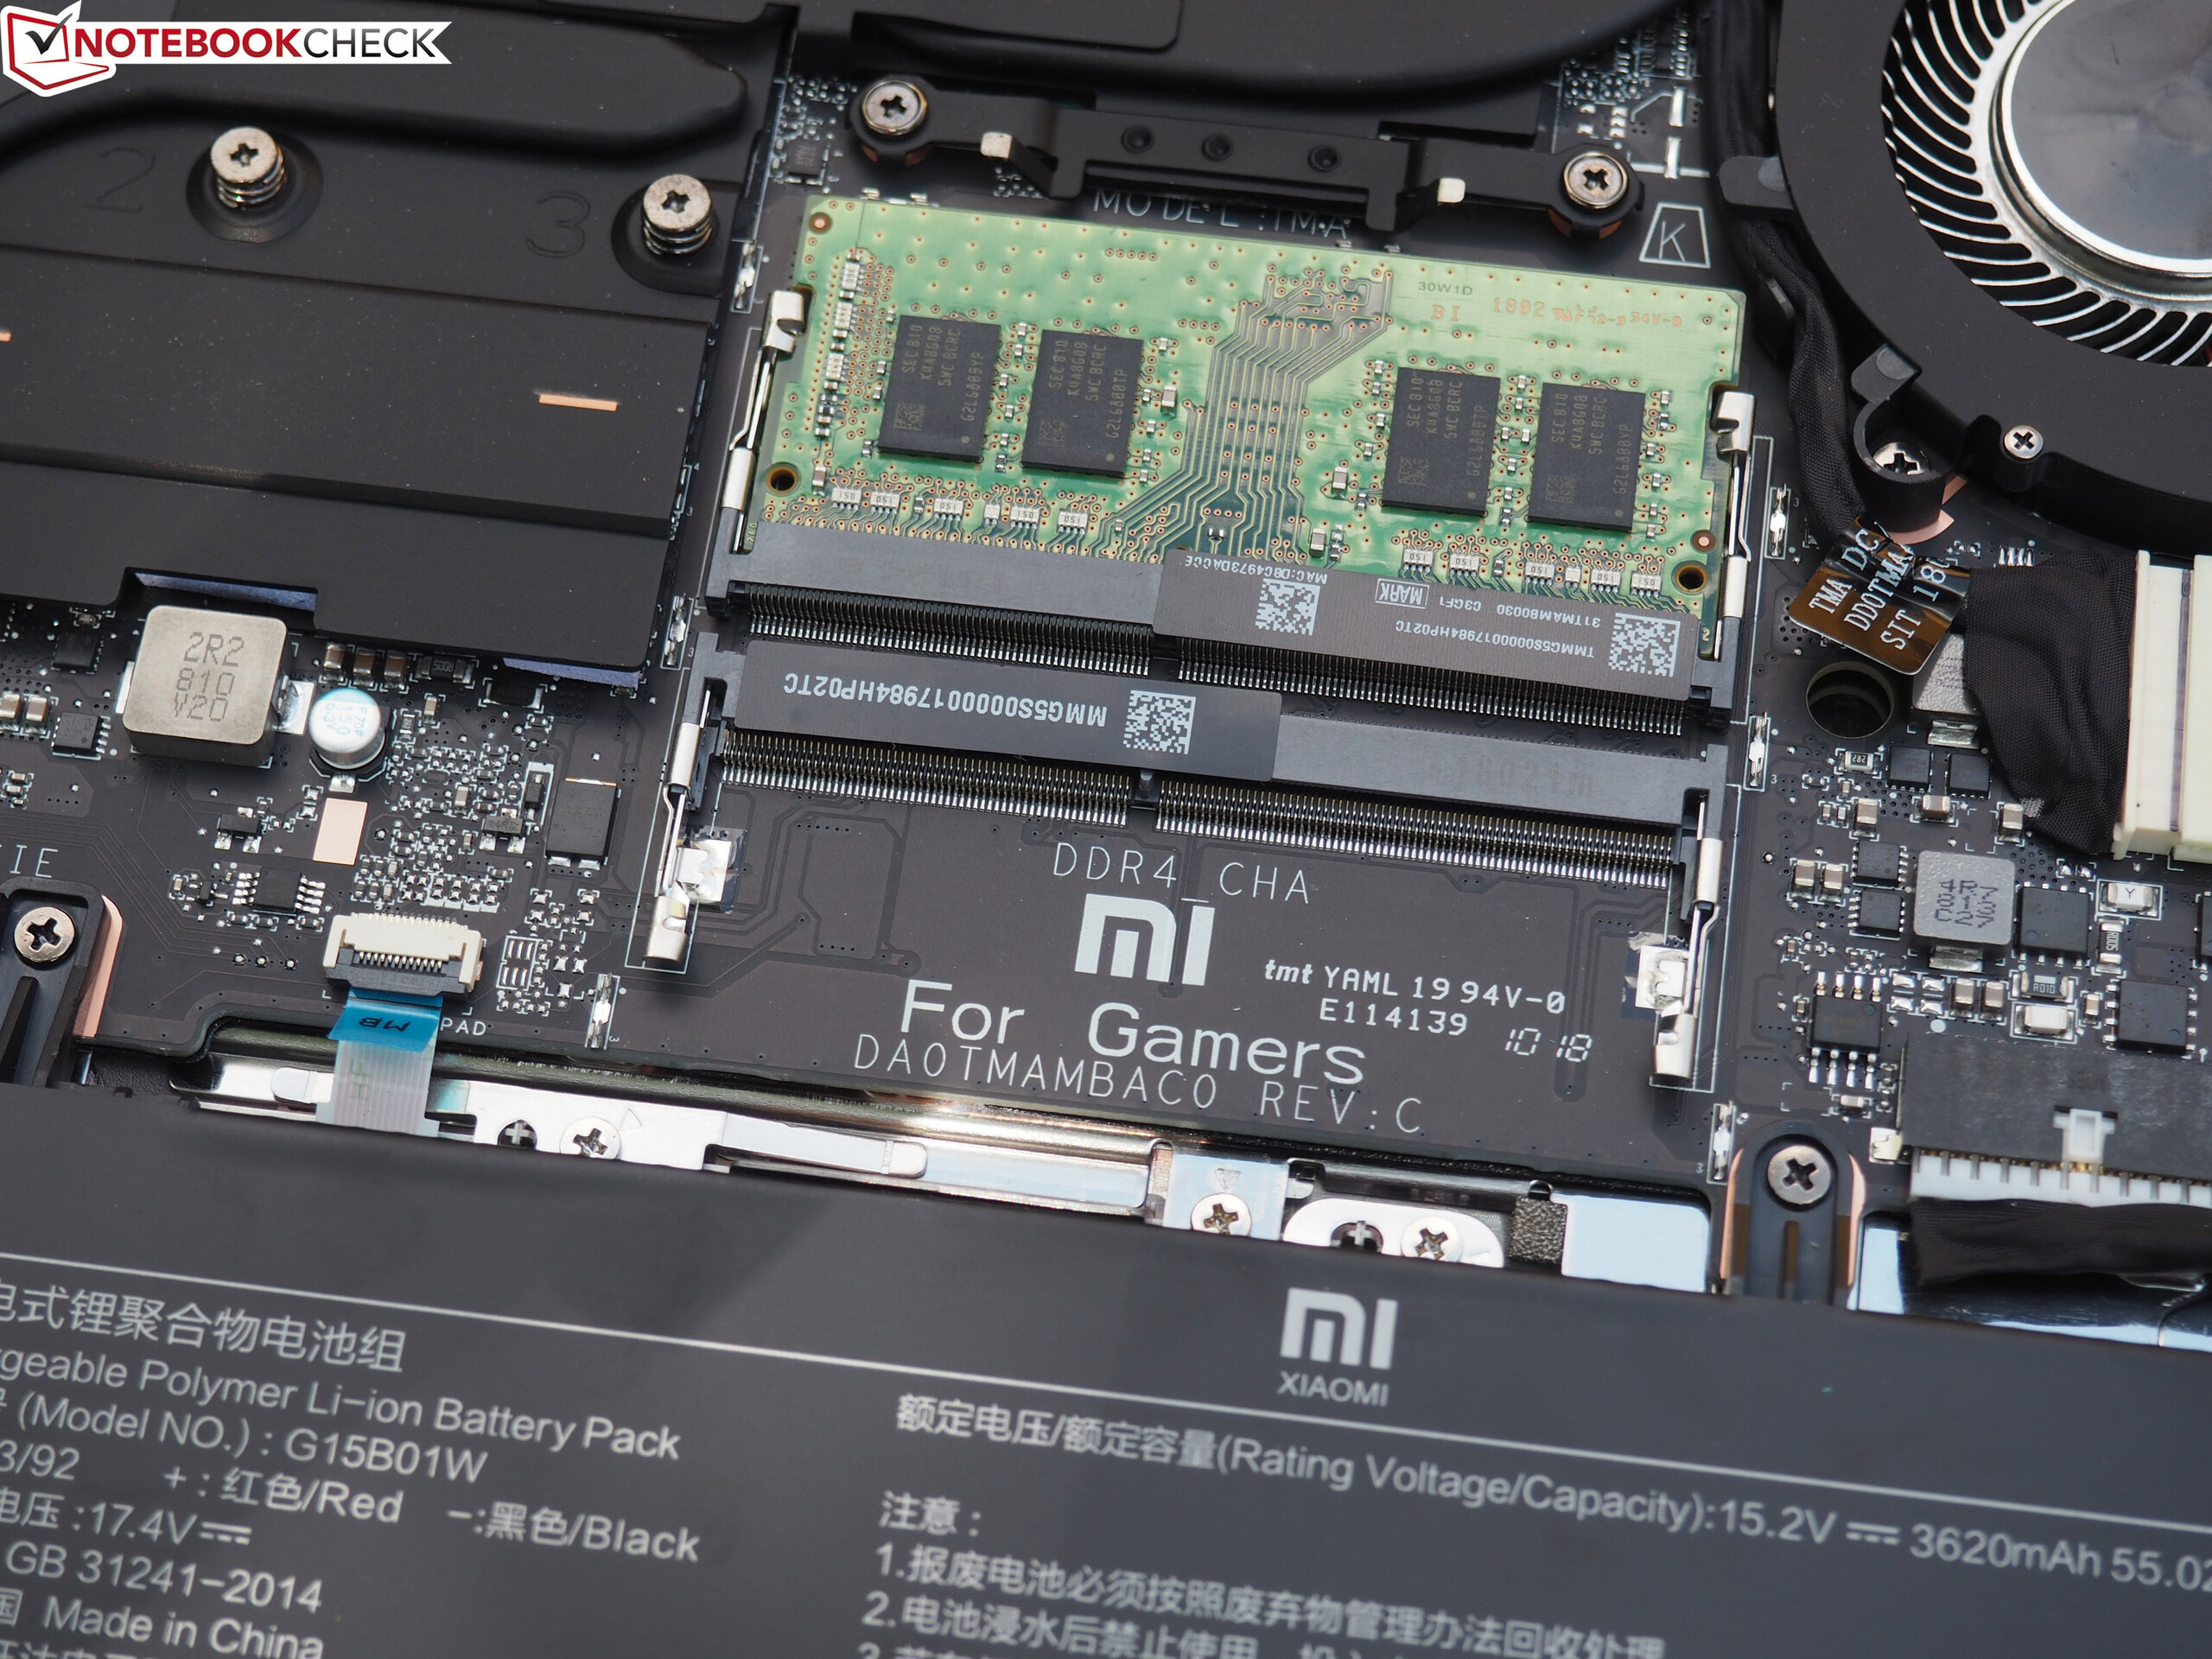
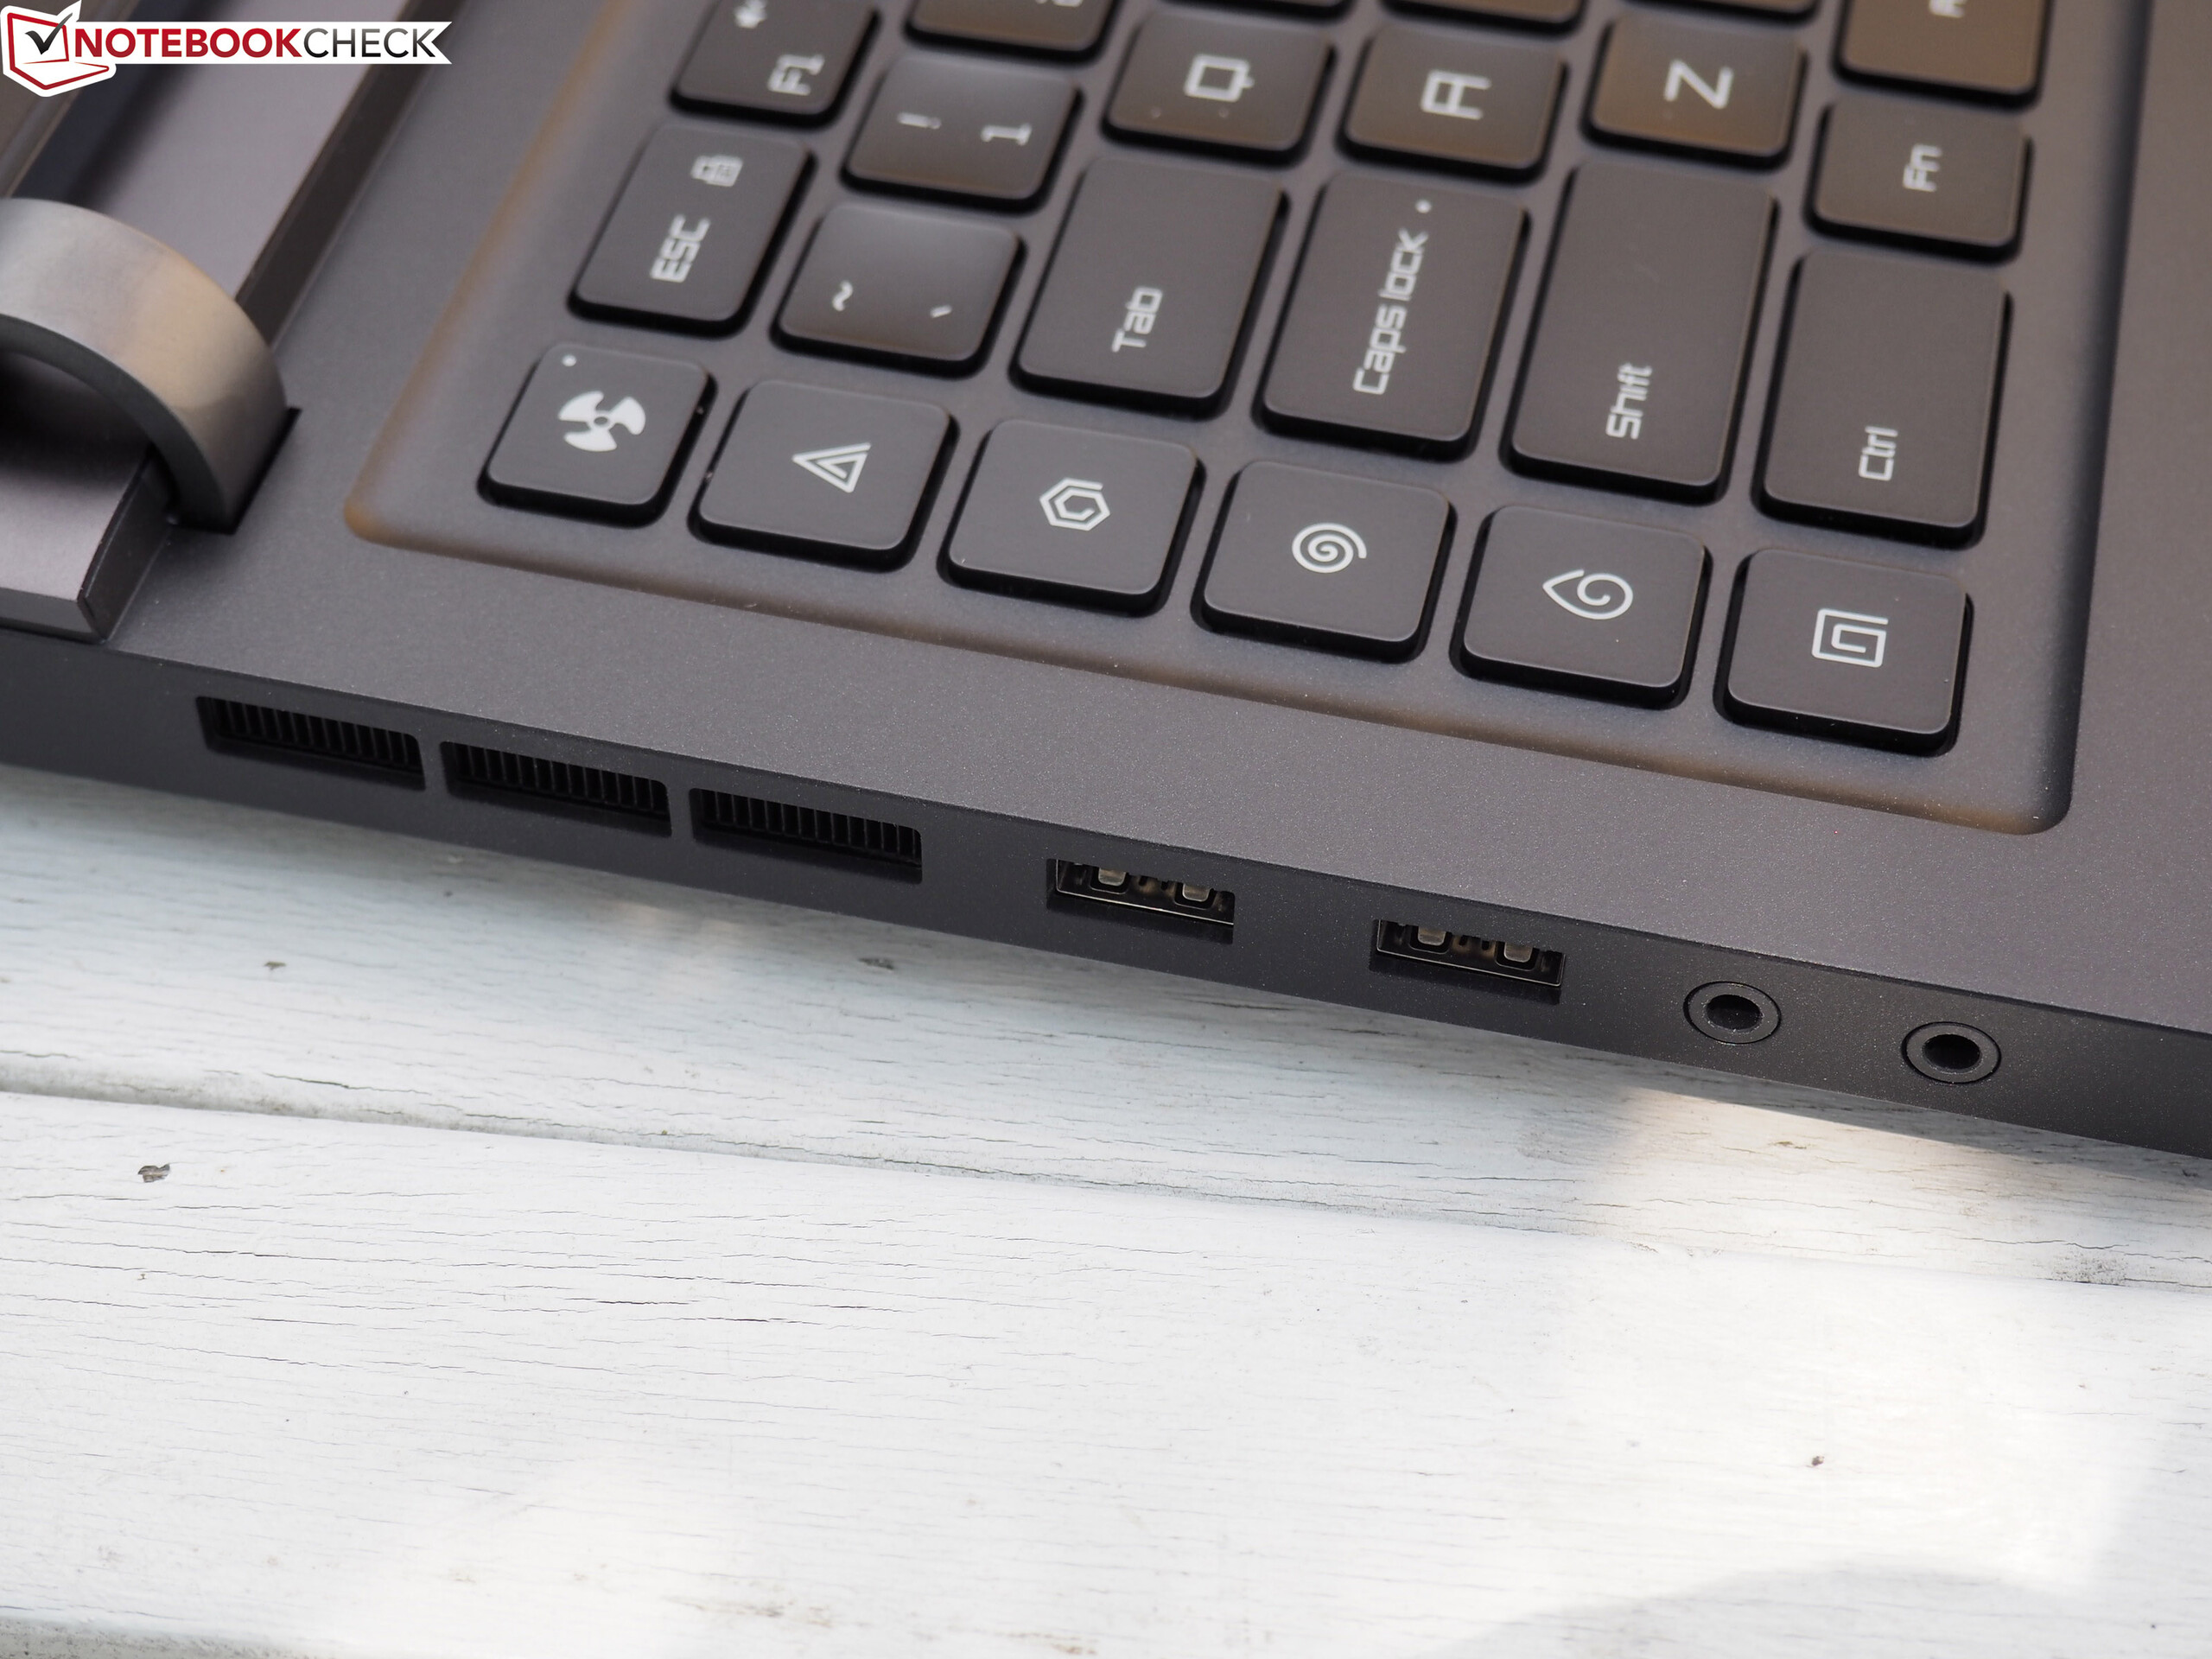
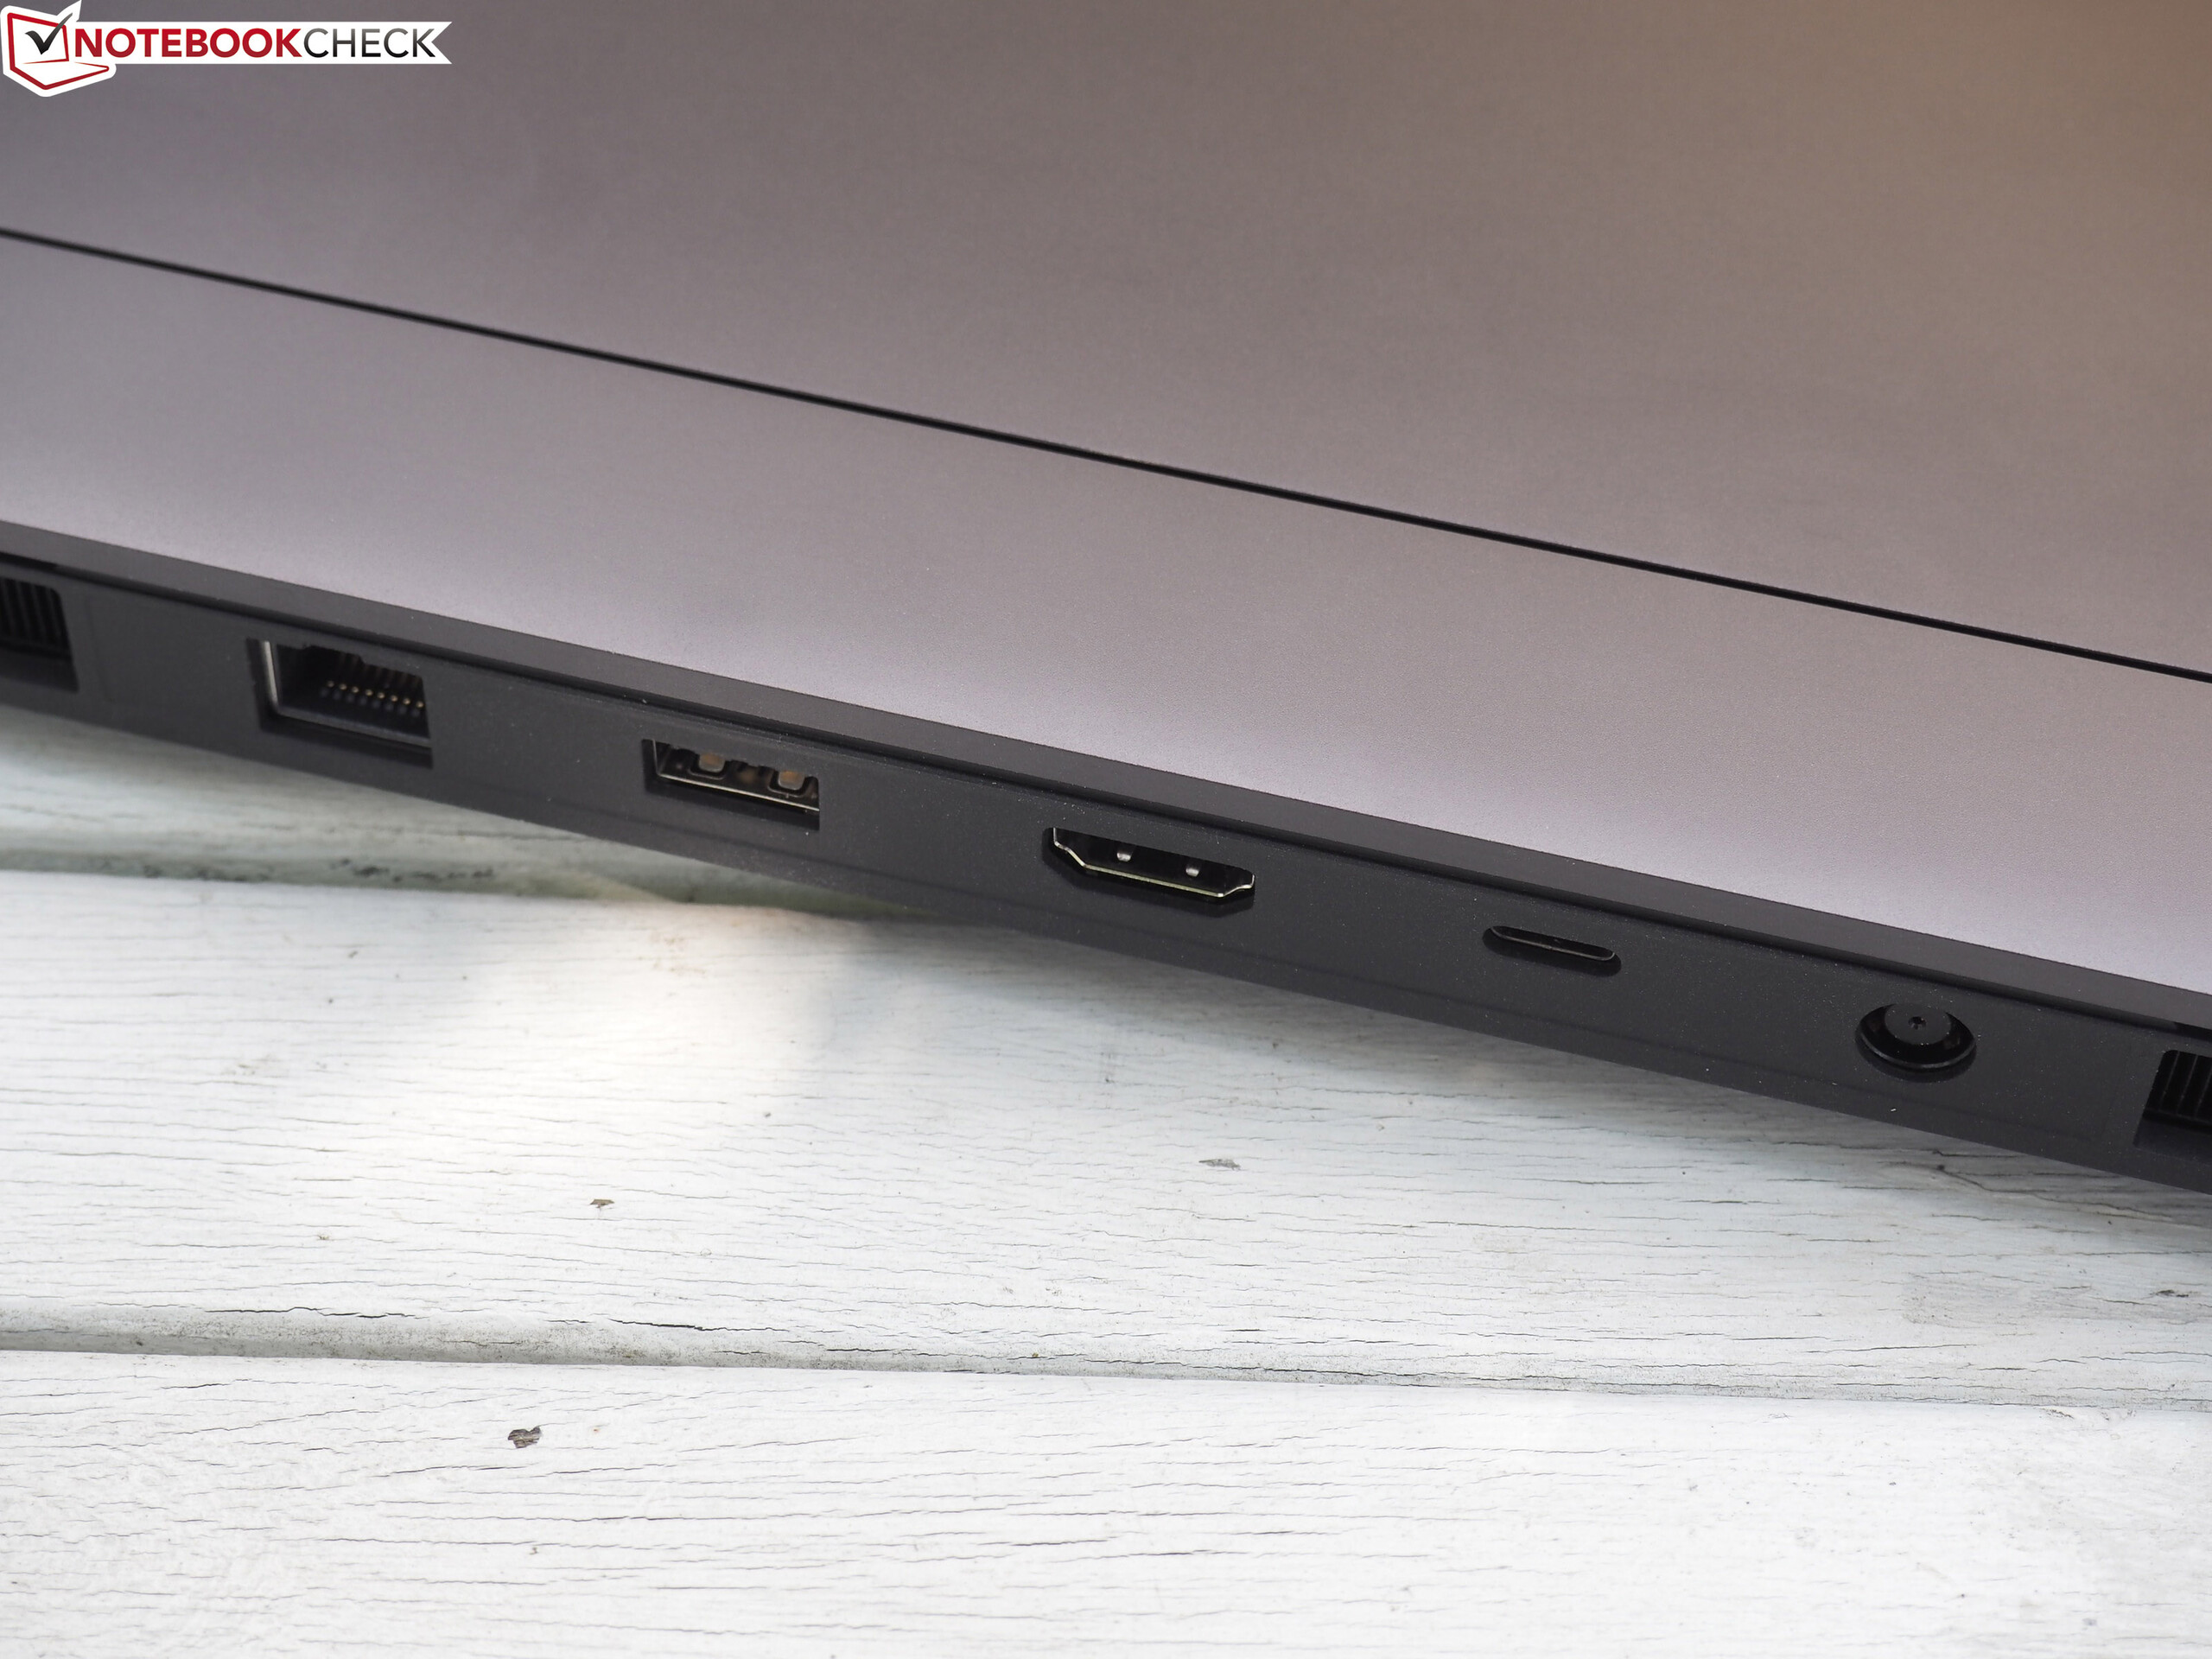
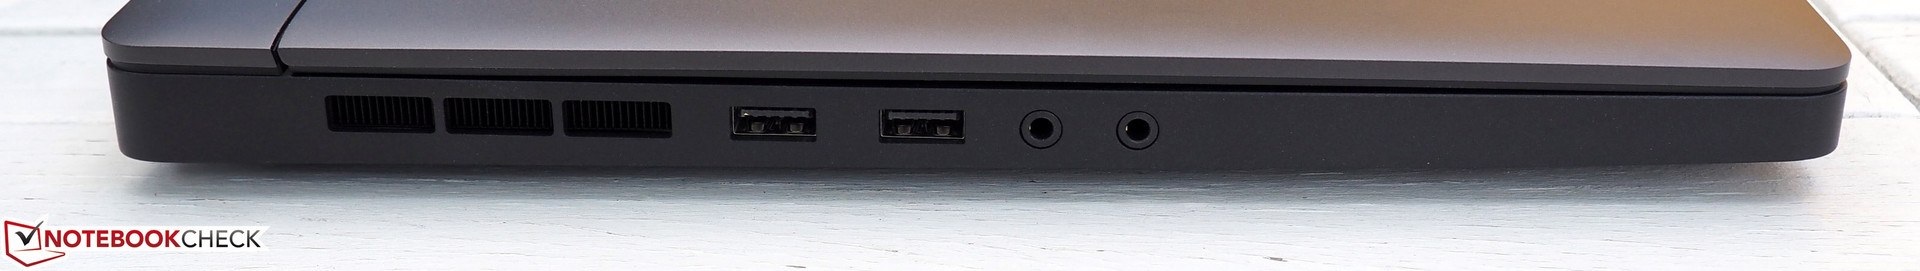
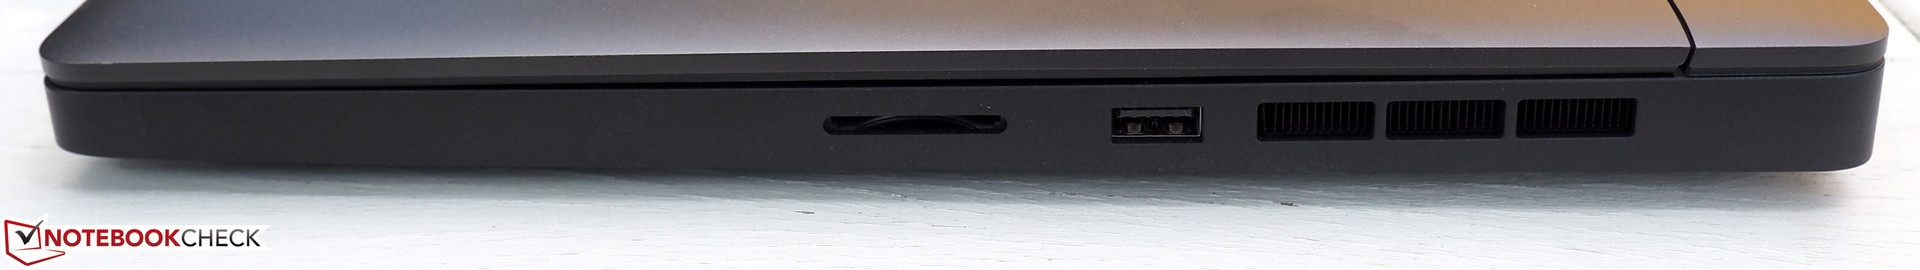
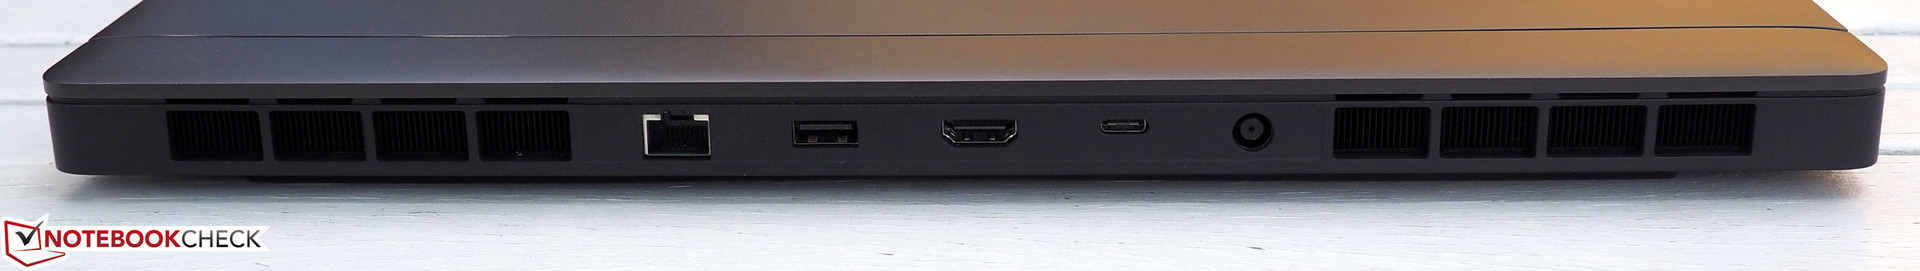
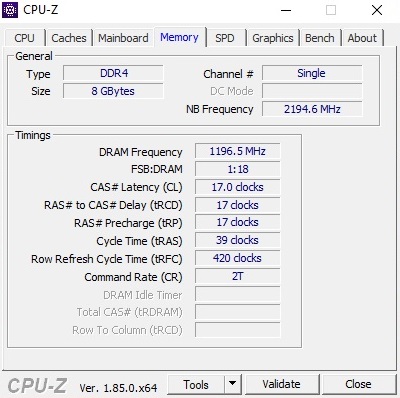
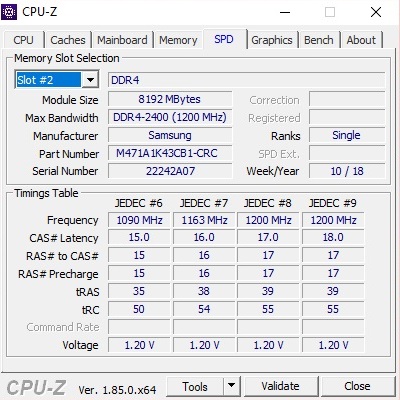
Men det förstås, allt som skiner är inte guld. För att hålla priset attraktivt har Xiaomi tvingats skära ner på en del detaljer, som en dålig kortläsare, långsam WiFi-prestanda och avsaknaden av vissa anslutningar (Thunderbolt 3, Kensington-lås). Även om 8 GB RAM och en SSD-enhet på 128 GB är en aning magert så kan du köpa enheten i en konfiguration med 16 GB och en SSD på 256 GB.
Men i vårt tycke kan vi har överseende med dessa saker. Vad som är betydligt mer irriterande är den höga ljudnivån vid 3D-arbete och det meningslösa fläktbeteendet vid tomgång. Även om detta är typiska fenomen för spellaptops så brukar konkurrenterna ofta lindra dem med manuell justering. Huruvida du ser avsaknaden av G-Sync som en negativ aspekt är en fråga om smak. Xiaomi använder istället Optimus, vilket förbättrar batteritiden.
Skärmen ger blandade intryck. Å ena sidan så gillade vi den högra kontrasten och dom stabila betraktningsvinklarna, men å andra sidan är en del aktuella gamer-kriterier (120/144 Hz, kort responstid) ouppfyllda. Innan köp behöver du också känna till att på grund av den Kinesiska mjukvaran är Mi Gaming Laptop bara till viss del tänkt för den europeiska eller den amerikanska marknaden. Men den som inte låter sig skrämmas av en del inledande hinder och har turen att få en enhet direkt eller genom några omvägar kommer få ett framgångsrikt helhetspaket till ett reapris.
I slutändan går denna doldis till att bli ett insider-tips och tar hem en hög placering i listan över dom 10 bästa billiga spellaptop-modellerna.
Xiaomi Mi Gaming Laptop 7300HQ 1060
- 05/28/2018 v6 (old)
Florian Glaser
Price comparison