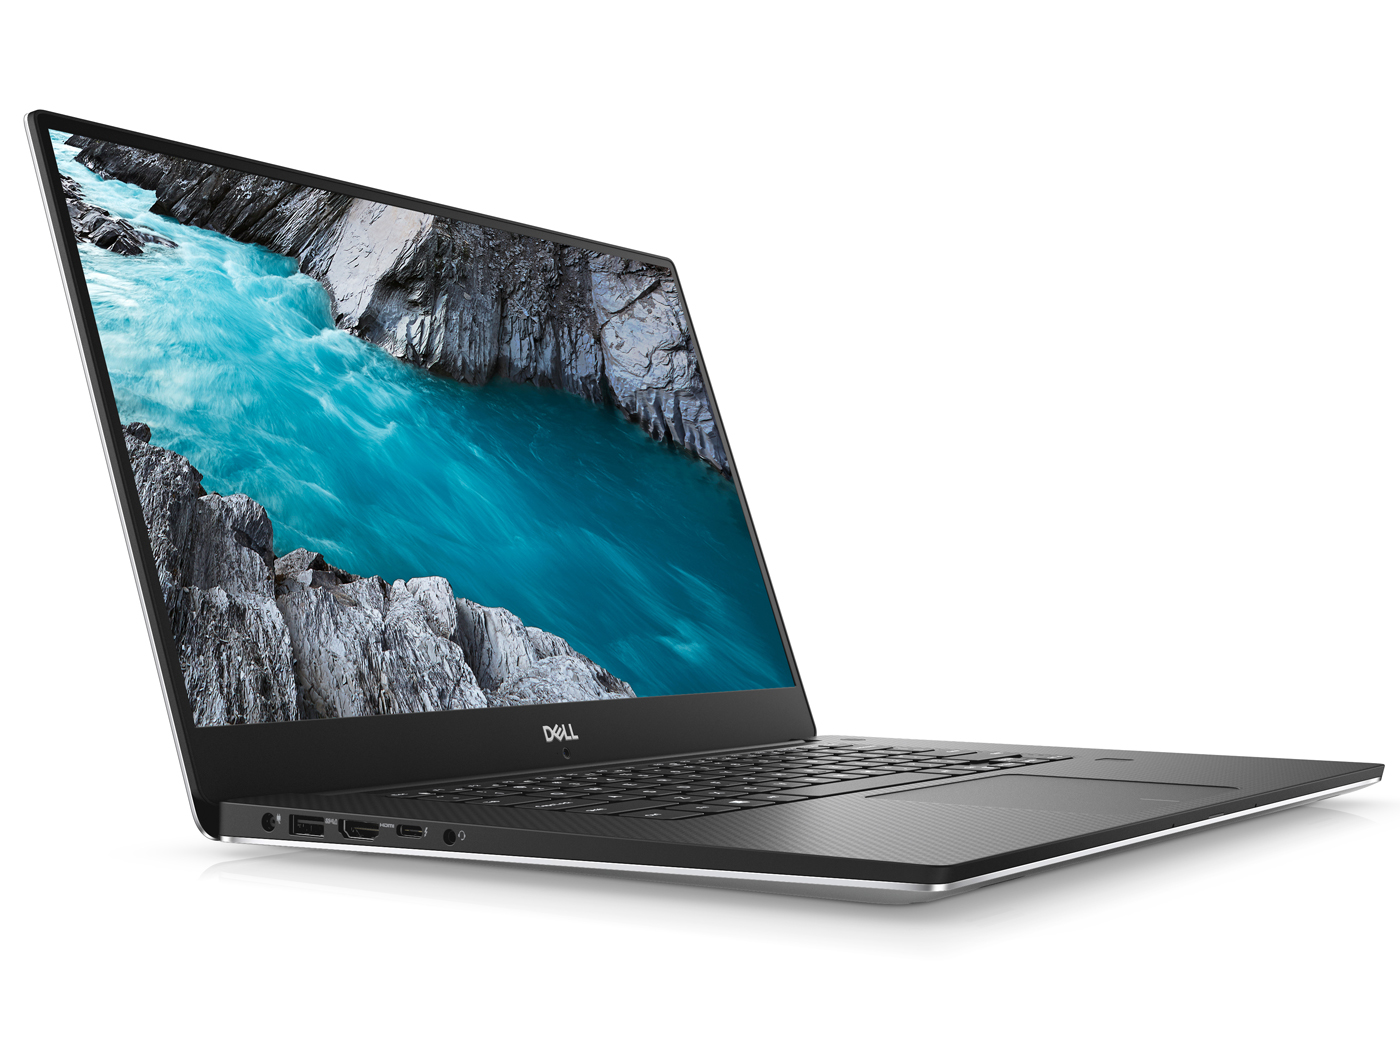
Test: Dell XPS 15 9570 (i7, UHD, GTX 1050 Ti Max-Q) Laptop (Sammanfattning)
| SD Card Reader | |
| average JPG Copy Test (av. of 3 runs) | |
| Dell XPS 15 9570 i7 UHD (Toshiba Exceria Pro SDXC 64 GB UHS-II) | |
| HP EliteBook 1050 G1-4QY20EA (Toshiba Exceria Pro SDXC 64 GB UHS-II) | |
| Genomsnitt av klass Multimedia (23 - 531, n=36, senaste 2 åren) | |
| Asus ZenBook Pro 15 UX580GE (Toshiba Exceria Pro M501 UHS-II) | |
| maximum AS SSD Seq Read Test (1GB) | |
| HP EliteBook 1050 G1-4QY20EA (Toshiba Exceria Pro SDXC 64 GB UHS-II) | |
| Genomsnitt av klass Multimedia (37.3 - 1455, n=35, senaste 2 åren) | |
| Dell XPS 15 9570 i7 UHD (Toshiba Exceria Pro SDXC 64 GB UHS-II) | |
| |||||||||||||||||||||||||
Distribution av ljusstyrkan: 88 %
Mitt på batteriet: 489 cd/m²
Kontrast: 1453:1 (Svärta: 0.34 cd/m²)
ΔE ColorChecker Calman: 5.2 | ∀{0.5-29.43 Ø4.71}
ΔE Greyscale Calman: 2.7 | ∀{0.09-98 Ø4.96}
98.8% sRGB (Argyll 1.6.3 3D)
71.2% AdobeRGB 1998 (Argyll 1.6.3 3D)
79.2% AdobeRGB 1998 (Argyll 3D)
98.8% sRGB (Argyll 3D)
79.1% Display P3 (Argyll 3D)
Gamma: 2.1
CCT: 7038 K
| Dell XPS 15 9570 i7 UHD LQ156D1, , 3840x2160, 15.6" | Dell XPS 15 2018 i5 FHD 97Wh Sharp SHP149A LQ156M1, , 1920x1080, 15.6" | Apple MacBook Pro 15 2018 (2.6 GHz, 560X) APPA040, , 2880x1800, 15.4" | HP EliteBook 1050 G1-4QY20EA AUO30EB, , 3840x2160, 15.6" | Asus ZenBook Pro 15 UX580GE AU Optronics B156ZAN03.1, , 3840x2160, 15.6" | Razer Blade 15 GTX 1060 LGD05C0, , 1920x1080, 15.6" | |
|---|---|---|---|---|---|---|
| Display | -12% | 12% | -11% | 12% | -14% | |
| Display P3 Coverage (%) | 79.1 | 66 -17% | 98.7 25% | 67.8 -14% | 85.9 9% | 64.4 -19% |
| sRGB Coverage (%) | 98.8 | 96.5 -2% | 99.9 1% | 94.1 -5% | 100 1% | 93.4 -5% |
| AdobeRGB 1998 Coverage (%) | 79.2 | 66.7 -16% | 86.6 9% | 67.9 -14% | 99.1 25% | 65.5 -17% |
| Response Times | 0% | 5% | -6% | 17% | 67% | |
| Response Time Grey 50% / Grey 80% * (ms) | 46.4 ? | 49 ? -6% | 43.2 ? 7% | 56 ? -21% | 44 ? 5% | 13.6 ? 71% |
| Response Time Black / White * (ms) | 32 ? | 30 ? 6% | 31.2 ? 2% | 29 ? 9% | 22.8 ? 29% | 12 ? 62% |
| PWM Frequency (Hz) | 980 ? | 961 ? | 117000 ? | |||
| Screen | 10% | 26% | -8% | 3% | 4% | |
| Brightness middle (cd/m²) | 494 | 413 -16% | 520 5% | 440 -11% | 357.6 -28% | 304.3 -38% |
| Brightness (cd/m²) | 457 | 378 -17% | 492 8% | 389 -15% | 350 -23% | 293 -36% |
| Brightness Distribution (%) | 88 | 86 -2% | 88 0% | 83 -6% | 85 -3% | 80 -9% |
| Black Level * (cd/m²) | 0.34 | 0.29 15% | 0.39 -15% | 0.34 -0% | 0.35 -3% | 0.38 -12% |
| Contrast (:1) | 1453 | 1424 -2% | 1333 -8% | 1294 -11% | 1022 -30% | 801 -45% |
| Colorchecker dE 2000 * | 5.2 | 2.44 53% | 1.2 77% | 5.04 3% | 4.12 21% | 1.79 66% |
| Colorchecker dE 2000 max. * | 17.5 | 4.46 75% | 2.3 87% | 6.99 60% | 9.91 43% | 3.69 79% |
| Greyscale dE 2000 * | 2.7 | 2.48 8% | 1.3 52% | 4.98 -84% | 1.8 33% | 1.1 59% |
| Gamma | 2.1 105% | 2.43 91% | 2.18 101% | 2.48 89% | 2.17 101% | 2.27 97% |
| CCT | 7038 92% | 7006 93% | 6738 96% | 7777 84% | 6613 98% | 6665 98% |
| Color Space (Percent of AdobeRGB 1998) (%) | 71.2 | 62 -13% | 61 -14% | 87.5 23% | 59.8 -16% | |
| Color Space (Percent of sRGB) (%) | 98.8 | 96 -3% | 94 -5% | 100 1% | 92.8 -6% | |
| Colorchecker dE 2000 calibrated * | 2.48 | 2.04 | 4.23 | |||
| Totalt genomsnitt (program/inställningar) | -1% /
4% | 14% /
19% | -8% /
-9% | 11% /
7% | 19% /
9% |
* ... mindre är bättre
Visa svarstider
| ↔ Svarstid svart till vitt | ||
|---|---|---|
| 32 ms ... stiga ↗ och falla ↘ kombinerat | ↗ 18 ms stiga | 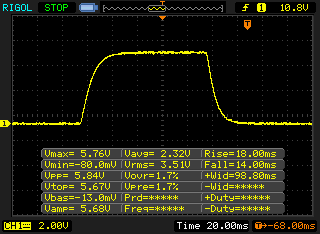 |
| ↘ 14 ms hösten | ||
| Skärmen visar långsamma svarsfrekvenser i våra tester och kommer att vara otillfredsställande för spelare. I jämförelse sträcker sig alla testade enheter från 0.1 (minst) till 240 (maximalt) ms. » 86 % av alla enheter är bättre. Detta innebär att den uppmätta svarstiden är sämre än genomsnittet av alla testade enheter (19.8 ms). | ||
| ↔ Svarstid 50 % grått till 80 % grått | ||
| 46.4 ms ... stiga ↗ och falla ↘ kombinerat | ↗ 22.8 ms stiga | 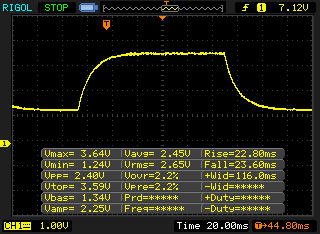 |
| ↘ 23.6 ms hösten | ||
| Skärmen visar långsamma svarsfrekvenser i våra tester och kommer att vara otillfredsställande för spelare. I jämförelse sträcker sig alla testade enheter från 0.165 (minst) till 636 (maximalt) ms. » 80 % av alla enheter är bättre. Detta innebär att den uppmätta svarstiden är sämre än genomsnittet av alla testade enheter (30.9 ms). | ||
Skärmflimmer / PWM (Puls-Width Modulation)
| Skärmflimmer / PWM upptäckt | 980 Hz | ≤ 25 % ljusstyrka inställning | 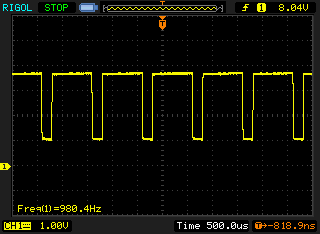 |
Displayens bakgrundsbelysning flimrar vid 980 Hz (i värsta fall, t.ex. med PWM) Flimrande upptäckt vid en ljusstyrkeinställning på 25 % och lägre. Det ska inte finnas något flimmer eller PWM över denna ljusstyrkeinställning. Frekvensen för 980 Hz är ganska hög, så de flesta användare som är känsliga för PWM bör inte märka något flimmer. Som jämförelse: 52 % av alla testade enheter använder inte PWM för att dämpa skärmen. Om PWM upptäcktes mättes ett medelvärde av 7744 (minst: 5 - maximum: 343500) Hz. | |||


| PCMark 8 Home Score Accelerated v2 | 3631 poäng | |
| PCMark 8 Creative Score Accelerated v2 | 5284 poäng | |
| PCMark 8 Work Score Accelerated v2 | 4418 poäng | |
| PCMark 10 Score | 4966 poäng | |
Hjälp | ||
| Dell XPS 15 9570 i7 UHD Toshiba XG5 KXG50ZNV512G | Dell XPS 15 2018 i5 FHD 97Wh Lite-On CA3-8D256-Q11 | HP EliteBook 1050 G1-4QY20EA Toshiba XG5-P KXG50PNV2T04 | Asus ZenBook Pro 15 UX580GE Samsung SSD PM961 1TB M.2 PCIe 3.0 x4 NVMe (MZVLW1T0) | Razer Blade 15 GTX 1060 Samsung SSD PM981 MZVLB512HAJQ | Genomsnitt Toshiba XG5 KXG50ZNV512G | |
|---|---|---|---|---|---|---|
| CrystalDiskMark 5.2 / 6 | -5% | -6% | 27% | 17% | 4% | |
| Write 4K (MB/s) | 79.1 | 89.4 13% | 94.8 20% | 125 58% | 97.9 24% | 114 ? 44% |
| Read 4K (MB/s) | 37.89 | 44.64 18% | 26.45 -30% | 44.68 18% | 41.32 9% | 35.6 ? -6% |
| Write Seq (MB/s) | 1119 | 830 -26% | 1037 -7% | 1059 -5% | 1594 42% | 684 ? -39% |
| Read Seq (MB/s) | 1852 | 1774 -4% | 1280 -31% | 772 -58% | 1353 -27% | 1612 ? -13% |
| Write 4K Q32T1 (MB/s) | 361.1 | 310.6 -14% | 277.6 -23% | 507 40% | 305.6 -15% | 401 ? 11% |
| Read 4K Q32T1 (MB/s) | 257.9 | 266.4 3% | 333.9 29% | 614 138% | 354.1 37% | 427 ? 66% |
| Write Seq Q32T1 (MB/s) | 1131 | 831 -27% | 1037 -8% | 1763 56% | 2033 80% | 830 ? -27% |
| Read Seq Q32T1 (MB/s) | 3096 | 2962 -4% | 3135 1% | 2171 -30% | 2543 -18% | 2950 ? -5% |

| 3DMark 06 1024x768 Score | 34786 poäng | |
| 3DMark Vantage P Result | 34180 poäng | |
| 3DMark 11 Performance | 9414 poäng | |
| 3DMark Ice Storm Standard Score | 41456 poäng | |
| 3DMark Fire Strike Score | 6753 poäng | |
| 3DMark Fire Strike Extreme Score | 3431 poäng | |
| 3DMark Time Spy Score | 2513 poäng | |
Hjälp | ||
| låg | med. | hög | ultra | 4K | |
|---|---|---|---|---|---|
| BioShock Infinite (2013) | 297 | 214 | 187.8 | 74.6 | |
| The Witcher 3 (2015) | 130.9 | 87.2 | 48.2 | 26 | 17.1 |
| Rainbow Six Siege (2015) | 263.6 | 162.2 | 92.7 | 62.5 | 29.3 |
| Rise of the Tomb Raider (2016) | 99.9 | 73.6 | 47.3 | 39.9 | 16.8 |
| The Division (2016) | 114.2 | 83.4 | 42.5 | 34.8 | 15.7 |
| Battlefield 1 (2016) | 89.5 | 85.2 | 51.7 | 49.8 | 21.1 |
| For Honor (2017) | 113.6 | 63.8 | 65.5 | 49.5 | 19.2 |
| Ghost Recon Wildlands (2017) | 68.6 | 42.7 | 40 | 23.4 | 14.5 |
| Assassin´s Creed Origins (2017) | 58 | 41 | 33 | 27 | 13 |
| Star Wars Battlefront 2 (2017) | 92.3 | 42 | 34.3 | 30.4 | |
| Far Cry 5 (2018) | 91 | 48 | 44 | 38 | 13 |
| The Crew 2 (2018) | 60 | 49.1 | 45.3 | 42 | 14 |
Ljudnivå
| Låg belastning |
| 29.9 / 29.9 / 30.3 dB(A) |
| Hög belastning |
| 36.5 / 40.4 dB(A) |
 | ||
30 dB tyst 40 dB(A) hörbar 50 dB(A) högt ljud |
||
min: | ||
| Dell XPS 15 9570 i7 UHD GeForce GTX 1050 Ti Max-Q, i7-8750H, Toshiba XG5 KXG50ZNV512G | Dell XPS 15 2018 i5 FHD 97Wh GeForce GTX 1050 Mobile, i5-8300H, Lite-On CA3-8D256-Q11 | Apple MacBook Pro 15 2018 (2.6 GHz, 560X) Radeon Pro 560X, i7-8850H, Apple SSD AP0512 | HP EliteBook 1050 G1-4QY20EA GeForce GTX 1050 Max-Q, i7-8750H, Toshiba XG5-P KXG50PNV2T04 | Asus ZenBook Pro 15 UX580GE GeForce GTX 1050 Ti Mobile, i9-8950HK, Samsung SSD PM961 1TB M.2 PCIe 3.0 x4 NVMe (MZVLW1T0) | Razer Blade 15 GTX 1060 GeForce GTX 1060 Max-Q, i7-8750H, Samsung SSD PM981 MZVLB512HAJQ | Dell XPS 15 9560 (i7-7700HQ, UHD) GeForce GTX 1050 Mobile, i7-7700HQ, Lite-On CX2-8B512-Q11 | |
|---|---|---|---|---|---|---|---|
| Noise | -3% | -5% | -6% | -4% | -7% | -10% | |
| av / miljö * (dB) | 29.9 | 30.3 -1% | 29.6 1% | 30.25 -1% | 28 6% | 28.1 6% | 28.4 5% |
| Idle Minimum * (dB) | 29.9 | 30.3 -1% | 30.1 -1% | 30.25 -1% | 28.6 4% | 28.1 6% | 29 3% |
| Idle Average * (dB) | 29.9 | 30.3 -1% | 30.1 -1% | 30.25 -1% | 29.9 -0% | 33 -10% | 29 3% |
| Idle Maximum * (dB) | 30.3 | 30.3 -0% | 30.1 1% | 31.8 -5% | 30.5 -1% | 33.5 -11% | 32.2 -6% |
| Load Average * (dB) | 36.5 | 37.1 -2% | 46.8 -28% | 44.7 -22% | 42.5 -16% | 42.2 -16% | 47.1 -29% |
| Witcher 3 ultra * (dB) | 40.4 | 43.3 -7% | 36 11% | 44.8 -11% | 45.3 -12% | 52 -29% | |
| Load Maximum * (dB) | 40.4 | 43 -6% | 46.8 -16% | 42 -4% | 44.8 -11% | 45.7 -13% | 47.1 -17% |
* ... mindre är bättre
(-) Den maximala temperaturen på ovansidan är 55.7 °C / 132 F, jämfört med genomsnittet av 36.8 °C / 98 F , allt från 21 till 71 °C för klassen Multimedia.
(-) Botten värms upp till maximalt 48.5 °C / 119 F, jämfört med genomsnittet av 39.1 °C / 102 F
(+) Vid tomgångsbruk är medeltemperaturen för ovansidan 24.1 °C / 75 F, jämfört med enhetsgenomsnittet på 31.3 °C / ### class_avg_f### F.
(±) När du spelar The Witcher 3 är medeltemperaturen för ovansidan 38 °C / 100 F, jämfört med enhetsgenomsnittet på 31.3 °C / ## #class_avg_f### F.
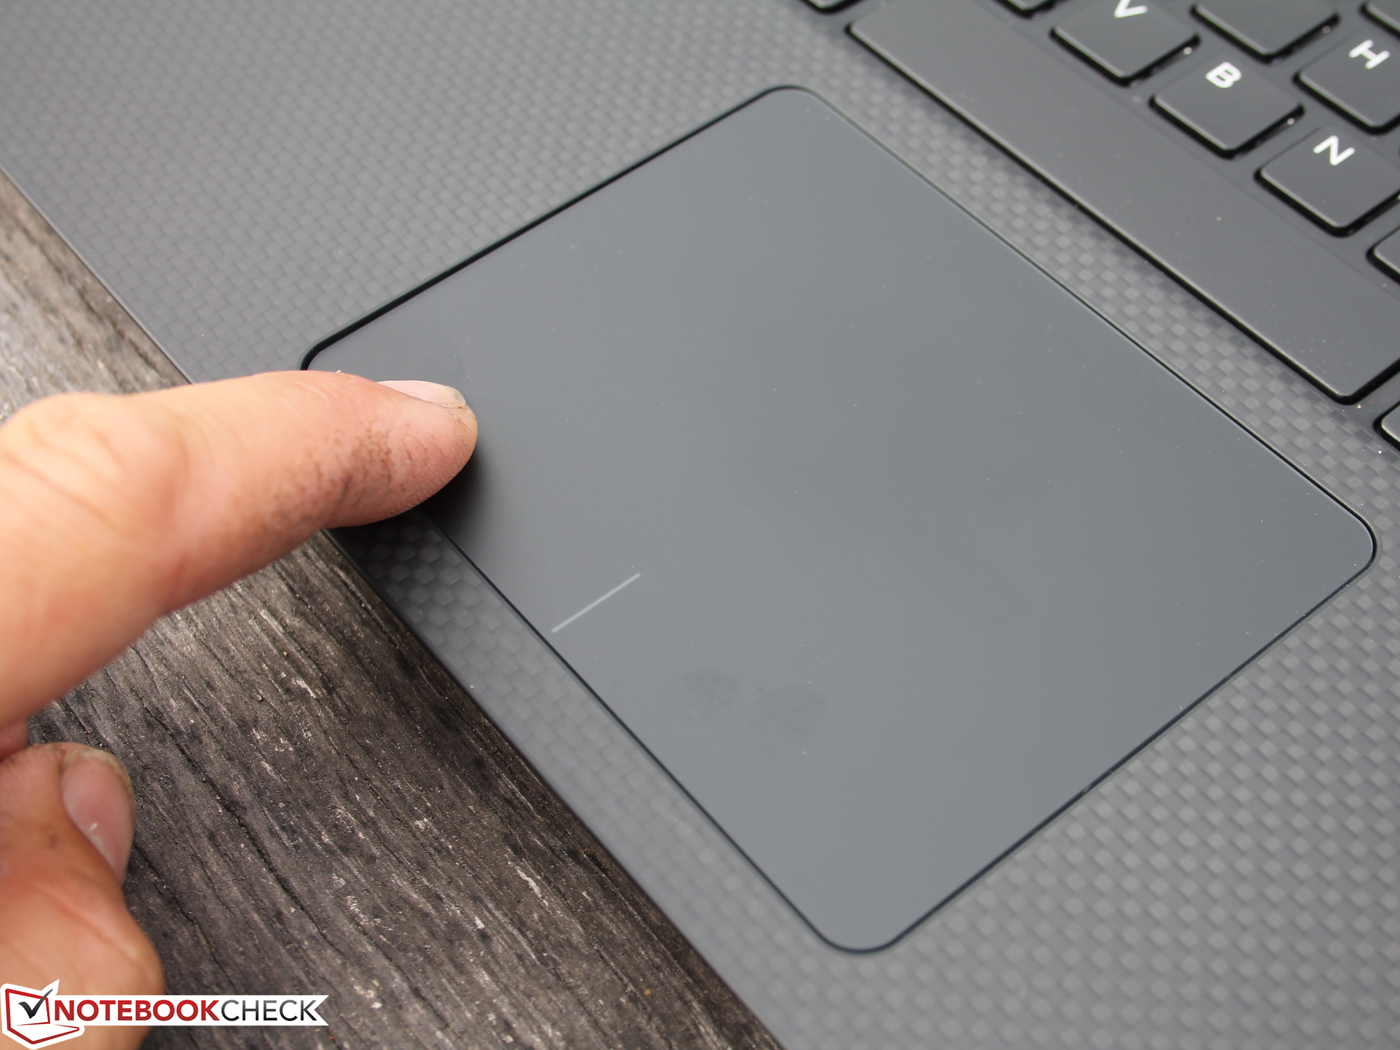
(+) Handledsstöden och pekplattan når maximal hudtemperatur (34.6 °C / 94.3 F) och är därför inte varma.
(-) Medeltemperaturen för handledsstödsområdet på liknande enheter var 28.7 °C / 83.7 F (-5.9 °C / -10.6 F).
| Av/Standby | |
| Låg belastning | |
| Hög belastning |
|
Förklaring:
min: | |
| Dell XPS 15 9570 i7 UHD i7-8750H, GeForce GTX 1050 Ti Max-Q, Toshiba XG5 KXG50ZNV512G, IPS, 3840x2160, 15.6" | Dell XPS 15 2018 i5 FHD 97Wh i5-8300H, GeForce GTX 1050 Mobile, Lite-On CA3-8D256-Q11, LED IGZO IPS InfinityEdge, 1920x1080, 15.6" | Apple MacBook Pro 15 2018 (2.6 GHz, 560X) i7-8850H, Radeon Pro 560X, Apple SSD AP0512, IPS, 2880x1800, 15.4" | HP EliteBook 1050 G1-4QY20EA i7-8750H, GeForce GTX 1050 Max-Q, Toshiba XG5-P KXG50PNV2T04, IPS LED, 3840x2160, 15.6" | Asus ZenBook Pro 15 UX580GE i9-8950HK, GeForce GTX 1050 Ti Mobile, Samsung SSD PM961 1TB M.2 PCIe 3.0 x4 NVMe (MZVLW1T0), IPS, 3840x2160, 15.6" | Razer Blade 15 GTX 1060 i7-8750H, GeForce GTX 1060 Max-Q, Samsung SSD PM981 MZVLB512HAJQ, IPS, 1920x1080, 15.6" | Genomsnitt NVIDIA GeForce GTX 1050 Ti Max-Q | Genomsnitt av klass Multimedia | |
|---|---|---|---|---|---|---|---|---|
| Power Consumption | 45% | 31% | 23% | -13% | -19% | 20% | 30% | |
| Idle Minimum * (Watt) | 9.48 | 2.9 69% | 3.4 64% | 6.1 36% | 11.7 -23% | 14.9 -57% | 5.8 ? 39% | 5.62 ? 41% |
| Idle Average * (Watt) | 16.1 | 5.8 64% | 11 32% | 10.2 37% | 18.5 -15% | 17.5 -9% | 11.2 ? 30% | 10.2 ? 37% |
| Idle Maximum * (Watt) | 16.9 | 7.5 56% | 14.9 12% | 13.4 21% | 22.8 -35% | 19.2 -14% | 13.5 ? 20% | 12.5 ? 26% |
| Load Average * (Watt) | 90.8 | 77.5 15% | 78.9 13% | 82 10% | 97.5 -7% | 103.2 -14% | 86.9 ? 4% | 65 ? 28% |
| Load Maximum * (Watt) | 134.4 | 107 20% | 91.2 32% | 122 9% | 111.1 17% | 132.7 1% | 122.4 ? 9% | 111.9 ? 17% |
| Witcher 3 ultra * (Watt) | 84 | 102.9 | 123.1 |
* ... mindre är bättre
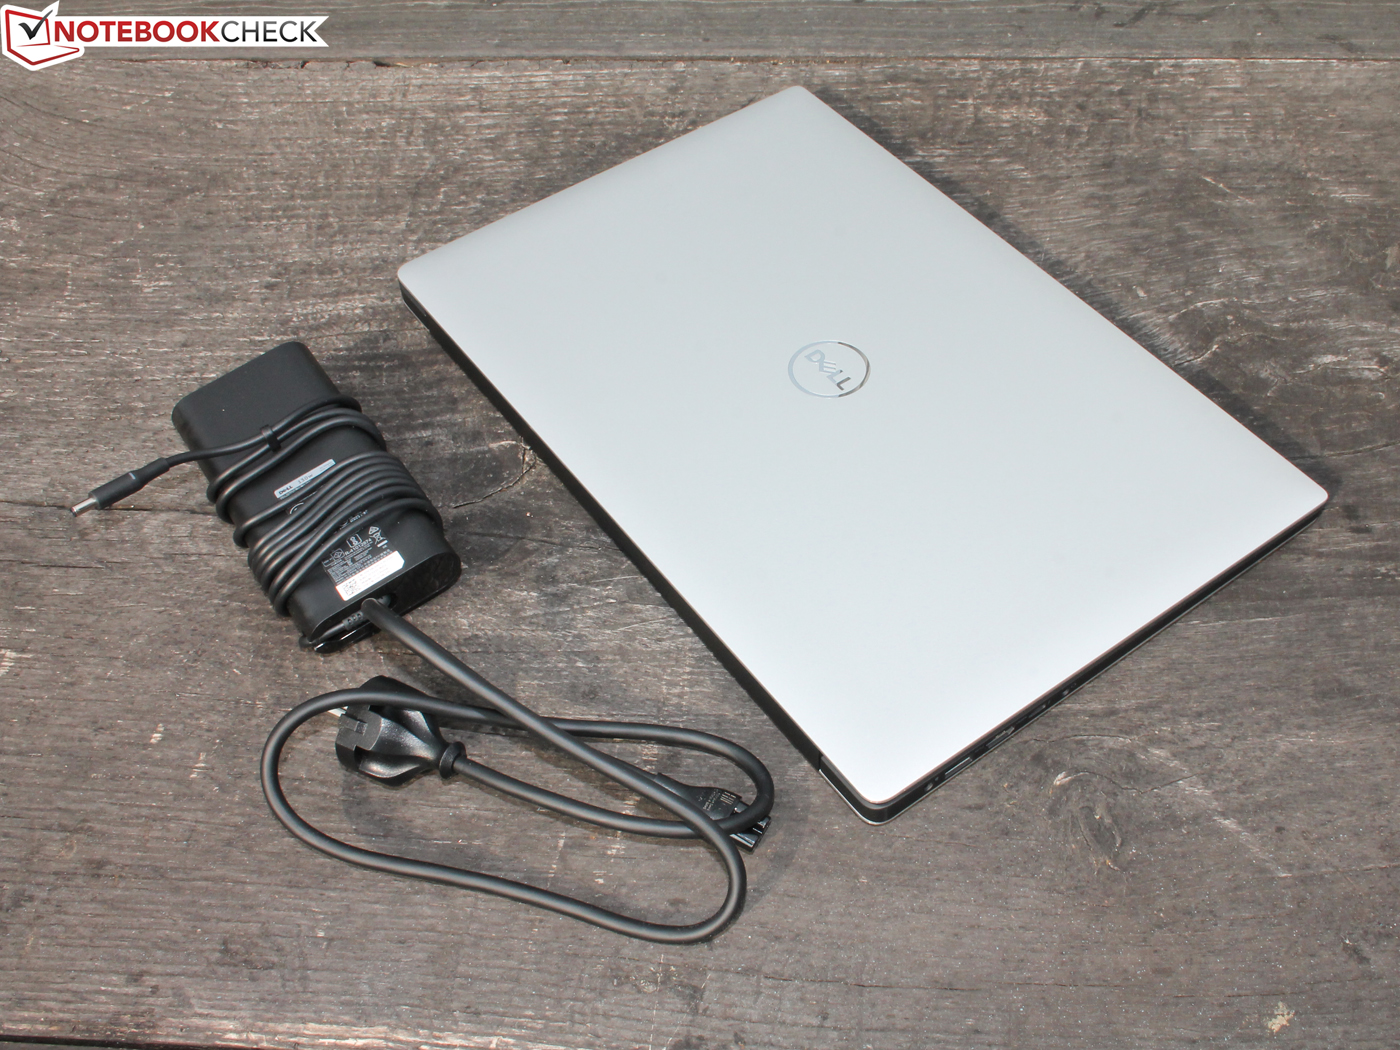
| Dell XPS 15 9570 i7 UHD i7-8750H, GeForce GTX 1050 Ti Max-Q, 97 Wh | Dell XPS 15 2018 i5 FHD 97Wh i5-8300H, GeForce GTX 1050 Mobile, 97 Wh | Apple MacBook Pro 15 2018 (2.6 GHz, 560X) i7-8850H, Radeon Pro 560X, 83 Wh | HP EliteBook 1050 G1-4QY20EA i7-8750H, GeForce GTX 1050 Max-Q, 96 Wh | Asus ZenBook Pro 15 UX580GE i9-8950HK, GeForce GTX 1050 Ti Mobile, 71 Wh | Razer Blade 15 GTX 1060 i7-8750H, GeForce GTX 1060 Max-Q, 80 Wh | Genomsnitt av klass Multimedia | |
|---|---|---|---|---|---|---|---|
| Batteridrifttid | 37% | 17% | 11% | -17% | -30% | 31% | |
| H.264 (h) | 12.3 | 11.7 -5% | 9.7 -21% | 16.8 ? 37% | |||
| WiFi v1.3 (h) | 9.6 | 15.7 64% | 10.2 6% | 8.7 -9% | 6.3 -34% | 6.7 -30% | 12.3 ? 28% |
| Witcher 3 ultra (h) | 1 | 1 0% | 1.5 50% | ||||
| Load (h) | 1.3 | 1.9 46% | 2.1 62% | 1.3 0% | 1.645 ? 27% |
För
Emot
Läs den fullständiga versionen av den här recensionen på engelska här.
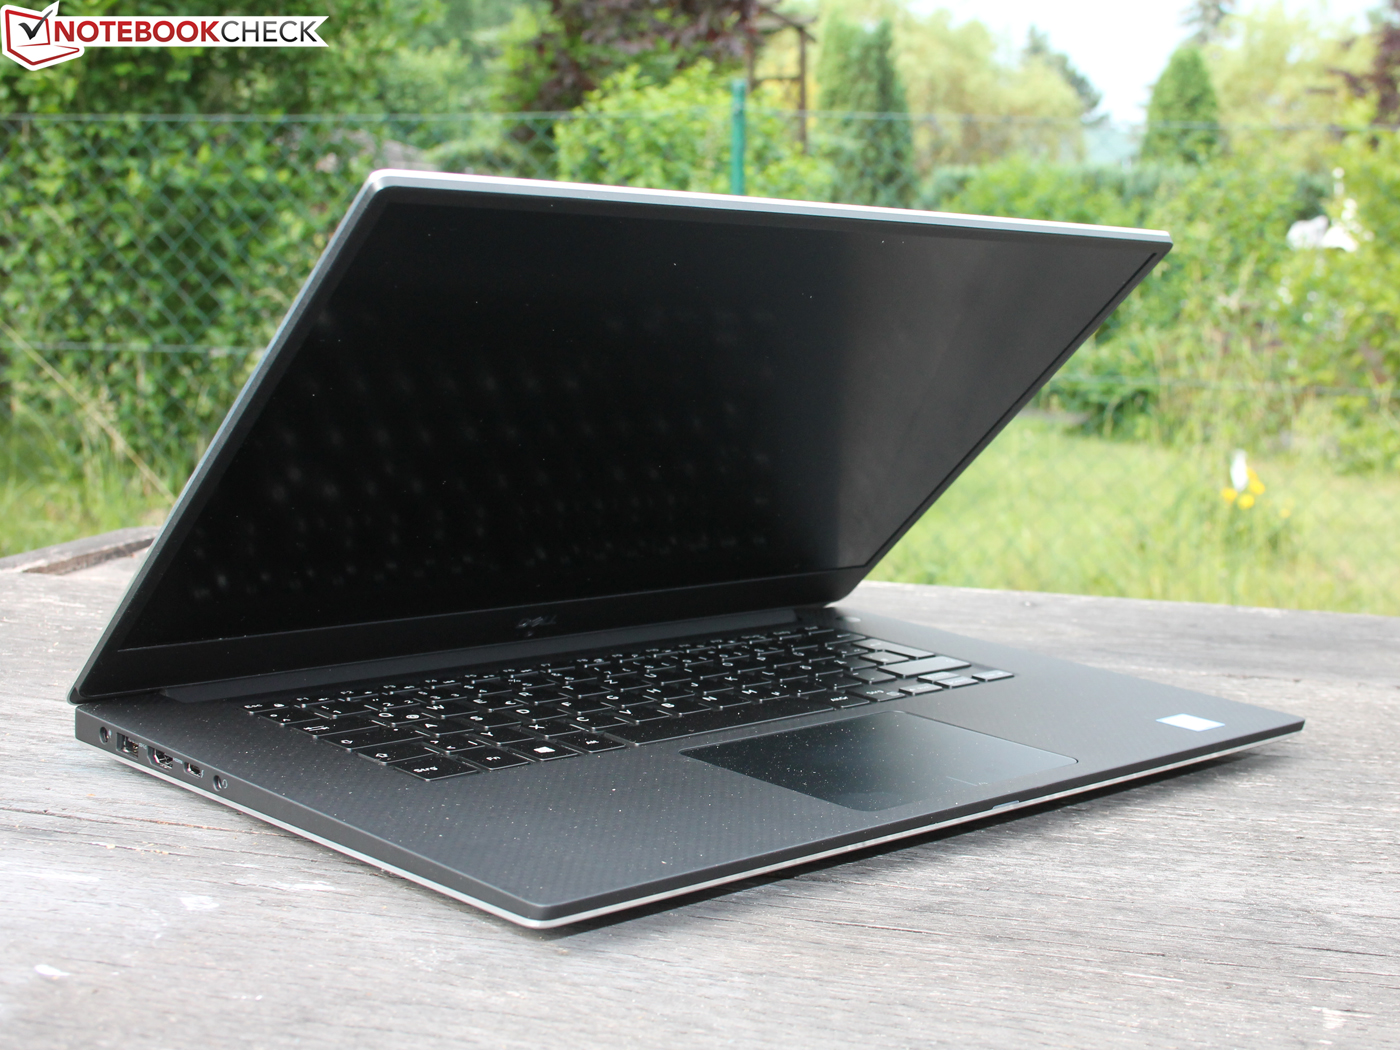
Fler CPU-kärnor, snabbare grafik och fler pixlar – är den dyrare konfigurationen av XPS 15 9570 ett bättre val? Nej, åtminstone inte för alla användare. Det är definitivt ett plus att dess CPU och GPU använder sin prestanda väl, vilket inte alltid är fallet med tunna enheter. Du kan dessutom optimera CPU-prestandan ytterligare, så Core i7-alternativet är givet om du behöver mycket processorkraft. Det är heller inte svårt att välja GPU, då GeForce GTX 1050 Ti Max-Q är en aning snabbare och har mer marginal inför framtiden.
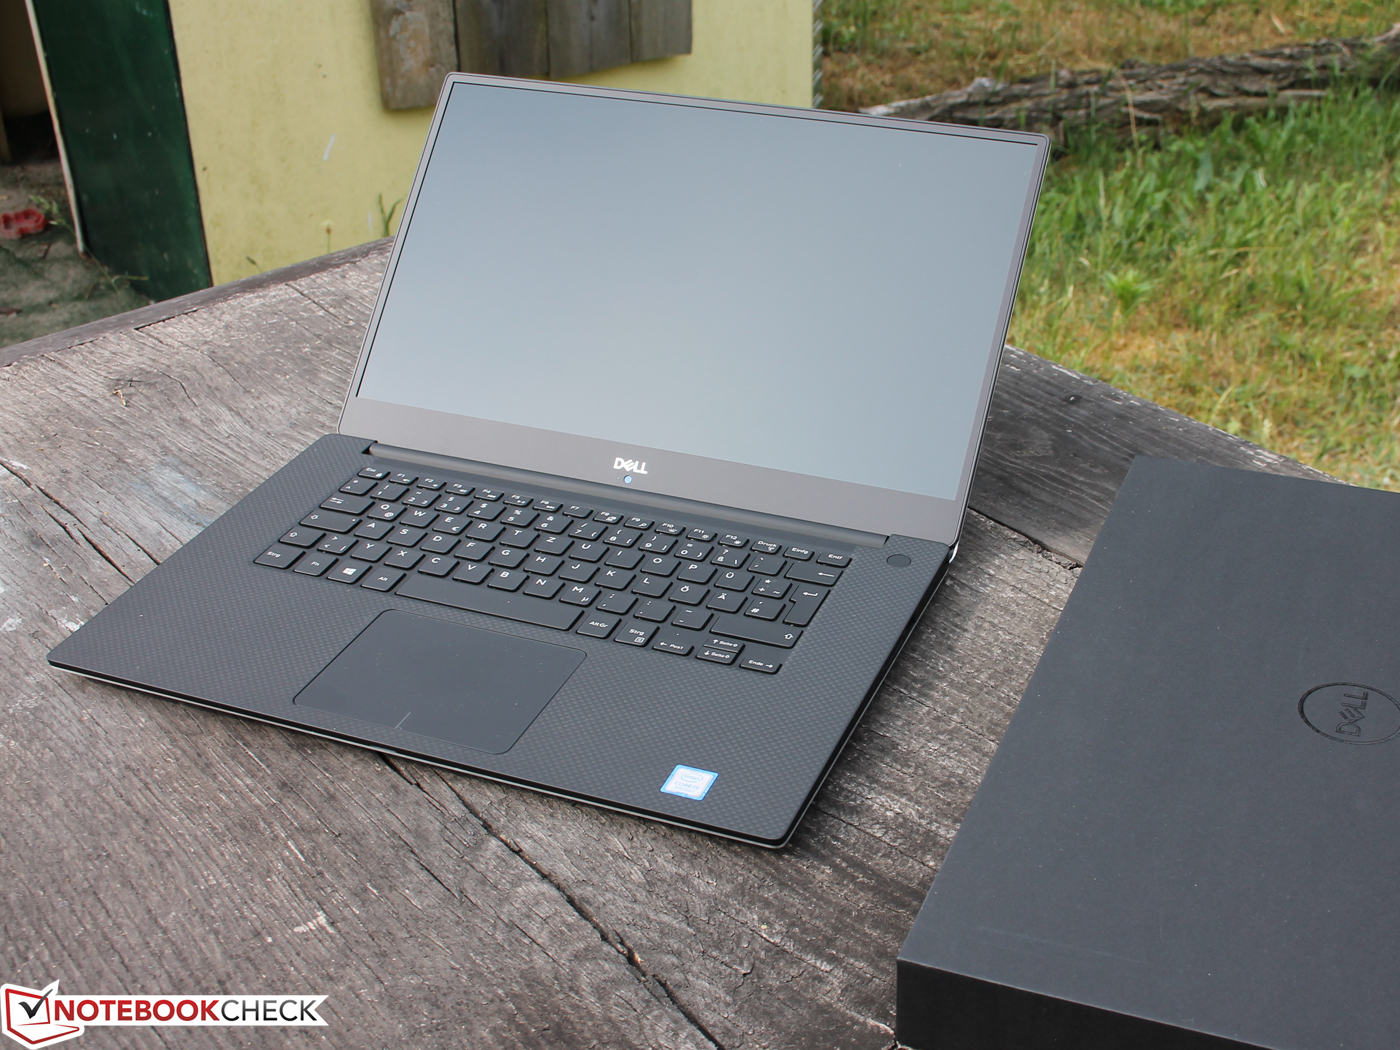
Valet av skärm är ett större problem. Den tryckkänsliga 4K UHD-skärmen som finns som tillval är en aning mer ljusstark och stödjer tryckinmatning (huruvida det är en fördel beror personlig preferens), men den är blank och vi blev överraskade av de höga färgavvikelserna, som bara förbättrades en aning efter kalibrering. 4K-skärmen är därför inte det bästa valet för bild/videoredigering. Den ökar dessutom vikten en aning och drar mycket mer energi, så batteritiden är mycket kortare. Runt 9.5 timmar är inte dåligt för ett system på 15 tum, men XPS 15 med den matta 1080p-skärmen håller mycket längre. Övriga mätvärden för 1080p-skärmen (ljusstyrka, kontrast, etc.) är också bra, så den billigare varianten är troligen det bästa valet för de flesta användare.
Processorn och grafikkortets extra prestanda är definitivt en fördel, men den tryckkänsliga 4K-skärmen som finns som tillval ger oss blandade intryck. Den drar mycket energi och rejäla färgavvikelser hindrar den från att få ett bättre omdöme.
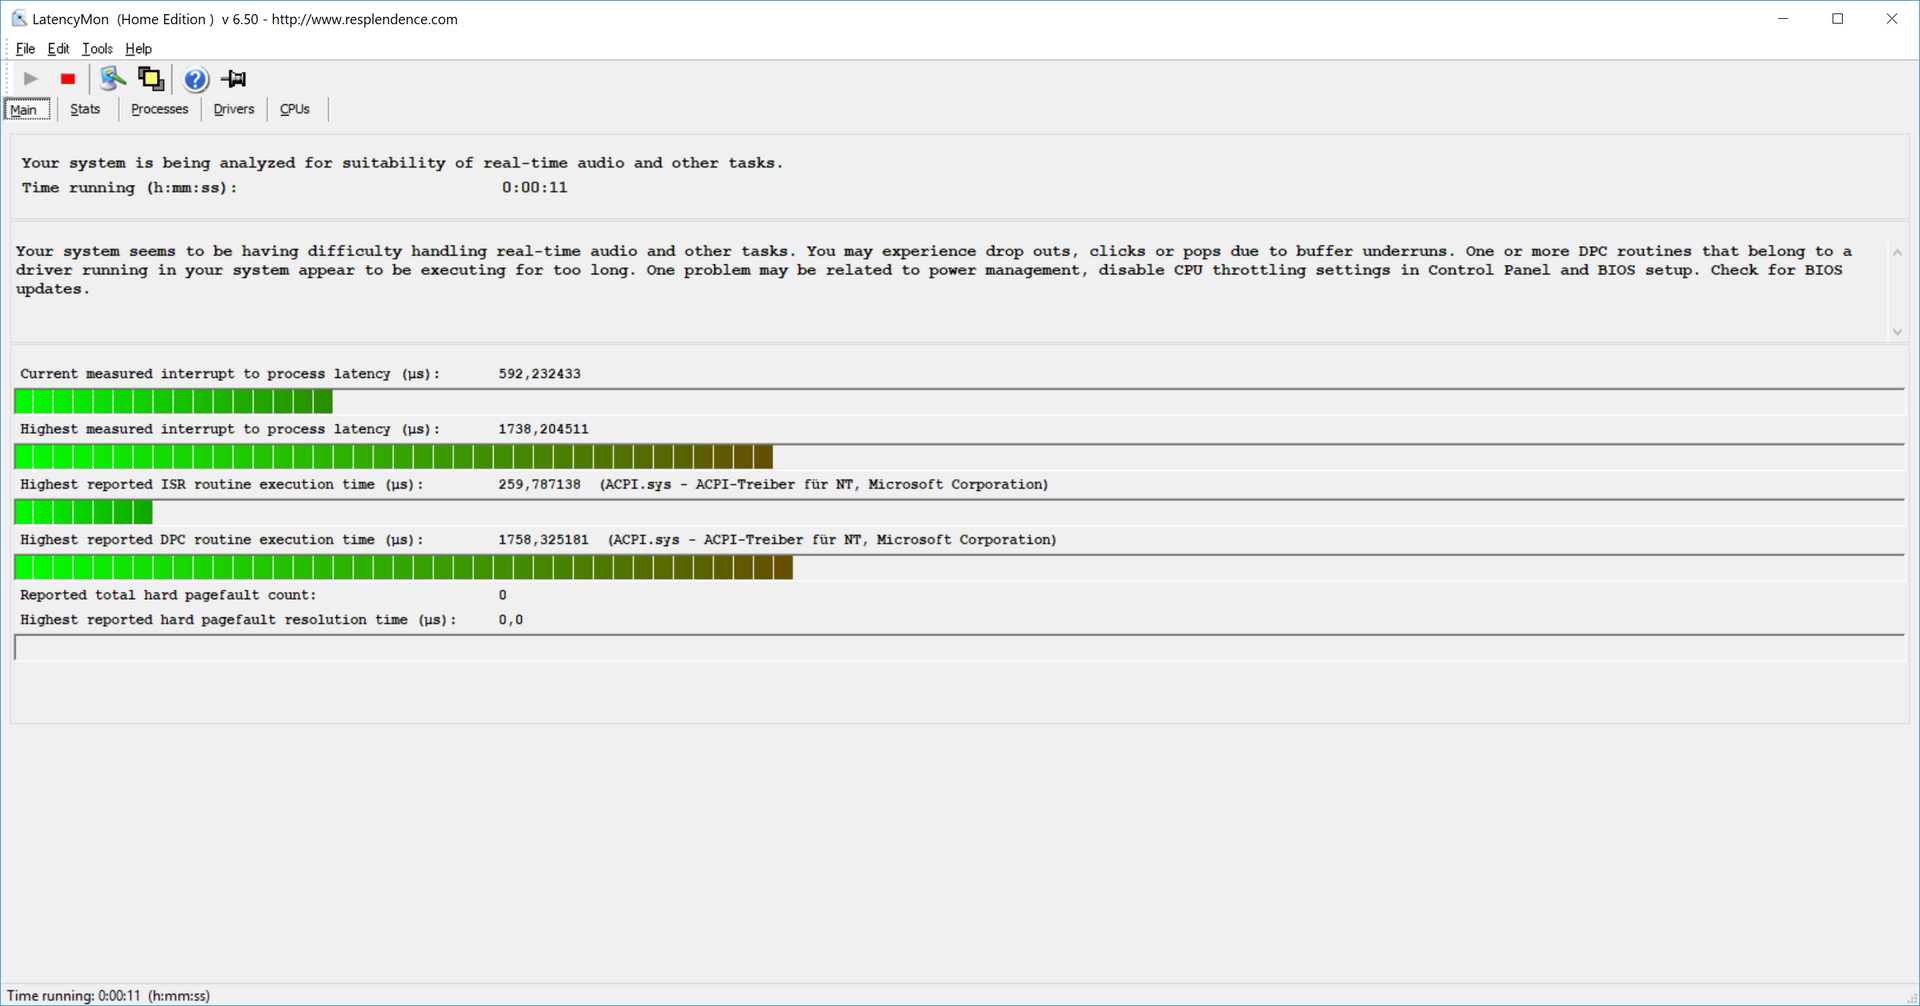
Vår testmodell led dessutom av spoltjut och fläktarna tenderade att pulsera vid mediumbelastning. Totalt sett är denna SKU av XPS 15 fortfarande en riktigt bra multimedialaptop, men basmodellen var ett mer balanserat paket och fick således ett bättre omdöme totalt sett. Vi kommer göra en separat recension av Core i9-modellen för att undersöka huruvida den är värd den extra kostnaden.
Dell XPS 15 9570 i7 UHD
- 09/17/2018 v6 (old)
Andreas Osthoff
Price comparison
