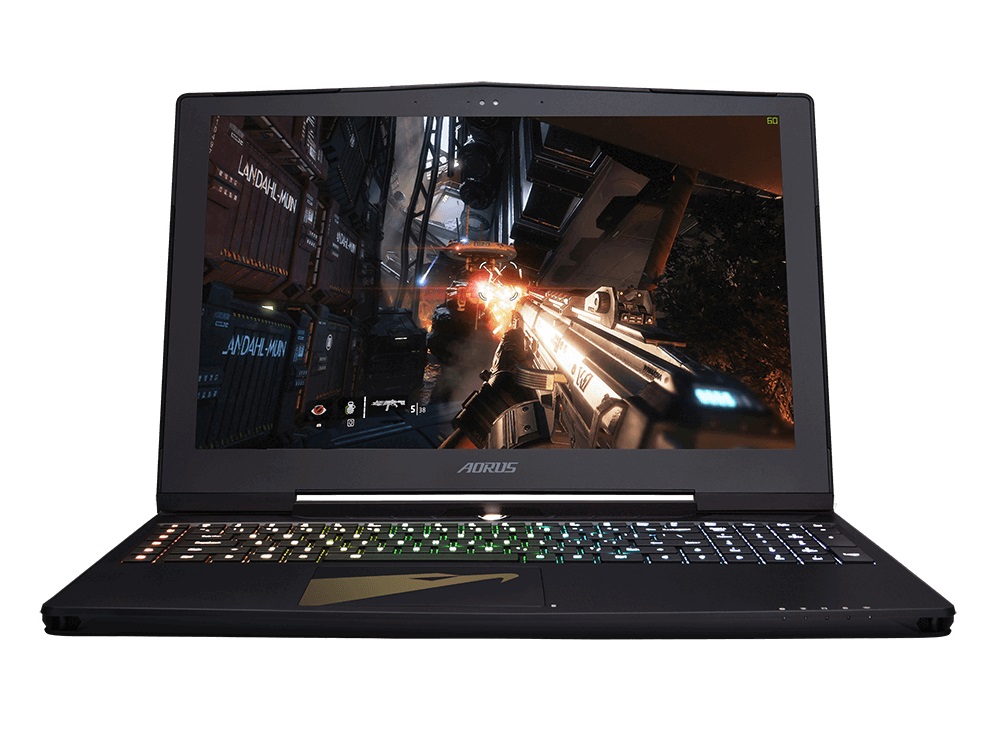
Test: Aorus X5 v8 (i7-8850H, GTX 1070, Full-HD) Laptop (Sammanfattning)
| SD Card Reader | |
| average JPG Copy Test (av. of 3 runs) | |
| Aorus X5 v8 (Toshiba Exceria Pro SDXC 64 GB UHS-II) | |
| Gigabyte Aero 15X v8 (Toshiba Exceria Pro SDXC 64 GB UHS-II) | |
| Genomsnitt av klass Gaming (20.9 - 210, n=55, senaste 2 åren) | |
| maximum AS SSD Seq Read Test (1GB) | |
| Gigabyte Aero 15X v8 (Toshiba Exceria Pro SDXC 64 GB UHS-II) | |
| Aorus X5 v8 (Toshiba Exceria Pro SDXC 64 GB UHS-II) | |
| Genomsnitt av klass Gaming (25.5 - 261, n=52, senaste 2 åren) | |
| |||||||||||||||||||||||||
Distribution av ljusstyrkan: 87 %
Mitt på batteriet: 271 cd/m²
Kontrast: 1004:1 (Svärta: 0.27 cd/m²)
ΔE ColorChecker Calman: 1.81 | ∀{0.5-29.43 Ø4.73}
ΔE Greyscale Calman: 1.09 | ∀{0.09-98 Ø4.97}
93% sRGB (Argyll 1.6.3 3D)
61% AdobeRGB 1998 (Argyll 1.6.3 3D)
68.1% AdobeRGB 1998 (Argyll 3D)
93.4% sRGB (Argyll 3D)
67.1% Display P3 (Argyll 3D)
Gamma: 2.45
CCT: 6435 K
| Aorus X5 v8 AU Optronics B156HAN07.0 (AUO70ED), IPS, 1920x1080 | Gigabyte Aero 15X v8 LGD05C0, IPS, 1920x1080 | MSI GS65 8RF-019DE Stealth Thin AU Optronics B156HAN08.0 (AUO80ED), IPS, 1920x1080 | Asus Zephyrus M GM501 AUO B156HAN07.1 (AUO71ED), IPS, 1920x1080 | Acer Predator Triton 700 AUO B156HAN04.2 (AUO42ED), IPS, 1920x1080 | |
|---|---|---|---|---|---|
| Display | -3% | -1% | -1% | -6% | |
| Display P3 Coverage (%) | 67.1 | 63.6 -5% | 66.2 -1% | 66.1 -1% | 62.5 -7% |
| sRGB Coverage (%) | 93.4 | 93.8 0% | 92.1 -1% | 92.7 -1% | 88.7 -5% |
| AdobeRGB 1998 Coverage (%) | 68.1 | 64.9 -5% | 67.2 -1% | 67.2 -1% | 63.5 -7% |
| Response Times | 9% | -1% | 39% | -143% | |
| Response Time Grey 50% / Grey 80% * (ms) | 18.8 ? | 16.8 ? 11% | 17.6 ? 6% | 6.6 ? 65% | 44.8 ? -138% |
| Response Time Black / White * (ms) | 12 ? | 11.2 ? 7% | 12.8 ? -7% | 10.4 ? 13% | 29.6 ? -147% |
| PWM Frequency (Hz) | |||||
| Screen | 10% | -9% | -89% | -88% | |
| Brightness middle (cd/m²) | 271 | 313 15% | 254 -6% | 307 13% | 291 7% |
| Brightness (cd/m²) | 259 | 300 16% | 262 1% | 296 14% | 277 7% |
| Brightness Distribution (%) | 87 | 78 -10% | 89 2% | 89 2% | 84 -3% |
| Black Level * (cd/m²) | 0.27 | 0.33 -22% | 0.22 19% | 0.25 7% | 0.22 19% |
| Contrast (:1) | 1004 | 948 -6% | 1155 15% | 1228 22% | 1323 32% |
| Colorchecker dE 2000 * | 1.81 | 1.29 29% | 2.37 -31% | 5.74 -217% | 5.52 -205% |
| Colorchecker dE 2000 max. * | 3.33 | 2.04 39% | 4.71 -41% | 11.32 -240% | 10.72 -222% |
| Greyscale dE 2000 * | 1.09 | 0.69 37% | 1.58 -45% | 6.44 -491% | 6.59 -505% |
| Gamma | 2.45 90% | 2.43 91% | 2.48 89% | 2.48 89% | 2.44 90% |
| CCT | 6435 101% | 6550 99% | 6785 96% | 8395 77% | 7816 83% |
| Color Space (Percent of AdobeRGB 1998) (%) | 61 | 60 -2% | 60 -2% | 60 -2% | 58 -5% |
| Color Space (Percent of sRGB) (%) | 93 | 94 1% | 92 -1% | 93 0% | 89 -4% |
| Colorchecker dE 2000 calibrated * | 1.84 | 1.94 | |||
| Totalt genomsnitt (program/inställningar) | 5% /
7% | -4% /
-6% | -17% /
-54% | -79% /
-79% |
* ... mindre är bättre
Visa svarstider
| ↔ Svarstid svart till vitt | ||
|---|---|---|
| 12 ms ... stiga ↗ och falla ↘ kombinerat | ↗ 7.6 ms stiga | 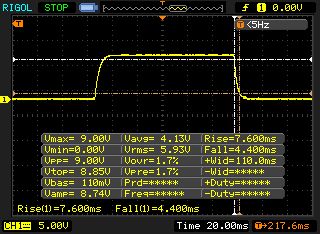 |
| ↘ 4.4 ms hösten | ||
| Skärmen visar bra svarsfrekvens i våra tester, men kan vara för långsam för konkurrenskraftiga spelare. I jämförelse sträcker sig alla testade enheter från 0.1 (minst) till 240 (maximalt) ms. » 31 % av alla enheter är bättre. Det betyder att den uppmätta svarstiden är bättre än genomsnittet av alla testade enheter (19.9 ms). | ||
| ↔ Svarstid 50 % grått till 80 % grått | ||
| 18.8 ms ... stiga ↗ och falla ↘ kombinerat | ↗ 10 ms stiga | 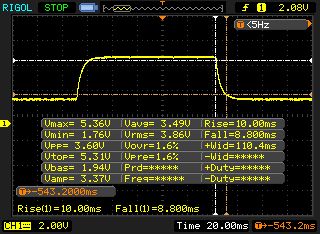 |
| ↘ 8.8 ms hösten | ||
| Skärmen visar bra svarsfrekvens i våra tester, men kan vara för långsam för konkurrenskraftiga spelare. I jämförelse sträcker sig alla testade enheter från 0.165 (minst) till 636 (maximalt) ms. » 32 % av alla enheter är bättre. Det betyder att den uppmätta svarstiden är bättre än genomsnittet av alla testade enheter (31.1 ms). | ||
Skärmflimmer / PWM (Puls-Width Modulation)
| Skärmflimmer / PWM upptäcktes inte |  | ||
Som jämförelse: 52 % av alla testade enheter använder inte PWM för att dämpa skärmen. Om PWM upptäcktes mättes ett medelvärde av 7801 (minst: 5 - maximum: 343500) Hz. | |||
| PCMark 10 - Score | |
| Genomsnitt av klass Gaming (5828 - 11574, n=96, senaste 2 åren) | |
| Aorus X5 v8 | |
| Acer Predator Triton 700 | |
| Asus Zephyrus M GM501 | |
| MSI GS65 8RF-019DE Stealth Thin | |
| Gigabyte Aero 15X v8 | |
| PCMark 8 Home Score Accelerated v2 | 5773 poäng | |
| PCMark 8 Work Score Accelerated v2 | 5953 poäng | |
| PCMark 10 Score | 6154 poäng | |
Hjälp | ||
| Aorus X5 v8 Toshiba NVMe THNSN5512GPU7 | Gigabyte Aero 15X v8 Toshiba NVMe THNSN5512GPU7 | MSI GS65 8RF-019DE Stealth Thin Samsung SSD PM981 MZVLB512HAJQ | Asus Zephyrus M GM501 Samsung SM961 MZVKW512HMJP m.2 PCI-e | Acer Predator Triton 700 2x SK Hynix Canvas SC300 512GB M.2 (HFS512G39MND) (RAID 0) | |
|---|---|---|---|---|---|
| AS SSD | 6% | 58% | 44% | 52% | |
| Seq Read (MB/s) | 1813 | 2213 22% | 1266 -30% | 2091 15% | 2517 39% |
| Seq Write (MB/s) | 966 | 1163 20% | 1834 90% | 1580 64% | 2372 146% |
| 4K Read (MB/s) | 23.21 | 23.36 1% | 48.94 111% | 43.42 87% | 41.47 79% |
| 4K Write (MB/s) | 84.5 | 80.4 -5% | 107.2 27% | 90.2 7% | 93 10% |
| Score Read (Points) | 1061 | 1092 3% | 1346 27% | 1471 39% | 1350 27% |
| Score Write (Points) | 954 | 939 -2% | 2051 115% | 1446 52% | 1243 30% |
| Score Total (Points) | 2515 | 2536 1% | 4122 64% | 3649 45% | 3282 30% |

| 3DMark - 1920x1080 Fire Strike Graphics | |
| Genomsnitt av klass Gaming (12242 - 62849, n=121, senaste 2 åren) | |
| Acer Predator Triton 700 | |
| Aorus X5 v8 | |
| Asus Zephyrus M GM501 | |
| Gigabyte Aero 15X v8 | |
| MSI GS65 8RF-019DE Stealth Thin | |
| 3DMark 06 Standard Score | 38437 poäng | |
| 3DMark 11 Performance | 18621 poäng | |
| 3DMark Ice Storm Standard Score | 172098 poäng | |
| 3DMark Cloud Gate Standard Score | 37234 poäng | |
| 3DMark Fire Strike Score | 15226 poäng | |
Hjälp | ||
| låg | med. | hög | ultra | |
|---|---|---|---|---|
| The Witcher 3 (2015) | 113 | 60 | ||
| Fortnite (2018) | 166 | 127 | ||
| Final Fantasy XV Benchmark (2018) | 53.3 | |||
| Kingdom Come: Deliverance (2018) | 87.8 | 65.2 | ||
| Far Cry 5 (2018) | 94 | 90 |
| The Witcher 3 - 1920x1080 Ultra Graphics & Postprocessing (HBAO+) | |
| Genomsnitt av klass Gaming (95 - 240, n=8, senaste 2 åren) | |
| Acer Predator Triton 700 | |
| Aorus X5 v8 | |
| Asus Zephyrus M GM501 | |
| MSI GS65 8RF-019DE Stealth Thin | |
| Gigabyte Aero 15X v8 | |
Ljudnivå
| Låg belastning |
| 33 / 35 / 40 dB(A) |
| Hårddisk |
| 33 dB(A) |
| Hög belastning |
| 45 / 55 dB(A) |
 | ||
30 dB tyst 40 dB(A) hörbar 50 dB(A) högt ljud |
||
min: | ||
| Aorus X5 v8 GeForce GTX 1070 Mobile, i7-8850H | Gigabyte Aero 15X v8 GeForce GTX 1070 Max-Q, i7-8750H | MSI GS65 8RF-019DE Stealth Thin GeForce GTX 1070 Max-Q, i7-8750H | Asus Zephyrus M GM501 GeForce GTX 1070 Mobile, i7-8750H | Acer Predator Triton 700 GeForce GTX 1080 Max-Q, i7-7700HQ | Genomsnitt av klass Gaming | |
|---|---|---|---|---|---|---|
| Noise | 4% | 11% | 5% | 5% | 16% | |
| av / miljö * (dB) | 30 | 29 3% | 30 -0% | 29 3% | 31 -3% | 24.1 ? 20% |
| Idle Minimum * (dB) | 33 | 30 9% | 30 9% | 30 9% | 33 -0% | 25.8 ? 22% |
| Idle Average * (dB) | 35 | 31 11% | 31 11% | 31 11% | 34 3% | 27.5 ? 21% |
| Idle Maximum * (dB) | 40 | 35 12% | 34 15% | 33 17% | 40 -0% | 30 ? 25% |
| Load Average * (dB) | 45 | 49 -9% | 43 4% | 49 -9% | 41 9% | 43.1 ? 4% |
| Witcher 3 ultra * (dB) | 50 | 51 -2% | 42 16% | 50 -0% | 43 14% | |
| Load Maximum * (dB) | 55 | 54 2% | 44 20% | 52 5% | 48 13% | 54 ? 2% |
* ... mindre är bättre
(-) Den maximala temperaturen på ovansidan är 50 °C / 122 F, jämfört med genomsnittet av 40.4 °C / 105 F , allt från 21.2 till 68.8 °C för klassen Gaming.
(-) Botten värms upp till maximalt 62 °C / 144 F, jämfört med genomsnittet av 43.2 °C / 110 F
(+) Vid tomgångsbruk är medeltemperaturen för ovansidan 25.2 °C / 77 F, jämfört med enhetsgenomsnittet på 33.9 °C / ### class_avg_f### F.
(-) När du spelar The Witcher 3 är medeltemperaturen för ovansidan 41.6 °C / 107 F, jämfört med enhetsgenomsnittet på 33.9 °C / ## #class_avg_f### F.
(-) Handledsstöden och pekplattan kan bli väldigt varma vid beröring med maximalt 42 °C / 107.6 F.
(-) Medeltemperaturen för handledsstödsområdet på liknande enheter var 28.8 °C / 83.8 F (-13.2 °C / -23.8 F).
| Aorus X5 v8 GeForce GTX 1070 Mobile, i7-8850H | Gigabyte Aero 15X v8 GeForce GTX 1070 Max-Q, i7-8750H | MSI GS65 8RF-019DE Stealth Thin GeForce GTX 1070 Max-Q, i7-8750H | Asus Zephyrus M GM501 GeForce GTX 1070 Mobile, i7-8750H | Acer Predator Triton 700 GeForce GTX 1080 Max-Q, i7-7700HQ | Genomsnitt av klass Gaming | |
|---|---|---|---|---|---|---|
| Heat | -3% | 6% | -1% | -13% | -0% | |
| Maximum Upper Side * (°C) | 50 | 53 -6% | 49 2% | 52 -4% | 61 -22% | 45.2 ? 10% |
| Maximum Bottom * (°C) | 62 | 65 -5% | 63 -2% | 49 21% | 69 -11% | 48.2 ? 22% |
| Idle Upper Side * (°C) | 27 | 26 4% | 24 11% | 31 -15% | 29 -7% | 31.1 ? -15% |
| Idle Bottom * (°C) | 29 | 30 -3% | 25 14% | 31 -7% | 32 -10% | 34.3 ? -18% |
* ... mindre är bättre
Aorus X5 v8 ljudanalys
(±) | högtalarljudstyrkan är genomsnittlig men bra (75 dB)
Bas 100 - 315 Hz
(±) | reducerad bas - i genomsnitt 12.8% lägre än medianen
(±) | linjäriteten för basen är genomsnittlig (10.6% delta till föregående frekvens)
Mellan 400 - 2000 Hz
(+) | balanserad mellan - endast 2% från medianen
(+) | mids är linjära (4.7% delta till föregående frekvens)
Högsta 2 - 16 kHz
(+) | balanserade toppar - endast 1.4% från medianen
(+) | toppar är linjära (4.1% delta till föregående frekvens)
Totalt 100 - 16 000 Hz
(+) | det totala ljudet är linjärt (13.8% skillnad mot median)
Jämfört med samma klass
» 21% av alla testade enheter i den här klassen var bättre, 7% liknande, 72% sämre
» Den bästa hade ett delta på 6%, genomsnittet var 18%, sämst var 132%
Jämfört med alla testade enheter
» 15% av alla testade enheter var bättre, 4% liknande, 81% sämre
» Den bästa hade ett delta på 4%, genomsnittet var 24%, sämst var 134%
Asus Zephyrus M GM501 ljudanalys
(+) | högtalare kan spela relativt högt (86 dB)
Bas 100 - 315 Hz
(+) | bra bas - bara 4.8% från medianen
(±) | linjäriteten för basen är genomsnittlig (8.3% delta till föregående frekvens)
Mellan 400 - 2000 Hz
(+) | balanserad mellan - endast 3.2% från medianen
(+) | mids är linjära (3.6% delta till föregående frekvens)
Högsta 2 - 16 kHz
(±) | högre toppar - i genomsnitt 5.8% högre än medianen
(+) | toppar är linjära (6.5% delta till föregående frekvens)
Totalt 100 - 16 000 Hz
(+) | det totala ljudet är linjärt (11.5% skillnad mot median)
Jämfört med samma klass
» 10% av alla testade enheter i den här klassen var bättre, 3% liknande, 87% sämre
» Den bästa hade ett delta på 6%, genomsnittet var 18%, sämst var 132%
Jämfört med alla testade enheter
» 8% av alla testade enheter var bättre, 2% liknande, 90% sämre
» Den bästa hade ett delta på 4%, genomsnittet var 24%, sämst var 134%
| Av/Standby | |
| Låg belastning | |
| Hög belastning |
|
Förklaring:
min: | |
| Aorus X5 v8 GeForce GTX 1070 Mobile, i7-8850H | Gigabyte Aero 15X v8 GeForce GTX 1070 Max-Q, i7-8750H | MSI GS65 8RF-019DE Stealth Thin GeForce GTX 1070 Max-Q, i7-8750H | Asus Zephyrus M GM501 GeForce GTX 1070 Mobile, i7-8750H | Acer Predator Triton 700 GeForce GTX 1080 Max-Q, i7-7700HQ | Genomsnitt av klass Gaming | |
|---|---|---|---|---|---|---|
| Power Consumption | 31% | 39% | 20% | -2% | 20% | |
| Idle Minimum * (Watt) | 25 | 14 44% | 7 72% | 16 36% | 28 -12% | 13.3 ? 47% |
| Idle Average * (Watt) | 31 | 18 42% | 11 65% | 19 39% | 33 -6% | 19 ? 39% |
| Idle Maximum * (Watt) | 33 | 22 33% | 20 39% | 26 21% | 41 -24% | 24.5 ? 26% |
| Load Average * (Watt) | 102 | 91 11% | 98 4% | 103 -1% | 94 8% | 108.1 ? -6% |
| Witcher 3 ultra * (Watt) | 194 | 142 27% | 132 32% | 164 15% | 160 18% | |
| Load Maximum * (Watt) | 239 | 173 28% | 182 24% | 223 7% | 222 7% | 254 ? -6% |
* ... mindre är bättre
| Aorus X5 v8 GeForce GTX 1070 Mobile, i7-8850H, 92.24 Wh | Gigabyte Aero 15X v8 GeForce GTX 1070 Max-Q, i7-8750H, 94.24 Wh | MSI GS65 8RF-019DE Stealth Thin GeForce GTX 1070 Max-Q, i7-8750H, 82 Wh | Asus Zephyrus M GM501 GeForce GTX 1070 Mobile, i7-8750H, 55 Wh | Acer Predator Triton 700 GeForce GTX 1080 Max-Q, i7-7700HQ, 54 Wh | Genomsnitt av klass Gaming | |
|---|---|---|---|---|---|---|
| Batteridrifttid | 122% | 43% | -21% | -40% | 68% | |
| Reader / Idle (h) | 4.9 | 12.7 159% | 8.5 73% | 4 -18% | 2.5 -49% | 8.71 ? 78% |
| H.264 (h) | 3.6 | 8.4 133% | 5.9 64% | 2.7 -25% | 1.8 -50% | 8.26 ? 129% |
| Load (h) | 1.5 | 2.6 73% | 1.4 -7% | 1.2 -20% | 1.2 -20% | 1.47 ? -2% |
| WiFi v1.3 (h) | 8.6 | 6 | 2.7 | 2.4 | 7.01 ? |
För
Emot
Läs den fullständiga versionen av den här recensionen på engelska här.
2018 års version av Aorus X5 v8 kan stå upp mot sina rivaler på dom flesta områden. Inte bara det ganska robusta metallhöljet utan även anslutbarheten, inmatningsenheterna och skärmen övertygade. IPS-panelen på 144 Hz är en perfekt kompromiss mellan hastighet och bildkvalitet (slagordet är X-Rite Pantone).
Till dom största nackdelarna hör hög temperaturutveckling och ljudnivå, men det är ett problem som många tunna spelenheter har. Sammantaget skulle vi placera X5 v8 på samma nivå som Asus GM501, som har väldigt lika prestandaresultat.
Den starkaste rivalen kommer dock från samma tillverkare som X5 v8. Klarar man sig utan G-Sync i 3D-applikationer och inte har något emot att tappa några FPS kan man vilja överväga att köpa Aero 15X istället. Syskonet på 15 tum är utrustad med ett lättare och kompaktare hölje och har mycket bättre batteritid, för att inte tala om ett lägre pris (25 000 kr mot 27 000 kronor).
Aorus X5 v8
- 05/15/2018 v6 (old)
Florian Glaser
Price comparison