Test: Razer Blade 15 Advanced Model (RTX 2070 Max-Q, FHD) Laptop (Sammanfattning)
| |||||||||||||||||||||||||
Distribution av ljusstyrkan: 90 %
Mitt på batteriet: 314.7 cd/m²
Kontrast: 828:1 (Svärta: 0.38 cd/m²)
ΔE ColorChecker Calman: 2.56 | ∀{0.5-29.43 Ø4.72}
calibrated: 1.71
ΔE Greyscale Calman: 3.4 | ∀{0.09-98 Ø4.97}
94.6% sRGB (Argyll 1.6.3 3D)
60.7% AdobeRGB 1998 (Argyll 1.6.3 3D)
66.3% AdobeRGB 1998 (Argyll 3D)
94.9% sRGB (Argyll 3D)
65.3% Display P3 (Argyll 3D)
Gamma: 2.3
CCT: 6435 K
| Razer Blade 15 RTX 2070 Max-Q LG Philips LGD05C0, IPS, 15.6", 1920x1080 | Alienware m15 GTX 1070 Max-Q AU Optronics B156HAN, IPS, 15.6", 1920x1080 | Razer Blade 15 2018 LGD05C0, IPS, 15.6", 1920x1080 | Apple MacBook Pro 15 2018 (2.6 GHz, 560X) APPA040, IPS, 15.4", 2880x1800 | MSI GS65 Stealth Thin 8RE-051US AUO80ED, IPS, 15.6", 1920x1080 | Gigabyte Aero 15X v8 LGD05C0, IPS, 15.6", 1920x1080 | |
|---|---|---|---|---|---|---|
| Display | -4% | -1% | 29% | -0% | -2% | |
| Display P3 Coverage (%) | 65.3 | 63.5 -3% | 64.3 -2% | 98.7 51% | 65.8 1% | 63.6 -3% |
| sRGB Coverage (%) | 94.9 | 89.4 -6% | 93.7 -1% | 99.9 5% | 92.1 -3% | 93.8 -1% |
| AdobeRGB 1998 Coverage (%) | 66.3 | 64.5 -3% | 65.5 -1% | 86.6 31% | 67 1% | 64.9 -2% |
| Response Times | -5% | -3% | -163% | -11% | 2% | |
| Response Time Grey 50% / Grey 80% * (ms) | 16.8 ? | 18 ? -7% | 17.2 ? -2% | 43.2 ? -157% | 20 ? -19% | 16.8 ? -0% |
| Response Time Black / White * (ms) | 11.6 ? | 12 ? -3% | 12 ? -3% | 31.2 ? -169% | 12 ? -3% | 11.2 ? 3% |
| PWM Frequency (Hz) | 117000 ? | |||||
| Screen | -17% | 2% | 43% | -12% | 20% | |
| Brightness middle (cd/m²) | 314.7 | 353.6 12% | 290 -8% | 520 65% | 250.9 -20% | 313 -1% |
| Brightness (cd/m²) | 312 | 346 11% | 281 -10% | 492 58% | 257 -18% | 300 -4% |
| Brightness Distribution (%) | 90 | 86 -4% | 82 -9% | 88 -2% | 83 -8% | 78 -13% |
| Black Level * (cd/m²) | 0.38 | 0.3 21% | 0.3 21% | 0.39 -3% | 0.32 16% | 0.33 13% |
| Contrast (:1) | 828 | 1179 42% | 967 17% | 1333 61% | 784 -5% | 948 14% |
| Colorchecker dE 2000 * | 2.56 | 4.55 -78% | 2.85 -11% | 1.2 53% | 2.77 -8% | 1.29 50% |
| Colorchecker dE 2000 max. * | 4.89 | 7.91 -62% | 6.27 -28% | 2.3 53% | 5.89 -20% | 2.04 58% |
| Colorchecker dE 2000 calibrated * | 1.71 | 3.37 -97% | 1.39 19% | 2.5 -46% | ||
| Greyscale dE 2000 * | 3.4 | 4.1 -21% | 2.4 29% | 1.3 62% | 4 -18% | 0.69 80% |
| Gamma | 2.3 96% | 2.27 97% | 2.34 94% | 2.18 101% | 2.27 97% | 2.43 91% |
| CCT | 6435 101% | 7434 87% | 6718 97% | 6738 96% | 6901 94% | 6550 99% |
| Color Space (Percent of AdobeRGB 1998) (%) | 60.7 | 57.9 -5% | 60 -1% | 60 -1% | 60 -1% | |
| Color Space (Percent of sRGB) (%) | 94.6 | 88.9 -6% | 94 -1% | 92 -3% | 94 -1% | |
| Totalt genomsnitt (program/inställningar) | -9% /
-13% | -1% /
1% | -30% /
8% | -8% /
-10% | 7% /
13% |
* ... mindre är bättre
Visa svarstider
| ↔ Svarstid svart till vitt | ||
|---|---|---|
| 11.6 ms ... stiga ↗ och falla ↘ kombinerat | ↗ 7.2 ms stiga | 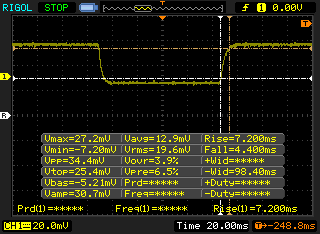 |
| ↘ 4.4 ms hösten | ||
| Skärmen visar bra svarsfrekvens i våra tester, men kan vara för långsam för konkurrenskraftiga spelare. I jämförelse sträcker sig alla testade enheter från 0.1 (minst) till 240 (maximalt) ms. » 31 % av alla enheter är bättre. Det betyder att den uppmätta svarstiden är bättre än genomsnittet av alla testade enheter (19.8 ms). | ||
| ↔ Svarstid 50 % grått till 80 % grått | ||
| 16.8 ms ... stiga ↗ och falla ↘ kombinerat | ↗ 9.2 ms stiga | 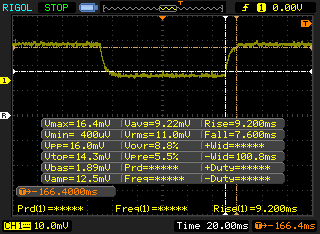 |
| ↘ 7.6 ms hösten | ||
| Skärmen visar bra svarsfrekvens i våra tester, men kan vara för långsam för konkurrenskraftiga spelare. I jämförelse sträcker sig alla testade enheter från 0.165 (minst) till 636 (maximalt) ms. » 31 % av alla enheter är bättre. Det betyder att den uppmätta svarstiden är bättre än genomsnittet av alla testade enheter (31 ms). | ||
Skärmflimmer / PWM (Puls-Width Modulation)
| Skärmflimmer / PWM upptäcktes inte | 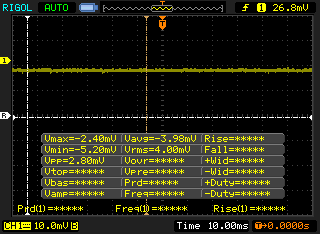 | ||
Som jämförelse: 52 % av alla testade enheter använder inte PWM för att dämpa skärmen. Om PWM upptäcktes mättes ett medelvärde av 7769 (minst: 5 - maximum: 343500) Hz. | |||
| Cinebench R11.5 | |
| CPU Single 64Bit | |
| no name | |
| Genomsnitt Intel Core i7-8750H (1.89 - 2, n=40) | |
| Razer Blade Pro RZ09-0220 | |
| Asus GL702ZC-GC104T | |
| CPU Multi 64Bit | |
| Asus GL702ZC-GC104T | |
| no name | |
| Genomsnitt Intel Core i7-8750H (9.54 - 13.5, n=41) | |
| Razer Blade Pro RZ09-0220 | |
| Cinebench R10 | |
| Rendering Multiple CPUs 32Bit | |
| no name | |
| Genomsnitt Intel Core i7-8750H (29664 - 35307, n=25) | |
| Asus GL702ZC-GC104T | |
| Razer Blade Pro RZ09-0220 | |
| Rendering Single 32Bit | |
| no name | |
| Genomsnitt Intel Core i7-8750H (6236 - 6645, n=25) | |
| Razer Blade Pro RZ09-0220 | |
| Asus GL702ZC-GC104T | |
| wPrime 2.10 - 1024m | |
| Razer Blade Pro RZ09-0220 | |
| Genomsnitt Intel Core i7-8750H (125.5 - 180.5, n=6) | |
| no name | |
* ... mindre är bättre
| PCMark 8 Home Score Accelerated v2 | 4150 poäng | |
| PCMark 8 Work Score Accelerated v2 | 5607 poäng | |
| PCMark 10 Score | 5416 poäng | |
Hjälp | ||
| Razer Blade 15 RTX 2070 Max-Q Samsung SSD PM981 MZVLB512HAJQ | Razer Blade 15 2018 Samsung PM961 NVMe MZVLW512HMJP | Apple MacBook Pro 15 2018 (2.6 GHz, 560X) Apple SSD AP0512 | Dell XPS 15 9570 Core i9 UHD Samsung SSD PM981 MZVLB1T0HALR | Alienware m15 GTX 1070 Max-Q Toshiba XG5 KXG50ZNV512G | |
|---|---|---|---|---|---|
| AS SSD | -7% | -78% | -6% | -45% | |
| Seq Read (MB/s) | 1840 | 2376 29% | 2239 22% | 1320 -28% | 1967 7% |
| Seq Write (MB/s) | 1822 | 1521 -17% | 1644 -10% | 1500 -18% | 1135 -38% |
| 4K Read (MB/s) | 52.3 | 46.45 -11% | 9.46 -82% | 30.73 -41% | 29.17 -44% |
| 4K Write (MB/s) | 110.7 | 93.6 -15% | 18.78 -83% | 94.4 -15% | 93.4 -16% |
| 4K-64 Read (MB/s) | 1126 | 1300 15% | 965 -14% | 1453 29% | 995 -12% |
| 4K-64 Write (MB/s) | 1717 | 1204 -30% | 163.5 -90% | 1815 6% | 656 -62% |
| Access Time Read * (ms) | 0.047 | 0.051 -9% | 0.225 -379% | 0.061 -30% | 0.116 -147% |
| Access Time Write * (ms) | 0.033 | 0.038 -15% | 0.044 -33% | 0.063 -91% | |
| Score Read (Points) | 1362 | 1584 16% | 1199 -12% | 1616 19% | 1221 -10% |
| Score Write (Points) | 2010 | 1450 -28% | 347 -83% | 2059 2% | 862 -57% |
| Score Total (Points) | 4079 | 3806 -7% | 2119 -48% | 4507 10% | 2667 -35% |
| Copy ISO MB/s (MB/s) | 1975 | 2577 30% | 642 -67% | ||
| Copy Program MB/s (MB/s) | 526 | 515 -2% | 431.5 -18% | ||
| Copy Game MB/s (MB/s) | 1200 | 1120 -7% | 706 -41% |
* ... mindre är bättre

| 3DMark | |
| 1280x720 Cloud Gate Standard Graphics | |
| Asus ROG Strix RTX 2070 OC | |
| Acer Triton 500 | |
| Asus Zephyrus GX501 | |
| Asus ROG G703GX | |
| Razer Blade Pro 2017 | |
| Razer Blade 15 RTX 2070 Max-Q | |
| Schenker XMG Ultra 15 | |
| Razer Blade 15 2018 | |
| Genomsnitt NVIDIA GeForce RTX 2070 Max-Q (39014 - 134255, n=28) | |
| Razer Blade 15 Base Model | |
| Lenovo Legion Y730-15ICH i5-8300H | |
| Razer Blade (2017) UHD | |
| Dell XPS 15 9570 Core i9 UHD | |
| MSI GF63 8RC-040XPL | |
| 1920x1080 Fire Strike Graphics | |
| Asus ROG G703GX | |
| Asus ROG Strix RTX 2070 OC | |
| Acer Triton 500 | |
| Razer Blade Pro 2017 | |
| Asus Zephyrus GX501 | |
| Razer Blade 15 RTX 2070 Max-Q | |
| Genomsnitt NVIDIA GeForce RTX 2070 Max-Q (11563 - 21191, n=31) | |
| Razer Blade 15 2018 | |
| Schenker XMG Ultra 15 | |
| Razer Blade 15 Base Model | |
| Razer Blade (2017) UHD | |
| Lenovo Legion Y730-15ICH i5-8300H | |
| Dell XPS 15 9570 Core i9 UHD | |
| MSI GF63 8RC-040XPL | |
| 2560x1440 Port Royal Graphics | |
| Asus ROG G703GX | |
| Acer Triton 500 | |
| Genomsnitt NVIDIA GeForce RTX 2070 Max-Q (3240 - 4742, n=23) | |
| Razer Blade 15 RTX 2070 Max-Q | |
| Schenker XMG Ultra 15 | |
| 3DMark 11 Performance | 17689 poäng | |
| 3DMark Cloud Gate Standard Score | 29109 poäng | |
| 3DMark Fire Strike Score | 15428 poäng | |
| 3DMark Fire Strike Extreme Score | 8041 poäng | |
| 3DMark Time Spy Score | 6367 poäng | |
Hjälp | ||
| The Witcher 3 - 1920x1080 Ultra Graphics & Postprocessing (HBAO+) | |
| Asus ROG G703GX | |
| Asus ROG Strix RTX 2070 OC | |
| Acer Triton 500 | |
| MSI GS75 8SG Stealth | |
| Razer Blade 15 RTX 2070 Max-Q | |
| Razer Blade Pro 2017 | |
| Asus Zephyrus GX501 | |
| Alienware 17 R5 | |
| Schenker XMG Ultra 15 | |
| Razer Blade 15 2018 | |
| Razer Blade 15 Base Model | |
| Razer Blade Pro RZ09-0220 | |
| Asus GL702ZC-GC104T | |
| Lenovo Legion Y730-15ICH i5-8300H | |
| Lenovo ThinkPad X1 Extreme-20MF000RGE | |
| Apple MacBook Pro 15 2018 (2.6 GHz, 560X) | |
| Rise of the Tomb Raider - 1920x1080 Very High Preset AA:FX AF:16x | |
| Asus ROG Strix RTX 2070 OC | |
| Asus Zephyrus GX501 | |
| Razer Blade 15 RTX 2070 Max-Q | |
| Razer Blade 15 Base Model | |
| Razer Blade Pro RZ09-0220 | |
| Asus GL702ZC-GC104T | |
| Lenovo Legion Y730-15ICH i5-8300H | |
| Apple MacBook Pro 15 2018 (2.6 GHz, 560X) | |
| låg | med. | hög | ultra | |
|---|---|---|---|---|
| BioShock Infinite (2013) | 290.8 | 260.1 | 246.1 | 152.5 |
| The Witcher 3 (2015) | 252.5 | 208.9 | 130.1 | 68.9 |
| Rise of the Tomb Raider (2016) | 204.2 | 157.8 | 121.9 | 103.9 |
| Razer Blade 15 RTX 2070 Max-Q GeForce RTX 2070 Max-Q, i7-8750H, Samsung SSD PM981 MZVLB512HAJQ | Razer Blade 15 2018 GeForce GTX 1070 Max-Q, i7-8750H, Samsung PM961 NVMe MZVLW512HMJP | Alienware m15 GTX 1070 Max-Q GeForce GTX 1070 Max-Q, i7-8750H, Toshiba XG5 KXG50ZNV512G | Dell XPS 15 9570 Core i9 UHD GeForce GTX 1050 Ti Max-Q, i9-8950HK, Samsung SSD PM981 MZVLB1T0HALR | Gigabyte Aero 15X v8 GeForce GTX 1070 Max-Q, i7-8750H, Toshiba NVMe THNSN5512GPU7 | MSI GS65 Stealth Thin 8RE-051US GeForce GTX 1060 Mobile, i7-8750H, Samsung SSD PM981 MZVLB256HAHQ | |
|---|---|---|---|---|---|---|
| Noise | -12% | -5% | -2% | -16% | -4% | |
| av / miljö * (dB) | 28.8 | 29 -1% | 28.6 1% | 28.2 2% | 29 -1% | 28.4 1% |
| Idle Minimum * (dB) | 28.8 | 29 -1% | 28.6 1% | 28.5 1% | 30 -4% | 28.4 1% |
| Idle Average * (dB) | 28.8 | 30 -4% | 28.6 1% | 28.6 1% | 31 -8% | 28.4 1% |
| Idle Maximum * (dB) | 29.4 | 38 -29% | 28.6 3% | 28.8 2% | 35 -19% | 29.6 -1% |
| Load Average * (dB) | 35.7 | 46 -29% | 40.8 -14% | 36.2 -1% | 49 -37% | 43.5 -22% |
| Witcher 3 ultra * (dB) | 42.5 | 49 -15% | 49.6 -17% | 47.6 -12% | 51 -20% | 45.7 -8% |
| Load Maximum * (dB) | 45 | 46 -2% | 49.6 -10% | 47.6 -6% | 54 -20% | 45.7 -2% |
* ... mindre är bättre
Ljudnivå
| Låg belastning |
| 28.8 / 28.8 / 29.4 dB(A) |
| Hög belastning |
| 35.7 / 45 dB(A) |
 | ||
30 dB tyst 40 dB(A) hörbar 50 dB(A) högt ljud |
||
min: | ||
(-) Den maximala temperaturen på ovansidan är 49 °C / 120 F, jämfört med genomsnittet av 40.4 °C / 105 F , allt från 21.2 till 68.8 °C för klassen Gaming.
(-) Botten värms upp till maximalt 49 °C / 120 F, jämfört med genomsnittet av 43.2 °C / 110 F
(+) Vid tomgångsbruk är medeltemperaturen för ovansidan 24.9 °C / 77 F, jämfört med enhetsgenomsnittet på 33.9 °C / ### class_avg_f### F.
(±) När du spelar The Witcher 3 är medeltemperaturen för ovansidan 35.8 °C / 96 F, jämfört med enhetsgenomsnittet på 33.9 °C / ## #class_avg_f### F.
(+) Handledsstöden och pekplattan når maximal hudtemperatur (34.2 °C / 93.6 F) och är därför inte varma.
(-) Medeltemperaturen för handledsstödsområdet på liknande enheter var 28.8 °C / 83.8 F (-5.4 °C / -9.8 F).
Razer Blade 15 RTX 2070 Max-Q ljudanalys
(-) | inte särskilt höga högtalare (71.6 dB)
Bas 100 - 315 Hz
(±) | reducerad bas - i genomsnitt 7.7% lägre än medianen
(±) | linjäriteten för basen är genomsnittlig (11.1% delta till föregående frekvens)
Mellan 400 - 2000 Hz
(±) | högre mellan - i genomsnitt 7.8% högre än median
(±) | linjäriteten för mids är genomsnittlig (9.5% delta till föregående frekvens)
Högsta 2 - 16 kHz
(+) | balanserade toppar - endast 3% från medianen
(±) | linjäriteten för toppar är genomsnittlig (7.2% delta till föregående frekvens)
Totalt 100 - 16 000 Hz
(±) | linjäriteten för det totala ljudet är genomsnittlig (23.9% skillnad mot median)
Jämfört med samma klass
» 86% av alla testade enheter i den här klassen var bättre, 5% liknande, 9% sämre
» Den bästa hade ett delta på 6%, genomsnittet var 18%, sämst var 132%
Jämfört med alla testade enheter
» 72% av alla testade enheter var bättre, 6% liknande, 22% sämre
» Den bästa hade ett delta på 4%, genomsnittet var 24%, sämst var 134%
Apple MacBook 12 (Early 2016) 1.1 GHz ljudanalys
(+) | högtalare kan spela relativt högt (83.6 dB)
Bas 100 - 315 Hz
(±) | reducerad bas - i genomsnitt 11.3% lägre än medianen
(±) | linjäriteten för basen är genomsnittlig (14.2% delta till föregående frekvens)
Mellan 400 - 2000 Hz
(+) | balanserad mellan - endast 2.4% från medianen
(+) | mids är linjära (5.5% delta till föregående frekvens)
Högsta 2 - 16 kHz
(+) | balanserade toppar - endast 2% från medianen
(+) | toppar är linjära (4.5% delta till föregående frekvens)
Totalt 100 - 16 000 Hz
(+) | det totala ljudet är linjärt (10.2% skillnad mot median)
Jämfört med samma klass
» 7% av alla testade enheter i den här klassen var bättre, 2% liknande, 91% sämre
» Den bästa hade ett delta på 5%, genomsnittet var 18%, sämst var 53%
Jämfört med alla testade enheter
» 5% av alla testade enheter var bättre, 1% liknande, 94% sämre
» Den bästa hade ett delta på 4%, genomsnittet var 24%, sämst var 134%
| Av/Standby | |
| Låg belastning | |
| Hög belastning |
|
Förklaring:
min: | |
| Razer Blade 15 RTX 2070 Max-Q i7-8750H, GeForce RTX 2070 Max-Q, Samsung SSD PM981 MZVLB512HAJQ, IPS, 1920x1080, 15.6" | Razer Blade 15 2018 i7-8750H, GeForce GTX 1070 Max-Q, Samsung PM961 NVMe MZVLW512HMJP, IPS, 1920x1080, 15.6" | Apple MacBook Pro 15 2018 (2.6 GHz, 560X) i7-8850H, Radeon Pro 560X, Apple SSD AP0512, IPS, 2880x1800, 15.4" | MSI GS65 Stealth Thin 8RE-051US i7-8750H, GeForce GTX 1060 Mobile, Samsung SSD PM981 MZVLB256HAHQ, IPS, 1920x1080, 15.6" | Gigabyte Aero 15X v8 i7-8750H, GeForce GTX 1070 Max-Q, Toshiba NVMe THNSN5512GPU7, IPS, 1920x1080, 15.6" | Alienware m15 GTX 1070 Max-Q i7-8750H, GeForce GTX 1070 Max-Q, Toshiba XG5 KXG50ZNV512G, IPS, 1920x1080, 15.6" | |
|---|---|---|---|---|---|---|
| Power Consumption | -13% | 32% | 9% | -14% | 7% | |
| Idle Minimum * (Watt) | 10.4 | 14 -35% | 3.4 67% | 8.7 16% | 14 -35% | 7.6 27% |
| Idle Average * (Watt) | 14.6 | 17 -16% | 11 25% | 13 11% | 18 -23% | 13.8 5% |
| Idle Maximum * (Watt) | 16.3 | 21 -29% | 14.9 9% | 14.3 12% | 22 -35% | 14.6 10% |
| Load Average * (Watt) | 88.5 | 95 -7% | 78.9 11% | 107.4 -21% | 91 -3% | 97.6 -10% |
| Witcher 3 ultra * (Watt) | 155.4 | 141 9% | 129 17% | 142 9% | 145.8 6% | |
| Load Maximum * (Watt) | 182.4 | 179 2% | 91.2 50% | 151.5 17% | 173 5% | 172.5 5% |
* ... mindre är bättre
| Razer Blade 15 RTX 2070 Max-Q i7-8750H, GeForce RTX 2070 Max-Q, 80 Wh | Razer Blade 15 2018 i7-8750H, GeForce GTX 1070 Max-Q, 80 Wh | Apple MacBook Pro 15 2018 (2.6 GHz, 560X) i7-8850H, Radeon Pro 560X, 83 Wh | MSI GS65 Stealth Thin 8RE-051US i7-8750H, GeForce GTX 1060 Mobile, 82 Wh | Alienware m15 GTX 1070 Max-Q i7-8750H, GeForce GTX 1070 Max-Q, 90 Wh | Gigabyte Aero 15X v8 i7-8750H, GeForce GTX 1070 Max-Q, 94.24 Wh | |
|---|---|---|---|---|---|---|
| Batteridrifttid | -27% | 57% | -13% | 8% | 39% | |
| Reader / Idle (h) | 11.4 | 6.4 -44% | 10.5 -8% | 12.7 11% | ||
| WiFi v1.3 (h) | 6.5 | 5.4 -17% | 10.2 57% | 6.2 -5% | 7.7 18% | 8.6 32% |
| Load (h) | 1.5 | 1.2 -20% | 1.2 -20% | 1.7 13% | 2.6 73% | |
| Witcher 3 ultra (h) | 1.5 |
För
Emot
Läs den fullständiga versionen av den här recensionen på engelska här.
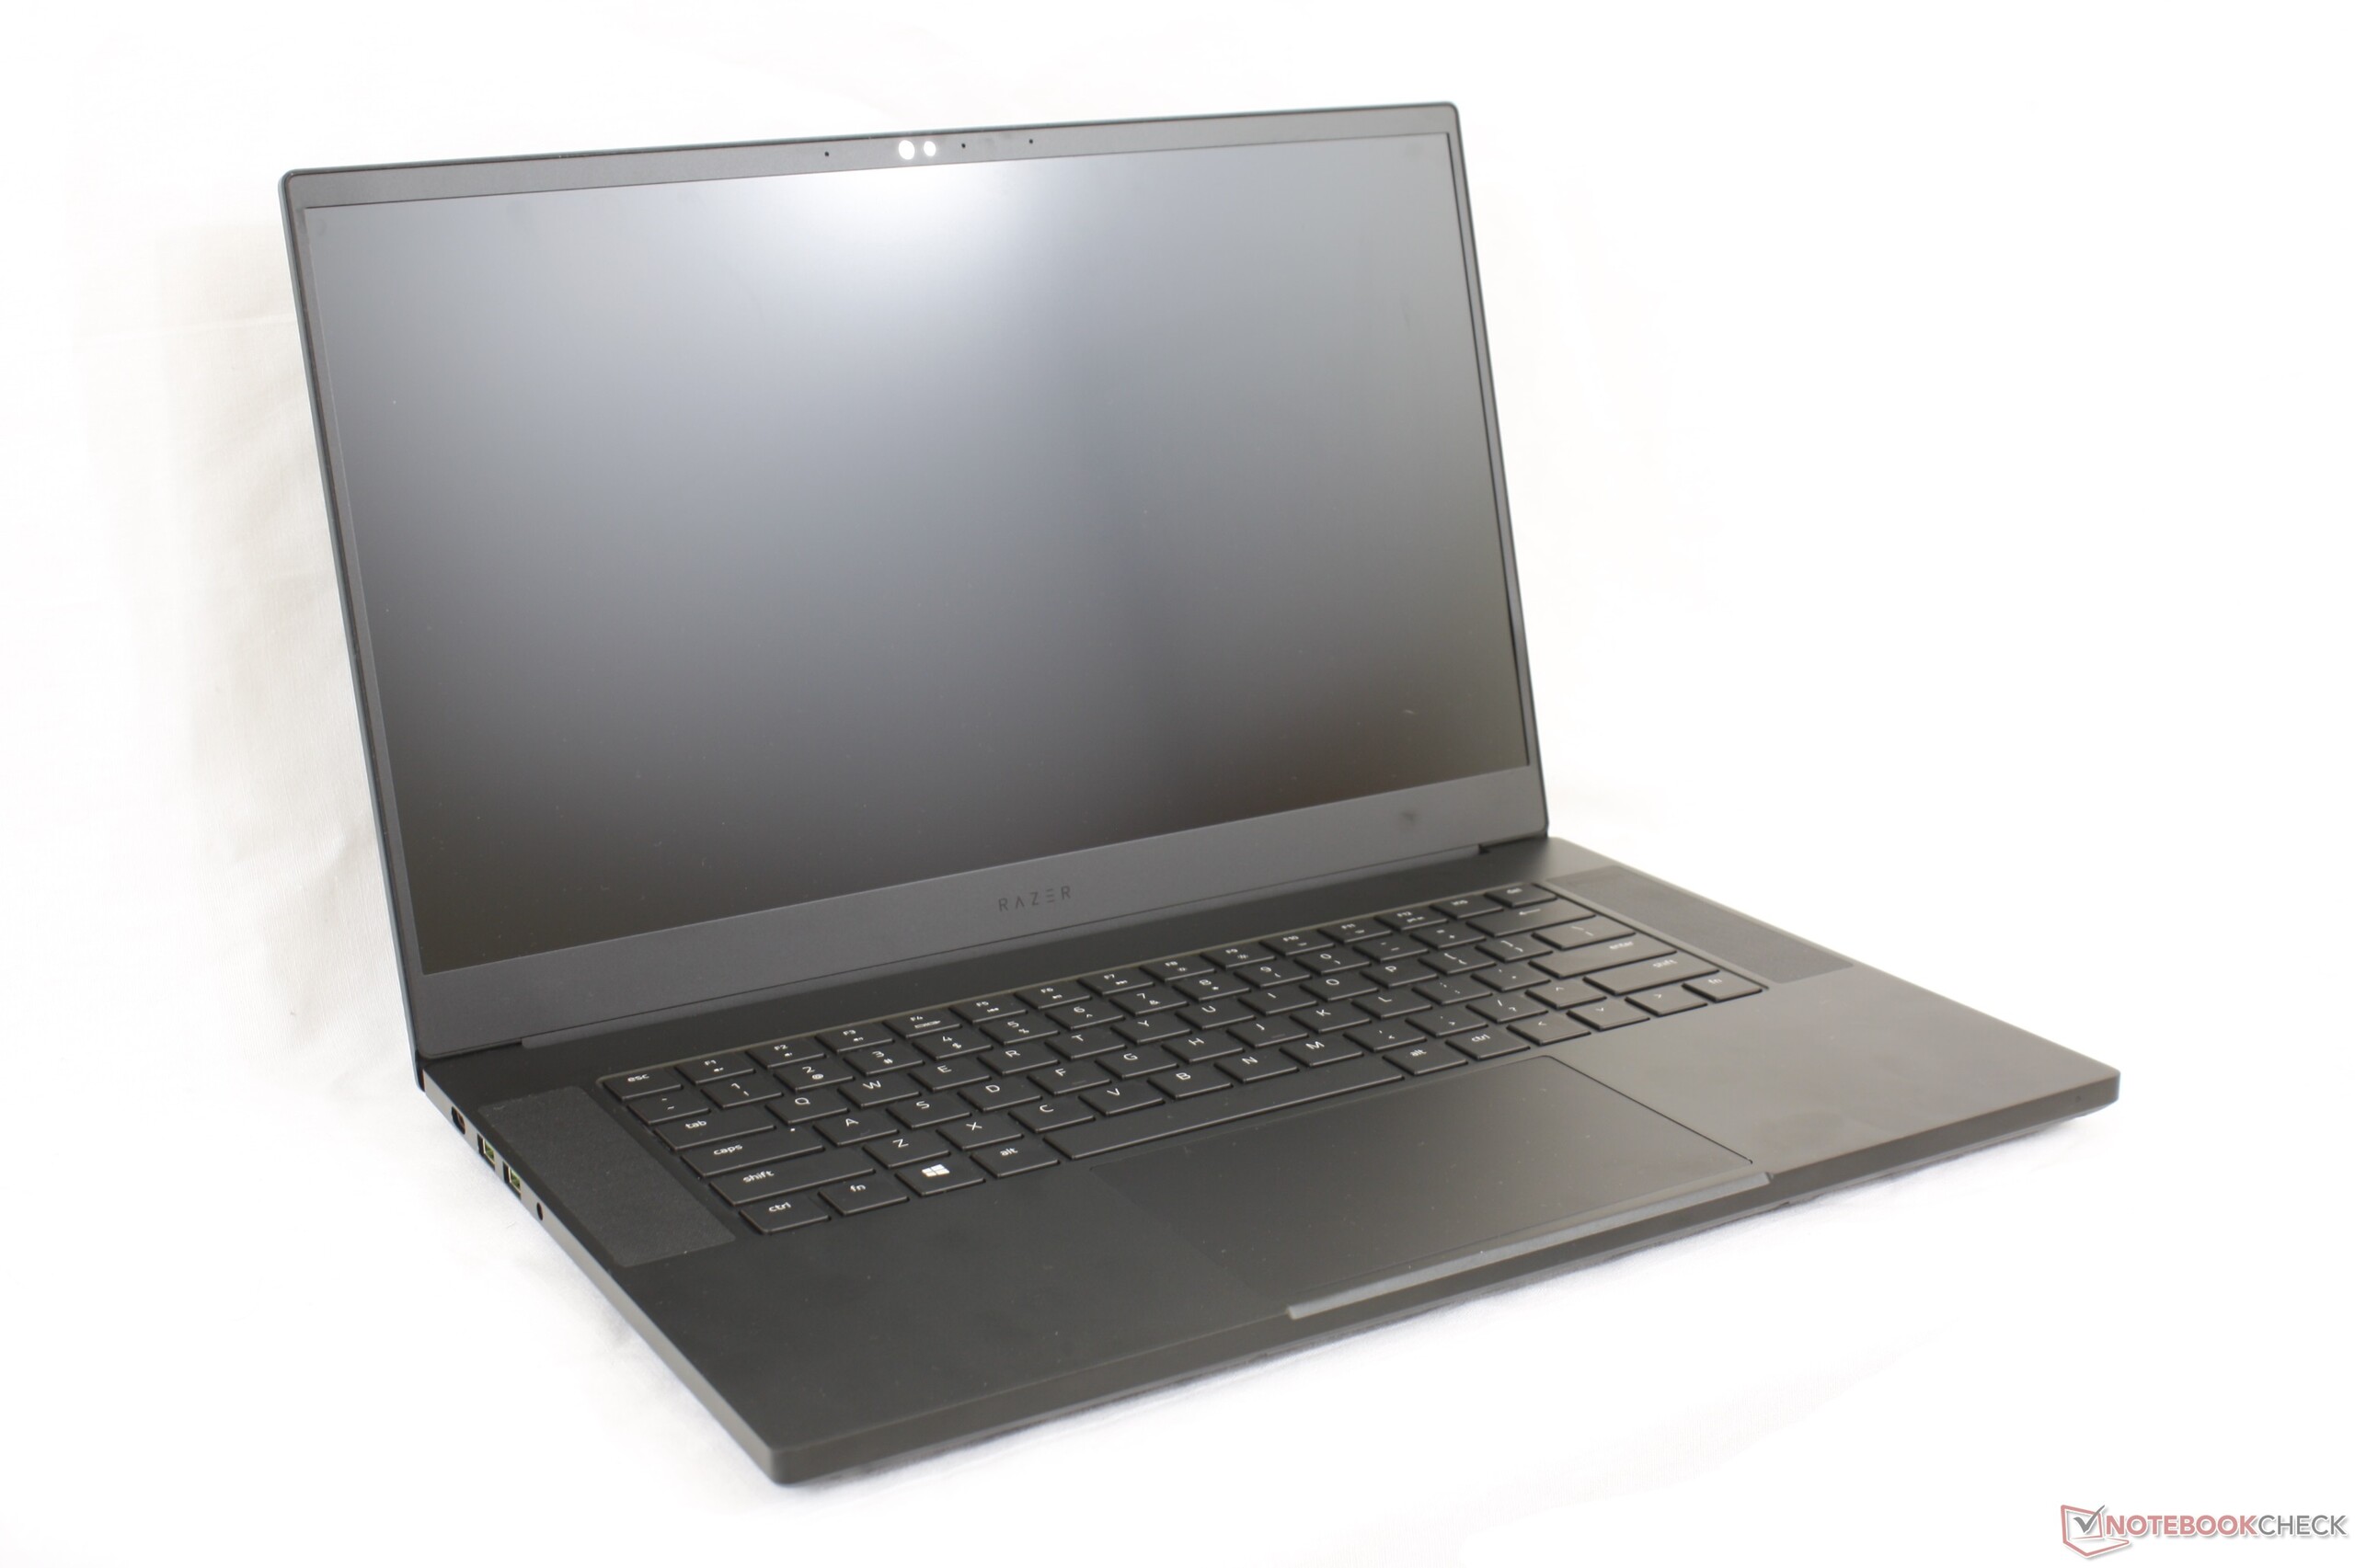
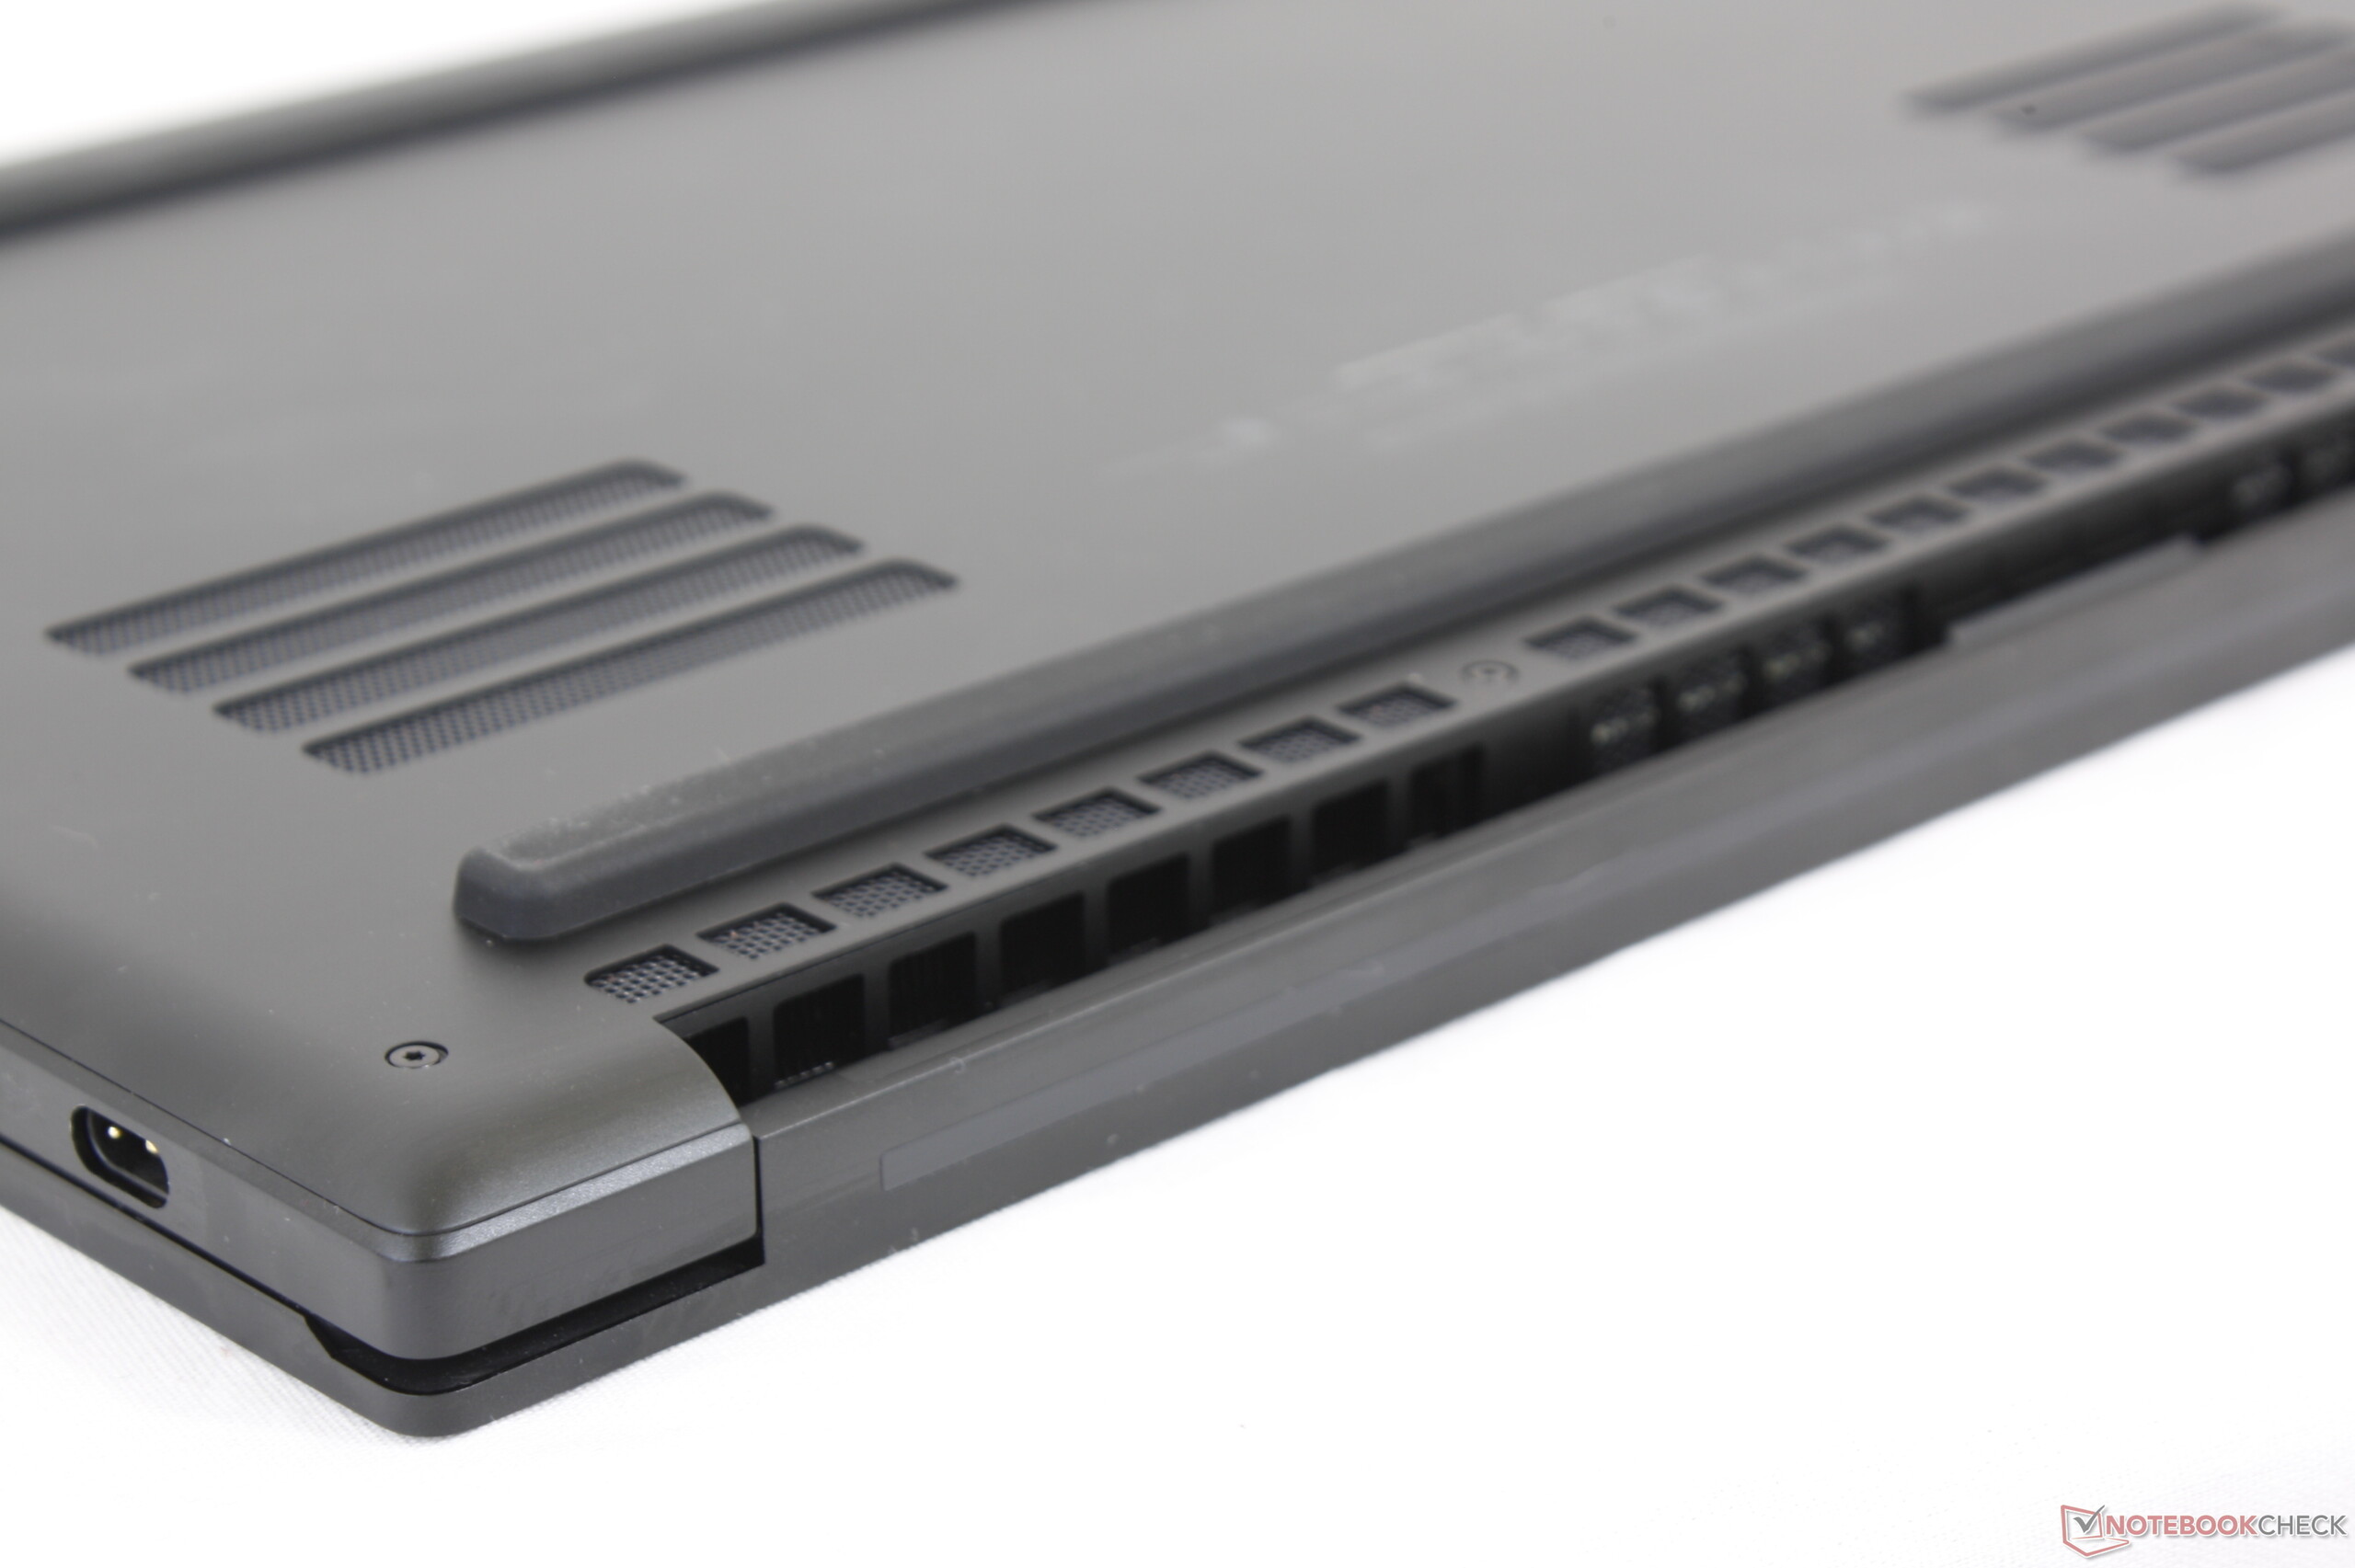
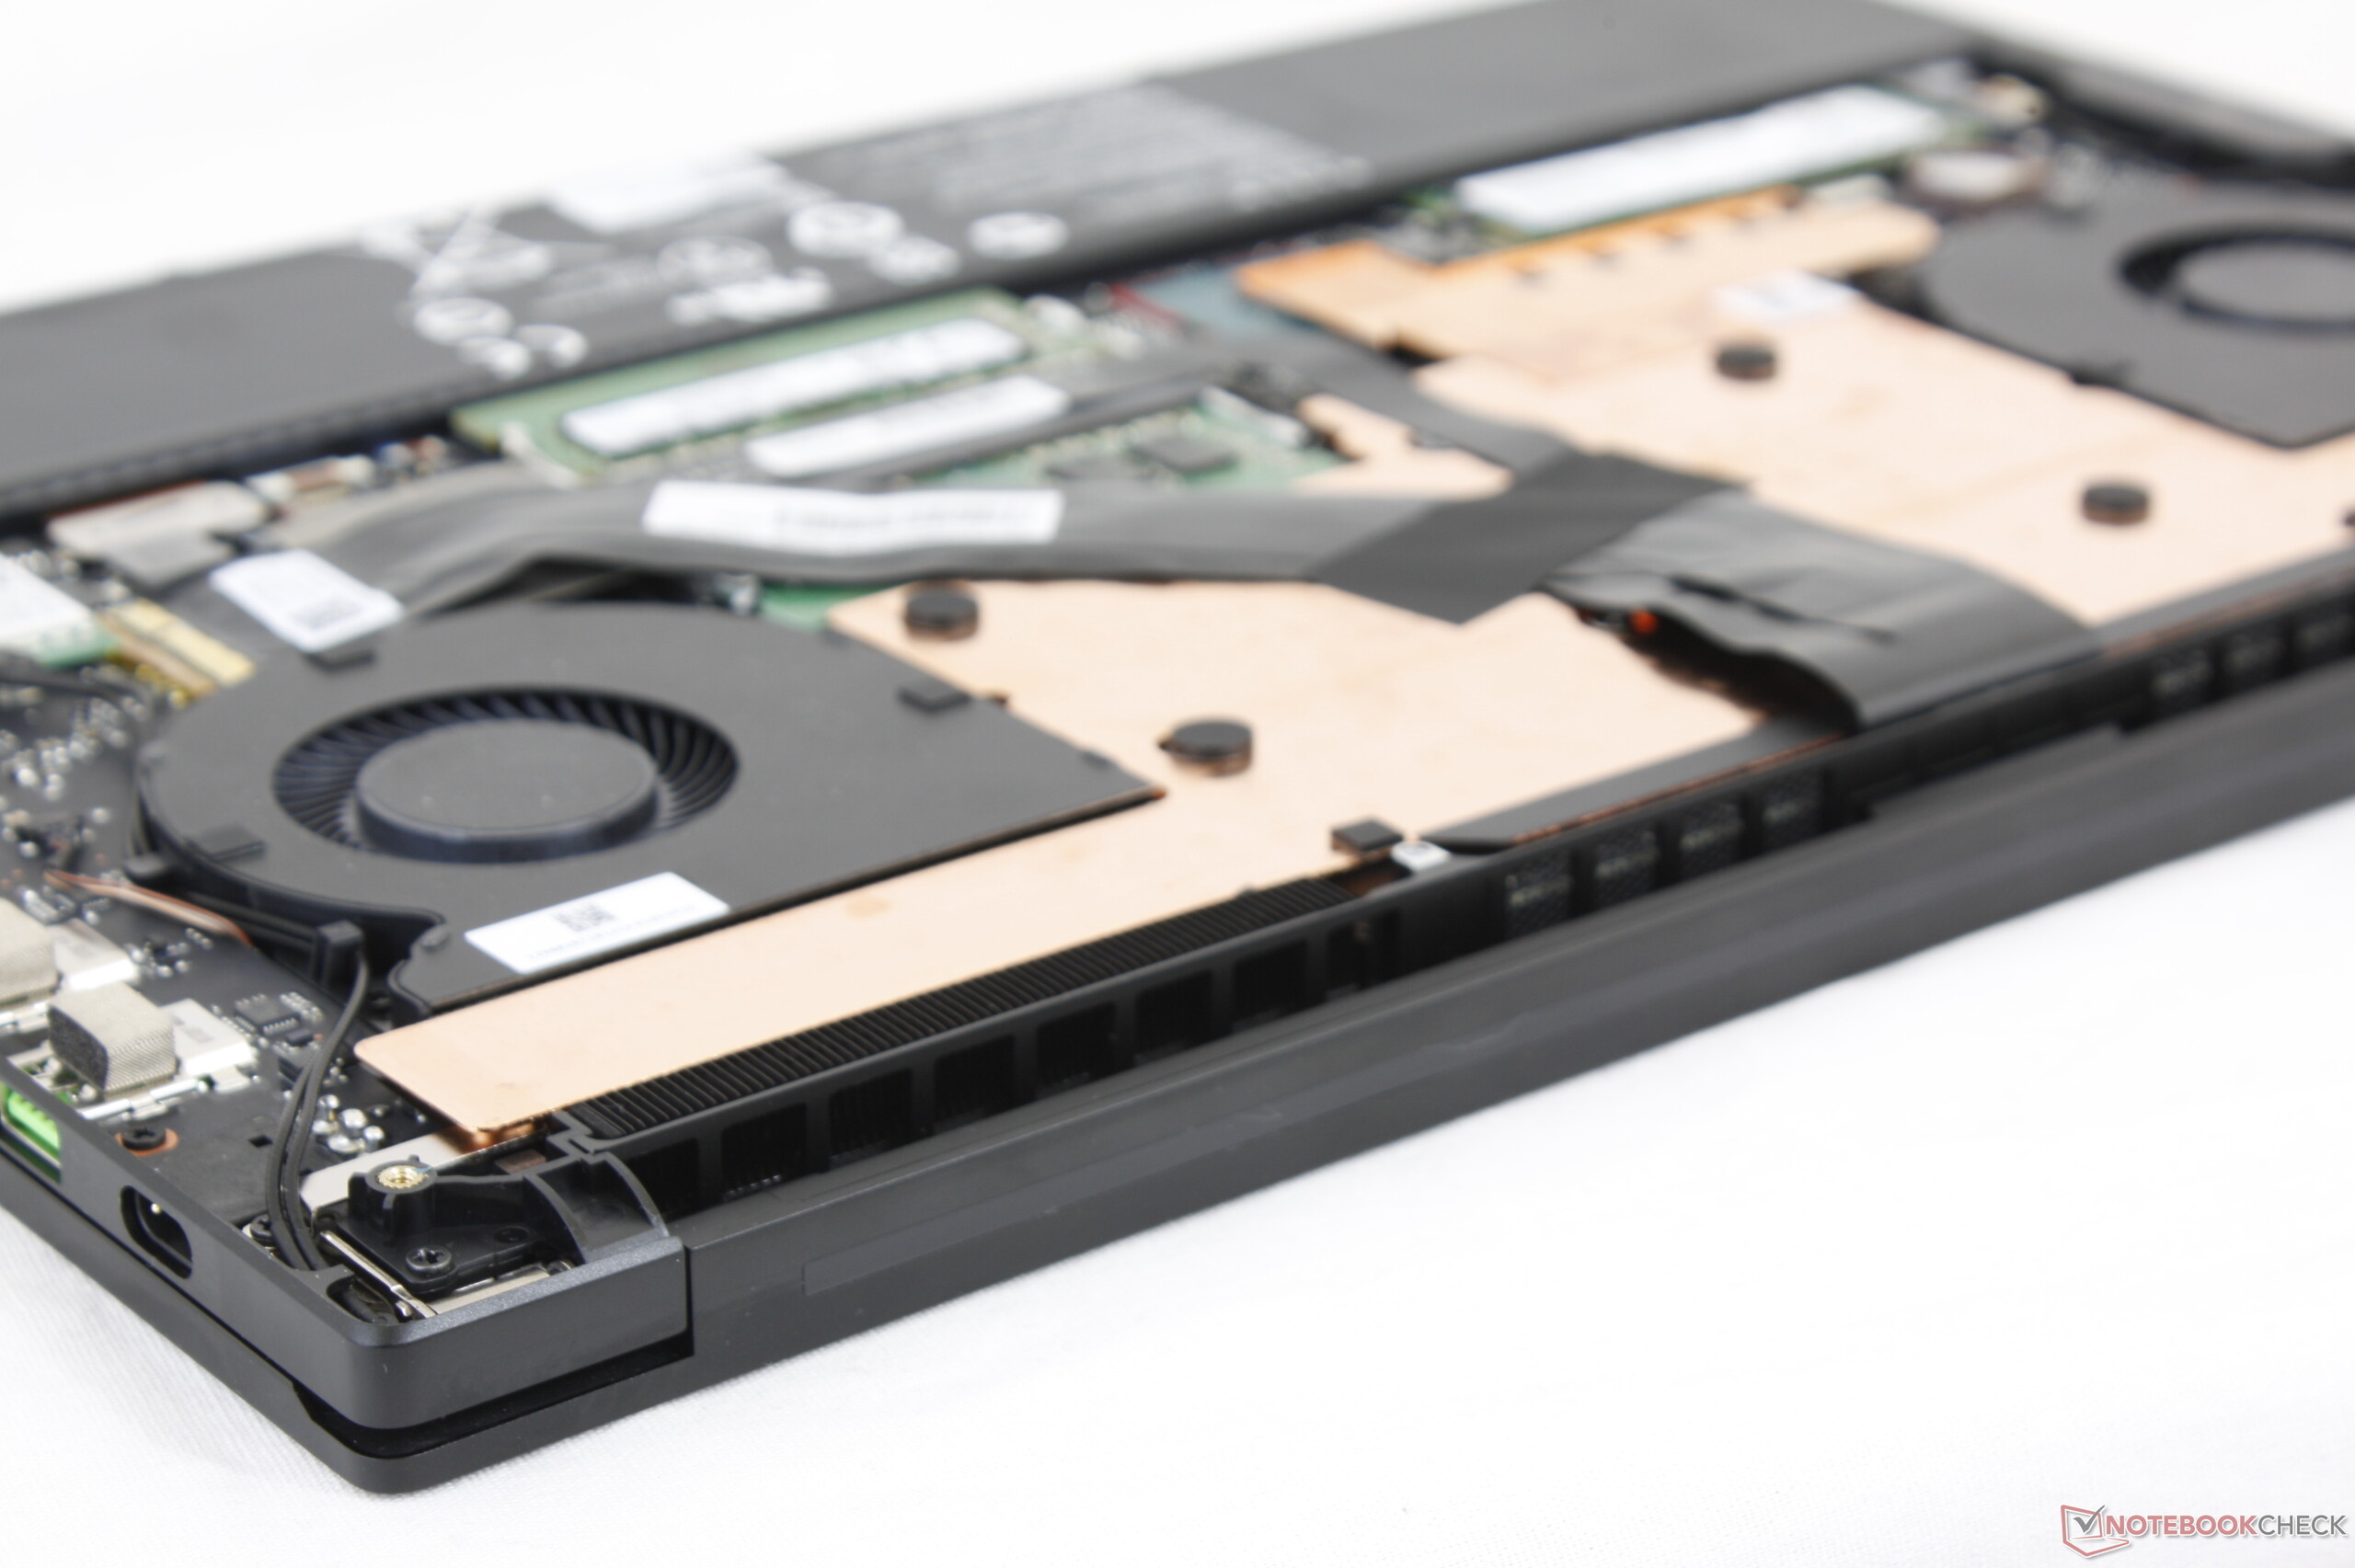
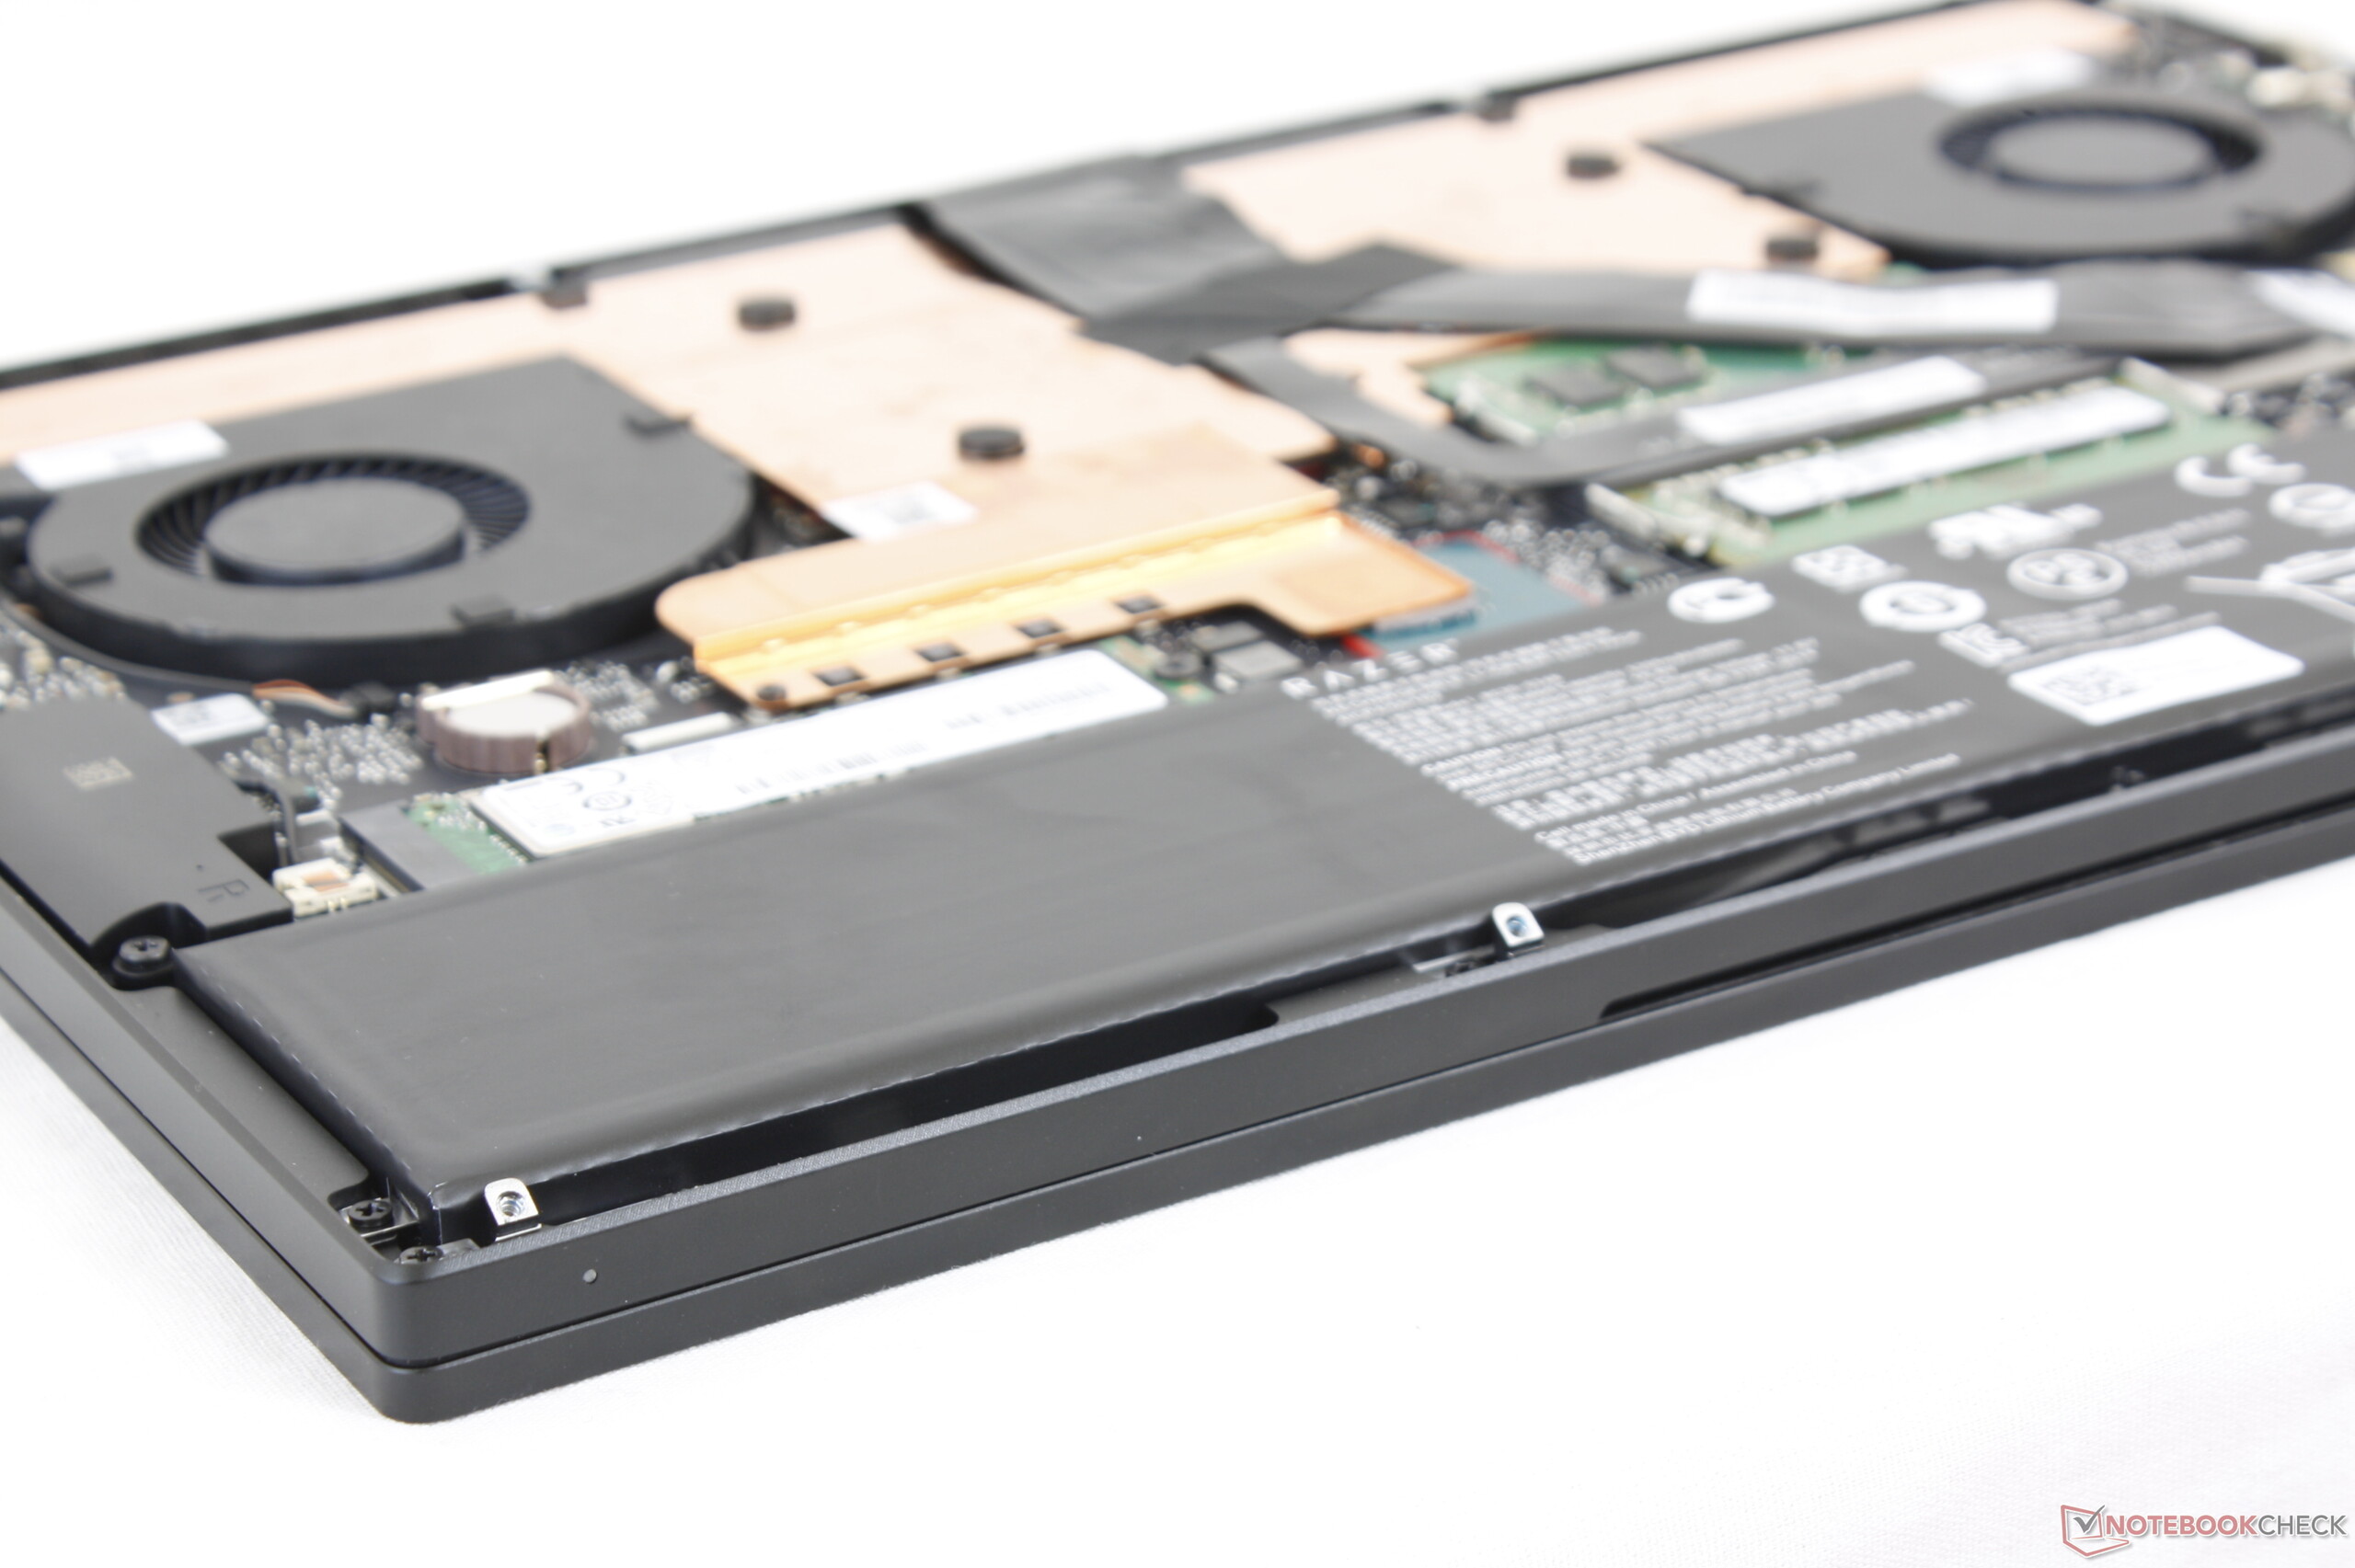
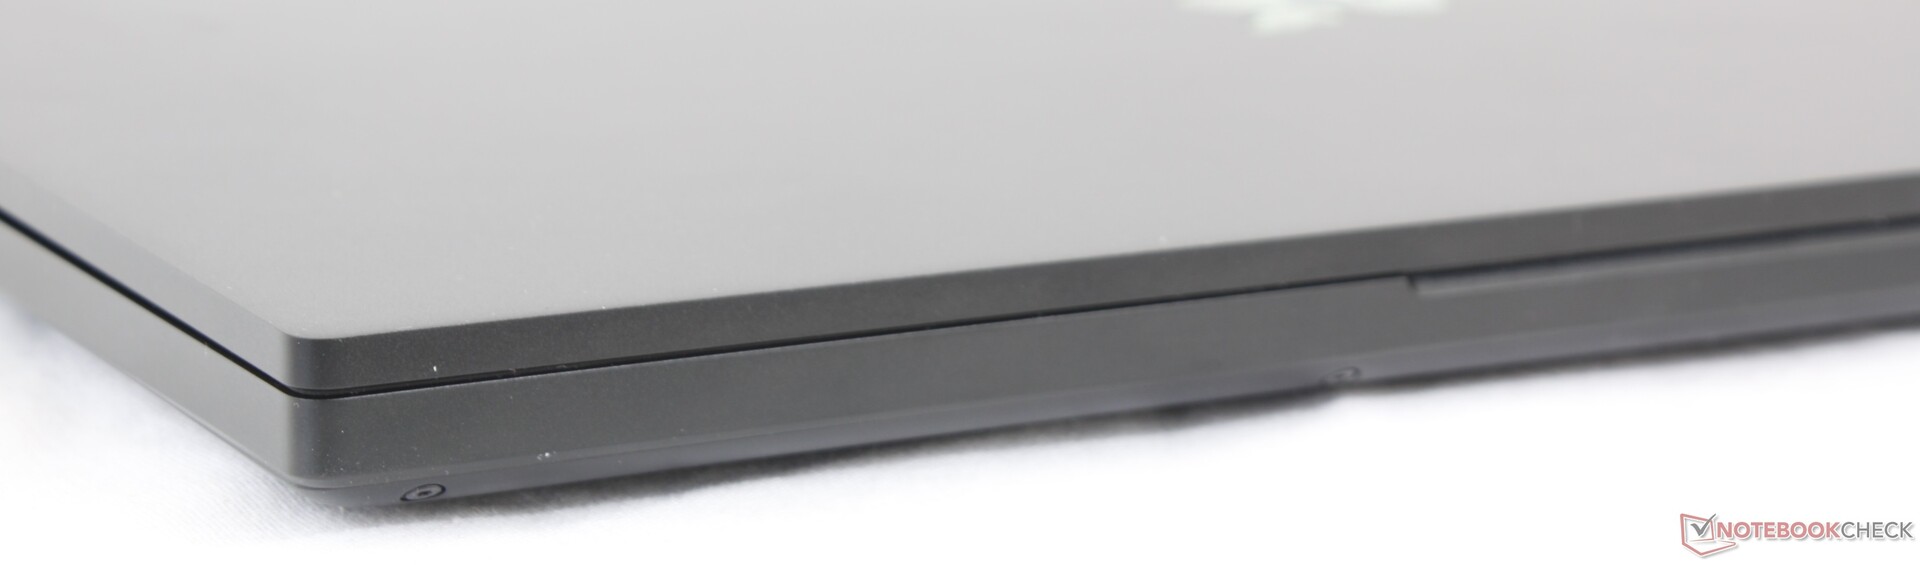
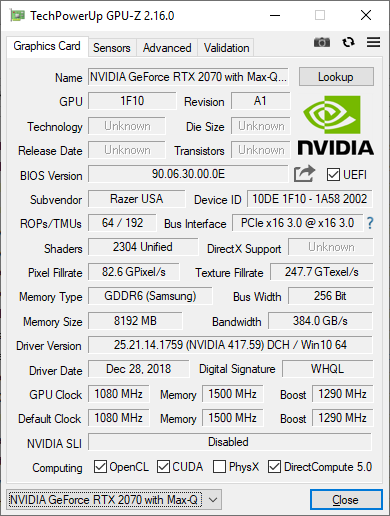
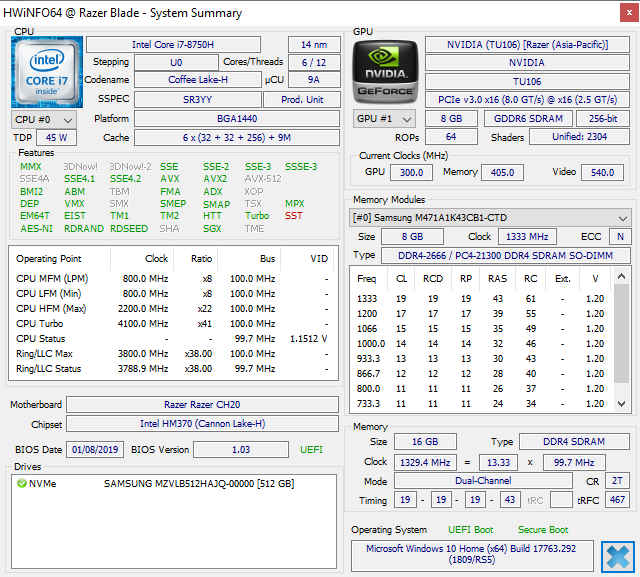
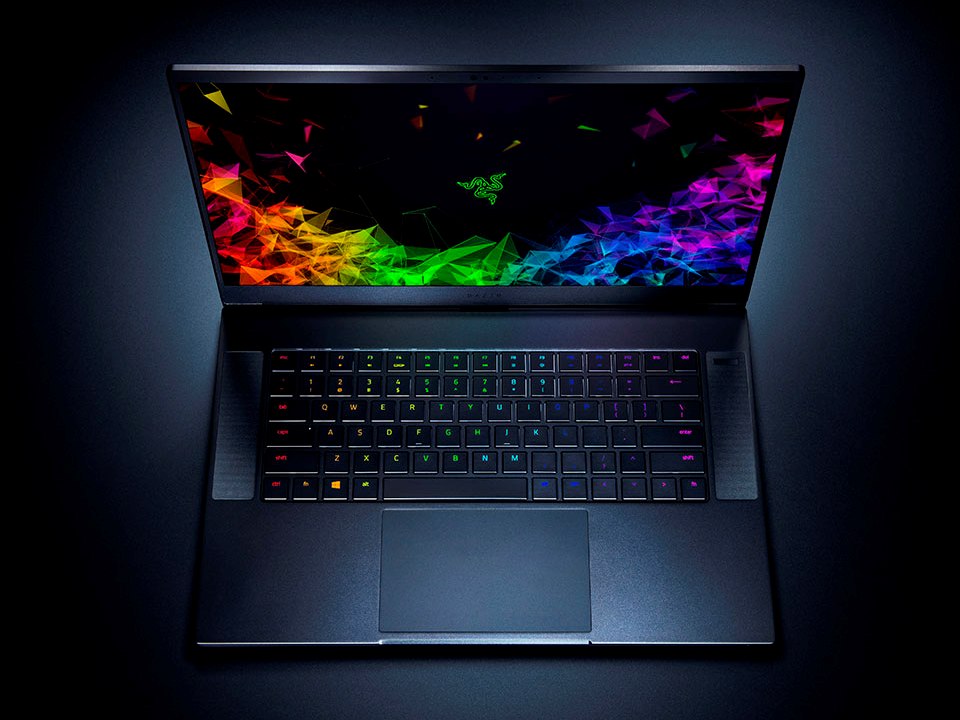
Vi rankade 2018 års modell av Blade 15 som en av de bästa ultratunna bärbara speldatorerna som fanns och den här modellen från början av 2019 är inte sämre. Alla större fördelar (tunn och gedigen konstruktion, smal infattning, förkalibrerad skärm) och nackdelar (grund restid för tangenterna, begränsad CPU Turbo Boost och avsaknad av SD-kortläsare, RJ-45 och sekundär lagringsplats) från förra årets modell av Blade 15 Advanced Model finns närvarande på den här nya utgåvan. Utöver det förväntade processorbytet har Razer också i tysthet uppdaterat WLAN och lagring från Intel 9260 till Intel 9560 respektive från Samsung PM961 til PM981.
När det kommer till dess GPU är RTX 2070 Max-Q snabbare än GTX 1070 Max-Q utan att den blir varmare eller mer högljudd. Totalt sett liknar spelprestandan laptopversionen av GTX 1080 Max-Q om man inte tar raytracing-förmågan i beaktande. Så om du inte måste ha raytracing eller DLSS (faktum är — 99 procent av PC-spelen stödjer inte ens dessa avancerade funktioner) så är prestandan bara runt 15 procent högre än på den mycket billigare Blade 15 GTX 1070 Max-Q. Den som letar efter en ultratunn spellaptop kommer faktiskt märka att den äldre Blade 15 Advanced Model är betydligt mer tilltalande på grund av detta.
Det är inte mycket som har förändrats, men det behövdes heller inte. Allt som var utmärkt med Blade 15 är nu tillbaka i full kraft med Nvidia RTX. Om du inte är intresserad av raytracing så kan den visuellt sett identiska men ändå billigare Blade 15 Advanced Model (2018) i de flesta fall ge nästan samma spelupplevelse som RTX 2070 Max-Q.
Razer Blade 15 RTX 2070 Max-Q
- 09/20/2019 v7 (old)
Allen Ngo
Price comparison
