Test: MSI GS65 Stealth Thin 9RE-051US (GTX 1060) Laptop (Sammanfattning)
| |||||||||||||||||||||||||
Distribution av ljusstyrkan: 83 %
Mitt på batteriet: 250.9 cd/m²
Kontrast: 784:1 (Svärta: 0.32 cd/m²)
ΔE ColorChecker Calman: 2.77 | ∀{0.5-29.43 Ø4.73}
calibrated: 2.5
ΔE Greyscale Calman: 4 | ∀{0.09-98 Ø4.97}
92% sRGB (Argyll 1.6.3 3D)
60% AdobeRGB 1998 (Argyll 1.6.3 3D)
67% AdobeRGB 1998 (Argyll 3D)
92.1% sRGB (Argyll 3D)
65.8% Display P3 (Argyll 3D)
Gamma: 2.27
CCT: 6901 K
| MSI GS65 Stealth Thin 8RE-051US AUO80ED, IPS, 15.6", 1920x1080 | MSI GS65 8RF-019DE Stealth Thin AU Optronics B156HAN08.0 (AUO80ED), IPS, 15.6", 1920x1080 | Gigabyte Aero 15X v8 LGD05C0, IPS, 15.6", 1920x1080 | Asus Zephyrus M GM501 AUO B156HAN07.1 (AUO71ED), IPS, 15.6", 1920x1080 | Dell XPS 15 9570 i7 UHD LQ156D1, IPS, 15.6", 3840x2160 | Razer Blade 15 GTX 1060 LGD05C0, IPS, 15.6", 1920x1080 | |
|---|---|---|---|---|---|---|
| Display | 0% | -1% | 0% | 15% | -1% | |
| Display P3 Coverage (%) | 65.8 | 66.2 1% | 63.6 -3% | 66.1 0% | 79.1 20% | 64.4 -2% |
| sRGB Coverage (%) | 92.1 | 92.1 0% | 93.8 2% | 92.7 1% | 98.8 7% | 93.4 1% |
| AdobeRGB 1998 Coverage (%) | 67 | 67.2 0% | 64.9 -3% | 67.2 0% | 79.2 18% | 65.5 -2% |
| Response Times | 3% | 12% | 40% | -150% | 16% | |
| Response Time Grey 50% / Grey 80% * (ms) | 20 ? | 17.6 ? 12% | 16.8 ? 16% | 6.6 ? 67% | 46.4 ? -132% | 13.6 ? 32% |
| Response Time Black / White * (ms) | 12 ? | 12.8 ? -7% | 11.2 ? 7% | 10.4 ? 13% | 32 ? -167% | 12 ? -0% |
| PWM Frequency (Hz) | 980 ? | |||||
| Screen | 19% | 26% | -10% | 3% | 16% | |
| Brightness middle (cd/m²) | 250.9 | 254 1% | 313 25% | 307 22% | 494 97% | 304.3 21% |
| Brightness (cd/m²) | 257 | 262 2% | 300 17% | 296 15% | 457 78% | 293 14% |
| Brightness Distribution (%) | 83 | 89 7% | 78 -6% | 89 7% | 88 6% | 80 -4% |
| Black Level * (cd/m²) | 0.32 | 0.22 31% | 0.33 -3% | 0.25 22% | 0.34 -6% | 0.38 -19% |
| Contrast (:1) | 784 | 1155 47% | 948 21% | 1228 57% | 1453 85% | 801 2% |
| Colorchecker dE 2000 * | 2.77 | 2.37 14% | 1.29 53% | 5.74 -107% | 5.2 -88% | 1.79 35% |
| Colorchecker dE 2000 max. * | 5.89 | 4.71 20% | 2.04 65% | 11.32 -92% | 17.5 -197% | 3.69 37% |
| Colorchecker dE 2000 calibrated * | 2.5 | 1.84 26% | 1.94 22% | |||
| Greyscale dE 2000 * | 4 | 1.58 60% | 0.69 83% | 6.44 -61% | 2.7 32% | 1.1 72% |
| Gamma | 2.27 97% | 2.48 89% | 2.43 91% | 2.48 89% | 2.1 105% | 2.27 97% |
| CCT | 6901 94% | 6785 96% | 6550 99% | 8395 77% | 7038 92% | 6665 98% |
| Color Space (Percent of AdobeRGB 1998) (%) | 60 | 60 0% | 60 0% | 60 0% | 71.2 19% | 59.8 0% |
| Color Space (Percent of sRGB) (%) | 92 | 92 0% | 94 2% | 93 1% | 98.8 7% | 92.8 1% |
| Totalt genomsnitt (program/inställningar) | 7% /
13% | 12% /
18% | 10% /
-2% | -44% /
-15% | 10% /
13% |
* ... mindre är bättre
Visa svarstider
| ↔ Svarstid svart till vitt | ||
|---|---|---|
| 12 ms ... stiga ↗ och falla ↘ kombinerat | ↗ 6.8 ms stiga | 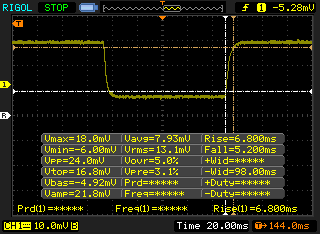 |
| ↘ 5.2 ms hösten | ||
| Skärmen visar bra svarsfrekvens i våra tester, men kan vara för långsam för konkurrenskraftiga spelare. I jämförelse sträcker sig alla testade enheter från 0.1 (minst) till 240 (maximalt) ms. » 31 % av alla enheter är bättre. Det betyder att den uppmätta svarstiden är bättre än genomsnittet av alla testade enheter (19.9 ms). | ||
| ↔ Svarstid 50 % grått till 80 % grått | ||
| 20 ms ... stiga ↗ och falla ↘ kombinerat | ↗ 10 ms stiga | 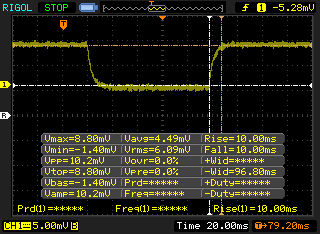 |
| ↘ 10 ms hösten | ||
| Skärmen visar bra svarsfrekvens i våra tester, men kan vara för långsam för konkurrenskraftiga spelare. I jämförelse sträcker sig alla testade enheter från 0.165 (minst) till 636 (maximalt) ms. » 33 % av alla enheter är bättre. Det betyder att den uppmätta svarstiden är bättre än genomsnittet av alla testade enheter (31.1 ms). | ||
Skärmflimmer / PWM (Puls-Width Modulation)
| Skärmflimmer / PWM upptäcktes inte |  | ||
Som jämförelse: 52 % av alla testade enheter använder inte PWM för att dämpa skärmen. Om PWM upptäcktes mättes ett medelvärde av 7784 (minst: 5 - maximum: 343500) Hz. | |||
| PCMark 8 Home Score Accelerated v2 | 4676 poäng | |
| PCMark 8 Work Score Accelerated v2 | 5731 poäng | |
| PCMark 10 Score | 4646 poäng | |
Hjälp | ||
| MSI GS65 Stealth Thin 8RE-051US Samsung SSD PM981 MZVLB256HAHQ | Gigabyte Aero 15X v8 Toshiba NVMe THNSN5512GPU7 | Asus Zephyrus M GM501 Samsung SM961 MZVKW512HMJP m.2 PCI-e | Acer Predator Triton 700 2x SK Hynix Canvas SC300 512GB M.2 (HFS512G39MND) (RAID 0) | Razer Blade 15 GTX 1060 Samsung SSD PM981 MZVLB512HAJQ | |
|---|---|---|---|---|---|
| AS SSD | |||||
| Score Total (Points) | 2039 | 2536 24% | 3649 79% | 3282 61% | 4095 101% |
| Score Write (Points) | 802 | 939 17% | 1446 80% | 1243 55% | 1955 144% |
| Score Read (Points) | 815 | 1092 34% | 1471 80% | 1350 66% | 1407 73% |
| Access Time Write * (ms) | 0.045 | 0.046 -2% | 0.041 9% | 0.041 9% | 0.037 18% |
| Access Time Read * (ms) | 0.071 | 0.119 -68% | 0.046 35% | 0.062 13% | 0.05 30% |
| 4K-64 Write (MB/s) | 570 | 742 30% | 1198 110% | 913 60% | 1664 192% |
| 4K-64 Read (MB/s) | 611 | 847 39% | 1218 99% | 1057 73% | 1177 93% |
| 4K Write (MB/s) | 83.8 | 80.4 -4% | 90.2 8% | 93 11% | 99.2 18% |
| 4K Read (MB/s) | 43.09 | 23.36 -46% | 43.42 1% | 41.47 -4% | 48.56 13% |
| Seq Write (MB/s) | 1475 | 1163 -21% | 1580 7% | 2372 61% | 1917 30% |
| Seq Read (MB/s) | 1612 | 2213 37% | 2091 30% | 2517 56% | 1820 13% |
* ... mindre är bättre

| 3DMark 11 Performance | 13554 poäng | |
| 3DMark Cloud Gate Standard Score | 29930 poäng | |
| 3DMark Fire Strike Score | 10311 poäng | |
Hjälp | ||
| låg | med. | hög | ultra | |
|---|---|---|---|---|
| BioShock Infinite (2013) | 274 | 223 | 220 | 159 |
| Metro: Last Light (2013) | 139 | 135 | 132 | 78 |
| The Witcher 3 (2015) | 40 | |||
| Rise of the Tomb Raider (2016) | 113 | 101 | 73 | 62 |
Ljudnivå
| Låg belastning |
| 28.4 / 28.4 / 29.6 dB(A) |
| Hög belastning |
| 43.5 / 45.7 dB(A) |
 | ||
30 dB tyst 40 dB(A) hörbar 50 dB(A) högt ljud |
||
min: | ||
| MSI GS65 Stealth Thin 8RE-051US GeForce GTX 1060 Mobile, i7-8750H, Samsung SSD PM981 MZVLB256HAHQ | Gigabyte Aero 15X v8 GeForce GTX 1070 Max-Q, i7-8750H, Toshiba NVMe THNSN5512GPU7 | Asus Zephyrus M GM501 GeForce GTX 1070 Mobile, i7-8750H, Samsung SM961 MZVKW512HMJP m.2 PCI-e | Acer Predator Triton 700 GeForce GTX 1080 Max-Q, i7-7700HQ, 2x SK Hynix Canvas SC300 512GB M.2 (HFS512G39MND) (RAID 0) | MSI GS65 8RF-019DE Stealth Thin GeForce GTX 1070 Max-Q, i7-8750H, Samsung SSD PM981 MZVLB512HAJQ | Razer Blade 15 GTX 1060 GeForce GTX 1060 Max-Q, i7-8750H, Samsung SSD PM981 MZVLB512HAJQ | |
|---|---|---|---|---|---|---|
| Noise | -11% | -9% | -10% | -3% | -3% | |
| av / miljö * (dB) | 28.4 | 29 -2% | 29 -2% | 31 -9% | 30 -6% | 28.1 1% |
| Idle Minimum * (dB) | 28.4 | 30 -6% | 30 -6% | 33 -16% | 30 -6% | 28.1 1% |
| Idle Average * (dB) | 28.4 | 31 -9% | 31 -9% | 34 -20% | 31 -9% | 33 -16% |
| Idle Maximum * (dB) | 29.6 | 35 -18% | 33 -11% | 40 -35% | 34 -15% | 33.5 -13% |
| Load Average * (dB) | 43.5 | 49 -13% | 49 -13% | 41 6% | 43 1% | 42.2 3% |
| Witcher 3 ultra * (dB) | 45.7 | 51 -12% | 50 -9% | 43 6% | 42 8% | 45.3 1% |
| Load Maximum * (dB) | 45.7 | 54 -18% | 52 -14% | 48 -5% | 44 4% | 45.7 -0% |
* ... mindre är bättre
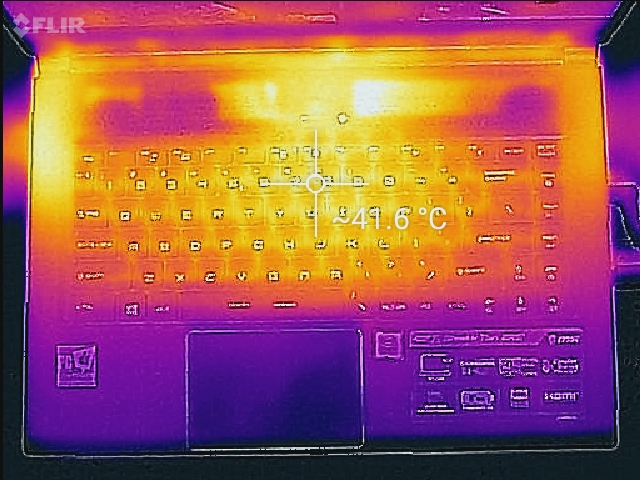
(-) Den maximala temperaturen på ovansidan är 46.8 °C / 116 F, jämfört med genomsnittet av 40.4 °C / 105 F , allt från 21.2 till 68.8 °C för klassen Gaming.
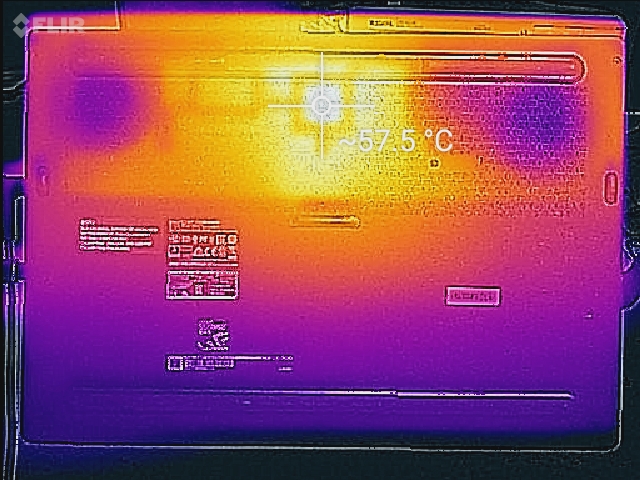
(-) Botten värms upp till maximalt 59.8 °C / 140 F, jämfört med genomsnittet av 43.2 °C / 110 F
(+) Vid tomgångsbruk är medeltemperaturen för ovansidan 26.9 °C / 80 F, jämfört med enhetsgenomsnittet på 33.9 °C / ### class_avg_f### F.
(±) När du spelar The Witcher 3 är medeltemperaturen för ovansidan 35.4 °C / 96 F, jämfört med enhetsgenomsnittet på 33.9 °C / ## #class_avg_f### F.
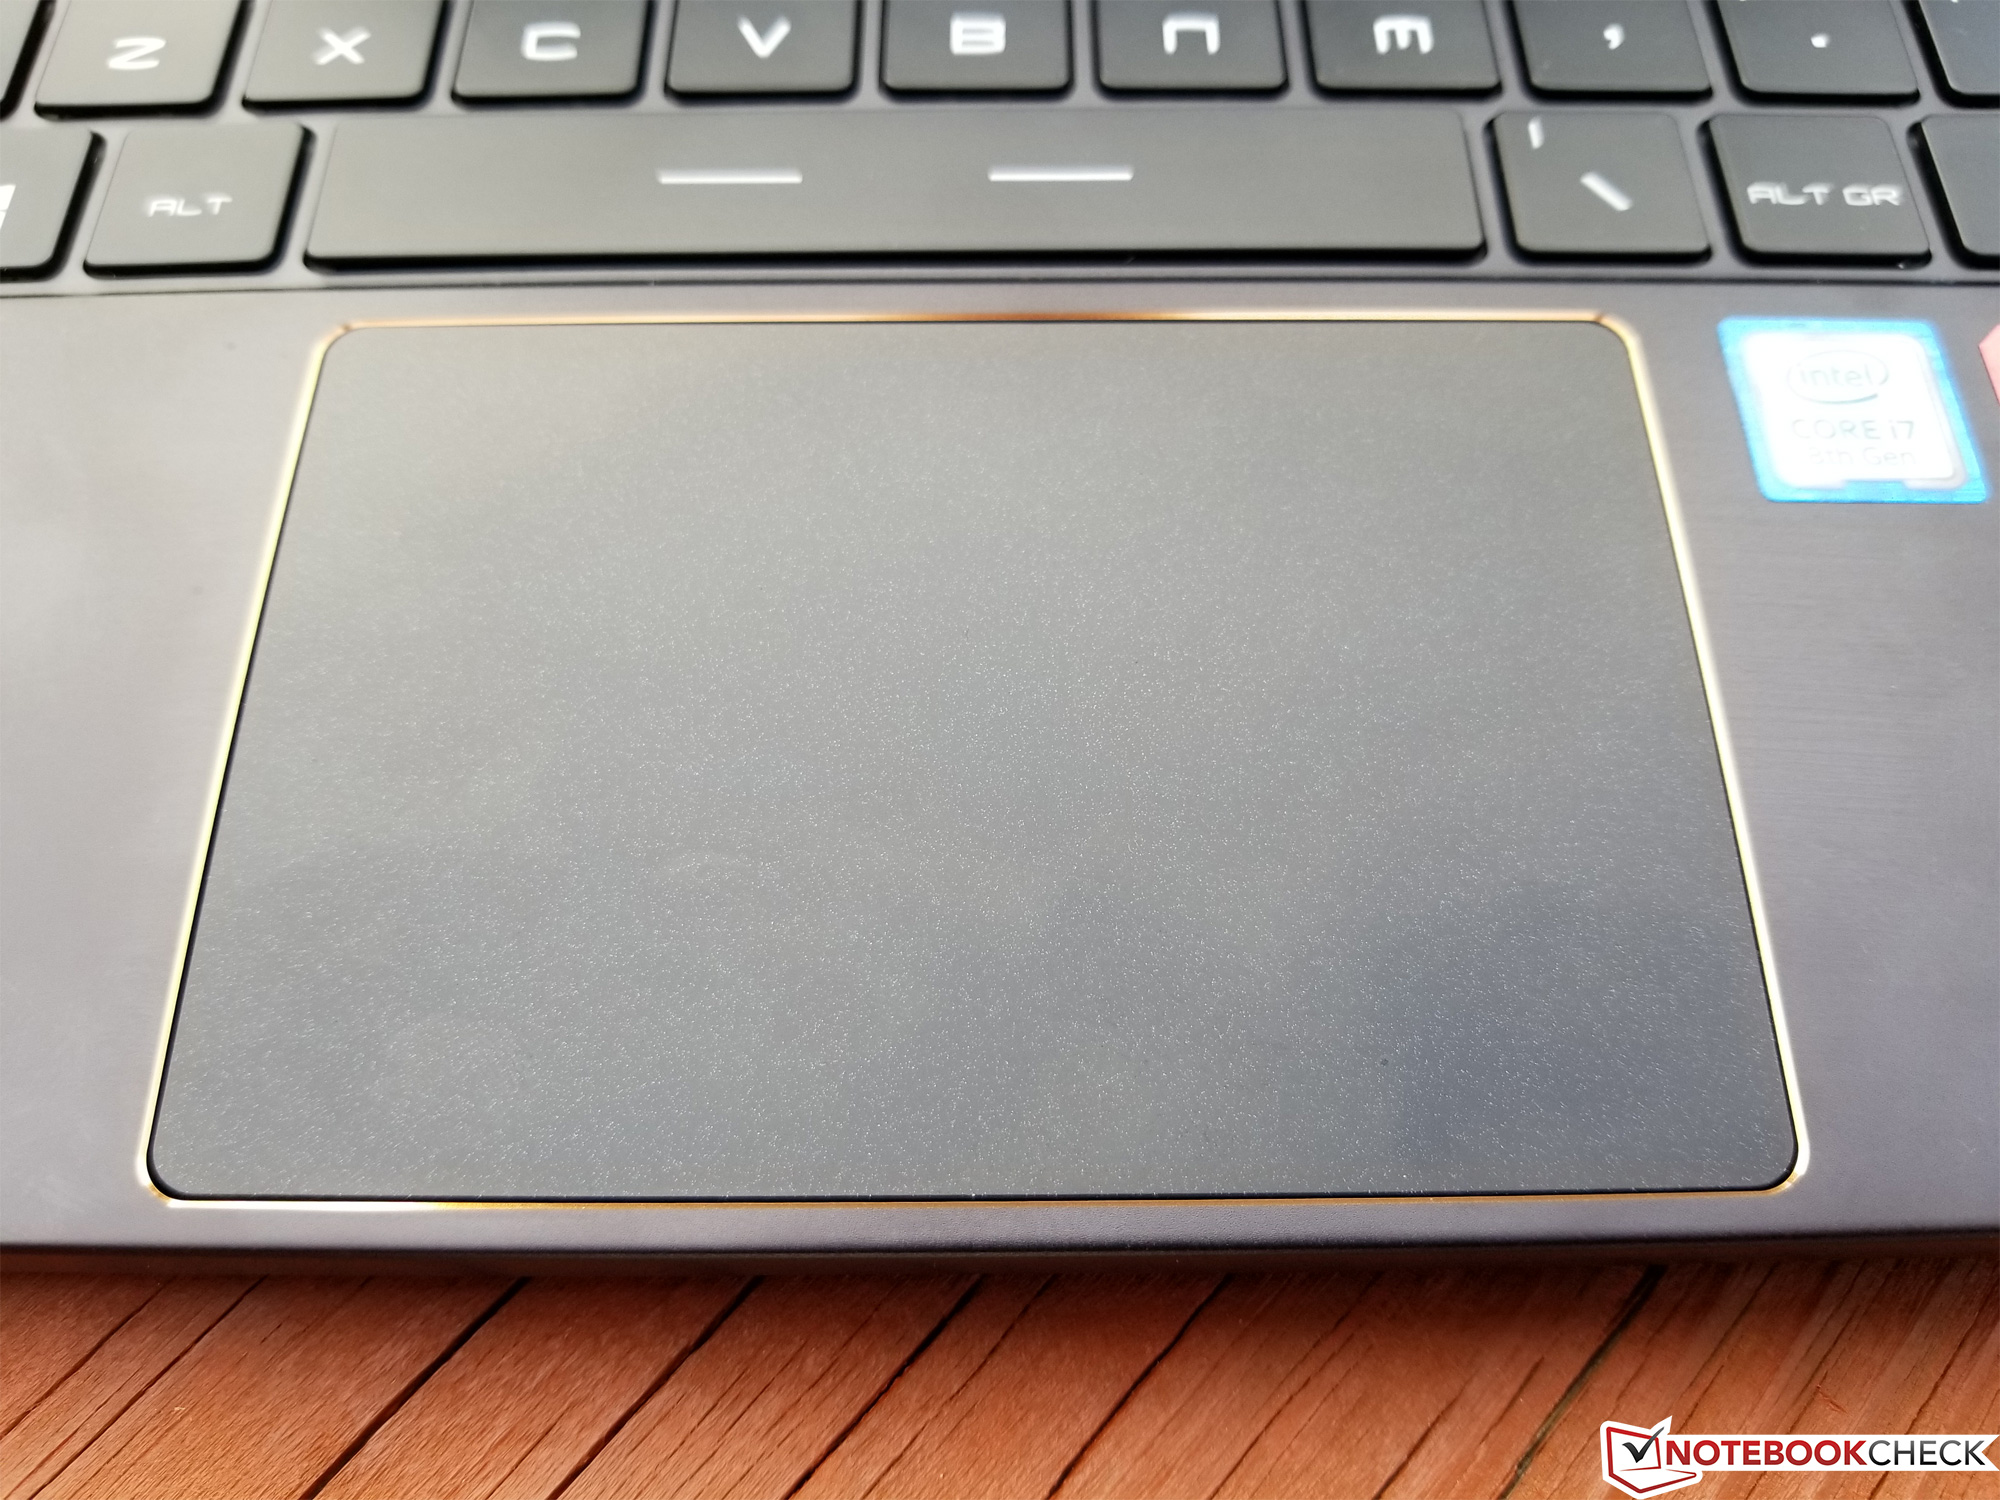
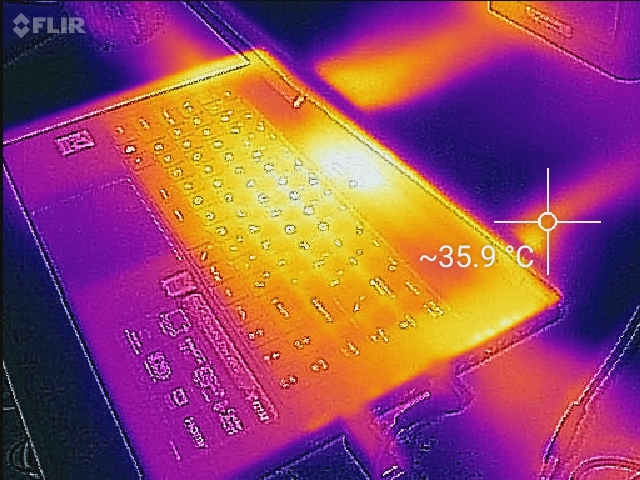
(+) Handledsstöden och pekplattan är kallare än hudtemperaturen med maximalt 28.2 °C / 82.8 F och är därför svala att ta på.
(±) Medeltemperaturen för handledsstödsområdet på liknande enheter var 28.8 °C / 83.8 F (+0.6 °C / 1 F).
MSI GS65 Stealth Thin 8RE-051US ljudanalys
(±) | högtalarljudstyrkan är genomsnittlig men bra (75.1 dB)
Bas 100 - 315 Hz
(-) | nästan ingen bas - i genomsnitt 17% lägre än medianen
(±) | linjäriteten för basen är genomsnittlig (10.1% delta till föregående frekvens)
Mellan 400 - 2000 Hz
(±) | högre mellan - i genomsnitt 5.7% högre än median
(±) | linjäriteten för mids är genomsnittlig (9.3% delta till föregående frekvens)
Högsta 2 - 16 kHz
(+) | balanserade toppar - endast 2.1% från medianen
(±) | linjäriteten för toppar är genomsnittlig (11.7% delta till föregående frekvens)
Totalt 100 - 16 000 Hz
(±) | linjäriteten för det totala ljudet är genomsnittlig (23.8% skillnad mot median)
Jämfört med samma klass
» 86% av alla testade enheter i den här klassen var bättre, 5% liknande, 10% sämre
» Den bästa hade ett delta på 6%, genomsnittet var 18%, sämst var 132%
Jämfört med alla testade enheter
» 71% av alla testade enheter var bättre, 6% liknande, 22% sämre
» Den bästa hade ett delta på 4%, genomsnittet var 24%, sämst var 134%
Gigabyte Aero 15X v8 ljudanalys
(±) | högtalarljudstyrkan är genomsnittlig men bra (78 dB)
Bas 100 - 315 Hz
(-) | nästan ingen bas - i genomsnitt 16.8% lägre än medianen
(±) | linjäriteten för basen är genomsnittlig (11.6% delta till föregående frekvens)
Mellan 400 - 2000 Hz
(+) | balanserad mellan - endast 4.3% från medianen
(+) | mids är linjära (5% delta till föregående frekvens)
Högsta 2 - 16 kHz
(+) | balanserade toppar - endast 3.6% från medianen
(±) | linjäriteten för toppar är genomsnittlig (9.1% delta till föregående frekvens)
Totalt 100 - 16 000 Hz
(±) | linjäriteten för det totala ljudet är genomsnittlig (18.4% skillnad mot median)
Jämfört med samma klass
» 59% av alla testade enheter i den här klassen var bättre, 9% liknande, 33% sämre
» Den bästa hade ett delta på 6%, genomsnittet var 18%, sämst var 132%
Jämfört med alla testade enheter
» 41% av alla testade enheter var bättre, 8% liknande, 52% sämre
» Den bästa hade ett delta på 4%, genomsnittet var 24%, sämst var 134%
| Av/Standby | |
| Låg belastning | |
| Hög belastning |
|
Förklaring:
min: | |
| MSI GS65 Stealth Thin 8RE-051US i7-8750H, GeForce GTX 1060 Mobile, Samsung SSD PM981 MZVLB256HAHQ, IPS, 1920x1080, 15.6" | Gigabyte Aero 15X v8 i7-8750H, GeForce GTX 1070 Max-Q, Toshiba NVMe THNSN5512GPU7, IPS, 1920x1080, 15.6" | Asus Zephyrus M GM501 i7-8750H, GeForce GTX 1070 Mobile, Samsung SM961 MZVKW512HMJP m.2 PCI-e, IPS, 1920x1080, 15.6" | MSI GS63VR 7RG-005 i7-7700HQ, GeForce GTX 1070 Max-Q, Samsung SM961 MZVPW256HEGL, TN LED, 1920x1080, 15.6" | Acer Predator Triton 700 i7-7700HQ, GeForce GTX 1080 Max-Q, 2x SK Hynix Canvas SC300 512GB M.2 (HFS512G39MND) (RAID 0), IPS, 1920x1080, 15.6" | MSI GS65 8RF-019DE Stealth Thin i7-8750H, GeForce GTX 1070 Max-Q, Samsung SSD PM981 MZVLB512HAJQ, IPS, 1920x1080, 15.6" | Dell XPS 15 9570 i7 UHD i7-8750H, GeForce GTX 1050 Ti Max-Q, Toshiba XG5 KXG50ZNV512G, IPS, 3840x2160, 15.6" | Razer Blade 15 GTX 1060 i7-8750H, GeForce GTX 1060 Max-Q, Samsung SSD PM981 MZVLB512HAJQ, IPS, 1920x1080, 15.6" | |
|---|---|---|---|---|---|---|---|---|
| Power Consumption | -27% | -47% | -16% | -104% | -3% | -5% | -20% | |
| Idle Minimum * (Watt) | 8.7 | 14 -61% | 16 -84% | 12 -38% | 28 -222% | 7 20% | 9.48 -9% | 14.9 -71% |
| Idle Average * (Watt) | 13 | 18 -38% | 19 -46% | 16 -23% | 33 -154% | 11 15% | 16.1 -24% | 17.5 -35% |
| Idle Maximum * (Watt) | 14.3 | 22 -54% | 26 -82% | 21 -47% | 41 -187% | 20 -40% | 16.9 -18% | 19.2 -34% |
| Load Average * (Watt) | 107.4 | 91 15% | 103 4% | 85 21% | 94 12% | 98 9% | 90.8 15% | 103.2 4% |
| Witcher 3 ultra * (Watt) | 129 | 142 -10% | 164 -27% | 128 1% | 160 -24% | 132 -2% | 123.1 5% | |
| Load Maximum * (Watt) | 151.5 | 173 -14% | 223 -47% | 162 -7% | 222 -47% | 182 -20% | 134.4 11% | 132.7 12% |
* ... mindre är bättre
| MSI GS65 Stealth Thin 8RE-051US i7-8750H, GeForce GTX 1060 Mobile, 82 Wh | Gigabyte Aero 15X v8 i7-8750H, GeForce GTX 1070 Max-Q, 94.24 Wh | Asus Zephyrus M GM501 i7-8750H, GeForce GTX 1070 Mobile, 55 Wh | MSI GS63VR 7RG-005 i7-7700HQ, GeForce GTX 1070 Max-Q, 52.4 Wh | Acer Predator Triton 700 i7-7700HQ, GeForce GTX 1080 Max-Q, 54 Wh | MSI GS65 8RF-019DE Stealth Thin i7-8750H, GeForce GTX 1070 Max-Q, 82 Wh | Dell XPS 15 9570 i7 UHD i7-8750H, GeForce GTX 1050 Ti Max-Q, 97 Wh | Razer Blade 15 GTX 1060 i7-8750H, GeForce GTX 1060 Max-Q, 80 Wh | |
|---|---|---|---|---|---|---|---|---|
| Batteridrifttid | 78% | -28% | -27% | -31% | 7% | 32% | 8% | |
| WiFi v1.3 (h) | 6.2 | 8.6 39% | 2.7 -56% | 3.9 -37% | 2.4 -61% | 6 -3% | 9.6 55% | 6.7 8% |
| Load (h) | 1.2 | 2.6 117% | 1.2 0% | 1 -17% | 1.2 0% | 1.4 17% | 1.3 8% | |
| Reader / Idle (h) | 12.7 | 4 | 5.7 | 2.5 | 8.5 | |||
| Witcher 3 ultra (h) | 1 |
För
Emot
Läs den fullständiga versionen av den här recensionen på engelska här.
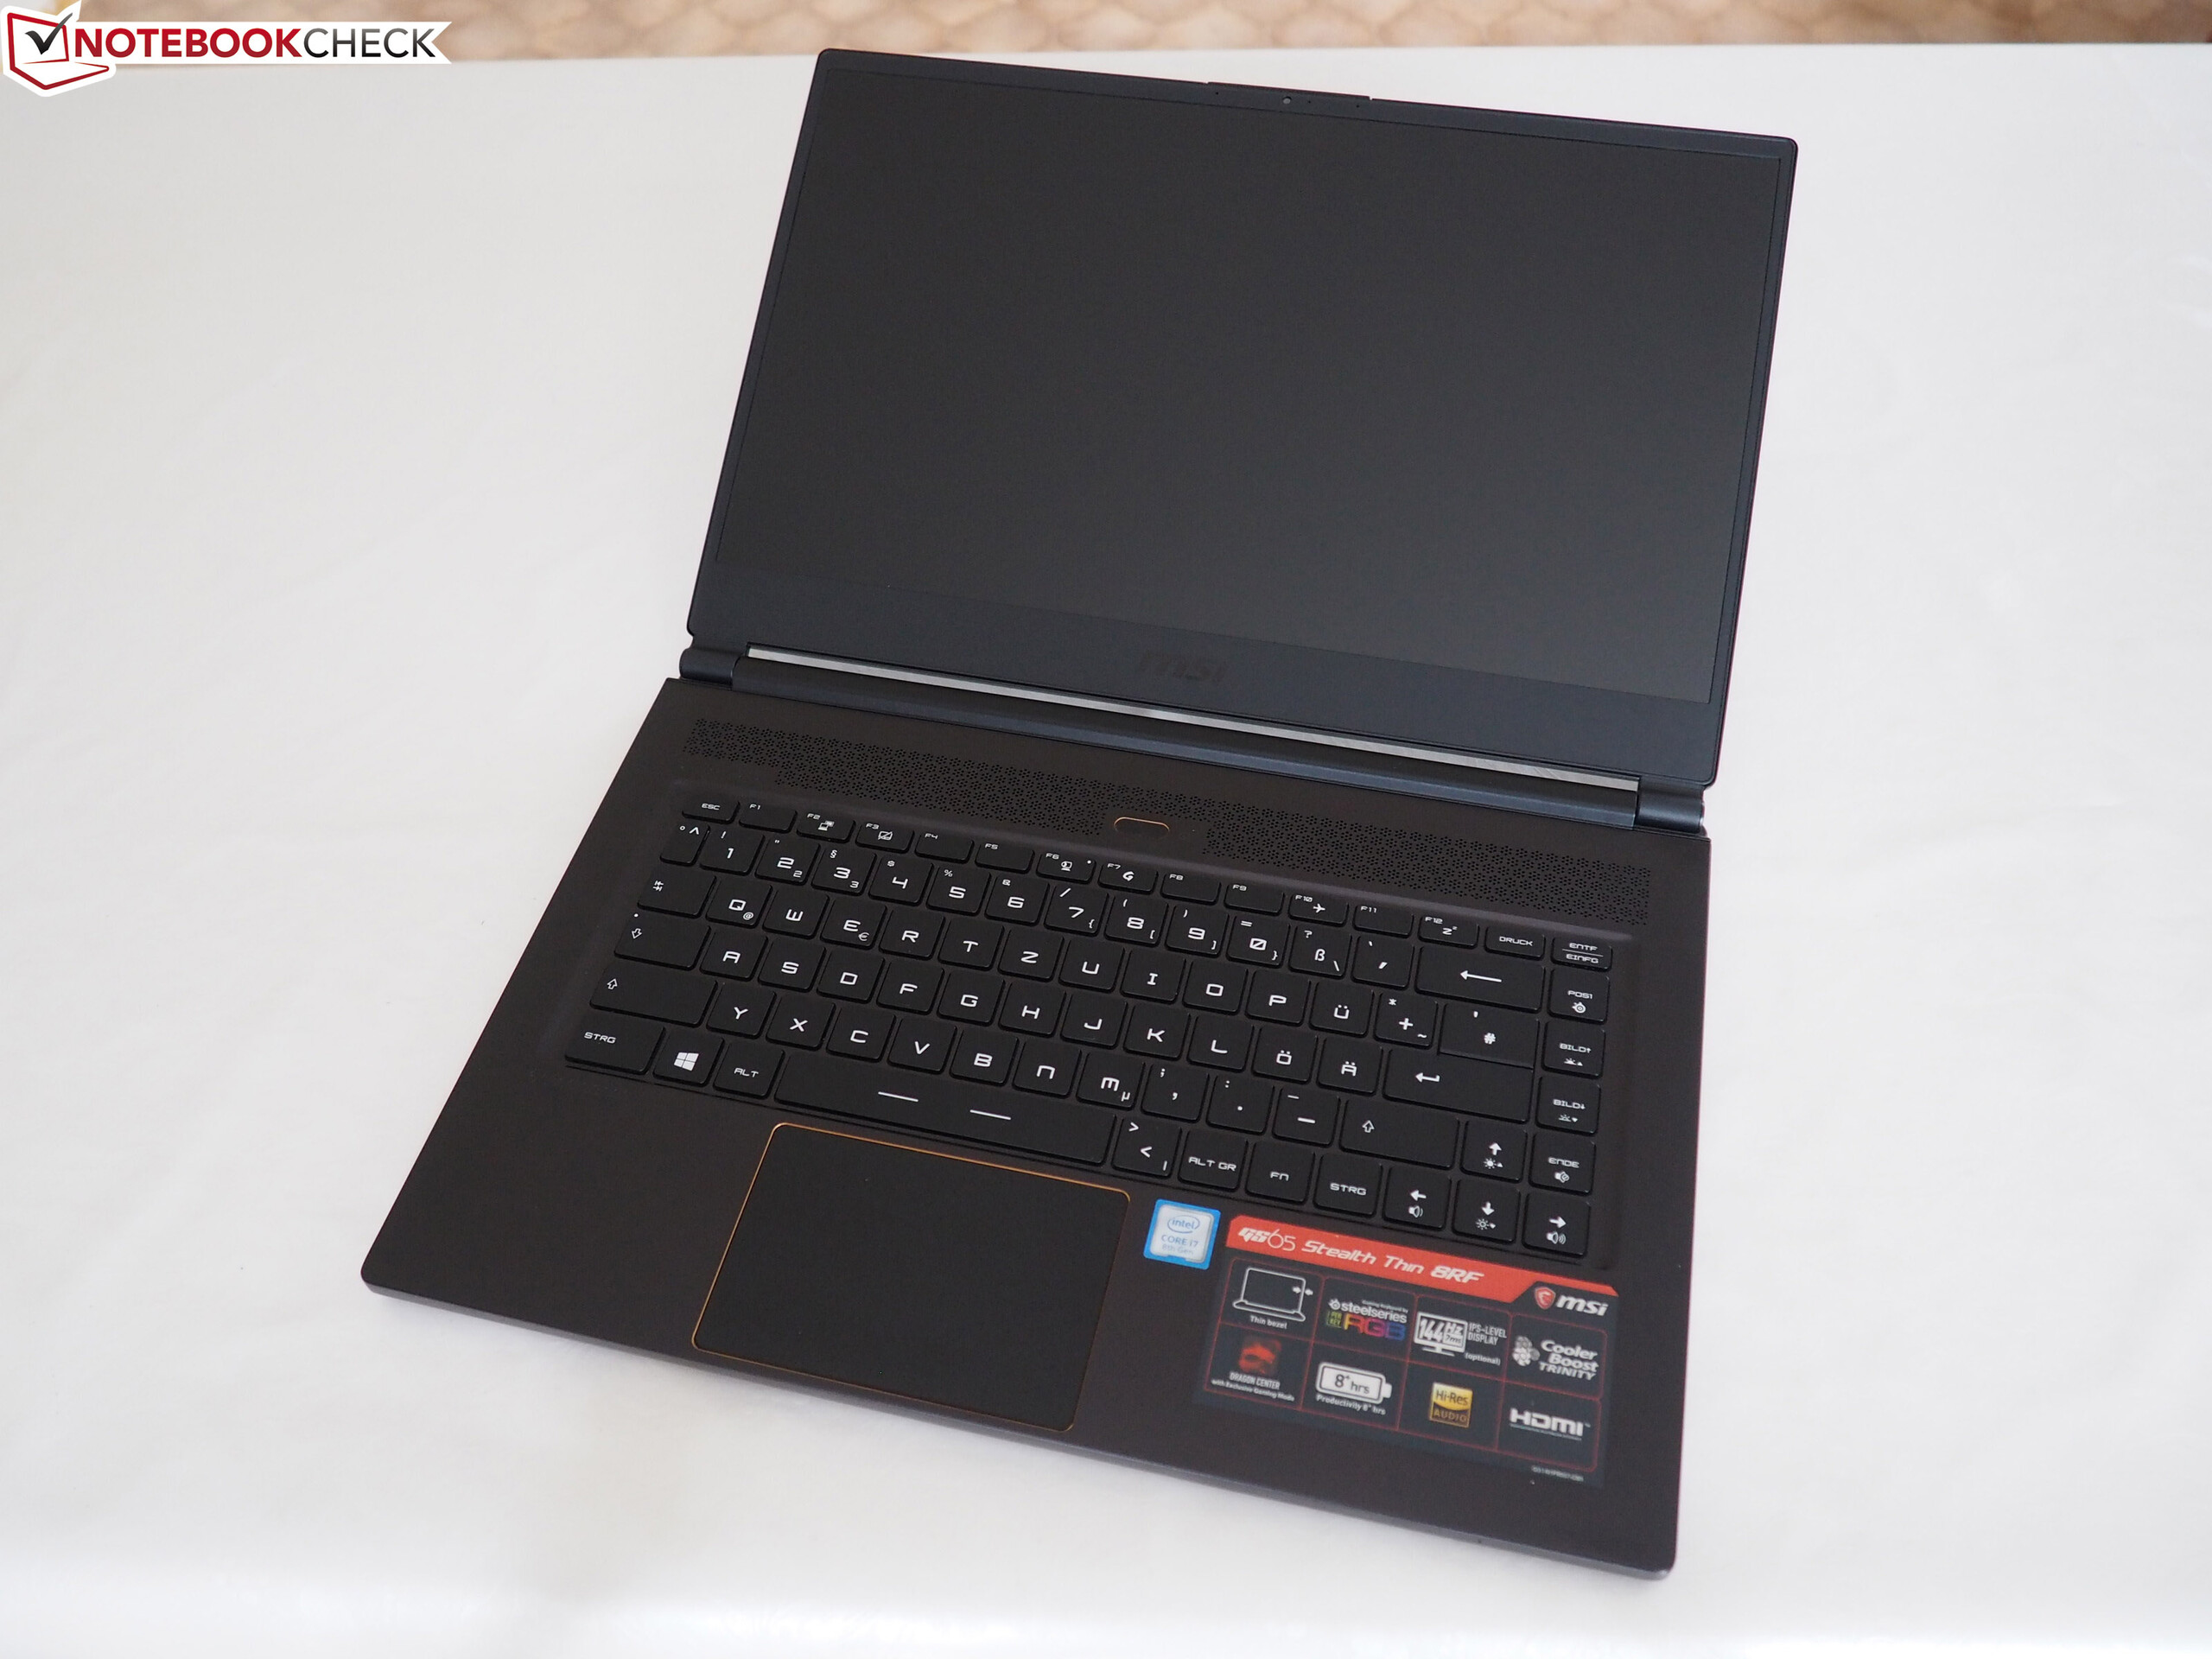
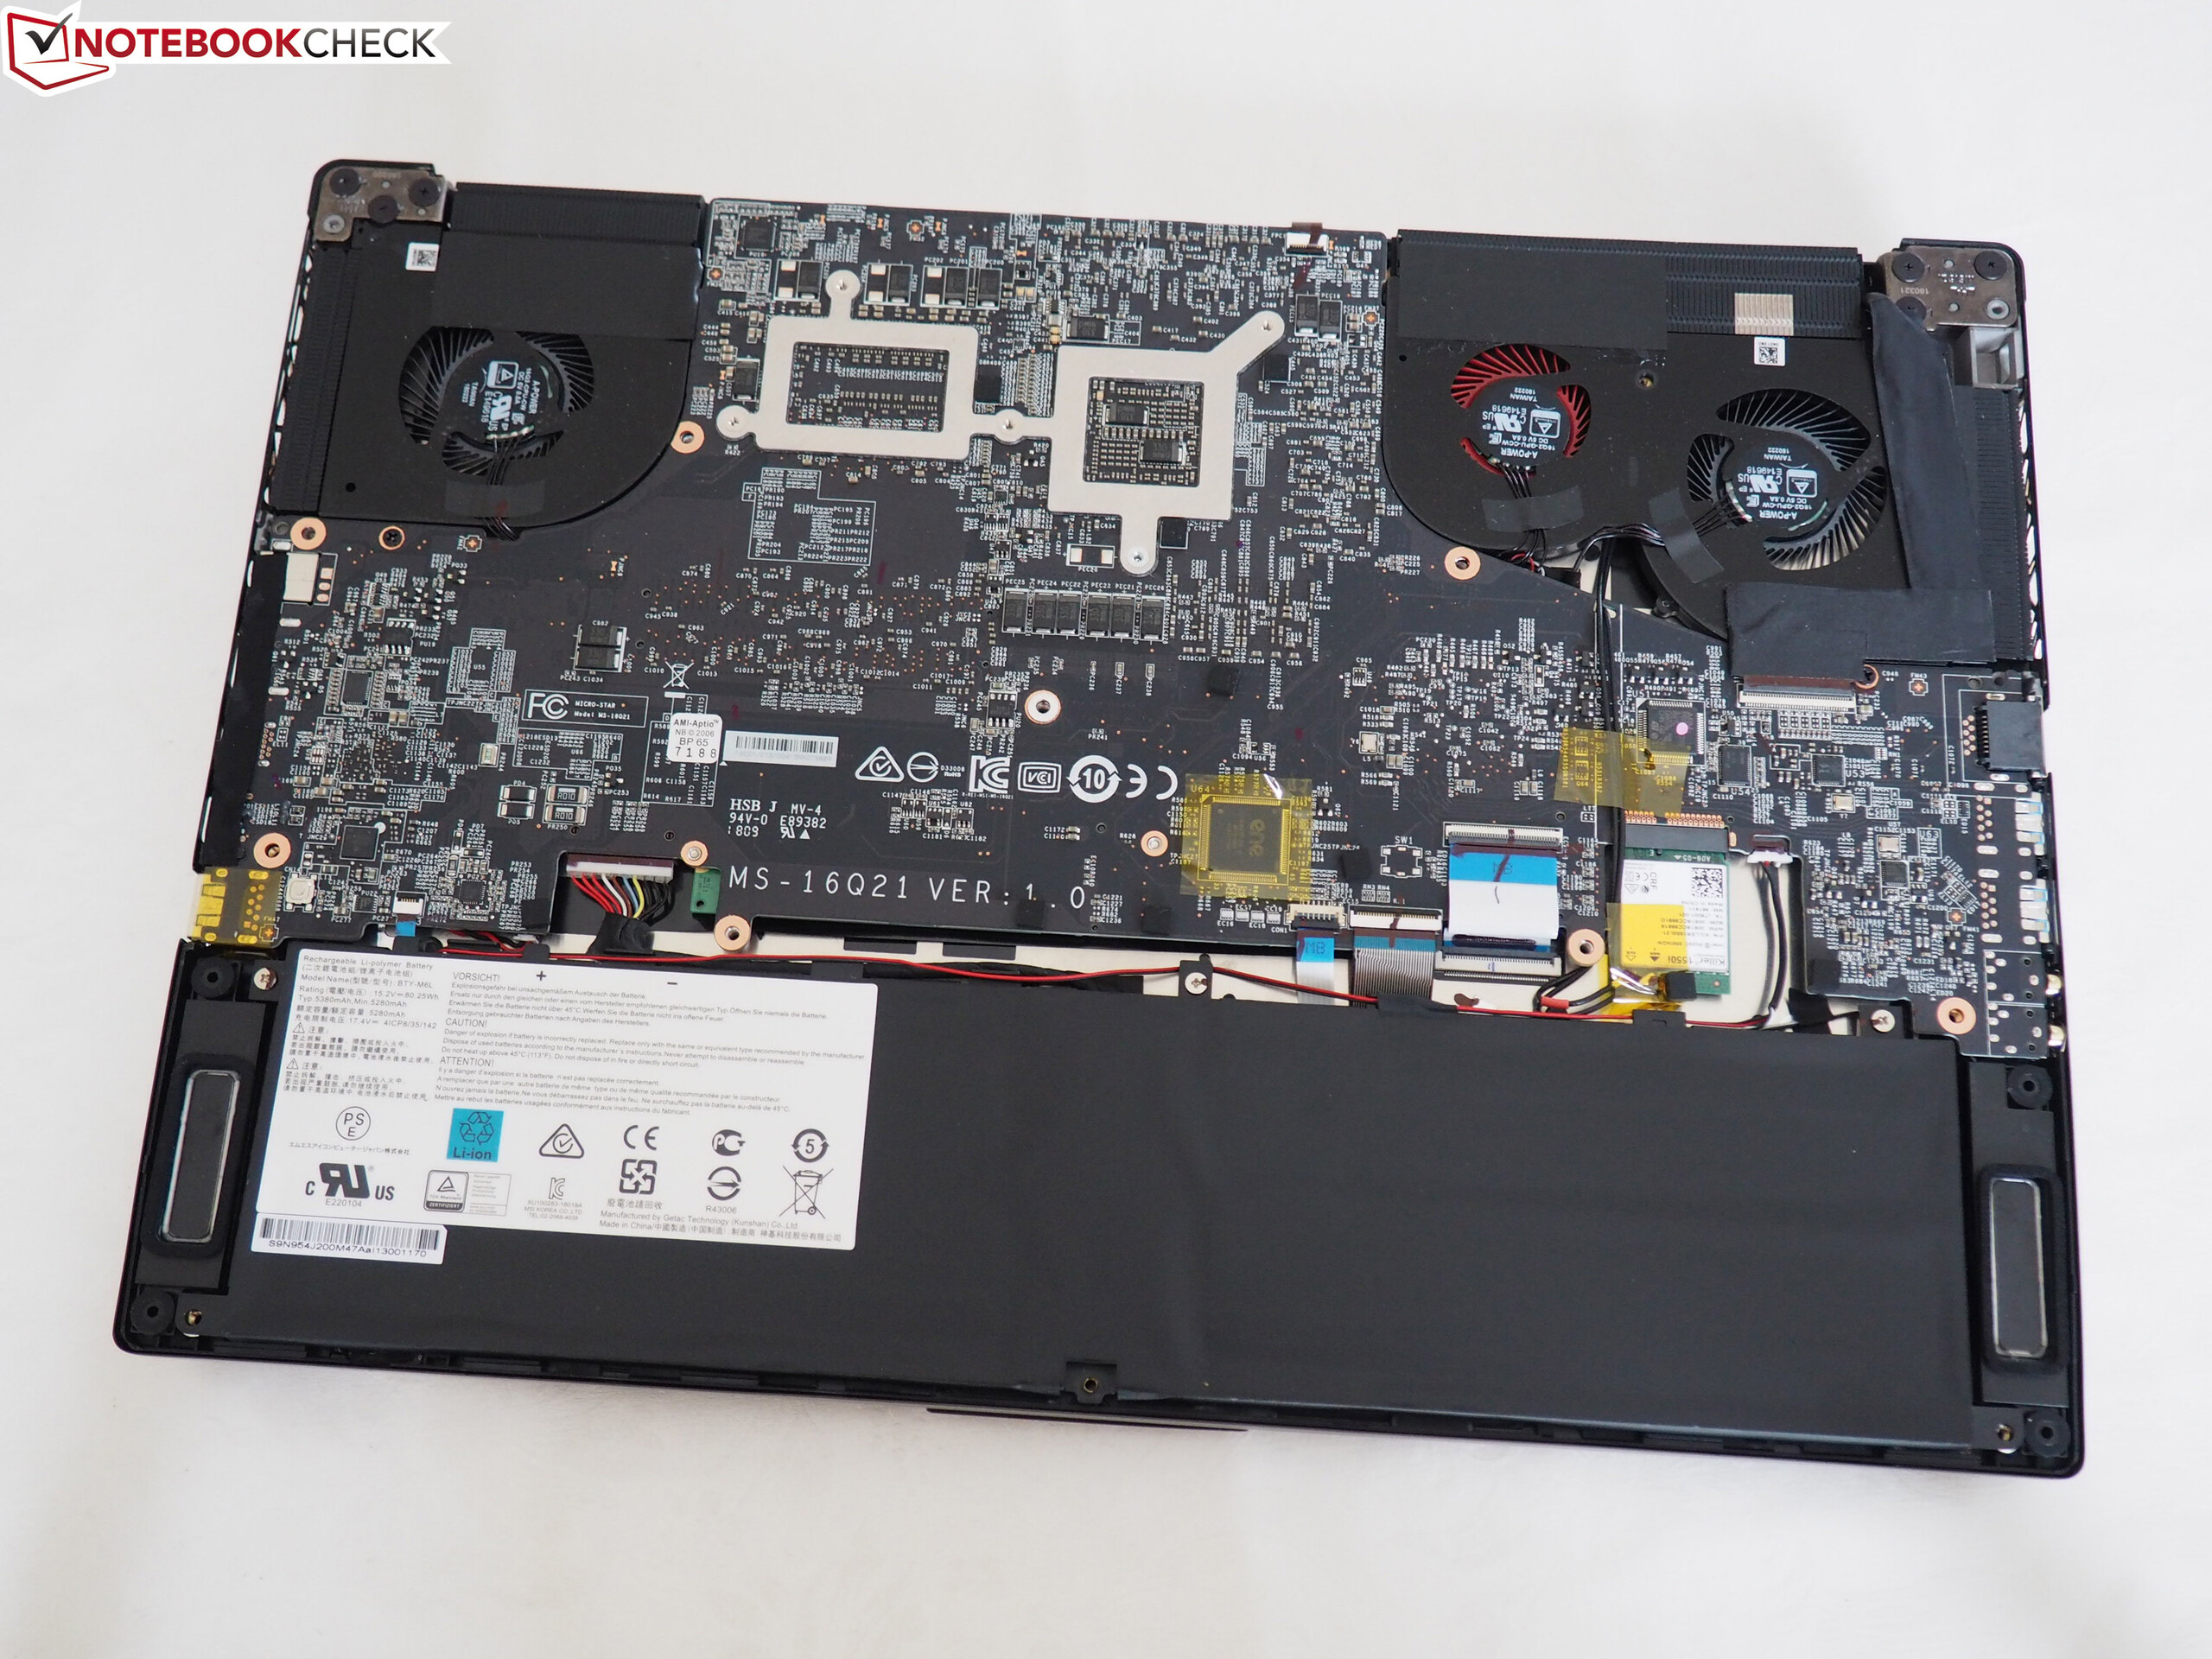
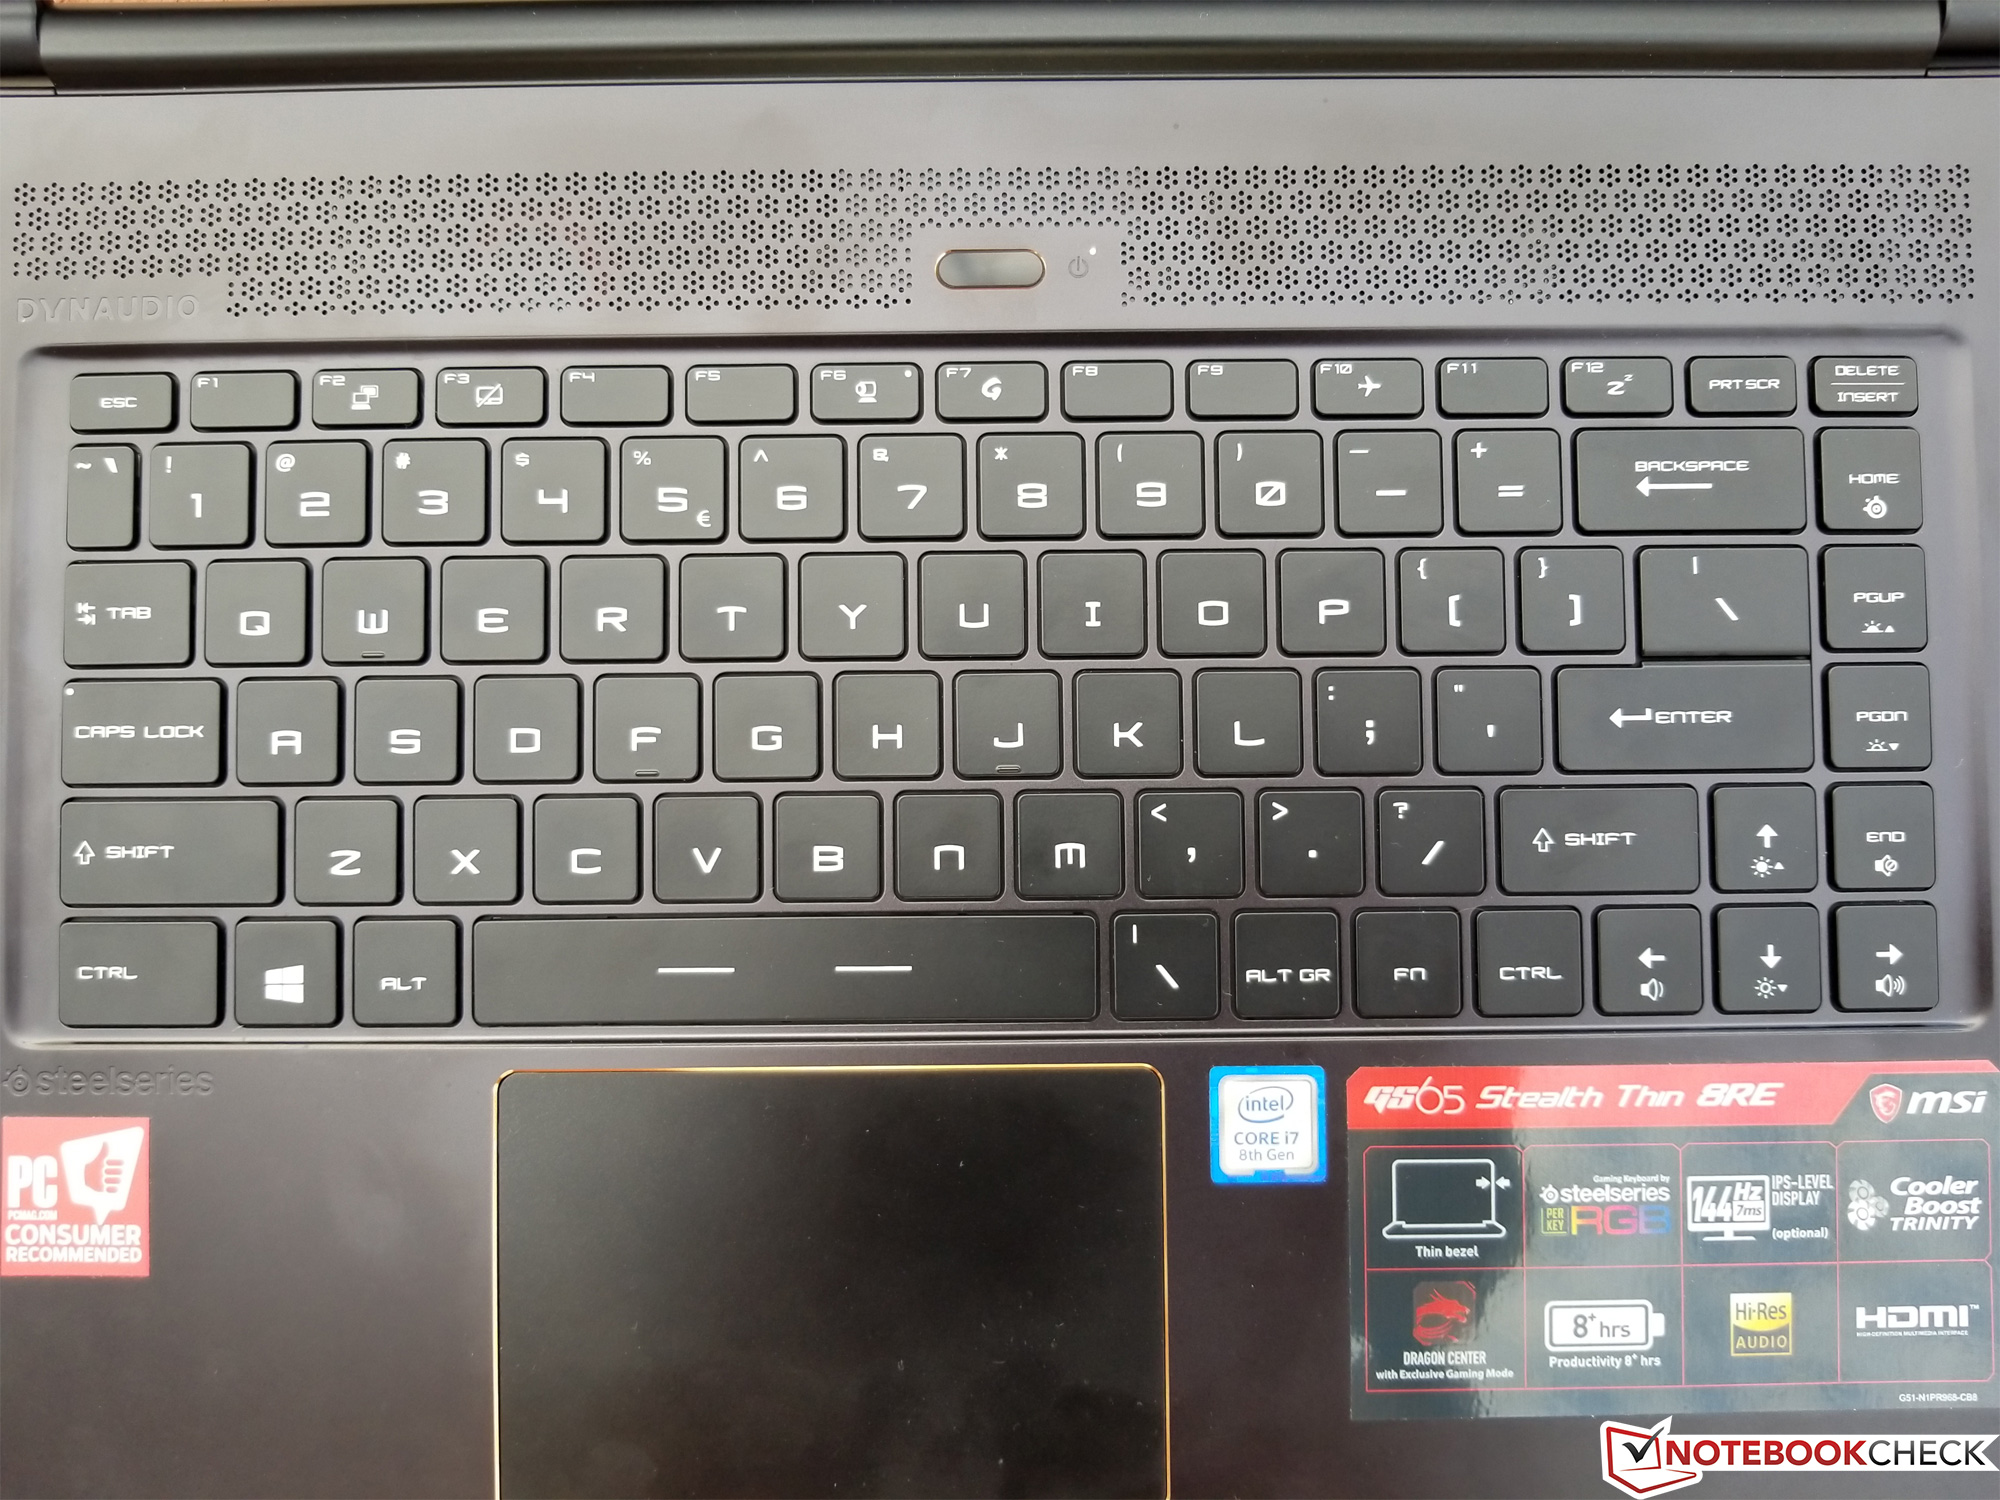
I ärlighetens namn gör dagens konfiguration av MSI GS65 inte särskilt mycket för att åtgärda de klagomål vi lyfte fram i vår recension från i Maj av en annan SKU. De största nackdelarna är fortfarande tveksamt hantverk, en konstruktion som inte känns robust (vilket leder till att höljet knarrar oundvikligt vid användning) samt de svåra serviceprocedurerna och de medelmåttiga inmatningsenheterna. Men dagens jämförelsevis enklare konfiguration, driven av ett GTX 1060 och en Core i7-8750H (samt en mindre NVMe SSD på 256 GB), lyckas överleva vårt syntetiska stress-test utan att varken behöva strypa CPU:n eller GPU:n, vilket är en välkommen förbättring jämfört med den GTX 1070 Max-Q-modell vi recenserat tidigare. Således har även yttemperaturen sjunkit en del, ett resultat av vad som verkar vara en aning mer aggresiv kylning i kombination med en märkbart mindre energi-slukande GPU.
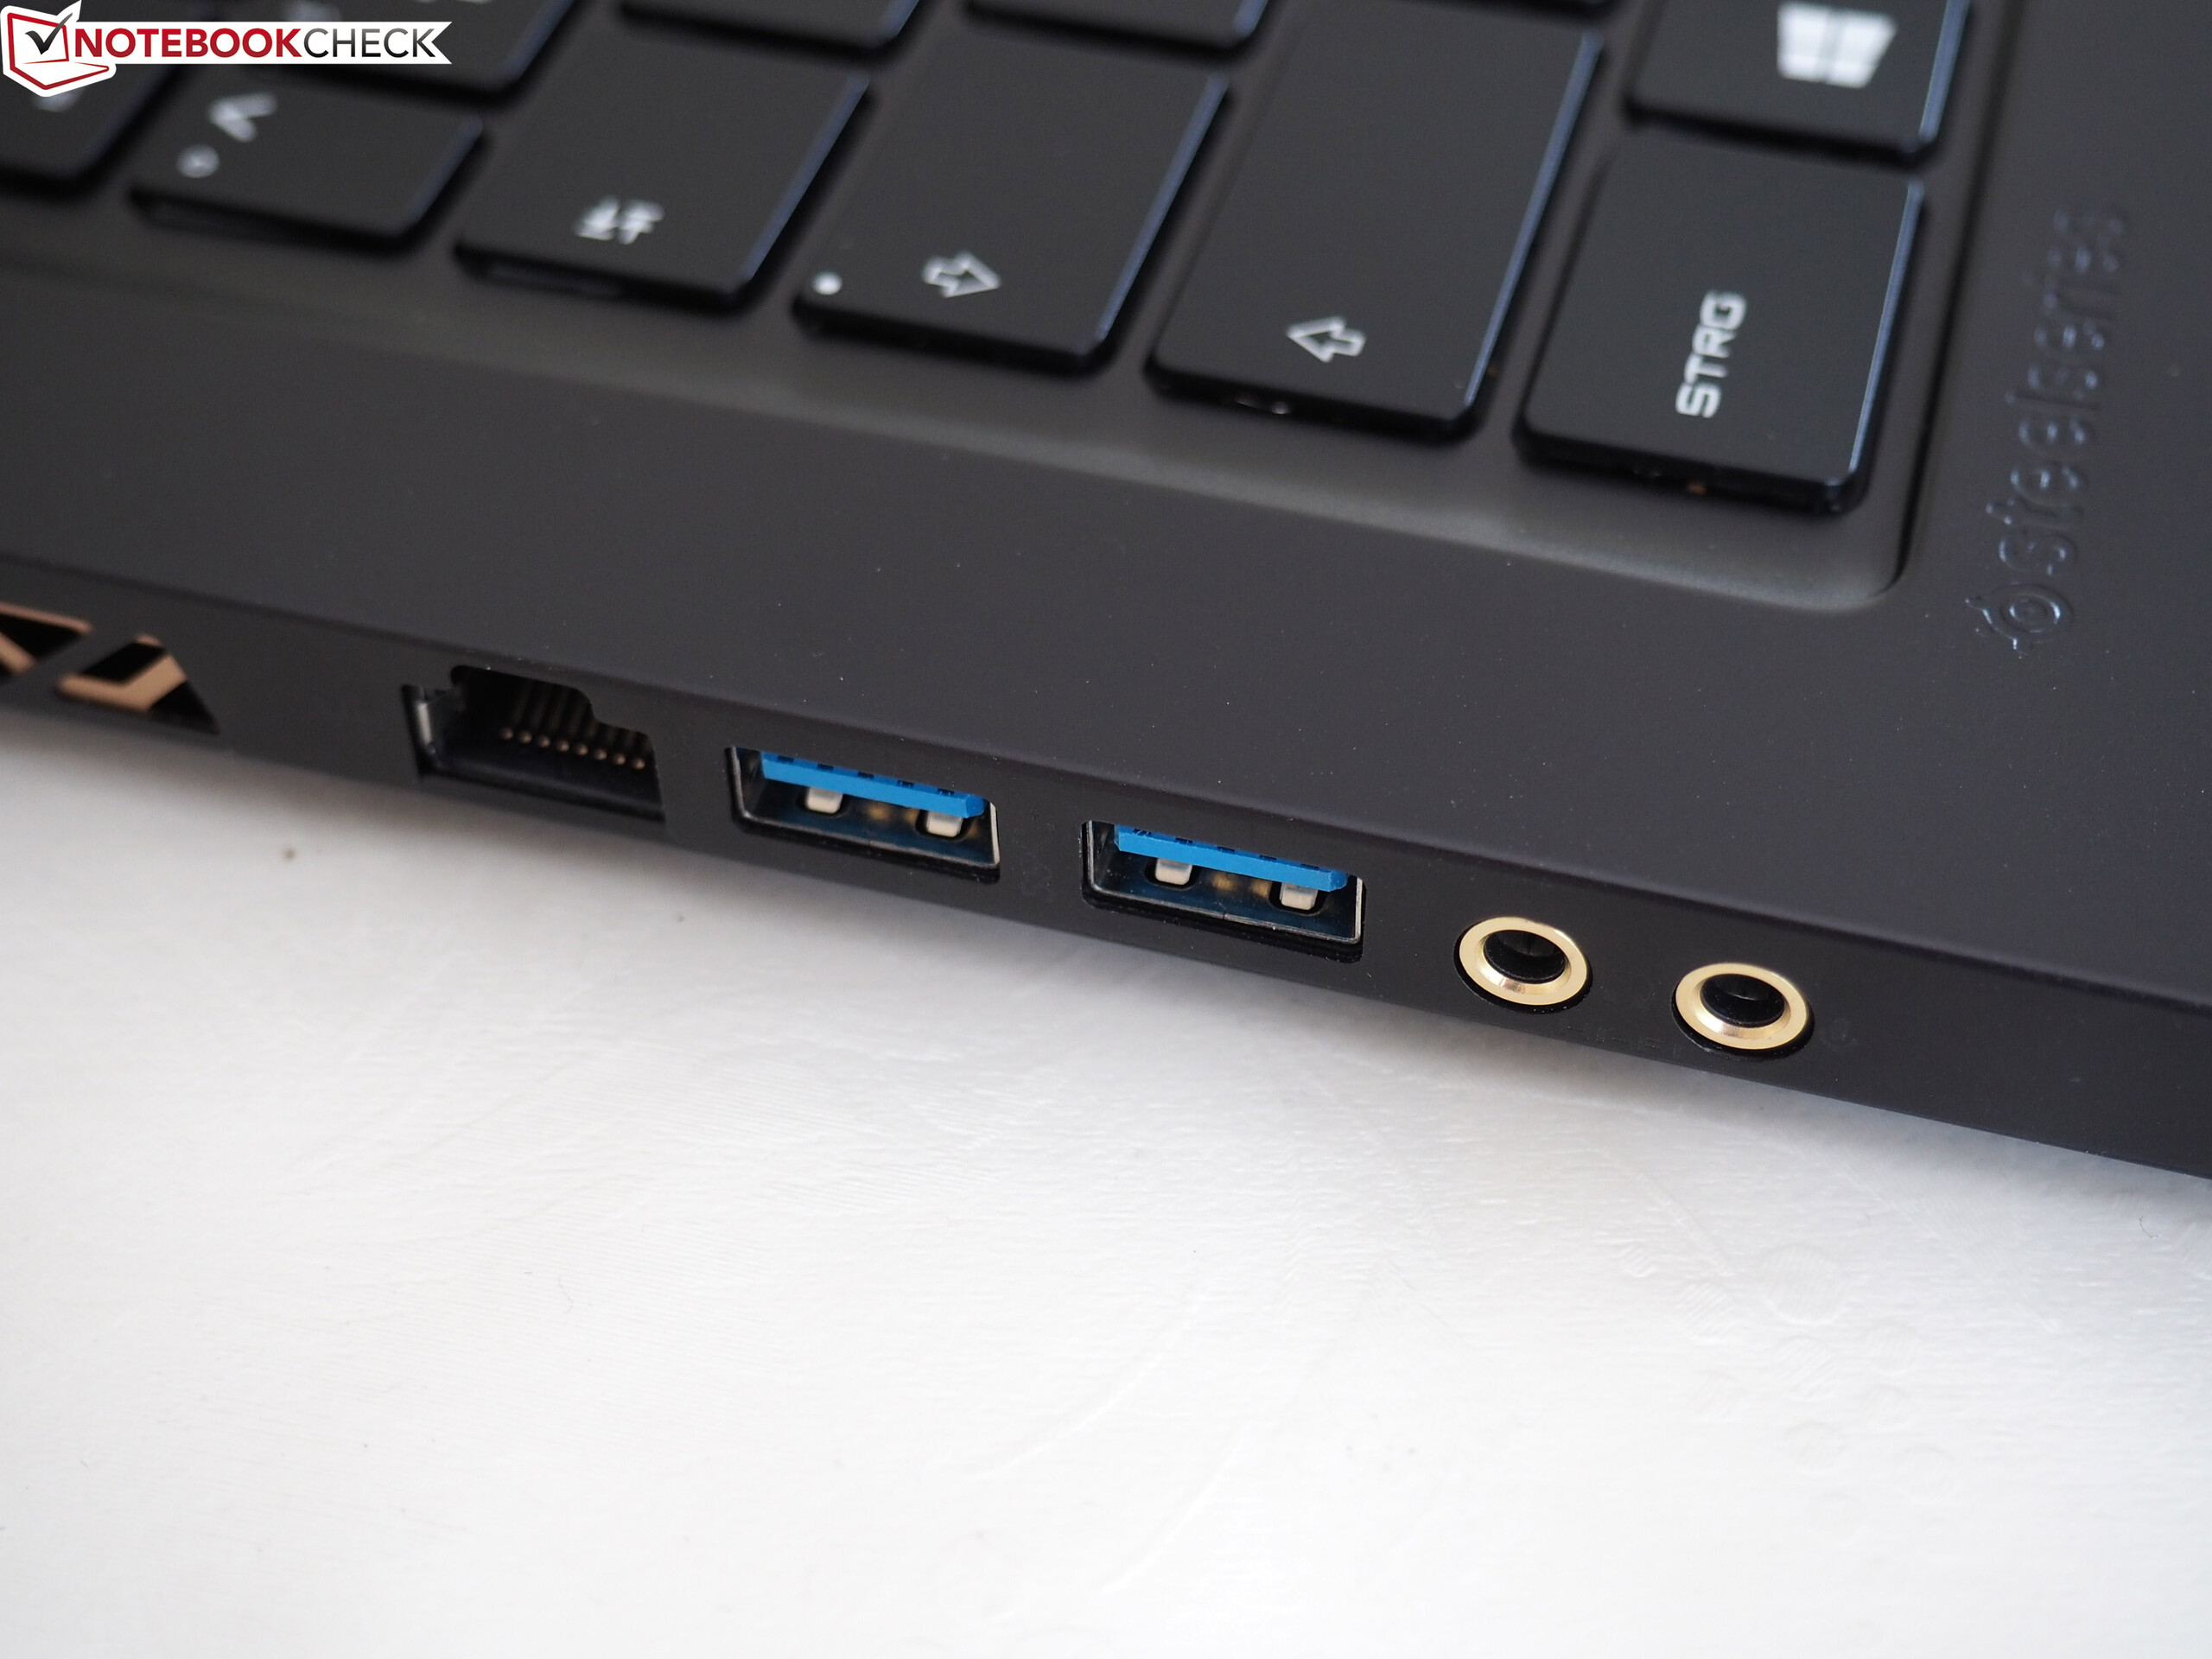
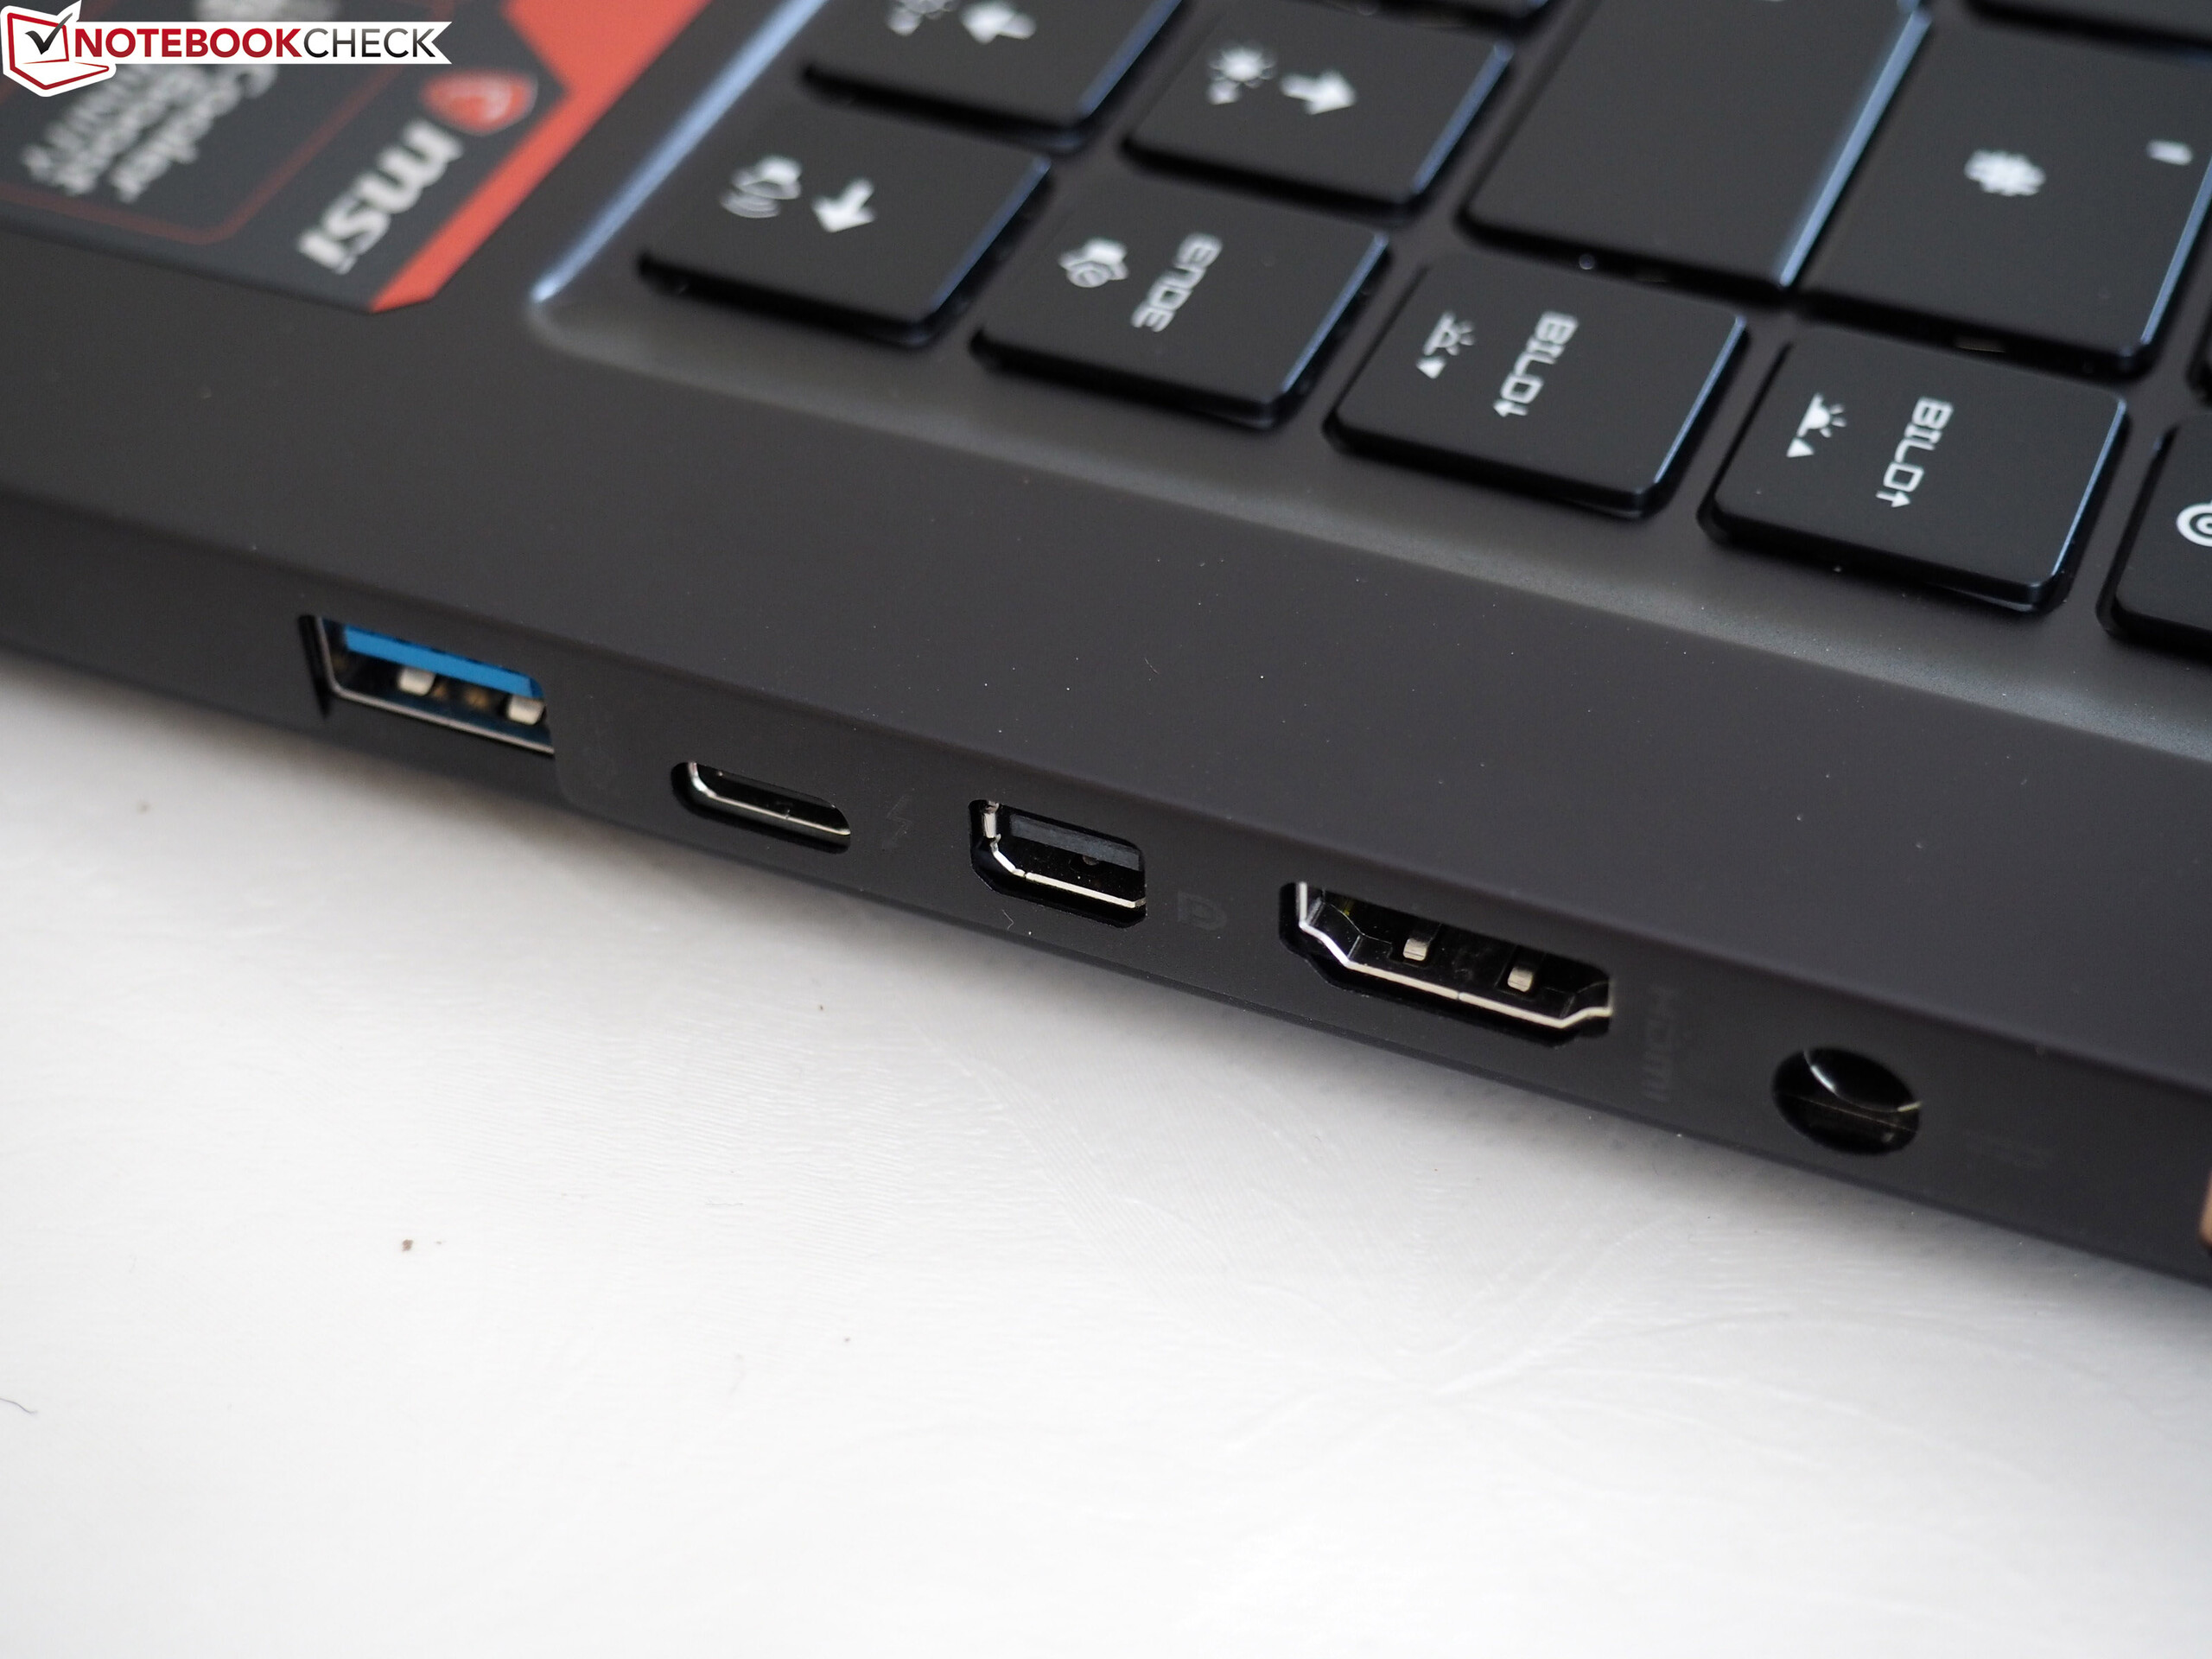
Resten av paketet är dock i huvudsak bra. GS65 är förvånansvärt lätt och ganska tyst vid belastning. Den antireflex-behandlade 144 Hz-skärmen har bra färgprecision och mättnad tillsammans med utmärkta betraktningsvinklar (även om ljusstyrka och kontrast kunde varit bättre). Bortsett från placeringen och avsaknaden av en kortläsare så är anslutbarheten nästan på samma nivå som Aero 15X. Och dessutom lyckas maskinen prestera bra med tanke på dess konfiguration — även om GTX 1060 inte är kraftfull nog för att dra full nytta av prakten från 144 Hz bilduppdatering i moderna spel (även om allt över 60 bilder per sekund kommer till nytta).
Från en rent statistisk synvinkel, och trots dess påfallande brister, förblir MSI GS65 en av de bästa tunna och lätta bärbara speldatorer som finns att tillgå för tillfället.
För 18.490 kronor är den definitivt inte billig — men priset är i linje med andra liknande modeller och kanske till och med en aning lägre. Innan du bestämmer dig för ett köp är det också värt att överväga bättre konstruerade konkurrenter såsom Gigabyte Aero 15X v8 och Razer Blade 15 — men kom ihåg att du behöver betala en del extra för den förmånen.
MSI GS65 Stealth Thin 8RE-051US
- 09/14/2018 v6 (old)
Steve Schardein
Price comparison
