Test: Gigabyte Aero 15-X9 (Core i7-8750H, RTX 2070 Max-Q) Laptop (Sammanfattning)
| SD Card Reader | |
| average JPG Copy Test (av. of 3 runs) | |
| Gigabyte Aero 15-X9 (Toshiba Exceria Pro SDXC 64 GB UHS-II) | |
| Gigabyte Aero 15X v8 (Toshiba Exceria Pro SDXC 64 GB UHS-II) | |
| Genomsnitt av klass Gaming (20.9 - 210, n=54, senaste 2 åren) | |
| maximum AS SSD Seq Read Test (1GB) | |
| Gigabyte Aero 15X v8 (Toshiba Exceria Pro SDXC 64 GB UHS-II) | |
| Gigabyte Aero 15-X9 (Toshiba Exceria Pro SDXC 64 GB UHS-II) | |
| Genomsnitt av klass Gaming (25.5 - 261, n=51, senaste 2 åren) | |
| |||||||||||||||||||||||||
Distribution av ljusstyrkan: 85 %
Mitt på batteriet: 250 cd/m²
Kontrast: 862:1 (Svärta: 0.29 cd/m²)
ΔE ColorChecker Calman: 1.46 | ∀{0.5-29.43 Ø4.71}
ΔE Greyscale Calman: 1.27 | ∀{0.09-98 Ø4.96}
93% sRGB (Argyll 1.6.3 3D)
60% AdobeRGB 1998 (Argyll 1.6.3 3D)
64.5% AdobeRGB 1998 (Argyll 3D)
93.1% sRGB (Argyll 3D)
63.5% Display P3 (Argyll 3D)
Gamma: 2.4
CCT: 6749 K
| Gigabyte Aero 15-X9 LGD05C0, IPS, 1920x1080 | Gigabyte Aero 15X v8 LGD05C0, IPS, 1920x1080 | Asus Zephyrus S GX531GS AU Optronics B156HAN08.2 (AUO82ED), IPS, 1920x1080 | MSI GS65 8RF-019DE Stealth Thin AU Optronics B156HAN08.0 (AUO80ED), IPS, 1920x1080 | Razer Blade 15 RTX 2070 Max-Q LG Philips LGD05C0, IPS, 1920x1080 | Acer Predator Triton 500 AU Optronics B156HAN08.2 (AUO82ED), IPS, 1920x1080 | |
|---|---|---|---|---|---|---|
| Display | 1% | 2% | 2% | 3% | 1% | |
| Display P3 Coverage (%) | 63.5 | 63.6 0% | 66.7 5% | 66.2 4% | 65.3 3% | 64.2 1% |
| sRGB Coverage (%) | 93.1 | 93.8 1% | 91.2 -2% | 92.1 -1% | 94.9 2% | 92.6 -1% |
| AdobeRGB 1998 Coverage (%) | 64.5 | 64.9 1% | 66.7 3% | 67.2 4% | 66.3 3% | 65.7 2% |
| Response Times | 8% | 41% | -1% | 7% | 35% | |
| Response Time Grey 50% / Grey 80% * (ms) | 16.4 ? | 16.8 ? -2% | 7.4 ? 55% | 17.6 ? -7% | 16.8 ? -2% | 8 ? 51% |
| Response Time Black / White * (ms) | 13.6 ? | 11.2 ? 18% | 10 ? 26% | 12.8 ? 6% | 11.6 ? 15% | 11.2 ? 18% |
| PWM Frequency (Hz) | ||||||
| Screen | 12% | -18% | -10% | -31% | -75% | |
| Brightness middle (cd/m²) | 250 | 313 25% | 294 18% | 254 2% | 314.7 26% | 304 22% |
| Brightness (cd/m²) | 235 | 300 28% | 275 17% | 262 11% | 312 33% | 299 27% |
| Brightness Distribution (%) | 85 | 78 -8% | 84 -1% | 89 5% | 90 6% | 89 5% |
| Black Level * (cd/m²) | 0.29 | 0.33 -14% | 0.24 17% | 0.22 24% | 0.38 -31% | 0.27 7% |
| Contrast (:1) | 862 | 948 10% | 1225 42% | 1155 34% | 828 -4% | 1126 31% |
| Colorchecker dE 2000 * | 1.46 | 1.29 12% | 2.57 -76% | 2.37 -62% | 2.56 -75% | 4.66 -219% |
| Colorchecker dE 2000 max. * | 2.47 | 2.04 17% | 4.88 -98% | 4.71 -91% | 4.89 -98% | 9.65 -291% |
| Greyscale dE 2000 * | 1.27 | 0.69 46% | 2.41 -90% | 1.58 -24% | 3.4 -168% | 5.53 -335% |
| Gamma | 2.4 92% | 2.43 91% | 2.5 88% | 2.48 89% | 2.3 96% | 2.5 88% |
| CCT | 6749 96% | 6550 99% | 6370 102% | 6785 96% | 6435 101% | 8028 81% |
| Color Space (Percent of AdobeRGB 1998) (%) | 60 | 60 0% | 59 -2% | 60 0% | 60.7 1% | 60 0% |
| Color Space (Percent of sRGB) (%) | 93 | 94 1% | 91 -2% | 92 -1% | 94.6 2% | 93 0% |
| Colorchecker dE 2000 calibrated * | 2.14 | 1.84 | 1.71 | 1.72 | ||
| Totalt genomsnitt (program/inställningar) | 7% /
9% | 8% /
-6% | -3% /
-6% | -7% /
-19% | -13% /
-45% |
* ... mindre är bättre
Visa svarstider
| ↔ Svarstid svart till vitt | ||
|---|---|---|
| 13.6 ms ... stiga ↗ och falla ↘ kombinerat | ↗ 8.4 ms stiga | 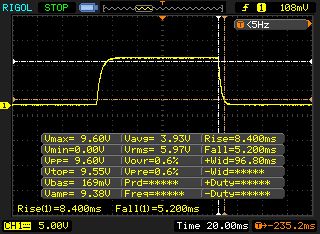 |
| ↘ 5.2 ms hösten | ||
| Skärmen visar bra svarsfrekvens i våra tester, men kan vara för långsam för konkurrenskraftiga spelare. I jämförelse sträcker sig alla testade enheter från 0.1 (minst) till 240 (maximalt) ms. » 34 % av alla enheter är bättre. Det betyder att den uppmätta svarstiden är bättre än genomsnittet av alla testade enheter (19.8 ms). | ||
| ↔ Svarstid 50 % grått till 80 % grått | ||
| 16.4 ms ... stiga ↗ och falla ↘ kombinerat | ↗ 8.8 ms stiga | 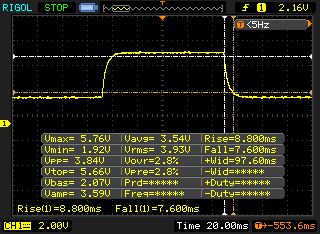 |
| ↘ 7.6 ms hösten | ||
| Skärmen visar bra svarsfrekvens i våra tester, men kan vara för långsam för konkurrenskraftiga spelare. I jämförelse sträcker sig alla testade enheter från 0.165 (minst) till 636 (maximalt) ms. » 31 % av alla enheter är bättre. Det betyder att den uppmätta svarstiden är bättre än genomsnittet av alla testade enheter (31 ms). | ||
Skärmflimmer / PWM (Puls-Width Modulation)
| Skärmflimmer / PWM upptäcktes inte |  | ||
Som jämförelse: 52 % av alla testade enheter använder inte PWM för att dämpa skärmen. Om PWM upptäcktes mättes ett medelvärde av 7754 (minst: 5 - maximum: 343500) Hz. | |||
| Cinebench R10 | |
| Rendering Single 32Bit | |
| Genomsnitt av klass Gaming (7457 - 12575, n=9, senaste 2 åren) | |
| Gigabyte Aero 15-X9 | |
| Rendering Multiple CPUs 32Bit | |
| Genomsnitt av klass Gaming (42932 - 102066, n=9, senaste 2 åren) | |
| Gigabyte Aero 15-X9 | |
| Geekbench 3 | |
| 32 Bit Multi-Core Score | |
| Gigabyte Aero 15-X9 | |
| 32 Bit Single-Core Score | |
| Gigabyte Aero 15-X9 | |
| Geekbench 4.0 | |
| 64 Bit Multi-Core Score | |
| Genomsnitt av klass Gaming (40469 - 76142, n=4, senaste 2 åren) | |
| Gigabyte Aero 15-X9 | |
| 64 Bit Single-Core Score | |
| Genomsnitt av klass Gaming (7589 - 9053, n=4, senaste 2 åren) | |
| Gigabyte Aero 15-X9 | |
| Geekbench 4.4 | |
| 64 Bit Multi-Core Score | |
| Genomsnitt av klass Gaming (89200 - 101054, n=3, senaste 2 åren) | |
| Gigabyte Aero 15-X9 | |
| 64 Bit Single-Core Score | |
| Genomsnitt av klass Gaming (9335 - 9775, n=3, senaste 2 åren) | |
| Gigabyte Aero 15-X9 | |
| Mozilla Kraken 1.1 - Total | |
| Gigabyte Aero 15-X9 (Edge 44) | |
| Razer Blade 15 RTX 2070 Max-Q (Edge 44.17763.1.0) | |
| Genomsnitt av klass Gaming (391 - 590, n=100, senaste 2 åren) | |
| Octane V2 - Total Score | |
| Genomsnitt av klass Gaming (93292 - 139447, n=27, senaste 2 åren) | |
| Gigabyte Aero 15-X9 (Edge 44) | |
| Razer Blade 15 RTX 2070 Max-Q (Edge 44.17763.1.0) | |
| JetStream 1.1 - 1.1 Total | |
| Genomsnitt av klass Gaming (549 - 647, n=3, senaste 2 åren) | |
| Razer Blade 15 RTX 2070 Max-Q (Edge 44.17763.1.0) | |
| Gigabyte Aero 15-X9 (Edge 44) | |
* ... mindre är bättre
| PCMark 7 Score | 6400 poäng | |
| PCMark 8 Home Score Accelerated v2 | 4338 poäng | |
| PCMark 8 Creative Score Accelerated v2 | 5111 poäng | |
| PCMark 8 Work Score Accelerated v2 | 5645 poäng | |
| PCMark 10 Score | 5353 poäng | |
Hjälp | ||

| Gigabyte Aero 15-X9 Intel SSD 760p SSDPEKKW010T8 | Gigabyte Aero 15X v8 Toshiba NVMe THNSN5512GPU7 | Asus Zephyrus S GX531GS WDC PC SN520 SDAPNUW-512G | MSI GS65 8RF-019DE Stealth Thin Samsung SSD PM981 MZVLB512HAJQ | Razer Blade 15 RTX 2070 Max-Q Samsung SSD PM981 MZVLB512HAJQ | Acer Predator Triton 500 2x WDC PC SN720 SDAPNTW-256G-1014 (RAID 0) | |
|---|---|---|---|---|---|---|
| CrystalDiskMark 5.2 / 6 | -10% | -14% | 1% | 3% | 23% | |
| Write 4K (MB/s) | 97.1 | 94.4 -3% | 98.2 1% | 95.3 -2% | 93.9 -3% | 93.6 -4% |
| Read 4K (MB/s) | 53.7 | 37.65 -30% | 39.43 -27% | 40.13 -25% | 40.56 -24% | 38.82 -28% |
| Write Seq (MB/s) | 1526 | 1335 -13% | 1386 -9% | 1883 23% | 1468 -4% | 2455 61% |
| Read Seq (MB/s) | 2020 | 1404 -30% | 1100 -46% | 1322 -35% | 1540 -24% | 2107 4% |
| Write 4K Q32T1 (MB/s) | 285.6 | 268.6 -6% | 270.3 -5% | 309.9 9% | 293.5 3% | 298.7 5% |
| Read 4K Q32T1 (MB/s) | 321.8 | 332.8 3% | 340.3 6% | 353.7 10% | 346 8% | 338.7 5% |
| Write Seq Q32T1 (MB/s) | 1533 | 1375 -10% | 1454 -5% | 1919 25% | 1941 27% | 2902 89% |
| Read Seq Q32T1 (MB/s) | 2351 | 2627 12% | 1681 -28% | 2466 5% | 3266 39% | 3536 50% |
| 3DMark 06 Standard Score | 34534 poäng | |
| 3DMark 11 Performance | 16608 poäng | |
| 3DMark Ice Storm Standard Score | 80496 poäng | |
| 3DMark Cloud Gate Standard Score | 31838 poäng | |
| 3DMark Fire Strike Score | 15587 poäng | |
| 3DMark Time Spy Score | 6400 poäng | |
Hjälp | ||
| 3DMark | |
| 1920x1080 Fire Strike Graphics | |
| Genomsnitt av klass Gaming (12242 - 62849, n=115, senaste 2 åren) | |
| Razer Blade 15 RTX 2070 Max-Q | |
| Gigabyte Aero 15-X9 | |
| Gigabyte Aero 15X v8 | |
| MSI GS65 8RF-019DE Stealth Thin | |
| 2560x1440 Time Spy Graphics | |
| Genomsnitt av klass Gaming (5012 - 26212, n=115, senaste 2 åren) | |
| Razer Blade 15 RTX 2070 Max-Q | |
| Gigabyte Aero 15-X9 | |
| 2560x1440 Port Royal Graphics | |
| Genomsnitt av klass Gaming (4395 - 17286, n=71, senaste 2 åren) | |
| Razer Blade 15 RTX 2070 Max-Q | |
| Gigabyte Aero 15-X9 | |
| låg | med. | hög | ultra | |
|---|---|---|---|---|
| BioShock Infinite (2013) | 233.9 | 217.9 | 202.6 | 127.7 |
| GTA V (2015) | 133.1 | 123.1 | 92.9 | 54.2 |
| The Witcher 3 (2015) | 177.7 | 144.9 | 86.5 | 58.3 |
| Ashes of the Singularity (2016) | 60.2 | 53.1 | 52.6 | |
| Destiny 2 (2017) | 110.9 | 95.9 | 96.9 | 96.1 |
| X-Plane 11.11 (2018) | 84.6 | 70.2 | 61.6 | |
| Far Cry 5 (2018) | 94 | 73 | 70 | 67 |
| Darksiders III (2018) | 102.2 | 68.2 | 65.3 | 64.9 |
| The Witcher 3 - 1920x1080 Ultra Graphics & Postprocessing (HBAO+) | |
| Genomsnitt av klass Gaming (104.7 - 240, n=7, senaste 2 åren) | |
| Acer Predator Triton 500 | |
| Razer Blade 15 RTX 2070 Max-Q | |
| Gigabyte Aero 15-X9 | |
| MSI GS65 8RF-019DE Stealth Thin | |
| Gigabyte Aero 15X v8 | |
| Asus Zephyrus S GX531GS | |
| BioShock Infinite - 1920x1080 Ultra Preset, DX11 (DDOF) | |
| Razer Blade 15 RTX 2070 Max-Q | |
| Gigabyte Aero 15-X9 | |
Ljudnivå
| Låg belastning |
| 32 / 34 / 36 dB(A) |
| Hög belastning |
| 42 / 48 dB(A) |
 | ||
30 dB tyst 40 dB(A) hörbar 50 dB(A) högt ljud |
||
min: | ||
| Gigabyte Aero 15-X9 i7-8750H, GeForce RTX 2070 Max-Q | Gigabyte Aero 15X v8 i7-8750H, GeForce GTX 1070 Max-Q | Asus Zephyrus S GX531GS i7-8750H, GeForce GTX 1070 Max-Q | MSI GS65 8RF-019DE Stealth Thin i7-8750H, GeForce GTX 1070 Max-Q | Razer Blade 15 RTX 2070 Max-Q i7-8750H, GeForce RTX 2070 Max-Q | Acer Predator Triton 500 i7-8750H, GeForce RTX 2080 Max-Q | Genomsnitt av klass Gaming | |
|---|---|---|---|---|---|---|---|
| Noise | -4% | -7% | 5% | 10% | 2% | 10% | |
| av / miljö * (dB) | 30 | 29 3% | 29 3% | 30 -0% | 28.8 4% | 29 3% | 24.1 ? 20% |
| Idle Minimum * (dB) | 32 | 30 6% | 33 -3% | 30 6% | 28.8 10% | 30 6% | 26 ? 19% |
| Idle Average * (dB) | 34 | 31 9% | 34 -0% | 31 9% | 28.8 15% | 32 6% | 27.4 ? 19% |
| Idle Maximum * (dB) | 36 | 35 3% | 40 -11% | 34 6% | 29.4 18% | 34 6% | 30.1 ? 16% |
| Load Average * (dB) | 42 | 49 -17% | 47 -12% | 43 -2% | 35.7 15% | 44 -5% | 43.6 ? -4% |
| Witcher 3 ultra * (dB) | 44 | 51 -16% | 51 -16% | 42 5% | 42.5 3% | 46 -5% | |
| Load Maximum * (dB) | 48 | 54 -13% | 53 -10% | 44 8% | 45 6% | 47 2% | 54.2 ? -13% |
* ... mindre är bättre
(-) Den maximala temperaturen på ovansidan är 56 °C / 133 F, jämfört med genomsnittet av 40.4 °C / 105 F , allt från 21.2 till 68.8 °C för klassen Gaming.
(-) Botten värms upp till maximalt 66 °C / 151 F, jämfört med genomsnittet av 43.2 °C / 110 F
(+) Vid tomgångsbruk är medeltemperaturen för ovansidan 25.4 °C / 78 F, jämfört med enhetsgenomsnittet på 33.9 °C / ### class_avg_f### F.
(-) När du spelar The Witcher 3 är medeltemperaturen för ovansidan 44.3 °C / 112 F, jämfört med enhetsgenomsnittet på 33.9 °C / ## #class_avg_f### F.
(±) Handledsstöden och pekplattan kan bli väldigt varma vid beröring med maximalt 38 °C / 100.4 F.
(-) Medeltemperaturen för handledsstödsområdet på liknande enheter var 28.8 °C / 83.8 F (-9.2 °C / -16.6 F).
| Gigabyte Aero 15-X9 i7-8750H, GeForce RTX 2070 Max-Q | Gigabyte Aero 15X v8 i7-8750H, GeForce GTX 1070 Max-Q | Asus Zephyrus S GX531GS i7-8750H, GeForce GTX 1070 Max-Q | MSI GS65 8RF-019DE Stealth Thin i7-8750H, GeForce GTX 1070 Max-Q | Razer Blade 15 RTX 2070 Max-Q i7-8750H, GeForce RTX 2070 Max-Q | Acer Predator Triton 500 i7-8750H, GeForce RTX 2080 Max-Q | Genomsnitt av klass Gaming | |
|---|---|---|---|---|---|---|---|
| Heat | 0% | -2% | 9% | 11% | -5% | 1% | |
| Maximum Upper Side * (°C) | 56 | 53 5% | 54 4% | 49 12% | 49 12% | 49 12% | 45.2 ? 19% |
| Maximum Bottom * (°C) | 66 | 65 2% | 60 9% | 63 5% | 49 26% | 58 12% | 48.1 ? 27% |
| Idle Upper Side * (°C) | 27 | 26 4% | 30 -11% | 24 11% | 25.4 6% | 33 -22% | 31 ? -15% |
| Idle Bottom * (°C) | 27 | 30 -11% | 30 -11% | 25 7% | 27.2 -1% | 33 -22% | 34.2 ? -27% |
* ... mindre är bättre
Gigabyte Aero 15-X9 ljudanalys
(±) | högtalarljudstyrkan är genomsnittlig men bra (81 dB)
Bas 100 - 315 Hz
(±) | reducerad bas - i genomsnitt 14% lägre än medianen
(±) | linjäriteten för basen är genomsnittlig (13.7% delta till föregående frekvens)
Mellan 400 - 2000 Hz
(±) | högre mellan - i genomsnitt 6.2% högre än median
(±) | linjäriteten för mids är genomsnittlig (7.9% delta till föregående frekvens)
Högsta 2 - 16 kHz
(+) | balanserade toppar - endast 4.4% från medianen
(±) | linjäriteten för toppar är genomsnittlig (9.7% delta till föregående frekvens)
Totalt 100 - 16 000 Hz
(±) | linjäriteten för det totala ljudet är genomsnittlig (17.5% skillnad mot median)
Jämfört med samma klass
» 49% av alla testade enheter i den här klassen var bättre, 12% liknande, 39% sämre
» Den bästa hade ett delta på 6%, genomsnittet var 18%, sämst var 132%
Jämfört med alla testade enheter
» 34% av alla testade enheter var bättre, 8% liknande, 58% sämre
» Den bästa hade ett delta på 4%, genomsnittet var 23%, sämst var 134%
Gigabyte Aero 15X v8 ljudanalys
(±) | högtalarljudstyrkan är genomsnittlig men bra (78 dB)
Bas 100 - 315 Hz
(-) | nästan ingen bas - i genomsnitt 16.8% lägre än medianen
(±) | linjäriteten för basen är genomsnittlig (11.6% delta till föregående frekvens)
Mellan 400 - 2000 Hz
(+) | balanserad mellan - endast 4.3% från medianen
(+) | mids är linjära (5% delta till föregående frekvens)
Högsta 2 - 16 kHz
(+) | balanserade toppar - endast 3.6% från medianen
(±) | linjäriteten för toppar är genomsnittlig (9.1% delta till föregående frekvens)
Totalt 100 - 16 000 Hz
(±) | linjäriteten för det totala ljudet är genomsnittlig (18.4% skillnad mot median)
Jämfört med samma klass
» 59% av alla testade enheter i den här klassen var bättre, 9% liknande, 32% sämre
» Den bästa hade ett delta på 6%, genomsnittet var 18%, sämst var 132%
Jämfört med alla testade enheter
» 41% av alla testade enheter var bättre, 8% liknande, 51% sämre
» Den bästa hade ett delta på 4%, genomsnittet var 23%, sämst var 134%
| Av/Standby | |
| Låg belastning | |
| Hög belastning |
|
Förklaring:
min: | |
| Gigabyte Aero 15-X9 i7-8750H, GeForce RTX 2070 Max-Q | Gigabyte Aero 15X v8 i7-8750H, GeForce GTX 1070 Max-Q | Asus Zephyrus S GX531GS i7-8750H, GeForce GTX 1070 Max-Q | MSI GS65 8RF-019DE Stealth Thin i7-8750H, GeForce GTX 1070 Max-Q | Razer Blade 15 RTX 2070 Max-Q i7-8750H, GeForce RTX 2070 Max-Q | Acer Predator Triton 500 i7-8750H, GeForce RTX 2080 Max-Q | Genomsnitt av klass Gaming | |
|---|---|---|---|---|---|---|---|
| Power Consumption | -2% | -21% | 13% | 7% | -15% | -15% | |
| Idle Minimum * (Watt) | 16 | 14 12% | 17 -6% | 7 56% | 10.4 35% | 16 -0% | 13 ? 19% |
| Idle Average * (Watt) | 18 | 18 -0% | 20 -11% | 11 39% | 14.6 19% | 22 -22% | 19 ? -6% |
| Idle Maximum * (Watt) | 23 | 22 4% | 29 -26% | 20 13% | 16.3 29% | 32 -39% | 24.6 ? -7% |
| Load Average * (Watt) | 88 | 91 -3% | 112 -27% | 98 -11% | 88.5 -1% | 89 -1% | 110.7 ? -26% |
| Witcher 3 ultra * (Watt) | 120 | 142 -18% | 152 -27% | 132 -10% | 155.4 -30% | 147 -23% | |
| Load Maximum * (Watt) | 167 | 173 -4% | 211 -26% | 182 -9% | 182.4 -9% | 173 -4% | 259 ? -55% |
* ... mindre är bättre
| Gigabyte Aero 15-X9 i7-8750H, GeForce RTX 2070 Max-Q, 94.24 Wh | Gigabyte Aero 15X v8 i7-8750H, GeForce GTX 1070 Max-Q, 94.24 Wh | Asus Zephyrus S GX531GS i7-8750H, GeForce GTX 1070 Max-Q, 50 Wh | MSI GS65 8RF-019DE Stealth Thin i7-8750H, GeForce GTX 1070 Max-Q, 82 Wh | Razer Blade 15 RTX 2070 Max-Q i7-8750H, GeForce RTX 2070 Max-Q, 80 Wh | Acer Predator Triton 500 i7-8750H, GeForce RTX 2080 Max-Q, 82 Wh | Genomsnitt av klass Gaming | |
|---|---|---|---|---|---|---|---|
| Batteridrifttid | 25% | -65% | -17% | -7% | -47% | -3% | |
| Reader / Idle (h) | 9.2 | 12.7 38% | 3.6 -61% | 8.5 -8% | 11.4 24% | 5.6 -39% | 8.27 ? -10% |
| H.264 (h) | 6.1 | 8.4 38% | 5.9 -3% | 8.32 ? 36% | |||
| WiFi v1.3 (h) | 6.4 | 8.6 34% | 2.6 -59% | 6 -6% | 6.5 2% | 3.2 -50% | 7.11 ? 11% |
| Load (h) | 2.9 | 2.6 -10% | 0.7 -76% | 1.4 -52% | 1.5 -48% | 1.4 -52% | 1.502 ? -48% |
För
Emot
Läs den fullständiga versionen av den här recensionen på engelska här.
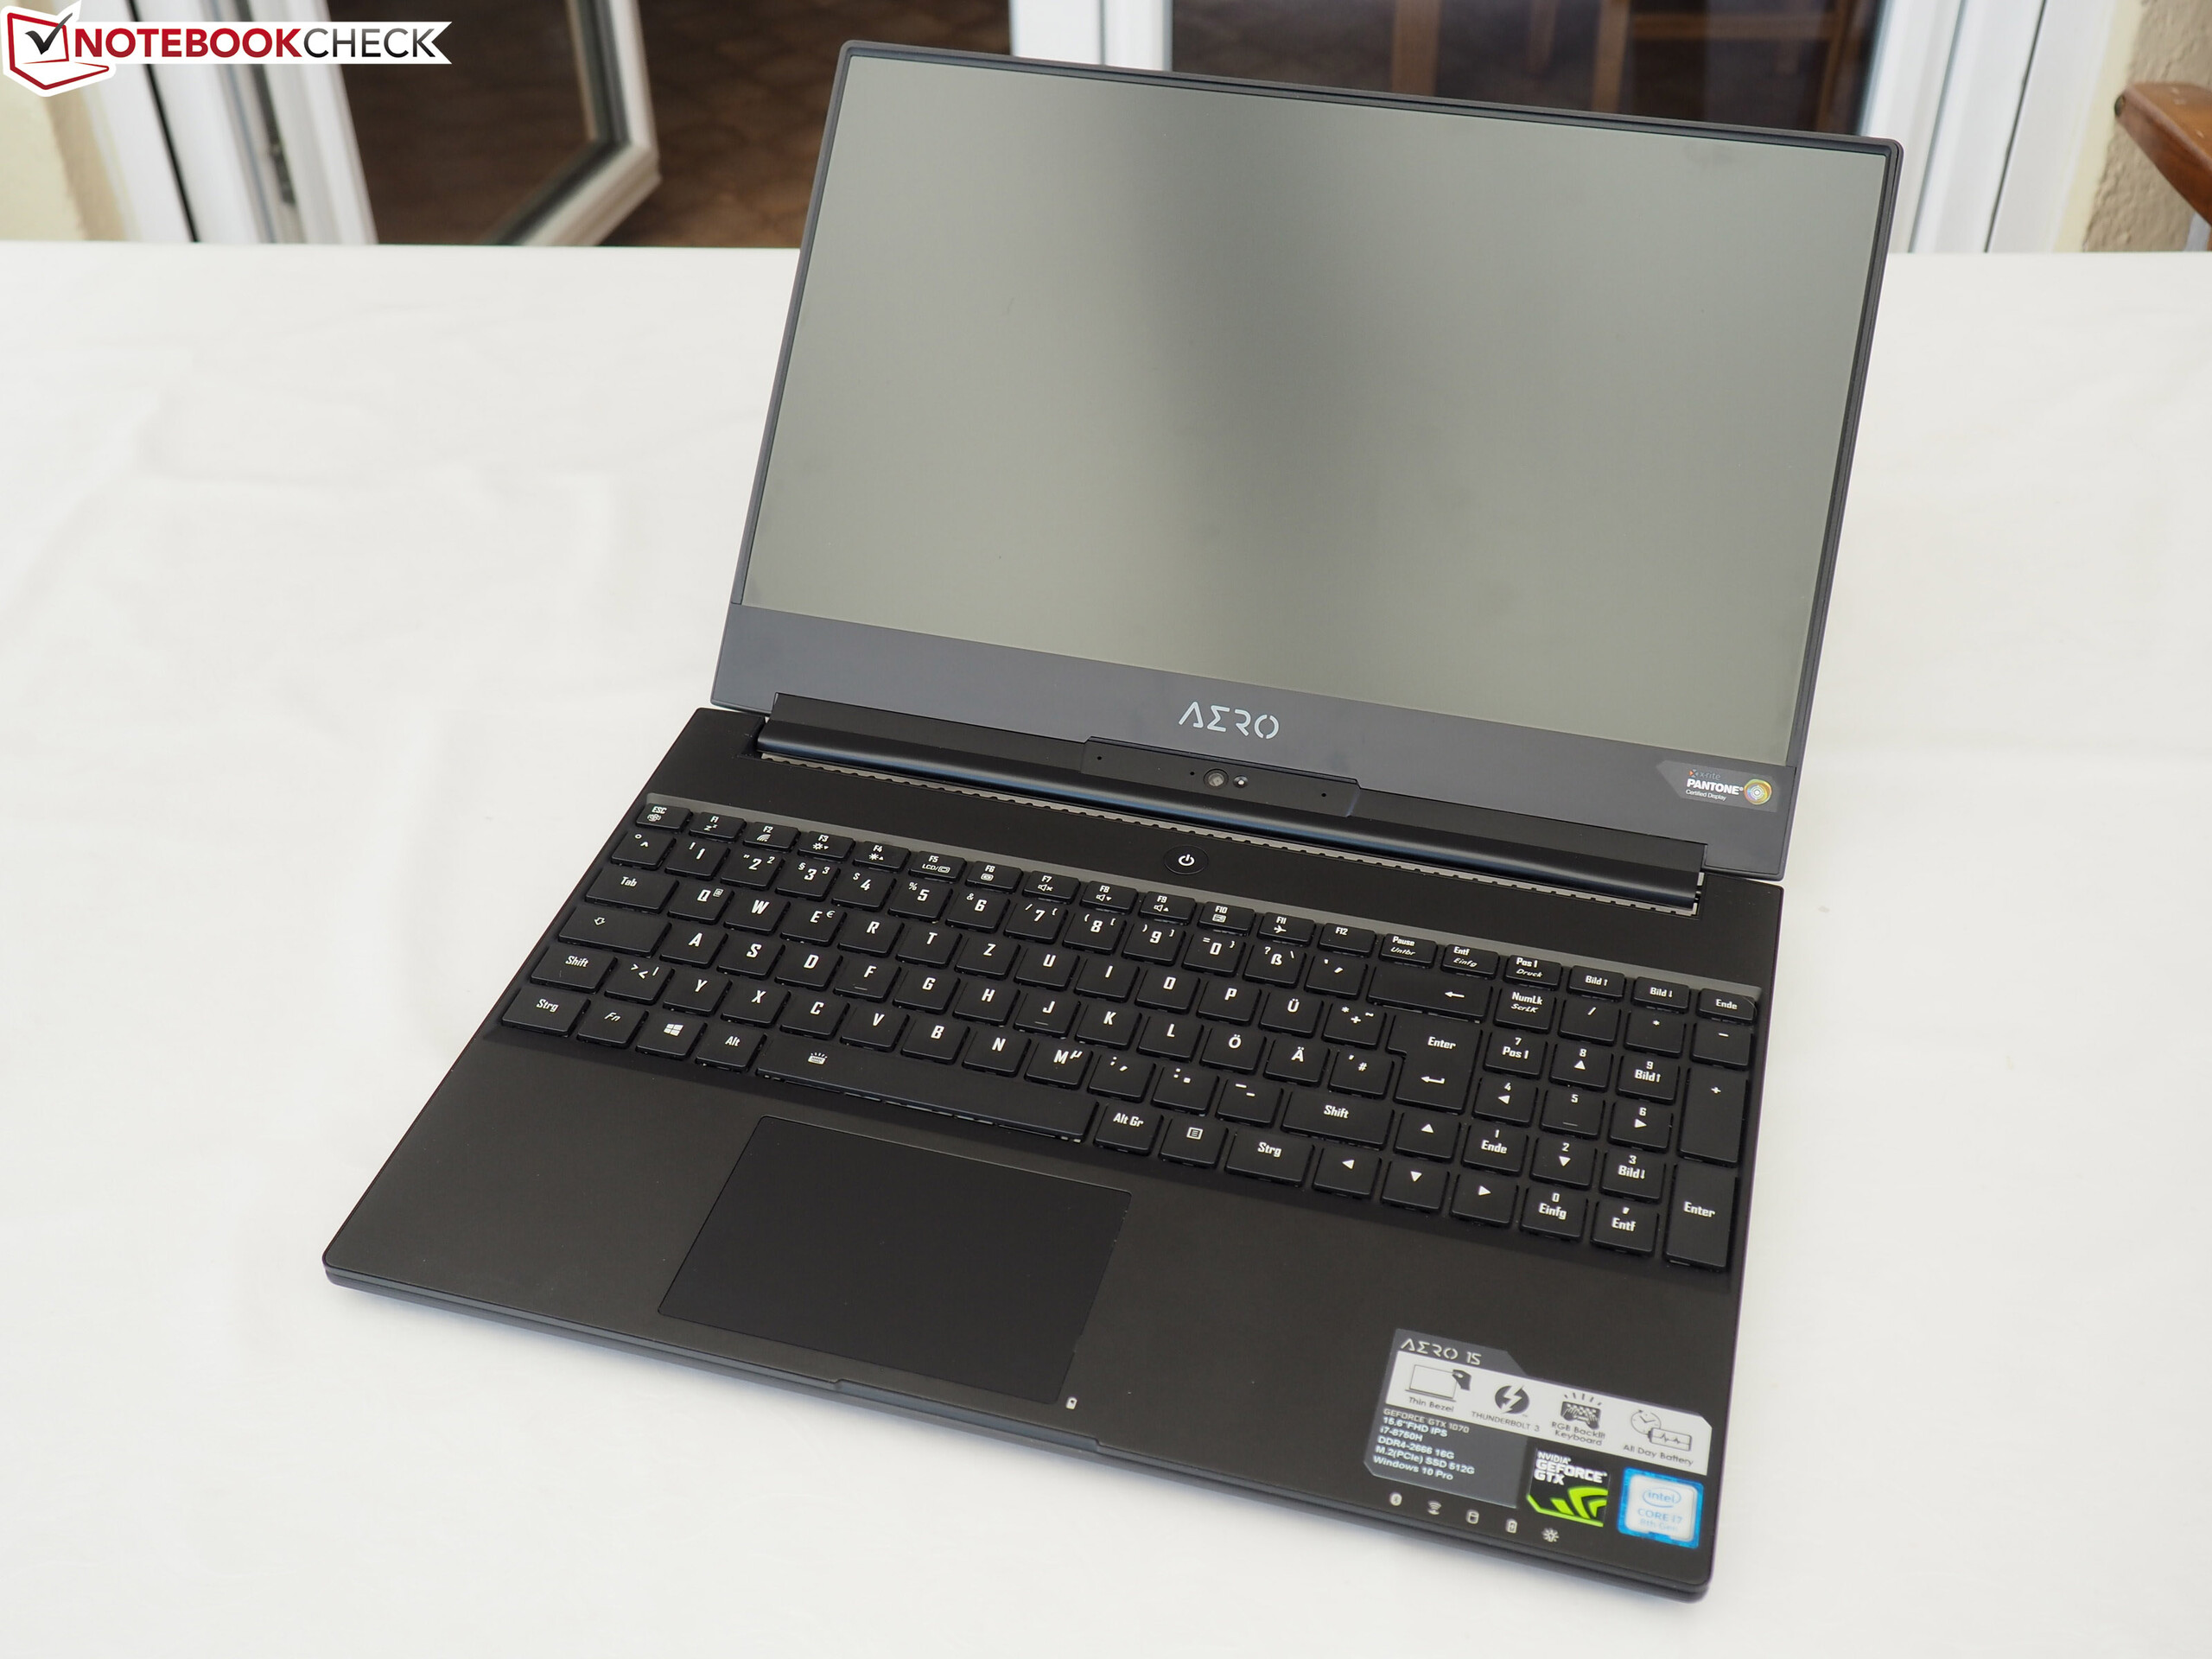
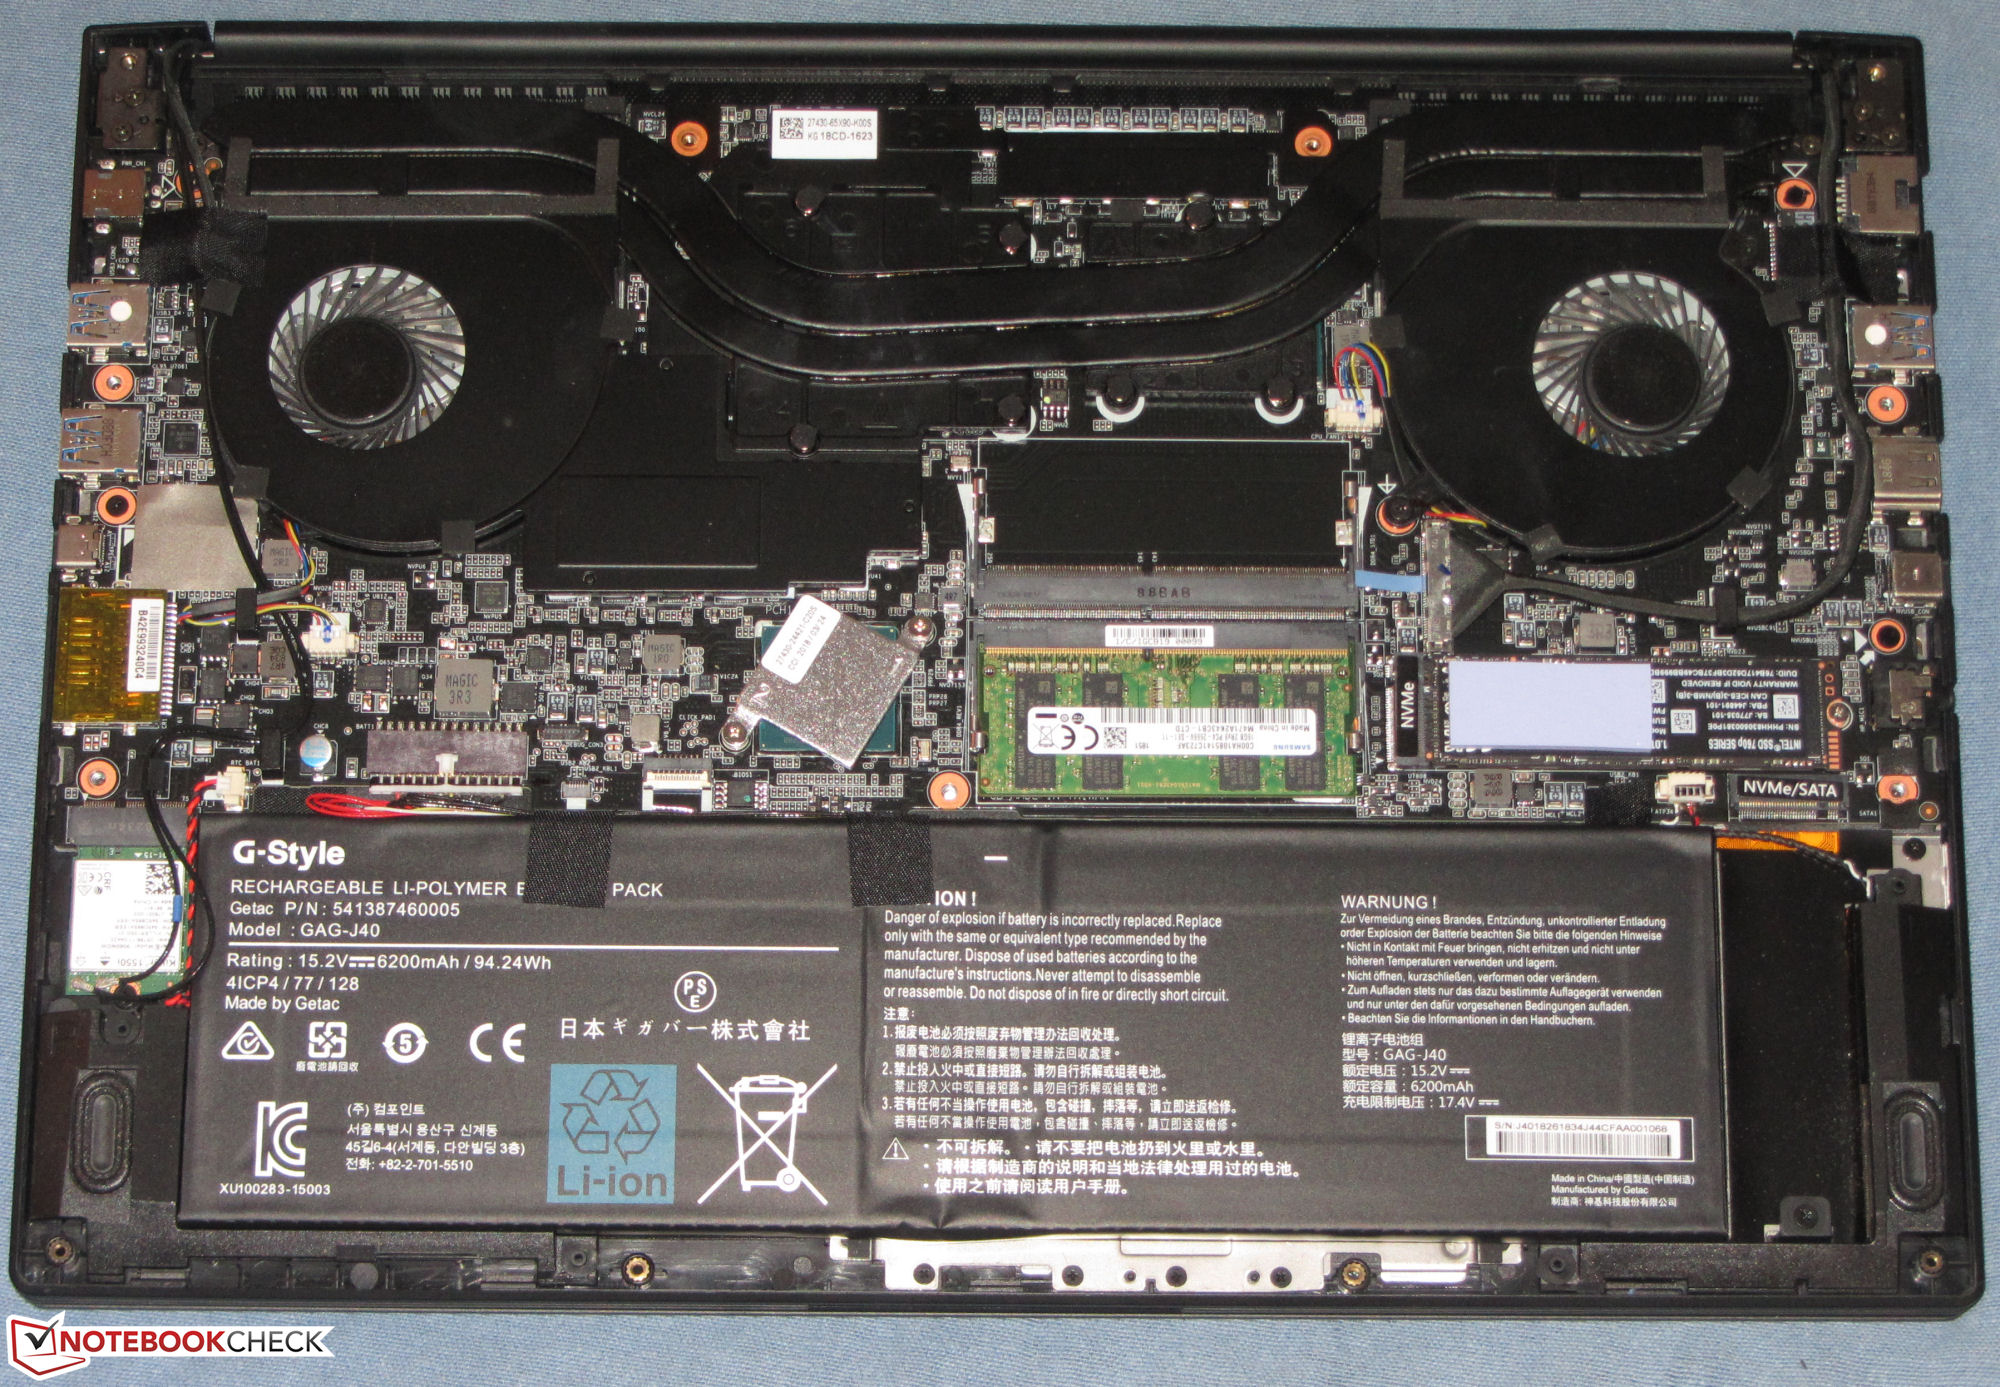
Gigabyte Aero 15-X9 är en utmärkt spellaptop men den utgör egentligen bara en förfining jämfört med sin föregångare och lägger dessutom till ett par brister. En Core i7-8750H processor och en RTX-2070 Max-Q GPU är en vinnande kombination som är tillräckligt kraftfull för att hantera alla AAA-spel med maximala grafikinställningar i 1080p. Vidare säkrar en NVMe SSD att systemet körs smidigt även vid ihållande belastning. Enheten är också lätt att underhålla och uppgradera, vilket är en bonus.
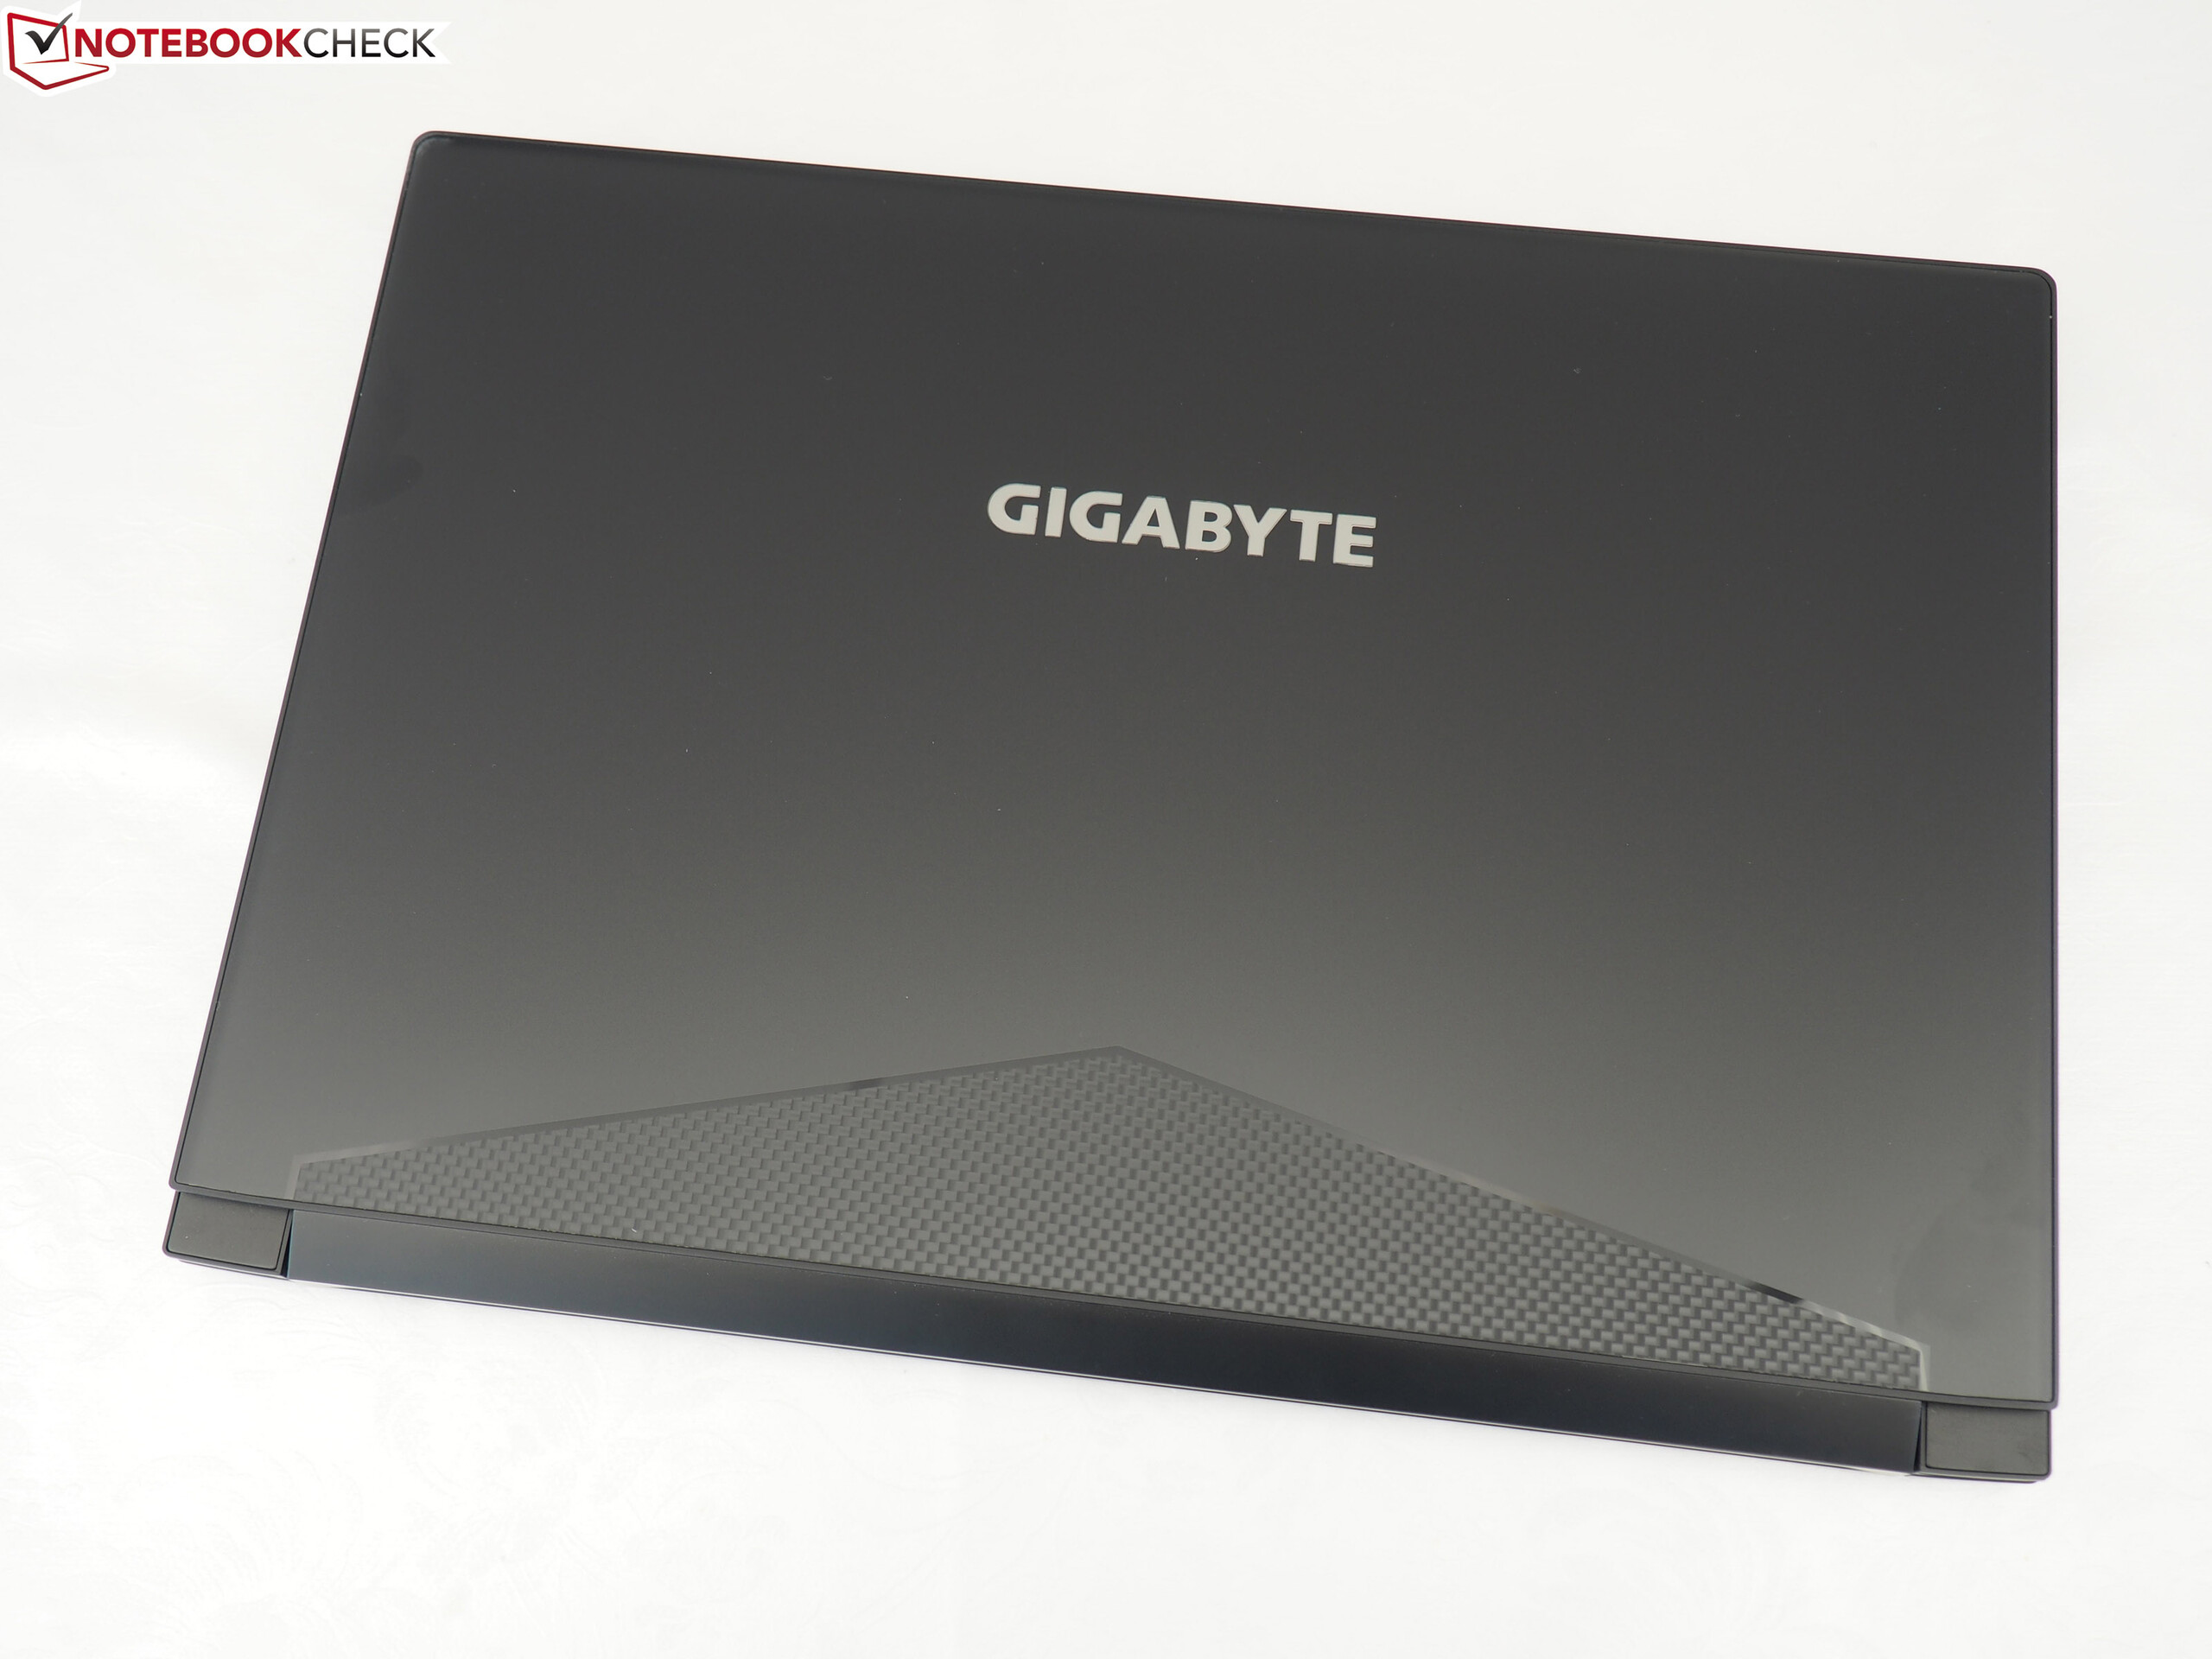
Gigabyte Aero 15-X9 är bland de bästa i klassen när det kommer till tunna och lätta bärbara speldatorer, men den är inte riktigt lika imponerande som föregångaren var för ett år sedan.
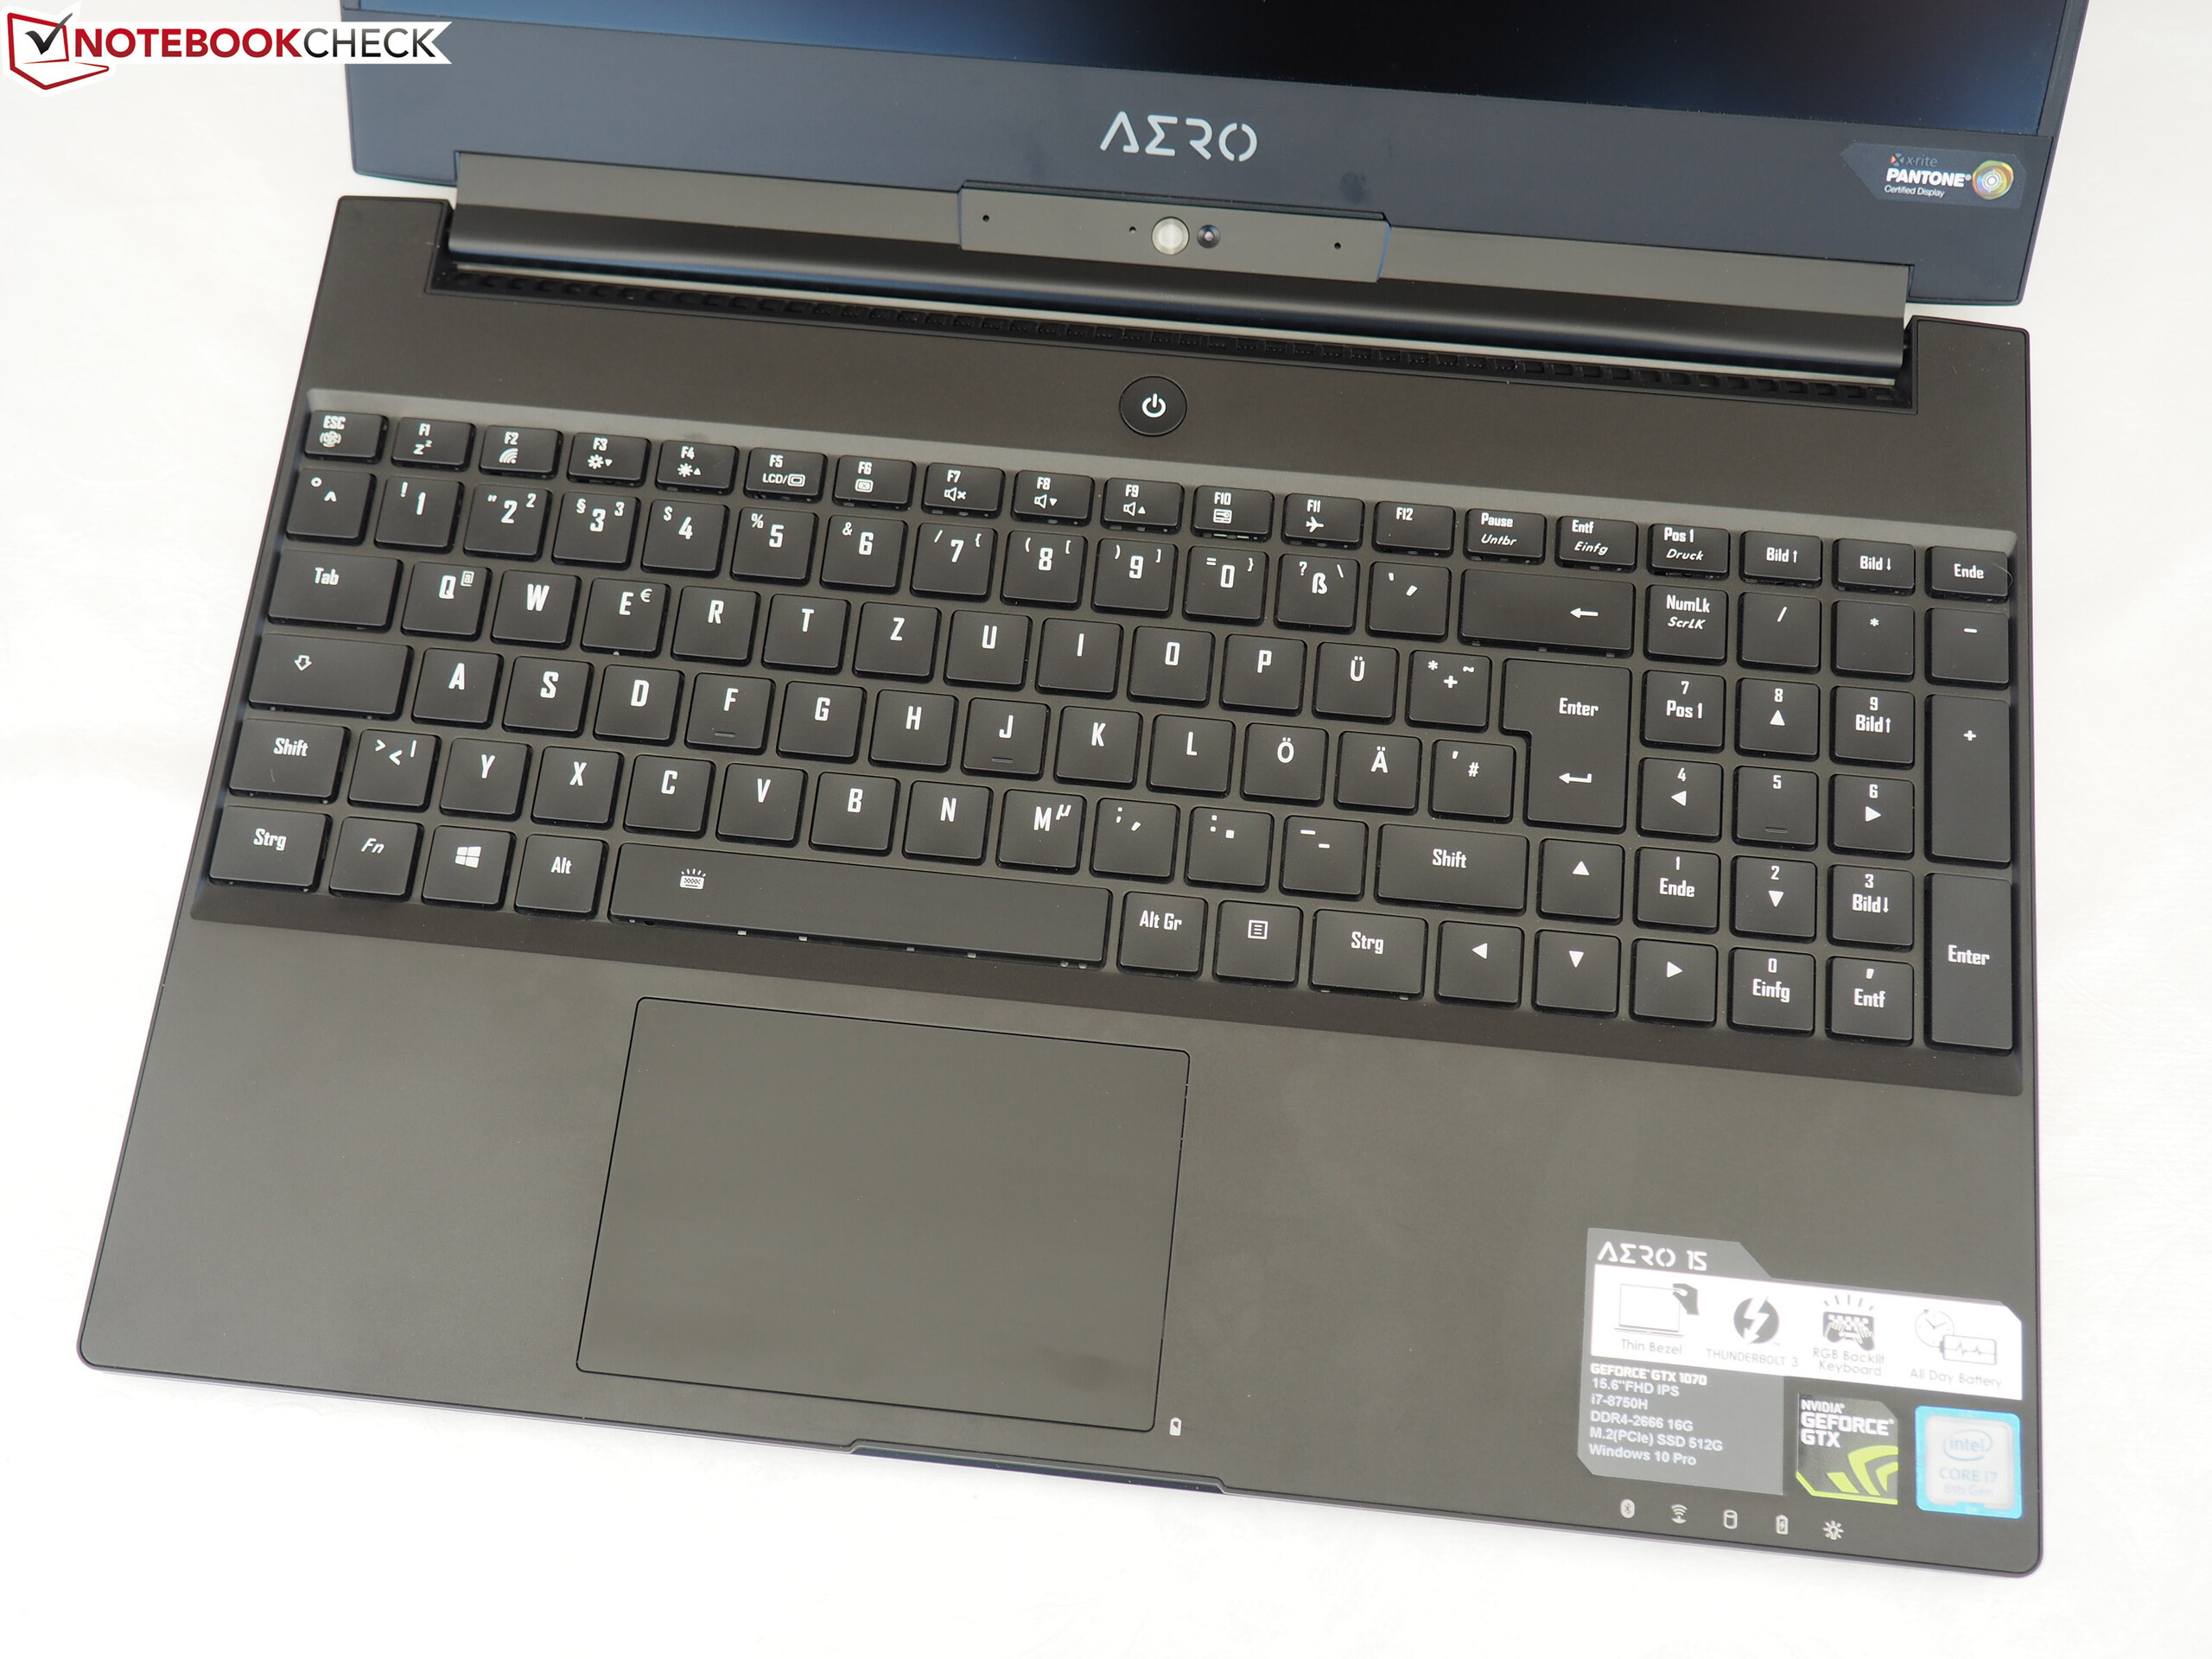
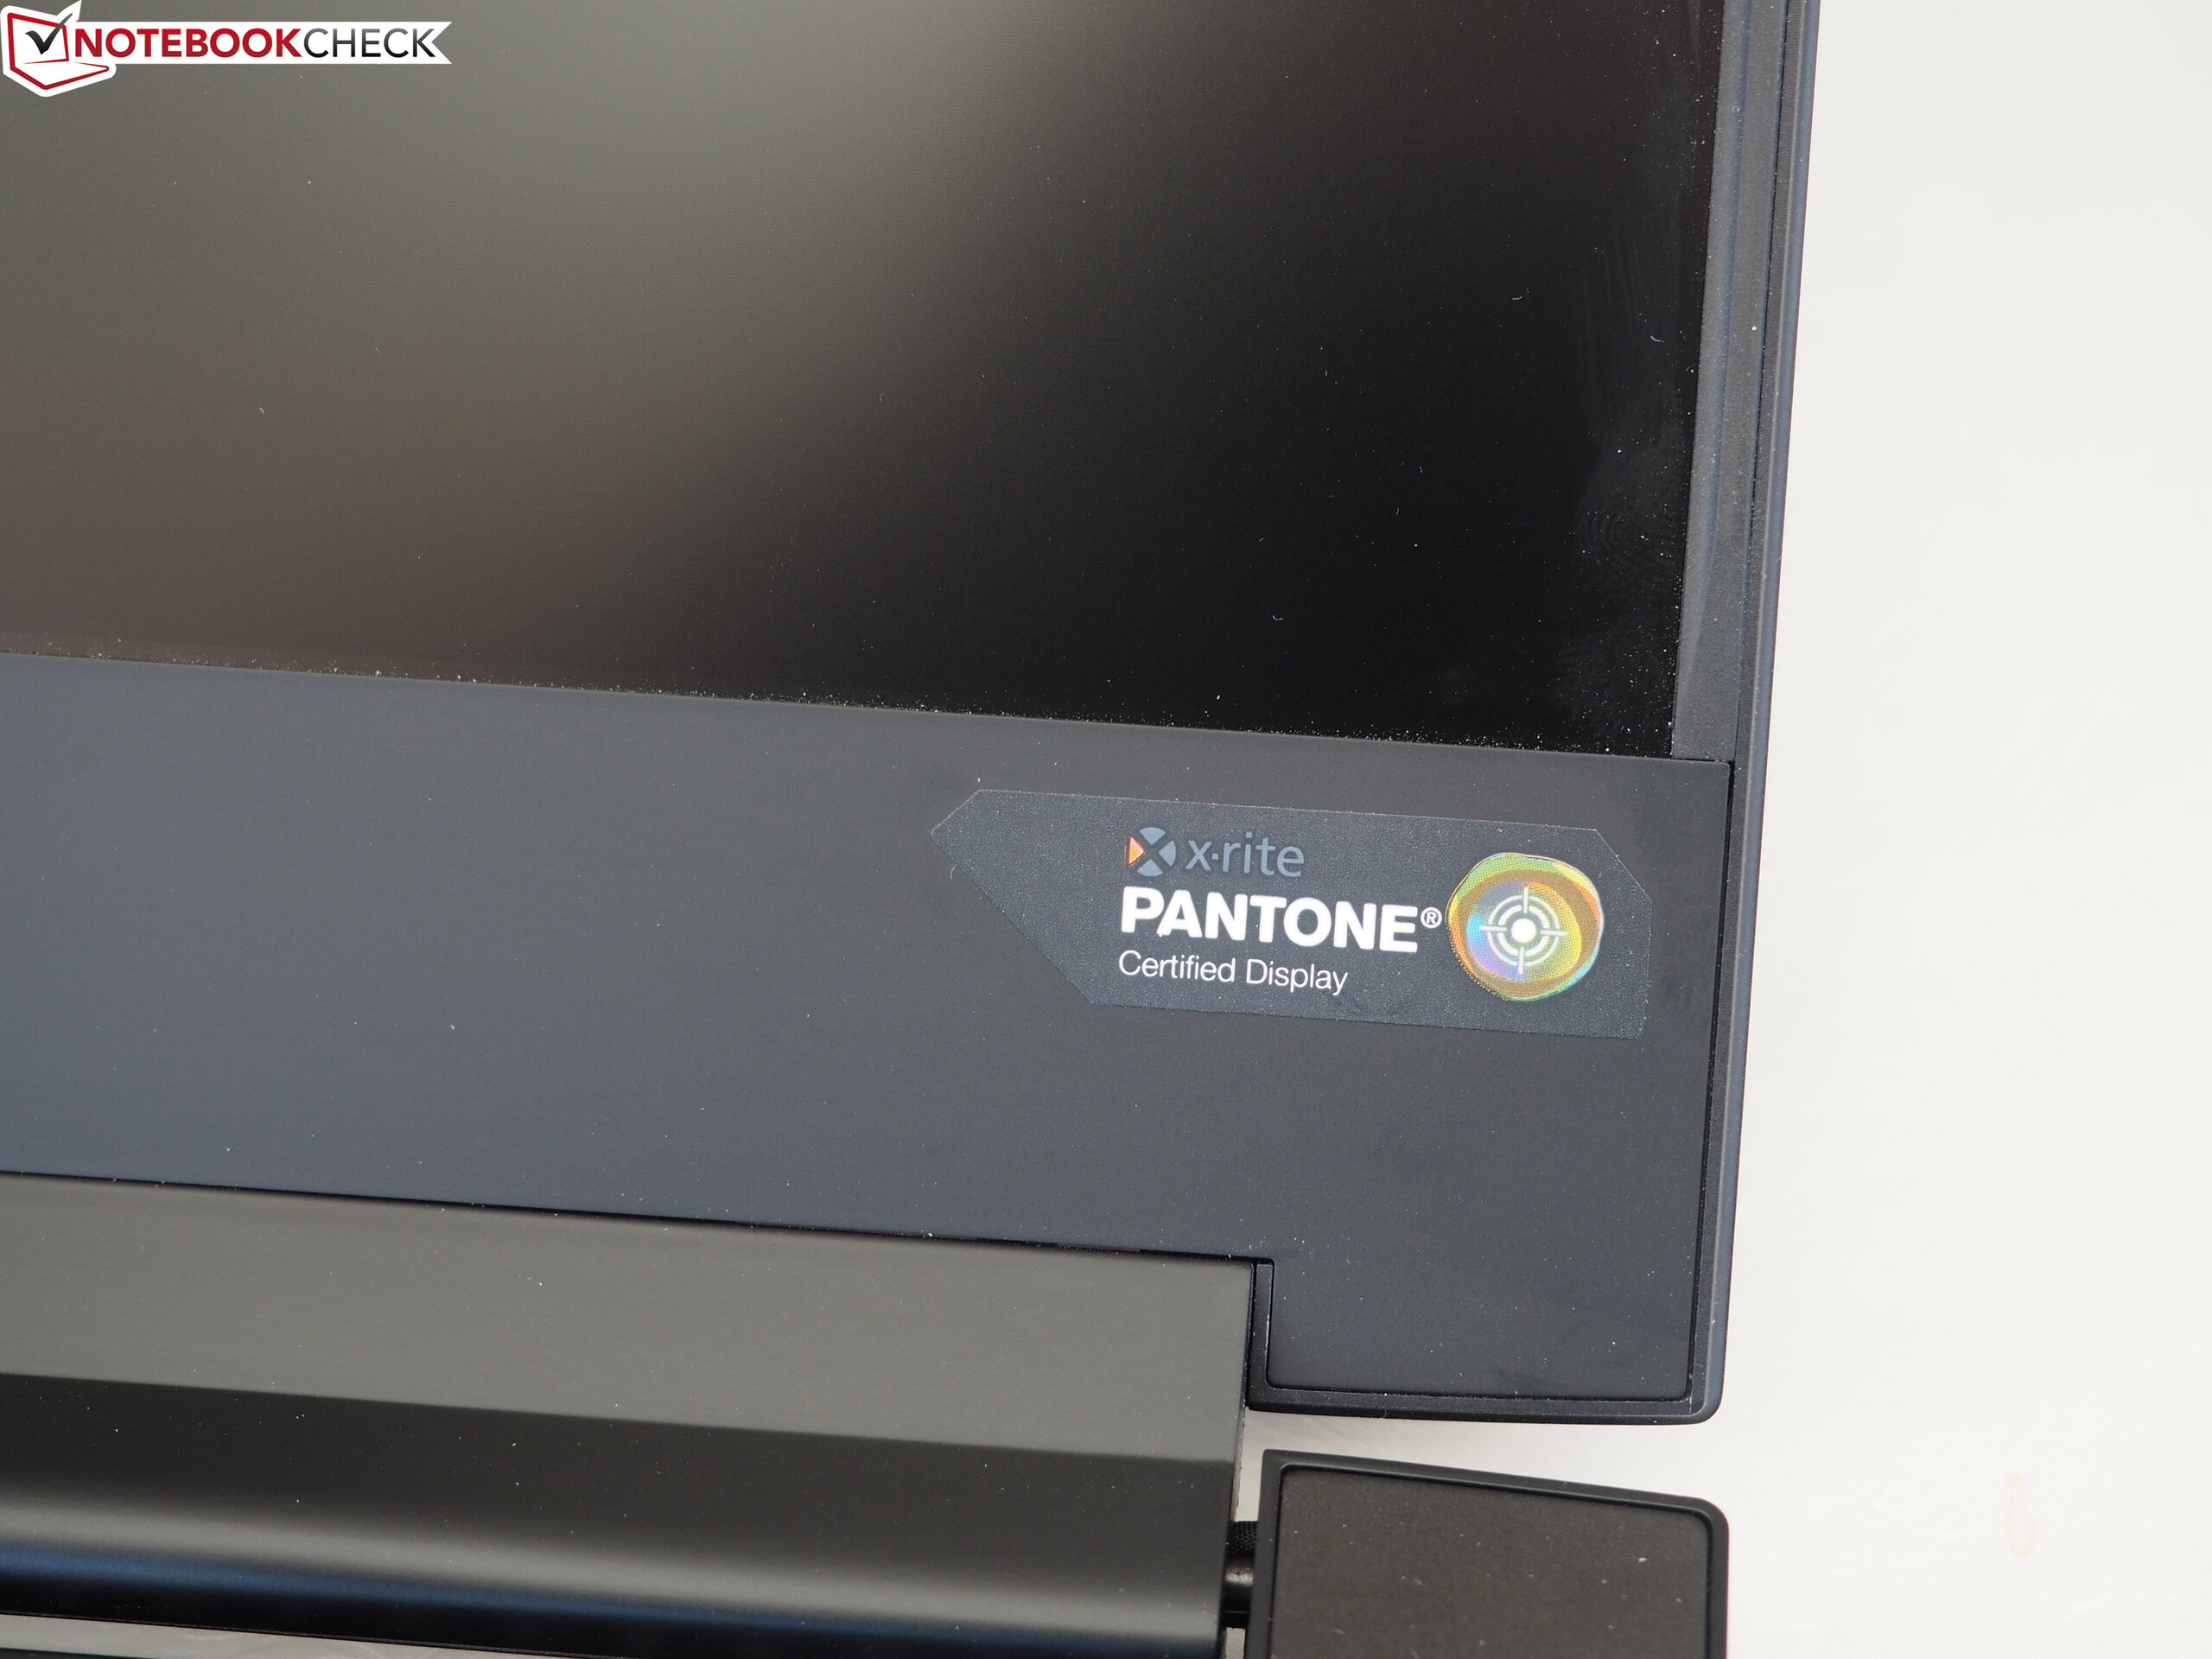
På samma sätt imponerade 144 Hz IPS-skärmen på oss med en X-Rite Pantone-certifiering, stabila betraktningsvinklar och korta responstider. Men skärmen är en aning mörk, vilket resulterar i ett dåligt kontrastförhållande.
Tyvärr är batteritiden en besvikelse med tanke på vilket utmärkt exempel föregångaren var på den punkten. Vi hoppas att detta är en bugg som Gigabyte kan fixa. Vidare genererar den kraftigare GPU:n mer värme vilket gör att enheten blir för varm för att ha i knät om man spelar eller redigerar video. Att den håller kvar vid enkelkanals-RAM resulterar också i en prestanda-flaskhals vilket känns onödigt och bör vara lätt för Razer att åtgärda. Som tur är kan alla dessa problem, bortsett från de höga temperaturerna, förhoppningsvis gå att lösa. Den här enheten kostar för tillfället också flera tusen kronor mer än sin föregångare men kommer ändå bara med mindre förbättringar. Sammanfattningsvis är Gigabyte Aero 15-X9 en av de bästa tunna och lätta bärbara speldatorerna som går att köpa för pengar, men det höga priset och problemen vi noterat vid skrivande stund innebär att vi inte kan rekommendera den lika mycket som föregångaren.
Gigabyte Aero 15-X9
- 02/25/2019 v6 (old)
Sascha Mölck
Price comparison
