Test: Schenker XMG Core 15 (Tongfang GK5CP6V) - Budgetgamer (Sammanfattning)
Gradering | Datum | Modell | Vikt | Höjd | Storlek | Upplösning | Pris |
|---|---|---|---|---|---|---|---|
| 81.3 % v7 (old) | 02/2020 | Schenker XMG Core 15 GK5CP6V i7-9750H, GeForce GTX 1660 Ti Mobile | 2 kg | 26 mm | 15.60" | 1920x1080 | |
| 84.2 % v7 (old) | 10/2019 | Razer Blade 15 GTX 1660 Ti i7-9750H, GeForce GTX 1660 Ti Mobile | 2.1 kg | 19.9 mm | 15.60" | 1920x1080 | |
| 82.9 % v7 (old) | 11/2019 | Asus ROG Zephyrus M15 GU502GU-XB74 i7-9750H, GeForce GTX 1660 Ti Mobile | 2 kg | 18.9 mm | 15.60" | 1920x1080 | |
| 85.5 % v6 (old) | 08/2019 | Aorus 15-SA i7-9750H, GeForce GTX 1660 Ti Mobile | 2.1 kg | 24.4 mm | 15.60" | 1920x1080 | |
| 82.3 % v7 (old) | 08/2019 | Lenovo Legion Y540-15IRH-81SX00B2GE i7-9750H, GeForce GTX 1660 Ti Mobile | 2.2 kg | 26 mm | 15.60" | 1920x1080 | |
| 82.1 % v7 (old) | 11/2019 | Acer Predator Helios 300 PH315-52-79TY i7-9750H, GeForce GTX 1660 Ti Mobile | 2.3 kg | 23.2 mm | 15.60" | 1920x1080 |
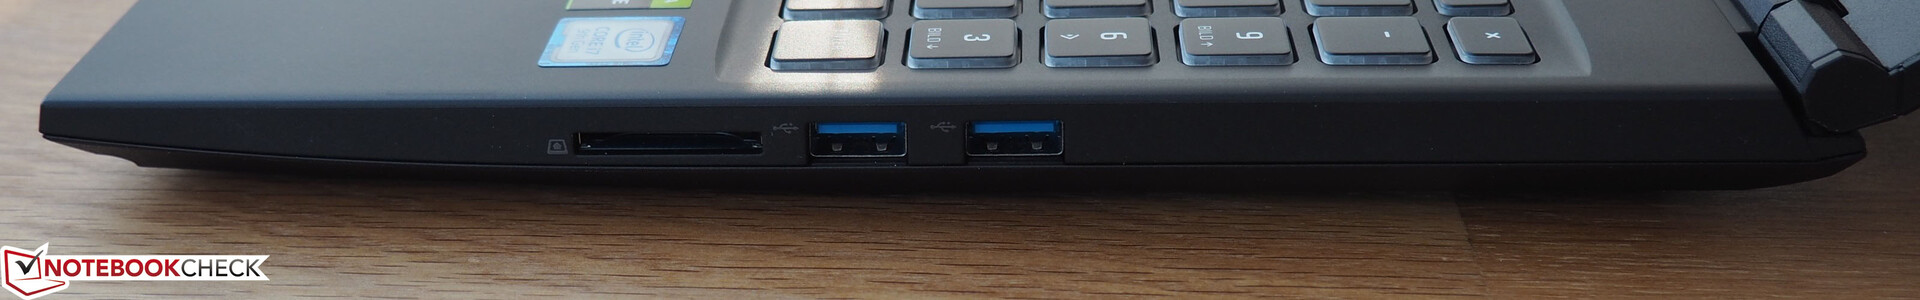
| SD Card Reader | |
| average JPG Copy Test (av. of 3 runs) | |
| Genomsnitt av klass Gaming (20.9 - 210, n=54, senaste 2 åren) | |
| Schenker XMG Core 15 GK5CP6V (Toshiba Exceria Pro SDXC 64 GB UHS-II) | |
| maximum AS SSD Seq Read Test (1GB) | |
| Genomsnitt av klass Gaming (25.5 - 261, n=51, senaste 2 åren) | |
| Schenker XMG Core 15 GK5CP6V (Toshiba Exceria Pro SDXC 64 GB UHS-II) | |

| |||||||||||||||||||||||||
Distribution av ljusstyrkan: 88 %
Mitt på batteriet: 324 cd/m²
Kontrast: 1200:1 (Svärta: 0.27 cd/m²)
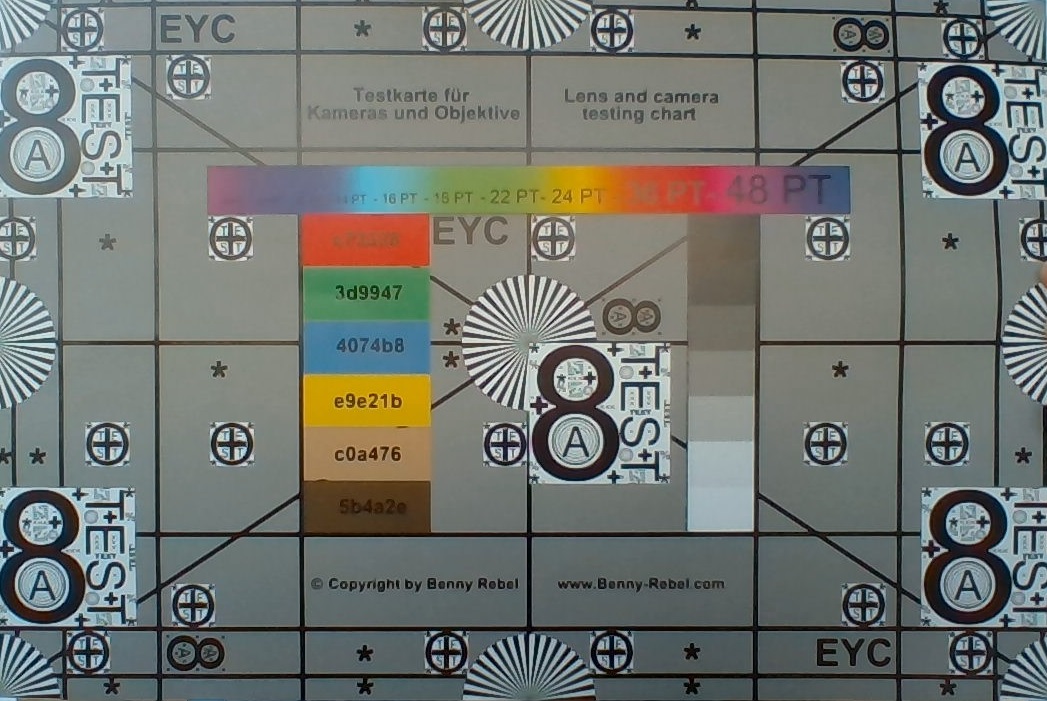
ΔE ColorChecker Calman: 4.07 | ∀{0.5-29.43 Ø4.72}
calibrated: 1.49
ΔE Greyscale Calman: 4.01 | ∀{0.09-98 Ø4.97}
91% sRGB (Argyll 1.6.3 3D)
59% AdobeRGB 1998 (Argyll 1.6.3 3D)
65% AdobeRGB 1998 (Argyll 3D)
91.2% sRGB (Argyll 3D)
63.3% Display P3 (Argyll 3D)
Gamma: 2.6
CCT: 7350 K
| Schenker XMG Core 15 GK5CP6V BOEhydis NV156FHM-N4G (BOE084D), IPS, 1920x1080 | Razer Blade 15 GTX 1660 Ti BOE NV156FHM-N4K, IPS, 1920x1080 | Asus ROG Zephyrus M15 GU502GU-XB74 AU Optronics B156HAN08.2, IPS, 1920x1080 | Aorus 15-SA LG Philips LP156WFG-SPB2 (LGD05E8), IPS, 1920x1080 | Lenovo Legion Y540-15IRH-81SX00B2GE BOE 084D, IPS, 1920x1080 | Acer Predator Helios 300 PH315-52-79TY AUO, B156HAN08.2, IPS, 1920x1080 | |
|---|---|---|---|---|---|---|
| Display | 2% | 2% | 2% | 0% | 1% | |
| Display P3 Coverage (%) | 63.3 | 65.3 3% | 66.5 5% | 64.3 2% | 63.6 0% | 64.1 1% |
| sRGB Coverage (%) | 91.2 | 91.8 1% | 90.8 0% | 93.6 3% | 91.7 1% | 93 2% |
| AdobeRGB 1998 Coverage (%) | 65 | 66.5 2% | 66.5 2% | 65.6 1% | 65.2 0% | 65.7 1% |
| Response Times | -26% | 21% | -50% | -8% | -29% | |
| Response Time Grey 50% / Grey 80% * (ms) | 8.8 ? | 13.6 ? -55% | 6.4 ? 27% | 15.6 ? -77% | 8.8 ? -0% | 15 ? -70% |
| Response Time Black / White * (ms) | 10.4 ? | 10 ? 4% | 8.8 ? 15% | 12.8 ? -23% | 12 ? -15% | 9 ? 13% |
| PWM Frequency (Hz) | 200 ? | |||||
| Screen | -11% | -15% | -1% | -6% | -4% | |
| Brightness middle (cd/m²) | 324 | 312.7 -3% | 297.7 -8% | 266 -18% | 299 -8% | 325 0% |
| Brightness (cd/m²) | 296 | 305 3% | 280 -5% | 254 -14% | 290 -2% | 310 5% |
| Brightness Distribution (%) | 88 | 90 2% | 84 -5% | 90 2% | 89 1% | 82 -7% |
| Black Level * (cd/m²) | 0.27 | 0.27 -0% | 0.43 -59% | 0.28 -4% | 0.29 -7% | 0.255 6% |
| Contrast (:1) | 1200 | 1158 -3% | 692 -42% | 950 -21% | 1031 -14% | 1275 6% |
| Colorchecker dE 2000 * | 4.07 | 4.57 -12% | 3.13 23% | 3.11 24% | 3.7 9% | 4.28 -5% |
| Colorchecker dE 2000 max. * | 6.39 | 6.81 -7% | 7.1 -11% | 5.84 9% | 7 -10% | 8.42 -32% |
| Colorchecker dE 2000 calibrated * | 1.49 | 2.91 -95% | 3.06 -105% | 1.37 8% | 2 -34% | 1.45 3% |
| Greyscale dE 2000 * | 4.01 | 4.3 -7% | 1.9 53% | 3.94 2% | 4.1 -2% | 5.01 -25% |
| Gamma | 2.6 85% | 2.29 96% | 2.23 99% | 2.53 87% | 2.19 100% | 2.6 85% |
| CCT | 7350 88% | 7098 92% | 6325 103% | 6210 105% | 7166 91% | 7678 85% |
| Color Space (Percent of AdobeRGB 1998) (%) | 59 | 59.4 1% | 59.2 0% | 60 2% | 59.3 1% | 60 2% |
| Color Space (Percent of sRGB) (%) | 91 | 91.3 0% | 90.5 -1% | 93 2% | 91.5 1% | 93 2% |
| Totalt genomsnitt (program/inställningar) | -12% /
-10% | 3% /
-7% | -16% /
-6% | -5% /
-5% | -11% /
-6% |
* ... mindre är bättre
Visa svarstider
| ↔ Svarstid svart till vitt | ||
|---|---|---|
| 10.4 ms ... stiga ↗ och falla ↘ kombinerat | ↗ 5.2 ms stiga | 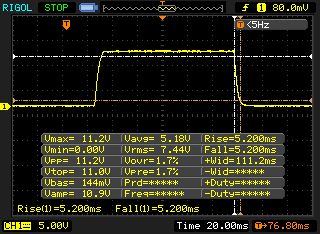 |
| ↘ 5.2 ms hösten | ||
| Skärmen visar bra svarsfrekvens i våra tester, men kan vara för långsam för konkurrenskraftiga spelare. I jämförelse sträcker sig alla testade enheter från 0.1 (minst) till 240 (maximalt) ms. » 28 % av alla enheter är bättre. Det betyder att den uppmätta svarstiden är bättre än genomsnittet av alla testade enheter (19.8 ms). | ||
| ↔ Svarstid 50 % grått till 80 % grått | ||
| 8.8 ms ... stiga ↗ och falla ↘ kombinerat | ↗ 4.4 ms stiga | 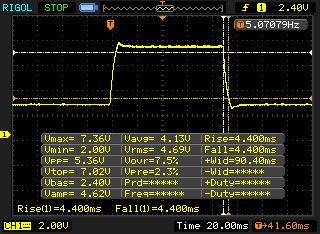 |
| ↘ 4.4 ms hösten | ||
| Skärmen visar snabba svarsfrekvenser i våra tester och bör passa för spel. I jämförelse sträcker sig alla testade enheter från 0.165 (minst) till 636 (maximalt) ms. » 22 % av alla enheter är bättre. Det betyder att den uppmätta svarstiden är bättre än genomsnittet av alla testade enheter (31 ms). | ||
Skärmflimmer / PWM (Puls-Width Modulation)
| Skärmflimmer / PWM upptäcktes inte | 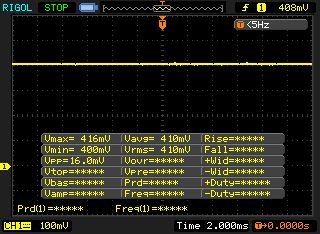 | ||
Som jämförelse: 52 % av alla testade enheter använder inte PWM för att dämpa skärmen. Om PWM upptäcktes mättes ett medelvärde av 7763 (minst: 5 - maximum: 343500) Hz. | |||
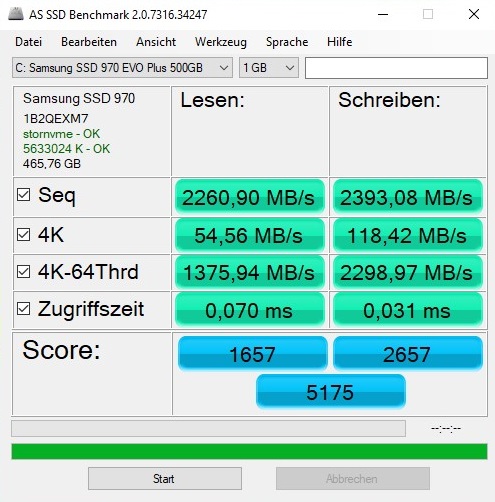
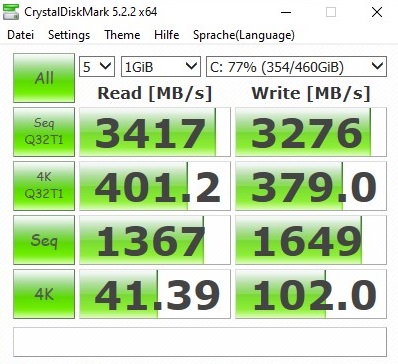
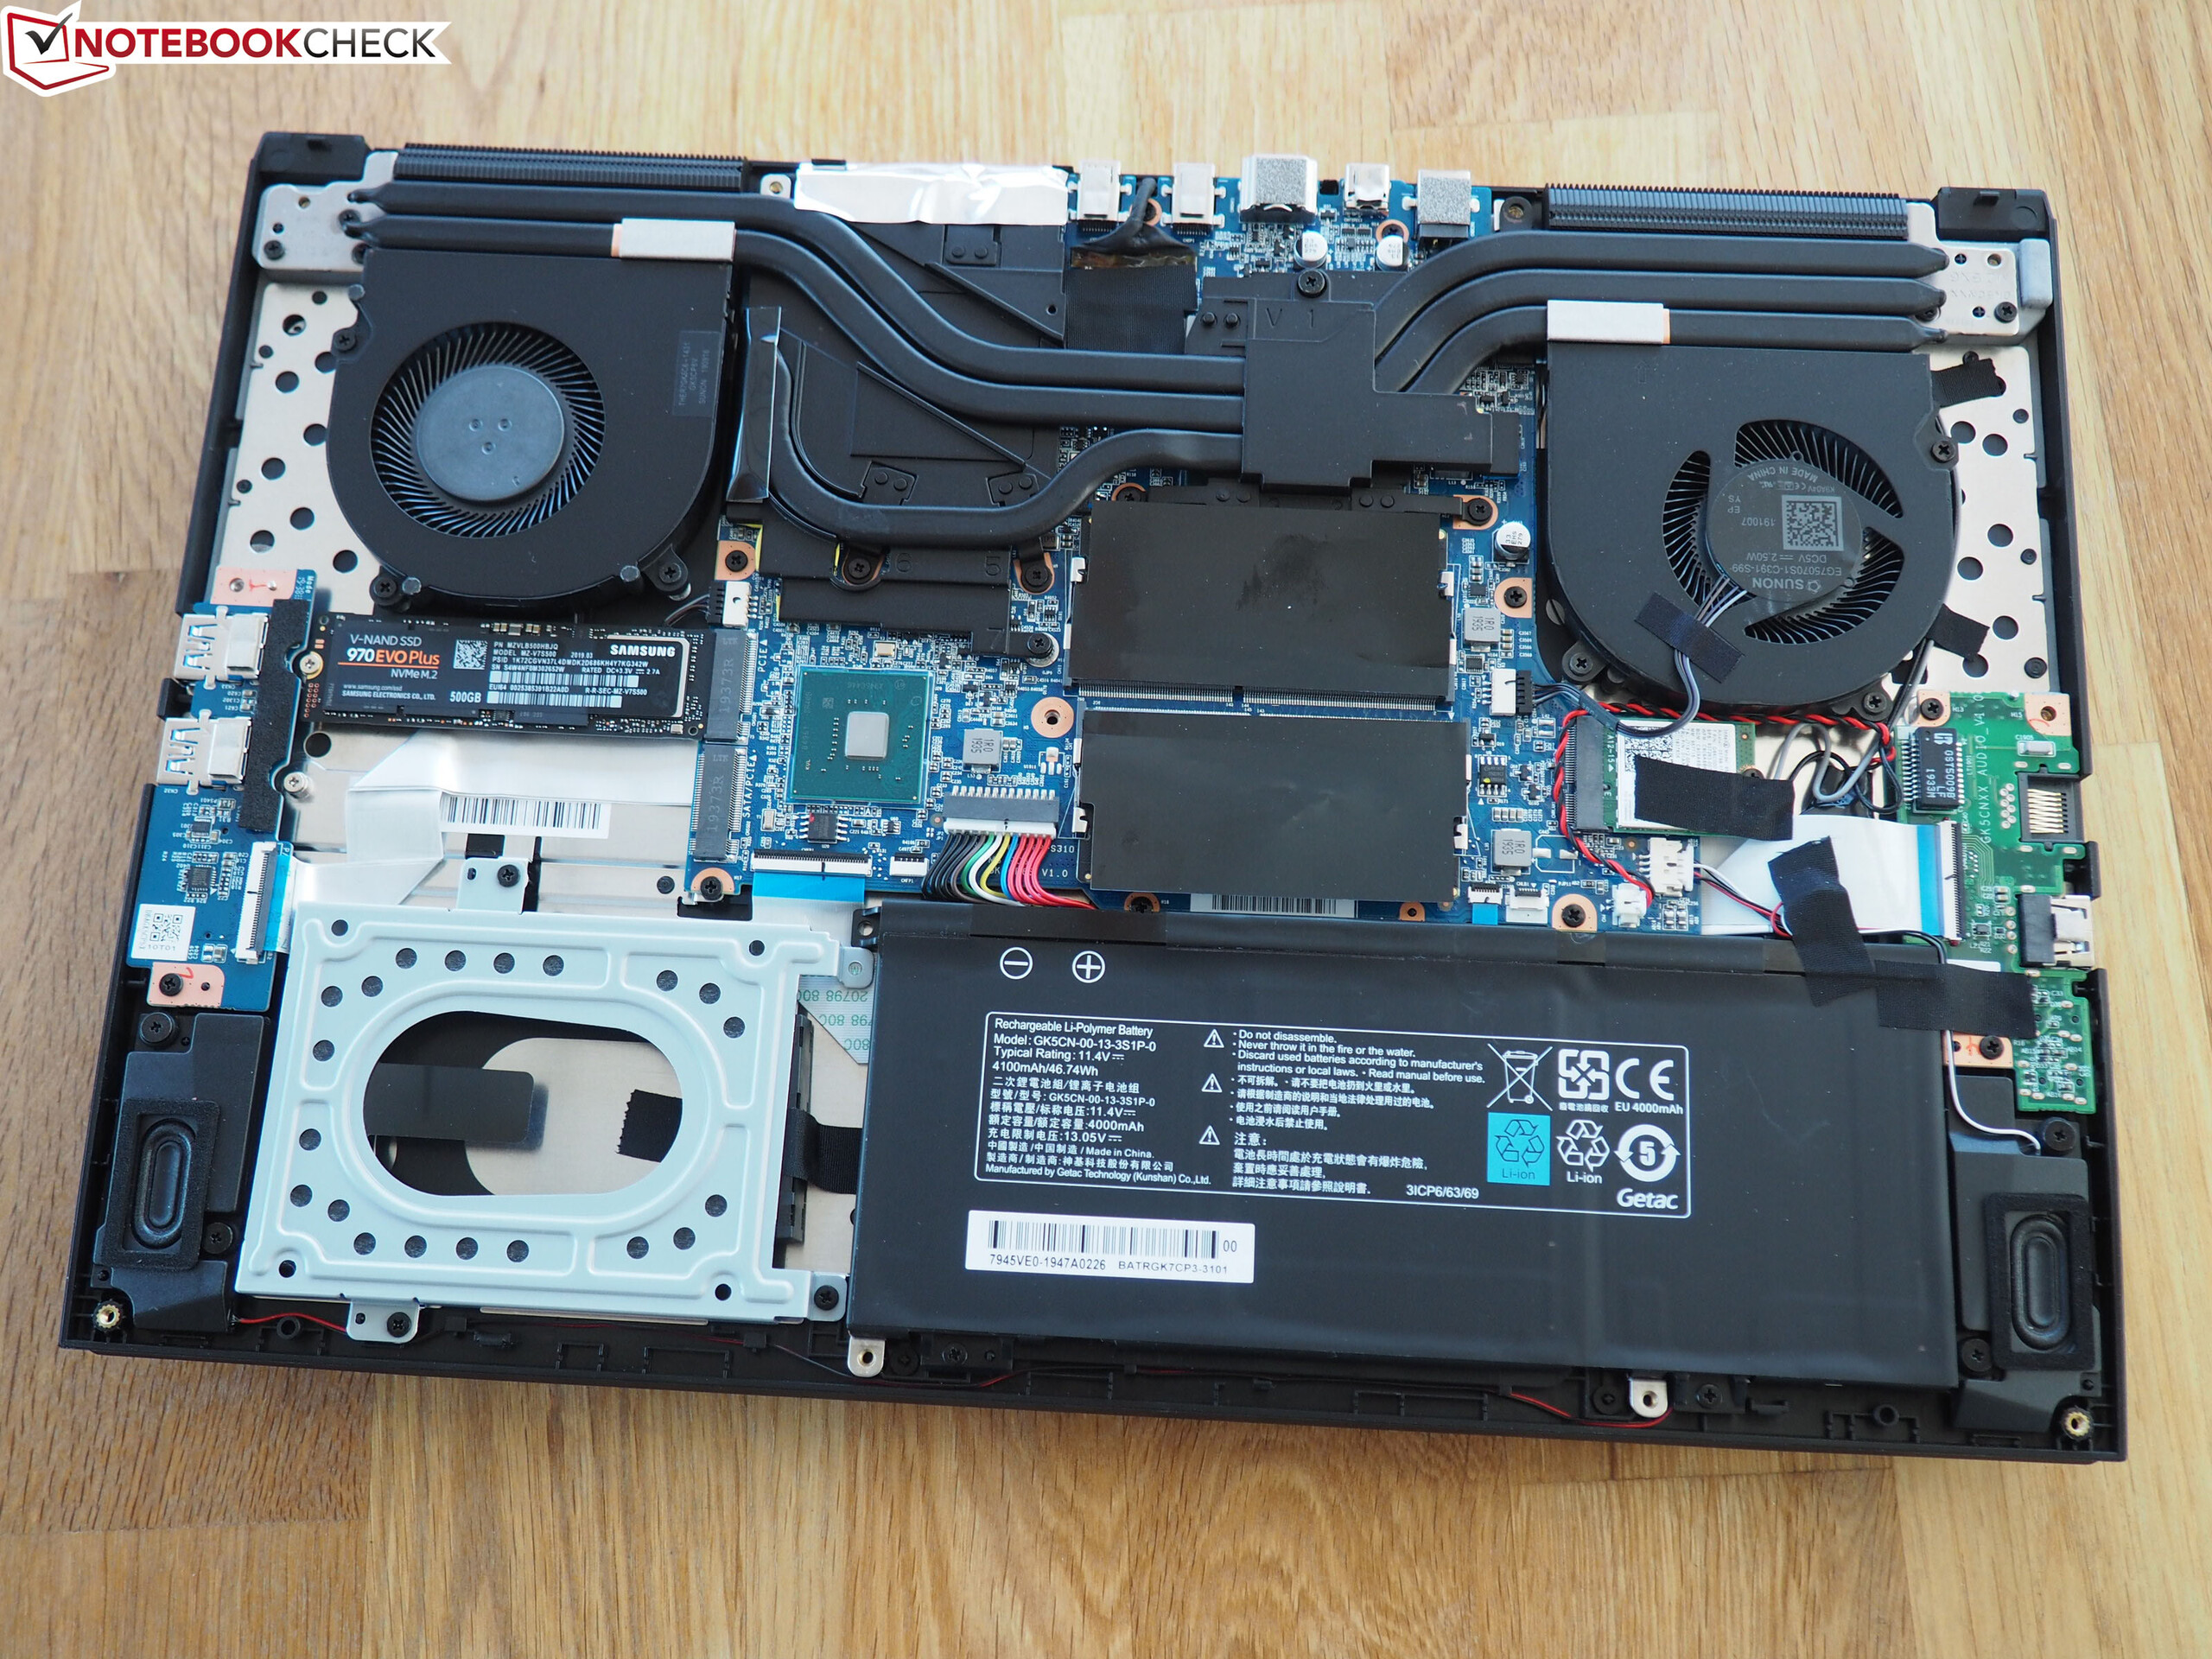
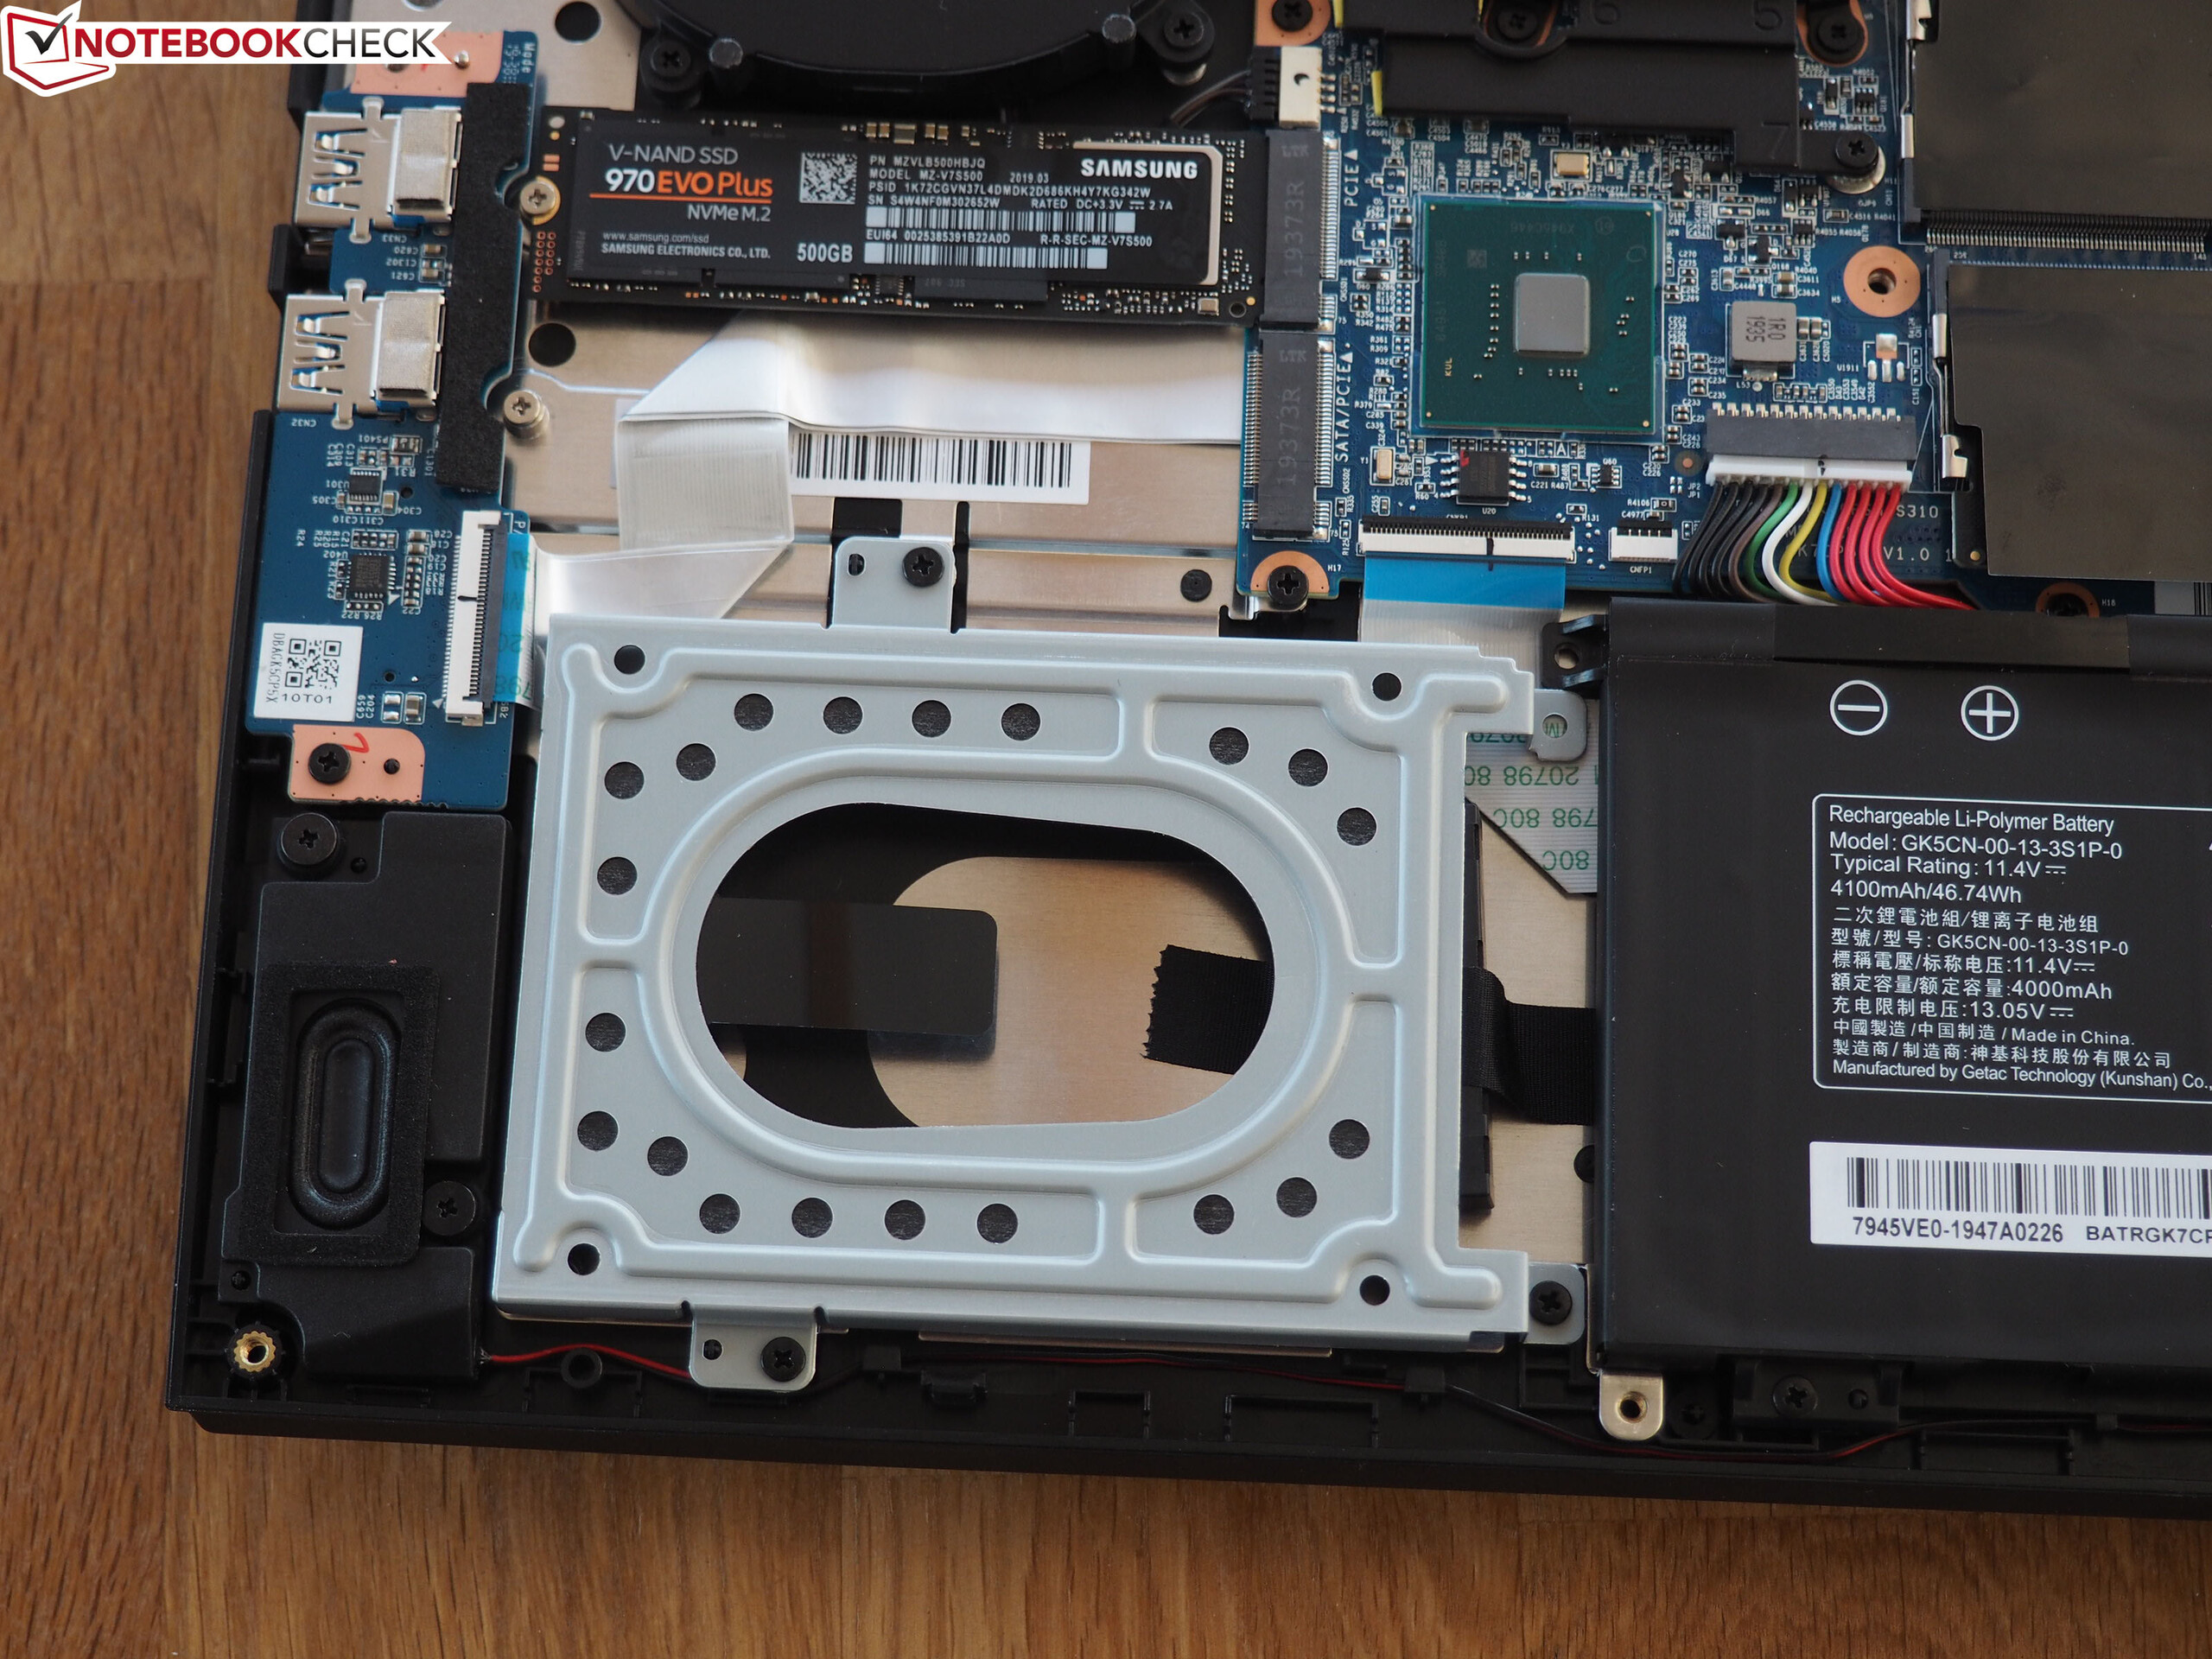
| Schenker XMG Core 15 GK5CP6V Samsung SSD 970 EVO Plus 500GB | Razer Blade 15 GTX 1660 Ti Samsung SSD PM981 MZVLB256HAHQ | Asus ROG Zephyrus M15 GU502GU-XB74 Intel SSD 660p SSDPEKNW512G8 | Aorus 15-SA Intel SSD 760p SSDPEKKW512G8 | Lenovo Legion Y540-15IRH-81SX00B2GE WDC PC SN720 SDAPNTW-512G | Acer Predator Helios 300 PH315-52-79TY WDC PC SN720 SDAPNTW-512G | |
|---|---|---|---|---|---|---|
| CrystalDiskMark 5.2 / 6 | 5% | -4% | 4% | 7% | 11% | |
| Write 4K (MB/s) | 102 | 135 32% | 156 53% | 104 2% | 158.8 56% | 108.7 7% |
| Read 4K (MB/s) | 41.39 | 41.1 -1% | 60.7 47% | 55.1 33% | 29.11 -30% | 44.91 9% |
| Write Seq (MB/s) | 1649 | 1427 -13% | 968 -41% | 1519 -8% | 1584 -4% | 2424 47% |
| Read Seq (MB/s) | 1367 | 1494 9% | 1619 18% | 2486 82% | 1694 24% | 1617 18% |
| Write 4K Q32T1 (MB/s) | 379 | 494.9 31% | 485 28% | 320.5 -15% | 536 41% | 356.9 -6% |
| Read 4K Q32T1 (MB/s) | 401.2 | 578 44% | 337.3 -16% | 431.8 8% | 363.9 -9% | 557 39% |
| Write Seq Q32T1 (MB/s) | 3276 | 1417 -57% | 969 -70% | 1498 -54% | 2536 -23% | 2542 -22% |
| Read Seq Q32T1 (MB/s) | 3417 | 3251 -5% | 1825 -47% | 2868 -16% | 3458 1% | 3218 -6% |

| 3DMark 11 Performance | 17351 poäng | |
| 3DMark Cloud Gate Standard Score | 35204 poäng | |
| 3DMark Fire Strike Score | 13267 poäng | |
| 3DMark Time Spy Score | 5724 poäng | |
Hjälp | ||
| The Witcher 3 | |
| 1920x1080 High Graphics & Postprocessing (Nvidia HairWorks Off) | |
| Aorus 15-SA | |
| Schenker XMG Core 15 GK5CP6V | |
| Razer Blade 15 GTX 1660 Ti | |
| Asus ROG Zephyrus M15 GU502GU-XB74 | |
| Acer Predator Helios 300 PH315-52-79TY | |
| 1920x1080 Ultra Graphics & Postprocessing (HBAO+) | |
| Aorus 15-SA | |
| Asus ROG Zephyrus M15 GU502GU-XB74 | |
| Acer Predator Helios 300 PH315-52-79TY | |
| Schenker XMG Core 15 GK5CP6V | |
| Lenovo Legion Y540-15IRH-81SX00B2GE | |
| Razer Blade 15 GTX 1660 Ti | |
| låg | med. | hög | ultra | |
|---|---|---|---|---|
| The Witcher 3 (2015) | 101 | 54.2 | ||
| Dota 2 Reborn (2015) | 144 | 131 | 124 | 118 |
| X-Plane 11.11 (2018) | 107 | 92.7 | 78.6 | |
| Apex Legends (2019) | 131 | 108 | 107 | |
| Anthem (2019) | 75.2 | 73.2 | 71 | |
| Dirt Rally 2.0 (2019) | 144 | 123 | 65.6 | |
| The Division 2 (2019) | 98 | 78 | 57 | |
| Control (2019) | 69.2 | 50.7 | ||
| Borderlands 3 (2019) | 91.7 | 61.7 | 46.6 | |
| FIFA 20 (2019) | 192 | 181 | 179 | |
| Ghost Recon Breakpoint (2019) | 79 | 70 | 51 | |
| GRID 2019 (2019) | 119 | 90.5 | 61.7 | |
| Call of Duty Modern Warfare 2019 (2019) | 99 | 88.1 | 71.9 | |
| Need for Speed Heat (2019) | 87.9 | 79.7 | 67.4 | |
| Star Wars Jedi Fallen Order (2019) | 94.7 | 84.9 | 77.7 | |
| Red Dead Redemption 2 (2019) | 75.3 | 50.5 | 31.2 |
Ljudnivå
| Låg belastning |
| 30 / 31 / 33 dB(A) |
| Hög belastning |
| 48 / 51 dB(A) |
 | ||
30 dB tyst 40 dB(A) hörbar 50 dB(A) högt ljud |
||
min: | ||
| Schenker XMG Core 15 GK5CP6V i7-9750H, GeForce GTX 1660 Ti Mobile | Razer Blade 15 GTX 1660 Ti i7-9750H, GeForce GTX 1660 Ti Mobile | Asus ROG Zephyrus M15 GU502GU-XB74 i7-9750H, GeForce GTX 1660 Ti Mobile | Aorus 15-SA i7-9750H, GeForce GTX 1660 Ti Mobile | Lenovo Legion Y540-15IRH-81SX00B2GE i7-9750H, GeForce GTX 1660 Ti Mobile | Acer Predator Helios 300 PH315-52-79TY i7-9750H, GeForce GTX 1660 Ti Mobile | |
|---|---|---|---|---|---|---|
| Noise | 5% | 2% | -9% | 10% | 5% | |
| av / miljö * (dB) | 30 | 28.5 5% | 28.2 6% | 29 3% | 29.3 2% | 30.2 -1% |
| Idle Minimum * (dB) | 30 | 30.3 -1% | 28.7 4% | 32 -7% | 29.3 2% | 31 -3% |
| Idle Average * (dB) | 31 | 30.5 2% | 30.5 2% | 35 -13% | 29.3 5% | 31 -0% |
| Idle Maximum * (dB) | 33 | 30.5 8% | 31 6% | 41 -24% | 29.3 11% | 31 6% |
| Load Average * (dB) | 48 | 41 15% | 39 19% | 54 -13% | 35.7 26% | 41.5 14% |
| Witcher 3 ultra * (dB) | 51 | 48 6% | 54.2 -6% | 52 -2% | 44.2 13% | 46.7 8% |
| Load Maximum * (dB) | 51 | 51.9 -2% | 59.6 -17% | 56 -10% | 45.6 11% | 46.9 8% |
* ... mindre är bättre
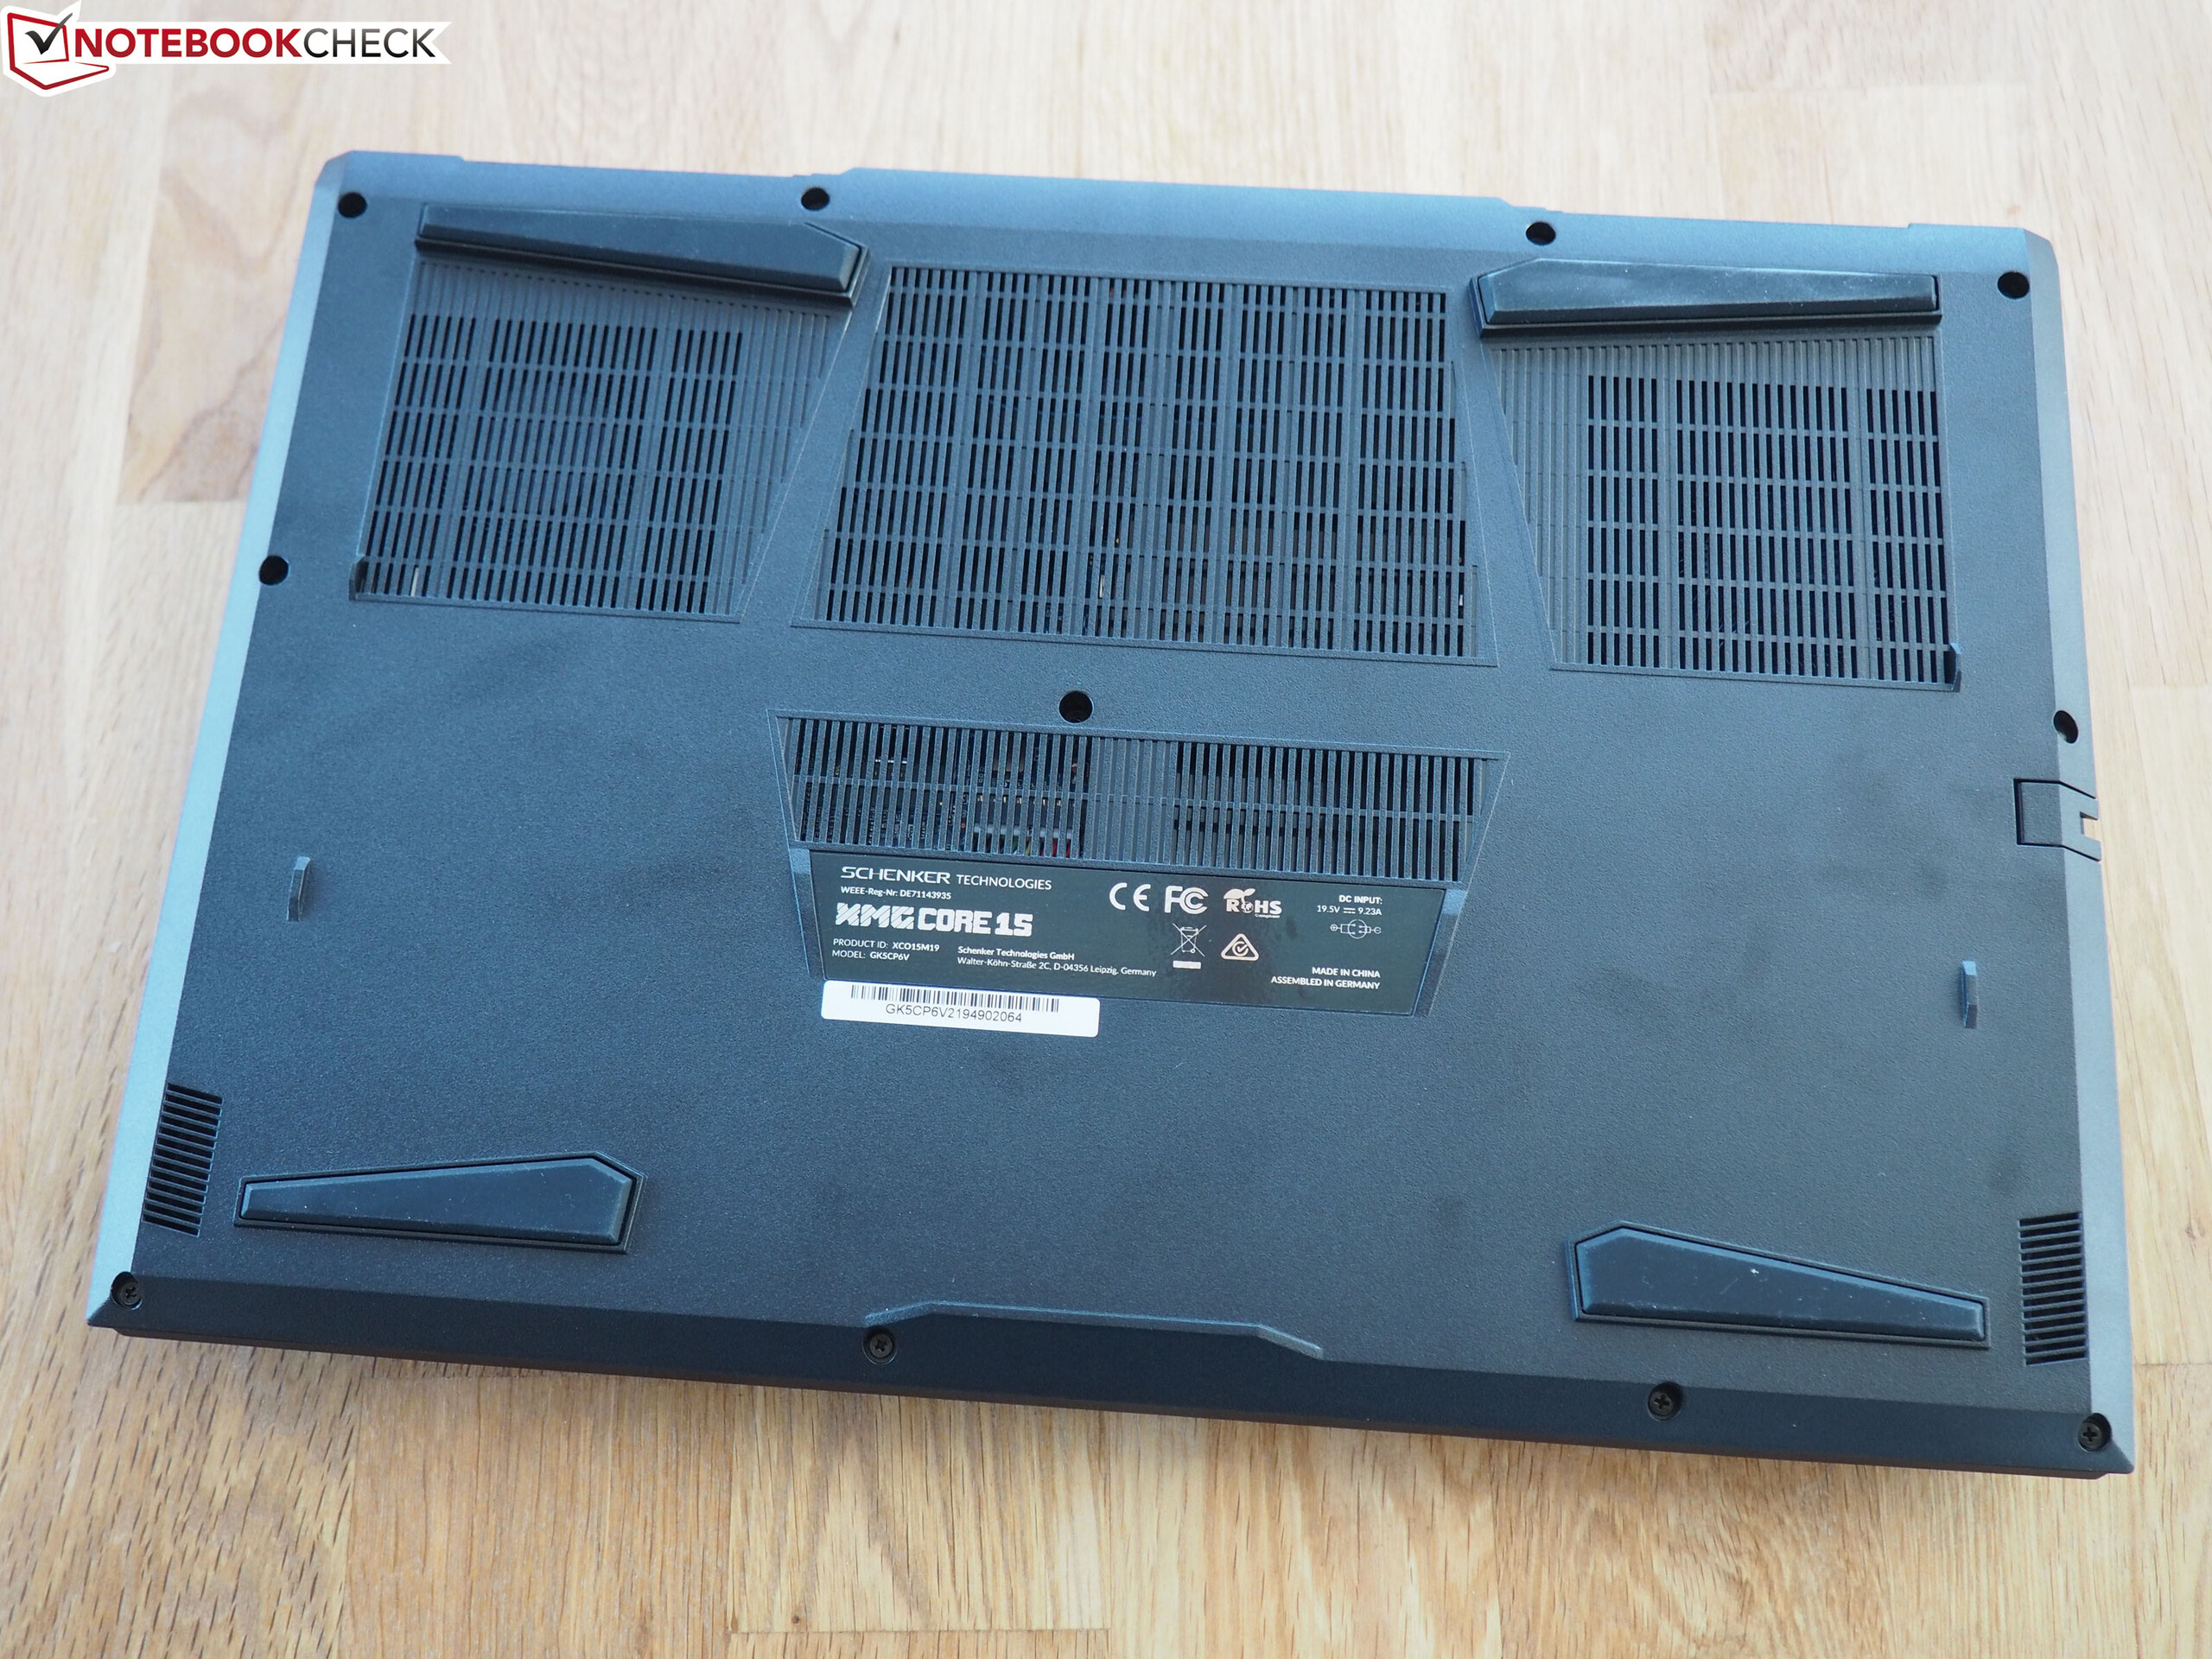
(-) Den maximala temperaturen på ovansidan är 48 °C / 118 F, jämfört med genomsnittet av 40.4 °C / 105 F , allt från 21.2 till 68.8 °C för klassen Gaming.
(-) Botten värms upp till maximalt 59 °C / 138 F, jämfört med genomsnittet av 43.2 °C / 110 F
(+) Vid tomgångsbruk är medeltemperaturen för ovansidan 25.7 °C / 78 F, jämfört med enhetsgenomsnittet på 33.9 °C / ### class_avg_f### F.
(-) När du spelar The Witcher 3 är medeltemperaturen för ovansidan 39.6 °C / 103 F, jämfört med enhetsgenomsnittet på 33.9 °C / ## #class_avg_f### F.
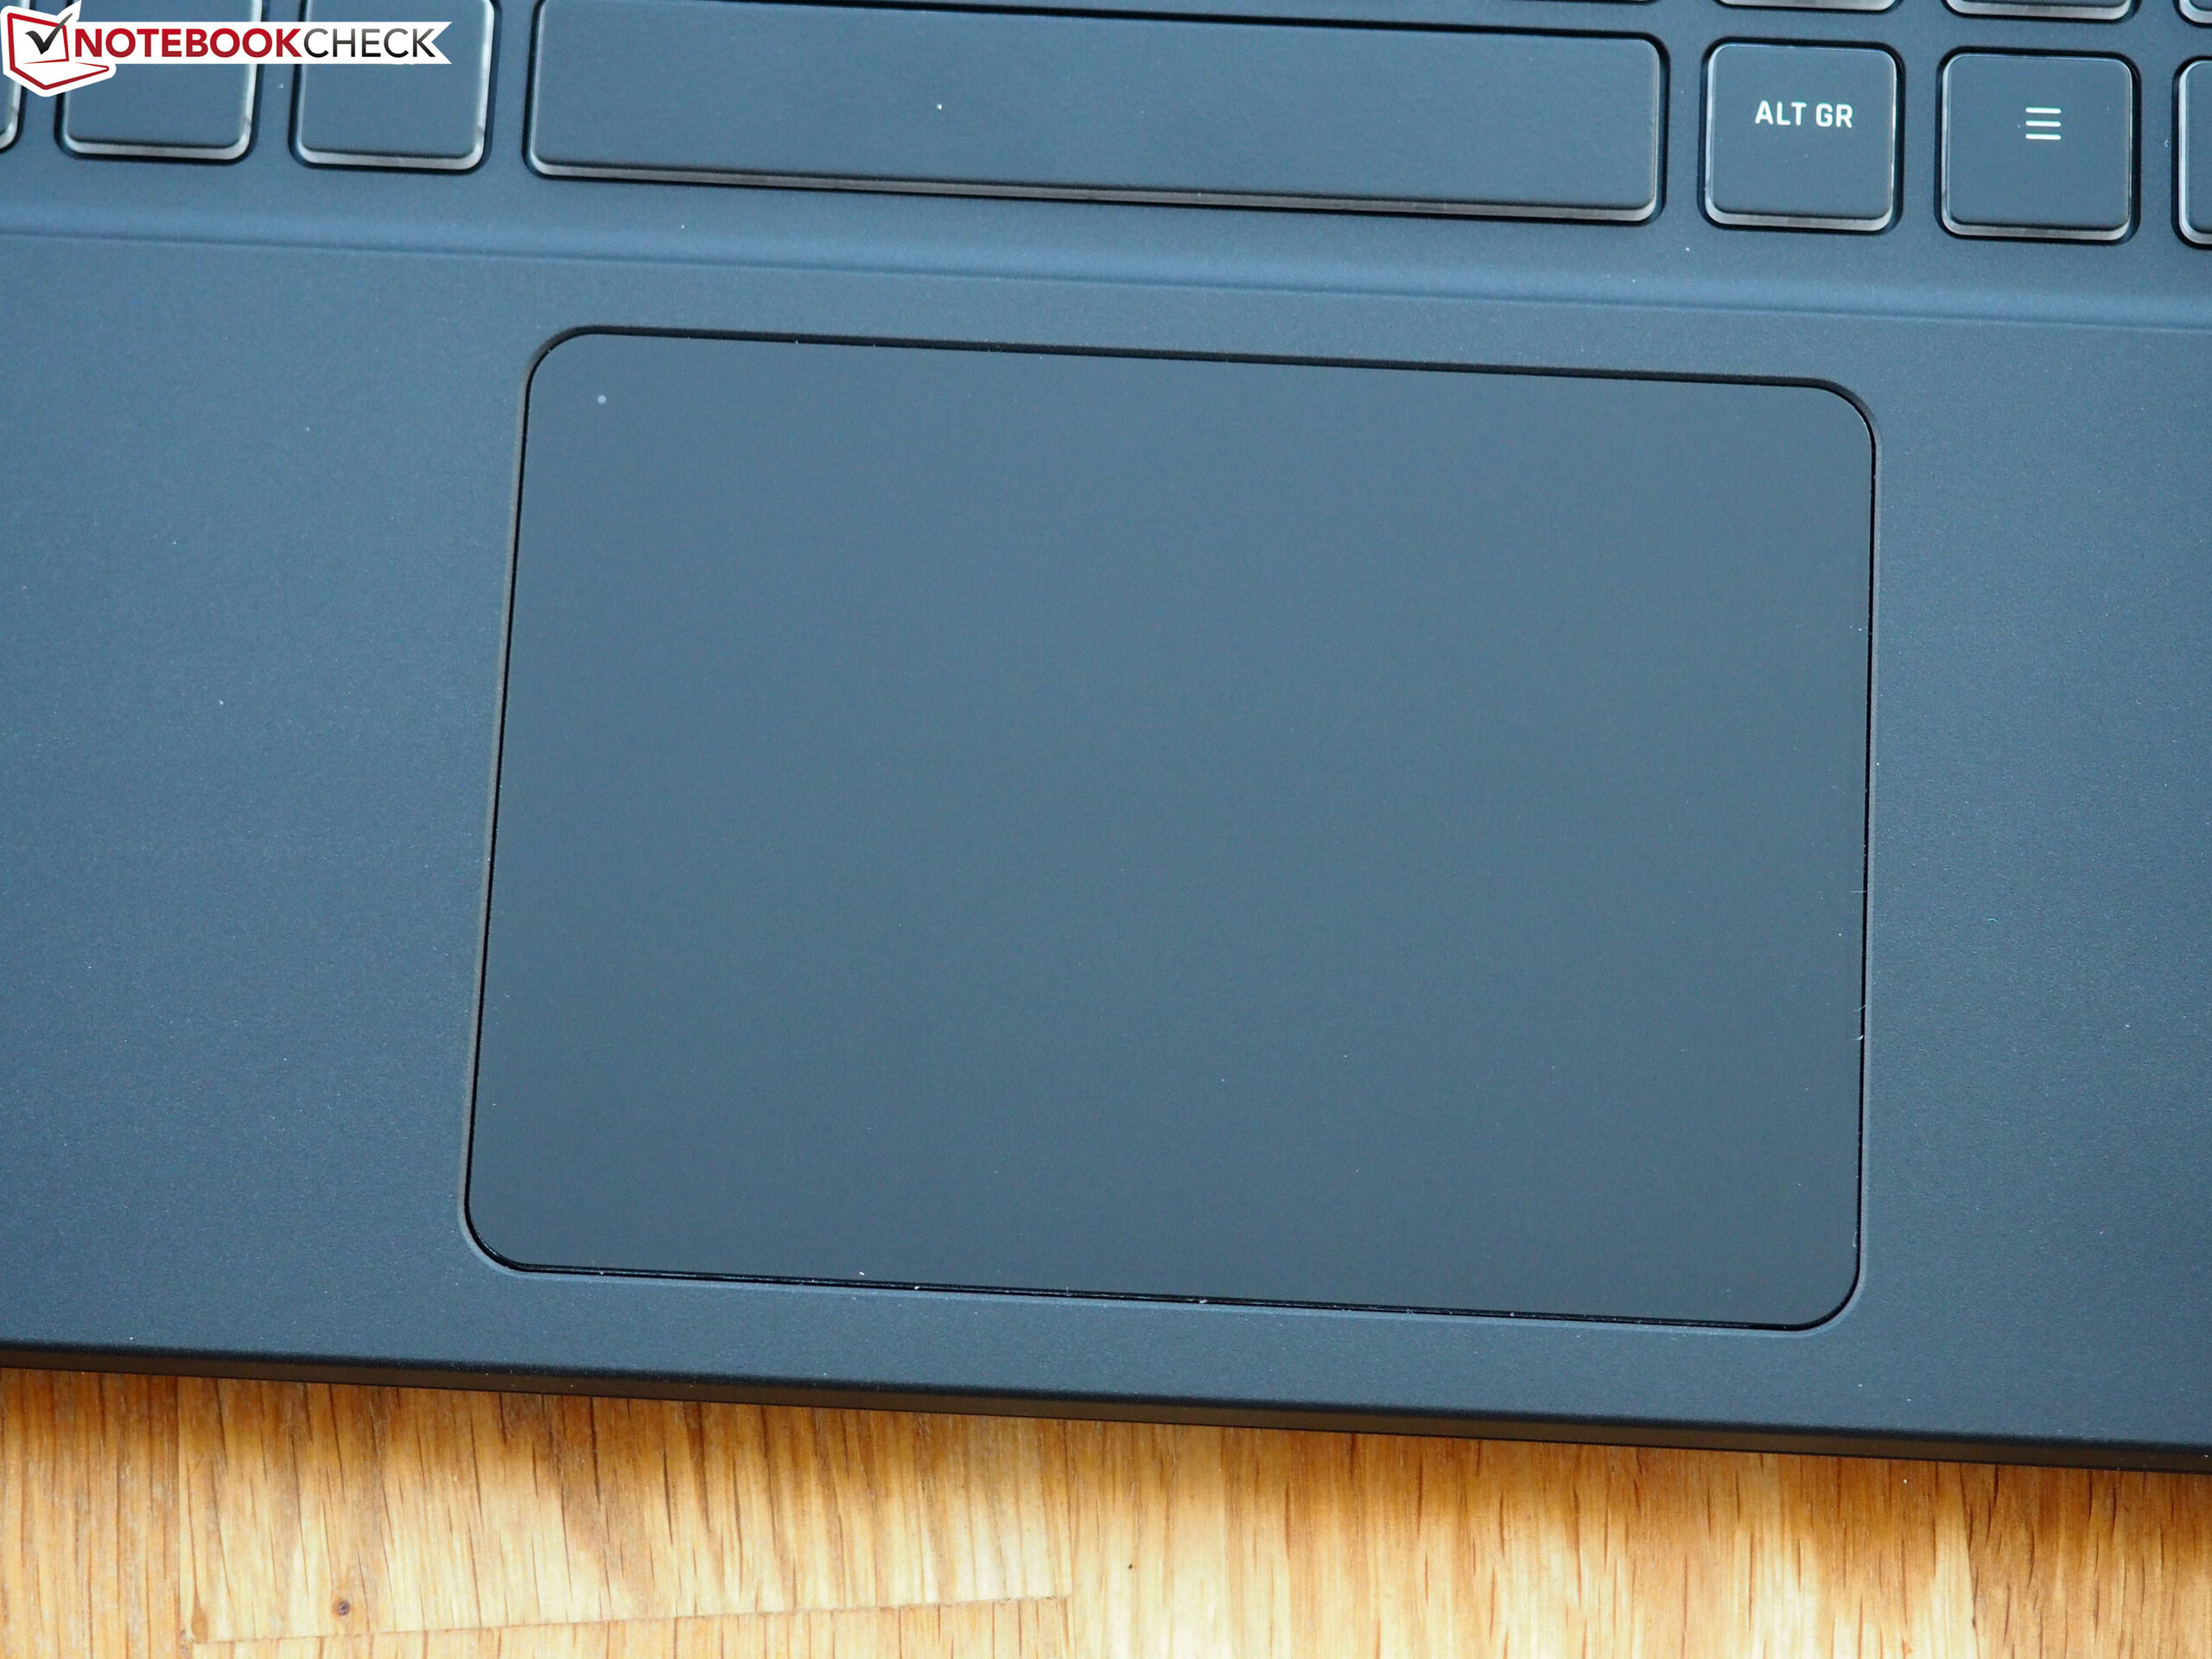
(±) Handledsstöden och pekplattan kan bli väldigt varma vid beröring med maximalt 37 °C / 98.6 F.
(-) Medeltemperaturen för handledsstödsområdet på liknande enheter var 28.8 °C / 83.8 F (-8.2 °C / -14.8 F).
| Schenker XMG Core 15 GK5CP6V i7-9750H, GeForce GTX 1660 Ti Mobile | Razer Blade 15 GTX 1660 Ti i7-9750H, GeForce GTX 1660 Ti Mobile | Asus ROG Zephyrus M15 GU502GU-XB74 i7-9750H, GeForce GTX 1660 Ti Mobile | Aorus 15-SA i7-9750H, GeForce GTX 1660 Ti Mobile | Lenovo Legion Y540-15IRH-81SX00B2GE i7-9750H, GeForce GTX 1660 Ti Mobile | Acer Predator Helios 300 PH315-52-79TY i7-9750H, GeForce GTX 1660 Ti Mobile | |
|---|---|---|---|---|---|---|
| Heat | -20% | -15% | -6% | -12% | 8% | |
| Maximum Upper Side * (°C) | 48 | 52 -8% | 49.8 -4% | 44 8% | 42.7 11% | 52 -8% |
| Maximum Bottom * (°C) | 59 | 52.2 12% | 63.2 -7% | 58 2% | 52.7 11% | 46.3 22% |
| Idle Upper Side * (°C) | 27 | 38 -41% | 32 -19% | 30 -11% | 33.1 -23% | 24.8 8% |
| Idle Bottom * (°C) | 28 | 40.4 -44% | 36.2 -29% | 34 -21% | 41 -46% | 25.4 9% |
* ... mindre är bättre
Schenker XMG Core 15 GK5CP6V ljudanalys
(±) | högtalarljudstyrkan är genomsnittlig men bra (76 dB)
Bas 100 - 315 Hz
(-) | nästan ingen bas - i genomsnitt 23.1% lägre än medianen
(±) | linjäriteten för basen är genomsnittlig (11.5% delta till föregående frekvens)
Mellan 400 - 2000 Hz
(+) | balanserad mellan - endast 4.7% från medianen
(±) | linjäriteten för mids är genomsnittlig (9% delta till föregående frekvens)
Högsta 2 - 16 kHz
(+) | balanserade toppar - endast 1.5% från medianen
(+) | toppar är linjära (4.6% delta till föregående frekvens)
Totalt 100 - 16 000 Hz
(±) | linjäriteten för det totala ljudet är genomsnittlig (23.1% skillnad mot median)
Jämfört med samma klass
» 84% av alla testade enheter i den här klassen var bättre, 4% liknande, 12% sämre
» Den bästa hade ett delta på 6%, genomsnittet var 18%, sämst var 132%
Jämfört med alla testade enheter
» 69% av alla testade enheter var bättre, 5% liknande, 26% sämre
» Den bästa hade ett delta på 4%, genomsnittet var 24%, sämst var 134%
Razer Blade 15 GTX 1660 Ti ljudanalys
(±) | högtalarljudstyrkan är genomsnittlig men bra (80.1 dB)
Bas 100 - 315 Hz
(±) | reducerad bas - i genomsnitt 13.5% lägre än medianen
(±) | linjäriteten för basen är genomsnittlig (13.2% delta till föregående frekvens)
Mellan 400 - 2000 Hz
(±) | högre mellan - i genomsnitt 5.3% högre än median
(+) | mids är linjära (4.7% delta till föregående frekvens)
Högsta 2 - 16 kHz
(±) | reducerade toppar - i genomsnitt 5.1% lägre än medianen
(±) | linjäriteten för toppar är genomsnittlig (7.2% delta till föregående frekvens)
Totalt 100 - 16 000 Hz
(±) | linjäriteten för det totala ljudet är genomsnittlig (25.2% skillnad mot median)
Jämfört med samma klass
» 90% av alla testade enheter i den här klassen var bättre, 3% liknande, 7% sämre
» Den bästa hade ett delta på 6%, genomsnittet var 18%, sämst var 132%
Jämfört med alla testade enheter
» 77% av alla testade enheter var bättre, 5% liknande, 18% sämre
» Den bästa hade ett delta på 4%, genomsnittet var 24%, sämst var 134%
| Av/Standby | |
| Låg belastning | |
| Hög belastning |
|
Förklaring:
min: | |
| Schenker XMG Core 15 GK5CP6V i7-9750H, GeForce GTX 1660 Ti Mobile | Razer Blade 15 GTX 1660 Ti i7-9750H, GeForce GTX 1660 Ti Mobile | Asus ROG Zephyrus M15 GU502GU-XB74 i7-9750H, GeForce GTX 1660 Ti Mobile | Aorus 15-SA i7-9750H, GeForce GTX 1660 Ti Mobile | Lenovo Legion Y540-15IRH-81SX00B2GE i7-9750H, GeForce GTX 1660 Ti Mobile | Acer Predator Helios 300 PH315-52-79TY i7-9750H, GeForce GTX 1660 Ti Mobile | |
|---|---|---|---|---|---|---|
| Power Consumption | -67% | -77% | -47% | -24% | -45% | |
| Idle Minimum * (Watt) | 9 | 18.7 -108% | 17.6 -96% | 20 -122% | 14.5 -61% | 17.2 -91% |
| Idle Average * (Watt) | 12 | 30.7 -156% | 24.7 -106% | 23 -92% | 18.5 -54% | 22.6 -88% |
| Idle Maximum * (Watt) | 18 | 33.9 -88% | 56.3 -213% | 29 -61% | 20 -11% | 25.5 -42% |
| Load Average * (Watt) | 86 | 93.4 -9% | 111.1 -29% | 87 -1% | 81.6 5% | 88 -2% |
| Witcher 3 ultra * (Watt) | 126 | 158.9 -26% | 149 -18% | 136 -8% | 132 -5% | |
| Load Maximum * (Watt) | 173 | 195.3 -13% | 170 2% | 173 -0% | 208.1 -20% | 177 -2% |
* ... mindre är bättre
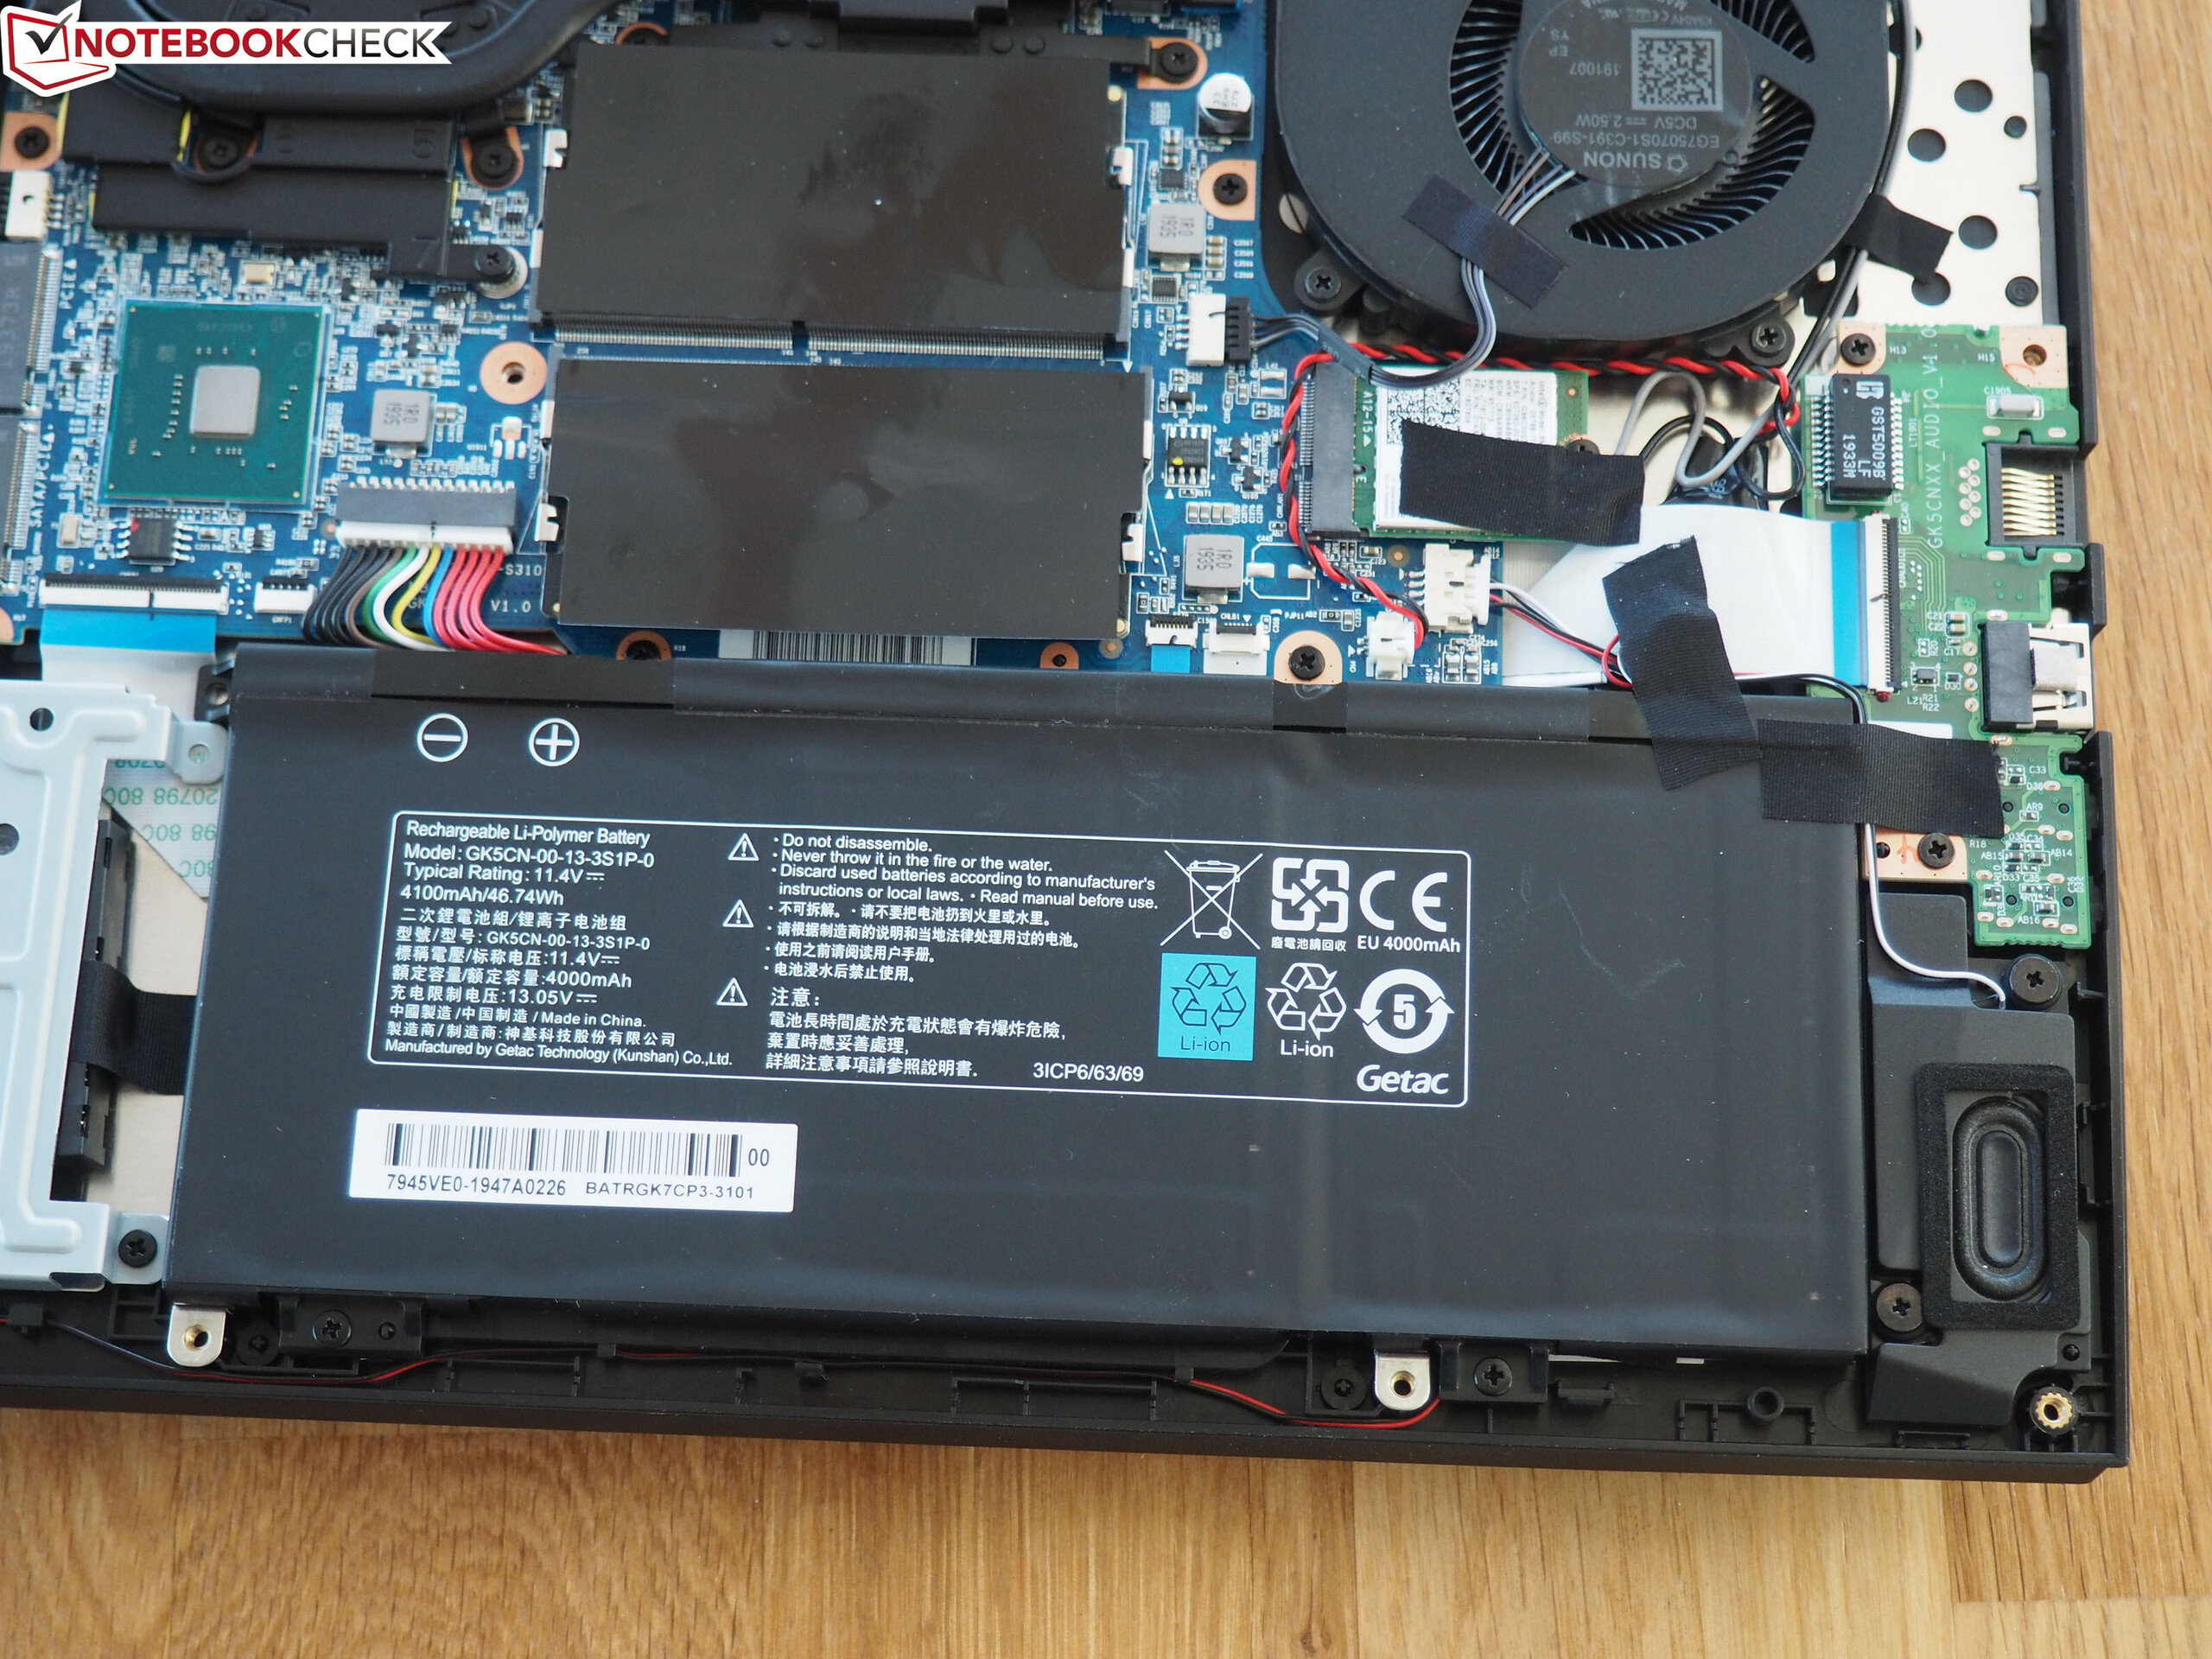
| Schenker XMG Core 15 GK5CP6V i7-9750H, GeForce GTX 1660 Ti Mobile, 46 Wh | Razer Blade 15 GTX 1660 Ti i7-9750H, GeForce GTX 1660 Ti Mobile, 65 Wh | Asus ROG Zephyrus M15 GU502GU-XB74 i7-9750H, GeForce GTX 1660 Ti Mobile, 76 Wh | Aorus 15-SA i7-9750H, GeForce GTX 1660 Ti Mobile, 62 Wh | Lenovo Legion Y540-15IRH-81SX00B2GE i7-9750H, GeForce GTX 1660 Ti Mobile, 57 Wh | Acer Predator Helios 300 PH315-52-79TY i7-9750H, GeForce GTX 1660 Ti Mobile, 58.75 Wh | |
|---|---|---|---|---|---|---|
| Batteridrifttid | 53% | 61% | 40% | 6% | 17% | |
| Reader / Idle (h) | 6.1 | 7.1 16% | 3.5 -43% | 4 -34% | 5 -18% | |
| WiFi v1.3 (h) | 3.6 | 5.5 53% | 4.5 25% | 2.8 -22% | 2.4 -33% | 3.5 -3% |
| Load (h) | 0.7 | 1.7 143% | 2 186% | 1.3 86% | 1.2 71% | |
| H.264 (h) | 2.8 | 3.4 |
För
Emot
Läs den fullständiga versionen av den här recensionen på engelska här.
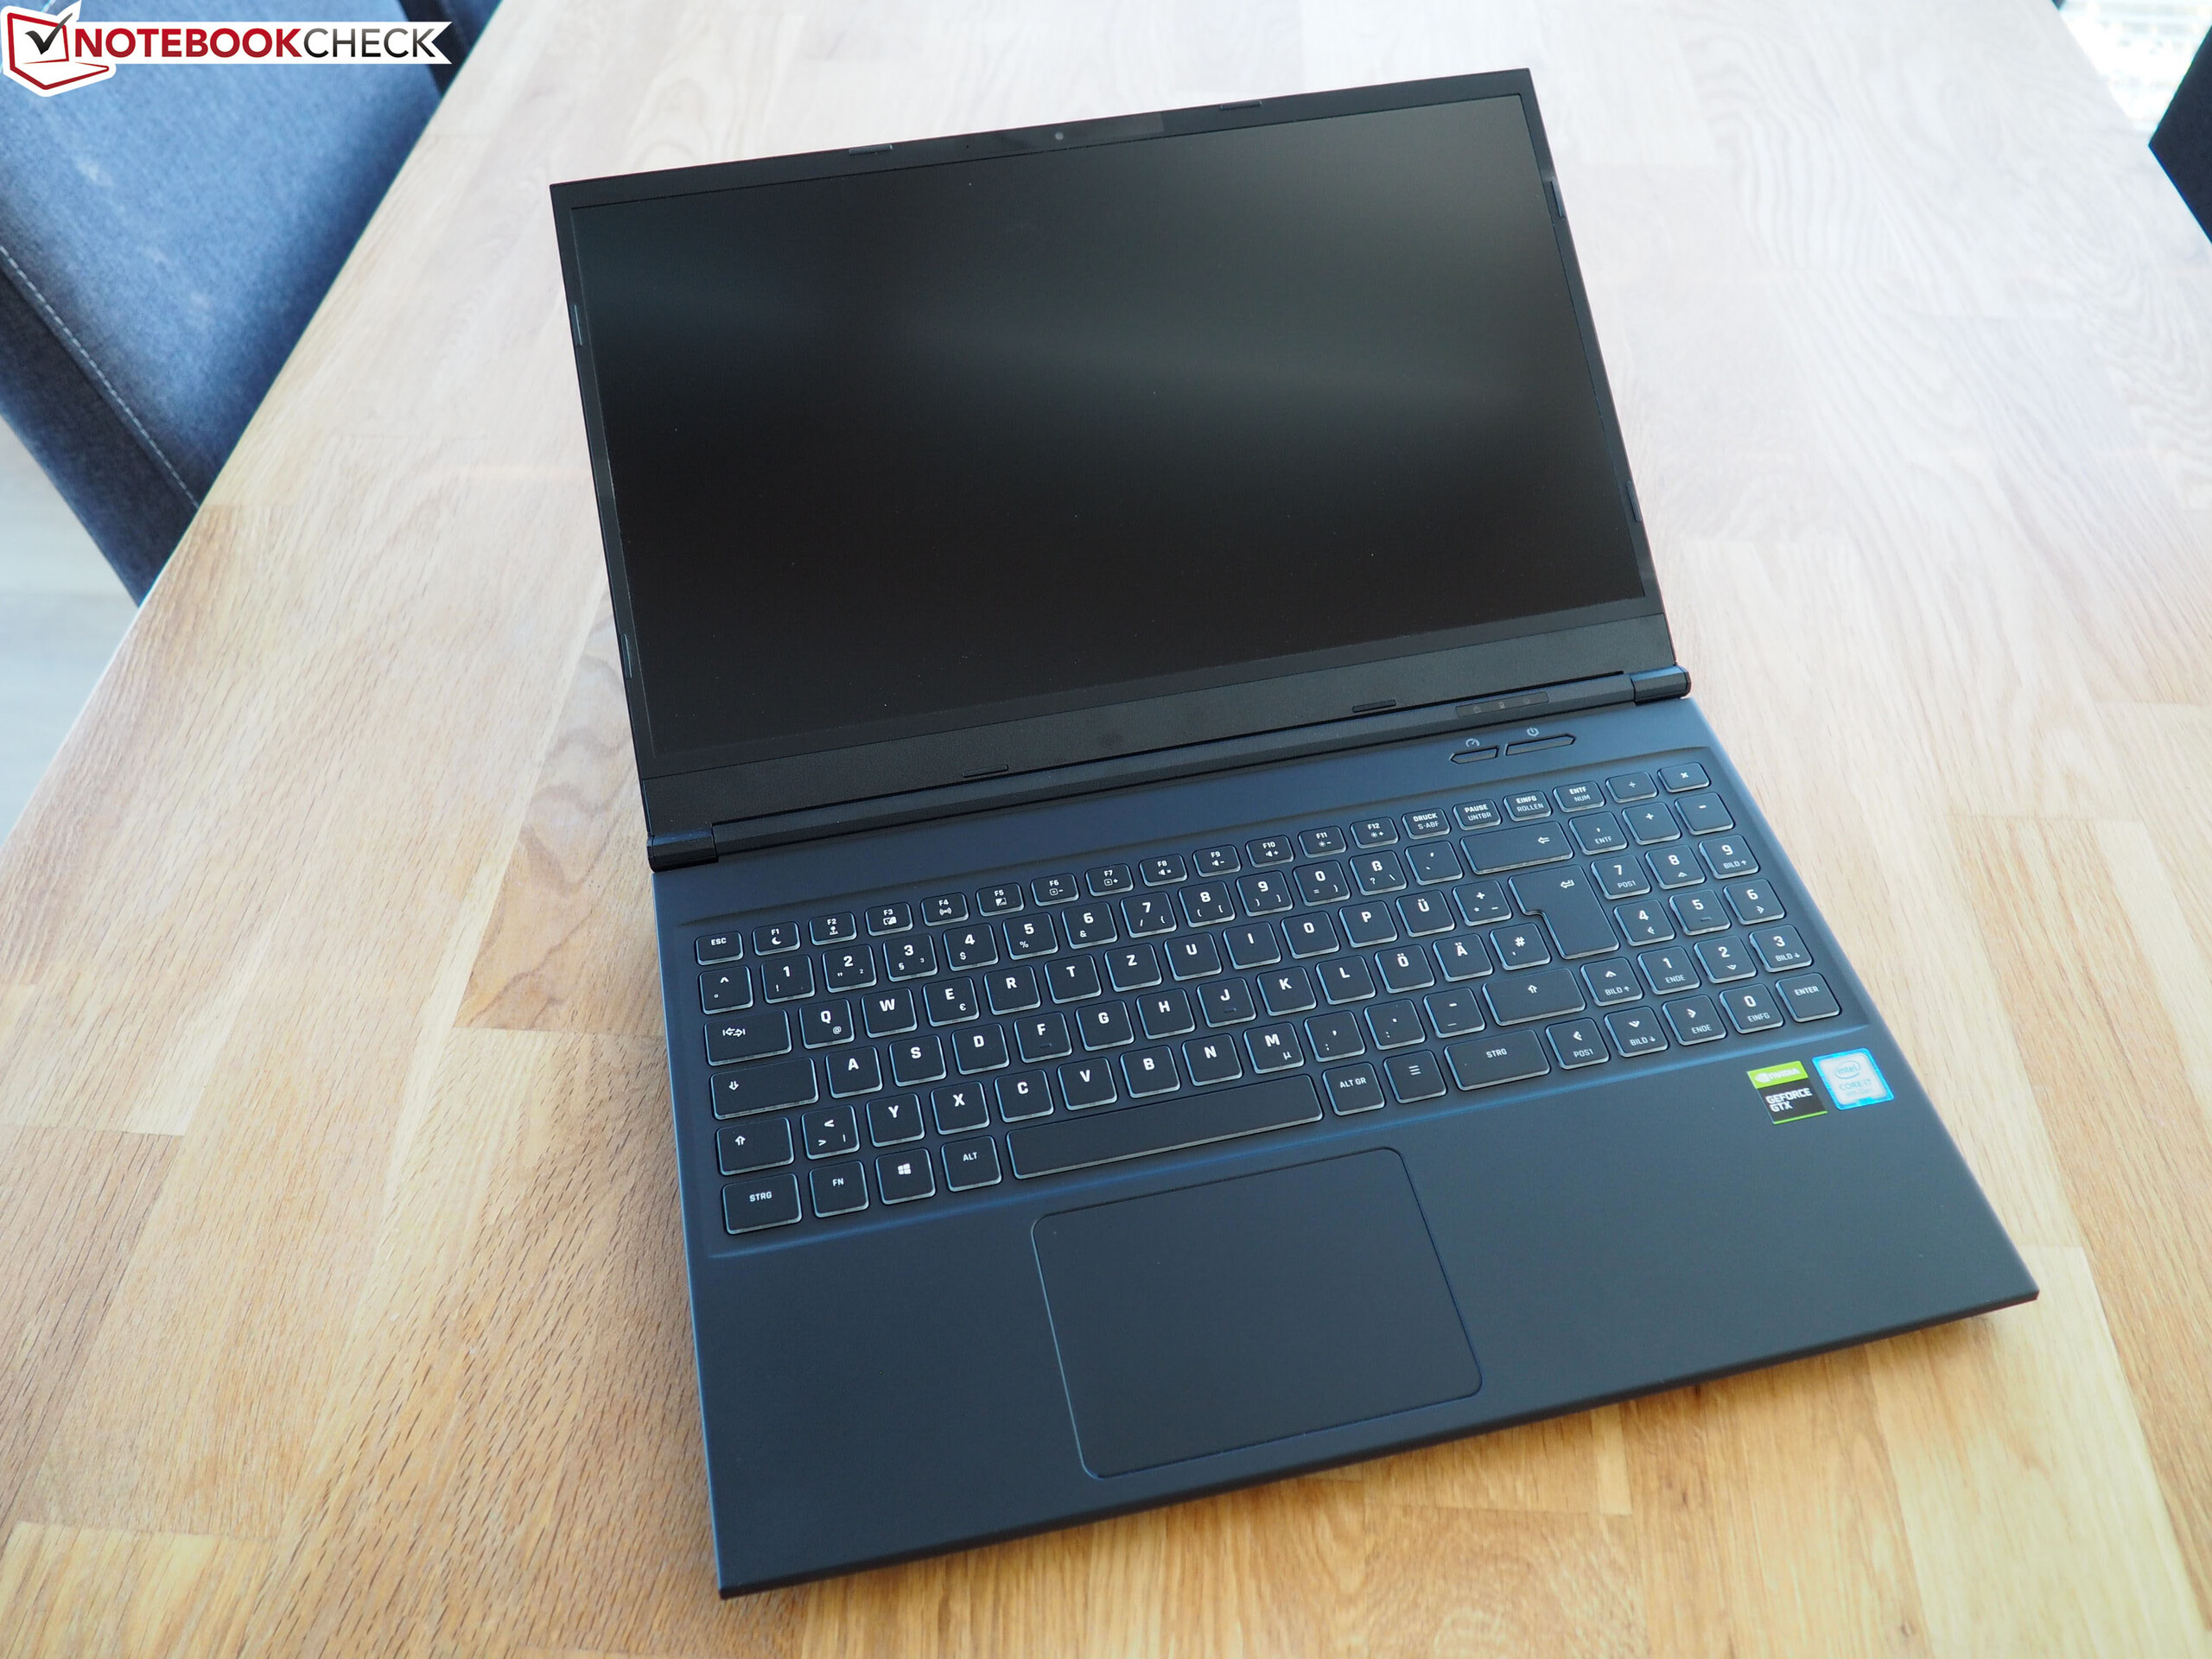
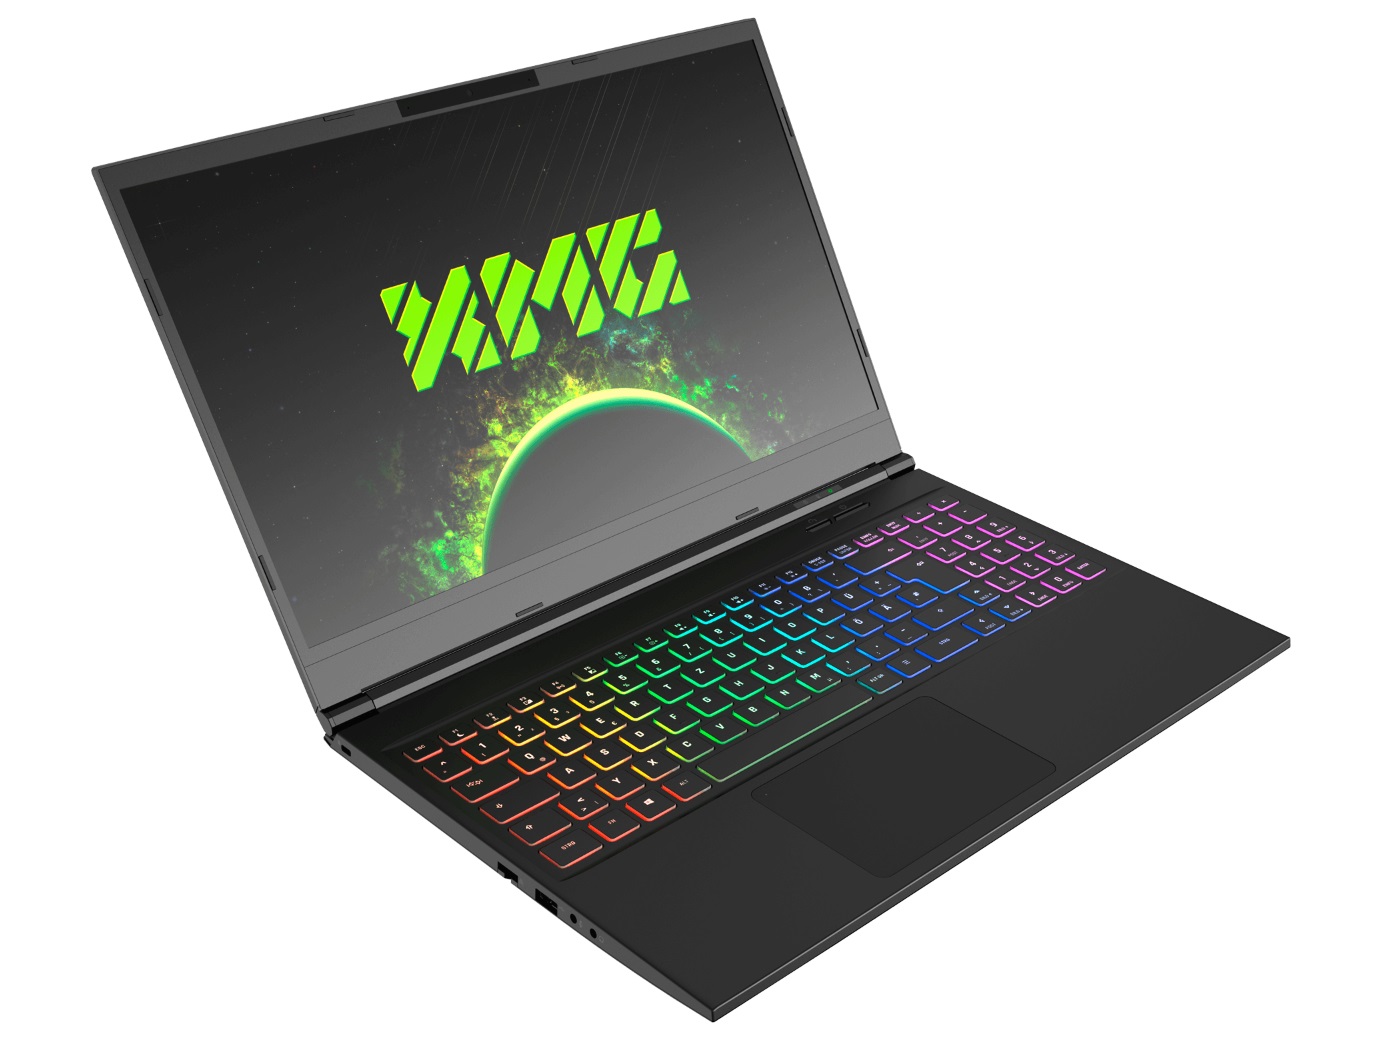
I vårt test visar sig XMG Core 15 vara ett ordentligt alternativ till produkter från större tillverkare (Acer, Asus, Lenovo, etc.).
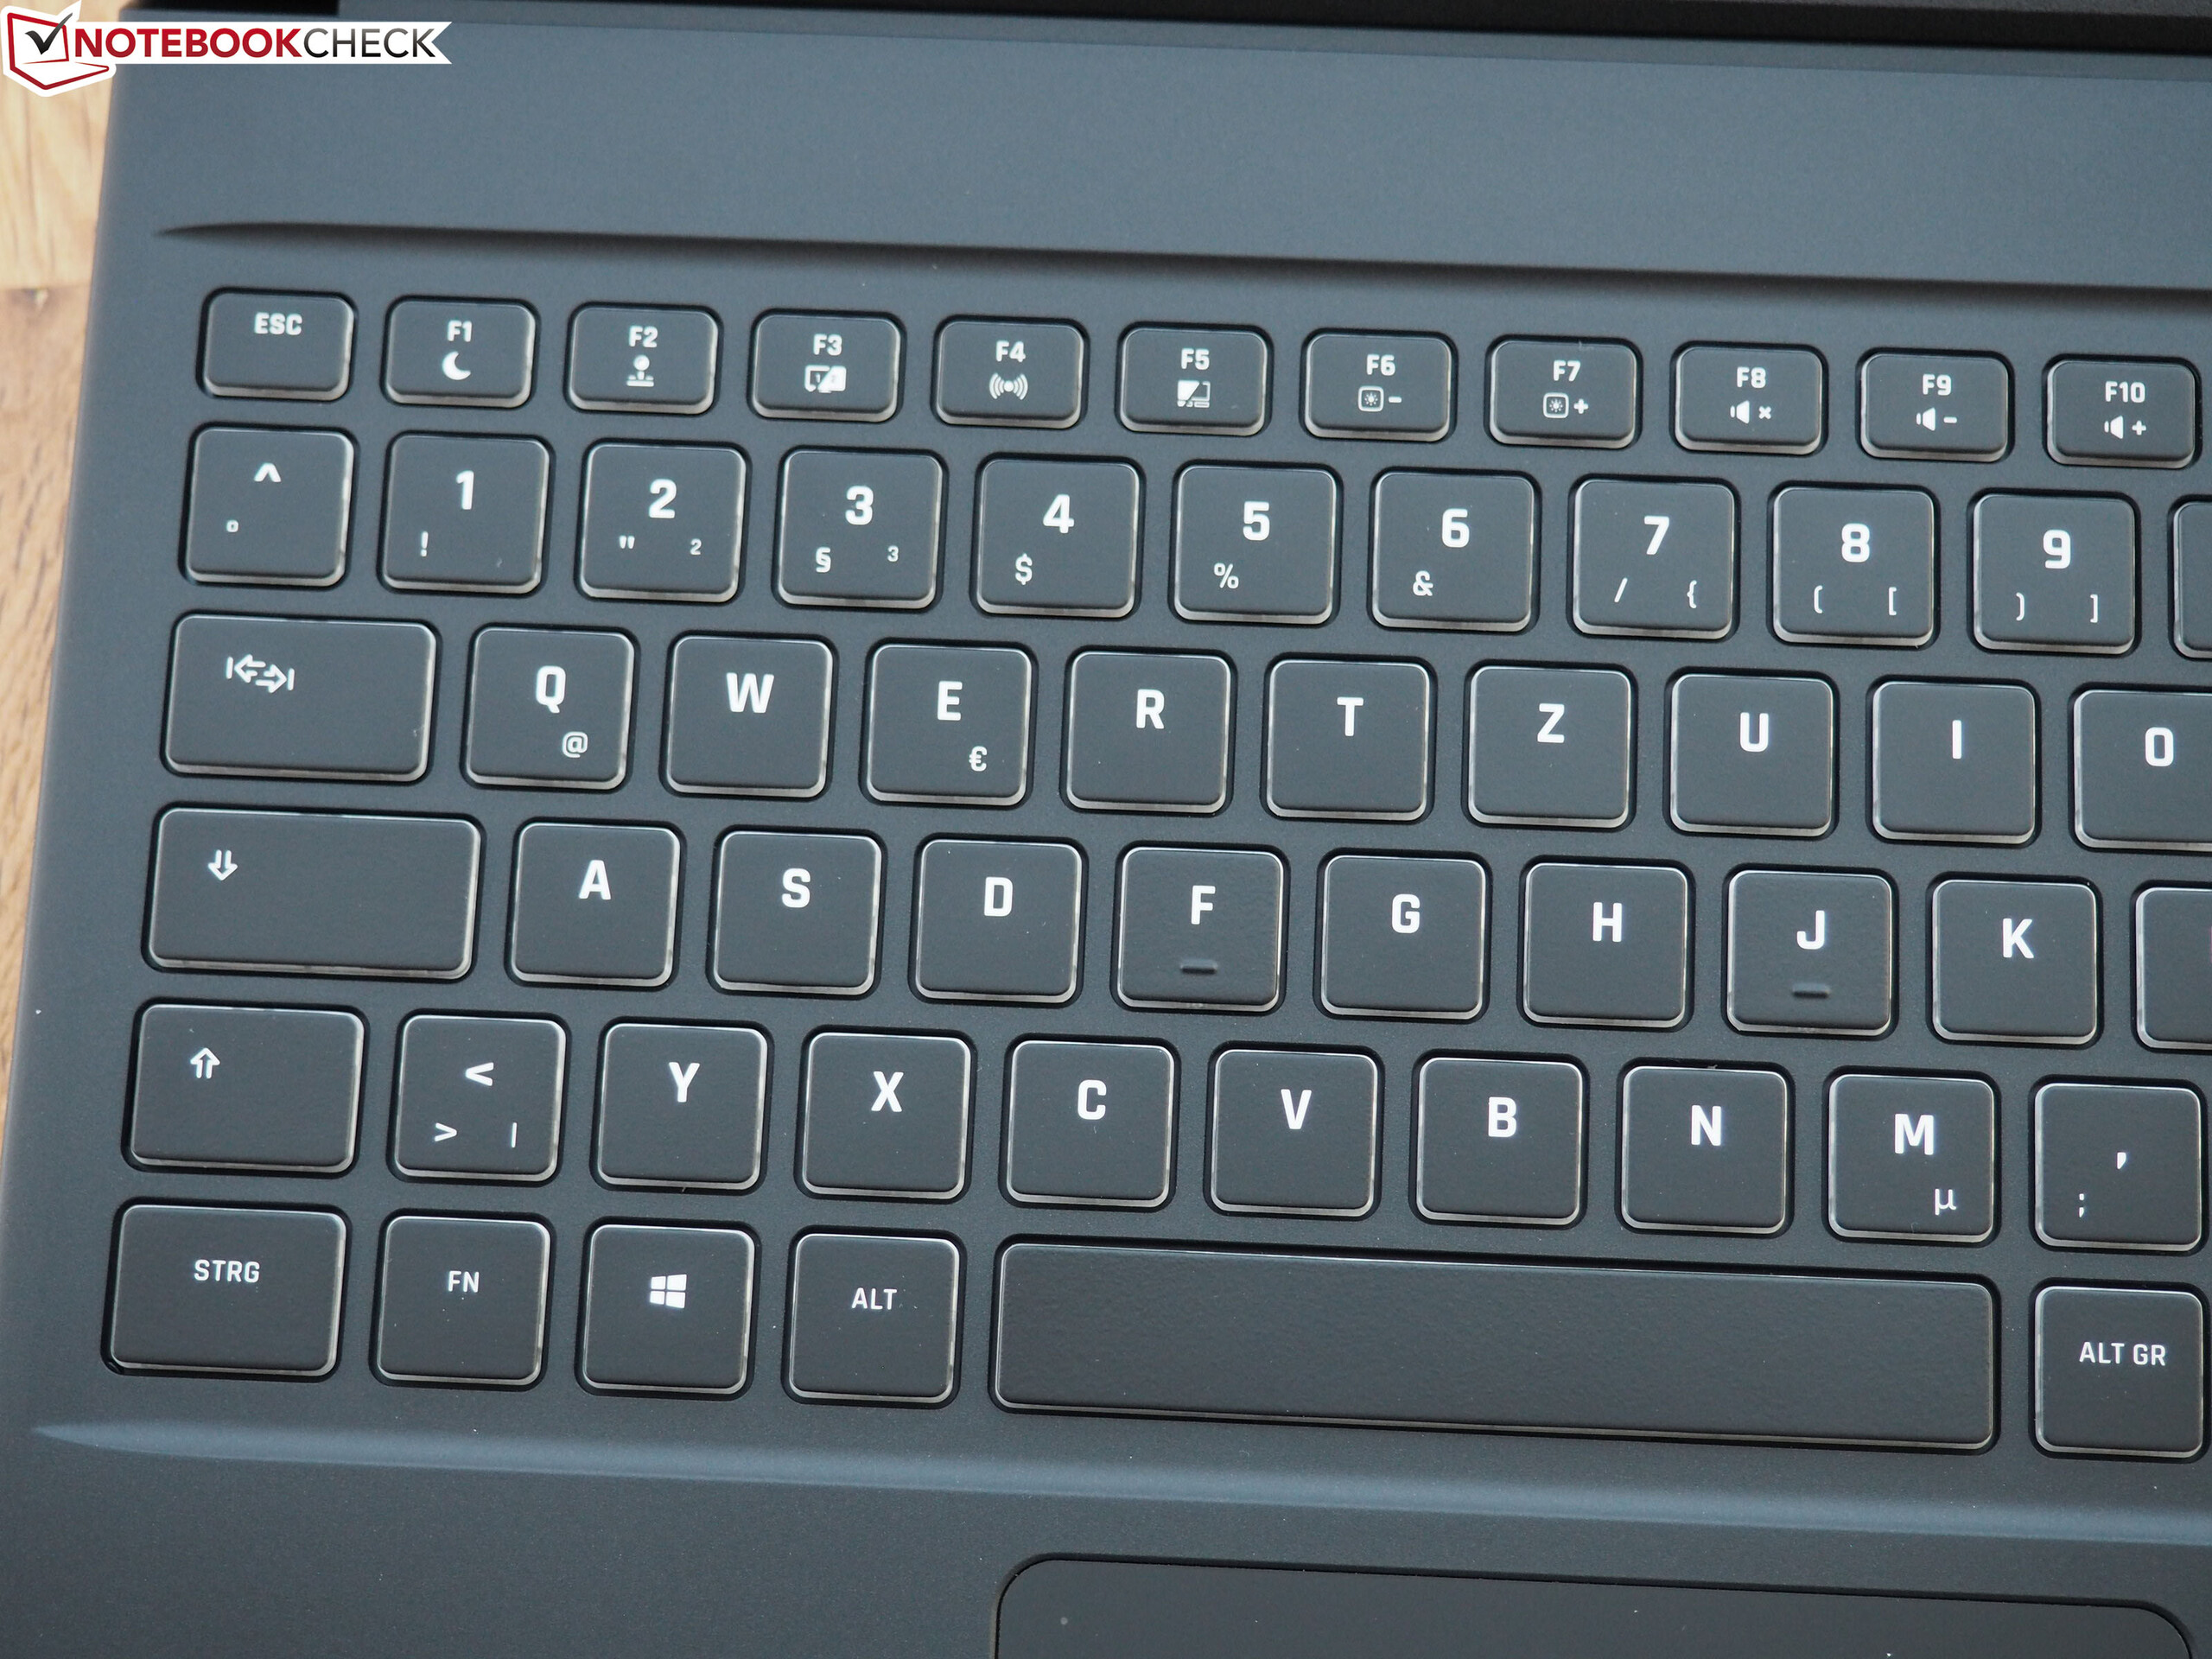
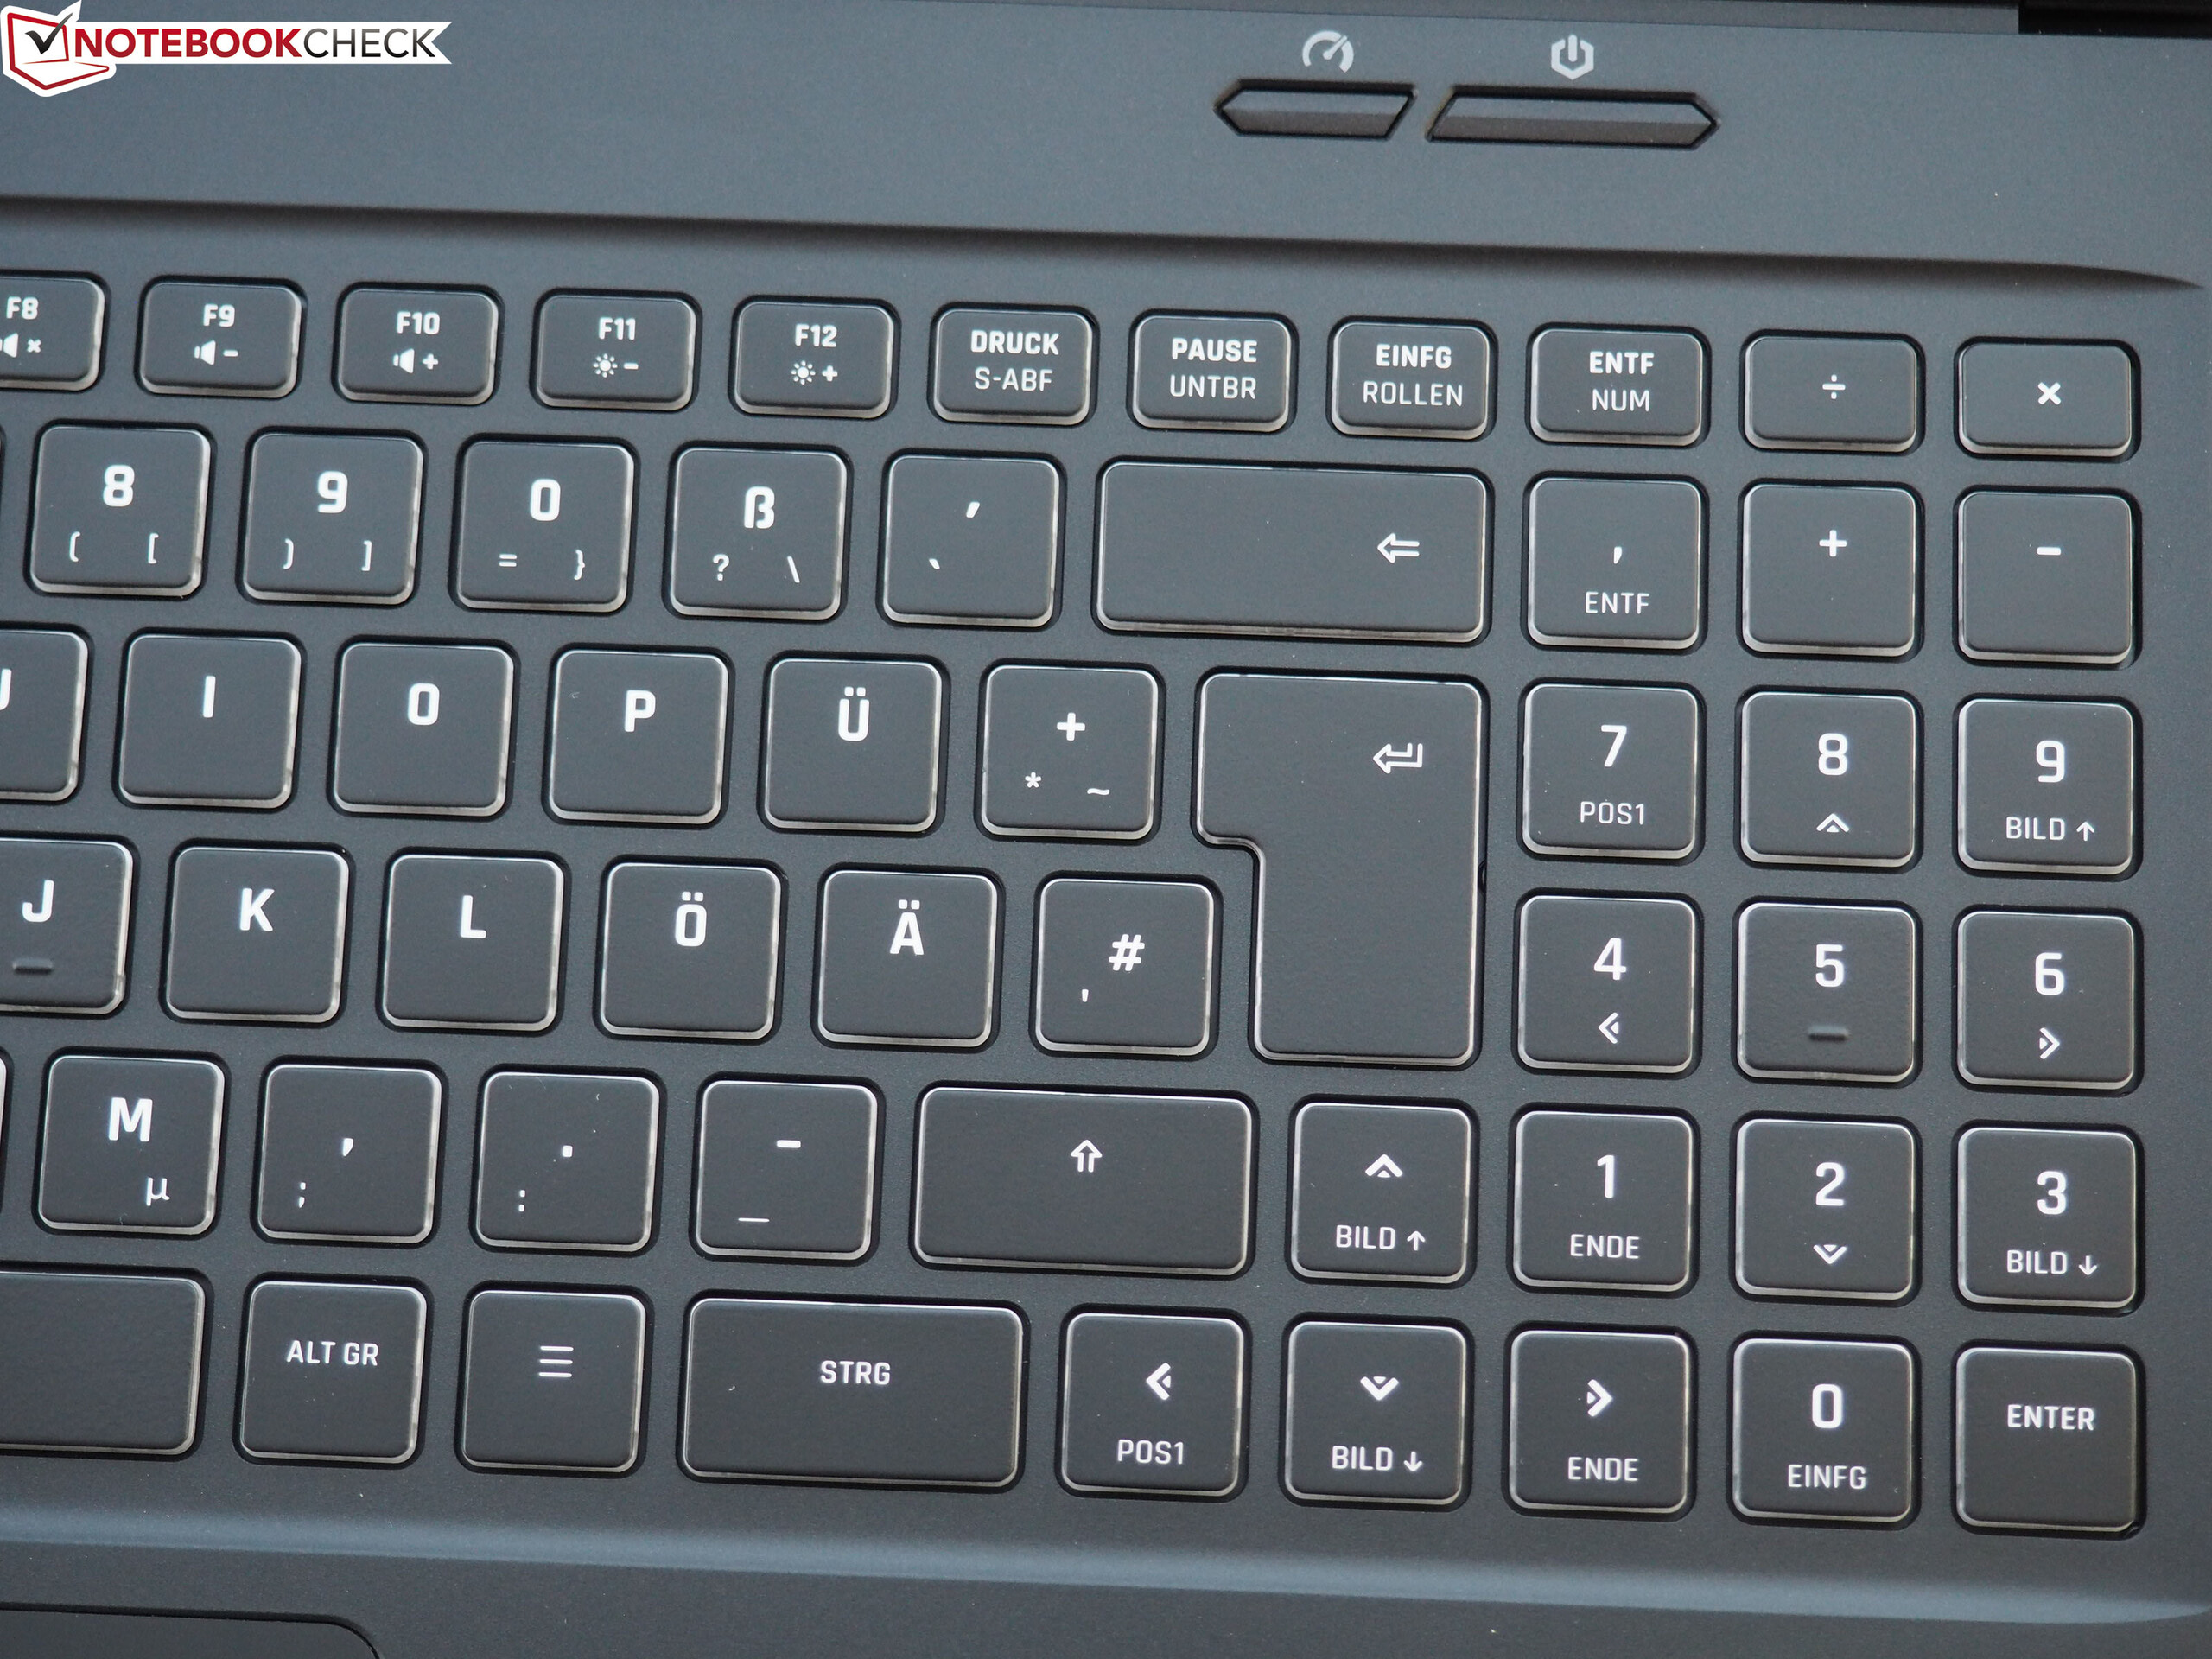
Schenker Technologies levererar en laptop på 15 tum till budgetpris som passar väl till spel och dessutom har en bra och responsiv IPS-skärm. Tangentbordets RGB-belysning lär också göra gamers nöjda. Tack vare låg vikt och små dimensioner är Core 15 också förvånansvärt mobil, förutsatt att du kan bortse från den mediokra batteritiden.
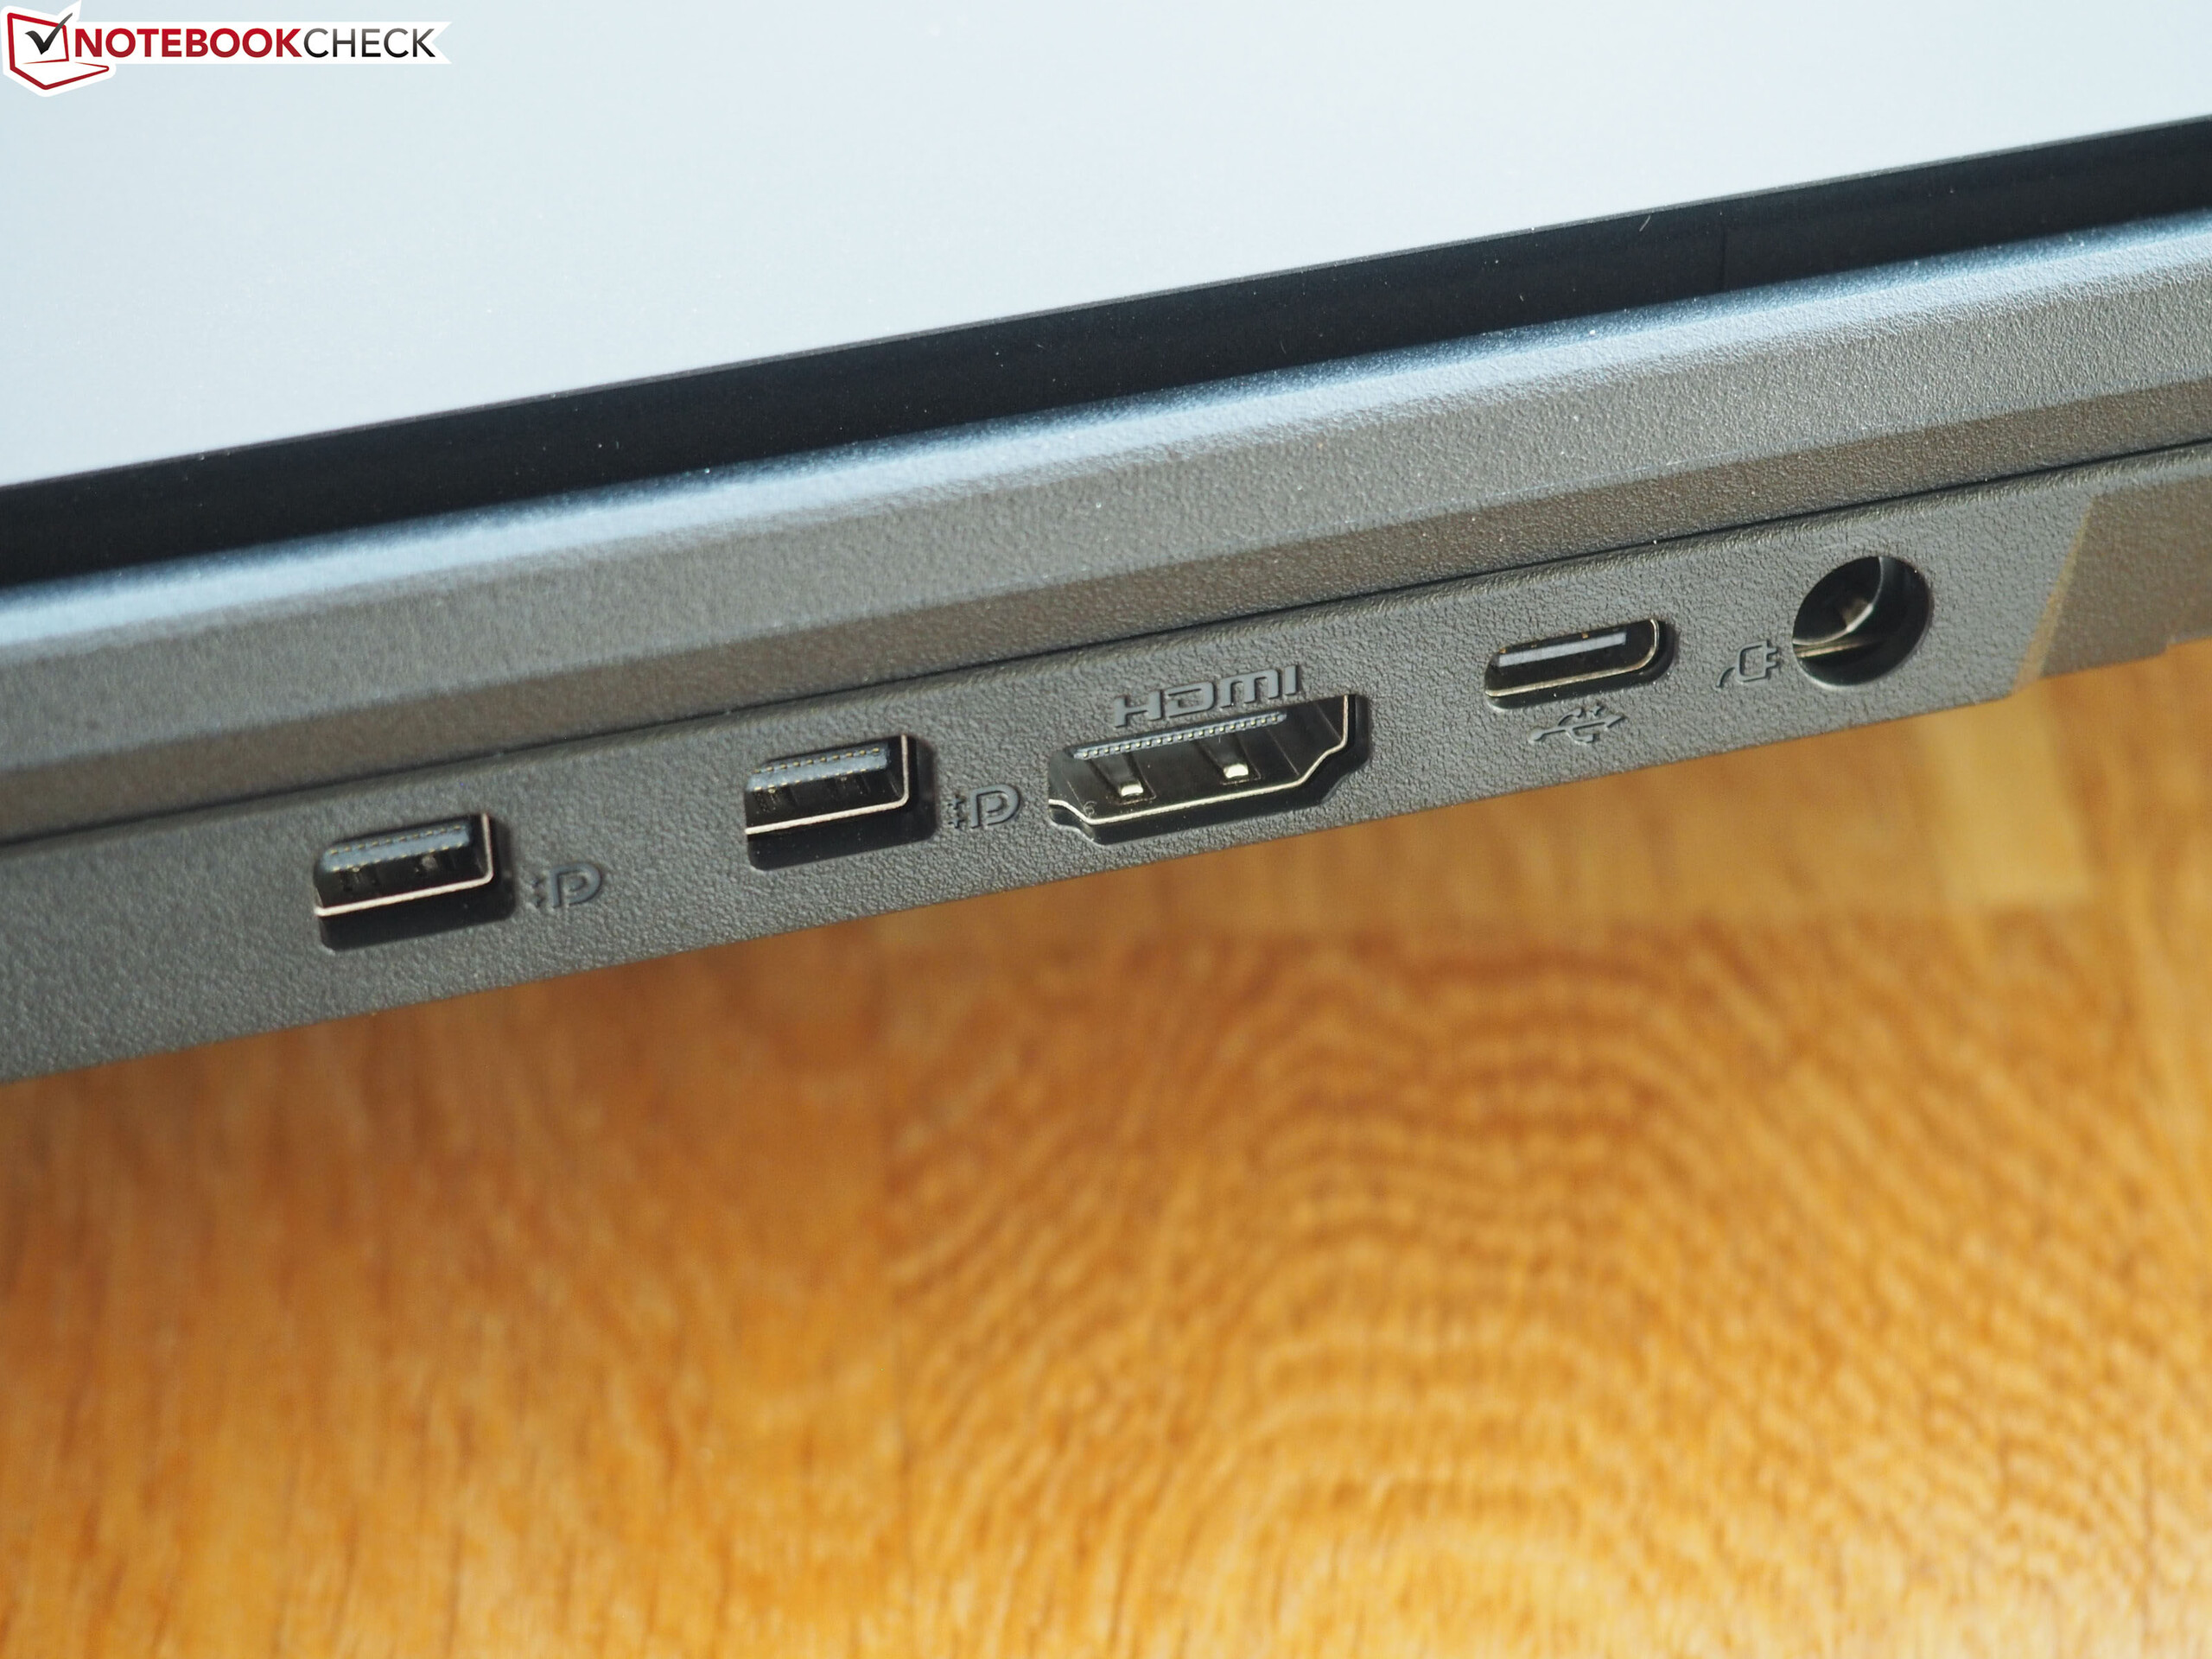
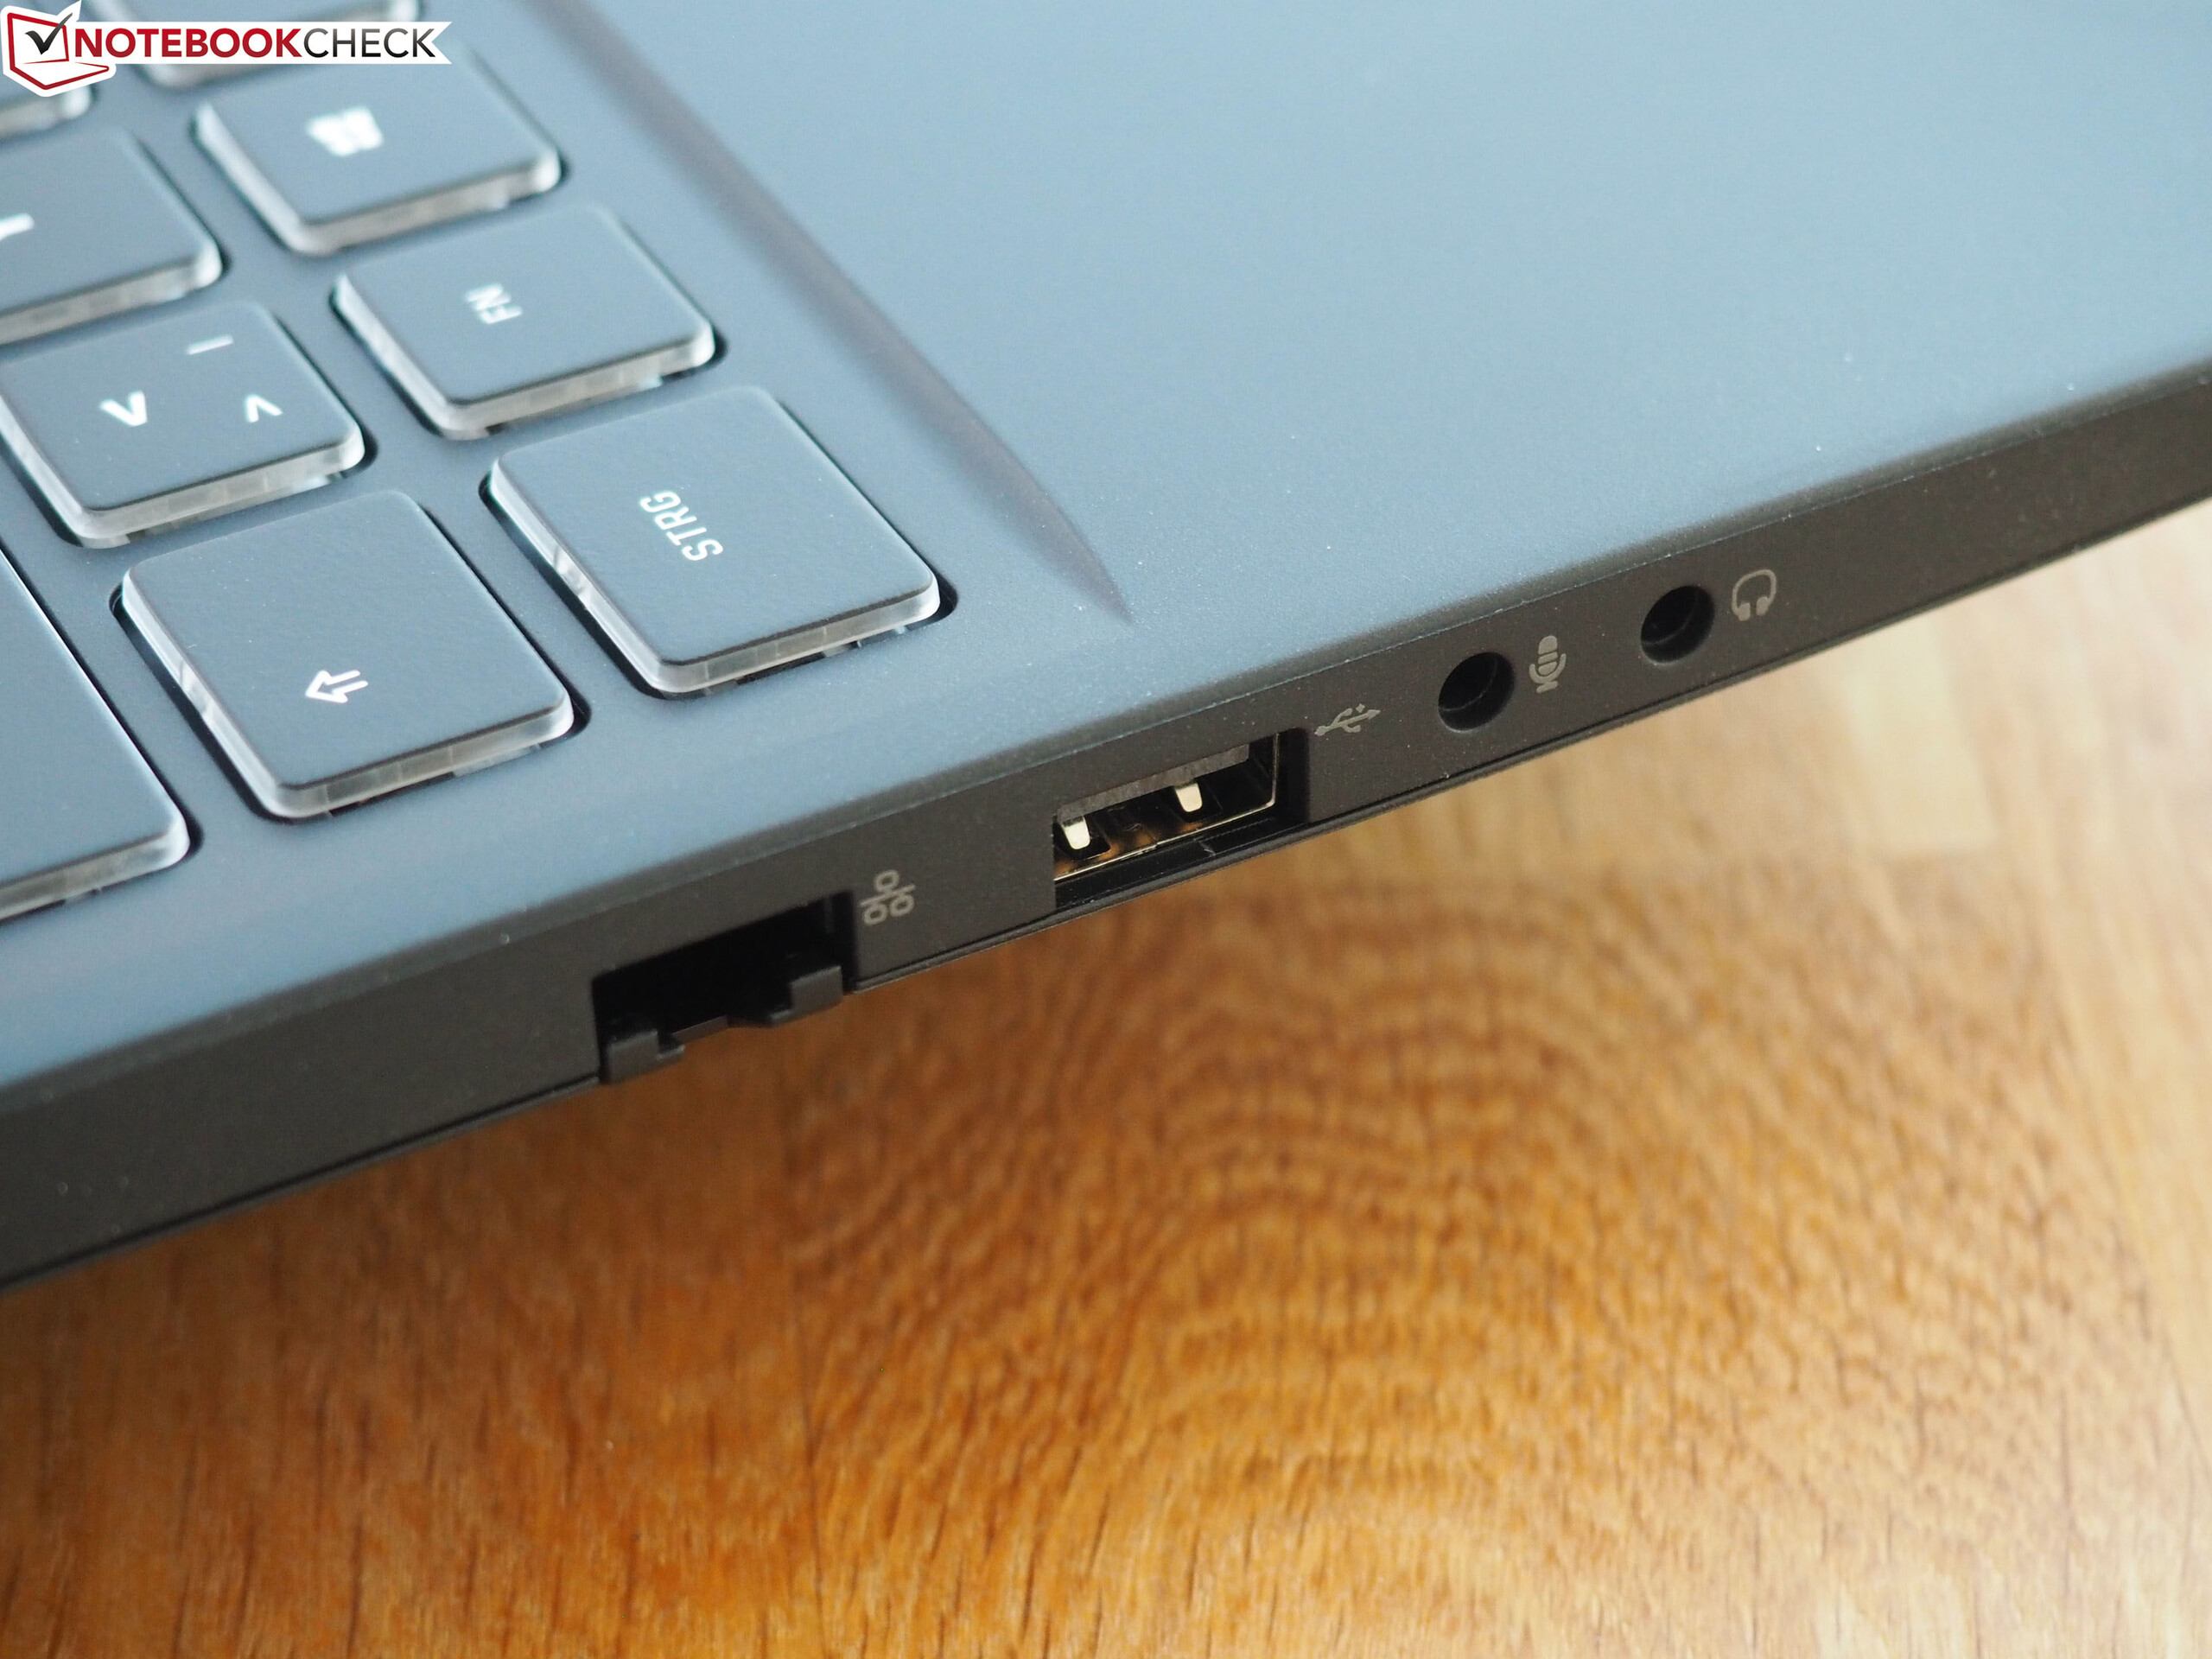
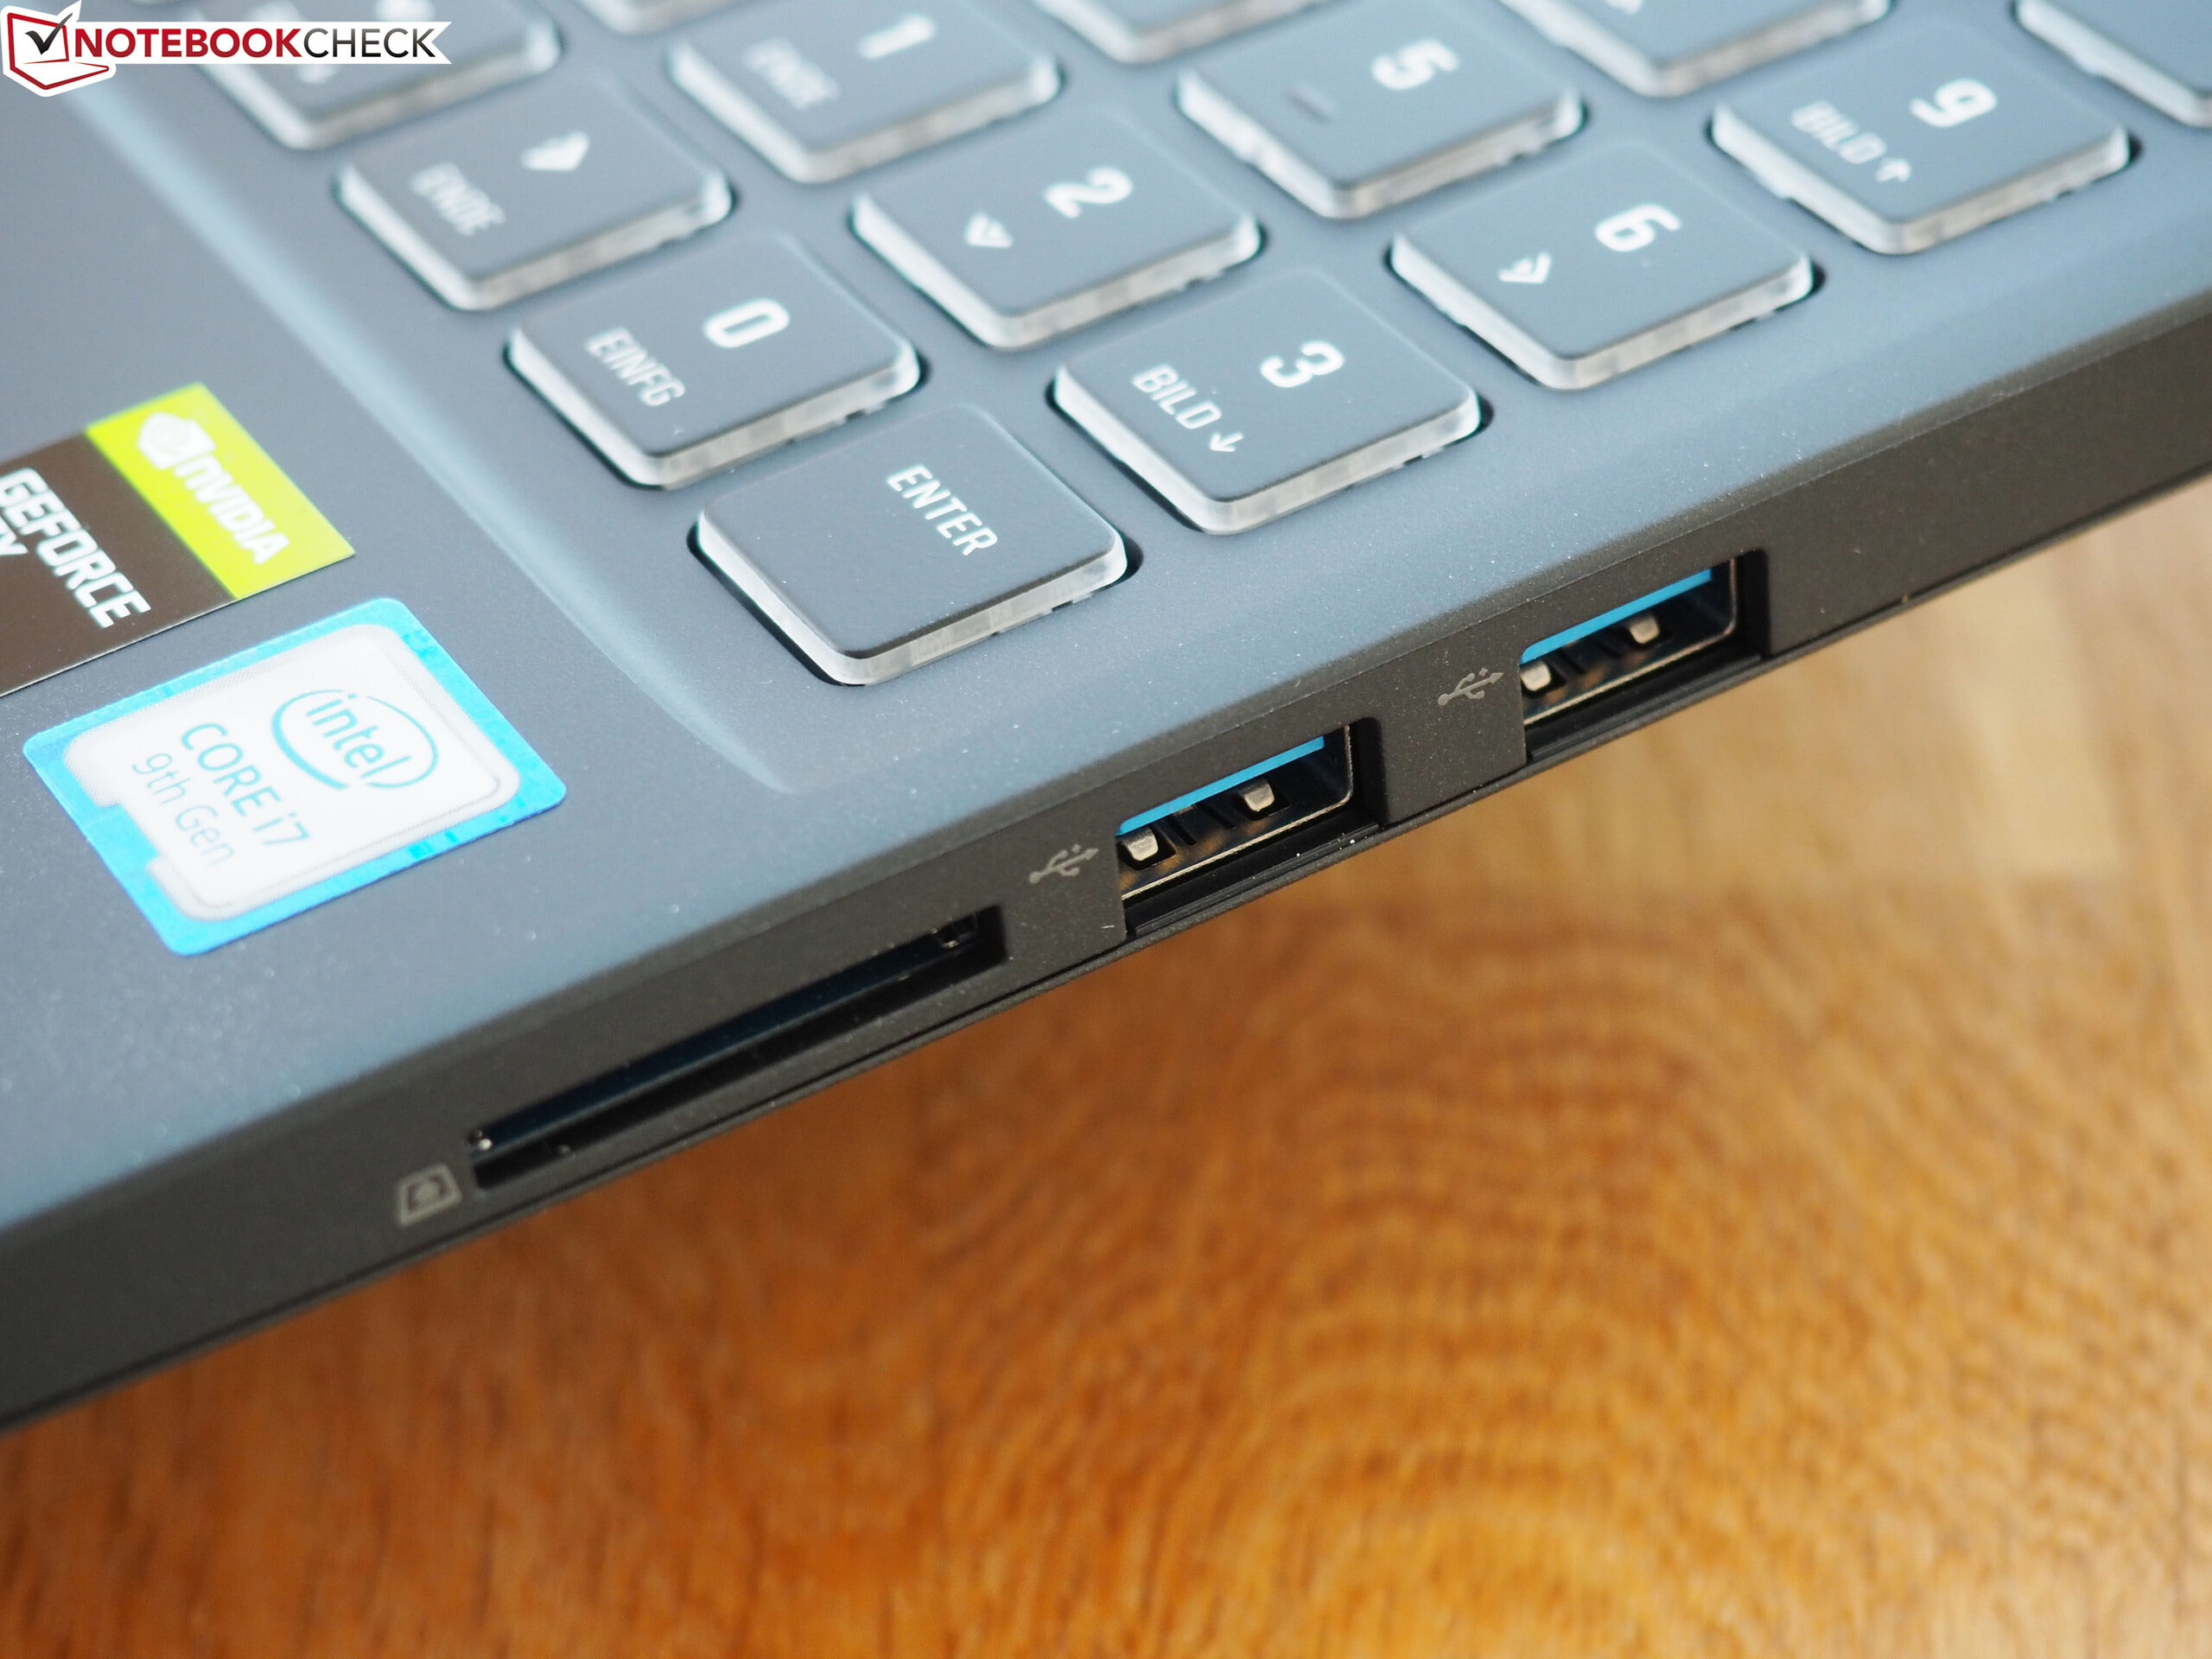
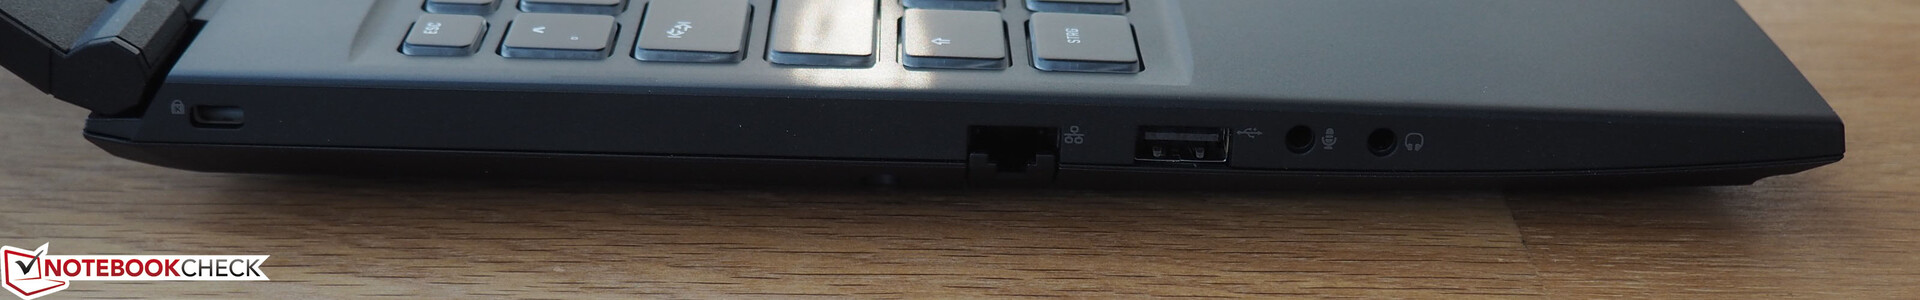
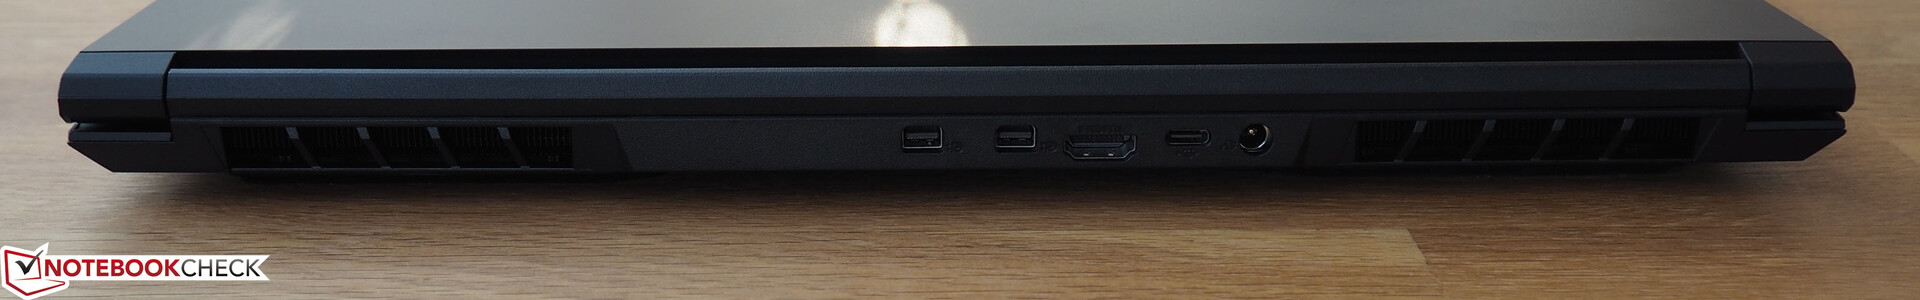
Barebone-tillverkaren Tongfang skulle dock kunna förbättra portutbudet (då datorn varken har Thunderbolt 3 eller USB 3.1 Gen2) och – som ofta är fallet i spelsegmentet – skulle ljudnivån vid belastning kunnat vara lägre.
Schenker XMG Core 15 GK5CP6V
- 02/09/2020 v7 (old)
Florian Glaser
Price comparison