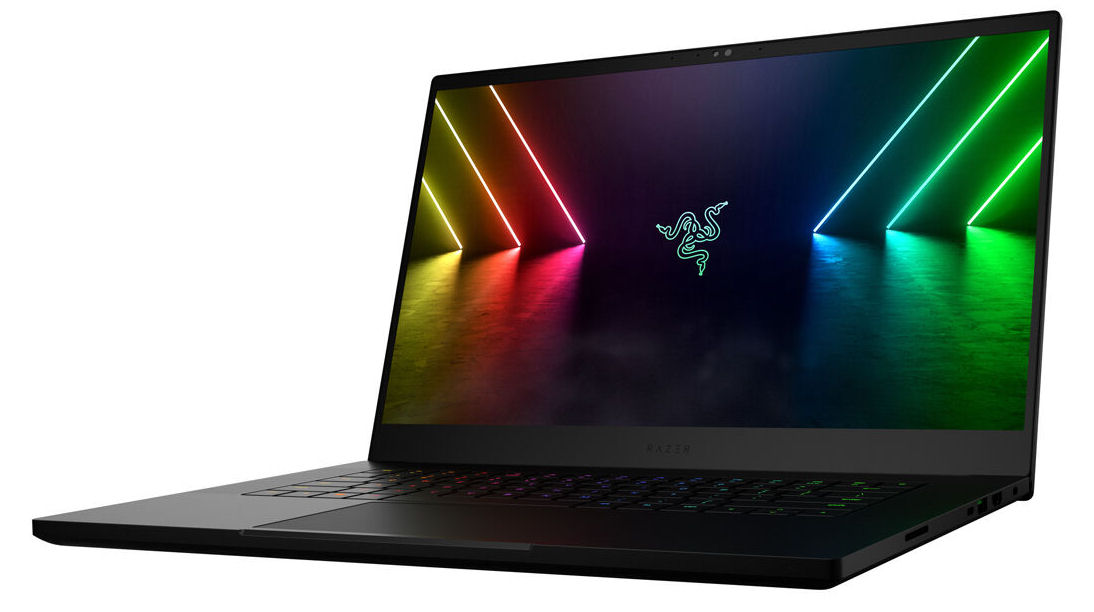
Razer Blade 15 OLED (början av 2022) recension: En kompakt bärbar dator för spel med RTX 3070 Ti

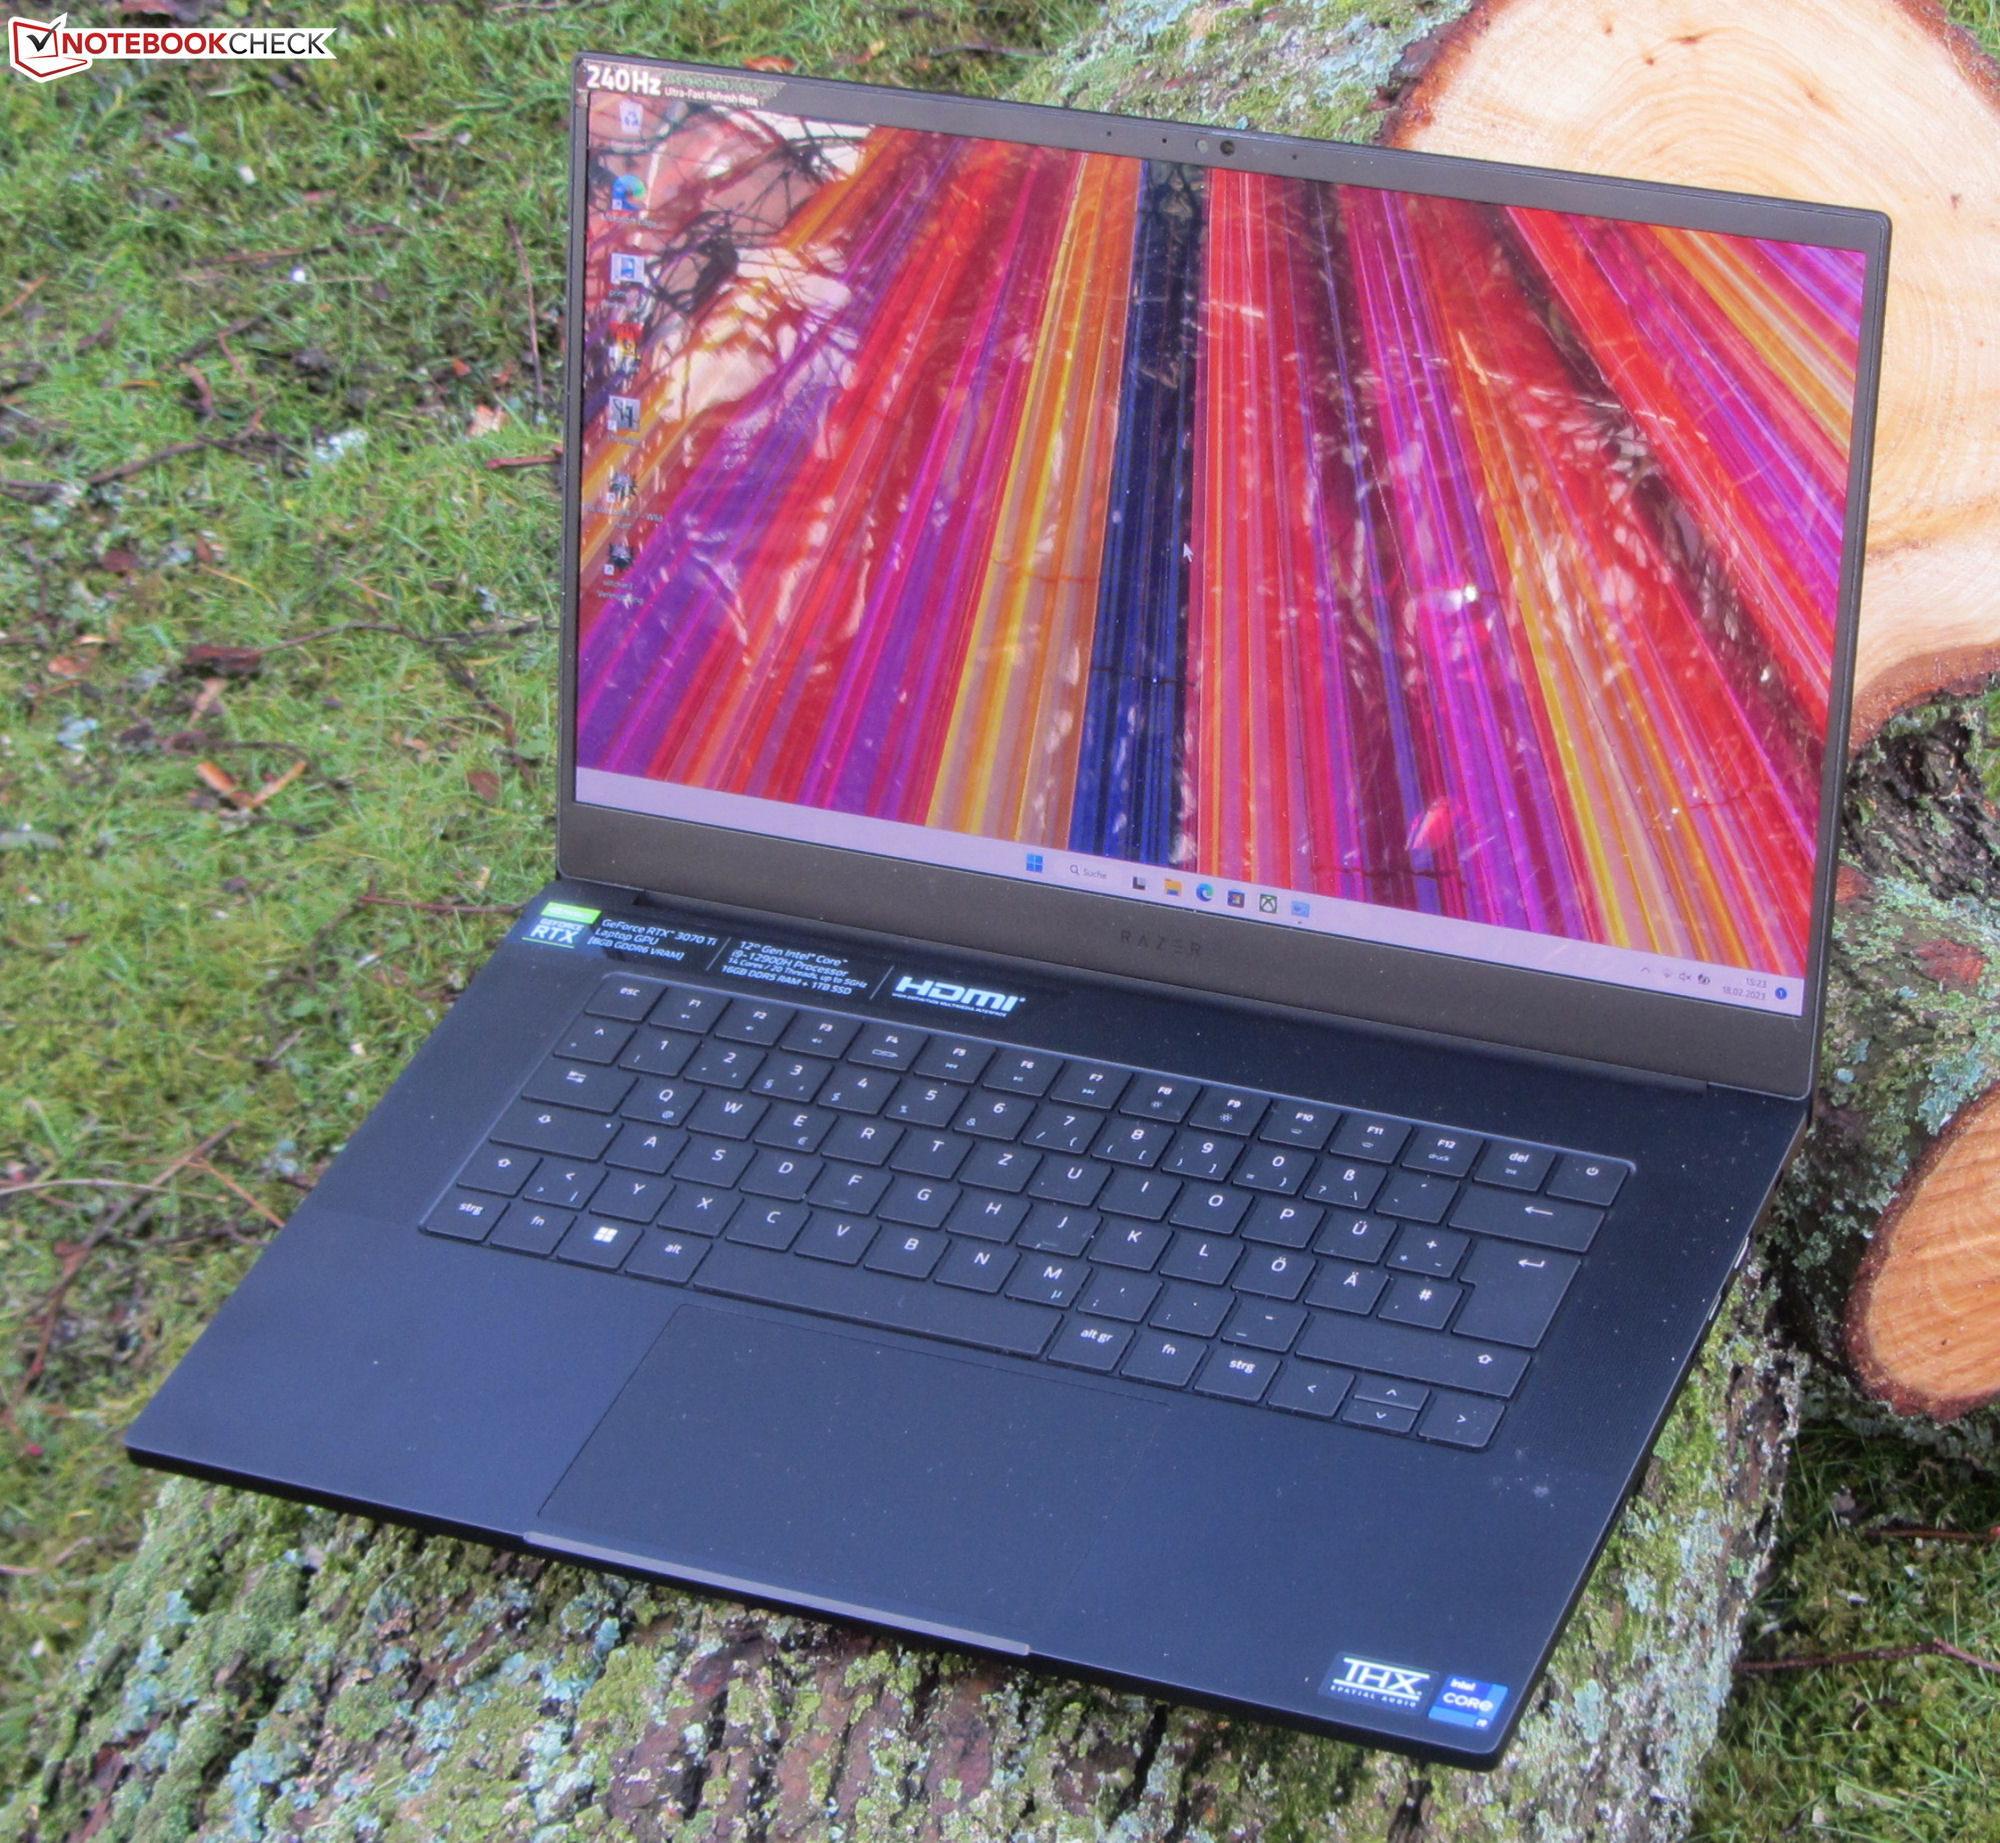
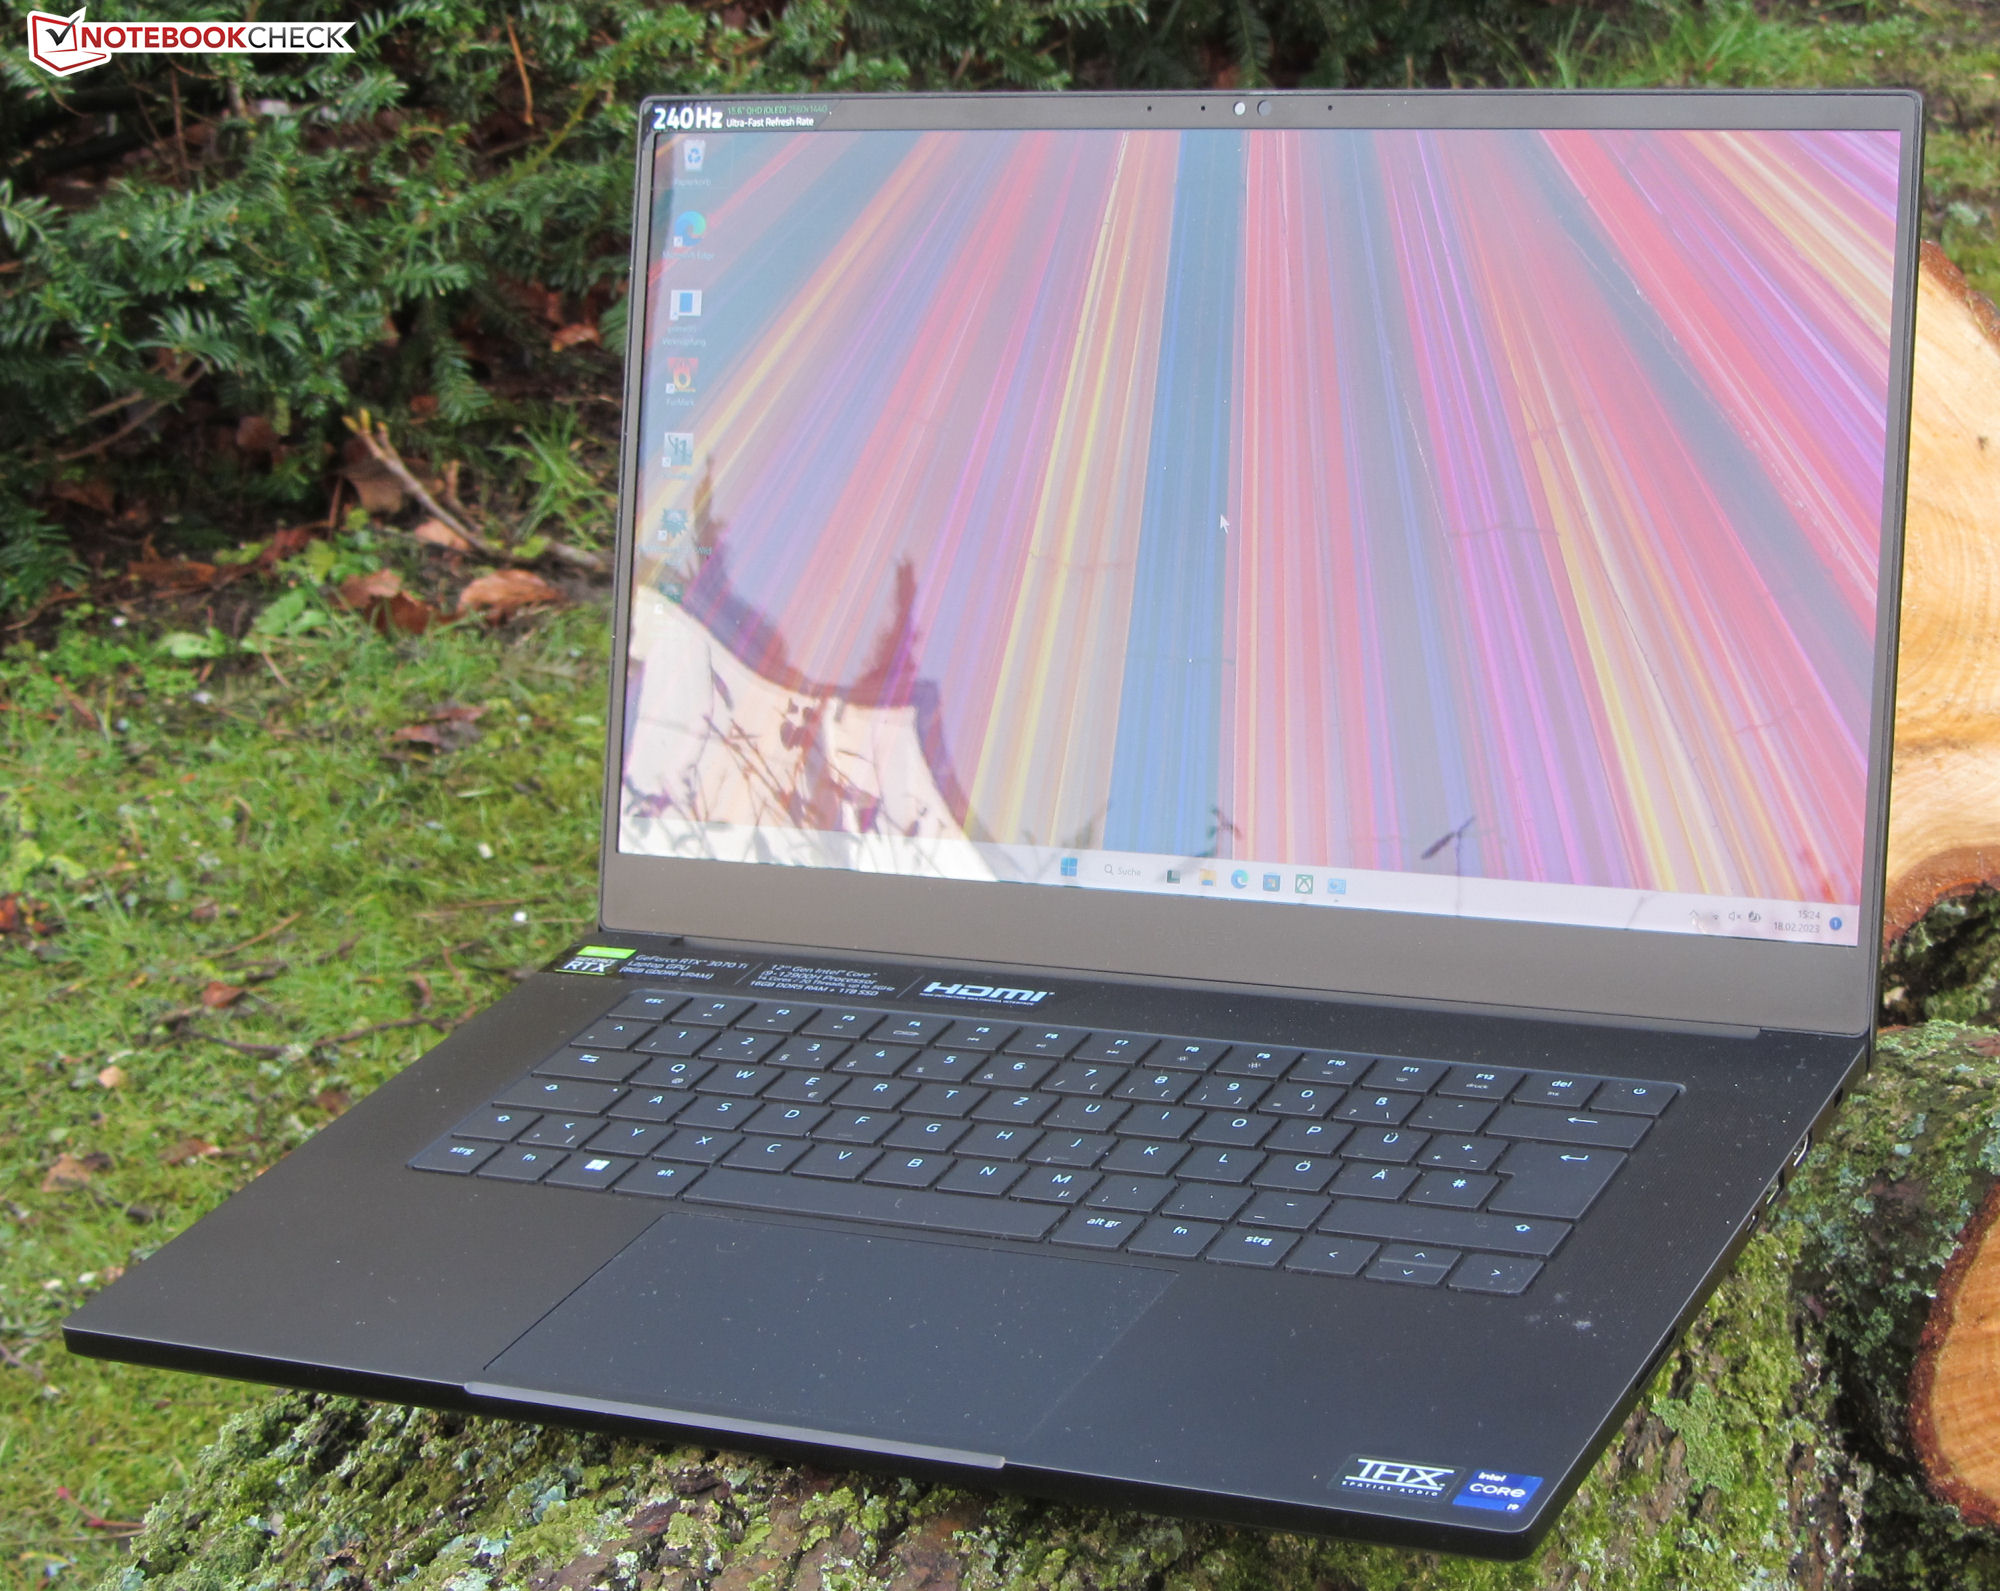
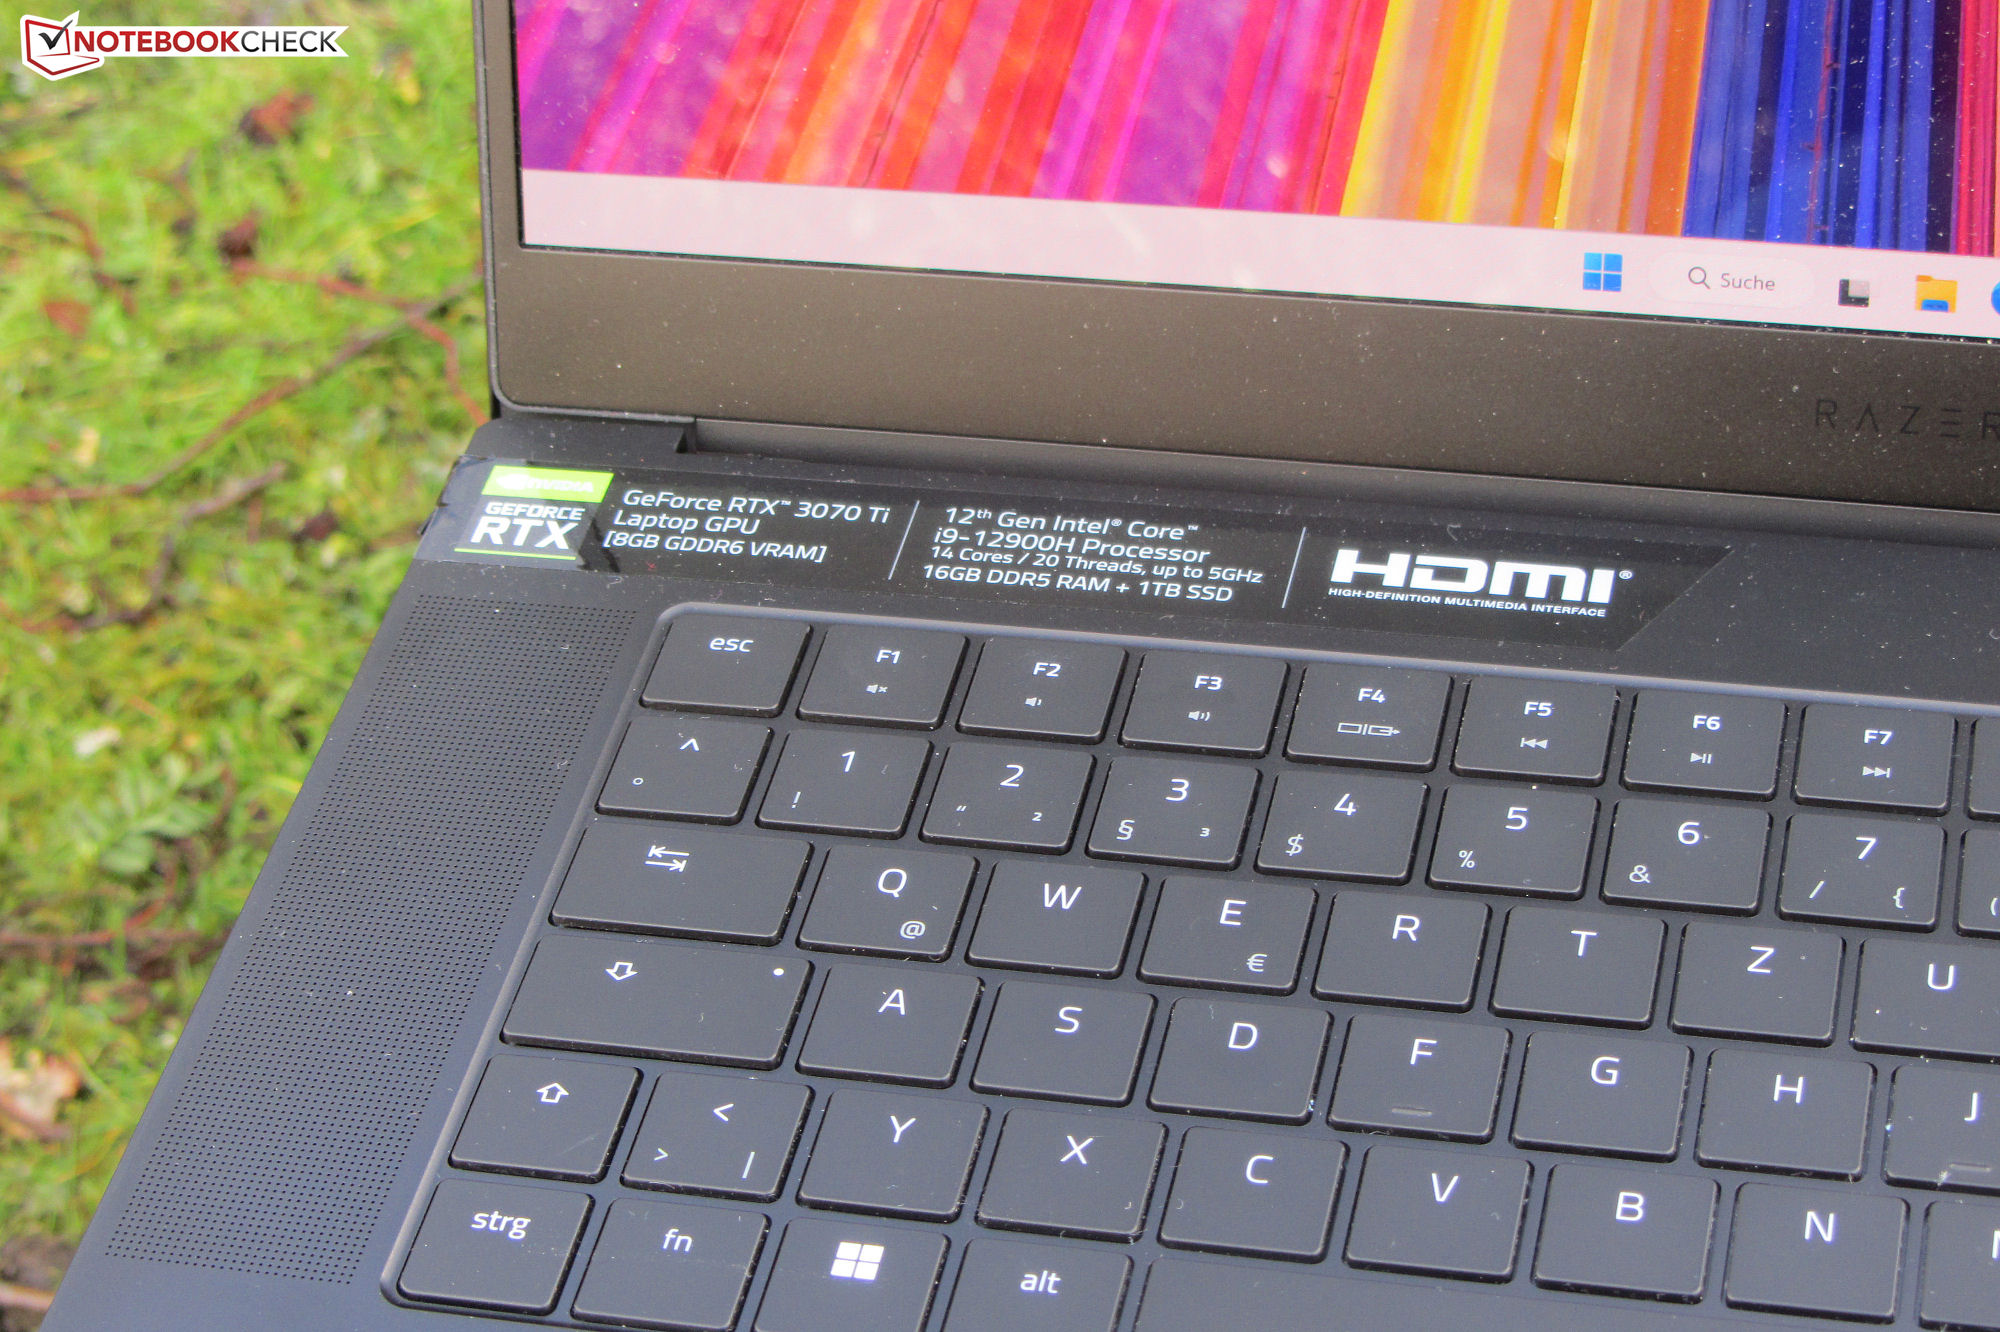
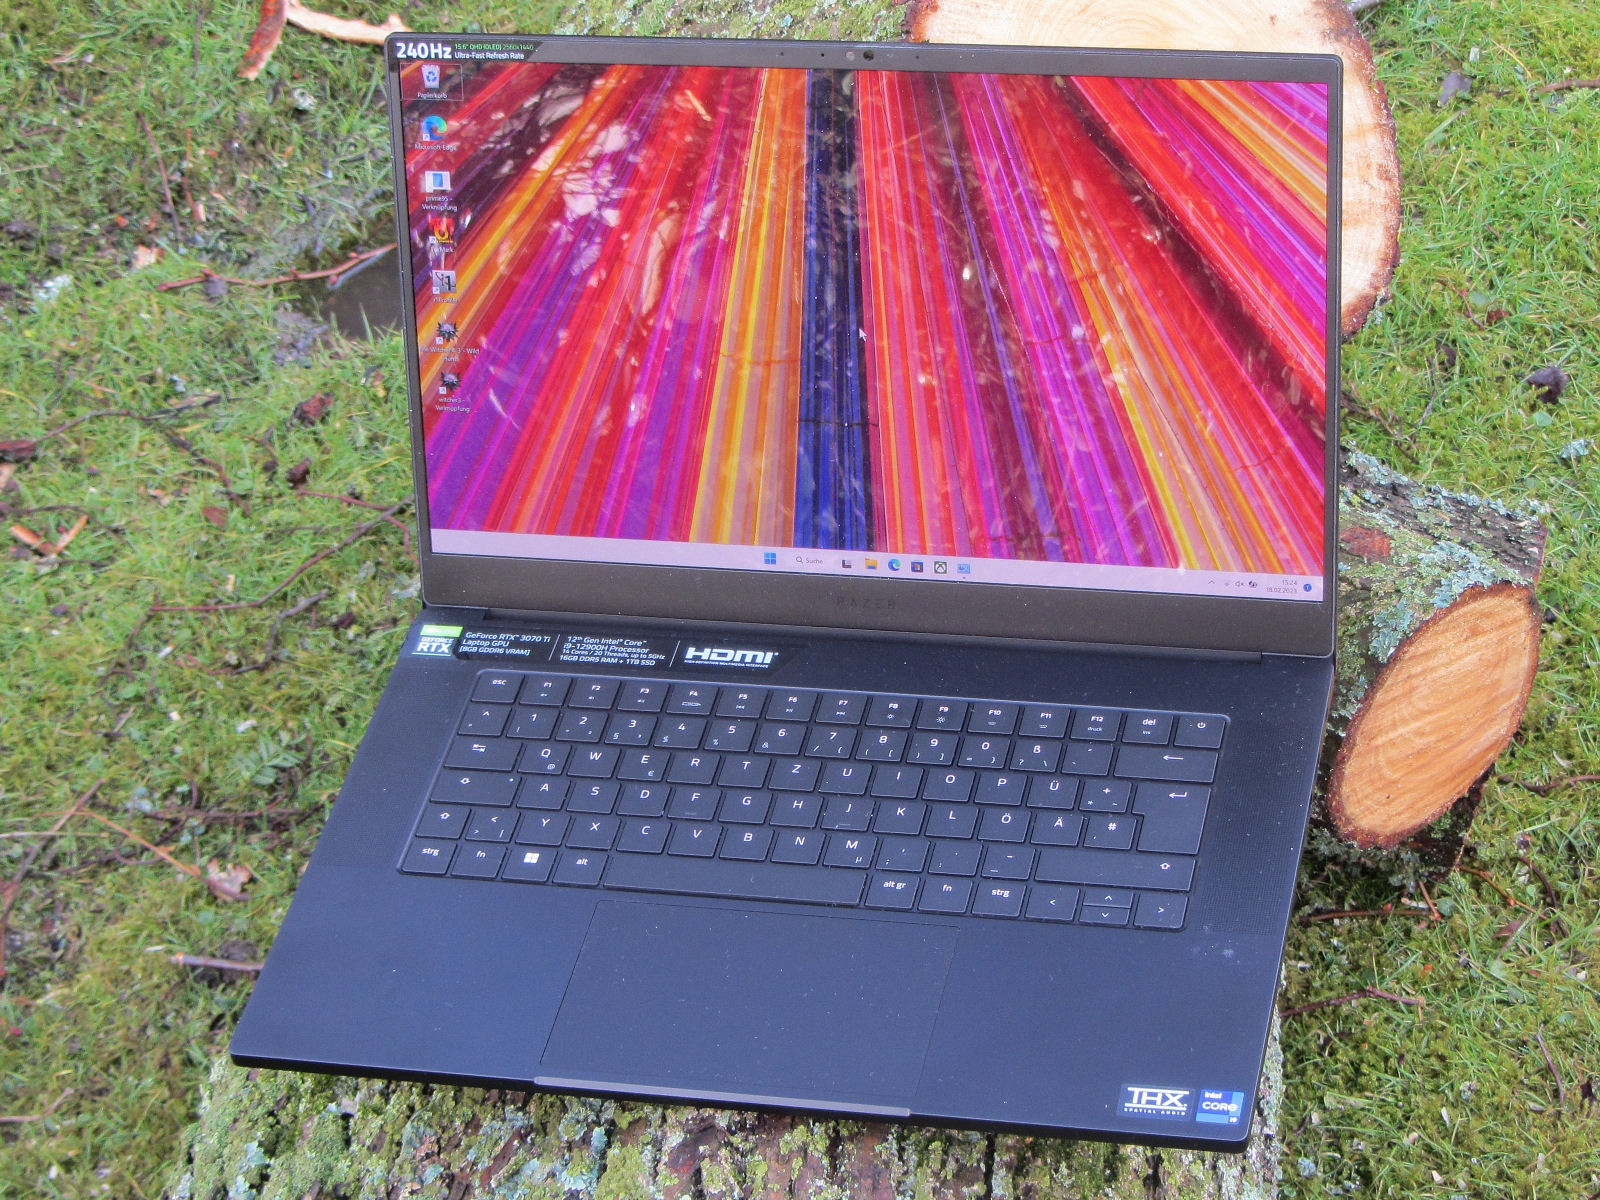
Razer Blade 15 (tidig 2022) har ambitioner att vara en bärbar dator för både spelare och kreativa användare. Lämplig hårdvara finns ombord: Core i9-12900HcPU, GeForce RTX 3070 TigPU för bärbar dator och en färgskön OLED-skärm (QHD). Liknande kompakta konkurrenter kan hittas i form av Schenker XMG Fusion 15 (Mid 22), denAorus 15 XE5, denHP Omen 16ochAsus ROG Zephyrus M16 GU603Z.
Information om fallet, funktioner, inmatningsenheter och högtalare finns redan till hands i vår recension av dess syskon, (12800H, RTX 3080 Ti). Den sistnämnda är utrustad med en LED-panel (QHD) - den mest relevanta skillnaden mot den nuvarande enheten.
Potentiella konkurrenter i jämförelse
Gradering | Datum | Modell | Vikt | Höjd | Storlek | Upplösning | Pris |
|---|---|---|---|---|---|---|---|
| 89.9 % v7 (old) | 03/2023 | Razer Blade 15 OLED (Early 2022) i9-12900H, GeForce RTX 3070 Ti Laptop GPU | 2 kg | 16.99 mm | 15.60" | 2560x1440 | |
| 87.8 % v7 (old) | 02/2023 | Asus ROG Zephyrus M16 GU603Z i9-12900H, GeForce RTX 3070 Ti Laptop GPU | 2.1 kg | 19.9 mm | 16.00" | 2560x1600 | |
| 85.5 % v7 (old) | 12/2022 | Aorus 15 XE5 i7-12700H, GeForce RTX 3070 Ti Laptop GPU | 2.3 kg | 24 mm | 15.60" | 2560x1440 | |
| 87.4 % v7 (old) | 08/2022 | Schenker XMG Fusion 15 (Mid 22) i7-11800H, GeForce RTX 3070 Laptop GPU | 1.9 kg | 21.65 mm | 15.60" | 2560x1440 | |
| 85.5 % v7 (old) | 05/2022 | HP Omen 16-b1090ng i7-12700H, GeForce RTX 3070 Ti Laptop GPU | 2.3 kg | 23 mm | 16.10" | 2560x1440 |
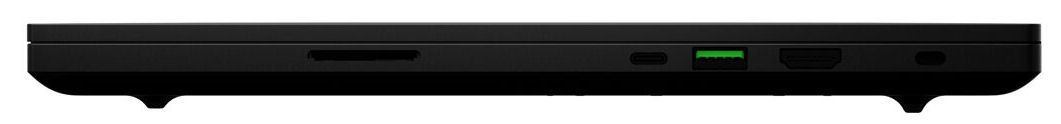
| SD Card Reader | |
| average JPG Copy Test (av. of 3 runs) | |
| Razer Blade 15 2022 (Toshiba Exceria Pro SDXC 64 GB UHS-II) | |
| Asus ROG Zephyrus M16 GU603Z | |
| Genomsnitt av klass Gaming (20.9 - 210, n=54, senaste 2 åren) | |
| Razer Blade 15 OLED (Early 2022) (AV Pro SD microSD 128 GB V60) | |
| Schenker XMG Fusion 15 (Mid 22) (AV PRO microSD 128 GB V60) | |
| HP Omen 16-b1090ng (AV PRO microSD 128 GB V60) | |
| maximum AS SSD Seq Read Test (1GB) | |
| Asus ROG Zephyrus M16 GU603Z | |
| Razer Blade 15 2022 (Toshiba Exceria Pro SDXC 64 GB UHS-II) | |
| Genomsnitt av klass Gaming (25.5 - 261, n=51, senaste 2 åren) | |
| Razer Blade 15 OLED (Early 2022) (AV Pro SD microSD 128 GB V60) | |

 GeForce RTX 3070 Ti Laptop GPU, i9-12900H, Samsung PM9A1 MZVL21T0HCLR")
 GeForce RTX 3070 Ti Laptop GPU, i9-12900H, Samsung PM9A1 MZVL21T0HCLR")
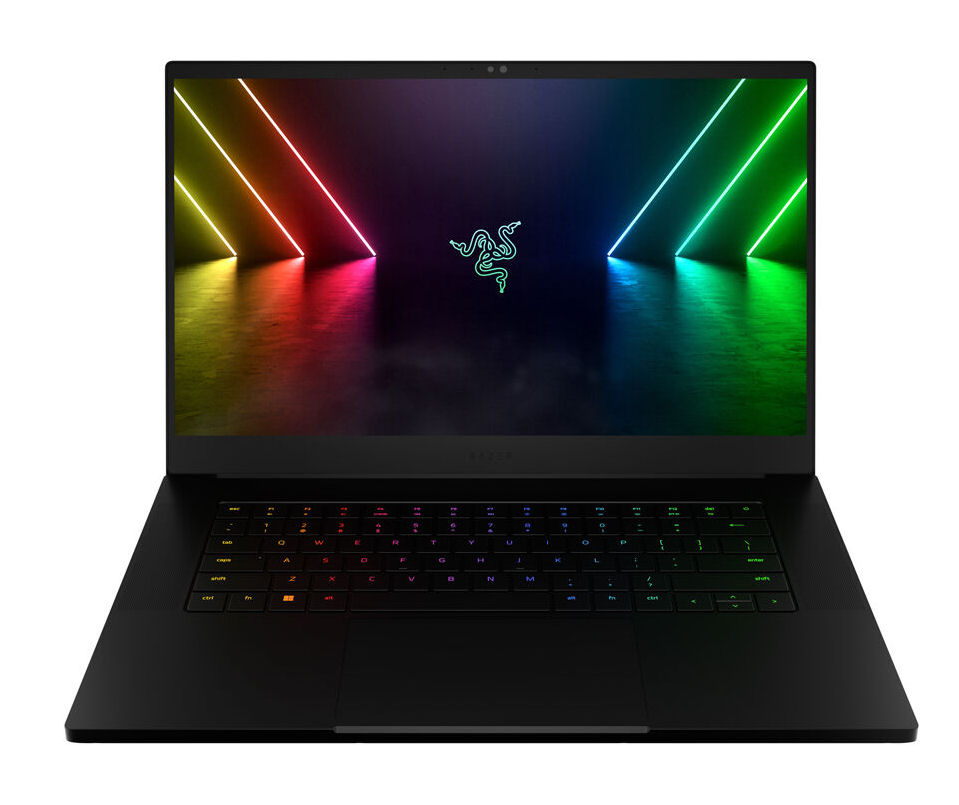
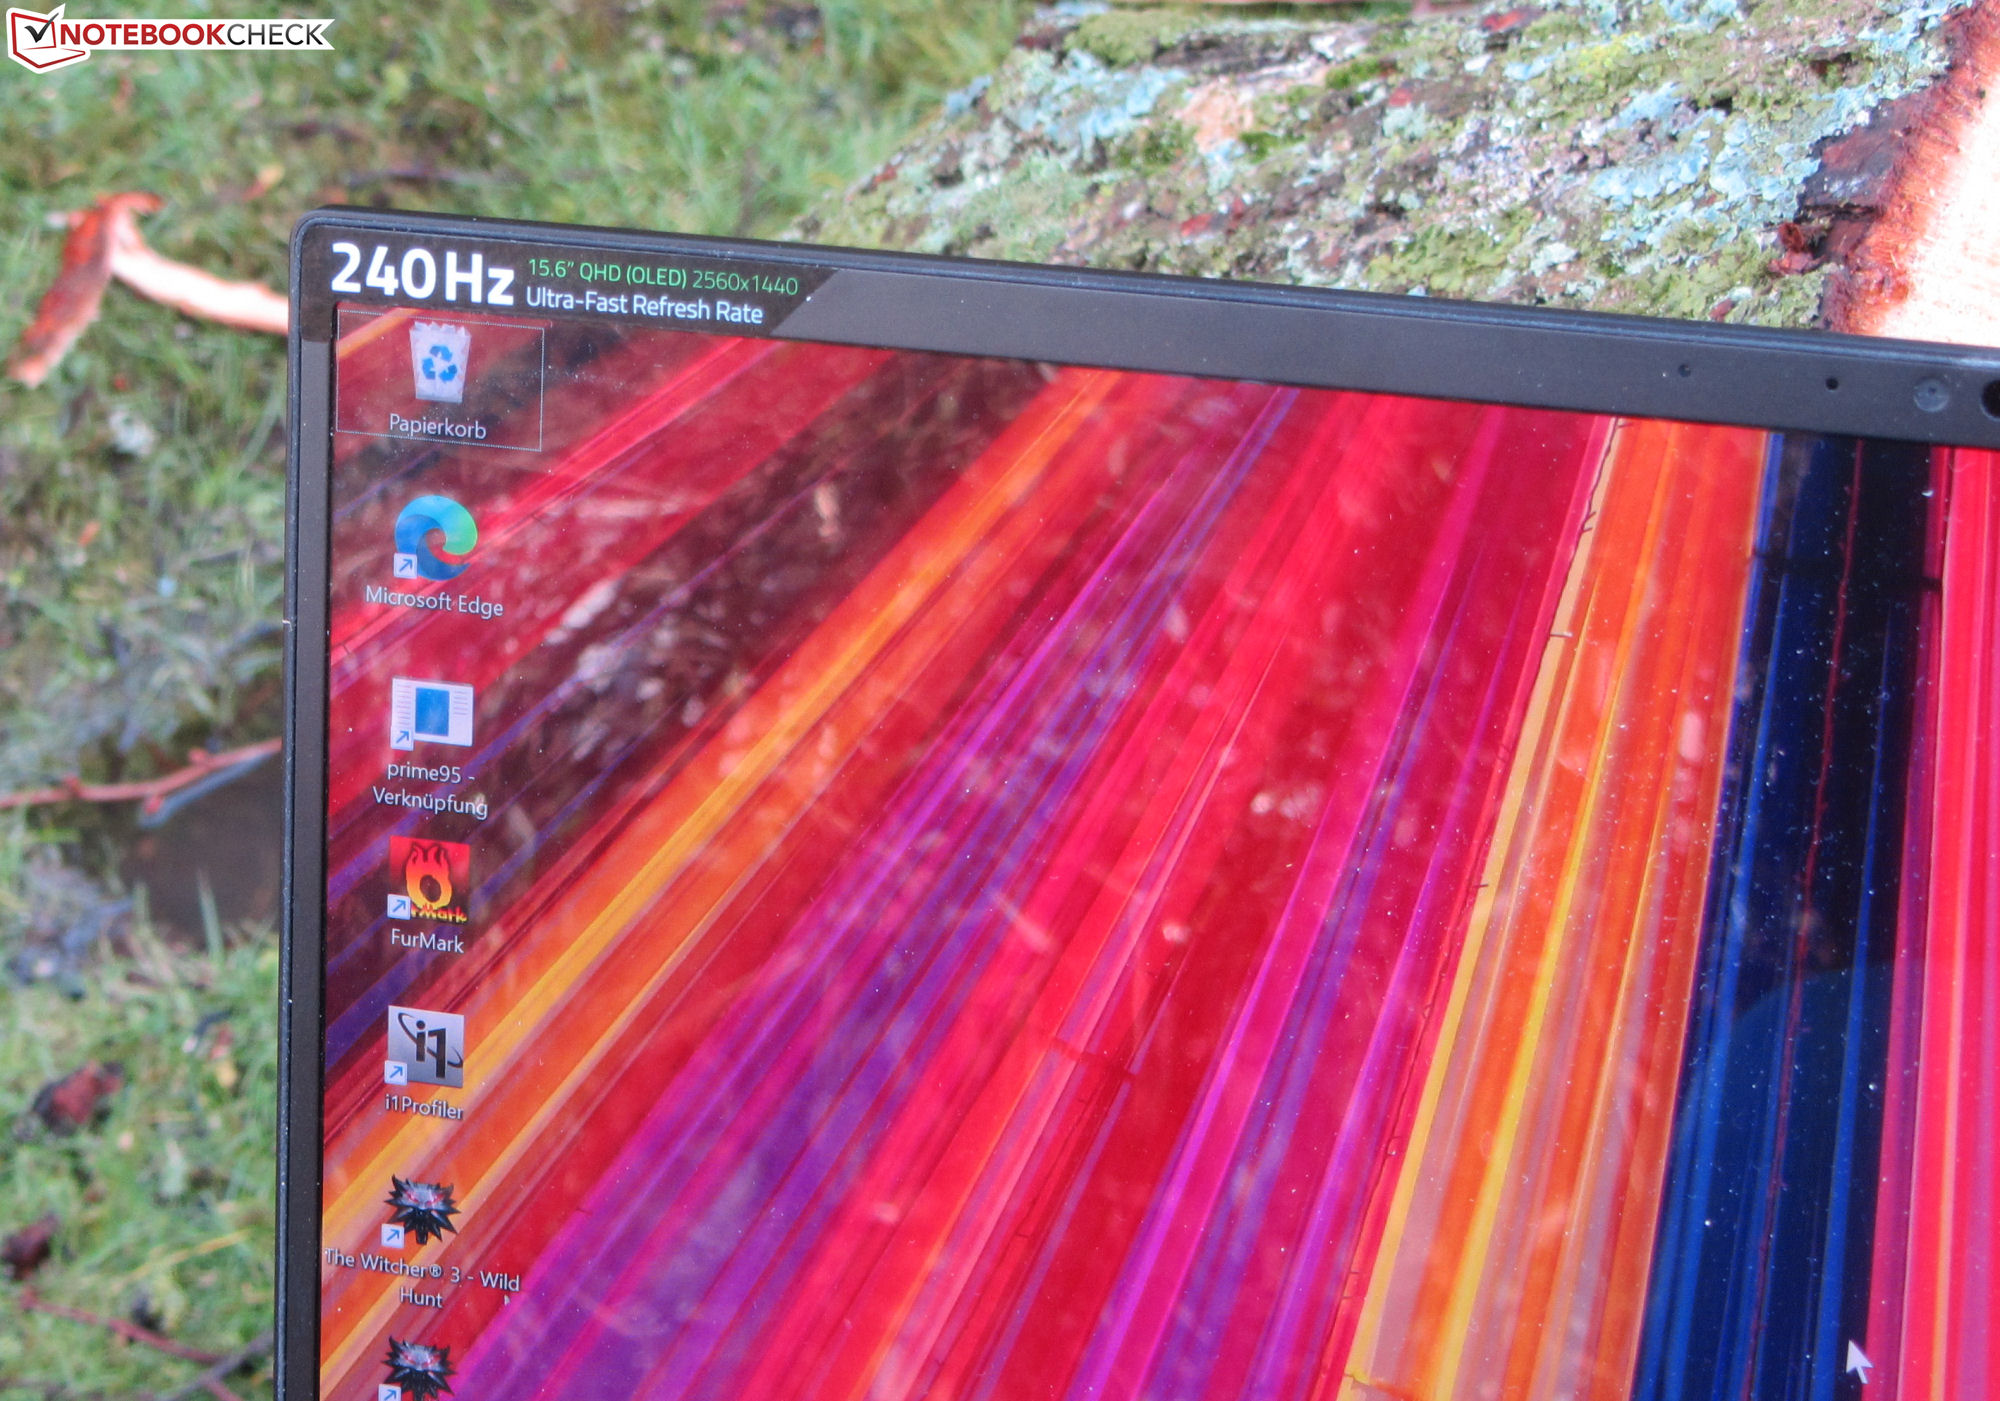
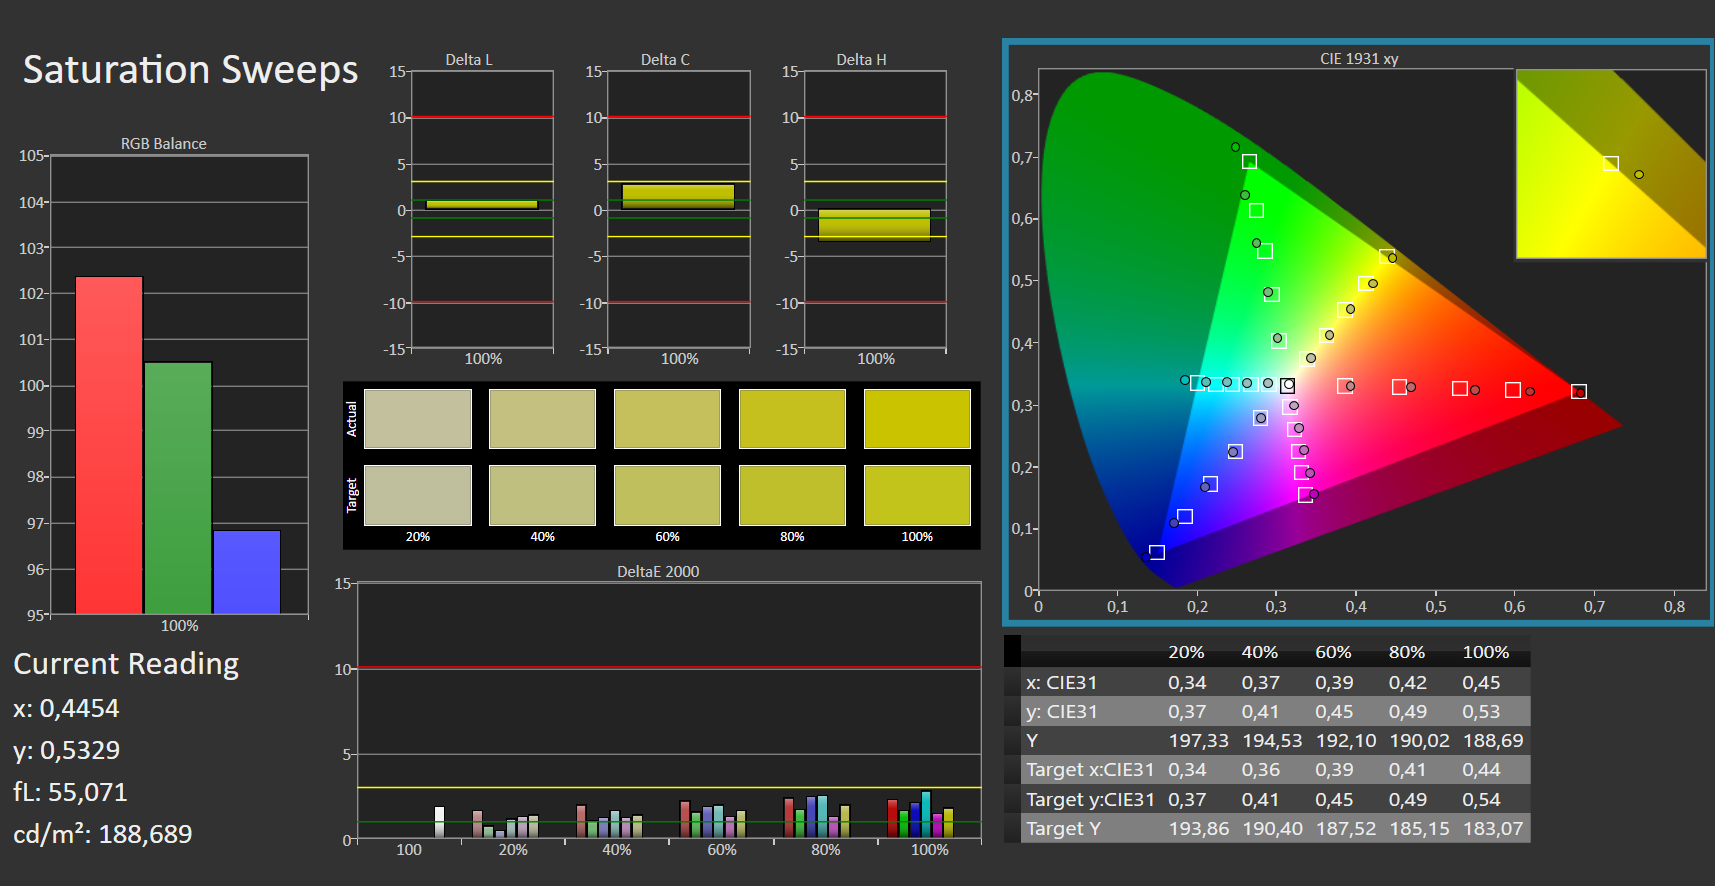
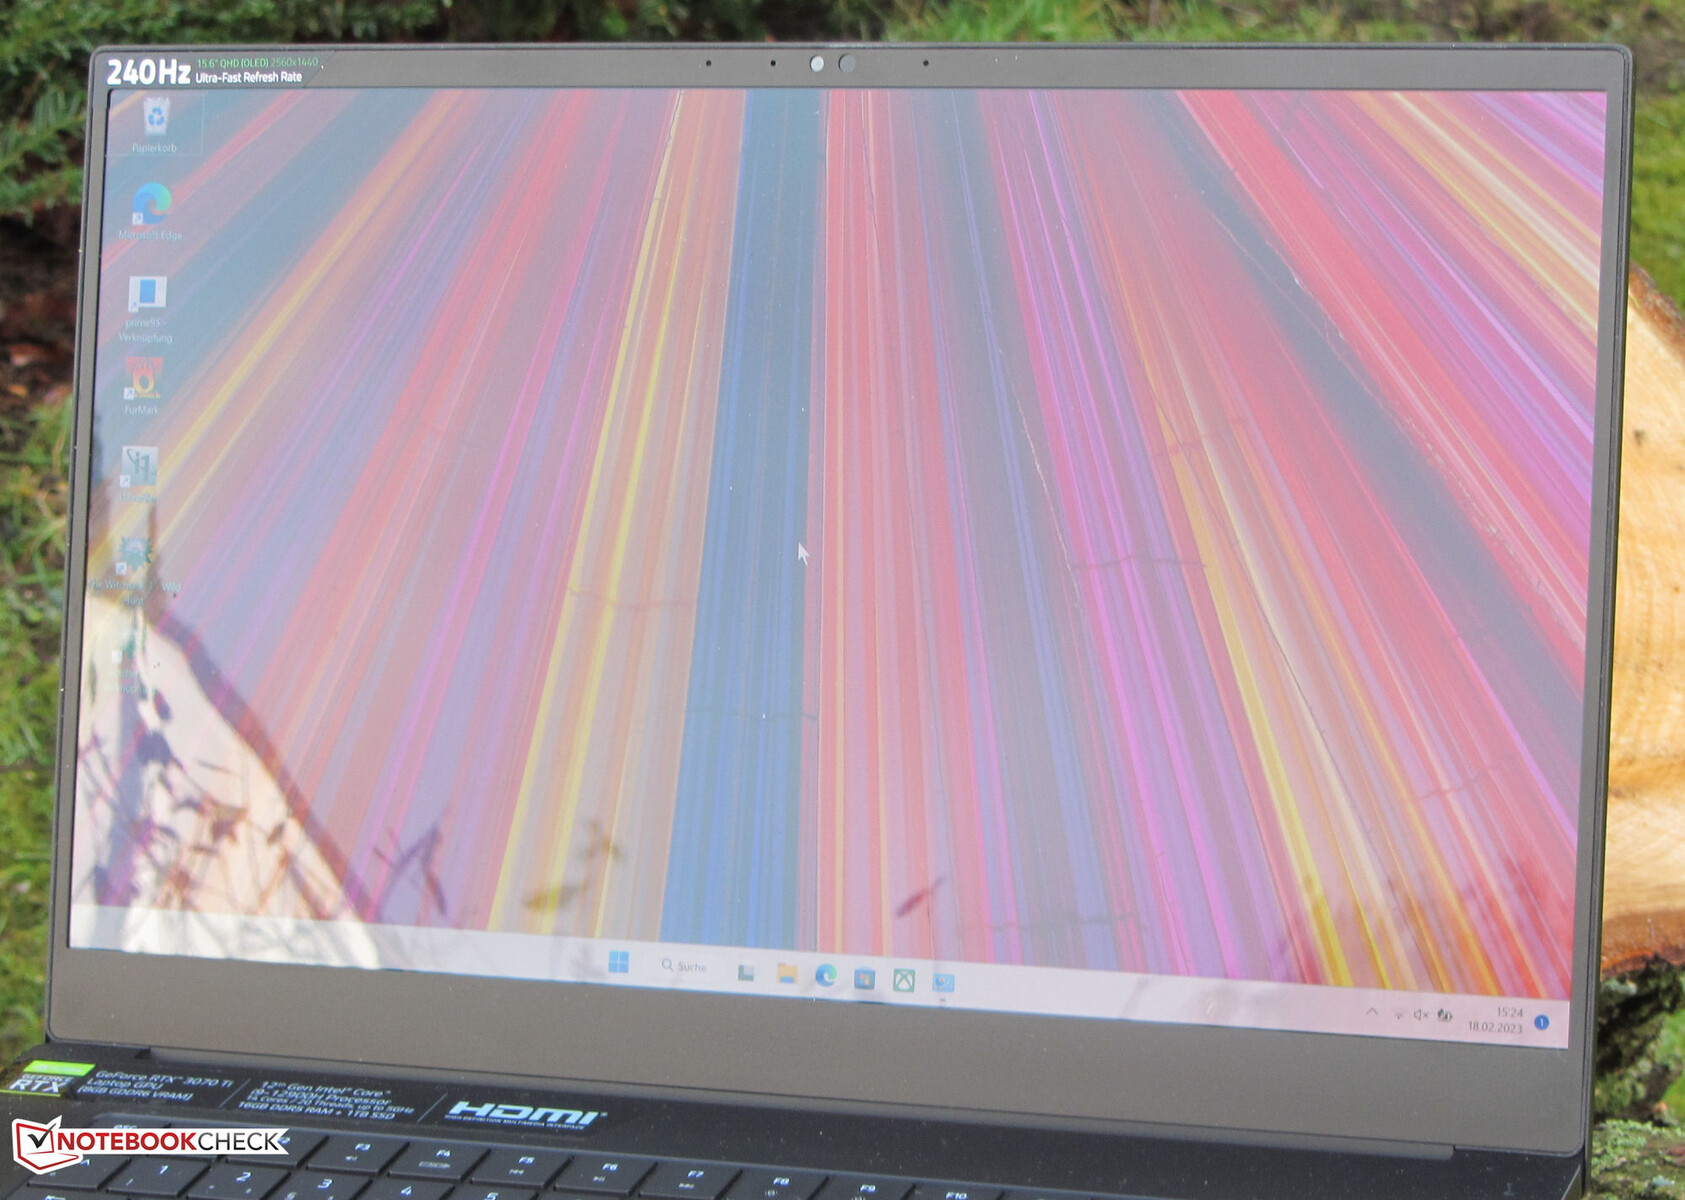
Skärm - Den mobila Razer-datorn har en OLED-panel

OLED-displayen erbjuder samma nyckeldata som sin syster med LED-display: En upplösning på 2560 x 1440 pixlar (QHD) med en uppdateringsfrekvens på 240 Hz och en diameter på 15,6 tum.
Typiskt för OLED-skärmar får panelen poäng för underbara svartnivåer och snabba svarstider. Dessutom åtföljs detta av relativt hög maximal ljusstyrka. Detta är något som dess LED-motsvarighet inte kan hålla en flamma för.
OLED-panelens svagheter: Den har en glansig yta och flimrar vid en ljusstyrka på ≤ 70 procent med en frekvens på 500 Hz. Det tekniskt inducerade flimret är kopplat till panelens reglering av ljusstyrkan. I detta avseende, dess syskons matt, flimmerfri LED-panel har sin näsa framme.
| |||||||||||||||||||||||||
Distribution av ljusstyrkan: 99 %
Mitt på batteriet: 381 cd/m²
Kontrast: 12767:1 (Svärta: 0.03 cd/m²)
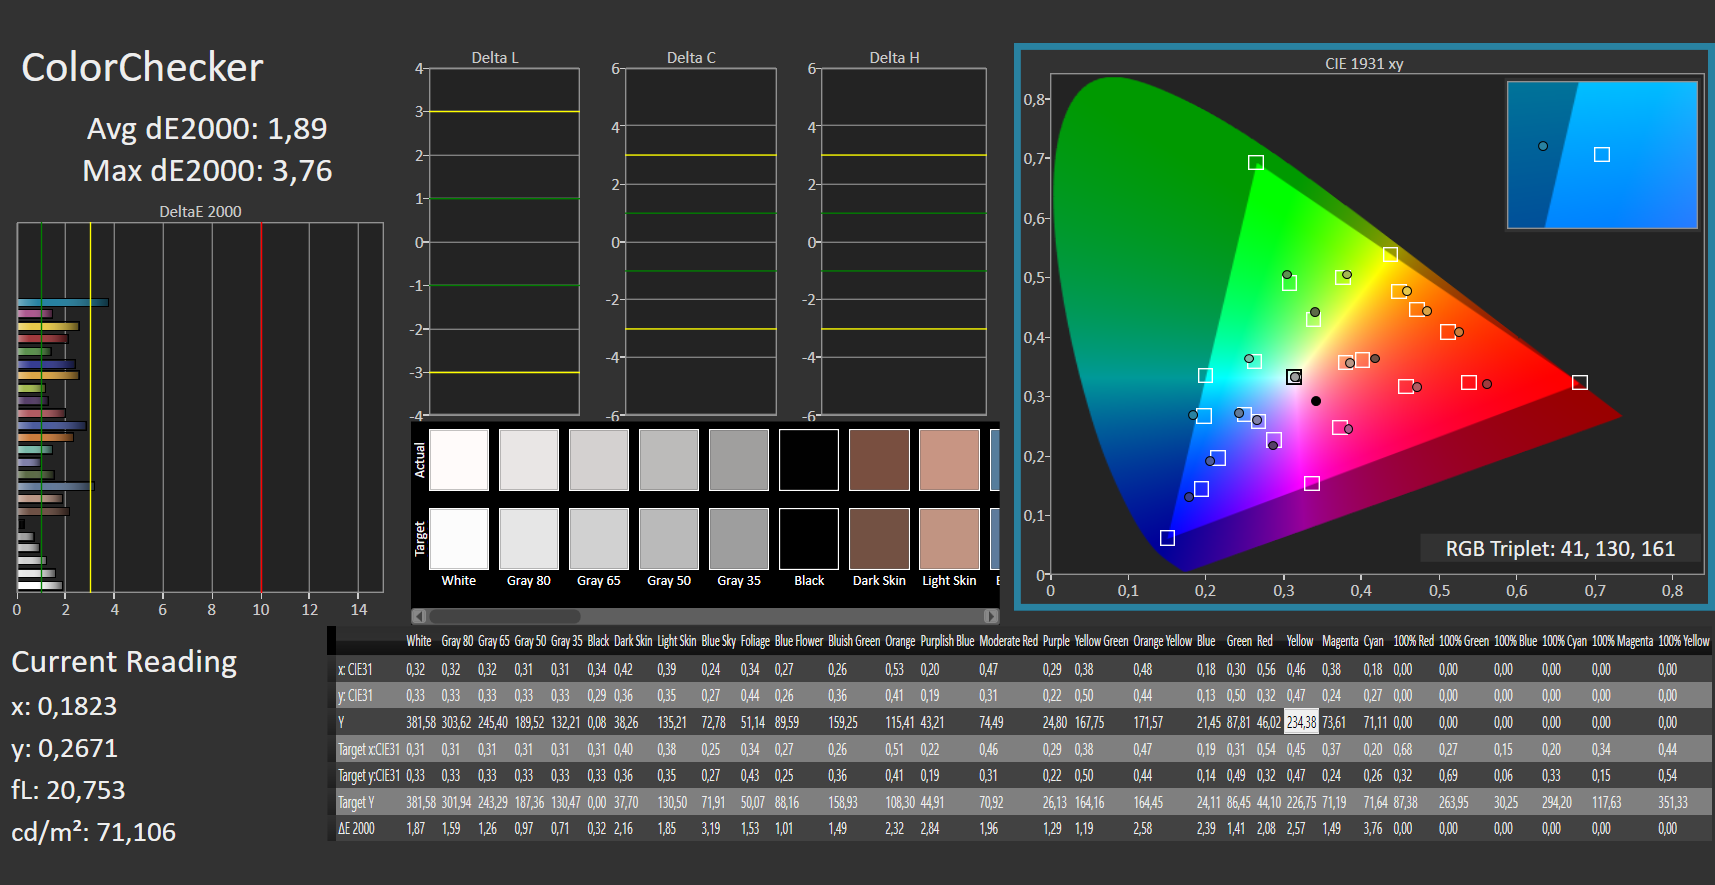
ΔE ColorChecker Calman: 1.89 | ∀{0.5-29.43 Ø4.72}
calibrated: 2.67
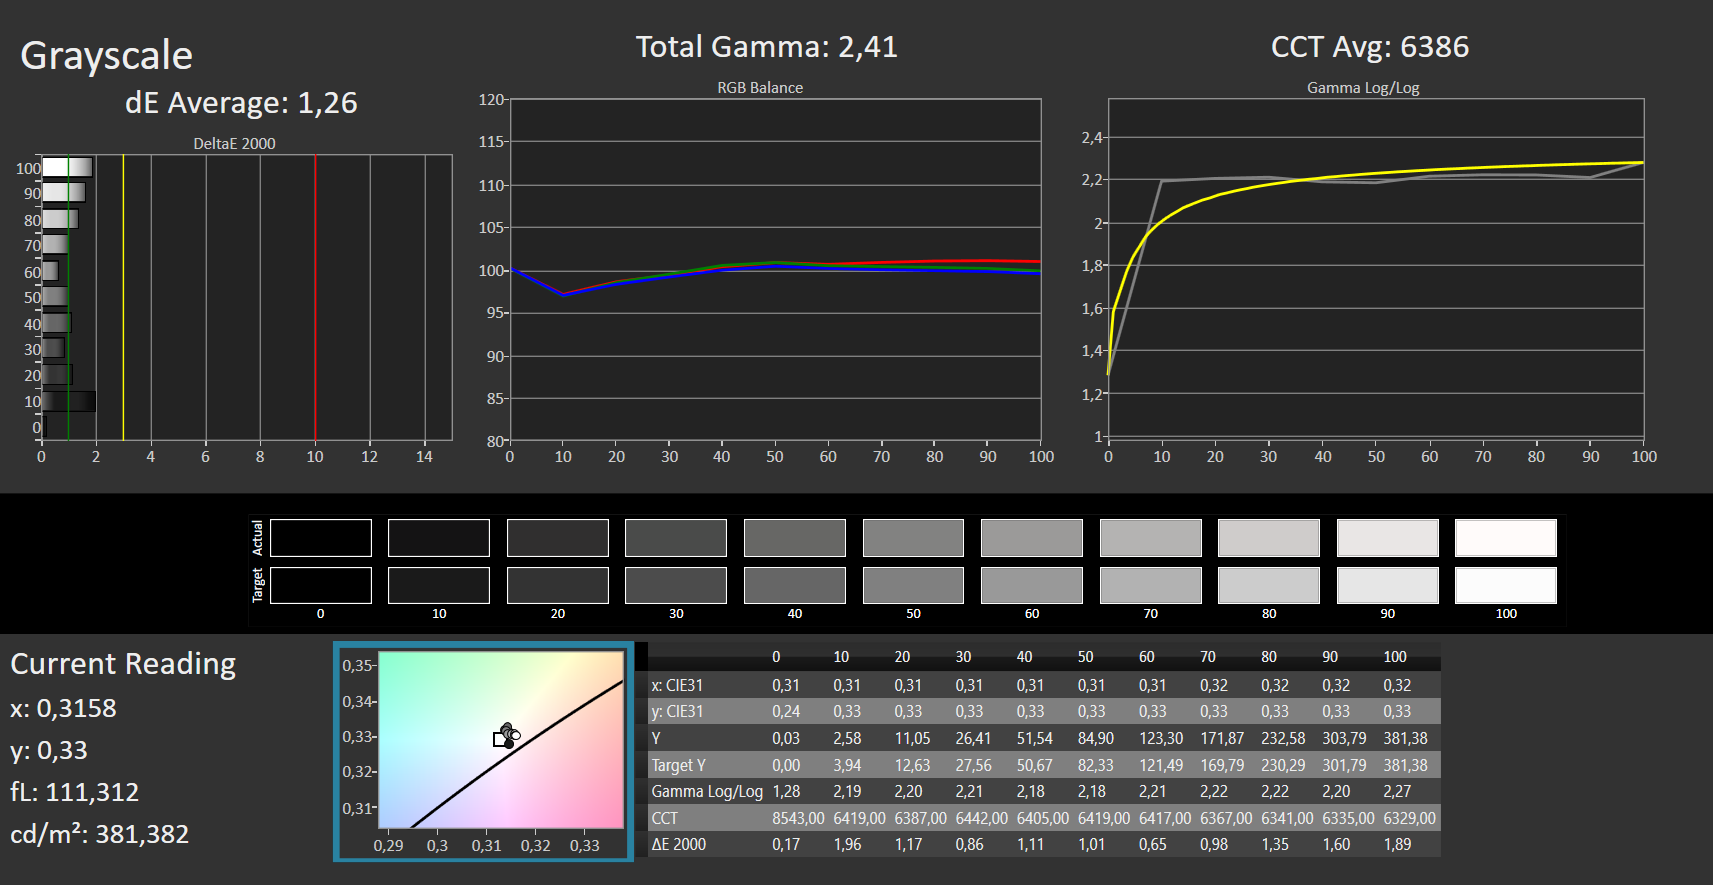
ΔE Greyscale Calman: 1.26 | ∀{0.09-98 Ø4.97}
94% AdobeRGB 1998 (Argyll 3D)
99.4% sRGB (Argyll 3D)
97.6% Display P3 (Argyll 3D)
Gamma: 2.41
CCT: 6386 K
| Razer Blade 15 OLED (Early 2022) Samsung ATNA562P02-0, OLED, 2560x1440, 15.6" | Asus ROG Zephyrus M16 GU603Z BOE0A0B (BOE CQ NE160QDM-NY3), IPS, 2560x1600, 16" | Aorus 15 XE5 Chi Mei N156KME-GNA, IPS, 2560x1440, 15.6" | Schenker XMG Fusion 15 (Mid 22) BOE CQ NE156QHM-NY2, IPS, 2560x1440, 15.6" | HP Omen 16-b1090ng BOE09E5, IPS, 2560x1440, 16.1" | Razer Blade 15 2022 Sharp LQ156T1JW03, IPS, 2560x1440, 15.6" | |
|---|---|---|---|---|---|---|
| Display | -6% | -4% | -20% | -17% | -2% | |
| Display P3 Coverage (%) | 97.6 | 92.8 -5% | 95.2 -2% | 67.3 -31% | 71 -27% | 99.1 2% |
| sRGB Coverage (%) | 99.4 | 98.5 -1% | 99.9 1% | 96.7 -3% | 97.9 -2% | 99.9 1% |
| AdobeRGB 1998 Coverage (%) | 94 | 83.1 -12% | 84.5 -10% | 68.2 -27% | 73.3 -22% | 86.8 -8% |
| Response Times | -340% | -475% | -365% | -498% | -550% | |
| Response Time Grey 50% / Grey 80% * (ms) | 2 ? | 7.6 ? -280% | 14.4 ? -620% | 11.6 ? -480% | 14.5 ? -625% | 14.4 ? -620% |
| Response Time Black / White * (ms) | 2 ? | 10 ? -400% | 8.6 ? -330% | 7 ? -250% | 9.4 ? -370% | 11.6 ? -480% |
| PWM Frequency (Hz) | 500 ? | |||||
| Screen | -96% | -169% | -178% | -184% | -106% | |
| Brightness middle (cd/m²) | 383 | 497 30% | 336 -12% | 326 -15% | 335 -13% | 286 -25% |
| Brightness (cd/m²) | 384 | 481 25% | 316 -18% | 303 -21% | 319 -17% | 271 -29% |
| Brightness Distribution (%) | 99 | 82 -17% | 89 -10% | 89 -10% | 90 -9% | 89 -10% |
| Black Level * (cd/m²) | 0.03 | 0.21 -600% | 0.34 -1033% | 0.33 -1000% | 0.28 -833% | 0.25 -733% |
| Contrast (:1) | 12767 | 2367 -81% | 988 -92% | 988 -92% | 1196 -91% | 1144 -91% |
| Colorchecker dE 2000 * | 1.89 | 3.53 -87% | 3.36 -78% | 2.73 -44% | 4.38 -132% | 2.74 -45% |
| Colorchecker dE 2000 max. * | 3.76 | 6.15 -64% | 6.67 -77% | 9.54 -154% | 9.48 -152% | 5.21 -39% |
| Colorchecker dE 2000 calibrated * | 2.67 | 3.53 -32% | 0.74 72% | 1.36 49% | 1.33 50% | 2.52 6% |
| Greyscale dE 2000 * | 1.26 | 1.74 -38% | 4.7 -273% | 5.2 -313% | 7 -456% | 1.1 13% |
| Gamma | 2.41 91% | 2.2 100% | 2.244 98% | 2.074 106% | 2.103 105% | 2.2 100% |
| CCT | 6386 102% | 6418 101% | 6897 94% | 6911 94% | 6244 104% | 6408 101% |
| Totalt genomsnitt (program/inställningar) | -147% /
-112% | -216% /
-177% | -188% /
-171% | -233% /
-193% | -219% /
-147% |
* ... mindre är bättre
Skärmen ger redan från början en imponerande färgåtergivning: Med en avvikelse på 1,9 är målet (DeltaE < 3) klart uppfyllt. Kalibrering leder inte till några förbättringar. Färgnoggrannheten är given: Färgrymderna sRGB och DCI-P3 återges helt och nästan helt med AdobeRGB-färgrymden på 94 procent. syskonets LED-panel levererar också liknande goda resultat.
Visa svarstider
| ↔ Svarstid svart till vitt | ||
|---|---|---|
| 2 ms ... stiga ↗ och falla ↘ kombinerat | ↗ 1 ms stiga |  |
| ↘ 1 ms hösten | ||
| Skärmen visar väldigt snabba svarsfrekvenser i våra tester och borde vara mycket väl lämpad för fartfyllt spel. I jämförelse sträcker sig alla testade enheter från 0.1 (minst) till 240 (maximalt) ms. » 11 % av alla enheter är bättre. Det betyder att den uppmätta svarstiden är bättre än genomsnittet av alla testade enheter (19.8 ms). | ||
| ↔ Svarstid 50 % grått till 80 % grått | ||
| 2 ms ... stiga ↗ och falla ↘ kombinerat | ↗ 1 ms stiga |  |
| ↘ 1 ms hösten | ||
| Skärmen visar väldigt snabba svarsfrekvenser i våra tester och borde vara mycket väl lämpad för fartfyllt spel. I jämförelse sträcker sig alla testade enheter från 0.165 (minst) till 636 (maximalt) ms. » 10 % av alla enheter är bättre. Det betyder att den uppmätta svarstiden är bättre än genomsnittet av alla testade enheter (31 ms). | ||
Skärmflimmer / PWM (Puls-Width Modulation)
| Skärmflimmer / PWM upptäckt | 500 Hz | ≤ 70 % ljusstyrka inställning |  |
Displayens bakgrundsbelysning flimrar vid 500 Hz (i värsta fall, t.ex. med PWM) Flimrande upptäckt vid en ljusstyrkeinställning på 70 % och lägre. Det ska inte finnas något flimmer eller PWM över denna ljusstyrkeinställning. Frekvensen för 500 Hz är relativt hög, så de flesta användare som är känsliga för PWM bör inte märka något flimmer. Det finns dock rapporter om att vissa användare fortfarande är känsliga för PWM vid 500 Hz och högre, så var uppmärksam. Som jämförelse: 52 % av alla testade enheter använder inte PWM för att dämpa skärmen. Om PWM upptäcktes mättes ett medelvärde av 7763 (minst: 5 - maximum: 343500) Hz. | |||
Panelen har en stor stabilitet i betraktningsvinkeln och är läsbar från alla vinklar. Utomhus är detta dock svårt på grund av skärmens blanka, reflekterande yta.

Prestanda - Blade 15 är baserad på Alder Lake och Ampere
Med Blade 15 (början av 2022) har Razer en bärbar dator i sitt produktsortiment som är utformad för QHD-spel (höga till maximala inställningar), men den är också mycket bra på områden som videoredigering och rendering. Modellen som recenseras här kan fås för cirka 1 967 dollar.
Provningsvillkor
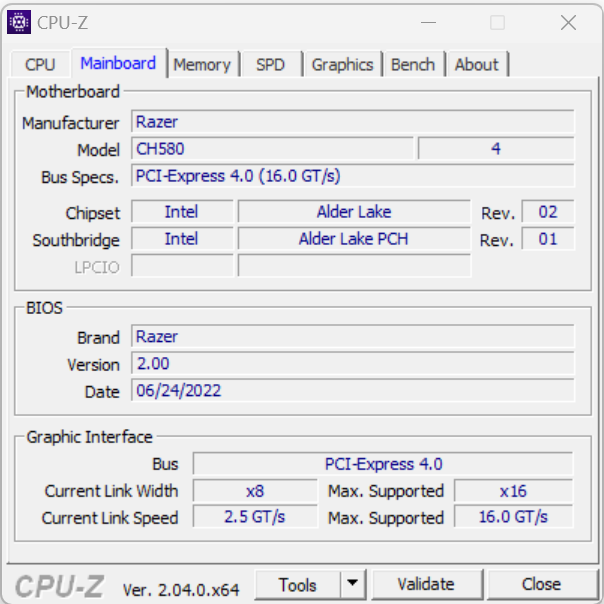
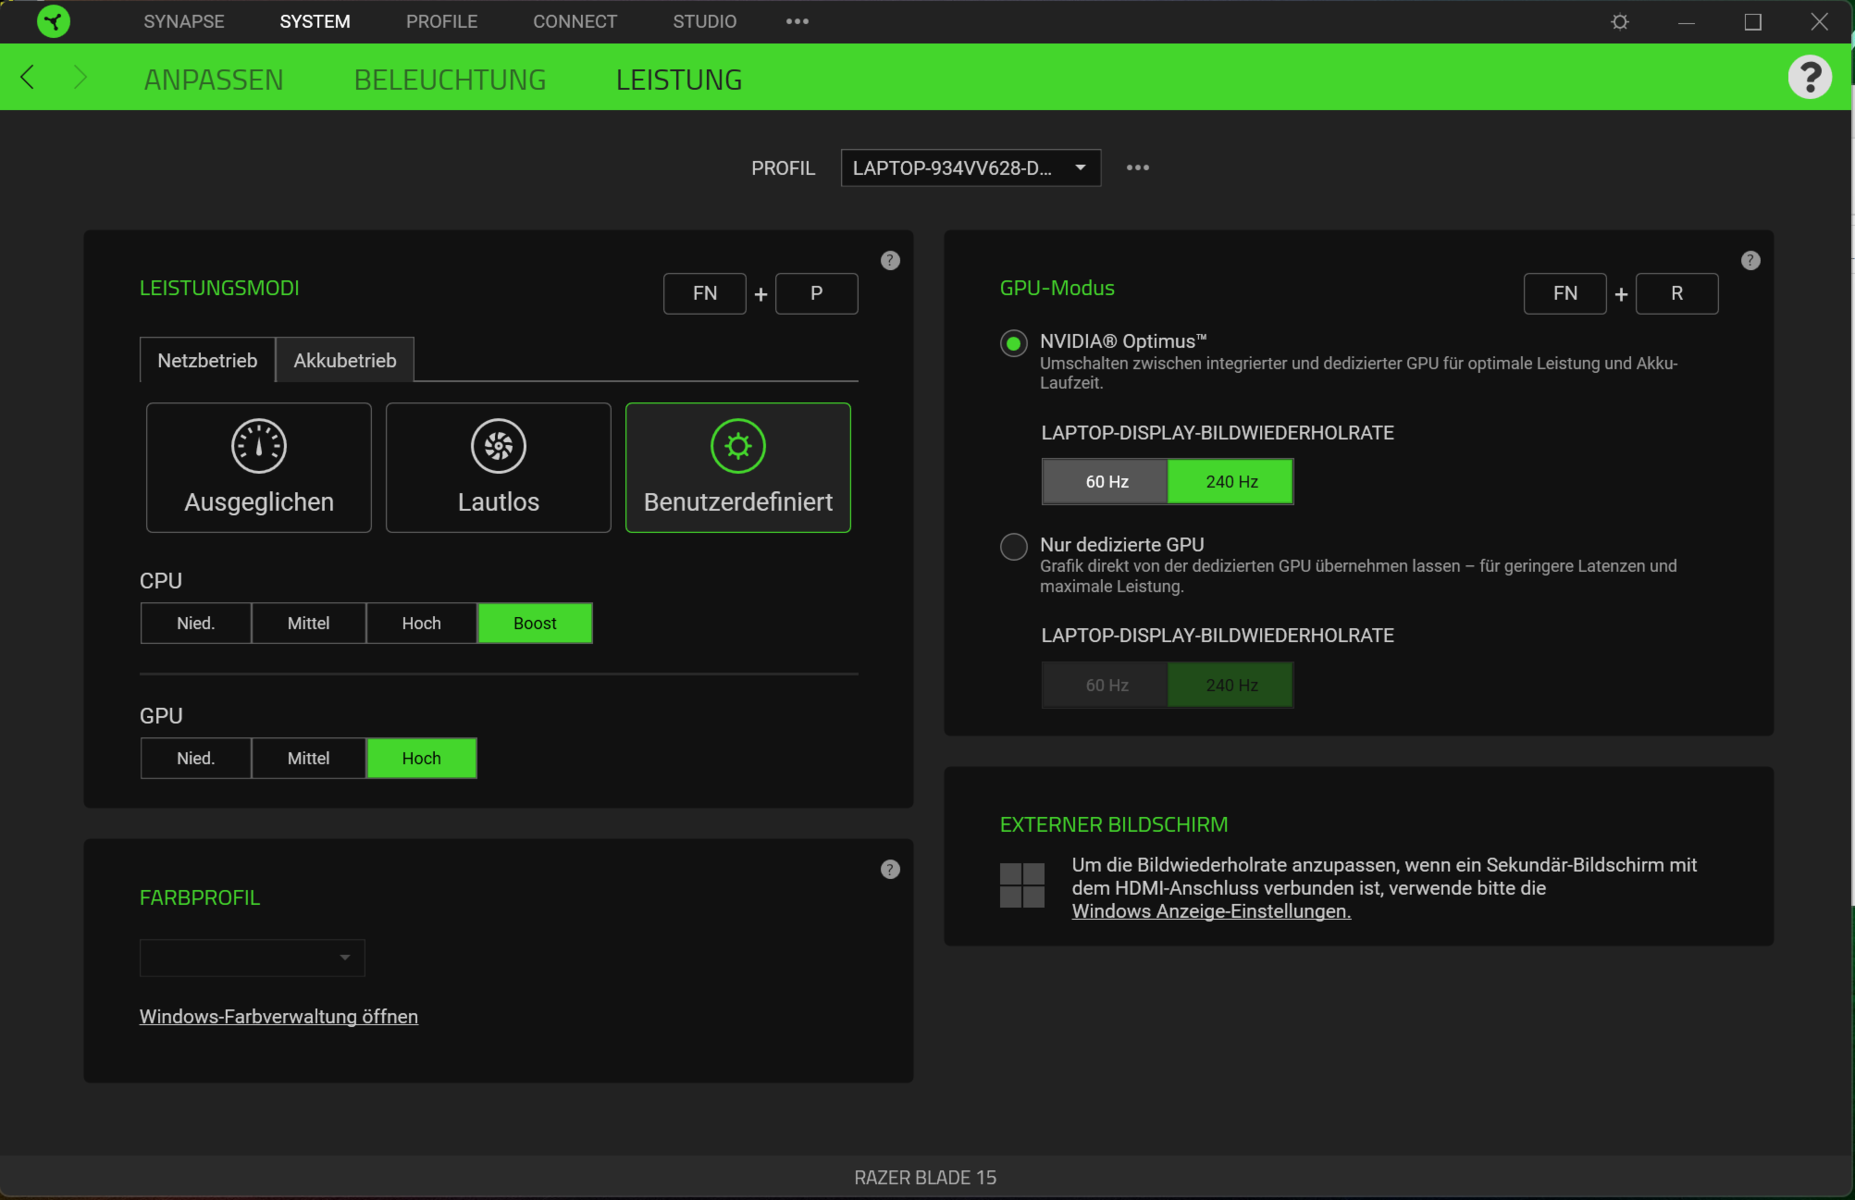
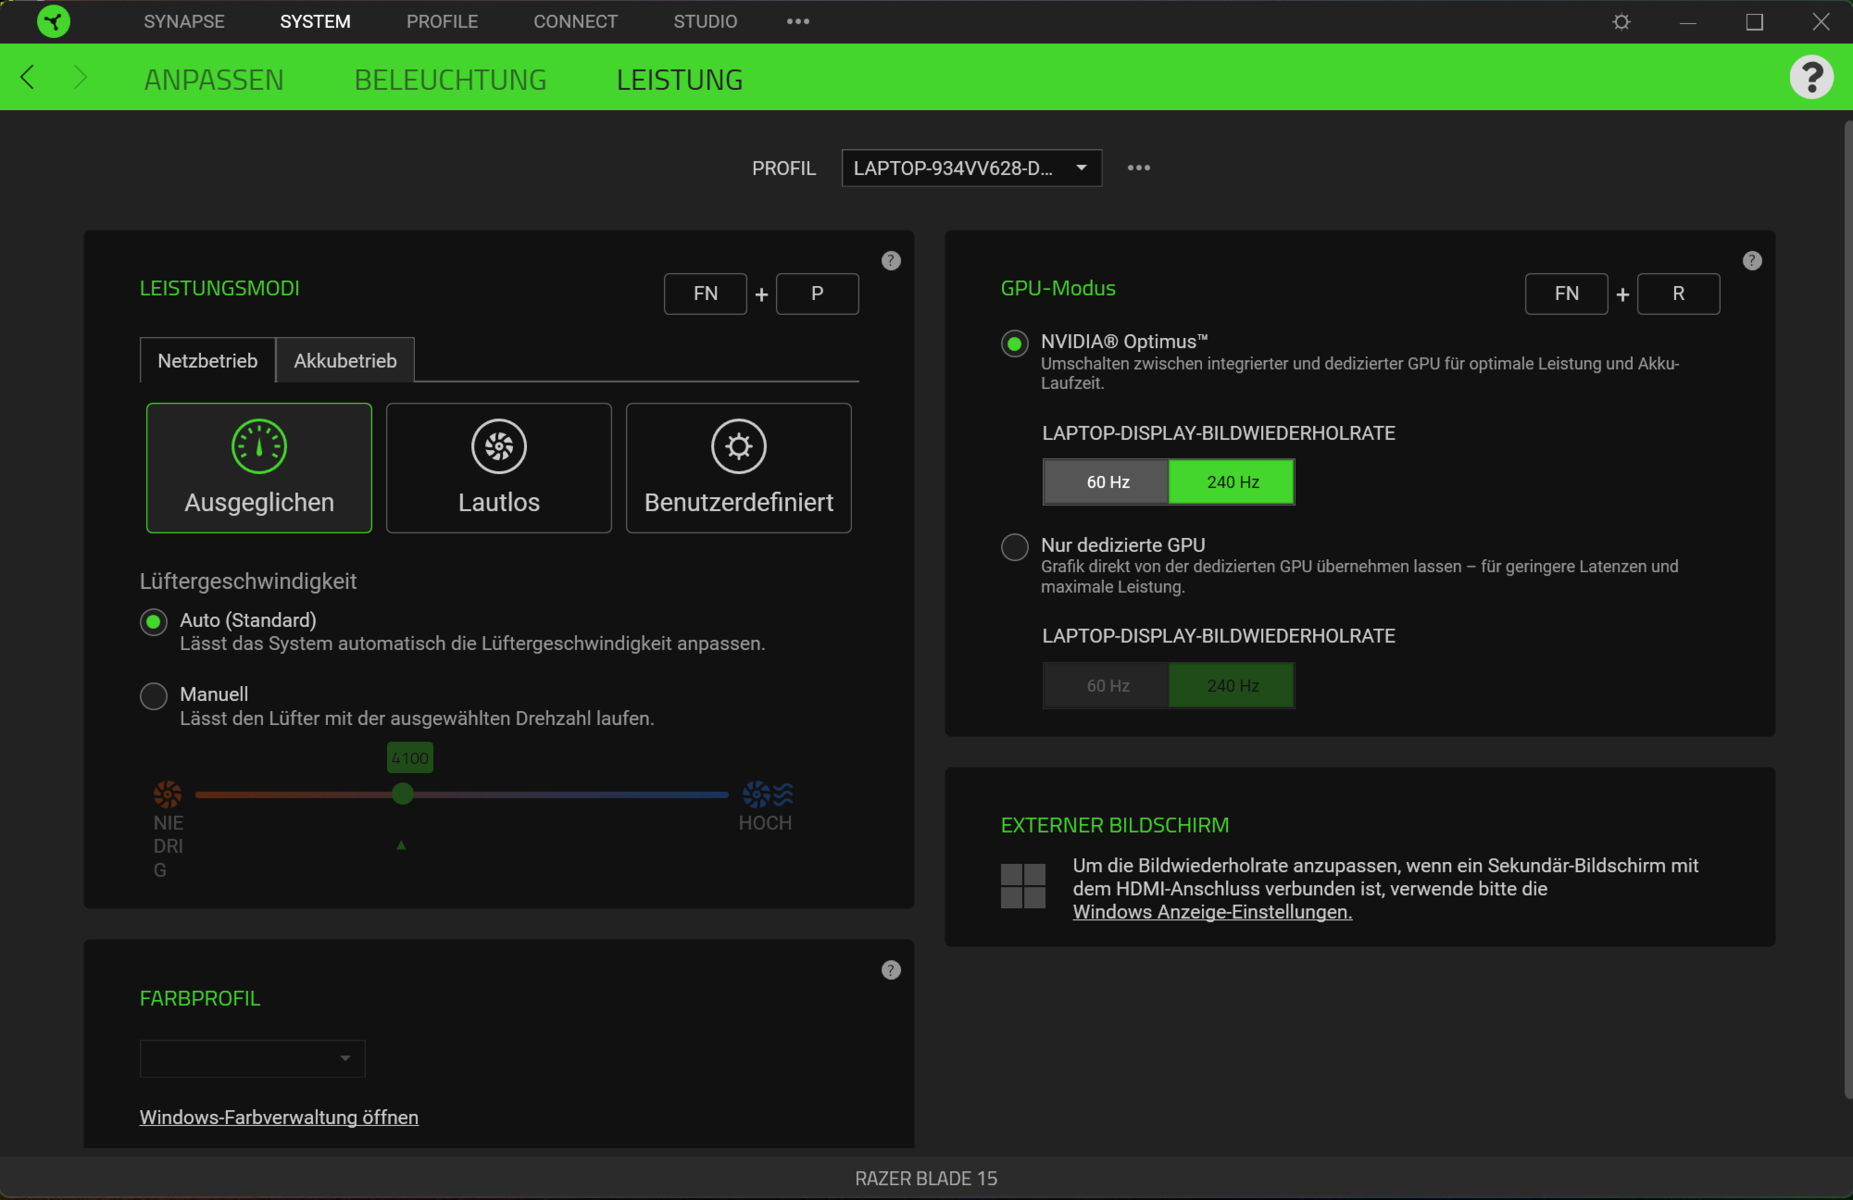
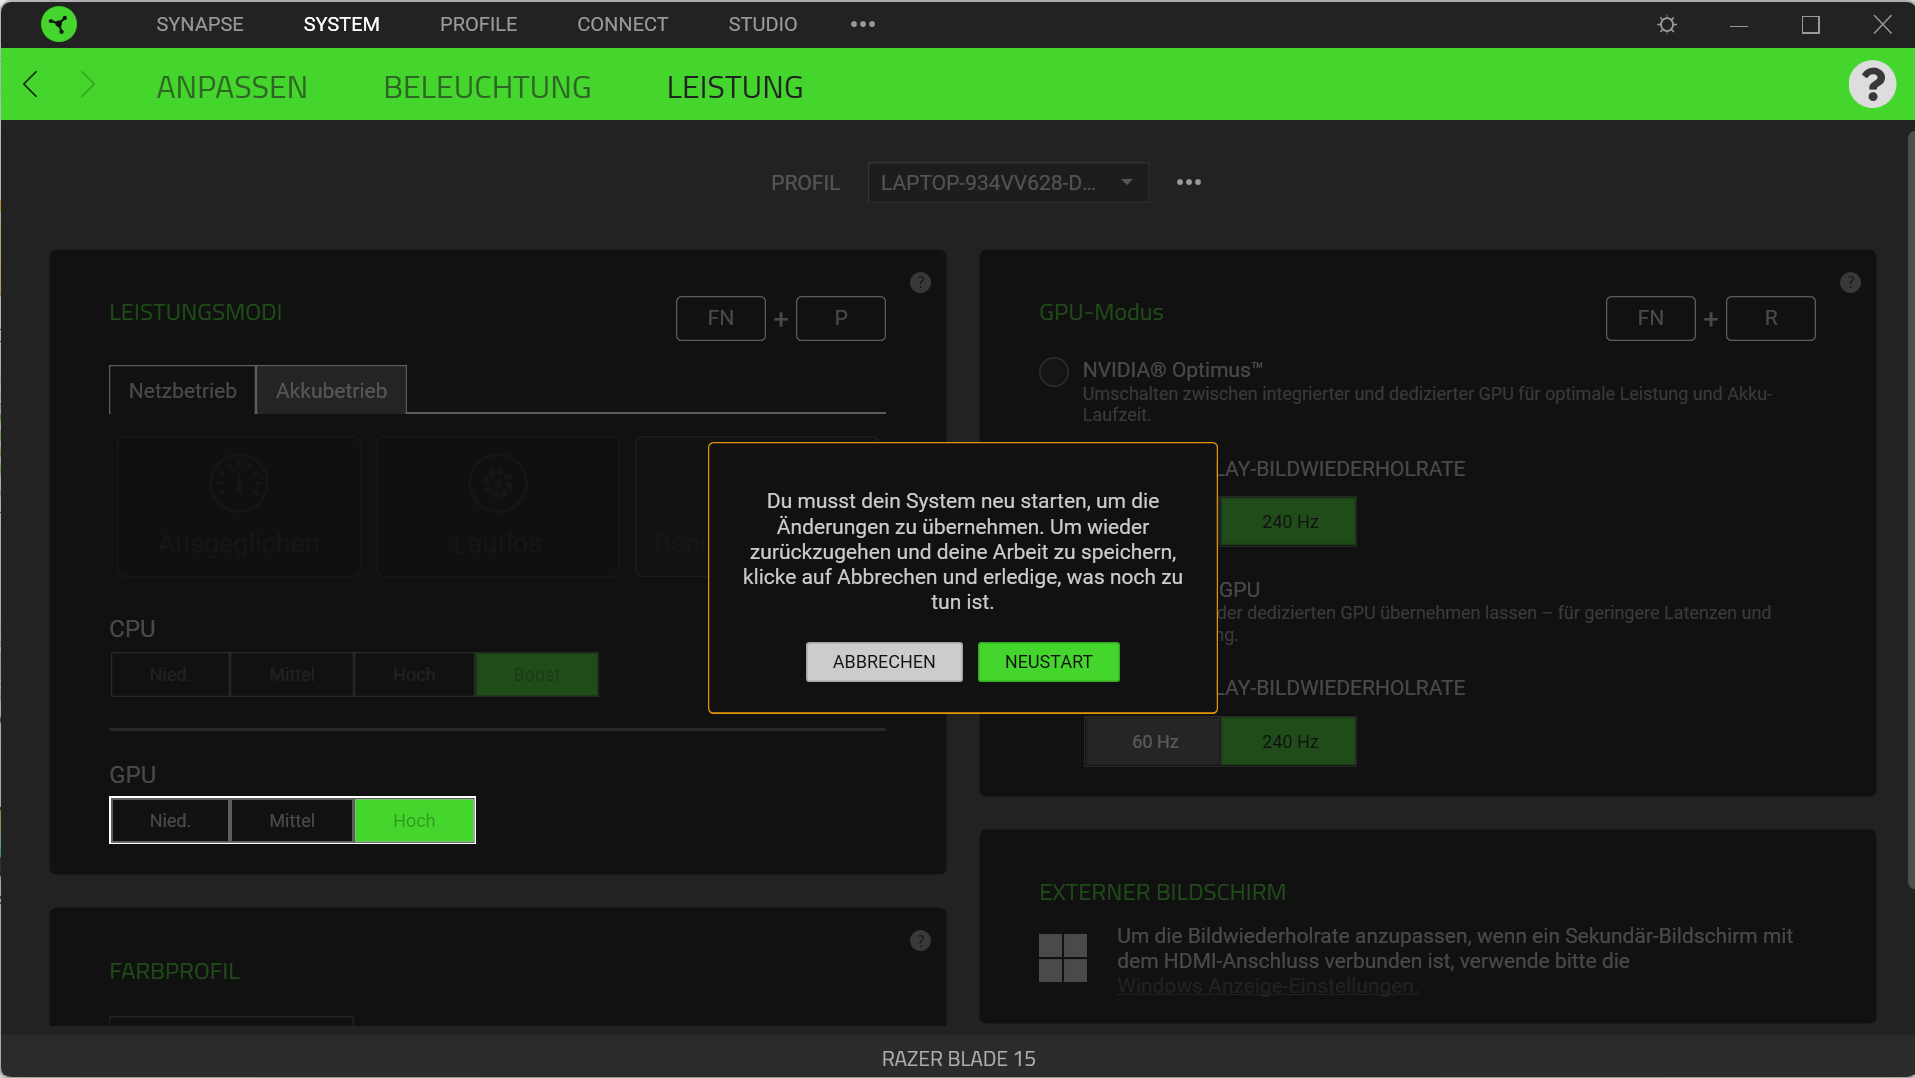
Det är möjligt att växla mellan de tre prestandalägena ("Balanced", "Silent" och "User-defined") med hjälp av kombinationen av tangenterna "Fn" + "P". Profilen "Användardefinierad" gör det möjligt att göra underinställningar för CPU ("Låg", "Medel", "Hög", "Boost") och GPU ("Låg", "Medel" och "Hög") - via den förinstallerade programvaran Razer Synapse. I batteriläge är endast profilen "Balanserad" tillgänglig.
Benchmarks utfördes med det aktiva läget "Användardefinierad" med maximala inställningar (underpresets "Boost" och "High"). För batteritestet användes profilen "Silent".
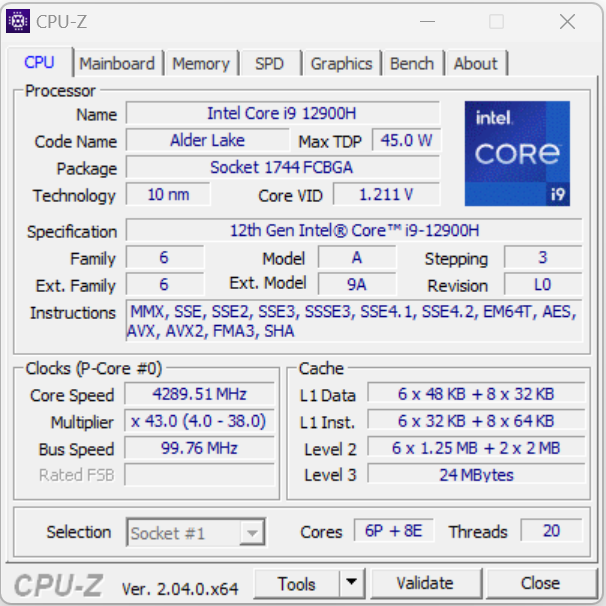
Processor
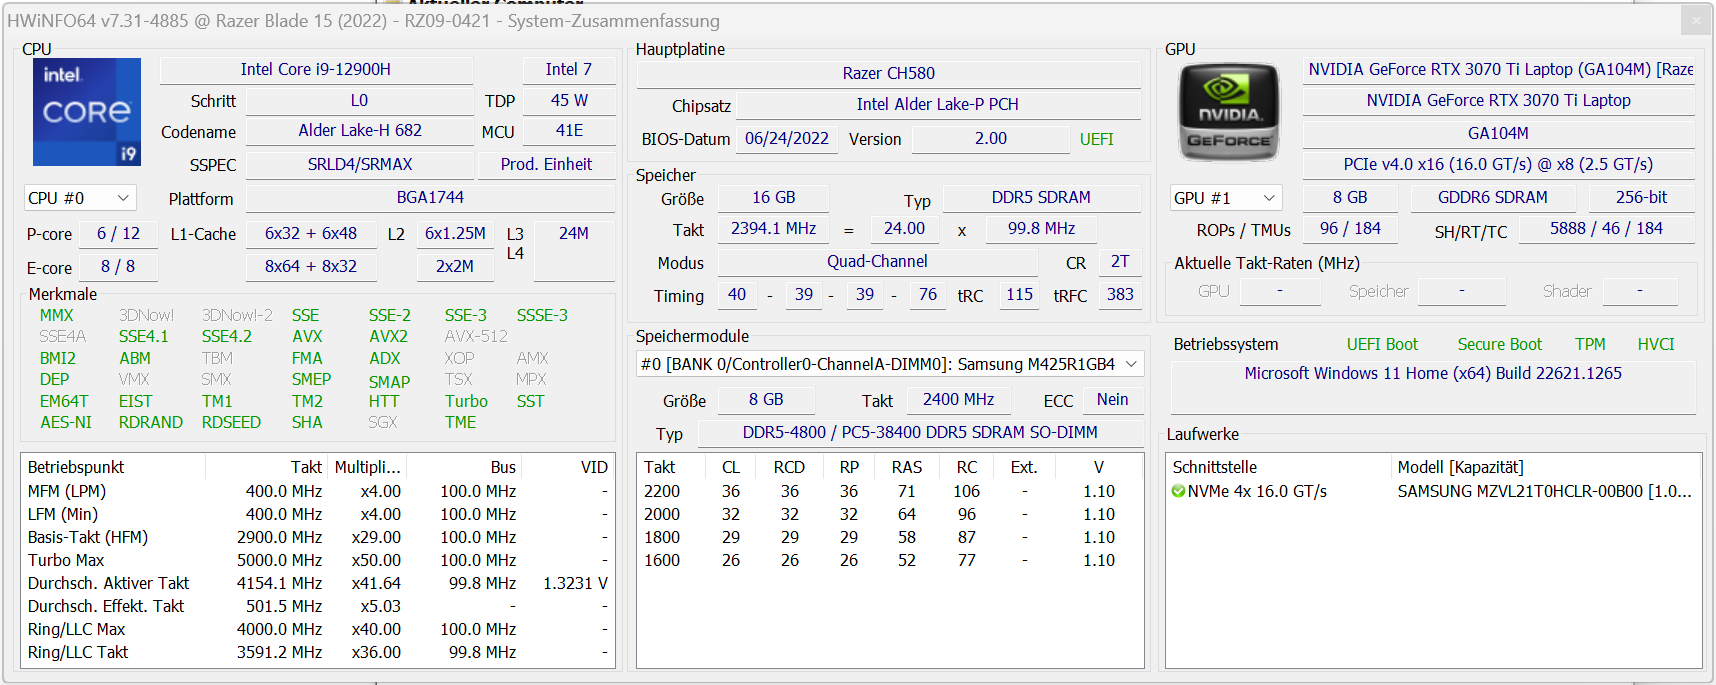
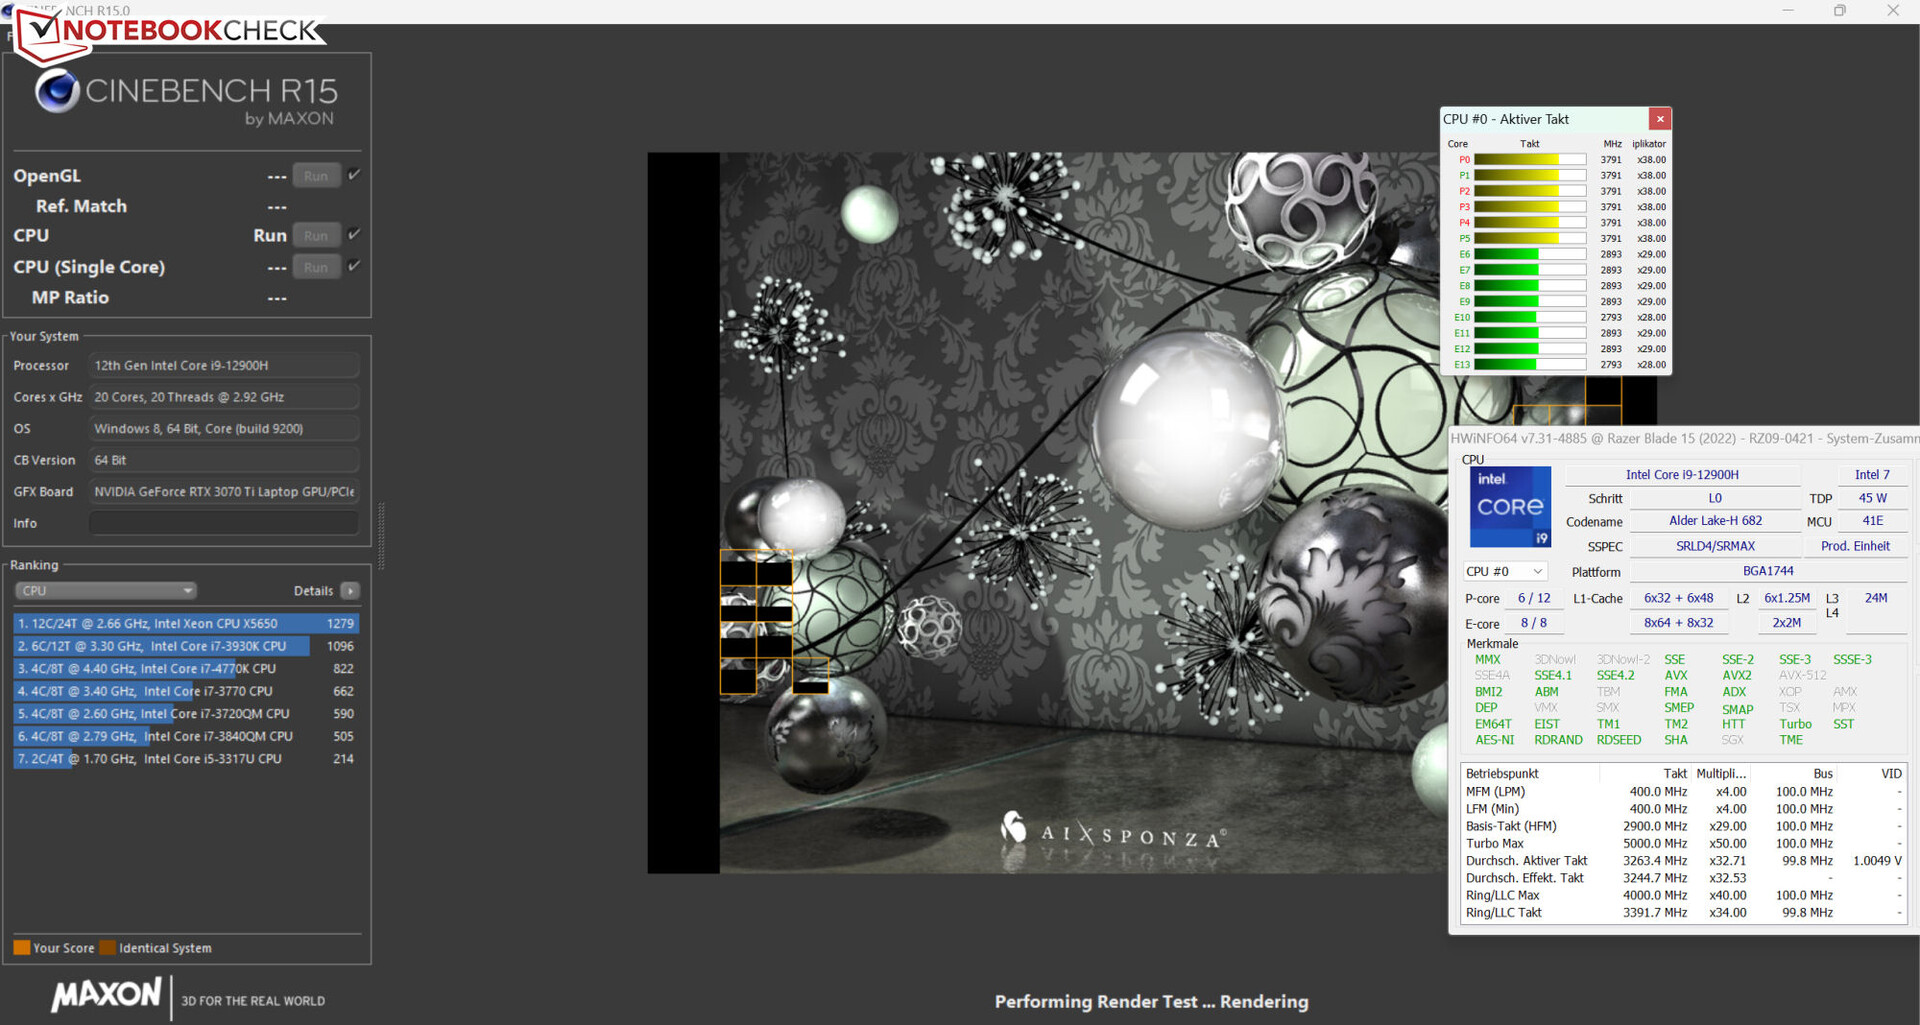
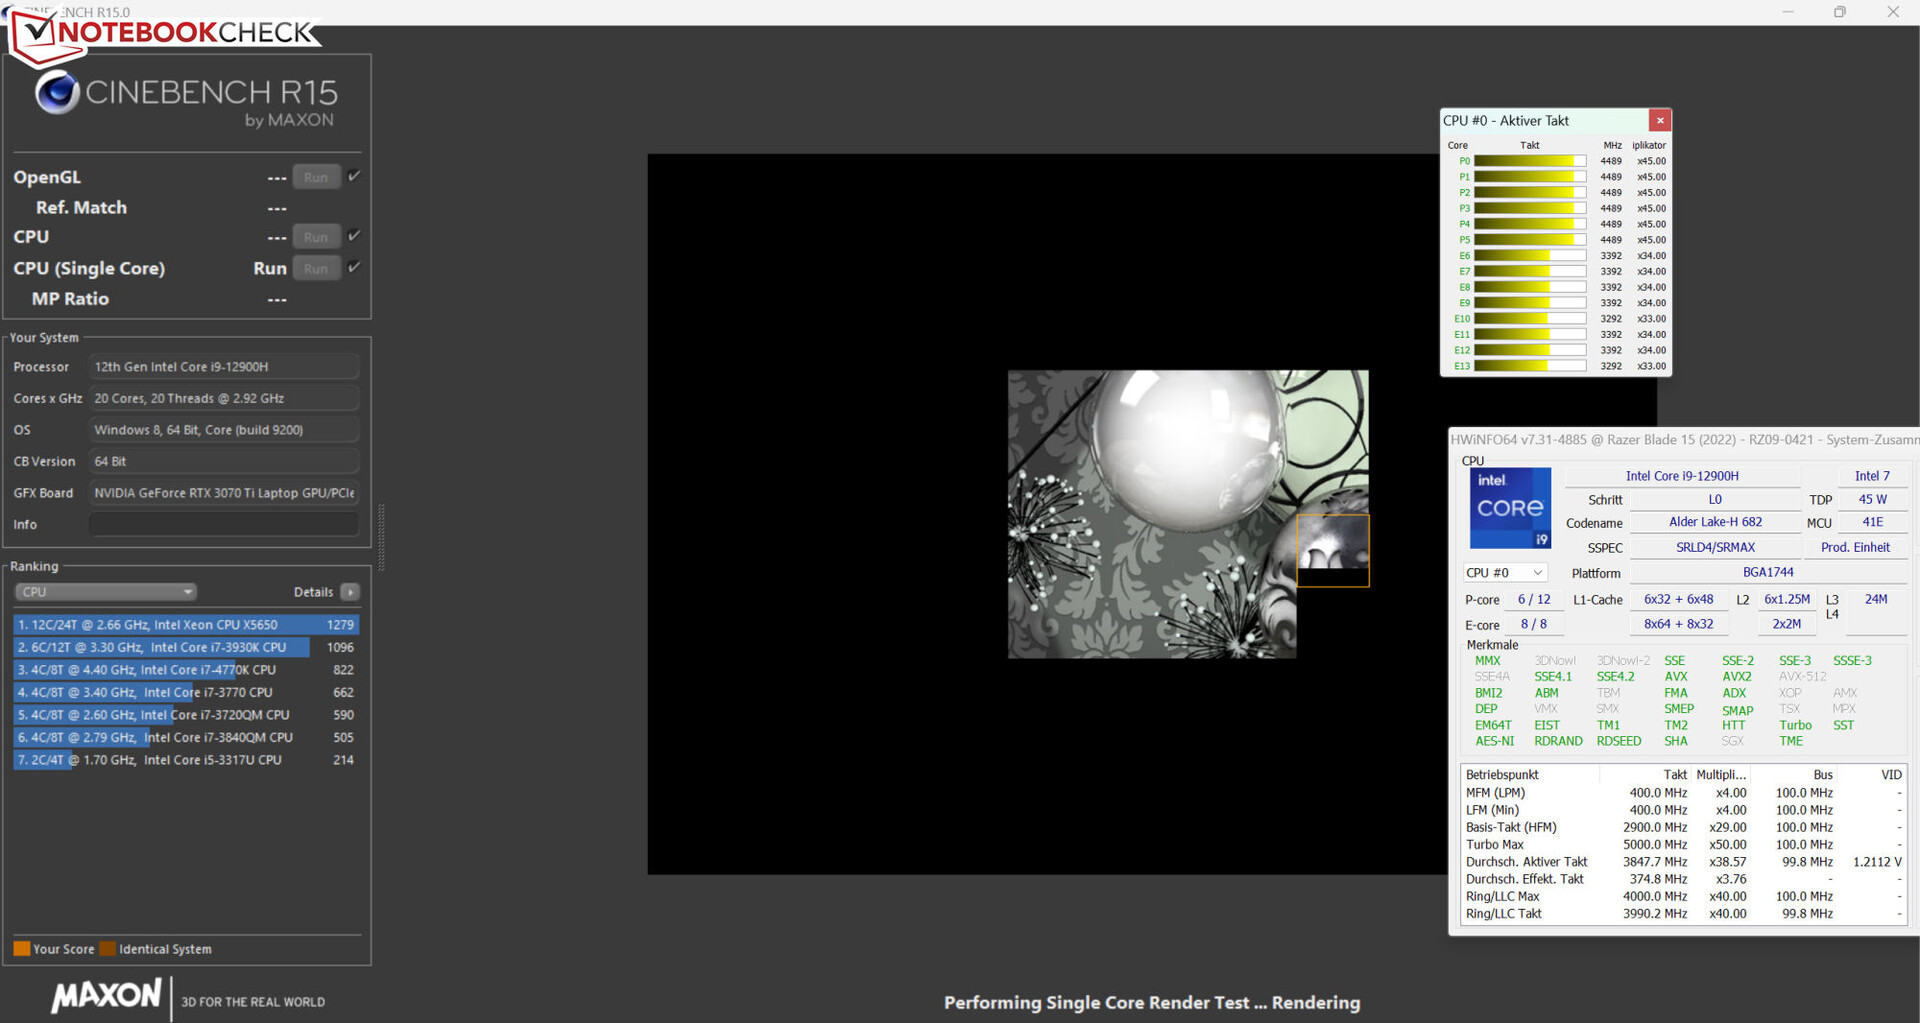
TheCore i9-12900H(Alder Lake) består av sex prestandakärnor (hyperthreading, 2,5 till 5 GHz) och åtta effektivitetskärnor (ingen hyperthreading, 1,8 till 3,8 GHz). Totalt finns det 20 logiska CPU-kärnor.
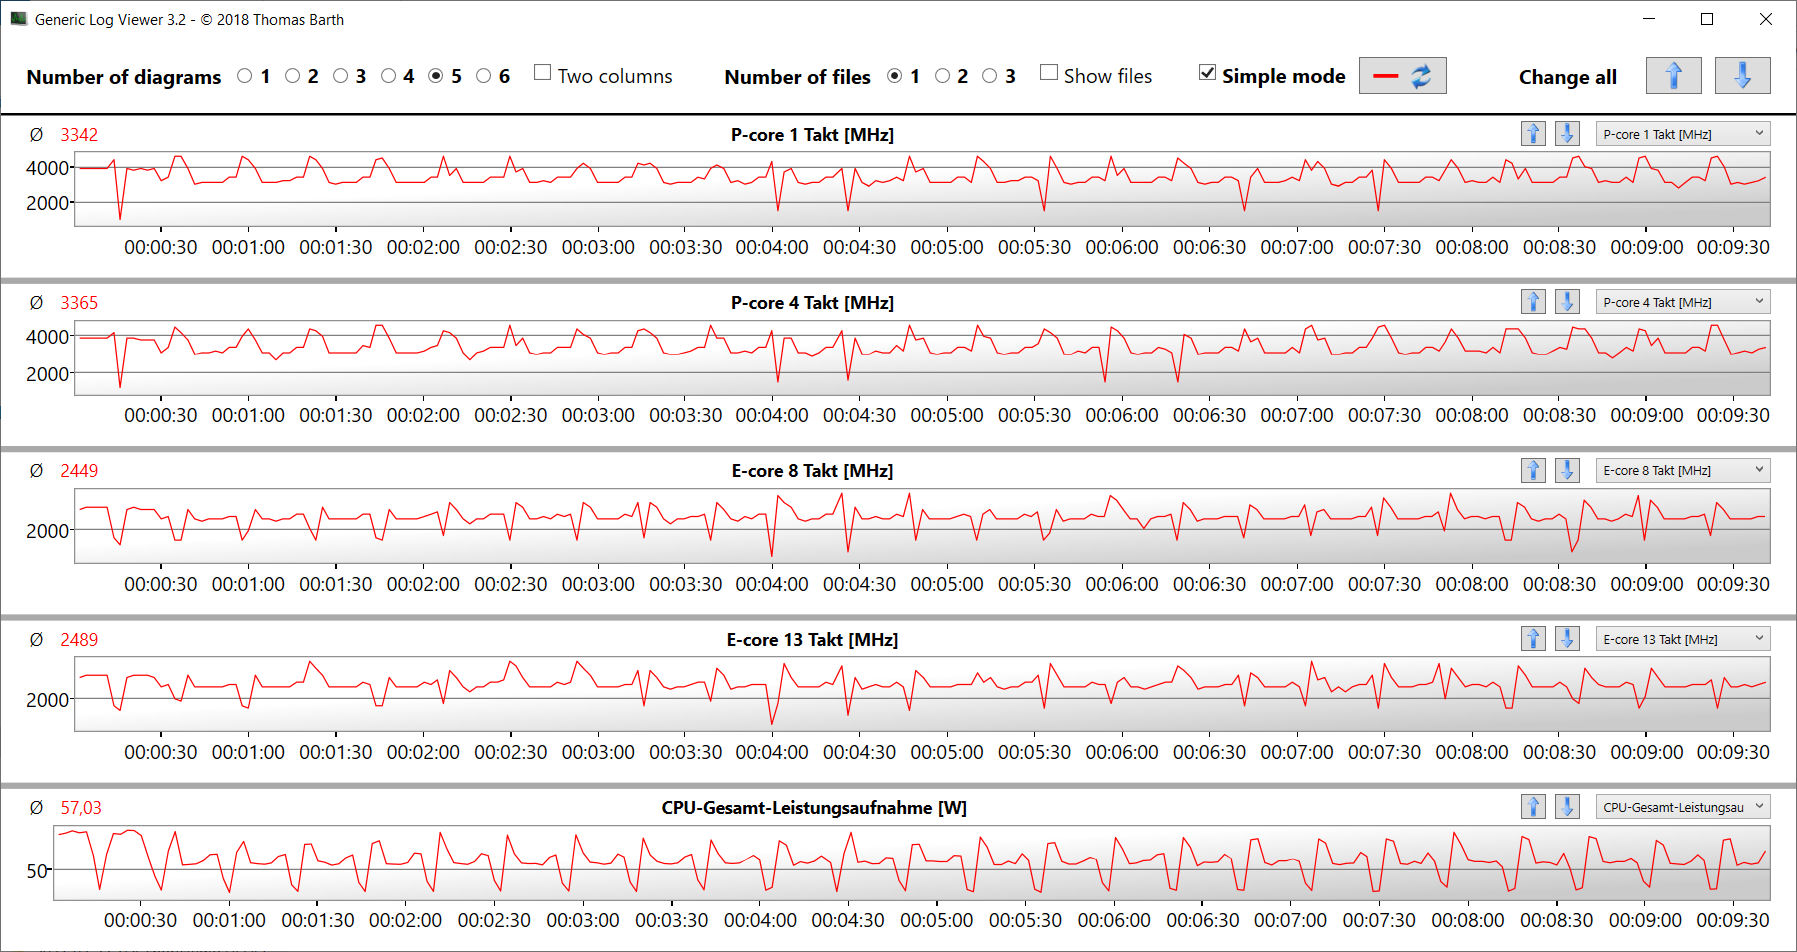
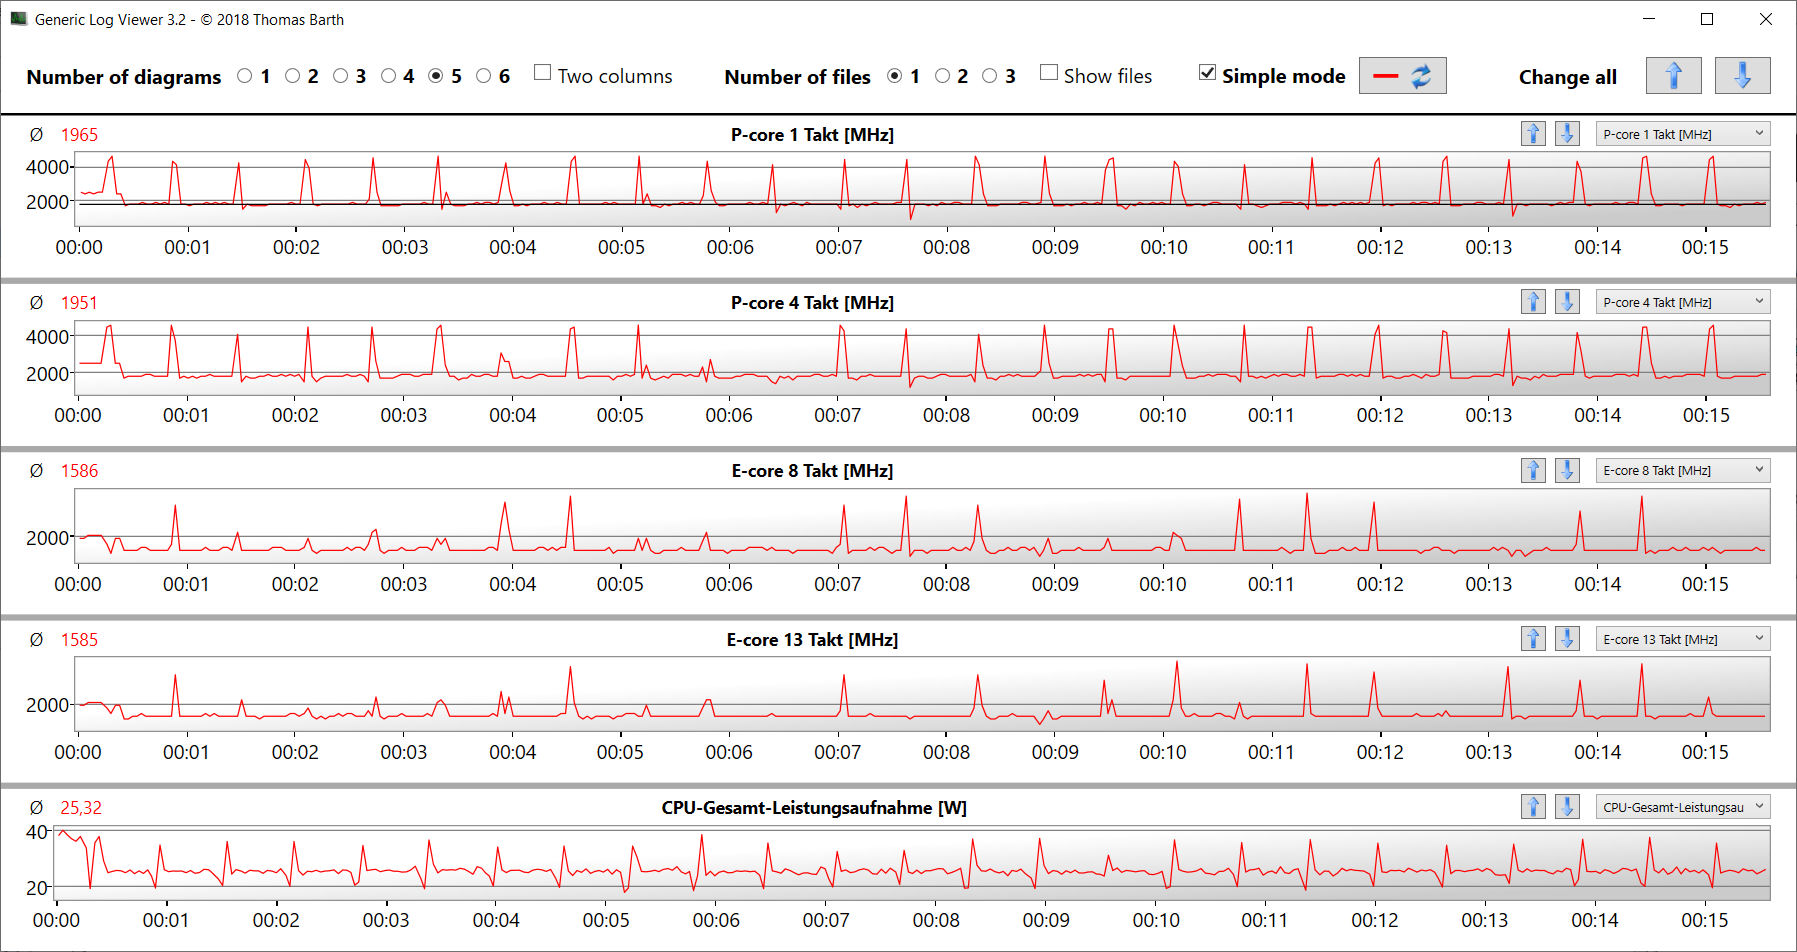
Cinebench R15-jämförelsetestet med flera trådar bearbetades vid 3,6-3,8 GHz (P-kärnor) och 2,8-2,9 GHz (E-kärnor). Vi körde testet med en enda tråd vid 1,4 till 4,5 GHz (P-kärnor) respektive 1,5 till 3,5 GHz (E-kärnor). I batteriläge är klockfrekvenserna lägre. CB15-slingtestet visar: Multi-thread-belastning konfronteras endast med hög turboklockhastighet under en kort tid. Efter 30-40 sekunder sjunker värdena till ungefär basklockhastigheten.
Cinebench R15 Multi Continuous Test

* ... mindre är bättre
AIDA64: FP32 Ray-Trace | FPU Julia | CPU SHA3 | CPU Queen | FPU SinJulia | FPU Mandel | CPU AES | CPU ZLib | FP64 Ray-Trace | CPU PhotoWorxx
| Performance rating | |
| Genomsnitt av klass Gaming | |
| Asus ROG Zephyrus M16 GU603Z | |
| Razer Blade 15 OLED (Early 2022) | |
| Aorus 15 XE5 | |
| Schenker XMG Fusion 15 (Mid 22) | |
| Genomsnitt Intel Core i9-12900H | |
| HP Omen 16-b1090ng | |
| Razer Blade 15 2022 | |
| AIDA64 / FP32 Ray-Trace | |
| Genomsnitt av klass Gaming (10227 - 85542, n=107, senaste 2 åren) | |
| Asus ROG Zephyrus M16 GU603Z | |
| Razer Blade 15 OLED (Early 2022) | |
| Aorus 15 XE5 | |
| Schenker XMG Fusion 15 (Mid 22) | |
| Genomsnitt Intel Core i9-12900H (4074 - 18289, n=29) | |
| Razer Blade 15 2022 | |
| HP Omen 16-b1090ng | |
| AIDA64 / FPU Julia | |
| Genomsnitt av klass Gaming (51376 - 238426, n=107, senaste 2 åren) | |
| Asus ROG Zephyrus M16 GU603Z | |
| Razer Blade 15 OLED (Early 2022) | |
| Aorus 15 XE5 | |
| Schenker XMG Fusion 15 (Mid 22) | |
| Genomsnitt Intel Core i9-12900H (22307 - 93236, n=29) | |
| Razer Blade 15 2022 | |
| HP Omen 16-b1090ng | |
| AIDA64 / CPU SHA3 | |
| Genomsnitt av klass Gaming (2180 - 9817, n=107, senaste 2 åren) | |
| Schenker XMG Fusion 15 (Mid 22) | |
| Asus ROG Zephyrus M16 GU603Z | |
| Razer Blade 15 OLED (Early 2022) | |
| Genomsnitt Intel Core i9-12900H (1378 - 4215, n=29) | |
| Aorus 15 XE5 | |
| Razer Blade 15 2022 | |
| HP Omen 16-b1090ng | |
| AIDA64 / CPU Queen | |
| Genomsnitt av klass Gaming (49785 - 173351, n=94, senaste 2 åren) | |
| Razer Blade 15 OLED (Early 2022) | |
| Asus ROG Zephyrus M16 GU603Z | |
| Aorus 15 XE5 | |
| Genomsnitt Intel Core i9-12900H (78172 - 111241, n=28) | |
| HP Omen 16-b1090ng | |
| Razer Blade 15 2022 | |
| Schenker XMG Fusion 15 (Mid 22) | |
| AIDA64 / FPU SinJulia | |
| Genomsnitt av klass Gaming (4424 - 33636, n=107, senaste 2 åren) | |
| Razer Blade 15 OLED (Early 2022) | |
| Asus ROG Zephyrus M16 GU603Z | |
| HP Omen 16-b1090ng | |
| Razer Blade 15 2022 | |
| Genomsnitt Intel Core i9-12900H (5709 - 10410, n=29) | |
| Schenker XMG Fusion 15 (Mid 22) | |
| Aorus 15 XE5 | |
| AIDA64 / FPU Mandel | |
| Genomsnitt av klass Gaming (25115 - 128721, n=107, senaste 2 åren) | |
| Schenker XMG Fusion 15 (Mid 22) | |
| Asus ROG Zephyrus M16 GU603Z | |
| Razer Blade 15 OLED (Early 2022) | |
| Aorus 15 XE5 | |
| Genomsnitt Intel Core i9-12900H (11257 - 45581, n=29) | |
| Razer Blade 15 2022 | |
| HP Omen 16-b1090ng | |
| AIDA64 / CPU AES | |
| Schenker XMG Fusion 15 (Mid 22) | |
| Asus ROG Zephyrus M16 GU603Z | |
| Aorus 15 XE5 | |
| Genomsnitt av klass Gaming (39258 - 247074, n=107, senaste 2 åren) | |
| Razer Blade 15 OLED (Early 2022) | |
| HP Omen 16-b1090ng | |
| Genomsnitt Intel Core i9-12900H (31935 - 151546, n=29) | |
| Razer Blade 15 2022 | |
| AIDA64 / CPU ZLib | |
| Genomsnitt av klass Gaming (574 - 2531, n=107, senaste 2 åren) | |
| Razer Blade 15 OLED (Early 2022) | |
| Asus ROG Zephyrus M16 GU603Z | |
| HP Omen 16-b1090ng | |
| Razer Blade 15 2022 | |
| Genomsnitt Intel Core i9-12900H (449 - 1193, n=29) | |
| Aorus 15 XE5 | |
| Schenker XMG Fusion 15 (Mid 22) | |
| AIDA64 / FP64 Ray-Trace | |
| Genomsnitt av klass Gaming (5509 - 45446, n=107, senaste 2 åren) | |
| Asus ROG Zephyrus M16 GU603Z | |
| Razer Blade 15 OLED (Early 2022) | |
| Schenker XMG Fusion 15 (Mid 22) | |
| Aorus 15 XE5 | |
| Genomsnitt Intel Core i9-12900H (2235 - 10511, n=29) | |
| HP Omen 16-b1090ng | |
| Razer Blade 15 2022 | |
| AIDA64 / CPU PhotoWorxx | |
| Genomsnitt av klass Gaming (12271 - 89891, n=107, senaste 2 åren) | |
| Asus ROG Zephyrus M16 GU603Z | |
| Razer Blade 15 2022 | |
| HP Omen 16-b1090ng | |
| Genomsnitt Intel Core i9-12900H (20960 - 48269, n=30) | |
| Aorus 15 XE5 | |
| Razer Blade 15 OLED (Early 2022) | |
| Razer Blade 15 OLED (Early 2022) | |
| Schenker XMG Fusion 15 (Mid 22) | |
Systemets prestanda
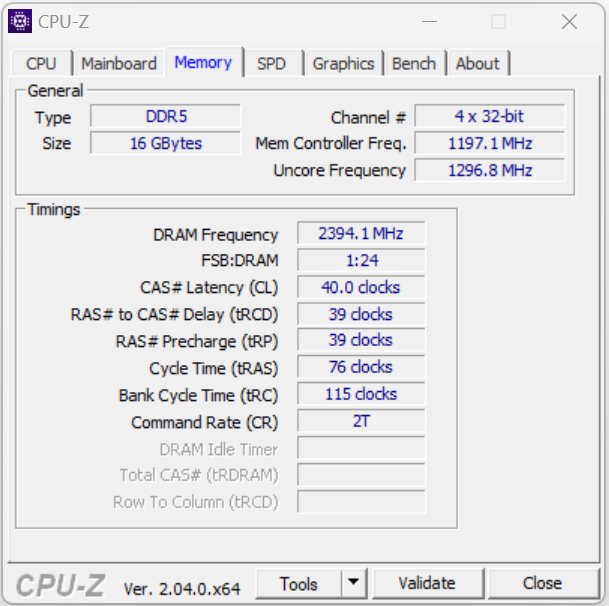
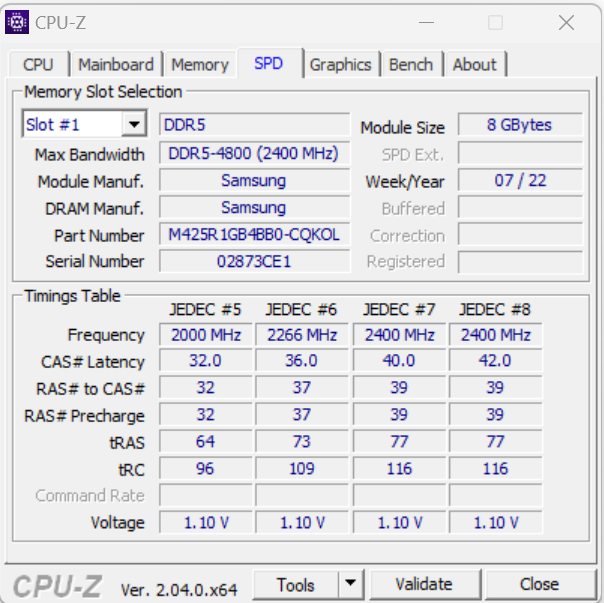
Systemet fungerar smidigt och tillförlitligt och ger tillräckligt med kraft för krävande tillämpningar som rendering, videoredigering och spel. RAM-minnets överföringshastigheter ligger på en normal nivå för DDR5-4800-minne och detta kompletteras av goda PC-Mark-resultat.
CrossMark: Overall | Productivity | Creativity | Responsiveness
| PCMark 10 / Score | |
| Genomsnitt av klass Gaming (5828 - 11574, n=95, senaste 2 åren) | |
| Asus ROG Zephyrus M16 GU603Z | |
| Genomsnitt Intel Core i9-12900H, NVIDIA GeForce RTX 3070 Ti Laptop GPU (7087 - 8072, n=6) | |
| Razer Blade 15 2022 | |
| Aorus 15 XE5 | |
| Razer Blade 15 OLED (Early 2022) | |
| HP Omen 16-b1090ng | |
| Schenker XMG Fusion 15 (Mid 22) | |
| PCMark 10 / Essentials | |
| Asus ROG Zephyrus M16 GU603Z | |
| Genomsnitt Intel Core i9-12900H, NVIDIA GeForce RTX 3070 Ti Laptop GPU (10266 - 11663, n=6) | |
| Aorus 15 XE5 | |
| Razer Blade 15 2022 | |
| Genomsnitt av klass Gaming (8810 - 12600, n=99, senaste 2 åren) | |
| Razer Blade 15 OLED (Early 2022) | |
| HP Omen 16-b1090ng | |
| Schenker XMG Fusion 15 (Mid 22) | |
| PCMark 10 / Productivity | |
| Genomsnitt av klass Gaming (6845 - 21327, n=97, senaste 2 åren) | |
| Aorus 15 XE5 | |
| Asus ROG Zephyrus M16 GU603Z | |
| Genomsnitt Intel Core i9-12900H, NVIDIA GeForce RTX 3070 Ti Laptop GPU (9402 - 10742, n=6) | |
| Razer Blade 15 OLED (Early 2022) | |
| Razer Blade 15 2022 | |
| HP Omen 16-b1090ng | |
| Schenker XMG Fusion 15 (Mid 22) | |
| PCMark 10 / Digital Content Creation | |
| Genomsnitt av klass Gaming (7602 - 19657, n=97, senaste 2 åren) | |
| Razer Blade 15 2022 | |
| Asus ROG Zephyrus M16 GU603Z | |
| Genomsnitt Intel Core i9-12900H, NVIDIA GeForce RTX 3070 Ti Laptop GPU (10009 - 12541, n=6) | |
| Aorus 15 XE5 | |
| HP Omen 16-b1090ng | |
| Razer Blade 15 OLED (Early 2022) | |
| Schenker XMG Fusion 15 (Mid 22) | |
| CrossMark / Overall | |
| Genomsnitt av klass Gaming (1366 - 2409, n=96, senaste 2 åren) | |
| Aorus 15 XE5 | |
| Asus ROG Zephyrus M16 GU603Z | |
| Genomsnitt Intel Core i9-12900H, NVIDIA GeForce RTX 3070 Ti Laptop GPU (1664 - 2044, n=6) | |
| Razer Blade 15 OLED (Early 2022) | |
| Schenker XMG Fusion 15 (Mid 22) | |
| CrossMark / Productivity | |
| Aorus 15 XE5 | |
| Genomsnitt av klass Gaming (1386 - 2254, n=96, senaste 2 åren) | |
| Asus ROG Zephyrus M16 GU603Z | |
| Genomsnitt Intel Core i9-12900H, NVIDIA GeForce RTX 3070 Ti Laptop GPU (1591 - 1968, n=6) | |
| Razer Blade 15 OLED (Early 2022) | |
| Schenker XMG Fusion 15 (Mid 22) | |
| CrossMark / Creativity | |
| Genomsnitt av klass Gaming (1343 - 2729, n=96, senaste 2 åren) | |
| Asus ROG Zephyrus M16 GU603Z | |
| Genomsnitt Intel Core i9-12900H, NVIDIA GeForce RTX 3070 Ti Laptop GPU (1797 - 2148, n=6) | |
| Aorus 15 XE5 | |
| Razer Blade 15 OLED (Early 2022) | |
| Schenker XMG Fusion 15 (Mid 22) | |
| CrossMark / Responsiveness | |
| Aorus 15 XE5 | |
| Asus ROG Zephyrus M16 GU603Z | |
| Genomsnitt Intel Core i9-12900H, NVIDIA GeForce RTX 3070 Ti Laptop GPU (1514 - 2069, n=6) | |
| Genomsnitt av klass Gaming (1226 - 2334, n=96, senaste 2 åren) | |
| Schenker XMG Fusion 15 (Mid 22) | |
| Razer Blade 15 OLED (Early 2022) | |
| PCMark 8 Home Score Accelerated v2 | 5101 poäng | |
| PCMark 8 Work Score Accelerated v2 | 5789 poäng | |
| PCMark 10 Score | 7336 poäng | |
Hjälp | ||
| AIDA64 / Memory Copy | |
| Genomsnitt av klass Gaming (21750 - 129946, n=107, senaste 2 åren) | |
| Asus ROG Zephyrus M16 GU603Z | |
| HP Omen 16-b1090ng | |
| Razer Blade 15 2022 | |
| Genomsnitt Intel Core i9-12900H (34438 - 74264, n=29) | |
| Razer Blade 15 OLED (Early 2022) | |
| Aorus 15 XE5 | |
| Schenker XMG Fusion 15 (Mid 22) | |
| AIDA64 / Memory Read | |
| Genomsnitt av klass Gaming (22956 - 118858, n=107, senaste 2 åren) | |
| Asus ROG Zephyrus M16 GU603Z | |
| HP Omen 16-b1090ng | |
| Razer Blade 15 2022 | |
| Genomsnitt Intel Core i9-12900H (36365 - 74642, n=29) | |
| Razer Blade 15 OLED (Early 2022) | |
| Aorus 15 XE5 | |
| Schenker XMG Fusion 15 (Mid 22) | |
| AIDA64 / Memory Write | |
| Genomsnitt av klass Gaming (22297 - 135096, n=107, senaste 2 åren) | |
| Asus ROG Zephyrus M16 GU603Z | |
| Razer Blade 15 2022 | |
| HP Omen 16-b1090ng | |
| Genomsnitt Intel Core i9-12900H (32276 - 67858, n=29) | |
| Aorus 15 XE5 | |
| Razer Blade 15 OLED (Early 2022) | |
| Schenker XMG Fusion 15 (Mid 22) | |
| AIDA64 / Memory Latency | |
| Genomsnitt av klass Gaming (75.3 - 259, n=107, senaste 2 åren) | |
| Razer Blade 15 OLED (Early 2022) | |
| Aorus 15 XE5 | |
| Schenker XMG Fusion 15 (Mid 22) | |
| HP Omen 16-b1090ng | |
| Asus ROG Zephyrus M16 GU603Z | |
| Genomsnitt Intel Core i9-12900H (74.7 - 118.1, n=28) | |
| Razer Blade 15 2022 | |
* ... mindre är bättre
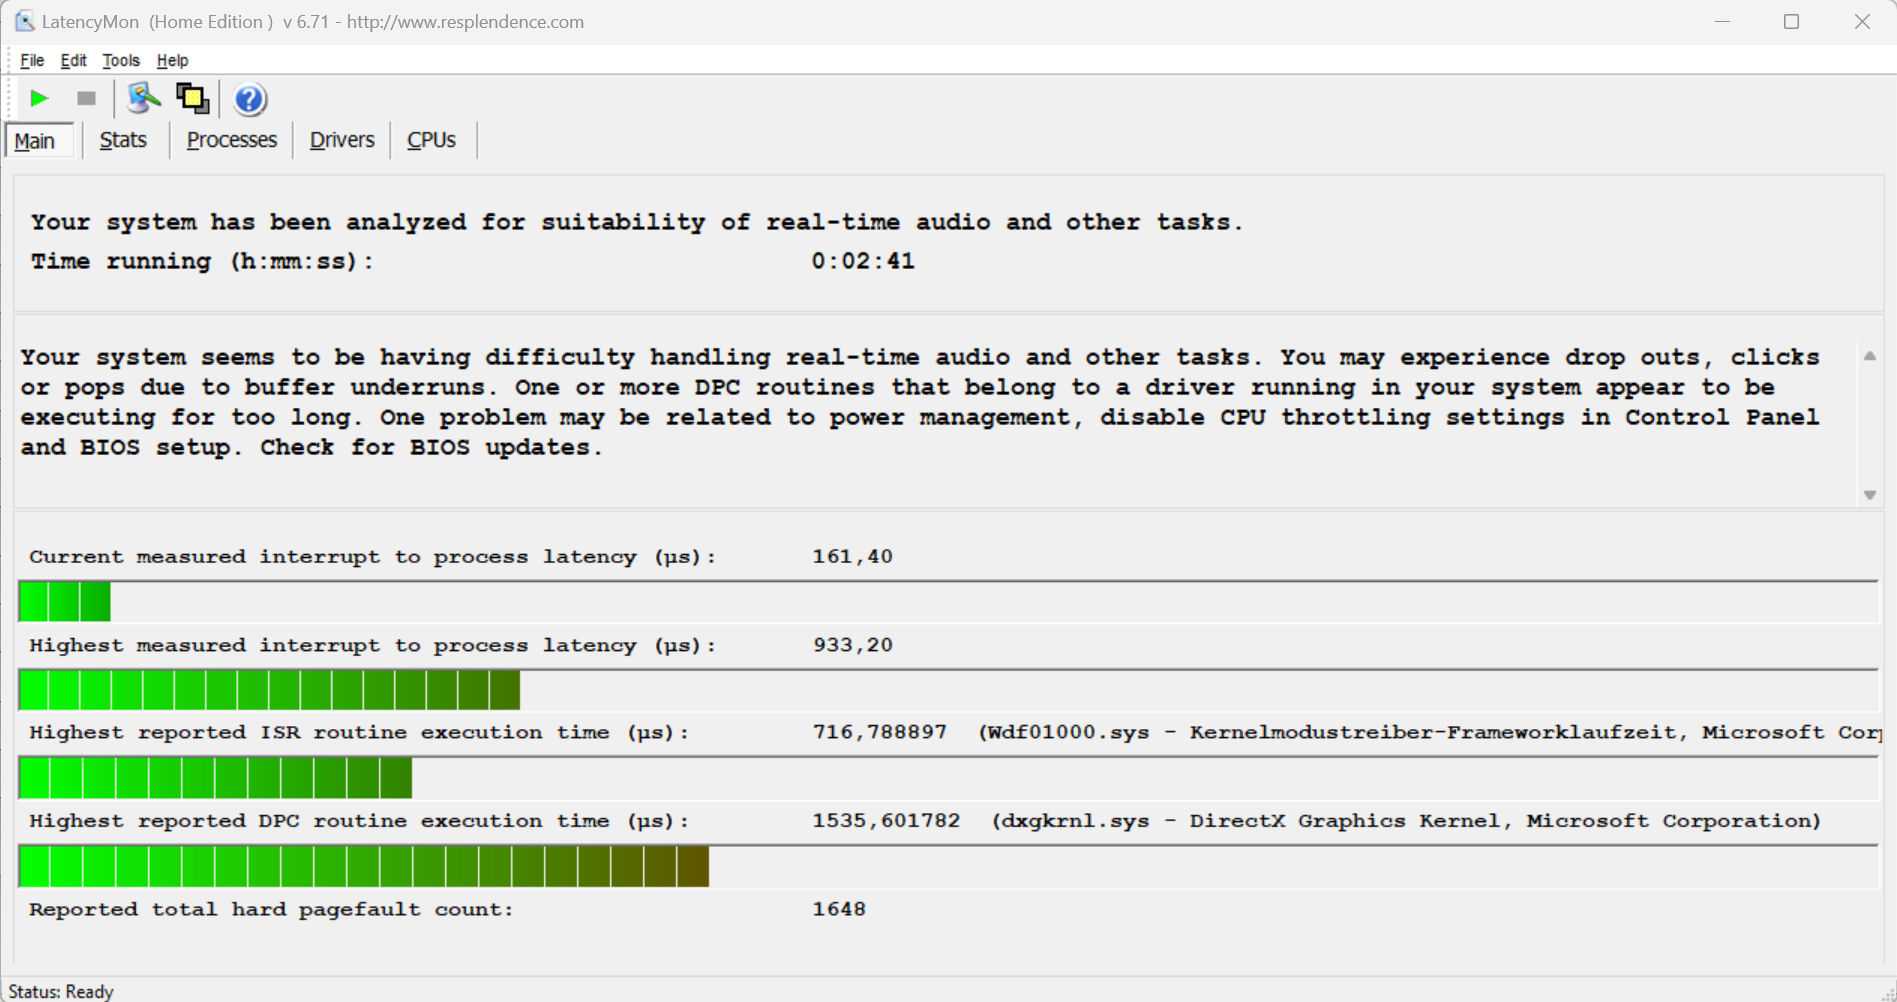
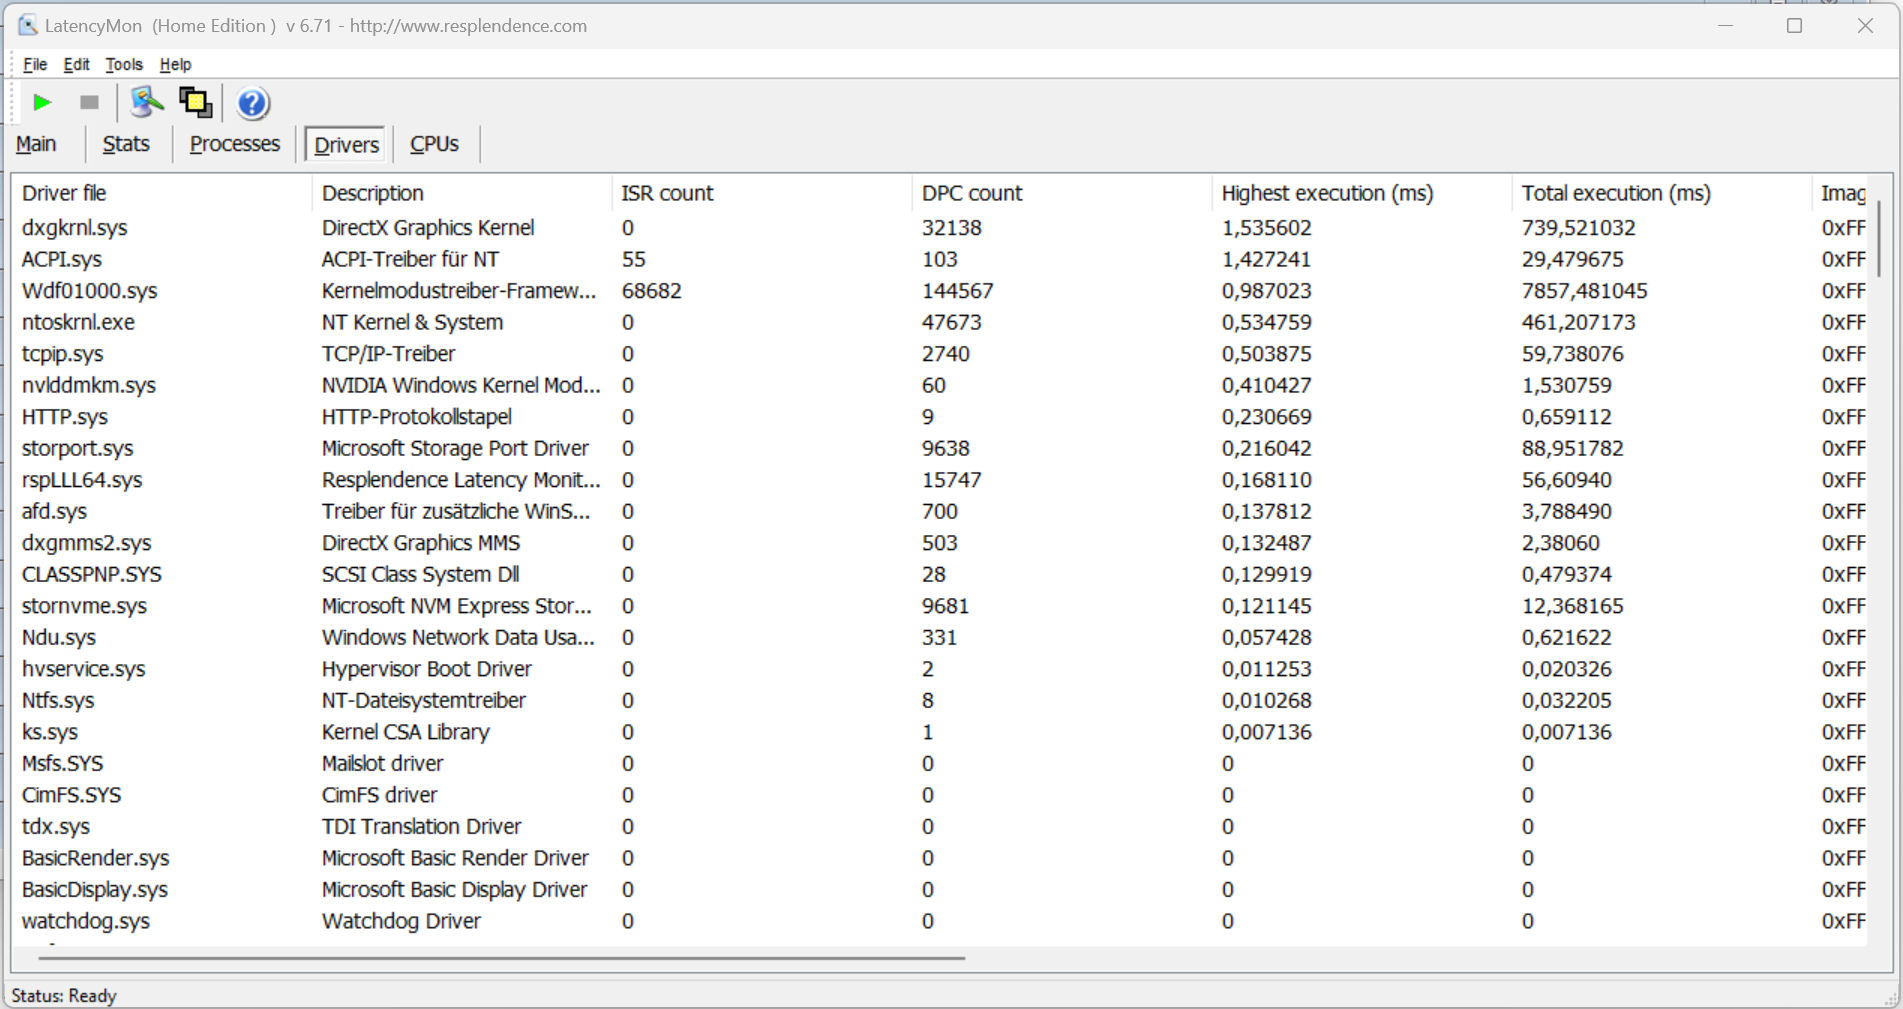
DPC-latenstider
Det standardiserade testet för övervakning av latens (surfning på internet, uppspelning av 4k-video, Prime95 hög belastning) visade på avvikelser. Systemet verkar inte vara lämpligt för video- och ljudredigering i realtid. Framtida mjukvaruuppdateringar kan dock leda till antingen förbättringar eller försämringar av prestandan.
| DPC Latencies / LatencyMon - interrupt to process latency (max), Web, Youtube, Prime95 | |
| Schenker XMG Fusion 15 (Mid 22) | |
| Razer Blade 15 2022 | |
| Aorus 15 XE5 | |
| Asus ROG Zephyrus M16 GU603Z | |
| Razer Blade 15 OLED (Early 2022) | |
| HP Omen 16-b1090ng | |
* ... mindre är bättre
Masslagring
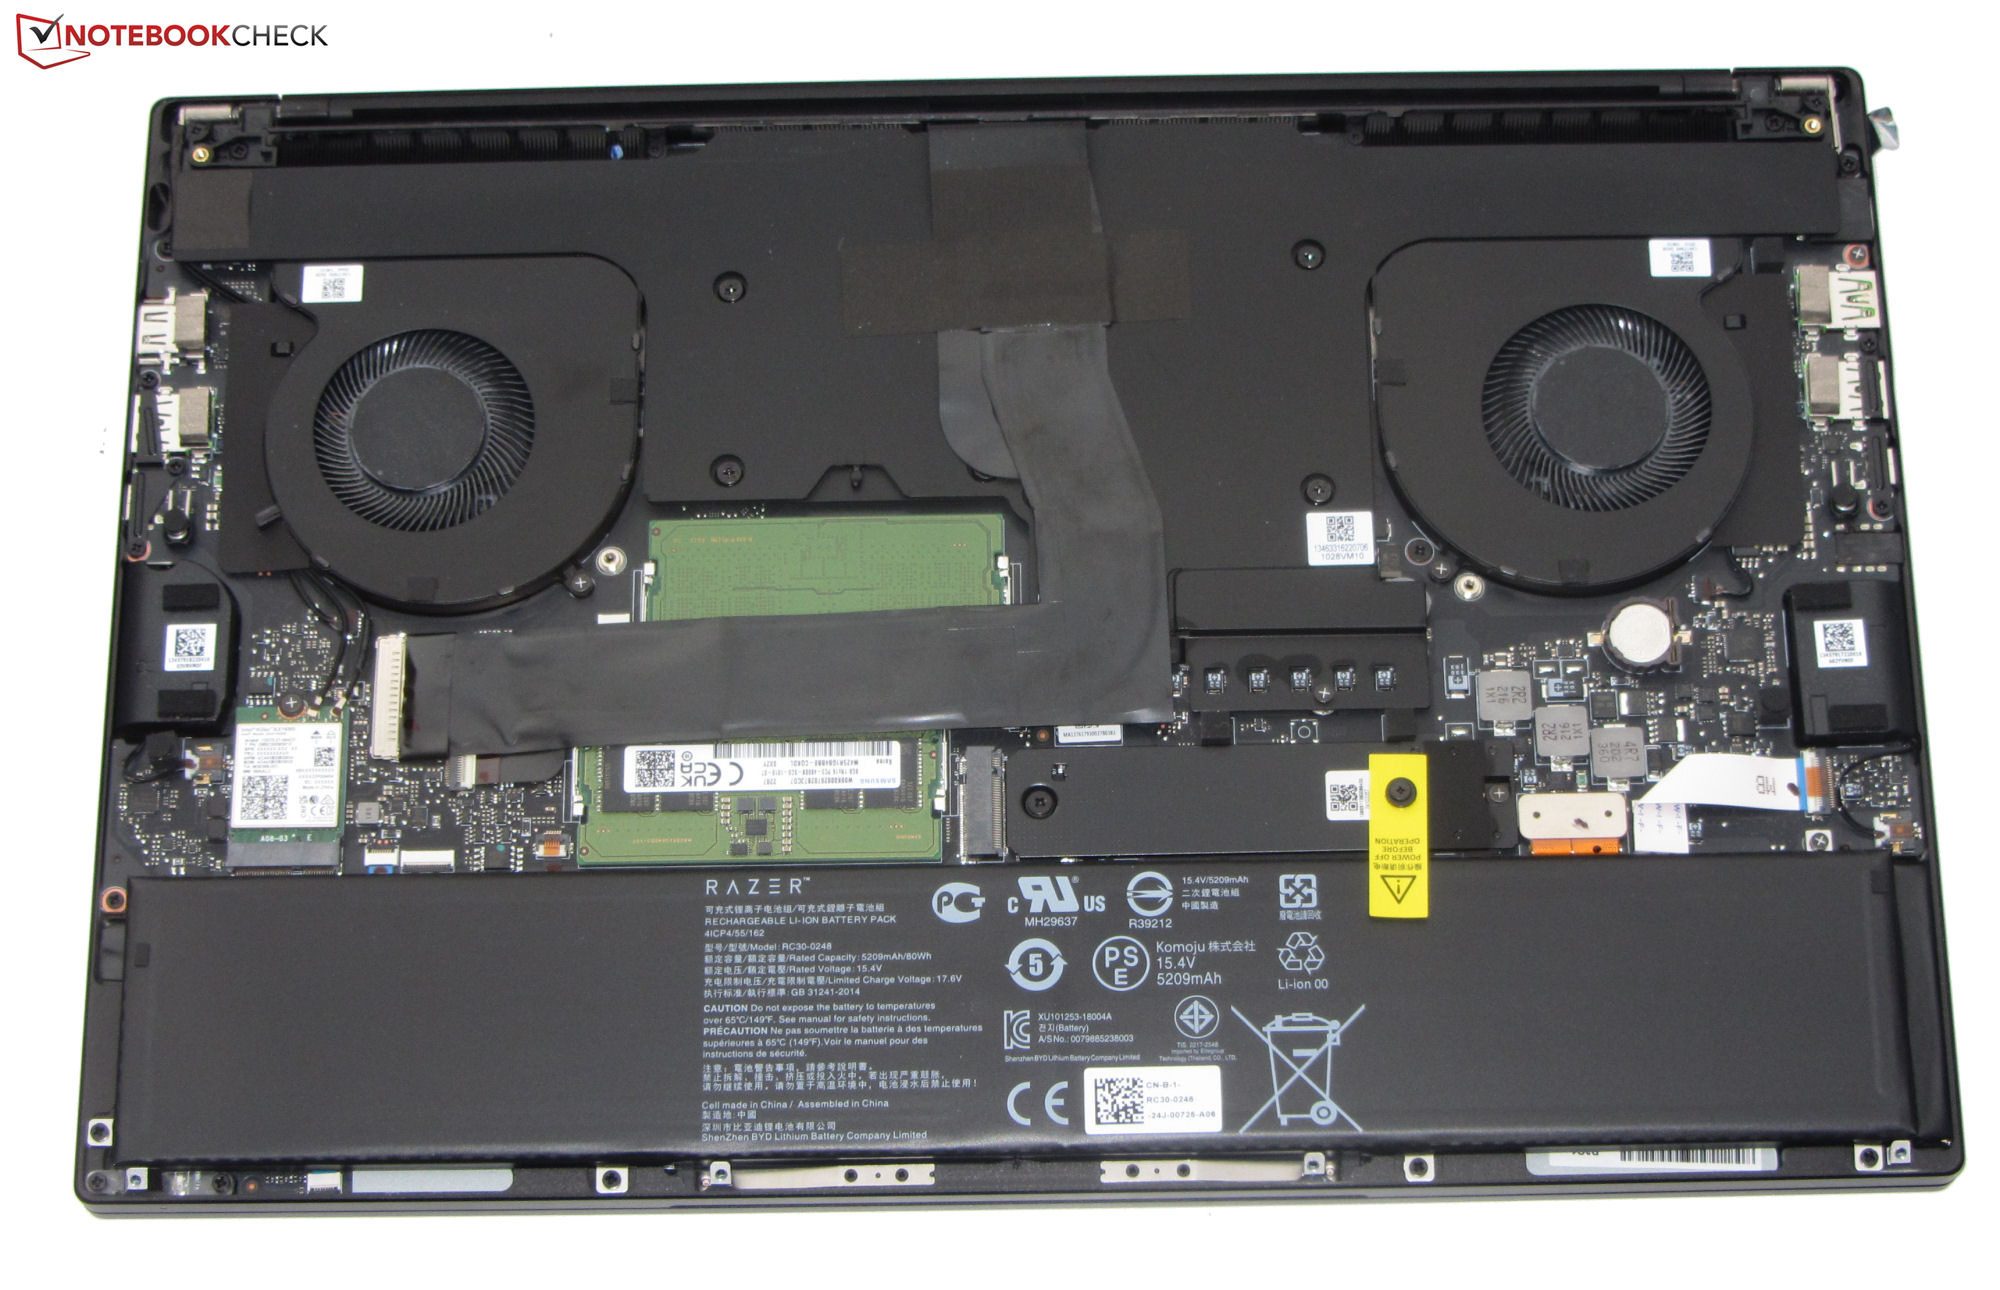
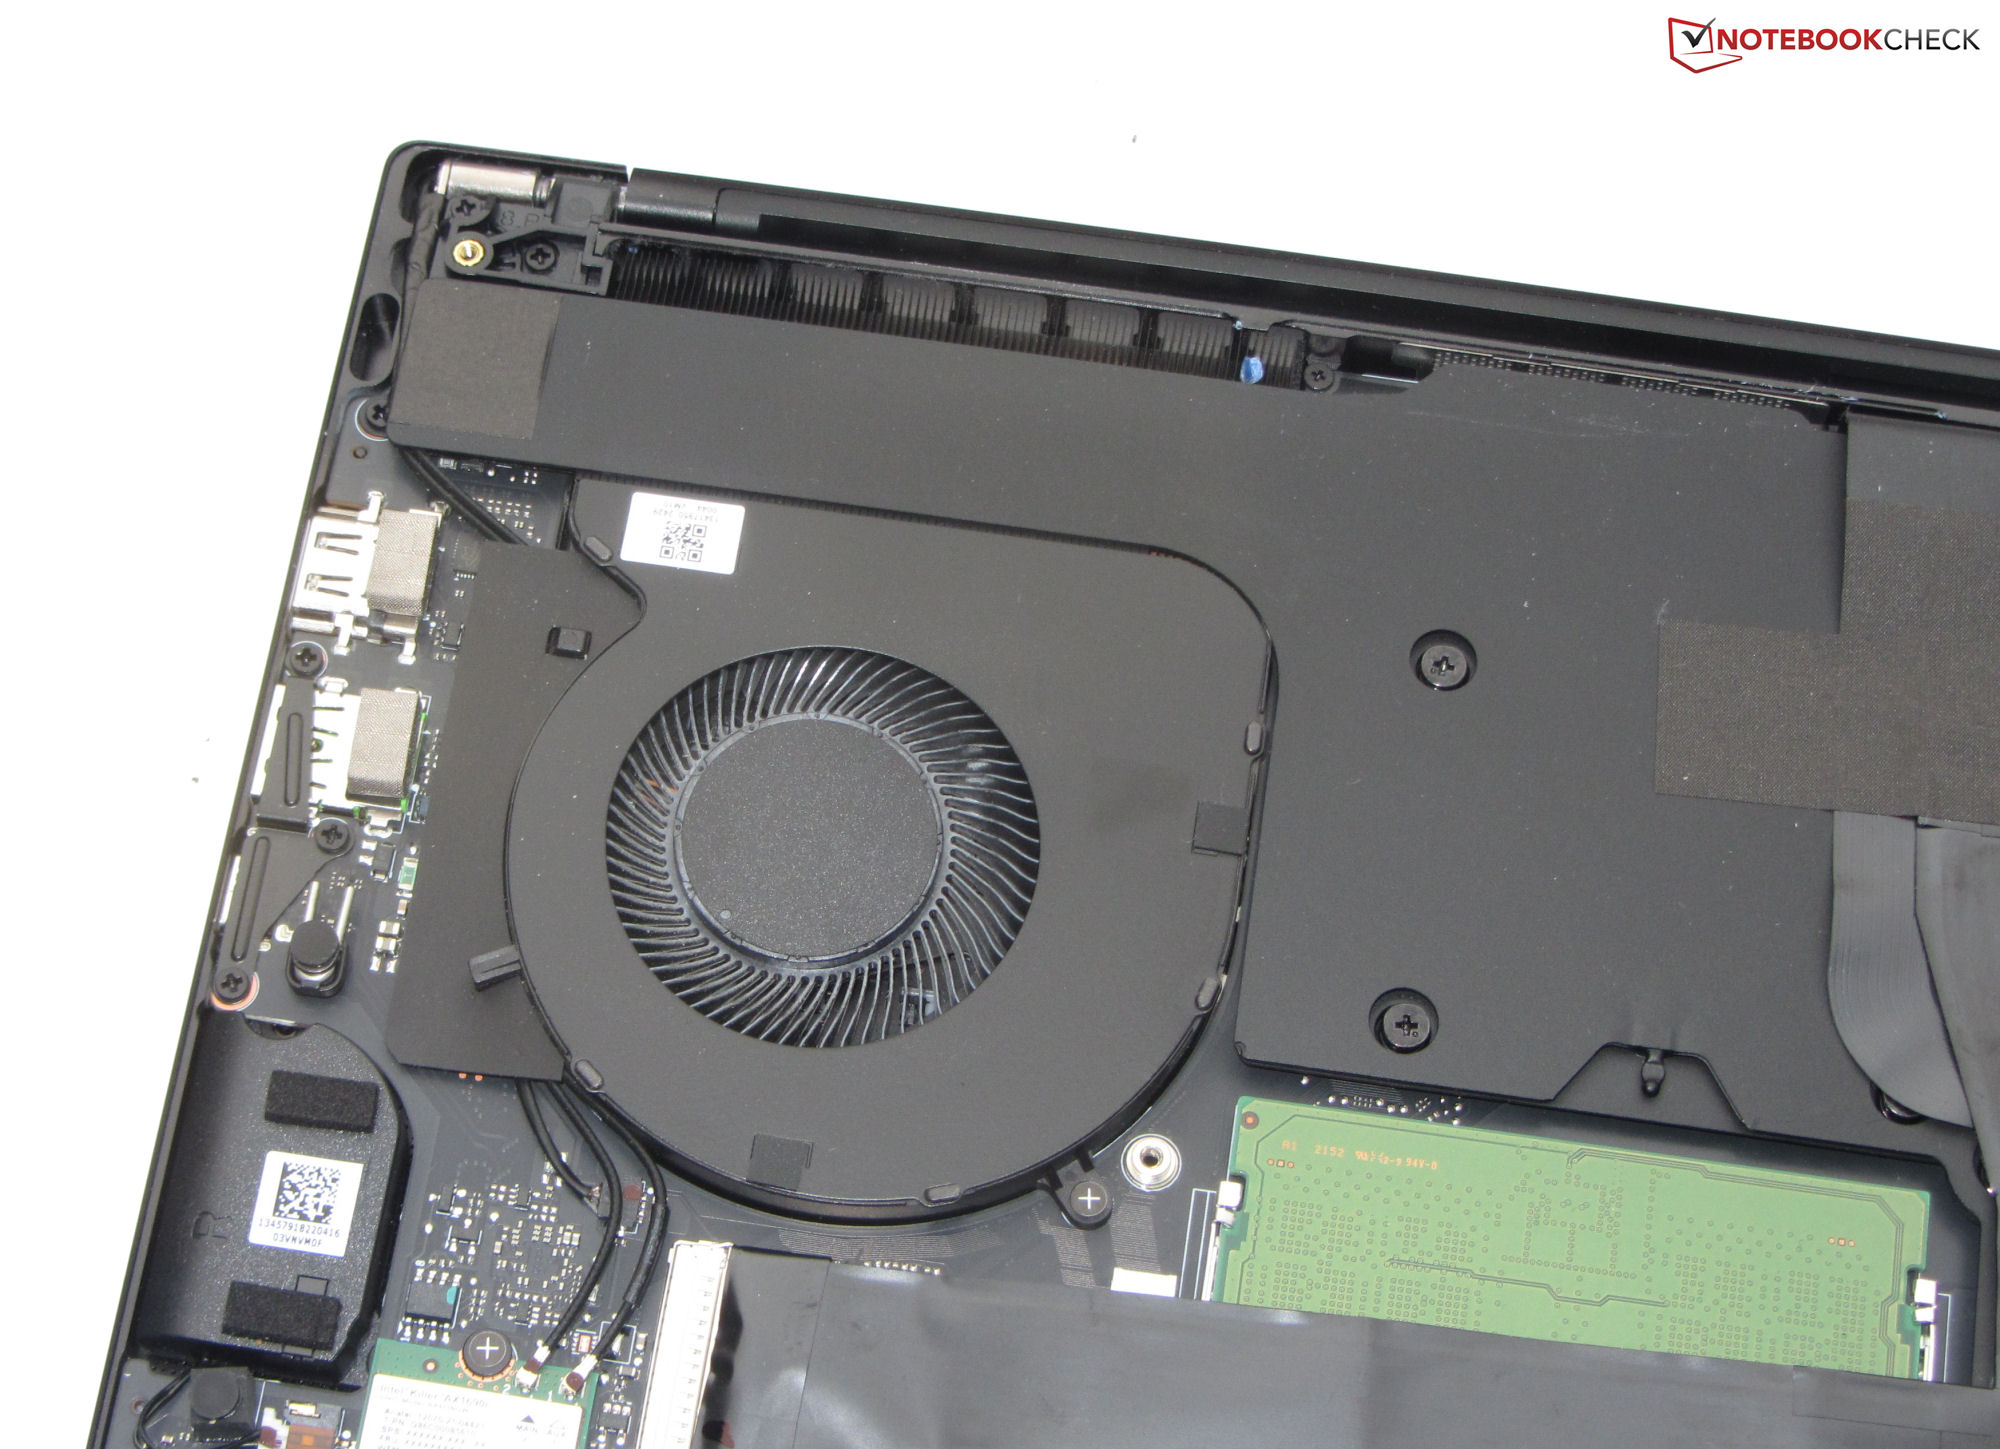
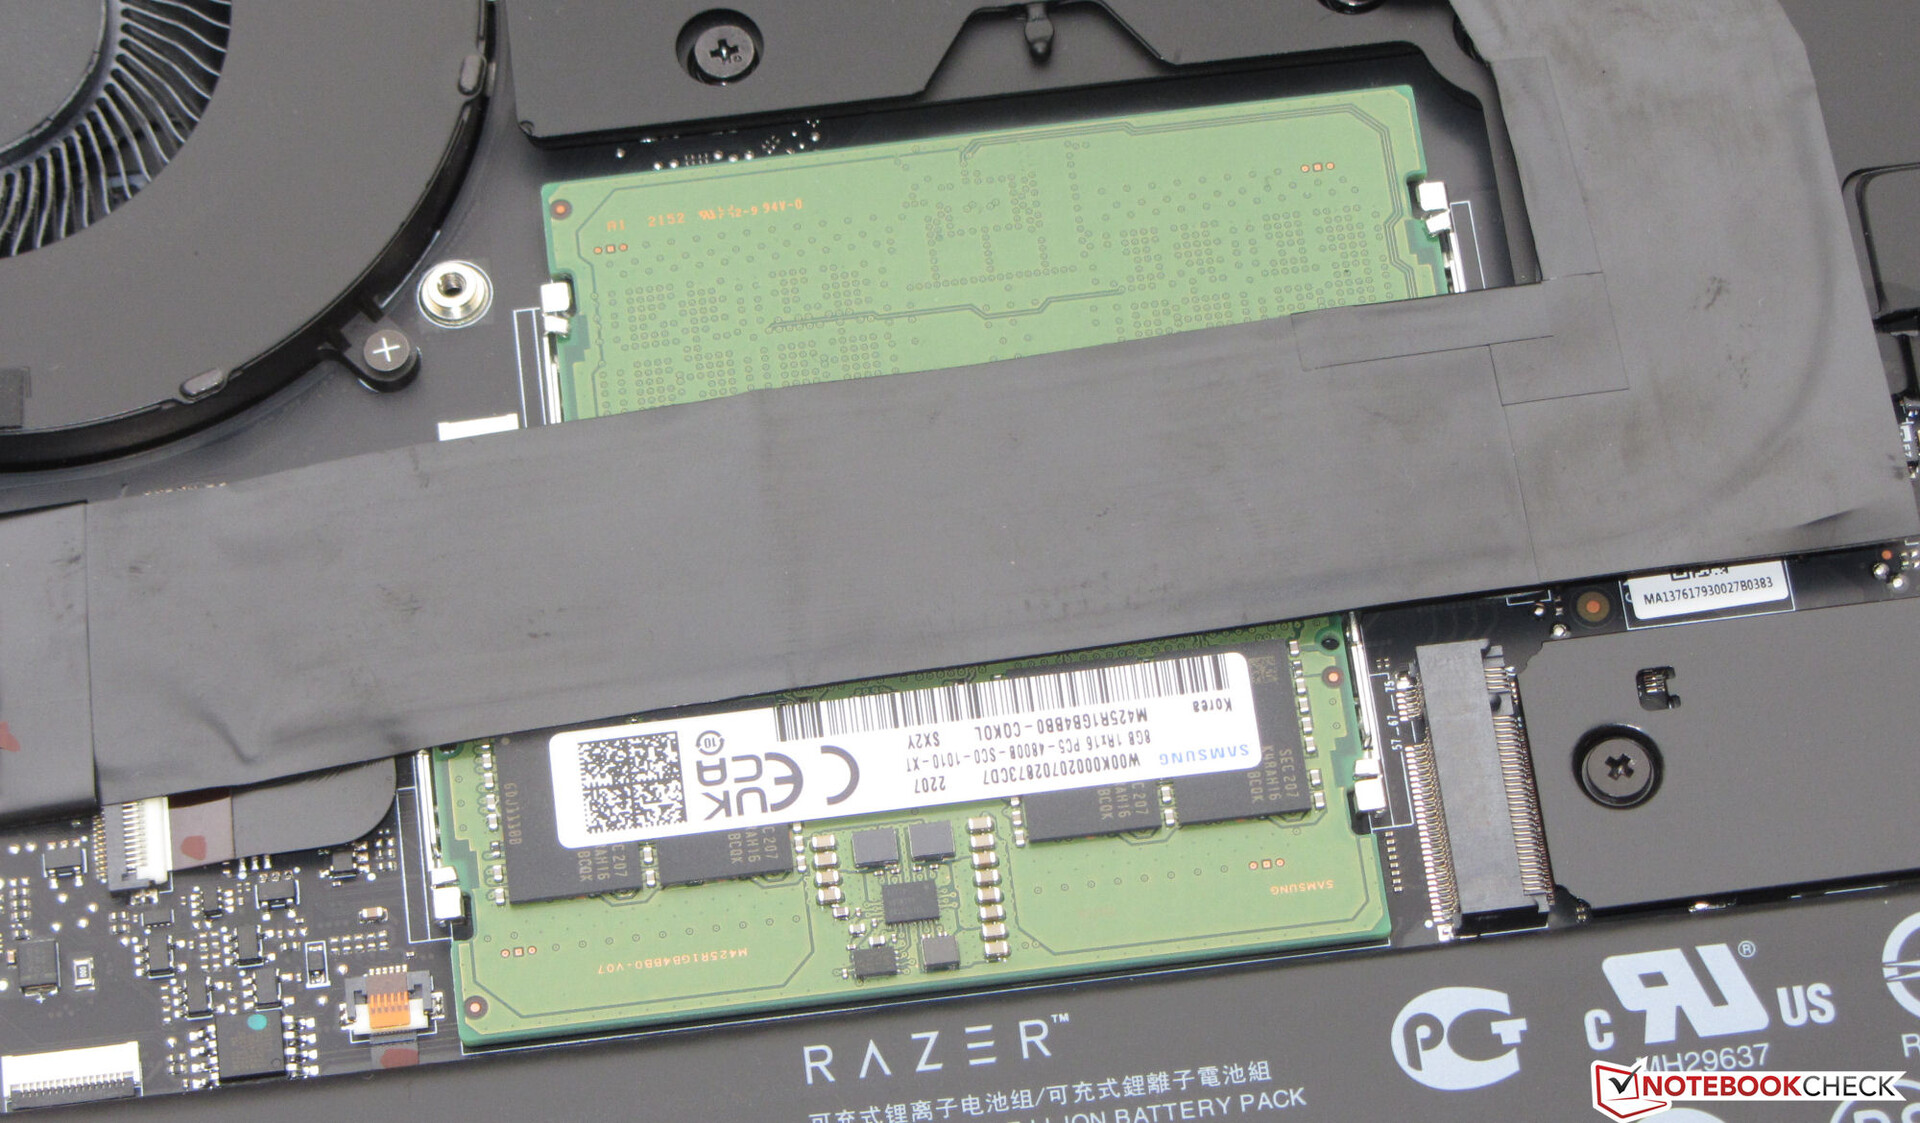
Blade har plats för två PCIe-4 SSD-diskar i M.2 2280-format. Den installerade PCIe-4 SSD:n (1 TB) från Samsung ger mycket bra överföringshastigheter. Nedgångar i prestanda på grund av termisk strypning förekom inte.

* ... mindre är bättre
Continuous Performance Read: DiskSpd Read Loop, Queue Depth 8
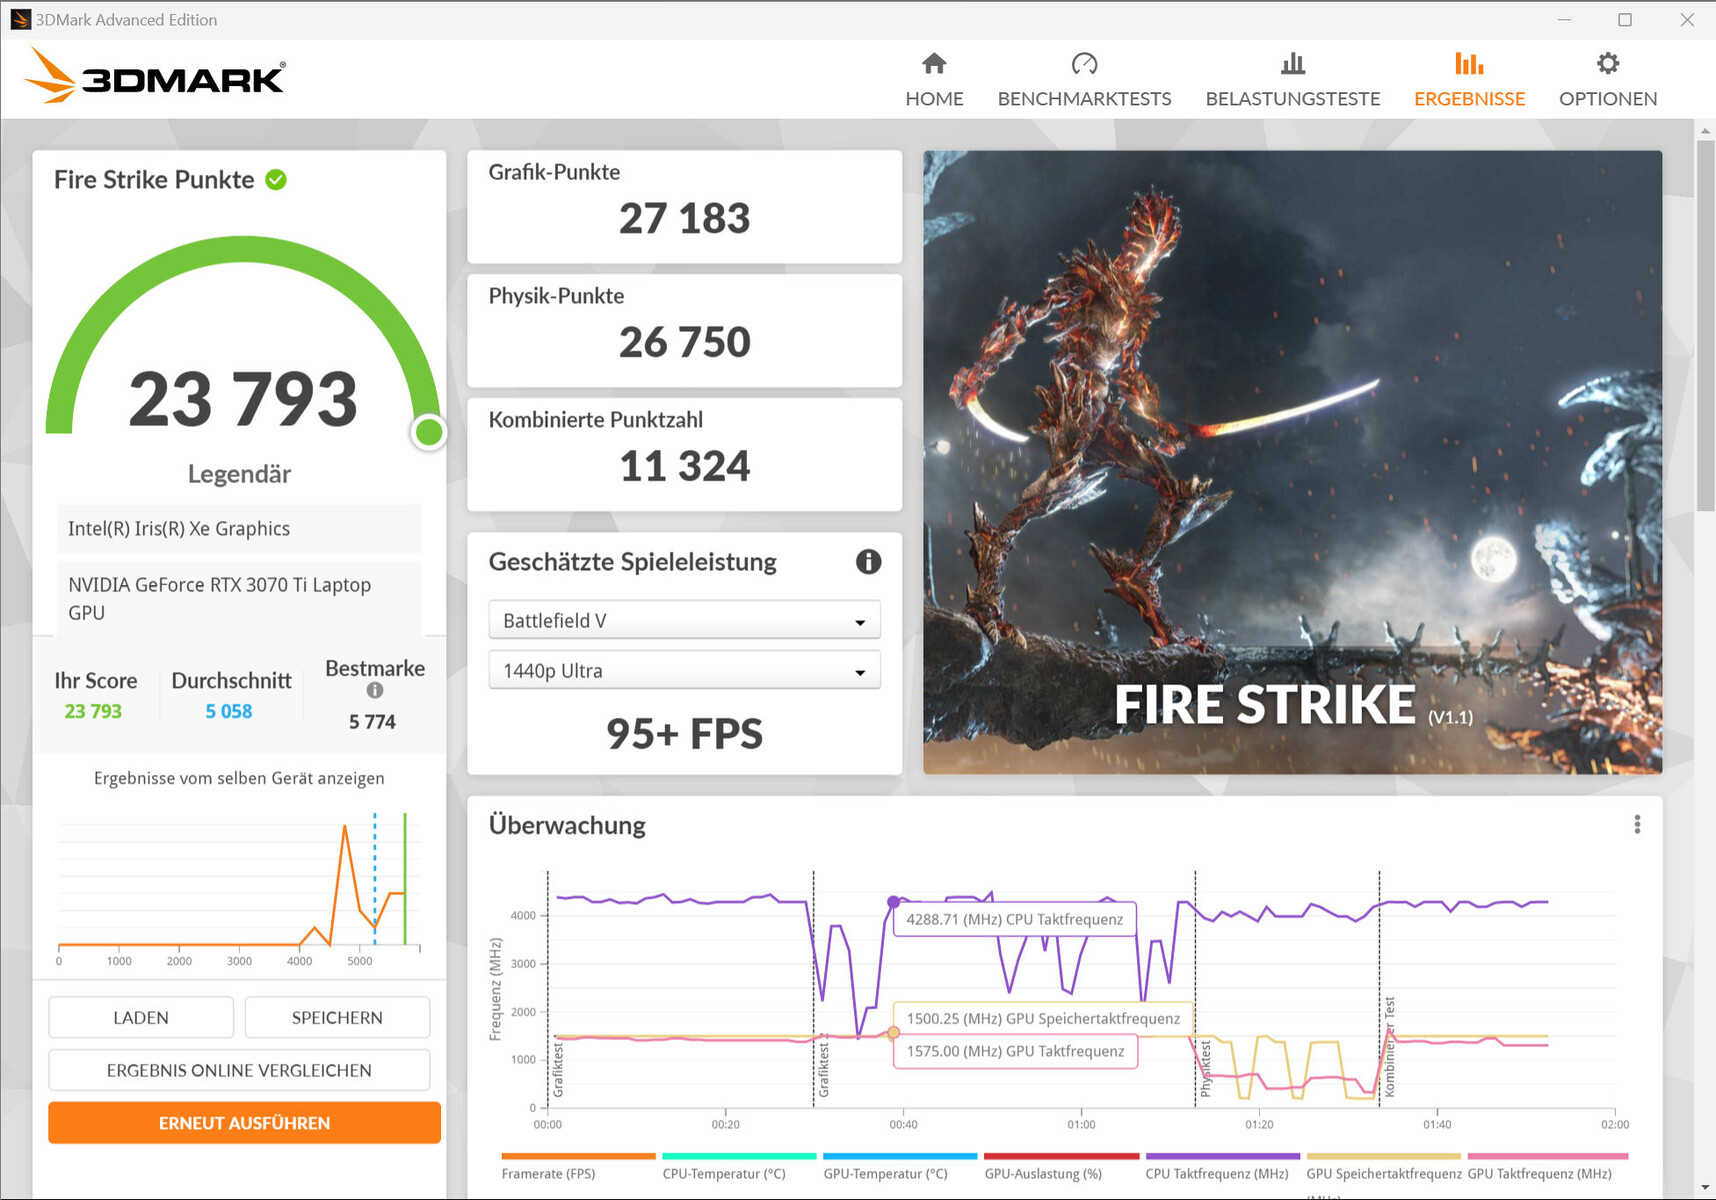
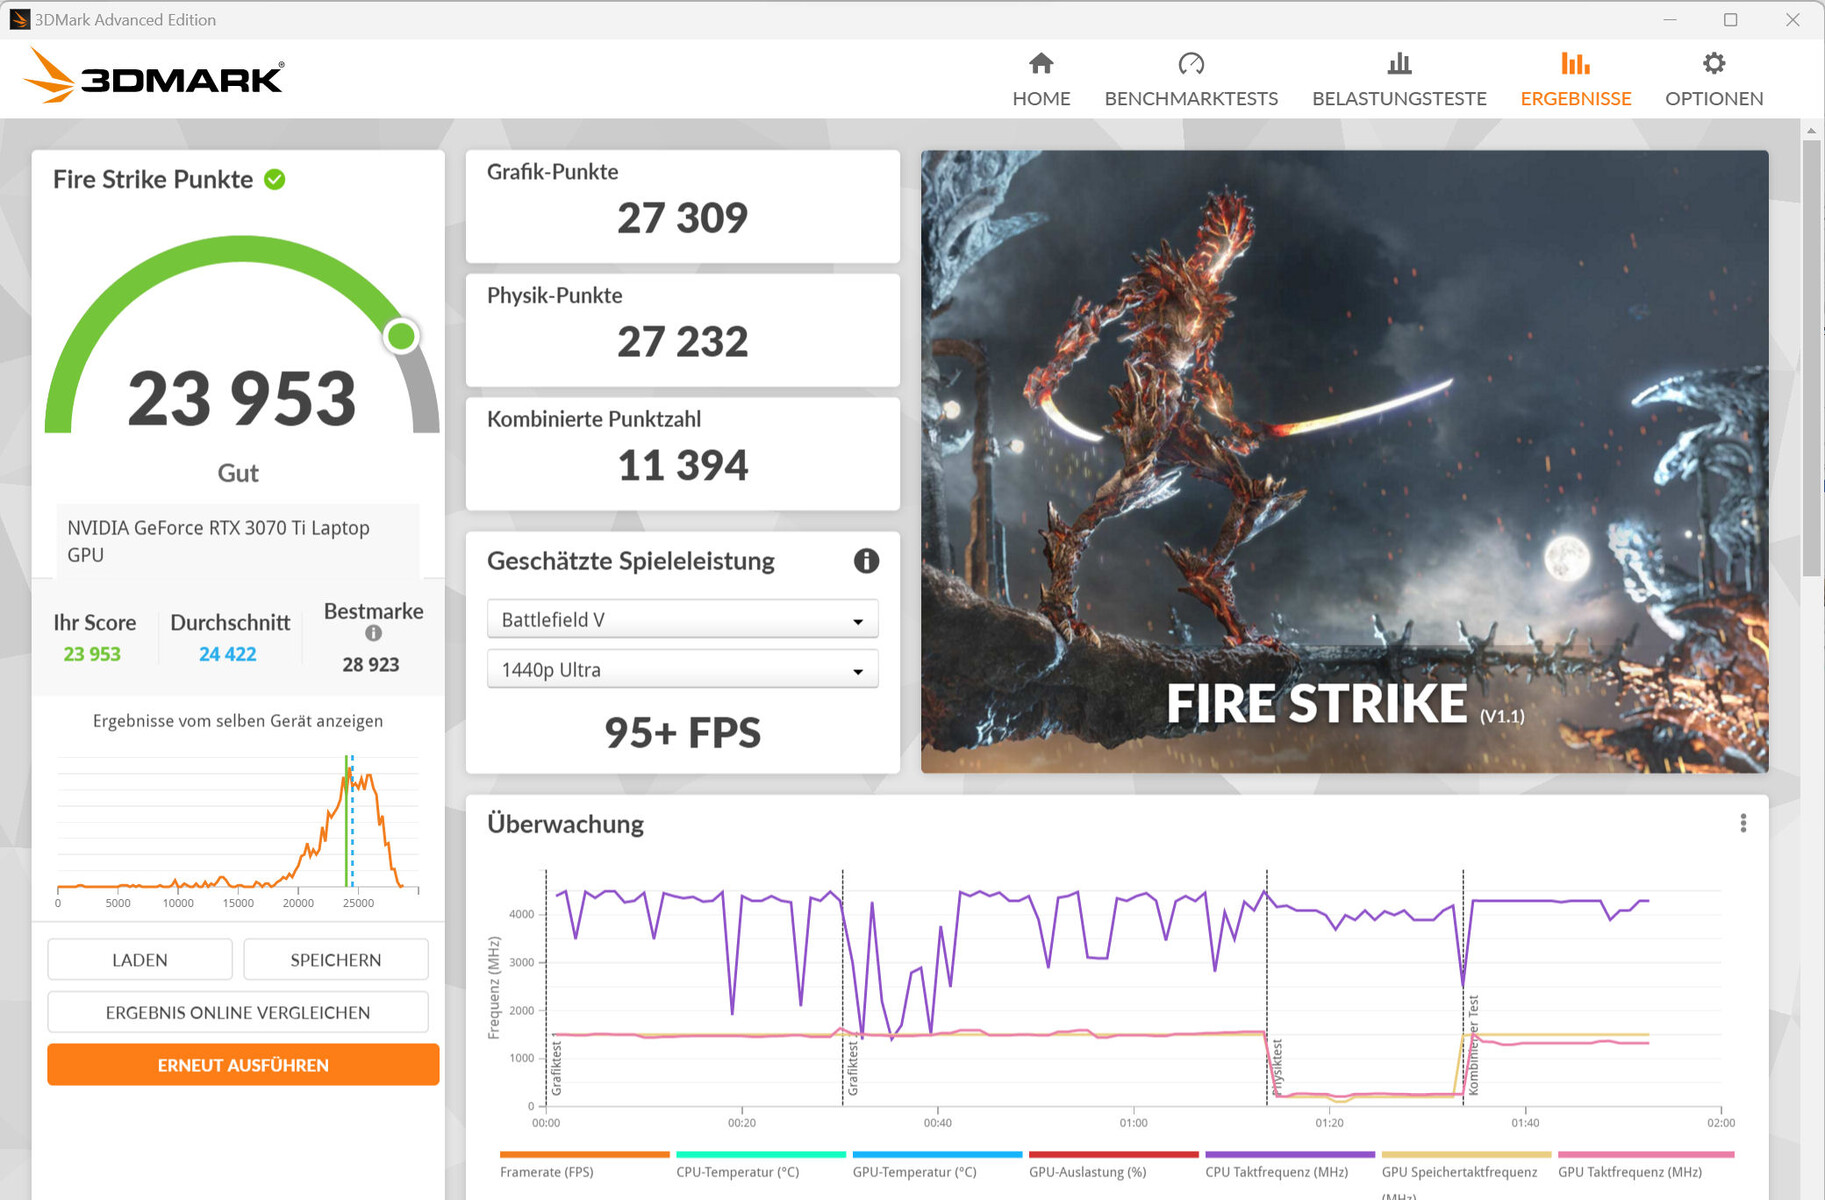
Grafikkort
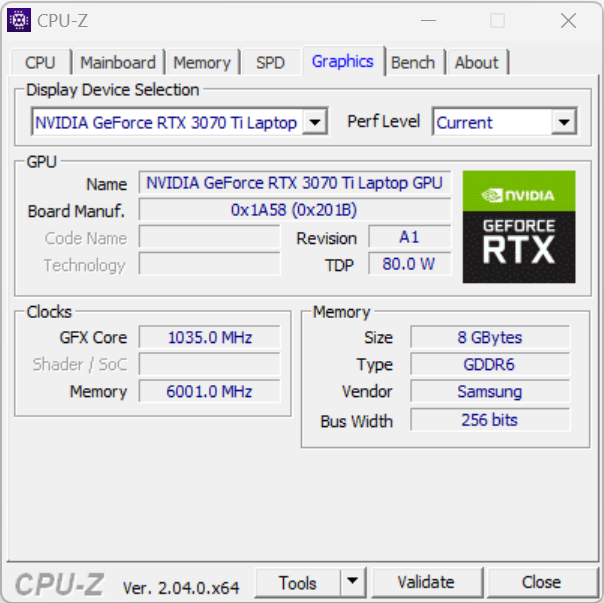
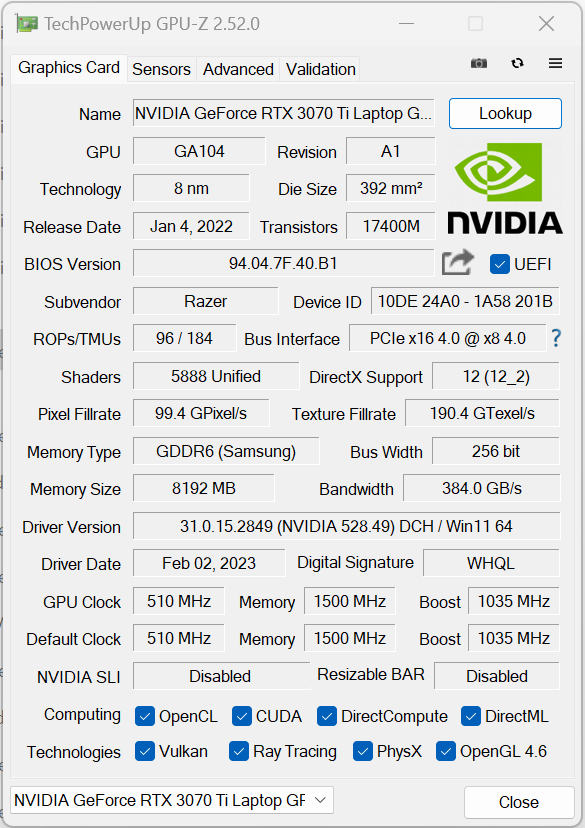
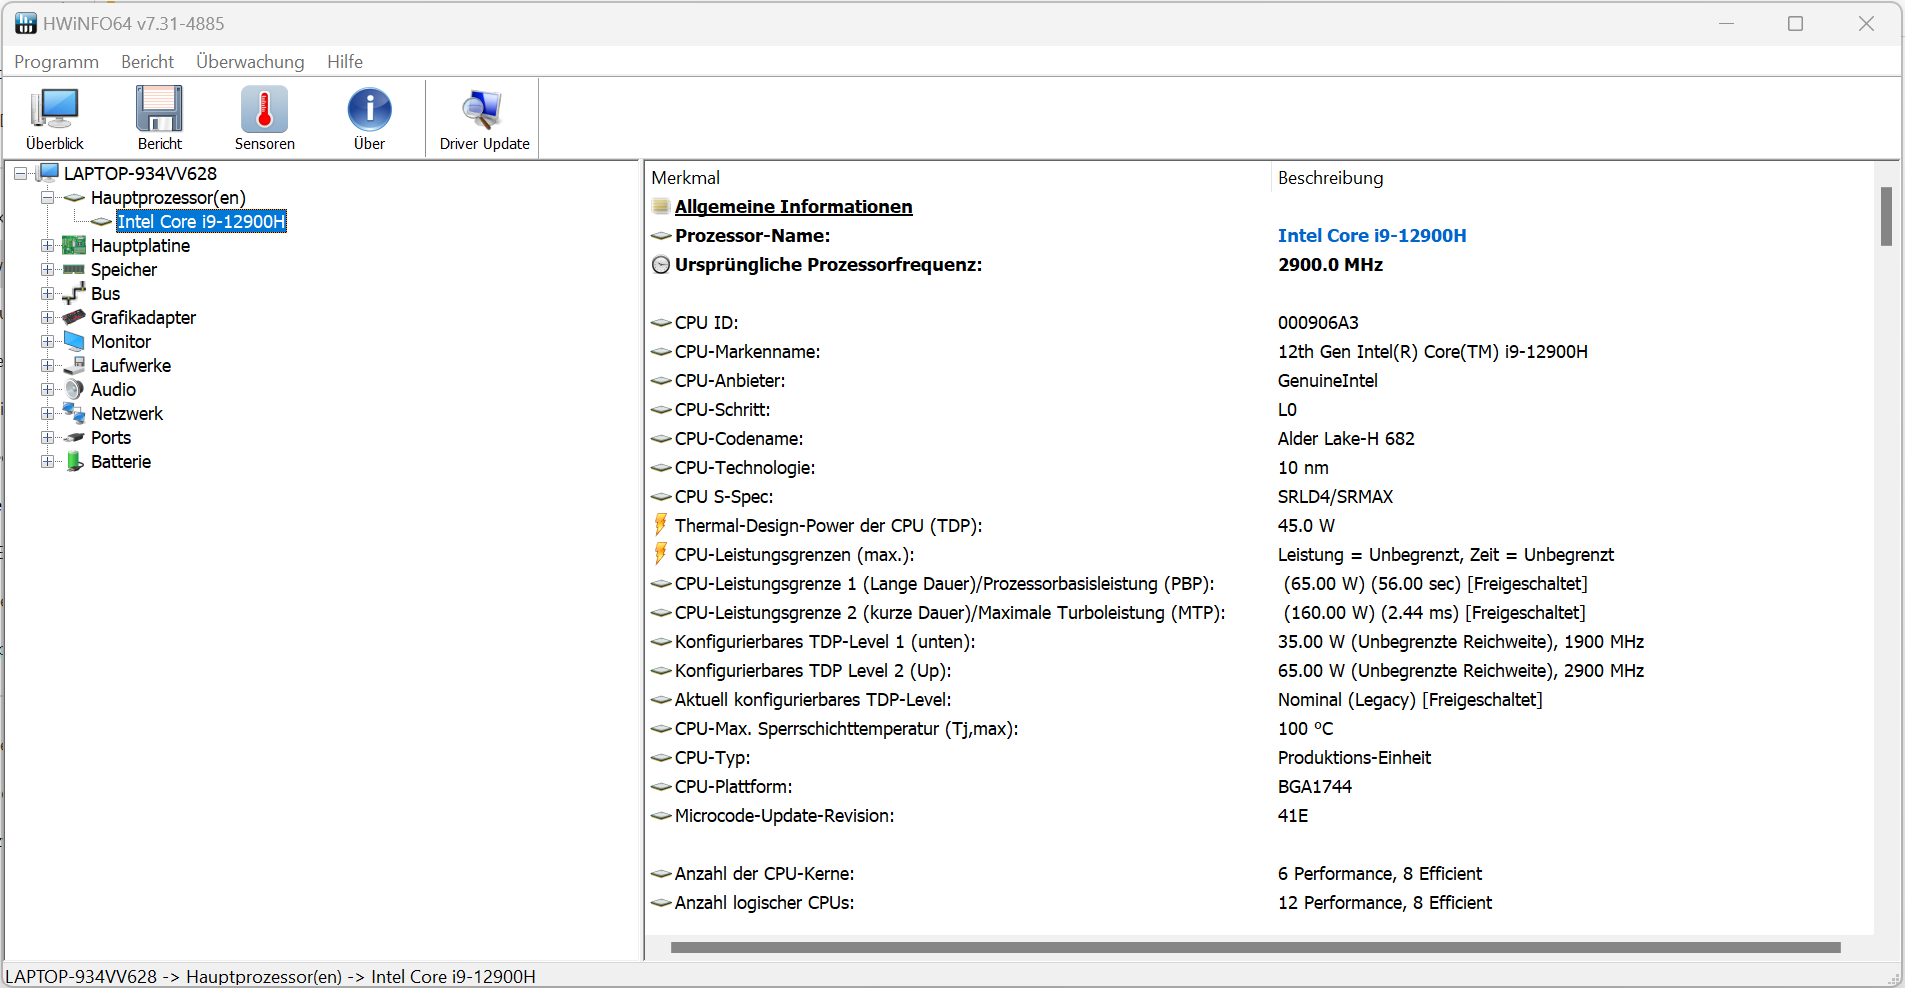
TheGeForce RTX 3070 Ti(VRAM: 8192 MB GDDR6) levererar 3D-Mark-resultat på den genomsnittliga nivå som hittills fastställts för GPU:n och den relativt låga maximala TGP på 110 watt är märkbar. Den direkta bildutgången via GeForce GPU leder till en försumbar ökning av grafikprestandan. Växling mellan Optimus- och dGPU-läge sker direkt i BIOS eller via Razer Synapse-programvaran. Avancerad Optimus stöds inte.


| 3DMark Performance rating - Percent | |
| Genomsnitt av klass Gaming | |
| Razer Blade 15 2022 | |
| Razer Blade 15 OLED (Early 2022) | |
| Razer Blade 15 OLED (Early 2022) | |
| Genomsnitt NVIDIA GeForce RTX 3070 Ti Laptop GPU | |
| HP Omen 16-b1090ng | |
| Aorus 15 XE5 -1! | |
| Asus ROG Zephyrus M16 GU603Z | |
| Schenker XMG Fusion 15 (Mid 22) | |
| 3DMark 11 - 1280x720 Performance GPU | |
| Genomsnitt av klass Gaming (21841 - 80022, n=106, senaste 2 åren) | |
| Razer Blade 15 2022 | |
| Aorus 15 XE5 | |
| Razer Blade 15 OLED (Early 2022) | |
| Genomsnitt NVIDIA GeForce RTX 3070 Ti Laptop GPU (13799 - 42569, n=36) | |
| Razer Blade 15 OLED (Early 2022) (dGPU) | |
| HP Omen 16-b1090ng | |
| Asus ROG Zephyrus M16 GU603Z | |
| Schenker XMG Fusion 15 (Mid 22) | |
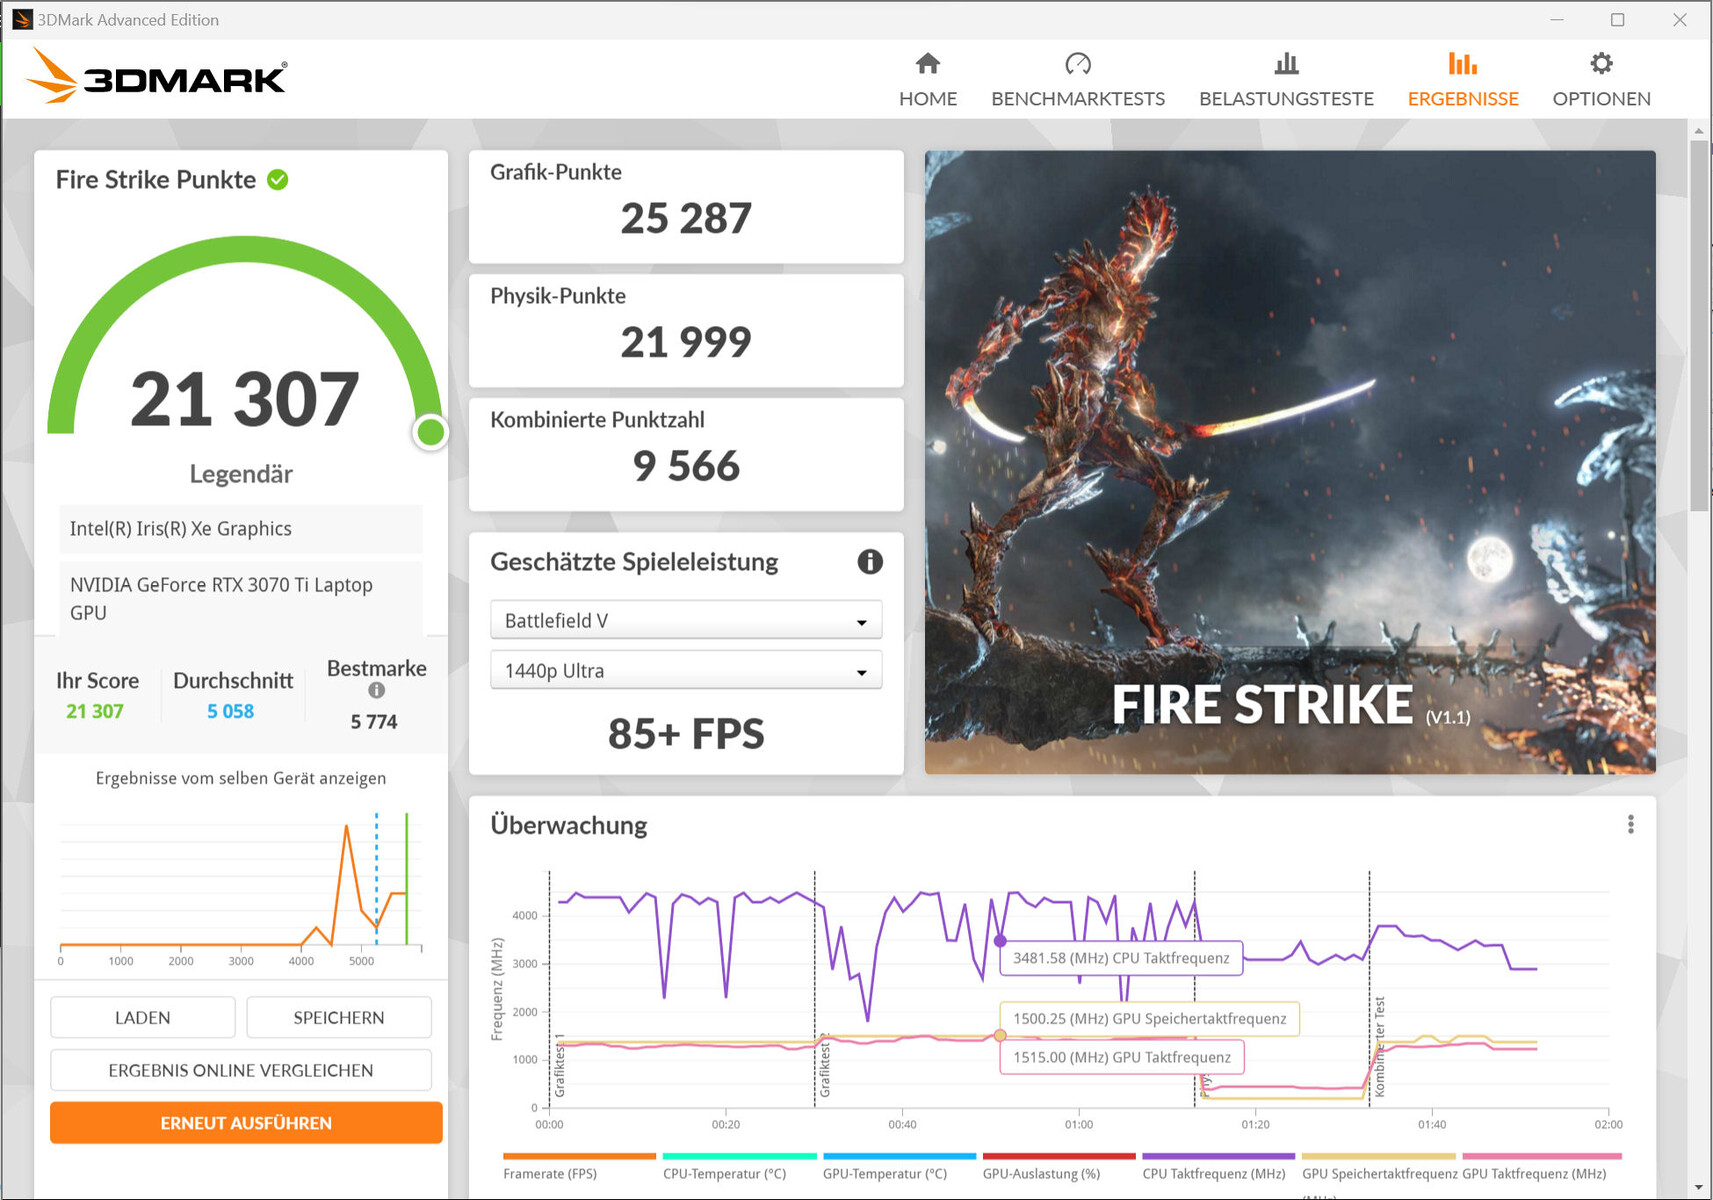
| 3DMark 06 Standard Score | 48871 poäng | |
| 3DMark 11 Performance | 30645 poäng | |
| 3DMark Cloud Gate Standard Score | 59982 poäng | |
| 3DMark Fire Strike Score | 23793 poäng | |
| 3DMark Time Spy Score | 10342 poäng | |
Hjälp | ||
| Blender | |
| v3.3 Classroom OPTIX/RTX | |
| Asus ROG Zephyrus M16 GU603Z (3.3.3) | |
| Razer Blade 15 OLED (Early 2022) (3.3.3) | |
| Razer Blade 15 OLED (Early 2022) (3.3.3, dGPU) | |
| Genomsnitt NVIDIA GeForce RTX 3070 Ti Laptop GPU (22 - 30, n=15) | |
| Aorus 15 XE5 (3.3.0) | |
| Genomsnitt av klass Gaming (9 - 32, n=109, senaste 2 åren) | |
| v3.3 Classroom CUDA | |
| Asus ROG Zephyrus M16 GU603Z (3.3.3) | |
| Razer Blade 15 OLED (Early 2022) (3.3.3) | |
| Razer Blade 15 OLED (Early 2022) (3.3.3, dGPU) | |
| Genomsnitt NVIDIA GeForce RTX 3070 Ti Laptop GPU (36 - 46, n=16) | |
| Aorus 15 XE5 (3.3.0) | |
| Genomsnitt av klass Gaming (15 - 233, n=110, senaste 2 åren) | |
| v3.3 Classroom CPU | |
| Schenker XMG Fusion 15 (Mid 22) | |
| Aorus 15 XE5 (3.3.0) | |
| Razer Blade 15 OLED (Early 2022) (3.3.3, dGPU) | |
| Razer Blade 15 OLED (Early 2022) (3.3.3) | |
| Genomsnitt NVIDIA GeForce RTX 3070 Ti Laptop GPU (285 - 459, n=16) | |
| Asus ROG Zephyrus M16 GU603Z (3.3.3) | |
| Genomsnitt av klass Gaming (122 - 565, n=105, senaste 2 åren) | |
| GPUScore: Sacred Path | |
| 2560x1440 Official VRS | |
| Razer Blade 15 OLED (Early 2022) (0.9.0 Vulkan 1.3) | |
| Razer Blade 15 OLED (Early 2022) (0.9.0 DirectX 12) | |
| Razer Blade 15 OLED (Early 2022) (0.9.0 Vulkan 1.3, dGPU) | |
| Razer Blade 15 OLED (Early 2022) (0.9.0 DirectX 12. dGPU) | |
| Genomsnitt av klass Gaming (13.8 - 330, n=148, senaste 2 åren) | |
| Genomsnitt NVIDIA GeForce RTX 3070 Ti Laptop GPU (17.9 - 134.8, n=4) | |
| 2560x1440 Official | |
| Razer Blade 15 OLED (Early 2022) (0.9.0 Vulkan 1.3, dGPU) | |
| Razer Blade 15 OLED (Early 2022) (0.9.0 DirectX 12, dGPU) | |
| Razer Blade 15 OLED (Early 2022) (0.9.0 Vulkan 1.3) | |
| Razer Blade 15 OLED (Early 2022) (0.9.0 DirectX 12) | |
| Genomsnitt av klass Gaming (11 - 331, n=245, senaste 2 åren) | |
| Asus ROG Zephyrus M16 GU603Z (1.0.0 Vulkan 1.3) | |
| Genomsnitt NVIDIA GeForce RTX 3070 Ti Laptop GPU (17 - 130.6, n=6) | |
| Geekbench 5.5 | |
| OpenCL Score | |
| Genomsnitt av klass Gaming (80702 - 277970, n=104, senaste 2 åren) | |
| Razer Blade 15 2022 | |
| Aorus 15 XE5 | |
| Genomsnitt NVIDIA GeForce RTX 3070 Ti Laptop GPU (100630 - 150471, n=38) | |
| Razer Blade 15 OLED (Early 2022) | |
| Asus ROG Zephyrus M16 GU603Z | |
| Schenker XMG Fusion 15 (Mid 22) | |
| Razer Blade 15 OLED (Early 2022) (dGPU) | |
| HP Omen 16-b1090ng | |
| Vulkan Score 5.5 | |
| Genomsnitt av klass Gaming (9296 - 246759, n=79, senaste 2 åren) | |
| Razer Blade 15 OLED (Early 2022) (dGPU) | |
| Genomsnitt NVIDIA GeForce RTX 3070 Ti Laptop GPU (52594 - 92020, n=10) | |
| Razer Blade 15 2022 | |
| Asus ROG Zephyrus M16 GU603Z | |
| Geekbench 6.0 | |
| GPU Vulkan 6.0 | |
| Genomsnitt av klass Gaming (165793 - 184611, n=2, senaste 2 åren) | |
| Razer Blade 15 OLED (Early 2022) (dGPU) | |
| Genomsnitt NVIDIA GeForce RTX 3070 Ti Laptop GPU (19109 - 96149, n=2) | |
| Razer Blade 15 OLED (Early 2022) | |
| GPU OpenCL 6.0 | |
| Genomsnitt av klass Gaming (155885 - 192027, n=2, senaste 2 åren) | |
| Razer Blade 15 OLED (Early 2022) | |
| Genomsnitt NVIDIA GeForce RTX 3070 Ti Laptop GPU (103225 - 104147, n=2) | |
| Razer Blade 15 OLED (Early 2022) (dGPU) | |
| V-Ray 5 Benchmark | |
| GPU RTX | |
| Genomsnitt av klass Gaming (1146 - 4363, n=34, senaste 2 åren) | |
| Aorus 15 XE5 (5.0.1) | |
| Genomsnitt NVIDIA GeForce RTX 3070 Ti Laptop GPU (1334 - 1847, n=15) | |
| Razer Blade 15 OLED (Early 2022) (5.0.1) | |
| Razer Blade 15 OLED (Early 2022) (5.0.1, dGPU) | |
| Schenker XMG Fusion 15 (Mid 22) (5.0.1) | |
| GPU CUDA | |
| Genomsnitt av klass Gaming (887 - 3288, n=34, senaste 2 åren) | |
| Aorus 15 XE5 (5.0.1) | |
| Genomsnitt NVIDIA GeForce RTX 3070 Ti Laptop GPU (1062 - 1391, n=14) | |
| Razer Blade 15 OLED (Early 2022) (5.0.1) | |
| Razer Blade 15 OLED (Early 2022) (5.0.1, dGPU) | |
| Schenker XMG Fusion 15 (Mid 22) (5.0.1) | |
| CPU | |
| Genomsnitt av klass Gaming (5864 - 30302, n=33, senaste 2 åren) | |
| Razer Blade 15 OLED (Early 2022) (5.0.1, dGPU) | |
| Razer Blade 15 OLED (Early 2022) (5.0.1) | |
| Razer Blade 15 2022 (5.0.1) | |
| Genomsnitt NVIDIA GeForce RTX 3070 Ti Laptop GPU (2880 - 11931, n=20) | |
| Aorus 15 XE5 (5.0.1) | |
| Schenker XMG Fusion 15 (Mid 22) (5.0.1) | |
| V-Ray Benchmark Next 4.10 | |
| GPU | |
| Genomsnitt av klass Gaming (427 - 1627, n=103, senaste 2 åren) | |
| Aorus 15 XE5 (v4.10.07 ) | |
| Genomsnitt NVIDIA GeForce RTX 3070 Ti Laptop GPU (277 - 559, n=33) | |
| Schenker XMG Fusion 15 (Mid 22) (v4.10.07 ) | |
| Razer Blade 15 OLED (Early 2022) (v4.10.07 ) | |
| Razer Blade 15 OLED (Early 2022) (v4.10.07, dGPU) | |
| HP Omen 16-b1090ng (v4.10.07 ) | |
| Asus ROG Zephyrus M16 GU603Z (v4.10.07 ) | |
| CPU | |
| Genomsnitt av klass Gaming (10048 - 45327, n=101, senaste 2 åren) | |
| HP Omen 16-b1090ng (v4.10.07 ) | |
| Razer Blade 15 OLED (Early 2022) (v4.10.07, dGPU) | |
| Asus ROG Zephyrus M16 GU603Z (v4.10.07 ) | |
| Razer Blade 15 OLED (Early 2022) (v4.10.07 ) | |
| Genomsnitt NVIDIA GeForce RTX 3070 Ti Laptop GPU (4722 - 19786, n=33) | |
| Aorus 15 XE5 (v4.10.07 ) | |
| Schenker XMG Fusion 15 (Mid 22) (v4.10.07 ) | |
* ... mindre är bättre
Spelprestanda
Den bärbara datorn är utformad för QHD-spel med höga till maximala inställningar. Högre upplösningar är möjliga genom att ansluta till en lämplig bildskärm - om än med ibland reducerade inställningar. Bildfrekvensen i de testade titlarna ligger på en nivå som är typisk för det bestämda RTX 3070 Ti-genomsnittet. Den direkta bildutgången via GeForce GPU kan - beroende på spel - leda till en minimal ökning av bildfrekvensen.
| Performance rating - Percent | |
| Genomsnitt av klass Gaming | |
| Razer Blade 15 2022 | |
| Aorus 15 XE5 | |
| Asus ROG Zephyrus M16 GU603Z | |
| HP Omen 16-b1090ng | |
| Razer Blade 15 OLED (Early 2022) | |
| Genomsnitt NVIDIA GeForce RTX 3070 Ti Laptop GPU | |
| Razer Blade 15 OLED (Early 2022) | |
| Schenker XMG Fusion 15 (Mid 22) | |
| The Witcher 3 - 1920x1080 Ultra Graphics & Postprocessing (HBAO+) | |
| Genomsnitt av klass Gaming (95 - 240, n=7, senaste 2 åren) | |
| Razer Blade 15 2022 | |
| Genomsnitt NVIDIA GeForce RTX 3070 Ti Laptop GPU (76.8 - 124.1, n=39) | |
| Aorus 15 XE5 | |
| Asus ROG Zephyrus M16 GU603Z | |
| HP Omen 16-b1090ng | |
| Razer Blade 15 OLED (Early 2022) (dGPU) | |
| Razer Blade 15 OLED (Early 2022) | |
| Schenker XMG Fusion 15 (Mid 22) | |
| GTA V - 1920x1080 Highest AA:4xMSAA + FX AF:16x | |
| Genomsnitt av klass Gaming (48.3 - 186.9, n=97, senaste 2 åren) | |
| Razer Blade 15 2022 | |
| Aorus 15 XE5 | |
| Razer Blade 15 OLED (Early 2022) (dGPU) | |
| Razer Blade 15 OLED (Early 2022) | |
| HP Omen 16-b1090ng | |
| Asus ROG Zephyrus M16 GU603Z | |
| Genomsnitt NVIDIA GeForce RTX 3070 Ti Laptop GPU (44 - 123.9, n=36) | |
| Schenker XMG Fusion 15 (Mid 22) | |
| Final Fantasy XV Benchmark - 1920x1080 High Quality | |
| Genomsnitt av klass Gaming (41 - 215, n=98, senaste 2 åren) | |
| Razer Blade 15 2022 (1.3) | |
| Aorus 15 XE5 (1.3) | |
| Razer Blade 15 OLED (Early 2022) (1.3, dGPU) | |
| Razer Blade 15 OLED (Early 2022) (1.3) | |
| HP Omen 16-b1090ng | |
| Genomsnitt NVIDIA GeForce RTX 3070 Ti Laptop GPU (49.5 - 122.4, n=35) | |
| Asus ROG Zephyrus M16 GU603Z (1.3) | |
| Schenker XMG Fusion 15 (Mid 22) (1.3) | |
| Strange Brigade - 1920x1080 ultra AA:ultra AF:16 | |
| Genomsnitt av klass Gaming (76.3 - 456, n=88, senaste 2 åren) | |
| Aorus 15 XE5 (1.47.22.14 D3D12) | |
| Razer Blade 15 2022 (1.47.22.14 D3D12) | |
| Genomsnitt NVIDIA GeForce RTX 3070 Ti Laptop GPU (109 - 221, n=37) | |
| Razer Blade 15 OLED (Early 2022) (1.47.22.14 D3D12, dGPU) | |
| Razer Blade 15 OLED (Early 2022) (1.47.22.14 D3D12) | |
| Schenker XMG Fusion 15 (Mid 22) (1.47.22.14 D3D12) | |
| Asus ROG Zephyrus M16 GU603Z (1.47.22.14 D3D12) | |
| HP Omen 16-b1090ng (1.47.22.14 D3D12) | |
| Dota 2 Reborn - 1920x1080 ultra (3/3) best looking | |
| Asus ROG Zephyrus M16 GU603Z | |
| Razer Blade 15 2022 | |
| Genomsnitt av klass Gaming (84.8 - 248, n=110, senaste 2 åren) | |
| HP Omen 16-b1090ng | |
| Aorus 15 XE5 | |
| Genomsnitt NVIDIA GeForce RTX 3070 Ti Laptop GPU (68.7 - 160.5, n=38) | |
| Razer Blade 15 OLED (Early 2022) (dGPU) | |
| Razer Blade 15 OLED (Early 2022) | |
| Schenker XMG Fusion 15 (Mid 22) | |
| X-Plane 11.11 - 1920x1080 high (fps_test=3) | |
| Asus ROG Zephyrus M16 GU603Z | |
| HP Omen 16-b1090ng | |
| Razer Blade 15 2022 | |
| Aorus 15 XE5 | |
| Razer Blade 15 OLED (Early 2022) (dGPU) | |
| Genomsnitt av klass Gaming (52.1 - 143.5, n=113, senaste 2 åren) | |
| Genomsnitt NVIDIA GeForce RTX 3070 Ti Laptop GPU (51.6 - 116.9, n=37) | |
| Razer Blade 15 OLED (Early 2022) | |
| Schenker XMG Fusion 15 (Mid 22) | |
För att kontrollera om bildfrekvensen förblir stabil under längre perioder körde vi spelet "The Witcher 3" i ungefär 60 minuter med Full HD-upplösning och maximala kvalitetsinställningar. Spelkaraktären flyttades inte och det fanns ingen märkbar minskning av bildfrekvensen.
Witcher 3 FPS Diagram

| låg | med. | hög | ultra | QHD | |
|---|---|---|---|---|---|
| GTA V (2015) | 182.7 | 177.2 | 172.8 | 113 | 94.3 |
| The Witcher 3 (2015) | 365.8 | 288.5 | 176.6 | 96.4 | |
| Dota 2 Reborn (2015) | 162 | 148.2 | 143.4 | 133 | |
| Final Fantasy XV Benchmark (2018) | 174.2 | 133.3 | 100.3 | 75.1 | |
| X-Plane 11.11 (2018) | 133.3 | 121.6 | 95 | ||
| Far Cry 5 (2018) | 170 | 141 | 135 | 126 | 100 |
| Strange Brigade (2018) | 351 | 240 | 197.2 | 173.4 | 130.9 |
| Flight Simulator 2020 (2020) | 124.8 | 97.8 | 70.2 | 52.2 | 41.3 |
| F1 22 (2022) | 203 | 202 | 173.1 | 65.2 | 42.3 |
| FIFA 23 (2022) | 104.3 | ||||
| A Plague Tale Requiem (2022) | 101.6 | 84 | 73.3 | 62.9 | 50.5 |
| Uncharted Legacy of Thieves Collection (2022) | 78 | 75.2 | 71.8 | 69.3 | 56.2 |
| Call of Duty Modern Warfare 2 2022 (2022) | 126 | 112 | 89 | 85 | 63 |
| Spider-Man Miles Morales (2022) | 107 | 102.6 | 94.9 | 93.2 | 69.6 |
| The Callisto Protocol (2022) | 117 | 99.3 | 71 | 70.7 | 52.8 |
| Need for Speed Unbound (2022) | 112.8 | 106.9 | 93 | 84.6 | 66.7 |
| High On Life (2023) | 175.7 | 139.4 | 117.5 | 97.1 | 60.8 |
| The Witcher 3 v4 (2023) | 174.4 | 149.6 | 81.3 | 71.4 | 47.4 |
| Dead Space Remake (2023) | 82.1 | 74.6 | 68.1 | 66.8 | 47.2 |
| Hogwarts Legacy (2023) | 88.5 | 79 | 69.7 | 59.3 | 42.6 |
Utsläpp - Razers bärbara dator värms inte upp överdrivet mycket
Bullerutsläpp
På det hela taget är ljudnivåerna måttliga för en bärbar dator för spel. Vid tomgång och daglig användning (kontor och internet) går fläktarna på låg hastighet och är praktiskt taget ohörbara. Vid full belastning (stresstest, Witcher 3 test) kan ljudtrycksnivåerna stiga till 43,9 dB (A). Prestandaprofilen "Silent" gör inte vad namnet antyder, men den lyckas sänka bakgrundsljudet - på bekostnad av beräkningskraften.
Ljudnivå
| Låg belastning |
| 28 / 28 / 28 dB(A) |
| Hög belastning |
| 38.5 / 43.9 dB(A) |
 | ||
30 dB tyst 40 dB(A) hörbar 50 dB(A) högt ljud |
||
min: | ||
| Razer Blade 15 OLED (Early 2022) GeForce RTX 3070 Ti Laptop GPU, i9-12900H, Samsung PM9A1 MZVL21T0HCLR | Asus ROG Zephyrus M16 GU603Z GeForce RTX 3070 Ti Laptop GPU, i9-12900H, Micron 3400 1TB MTFDKBA1T0TFH | Aorus 15 XE5 GeForce RTX 3070 Ti Laptop GPU, i7-12700H, Gigabyte AG470S1TB-SI B10 | Schenker XMG Fusion 15 (Mid 22) GeForce RTX 3070 Laptop GPU, i7-11800H, Samsung SSD 980 Pro 1TB MZ-V8P1T0BW | HP Omen 16-b1090ng GeForce RTX 3070 Ti Laptop GPU, i7-12700H, WDC PC SN810 1TB | Razer Blade 15 2022 GeForce RTX 3080 Ti Laptop GPU, i7-12800H, SSSTC CA6-8D1024 | |
|---|---|---|---|---|---|---|
| Noise | -10% | -6% | -5% | -16% | -4% | |
| av / miljö * (dB) | 26 | 23 12% | 24 8% | 26 -0% | 26 -0% | 25.4 2% |
| Idle Minimum * (dB) | 28 | 23 18% | 26 7% | 26 7% | 30 -7% | 26.2 6% |
| Idle Average * (dB) | 28 | 24 14% | 28 -0% | 28 -0% | 31 -11% | 26.2 6% |
| Idle Maximum * (dB) | 28 | 47 -68% | 30 -7% | 31 -11% | 33 -18% | 28.4 -1% |
| Load Average * (dB) | 38.5 | 47.91 -24% | 48 -25% | 45 -17% | 49 -27% | 44.7 -16% |
| Load Maximum * (dB) | 43.9 | 50.25 -14% | 52 -18% | 48 -9% | 57 -30% | 51.9 -18% |
| Witcher 3 ultra * (dB) | 48.91 | 52 | 46 | 53 | 44.7 |
* ... mindre är bättre
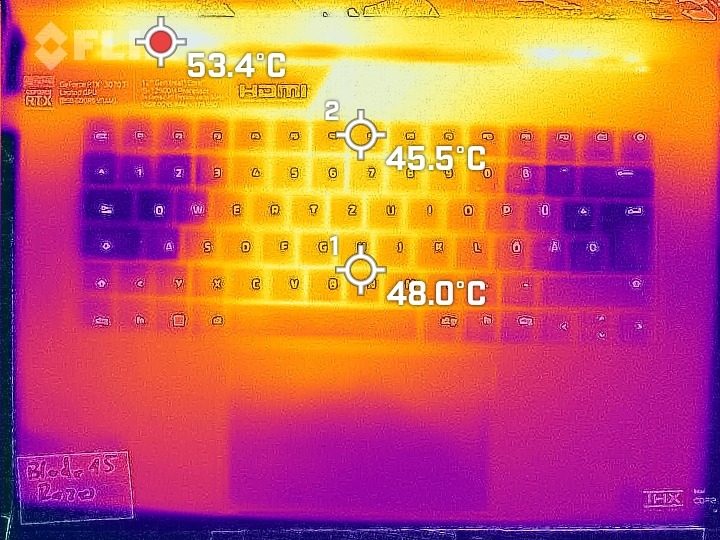
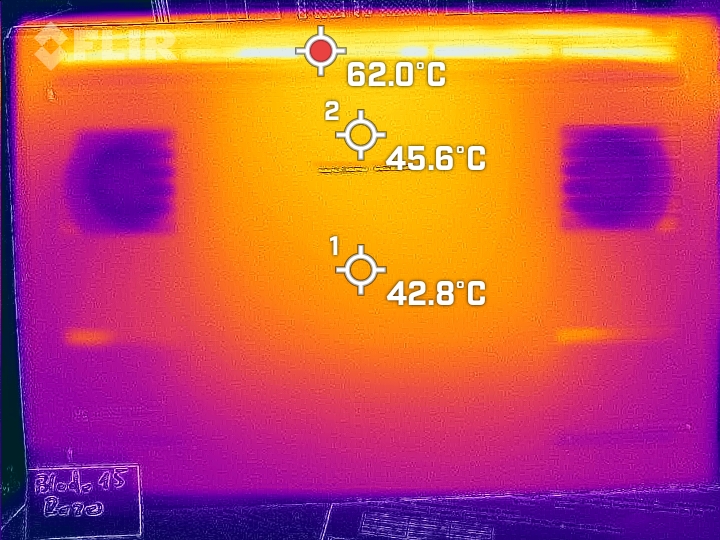
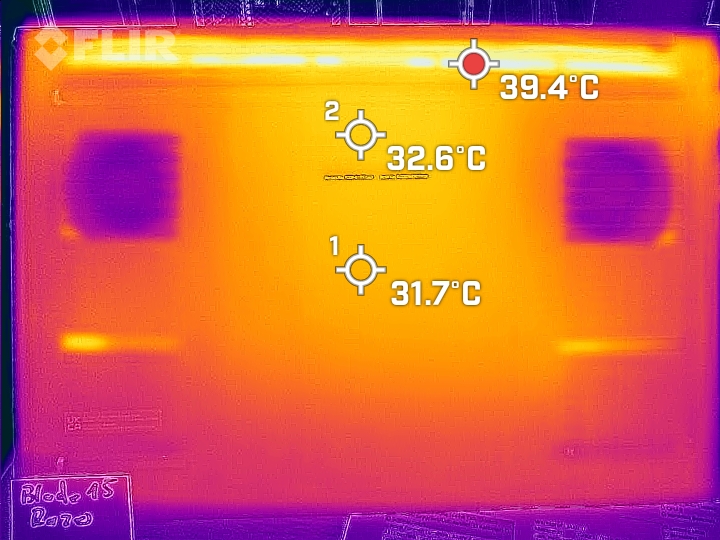
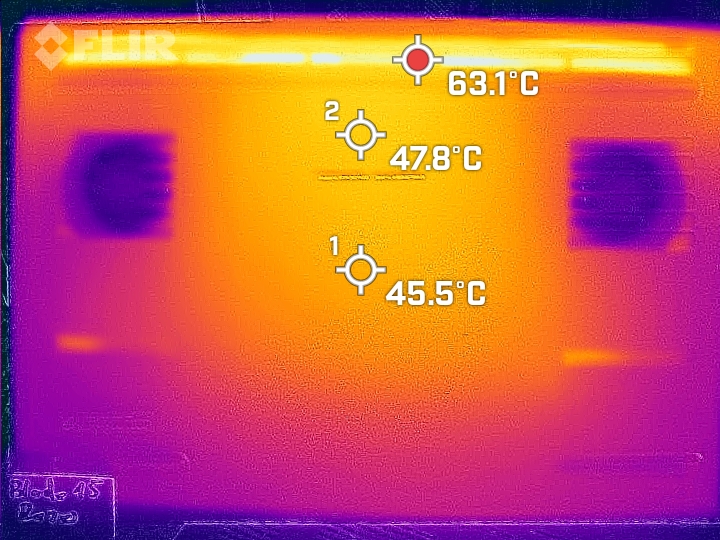
Temperatur
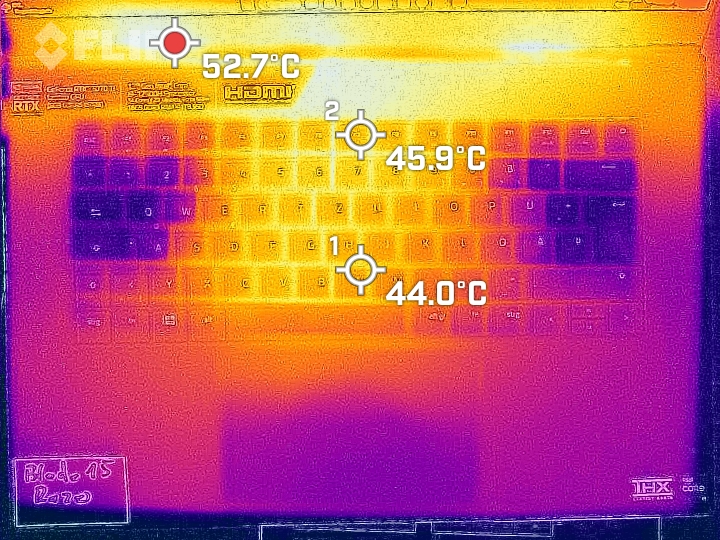
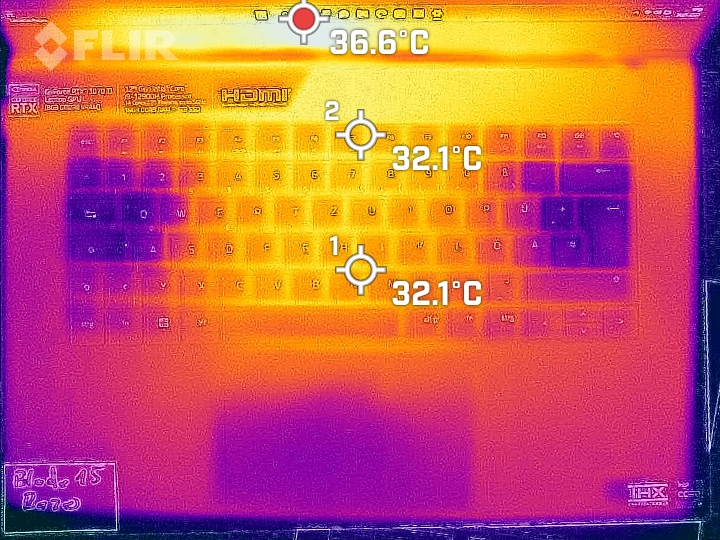
Vid vardaglig användning (kontor, internet) ligger temperaturen i fallet i stort sett i det gröna området. Vid belastning (stresstest, Witcher 3 test) blir den bärbara datorn märkbart varm, men inte överdrivet varm.
(-) Den maximala temperaturen på ovansidan är 49.5 °C / 121 F, jämfört med genomsnittet av 40.4 °C / 105 F , allt från 21.2 till 68.8 °C för klassen Gaming.
(-) Botten värms upp till maximalt 47.5 °C / 118 F, jämfört med genomsnittet av 43.2 °C / 110 F
(+) Vid tomgångsbruk är medeltemperaturen för ovansidan 30 °C / 86 F, jämfört med enhetsgenomsnittet på 33.9 °C / ### class_avg_f### F.
(-) När du spelar The Witcher 3 är medeltemperaturen för ovansidan 40.3 °C / 105 F, jämfört med enhetsgenomsnittet på 33.9 °C / ## #class_avg_f### F.
(±) Handledsstöden och pekplattan kan bli väldigt varma vid beröring med maximalt 38 °C / 100.4 F.
(-) Medeltemperaturen för handledsstödsområdet på liknande enheter var 28.8 °C / 83.8 F (-9.2 °C / -16.6 F).
| Razer Blade 15 OLED (Early 2022) Intel Core i9-12900H, NVIDIA GeForce RTX 3070 Ti Laptop GPU | Asus ROG Zephyrus M16 GU603Z Intel Core i9-12900H, NVIDIA GeForce RTX 3070 Ti Laptop GPU | Aorus 15 XE5 Intel Core i7-12700H, NVIDIA GeForce RTX 3070 Ti Laptop GPU | Schenker XMG Fusion 15 (Mid 22) Intel Core i7-11800H, NVIDIA GeForce RTX 3070 Laptop GPU | HP Omen 16-b1090ng Intel Core i7-12700H, NVIDIA GeForce RTX 3070 Ti Laptop GPU | Razer Blade 15 2022 Intel Core i7-12800H, NVIDIA GeForce RTX 3080 Ti Laptop GPU | |
|---|---|---|---|---|---|---|
| Heat | 2% | -12% | -15% | 9% | -6% | |
| Maximum Upper Side * (°C) | 49.5 | 52 -5% | 46 7% | 52 -5% | 41 17% | 50 -1% |
| Maximum Bottom * (°C) | 47.5 | 51 -7% | 57 -20% | 63 -33% | 62 -31% | 47 1% |
| Idle Upper Side * (°C) | 33.4 | 29 13% | 38 -14% | 37 -11% | 25 25% | 37.4 -12% |
| Idle Bottom * (°C) | 35 | 33 6% | 42 -20% | 38 -9% | 26 26% | 38.4 -10% |
* ... mindre är bättre
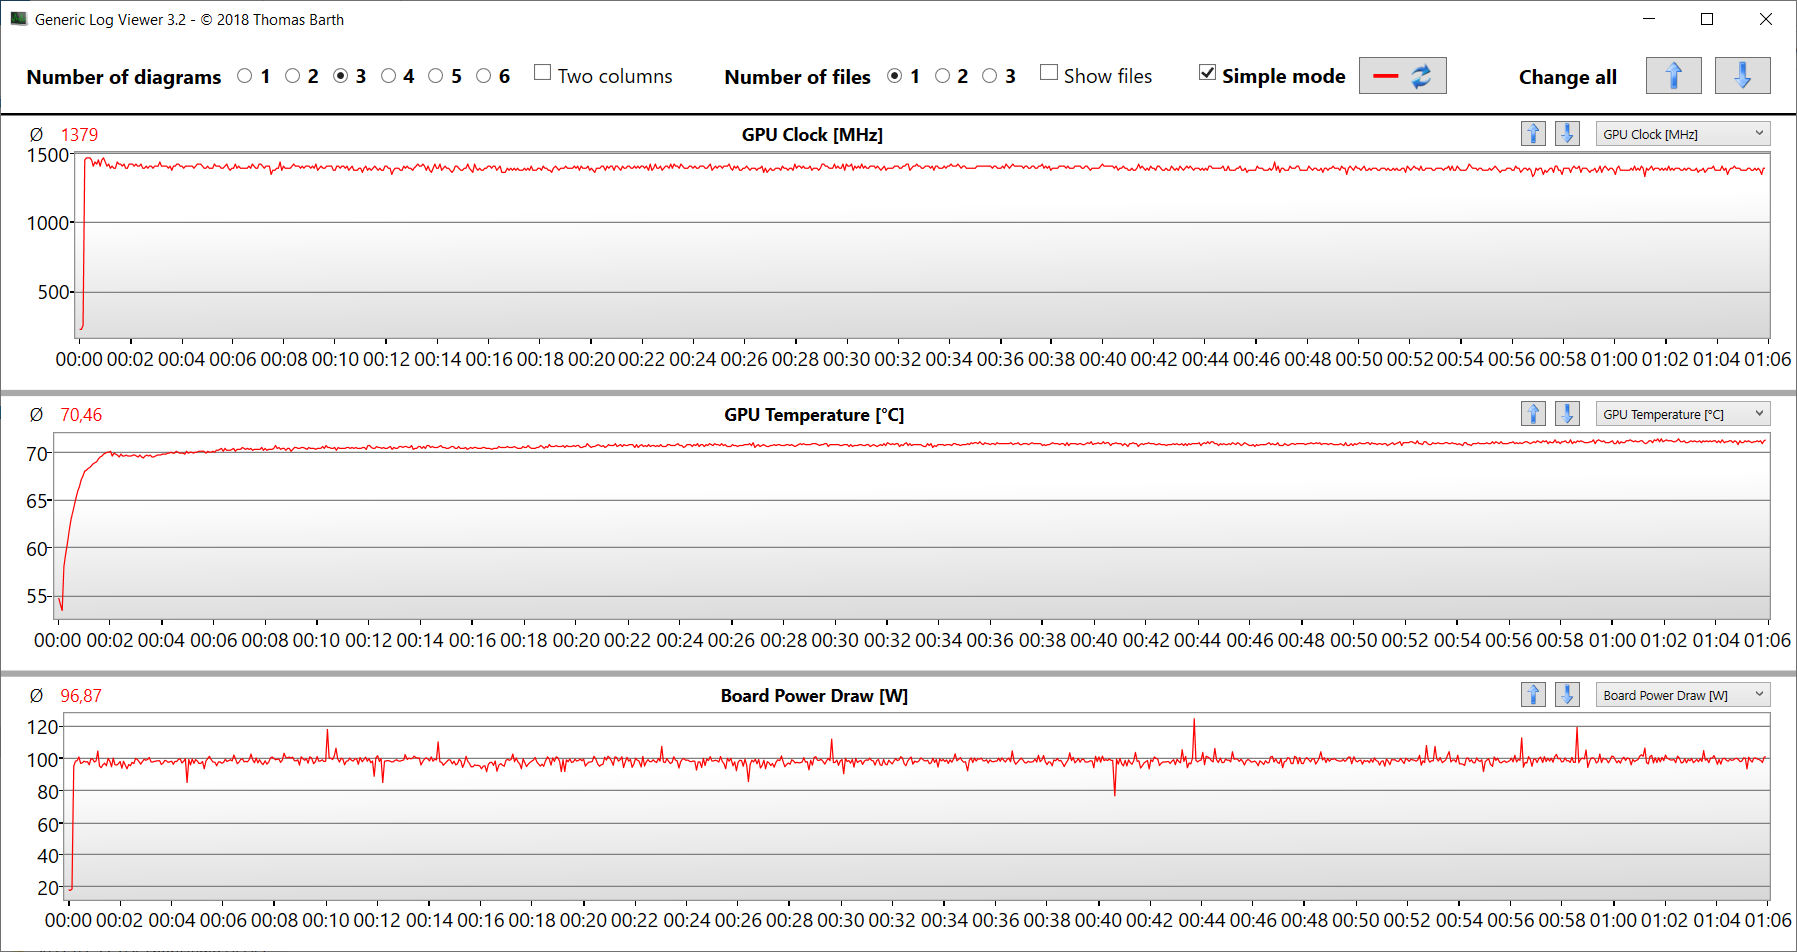
Stresstest
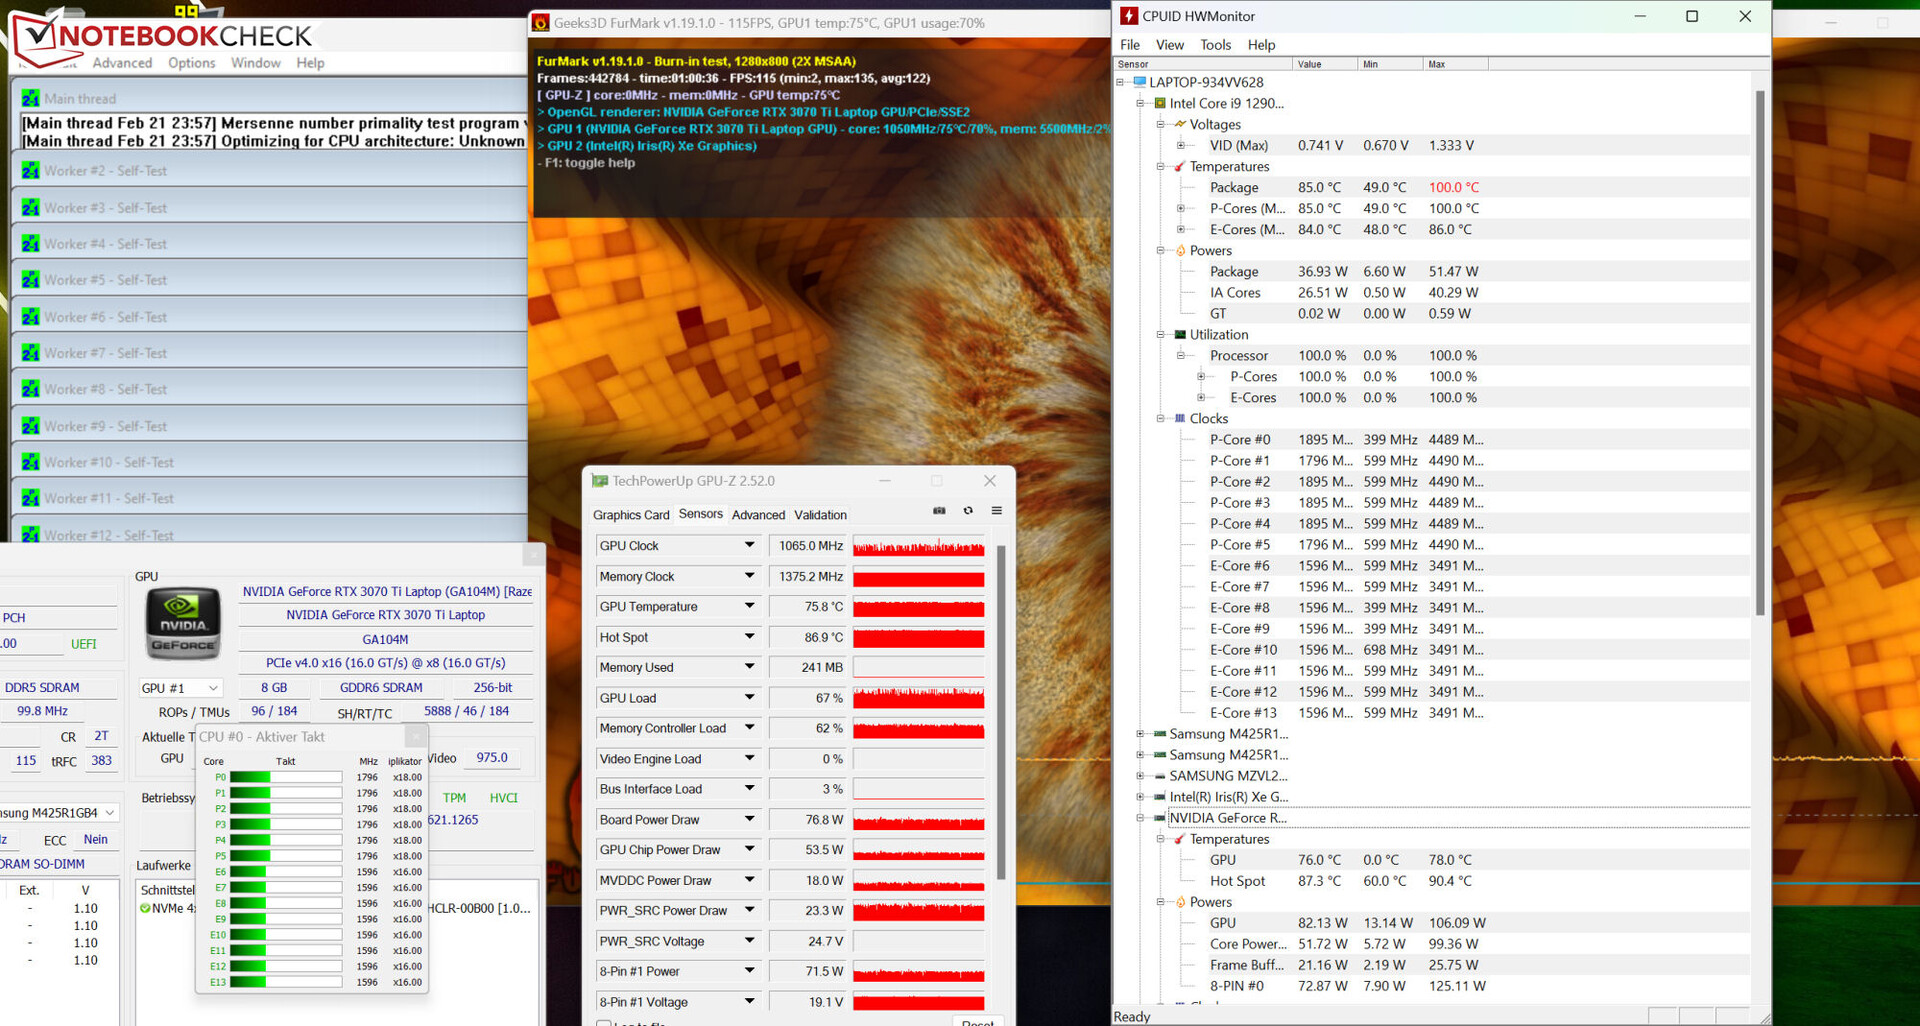
Stresstestet (Prime95 och Furmark i kontinuerlig drift) är ett extremt scenario för att analysera systemets stabilitet under full belastning. Under testet sjönk CPU:s klockfrekvens från en utgångspunkt på 2,5 GHz (P-kärnor) respektive 2,1 GHz (E-kärnor) till cirka 1,7 GHz (P-kärnor) respektive 1,5 GHz (E-kärnor). GPU:s klockfrekvens varierar mellan 700 och 1 300 MHz.
Högtalare
Stereohögtalarna ger ett hyfsat ljud men saknar bas.
Razer Blade 15 OLED (Early 2022) ljudanalys
(+) | högtalare kan spela relativt högt (89.2 dB)
Bas 100 - 315 Hz
(-) | nästan ingen bas - i genomsnitt 24.8% lägre än medianen
(±) | linjäriteten för basen är genomsnittlig (12.7% delta till föregående frekvens)
Mellan 400 - 2000 Hz
(+) | balanserad mellan - endast 3% från medianen
(+) | mids är linjära (4.3% delta till föregående frekvens)
Högsta 2 - 16 kHz
(+) | balanserade toppar - endast 2.2% från medianen
(+) | toppar är linjära (4.1% delta till föregående frekvens)
Totalt 100 - 16 000 Hz
(+) | det totala ljudet är linjärt (14.1% skillnad mot median)
Jämfört med samma klass
» 24% av alla testade enheter i den här klassen var bättre, 8% liknande, 68% sämre
» Den bästa hade ett delta på 6%, genomsnittet var 18%, sämst var 132%
Jämfört med alla testade enheter
» 17% av alla testade enheter var bättre, 4% liknande, 79% sämre
» Den bästa hade ett delta på 4%, genomsnittet var 24%, sämst var 134%
Asus ROG Zephyrus M16 GU603Z ljudanalys
(+) | högtalare kan spela relativt högt (82.96 dB)
Bas 100 - 315 Hz
(±) | reducerad bas - i genomsnitt 11.6% lägre än medianen
(±) | linjäriteten för basen är genomsnittlig (9.2% delta till föregående frekvens)
Mellan 400 - 2000 Hz
(+) | balanserad mellan - endast 4.3% från medianen
(+) | mids är linjära (5.7% delta till föregående frekvens)
Högsta 2 - 16 kHz
(+) | balanserade toppar - endast 1.6% från medianen
(+) | toppar är linjära (3.9% delta till föregående frekvens)
Totalt 100 - 16 000 Hz
(+) | det totala ljudet är linjärt (10.1% skillnad mot median)
Jämfört med samma klass
» 5% av alla testade enheter i den här klassen var bättre, 2% liknande, 93% sämre
» Den bästa hade ett delta på 6%, genomsnittet var 18%, sämst var 132%
Jämfört med alla testade enheter
» 5% av alla testade enheter var bättre, 1% liknande, 94% sämre
» Den bästa hade ett delta på 4%, genomsnittet var 24%, sämst var 134%
Energihantering - Blade är mycket hungrig när den är inaktiv
Effektförbrukning
Vid tomgångsanvändning är energibehovet (upp till 39 watt) jämförelsevis högt. Detta verkar vara ett generellt problem som finns i 2022 Blade-modellerna som vi stött på vid många tillfällen. Under belastning är förbrukningen normal för den här typen av hårdvara. Medan Witcher 3 -testet kördes med konstant energiförbrukning sjönk kraven abrupt under stresstestet - CPU:n kvävdes. Nätaggregatet (230 watt) är lämpligt dimensionerat.
| Av/Standby | |
| Låg belastning | |
| Hög belastning |
|
Förklaring:
min: | |
| Razer Blade 15 OLED (Early 2022) i9-12900H, GeForce RTX 3070 Ti Laptop GPU, Samsung PM9A1 MZVL21T0HCLR, OLED, 2560x1440, 15.6" | Asus ROG Zephyrus M16 GU603Z i9-12900H, GeForce RTX 3070 Ti Laptop GPU, Micron 3400 1TB MTFDKBA1T0TFH, IPS, 2560x1600, 16" | Aorus 15 XE5 i7-12700H, GeForce RTX 3070 Ti Laptop GPU, Gigabyte AG470S1TB-SI B10, IPS, 2560x1440, 15.6" | Schenker XMG Fusion 15 (Mid 22) i7-11800H, GeForce RTX 3070 Laptop GPU, Samsung SSD 980 Pro 1TB MZ-V8P1T0BW, IPS, 2560x1440, 15.6" | HP Omen 16-b1090ng i7-12700H, GeForce RTX 3070 Ti Laptop GPU, WDC PC SN810 1TB, IPS, 2560x1440, 16.1" | Razer Blade 15 2022 i7-12800H, GeForce RTX 3080 Ti Laptop GPU, SSSTC CA6-8D1024, IPS, 2560x1440, 15.6" | Genomsnitt NVIDIA GeForce RTX 3070 Ti Laptop GPU | Genomsnitt av klass Gaming | |
|---|---|---|---|---|---|---|---|---|
| Power Consumption | 26% | -18% | 24% | 29% | -8% | 18% | 22% | |
| Idle Minimum * (Watt) | 31.6 | 10.8 66% | 31 2% | 12 62% | 4 87% | 33.2 -5% | 14.2 ? 55% | 13 ? 59% |
| Idle Average * (Watt) | 33.3 | 17 49% | 35 -5% | 17 49% | 10 70% | 36.4 -9% | 19.9 ? 40% | 18.7 ? 44% |
| Idle Maximum * (Watt) | 38.6 | 17.8 54% | 46 -19% | 24 38% | 19 51% | 37.6 3% | 26.2 ? 32% | 24.3 ? 37% |
| Load Average * (Watt) | 149 | 116 22% | 120 19% | 106 29% | 114 23% | 116.7 22% | 125.8 ? 16% | 108.2 ? 27% |
| Witcher 3 ultra * (Watt) | 149.6 | 144 4% | 202 -35% | 159.9 -7% | 183.2 -22% | 172 -15% | ||
| Load Maximum * (Watt) | 160 | 220 -38% | 268 -68% | 208 -30% | 221 -38% | 228.6 -43% | 248 ? -55% | 254 ? -59% |
* ... mindre är bättre
Power consumption Witcher 3 / Stress test
Power consumption with an external monitor
Batteriets livslängd
I WiFi-testet (öppning av webbplatser med hjälp av ett skript) och videotestet (kortfilmen Big Buck Bunny (H.264-kodning, FHD) i en slinga) uppnådde 15-tumsenheten batteritider på 4,34 timmar respektive 5,52 timmar. Den bärbara datorns energisparfunktioner var avaktiverade under båda testerna och skärmens ljusstyrka var inställd på 150 cd/m². Videotestet utfördes också med radiomodulen avstängd.
På det hela taget kunde Blade inte leverera en imponerande batteritid - inte ens för en kraftfull bärbar dator med QHD. Över hela linjen erbjuder konkurrenterna bättre uthållighet - både i absoluta tal och även i beräknade watttimmar.
| Razer Blade 15 OLED (Early 2022) i9-12900H, GeForce RTX 3070 Ti Laptop GPU, 80 Wh | Asus ROG Zephyrus M16 GU603Z i9-12900H, GeForce RTX 3070 Ti Laptop GPU, 90 Wh | Aorus 15 XE5 i7-12700H, GeForce RTX 3070 Ti Laptop GPU, 99 Wh | Schenker XMG Fusion 15 (Mid 22) i7-11800H, GeForce RTX 3070 Laptop GPU, 93.48 Wh | HP Omen 16-b1090ng i7-12700H, GeForce RTX 3070 Ti Laptop GPU, 83 Wh | Razer Blade 15 2022 i7-12800H, GeForce RTX 3080 Ti Laptop GPU, 80 Wh | Genomsnitt av klass Gaming | |
|---|---|---|---|---|---|---|---|
| Batteridrifttid | 17% | 23% | 51% | 21% | 7% | 26% | |
| Reader / Idle (h) | 6.7 | 10 49% | 15.5 131% | 10.1 51% | 8.71 ? 30% | ||
| H.264 (h) | 5.9 | 7.3 24% | 6.2 5% | 7.5 27% | 8.9 ? 51% | ||
| WiFi v1.3 (h) | 4.6 | 7.4 61% | 6.8 48% | 7.4 61% | 5.6 22% | 4.9 7% | 7 ? 52% |
| Load (h) | 2.1 | 1.4 -33% | 1.9 -10% | 1.8 -14% | 1.9 -10% | 1.51 ? -28% |
För
Emot
Bedömning - Ett kompakt kraftpaket
Blade 15:s huvudsakliga användningsområden är videoredigering, rendering och spel. TheCore-i9 12900HcPU och GeForce RTX 3070 Ti laptopgPU (TGP: 110 watt) levererar den nödvändiga kraften. En snabb PCIe-4 SSD (1 TB) garanterar korta laddningstider.
Blade 15 OLED (Early 2022) är ett kraftfullt verktyg för både spelare och kreativa typer.
Fokus ligger inte bara på hög prestanda: Beräkningskärnornas maximala resultat är genomsnittliga jämfört med tidigare recenserade bärbara datorer med 12900H eller 3070 Ti. Medan värmeproduktionen är typisk för en bärbar dator med den här kraften är bullerutsläppen relativt måttliga. Det sistnämnda kan inte sägas om strömförbrukningen vid tomgångsanvändning: Blade 15 hjälper sig själv med en mycket stor klunk ur flaskan.
Den verkliga batteritiden på 4 till 6 timmar lyckas inte imponera. I detta avseende har konkurrenterna mycket mer att erbjuda. Trots detta kan batteriet laddas via en universell USB-C-strömförsörjning (minst 65 watt, 20 V) och båda USB-C-portarna (2x Thunderbolt) har stöd för Power Delivery (och Displayport).
Sammantaget får den reflekterande OLED-panelen (QHD) ett något bättre resultat än den konventionella LED-panelen (QHD) som finns i den tidigare recenserade Blade 2022-modellen. Båda skärmarna erbjuder god färgområdestäckning (sRGB: 100 %) och bra färgåtergivning. OLED-modellen har näsan i vädret när det gäller svartnivåer, ljusstyrka och svarstider, varvid LED-modellen får poäng tack vare sin matta yta.
Ett möjligt alternativ till den här enheten skulle kunna komma i form av denAsus ROG Zephyrus M16 GU603Z. Prestandamässigt ligger processorn på samma nivå, men den får extra poäng tack vare en ljusare skärm i 16:10-format samt en betydligt längre batteritid. Ett budgetalternativ kan varaAorus 15 XE5. Trots att den här maskinen är några hundra dollar billigare i pris levererar den lite mer kraft och bättre batteritid än Blade.
Pris och tillgänglighet
Den granskade specifikationen Razer Blade 15 OLED (Early 22) kan köpas på Amazon för 1 967 dollar.
Razer Blade 15 OLED (Early 2022)
- 03/04/2023 v7 (old)
Sascha Mölck
Genomskinlighet
Valet av enheter som ska granskas görs av vår redaktion. Testprovet gavs till författaren som ett lån av tillverkaren eller återförsäljaren för denna recension. Långivaren hade inget inflytande på denna recension och inte heller fick tillverkaren en kopia av denna recension innan publiceringen. Det fanns ingen skyldighet att publicera denna recension. Som ett oberoende medieföretag är Notebookcheck inte föremål för auktoritet från tillverkare, återförsäljare eller förlag.
This is how Notebookcheck is testingEvery year, Notebookcheck independently reviews hundreds of laptops and smartphones using standardized procedures to ensure that all results are comparable. We have continuously developed our test methods for around 20 years and set industry standards in the process. In our test labs, high-quality measuring equipment is utilized by experienced technicians and editors. These tests involve a multi-stage validation process. Our complex rating system is based on hundreds of well-founded measurements and benchmarks, which maintains objectivity.
Price comparison

