Test: HP Omen 15 (i7-8750H, GTX 1070 Max-Q, SSD, FHD) Laptop (Sammanfattning)
| SD Card Reader | |
| average JPG Copy Test (av. of 3 runs) | |
| Genomsnitt av klass Gaming (20.9 - 210, n=54, senaste 2 åren) | |
| HP Omen 15-dc0015ng (Toshiba Exceria Pro SDXC 64 GB UHS-II) | |
| HP Omen 15-dc0001ng (Toshiba Exceria Pro SDXC 64 GB UHS-II) | |
| MSI GE63 Raider RGB 8RF-008 (Toshiba Exceria Pro SDXC 64 GB UHS-II) | |
| Schenker XMG Neo 15 (Toshiba Exceria Pro SDXC 64 GB UHS-II) | |
| maximum AS SSD Seq Read Test (1GB) | |
| Genomsnitt av klass Gaming (25.5 - 261, n=51, senaste 2 åren) | |
| HP Omen 15-dc0001ng (Toshiba Exceria Pro SDXC 64 GB UHS-II) | |
| HP Omen 15-dc0015ng (Toshiba Exceria Pro SDXC 64 GB UHS-II) | |
| MSI GE63 Raider RGB 8RF-008 (Toshiba Exceria Pro SDXC 64 GB UHS-II) | |
| Schenker XMG Neo 15 (Toshiba Exceria Pro SDXC 64 GB UHS-II) | |
| |||||||||||||||||||||||||
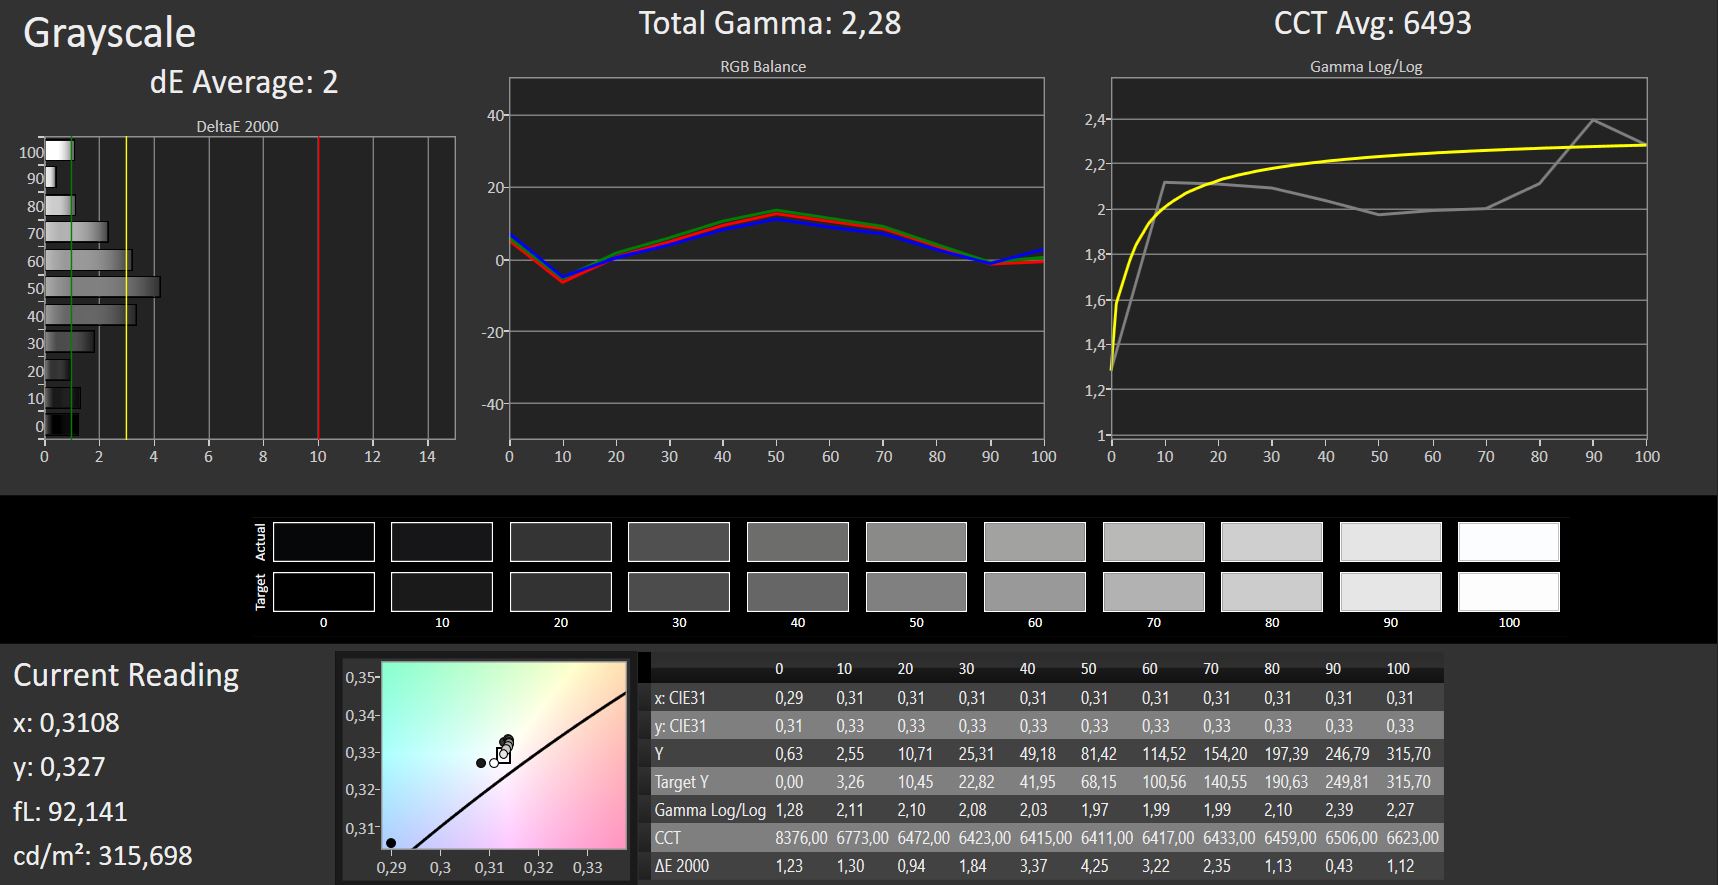
Distribution av ljusstyrkan: 76 %
Mitt på batteriet: 317 cd/m²
Kontrast: 511:1 (Svärta: 0.62 cd/m²)
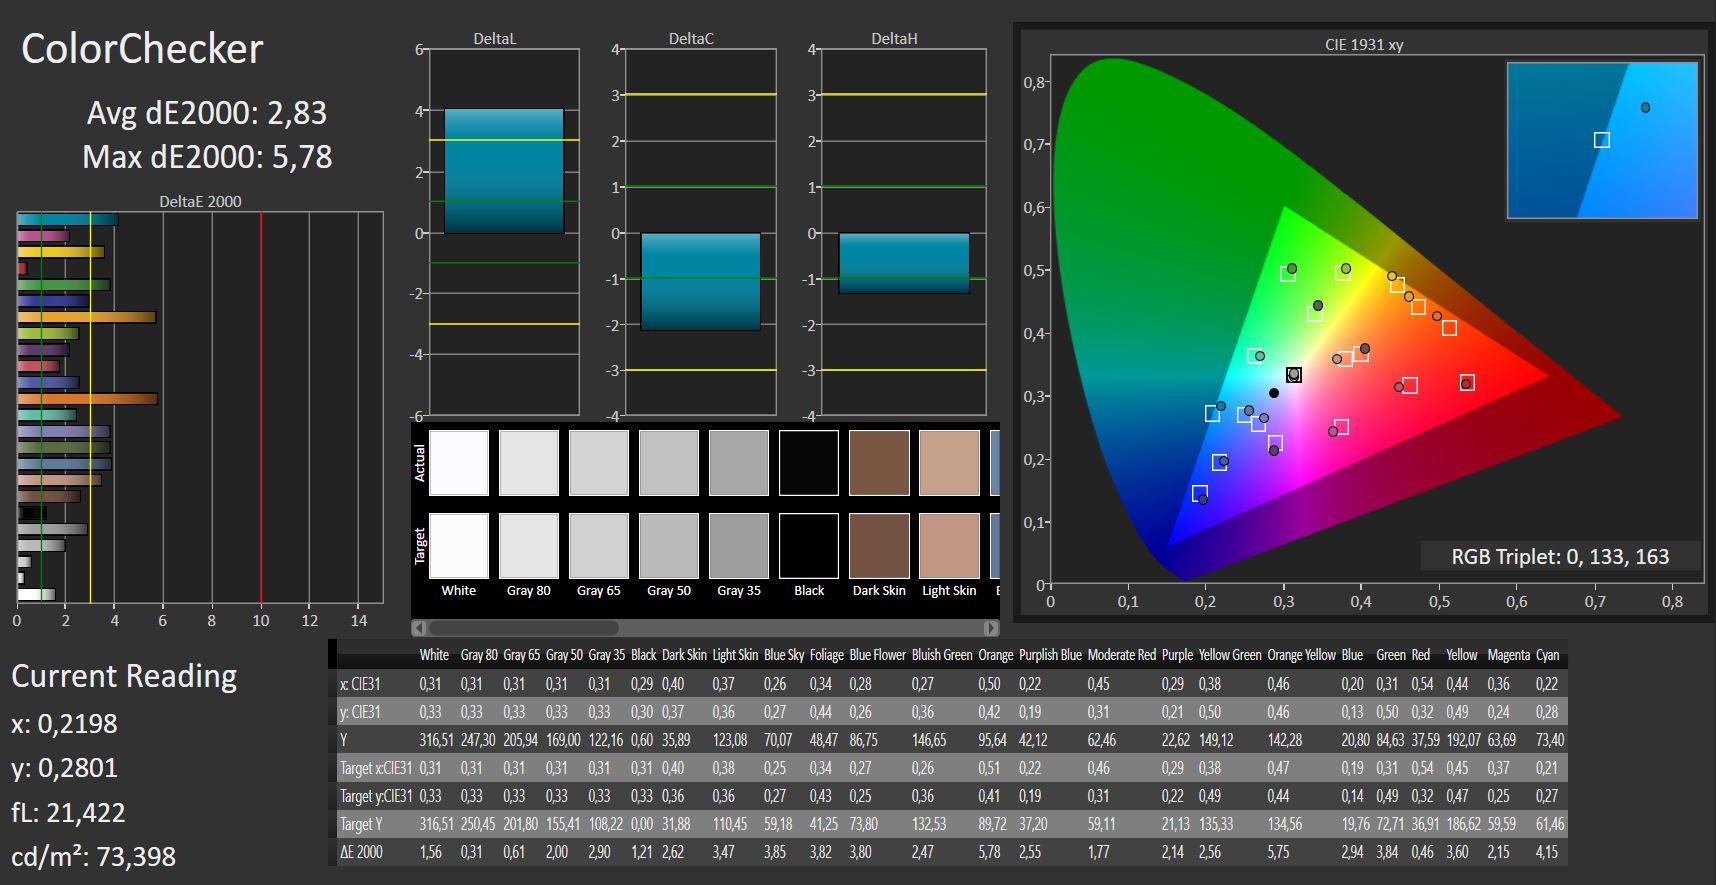
ΔE ColorChecker Calman: 2.83 | ∀{0.5-29.43 Ø4.73}
ΔE Greyscale Calman: 2 | ∀{0.09-98 Ø4.97}
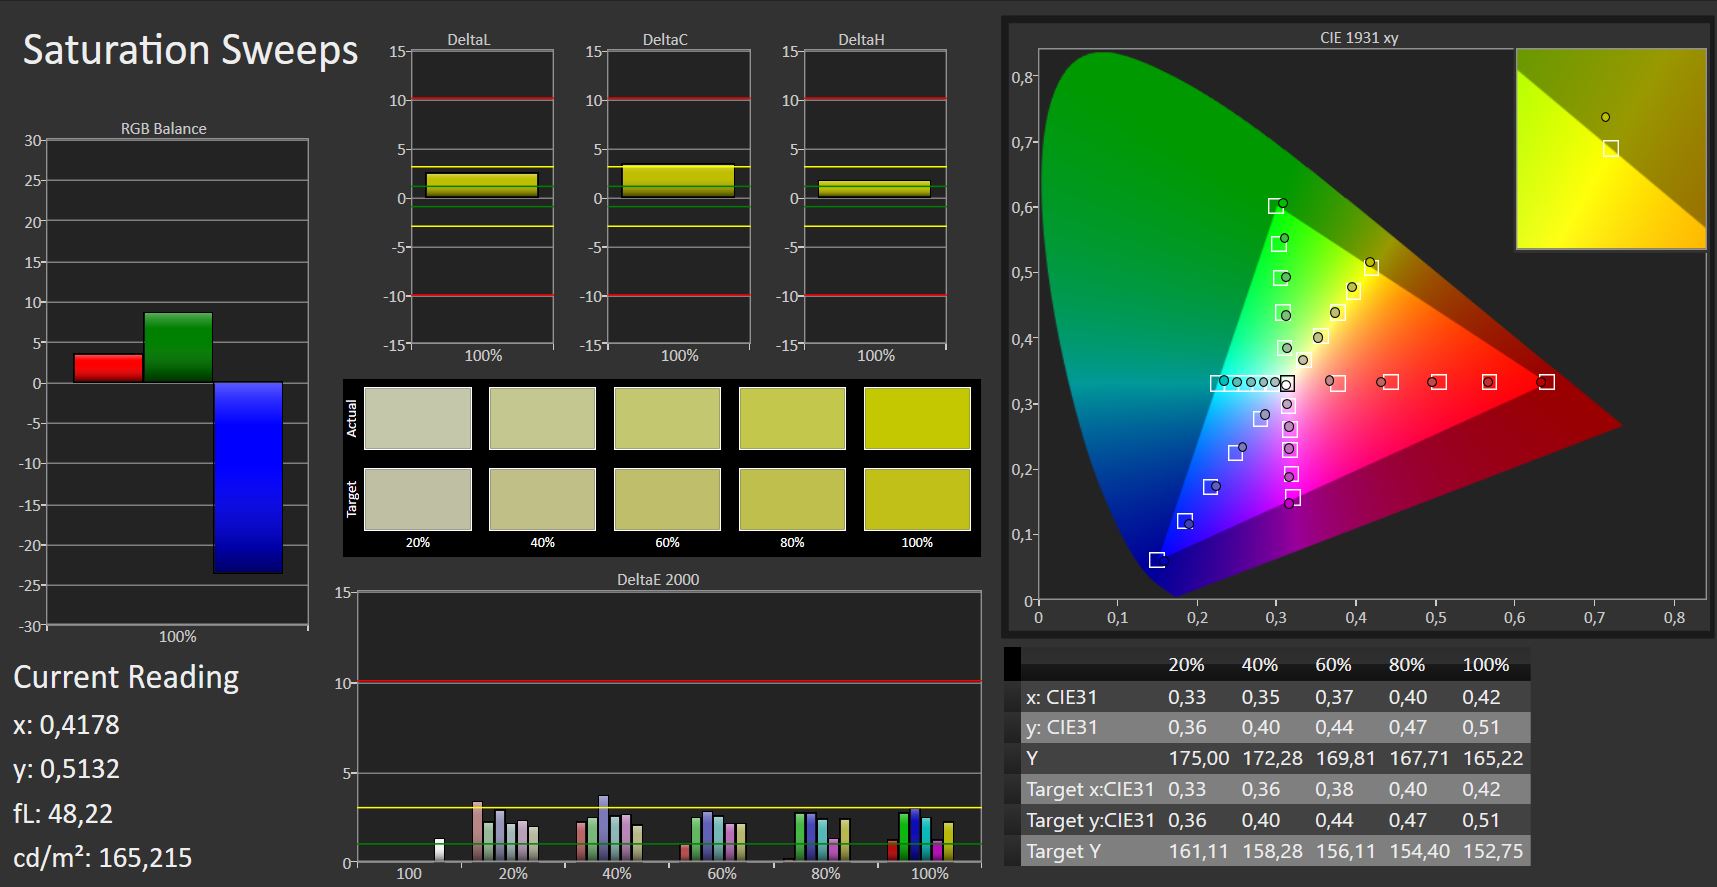
93% sRGB (Argyll 1.6.3 3D)
60% AdobeRGB 1998 (Argyll 1.6.3 3D)
65.1% AdobeRGB 1998 (Argyll 3D)
93.4% sRGB (Argyll 3D)
64.2% Display P3 (Argyll 3D)
Gamma: 2.28
CCT: 6493 K
| HP Omen 15-dc0015ng IPS, 1920x1080, 15.6" | HP Omen 15-dc0001ng IPS, 1920x1080, 15.6" | MSI P65 8RF-451 - Creator IPS, 1920x1080, 15.6" | Asus Zephyrus S GX531GS IPS, 1920x1080, 15.6" | Razer Blade 15 GTX 1060 IPS, 1920x1080, 15.6" | Schenker XMG Neo 15 IPS, 1920x1080, 15.6" | MSI GE63 Raider RGB 8RF-008 TN, 1920x1080, 15.6" | |
|---|---|---|---|---|---|---|---|
| Display | -37% | 0% | 1% | 0% | 0% | 26% | |
| Display P3 Coverage (%) | 64.2 | 39.64 -38% | 65.1 1% | 66.7 4% | 64.4 0% | 64.3 0% | 90 40% |
| sRGB Coverage (%) | 93.4 | 59 -37% | 91.1 -2% | 91.2 -2% | 93.4 0% | 94.1 1% | 100 7% |
| AdobeRGB 1998 Coverage (%) | 65.1 | 40.95 -37% | 65.9 1% | 66.7 2% | 65.5 1% | 65.3 0% | 86 32% |
| Response Times | -187% | 3% | 33% | 6% | 10% | -44% | |
| Response Time Grey 50% / Grey 80% * (ms) | 17 ? | 47.2 ? -178% | 16 ? 6% | 7.4 ? 56% | 13.6 ? 20% | 16 ? 6% | 24.4 ? -44% |
| Response Time Black / White * (ms) | 11 ? | 32.4 ? -195% | 11 ? -0% | 10 ? 9% | 12 ? -9% | 9.6 ? 13% | 15.8 ? -44% |
| PWM Frequency (Hz) | 200 ? | 25510 ? | |||||
| Screen | -14% | 14% | 20% | 22% | 17% | -6% | |
| Brightness middle (cd/m²) | 317 | 275 -13% | 235 -26% | 294 -7% | 304.3 -4% | 325 3% | 292 -8% |
| Brightness (cd/m²) | 283 | 254 -10% | 235 -17% | 275 -3% | 293 4% | 303 7% | 258 -9% |
| Brightness Distribution (%) | 76 | 90 18% | 85 12% | 84 11% | 80 5% | 90 18% | 81 7% |
| Black Level * (cd/m²) | 0.62 | 0.27 56% | 0.22 65% | 0.24 61% | 0.38 39% | 0.33 47% | 0.23 63% |
| Contrast (:1) | 511 | 1019 99% | 1068 109% | 1225 140% | 801 57% | 985 93% | 1270 149% |
| Colorchecker dE 2000 * | 2.83 | 4.62 -63% | 2.82 -0% | 2.57 9% | 1.79 37% | 2.69 5% | 5.82 -106% |
| Colorchecker dE 2000 max. * | 5.78 | 8.05 -39% | 4.82 17% | 4.88 16% | 3.69 36% | 4.91 15% | 9.05 -57% |
| Greyscale dE 2000 * | 2 | 4.31 -115% | 2.32 -16% | 2.41 -21% | 1.1 45% | 2.34 -17% | 4.61 -131% |
| Gamma | 2.28 96% | 2.49 88% | 2.49 88% | 2.5 88% | 2.27 97% | 2.38 92% | 2.65 83% |
| CCT | 6493 100% | 7000 93% | 6310 103% | 6370 102% | 6665 98% | 6872 95% | 6950 94% |
| Color Space (Percent of AdobeRGB 1998) (%) | 60 | 38 -37% | 59 -2% | 59 -2% | 59.8 0% | 60 0% | 76 27% |
| Color Space (Percent of sRGB) (%) | 93 | 59 -37% | 92 -1% | 91 -2% | 92.8 0% | 94 1% | 100 8% |
| Colorchecker dE 2000 calibrated * | 3.59 | 4.88 | 2.14 | 1.27 | 2.82 | ||
| Totalt genomsnitt (program/inställningar) | -79% /
-42% | 6% /
10% | 18% /
18% | 9% /
15% | 9% /
13% | -8% /
-4% |
* ... mindre är bättre
Skärmflimmer / PWM (Puls-Width Modulation)
| Skärmflimmer / PWM upptäcktes inte | 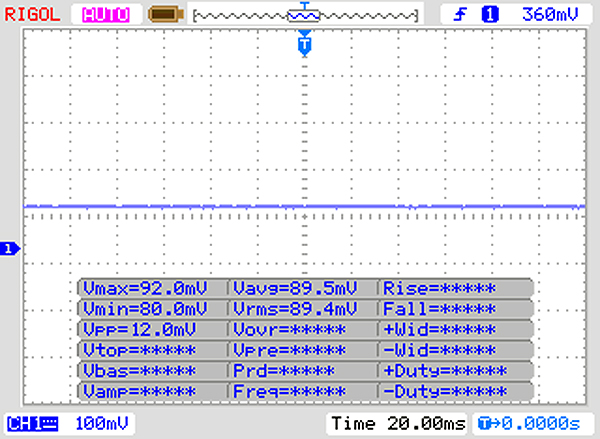 | ||
Som jämförelse: 52 % av alla testade enheter använder inte PWM för att dämpa skärmen. Om PWM upptäcktes mättes ett medelvärde av 7784 (minst: 5 - maximum: 343500) Hz. | |||
Visa svarstider
| ↔ Svarstid svart till vitt | ||
|---|---|---|
| 11 ms ... stiga ↗ och falla ↘ kombinerat | ↗ 7 ms stiga | 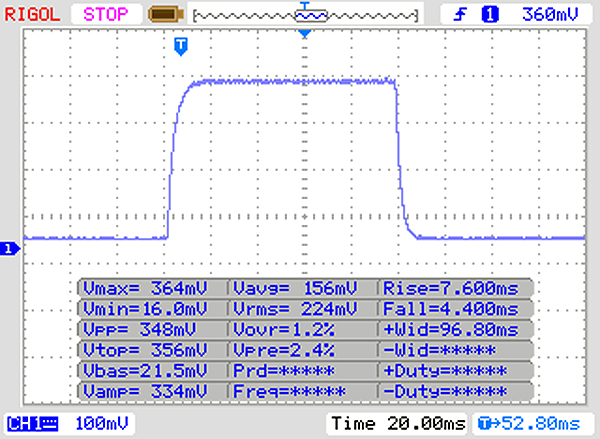 |
| ↘ 4 ms hösten | ||
| Skärmen visar bra svarsfrekvens i våra tester, men kan vara för långsam för konkurrenskraftiga spelare. I jämförelse sträcker sig alla testade enheter från 0.1 (minst) till 240 (maximalt) ms. » 29 % av alla enheter är bättre. Det betyder att den uppmätta svarstiden är bättre än genomsnittet av alla testade enheter (19.9 ms). | ||
| ↔ Svarstid 50 % grått till 80 % grått | ||
| 17 ms ... stiga ↗ och falla ↘ kombinerat | ↗ 9 ms stiga | 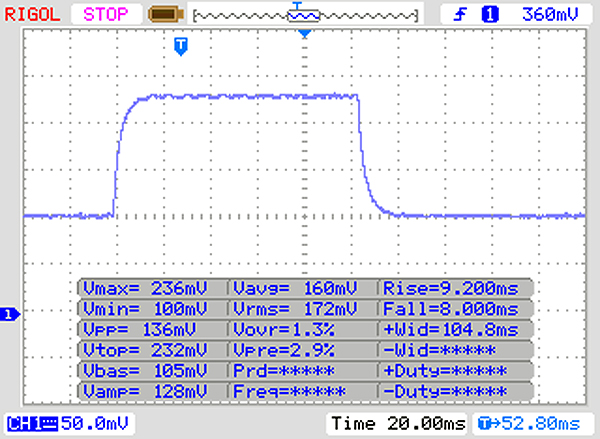 |
| ↘ 8 ms hösten | ||
| Skärmen visar bra svarsfrekvens i våra tester, men kan vara för långsam för konkurrenskraftiga spelare. I jämförelse sträcker sig alla testade enheter från 0.165 (minst) till 636 (maximalt) ms. » 31 % av alla enheter är bättre. Det betyder att den uppmätta svarstiden är bättre än genomsnittet av alla testade enheter (31.1 ms). | ||
| Cinebench R10 | |
| Rendering Multiple CPUs 32Bit | |
| Genomsnitt av klass Gaming (42932 - 81339, n=8, senaste 2 åren) | |
| Genomsnitt Intel Core i7-8750H (29664 - 35307, n=25) | |
| HP Omen 15-dc0015ng | |
| MSI P65 8RF-451 - Creator | |
| Rendering Single 32Bit | |
| Genomsnitt av klass Gaming (7457 - 11779, n=8, senaste 2 åren) | |
| Genomsnitt Intel Core i7-8750H (6236 - 6645, n=25) | |
| HP Omen 15-dc0015ng | |
| MSI P65 8RF-451 - Creator | |
| Geekbench 3 | |
| 32 Bit Multi-Core Score | |
| HP Omen 15-dc0015ng | |
| Genomsnitt Intel Core i7-8750H (20725 - 22665, n=13) | |
| 32 Bit Single-Core Score | |
| HP Omen 15-dc0015ng | |
| Genomsnitt Intel Core i7-8750H (3734 - 4163, n=13) | |
| Geekbench 4.0 | |
| 64 Bit Multi-Core Score | |
| Genomsnitt av klass Gaming (40469 - 76142, n=4, senaste 2 åren) | |
| HP Omen 15-dc0015ng | |
| Genomsnitt Intel Core i7-8750H (17048 - 22006, n=8) | |
| 64 Bit Single-Core Score | |
| Genomsnitt av klass Gaming (7589 - 9053, n=4, senaste 2 åren) | |
| HP Omen 15-dc0015ng | |
| Genomsnitt Intel Core i7-8750H (4548 - 4997, n=8) | |
| Mozilla Kraken 1.1 - Total | |
| MSI P65 8RF-451 - Creator (EDGE: 42.17134.1.0) | |
| Genomsnitt Intel Core i7-8750H (695 - 1272, n=50) | |
| HP Omen 15-dc0015ng (Edge 44) | |
| Razer Blade 15 GTX 1060 (Edge 42.17134.1.0) | |
| Genomsnitt av klass Gaming (391 - 590, n=104, senaste 2 åren) | |
| Octane V2 - Total Score | |
| Genomsnitt av klass Gaming (89353 - 139447, n=29, senaste 2 åren) | |
| HP Omen 15-dc0015ng (Edge 44) | |
| Razer Blade 15 GTX 1060 (Edge 42.17134.1.0) | |
| Genomsnitt Intel Core i7-8750H (27460 - 44549, n=47) | |
| MSI P65 8RF-451 - Creator (EDGE: 42.17134.1.0) | |
| JetStream 1.1 - 1.1 Total | |
| Genomsnitt av klass Gaming (533 - 647, n=4, senaste 2 åren) | |
| Razer Blade 15 GTX 1060 (Edge 42.17134.1.0) | |
| MSI P65 8RF-451 - Creator (EDGE: 42.17134.1.0) | |
| Genomsnitt Intel Core i7-8750H (205 - 299, n=49) | |
| HP Omen 15-dc0015ng (Edge 44) | |
* ... mindre är bättre
| PCMark 7 Score | 7168 poäng | |
| PCMark 8 Home Score Accelerated v2 | 5130 poäng | |
| PCMark 8 Creative Score Accelerated v2 | 5908 poäng | |
| PCMark 8 Work Score Accelerated v2 | 5818 poäng | |
| PCMark 10 Score | 5728 poäng | |
Hjälp | ||

| HP Omen 15-dc0015ng Toshiba XG5 KXG50ZNV512G | HP Omen 15-dc0001ng Toshiba KBG30ZMV128G | MSI P65 8RF-451 - Creator Kingston RBUSNS8154P3512GJ | Asus Zephyrus S GX531GS WDC PC SN520 SDAPNUW-512G | Razer Blade 15 GTX 1060 Samsung SSD PM981 MZVLB512HAJQ | Schenker XMG Neo 15 Samsung SSD 970 Pro 1TB | MSI GE63 Raider RGB 8RF-008 Samsung SSD PM871a MZNLN256HMHQ | Genomsnitt Toshiba XG5 KXG50ZNV512G | |
|---|---|---|---|---|---|---|---|---|
| CrystalDiskMark 5.2 / 6 | -37% | 27% | 48% | 75% | 97% | -25% | 36% | |
| Write 4K (MB/s) | 87.5 | 77.1 -12% | 89.2 2% | 98.2 12% | 97.9 12% | 100.5 15% | 66.4 -24% | 114 ? 30% |
| Read 4K (MB/s) | 16.08 | 29.51 84% | 34.36 114% | 39.43 145% | 41.32 157% | 48.64 202% | 29.59 84% | 35.6 ? 121% |
| Write Seq (MB/s) | 614 | 130.9 -79% | 949 55% | 1386 126% | 1594 160% | 1456 137% | 477.9 -22% | 684 ? 11% |
| Read Seq (MB/s) | 1341 | 857 -36% | 899 -33% | 1100 -18% | 1353 1% | 1278 -5% | 515 -62% | 1612 ? 20% |
| Write 4K Q32T1 (MB/s) | 307.9 | 104.1 -66% | 371.4 21% | 270.3 -12% | 305.6 -1% | 298.1 -3% | 180.2 -41% | 401 ? 30% |
| Read 4K Q32T1 (MB/s) | 358.4 | 195.8 -45% | 399 11% | 340.3 -5% | 354.1 -1% | 348.7 -3% | 199.5 -44% | 427 ? 19% |
| Write Seq Q32T1 (MB/s) | 525 | 130.8 -75% | 1035 97% | 1454 177% | 2033 287% | 2742 422% | 497.6 -5% | 830 ? 58% |
| Read Seq Q32T1 (MB/s) | 3077 | 1096 -64% | 1603 -48% | 1681 -45% | 2543 -17% | 3389 10% | 547 -82% | 2950 ? -4% |
| Write 4K Q8T8 (MB/s) | 760 | 887 ? | ||||||
| Read 4K Q8T8 (MB/s) | 811 | 1060 ? | ||||||
| AS SSD | -69% | 65% | 48% | 146% | 123% | -27% | 69% | |
| Seq Read (MB/s) | 2432 | 1238 -49% | 850 -65% | 903 -63% | 1820 -25% | 1915 -21% | 512 -79% | 2137 ? -12% |
| Seq Write (MB/s) | 843 | 123.5 -85% | 869 3% | 1261 50% | 1917 127% | 2324 176% | 462.8 -45% | 744 ? -12% |
| 4K Read (MB/s) | 21.24 | 31.48 48% | 36.43 72% | 40.02 88% | 48.56 129% | 48.03 126% | 32.36 52% | 30.1 ? 42% |
| 4K Write (MB/s) | 99.3 | 79.3 -20% | 84.4 -15% | 103.6 4% | 99.2 0% | 106 7% | 68.6 -31% | 93.6 ? -6% |
| 4K-64 Read (MB/s) | 730 | 187.8 -74% | 839 15% | 1030 41% | 1177 61% | 1598 119% | 348.6 -52% | 784 ? 7% |
| 4K-64 Write (MB/s) | 484.4 | 103.6 -79% | 602 24% | 1285 165% | 1664 244% | 2085 330% | 294.3 -39% | 515 ? 6% |
| Access Time Read * (ms) | 0.126 | 0.177 -40% | 0.104 17% | 0.129 -2% | 0.05 60% | 0.038 70% | 0.101 20% | 0.09253 ? 27% |
| Access Time Write * (ms) | 0.063 | 0.227 -260% | 0.044 30% | 0.036 43% | 0.037 41% | 0.034 46% | 0.051 19% | 0.1653 ? -162% |
| Score Read (Points) | 994 | 343 -65% | 960 -3% | 1161 17% | 1407 42% | 1837 85% | 432 -57% | 1028 ? 3% |
| Score Write (Points) | 668 | 195 -71% | 773 16% | 1515 127% | 1955 193% | 2423 263% | 409 -39% | 683 ? 2% |
| Score Total (Points) | 2091 | 670 -68% | 2233 7% | 3294 58% | 4095 96% | 5224 150% | 1071 -49% | 2170 ? 4% |
| Copy ISO MB/s (MB/s) | 1632 | 840 -49% | 1452 -11% | 1109 ? -32% | ||||
| Copy Program MB/s (MB/s) | 30.89 | 306.9 894% | 370.7 1100% | 380 ? 1130% | ||||
| Copy Game MB/s (MB/s) | 980 | 622 -37% | 882 -10% | 738 ? -25% | ||||
| Totalt genomsnitt (program/inställningar) | -53% /
-56% | 46% /
51% | 48% /
48% | 111% /
120% | 110% /
112% | -26% /
-26% | 53% /
57% |
* ... mindre är bättre
| 3DMark 06 Standard Score | 35269 poäng | |
| 3DMark 11 Performance | 16908 poäng | |
| 3DMark Ice Storm Standard Score | 165902 poäng | |
| 3DMark Cloud Gate Standard Score | 34535 poäng | |
| 3DMark Fire Strike Score | 12877 poäng | |
| 3DMark Fire Strike Extreme Score | 6571 poäng | |
| 3DMark Time Spy Score | 4856 poäng | |
Hjälp | ||
| låg | med. | hög | ultra | |
|---|---|---|---|---|
| BioShock Infinite (2013) | 313.8 | 279.9 | 256 | 139.4 |
| GTA V (2015) | 166.7 | 159.8 | 145.9 | 64.6 |
| The Witcher 3 (2015) | 251 | 170.8 | 97.7 | 55.3 |
| Dota 2 Reborn (2015) | 126.9 | 118.2 | 111.7 | 109.7 |
| World of Warships (2015) | 205.4 | 169.8 | 146.3 | 140.7 |
| Mass Effect Andromeda (2017) | 150.1 | 110.8 | 77.6 | 68.5 |
| Warhammer 40.000: Dawn of War III (2017) | 167.3 | 106.4 | 100.9 | 89.9 |
| Team Fortress 2 (2017) | 128.4 | 126.3 | 122 | 120.8 |
| Ark Survival Evolved (2017) | 158.3 | 62.7 | 45.7 | 31.9 |
| Destiny 2 (2017) | 152.6 | 137.4 | 130.8 | 111 |
| X-Plane 11.11 (2018) | 109 | 96.5 | 81.1 | |
| Monster Hunter World (2018) | 156.5 | 88.4 | 80.4 | 60.3 |
| Shadow of the Tomb Raider (2018) | 130 | 78 | 72 | 61 |
| Call of Duty Black Ops 4 (2018) | 169.8 | 105 | 98.9 | 93.3 |
| Hitman 2 (2018) | 92 | 80.5 | 74.8 | 68.8 |
| Battlefield V (2018) | 140.7 | 80.6 | 70 | 64.7 |
| Farming Simulator 19 (2018) | 214.4 | 167.6 | 110.4 | 89.6 |
| Darksiders III (2018) | 169.2 | 83.9 | 68.3 | 59.7 |
| Just Cause 4 (2018) | 126.1 | 86.1 | 78.8 | 75.7 |
| The Witcher 3 - 1920x1080 Ultra Graphics & Postprocessing (HBAO+) | |
| Genomsnitt av klass Gaming (95 - 240, n=8, senaste 2 åren) | |
| MSI GE63 Raider RGB 8RF-008 | |
| HP Omen 15-dc0015ng | |
| MSI P65 8RF-451 - Creator | |
| Genomsnitt NVIDIA GeForce GTX 1070 Max-Q (46 - 55.3, n=19) | |
| Asus Zephyrus S GX531GS | |
| Schenker XMG Neo 15 | |
| Razer Blade 15 GTX 1060 | |
| HP Omen 15-dc0001ng | |
| BioShock Infinite - 1920x1080 Ultra Preset, DX11 (DDOF) | |
| HP Omen 15-dc0015ng | |
| Genomsnitt NVIDIA GeForce GTX 1070 Max-Q (109.6 - 139.4, n=10) | |
| MSI P65 8RF-451 - Creator | |
| Razer Blade 15 GTX 1060 | |
Ljudnivå
| Låg belastning |
| 30.6 / 30.6 / 32.2 dB(A) |
| Hög belastning |
| 47.2 / 42.3 dB(A) |
 | ||
30 dB tyst 40 dB(A) hörbar 50 dB(A) högt ljud |
||
min: | ||
| HP Omen 15-dc0015ng i7-8750H, GeForce GTX 1070 Max-Q | HP Omen 15-dc0001ng i5-8300H, GeForce GTX 1050 Ti Mobile | MSI P65 8RF-451 - Creator i7-8750H, GeForce GTX 1070 Max-Q | Asus Zephyrus S GX531GS i7-8750H, GeForce GTX 1070 Max-Q | Razer Blade 15 GTX 1060 i7-8750H, GeForce GTX 1060 Max-Q | Schenker XMG Neo 15 i7-8750H, GeForce GTX 1060 Mobile | MSI GE63 Raider RGB 8RF-008 i7-8750H, GeForce GTX 1070 Mobile | Genomsnitt NVIDIA GeForce GTX 1070 Max-Q | Genomsnitt av klass Gaming | |
|---|---|---|---|---|---|---|---|---|---|
| Noise | -7% | 2% | -12% | -0% | -14% | -10% | -2% | 6% | |
| av / miljö * (dB) | 30.6 | 29 5% | 30.7 -0% | 29 5% | 28.1 8% | 29 5% | 30 2% | 29.4 ? 4% | 24.1 ? 21% |
| Idle Minimum * (dB) | 30.6 | 29 5% | 32.1 -5% | 33 -8% | 28.1 8% | 29 5% | 30 2% | 30.5 ? -0% | 25.8 ? 16% |
| Idle Average * (dB) | 30.6 | 33 -8% | 32.1 -5% | 34 -11% | 33 -8% | 35 -14% | 35 -14% | 31.8 ? -4% | 27.4 ? 10% |
| Idle Maximum * (dB) | 32.2 | 41 -27% | 32.4 -1% | 40 -24% | 33.5 -4% | 40 -24% | 36 -12% | 34.6 ? -7% | 29.9 ? 7% |
| Load Average * (dB) | 47.2 | 44 7% | 39 17% | 47 -0% | 42.2 11% | 50 -6% | 42 11% | 43.2 ? 8% | 43 ? 9% |
| Witcher 3 ultra * (dB) | 41.7 | 47 -13% | 51 -22% | 45.3 -9% | 53 -27% | 54 -29% | |||
| Load Maximum * (dB) | 42.3 | 49 -16% | 40.2 5% | 53 -25% | 45.7 -8% | 58 -37% | 56 -32% | 48.2 ? -14% | 54 ? -28% |
* ... mindre är bättre
(-) Den maximala temperaturen på ovansidan är 49.7 °C / 121 F, jämfört med genomsnittet av 40.4 °C / 105 F , allt från 21.2 till 68.8 °C för klassen Gaming.
(-) Botten värms upp till maximalt 48 °C / 118 F, jämfört med genomsnittet av 43.2 °C / 110 F
(+) Vid tomgångsbruk är medeltemperaturen för ovansidan 29.2 °C / 85 F, jämfört med enhetsgenomsnittet på 33.9 °C / ### class_avg_f### F.
(-) När du spelar The Witcher 3 är medeltemperaturen för ovansidan 42 °C / 108 F, jämfört med enhetsgenomsnittet på 33.9 °C / ## #class_avg_f### F.
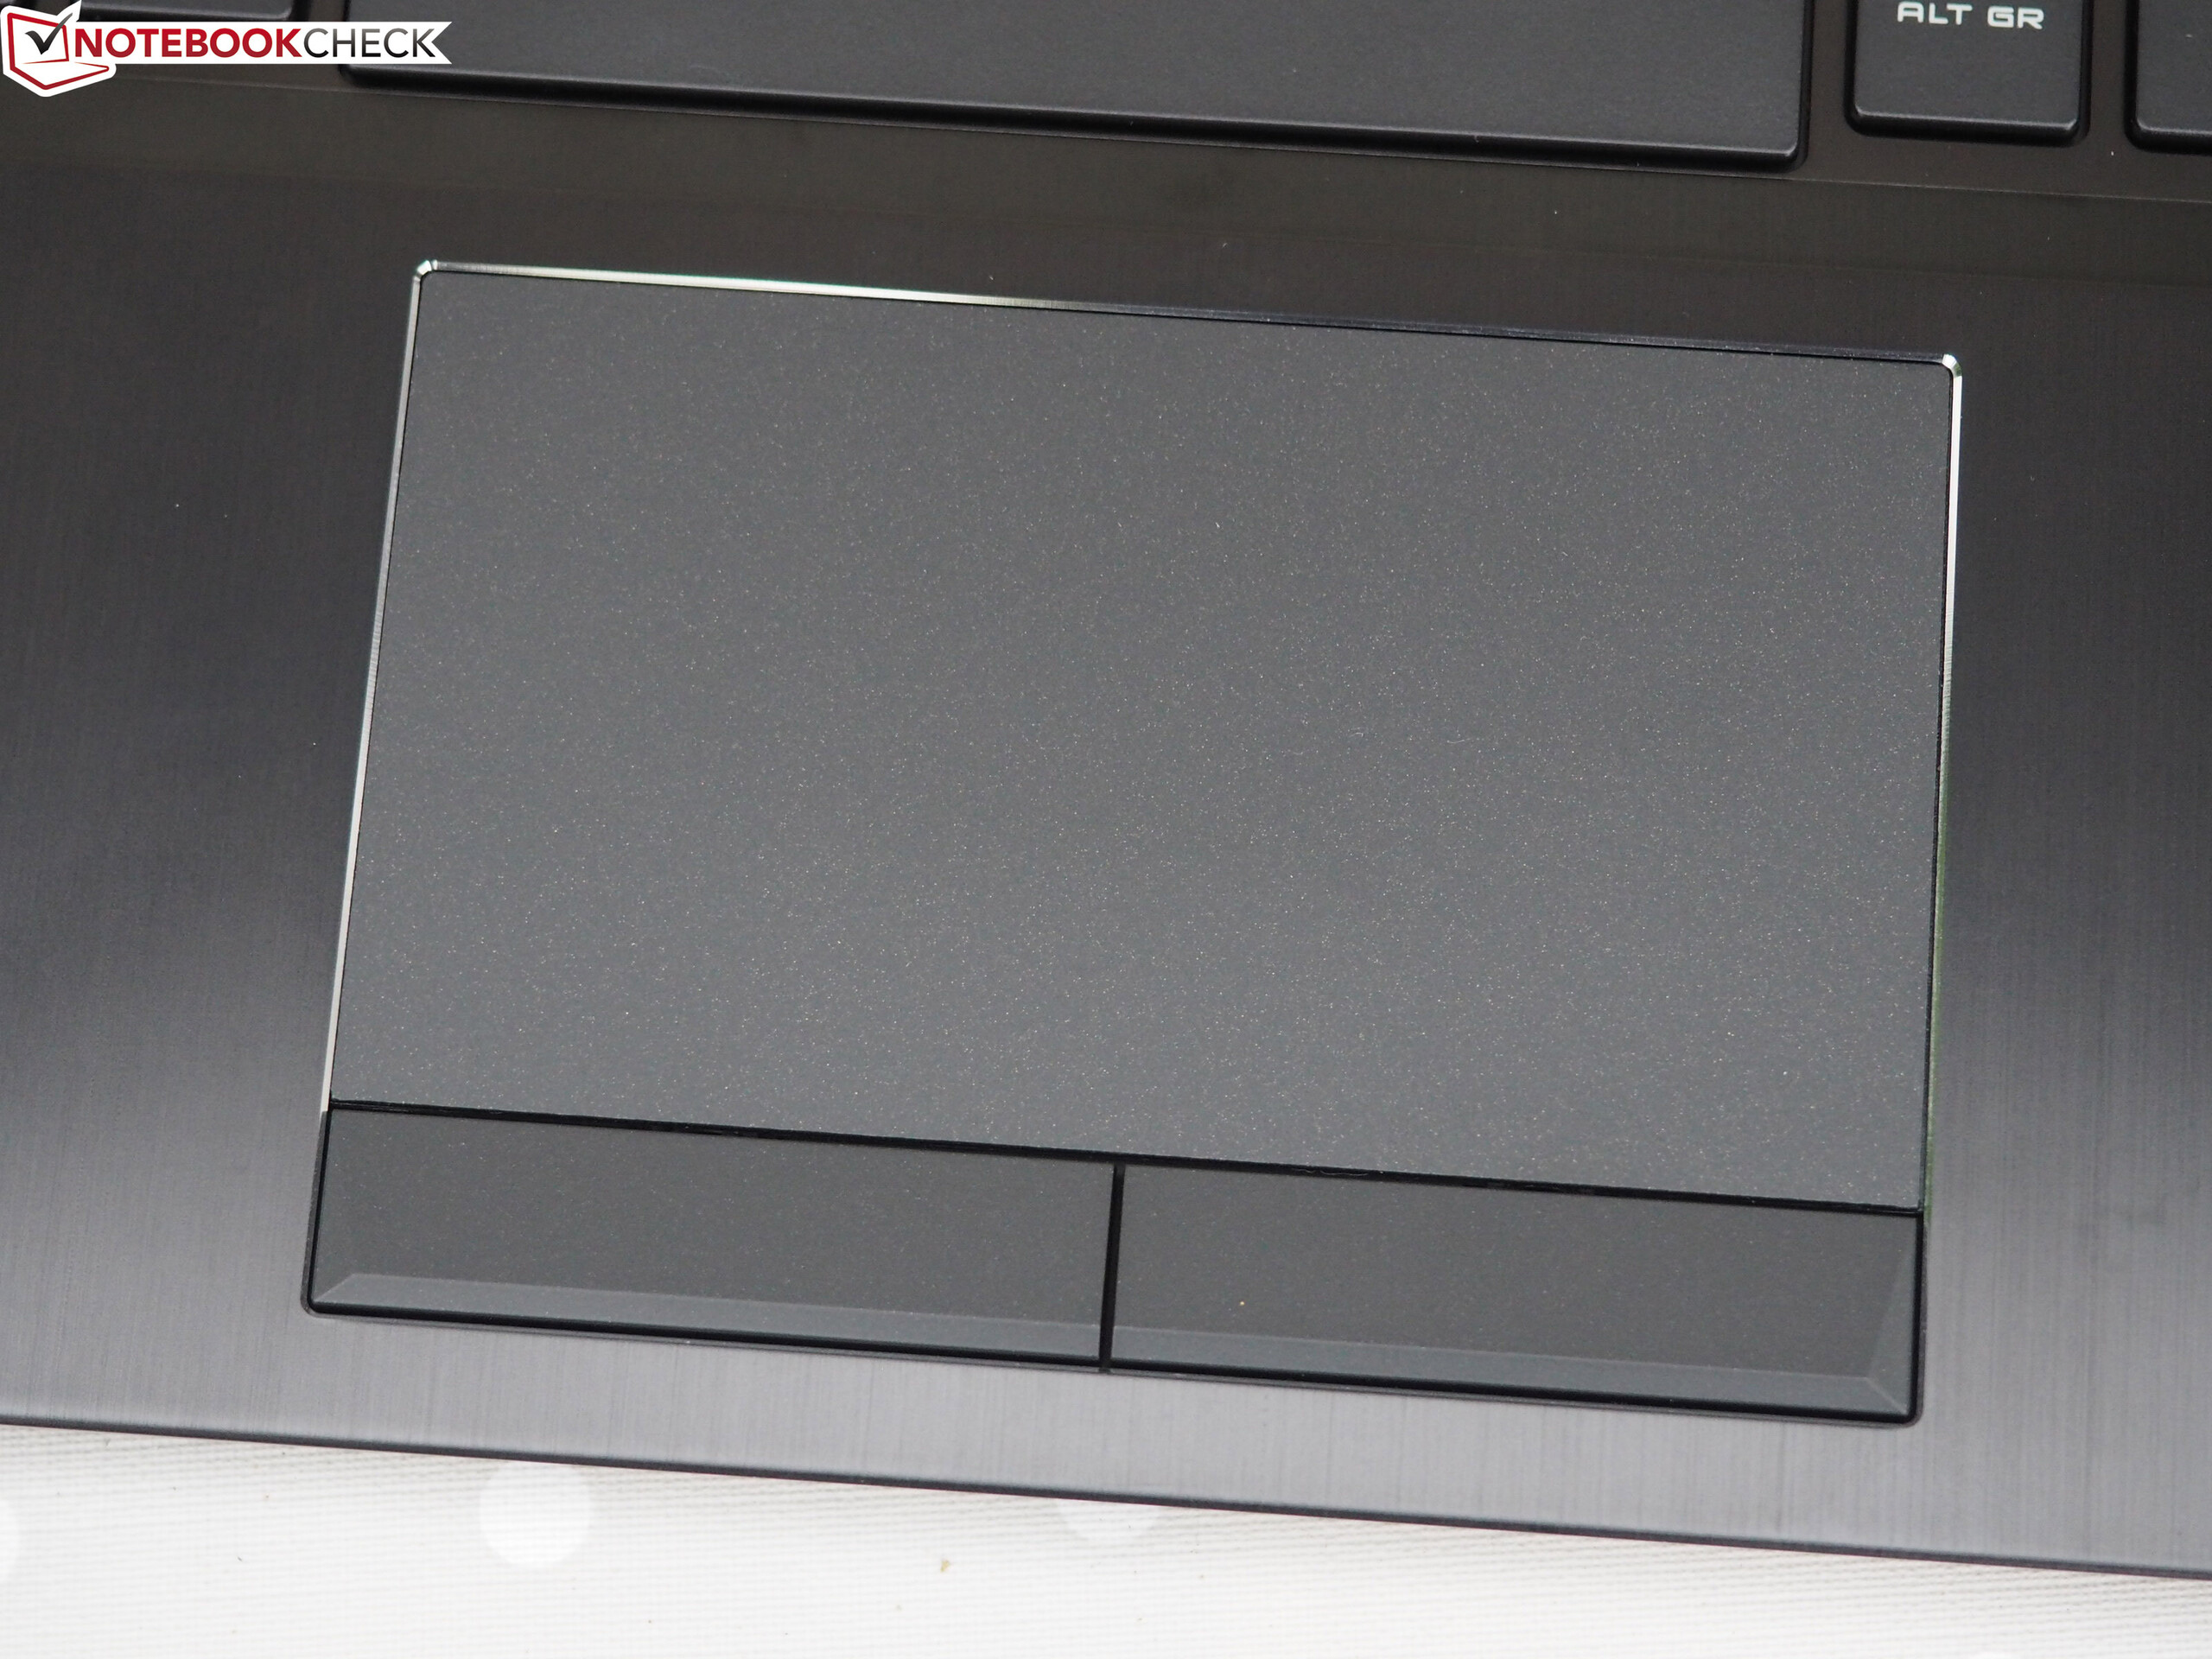
(+) Handledsstöden och pekplattan når maximal hudtemperatur (34 °C / 93.2 F) och är därför inte varma.
(-) Medeltemperaturen för handledsstödsområdet på liknande enheter var 28.8 °C / 83.8 F (-5.2 °C / -9.4 F).
| HP Omen 15-dc0015ng i7-8750H, GeForce GTX 1070 Max-Q | HP Omen 15-dc0001ng i5-8300H, GeForce GTX 1050 Ti Mobile | MSI P65 8RF-451 - Creator i7-8750H, GeForce GTX 1070 Max-Q | Asus Zephyrus S GX531GS i7-8750H, GeForce GTX 1070 Max-Q | Razer Blade 15 GTX 1060 i7-8750H, GeForce GTX 1060 Max-Q | Schenker XMG Neo 15 i7-8750H, GeForce GTX 1060 Mobile | MSI GE63 Raider RGB 8RF-008 i7-8750H, GeForce GTX 1070 Mobile | Genomsnitt NVIDIA GeForce GTX 1070 Max-Q | Genomsnitt av klass Gaming | |
|---|---|---|---|---|---|---|---|---|---|
| Heat | -9% | 4% | -4% | -5% | -7% | 5% | -1% | 3% | |
| Maximum Upper Side * (°C) | 49.7 | 51 -3% | 46.6 6% | 54 -9% | 51.2 -3% | 56 -13% | 48 3% | 52.1 ? -5% | 45.2 ? 9% |
| Maximum Bottom * (°C) | 48 | 58 -21% | 56.6 -18% | 60 -25% | 55.2 -15% | 68 -42% | 49 -2% | 57.3 ? -19% | 47.9 ? -0% |
| Idle Upper Side * (°C) | 32 | 35 -9% | 28.8 10% | 30 6% | 31 3% | 28 12% | 29 9% | 29.2 ? 9% | 31.1 ? 3% |
| Idle Bottom * (°C) | 34 | 35 -3% | 28.5 16% | 30 12% | 35.6 -5% | 29 15% | 31 9% | 29.9 ? 12% | 34.2 ? -1% |
* ... mindre är bättre
HP Omen 15-dc0015ng ljudanalys
(-) | inte särskilt höga högtalare (70.6 dB)
Bas 100 - 315 Hz
(-) | nästan ingen bas - i genomsnitt 21.3% lägre än medianen
(±) | linjäriteten för basen är genomsnittlig (12.1% delta till föregående frekvens)
Mellan 400 - 2000 Hz
(+) | balanserad mellan - endast 2.3% från medianen
(±) | linjäriteten för mids är genomsnittlig (8.9% delta till föregående frekvens)
Högsta 2 - 16 kHz
(+) | balanserade toppar - endast 3.5% från medianen
(+) | toppar är linjära (6.1% delta till föregående frekvens)
Totalt 100 - 16 000 Hz
(±) | linjäriteten för det totala ljudet är genomsnittlig (19.9% skillnad mot median)
Jämfört med samma klass
» 70% av alla testade enheter i den här klassen var bättre, 6% liknande, 24% sämre
» Den bästa hade ett delta på 6%, genomsnittet var 18%, sämst var 132%
Jämfört med alla testade enheter
» 51% av alla testade enheter var bättre, 7% liknande, 42% sämre
» Den bästa hade ett delta på 4%, genomsnittet var 24%, sämst var 134%
Apple MacBook 12 (Early 2016) 1.1 GHz ljudanalys
(+) | högtalare kan spela relativt högt (83.6 dB)
Bas 100 - 315 Hz
(±) | reducerad bas - i genomsnitt 11.3% lägre än medianen
(±) | linjäriteten för basen är genomsnittlig (14.2% delta till föregående frekvens)
Mellan 400 - 2000 Hz
(+) | balanserad mellan - endast 2.4% från medianen
(+) | mids är linjära (5.5% delta till föregående frekvens)
Högsta 2 - 16 kHz
(+) | balanserade toppar - endast 2% från medianen
(+) | toppar är linjära (4.5% delta till föregående frekvens)
Totalt 100 - 16 000 Hz
(+) | det totala ljudet är linjärt (10.2% skillnad mot median)
Jämfört med samma klass
» 7% av alla testade enheter i den här klassen var bättre, 2% liknande, 91% sämre
» Den bästa hade ett delta på 5%, genomsnittet var 18%, sämst var 53%
Jämfört med alla testade enheter
» 5% av alla testade enheter var bättre, 1% liknande, 94% sämre
» Den bästa hade ett delta på 4%, genomsnittet var 24%, sämst var 134%
| Av/Standby | |
| Låg belastning | |
| Hög belastning |
|
Förklaring:
min: | |
| HP Omen 15-dc0015ng i7-8750H, GeForce GTX 1070 Max-Q | HP Omen 15-dc0001ng i5-8300H, GeForce GTX 1050 Ti Mobile | MSI P65 8RF-451 - Creator i7-8750H, GeForce GTX 1070 Max-Q | Asus Zephyrus S GX531GS i7-8750H, GeForce GTX 1070 Max-Q | Razer Blade 15 GTX 1060 i7-8750H, GeForce GTX 1060 Max-Q | Schenker XMG Neo 15 i7-8750H, GeForce GTX 1060 Mobile | MSI GE63 Raider RGB 8RF-008 i7-8750H, GeForce GTX 1070 Mobile | Genomsnitt NVIDIA GeForce GTX 1070 Max-Q | Genomsnitt av klass Gaming | |
|---|---|---|---|---|---|---|---|---|---|
| Power Consumption | 24% | 31% | -10% | 13% | 22% | 8% | 17% | -2% | |
| Idle Minimum * (Watt) | 14 | 12 14% | 7.4 47% | 17 -21% | 14.9 -6% | 10 29% | 9 36% | 11.4 ? 19% | 13.2 ? 6% |
| Idle Average * (Watt) | 18.2 | 14 23% | 11.7 36% | 20 -10% | 17.5 4% | 13 29% | 14 23% | 15.7 ? 14% | 18.9 ? -4% |
| Idle Maximum * (Watt) | 24 | 18 25% | 16.8 30% | 29 -21% | 19.2 20% | 18 25% | 19 21% | 20.7 ? 14% | 24.3 ? -1% |
| Load Average * (Watt) | 143 | 92 36% | 94 34% | 112 22% | 103.2 28% | 95 34% | 91 36% | 98.1 ? 31% | 108.3 ? 24% |
| Witcher 3 ultra * (Watt) | 126 | 100 21% | 152 -21% | 123.1 2% | 114 10% | 182 -44% | |||
| Load Maximum * (Watt) | 190 | 142 25% | 177 7% | 211 -11% | 132.7 30% | 179 6% | 238 -25% | 173.8 ? 9% | 254 ? -34% |
* ... mindre är bättre
| HP Omen 15-dc0015ng i7-8750H, GeForce GTX 1070 Max-Q, 70.07 Wh | HP Omen 15-dc0001ng i5-8300H, GeForce GTX 1050 Ti Mobile, 70 Wh | MSI P65 8RF-451 - Creator i7-8750H, GeForce GTX 1070 Max-Q, 82 Wh | Asus Zephyrus S GX531GS i7-8750H, GeForce GTX 1070 Max-Q, 50 Wh | Razer Blade 15 GTX 1060 i7-8750H, GeForce GTX 1060 Max-Q, 80 Wh | Schenker XMG Neo 15 i7-8750H, GeForce GTX 1060 Mobile, 46.7 Wh | MSI GE63 Raider RGB 8RF-008 i7-8750H, GeForce GTX 1070 Mobile, 51 Wh | Genomsnitt av klass Gaming | |
|---|---|---|---|---|---|---|---|---|
| Batteridrifttid | 65% | 24% | -54% | 46% | 5% | -33% | 46% | |
| Reader / Idle (h) | 7.7 | 10.4 35% | 7.5 -3% | 3.6 -53% | 6.7 -13% | 5.7 -26% | 8.71 ? 13% | |
| H.264 (h) | 3.4 | 8.4 147% | 5.9 74% | 4.8 41% | 8.26 ? 143% | |||
| WiFi v1.3 (h) | 4.6 | 8.6 87% | 7.1 54% | 2.6 -43% | 6.7 46% | 4.4 -4% | 4 -13% | 7.04 ? 53% |
| Load (h) | 2 | 1.8 -10% | 1.4 -30% | 0.7 -65% | 1.9 -5% | 0.8 -60% | 1.47 ? -26% |
För
Emot
Läs den fullständiga versionen av den här recensionen på engelska här.
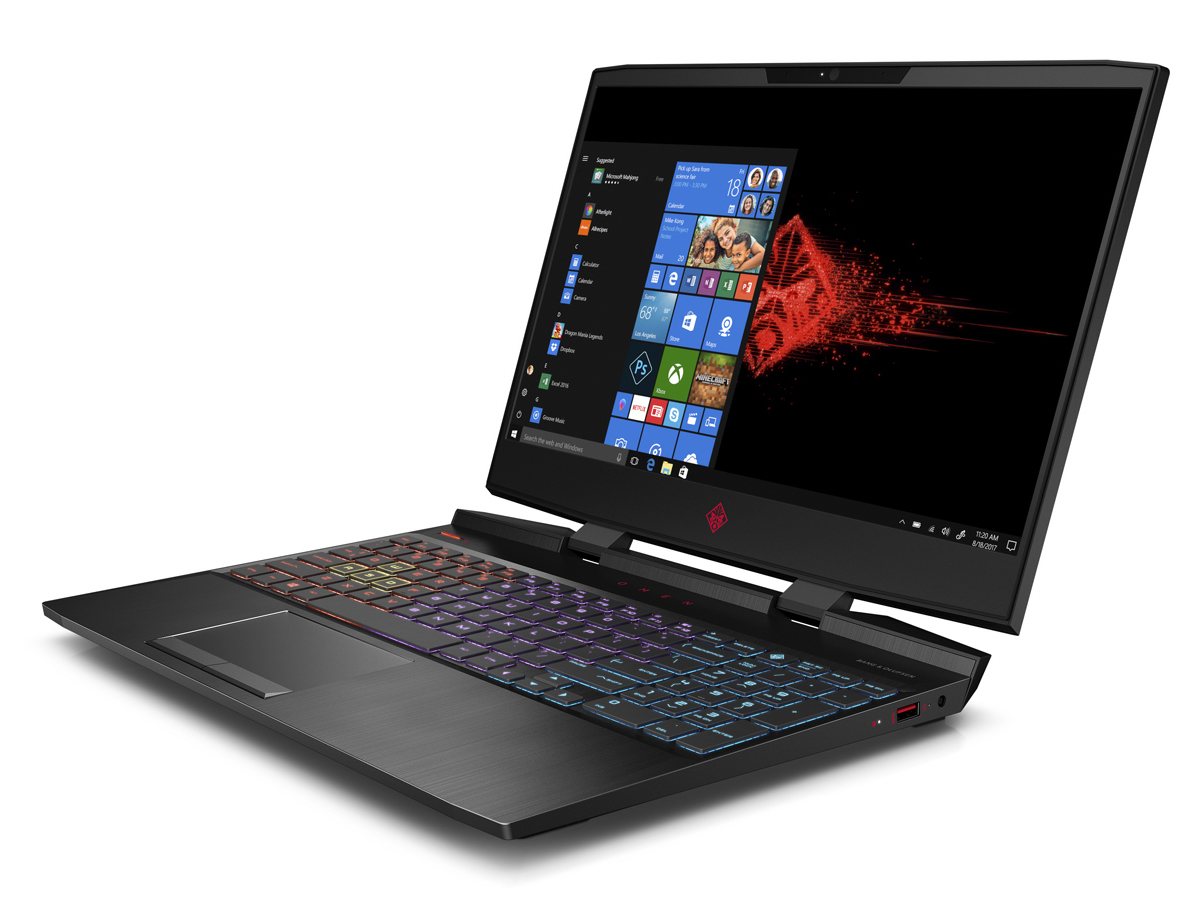
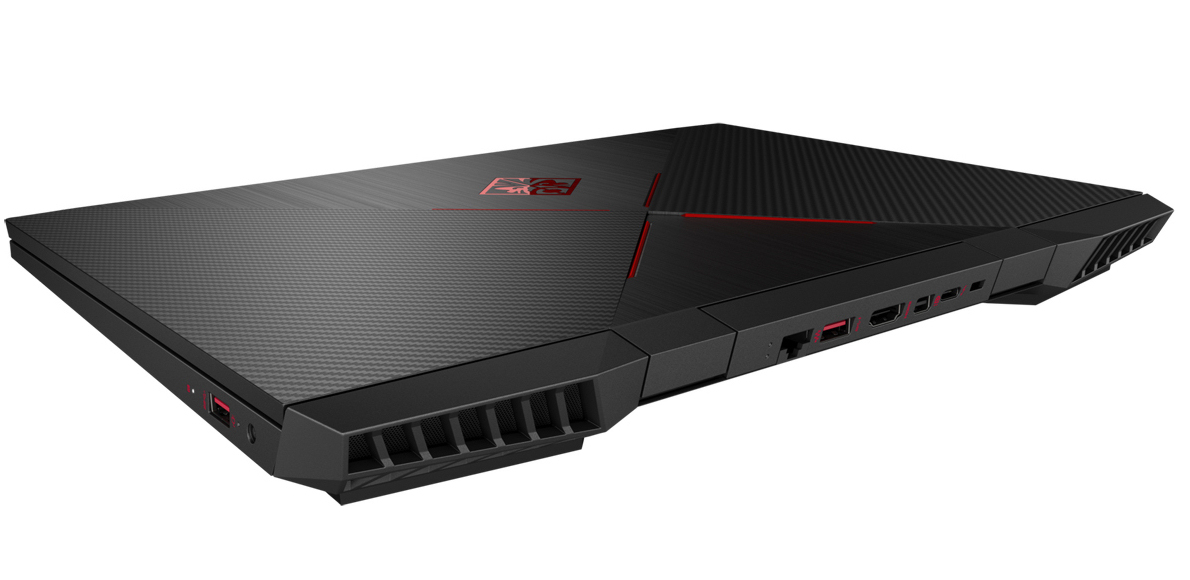
Omen 15 har hårdvara som kan visa alla aktuella datorspel på den matta Full HD-skärmen utan ryckighet. Det går alltid att välja höga eller maximala grafikinställningar. Nvidias G-Sync teknik säkrar att bilden visas smidigt på 144 Hz-skärmen. Enligt underhållsmanualen kan G-Sync även användas för externa skärmar. Ansluter man en sådan skärm går det också att använda upplösningar som är högre än Full HD, men då får du reducera grafikens kvalitetsnivå.
Med sin Omen 15 levererar Hewlett-Packard en kompakt spellaptop som totalt sett kan sägas vara en framgång. Men trots sitt pris på 21.000 kronor är den inte utan brister.
En extremt snabb NVMe SSD säkrar att systemet känns kvickt. Dessutom är datorn utrustad med en hårddisk på 1 TB. Båda lagringsmodulerna kan bytas ut. Allt detta stöds av ett bra tangentbord. Även om batteritiden inte direkt är inspirerande så är den acceptabel för en spellaptop som har sin integrerade grafikkärna inaktiverad.
Den matta Full HD-skärmen tillfredsställer med stabila betraktningsvinklar och snabba responstider. Men den saknar ljusstyrka och har i synnerhet för låg kontrastnivå för en laptop i den här prisklassen.
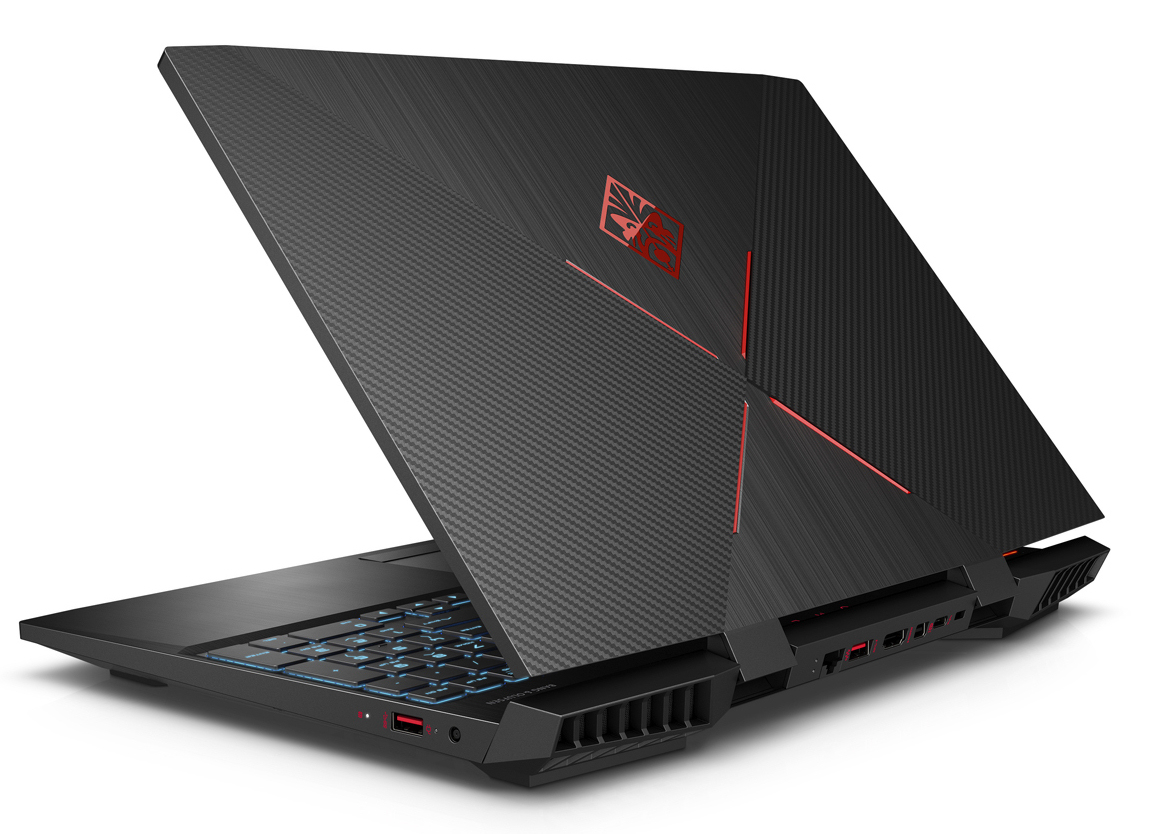
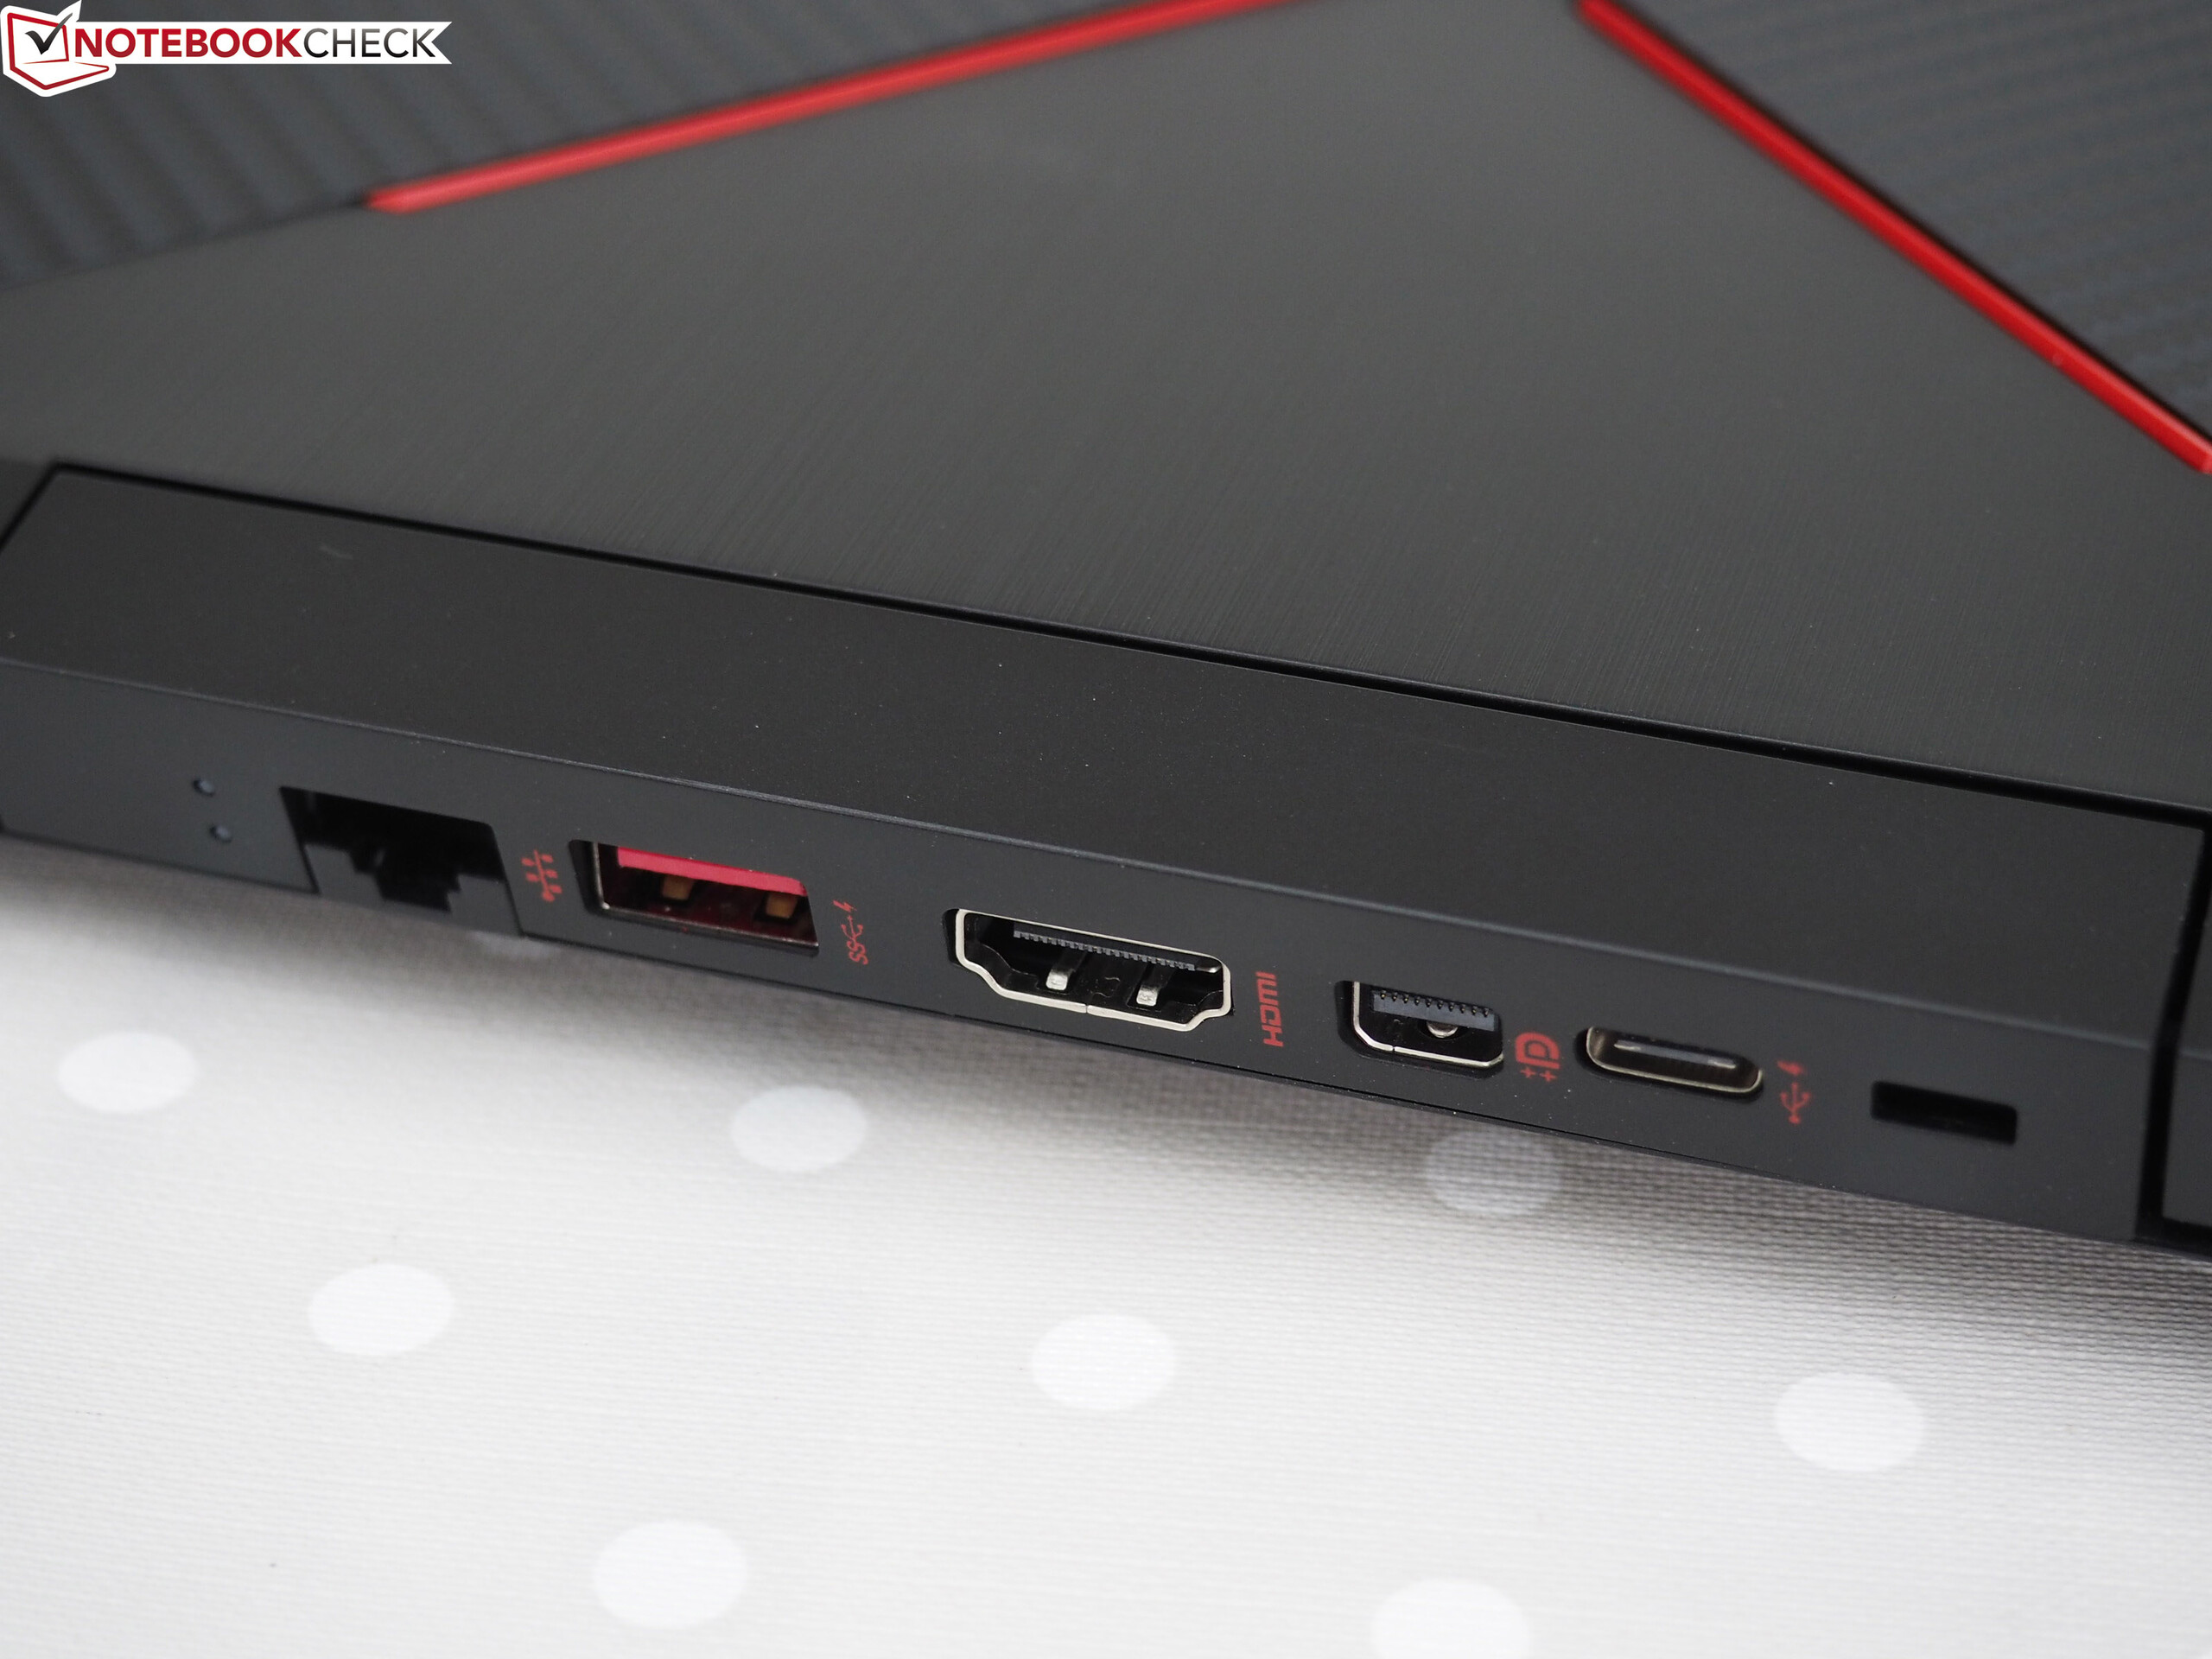
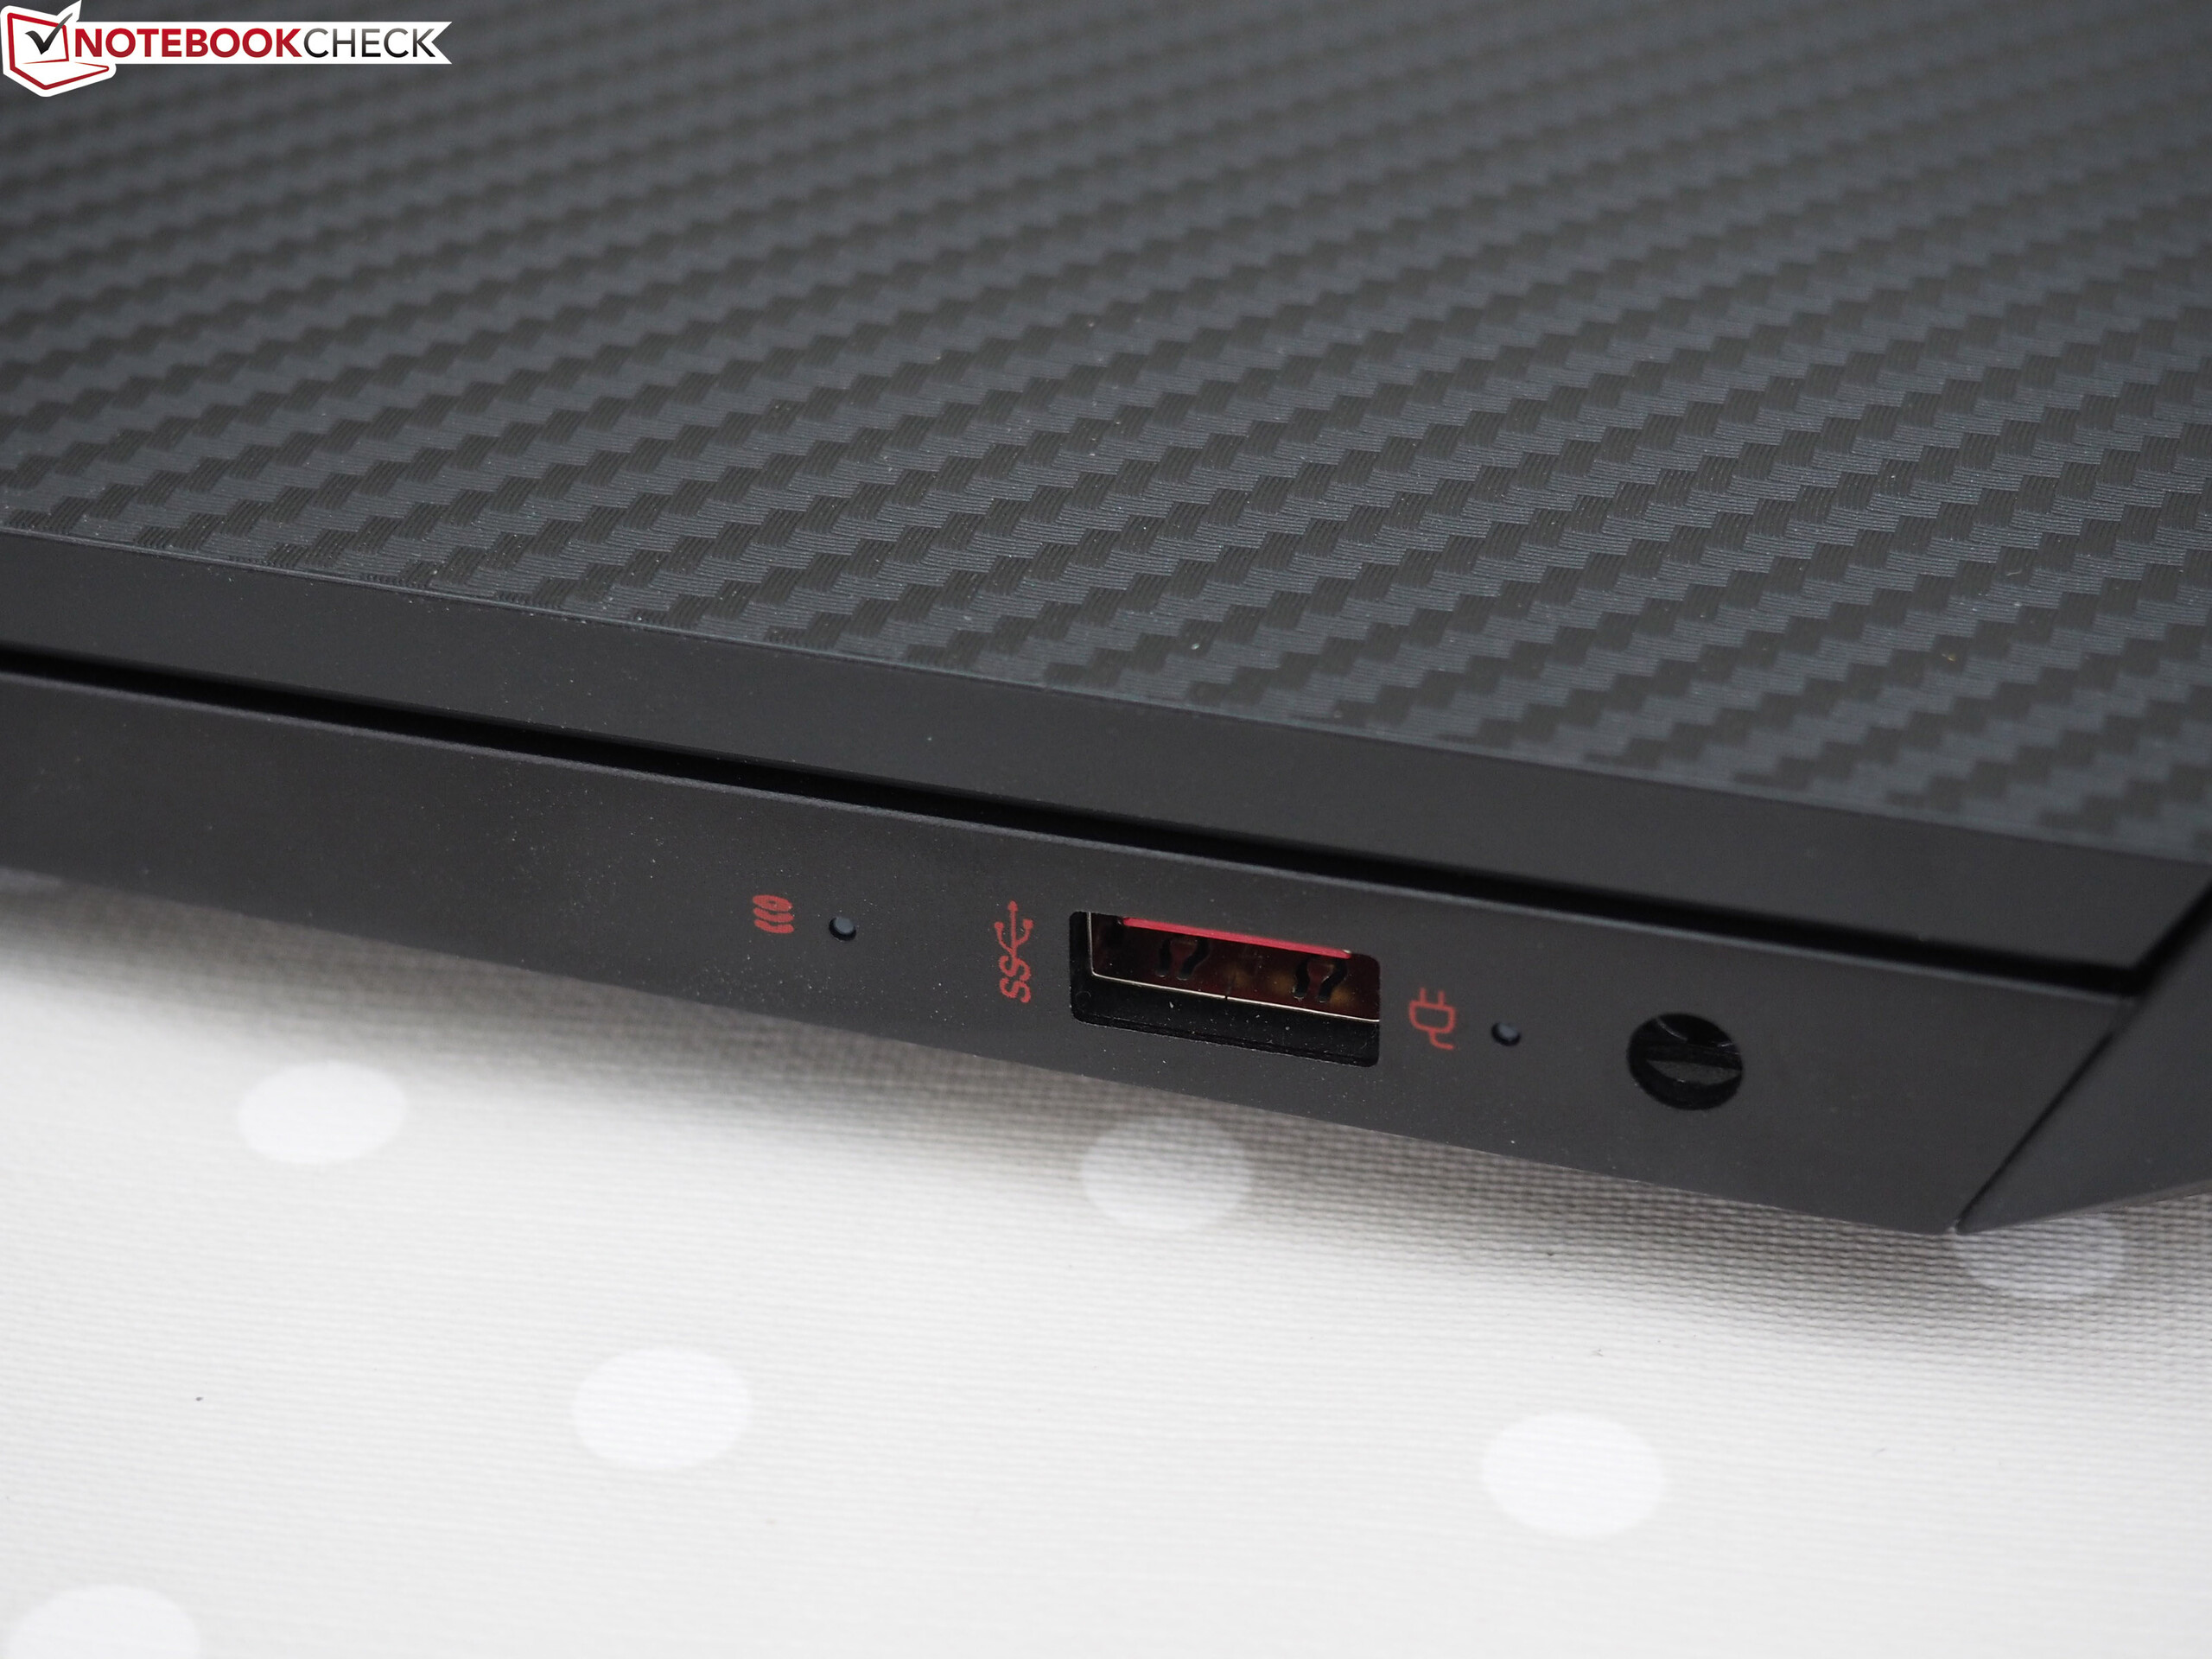
Även om syskonmodellen som vi tidigare testat bara hade en USB 3.1 Typ C Gen 1-plats så har den enhet vi testar idag en Thunderbolt 3-anslutning, så du kan också ansluta en extern GPU ifall den inbyggda modellen nån dag inte räcker till för dina behov.
HP Omen 15-dc0015ng
- 12/10/2018 v6 (old)
Sascha Mölck
Price comparison
